Exhibit 13
2012 Annual Report
Financial Highlights Year Ended April 30,
(Dollars in thousands, except per share data) 2012 2011
Net sales $ 5,525,782 $ 4,825,743
Net income and net income per common share:
Net income $ 459,744 $ 479,482
Net income per common share – assuming dilution $ 4.06 $ 4.05
Income and income per common share excluding
special project costs:(1)
Income $ 535,579 $ 555,133
Income per common share – assuming dilution $ 4.73 $ 4.69
Common shares outstanding at year end 110,284,715 114,172,122
Number of employees 4,850 4,500
Refer to “Non-GAAP Measures” located on page 32 in the “Management’s Discussion and Analysis” section for a reconciliation to the comparable GAAP financial measure.
About Our Cover
“Adams-Morgan”
©2011-2012 – Mitchell Johnson
Based in Silicon Valley, California, artist Mitchell Johnson is best known for his oil/linen paintings and his particular use of flat color and pattern. Johnson’s paintings can be found in more than 600 collections across the U.S. and have appeared in many publications and feature films.
Contents
| 1 |
|
Why We Are, Who We Are
| 4 |
|
Letter to Shareholders
| 8 |
|
U.S. Retail Coffee
12
U.S. Retail Consumer Foods
16
International, Foodservice,
and Natural Foods
20
Sustainability and Smucker
21
Financial Review
24
Management’s Discussion
and Analysis
41
Consolidated Financial Statements
46
Notes to Consolidated Financial Statements

Why We Are, Who We Are.
Our Culture
A culture of dotting the i’s and crossing the t’s…
Of doing the right things and doing things right…
A culture of growth – individual and as a company.
It’s who we are. It’s because of who we are.
It’s a result of living our Basic Beliefs…
Our Commitment to Each Other. To our consumers and to our customers.
As we look to the future of unlimited possibilities, we recognize the principles that are instrumental to our success…
A culture deeply rooted in our Basic Beliefs…
Guideposts for decisions at every level…
Why we are who we are.
A culture that encourages commitment to each other…
Clear communication and collaboration…
Vision…A culture of appreciation.
A family-sense of sharing in a job well done…
Where every person makes a difference.
The J. M. Smucker Company 2012 Annual Repor t 1

2 The J.M. Smucker Company 2012 Annual Repor t

Helping to bring families together to share memorable meals and moments.
While strong financial results are important, we are driven by a greater purpose – helping to bring families together to share memorable meals and moments. We know, and research demonstrates, that families who eat together are happier and healthier. Shared family meals can lead to better grades, healthier eating habits, fewer behavioral problems, less family tension, and closer family bonds. We continue to partner with Miriam Weinstein, author of The Surprising Power of Family Meals, to provide resources and assistance on making the most of your mealtime through our website, PowerOfFamilyMeals.com. By focusing our business around convenient, delicious, and nutritious products, we help support the power of the family meal and all its benefits.
The J.M. Smucker Company 2012 Annual Repor t 3

Dear ShareholDerS anD FrienDS:
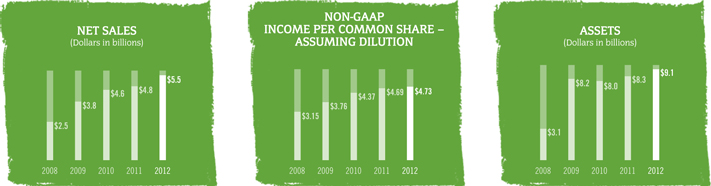
Fiscal 2012 was a challenging yet successful year for The J. M. Smucker Company as we introduced a record number of products, acquired new businesses, and made brand investments – all while achieving solid results and returning value to our shareholders. In fiscal 2012, sales reached a new high of $5.5 billion, an increase of 15 percent over fiscal 2011. Non-GAAP earnings rose to a record $4.73 per share compared to $4.69 in the prior year.
These accomplishments have been achieved despite a challenging economic environment where consumers have remained under pressure, impacting volume in many categories across the industry, and where commodity costs remained high. Our stability amid these challenges reflects the Smucker portfolio of iconic brands’ abilities to provide value and to meet a wide variety of consumer needs throughout the day. We are building upon this strength by continuing to make investments that deliver great products to our consumers and returns to our shareholders.
Brand Investment
Product innovation, in particular, is a major focus and one that our retail customers expect of us as category leaders. We met this expectation in fiscal 2012 by launching more than 60 new products. In total, the new products introduced in the last three years contributed more than five percent of fiscal 2012 net sales.
Product innovation is guided by our focus on meeting the diverse needs of our consumers for taste, health, convenience, and emotional fulfillment as these new product examples demonstrate:
Pillsbury ® Pink Lemonade Premium Cookie and Cake Mixes
Jif® To Go™ in Natural and Chocolate Silk varieties
Smucker’s® Uncrustables® reduced sugar sandwiches on whole wheat
Folgers® Gourmet Selections® and Millstone® single-serve K-Cup® portion packs in new flavors
By focusing on innovation, Pillsbury has moved from the #3 to #2 position in the dessert baking mix category in recent years. The momentum behind our innovation efforts will continue in fiscal 2013, when we expect to introduce as many as 100 new products across our brand portfolio.
Our brand support extends to the marketplace through media investments that include both traditional outlets, such as television spots, and new digital approaches. Today, our brands host nearly 30 social media sites and seven mobile websites and offer a variety of interactive contact, such as eCoupon support, to consumers.
Business Expansion
Acquisitions have played a transformative role in our growth strategy over the past decade. During this time, for example, Smucker has become the #1 manufacturer of at-home retail coffee in the United States beginning with the acquisition of the Folgers brand in 2008. In fiscal 2012 we acquired Rowland Coffee Roasters, Inc., which included the leading Hispanic Café Bustelo® and Café Pilon® brands. With a successful integration completed during fiscal 2012, we are looking forward to further expanding distribution in key markets and leveraging the brands’ presence among a growing base of Hispanic consumers.
During the year, the Company completed the acquisition of a majority of the North American foodservice coffee and hot beverage business of Sara Lee Corporation. This transaction added the market-leading liquid coffee concentrate and other hot beverages to our portfolio, which allows us to further participate in the away-from-home hot beverage business. Beyond these new offerings, this transaction has had a strategic impact on our foodservice business by nearly doubling its size, adding a direct sales force, and enhancing its ability to offer a full hot beverage solution to foodservice operators and customers. We were honored to welcome more than 400 employees to the Company as part of these two transactions.
Beyond North America, we continue to work toward the development of a long-term meaningful presence in China. New developments include the establishment of a Shanghai office and a minority investment in the privately owned Guilin Seamild Biologic Technology Development Co., Ltd. (“Seamild”). Our investment in
4 The J. M. Smucker Company 2012 Annual Repor t

this family-run business, which enjoys an established presence in the rapidly growing oats category, will be an effective vehicle to learn more about Chinese consumers and successful go-to-market strategies in China.
Supply Chain Investments
We remain focused on two important investment projects that will help drive operational excellence through our supply chain. We continue to move forward with the consolidation of our coffee manufac-turing operations and the expansion initiatives currently underway at our coffee manufacturing facilities in New Orleans, Louisiana. In fiscal 2013, a new state-of-the-art fruit spreads manufacturing facility is expected to become operational in Orrville, Ohio. Both projects will not only simplify our supply chain but also provide greater flexibility to support product innovation, improve quality, and optimize capacity to accommodate future growth.
Responsible Capital Management
These significant and ongoing levels of reinvestment underscore the long-term approach that we take in our business. Certain benefits from these investments are readily apparent, but most will emerge over time and serve us well for years to come. It is particularly gratifying to be able to support sizable reinvestment initiatives while also returning value to our share-holders. The ability to do both underscores our Company’s strong cash generation capabilities in which we deploy cash between business growth initiatives and shareholder return programs. During fiscal 2012, these programs included a 15 percent increase in dividends paid per share and the repurchase of more than four million common shares for approximately $305 million.
Further focusing on our capital management structure, we entered the public debt market for the first time in Company history. In October 2011, we issued $750 million in 10-year notes to further our financial flexibility.
An Effective Combination for Growth
As one of our Basic Beliefs, Growth is defined as reaching for that potential whether through the acquisition of new brands, the development of new products and new markets, the discovery of new
management or manufacturing capabilities, or the personal growth and development of our people and their ideas. We know from experience that when we combine our unique culture with our strategy and our ability to implement, meaningful growth will be the result. Over the past decade, this combination has enabled Smucker to evolve from a fruit spreads-focused company with sales of $650 million into a broader business with multiple iconic brands, approaching sales of $6 billion. Going forward, we believe this same combination of culture, strategy, and implementation will continue to successfully evolve our business to ever-higher levels of performance. In the process, we will continue to fulfill Our Purpose – helping to bring families together to share memorable meals and moments.
Looking ahead to fiscal 2013, our focus will be on further enhancing long-term shareholder value by:
A focus on innovation, with plans to significantly increase the number of new product introductions as compared to last year
Optimizing pricing, with an increased emphasis on opening price point offerings for value-conscious consumers
Realizing synergies from our supply chain optimization projects and recent acquisitions
Continuing to evolve our sustainability initiatives, particularly in the area of green coffee
As we close another successful year in the 100-plus-year history of The J.M. Smucker Company, we remain committed to our Basic Beliefs of Quality, People, Ethics, Growth, and Independence to guide both our strategic decisions and daily behavior. We believe the best is yet to come for our Company, and we appreciate your continued support. We extend our deepest gratitude to our constituents who contribute to our success – consumers, customers, employees, suppliers, communities, and shareholders.
Sincerely,
Tim Smucker Richard Smucker
June 20, 2012
The J. M. Smucker Company 2012 Annual Repor t 5

Our portfolio encompasses numerous products that represent Our Vision to own and market food brands that hold the #1 position in their respective categories. Today, we hold branded leadership positions in seven categories in both the United States and Canada. Our products can be part of meals – whether breakfast, lunch, dinner, or snack options – throughout the day. We are honored to have our products be a part of your family meals and to be a staple in your pantries.
Memorable Meals and Moments
6 The J.M. Smucker Company 2012 Annual Repor t


U.S. Retail
Coffee
In just four short years, Smucker has established a wide-ranging presence in the coffee marketplace – a presence that demonstrates our diverse portfolio’s ability to meet the unique needs of consumers by offering products in every segment with different blends, flavors, sizes, and convenience attributes. In addition to the Folgers, Millstone, and Dunkin’ Donuts ® brands, we are pleased to have added the leading Hispanic Café Bustelo and Café Pilon brands in the past year.
8 The J.M. Smucker Company 2012 Annual Repor t

Our Brands
The J.M. Smucker Company 2012 Annual Repor t 9
keeping the coffee market momentum going
Sales for U.S. Retail Coffee grew 19 percent during fiscal 2012, though higher commodity costs resulted in only a slight increase in segment profitability. Our coffee business continued to capitalize on the increasing popularity of the single-serve K-Cup® portion packs, which is creating attractive growth opportunities for us.
These single-serve packages account for more than $1 billion in annual sales in the channels we participate in today and continue to command more space on retail shelves. Our Folgers Gourmet Selections and Millstone branded K-Cups are following a similar trajectory, with sales increasing more than 200 percent in grocery, mass, drug store, and club retail channels last year to approximately $180 million on an annual basis.
During fiscal 2012, we further expanded our participation in the single-serve category by signing an agreement with Green Mountain Coffee Roasters to include Folgers Gourmet Selections and Millstone brands in its new Keurig Vue™ brewing system. We also introduced Folgers Instant Coffee Single-Serve Packets to provide consumers with another one-cup solution, and to complement the Folgers instant coffee line.
The Dunkin’ Donuts brand is another growth vehicle for our retail coffee business. With annual retail sales in excess of $300 million today, Dunkin’ Donuts has three of the top-10 premium coffee SKUs in measured channels; its 12-ounce original blend occupies the top slot, with sales nearly 2.5 times those of its closest competitor.
We remain focused on our core Folgers roast and ground products, which participate in the largest segment in the category, as well as on growing the Dunkin’ Donuts and Folgers Gourmet Selections brands in the premium segment. In addition, the popularity of Dunkin’ Donuts’ seasonal offerings is strong, with sales doubling from fiscal 2011 to fiscal 2012.
Our investment priorities include new product innovation and acquisitions that can tap into channels where we see growth potential, such as leveraging the Café Bustelo and Café Pilon brands in the growing Hispanic market. We also are focused on innovation in our supply chain through capital investments, which have already provided savings, and by realizing efficiencies with future integration of acquired facilities. Finally, we continue to work proactively on our strategy to balance cost management with the responsibilities of green coffee sustainability.
10 The J.M. Smucker Company 2012 Annual Repor t

U.S. Retail Coffee

U.S. Retail
Consumer
Foods
Our U.S. Retail Consumer Foods segment encompasses many of the industry’s most iconic food brands, including category leaders such as Smucker’s fruit spreads and Jif peanut butter, as well as Crisco® oils, Pillsbury baking mixes and frostings, Eagle Brand® sweetened condensed milk, Hungry Jack® pancake mix and syrup, and Martha White® and White Lily® flours.
12 The J.M. Smucker Company 2012 Annual Repor t

Our Brands
The J.M. Smucker Company 2012 Annual Repor t 13
Growing Through Ideas and Innovation
U.S. Retail Consumer Foods grew net sales seven percent during fiscal 2012 in the face of volume and competitive pressures, which resulted in a three percent decline in profitability. New product introductions were particularly helpful to sales growth during the year.
Recent new product launches have focused on consumers’ need for convenience, such as Jif To Go, which added natural and chocolate silk varieties during the past year. Jif also is expanding into the specialty nut butter category with the launch of two chocolate hazelnut spread varieties in fiscal 2013. This type of product innovation has helped us increase sales by over 60 percent since we acquired the Jif brand in 2002.
Pillsbury is another brand that has experienced significant growth since we acquired it seven years ago, with its baking mixes and frosting sales increasing approximately 50 percent. Recent product introductions have included Pink Lemonade Premium Cookie Mix, Sugar Free Classic Yellow Premium Cake Mix and Funfetti® Cookie Pop Kit.
Several new products launched in fiscal 2012, including sugar-free Smucker’s fruit spread varieties with Truvia sweetener and Smucker’s Uncrustables sandwiches whole wheat offering. We also responded to consumer requests with the introduction of two new flavors of Smucker’s Orchard’s Finest® Preserves – Pacific Grove Orange Marmalade Medley and Lakeside Raspberry Cranberry.
During the year, we continued to make significant investments in our manufacturing facilities. Our new Orrville manufacturing facility will begin initial production this summer and should result in long-term cost efficiencies. In addition, capacity expansions at our Smucker’s Uncrustables sandwiches plant in Scottsville, Kentucky, will enable us to capitalize on continued strong consumer demand.
14 The J.M. Smucker Company 2012 Annual Repor t

U.S. Retail Consumer Foods

International,
Foodservice, and
natural foods
Our International operations include our Canadian and Mexican entities as well as the products we export to more than 65 countries for consumers around the world to enjoy. In Canada, we market many of our retail brands, including the #1 Bick’s® and Robin Hood® brands. Our Foodservice division markets our branded products to foodservice operators. The Natural Foods business includes
R.W. Knudsen Family® and Santa Cruz Organic® juice brands, both pioneers in organic foods.
16 The J.M. Smucker Company 2012 Annual Repor t

Our Brands
The J.M. Smucker Company 2012 Annual Repor t 17
Realizing TRansfoRmaTional oppoRTuniTies
Our International, Foodservice, and Natural Foods segment experienced transformative change this year with the newly acquired Sara Lee North American foodservice away-from-home coffee and hot beverage business. Segment net sales increased 20 percent and segment profit grew six percent in fiscal 2012.
The acquisition of a majority of the north american foodservice coffee and hot beverage business of sara lee Corporation enables us to participate in the liquid coffee business, which is consistent with our desire to compete in all forms of coffee. given the importance of coffee to foodservice operators, this business enables us to offer a complete hot beverage solution to this customer base. The transaction also provided us with a unique opportunity to establish a multi-year innovation partnership with the new coffee company that will be spun off from sara lee, which will allow us to collaborate on new technologies in the liquid coffee category.
The integration of the sara lee foodservice coffee and hot beverage business was accomplished in record time, with major systems and processes transitioned within approximately four months. in addition, we redesigned our foodservice sales organization and go-to-market approach. The resulting direct sales team will significantly enhance our customer relationships, which, in turn, should create new long-term growth opportunities.
Coffee also was a big story for us in Canada this year with the launch of Folgers Gourmet Selections K-Cups, which was the Company’s most successful Canadian new product launch in our history.
Consistent with Our Vision of maintaining a global perspective, we entered the Chinese marketplace in fiscal 2012 by making a minority investment in Seamild, a privately-owned manufacturer and marketer of oats products. as a leading retail oats brand in China, their oatmeal and oat-based products are sold primarily under the Seamild brand, with distribution in retail channels throughout China. as a leader in the oats category, their portfolio of quality, trusted products aligns with Our Vision to own and market food brands that hold the #1 market position in their respective categories.
18 The J. M. Smucker Company 2012 Annual Repor t

International, Foodservice,
and Natural Foods
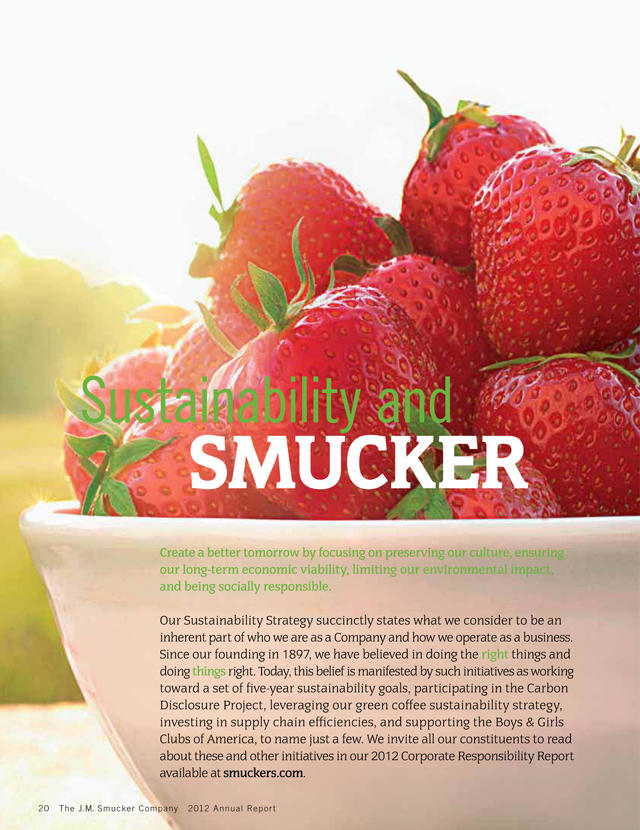
Sustainability and
Smucker
Create a better tomorrow by focusing on preserving our culture, ensuring our long-term economic viability, limiting our environmental impact, and being socially responsible.
Our Sustainability Strategy succinctly states what we consider to be an inherent part of who we are as a Company and how we operate as a business. Since our founding in 1897, we have believed in doing the right things and doing things right. Today, this belief is manifested by such initiatives as working toward a set of five-year sustainability goals, participating in the Carbon Disclosure Project, leveraging our green coffee sustainability strategy, investing in supply chain efficiencies, and supporting the Boys & Girls Clubs of America, to name just a few. We invite all our constituents to read about these and other initiatives in our 2012 Corporate Responsibility Report available at smuckers.com.
20 The J.M. Smucker Company 2012 Annual Repor t

peanut butter blossoms CREAMY ALMOND CANDY
Grilled Tomato and Turkey Salad with
Basil Bruschetta Orange-Peanut Dressing
peanut butter jalapeÑo poppers Berry Yogurt Breakfast Bowls
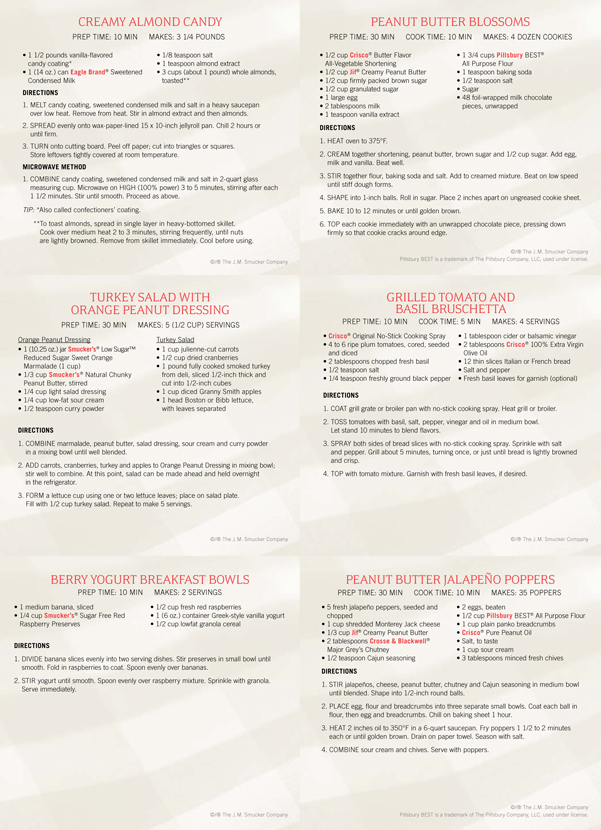
CREAMY ALMOND CANDY
Prep Time: 10 min Makes: 3 1/4 POUNDS
• 1 1/2 pounds vanilla-flavored • 1/8 teaspoon salt
candy coating* • 1 teaspoon almond extract
• 1 (14 oz.) can Eagle Brand® Sweetened • 3 cups (about 1 pound) whole almonds,
Condensed Milk toasted**
directions
MELT candy coating, sweetened condensed milk and salt in a heavy saucepan over low heat. Remove from heat. Stir in almond extract and then almonds.
SPREAD evenly onto wax-paper-lined 15 x 10-inch jellyroll pan. Chill 2 hours or until firm.
TURN onto cutting board. Peel off paper; cut into triangles or squares. Store leftovers tightly covered at room temperature.
MICROWAVE METHOD
COMBINE candy coating, sweetened condensed milk and salt in 2-quart glass measuring cup. Microwave on HIGH (100% power) 3 to 5 minutes, stirring after each
1 1/2 minutes. Stir until smooth. Proceed as above.
TIP: *Also called confectioners’ coating.
**To toast almonds, spread in single layer in heavy-bottomed skillet. Cook over medium heat 2 to 3 minutes, stirring frequently, until nuts are lightly browned. Remove from skillet immediately. Cool before using.
©/® The J.M. Smucker Company
Peanut butter blossoms
Prep Time: 30 min Cook Time: 10 min Makes: 4 DOZEN COOKIES
• 1/2 cup Crisco® Butter Flavor • 1 3/4 cups Pillsbury BEST®
All-Vegetable Shortening All Purpose Flour
• 1/2 cup Jif® Creamy Peanut Butter • 1 teaspoon baking soda
• 1/2 cup firmly packed brown sugar • 1/2 teaspoon salt
• 1/2 cup granulated sugar • Sugar
• 1 large egg • 48 foil-wrapped milk chocolate
• 2 tablespoons milk pieces, unwrapped
• 1 teaspoon vanilla extract
directions
HEAT oven to 375°F.
CREAM together shortening, peanut butter, brown sugar and 1/2 cup sugar. Add egg, milk and vanilla. Beat well.
STIR together flour, baking soda and salt. Add to creamed mixture. Beat on low speed until stiff dough forms.
SHAPE into 1-inch balls. Roll in sugar. Place 2 inches apart on ungreased cookie sheet.
BAKE 10 to 12 minutes or until golden brown.
TOP each cookie immediately with an unwrapped chocolate piece, pressing down firmly so that cookie cracks around edge.
©/® The J.M. Smucker Company Pillsbury BEST is a trademark of The Pillsbury Company, LLC, used under license.
Turkey Salad with
Orange Peanut Dressing
Prep Time: 30 min Makes: 5 (1/2 CUP) servings
Orange Peanut Dressing Turkey Salad
• 1 (10.25 oz.) jar Smucker’s® Low Sugar™ • 1 cup julienne-cut carrots
Reduced Sugar Sweet Orange • 1/2 cup dried cranberries
Marmalade (1 cup) • 1 pound fully cooked smoked turkey
• 1/3 cup Smucker’s® Natural Chunky from deli, sliced 1/2-inch thick and
Peanut Butter, stirred cut into 1/2-inch cubes
• 1/4 cup light salad dressing • 1 cup diced Granny Smith apples
• 1/4 cup low-fat sour cream • 1 head Boston or Bibb lettuce,
• 1/2 teaspoon curry powder with leaves separated
directions
COMBINE marmalade, peanut butter, salad dressing, sour cream and curry powder in a mixing bowl until well blended.
ADD carrots, cranberries, turkey and apples to Orange Peanut Dressing in mixing bowl; stir well to combine. At this point, salad can be made ahead and held overnight
in the refrigerator.
FORM a lettuce cup using one or two lettuce leaves; place on salad plate. Fill with 1/2 cup turkey salad. Repeat to make 5 servings.
©/® The J.M. Smucker Company
Berry Yogurt Breakfast Bowls
Prep Time: 10 min Makes: 2 SERVINGS
• 1 medium banana, sliced • 1/2 cup fresh red raspberries
• 1/4 cup Smucker’s® Sugar Free Red • 1 (6 oz.) container Greek-style vanilla yogurt
Raspberry Preserves • 1/2 cup lowfat granola cereal
directions
DIVIDE banana slices evenly into two serving dishes. Stir preserves in small bowl until smooth. Fold in raspberries to coat. Spoon evenly over bananas.
STIR yogurt until smooth. Spoon evenly over raspberry mixture. Sprinkle with granola. Serve immediately.
Grilled Tomato and
Basil Bruschetta
Prep Time: 10 min Cook Time: 5 min Makes: 4 Servings
• Crisco® Original No-Stick Cooking Spray • 1 tablespoon cider or balsamic vinegar
• 4 to 6 ripe plum tomatoes, cored, seeded • 2 tablespoons Crisco® 100% Extra Virgin
and diced Olive Oil
• 2 tablespoons chopped fresh basil • 12 thin slices Italian or French bread
• 1/2 teaspoon salt • Salt and pepper
• 1/4 teaspoon freshly ground black pepper • Fresh basil leaves for garnish (optional)
directions
COAT grill grate or broiler pan with no-stick cooking spray. Heat grill or broiler.
TOSS tomatoes with basil, salt, pepper, vinegar and oil in medium bowl. Let stand 10 minutes to blend flavors.
SPRAY both sides of bread slices with no-stick cooking spray. Sprinkle with salt
and pepper. Grill about 5 minutes, turning once, or just until bread is lightly browned and crisp.
TOP with tomato mixture. Garnish with fresh basil leaves, if desired.
©/® The J.M. Smucker Company
peanut butter jalapeÑo poppers
Prep Time: 30 min Cook Time: 10 min Makes: 35 POPPERS
• 5 fresh jalapeño peppers, seeded and • 2 eggs, beaten
chopped • 1/2 cup Pillsbury BEST® All Purpose Flour
• 1 cup shredded Monterey Jack cheese • 1 cup plain panko breadcrumbs
• 1/3 cup Jif® Creamy Peanut Butter • Crisco® Pure Peanut Oil
• 2 tablespoons Crosse & Blackwell® • Salt, to taste
Major Grey’s Chutney • 1 cup sour cream
• 1/2 teaspoon Cajun seasoning • 3 tablespoons minced fresh chives
directions
STIR jalapeños, cheese, peanut butter, chutney and Cajun seasoning in medium bowl until blended. Shape into 1/2-inch round balls.
PLACE egg, flour and breadcrumbs into three separate small bowls. Coat each ball in flour, then egg and breadcrumbs. Chill on baking sheet 1 hour.
HEAT 2 inches oil to 350°F in a 6-quart saucepan. Fry poppers 1 1/2 to 2 minutes each or until golden brown. Drain on paper towel. Season with salt.
COMBINE sour cream and chives. Serve with poppers.
©/® The J.M. Smucker Company
©/® The J.M. Smucker Company Pillsbury BEST is a trademark of The Pillsbury Company, LLC, used under license.
2012 FINANCIAL REVIEW
FIVE-YEAR SUMMARY OF SELECTED FINANCIAL DATA
The following table presents selected financial data for each of the five years in the period ended April 30, 2012. The selected financial data was derived from the consolidated financial statements and should be read in conjunction with the “Results of Operations” and “Financial Condition” sections of “Management’s Discussion and Analysis” and the consolidated financial statements and notes thereto.
| Year Ended April 30, | ||||||||||||||||||||
| (Dollars in thousands, except per share data) |
2012 | 2011 | 2010 | 2009 | 2008 | |||||||||||||||
| Statements of Income: |
||||||||||||||||||||
| Net sales |
$ | 5,525,782 | $ | 4,825,743 | $ | 4,605,289 | $ | 3,757,933 | $ | 2,524,774 | ||||||||||
| Gross profit |
$ | 1,845,223 | $ | 1,798,517 | $ | 1,786,690 | $ | 1,251,429 | $ | 782,164 | ||||||||||
| % of net sales |
33.4 | % | 37.3 | % | 38.8 | % | 33.3 | % | 31.0 | % | ||||||||||
| Operating income |
$ | 778,283 | $ | 784,272 | $ | 790,909 | $ | 452,275 | $ | 284,559 | ||||||||||
| % of net sales |
14.1 | % | 16.3 | % | 17.2 | % | 12.0 | % | 11.3 | % | ||||||||||
| Net income |
$ | 459,744 | $ | 479,482 | $ | 494,138 | $ | 265,953 | $ | 170,379 | ||||||||||
| Financial Position: |
||||||||||||||||||||
| Cash and cash equivalents |
$ | 229,708 | $ | 319,845 | $ | 283,570 | $ | 456,693 | $ | 171,541 | ||||||||||
| Total assets |
9,115,226 | 8,324,585 | 7,974,853 | 8,192,161 | 3,129,881 | |||||||||||||||
| Total debt |
2,070,543 | 1,304,039 | 910,000 | 1,536,726 | 789,684 | |||||||||||||||
| Shareholders’ equity |
5,163,386 | 5,292,363 | 5,326,320 | 4,939,931 | 1,799,853 | |||||||||||||||
| Statements of Cash Flows: |
||||||||||||||||||||
| Net cash provided by operating activities |
$ | 730,929 | $ | 391,562 | $ | 713,478 | $ | 446,993 | $ | 182,918 | ||||||||||
| Capital expenditures |
274,244 | 180,080 | 136,983 | 108,907 | 76,430 | |||||||||||||||
| Quarterly dividends paid |
213,667 | 194,024 | 166,224 | 110,668 | 68,074 | |||||||||||||||
| Purchase of treasury shares |
315,780 | 389,135 | 5,569 | 4,025 | 152,521 | |||||||||||||||
| Share Data: |
||||||||||||||||||||
| Weighted-average shares outstanding |
113,263,951 | 118,165,751 | 118,951,434 | 85,448,592 | 56,641,810 | |||||||||||||||
| Weighted-average shares outstanding – assuming dilution |
113,313,567 | 118,276,086 | 119,081,445 | 85,547,530 | 56,873,492 | |||||||||||||||
| Dividends declared per common share |
$ | 1.92 | $ | 1.68 | $ | 1.45 | $ | 6.31 | $ | 1.22 | ||||||||||
| Earnings per Common Share: |
||||||||||||||||||||
| Net income |
$ | 4.06 | $ | 4.06 | $ | 4.15 | $ | 3.11 | $ | 3.01 | ||||||||||
| Net income – assuming dilution |
4.06 | 4.05 | 4.15 | 3.11 | 3.00 | |||||||||||||||
| Non-GAAP Measures: (1) |
||||||||||||||||||||
| Gross profit excluding special project costs |
$ | 1,888,385 | $ | 1,852,606 | $ | 1,790,560 | $ | 1,251,429 | $ | 783,674 | ||||||||||
| % of net sales |
34.2 | % | 38.4 | % | 38.9 | % | 33.3 | % | 31.0 | % | ||||||||||
| Operating income excluding special project costs |
$ | 893,938 | $ | 897,423 | $ | 830,312 | $ | 535,170 | $ | 297,273 | ||||||||||
| % of net sales |
16.2 | % | 18.6 | % | 18.0 | % | 14.2 | % | 11.8 | % | ||||||||||
| Income and income per common share excluding special project costs: |
||||||||||||||||||||
| Income |
$ | 535,579 | $ | 555,133 | $ | 520,782 | $ | 321,617 | $ | 178,881 | ||||||||||
| Income per common share – assuming dilution |
$ | 4.73 | $ | 4.69 | $ | 4.37 | $ | 3.76 | $ | 3.15 | ||||||||||
| (1) | Refer to “Non-GAAP Measures” located on page 32 in the “Management’s Discussion and Analysis” section for a reconciliation to the comparable GAAP financial measure. |
| The J. M. Smucker Company 2012 Annual Report 21 |
SUMMARY OF QUARTERLY RESULTS OF OPERATIONS
The J. M. Smucker Company
The following is a summary of unaudited quarterly results of operations for the years ended April 30, 2012 and 2011.
| (Dollars in thousands, except per share data) |
Quarter Ended | Net Sales | Gross Profit | Net Income | Net Income per Common Share |
Net Income per Common Share – Assuming Dilution |
||||||||||||||||||
| 2012 |
July 31, 2011 | $ | 1,188,883 | $ | 431,084 | $ | 111,523 | $ | 0.98 | $ | 0.98 | |||||||||||||
| October 31, 2011 | 1,513,905 | 498,669 | 127,247 | 1.12 | 1.12 | |||||||||||||||||||
| January 31, 2012 | 1,467,641 | 465,685 | 116,844 | 1.03 | 1.03 | |||||||||||||||||||
| April 30, 2012 | 1,355,353 | 449,785 | 104,130 | 0.93 | 0.93 | |||||||||||||||||||
| 2011 |
July 31, 2010 | $ | 1,047,312 | $ | 408,435 | $ | 102,881 | $ | 0.86 | $ | 0.86 | |||||||||||||
| October 31, 2010 | 1,278,913 | 494,670 | 149,726 | 1.25 | 1.25 | |||||||||||||||||||
| January 31, 2011 | 1,312,351 | 474,414 | 131,995 | 1.12 | 1.11 | |||||||||||||||||||
| April 30, 2011 | 1,187,167 | 420,998 | 94,880 | 0.82 | 0.82 | |||||||||||||||||||
Annual net income per common share may not equal the sum of the individual quarters due to differences in the average number of shares outstanding during the respective periods.
STOCK PRICE DATA
The Company’s common shares are listed on the New York Stock Exchange – ticker symbol SJM. The table below presents the high and low market prices for the shares and the quarterly dividends declared. There were approximately 284,900 shareholders as of June 15, 2012, of which approximately 51,800 were registered holders of common shares.
| Quarter Ended | High | Low | Dividends | |||||||||||||
| 2012 |
July 31, 2011 | $ | 80.26 | $ | 73.76 | $ | 0.48 | |||||||||
| October 31, 2011 | 78.62 | 66.43 | 0.48 | |||||||||||||
| January 31, 2012 | 81.40 | 71.24 | 0.48 | |||||||||||||
| April 30, 2012 | 81.97 | 70.50 | 0.48 | |||||||||||||
| 2011 |
July 31, 2010 | $ | 63.75 | $ | 53.27 | $ | 0.40 | |||||||||
| October 31, 2010 | 64.55 | 57.20 | 0.40 | |||||||||||||
| January 31, 2011 | 66.28 | 60.46 | 0.44 | |||||||||||||
| April 30, 2011 | 75.46 | 61.16 | 0.44 | |||||||||||||
| 22 The J. M. Smucker Company 2012 Annual Report |
COMPARISON OF FIVE-YEAR CUMULATIVE
TOTAL SHAREHOLDER RETURN
The J. M. Smucker Company
Among The J. M. Smucker Company, the S&P 500 Index, and the S&P Packaged Foods & Meats Index

| April 30, | ||||||||||||||||||||||||
| 2007 | 2008 | 2009 | 2010 | 2011 | 2012 | |||||||||||||||||||
| The J. M. Smucker Company |
$ | 100.00 | $ | 91.39 | $ | 81.44 | $ | 129.79 | $ | 163.91 | $ | 178.21 | ||||||||||||
| S&P 500 |
100.00 | 95.32 | 61.66 | 85.61 | 100.36 | 105.13 | ||||||||||||||||||
| S&P Packaged Foods & Meats |
100.00 | 98.19 | 77.72 | 108.80 | 126.50 | 143.03 | ||||||||||||||||||
The above graph compares the cumulative total shareholder return for the five years ended April 30, 2012, for the Company’s common shares, the S&P 500 Index, and the S&P Packaged Foods & Meats Index. These figures assume all dividends are reinvested when received and are based on $100 invested in the Company’s common shares and the referenced index funds on April 30, 2007.
Copyright© 2012 Standard & Poor’s, a division of The McGraw-Hill Companies Inc. All rights reserved. www.researchdatagroup.com/S&P.htm
| The J. M. Smucker Company 2012 Annual Report 23 |
MANAGEMENT’S DISCUSSION AND ANALYSIS
The J. M. Smucker Company
| 24 The J. M. Smucker Company 2012 Annual Report |
MANAGEMENT’S DISCUSSION AND ANALYSIS
The J. M. Smucker Company
| Year Ended April 30, | ||||||||||||||||||||
| (Dollars in millions, except per share data) |
2012 | 2011 | 2010 | 2012 % Increase (Decrease) |
2011 % Increase (Decrease) |
|||||||||||||||
| Net sales |
$ | 5,525.8 | $ | 4,825.7 | $ | 4,605.3 | 15 | % | 5 | % | ||||||||||
| Gross profit |
$ | 1,845.2 | $ | 1,798.5 | $ | 1,786.7 | 3 | % | 1 | % | ||||||||||
| % of net sales |
33.4 | % | 37.3 | % | 38.8 | % | ||||||||||||||
| Operating income |
$ | 778.3 | $ | 784.3 | $ | 790.9 | (1 | )% | (1 | )% | ||||||||||
| % of net sales |
14.1 | % | 16.3 | % | 17.2 | % | ||||||||||||||
| Net income: |
||||||||||||||||||||
| Net income |
$ | 459.7 | $ | 479.5 | $ | 494.1 | (4 | )% | (3 | )% | ||||||||||
| Net income per common share – assuming dilution |
$ | 4.06 | $ | 4.05 | $ | 4.15 | — | % | (2 | )% | ||||||||||
| Gross profit excluding special project costs (1) |
$ | 1,888.4 | $ | 1,852.6 | $ | 1,790.6 | 2 | % | 3 | % | ||||||||||
| % of net sales |
34.2 | % | 38.4 | % | 38.9 | % | ||||||||||||||
| Operating income excluding special project costs (1) |
$ | 893.9 | $ | 897.4 | $ | 830.3 | — | % | 8 | % | ||||||||||
| % of net sales |
16.2 | % | 18.6 | % | 18.0 | % | ||||||||||||||
| Income excluding special project costs: (1) |
||||||||||||||||||||
| Income |
$ | 535.6 | $ | 555.1 | $ | 520.8 | (4 | )% | 7 | % | ||||||||||
| Income per common share – assuming dilution |
$ | 4.73 | $ | 4.69 | $ | 4.37 | 1 | % | 7 | % | ||||||||||
| (1) | Refer to “Non-GAAP Measures” located on page 32 in the “Management’s Discussion and Analysis” section for a reconciliation to the comparable GAAP financial measure. |
| The J. M. Smucker Company 2012 Annual Report 25 |
MANAGEMENT’S DISCUSSION AND ANALYSIS
The J. M. Smucker Company
| 26 The J. M. Smucker Company 2012 Annual Report |
MANAGEMENT’S DISCUSSION AND ANALYSIS
The J. M. Smucker Company
| The J. M. Smucker Company 2012 Annual Report 27 |
MANAGEMENT’S DISCUSSION AND ANALYSIS
The J. M. Smucker Company
| Year Ended April 30, | ||||||||||||||||||||
| (Dollars in millions) |
2012 | 2011 | 2010 | 2012 % Increase (Decrease) |
2011 % Increase (Decrease) |
|||||||||||||||
| Net sales: |
||||||||||||||||||||
| U.S. Retail Coffee |
$ | 2,297.7 | $ | 1,930.9 | $ | 1,700.5 | 19 | % | 14 | % | ||||||||||
| U.S. Retail Consumer Foods |
2,094.5 | 1,953.0 | 2,004.7 | 7 | (3 | ) | ||||||||||||||
| International, Foodservice, and Natural Foods |
1,133.6 | 941.8 | 900.1 | 20 | 5 | |||||||||||||||
| Segment profit: |
||||||||||||||||||||
| U.S. Retail Coffee |
$ | 543.0 | $ | 536.1 | $ | 484.0 | 1 | % | 11 | % | ||||||||||
| U.S. Retail Consumer Foods |
393.3 | 406.5 | 407.7 | (3 | ) | — | ||||||||||||||
| International, Foodservice, and Natural Foods |
168.6 | 159.6 | 140.4 | 6 | 14 | |||||||||||||||
| Segment profit margin: |
||||||||||||||||||||
| U.S. Retail Coffee |
23.6 | % | 27.8 | % | 28.5 | % | ||||||||||||||
| U.S. Retail Consumer Foods |
18.8 | 20.8 | 20.3 | |||||||||||||||||
| International, Foodservice, and Natural Foods |
14.9 | 16.9 | 15.6 | |||||||||||||||||
| 28 The J. M. Smucker Company 2012 Annual Report |
MANAGEMENT’S DISCUSSION AND ANALYSIS
The J. M. Smucker Company
| The J. M. Smucker Company 2012 Annual Report 29 |
MANAGEMENT’S DISCUSSION AND ANALYSIS
The J. M. Smucker Company
| 30 The J. M. Smucker Company 2012 Annual Report |
MANAGEMENT’S DISCUSSION AND ANALYSIS
The J. M. Smucker Company
| The J. M. Smucker Company 2012 Annual Report 31 |
MANAGEMENT’S DISCUSSION AND ANALYSIS
The J. M. Smucker Company
| Year Ended April 30, | ||||||||||||||||||||
| (Dollars in thousands, except per share data) |
2012 | 2011 | 2010 | 2009 | 2008 | |||||||||||||||
| Reconciliation to gross profit: |
||||||||||||||||||||
| Gross profit |
$ | 1,845,223 | $ | 1,798,517 | $ | 1,786,690 | $ | 1,251,429 | $ | 782,164 | ||||||||||
| Cost of products sold – restructuring |
38,552 | 54,089 | 3,870 | — | 1,510 | |||||||||||||||
| Cost of products sold – merger and integration |
4,610 | — | — | — | — | |||||||||||||||
|
|
|
|
|
|
|
|
|
|
|
|||||||||||
| Gross profit excluding special project costs |
$ | 1,888,385 | $ | 1,852,606 | $ | 1,790,560 | $ | 1,251,429 | $ | 783,674 | ||||||||||
|
|
|
|
|
|
|
|
|
|
|
|||||||||||
| Reconciliation to operating income: |
||||||||||||||||||||
| Operating income |
$ | 778,283 | $ | 784,272 | $ | 790,909 | $ | 452,275 | $ | 284,559 | ||||||||||
| Cost of products sold – restructuring |
38,552 | 54,089 | 3,870 | — | 1,510 | |||||||||||||||
| Cost of products sold – merger and integration |
4,610 | — | — | — | — | |||||||||||||||
| Other restructuring costs |
42,589 | 47,868 | 1,841 | 10,229 | 3,237 | |||||||||||||||
| Other merger and integration costs |
29,904 | 11,194 | 33,692 | 72,666 | 7,967 | |||||||||||||||
|
|
|
|
|
|
|
|
|
|
|
|||||||||||
| Operating income excluding special project costs |
$ | 893,938 | $ | 897,423 | $ | 830,312 | $ | 535,170 | $ | 297,273 | ||||||||||
|
|
|
|
|
|
|
|
|
|
|
|||||||||||
| Reconciliation to net income: |
||||||||||||||||||||
| Net income |
$ | 459,744 | $ | 479,482 | $ | 494,138 | $ | 265,953 | $ | 170,379 | ||||||||||
| Income taxes |
241,414 | 237,682 | 236,615 | 130,112 | 84,409 | |||||||||||||||
| Cost of products sold – restructuring |
38,552 | 54,089 | 3,870 | — | 1,510 | |||||||||||||||
| Cost of products sold – merger and integration |
4,610 | — | — | — | — | |||||||||||||||
| Other restructuring costs |
42,589 | 47,868 | 1,841 | 10,229 | 3,237 | |||||||||||||||
| Other merger and integration costs |
29,904 | 11,194 | 33,692 | 72,666 | 7,967 | |||||||||||||||
|
|
|
|
|
|
|
|
|
|
|
|||||||||||
| Income before income taxes excluding special project costs |
$ | 816,813 | $ | 830,315 | $ | 770,156 | $ | 478,960 | $ | 267,502 | ||||||||||
| Income taxes, as adjusted |
281,234 | 275,182 | 249,374 | 157,343 | 88,621 | |||||||||||||||
|
|
|
|
|
|
|
|
|
|
|
|||||||||||
| Income excluding special project costs |
$ | 535,579 | $ | 555,133 | $ | 520,782 | $ | 321,617 | $ | 178,881 | ||||||||||
| Weighted-average shares – assuming dilution |
113,313,567 | 118,276,086 | 119,081,445 | 85,547,530 | 56,873,492 | |||||||||||||||
| Income per common share excluding special project costs – assuming dilution |
$ | 4.73 | $ | 4.69 | $ | 4.37 | $ | 3.76 | $ | 3.15 | ||||||||||
|
|
|
|
|
|
|
|
|
|
|
|||||||||||
| 32 The J. M. Smucker Company 2012 Annual Report |
MANAGEMENT’S DISCUSSION AND ANALYSIS
The J. M. Smucker Company
| The J. M. Smucker Company 2012 Annual Report 33 |
MANAGEMENT’S DISCUSSION AND ANALYSIS
The J. M. Smucker Company
| 34 The J. M. Smucker Company 2012 Annual Report |
MANAGEMENT’S DISCUSSION AND ANALYSIS
The J. M. Smucker Company
| The J. M. Smucker Company 2012 Annual Report 35 |
MANAGEMENT’S DISCUSSION AND ANALYSIS
The J. M. Smucker Company
| 36 The J. M. Smucker Company 2012 Annual Report |
REPORT OF MANAGEMENT ON INTERNAL CONTROL OVER FINANCIAL REPORTING
The J. M. Smucker Company
Shareholders
The J. M. Smucker Company
Management of The J. M. Smucker Company is responsible for establishing and maintaining adequate accounting and internal control systems over financial reporting, as such term is defined in Rules 13a-15(f) and 15d-15(f) under the Securities and Exchange Act of 1934, as amended. The Company’s internal control system is designed to provide reasonable assurance that the Company has the ability to record, process, summarize, and report reliable financial information on a timely basis.
The Company’s management, with the participation of the principal financial and executive officers, assessed the effectiveness of the Company’s internal control over financial reporting as of April 30, 2012. In making this assessment, management used the criteria established in Internal Control – Integrated Framework issued by the Committee of Sponsoring Organizations of the Treadway Commission (“the COSO criteria”).
Based on the Company’s assessment of internal control over financial reporting under the COSO criteria, management concluded the Company’s internal control over financial reporting was effective as of April 30, 2012.
Ernst & Young LLP, an independent registered public accounting firm, audited the effectiveness of the Company’s internal control over financial reporting as of April 30, 2012, and their report thereon is included on page 38 of this report.
| Richard K. Smucker | Mark R. Belgya | |||||
| Chief Executive Officer | Senior Vice President and | |||||
| Chief Financial Officer |
| The J. M. Smucker Company 2012 Annual Report 37 |
REPORT OF INDEPENDENT REGISTERED PUBLIC ACCOUNTING FIRM ON INTERNAL CONTROL OVER FINANCIAL REPORTING
The J. M. Smucker Company
Board of Directors and Shareholders
The J. M. Smucker Company
We have audited The J. M. Smucker Company’s internal control over financial reporting as of April 30, 2012, based on criteria established in Internal Control – Integrated Framework issued by the Committee of Sponsoring Organizations of the Treadway Commission (“the COSO criteria”). The J. M. Smucker Company’s management is responsible for maintaining effective internal control over financial reporting, and for its assessment of the effectiveness of internal control over financial reporting included in the accompanying Report of Management on Internal Control Over Financial Reporting. Our responsibility is to express an opinion on the Company’s internal control over financial reporting based on our audit.
We conducted our audit in accordance with the standards of the Public Company Accounting Oversight Board (United States). Those standards require that we plan and perform the audit to obtain reasonable assurance about whether effective internal control over financial reporting was maintained in all material respects. Our audit included obtaining an understanding of internal control over financial reporting, assessing the risk that a material weakness exists, testing and evaluating the design and operating effectiveness of internal control based on the assessed risk, and performing such other procedures as we considered necessary in the circumstances. We believe that our audit provides a reasonable basis for our opinion.
A company’s internal control over financial reporting is a process designed to provide reasonable assurance regarding the reliability of financial reporting and the preparation of financial statements for external purposes in accordance with generally accepted accounting principles. A company’s internal control over financial reporting includes those policies and procedures that (1) pertain to the maintenance of records that, in reasonable detail, accurately and fairly reflect the transactions and dispositions of the assets of the company; (2) provide reasonable assurance that transactions are recorded as necessary to permit preparation of financial statements in accordance with generally accepted accounting principles, and that receipts and expenditures of the company are being made only in accordance with authorizations of management and directors of the company; and (3) provide reasonable assurance regarding prevention or timely detection of unauthorized acquisition, use, or disposition of the company’s assets that could have a material effect on the financial statements.
Because of its inherent limitations, internal control over financial reporting may not prevent or detect misstatements. Also, projections of any evaluation of effectiveness to future periods are subject to the risk that controls may become inadequate because of changes in conditions, or that the degree of compliance with the policies or procedures may deteriorate.
In our opinion, The J. M. Smucker Company maintained, in all material respects, effective internal control over financial reporting as of April 30, 2012, based on the COSO criteria.
We also have audited, in accordance with the standards of the Public Company Accounting Oversight Board (United States), the consolidated balance sheets of The J. M. Smucker Company as of April 30, 2012 and 2011, and the related statements of consolidated income, shareholders’ equity, and cash flows for each of the three years in the period ended April 30, 2012, and our report dated June 20, 2012, expressed an unqualified opinion thereon.

|
Akron, Ohio
June 20, 2012
| 38 The J. M. Smucker Company 2012 Annual Report |
REPORT OF INDEPENDENT REGISTERED PUBLIC ACCOUNTING FIRM ON THE CONSOLIDATED FINANCIAL STATEMENTS
The J. M. Smucker Company
Board of Directors and Shareholders
The J. M. Smucker Company
We have audited the accompanying consolidated balance sheets of The J. M. Smucker Company as of April 30, 2012 and 2011, and the related statements of consolidated income, shareholders’ equity, and cash flows for each of the three years in the period ended April 30, 2012. These financial statements are the responsibility of the Company’s management. Our responsibility is to express an opinion on these financial statements based on our audits.
We conducted our audits in accordance with the standards of the Public Company Accounting Oversight Board (United States). Those standards require that we plan and perform the audit to obtain reasonable assurance about whether the financial statements are free of material misstatement. An audit includes examining, on a test basis, evidence supporting the amounts and disclosures in the financial statements. An audit also includes assessing the accounting principles used and significant estimates made by management, as well as evaluating the overall financial statement presentation. We believe that our audits provide a reasonable basis for our opinion.
In our opinion, the consolidated financial statements referred to above present fairly, in all material respects, the consolidated financial position of The J. M. Smucker Company at April 30, 2012 and 2011, and the consolidated results of its operations and its cash flows for each of the three years in the period ended April 30, 2012, in conformity with U.S. generally accepted accounting principles.
We also have audited in accordance with the standards of the Public Company Accounting Oversight Board (United States), The
J. M. Smucker Company’s internal control over financial reporting as of April 30, 2012, based on criteria established in Internal Control – Integrated Framework issued by the Committee of Sponsoring Organizations of the Treadway Commission and our report dated June 20, 2012, expressed an unqualified opinion thereon.
|
Akron, Ohio
June 20, 2012
| The J. M. Smucker Company 2012 Annual Report 39 |
REPORT OF MANAGEMENT ON RESPONSIBILITY FOR FINANCIAL REPORTING
The J. M. Smucker Company
Shareholders
The J. M. Smucker Company
Management of The J. M. Smucker Company is responsible for the preparation, integrity, accuracy, and consistency of the consolidated financial statements and the related financial information in this report. Such information has been prepared in accordance with U.S. generally accepted accounting principles and is based on our best estimates and judgments.
The Company maintains systems of internal accounting controls supported by formal policies and procedures that are communicated throughout the Company. There is a program of audits performed by the Company’s internal audit staff designed to evaluate the adequacy of and adherence to these controls, policies, and procedures.
Ernst & Young LLP, an independent registered public accounting firm, has audited the Company’s financial statements in accordance with the standards of the Public Company Accounting Oversight Board (United States). Management has made all financial records and related data available to Ernst & Young LLP during its audit.
The Company’s audit committee, comprised of three non-employee members of the Board of Directors, meets regularly with the independent registered public accounting firm and management to review the work of the internal audit staff and the work, audit scope, timing arrangements, and fees of the independent registered public accounting firm. The audit committee also regularly satisfies itself as to the adequacy of controls, systems, and financial records. The manager of the internal audit department is required to report directly to the chair of the audit committee as to internal audit matters.
It is the Company’s best judgment that its policies and procedures, its program of internal and independent audits, and the oversight activity of the audit committee work together to provide reasonable assurance that the operations of the Company are conducted according to law and in compliance with the high standards of business ethics and conduct to which the Company subscribes.
| Richard K. Smucker | Mark R. Belgya | |||||
| Chief Executive Officer | Senior Vice President and | |||||
| Chief Financial Officer |
| 40 The J. M. Smucker Company 2012 Annual Report |
For the fiscal year ended April 30, 2012
STATEMENTS OF CONSOLIDATED INCOME
The J. M. Smucker Company
| Year Ended April 30, | ||||||||||||
| (Dollars in thousands, except per share data) |
2012 | 2011 | 2010 | |||||||||
| Net sales |
$ | 5,525,782 | $ | 4,825,743 | $ | 4,605,289 | ||||||
| Cost of products sold |
3,637,397 | 2,973,137 | 2,814,729 | |||||||||
| Cost of products sold – restructuring |
38,552 | 54,089 | 3,870 | |||||||||
| Cost of products sold – merger and integration |
4,610 | — | — | |||||||||
|
|
|
|
|
|
|
|||||||
| Gross Profit |
1,845,223 | 1,798,517 | 1,786,690 | |||||||||
| Selling, distribution, and administrative expenses |
892,683 | 863,114 | 878,221 | |||||||||
| Amortization |
88,060 | 73,844 | 73,657 | |||||||||
| Impairment charges |
4,590 | 17,599 | 11,658 | |||||||||
| Other restructuring costs |
42,589 | 47,868 | 1,841 | |||||||||
| Other merger and integration costs |
29,904 | 11,194 | 33,692 | |||||||||
| Loss (gain) on divestitures |
11,287 | — | (13,607 | ) | ||||||||
| Other operating (income) expense – net |
(2,173 | ) | 626 | 10,319 | ||||||||
|
|
|
|
|
|
|
|||||||
| Operating Income |
778,283 | 784,272 | 790,909 | |||||||||
| Interest income |
1,504 | 2,512 | 2,793 | |||||||||
| Interest expense |
(81,296 | ) | (69,594 | ) | (65,187 | ) | ||||||
| Other income (expense) – net |
2,667 | (26 | ) | 2,238 | ||||||||
|
|
|
|
|
|
|
|||||||
| Income Before Income Taxes |
701,158 | 717,164 | 730,753 | |||||||||
| Income taxes |
241,414 | 237,682 | 236,615 | |||||||||
|
|
|
|
|
|
|
|||||||
| Net Income |
$ | 459,744 | $ | 479,482 | $ | 494,138 | ||||||
|
|
|
|
|
|
|
|||||||
| Earnings per common share: |
||||||||||||
| Net Income |
$ | 4.06 | $ | 4.06 | $ | 4.15 | ||||||
|
|
|
|
|
|
|
|||||||
| Net Income – Assuming Dilution |
$ | 4.06 | $ | 4.05 | $ | 4.15 | ||||||
|
|
|
|
|
|
|
|||||||
See notes to consolidated financial statements.
| The J. M. Smucker Company 2012 Annual Report 41 |
CONSOLIDATED BALANCE SHEETS
The J. M. Smucker Company
| ASSETS | ||||||||
| April 30, | ||||||||
| (Dollars in thousands) |
2012 | 2011 | ||||||
| Current Assets |
||||||||
| Cash and cash equivalents |
$ | 229,708 | $ | 319,845 | ||||
| Trade receivables, less allowance for doubtful accounts |
347,518 | 344,410 | ||||||
| Inventories: |
||||||||
| Finished products |
643,517 | 518,243 | ||||||
| Raw materials |
318,059 | 345,336 | ||||||
|
|
|
|
|
|||||
| 961,576 | 863,579 | |||||||
| Other current assets |
104,663 | 109,165 | ||||||
|
|
|
|
|
|||||
| Total Current Assets |
1,643,465 | 1,636,999 | ||||||
|
|
|
|
|
|||||
| Property, Plant, and Equipment |
||||||||
| Land and land improvements |
89,599 | 77,074 | ||||||
| Buildings and fixtures |
460,242 | 347,950 | ||||||
| Machinery and equipment |
1,160,307 | 1,022,670 | ||||||
| Construction in progress |
142,983 | 76,778 | ||||||
|
|
|
|
|
|||||
| 1,853,131 | 1,524,472 | |||||||
| Accumulated depreciation |
(757,042 | ) | (656,590 | ) | ||||
|
|
|
|
|
|||||
| Total Property, Plant, and Equipment |
1,096,089 | 867,882 | ||||||
|
|
|
|
|
|||||
| Other Noncurrent Assets |
||||||||
| Goodwill |
3,054,618 | 2,812,746 | ||||||
| Other intangible assets – net |
3,187,007 | 2,940,010 | ||||||
| Other noncurrent assets |
134,047 | 66,948 | ||||||
|
|
|
|
|
|||||
| Total Other Noncurrent Assets |
6,375,672 | 5,819,704 | ||||||
|
|
|
|
|
|||||
| $ | 9,115,226 | $ | 8,324,585 | |||||
|
|
|
|
|
|||||
See notes to consolidated financial statements.
| 42 The J. M. Smucker Company 2012 Annual Report |
CONSOLIDATED BALANCE SHEETS
The J. M. Smucker Company
| LIABILITIES AND SHAREHOLDERS’ EQUITY | ||||||||
| April 30, | ||||||||
| (Dollars in thousands) |
2012 | 2011 | ||||||
| Current Liabilities |
||||||||
| Accounts payable |
$ | 274,725 | $ | 234,916 | ||||
| Accrued compensation |
83,261 | 62,313 | ||||||
| Accrued trade marketing and merchandising |
62,111 | 62,588 | ||||||
| Dividends payable |
52,937 | 50,236 | ||||||
| Current portion of long-term debt |
50,000 | — | ||||||
| Other current liabilities |
93,938 | 72,623 | ||||||
|
|
|
|
|
|||||
| Total Current Liabilities |
616,972 | 482,676 | ||||||
|
|
|
|
|
|||||
| Noncurrent Liabilities |
||||||||
| Long-term debt |
2,020,543 | 1,304,039 | ||||||
| Defined benefit pensions |
147,551 | 98,722 | ||||||
| Other postretirement benefits |
68,829 | 59,789 | ||||||
| Deferred income taxes |
992,692 | 1,042,823 | ||||||
| Other noncurrent liabilities |
105,253 | 44,173 | ||||||
|
|
|
|
|
|||||
| Total Noncurrent Liabilities |
3,334,868 | 2,549,546 | ||||||
|
|
|
|
|
|||||
| Shareholders’ Equity |
||||||||
| Serial preferred shares – no par value: |
||||||||
| Authorized – 6,000,000 shares; outstanding – none |
— | — | ||||||
| Common shares – no par value: |
||||||||
| Authorized – 150,000,000 shares; outstanding – 110,284,715 at April 30, 2012, and 114,172,122 at April 30, 2011 (net of 18,320,450 and 14,432,043 treasury shares, respectively), at stated value |
27,571 | 28,543 | ||||||
| Additional capital |
4,261,171 | 4,396,592 | ||||||
| Retained income |
961,207 | 866,933 | ||||||
| Amount due from ESOP Trust |
(2,572 | ) | (3,334 | ) | ||||
| Accumulated other comprehensive (loss) income |
(83,991 | ) | 3,629 | |||||
|
|
|
|
|
|||||
| Total Shareholders’ Equity |
5,163,386 | 5,292,363 | ||||||
|
|
|
|
|
|||||
| $ | 9,115,226 | $ | 8,324,585 | |||||
|
|
|
|
|
|||||
See notes to consolidated financial statements.
| The J. M. Smucker Company 2012 Annual Report 43 |
STATEMENTS OF CONSOLIDATED CASH FLOWS
The J. M. Smucker Company
| Year Ended April 30, | ||||||||||||
| (Dollars in thousands) |
2012 | 2011 | 2010 | |||||||||
| Operating Activities |
||||||||||||
| Net income |
$ | 459,744 | $ | 479,482 | $ | 494,138 | ||||||
| Adjustments to reconcile net income to net cash provided by operations: |
||||||||||||
| Depreciation |
120,366 | 112,226 | 108,225 | |||||||||
| Depreciation – restructuring and merger and integration |
38,570 | 53,569 | 3,870 | |||||||||
| Amortization |
88,060 | 73,844 | 73,657 | |||||||||
| Impairment charges |
4,590 | 17,599 | 11,658 | |||||||||
| Share-based compensation expense |
21,711 | 24,044 | 25,949 | |||||||||
| Other noncash restructuring charges |
8,030 | 8,540 | — | |||||||||
| Loss on sale of assets – net |
3,390 | 2,867 | 5,776 | |||||||||
| Loss (gain) on divestitures |
11,287 | — | (13,607 | ) | ||||||||
| Deferred income tax benefit |
(17,218 | ) | (59,801 | ) | (39,320 | ) | ||||||
| Changes in assets and liabilities, net of effect from businesses acquired: |
||||||||||||
| Trade receivables |
9,286 | (102,625 | ) | 31,521 | ||||||||
| Inventories |
(48,189 | ) | (204,159 | ) | (46,160 | ) | ||||||
| Other current assets |
2,978 | (33,443 | ) | 2,683 | ||||||||
| Accounts payable and accrued items |
72,774 | 84,633 | (34,620 | ) | ||||||||
| Proceeds from settlement of interest rate swaps – net |
17,718 | — | — | |||||||||
| Defined benefit pension contributions |
(11,428 | ) | (16,779 | ) | (4,436 | ) | ||||||
| Accrued and prepaid taxes |
(2,959 | ) | (78,393 | ) | 56,227 | |||||||
| Other – net |
(47,781 | ) | 29,958 | 37,917 | ||||||||
|
|
|
|
|
|
|
|||||||
| Net Cash Provided by Operating Activities |
730,929 | 391,562 | 713,478 | |||||||||
|
|
|
|
|
|
|
|||||||
| Investing Activities |
||||||||||||
| Businesses acquired, net of cash acquired |
(737,255 | ) | — | — | ||||||||
| Additions to property, plant, and equipment |
(274,244 | ) | (180,080 | ) | (136,983 | ) | ||||||
| Equity investment in affiliate |
(35,874 | ) | — | — | ||||||||
| Proceeds from divestitures |
9,268 | — | 19,554 | |||||||||
| Purchases of marketable securities |
— | (75,637 | ) | — | ||||||||
| Sales and maturities of marketable securities |
18,600 | 57,100 | 13,519 | |||||||||
| Proceeds from disposal of property, plant, and equipment |
4,039 | 5,830 | 205 | |||||||||
| Other – net |
(20,398 | ) | (126 | ) | (738 | ) | ||||||
|
|
|
|
|
|
|
|||||||
| Net Cash Used for Investing Activities |
(1,035,864 | ) | (192,913 | ) | (104,443 | ) | ||||||
|
|
|
|
|
|
|
|||||||
| Financing Activities |
||||||||||||
| Repayment of bank note payable |
— | — | (350,000 | ) | ||||||||
| Repayments of long-term debt |
— | (10,000 | ) | (275,000 | ) | |||||||
| Proceeds from long-term debt |
748,560 | 400,000 | — | |||||||||
| Quarterly dividends paid |
(213,667 | ) | (194,024 | ) | (166,224 | ) | ||||||
| Purchase of treasury shares |
(315,780 | ) | (389,135 | ) | (5,569 | ) | ||||||
| Proceeds from stock option exercises |
2,826 | 14,525 | 6,413 | |||||||||
| Other – net |
(2,313 | ) | 8,215 | 1,832 | ||||||||
|
|
|
|
|
|
|
|||||||
| Net Cash Provided by (Used for) Financing Activities |
219,626 | (170,419 | ) | (788,548 | ) | |||||||
| Effect of exchange rate changes on cash |
(4,828 | ) | 8,045 | 6,390 | ||||||||
|
|
|
|
|
|
|
|||||||
| Net (decrease) increase in cash and cash equivalents |
(90,137 | ) | 36,275 | (173,123 | ) | |||||||
| Cash and cash equivalents at beginning of year |
319,845 | 283,570 | 456,693 | |||||||||
|
|
|
|
|
|
|
|||||||
| Cash and Cash Equivalents at End of Year |
$ | 229,708 | $ | 319,845 | $ | 283,570 | ||||||
|
|
|
|
|
|
|
|||||||
| ( ) | Denotes use of cash |
See notes to consolidated financial statements.
| 44 The J. M. Smucker Company 2012 Annual Report |
STATEMENTS OF CONSOLIDATED SHAREHOLDERS’ EQUITY
The J. M. Smucker Company
| (Dollars in thousands, except per share data) |
Common Shares Outstanding |
Common Shares |
Additional Capital |
Retained Income |
Amount Due from ESOP Trust |
Accumulated Other Comprehensive (Loss) Income |
Total Shareholders’ Equity |
|||||||||||||||||||||
| Balance at May 1, 2009 |
118,422,123 | $ | 29,606 | $ | 4,547,921 | $ | 424,504 | $ | (4,830 | ) | $ | (57,270 | ) | $ | 4,939,931 | |||||||||||||
| Net income |
494,138 | 494,138 | ||||||||||||||||||||||||||
| Foreign currency translation adjustment |
45,926 | 45,926 | ||||||||||||||||||||||||||
| Pensions and other postretirement liabilities |
(12,313 | ) | (12,313 | ) | ||||||||||||||||||||||||
| Unrealized gain on available-for-sale securities |
2,652 | 2,652 | ||||||||||||||||||||||||||
| Unrealized gain on cash flow hedging derivatives |
424 | 424 | ||||||||||||||||||||||||||
|
|
|
|||||||||||||||||||||||||||
| Comprehensive Income |
530,827 | |||||||||||||||||||||||||||
| Purchase of treasury shares |
(122,483 | ) | (31 | ) | (5,383 | ) | (155 | ) | (5,569 | ) | ||||||||||||||||||
| Stock plans |
819,512 | 205 | 29,584 | 29,789 | ||||||||||||||||||||||||
| Cash dividends declared – $1.45 per share |
(172,424 | ) | (172,424 | ) | ||||||||||||||||||||||||
| Tax benefit of stock plans |
3,005 | 3,005 | ||||||||||||||||||||||||||
| Other |
761 | 761 | ||||||||||||||||||||||||||
|
|
|
|
|
|
|
|
|
|
|
|
|
|
|
|||||||||||||||
| Balance at April 30, 2010 |
119,119,152 | 29,780 | 4,575,127 | 746,063 | (4,069 | ) | (20,581 | ) | 5,326,320 | |||||||||||||||||||
| Net income |
479,482 | 479,482 | ||||||||||||||||||||||||||
| Foreign currency translation adjustment |
24,773 | 24,773 | ||||||||||||||||||||||||||
| Pensions and other postretirement liabilities |
(5,928 | ) | (5,928 | ) | ||||||||||||||||||||||||
| Unrealized gain on available-for-sale securities |
1,359 | 1,359 | ||||||||||||||||||||||||||
| Unrealized gain on cash flow hedging derivatives |
4,006 | 4,006 | ||||||||||||||||||||||||||
|
|
|
|||||||||||||||||||||||||||
| Comprehensive Income |
503,692 | |||||||||||||||||||||||||||
| Purchase of treasury shares |
(5,832,423 | ) | (1,458 | ) | (225,677 | ) | (162,000 | ) | (389,135 | ) | ||||||||||||||||||
| Stock plans |
885,393 | 221 | 39,832 | 40,053 | ||||||||||||||||||||||||
| Cash dividends declared – $1.68 per share |
(196,612 | ) | (196,612 | ) | ||||||||||||||||||||||||
| Tax benefit of stock plans |
7,310 | 7,310 | ||||||||||||||||||||||||||
| Other |
735 | 735 | ||||||||||||||||||||||||||
|
|
|
|
|
|
|
|
|
|
|
|
|
|
|
|||||||||||||||
| Balance at April 30, 2011 |
114,172,122 | 28,543 | 4,396,592 | 866,933 | (3,334 | ) | 3,629 | 5,292,363 | ||||||||||||||||||||
| Net income |
459,744 | 459,744 | ||||||||||||||||||||||||||
| Foreign currency translation adjustment |
(14,785 | ) | (14,785 | ) | ||||||||||||||||||||||||
| Pensions and other postretirement liabilities |
(48,329 | ) | (48,329 | ) | ||||||||||||||||||||||||
| Unrealized gain on available-for-sale securities |
742 | 742 | ||||||||||||||||||||||||||
| Unrealized loss on cash flow hedging derivatives |
(25,248 | ) | (25,248 | ) | ||||||||||||||||||||||||
|
|
|
|||||||||||||||||||||||||||
| Comprehensive Income |
372,124 | |||||||||||||||||||||||||||
| Purchase of treasury shares |
(4,236,430 | ) | (1,059 | ) | (165,619 | ) | (149,102 | ) | (315,780 | ) | ||||||||||||||||||
| Stock plans |
349,023 | 87 | 25,373 | 25,460 | ||||||||||||||||||||||||
| Cash dividends declared – $1.92 per share |
(216,368 | ) | (216,368 | ) | ||||||||||||||||||||||||
| Tax benefit of stock plans |
4,825 | 4,825 | ||||||||||||||||||||||||||
| Other |
762 | 762 | ||||||||||||||||||||||||||
|
|
|
|
|
|
|
|
|
|
|
|
|
|
|
|||||||||||||||
| Balance at April 30, 2012 |
110,284,715 | $ | 27,571 | $ | 4,261,171 | $ | 961,207 | $ | (2,572 | ) | $ | (83,991 | ) | $ | 5,163,386 | |||||||||||||
|
|
|
|
|
|
|
|
|
|
|
|
|
|
|
|||||||||||||||
See notes to consolidated financial statements.
| The J. M. Smucker Company 2012 Annual Report 45 |
NOTES TO CONSOLIDATED FINANCIAL STATEMENTS
The J. M. Smucker Company
(Dollars in thousands, unless otherwise noted, except per share data)
| NOTE 1 | ACCOUNTING POLICIES |
Principles of Consolidation: The consolidated financial statements include the accounts of the Company, its wholly-owned subsidiaries, and its majority-owned investments, if any. Intercompany transactions and accounts are eliminated in consolidation.
Use of Estimates: The preparation of consolidated financial statements in conformity with U.S. generally accepted accounting principles requires management to make certain estimates and assumptions that affect the amounts reported in the consolidated financial statements and accompanying notes. Significant estimates in these consolidated financial statements include: allowances for doubtful trade receivables, estimates of future cash flows associated with assets, asset impairments, useful lives and residual values for depreciation and amortization, loss contingencies, net realizable value of inventories, accruals for trade marketing and merchandising programs, income taxes, and the determination of discount and other rate assumptions for defined benefit pension and other postretirement benefit expenses. Actual results could differ from these estimates.
Revenue Recognition: The Company recognizes revenue, net of estimated returns and allowances, when all of the following criteria have been met: a valid customer order with a determinable price has been received; the product has been shipped and title has transferred to the customer; there is no further significant obligation to assist in the resale of the product; and collectibility is reasonably assured.
Major Customer: Sales to Wal-Mart Stores, Inc. and subsidiaries amounted to approximately 26 percent of net sales in both 2012 and 2011, and 27 percent of net sales in 2010. These sales are primarily included in the two U.S. retail market segments. No other customer exceeded 10 percent of net sales for any year. Trade receivables at April 30, 2012 and 2011, included amounts due from Wal-Mart Stores, Inc. and subsidiaries of $84,068 and $87,623, respectively.
Shipping and Handling Costs: Shipping and handling costs are included in cost of products sold.
Trade Marketing and Merchandising Programs: In order to support the Company’s products, various promotional activities are conducted through retail trade, distributors, or directly with consumers, including in-store display and product placement programs, feature price discounts, coupons, and other similar activities. The Company regularly reviews and revises, when it deems necessary, estimates of costs to the Company for these promotional programs based on estimates of what will be redeemed by retail trade, distributors, or consumers. These estimates are made using various techniques including historical data on performance of similar promotional programs. Differences between estimated expenditures and actual performance are recognized as a change in management’s estimate in a subsequent period. As the Company’s total promotional expenditures, including amounts classified as a reduction of net sales, represented approximately 23 percent of net sales in 2012, a possibility exists of materially different reported results if factors such as the level and success of the promotional programs or other conditions differ from expectations.
Advertising Expense: Advertising costs are expensed as incurred. Advertising expense was $119,600, $115,066, and $130,583 in 2012, 2011, and 2010, respectively.
Research and Development Costs: Total research and development costs were $21,931, $20,981, and $20,963 in 2012, 2011, and 2010, respectively.
Share-Based Payments: Share-based compensation expense is recognized over the requisite service period, which includes a one-year performance period plus the defined forfeiture period, which is typically four years of service or the attainment of a defined age and years of service.
The following table summarizes amounts related to share-based payments.
| Year Ended April 30, | ||||||||||||
| 2012 | 2011 | 2010 | ||||||||||
| Share-based compensation expense included in selling, distribution, and administrative expenses |
$ | 19,292 | $ | 19,896 | $ | 20,687 | ||||||
| Share-based compensation expense included in other merger and integration costs |
2,419 | 4,148 | 5,262 | |||||||||
| Share-based compensation expense included in other restructuring costs |
105 | 290 | — | |||||||||
|
|
|
|
|
|
|
|||||||
| Total share-based compensation expense |
$ | 21,816 | $ | 24,334 | $ | 25,949 | ||||||
|
|
|
|
|
|
|
|||||||
| Related income tax benefit |
$ | 7,511 | $ | 8,064 | $ | 8,402 | ||||||
|
|
|
|
|
|
|
|||||||
| 46 The J. M. Smucker Company 2012 Annual Report |
NOTES TO CONSOLIDATED FINANCIAL STATEMENTS
The J. M. Smucker Company
As of April 30, 2012, total unrecognized share-based compensation cost related to nonvested share-based awards was approximately $29,881. The weighted-average period over which this amount is expected to be recognized is 2.9 years.
Corporate income tax benefits realized upon exercise or vesting of an award in excess of that previously recognized in earnings, referred to as excess tax benefits, are presented in the Statements of Consolidated Cash Flows as a financing activity. Realized excess tax benefits are credited to additional capital in the Consolidated Balance Sheets. Realized shortfall tax benefits, amounts which are less than that previously recognized in earnings, are first offset against the cumulative balance of excess tax benefits, if any, and then charged directly to income tax expense. For 2012, 2011, and 2010, the actual tax deductible benefit realized from share-based compensation was $4,825, $7,310, and $3,005, including $4,832, $6,990, and $2,908, respectively, of excess tax benefits realized upon exercise or vesting of share-based compensation, and classified as other – net, under financing activities in the Statements of Consolidated Cash Flows.
Defined Contribution Plans: The Company offers employee savings plans for domestic and Canadian employees. The Company’s contributions under these plans are based on a specified percentage of employee contributions. Charges to operations for these plans in 2012, 2011, and 2010 were $16,078, $16,440, and $15,625, respectively.
Income Taxes: The Company accounts for income taxes using the liability method. Accordingly, deferred tax assets and liabilities are recognized for the future tax consequences attributable to differences between financial statement carrying amounts of existing assets and liabilities and their respective tax bases. Deferred tax assets and liabilities are measured using enacted tax rates expected to apply to taxable income in the years in which those temporary differences are expected to be recovered or settled. The effect on deferred tax assets and liabilities of a change in the applicable tax rate is recognized in income or expense in the period that the change is effective. A valuation allowance is established when it is more likely than not that all or a portion of a deferred tax asset will not be realized. A tax benefit is recognized when it is more likely than not to be sustained.
The Company accounts for the financial statement recognition and measurement criteria of a tax position taken or expected to be taken in a tax return under Financial Accounting Standards Board (“FASB”) Accounting Standards Codification (“ASC”) 740, Income Taxes. FASB ASC 740 also provides guidance on derecognition, classification, interest and penalties, accounting in interim periods, disclosure, and transition.
In accordance with the requirements of FASB ASC 740, uncertain tax positions have been classified in the Consolidated Balance Sheets as long term, except to the extent payment is expected within one year. The Company recognizes net interest and penalties related to unrecognized tax benefits in income tax expense.
Cash and Cash Equivalents: The Company considers all short-term, highly-liquid investments with a maturity of three months or less when purchased to be cash equivalents.
Trade Receivables: In the normal course of business, the Company extends credit to customers. Trade receivables, less allowance for doubtful accounts, reflect the net realizable value of receivables and approximate fair value. The Company evaluates its trade receivables and establishes an allowance for doubtful accounts based on a combination of factors. When aware that a specific customer has been impacted by circumstances such as bankruptcy filings or deterioration in the customer’s operating results or financial position, potentially making it unable to meet its financial obligations, the Company records a specific reserve for bad debt to reduce the related receivable to the amount the Company reasonably believes is collectible. The Company also records reserves for bad debt for all other customers based on a variety of factors, including the length of time the receivables are past due, historical collection experience, and an evaluation of current and projected economic conditions at the balance sheet date. Trade receivables are charged off against the allowance after management determines the potential for recovery is remote. At April 30, 2012 and 2011, the allowance for doubtful accounts was $1,715 and $1,882, respectively. The net provision for the allowance for doubtful accounts decreased $167 and $480 in 2012 and 2010, respectively, and increased $361 in 2011. The Company believes there is no concentration of risk with any single customer whose failure or nonperformance would materially affect the Company’s results other than as discussed in Major Customer.
Inventories: Inventories are stated at the lower of cost or market. Cost for all inventories is determined using the first-in, first-out method applied on a consistent basis.
The cost of finished products and work-in-process inventory includes materials, direct labor, and overhead. Work-in-process is included in finished products in the Consolidated Balance Sheets and was $78,344 and $77,594 at April 30, 2012 and 2011, respectively.
| The J. M. Smucker Company 2012 Annual Report 47 |
NOTES TO CONSOLIDATED FINANCIAL STATEMENTS
The J. M. Smucker Company
Derivative Financial Instruments: The Company utilizes derivative instruments such as basis contracts, commodity futures and options contracts, foreign currency forwards and options, and interest rate swaps to manage exposures in commodity prices, foreign currency exchange rates, and interest rates. The Company accounts for these derivative instruments in accordance with FASB ASC 815, Derivatives and Hedging, which requires all derivative instruments to be recognized in the financial statements and measured at fair value regardless of the purpose or intent for holding them. For derivatives designated as a cash flow hedge that are used to hedge an anticipated transaction, changes in fair value are deferred and recognized in shareholders’ equity as a component of accumulated other comprehensive (loss) income to the extent the hedge is effective and then recognized in the Statements of Consolidated Income in the period during which the hedged transaction affects earnings. Hedge effectiveness is measured at inception and on a monthly basis. Any ineffectiveness associated with the hedge or changes in fair value of derivatives that are nonqualifying are recognized immediately in the Statements of Consolidated Income. Derivatives designated as fair value hedges that are used to hedge against changes in the fair value of the underlying long-term debt are recognized at fair value on the Consolidated Balance Sheets. Changes in the fair value of the derivative are recognized in the Statements of Consolidated Income and are offset by the change in the fair value of the underlying long-term debt. By policy, the Company historically has not entered into derivative financial instruments for trading purposes or for speculation. For additional information, see Note 12: Derivative Financial Instruments.
Property, Plant, and Equipment: Property, plant, and equipment is recognized at cost and is depreciated on a straight-line basis over the estimated useful life of the asset (3 to 20 years for machinery and equipment, 3 to 7 years for capitalized software costs, and 5 to 40 years for buildings, fixtures, and improvements).
In 2012, the Company acquired a majority of the North American foodservice coffee and hot beverage business of Sara Lee Corporation (“Sara Lee foodservice business”), which included $36,168 of coffee brew equipment. Brew equipment is recorded at cost and depreciated on a straight-line basis over an estimated useful life of 3 to 5 years. Brew equipment is included in machinery and equipment in the Consolidated Balance Sheet and was $37,100 at April 30, 2012. For additional information, see Note 2: Acquisitions.
The Company leases certain land, buildings, and equipment for varying periods of time, with renewal options. Rent expense in 2012, 2011, and 2010 totaled $56,502, $57,572, and $55,010, respectively. As of April 30, 2012, the Company’s minimum operating lease obligations were as follows: $22,445 in 2013, $20,577 in 2014, $13,889 in 2015, $11,929 in 2016, and $9,561 in 2017.
Impairment of Long-Lived Assets: In accordance with FASB ASC 360, Property, Plant, and Equipment, long-lived assets, except goodwill and indefinite-lived intangible assets, are reviewed for impairment when circumstances indicate the carrying value of an asset may not be recoverable. Recoverability of assets to be held and used is measured by a comparison of the carrying amount of the assets to future net cash flows estimated by the Company to be generated by such assets. If such assets are considered to be impaired, the impairment to be recognized is the amount by which the carrying amount of the assets exceeds the estimated fair value of the assets. Assets to be disposed of by sale are recognized as held for sale at the lower of carrying value or estimated net realizable value.
Goodwill and Other Intangible Assets: Goodwill is the excess of the purchase price paid over the estimated fair value of the net assets of the business acquired. In accordance with FASB ASC 350, Intangibles – Goodwill and Other, goodwill and other indefinite-lived intangible assets are not amortized but are reviewed at least annually for impairment. The Company conducts its annual test for impairment of goodwill and other indefinite-lived intangible assets as of February 1 of each year. A discounted cash flow valuation technique and a market-based approach are utilized to estimate the fair value of the Company’s reporting units. For annual impairment testing purposes, the Company’s reporting units are its operating segments. The discount rates utilized in the analysis are developed using a weighted-average cost of capital methodology. In addition to the annual test, the Company will test for impairment if events or circumstances occur that would more likely than not reduce the fair value of a reporting unit below its carrying amount. Finite-lived intangible assets are amortized on a straight-line basis over their estimated useful lives. For additional information, see Note 7: Goodwill and Other Intangible Assets.
Marketable Securities and Other Investments: Under the Company’s investment policy, it may invest in debt securities deemed to be investment grade at the time of purchase for general corporate purposes. The Company determines the appropriate categorization of debt securities at the time of purchase and reevaluates such designation at each balance sheet date. The Company categorized all debt securities as available for sale as it had the intent to convert these investments into cash if and when needed. Classification of available-for-sale marketable securities as current or noncurrent is based on whether the conversion to cash is expected to be necessary for operations in the upcoming year, which is consistent with the security’s maturity date.
| 48 The J. M. Smucker Company 2012 Annual Report |
NOTES TO CONSOLIDATED FINANCIAL STATEMENTS
The J. M. Smucker Company
Securities categorized as available for sale are stated at fair value, with unrealized gains and losses reported as a component of accumulated other comprehensive (loss) income. The fair value of available-for-sale marketable securities was $18,600 at April 30, 2011, and was included in other current assets. All available-for-sale securities had matured or were sold prior to April 30, 2012. Proceeds of $18,600, $57,100, and $13,519 have been realized upon maturity or sale of available-for-sale marketable securities in 2012, 2011, and 2010, respectively. The Company uses specific identification to determine the basis on which securities are sold.
The Company also maintains funds for the payment of benefits associated with nonqualified retirement plans. These funds include investments considered to be available-for-sale marketable securities. At April 30, 2012 and 2011, the fair value of these investments was $43,217 and $41,560, respectively, and was included in other noncurrent assets. Included in accumulated other comprehensive (loss) income at April 30, 2012 and 2011, were unrealized gains of $3,984 and $2,817, respectively.
Foreign Currency Translation: Assets and liabilities of the Company’s foreign subsidiaries are translated using the exchange rates in effect at the balance sheet date, while income and expenses are translated using average rates. Translation adjustments are reported as a component of shareholders’ equity in accumulated other comprehensive (loss) income.
Recently Issued Accounting Standards: In June 2011, the FASB issued Accounting Standard Update (“ASU”) 2011-05, Presentation of Comprehensive Income, which eliminates the option to present the components of other comprehensive income as part of the statement of shareholders’ equity and requires the presentation of net income and other comprehensive income to be in a single continuous statement of comprehensive income or in two separate but consecutive statements. ASU 2011-05 does not change the components that are recognized in net income or other comprehensive income. In December 2011, the FASB issued ASU 2011-12, Deferral of the Effective Date for Amendments to the Presentation of Reclassifications of Items Out of Accumulated Other Comprehensive Income in ASU 2011-05, which defers the requirement to present on the face of the financial statements reclassification adjustments for items that are reclassified from accumulated other comprehensive income to net income while the FASB further deliberates this aspect of the standard. ASU 2011-05, as amended by ASU 2011-12, will be effective May 1, 2012, for the Company. Adoption of this guidance requires retrospective application and will affect the presentation of certain elements of the Company’s financial statements, but will not otherwise have an impact on the financial statements.
In September 2011, the FASB issued ASU 2011-08, Testing Goodwill for Impairment, which simplifies the testing of goodwill for impairment. ASU 2011-08 will allow the Company the option to perform either a qualitative test or the first step of the two-step quantitative goodwill impairment test to assess the likelihood that the estimated fair value of a reporting unit is less than the carrying amount. This ASU will also be effective May 1, 2012, for the Company. The Company anticipates that adoption of ASU 2011-08 could change the annual process for goodwill impairment testing, but will not impact the financial statements or disclosures.
In December 2011, the FASB issued ASU 2011-11, Disclosures about Offsetting Assets and Liabilities. ASU 2011-11 requires the disclosure of both gross and net information about instruments and transactions eligible for offset in the consolidated balance sheet. This ASU will be effective May 1, 2013, for the Company and will require retrospective application. The Company anticipates the adoption of ASU 2011-11 will not impact the financial statements, but will expand the disclosures related to derivative instruments.
Risks and Uncertainties: The raw materials used by the Company in each of its segments are primarily commodities and agricultural-based products. Glass, plastic, steel cans, caps, carton board, and corrugate are the principal packaging materials used by the Company. The fruit and vegetable raw materials used by the Company in the production of its food products are purchased from independent growers and suppliers. Green coffee, peanuts, edible oils, sweeteners, milk, flour, corn, and other ingredients are obtained from various suppliers. The availability, quality, and cost of many of these commodities have fluctuated, and may continue to fluctuate, over time. Green coffee is sourced solely from foreign countries and its supply and price are subject to high volatility due to factors such as weather, global supply and demand, pest damage, and political and economic conditions in the source countries. Raw materials are generally available from numerous sources, although the Company has elected to source certain plastic packaging materials from single sources of supply pursuant to long-term contracts. While availability may vary year to year, the Company believes that it will continue to be able to obtain adequate supplies and that alternatives to single-sourced materials are available. The Company has not historically encountered significant shortages of key raw materials. The Company considers its relationships with key material suppliers to be good.
Approximately 28 percent of the Company’s employees are covered by union contracts at 11 locations. The contracts vary in term depending on the location, with three contracts expiring in 2013.
| The J. M. Smucker Company 2012 Annual Report 49 |
NOTES TO CONSOLIDATED FINANCIAL STATEMENTS
The J. M. Smucker Company
The Company insures its business and assets in each country against insurable risks, to the extent that it deems appropriate, based upon an analysis of the relative risks and costs.
Reclassifications: Certain prior year amounts have been reclassified to conform to current year classifications.
| NOTE 2 | ACQUISITIONS |
On January 3, 2012, the Company completed the acquisition of a majority of the North American foodservice coffee and hot beverage business of Sara Lee Corporation, including a state-of-the-art liquid coffee manufacturing facility in Suffolk, Virginia, for $420.6 million in an all-cash transaction. Utilizing proceeds from the 3.50 percent Notes issued in October 2011, the Company paid $375.6 million, net of a working capital adjustment, and will pay Sara Lee Corporation an additional $50.0 million in declining installments over the next 10 years. The additional $50.0 million obligation was included in other current liabilities and other noncurrent liabilities in the Consolidated Balance Sheet and recorded at a present value of $45.0 million as of the date of acquisition. In addition, the Company has incurred one-time costs of $14.2 million through April 30, 2012, directly related to the merger and integration of the acquired Sara Lee foodservice business, and the charges were reported in other merger and integration costs in the Statement of Consolidated Income. Total one-time costs related to the acquisition are estimated to be approximately $25.0 million, consisting primarily of transition services provided by Sara Lee Corporation and employee separation and relocation costs, nearly all of which are cash related. The Company expects the remaining costs to be incurred over the next two fiscal years.
The acquisition included the market-leading liquid coffee concentrate business sold under the licensed Douwe Egberts brand, along with a variety of roast and ground coffee, cappuccino, tea, and cocoa products, sold through foodservice channels in North America. Liquid coffee concentrate adds a unique, high-quality, and technology-driven form of coffee to the Company’s existing foodservice product offering.
The purchase price was allocated to the underlying assets acquired and liabilities assumed based upon their estimated fair values at the date of acquisition. The Company determined the estimated fair values based on independent appraisals, discounted cash flow analyses, and estimates made by management. The purchase price exceeded the estimated fair value of the net identifiable tangible and intangible assets acquired, and, as such, the excess was allocated to goodwill. The amount allocated to goodwill was primarily attributable to anticipated synergies and market expansion. The following table summarizes the estimated fair values of the assets acquired and liabilities assumed at the acquisition date.
| Assets acquired: |
||||
| Cash and cash equivalents |
$ | 1,221 | ||
| Other current assets |
42,619 | |||
| Property, plant, and equipment |
92,775 | |||
| Intangible assets |
138,900 | |||
| Goodwill |
149,948 | |||
| Other noncurrent assets |
863 | |||
|
|
|
|||
| Total assets acquired |
$ | 426,326 | ||
|
|
|
|||
| Liabilities assumed: |
||||
| Current liabilities |
$ | 3,599 | ||
| Noncurrent liabilities |
2,097 | |||
|
|
|
|||
| Total liabilities assumed |
$ | 5,696 | ||
|
|
|
|||
| Net assets acquired |
$ | 420,630 | ||
|
|
|
Goodwill of $149.9 million was assigned to the International, Foodservice, and Natural Foods segment. Of the total goodwill, $143.3 million is deductible for income tax purposes.
The purchase price allocated to the identifiable intangible assets acquired is as follows:
| Intangible assets with finite lives: |
||||
| Customer relationships (10-year useful life) |
$ | 92,000 | ||
| Technology (10-year useful life) |
23,800 | |||
| Trademarks (6-year weighted-average useful life) |
23,100 | |||
|
|
|
|||
| Total intangible assets |
$ | 138,900 | ||
|
|
|
| 50 The J. M. Smucker Company 2012 Annual Report |
NOTES TO CONSOLIDATED FINANCIAL STATEMENTS
The J. M. Smucker Company
The results of operations of the Sara Lee foodservice business are reported in the Company’s consolidated financial statements from the date of acquisition and include $124.2 million of total net sales, included in the International, Foodservice, and Natural Foods segment financial results, and did not have a material impact on segment profit for the year ended April 30, 2012.
On May 16, 2011, the Company completed the acquisition of the coffee brands and business operations of Rowland Coffee Roasters, Inc. (“Rowland Coffee”), a privately-held company headquartered in Miami, Florida, for $362.8 million. The acquisition included a manufacturing, distribution, and office facility in Miami. The Company utilized cash on hand and borrowed $180.0 million under its revolving credit facility to fund the transaction. In addition, the Company has incurred one-time costs of $10.7 million through April 30, 2012, directly related to the merger and integration of Rowland Coffee, which includes approximately $4.6 million in noncash expense items that were reported in cost of products sold. The remaining charges were reported in other merger and integration costs in the Statement of Consolidated Income. Total one-time costs related to the acquisition are estimated to be approximately $25.0 million, including approximately $10.0 million of noncash charges, primarily accelerated depreciation, associated with consolidating coffee production currently in Miami into the Company’s existing facilities in New Orleans, Louisiana. The Company expects the remaining costs to be incurred over the next two fiscal years.
The acquisition of Rowland Coffee, a leading producer of espresso coffee in the U.S., strengthens and broadens the Company’s leadership in the U.S. retail coffee category by adding the leading Hispanic brands, Café Bustelo and Café Pilon, to the Company’s portfolio of brands.
The purchase price was allocated to the underlying assets acquired and liabilities assumed based upon their estimated fair values at the date of acquisition. The Company determined the estimated fair values based on independent appraisals, discounted cash flow analyses, and estimates made by management. The purchase price exceeded the estimated fair value of the net identifiable tangible and intangible assets acquired, and, as such, the excess was allocated to goodwill. The amount allocated to goodwill was primarily attributable to anticipated synergies and market expansion. The following table summarizes the estimated fair values of the assets acquired and liabilities assumed at the acquisition date.
| Assets acquired: |
||||
| Current assets |
$ | 33,971 | ||
| Property, plant, and equipment |
29,227 | |||
| Intangible assets |
213,500 | |||
| Goodwill |
91,675 | |||
|
|
|
|||
| Total assets acquired |
$ | 368,373 | ||
|
|
|
|||
| Liabilities assumed: |
||||
| Current liabilities |
$ | 5,527 | ||
|
|
|
|||
| Total liabilities assumed |
$ | 5,527 | ||
|
|
|
|||
| Net assets acquired |
$ | 362,846 | ||
|
|
|
Goodwill of $84.8 million and $6.9 million was assigned to the U.S. Retail Coffee and the International, Foodservice, and Natural Foods segments, respectively. Of the total goodwill, $88.7 million is deductible for income tax purposes.
The purchase price allocated to the identifiable intangible assets acquired is as follows:
| Intangible assets with finite lives: |
||||
| Customer relationships (19-year weighted-average useful life) |
$ | 147,800 | ||
| Trademark (10-year useful life) |
1,600 | |||
| Intangible assets with indefinite lives: |
||||
| Trademarks |
64,100 | |||
|
|
|
|||
| Total intangible assets |
$ | 213,500 | ||
|
|
|
The results of operations of the Rowland Coffee business are included in the Company’s consolidated financial statements from the date of acquisition and include $99.3 million and $16.0 million of total net sales and $13.9 million and $2.5 million of total segment profit included in the U.S. Retail Coffee and International, Foodservice, and Natural Foods segment financial results, respectively, for the year ended April 30, 2012.
| The J. M. Smucker Company 2012 Annual Report 51 |
NOTES TO CONSOLIDATED FINANCIAL STATEMENTS
The J. M. Smucker Company
If the Sara Lee foodservice business and Rowland Coffee acquisitions had occurred on May 1, 2010, pro forma consolidated net sales would have been approximately $5.7 billion and $5.3 billion for the years ended April 30, 2012 and 2011, respectively, and the contribution of the acquired businesses would not have had a material impact to reported consolidated earnings for the years ended April 30, 2012 and 2011. The pro forma consolidated results do not give effect to the synergies of the acquisitions and are not indicative of the results of operations in future periods.
| NOTE 3 | EQUITY METHOD INVESTMENT |
On March 26, 2012, the Company acquired a 25 percent equity interest in Guilin Seamild Biologic Technology Development Co., Ltd. (“Seamild”), a privately-owned manufacturer and marketer of oats products headquartered in Guilin in the Guangxi province of China, for $35.9 million. Seamild’s products, primarily oatmeal and oat-based cereals, are sold under the leading Seamild brand with distribution in retail channels throughout China. Seamild’s portfolio of quality, trusted products aligns with the Company’s strategy of owning and marketing leading food brands.
The initial investment in Seamild was recorded at cost and is included in other noncurrent assets in the Consolidated Balance Sheet at April 30, 2012. The difference between the carrying amount of the investment and the underlying equity in net assets is primarily attributable to goodwill and other intangible assets. Under the equity method of accounting, the investment is adjusted for the Company’s proportionate share of earnings or losses, including consideration of basis differences resulting from the difference between the initial carrying amount of the investment and the underlying equity in net assets. The investment did not have a material impact on the Company’s consolidated financial statements for the year ended April 30, 2012.
| NOTE 4 | RESTRUCTURING |
In calendar 2010, the Company announced its plan to restructure its coffee, fruit spreads, and Canadian pickle and condiments operations as part of its ongoing efforts to enhance the long-term strength and profitability of its leading brands. The initiative is a long-term investment to optimize production capacity and lower the overall cost structure. It includes capital investments for a new state-of-the-art food manufacturing facility in Orrville, Ohio; consolidation of coffee production in New Orleans, Louisiana; and the transition of the Company’s pickle and condiments production to third-party manufacturers.
Upon completion, the restructuring plan will result in a reduction of approximately 850 full-time positions and the closing of six of the Company’s facilities – Memphis, Tennessee; Ste. Marie, Quebec; Sherman, Texas; Kansas City, Missouri; Dunnville, Ontario; and Delhi Township, Ontario. The Sherman, Dunnville, Delhi Township, and Kansas City facilities have been closed and approximately 70 percent of the full-time positions have been reduced as of April 30, 2012.
During 2012, the Company increased its estimate of the total anticipated restructuring costs from approximately $235.0 million to $245.0 million, consisting primarily of increases to employee separation and site preparation and equipment relocation charges. The Company has incurred cumulative costs of $188.8 million related to the initiative through April 30, 2012. The majority of the remaining costs are anticipated to be recognized over the next two fiscal years.
| 52 The J. M. Smucker Company 2012 Annual Report |
NOTES TO CONSOLIDATED FINANCIAL STATEMENTS
The J. M. Smucker Company
The following table summarizes the restructuring activity, including the liabilities recorded and the total amount expected to be incurred.
| Long-Lived Asset Charges |
Employee Separation |
Site Preparation and Equipment Relocation |
Production Start-up |
Other Costs | Total | |||||||||||||||||||
| Total expected restructuring charge |
$ | 105,000 | $ | 71,000 | $ | 31,000 | $ | 26,000 | $ | 12,000 | $ | 245,000 | ||||||||||||
|
|
|
|
|
|
|
|
|
|
|
|
|
|||||||||||||
| Balance at May 1, 2009 |
$ | — | $ | — | $ | — | $ | — | $ | — | $ | — | ||||||||||||
| Charge to expense |
3,870 | 1,139 | 407 | 16 | 279 | 5,711 | ||||||||||||||||||
| Cash payments |
— | (50 | ) | (407 | ) | (16 | ) | (279 | ) | (752 | ) | |||||||||||||
| Noncash utilization |
(3,870 | ) | — | — | — | — | (3,870 | ) | ||||||||||||||||
|
|
|
|
|
|
|
|
|
|
|
|
|
|||||||||||||
| Balance at April 30, 2010 |
$ | — | $ | 1,089 | $ | — | $ | — | $ | — | $ | 1,089 | ||||||||||||
| Charge to expense |
53,569 | 36,010 | 6,192 | 5,194 | 992 | 101,957 | ||||||||||||||||||
| Cash payments |
— | (18,361 | ) | (6,192 | ) | (5,194 | ) | (992 | ) | (30,739 | ) | |||||||||||||
| Noncash utilization |
(53,569 | ) | (8,540 | ) | — | — | — | (62,109 | ) | |||||||||||||||
|
|
|
|
|
|
|
|
|
|
|
|
|
|||||||||||||
| Balance at April 30, 2011 |
$ | — | $ | 10,198 | $ | — | $ | — | $ | — | $ | 10,198 | ||||||||||||
| Charge to expense |
34,195 | 20,364 | 12,963 | 10,689 | 2,930 | 81,141 | ||||||||||||||||||
| Cash payments |
— | (13,754 | ) | (12,963 | ) | (10,689 | ) | (2,930 | ) | (40,336 | ) | |||||||||||||
| Noncash utilization |
(34,195 | ) | (8,030 | ) | — | — | — | (42,225 | ) | |||||||||||||||
|
|
|
|
|
|
|
|
|
|
|
|
|
|||||||||||||
| Balance at April 30, 2012 |
$ | — | $ | 8,778 | $ | — | $ | — | $ | — | $ | 8,778 | ||||||||||||
|
|
|
|
|
|
|
|
|
|
|
|
|
|||||||||||||
| Remaining expected restructuring charge |
$ | 13,366 | $ | 13,487 | $ | 11,438 | $ | 10,101 | $ | 7,799 | $ | 56,191 | ||||||||||||
|
|
|
|
|
|
|
|
|
|
|
|
|
|||||||||||||
During the years ended April 30, 2012, 2011, and 2010, total restructuring charges of $81.1 million, $102.0 million, and $5.7 million, respectively, were reported in the Statements of Consolidated Income. Of the total restructuring charges, $38.6 million, $54.1 million, and $3.9 million were reported in cost of products sold in the years ended April 30, 2012, 2011, and 2010, respectively. The remaining charges were reported in other restructuring costs. The restructuring costs classified as cost of products sold primarily include long-lived asset charges for accelerated depreciation related to property, plant, and equipment that will be used at the affected production facilities until they are closed or sold.
Employee separation costs include severance, retention bonuses, and pension costs. Severance costs and retention bonuses are being recognized over the estimated future service period of the affected employees. The obligation related to employee separation costs is included in other current liabilities in the Consolidated Balance Sheets. For additional information on the impact of the restructuring plan on defined benefit pension and other postretirement benefit plans, see Note 8: Pensions and Other Postretirement Benefits.
Other costs include professional fees, costs related to closing the facilities, and miscellaneous expenditures associated with the Company’s restructuring initiative and are expensed as incurred.
| NOTE 5 | REPORTABLE SEGMENTS |
The Company operates in one industry: the manufacturing and marketing of food products. The Company has three reportable segments: U.S. Retail Coffee, U.S. Retail Consumer Foods, and International, Foodservice, and Natural Foods. The U.S. Retail Coffee segment primarily represents the domestic sales of Folgers, Dunkin’ Donuts, Millstone, Café Bustelo, and Café Pilon branded coffee; the U.S. Retail Consumer Foods segment primarily includes domestic sales of Smucker’s, Crisco, Jif, Pillsbury, Eagle Brand, Hungry Jack, and Martha White branded products; and the International, Foodservice, and Natural Foods segment is comprised of products distributed domestically and in foreign countries through retail channels, foodservice distributors and operators (e.g., restaurants, lodging, schools and universities, health care operators), and health and natural foods stores and distributors.
| The J. M. Smucker Company 2012 Annual Report 53 |
NOTES TO CONSOLIDATED FINANCIAL STATEMENTS
The J. M. Smucker Company
Segment profit represents revenue, less direct and allocable operating expenses, and is consistent with the way in which the Company manages segments. However, the Company does not represent that the segments, if operated independently, would report the segment profit set forth below, as segment profit excludes certain operating expenses such as corporate administrative expenses. Segment assets represent direct and allocable assets, including certain corporate-held assets such as property, plant, and equipment, and are also set forth in the following table.
| Year Ended April 30, | ||||||||||||
| 2012 | 2011 | 2010 | ||||||||||
| Net sales: |
||||||||||||
| U.S. Retail Coffee |
$ | 2,297,737 | $ | 1,930,869 | $ | 1,700,458 | ||||||
| U.S. Retail Consumer Foods |
2,094,456 | 1,953,043 | 2,004,700 | |||||||||
| International, Foodservice, and Natural Foods |
1,133,589 | 941,831 | 900,131 | |||||||||
|
|
|
|
|
|
|
|||||||
| Total net sales |
$ | 5,525,782 | $ | 4,825,743 | $ | 4,605,289 | ||||||
|
|
|
|
|
|
|
|||||||
| Segment profit: |
||||||||||||
| U.S. Retail Coffee |
$ | 543,012 | $ | 536,133 | $ | 484,006 | ||||||
| U.S. Retail Consumer Foods |
393,300 | 406,455 | 407,721 | |||||||||
| International, Foodservice, and Natural Foods |
168,572 | 159,580 | 140,404 | |||||||||
|
|
|
|
|
|
|
|||||||
| Total segment profit |
$ | 1,104,884 | $ | 1,102,168 | $ | 1,032,131 | ||||||
|
|
|
|
|
|
|
|||||||
| Interest income |
1,504 | 2,512 | 2,793 | |||||||||
| Interest expense |
(81,296 | ) | (69,594 | ) | (65,187 | ) | ||||||
| Share-based compensation expense |
(19,292 | ) | (19,896 | ) | (20,687 | ) | ||||||
| Cost of products sold – restructuring |
(38,552 | ) | (54,089 | ) | (3,870 | ) | ||||||
| Cost of products sold – merger and integration |
(4,610 | ) | — | — | ||||||||
| Other restructuring costs |
(42,589 | ) | (47,868 | ) | (1,841 | ) | ||||||
| Other merger and integration costs |
(29,904 | ) | (11,194 | ) | (33,692 | ) | ||||||
| Corporate administrative expenses |
(191,654 | ) | (184,849 | ) | (181,132 | ) | ||||||
| Other income (expense) – net |
2,667 | (26 | ) | 2,238 | ||||||||
|
|
|
|
|
|
|
|||||||
| Income before income taxes |
$ | 701,158 | $ | 717,164 | $ | 730,753 | ||||||
|
|
|
|
|
|
|
|||||||
| Assets: |
||||||||||||
| U.S. Retail Coffee |
$ | 5,033,561 | $ | 4,830,127 | $ | 4,625,502 | ||||||
| U.S. Retail Consumer Foods |
2,612,732 | 2,416,037 | 2,327,466 | |||||||||
| International, Foodservice, and Natural Foods |
1,179,624 | 684,434 | 694,478 | |||||||||
| Unallocated (A) |
289,309 | 393,987 | 327,407 | |||||||||
|
|
|
|
|
|
|
|||||||
| Total assets |
$ | 9,115,226 | $ | 8,324,585 | $ | 7,974,853 | ||||||
|
|
|
|
|
|
|
|||||||
| Depreciation, amortization, and impairment charges: |
||||||||||||
| U.S. Retail Coffee |
$ | 102,323 | $ | 95,423 | $ | 99,490 | ||||||
| U.S. Retail Consumer Foods |
46,744 | 43,280 | 44,727 | |||||||||
| International, Foodservice, and Natural Foods |
37,698 | 41,680 | 28,976 | |||||||||
| Unallocated (B) |
64,821 | 76,855 | 24,217 | |||||||||
|
|
|
|
|
|
|
|||||||
| Total depreciation, amortization, and impairment charges |
$ | 251,586 | $ | 257,238 | $ | 197,410 | ||||||
|
|
|
|
|
|
|
|||||||
| Additions to property, plant, and equipment: |
||||||||||||
| U.S. Retail Coffee |
$ | 86,903 | $ | 59,910 | $ | 52,198 | ||||||
| U.S. Retail Consumer Foods |
159,544 | 88,217 | 58,457 | |||||||||
| International, Foodservice, and Natural Foods |
27,797 | 31,953 | 26,328 | |||||||||
|
|
|
|
|
|
|
|||||||
| Total additions to property, plant, and equipment |
$ | 274,244 | $ | 180,080 | $ | 136,983 | ||||||
|
|
|
|
|
|
|
|||||||
| (A) | Primarily represents unallocated cash and cash equivalents and corporate-held investments. |
| (B) | Primarily represents unallocated depreciation expense included in cost of products sold – restructuring, cost of products sold – merger and intergration, and corporate administrative expenses. |
| 54 The J. M. Smucker Company 2012 Annual Report |
NOTES TO CONSOLIDATED FINANCIAL STATEMENTS
The J. M. Smucker Company
The following table presents certain geographical information.
| Year Ended April 30, | ||||||||||||
| 2012 | 2011 | 2010 | ||||||||||
| Net sales: |
||||||||||||
| Domestic |
$ | 5,014,695 | $ | 4,358,091 | $ | 4,167,042 | ||||||
| International: |
||||||||||||
| Canada |
$ | 447,004 | $ | 409,710 | $ | 385,870 | ||||||
| All other international |
64,083 | 57,942 | 52,377 | |||||||||
|
|
|
|
|
|
|
|||||||
| Total international |
$ | 511,087 | $ | 467,652 | $ | 438,247 | ||||||
|
|
|
|
|
|
|
|||||||
| Total net sales |
$ | 5,525,782 | $ | 4,825,743 | $ | 4,605,289 | ||||||
|
|
|
|
|
|
|
|||||||
| Assets: |
||||||||||||
| Domestic |
$ | 8,721,449 | $ | 7,912,311 | $ | 7,591,931 | ||||||
| International: |
||||||||||||
| Canada |
$ | 386,026 | $ | 406,576 | $ | 376,788 | ||||||
| All other international |
7,751 | 5,698 | 6,134 | |||||||||
|
|
|
|
|
|
|
|||||||
| Total international |
$ | 393,777 | $ | 412,274 | $ | 382,922 | ||||||
|
|
|
|
|
|
|
|||||||
| Total assets |
$ | 9,115,226 | $ | 8,324,585 | $ | 7,974,853 | ||||||
|
|
|
|
|
|
|
|||||||
| Long-lived assets (excluding goodwill and other intangibles): |
||||||||||||
| Domestic |
$ | 1,164,802 | $ | 885,952 | $ | 854,523 | ||||||
| International: |
||||||||||||
| Canada |
$ | 28,072 | $ | 48,172 | $ | 61,743 | ||||||
| All other international |
37,262 | 706 | 712 | |||||||||
|
|
|
|
|
|
|
|||||||
| Total international |
$ | 65,334 | $ | 48,878 | $ | 62,455 | ||||||
|
|
|
|
|
|
|
|||||||
| Total long-lived assets (excluding goodwill and other intangibles) |
$ | 1,230,136 | $ | 934,830 | $ | 916,978 | ||||||
|
|
|
|
|
|
|
|||||||
The following table presents product sales information.
| Year Ended April 30, | ||||||||||||
| 2012 | 2011 | 2010 | ||||||||||
| Coffee |
48 | % | 44 | % | 40 | % | ||||||
| Peanut butter |
12 | 12 | 12 | |||||||||
| Fruit spreads |
7 | 8 | 8 | |||||||||
| Shortening and oils |
7 | 7 | 8 | |||||||||
| Baking mixes and frostings |
6 | 6 | 6 | |||||||||
| Canned milk |
5 | 5 | 5 | |||||||||
| Flour and baking ingredients |
5 | 5 | 5 | |||||||||
| Portion control |
2 | 3 | 3 | |||||||||
| Juices and beverages |
2 | 3 | 3 | |||||||||
| Handheld frozen sandwiches |
2 | 2 | 3 | |||||||||
| Toppings and syrups |
2 | 2 | 2 | |||||||||
| Other |
2 | 3 | 5 | |||||||||
|
|
|
|
|
|
|
|||||||
| Total product sales |
100 | % | 100 | % | 100 | % | ||||||
|
|
|
|
|
|
|
|||||||
| The J. M. Smucker Company 2012 Annual Report 55 |
NOTES TO CONSOLIDATED FINANCIAL STATEMENTS
The J. M. Smucker Company
| NOTE 6 | EARNINGS PER SHARE |
The following table sets forth the computation of net income per common share and net income per common share – assuming dilution under the two-class method.
| Year Ended April 30, | ||||||||||||
| 2012 | 2011 | 2010 | ||||||||||
| Computation of net income per common share: |
||||||||||||
| Net income |
$ | 459,744 | $ | 479,482 | $ | 494,138 | ||||||
| Net income allocated to participating securities |
4,267 | 4,692 | 4,321 | |||||||||
|
|
|
|
|
|
|
|||||||
| Net income allocated to common stockholders |
$ | 455,477 | $ | 474,790 | $ | 489,817 | ||||||
|
|
|
|
|
|
|
|||||||
| Weighted-average common shares outstanding |
112,212,677 | 117,009,362 | 117,911,160 | |||||||||
|
|
|
|
|
|
|
|||||||
| Net income per common share |
$ | 4.06 | $ | 4.06 | $ | 4.15 | ||||||
|
|
|
|
|
|
|
|||||||
| Computation of net income per common share – assuming dilution: |
||||||||||||
| Net income |
$ | 459,744 | $ | 479,482 | $ | 494,138 | ||||||
| Net income allocated to participating securities |
4,266 | 4,690 | 4,318 | |||||||||
|
|
|
|
|
|
|
|||||||
| Net income allocated to common stockholders |
$ | 455,478 | $ | 474,792 | $ | 489,820 | ||||||
|
|
|
|
|
|
|
|||||||
| Weighted-average common shares outstanding |
112,212,677 | 117,009,362 | 117,911,160 | |||||||||
| Dilutive effect of stock options |
49,616 | 110,335 | 130,011 | |||||||||
|
|
|
|
|
|
|
|||||||
| Weighted-average common shares outstanding – assuming dilution |
112,262,293 | 117,119,697 | 118,041,171 | |||||||||
|
|
|
|
|
|
|
|||||||
| Net income per common share – assuming dilution |
$ | 4.06 | $ | 4.05 | $ | 4.15 | ||||||
|
|
|
|
|
|
|
|||||||
The following table reconciles the weighted-average common shares used in the basic and diluted earnings per share disclosures to the total weighted-average shares outstanding.
| Year Ended April 30, | ||||||||||||
| 2012 | 2011 | 2010 | ||||||||||
| Weighted-average common shares outstanding |
112,212,677 | 117,009,362 | 117,911,160 | |||||||||
| Weighted-average participating shares outstanding |
1,051,274 | 1,156,389 | 1,040,274 | |||||||||
|
|
|
|
|
|
|
|||||||
| Weighted-average shares outstanding |
113,263,951 | 118,165,751 | 118,951,434 | |||||||||
| Dilutive effect of stock options |
49,616 | 110,335 | 130,011 | |||||||||
|
|
|
|
|
|
|
|||||||
| Weighted-average shares outstanding – assuming dilution |
113,313,567 | 118,276,086 | 119,081,445 | |||||||||
|
|
|
|
|
|
|
|||||||
| 56 The J. M. Smucker Company 2012 Annual Report |
NOTES TO CONSOLIDATED FINANCIAL STATEMENTS
The J. M. Smucker Company
| NOTE 7 | GOODWILL AND OTHER INTANGIBLE ASSETS |
A summary of changes in the Company’s goodwill during the years ended April 30, 2012 and 2011, by reportable segment is as follows:
| U.S. Retail Coffee |
U.S. Retail Consumer Foods |
International, Foodservice, and Natural Foods |
Total | |||||||||||||
| Balance at May 1, 2010 |
$ | 1,635,413 | $ | 1,034,395 | $ | 137,922 | $ | 2,807,730 | ||||||||
| Other |
(47 | ) | 1,772 | 3,291 | 5,016 | |||||||||||
|
|
|
|
|
|
|
|
|
|||||||||
| Balance at April 30, 2011 |
$ | 1,635,366 | $ | 1,036,167 | $ | 141,213 | $ | 2,812,746 | ||||||||
| Acquisitions |
84,845 | — | 156,778 | 241,623 | ||||||||||||
| Other |
86 | (925 | ) | 1,088 | 249 | |||||||||||
|
|
|
|
|
|
|
|
|
|||||||||
| Balance at April 30, 2012 |
$ | 1,720,297 | $ | 1,035,242 | $ | 299,079 | $ | 3,054,618 | ||||||||
|
|
|
|
|
|
|
|
|
|||||||||
Included in the other category at April 30, 2012 and 2011, were foreign currency exchange and other adjustments.
The Company’s other intangible assets and related accumulated amortization and impairment charges are as follows:
| April 30, 2012 | April 30, 2011 | |||||||||||||||||||||||
| Acquisition Cost |
Accumulated Amortization/ Impairment Charges |
Net | Acquisition Cost |
Accumulated Amortization/ Impairment Charges |
Net | |||||||||||||||||||
| Finite-lived intangible assets subject to amortization: |
||||||||||||||||||||||||
| Customer and contractual relationships |
$ | 1,415,084 | $ | 238,419 | $ | 1,176,665 | $ | 1,180,000 | $ | 168,125 | $ | 1,011,875 | ||||||||||||
| Patents and technology |
158,770 | 36,888 | 121,882 | 134,970 | 25,980 | 108,990 | ||||||||||||||||||
| Trademarks |
62,554 | 18,854 | 43,700 | 35,153 | 6,652 | 28,501 | ||||||||||||||||||
|
|
|
|
|
|
|
|
|
|
|
|
|
|||||||||||||
| Total intangible assets subject to amortization |
$ | 1,636,408 | $ | 294,161 | $ | 1,342,247 | $ | 1,350,123 | $ | 200,757 | $ | 1,149,366 | ||||||||||||
|
|
|
|
|
|
|
|
|
|
|
|
|
|||||||||||||
| Indefinite-lived intangible assets not subject to amortization: |
||||||||||||||||||||||||
| Trademarks |
$ | 1,855,621 | $ | 10,861 | $ | 1,844,760 | $ | 1,799,862 | $ | 9,218 | $ | 1,790,644 | ||||||||||||
|
|
|
|
|
|
|
|
|
|
|
|
|
|||||||||||||
| Total other intangible assets |
$ | 3,492,029 | $ | 305,022 | $ | 3,187,007 | $ | 3,149,985 | $ | 209,975 | $ | 2,940,010 | ||||||||||||
|
|
|
|
|
|
|
|
|
|
|
|
|
|||||||||||||
Amortization expense for finite-lived intangible assets was $87,721, $73,438, and $72,417 in 2012, 2011, and 2010, respectively. The weighted-average useful life of the finite-lived intangible assets is 18 years. Based on the amount of intangible assets subject to amortization at April 30, 2012, the estimated amortization expense for each of the succeeding five years is approximately $96,000.
The Company reviews goodwill and other indefinite-lived intangible assets at least annually for impairment. The annual impairment review was performed as of February 1, 2012. Goodwill impairment is tested at the reporting unit level which is the Company’s operating segments.
Nonrecurring fair value adjustments of $4,590, $17,599, and $11,658 were recognized related to the impariment of certain intangible assets in 2012, 2011, and 2010, respectively. The impairment recognized in 2012 was related to a finite-lived trademark. The impairment was recognized in the fourth quarter when the Company evaluated the historical performance and future growth of this regional canned milk brand. The Company utilized Level 3 inputs based on management’s best estimates and assumptions to estimate the fair value of the trademark and concluded the trademark had no value. The majority of the impairment recognized in 2011 and 2010 was related to the Europe’s Best trademark and customer relationship. In October 2011, the Company sold the Europe’s Best frozen fruit and vegetable business, resulting in a loss of $11,287.
| The J. M. Smucker Company 2012 Annual Report 57 |
NOTES TO CONSOLIDATED FINANCIAL STATEMENTS
The J. M. Smucker Company
| NOTE 8 | PENSIONS AND OTHER POSTRETIREMENT BENEFITS |
The Company has defined benefit pension plans covering certain domestic and Canadian employees. Benefits are based on the employee’s years of service and compensation. The Company’s plans are funded in conformity with the funding requirements of applicable government regulations.
In addition to providing pension benefits, the Company sponsors several unfunded, defined postretirement plans that provide health care and life insurance benefits to certain retired domestic and Canadian employees. These plans are contributory, with retiree contributions adjusted periodically, and contain other cost-sharing features, such as deductibles and coinsurance. Covered employees generally are eligible for these benefits when they reach age 55 and have attained 10 years of credited service.
Upon completion of the restructuring activity discussed in Note 4: Restructuring, approximately 850 full-time positions will be reduced. The Company has included the estimated impact of the planned reductions in measuring the U.S. and Canadian benefit obligation of the pension plans and other postretirement plans at April 30, 2012. As a result, the benefit obligation of the pension plans and other postretirement plans decreased by approximately $2,700 and increased by approximately $1,900, respectively. Included in the following tables are charges recognized for termination benefits, curtailment, and settlement as a result of the restructuring plan.
The following table summarizes the components of net periodic benefit cost and the change in accumulated other comprehensive (loss) income related to the defined benefit pension and other postretirement plans.
| Defined Benefit Pension Plans | Other Postretirement Benefits | |||||||||||||||||||||||
| Year Ended April 30, |
2012 | 2011 | 2010 | 2012 | 2011 | 2010 | ||||||||||||||||||
| Service cost |
$ | 8,050 | $ | 7,504 | $ | 5,755 | $ | 2,348 | $ | 1,620 | $ | 1,525 | ||||||||||||
| Interest cost |
26,210 | 25,491 | 24,788 | 3,075 | 2,775 | 2,607 | ||||||||||||||||||
| Expected return on plan assets |
(26,955 | ) | (26,848 | ) | (22,894 | ) | — | — | — | |||||||||||||||
| Amortization of prior service cost (credit) |
1,117 | 1,146 | 1,362 | (425 | ) | (489 | ) | (489 | ) | |||||||||||||||
| Amortization of net actuarial loss (gain) |
9,381 | 10,294 | 6,291 | (43 | ) | (536 | ) | (1,043 | ) | |||||||||||||||
| Curtailment loss (gain) |
1,124 | 4,095 | — | (115 | ) | — | — | |||||||||||||||||
| Settlement loss |
1,066 | — | — | — | — | — | ||||||||||||||||||
| Termination benefit cost |
1,838 | 8,395 | — | 2,030 | 2,413 | — | ||||||||||||||||||
|
|
|
|
|
|
|
|
|
|
|
|
|
|||||||||||||
| Net periodic benefit cost |
$ | 21,831 | $ | 30,077 | $ | 15,302 | $ | 6,870 | $ | 5,783 | $ | 2,600 | ||||||||||||
|
|
|
|
|
|
|
|
|
|
|
|
|
|||||||||||||
| Other changes in plan assets and benefit liabilities recognized in accumulated other comprehensive (loss) income before income taxes: |
||||||||||||||||||||||||
| Prior service cost arising during the year |
$ | — | $ | (359 | ) | $ | (1,334 | ) | $ | — | $ | (925 | ) | $ | — | |||||||||
| Net actuarial loss arising during the year |
(82,125 | ) | (13,533 | ) | (13,713 | ) | (4,163 | ) | (7,769 | ) | (3,248 | ) | ||||||||||||
| Amortization of prior service cost (credit) |
1,117 | 1,146 | 1,362 | (425 | ) | (489 | ) | (489 | ) | |||||||||||||||
| Amortization of net actuarial loss (gain) |
9,381 | 10,294 | 6,291 | (43 | ) | (536 | ) | (1,043 | ) | |||||||||||||||
| Curtailment loss (gain) |
1,124 | 4,095 | — | (115 | ) | — | — | |||||||||||||||||
| Settlement loss |
1,066 | — | — | — | — | — | ||||||||||||||||||
| Foreign currency translation |
1,092 | (2,032 | ) | (5,932 | ) | (69 | ) | 104 | 173 | |||||||||||||||
| Other adjustments |
23 | — | (71 | ) | — | — | — | |||||||||||||||||
|
|
|
|
|
|
|
|
|
|
|
|
|
|||||||||||||
| Net change for year |
$ | (68,322 | ) | $ | (389 | ) | $ | (13,397 | ) | $ | (4,815 | ) | $ | (9,615 | ) | $ | (4,607 | ) | ||||||
|
|
|
|
|
|
|
|
|
|
|
|
|
|||||||||||||
| Weighted-average assumptions used in determining net periodic benefit costs: |
||||||||||||||||||||||||
| U.S. plans: |
||||||||||||||||||||||||
| Discount rate |
5.50 | % | 5.80 | % | 7.40 | % | 5.50 | % | 5.80 | % | 7.40 | % | ||||||||||||
| Expected return on plan assets |
7.00 | 7.50 | 7.75 | — | — | — | ||||||||||||||||||
| Rate of compensation increase |
4.14 | 4.15 | 3.79 | — | — | — | ||||||||||||||||||
| Canadian plans: |
||||||||||||||||||||||||
| Discount rate |
5.00 | % | 5.30 | % | 5.40 | % | 5.00 | % | 5.30 | % | 5.40 | % | ||||||||||||
| Expected return on plan assets |
6.66 | 7.08 | 7.33 | — | — | — | ||||||||||||||||||
| Rate of compensation increase |
4.00 | 4.00 | 4.00 | — | — | — | ||||||||||||||||||
|
|
|
|
|
|
|
|
|
|
|
|
|
|||||||||||||
The Company uses a measurement date of April 30 to determine defined benefit pension plans and other postretirement benefits’ assets and benefit obligations.
| 58 The J. M. Smucker Company 2012 Annual Report |
NOTES TO CONSOLIDATED FINANCIAL STATEMENTS
The J. M. Smucker Company
The following table sets forth the combined status of the plans as recognized in the Consolidated Balance Sheets.
| Defined Benefit Pension Plans | Other Postretirement Benefits | |||||||||||||||
| April 30, |
2012 | 2011 | 2012 | 2011 | ||||||||||||
| Change in benefit obligation: |
||||||||||||||||
| Benefit obligation at beginning of year |
$ | 503,346 | $ | 450,728 | $ | 59,789 | $ | 45,592 | ||||||||
| Service cost |
8,050 | 7,504 | 2,348 | 1,620 | ||||||||||||
| Interest cost |
26,210 | 25,491 | 3,075 | 2,775 | ||||||||||||
| Amendments |
— | 359 | — | 925 | ||||||||||||
| Actuarial loss |
60,019 | 30,276 | 4,278 | 7,769 | ||||||||||||
| Participant contributions |
514 | 498 | 1,412 | 1,077 | ||||||||||||
| Benefits paid |
(28,603 | ) | (30,502 | ) | (3,595 | ) | (3,674 | ) | ||||||||
| Foreign currency translation adjustments |
(5,052 | ) | 8,446 | (526 | ) | 1,270 | ||||||||||
| Curtailment |
398 | 2,151 | (115 | ) | — | |||||||||||
| Settlement |
(4,974 | ) | — | — | — | |||||||||||
| Termination benefit cost |
1,838 | 8,395 | 2,030 | 2,413 | ||||||||||||
| Other adjustments |
— | — | 133 | 22 | ||||||||||||
|
|
|
|
|
|
|
|
|
|||||||||
| Benefit obligation at end of year |
$ | 561,746 | $ | 503,346 | $ | 68,829 | $ | 59,789 | ||||||||
|
|
|
|
|
|
|
|
|
|||||||||
| Change in plan assets: |
||||||||||||||||
| Fair value of plan assets at beginning of year |
$ | 407,600 | $ | 367,322 | $ | — | $ | — | ||||||||
| Actual return on plan assets |
5,246 | 45,743 | — | — | ||||||||||||
| Company contributions |
11,428 | 16,779 | 2,165 | 2,576 | ||||||||||||
| Participant contributions |
514 | 498 | 1,412 | 1,077 | ||||||||||||
| Benefits paid |
(28,603 | ) | (30,502 | ) | (3,595 | ) | (3,674 | ) | ||||||||
| Foreign currency translation adjustments |
(4,744 | ) | 7,760 | — | — | |||||||||||
| Settlement |
(4,974 | ) | — | — | — | |||||||||||
| Other adjustments |
— | — | 18 | 21 | ||||||||||||
|
|
|
|
|
|
|
|
|
|||||||||
| Fair value of plan assets at end of year |
$ | 386,467 | $ | 407,600 | $ | — | $ | — | ||||||||
|
|
|
|
|
|
|
|
|
|||||||||
| Funded status of the plans |
$ | (175,279 | ) | $ | (95,746 | ) | $ | (68,829 | ) | $ | (59,789 | ) | ||||
|
|
|
|
|
|
|
|
|
|||||||||
| Other noncurrent assets |
$ | — | $ | 2,976 | $ | — | $ | — | ||||||||
| Defined benefit pensions |
(147,551 | ) | (98,722 | ) | — | — | ||||||||||
| Accrued compensation |
(27,728 | ) | — | — | — | |||||||||||
| Postretirement benefits other than pensions |
— | — | (68,829 | ) | (59,789 | ) | ||||||||||
|
|
|
|
|
|
|
|
|
|||||||||
| Net benefit liability |
$ | (175,279 | ) | $ | (95,746 | ) | $ | (68,829 | ) | $ | (59,789 | ) | ||||
|
|
|
|
|
|
|
|
|
|||||||||
The Company will offer terminated pension participants a lump-sum cash settlement in order to reduce the Company’s future pension obligation and administrative costs. Approximately $20,000 of the $27,728 in accrued compensation relates to the anticipated lump-sum payments.
The following table summarizes amounts recognized in accumulated other comprehensive (loss) income in the Consolidated Balance Sheets, before income taxes.
| Defined Benefit Pension Plans | Other Postretirement Benefits | |||||||||||||||
| April 30, |
2012 | 2011 | 2012 | 2011 | ||||||||||||
| Net actuarial (loss) gain |
$ | (204,471 | ) | $ | (134,306 | ) | $ | 2,293 | $ | 6,683 | ||||||
| Prior service (cost) credit |
(2,966 | ) | (4,809 | ) | 1,704 | 2,129 | ||||||||||
|
|
|
|
|
|
|
|
|
|||||||||
| Total recognized in accumulated other comprehensive (loss) income |
$ | (207,437 | ) | $ | (139,115 | ) | $ | 3,997 | $ | 8,812 | ||||||
|
|
|
|
|
|
|
|
|
|||||||||
During 2013, the Company expects to recognize amortization of net actuarial losses and prior service cost of $13,298 and $588, respectively, in net periodic benefit cost.
| The J. M. Smucker Company 2012 Annual Report 59 |
NOTES TO CONSOLIDATED FINANCIAL STATEMENTS
The J. M. Smucker Company
The following table sets forth the assumptions used in determining the benefit obligations.
| Defined Benefit Pension Plans | Other Postretirement Benefits |
|||||||||||||||
| April 30, |
2012 | 2011 | 2012 | 2011 | ||||||||||||
| Weighted-average assumptions used in determining benefit obligation: |
||||||||||||||||
| U.S. plans: |
||||||||||||||||
| Discount rate |
4.70 | % | 5.50 | % | 4.70 | % | 5.50 | % | ||||||||
| Rate of compensation increase |
4.14 | 4.14 | — | — | ||||||||||||
| Canadian plans: |
||||||||||||||||
| Discount rate |
4.20 | % | 5.00 | % | 4.20 | % | 5.00 | % | ||||||||
| Rate of compensation increase |
4.00 | 4.00 | — | — | ||||||||||||
For 2013, the assumed health care trend rates are 8.0 percent and 6.5 percent for the U.S. and Canadian plans, respectively. The rate for participants under age 65 is assumed to decrease to 5.0 percent in 2019 and 4.5 percent in 2017 for the U.S. and Canadian plans, respectively. The health care cost trend rate assumption has a significant effect on the amount of the other postretirement benefits obligation and periodic other postretirement benefits cost reported.
A one-percentage point annual change in the assumed health care cost trend rate would have the following effect as of April 30, 2012:
| One-Percentage Point | ||||||||
| Increase | Decrease | |||||||
| Effect on total service and interest cost components |
$ | 209 | $ | 176 | ||||
| Effect on benefit obligation |
3,274 | 2,844 | ||||||
The following table sets forth selective information pertaining to the Company’s Canadian pension and other postretirement benefit plans.
| Defined Benefit Pension Plans | Other Postretirement Benefits | |||||||||||||||
| Year Ended April 30, |
2012 | 2011 | 2012 | 2011 | ||||||||||||
| Benefit obligation at end of year |
$ | 125,708 | $ | 123,600 | $ | 13,255 | $ | 12,898 | ||||||||
| Fair value of plan assets at end of year |
104,475 | 113,814 | — | — | ||||||||||||
|
|
|
|
|
|
|
|
|
|||||||||
| Funded status of the plans |
$ | (21,233 | ) | $ | (9,786 | ) | $ | (13,255 | ) | $ | (12,898 | ) | ||||
|
|
|
|
|
|
|
|
|
|||||||||
| Components of net periodic benefit cost: |
||||||||||||||||
| Service cost |
$ | 1,362 | $ | 1,470 | $ | 39 | $ | 34 | ||||||||
| Interest cost |
5,616 | 5,713 | 570 | 596 | ||||||||||||
| Expected return on plan assets |
(7,018 | ) | (6,912 | ) | — | — | ||||||||||
| Amortization of net actuarial loss (gain) |
2,983 | 4,836 | (4 | ) | (39 | ) | ||||||||||
| Curtailment loss (gain) |
— | 185 | (115 | ) | — | |||||||||||
| Settlement loss |
1,066 | — | — | — | ||||||||||||
| Termination benefit cost |
— | 933 | — | — | ||||||||||||
| Other |
— | 6 | — | (1 | ) | |||||||||||
|
|
|
|
|
|
|
|
|
|||||||||
| Net periodic benefit cost |
$ | 4,009 | $ | 6,231 | $ | 490 | $ | 590 | ||||||||
|
|
|
|
|
|
|
|
|
|||||||||
| Changes in plan assets: |
||||||||||||||||
| Company contributions |
$ | 6,123 | $ | 4,629 | $ | 762 | $ | 771 | ||||||||
| Participant contributions |
514 | 498 | — | — | ||||||||||||
| Benefits paid |
(9,324 | ) | (8,595 | ) | (762 | ) | (771 | ) | ||||||||
| Actual return on plan assets |
3,066 | 10,419 | — | — | ||||||||||||
| Foreign currency translation |
(4,744 | ) | 7,760 | — | — | |||||||||||
| Settlement loss |
(4,974 | ) | — | — | — | |||||||||||
|
|
|
|
|
|
|
|
|
|||||||||
| 60 The J. M. Smucker Company 2012 Annual Report |
NOTES TO CONSOLIDATED FINANCIAL STATEMENTS
The J. M. Smucker Company
The following table sets forth additional information related to the Company’s defined benefit pension plans.
| April 30, | ||||||||
| 2012 | 2011 | |||||||
| Accumulated benefit obligation for all pension plans |
$ | 523,584 | $ | 468,604 | ||||
| Plans with an accumulated benefit obligation in excess of plan assets: |
||||||||
| Accumulated benefit obligation |
523,584 | 436,329 | ||||||
| Fair value of plan assets |
386,467 | 371,895 | ||||||
| Plans with a projected benefit obligation in excess of plan assets: |
||||||||
| Projected benefit obligation |
561,746 | 473,555 | ||||||
| Fair value of plan assets |
386,467 | 374,741 | ||||||
The Company employs a total return on investment approach for the defined benefit pension plans’ assets. A mix of equity, fixed-income, and alternative investments is used to maximize the long-term rate of return on assets for the level of risk. In determining the expected long-term rate of return on the defined benefit pension plans’ assets, management considers the historical rates of return, the nature of investments, the asset allocation, and expectations of future investment strategies.
The following tables summarize the fair value of the major asset classes for the U.S. and Canadian defined benefit pension plans and the levels within the fair value hierarchy in which the fair value measurements fall.
| Quoted Prices in Active Markets for Identical Assets (Level 1) |
Significant Observable Inputs (Level 2) |
Significant Unobservable Inputs (Level 3) |
Fair Value at April 30, 2012 |
|||||||||||||
| Cash and cash equivalents (A) |
$ | 13,999 | $ | — | $ | — | $ | 13,999 | ||||||||
| Equity securities: |
||||||||||||||||
| U.S. (B) |
79,582 | 16,872 | — | 96,454 | ||||||||||||
| International (C) |
65,361 | 13,029 | — | 78,390 | ||||||||||||
| Fixed-income securities: |
||||||||||||||||
| Bonds (D) |
82,109 | — | — | 82,109 | ||||||||||||
| Fixed income (E) |
76,866 | — | — | 76,866 | ||||||||||||
| Other types of investments: |
||||||||||||||||
| Hedge funds (F) |
— | — | 22,351 | 22,351 | ||||||||||||
| Private equity funds (F) |
— | — | 16,298 | 16,298 | ||||||||||||
|
|
|
|
|
|
|
|
|
|||||||||
| Total financial assets measured at fair value |
$ | 317,917 | $ | 29,901 | $ | 38,649 | $ | 386,467 | ||||||||
|
|
|
|
|
|
|
|
|
|||||||||
| The J. M. Smucker Company 2012 Annual Report 61 |
NOTES TO CONSOLIDATED FINANCIAL STATEMENTS
The J. M. Smucker Company
| Quoted Prices in Active Markets for Identical Assets (Level 1) |
Significant Observable Inputs (Level 2) |
Significant Unobservable Inputs (Level 3) |
Fair Value at April 30, 2011 |
|||||||||||||
| Cash and cash equivalents (A) |
$ | 6,006 | $ | — | $ | — | $ | 6,006 | ||||||||
| Equity securities: |
||||||||||||||||
| U.S. (B) |
82,457 | 18,930 | 4,777 | 106,164 | ||||||||||||
| International (C) |
40,189 | 41,808 | — | 81,997 | ||||||||||||
| Fixed-income securities: |
||||||||||||||||
| Bonds (D) |
65,126 | 17,610 | — | 82,736 | ||||||||||||
| Fixed income (E) |
45,515 | 34,544 | — | 80,059 | ||||||||||||
| Other types of investments: |
||||||||||||||||
| Hedge funds (F) |
— | — | 37,451 | 37,451 | ||||||||||||
| Private equity funds (F) |
— | — | 13,187 | 13,187 | ||||||||||||
|
|
|
|
|
|
|
|
|
|||||||||
| Total financial assets measured at fair value |
$ | 239,293 | $ | 112,892 | $ | 55,415 | $ | 407,600 | ||||||||
|
|
|
|
|
|
|
|
|
|||||||||
| (A) | This category includes money market holdings with maturities of three months or less and are classified as Level 1. Based on the short-term nature of these assets, carrying value approximates fair value. |
| (B) | This category is invested primarily in a portfolio of common stocks included in the Russell 1000 Index and traded on active exchanges. The Level 1 assets are valued using quoted market prices for identical securities in active markets. The Level 2 assets are funds that consist of equity securities traded on active exchanges. The Level 3 assets are valued at approximate fair value. No assets were classified as Level 3 as of April 30, 2012. |
| (C) | This category is invested primarily in common stocks and other equity securities traded on active exchanges whose issuers are located outside of the U.S. The fund invests primarily in developed countries, but may also invest in emerging markets. The Level 1 assets are valued using quoted market prices for identical securities in active markets. The Level 2 assets are funds that consist of equity securities traded on active exchanges. |
| (D) | This category seeks to duplicate the return characteristics of high-quality corporate bonds with a duration range of 10 to 13 years. The Level 1 assets are valued using quoted market prices for identical securities in active markets. The Level 2 assets are funds that consist of bonds traded on active exchanges. No assets were classified as Level 2 as of April 30, 2012. |
| (E) | This category is comprised of a core fixed-income fund that invests at least 80 percent of its assets in investment-grade U.S. corporate and government fixed-income securities, including mortgage-backed securities. The Level 1 assets are valued using quoted market prices for identical securities in active markets. The Level 2 assets are funds that consist of fixed-income securities traded on active exchanges. No assets were classified as Level 2 as of April 30, 2012. |
| (F) | The hedge funds category is comprised of hedge funds of funds which invest in equity hedge, directional, relative value, and event-driven funds. The hedge funds have quarterly liquidity with 65 days’ notice. The private equity funds category is comprised of one fund that consists primarily of limited partnership interests in corporate finance and venture capital funds. The private equity fund cannot be redeemed and return of principal is based on the liquidation of the underlying assets. Both the hedge funds and the private equity fund are classified as Level 3 assets and are valued based on each fund’s net asset value (“NAV”). NAV is calculated based on the estimated fair value of the underlying investment funds within the portfolio and is corroborated by management’s review. |
The following table presents a rollforward of activity for Level 3 assets between May 1, 2011 and April 30, 2012.
| U.S. Equity Securities |
Hedge Funds |
Private Equity Funds |
Total | |||||||||||||
| Balance at May 1, 2011 |
$ | 4,777 | $ | 37,451 | $ | 13,187 | $ | 55,415 | ||||||||
| Purchases and sales – net |
2,999 | (13,616 | ) | 1,095 | (9,522 | ) | ||||||||||
| Actual return on plan assets sold during the period |
(7,776 | ) | (893 | ) | — | (8,669 | ) | |||||||||
| Actual return on plan assets still held at reporting date |
— | (591 | ) | 2,016 | 1,425 | |||||||||||
|
|
|
|
|
|
|
|
|
|||||||||
| Balance at April 30, 2012 |
$ | — | $ | 22,351 | $ | 16,298 | $ | 38,649 | ||||||||
|
|
|
|
|
|
|
|
|
|||||||||
The Company’s current investment policy is to invest approximately 45 percent of assets in equity securities, 41 percent in fixed-income securities, and 14 percent in cash and other investments. Included in equity securities were 317,552 of the Company’s common shares at April 30, 2012 and 2011. The market value of these shares was $25,287 at April 30, 2012. The Company paid dividends of $597 on these shares during 2012.
The Company expects to contribute approximately $32 million, including $20 million of anticipated lump-sum cash settlements, to the defined benefit pension plans in 2013. The Company expects the following payments to be made from the defined benefit pension and other postretirement benefit plans: $47 million in 2013, $34 million in 2014, $33 million in 2015, $40 million in 2016, $34 million in 2017, and $185 million in 2018 through 2022.
| 62 The J. M. Smucker Company 2012 Annual Report |
NOTES TO CONSOLIDATED FINANCIAL STATEMENTS
The J. M. Smucker Company
| NOTE 9 | SHARE-BASED PAYMENTS |
The Company provides for equity-based incentives to be awarded to key employees and non-employee directors. Currently, these incentives consist of restricted shares, restricted stock units, deferred shares, deferred stock units, performance units, and stock options. These awards are administered primarily through the 2010 Equity and Incentive Compensation Plan approved by the Company’s shareholders in August 2010. Awards under this plan may be in the form of stock options, stock appreciation rights, restricted shares, restricted stock units (which may also be referred to as deferred stock units), performance shares, performance units, incentive awards, and other share-based awards. Awards under this plan may be granted to the Company’s and its subsidiaries’ non-employee directors, consultants, officers, and other employees. Deferred stock units granted to non-employee directors vest immediately. At April 30, 2012, there were 7,311,613 shares available for future issuance under this plan.
Under the 2010 Equity and Incentive Compensation Plan, the Company has the option to settle share-based awards by issuing common shares from treasury, issuing new Company common shares, or issuing a combination of common shares from treasury and new Company common shares.
Stock Options: The following table is a summary of the Company’s stock option activity and related information.
| Options | Weighted-Average Exercise Price |
|||||||
| Outstanding at May 1, 2011 |
196,925 | $ | 41.18 | |||||
| Exercised |
(72,084 | ) | 39.46 | |||||
|
|
|
|
|
|||||
| Outstanding and exercisable at April 30, 2012 |
124,841 | $ | 42.18 | |||||
|
|
|
|
|
|||||
At April 30, 2012, the weighted-average remaining contractual term for stock options outstanding and exercisable was 1.8 years and the aggregate intrinsic value of these stock options was approximately $4,675.
The total intrinsic value of options exercised during 2012, 2011, and 2010 was approximately $2,644, $13,355, and $5,876, respectively.
Other Equity Awards: The following table is a summary of the Company’s restricted shares, deferred shares, deferred stock units, and performance units.
| Restricted/Deferred Shares and Deferred Stock Units |
Weighted-Average Grant Date Fair Value |
Performance Units |
Weighted-Average Fair Value |
|||||||||||||
| Outstanding at May 1, 2011 |
1,157,266 | $ | 49.39 | 125,360 | $ | 77.53 | ||||||||||
| Granted |
152,180 | 78.32 | 99,455 | 76.37 | ||||||||||||
| Converted |
125,360 | 77.53 | (125,360 | ) | 77.53 | |||||||||||
| Vested |
(430,831 | ) | 52.60 | — | — | |||||||||||
| Forfeited |
(12,985 | ) | 52.91 | — | — | |||||||||||
|
|
|
|
|
|
|
|
|
|||||||||
| Outstanding at April 30, 2012 |
990,990 | $ | 55.95 | 99,455 | $ | 76.37 | ||||||||||
|
|
|
|
|
|
|
|
|
|||||||||
| The J. M. Smucker Company 2012 Annual Report 63 |
NOTES TO CONSOLIDATED FINANCIAL STATEMENTS
The J. M. Smucker Company
The total fair value of equity awards other than stock options vesting in 2012, 2011, and 2010 was approximately $22,663, $17,680, and $16,273, respectively. The weighted-average grant date fair value of restricted shares, deferred shares, deferred stock units, and performance units is the average of the high and the low share price on the date of grant. The following table summarizes the weighted-average grant date fair values of the equity awards granted in 2012, 2011, and 2010.
| Year Ended April 30, |
Restricted/ Deferred Shares and Deferred Stock Units |
Weighted- Average Grant Date Fair Value |
Performance Units |
Weighted- Average Grant Date Fair Value |
||||||||||||
| 2012 |
152,180 | $ | 78.32 | 99,455 | $ | 76.37 | ||||||||||
| 2011 |
303,863 | 58.32 | 125,360 | 77.53 | ||||||||||||
| 2010 |
504,580 | 44.63 | 190,010 | 57.37 | ||||||||||||
The performance units column represents the number of restricted shares received by certain executive officers, subsequent to year end, upon conversion of the performance units earned during the year. Restricted stock generally vests four years from the date of grant or upon the attainment of a defined age and years of service.
| NOTE 10 | DEBT AND FINANCING ARRANGEMENTS |
Long-term debt consists of the following:
| Year Ended April 30, | ||||||||
| 2012 | 2011 | |||||||
| 4.78% Senior Notes due June 1, 2014 |
$ | 100,000 | $ | 100,000 | ||||
| 6.12% Senior Notes due November 1, 2015 |
24,000 | 24,000 | ||||||
| 6.63% Senior Notes due November 1, 2018 |
397,906 | 380,039 | ||||||
| 3.50% Notes due October 15, 2021 |
748,637 | — | ||||||
| 5.55% Senior Notes due April 1, 2022 |
400,000 | 400,000 | ||||||
| 4.50% Senior Notes due June 1, 2025 |
400,000 | 400,000 | ||||||
|
|
|
|
|
|||||
| Total long-term debt |
$ | 2,070,543 | $ | 1,304,039 | ||||
| Current portion of long-term debt |
50,000 | — | ||||||
|
|
|
|
|
|||||
| Total long-term debt, less current portion |
$ | 2,020,543 | $ | 1,304,039 | ||||
|
|
|
|
|
|||||
On October 18, 2011, the Company completed a public issuance of $750.0 million in aggregate principal amount of 3.50 percent Notes due October 15, 2021. Interest is payable semiannually beginning April 15, 2012. The Company received proceeds of $748.6 million, net of an offering discount of $1.4 million. The discount is being amortized to interest expense over the life of the 3.50 percent Notes, resulting in an effective rate of 3.52 percent. The 3.50 percent Notes may be redeemed at any time prior to maturity, at the option of the Company. The 3.50 percent Notes are senior unsecured obligations and rank equally with the Company’s other unsecured and unsubordinated debt and are guaranteed fully and unconditionally, on a joint and several basis, by J. M. Smucker LLC and The Folgers Coffee Company, two of the Company’s 100 percent wholly-owned subsidiaries. A portion of the proceeds was used to fund the Sara Lee foodservice business acquisition and for the repayment of borrowings outstanding under the Company’s revolving credit facility, resulting from funding the Rowland Coffee acquisition. The remainder was used for general corporate purposes, including share repurchases.
In anticipation of the 3.50 percent Notes public issuance, the Company entered into a forward-starting interest rate swap in August 2011 to partially hedge the risk of an increase in the benchmark interest rate during the period leading up to the public issuance. The interest rate swap was designated as a cash flow hedge with a notional amount of $500.0 million. On October 13, 2011, in conjunction with the pricing of the 3.50 percent Notes, the Company terminated the interest rate swap prior to maturity. The termination resulted in a loss of $6.2 million, which will be amortized over the life of the related debt offering. For additional information, see Note 12: Derivative Financial Instruments.
| 64 The J. M. Smucker Company 2012 Annual Report |
NOTES TO CONSOLIDATED FINANCIAL STATEMENTS
The J. M. Smucker Company
In 2011, the Company entered into an interest rate swap on the 6.63 percent Senior Notes due November 1, 2018, converting the Senior Notes from a fixed to a variable-rate basis until maturity. The interest rate swap was designated as a fair value hedge of the underlying debt obligation with a notional amount of $376.0 million. In August 2011, the Company terminated the interest rate swap prior to maturity. As a result of the early termination, the Company received $27.0 million in cash, which included $3.1 million of interest receivable, and realized a gain of $23.9 million, which was deferred and will be recognized as a reduction of future interest expense through November 1, 2018. The unamortized benefit at April 30, 2012, was $21.9 million and the fair value adjustment of the interest rate swap at April 30, 2011, was $4.0 million, and both were recorded as an increase in the long-term debt balance. For additional information, see Note 12: Derivative Financial Instruments.
All of the Company’s Senior Notes are unsecured and interest is paid semiannually. Scheduled payments are required on the 5.55 percent Senior Notes, the first of which is $50.0 million on April 1, 2013, and on the 4.50 percent Senior Notes, the first of which is $100.0 million on June 1, 2020.
Interest paid totaled approximately $86.6 million, $62.1 million, and $76.5 million in 2012, 2011, and 2010, respectively. This differs from interest expense due to the timing of payments, amortization of fair value adjustments, amortization of debt issuance costs, and interest capitalized.
On July 29, 2011, the Company entered into a second amended and restated credit agreement with a group of 10 banks, which provides for an unsecured revolving credit line of $1.0 billion and matures July 29, 2016. The Company’s borrowings under the credit facility bear interest based on the prevailing U.S. Prime Rate, Canadian Base Rate, London Interbank Offered Rate (“LIBOR”), or Canadian Dealer Offered Rate, as determined by the Company. Interest is payable either on a quarterly basis or at the end of the borrowing term. At April 30, 2012, the Company did not have a balance outstanding under the revolving credit facility. The Company had standby letters of credit of approximately $7.8 million outstanding at April 30, 2012.
The Company’s debt instruments contain certain financial covenant restrictions including consolidated net worth, a leverage ratio, and an interest coverage ratio. The Company is in compliance with all covenants.
| NOTE 11 | CONTINGENCIES |
The Company, like other food manufacturers, is from time to time subject to various administrative, regulatory, and other legal proceedings arising in the ordinary course of business. The Company is currently a defendant in a variety of such legal proceedings. The Company cannot predict with certainty the ultimate results of these proceedings or reasonably determine a range of potential loss. The Company’s policy is to accrue costs for contingent liabilities when such liabilities are probable and amounts can be reasonably estimated. Based on the information known to date, the Company does not believe the final outcome of these proceedings will have a material adverse effect on the Company’s financial position, results of operations, or cash flows.
| NOTE 12 | DERIVATIVE FINANCIAL INSTRUMENTS |
The Company is exposed to market risks, such as changes in commodity prices, foreign currency exchange rates, and interest rates. To manage the volatility related to these exposures, the Company enters into various derivative transactions. By policy, the Company historically has not entered into derivative financial instruments for trading purposes or for speculation.
Commodity Price Management: The Company enters into commodity futures and options contracts to manage the price volatility and reduce the variability of future cash flows related to anticipated inventory purchases of key raw materials, notably green coffee, edible oils, and flour. The Company also enters into commodity futures and options contracts to manage price risk for energy input costs, including natural gas and diesel fuel. The derivative instruments generally have maturities of less than one year.
| The J. M. Smucker Company 2012 Annual Report 65 |
NOTES TO CONSOLIDATED FINANCIAL STATEMENTS
The J. M. Smucker Company
Certain of the derivative instruments associated with the Company’s U.S. Retail Coffee and U.S. Retail Consumer Foods segments meet the hedge criteria and are accounted for as cash flow hedges. The mark-to-market gains or losses on qualifying hedges are deferred and included as a component of accumulated other comprehensive (loss) income to the extent effective, and reclassified to cost of products sold in the period during which the hedged transaction affects earnings. Cash flows related to qualifying hedges are classified consistently with the cash flows from the hedged item in the Statements of Consolidated Cash Flows. In order to qualify as a hedge of commodity price risk, it must be demonstrated that the changes in the fair value of the commodity’s futures contracts are highly effective in hedging price risks associated with the commodity purchased. Hedge effectiveness is measured and assessed at inception and on a monthly basis. The mark-to-market gains or losses on nonqualifying and ineffective portions of commodity hedges are recognized in cost of products sold immediately.
Foreign Currency Exchange Rate Hedging: The Company utilizes foreign currency forwards and options contracts to manage the effect of foreign currency exchange fluctuations on future cash payments primarily related to purchases of certain raw materials, finished goods, and fixed assets in Canada. The contracts generally have maturities of less than one year. At the inception of the contract, the derivative is evaluated and documented for hedge accounting treatment. Instruments currently used to manage foreign currency exchange exposures do not meet the requirements for hedge accounting treatment and the change in value of these instruments is immediately recognized in cost of products sold. If the contract qualifies for hedge accounting treatment, to the extent the hedge is deemed effective, the associated mark-to-market gains and losses are deferred and included as a component of accumulated other comprehensive (loss) income. These gains or losses are reclassified to earnings in the period the contract is executed. The ineffective portion of these contracts is immediately recognized in earnings.
Interest Rate Hedging: The Company utilizes interest rate swaps to mitigate the exposure to interest rate risk. At the inception of the contract, the instrument is evaluated and documented for hedge accounting treatment.
In August 2011, the Company entered into a forward-starting interest rate swap agreement to partially hedge the risk of an increase in the benchmark interest rate during the period leading up to the $750.0 million 3.50 percent Notes public offering. The interest rate swap was designated as a cash flow hedge. The mark-to-market gains or losses on the swap were deferred and included as a component of accumulated other comprehensive (loss) income to the extent effective, and reclassified to interest expense in the period during which the hedged transaction affected earnings. In October 2011, in conjunction with the pricing of the 3.50 percent Notes, the Company terminated the interest rate swap prior to maturity, resulting in a loss of $6.2 million. The resulting loss will be recognized in interest expense ratably over the life of the related debt. The ineffective portion of the hedge was reclassified to interest expense upon termination of the swap. For additional information, see Note 10: Debt and Financing Arrangements.
The Company’s interest rate swap on the 6.63 percent Senior Notes due November 1, 2018, met the criteria to be designated as a fair value hedge. The Company received a fixed rate and paid variable rates, hedging the underlying debt and the associated changes in the fair value of the debt. The interest rate swap was recognized at fair value in the Consolidated Balance Sheet at April 30, 2011, and changes in the fair value were recognized in interest expense. Gains and losses recognized in interest expense on the instrument had no net impact to earnings, as the change in the fair value of the derivative was equal to the change in fair value of the underlying debt. In August 2011, the Company terminated the interest rate swap on the 6.63 percent Senior Notes prior to maturity, resulting in a gain of $23.9 million which was deferred and will be recognized over the remaining life of the underlying debt as a reduction of future interest expense. In 2012, the Company recognized $2.0 million of the gain with the remaining to be recognized as follows: $2.9 million in 2013, $3.0 million in 2014, $3.2 million in 2015, $3.4 million in 2016, and the remaining $9.4 million in 2017 through 2019. For additional information, see Note 10: Debt and Financing Arrangements.
| 66 The J. M. Smucker Company 2012 Annual Report |
NOTES TO CONSOLIDATED FINANCIAL STATEMENTS
The J. M. Smucker Company
The following table sets forth the fair value of derivative instruments recognized in the Consolidated Balance Sheets.
| April 30, 2012 | April 30, 2011 | |||||||||||||||||||
| Other Current Assets |
Other Current Liabilities |
Other Current Assets |
Other Current Liabilities |
Other Noncurrent Liabilities |
||||||||||||||||
| Derivatives designated as hedging instruments: |
||||||||||||||||||||
| Commodity contracts |
$ | 6,569 | $ | 19,510 | $ | 3,408 | $ | — | $ | — | ||||||||||
| Interest rate contract |
— | — | 5,423 | — | 1,384 | |||||||||||||||
|
|
|
|
|
|
|
|
|
|
|
|||||||||||
| Total derivatives designated as hedging instruments |
$ | 6,569 | $ | 19,510 | $ | 8,831 | $ | — | $ | 1,384 | ||||||||||
|
|
|
|
|
|
|
|
|
|
|
|||||||||||
| Derivatives not designated as hedging instruments: |
||||||||||||||||||||
| Commodity contracts |
$ | 3,166 | $ | 3,631 | $ | 9,887 | $ | 5,432 | $ | — | ||||||||||
| Foreign currency exchange contracts |
436 | 982 | 317 | 3,204 | — | |||||||||||||||
|
|
|
|
|
|
|
|
|
|
|
|||||||||||
| Total derivatives not designated as hedging instruments |
$ | 3,602 | $ | 4,613 | $ | 10,204 | $ | 8,636 | $ | — | ||||||||||
|
|
|
|
|
|
|
|
|
|
|
|||||||||||
| Total derivative instruments |
$ | 10,171 | $ | 24,123 | $ | 19,035 | $ | 8,636 | $ | 1,384 | ||||||||||
|
|
|
|
|
|
|
|
|
|
|
|||||||||||
The Company has elected to not offset fair value amounts recognized for commodity derivative instruments and its cash margin accounts executed with the same counterparty. The Company maintained cash margin accounts of $32,529 and $12,292 at April 30, 2012 and 2011, respectively, that are included in other current assets in the Consolidated Balance Sheets.
The following table presents information on pre-tax commodity contract net gains and losses recognized on derivatives designated as cash flow hedges.
| Year Ended April 30, | ||||||||
| 2012 | 2011 | |||||||
| (Losses) gains recognized in other comprehensive (loss) income (effective portion) |
$ | (31,830 | ) | $ | 21,082 | |||
| Gains reclassified from accumulated other comprehensive (loss) income to cost of products sold (effective portion) |
1,887 | 14,780 | ||||||
|
|
|
|
|
|||||
| Change in accumulated other comprehensive (loss) income |
$ | (33,717 | ) | $ | 6,302 | |||
|
|
|
|
|
|||||
| (Losses) gains recognized in cost of products sold (ineffective portion) |
$ | (853 | ) | $ | 611 | |||
|
|
|
|
|
|||||
Included as a component of accumulated other comprehensive (loss) income at April 30, 2012 and 2011, were deferred pre-tax net losses of $24,287 and deferred pre-tax net gains of $9,430, respectively, related to commodity contracts. The related tax impact recognized in accumulated other comprehensive (loss) income was a benefit of $8,820 and expense of $3,430 at April 30, 2012 and 2011, respectively. The entire amount of the deferred net loss included in accumulated other comprehensive (loss) income at April 30, 2012, is expected to be recognized in earnings within one year as the related commodity is sold.
The following table presents information on the pre-tax losses recognized on the interest rate swap designated as a cash flow hedge.
| Year Ended April 30, | ||||||||
| 2012 | 2011 | |||||||
| Losses recognized in other comprehensive (loss) income (effective portion) |
$ | (6,192 | ) | $ | — | |||
| Losses reclassified from accumulated other comprehensive (loss) income to interest expense (effective portion) |
(278 | ) | — | |||||
|
|
|
|
|
|||||
| Change in accumulated other comprehensive (loss) income |
$ | (5,914 | ) | $ | — | |||
|
|
|
|
|
|||||
| Losses recognized in interest expense (ineffective portion) |
$ | (19 | ) | $ | — | |||
|
|
|
|
|
|||||
Included as a component of accumulated other comprehensive (loss) income at April 30, 2012, were deferred pre-tax losses of $5,914 related to the termination of the interest rate contract, of which approximately $500 will be recognized over the next 12 months. The related tax benefit recognized in accumulated other comprehensive (loss) income was $2,133 at April 30, 2012.
| The J. M. Smucker Company 2012 Annual Report 67 |
NOTES TO CONSOLIDATED FINANCIAL STATEMENTS
The J. M. Smucker Company
The following table presents the net realized and unrealized gains and losses recognized in cost of products sold on derivatives not designated as qualified hedging instruments.
| Year Ended April 30, | ||||||||
| 2012 | 2011 | |||||||
| Gains (losses) on commodity contracts |
$ | 16,306 | $ | (3,994 | ) | |||
| Gains (losses) on foreign currency exchange contracts |
951 | (3,290 | ) | |||||
|
|
|
|
|
|||||
| Gains (losses) recognized in cost of products sold (derivatives not designated as hedging instruments) |
$ | 17,257 | $ | (7,284 | ) | |||
|
|
|
|
|
|||||
The following table presents the gross contract notional value of outstanding derivative contracts.
| April 30, | ||||||||
| 2012 | 2011 | |||||||
| Commodity contracts |
$ | 983,381 | $ | 869,107 | ||||
| Foreign currency exchange contracts |
94,424 | 73,158 | ||||||
| Interest rate contract |
— | 376,000 | ||||||
| NOTE 13 | OTHER FINANCIAL INSTRUMENTS AND FAIR VALUE MEASUREMENTS |
Financial instruments, other than derivatives, that potentially subject the Company to significant concentrations of credit risk consist principally of cash investments and trade receivables. With respect to trade receivables, the Company believes there is no concentration of risk with any single customer whose failure or nonperformance would materially affect the Company’s results other than as discussed in Major Customer of Note 1: Accounting Policies. The Company does not require collateral from its customers. The Company’s financial instruments, other than its long-term debt, are recognized at estimated fair value in the Consolidated Balance Sheets.
The following table provides information on the carrying amount and fair value of the Company’s financial assets (liabilities).
| April 30, 2012 | April 30, 2011 | |||||||||||||||
| Carrying Amount |
Fair Value | Carrying Amount |
Fair Value | |||||||||||||
| Marketable securities |
$ | — | $ | — | $ | 18,600 | $ | 18,600 | ||||||||
| Other investments |
43,217 | 43,217 | 41,560 | 41,560 | ||||||||||||
| Derivative financial instruments – net |
(13,952 | ) | (13,952 | ) | 9,015 | 9,015 | ||||||||||
| Long-term debt |
(2,070,543 | ) | (2,443,514 | ) | (1,304,039 | ) | (1,648,614 | ) | ||||||||
Fair value is defined as the price that would be received to sell an asset or paid to transfer a liability in an orderly transaction between market participants at the measurement date. Valuation techniques are based on observable and unobservable inputs. Observable inputs reflect readily obtainable data from independent sources, while unobservable inputs reflect the Company’s market assumptions.
| 68 The J. M. Smucker Company 2012 Annual Report |
NOTES TO CONSOLIDATED FINANCIAL STATEMENTS
The J. M. Smucker Company
The following tables summarize the fair values and the levels within the fair value hierarchy in which the fair value measurements fall for the Company’s financial assets (liabilities).
| Quoted Prices in Active Markets for Identical Assets (Level 1) |
Significant Observable Inputs (Level 2) |
Significant Unobservable Inputs (Level 3) |
Fair Value
at April 30, 2012 |
|||||||||||||
| Other investments: (B) |
||||||||||||||||
| Equity mutual funds |
$ | 14,649 | $ | — | $ | — | $ | 14,649 | ||||||||
| Municipal obligations |
— | 20,392 | — | 20,392 | ||||||||||||
| Other investments |
1,132 | 7,044 | — | 8,176 | ||||||||||||
| Derivatives: (C) |
||||||||||||||||
| Commodity contracts – net |
(12,788 | ) | (618 | ) | — | (13,406 | ) | |||||||||
| Foreign currency exchange contracts – net |
(1 | ) | (545 | ) | — | (546 | ) | |||||||||
| Long-term debt (D) |
(777,023 | ) | (1,666,491 | ) | — | (2,443,514 | ) | |||||||||
|
|
|
|
|
|
|
|
|
|||||||||
| Total financial instruments measured at fair value |
$ | (774,031 | ) | $ | (1,640,218 | ) | $ | — | $ | (2,414,249 | ) | |||||
|
|
|
|
|
|
|
|
|
|||||||||
| Quoted Prices in Active Markets for Identical Assets (Level 1) |
Significant Observable Inputs (Level 2) |
Significant Unobservable Inputs (Level 3) |
Fair Value at April 30, 2011 |
|||||||||||||
| Marketable securities (A) |
$ | — | $ | 18,600 | $ | — | $ | 18,600 | ||||||||
| Other investments: (B) |
||||||||||||||||
| Equity mutual funds |
14,011 | — | — | 14,011 | ||||||||||||
| Municipal obligations |
— | 20,042 | — | 20,042 | ||||||||||||
| Other investments |
464 | 7,043 | — | 7,507 | ||||||||||||
| Derivatives: (C) |
||||||||||||||||
| Commodity contracts – net |
7,863 | — | — | 7,863 | ||||||||||||
| Foreign currency exchange contracts – net |
(2,887 | ) | — | — | (2,887 | ) | ||||||||||
| Interest rate contract – net |
— | 4,039 | — | 4,039 | ||||||||||||
| Long-term debt (D) |
— | (1,648,614 | ) | — | (1,648,614 | ) | ||||||||||
|
|
|
|
|
|
|
|
|
|||||||||
| Total financial instruments measured at fair value |
$ | 19,451 | $ | (1,598,890 | ) | $ | — | $ | (1,579,439 | ) | ||||||
|
|
|
|
|
|
|
|
|
|||||||||
| (A) | The Company’s marketable securities consisted entirely of commercial paper at April 30, 2011, and were broker-priced and valued by a third party using valuation techniques which utilize inputs that are derived principally from or corroborated by observable market data. All securities had matured or were sold at values that were consistent with the previously estimated fair values prior to April 30, 2012. |
| (B) | The Company’s other investments consist of funds maintained for the payment of benefits associated with nonqualified retirement plans. The funds include equity securities listed in active markets and municipal obligations valued by a third party using valuation techniques which utilize inputs that are derived principally from or corroborated by observable market data. As of April 30, 2012, the Company’s municipal obligations are scheduled to mature as follows: $3,536 in 2013, $732 in 2014, $2,739 in 2015, $927 in 2016, and the remaining $12,458 in 2017 and beyond. |
| (C) | The Company’s Level 1 derivatives are valued using quoted market prices for identical instruments in active markets. The Level 2 derivatives are valued using quoted prices for similar assets or liabilities in active markets and inputs other than quoted prices that are observable for the asset or liability. The Company’s interest rate swap was valued using the income approach, observable Level 2 market expectations at the measurement date, and standard valuation techniques to convert future amounts to a single discounted present value. The specific inputs used to value the swap included futures contracts valued based on LIBOR, LIBOR cash and swap rates, and credit risk at commonly quoted intervals. For additional information, see Note 12: Derivative Financial Instruments. |
| (D) | The Company’s long-term debt is comprised of public Notes classified as Level 1 and private Senior Notes classified as Level 2. The public Notes are traded in an active secondary market and valued using quoted prices. The value of the private Senior Notes is based on the net present value of each interest and principal payment calculated, utilizing an interest rate derived from a fair market yield curve. For additional information, see Note 10: Debt and Financing Arrangements. |
| The J. M. Smucker Company 2012 Annual Report 69 |
NOTES TO CONSOLIDATED FINANCIAL STATEMENTS
The J. M. Smucker Company
| NOTE 14 | INCOME TAXES |
Deferred income taxes reflect the tax effects of temporary differences between the carrying amounts of assets and liabilities for financial reporting purposes and the amounts used for income tax reporting. Significant components of the Company’s deferred tax assets and liabilities are as follows:
| April 30, | ||||||||
| 2012 | 2011 | |||||||
| Deferred tax liabilities: |
||||||||
| Intangible assets |
$ | 1,018,262 | $ | 1,025,301 | ||||
| Property, plant, and equipment |
106,218 | 111,537 | ||||||
| Other |
8,107 | 10,016 | ||||||
|
|
|
|
|
|||||
| Total deferred tax liability |
$ | 1,132,587 | $ | 1,146,854 | ||||
|
|
|
|
|
|||||
| Deferred tax assets: |
||||||||
| Post-employment and other employee benefits |
$ | 107,543 | $ | 84,723 | ||||
| Tax credit and loss carryforwards |
5,494 | 4,583 | ||||||
| Intangible assets |
3,370 | 3,279 | ||||||
| Other |
40,719 | 27,668 | ||||||
|
|
|
|
|
|||||
| Total deferred tax assets |
$ | 157,126 | $ | 120,253 | ||||
| Valuation allowance for deferred tax assets |
(3,072 | ) | (3,324 | ) | ||||
|
|
|
|
|
|||||
| Total deferred tax assets, less allowance |
$ | 154,054 | $ | 116,929 | ||||
|
|
|
|
|
|||||
| Net deferred tax liability |
$ | 978,533 | $ | 1,029,925 | ||||
|
|
|
|
|
|||||
The following table summarizes domestic and foreign loss and credit carryforwards at April 30, 2012.
| Related Tax Deduction |
Deferred Tax Asset |
Valuation Allowance |
Expiration Date |
|||||||||||||
| Tax carryforwards: |
||||||||||||||||
| Federal capital loss carryforward |
$ | 1,917 | $ | 694 | $ | — | 2017 | |||||||||
| State loss carryforwards |
63,482 | 3,154 | 2,935 | 2013 to 2031 | ||||||||||||
| State tax credit carryforwards |
— | 1,636 | — | 2019 | ||||||||||||
| Foreign jurisdictional tax credit carryforwards |
— | 10 | — | 2015 | ||||||||||||
|
|
|
|
|
|
|
|
|
|||||||||
| Total tax carryforwards |
$ | 65,399 | $ | 5,494 | $ | 2,935 | ||||||||||
|
|
|
|
|
|
|
|
|
|||||||||
The Company evaluates the realizability of deferred tax assets for each of the jurisdictions in which it operates. Included in the overall valuation allowance is $137 for other deferred tax assets where it is more likely than not that those assets will not be realized. The total valuation allowance decreased by $252, $146, and $5,556 in 2012, 2011, and 2010, respectively, primarily due to the expiration of state loss carryforwards that had full valuation allowances.
Deferred income taxes have not been provided on approximately $200,100 of undistributed earnings of foreign subsidiaries since these amounts are considered to be permanently reinvested. Any additional taxes payable on the earnings of foreign subsidiaries, if remitted, would be partially offset by domestic tax deductions or tax credits for foreign taxes paid. It is not practical to estimate the amount of additional taxes that might be payable on such undistributed earnings.
| 70 The J. M. Smucker Company 2012 Annual Report |
NOTES TO CONSOLIDATED FINANCIAL STATEMENTS
The J. M. Smucker Company
Income (loss) before income taxes is as follows:
| Year Ended April 30, | ||||||||||||
| 2012 | 2011 | 2010 | ||||||||||
| Domestic |
$ | 706,366 | $ | 729,654 | $ | 712,226 | ||||||
| Foreign |
(5,208 | ) | (12,490 | ) | 18,527 | |||||||
|
|
|
|
|
|
|
|||||||
| Income before income taxes |
$ | 701,158 | $ | 717,164 | $ | 730,753 | ||||||
|
|
|
|
|
|
|
|||||||
The components of the provision for income taxes are as follows:
| Year Ended April 30, | ||||||||||||
| 2012 | 2011 | 2010 | ||||||||||
| Current: |
||||||||||||
| Federal |
$ | 228,255 | $ | 271,361 | $ | 256,444 | ||||||
| Foreign |
6,798 | 4,554 | 6,584 | |||||||||
| State and local |
23,579 | 21,568 | 12,907 | |||||||||
| Deferred: |
||||||||||||
| Federal |
(10,273 | ) | (51,011 | ) | (21,362 | ) | ||||||
| Foreign |
(6,867 | ) | (7,338 | ) | (4,386 | ) | ||||||
| State and local |
(78 | ) | (1,452 | ) | (13,572 | ) | ||||||
|
|
|
|
|
|
|
|||||||
| Total income tax expense |
$ | 241,414 | $ | 237,682 | $ | 236,615 | ||||||
|
|
|
|
|
|
|
|||||||
A reconciliation of the statutory federal income tax rate and the effective income tax rate is as follows:
| Year Ended April 30, | ||||||||||||
| Percent of Pretax Income |
2012 | 2011 | 2010 | |||||||||
| Statutory federal income tax rate |
35.0 | % | 35.0 | % | 35.0 | % | ||||||
| State and local income taxes, net of federal income tax benefit |
2.3 | 2.2 | 1.2 | |||||||||
| Domestic manufacturing deduction |
(3.1 | ) | (3.8 | ) | (1.9 | ) | ||||||
| Other items – net |
0.2 | (0.3 | ) | (1.9 | ) | |||||||
|
|
|
|
|
|
|
|||||||
| Effective income tax rate |
34.4 | % | 33.1 | % | 32.4 | % | ||||||
|
|
|
|
|
|
|
|||||||
| Income taxes paid |
$ | 257,762 | $ | 365,994 | $ | 212,981 | ||||||
|
|
|
|
|
|
|
|||||||
| The J. M. Smucker Company 2012 Annual Report 71 |
NOTES TO CONSOLIDATED FINANCIAL STATEMENTS
The J. M. Smucker Company
The Company files income tax returns in the U.S. and various state, local, and foreign jurisdictions. The Company is no longer subject to examination, with limited exceptions, for tax years prior to 2008 for U.S. federal, state, and local income taxes and tax years prior to 2005 for foreign income taxes. During 2011, the Company reached agreement with the Internal Revenue Service (“IRS”) on proposed adjustments resulting from the examination of its federal income tax returns for the tax periods ended April 30, 2008, June 30, 2009, and April 30, 2010. The agreement did not have a material effect on the Company’s effective tax rate or financial position. The Company is a voluntary participant in the Compliance Assurance Process (“CAP”) offered by the IRS and is currently under a CAP examination for the tax year ended April 30, 2012. Through the contemporaneous exchange of information with the IRS, this program is designed to identify and resolve tax positions with the IRS prior to the filing of a tax return, which allows the Company to remain current with its IRS examinations.
Within the next 12 months, it is reasonably possible that the Company could decrease its unrecognized tax benefits by an estimated $636, primarily as a result of the expiration of statute of limitations periods.
The Company’s unrecognized tax benefits as of April 30, 2012 and 2011, were $23,977 and $20,261, respectively. Of the unrecognized tax benefits, $16,410 and $13,939 would affect the effective tax rate, if recognized, as of April 30, 2012 and 2011, respectively. The Company’s accrual for tax-related net interest and penalties totaled $1,704 and $1,792 as of April 30, 2012 and 2011, respectively. The amount of tax-related net interest and penalties charged to earnings totaled $88 for 2012, and credited to earnings totaled $497 and $594 during 2011 and 2010, respectively.
A reconciliation of the Company’s unrecognized tax benefits is as follows:
| 2012 | 2011 | |||||||
| Balance at May 1, |
$ | 20,261 | $ | 15,322 | ||||
| Increases: |
||||||||
| Current year tax positions |
3,617 | 5,237 | ||||||
| Prior year tax positions |
2,103 | 4,106 | ||||||
| Foreign currency translation |
157 | — | ||||||
| Decreases: |
||||||||
| Prior year tax positions |
— | 271 | ||||||
| Settlement with tax authorities |
287 | 31 | ||||||
| Expiration of statute of limitations periods |
1,874 | 3,985 | ||||||
| Foreign currency translation |
— | 117 | ||||||
|
|
|
|
|
|||||
| Balance at April 30, |
$ | 23,977 | $ | 20,261 | ||||
|
|
|
|
|
|||||
| 72 The J. M. Smucker Company 2012 Annual Report |
NOTES TO CONSOLIDATED FINANCIAL STATEMENTS
The J. M. Smucker Company
| NOTE 15 | ACCUMULATED OTHER COMPREHENSIVE (LOSS) INCOME |
Comprehensive income is included in the Statements of Consolidated Shareholders’ Equity. The components of accumulated other comprehensive (loss) income as shown in the Consolidated Balance Sheets are as follows:
| Foreign Currency Translation Adjustment |
Pension and Other Postretirement Liabilities |
Unrealized Gain (Loss) on Available-for- Sale Securities |
Unrealized (Loss) Gain on Cash Flow Hedging Derivatives |
Accumulated Other Comprehensive (Loss) Income |
||||||||||||||||
| Balance at May 1, 2009 |
$ | 11,062 | $ | (67,693 | ) | $ | (2,209 | ) | $ | 1,570 | $ | (57,270 | ) | |||||||
| Reclassification adjustments |
— | — | — | (2,494 | ) | (2,494 | ) | |||||||||||||
| Current period credit (charge) |
45,926 | (18,004 | ) | 4,162 | 3,128 | 35,212 | ||||||||||||||
| Income tax benefit (expense) |
— | 5,691 | (1,510 | ) | (210 | ) | 3,971 | |||||||||||||
|
|
|
|
|
|
|
|
|
|
|
|||||||||||
| Balance at April 30, 2010 |
$ | 56,988 | $ | (80,006 | ) | $ | 443 | $ | 1,994 | $ | (20,581 | ) | ||||||||
| Reclassification adjustments |
— | — | — | (3,128 | ) | (3,128 | ) | |||||||||||||
| Current period credit (charge) |
24,773 | (10,004 | ) | 2,124 | 9,430 | 26,323 | ||||||||||||||
| Income tax benefit (expense) |
— | 4,076 | (765 | ) | (2,296 | ) | 1,015 | |||||||||||||
|
|
|
|
|
|
|
|
|
|
|
|||||||||||
| Balance at April 30, 2011 |
$ | 81,761 | $ | (85,934 | ) | $ | 1,802 | $ | 6,000 | $ | 3,629 | |||||||||
| Reclassification adjustments |
— | — | — | (9,430 | ) | (9,430 | ) | |||||||||||||
| Current period (charge) credit |
(14,785 | ) | (73,137 | ) | 1,167 | (30,201 | ) | (116,956 | ) | |||||||||||
| Income tax benefit (expense) |
— | 24,808 | (425 | ) | 14,383 | 38,766 | ||||||||||||||
|
|
|
|
|
|
|
|
|
|
|
|||||||||||
| Balance at April 30, 2012 |
$ | 66,976 | $ | (134,263 | ) | $ | 2,544 | $ | (19,248 | ) | $ | (83,991 | ) | |||||||
|
|
|
|
|
|
|
|
|
|
|
|||||||||||
Income tax benefit (expense) is determined using the applicable deferred tax rate for each component of accumulated other comprehensive (loss) income.
| The J. M. Smucker Company 2012 Annual Report 73 |
NOTES TO CONSOLIDATED FINANCIAL STATEMENTS
The J. M. Smucker Company
| NOTE 16 | GUARANTOR AND NON-GUARANTOR FINANCIAL INFORMATION |
On October 13, 2011, the Company filed a registration statement on Form S-3 registering certain securities described therein, including debt securities which are guaranteed by certain of the Company’s subsidiaries. The Company issued $750.0 million of 3.50 percent Notes pursuant to the registration statement that are fully and unconditionally guaranteed, on a joint and several basis, by the following 100 percent wholly-owned subsidiaries of the Company: J. M. Smucker LLC and The Folgers Coffee Company (“subsidiary guarantors”). The following condensed consolidated financial information for the Company, the subsidiary guarantors, and the non-guarantor subsidiaries is provided. The principal elimination entries relate to investments in subsidiaries and intercompany balances and transactions, including transactions with the Company’s 100 percent wholly-owned subsidiary guarantors and non-guarantor subsidiaries. The Company has accounted for investments in subsidiaries using the equity method.
CONDENSED STATEMENTS OF CONSOLIDATED INCOME
| Year Ended April 30, 2012 | ||||||||||||||||||||
| The J. M. Smucker Company (Parent) |
Subsidiary Guarantors |
Non-Guarantor Subsidiaries |
Eliminations | Consolidated | ||||||||||||||||
| Net sales |
$ | 4,302,743 | $ | 1,547,757 | $ | 3,822,370 | $ | (4,147,088 | ) | $ | 5,525,782 | |||||||||
| Cost of products sold |
3,741,054 | 1,408,792 | 2,682,636 | (4,151,923 | ) | 3,680,559 | ||||||||||||||
|
|
|
|
|
|
|
|
|
|
|
|||||||||||
| Gross Profit |
561,689 | 138,965 | 1,139,734 | 4,835 | 1,845,223 | |||||||||||||||
| Selling, distribution, and administrative expenses, restructuring, and merger and integration costs |
243,392 | 61,457 | 660,327 | — | 965,176 | |||||||||||||||
| Amortization and impairment charges |
11,196 | — | 81,454 | — | 92,650 | |||||||||||||||
| Other operating (income) expense – net |
(1,325 | ) | (1,251 | ) | 11,690 | — | 9,114 | |||||||||||||
|
|
|
|
|
|
|
|
|
|
|
|||||||||||
| Operating Income |
308,426 | 78,759 | 386,263 | 4,835 | 778,283 | |||||||||||||||
| Interest (expense) income – net |
(80,675 | ) | 2,969 | (2,086 | ) | — | (79,792 | ) | ||||||||||||
| Other income (expense) – net |
1,404,340 | 443 | (3,605 | ) | (1,398,511 | ) | 2,667 | |||||||||||||
| Equity in net earnings of subsidiaries |
(1,095,007 | ) | 184,217 | 79,192 | 831,598 | — | ||||||||||||||
|
|
|
|
|
|
|
|
|
|
|
|||||||||||
| Income Before Income Taxes |
537,084 | 266,388 | 459,764 | (562,078 | ) | 701,158 | ||||||||||||||
| Income taxes |
77,340 | 1,140 | 162,934 | — | 241,414 | |||||||||||||||
|
|
|
|
|
|
|
|
|
|
|
|||||||||||
| Net Income |
$ | 459,744 | $ | 265,248 | $ | 296,830 | $ | (562,078 | ) | $ | 459,744 | |||||||||
|
|
|
|
|
|
|
|
|
|
|
|||||||||||
| 74 The J. M. Smucker Company 2012 Annual Report |
NOTES TO CONSOLIDATED FINANCIAL STATEMENTS
The J. M. Smucker Company
CONDENSED STATEMENTS OF CONSOLIDATED INCOME
| Year Ended April 30, 2011 | ||||||||||||||||||||
| The J. M. Smucker Company (Parent) |
Subsidiary Guarantors |
Non-Guarantor Subsidiaries |
Eliminations | Consolidated | ||||||||||||||||
| Net sales |
$ | 3,880,940 | $ | 2,805,614 | $ | 3,759,833 | $ | (5,620,644 | ) | $ | 4,825,743 | |||||||||
| Cost of products sold |
3,196,825 | 2,546,492 | 2,884,851 | (5,600,942 | ) | 3,027,226 | ||||||||||||||
|
|
|
|
|
|
|
|
|
|
|
|||||||||||
| Gross Profit |
684,115 | 259,122 | 874,982 | (19,702 | ) | 1,798,517 | ||||||||||||||
| Selling, distribution, and administrative expenses, restructuring, and merger and integration costs |
216,731 | 79,263 | 626,182 | — | 922,176 | |||||||||||||||
| Amortization and impairment charges |
5,188 | 64,675 | 21,580 | — | 91,443 | |||||||||||||||
| Other operating (income) expense – net |
(665 | ) | (2,599 | ) | 3,890 | — | 626 | |||||||||||||
|
|
|
|
|
|
|
|
|
|
|
|||||||||||
| Operating Income |
462,861 | 117,783 | 223,330 | (19,702 | ) | 784,272 | ||||||||||||||
| Interest (expense) income – net |
(67,687 | ) | 3,400 | (2,795 | ) | — | (67,082 | ) | ||||||||||||
| Other (expense) income – net |
(1,338 | ) | 1,735 | (423 | ) | — | (26 | ) | ||||||||||||
| Equity in net earnings of subsidiaries |
203,115 | 83,879 | 67,256 | (354,250 | ) | — | ||||||||||||||
|
|
|
|
|
|
|
|
|
|
|
|||||||||||
| Income Before Income Taxes |
596,951 | 206,797 | 287,368 | (373,952 | ) | 717,164 | ||||||||||||||
| Income taxes |
117,469 | 21,838 | 98,375 | — | 237,682 | |||||||||||||||
|
|
|
|
|
|
|
|
|
|
|
|||||||||||
| Net Income |
$ | 479,482 | $ | 184,959 | $ | 188,993 | $ | (373,952 | ) | $ | 479,482 | |||||||||
|
|
|
|
|
|
|
|
|
|
|
|||||||||||
CONDENSED STATEMENTS OF CONSOLIDATED INCOME
| Year Ended April 30, 2010 | ||||||||||||||||||||
| The J. M. Smucker Company (Parent) |
Subsidiary Guarantors |
Non-Guarantor Subsidiaries |
Eliminations | Consolidated | ||||||||||||||||
| Net sales |
$ | 3,675,770 | $ | 2,899,461 | $ | 3,723,605 | $ | (5,693,547 | ) | $ | 4,605,289 | |||||||||
| Cost of products sold |
3,259,807 | 2,383,363 | 2,858,293 | (5,682,864 | ) | 2,818,599 | ||||||||||||||
|
|
|
|
|
|
|
|
|
|
|
|||||||||||
| Gross Profit |
415,963 | 516,098 | 865,312 | (10,683 | ) | 1,786,690 | ||||||||||||||
| Selling, distribution, and administrative expenses, restructuring, and merger and integration costs |
193,036 | 107,407 | 613,311 | — | 913,754 | |||||||||||||||
| Amortization and impairment charges |
10,200 | 65,681 | 9,434 | — | 85,315 | |||||||||||||||
| Other operating (income) expense – net |
(22,546 | ) | 7,083 | 12,175 | — | (3,288 | ) | |||||||||||||
|
|
|
|
|
|
|
|
|
|
|
|||||||||||
| Operating Income |
235,273 | 335,927 | 230,392 | (10,683 | ) | 790,909 | ||||||||||||||
| Interest (expense) income – net |
(53,264 | ) | 12,429 | (21,559 | ) | — | (62,394 | ) | ||||||||||||
| Other income (expense) – net |
151 | 17,609 | (15,522 | ) | — | 2,238 | ||||||||||||||
| Equity in net earnings of subsidiaries |
393,208 | 61,459 | 35,223 | (489,890 | ) | — | ||||||||||||||
|
|
|
|
|
|
|
|
|
|
|
|||||||||||
| Income Before Income Taxes |
575,368 | 427,424 | 228,534 | (500,573 | ) | 730,753 | ||||||||||||||
| Income taxes |
81,230 | 77,280 | 78,105 | — | 236,615 | |||||||||||||||
|
|
|
|
|
|
|
|
|
|
|
|||||||||||
| Net Income |
$ | 494,138 | $ | 350,144 | $ | 150,429 | $ | (500,573 | ) | $ | 494,138 | |||||||||
|
|
|
|
|
|
|
|
|
|
|
|||||||||||
| The J. M. Smucker Company 2012 Annual Report 75 |
NOTES TO CONSOLIDATED FINANCIAL STATEMENTS
The J. M. Smucker Company
CONDENSED CONSOLIDATED BALANCE SHEETS
| April 30, 2012 | ||||||||||||||||||||
| The J. M. Smucker Company (Parent) |
Subsidiary Guarantors |
Non-Guarantor Subsidiaries |
Eliminations | Consolidated | ||||||||||||||||
| ASSETS |
||||||||||||||||||||
| Current Assets |
||||||||||||||||||||
| Cash and cash equivalents |
$ | 108,281 | $ | — | $ | 121,427 | $ | — | $ | 229,708 | ||||||||||
| Inventories |
— | 161,411 | 815,030 | (14,865 | ) | 961,576 | ||||||||||||||
| Other current assets |
334,220 | 3,499 | 114,462 | — | 452,181 | |||||||||||||||
|
|
|
|
|
|
|
|
|
|
|
|||||||||||
| Total Current Assets |
442,501 | 164,910 | 1,050,919 | (14,865 | ) | 1,643,465 | ||||||||||||||
| Property, Plant, and Equipment |
220,354 | 389,163 | 486,572 | — | 1,096,089 | |||||||||||||||
| Investments in Subsidiaries and Intercompany |
5,684,496 | 4,241,145 | 702,550 | (10,628,191 | ) | — | ||||||||||||||
| Other Noncurrent Assets |
||||||||||||||||||||
| Goodwill |
981,606 | — | 2,073,012 | — | 3,054,618 | |||||||||||||||
| Other intangible assets – net |
435,713 | — | 2,751,294 | — | 3,187,007 | |||||||||||||||
| Other noncurrent assets |
59,992 | 11,137 | 62,918 | — | 134,047 | |||||||||||||||
|
|
|
|
|
|
|
|
|
|
|
|||||||||||
| Total Other Noncurrent Assets |
1,477,311 | 11,137 | 4,887,224 | — | 6,375,672 | |||||||||||||||
|
|
|
|
|
|
|
|
|
|
|
|||||||||||
| $ | 7,824,662 | $ | 4,806,355 | $ | 7,127,265 | $ | (10,643,056 | ) | $ | 9,115,226 | ||||||||||
|
|
|
|
|
|
|
|
|
|
|
|||||||||||
| LIABILITIES AND SHAREHOLDERS’ EQUITY |
||||||||||||||||||||
| Current Liabilities |
$ | 323,608 | $ | 101,714 | $ | 191,650 | $ | — | $ | 616,972 | ||||||||||
| Noncurrent Liabilities |
||||||||||||||||||||
| Long-term debt |
2,020,543 | — | — | — | 2,020,543 | |||||||||||||||
| Deferred income taxes |
104,822 | 311 | 887,559 | — | 992,692 | |||||||||||||||
| Other noncurrent liabilities |
212,303 | 20,031 | 89,299 | — | 321,633 | |||||||||||||||
|
|
|
|
|
|
|
|
|
|
|
|||||||||||
| Total Noncurrent Liabilities |
2,337,668 | 20,342 | 976,858 | — | 3,334,868 | |||||||||||||||
| Shareholders’ Equity |
5,163,386 | 4,684,299 | 5,958,757 | (10,643,056 | ) | 5,163,386 | ||||||||||||||
|
|
|
|
|
|
|
|
|
|
|
|||||||||||
| $ | 7,824,662 | $ | 4,806,355 | $ | 7,127,265 | $ | (10,643,056 | ) | $ | 9,115,226 | ||||||||||
|
|
|
|
|
|
|
|
|
|
|
|||||||||||
| 76 The J. M. Smucker Company 2012 Annual Report |
NOTES TO CONSOLIDATED FINANCIAL STATEMENTS
The J. M. Smucker Company
CONDENSED CONSOLIDATED BALANCE SHEETS
| April 30, 2011 | ||||||||||||||||||||
| The J. M. Smucker Company (Parent) |
Subsidiary Guarantors |
Non-Guarantor Subsidiaries |
Eliminations | Consolidated | ||||||||||||||||
| ASSETS |
||||||||||||||||||||
| Current Assets |
||||||||||||||||||||
| Cash and cash equivalents |
$ | 206,845 | $ | — | $ | 113,000 | $ | — | $ | 319,845 | ||||||||||
| Inventories |
— | 182,531 | 700,750 | (19,702 | ) | 863,579 | ||||||||||||||
| Other current assets |
364,377 | 8,190 | 81,008 | — | 453,575 | |||||||||||||||
|
|
|
|
|
|
|
|
|
|
|
|||||||||||
| Total Current Assets |
571,222 | 190,721 | 894,758 | (19,702 | ) | 1,636,999 | ||||||||||||||
| Property, Plant, and Equipment |
193,321 | 305,519 | 369,042 | — | 867,882 | |||||||||||||||
| Investments in Subsidiaries and Intercompany |
4,872,622 | 802,936 | 1,209,603 | (6,885,161 | ) | — | ||||||||||||||
| Other Noncurrent Assets |
||||||||||||||||||||
| Goodwill |
981,606 | — | 1,831,140 | — | 2,812,746 | |||||||||||||||
| Other intangible assets – net |
440,174 | 3,116 | 2,496,720 | — | 2,940,010 | |||||||||||||||
| Other noncurrent assets |
50,012 | 15,106 | 1,830 | — | 66,948 | |||||||||||||||
|
|
|
|
|
|
|
|
|
|
|
|||||||||||
| Total Other Noncurrent Assets |
1,471,792 | 18,222 | 4,329,690 | — | 5,819,704 | |||||||||||||||
|
|
|
|
|
|
|
|
|
|
|
|||||||||||
| $ | 7,108,957 | $ | 1,317,398 | $ | 6,803,093 | $ | (6,904,863 | ) | $ | 8,324,585 | ||||||||||
|
|
|
|
|
|
|
|
|
|
|
|||||||||||
| LIABILITIES AND SHAREHOLDERS’ EQUITY |
||||||||||||||||||||
| Current Liabilities |
$ | 234,262 | $ | 81,239 | $ | 167,175 | $ | — | $ | 482,676 | ||||||||||
| Noncurrent Liabilities |
||||||||||||||||||||
| Long-term debt |
1,304,039 | — | — | — | 1,304,039 | |||||||||||||||
| Deferred income taxes |
115,985 | — | 926,838 | — | 1,042,823 | |||||||||||||||
| Other noncurrent liabilities |
162,308 | 16,447 | 23,929 | — | 202,684 | |||||||||||||||
|
|
|
|
|
|
|
|
|
|
|
|||||||||||
| Total Noncurrent Liabilities |
1,582,332 | 16,447 | 950,767 | — | 2,549,546 | |||||||||||||||
| Shareholders’ Equity |
5,292,363 | 1,219,712 | 5,685,151 | (6,904,863 | ) | 5,292,363 | ||||||||||||||
|
|
|
|
|
|
|
|
|
|
|
|||||||||||
| $ | 7,108,957 | $ | 1,317,398 | $ | 6,803,093 | $ | (6,904,863 | ) | $ | 8,324,585 | ||||||||||
|
|
|
|
|
|
|
|
|
|
|
|||||||||||
| The J. M. Smucker Company 2012 Annual Report 77 |
NOTES TO CONSOLIDATED FINANCIAL STATEMENTS
The J. M. Smucker Company
CONDENSED STATEMENTS OF CONSOLIDATED CASH FLOWS
| Year Ended April 30, 2012 | ||||||||||||||||||||
| The J. M. Smucker Company (Parent) |
Subsidiary Guarantors |
Non-Guarantor Subsidiaries |
Eliminations | Consolidated | ||||||||||||||||
| Net Cash Provided by (Used for) Operating Activities |
$ | 1,622,917 | $ | 165,048 | $ | (1,057,036 | ) | $ | — | $ | 730,929 | |||||||||
|
|
|
|
|
|
|
|
|
|
|
|||||||||||
| Investing Activities |
||||||||||||||||||||
| Businesses acquired, net of cash acquired |
— | — | (737,255 | ) | — | (737,255 | ) | |||||||||||||
| Additions to property, plant, and equipment |
(52,994 | ) | (133,605 | ) | (87,645 | ) | — | (274,244 | ) | |||||||||||
| Equity investment in affiliate |
— | — | (35,874 | ) | — | (35,874 | ) | |||||||||||||
| Proceeds from divestitures |
— | — | 9,268 | — | 9,268 | |||||||||||||||
| Sales and maturities of marketable securities |
18,600 | — | — | — | 18,600 | |||||||||||||||
| Proceeds from disposal of property, plant, and equipment |
168 | 396 | 3,475 | — | 4,039 | |||||||||||||||
| Other – net |
— | (3,495 | ) | (16,903 | ) | — | (20,398 | ) | ||||||||||||
|
|
|
|
|
|
|
|
|
|
|
|||||||||||
| Net Cash Used for Investing Activities |
(34,226 | ) | (136,704 | ) | (864,934 | ) | — | (1,035,864 | ) | |||||||||||
|
|
|
|
|
|
|
|
|
|
|
|||||||||||
| Financing Activities |
||||||||||||||||||||
| Proceeds from long-term debt |
748,560 | — | — | — | 748,560 | |||||||||||||||
| Quarterly dividends paid |
(213,667 | ) | — | — | — | (213,667 | ) | |||||||||||||
| Purchase of treasury shares |
(315,780 | ) | — | — | — | (315,780 | ) | |||||||||||||
| Proceeds from stock option exercises |
2,826 | — | — | — | 2,826 | |||||||||||||||
| Intercompany |
(1,906,881 | ) | (28,344 | ) | 1,935,225 | — | — | |||||||||||||
| Other – net |
(2,313 | ) | — | — | — | (2,313 | ) | |||||||||||||
|
|
|
|
|
|
|
|
|
|
|
|||||||||||
| Net Cash (Used for) Provided by Financing Activities |
(1,687,255 | ) | (28,344 | ) | 1,935,225 | — | 219,626 | |||||||||||||
| Effect of exchange rate changes on cash |
— | — | (4,828 | ) | — | (4,828 | ) | |||||||||||||
|
|
|
|
|
|
|
|
|
|
|
|||||||||||
| Net (decrease) increase in cash and cash equivalents |
(98,564 | ) | — | 8,427 | — | (90,137 | ) | |||||||||||||
| Cash and cash equivalents at beginning of year |
206,845 | — | 113,000 | — | 319,845 | |||||||||||||||
|
|
|
|
|
|
|
|
|
|
|
|||||||||||
| Cash and Cash Equivalents at End of Year |
$ | 108,281 | $ | — | $ | 121,427 | $ | — | $ | 229,708 | ||||||||||
|
|
|
|
|
|
|
|
|
|
|
|||||||||||
| ( ) | Denotes use of cash |
| 78 The J. M. Smucker Company 2012 Annual Report |
NOTES TO CONSOLIDATED FINANCIAL STATEMENTS
The J. M. Smucker Company
CONDENSED STATEMENTS OF CONSOLIDATED CASH FLOWS
| Year Ended April 30, 2011 | ||||||||||||||||||||
| The J. M. Smucker Company (Parent) |
Subsidiary Guarantors |
Non-Guarantor Subsidiaries |
Eliminations | Consolidated | ||||||||||||||||
| Net Cash Provided by Operating Activities |
$ | 212,428 | $ | 92,965 | $ | 86,169 | $ | — | $ | 391,562 | ||||||||||
|
|
|
|
|
|
|
|
|
|
|
|||||||||||
| Investing Activities |
||||||||||||||||||||
| Additions to property, plant, and equipment |
(59,072 | ) | (53,416 | ) | (67,592 | ) | — | (180,080 | ) | |||||||||||
| Purchases of marketable securities |
(75,637 | ) | — | — | — | (75,637 | ) | |||||||||||||
| Sales and maturities of marketable securities |
57,100 | — | — | — | 57,100 | |||||||||||||||
| Proceeds from disposal of property, plant, and equipment |
1,081 | 305 | 4,444 | — | 5,830 | |||||||||||||||
| Other – net |
(43 | ) | 37 | (120 | ) | — | (126 | ) | ||||||||||||
|
|
|
|
|
|
|
|
|
|
|
|||||||||||
| Net Cash Used for Investing Activities |
(76,571 | ) | (53,074 | ) | (63,268 | ) | — | (192,913 | ) | |||||||||||
|
|
|
|
|
|
|
|
|
|
|
|||||||||||
| Financing Activities |
||||||||||||||||||||
| Repayments of long-term debt |
(10,000 | ) | — | — | — | (10,000 | ) | |||||||||||||
| Proceeds from long-term debt |
400,000 | — | — | — | 400,000 | |||||||||||||||
| Quarterly dividends paid |
(194,024 | ) | — | — | — | (194,024 | ) | |||||||||||||
| Purchase of treasury shares |
(389,135 | ) | — | — | — | (389,135 | ) | |||||||||||||
| Proceeds from stock option exercises |
14,525 | — | — | — | 14,525 | |||||||||||||||
| Intercompany |
24,152 | (39,891 | ) | 15,739 | — | — | ||||||||||||||
| Other – net |
7,740 | — | 475 | — | 8,215 | |||||||||||||||
|
|
|
|
|
|
|
|
|
|
|
|||||||||||
| Net Cash (Used for) Provided by Financing Activities |
(146,742 | ) | (39,891 | ) | 16,214 | — | (170,419 | ) | ||||||||||||
| Effect of exchange rate changes on cash |
— | — | 8,045 | — | 8,045 | |||||||||||||||
|
|
|
|
|
|
|
|
|
|
|
|||||||||||
| Net (decrease) increase in cash and cash equivalents |
(10,885 | ) | — | 47,160 | — | 36,275 | ||||||||||||||
| Cash and cash equivalents at beginning of year |
217,730 | — | 65,840 | — | 283,570 | |||||||||||||||
|
|
|
|
|
|
|
|
|
|
|
|||||||||||
| Cash and Cash Equivalents at End of Year |
$ | 206,845 | $ | — | $ | 113,000 | $ | — | $ | 319,845 | ||||||||||
|
|
|
|
|
|
|
|
|
|
|
|||||||||||
| ( ) | Denotes use of cash |
| The J. M. Smucker Company 2012 Annual Report 79 |
NOTES TO CONSOLIDATED FINANCIAL STATEMENTS
The J. M. Smucker Company
CONDENSED STATEMENTS OF CONSOLIDATED CASH FLOWS
| Year Ended April 30, 2010 | ||||||||||||||||||||
| The J. M. Smucker Company (Parent) |
Subsidiary Guarantors |
Non-Guarantor Subsidiaries |
Eliminations | Consolidated | ||||||||||||||||
| Net Cash Provided by (Used for) Operating Activities |
$ | 499,197 | $ | 218,064 | $ | (3,783 | ) | $ | — | $ | 713,478 | |||||||||
|
|
|
|
|
|
|
|
|
|
|
|||||||||||
| Investing Activities |
||||||||||||||||||||
| Additions to property, plant, and equipment |
(41,148 | ) | (62,324 | ) | (33,511 | ) | — | (136,983 | ) | |||||||||||
| Proceeds from divestitures |
19,554 | — | — | — | 19,554 | |||||||||||||||
| Sales and maturities of marketable securities |
13,519 | — | — | — | 13,519 | |||||||||||||||
| Proceeds from disposal of property, plant, and equipment |
— | 185 | 20 | — | 205 | |||||||||||||||
| Other – net |
(706 | ) | — | (32 | ) | — | (738 | ) | ||||||||||||
|
|
|
|
|
|
|
|
|
|
|
|||||||||||
| Net Cash Used for Investing Activities |
(8,781 | ) | (62,139 | ) | (33,523 | ) | — | (104,443 | ) | |||||||||||
|
|
|
|
|
|
|
|
|
|
|
|||||||||||
| Financing Activities |
||||||||||||||||||||
| Repayment of bank note payable |
— | (350,000 | ) | — | — | (350,000 | ) | |||||||||||||
| Repayments of long-term debt |
(275,000 | ) | — | — | — | (275,000 | ) | |||||||||||||
| Quarterly dividends paid |
(166,224 | ) | — | — | — | (166,224 | ) | |||||||||||||
| Purchase of treasury shares |
(5,569 | ) | — | — | — | (5,569 | ) | |||||||||||||
| Proceeds from stock option exercises |
6,413 | — | — | — | 6,413 | |||||||||||||||
| Intercompany |
(258,696 | ) | 194,075 | 64,621 | — | — | ||||||||||||||
| Other – net |
2,393 | — | (561 | ) | — | 1,832 | ||||||||||||||
|
|
|
|
|
|
|
|
|
|
|
|||||||||||
| Net Cash (Used for) Provided by Financing Activities |
(696,683 | ) | (155,925 | ) | 64,060 | — | (788,548 | ) | ||||||||||||
| Effect of exchange rate changes on cash |
— | — | 6,390 | — | 6,390 | |||||||||||||||
|
|
|
|
|
|
|
|
|
|
|
|||||||||||
| Net (decrease) increase in cash and cash equivalents |
(206,267 | ) | — | 33,144 | — | (173,123 | ) | |||||||||||||
| Cash and cash equivalents at beginning of year |
423,997 | — | 32,696 | — | 456,693 | |||||||||||||||
|
|
|
|
|
|
|
|
|
|
|
|||||||||||
| Cash and Cash Equivalents at End of Year |
$ | 217,730 | $ | — | $ | 65,840 | $ | — | $ | 283,570 | ||||||||||
|
|
|
|
|
|
|
|
|
|
|
|||||||||||
| ( ) | Denotes use of cash |
| 80 The J. M. Smucker Company 2012 Annual Report |
NOTES TO CONSOLIDATED FINANCIAL STATEMENTS
The J. M. Smucker Company
| NOTE 17 | COMMON SHARES |
Voting: The Company’s Amended Articles of Incorporation (“Articles”) provide that each holder of an outstanding common share is entitled to one vote on each matter submitted to a vote of the shareholders except for the following specific matters:
| • | any matter that relates to or would result in the dissolution or liquidation of the Company; |
| • | the adoption of any amendment of the Articles or the Regulations of the Company, or the adoption of amended Articles, other than the adoption of any amendment or amended Articles that increases the number of votes to which holders of common shares are entitled or expands the matters to which time-phase voting applies; |
| • | any proposal or other action to be taken by the shareholders of the Company, relating to the Company’s Rights Agreement, dated as of May 20, 2009, between the Company and Computershare Trust Company, N.A. or any successor plan; |
| • | any matter relating to any stock option plan, stock purchase plan, executive compensation plan, executive benefit plan, or other similar plan, arrangement, or agreement; |
| • | adoption of any agreement or plan of or for the merger, consolidation, or majority share acquisition of the Company or any of its subsidiaries with or into any other person, whether domestic or foreign, corporate or noncorporate, or the authorization of the lease, sale, exchange, transfer, or other disposition of all, or substantially all, of the Company’s assets; |
| • | any matter submitted to the Company’s shareholders pursuant to Article Fifth (which relates to procedures applicable to certain business combinations) or Article Seventh (which relates to procedures applicable to certain proposed acquisitions of specified percentages of the Company’s outstanding common shares) of the Articles, as they may be further amended, or any issuance of common shares of the Company for which shareholder approval is required by applicable stock exchange rules; and |
| • | any matter relating to the issuance of common shares, or the repurchase of common shares that the Board determines is required or appropriate to be submitted to the Company’s shareholders under the Ohio Revised Code or applicable stock exchange rules. |
On the matters listed above, common shares are entitled to 10 votes per share, if they meet the requirements set forth in the Articles. Common shares which would be entitled to 10 votes per share must meet one of the following criteria:
| • | common shares beneficially owned as of November 6, 2008, and for which there has not been a change in beneficial ownership after November 6, 2008; or |
| • | common shares received through the Company’s various equity plans which have not been sold or otherwise transferred since November 6, 2008. |
In the event of a change in beneficial ownership, the new owner of that common share will be entitled to only one vote with respect to that share on all matters until four years pass without a further change in beneficial ownership of the share.
Shareholders’ Rights Plan: Pursuant to a Shareholders’ Rights Plan adopted by the Company’s Board of Directors on May 20, 2009, one share purchase right is associated with each of the Company’s outstanding common shares.
Under the plan, the rights will initially trade together with the Company’s common shares and will not be exercisable. In the absence of further action by the directors, the rights generally will become exercisable and allow the holder to acquire the Company’s common shares at a discounted price if a person or group acquires 10 percent or more of the outstanding common shares. Rights held by persons who exceed the applicable threshold will be void. Shares held by members of the Smucker family are not subject to the threshold. If exercisable, each right entitles the shareholder to buy one common share at a discounted price. Under certain circumstances, the rights will entitle the holder to buy shares in an acquiring entity at a discounted price.
The plan also includes an exchange option. In general, if the rights become exercisable, the directors may, at their option, effect an exchange of part or all of the rights, other than rights that have become void, for common shares. Under this option, the Company would issue one common share for each right, in each case subject to adjustment in certain circumstances.
The Company’s directors may, at their option, redeem all rights for $0.001 per right, generally at any time prior to the rights becoming exercisable. The rights will expire June 3, 2019, unless earlier redeemed, exchanged, or amended by the directors.
| The J. M. Smucker Company 2012 Annual Report 81 |
DIRECTORS AND OFFICERS
The J. M. Smucker Company
| DIRECTORS
Vincent C. Byrd President and Chief Operating Officer The J. M. Smucker Company
R. Douglas Cowan A Director and Retired Chairman and Chief Executive Officer The Davey Tree Expert Company Kent, Ohio
Kathryn W. Dindo A, E Retired Vice President and Chief Risk Officer FirstEnergy Corp. Akron, Ohio
Paul J. Dolan E Chairman and Chief Executive Officer Cleveland Indians Cleveland, Ohio
Elizabeth Valk Long A, E Former Executive Vice President Time Inc. New York, New York
Nancy Lopez Knight G Founder Nancy Lopez Golf Company Auburn, Alabama
Gary A. Oatey G Chairman and Chief Executive Officer Oatey Co. Cleveland, Ohio
Alex Shumate G Managing Partner, North America Squire, Sanders & Dempsey L.L.P. Columbus, Ohio
Mark T. Smucker President, U.S. Retail Coffee The J. M. Smucker Company
Richard K. Smucker Chief Executive Officer The J. M. Smucker Company
Timothy P. Smucker Chairman of the Board The J. M. Smucker Company
William H. Steinbrink G Principal Unstuk LLC Shaker Heights, Ohio
Paul Smucker Wagstaff President, U.S. Retail Consumer Foods The J. M. Smucker Company |
EXECUTIVE OFFICERS
Timothy P. Smucker Chairman of the Board
Richard K. Smucker Chief Executive Officer
Dennis J. Armstrong Senior Vice President, Logistics and Operations Support
Mark R. Belgya Senior Vice President and Chief Financial Officer
James A. Brown Vice President, U.S. Grocery Sales
Vincent C. Byrd President and Chief Operating Officer
John W. Denman Vice President and Controller
Barry C. Dunaway Senior Vice President and Chief Administrative Officer
Tamara J. Fynan Vice President, Marketing Services
Jeannette L. Knudsen Vice President, General Counsel and Corporate Secretary
David J. Lemmon Vice President and Managing Director, Canada
John F. Mayer Vice President, U.S. Retail Sales
Kenneth A. Miller Vice President and General Manager, Foodservice
Steven Oakland President, International, Foodservice, and Natural Foods
Andrew G. Platt Vice President, Information Services and Chief Information Officer
Christopher P. Resweber Senior Vice President, Corporate Communications and Public Affairs
Julia L. Sabin Vice President, Industry and Government Affairs
Mark T. Smucker President, U.S. Retail Coffee |
Paul Smucker Wagstaff President, U.S. Retail Consumer Foods
Albert W. Yeagley Vice President, Industry and Government Affairs
PROPERTIES
Corporate Office: Orrville, Ohio
Domestic Manufacturing Locations:
Chico, California Cincinnati, Ohio El Paso, Texas Grandview, Washington Harahan, Louisiana Havre de Grace, Maryland Lexington, Kentucky Memphis, Tennessee Miami, Florida New Bethlehem, Pennsylvania New Orleans, Louisiana (2) Orrville, Ohio Oxnard, California Ripon, Wisconsin Scottsville, Kentucky Seneca, Missouri Suffolk, Virginia Toledo, Ohio
International Manufacturing Locations:
Sherbrooke, Quebec, Canada Ste. Marie, Quebec, Canada
A Audit Committee Member E Executive Compensation Committee Member G Nominating and Corporate Governance Committee Member |
| 82 The J. M. Smucker Company 2012 Annual Report |
Shareholder information
WWW.CORPORATEREPORT.COM
Corporate Reports Inc. Atlanta, GA
Corporate Office
The J.M. Smucker Company
One Strawberry Lane
Orrville, Ohio 44667
Telephone: (330) 682-3000
Stock Listing
The J.M. Smucker Company’s common shares are listed on the New York Stock Exchange – ticker symbol SJM.
Corporate WebSite
To learn more about The J.M. Smucker Company, visit smuckers.com.
Annual Meeting
The annual meeting will be held at 11:00 a.m. Eastern Time, Wednesday, August 15, 2012, in the Fisher Auditorium at the Ohio Agricultural Research and Development Center, 1680 Madison Avenue, Wooster, Ohio 44691.
Corporate News and Reports
Corporate news releases, annual reports, and Securities and Exchange Commission filings, including Forms 10-K, 10-Q, and 8-K, are available free of charge on the Company’s website. They are also available without cost to shareholders who submit a written request to:
The J.M. Smucker Company Attention: Corporate Secretary One Strawberry Lane
Orrville, Ohio 44667
Certifications
The Company’s Chief Executive Officer and Chief Financial Officer have certified to the New York Stock Exchange that they are not aware of any violation by the Company of the New York Stock Exchange corporate governance standards. The Company has also filed with the Securities and Exchange Commission certain certifications relating to the quality of the Company’s public disclosures. These certifications are filed as exhibits to the Company’s Annual Report on Form 10-K.
forward-looking statements
This Annual Report includes certain forward-looking statements that are based on current expectations and are subject to a number of risks and uncertainties. Please reference “Forward-Looking Statements” located on page 36 in the “Management’s Discussion and Analysis” section.
Independent Registered Public
Accounting Firm
Ernst & Young LLP
Akron, Ohio
Dividends
The Company’s Board of Directors typically declares a cash dividend each quarter. Dividends are generally payable on the first business day of March, June, September, and December. The record date is approximately two weeks before the payment date. The Company’s dividend disbursement agent is Computershare Investor Services, LLC.
Shareholder Services
The transfer agent and registrar for the Company, Computershare Investor Services, LLC, is responsible for assisting registered shareholders with a variety of matters, including:
Shareholder investment program (CIPSM)
– direct purchase of Company common shares
– dividend reinvestment
– automatic monthly cash investments
Book-entry share ownership
Share transfer matters (including name changes, gifting, and inheritances)
Direct deposit of dividend payments
Nonreceipt of dividend checks
Lost share certificates
Changes of address
Online shareholder account access
Form 1099 income inquiries (including requests for duplicate copies)
Shareholders may contact Shareholder Services at the corporate offices regarding other shareholder inquiries.
Transfer Agent and Registrar
Computershare Investor Services, LLC 250 Royall Street
Canton, Massachusetts 02021 Telephone: (800) 456-1169
Telephone outside the U.S., Canada, and Puerto Rico: (312) 360-5254
Website: computershare.com/investor
Designed by:
The J. M. Smucker Company is the owner of all trademarks referenced herein, except for the following which are used under license: Pillsbury®, the Barrelhead logo and the Doughboy character are trademarks of The Pillsbury Company, LLC; Carnation® is a trademark of Société des Produits Nestlé S.A.; Dunkin’ Donuts® is a registered trademark of DD IP Holder, LLC; and Douwe Egberts® and Pickwick® are registered trademarks of Sara Lee/DE B.V. Borden® and Elsie are also trademarks used under license.
One Strawberry Lane / Orrville, Ohio 44667 / (330) 682-3000
smuckers.com