00009127522021FYFALSEP1YP3YP0Yhttp://fasb.org/us-gaap/2021-01-31#PropertyPlantAndEquipmentAndFinanceLeaseRightOfUseAssetAfterAccumulatedDepreciationAndAmortizationhttp://fasb.org/us-gaap/2021-01-31#PropertyPlantAndEquipmentAndFinanceLeaseRightOfUseAssetAfterAccumulatedDepreciationAndAmortizationhttp://fasb.org/us-gaap/2021-01-31#DebtCurrenthttp://fasb.org/us-gaap/2021-01-31#DebtCurrenthttp://fasb.org/us-gaap/2021-01-31#LongTermDebtAndCapitalLeaseObligationshttp://fasb.org/us-gaap/2021-01-31#LongTermDebtAndCapitalLeaseObligations0.500009127522021-01-012021-12-3100009127522021-06-30iso4217:USD0000912752us-gaap:CommonClassAMember2022-02-23xbrli:shares0000912752us-gaap:CommonClassBMember2022-02-230000912752sbgi:BroadcastSegmentMember2021-12-31sbgi:market00009127522020-01-012020-12-310000912752us-gaap:OtherNonoperatingIncomeExpenseMembersbgi:VariablePaymentObligationsMembersbgi:RegionalSportsNetworksAndFoxCollegeSportsRSNsMember2020-01-012020-12-3100009127522021-12-3100009127522020-12-310000912752us-gaap:CustomerRelationshipsMember2021-12-310000912752us-gaap:CustomerRelationshipsMember2020-12-310000912752us-gaap:OtherIntangibleAssetsMember2021-12-310000912752us-gaap:OtherIntangibleAssetsMember2020-12-310000912752us-gaap:CommonClassAMember2021-12-31iso4217:USDxbrli:shares0000912752us-gaap:CommonClassAMember2020-12-310000912752us-gaap:CommonClassBMember2020-12-310000912752us-gaap:CommonClassBMember2021-12-310000912752us-gaap:VariableInterestEntityPrimaryBeneficiaryMember2021-12-310000912752us-gaap:VariableInterestEntityPrimaryBeneficiaryMember2020-12-310000912752us-gaap:VariableInterestEntityPrimaryBeneficiaryMemberus-gaap:RecourseMember2021-12-310000912752us-gaap:VariableInterestEntityPrimaryBeneficiaryMemberus-gaap:RecourseMember2020-12-3100009127522019-01-012019-12-3100009127522018-12-310000912752us-gaap:CommonStockMemberus-gaap:CommonClassAMember2018-12-310000912752us-gaap:CommonStockMemberus-gaap:CommonClassBMember2018-12-310000912752us-gaap:AdditionalPaidInCapitalMember2018-12-310000912752us-gaap:RetainedEarningsMember2018-12-310000912752us-gaap:AccumulatedOtherComprehensiveIncomeMember2018-12-310000912752us-gaap:NoncontrollingInterestMember2018-12-310000912752us-gaap:CommonClassBMember2019-01-012019-12-310000912752us-gaap:CommonClassAMember2019-01-012019-12-310000912752us-gaap:RetainedEarningsMember2019-01-012019-12-310000912752us-gaap:CommonStockMemberus-gaap:CommonClassAMember2019-01-012019-12-310000912752us-gaap:CommonStockMemberus-gaap:CommonClassBMember2019-01-012019-12-310000912752us-gaap:AdditionalPaidInCapitalMember2019-01-012019-12-310000912752us-gaap:NoncontrollingInterestMember2019-01-012019-12-310000912752us-gaap:AccumulatedOtherComprehensiveIncomeMember2019-01-012019-12-3100009127522019-12-310000912752us-gaap:CommonStockMemberus-gaap:CommonClassAMember2019-12-310000912752us-gaap:CommonStockMemberus-gaap:CommonClassBMember2019-12-310000912752us-gaap:AdditionalPaidInCapitalMember2019-12-310000912752us-gaap:RetainedEarningsMember2019-12-310000912752us-gaap:AccumulatedOtherComprehensiveIncomeMember2019-12-310000912752us-gaap:NoncontrollingInterestMember2019-12-310000912752us-gaap:CommonClassBMember2020-01-012020-12-310000912752us-gaap:CommonClassAMember2020-01-012020-12-310000912752us-gaap:RetainedEarningsMember2020-01-012020-12-310000912752us-gaap:CommonStockMemberus-gaap:CommonClassAMember2020-01-012020-12-310000912752us-gaap:AdditionalPaidInCapitalMember2020-01-012020-12-310000912752us-gaap:NoncontrollingInterestMember2020-01-012020-12-310000912752us-gaap:AccumulatedOtherComprehensiveIncomeMember2020-01-012020-12-310000912752us-gaap:CommonStockMemberus-gaap:CommonClassAMember2020-12-310000912752us-gaap:CommonStockMemberus-gaap:CommonClassBMember2020-12-310000912752us-gaap:AdditionalPaidInCapitalMember2020-12-310000912752us-gaap:RetainedEarningsMember2020-12-310000912752us-gaap:AccumulatedOtherComprehensiveIncomeMember2020-12-310000912752us-gaap:NoncontrollingInterestMember2020-12-310000912752us-gaap:RetainedEarningsMember2021-01-012021-12-310000912752us-gaap:CommonStockMemberus-gaap:CommonClassAMember2021-01-012021-12-310000912752us-gaap:CommonStockMemberus-gaap:CommonClassBMember2021-01-012021-12-310000912752us-gaap:AdditionalPaidInCapitalMember2021-01-012021-12-310000912752us-gaap:NoncontrollingInterestMember2021-01-012021-12-310000912752us-gaap:AccumulatedOtherComprehensiveIncomeMember2021-01-012021-12-310000912752us-gaap:CommonStockMemberus-gaap:CommonClassAMember2021-12-310000912752us-gaap:CommonStockMemberus-gaap:CommonClassBMember2021-12-310000912752us-gaap:AdditionalPaidInCapitalMember2021-12-310000912752us-gaap:RetainedEarningsMember2021-12-310000912752us-gaap:AccumulatedOtherComprehensiveIncomeMember2021-12-310000912752us-gaap:NoncontrollingInterestMember2021-12-31sbgi:segmentsbgi:stationsbgi:channel0000912752sbgi:CustomerOneMemberus-gaap:CustomerConcentrationRiskMemberus-gaap:AccountsReceivableMember2021-01-012021-12-31xbrli:pure0000912752us-gaap:CustomerConcentrationRiskMemberus-gaap:AccountsReceivableMembersbgi:CustomerTwoMember2021-01-012021-12-310000912752sbgi:CustomerThreeMemberus-gaap:CustomerConcentrationRiskMemberus-gaap:AccountsReceivableMember2021-01-012021-12-310000912752sbgi:CustomerOneMemberus-gaap:CustomerConcentrationRiskMemberus-gaap:AccountsReceivableMember2020-01-012020-12-310000912752us-gaap:CustomerConcentrationRiskMemberus-gaap:AccountsReceivableMembersbgi:CustomerTwoMember2020-01-012020-12-310000912752sbgi:CustomerThreeMemberus-gaap:CustomerConcentrationRiskMemberus-gaap:AccountsReceivableMember2020-01-012020-12-310000912752srt:MinimumMember2021-01-012021-12-310000912752srt:MaximumMember2021-01-012021-12-310000912752us-gaap:CustomerRelationshipsMember2020-01-012020-12-310000912752us-gaap:OtherIntangibleAssetsMember2020-01-012020-12-310000912752us-gaap:EquipmentMember2021-01-012021-12-310000912752us-gaap:OperatingSegmentsMembersbgi:DistributionRevenueMembersbgi:BroadcastSegmentMember2021-01-012021-12-310000912752us-gaap:OperatingSegmentsMembersbgi:DistributionRevenueMembersbgi:LocalSportsSegmentMember2021-01-012021-12-310000912752us-gaap:OperatingSegmentsMembersbgi:DistributionRevenueMemberus-gaap:AllOtherSegmentsMember2021-01-012021-12-310000912752sbgi:DistributionRevenueMemberus-gaap:IntersegmentEliminationMember2021-01-012021-12-310000912752sbgi:DistributionRevenueMember2021-01-012021-12-310000912752us-gaap:OperatingSegmentsMembersbgi:AdvertisingRevenueNetOfAgencyCommissionsMembersbgi:BroadcastSegmentMember2021-01-012021-12-310000912752us-gaap:OperatingSegmentsMembersbgi:LocalSportsSegmentMembersbgi:AdvertisingRevenueNetOfAgencyCommissionsMember2021-01-012021-12-310000912752us-gaap:OperatingSegmentsMemberus-gaap:AllOtherSegmentsMembersbgi:AdvertisingRevenueNetOfAgencyCommissionsMember2021-01-012021-12-310000912752us-gaap:IntersegmentEliminationMembersbgi:AdvertisingRevenueNetOfAgencyCommissionsMember2021-01-012021-12-310000912752sbgi:AdvertisingRevenueNetOfAgencyCommissionsMember2021-01-012021-12-310000912752us-gaap:OperatingSegmentsMembersbgi:OtherMediaAndNonMediaRevenuesMembersbgi:BroadcastSegmentMember2021-01-012021-12-310000912752us-gaap:OperatingSegmentsMembersbgi:OtherMediaAndNonMediaRevenuesMembersbgi:LocalSportsSegmentMember2021-01-012021-12-310000912752us-gaap:OperatingSegmentsMemberus-gaap:AllOtherSegmentsMembersbgi:OtherMediaAndNonMediaRevenuesMember2021-01-012021-12-310000912752us-gaap:IntersegmentEliminationMembersbgi:OtherMediaAndNonMediaRevenuesMember2021-01-012021-12-310000912752sbgi:OtherMediaAndNonMediaRevenuesMember2021-01-012021-12-310000912752us-gaap:OperatingSegmentsMembersbgi:BroadcastSegmentMember2021-01-012021-12-310000912752us-gaap:OperatingSegmentsMembersbgi:LocalSportsSegmentMember2021-01-012021-12-310000912752us-gaap:OperatingSegmentsMemberus-gaap:AllOtherSegmentsMember2021-01-012021-12-310000912752us-gaap:IntersegmentEliminationMember2021-01-012021-12-310000912752us-gaap:OperatingSegmentsMembersbgi:DistributionRevenueMembersbgi:BroadcastSegmentMember2020-01-012020-12-310000912752us-gaap:OperatingSegmentsMembersbgi:DistributionRevenueMembersbgi:LocalSportsSegmentMember2020-01-012020-12-310000912752us-gaap:OperatingSegmentsMembersbgi:DistributionRevenueMemberus-gaap:AllOtherSegmentsMember2020-01-012020-12-310000912752sbgi:DistributionRevenueMemberus-gaap:IntersegmentEliminationMember2020-01-012020-12-310000912752sbgi:DistributionRevenueMember2020-01-012020-12-310000912752us-gaap:OperatingSegmentsMembersbgi:AdvertisingRevenueNetOfAgencyCommissionsMembersbgi:BroadcastSegmentMember2020-01-012020-12-310000912752us-gaap:OperatingSegmentsMembersbgi:LocalSportsSegmentMembersbgi:AdvertisingRevenueNetOfAgencyCommissionsMember2020-01-012020-12-310000912752us-gaap:OperatingSegmentsMemberus-gaap:AllOtherSegmentsMembersbgi:AdvertisingRevenueNetOfAgencyCommissionsMember2020-01-012020-12-310000912752us-gaap:IntersegmentEliminationMembersbgi:AdvertisingRevenueNetOfAgencyCommissionsMember2020-01-012020-12-310000912752sbgi:AdvertisingRevenueNetOfAgencyCommissionsMember2020-01-012020-12-310000912752us-gaap:OperatingSegmentsMembersbgi:OtherMediaAndNonMediaRevenuesMembersbgi:BroadcastSegmentMember2020-01-012020-12-310000912752us-gaap:OperatingSegmentsMembersbgi:OtherMediaAndNonMediaRevenuesMembersbgi:LocalSportsSegmentMember2020-01-012020-12-310000912752us-gaap:OperatingSegmentsMemberus-gaap:AllOtherSegmentsMembersbgi:OtherMediaAndNonMediaRevenuesMember2020-01-012020-12-310000912752us-gaap:IntersegmentEliminationMembersbgi:OtherMediaAndNonMediaRevenuesMember2020-01-012020-12-310000912752sbgi:OtherMediaAndNonMediaRevenuesMember2020-01-012020-12-310000912752us-gaap:OperatingSegmentsMembersbgi:BroadcastSegmentMember2020-01-012020-12-310000912752us-gaap:OperatingSegmentsMembersbgi:LocalSportsSegmentMember2020-01-012020-12-310000912752us-gaap:OperatingSegmentsMemberus-gaap:AllOtherSegmentsMember2020-01-012020-12-310000912752us-gaap:IntersegmentEliminationMember2020-01-012020-12-310000912752us-gaap:OperatingSegmentsMembersbgi:DistributionRevenueMembersbgi:BroadcastSegmentMember2019-01-012019-12-310000912752us-gaap:OperatingSegmentsMembersbgi:DistributionRevenueMembersbgi:LocalSportsSegmentMember2019-01-012019-12-310000912752us-gaap:OperatingSegmentsMembersbgi:DistributionRevenueMemberus-gaap:AllOtherSegmentsMember2019-01-012019-12-310000912752sbgi:DistributionRevenueMemberus-gaap:IntersegmentEliminationMember2019-01-012019-12-310000912752sbgi:DistributionRevenueMember2019-01-012019-12-310000912752us-gaap:OperatingSegmentsMembersbgi:AdvertisingRevenueNetOfAgencyCommissionsMembersbgi:BroadcastSegmentMember2019-01-012019-12-310000912752us-gaap:OperatingSegmentsMembersbgi:LocalSportsSegmentMembersbgi:AdvertisingRevenueNetOfAgencyCommissionsMember2019-01-012019-12-310000912752us-gaap:OperatingSegmentsMemberus-gaap:AllOtherSegmentsMembersbgi:AdvertisingRevenueNetOfAgencyCommissionsMember2019-01-012019-12-310000912752us-gaap:IntersegmentEliminationMembersbgi:AdvertisingRevenueNetOfAgencyCommissionsMember2019-01-012019-12-310000912752sbgi:AdvertisingRevenueNetOfAgencyCommissionsMember2019-01-012019-12-310000912752us-gaap:OperatingSegmentsMembersbgi:OtherMediaAndNonMediaRevenuesMembersbgi:BroadcastSegmentMember2019-01-012019-12-310000912752us-gaap:OperatingSegmentsMembersbgi:OtherMediaAndNonMediaRevenuesMembersbgi:LocalSportsSegmentMember2019-01-012019-12-310000912752us-gaap:OperatingSegmentsMemberus-gaap:AllOtherSegmentsMembersbgi:OtherMediaAndNonMediaRevenuesMember2019-01-012019-12-310000912752us-gaap:IntersegmentEliminationMembersbgi:OtherMediaAndNonMediaRevenuesMember2019-01-012019-12-310000912752sbgi:OtherMediaAndNonMediaRevenuesMember2019-01-012019-12-310000912752us-gaap:OperatingSegmentsMembersbgi:BroadcastSegmentMember2019-01-012019-12-310000912752us-gaap:OperatingSegmentsMembersbgi:LocalSportsSegmentMember2019-01-012019-12-310000912752us-gaap:OperatingSegmentsMemberus-gaap:AllOtherSegmentsMember2019-01-012019-12-310000912752us-gaap:IntersegmentEliminationMember2019-01-012019-12-310000912752sbgi:DistributionRevenueRebateMember2021-12-310000912752sbgi:DistributionRevenueRebateMember2020-12-3100009127522022-01-012020-11-180000912752sbgi:BallysMembersbgi:OptionsAndWarrantsMember2020-11-182020-11-180000912752sbgi:CustomerOneMemberus-gaap:SalesRevenueNetMemberus-gaap:CustomerConcentrationRiskMember2021-01-012021-12-310000912752us-gaap:SalesRevenueNetMemberus-gaap:CustomerConcentrationRiskMembersbgi:CustomerTwoMember2021-01-012021-12-310000912752sbgi:CustomerThreeMemberus-gaap:SalesRevenueNetMemberus-gaap:CustomerConcentrationRiskMember2021-01-012021-12-310000912752sbgi:CustomerOneMemberus-gaap:SalesRevenueNetMemberus-gaap:CustomerConcentrationRiskMember2020-01-012020-12-310000912752us-gaap:SalesRevenueNetMemberus-gaap:CustomerConcentrationRiskMembersbgi:CustomerTwoMember2020-01-012020-12-310000912752sbgi:CustomerThreeMemberus-gaap:SalesRevenueNetMemberus-gaap:CustomerConcentrationRiskMember2020-01-012020-12-310000912752sbgi:CustomerOneMemberus-gaap:SalesRevenueNetMemberus-gaap:CustomerConcentrationRiskMember2019-01-012019-12-310000912752us-gaap:SalesRevenueNetMemberus-gaap:CustomerConcentrationRiskMembersbgi:CustomerTwoMember2019-01-012019-12-310000912752sbgi:CustomerThreeMemberus-gaap:SalesRevenueNetMemberus-gaap:CustomerConcentrationRiskMember2019-01-012019-12-310000912752us-gaap:SupplementalEmployeeRetirementPlanDefinedBenefitMembersbgi:FisherCommunicationsIncMember2021-12-310000912752us-gaap:AccountsPayableAndAccruedLiabilitiesMemberus-gaap:SupplementalEmployeeRetirementPlanDefinedBenefitMembersbgi:FisherCommunicationsIncMember2021-12-310000912752us-gaap:SupplementalEmployeeRetirementPlanDefinedBenefitMemberus-gaap:OtherNoncurrentLiabilitiesMembersbgi:FisherCommunicationsIncMember2021-12-310000912752us-gaap:SupplementalEmployeeRetirementPlanDefinedBenefitMembersbgi:FisherCommunicationsIncMember2020-12-310000912752us-gaap:SupplementalEmployeeRetirementPlanDefinedBenefitMembersbgi:FisherCommunicationsIncMember2020-01-012020-12-310000912752us-gaap:SupplementalEmployeeRetirementPlanDefinedBenefitMembersbgi:FisherCommunicationsIncMember2021-01-012021-12-310000912752sbgi:OtherPostRetirementPlansMember2021-12-3100009127522019-01-012021-12-310000912752sbgi:ZypMediaMember2021-01-012021-12-310000912752sbgi:A360IALLCMember2021-01-012021-12-310000912752sbgi:RadioStationAssetsMember2020-01-012020-12-310000912752sbgi:TelevisionStationAssetsMember2020-01-012020-12-310000912752sbgi:RegionalSportsNetworksAndFoxCollegeSportsRSNsMember2019-05-31sbgi:brand0000912752sbgi:RegionalSportsNetworksAndFoxCollegeSportsRSNsMember2019-05-012019-05-310000912752sbgi:RegionalSportsNetworksAndFoxCollegeSportsRSNsMember2019-08-232019-08-230000912752sbgi:RegionalSportsNetworksAndFoxCollegeSportsRSNsMember2019-08-23sbgi:professional_team0000912752sbgi:MajorLeagueBaseballMembersbgi:RegionalSportsNetworksAndFoxCollegeSportsRSNsMember2019-08-23sbgi:major_league_baseball_team0000912752sbgi:NationalBasketballAssociationMembersbgi:RegionalSportsNetworksAndFoxCollegeSportsRSNsMember2019-08-23sbgi:national_basketball_association_team0000912752sbgi:RegionalSportsNetworksAndFoxCollegeSportsRSNsMembersbgi:NationalHockeyLeagueMember2019-08-23sbgi:national_hockey_league_team0000912752sbgi:RegionalSportsNetworksAndFoxCollegeSportsRSNsMember2021-12-310000912752us-gaap:CustomerRelationshipsMembersbgi:RegionalSportsNetworksAndFoxCollegeSportsRSNsMember2021-12-310000912752us-gaap:OtherIntangibleAssetsMembersbgi:RegionalSportsNetworksAndFoxCollegeSportsRSNsMember2021-12-310000912752sbgi:RegionalSportsNetworksAndFoxCollegeSportsRSNsMember2021-01-012021-12-310000912752us-gaap:CustomerRelationshipsMembersbgi:RegionalSportsNetworksAndFoxCollegeSportsRSNsMember2019-08-232019-08-230000912752sbgi:RegionalSportsNetworksAndFoxCollegeSportsRSNsMembersbgi:SportsContractsMember2019-08-232019-08-230000912752sbgi:RegionalSportsNetworksAndFoxCollegeSportsRSNsMemberus-gaap:TrademarksAndTradeNamesMember2019-08-232019-08-230000912752sbgi:RegionalSportsNetworksAndFoxCollegeSportsRSNsMember2020-01-012020-12-310000912752sbgi:RegionalSportsNetworksAndFoxCollegeSportsRSNsMember2019-01-012019-12-310000912752sbgi:OtherAcquisitionsIn2020Member2021-01-012021-12-310000912752sbgi:OtherAcquisitionsIn2020Member2020-01-012020-12-310000912752sbgi:OtherAcquisitionsIn2020Member2019-01-012019-12-310000912752sbgi:OtherAcquisition2021Member2021-01-012021-12-310000912752sbgi:OtherAcquisition2021Member2020-01-012020-12-310000912752sbgi:OtherAcquisition2021Member2019-01-012019-12-310000912752sbgi:TotalAcquisitionsMember2021-01-012021-12-310000912752sbgi:TotalAcquisitionsMember2020-01-012020-12-310000912752sbgi:TotalAcquisitionsMember2019-01-012019-12-310000912752us-gaap:DisposalGroupDisposedOfBySaleNotDiscontinuedOperationsMembersbgi:KOMOFMKOMOAMKPLZFMAndKVIAMMember2021-09-300000912752us-gaap:DisposalGroupDisposedOfBySaleNotDiscontinuedOperationsMembersbgi:KOMOFMKOMOAMKPLZFMAndKVIAMMember2021-01-012021-12-310000912752us-gaap:DisposalGroupDisposedOfBySaleNotDiscontinuedOperationsMembersbgi:TriangleSignServiceLLCMember2021-06-300000912752us-gaap:DisposalGroupDisposedOfBySaleNotDiscontinuedOperationsMembersbgi:TriangleSignServiceLLCMember2021-01-012021-12-310000912752us-gaap:DisposalGroupDisposedOfBySaleNotDiscontinuedOperationsMembersbgi:TriangleSignServiceLLCMember2021-12-3100009127522021-02-012021-02-28sbgi:television_broadcast_station0000912752sbgi:WKDATVAndKBSITVMemberus-gaap:DisposalGroupDisposedOfBySaleNotDiscontinuedOperationsMember2021-02-280000912752sbgi:WKDATVAndKBSITVMemberus-gaap:DisposalGroupDisposedOfBySaleNotDiscontinuedOperationsMember2021-01-012021-12-310000912752sbgi:KGBTNonLicenseAssetsandWDKYLicenseandNonLicenseAssetsMemberus-gaap:DisposalGroupDisposedOfBySaleNotDiscontinuedOperationsMember2020-01-310000912752us-gaap:DisposalGroupDisposedOfBySaleNotDiscontinuedOperationsMembersbgi:KGBTNonLicenseAssetsMember2020-01-012020-03-310000912752us-gaap:DisposalGroupDisposedOfBySaleNotDiscontinuedOperationsMembersbgi:WDKYLicenseandNonLicenseAssetsMember2020-07-012020-09-3000009127522017-02-012017-02-280000912752sbgi:CBandSpectrumMember2021-01-012021-12-310000912752sbgi:LongTermIncentivePlan1996Memberus-gaap:CommonClassAMember2021-12-310000912752sbgi:StockBasedCompensationPlansMember2021-01-012021-12-310000912752sbgi:StockBasedCompensationPlansMember2020-01-012020-12-310000912752sbgi:StockBasedCompensationPlansMember2019-01-012019-12-310000912752sbgi:RestrictedStockAwardsMembersbgi:LongTermIncentivePlan1996Member2021-01-012021-12-310000912752sbgi:RestrictedStockAwardsMembersbgi:LongTermIncentivePlan1996Member2020-01-012020-12-310000912752sbgi:RestrictedStockAwardsMembersbgi:LongTermIncentivePlan1996Member2019-01-012019-12-310000912752sbgi:RestrictedStockAwardsMember2020-12-310000912752sbgi:RestrictedStockAwardsMember2021-01-012021-12-310000912752sbgi:RestrictedStockAwardsMember2021-12-310000912752sbgi:RestrictedStockAwardsMember2020-01-012020-12-310000912752sbgi:RestrictedStockAwardsMember2019-01-012019-12-310000912752sbgi:NonEmployeeDirectorMembersbgi:StockGrantsMember2021-01-012021-12-310000912752sbgi:NonEmployeeDirectorMembersbgi:StockGrantsMember2020-01-012020-12-310000912752sbgi:NonEmployeeDirectorMembersbgi:StockGrantsMember2019-01-012019-12-310000912752us-gaap:StockAppreciationRightsSARSMember2021-01-012021-12-310000912752us-gaap:StockAppreciationRightsSARSMembersrt:MinimumMember2021-01-012021-12-310000912752us-gaap:StockAppreciationRightsSARSMembersrt:MaximumMember2021-01-012021-12-310000912752us-gaap:StockAppreciationRightsSARSMember2020-01-012020-12-310000912752us-gaap:StockAppreciationRightsSARSMember2019-01-012019-12-310000912752us-gaap:StockAppreciationRightsSARSMember2020-12-310000912752us-gaap:StockAppreciationRightsSARSMember2021-12-310000912752us-gaap:EmployeeStockOptionMember2021-12-310000912752us-gaap:StockAppreciationRightsSARSMembersrt:MinimumMember2020-01-012020-12-310000912752us-gaap:StockAppreciationRightsSARSMembersrt:MaximumMember2020-01-012020-12-310000912752us-gaap:StockAppreciationRightsSARSMembersrt:MinimumMember2019-01-012019-12-310000912752us-gaap:EmployeeStockOptionMember2020-01-012020-12-310000912752us-gaap:EmployeeStockOptionMember2019-01-012019-12-310000912752us-gaap:EmployeeStockOptionMember2021-01-012021-12-310000912752sbgi:FourZeroOneKPlanMember2021-01-012021-12-310000912752sbgi:FourZeroOneKPlanMember2020-01-012020-12-310000912752sbgi:FourZeroOneKPlanMember2019-01-012019-12-310000912752sbgi:FourZeroOneKPlanMember2021-12-310000912752srt:MaximumMembersbgi:EmployeeStockPurchasePlanMember2021-01-012021-12-310000912752sbgi:EmployeeStockPurchasePlanMember2021-01-012021-12-310000912752sbgi:EmployeeStockPurchasePlanMember2020-01-012020-12-310000912752sbgi:EmployeeStockPurchasePlanMember2019-01-012019-12-310000912752sbgi:EmployeeStockPurchasePlanMember2021-12-310000912752us-gaap:BuildingAndBuildingImprovementsMembersrt:MinimumMember2021-01-012021-12-310000912752srt:MaximumMemberus-gaap:BuildingAndBuildingImprovementsMember2021-01-012021-12-310000912752srt:MinimumMembersbgi:OperatingEquipmentMember2021-01-012021-12-310000912752srt:MaximumMembersbgi:OperatingEquipmentMember2021-01-012021-12-310000912752srt:MinimumMemberus-gaap:FurnitureAndFixturesMember2021-01-012021-12-310000912752srt:MaximumMemberus-gaap:FurnitureAndFixturesMember2021-01-012021-12-310000912752srt:MinimumMemberus-gaap:LeaseholdImprovementsMember2021-01-012021-12-310000912752srt:MaximumMemberus-gaap:LeaseholdImprovementsMember2021-01-012021-12-310000912752srt:MinimumMembersbgi:AutomotiveEquipmentMember2021-01-012021-12-310000912752srt:MaximumMembersbgi:AutomotiveEquipmentMember2021-01-012021-12-310000912752us-gaap:LandAndLandImprovementsMember2021-12-310000912752us-gaap:LandAndLandImprovementsMember2020-12-310000912752sbgi:RealEstateHeldForDevelopmentAndSaleMember2021-12-310000912752sbgi:RealEstateHeldForDevelopmentAndSaleMember2020-12-310000912752us-gaap:BuildingAndBuildingImprovementsMember2021-12-310000912752us-gaap:BuildingAndBuildingImprovementsMember2020-12-310000912752sbgi:OperatingEquipmentMember2021-12-310000912752sbgi:OperatingEquipmentMember2020-12-310000912752us-gaap:FurnitureAndFixturesMember2021-12-310000912752us-gaap:FurnitureAndFixturesMember2020-12-310000912752us-gaap:LeaseholdImprovementsMember2021-12-310000912752us-gaap:LeaseholdImprovementsMember2020-12-310000912752sbgi:AutomotiveEquipmentMember2021-12-310000912752sbgi:AutomotiveEquipmentMember2020-12-310000912752us-gaap:ConstructionInProgressMember2021-12-310000912752us-gaap:ConstructionInProgressMember2020-12-310000912752sbgi:BroadcastSegmentMember2019-12-310000912752sbgi:LocalSportsSegmentMember2019-12-310000912752us-gaap:AllOtherSegmentsMember2019-12-310000912752sbgi:BroadcastSegmentMember2020-01-012020-12-310000912752sbgi:LocalSportsSegmentMember2020-01-012020-12-310000912752us-gaap:AllOtherSegmentsMember2020-01-012020-12-310000912752sbgi:BroadcastSegmentMember2020-12-310000912752sbgi:LocalSportsSegmentMember2020-12-310000912752us-gaap:AllOtherSegmentsMember2020-12-310000912752sbgi:BroadcastSegmentMember2021-01-012021-12-310000912752sbgi:LocalSportsSegmentMember2021-01-012021-12-310000912752us-gaap:AllOtherSegmentsMember2021-01-012021-12-310000912752sbgi:LocalSportsSegmentMember2021-12-310000912752us-gaap:AllOtherSegmentsMember2021-12-310000912752sbgi:NetworkAffiliationsMember2021-12-310000912752sbgi:SportsContractsMember2021-12-310000912752sbgi:OtherFiniteLivedIntangibleAssetsMember2021-12-310000912752sbgi:NetworkAffiliationsMember2020-12-310000912752sbgi:SportsContractsMember2020-12-310000912752sbgi:OtherFiniteLivedIntangibleAssetsMember2020-12-310000912752sbgi:SportsContractsMember2020-01-012020-12-310000912752us-gaap:CustomerRelationshipsMember2021-01-012021-12-310000912752sbgi:NetworkAffiliationsMember2021-01-012021-12-310000912752sbgi:SportsContractsMember2021-01-012021-12-310000912752sbgi:SportsContractsMember2019-01-012019-12-3100009127522020-07-012020-09-30sbgi:network0000912752us-gaap:CustomerRelationshipsMembersbgi:LocalSportsSegmentMember2021-12-310000912752sbgi:OtherFiniteLivedIntangibleAssetsMembersbgi:LocalSportsSegmentMember2021-12-310000912752us-gaap:EquityMethodInvestmentNonconsolidatedInvesteeOrGroupOfInvesteesMember2021-01-012021-12-310000912752us-gaap:EquityMethodInvestmentNonconsolidatedInvesteeOrGroupOfInvesteesMember2020-01-012020-12-310000912752us-gaap:EquityMethodInvestmentNonconsolidatedInvesteeOrGroupOfInvesteesMember2019-01-012019-12-310000912752us-gaap:EquityMethodInvestmentNonconsolidatedInvesteeOrGroupOfInvesteesMember2021-12-310000912752us-gaap:EquityMethodInvestmentNonconsolidatedInvesteeOrGroupOfInvesteesMember2020-12-310000912752sbgi:YankeeEntertainmentAndSportsNetworkLLCMember2021-01-012021-12-310000912752sbgi:YankeeEntertainmentAndSportsNetworkLLCMember2020-01-012020-12-310000912752sbgi:YankeeEntertainmentAndSportsNetworkLLCMember2019-01-012019-12-310000912752us-gaap:FairValueMeasuredAtNetAssetValuePerShareMember2021-12-310000912752us-gaap:FairValueMeasuredAtNetAssetValuePerShareMember2020-12-310000912752sbgi:BallysMember2020-11-180000912752sbgi:BallysMember2020-11-182020-11-180000912752sbgi:BallysMember2021-04-012021-04-300000912752sbgi:BallysMember2021-04-3000009127522021-04-300000912752sbgi:STGTermLoanFacilityMembersbgi:TermLoanB1Membersbgi:TermLoanMember2021-12-310000912752sbgi:STGTermLoanFacilityMembersbgi:TermLoanB1Membersbgi:TermLoanMember2020-12-310000912752sbgi:TermLoanB2Membersbgi:STGTermLoanFacilityMembersbgi:TermLoanMember2021-12-310000912752sbgi:TermLoanB2Membersbgi:STGTermLoanFacilityMembersbgi:TermLoanMember2020-12-310000912752sbgi:STGTermLoanFacilityMembersbgi:TermLoanB3Membersbgi:TermLoanMember2021-12-310000912752sbgi:STGTermLoanFacilityMembersbgi:TermLoanB3Membersbgi:TermLoanMember2020-12-310000912752sbgi:TermLoanMembersbgi:DSGTermLoanMember2021-12-310000912752sbgi:TermLoanMembersbgi:DSGTermLoanMember2020-12-310000912752us-gaap:SeniorNotesMembersbgi:STG5.875UnsecuredNotesMember2021-12-310000912752us-gaap:SeniorNotesMembersbgi:STG5.875UnsecuredNotesMember2020-12-310000912752us-gaap:SeniorNotesMembersbgi:STG5.125UnsecuredNotesMember2021-12-310000912752us-gaap:SeniorNotesMembersbgi:STG5.125UnsecuredNotesMember2020-12-310000912752sbgi:STG5.500UnsecuredNotesMemberus-gaap:SeniorNotesMember2021-12-310000912752sbgi:STG5.500UnsecuredNotesMemberus-gaap:SeniorNotesMember2020-12-310000912752sbgi:STG4125SecuredNotesMemberus-gaap:SeniorNotesMember2021-12-310000912752sbgi:STG4125SecuredNotesMemberus-gaap:SeniorNotesMember2020-12-310000912752us-gaap:SeniorNotesMembersbgi:DSG12750SecuredNotesDue2026Member2021-12-310000912752us-gaap:SeniorNotesMembersbgi:DSG12750SecuredNotesDue2026Member2020-12-310000912752sbgi:DSG5375SeniorSecuredNotesMemberus-gaap:SeniorNotesMember2021-12-310000912752sbgi:DSG5375SeniorSecuredNotesMemberus-gaap:SeniorNotesMember2020-12-310000912752us-gaap:SeniorNotesMembersbgi:DSG6625UnsecuredNotesMember2021-12-310000912752us-gaap:SeniorNotesMembersbgi:DSG6625UnsecuredNotesMember2020-12-310000912752sbgi:DSGAccountsReceivableSecuritizationFacilityMember2021-12-310000912752sbgi:DSGAccountsReceivableSecuritizationFacilityMember2020-12-310000912752sbgi:RecourseDebtOfVariableInterestEntitiesMember2021-12-310000912752sbgi:RecourseDebtOfVariableInterestEntitiesMember2020-12-310000912752sbgi:OtherOperatingDivisionsDebtMember2021-12-310000912752sbgi:OtherOperatingDivisionsDebtMember2020-12-310000912752sbgi:FinanceLeaseExcludingAffiliatesMember2021-12-310000912752sbgi:FinanceLeaseExcludingAffiliatesMember2020-12-310000912752sbgi:FinanceLeaseAffiliatesMember2021-12-310000912752sbgi:FinanceLeaseAffiliatesMember2020-12-310000912752sbgi:STGTermLoanFacilityMembersbgi:STGTermLoanB3Member2021-04-010000912752sbgi:DSG5375SeniorSecuredNotesMemberus-gaap:SubsequentEventMemberus-gaap:SeniorNotesMember2022-03-010000912752us-gaap:SubsequentEventMemberus-gaap:SeniorNotesMembersbgi:DSG12750SecuredNotesDue2026Member2022-03-012022-03-010000912752sbgi:ARFacilityMemberus-gaap:LineOfCreditMember2021-11-052021-11-050000912752sbgi:ARFacilityMemberus-gaap:LineOfCreditMember2021-11-050000912752sbgi:STGTermLoanFacilityMemberus-gaap:LondonInterbankOfferedRateLIBORMembersbgi:TermLoanB1Membersbgi:TermLoanMember2021-01-012021-12-310000912752sbgi:TermLoanB2Membersbgi:STGTermLoanFacilityMemberus-gaap:LondonInterbankOfferedRateLIBORMembersbgi:TermLoanMember2021-01-012021-12-310000912752sbgi:STGTermLoanFacilityMemberus-gaap:LondonInterbankOfferedRateLIBORMembersbgi:TermLoanB3Membersbgi:TermLoanMember2021-01-012021-12-310000912752us-gaap:LondonInterbankOfferedRateLIBORMemberus-gaap:LineOfCreditMembersbgi:STGRevolvingCreditFacilityMember2021-01-012021-12-310000912752us-gaap:LineOfCreditMembersbgi:STGRevolvingCreditFacilityMember2021-12-310000912752us-gaap:LineOfCreditMembersbgi:STGRevolvingCreditFacilityMember2020-12-310000912752us-gaap:LondonInterbankOfferedRateLIBORMembersbgi:TermLoanMembersbgi:DSGTermLoanMember2021-01-012021-12-310000912752us-gaap:LondonInterbankOfferedRateLIBORMembersbgi:DSGRevolvingCreditFacilityMemberus-gaap:LineOfCreditMember2021-01-012021-12-310000912752sbgi:DSGRevolvingCreditFacilityMemberus-gaap:LineOfCreditMember2021-12-310000912752sbgi:DSGRevolvingCreditFacilityMemberus-gaap:LineOfCreditMember2020-12-310000912752us-gaap:LondonInterbankOfferedRateLIBORMemberus-gaap:LineOfCreditMembersbgi:DSGAccountsReceivableSecuritizationFacilityMember2021-01-012021-12-310000912752us-gaap:LineOfCreditMembersbgi:DSGAccountsReceivableSecuritizationFacilityMember2021-12-310000912752us-gaap:LineOfCreditMembersbgi:DSGAccountsReceivableSecuritizationFacilityMember2020-12-310000912752srt:MinimumMemberus-gaap:LineOfCreditMembersbgi:STGRevolvingCreditFacilityMember2021-01-012021-12-310000912752us-gaap:LineOfCreditMembersrt:WeightedAverageMembersbgi:STGRevolvingCreditFacilityMember2021-01-012021-12-310000912752srt:MaximumMemberus-gaap:LineOfCreditMembersbgi:STGRevolvingCreditFacilityMember2021-01-012021-12-310000912752sbgi:DSGRevolvingCreditFacilityMembersrt:MinimumMemberus-gaap:LineOfCreditMember2021-01-012021-12-310000912752sbgi:DSGRevolvingCreditFacilityMemberus-gaap:LineOfCreditMembersrt:WeightedAverageMember2021-01-012021-12-310000912752srt:MaximumMembersbgi:DSGRevolvingCreditFacilityMemberus-gaap:LineOfCreditMember2021-01-012021-12-310000912752sbgi:BankCreditAgreementMember2019-12-310000912752sbgi:TermLoanMembersbgi:TermLoanB2bMember2019-08-132019-08-130000912752sbgi:TermLoanMembersbgi:TermLoanB2bMember2019-08-130000912752us-gaap:LondonInterbankOfferedRateLIBORMembersbgi:TermLoanMembersbgi:TermLoanB2bMember2019-08-132019-08-130000912752us-gaap:SeniorNotesMembersbgi:SeniorUnsecuredNotes5375PercentDue2021Member2019-08-132019-08-130000912752us-gaap:SeniorNotesMembersbgi:SeniorUnsecuredNotes5375PercentDue2021Member2019-08-130000912752us-gaap:SeniorNotesMembersbgi:SeniorUnsecuredNotes5375PercentDue2021Member2019-01-012019-12-310000912752sbgi:TermLoanMembersbgi:TermLoanB2aMember2019-08-232019-08-230000912752sbgi:TermLoanMembersbgi:TermLoanB2aMember2019-08-230000912752us-gaap:LondonInterbankOfferedRateLIBORMembersbgi:TermLoanMembersbgi:TermLoanB2aMember2019-08-232019-08-230000912752sbgi:STGRevolvingCreditFacilityMember2019-08-232019-08-230000912752us-gaap:LondonInterbankOfferedRateLIBORMembersbgi:STGRevolvingCreditFacilityMember2019-08-232019-08-230000912752sbgi:STGLettersOfCreditFacilityMember2019-08-230000912752sbgi:STGSwinglineLoansFacilityMember2019-08-230000912752us-gaap:LondonInterbankOfferedRateLIBORMembersbgi:TermLoanB3Membersbgi:TermLoanMember2019-08-232019-08-230000912752sbgi:TermLoanB2Membersbgi:TermLoanMember2019-08-230000912752sbgi:STGRevolvingCreditFacilityMember2021-12-310000912752sbgi:STG5.500UnsecuredNotesMemberus-gaap:SeniorNotesMember2019-11-270000912752us-gaap:SeniorNotesMembersbgi:STG6.125SeniorUnsecuredNotesMember2019-11-270000912752us-gaap:SeniorNotesMembersbgi:STG6.125SeniorUnsecuredNotesMember2021-01-012021-12-310000912752sbgi:STG5.500UnsecuredNotesMemberus-gaap:SeniorNotesMemberus-gaap:DebtInstrumentRedemptionPeriodOneMember2019-11-272019-11-270000912752sbgi:STG5.500UnsecuredNotesMemberus-gaap:SeniorNotesMemberus-gaap:DebtInstrumentRedemptionPeriodTwoMember2019-11-272019-11-270000912752sbgi:STG5.500UnsecuredNotesMemberus-gaap:SeniorNotesMemberus-gaap:DebtInstrumentRedemptionPeriodThreeMember2019-11-272019-11-270000912752us-gaap:DebtInstrumentRedemptionPeriodFourMembersbgi:STG5.500UnsecuredNotesMemberus-gaap:SeniorNotesMember2019-11-272019-11-270000912752sbgi:STG5.500UnsecuredNotesMemberus-gaap:SeniorNotesMemberus-gaap:DebtInstrumentRedemptionPeriodFiveMember2019-11-272019-11-270000912752us-gaap:SeniorNotesMembersbgi:STG5.875UnsecuredNotesMember2020-05-212020-05-210000912752us-gaap:SeniorNotesMembersbgi:STG5.875UnsecuredNotesMember2020-05-210000912752us-gaap:SeniorNotesMembersbgi:STG5.875UnsecuredNotesMember2020-01-012020-12-310000912752sbgi:STG4125SecuredNotesMemberus-gaap:SeniorNotesMember2020-12-042020-12-040000912752sbgi:STG4125SecuredNotesMemberus-gaap:SeniorNotesMember2020-12-040000912752sbgi:STG5.625UnsecuredNotesMemberus-gaap:SeniorNotesMember2020-12-040000912752sbgi:STG5.625UnsecuredNotesMemberus-gaap:SeniorNotesMember2020-12-310000912752sbgi:STG5.625UnsecuredNotesMemberus-gaap:SeniorNotesMember2020-12-042020-12-040000912752sbgi:STGTermLoanFacilityMembersbgi:TermLoanB1Membersbgi:TermLoanMember2020-12-042020-12-040000912752sbgi:STG5.625UnsecuredNotesMemberus-gaap:SeniorNotesMember2020-01-012020-12-310000912752sbgi:STG4125SecuredNotesMemberus-gaap:SeniorNotesMember2021-01-012021-12-310000912752sbgi:STG4125SecuredNotesMemberus-gaap:SeniorNotesMemberus-gaap:DebtInstrumentRedemptionPeriodOneMember2019-11-272019-11-270000912752sbgi:STG4125SecuredNotesMemberus-gaap:SeniorNotesMemberus-gaap:DebtInstrumentRedemptionPeriodTwoMember2019-11-272019-11-270000912752sbgi:STG4125SecuredNotesMemberus-gaap:SeniorNotesMemberus-gaap:DebtInstrumentRedemptionPeriodThreeMember2019-11-272019-11-270000912752us-gaap:DebtInstrumentRedemptionPeriodFourMembersbgi:STG4125SecuredNotesMemberus-gaap:SeniorNotesMember2019-11-272019-11-270000912752sbgi:STG4125SecuredNotesMemberus-gaap:SeniorNotesMemberus-gaap:DebtInstrumentRedemptionPeriodFiveMember2019-11-272019-11-270000912752us-gaap:SeniorNotesMembersbgi:STGNotesMemberus-gaap:DebtInstrumentRedemptionPeriodOneMember2021-01-012021-12-310000912752us-gaap:SeniorNotesMemberus-gaap:DebtInstrumentRedemptionPeriodTwoMembersbgi:STGNotesMember2021-01-012021-12-310000912752sbgi:DSGTermLoanMembersbgi:TermLoanMember2019-08-232019-08-230000912752sbgi:DSGTermLoanMembersbgi:TermLoanMember2019-08-230000912752us-gaap:LondonInterbankOfferedRateLIBORMembersbgi:DSGTermLoanMembersbgi:TermLoanMember2019-08-232019-08-230000912752sbgi:PrepaymentRequirementOneMembersbgi:DSGTermLoanMembersbgi:TermLoanMember2019-08-230000912752sbgi:PrepaymentRequirementOneMembersbgi:DSGTermLoanMembersbgi:TermLoanMembersrt:MinimumMember2019-08-230000912752sbgi:DSGTermLoanMembersbgi:TermLoanMembersbgi:PrepaymentRequirementTwoMember2019-08-230000912752sbgi:DSGTermLoanMembersbgi:TermLoanMembersrt:MinimumMembersbgi:PrepaymentRequirementTwoMember2019-08-230000912752srt:MaximumMembersbgi:DSGTermLoanMembersbgi:TermLoanMembersbgi:PrepaymentRequirementTwoMember2019-08-230000912752sbgi:DSGTermLoanMembersbgi:PrepaymentRequirementThreeMembersbgi:TermLoanMember2019-08-230000912752srt:MaximumMembersbgi:DSGTermLoanMembersbgi:PrepaymentRequirementThreeMembersbgi:TermLoanMember2019-08-230000912752sbgi:DSGRevolvingCreditFacilityMember2019-08-230000912752sbgi:DSGRevolvingCreditFacilityMember2019-08-232019-08-230000912752us-gaap:LondonInterbankOfferedRateLIBORMembersbgi:DSGRevolvingCreditFacilityMember2019-08-232019-08-230000912752sbgi:DSGLettersOfCreditFacilityMember2019-08-230000912752sbgi:DSGSwinglineLoansFacilityMember2019-08-230000912752sbgi:DSGRevolvingCreditFacilityMember2021-12-310000912752sbgi:DSG5375SeniorSecuredNotesMemberus-gaap:SeniorNotesMember2019-08-020000912752us-gaap:SeniorNotesMembersbgi:DSG6625UnsecuredNotesMember2019-08-020000912752us-gaap:SeniorNotesMembersbgi:DSG6625UnsecuredNotesMember2020-03-310000912752sbgi:DSG5375SeniorSecuredNotesMemberus-gaap:SeniorNotesMembersbgi:RegionalSportsNetworksAndFoxCollegeSportsRSNsMember2019-08-020000912752us-gaap:SeniorNotesMembersbgi:RegionalSportsNetworksAndFoxCollegeSportsRSNsMembersbgi:DSG6625UnsecuredNotesMember2019-08-020000912752us-gaap:SeniorNotesMembersbgi:DSG6625UnsecuredNotesMember2021-04-012021-06-300000912752us-gaap:SeniorNotesMembersbgi:DSG6625UnsecuredNotesMember2020-01-012020-12-310000912752us-gaap:SeniorNotesMembersbgi:DSG6625UnsecuredNotesMember2020-06-102020-06-100000912752us-gaap:SeniorNotesMembersbgi:DSG6625UnsecuredNotesMember2020-06-100000912752us-gaap:SeniorNotesMembersbgi:DSG12750SeniorSecuredNotesMember2021-12-310000912752sbgi:DSGNotesMemberus-gaap:SeniorNotesMemberus-gaap:DebtInstrumentRedemptionPeriodOneMember2019-08-022019-08-020000912752sbgi:DSG5375SeniorSecuredNotesMemberus-gaap:SeniorNotesMemberus-gaap:DebtInstrumentRedemptionPeriodOneMember2019-08-022019-08-020000912752sbgi:DSG5375SeniorSecuredNotesMemberus-gaap:SeniorNotesMemberus-gaap:DebtInstrumentRedemptionPeriodTwoMember2019-08-022019-08-020000912752sbgi:DSG5375SeniorSecuredNotesMemberus-gaap:SeniorNotesMemberus-gaap:DebtInstrumentRedemptionPeriodThreeMember2019-08-022019-08-020000912752us-gaap:SeniorNotesMembersbgi:DSG6625UnsecuredNotesMemberus-gaap:DebtInstrumentRedemptionPeriodOneMember2019-08-022019-08-020000912752us-gaap:SeniorNotesMemberus-gaap:DebtInstrumentRedemptionPeriodTwoMembersbgi:DSG6625UnsecuredNotesMember2019-08-022019-08-020000912752us-gaap:SeniorNotesMemberus-gaap:DebtInstrumentRedemptionPeriodThreeMembersbgi:DSG6625UnsecuredNotesMember2019-08-022019-08-020000912752us-gaap:SeniorNotesMembersbgi:DSG12750SeniorSecuredNotesMemberus-gaap:DebtInstrumentRedemptionPeriodOneMember2021-01-012021-12-310000912752us-gaap:SeniorNotesMemberus-gaap:DebtInstrumentRedemptionPeriodTwoMembersbgi:DSG12750SeniorSecuredNotesMember2021-01-012021-12-310000912752us-gaap:SeniorNotesMemberus-gaap:DebtInstrumentRedemptionPeriodThreeMembersbgi:DSG12750SeniorSecuredNotesMember2021-01-012021-12-310000912752sbgi:ARFacilityMemberus-gaap:LineOfCreditMember2020-09-230000912752sbgi:ARFacilityMemberus-gaap:LineOfCreditMember2020-09-240000912752us-gaap:SubsequentEventMembersbgi:NewFirstLienTermLoanMemberus-gaap:LineOfCreditMember2022-01-130000912752us-gaap:GuaranteeObligationsMember2021-12-310000912752us-gaap:GuaranteeObligationsMember2020-12-310000912752sbgi:RecourseDebtOfVariableInterestEntitiesMemberus-gaap:LondonInterbankOfferedRateLIBORMember2021-01-012021-12-310000912752sbgi:ProgramRightsMember2021-12-310000912752us-gaap:RedeemablePreferredStockMembersbgi:DSHMember2019-08-232019-08-2300009127522019-08-230000912752sbgi:TemporaryEquityRedemptionPeriodOneMember2019-08-232019-08-230000912752sbgi:TemporaryEquityRedemptionPeriodTwoMember2019-08-232019-08-230000912752sbgi:TemporaryEquityRedemptionPeriodThreeMember2019-08-232019-08-230000912752sbgi:TemporaryEquityRedemptionPeriodFourMember2019-08-232019-08-230000912752sbgi:TemporaryEquityRedemptionPeriodFiveMember2019-08-232019-08-230000912752sbgi:TemporaryEquityRedemptionPeriodSixMember2019-08-232019-08-230000912752sbgi:LondonInterbankOfferedRateLIBORFloorMember2019-08-230000912752us-gaap:LondonInterbankOfferedRateLIBORMember2019-08-230000912752sbgi:LondonInterbankOfferedRateLIBORPaidInKindMember2019-08-230000912752sbgi:TemporaryEquityPeriodOneMember2019-08-230000912752sbgi:TemporaryEquityPeriodOneMemberus-gaap:LondonInterbankOfferedRateLIBORMember2019-08-230000912752sbgi:TemporaryEquityPeriodTwoMember2019-08-230000912752us-gaap:LondonInterbankOfferedRateLIBORMembersbgi:TemporaryEquityPeriodTwoMember2019-08-2300009127522019-08-232019-08-230000912752us-gaap:RedeemablePreferredStockMember2020-01-012020-12-310000912752sbgi:TemporaryEquityPeriodThreeMember2021-12-31sbgi:vote0000912752us-gaap:CommonClassBMember2021-01-012021-12-310000912752us-gaap:SubsequentEventMember2022-02-012022-02-2800009127522020-08-0400009127522018-08-090000912752us-gaap:SubsequentEventMember2022-01-012022-02-230000912752us-gaap:DomesticCountryMember2021-12-310000912752us-gaap:StateAndLocalJurisdictionMember2021-12-310000912752sbgi:SportsProgrammingRightsMember2021-12-310000912752sbgi:FixedPaymentObligationsMembersbgi:RegionalSportsNetworksAndFoxCollegeSportsRSNsMember2021-12-310000912752sbgi:FixedPaymentObligationsMembersbgi:RegionalSportsNetworksAndFoxCollegeSportsRSNsMember2020-12-310000912752sbgi:FixedPaymentObligationsMembersbgi:RegionalSportsNetworksAndFoxCollegeSportsRSNsMember2021-01-012021-12-310000912752sbgi:FixedPaymentObligationsMembersbgi:RegionalSportsNetworksAndFoxCollegeSportsRSNsMember2020-01-012020-12-310000912752sbgi:FixedPaymentObligationsMembersbgi:RegionalSportsNetworksAndFoxCollegeSportsRSNsMember2019-01-012019-12-310000912752sbgi:VariablePaymentObligationsMembersbgi:RegionalSportsNetworksAndFoxCollegeSportsRSNsMember2021-12-310000912752sbgi:VariablePaymentObligationsMembersbgi:RegionalSportsNetworksAndFoxCollegeSportsRSNsMember2020-12-310000912752us-gaap:OtherNonoperatingIncomeExpenseMembersbgi:VariablePaymentObligationsMembersbgi:RegionalSportsNetworksAndFoxCollegeSportsRSNsMember2021-01-012021-12-310000912752sbgi:BreachOfMergerAgreementMember2020-05-222020-05-220000912752us-gaap:UnfavorableRegulatoryActionMember2017-12-012017-12-310000912752sbgi:BreachOfMergerAgreementMember2020-08-192020-08-190000912752sbgi:BreachOfMergerAgreementMember2020-06-082020-06-08sbgi:petition0000912752us-gaap:UnfavorableRegulatoryActionMember2020-09-022020-09-0200009127522020-10-152020-10-150000912752us-gaap:UnfavorableRegulatoryActionMember2021-07-282021-07-280000912752us-gaap:UnfavorableRegulatoryActionMember2021-01-012021-12-310000912752sbgi:VariousCasesAllegingViolationOfShermanAntitrustActMember2021-01-012021-12-31sbgi:lawsuit0000912752sbgi:VariousCasesAllegingViolationOfShermanAntitrustActMember2018-10-03sbgi:broadcaster0000912752sbgi:LocalMarketingAgreementsMember2021-01-012021-12-310000912752sbgi:FCCConsentDecreeSettlementMember2021-12-310000912752us-gaap:VariableInterestEntityPrimaryBeneficiaryMember2021-01-012021-12-310000912752us-gaap:VariableInterestEntityPrimaryBeneficiaryMembersrt:ConsolidationEliminationsMember2021-12-310000912752us-gaap:VariableInterestEntityPrimaryBeneficiaryMembersrt:ConsolidationEliminationsMember2020-12-310000912752us-gaap:VariableInterestEntityNotPrimaryBeneficiaryMember2021-12-310000912752us-gaap:VariableInterestEntityNotPrimaryBeneficiaryMember2020-12-310000912752us-gaap:VariableInterestEntityNotPrimaryBeneficiaryMember2021-01-012021-12-310000912752us-gaap:VariableInterestEntityNotPrimaryBeneficiaryMember2020-01-012020-12-310000912752us-gaap:VariableInterestEntityNotPrimaryBeneficiaryMember2019-01-012019-12-310000912752sbgi:EntitiesOwnedByControllingShareholdersMembersbgi:LeaseServicesMember2020-01-012020-12-310000912752sbgi:EntitiesOwnedByControllingShareholdersMembersbgi:LeaseServicesMember2021-01-012021-12-310000912752sbgi:EntitiesOwnedByControllingShareholdersMembersbgi:LeaseServicesMember2019-01-012019-12-310000912752sbgi:EntitiesOwnedByControllingShareholdersMembersbgi:FinanceLeaseObligationsMember2021-12-310000912752sbgi:EntitiesOwnedByControllingShareholdersMembersbgi:FinanceLeaseObligationsMember2020-12-310000912752sbgi:EntitiesOwnedByControllingShareholdersMembersbgi:CharterAircraftMember2021-01-012021-12-310000912752sbgi:EntitiesOwnedByControllingShareholdersMembersbgi:CharterAircraftMember2020-01-012020-12-310000912752sbgi:EntitiesOwnedByControllingShareholdersMembersbgi:CharterAircraftMember2019-01-012019-12-310000912752srt:AffiliatedEntityMemberus-gaap:GuaranteeObligationsMembersbgi:CunninghamBroadcastingCorporationMember2021-12-310000912752srt:AffiliatedEntityMemberus-gaap:VariableInterestEntityPrimaryBeneficiaryMembersbgi:CunninghamBroadcastingCorporationMember2021-12-310000912752sbgi:LocalMarketingAgreementsMembersrt:AffiliatedEntityMembersbgi:CunninghamBroadcastingCorporationMember2021-01-012021-12-31sbgi:renewal0000912752srt:AffiliatedEntityMembersbgi:CunninghamBroadcastingCorporationMember2021-12-310000912752sbgi:LocalMarketingAgreementsMembersrt:AffiliatedEntityMembersbgi:CunninghamBroadcastingCorporationMember2021-12-310000912752srt:AffiliatedEntityMembersbgi:CunninghamBroadcastingCorporationMember2020-12-310000912752sbgi:LocalMarketingAgreementsMembersbgi:CunninghamBroadcastingCorporationMember2021-01-012021-12-310000912752sbgi:LocalMarketingAgreementsMembersbgi:CunninghamBroadcastingCorporationMember2020-01-012020-12-310000912752sbgi:LocalMarketingAgreementsMembersbgi:CunninghamBroadcastingCorporationMember2019-01-012019-12-310000912752sbgi:CunninghamBroadcastingCorporationMembersbgi:CunninghamLicenseRelatedAssetsMember2021-01-012021-12-310000912752sbgi:CunninghamBroadcastingCorporationMembersbgi:CunninghamLicenseRelatedAssetsMember2020-01-012020-12-310000912752sbgi:CunninghamBroadcastingCorporationMembersbgi:CunninghamLicenseRelatedAssetsMember2019-01-012019-12-310000912752srt:AffiliatedEntityMembersbgi:CunninghamBroadcastingCorporationMember2016-04-012016-04-300000912752srt:AffiliatedEntityMembersbgi:CunninghamBroadcastingCorporationMember2016-08-012016-08-310000912752sbgi:AdvertisingTimeServicesMembersbgi:AtlanticAutomotiveCorporationMembersrt:AffiliatedEntityMember2021-01-012021-12-310000912752sbgi:AdvertisingTimeServicesMembersbgi:AtlanticAutomotiveCorporationMembersrt:AffiliatedEntityMember2020-01-012020-12-310000912752sbgi:AdvertisingTimeServicesMembersbgi:AtlanticAutomotiveCorporationMembersrt:AffiliatedEntityMember2019-01-012019-12-310000912752sbgi:LeaseServicesMembersbgi:EntitiesOwnedByControllingShareholdersMember2020-01-012020-12-310000912752sbgi:LeaseServicesMembersbgi:EntitiesOwnedByControllingShareholdersMember2019-01-012019-12-310000912752sbgi:LeaseServicesMembersbgi:EntitiesOwnedByControllingShareholdersMember2021-01-012021-12-310000912752sbgi:YankeeEntertainmentAndSportsNetworkLLCMember2019-08-012019-08-310000912752sbgi:MobileProductionBusinessesMember2021-01-012021-12-310000912752sbgi:MobileProductionBusinessesMember2020-01-012020-12-310000912752sbgi:MobileProductionBusinessesMember2019-01-012019-12-310000912752us-gaap:EquityMethodInvesteeMember2021-01-012021-12-310000912752sbgi:SportsTeamsAffiliatesMember2021-12-310000912752sbgi:SportsTeamsAffiliatesMember2021-01-012021-12-310000912752sbgi:SportsTeamsAffiliatesMember2020-01-012020-12-310000912752sbgi:SportsTeamsAffiliatesMember2019-01-012019-12-310000912752srt:AffiliatedEntityMembersbgi:EmployeeMembersbgi:JasonSmithMember2020-01-012020-12-310000912752srt:AffiliatedEntityMembersbgi:EmployeeMembersbgi:JasonSmithMember2021-01-012021-12-310000912752srt:AffiliatedEntityMembersbgi:EmployeeMembersbgi:JasonSmithMember2019-01-012019-12-310000912752srt:AffiliatedEntityMembersbgi:EmployeeMembersbgi:JasonSmithMemberus-gaap:RestrictedStockMember2021-01-012021-12-310000912752srt:AffiliatedEntityMembersbgi:EmployeeMembersbgi:JasonSmithMemberus-gaap:RestrictedStockMember2020-01-012020-12-310000912752srt:AffiliatedEntityMembersbgi:EmployeeMembersbgi:AmberlyThompsonMember2019-01-012019-12-310000912752srt:AffiliatedEntityMembersbgi:EmployeeMembersbgi:AmberlyThompsonMember2021-01-012021-12-310000912752srt:AffiliatedEntityMembersbgi:EmployeeMembersbgi:AmberlyThompsonMember2020-01-012020-12-310000912752srt:AffiliatedEntityMembersbgi:EmployeeMembersbgi:EdwardKimMember2021-01-012021-12-310000912752srt:AffiliatedEntityMembersbgi:EmployeeMembersbgi:EdwardKimMember2020-01-012020-12-310000912752us-gaap:OperatingSegmentsMembersbgi:BroadcastSegmentMember2021-12-310000912752us-gaap:OperatingSegmentsMembersbgi:LocalSportsSegmentMember2021-12-310000912752us-gaap:OperatingSegmentsMemberus-gaap:CorporateAndOtherMember2021-12-310000912752us-gaap:IntersegmentEliminationMember2021-12-310000912752us-gaap:OperatingSegmentsMemberus-gaap:CorporateAndOtherMember2021-01-012021-12-310000912752us-gaap:OperatingSegmentsMembersbgi:BroadcastSegmentMember2020-12-310000912752us-gaap:OperatingSegmentsMembersbgi:LocalSportsSegmentMember2020-12-310000912752us-gaap:OperatingSegmentsMemberus-gaap:CorporateAndOtherMember2020-12-310000912752us-gaap:IntersegmentEliminationMember2020-12-310000912752us-gaap:OperatingSegmentsMemberus-gaap:CorporateAndOtherMember2020-01-012020-12-310000912752us-gaap:OperatingSegmentsMemberus-gaap:CorporateAndOtherMember2019-01-012019-12-310000912752sbgi:BroadcastIncentiveAuctionAndCBandSpectrumMember2021-01-012021-12-310000912752sbgi:SpectrumAuctionMember2019-01-012019-12-310000912752us-gaap:CarryingReportedAmountFairValueDisclosureMemberus-gaap:FairValueInputsLevel1Member2021-12-310000912752us-gaap:EstimateOfFairValueFairValueDisclosureMemberus-gaap:FairValueInputsLevel1Member2021-12-310000912752us-gaap:CarryingReportedAmountFairValueDisclosureMemberus-gaap:FairValueInputsLevel1Member2020-12-310000912752us-gaap:EstimateOfFairValueFairValueDisclosureMemberus-gaap:FairValueInputsLevel1Member2020-12-310000912752us-gaap:CarryingReportedAmountFairValueDisclosureMembersbgi:STGMoneyMarketFundsMemberus-gaap:FairValueInputsLevel1Member2021-12-310000912752sbgi:STGMoneyMarketFundsMemberus-gaap:EstimateOfFairValueFairValueDisclosureMemberus-gaap:FairValueInputsLevel1Member2021-12-310000912752us-gaap:CarryingReportedAmountFairValueDisclosureMembersbgi:STGMoneyMarketFundsMemberus-gaap:FairValueInputsLevel1Member2020-12-310000912752sbgi:STGMoneyMarketFundsMemberus-gaap:EstimateOfFairValueFairValueDisclosureMemberus-gaap:FairValueInputsLevel1Member2020-12-310000912752sbgi:DSGMoneyMarketFundsMemberus-gaap:CarryingReportedAmountFairValueDisclosureMemberus-gaap:FairValueInputsLevel1Member2021-12-310000912752sbgi:DSGMoneyMarketFundsMemberus-gaap:EstimateOfFairValueFairValueDisclosureMemberus-gaap:FairValueInputsLevel1Member2021-12-310000912752sbgi:DSGMoneyMarketFundsMemberus-gaap:CarryingReportedAmountFairValueDisclosureMemberus-gaap:FairValueInputsLevel1Member2020-12-310000912752sbgi:DSGMoneyMarketFundsMemberus-gaap:EstimateOfFairValueFairValueDisclosureMemberus-gaap:FairValueInputsLevel1Member2020-12-310000912752us-gaap:FairValueInputsLevel2Memberus-gaap:CarryingReportedAmountFairValueDisclosureMember2021-12-310000912752us-gaap:FairValueInputsLevel2Memberus-gaap:EstimateOfFairValueFairValueDisclosureMember2021-12-310000912752us-gaap:FairValueInputsLevel2Memberus-gaap:CarryingReportedAmountFairValueDisclosureMember2020-12-310000912752us-gaap:FairValueInputsLevel2Memberus-gaap:EstimateOfFairValueFairValueDisclosureMember2020-12-310000912752us-gaap:SeniorNotesMemberus-gaap:FairValueInputsLevel2Memberus-gaap:CarryingReportedAmountFairValueDisclosureMembersbgi:STG5.875UnsecuredNotesMember2021-12-310000912752us-gaap:SeniorNotesMemberus-gaap:FairValueInputsLevel2Membersbgi:STG5.875UnsecuredNotesMemberus-gaap:EstimateOfFairValueFairValueDisclosureMember2021-12-310000912752us-gaap:SeniorNotesMemberus-gaap:FairValueInputsLevel2Memberus-gaap:CarryingReportedAmountFairValueDisclosureMembersbgi:STG5.875UnsecuredNotesMember2020-12-310000912752us-gaap:SeniorNotesMemberus-gaap:FairValueInputsLevel2Membersbgi:STG5.875UnsecuredNotesMemberus-gaap:EstimateOfFairValueFairValueDisclosureMember2020-12-310000912752sbgi:STG5.500UnsecuredNotesMemberus-gaap:SeniorNotesMemberus-gaap:FairValueInputsLevel2Memberus-gaap:CarryingReportedAmountFairValueDisclosureMember2021-12-310000912752sbgi:STG5.500UnsecuredNotesMemberus-gaap:SeniorNotesMemberus-gaap:FairValueInputsLevel2Memberus-gaap:EstimateOfFairValueFairValueDisclosureMember2021-12-310000912752sbgi:STG5.500UnsecuredNotesMemberus-gaap:SeniorNotesMemberus-gaap:FairValueInputsLevel2Memberus-gaap:CarryingReportedAmountFairValueDisclosureMember2020-12-310000912752sbgi:STG5.500UnsecuredNotesMemberus-gaap:SeniorNotesMemberus-gaap:FairValueInputsLevel2Memberus-gaap:EstimateOfFairValueFairValueDisclosureMember2020-12-310000912752us-gaap:SeniorNotesMemberus-gaap:FairValueInputsLevel2Memberus-gaap:CarryingReportedAmountFairValueDisclosureMembersbgi:STG5.125UnsecuredNotesMember2021-12-310000912752us-gaap:SeniorNotesMemberus-gaap:FairValueInputsLevel2Membersbgi:STG5.125UnsecuredNotesMemberus-gaap:EstimateOfFairValueFairValueDisclosureMember2021-12-310000912752us-gaap:SeniorNotesMemberus-gaap:FairValueInputsLevel2Memberus-gaap:CarryingReportedAmountFairValueDisclosureMembersbgi:STG5.125UnsecuredNotesMember2020-12-310000912752us-gaap:SeniorNotesMemberus-gaap:FairValueInputsLevel2Membersbgi:STG5.125UnsecuredNotesMemberus-gaap:EstimateOfFairValueFairValueDisclosureMember2020-12-310000912752sbgi:STG4125SecuredNotesMemberus-gaap:SeniorNotesMemberus-gaap:FairValueInputsLevel2Memberus-gaap:CarryingReportedAmountFairValueDisclosureMember2021-12-310000912752sbgi:STG4125SecuredNotesMemberus-gaap:SeniorNotesMemberus-gaap:FairValueInputsLevel2Memberus-gaap:EstimateOfFairValueFairValueDisclosureMember2021-12-310000912752sbgi:STG4125SecuredNotesMemberus-gaap:SeniorNotesMemberus-gaap:FairValueInputsLevel2Memberus-gaap:CarryingReportedAmountFairValueDisclosureMember2020-12-310000912752sbgi:STG4125SecuredNotesMemberus-gaap:SeniorNotesMemberus-gaap:FairValueInputsLevel2Memberus-gaap:EstimateOfFairValueFairValueDisclosureMember2020-12-310000912752sbgi:STGTermLoanFacilityMemberus-gaap:FairValueInputsLevel2Memberus-gaap:CarryingReportedAmountFairValueDisclosureMembersbgi:TermLoanB1Membersbgi:TermLoanMember2021-12-310000912752sbgi:STGTermLoanFacilityMemberus-gaap:FairValueInputsLevel2Membersbgi:TermLoanB1Membersbgi:TermLoanMemberus-gaap:EstimateOfFairValueFairValueDisclosureMember2021-12-310000912752sbgi:STGTermLoanFacilityMemberus-gaap:FairValueInputsLevel2Memberus-gaap:CarryingReportedAmountFairValueDisclosureMembersbgi:TermLoanB1Membersbgi:TermLoanMember2020-12-310000912752sbgi:STGTermLoanFacilityMemberus-gaap:FairValueInputsLevel2Membersbgi:TermLoanB1Membersbgi:TermLoanMemberus-gaap:EstimateOfFairValueFairValueDisclosureMember2020-12-310000912752sbgi:TermLoanB2Membersbgi:STGTermLoanFacilityMemberus-gaap:FairValueInputsLevel2Memberus-gaap:CarryingReportedAmountFairValueDisclosureMembersbgi:TermLoanMember2021-12-310000912752sbgi:TermLoanB2Membersbgi:STGTermLoanFacilityMemberus-gaap:FairValueInputsLevel2Membersbgi:TermLoanMemberus-gaap:EstimateOfFairValueFairValueDisclosureMember2021-12-310000912752sbgi:TermLoanB2Membersbgi:STGTermLoanFacilityMemberus-gaap:FairValueInputsLevel2Memberus-gaap:CarryingReportedAmountFairValueDisclosureMembersbgi:TermLoanMember2020-12-310000912752sbgi:TermLoanB2Membersbgi:STGTermLoanFacilityMemberus-gaap:FairValueInputsLevel2Membersbgi:TermLoanMemberus-gaap:EstimateOfFairValueFairValueDisclosureMember2020-12-310000912752us-gaap:FairValueInputsLevel2Memberus-gaap:CarryingReportedAmountFairValueDisclosureMembersbgi:TermLoanMembersbgi:STGTermLoanB3Member2021-12-310000912752us-gaap:FairValueInputsLevel2Membersbgi:TermLoanMemberus-gaap:EstimateOfFairValueFairValueDisclosureMembersbgi:STGTermLoanB3Member2021-12-310000912752us-gaap:FairValueInputsLevel2Memberus-gaap:CarryingReportedAmountFairValueDisclosureMembersbgi:TermLoanMembersbgi:STGTermLoanB3Member2020-12-310000912752us-gaap:FairValueInputsLevel2Membersbgi:TermLoanMemberus-gaap:EstimateOfFairValueFairValueDisclosureMembersbgi:STGTermLoanB3Member2020-12-310000912752us-gaap:SeniorNotesMemberus-gaap:FairValueInputsLevel2Membersbgi:DSG12750SecuredNotesDue2026Memberus-gaap:CarryingReportedAmountFairValueDisclosureMember2021-12-310000912752us-gaap:SeniorNotesMemberus-gaap:FairValueInputsLevel2Membersbgi:DSG12750SecuredNotesDue2026Memberus-gaap:EstimateOfFairValueFairValueDisclosureMember2021-12-310000912752us-gaap:SeniorNotesMemberus-gaap:FairValueInputsLevel2Membersbgi:DSG12750SecuredNotesDue2026Memberus-gaap:CarryingReportedAmountFairValueDisclosureMember2020-12-310000912752us-gaap:SeniorNotesMemberus-gaap:FairValueInputsLevel2Membersbgi:DSG12750SecuredNotesDue2026Memberus-gaap:EstimateOfFairValueFairValueDisclosureMember2020-12-310000912752us-gaap:SeniorNotesMemberus-gaap:FairValueInputsLevel2Memberus-gaap:CarryingReportedAmountFairValueDisclosureMembersbgi:DSG6625UnsecuredNotesMember2021-12-310000912752us-gaap:SeniorNotesMemberus-gaap:FairValueInputsLevel2Membersbgi:DSG6625UnsecuredNotesMemberus-gaap:EstimateOfFairValueFairValueDisclosureMember2021-12-310000912752us-gaap:SeniorNotesMemberus-gaap:FairValueInputsLevel2Memberus-gaap:CarryingReportedAmountFairValueDisclosureMembersbgi:DSG6625UnsecuredNotesMember2020-12-310000912752us-gaap:SeniorNotesMemberus-gaap:FairValueInputsLevel2Membersbgi:DSG6625UnsecuredNotesMemberus-gaap:EstimateOfFairValueFairValueDisclosureMember2020-12-310000912752sbgi:DSG5375SeniorSecuredNotesMemberus-gaap:SeniorNotesMemberus-gaap:FairValueInputsLevel2Memberus-gaap:CarryingReportedAmountFairValueDisclosureMember2021-12-310000912752sbgi:DSG5375SeniorSecuredNotesMemberus-gaap:SeniorNotesMemberus-gaap:FairValueInputsLevel2Memberus-gaap:EstimateOfFairValueFairValueDisclosureMember2021-12-310000912752sbgi:DSG5375SeniorSecuredNotesMemberus-gaap:SeniorNotesMemberus-gaap:FairValueInputsLevel2Memberus-gaap:CarryingReportedAmountFairValueDisclosureMember2020-12-310000912752sbgi:DSG5375SeniorSecuredNotesMemberus-gaap:SeniorNotesMemberus-gaap:FairValueInputsLevel2Memberus-gaap:EstimateOfFairValueFairValueDisclosureMember2020-12-310000912752us-gaap:FairValueInputsLevel2Membersbgi:DSGTermLoanMemberus-gaap:CarryingReportedAmountFairValueDisclosureMembersbgi:TermLoanMember2021-12-310000912752us-gaap:FairValueInputsLevel2Membersbgi:DSGTermLoanMembersbgi:TermLoanMemberus-gaap:EstimateOfFairValueFairValueDisclosureMember2021-12-310000912752us-gaap:FairValueInputsLevel2Membersbgi:DSGTermLoanMemberus-gaap:CarryingReportedAmountFairValueDisclosureMembersbgi:TermLoanMember2020-12-310000912752us-gaap:FairValueInputsLevel2Membersbgi:DSGTermLoanMembersbgi:TermLoanMemberus-gaap:EstimateOfFairValueFairValueDisclosureMember2020-12-310000912752sbgi:DSGAccountsReceivableSecuritizationFacilityMemberus-gaap:FairValueInputsLevel2Memberus-gaap:CarryingReportedAmountFairValueDisclosureMember2021-12-310000912752sbgi:DSGAccountsReceivableSecuritizationFacilityMemberus-gaap:FairValueInputsLevel2Memberus-gaap:EstimateOfFairValueFairValueDisclosureMember2021-12-310000912752sbgi:DSGAccountsReceivableSecuritizationFacilityMemberus-gaap:FairValueInputsLevel2Memberus-gaap:CarryingReportedAmountFairValueDisclosureMember2020-12-310000912752sbgi:DSGAccountsReceivableSecuritizationFacilityMemberus-gaap:FairValueInputsLevel2Memberus-gaap:EstimateOfFairValueFairValueDisclosureMember2020-12-310000912752us-gaap:FairValueInputsLevel2Memberus-gaap:CarryingReportedAmountFairValueDisclosureMembersbgi:DebtOfVariableInterestEntitiesMember2021-12-310000912752us-gaap:FairValueInputsLevel2Membersbgi:DebtOfVariableInterestEntitiesMemberus-gaap:EstimateOfFairValueFairValueDisclosureMember2021-12-310000912752us-gaap:FairValueInputsLevel2Memberus-gaap:CarryingReportedAmountFairValueDisclosureMembersbgi:DebtOfVariableInterestEntitiesMember2020-12-310000912752us-gaap:FairValueInputsLevel2Membersbgi:DebtOfVariableInterestEntitiesMemberus-gaap:EstimateOfFairValueFairValueDisclosureMember2020-12-310000912752us-gaap:FairValueInputsLevel2Memberus-gaap:CarryingReportedAmountFairValueDisclosureMembersbgi:DebtOfNonMediaSubsidiariesMember2021-12-310000912752us-gaap:FairValueInputsLevel2Membersbgi:DebtOfNonMediaSubsidiariesMemberus-gaap:EstimateOfFairValueFairValueDisclosureMember2021-12-310000912752us-gaap:FairValueInputsLevel2Memberus-gaap:CarryingReportedAmountFairValueDisclosureMembersbgi:DebtOfNonMediaSubsidiariesMember2020-12-310000912752us-gaap:FairValueInputsLevel2Membersbgi:DebtOfNonMediaSubsidiariesMemberus-gaap:EstimateOfFairValueFairValueDisclosureMember2020-12-310000912752us-gaap:CarryingReportedAmountFairValueDisclosureMemberus-gaap:FairValueInputsLevel3Member2021-12-310000912752us-gaap:FairValueInputsLevel3Memberus-gaap:EstimateOfFairValueFairValueDisclosureMember2021-12-310000912752us-gaap:CarryingReportedAmountFairValueDisclosureMemberus-gaap:FairValueInputsLevel3Member2020-12-310000912752us-gaap:FairValueInputsLevel3Memberus-gaap:EstimateOfFairValueFairValueDisclosureMember2020-12-310000912752sbgi:OptionsAndWarrantsMemberus-gaap:CarryingReportedAmountFairValueDisclosureMemberus-gaap:FairValueInputsLevel3Member2021-01-012021-12-310000912752sbgi:OptionsAndWarrantsMemberus-gaap:CarryingReportedAmountFairValueDisclosureMemberus-gaap:FairValueInputsLevel3Member2020-01-012020-12-310000912752sbgi:VariablePaymentObligationsMemberus-gaap:FairValueInputsLevel3Member2021-12-310000912752sbgi:VariablePaymentObligationsMemberus-gaap:FairValueInputsLevel3Member2020-12-310000912752sbgi:OptionsAndWarrantsMemberus-gaap:CarryingReportedAmountFairValueDisclosureMemberus-gaap:FairValueInputsLevel3Member2019-12-310000912752sbgi:OptionsAndWarrantsMemberus-gaap:CarryingReportedAmountFairValueDisclosureMemberus-gaap:FairValueInputsLevel3Member2020-12-310000912752sbgi:OptionsAndWarrantsMemberus-gaap:CarryingReportedAmountFairValueDisclosureMemberus-gaap:FairValueInputsLevel3Member2021-12-310000912752sbgi:SeniorUnsecuredNotes5.875PercentDue2026Memberus-gaap:SeniorNotesMembersrt:SubsidiariesMember2021-12-310000912752us-gaap:SeniorNotesMembersrt:SubsidiariesMembersbgi:SeniorUnsecuredNotes5.125PercentDue2027Member2021-12-310000912752sbgi:STG5.500UnsecuredNotesMemberus-gaap:SeniorNotesMembersrt:SubsidiariesMember2021-12-310000912752sbgi:STG4125SecuredNotesMemberus-gaap:SeniorNotesMembersrt:SubsidiariesMember2021-12-310000912752srt:GuarantorSubsidiariesMembersbgi:SeniorUnsecuredNotes5.875PercentDue2026Memberus-gaap:SeniorNotesMember2021-12-310000912752srt:GuarantorSubsidiariesMemberus-gaap:SeniorNotesMembersbgi:SeniorUnsecuredNotes5.125PercentDue2027Member2021-12-310000912752srt:GuarantorSubsidiariesMembersbgi:STG5.500UnsecuredNotesMemberus-gaap:SeniorNotesMember2021-12-310000912752srt:GuarantorSubsidiariesMembersbgi:STG4125SecuredNotesMemberus-gaap:SeniorNotesMember2021-12-310000912752srt:SubsidiaryIssuerMember2021-12-310000912752srt:ParentCompanyMembersrt:ReportableLegalEntitiesMember2021-12-310000912752srt:SubsidiaryIssuerMembersrt:ReportableLegalEntitiesMember2021-12-310000912752srt:GuarantorSubsidiariesMembersrt:ReportableLegalEntitiesMember2021-12-310000912752srt:NonGuarantorSubsidiariesMembersrt:ReportableLegalEntitiesMember2021-12-310000912752srt:ConsolidationEliminationsMember2021-12-310000912752srt:ParentCompanyMembersrt:ReportableLegalEntitiesMember2020-12-310000912752srt:SubsidiaryIssuerMembersrt:ReportableLegalEntitiesMember2020-12-310000912752srt:GuarantorSubsidiariesMembersrt:ReportableLegalEntitiesMember2020-12-310000912752srt:NonGuarantorSubsidiariesMembersrt:ReportableLegalEntitiesMember2020-12-310000912752srt:ConsolidationEliminationsMember2020-12-310000912752srt:ParentCompanyMembersrt:ReportableLegalEntitiesMember2021-01-012021-12-310000912752srt:SubsidiaryIssuerMembersrt:ReportableLegalEntitiesMember2021-01-012021-12-310000912752srt:GuarantorSubsidiariesMembersrt:ReportableLegalEntitiesMember2021-01-012021-12-310000912752srt:NonGuarantorSubsidiariesMembersrt:ReportableLegalEntitiesMember2021-01-012021-12-310000912752srt:ConsolidationEliminationsMember2021-01-012021-12-310000912752srt:ParentCompanyMembersrt:ReportableLegalEntitiesMember2020-01-012020-12-310000912752srt:SubsidiaryIssuerMembersrt:ReportableLegalEntitiesMember2020-01-012020-12-310000912752srt:GuarantorSubsidiariesMembersrt:ReportableLegalEntitiesMember2020-01-012020-12-310000912752srt:NonGuarantorSubsidiariesMembersrt:ReportableLegalEntitiesMember2020-01-012020-12-310000912752srt:ConsolidationEliminationsMember2020-01-012020-12-310000912752srt:ParentCompanyMembersrt:ReportableLegalEntitiesMember2019-01-012019-12-310000912752srt:SubsidiaryIssuerMembersrt:ReportableLegalEntitiesMember2019-01-012019-12-310000912752srt:GuarantorSubsidiariesMembersrt:ReportableLegalEntitiesMember2019-01-012019-12-310000912752srt:NonGuarantorSubsidiariesMembersrt:ReportableLegalEntitiesMember2019-01-012019-12-310000912752srt:ConsolidationEliminationsMember2019-01-012019-12-310000912752srt:ParentCompanyMembersrt:ReportableLegalEntitiesMember2019-12-310000912752srt:SubsidiaryIssuerMembersrt:ReportableLegalEntitiesMember2019-12-310000912752srt:GuarantorSubsidiariesMembersrt:ReportableLegalEntitiesMember2019-12-310000912752srt:NonGuarantorSubsidiariesMembersrt:ReportableLegalEntitiesMember2019-12-310000912752srt:ConsolidationEliminationsMember2019-12-310000912752srt:ParentCompanyMembersrt:ReportableLegalEntitiesMember2018-12-310000912752srt:SubsidiaryIssuerMembersrt:ReportableLegalEntitiesMember2018-12-310000912752srt:GuarantorSubsidiariesMembersrt:ReportableLegalEntitiesMember2018-12-310000912752srt:NonGuarantorSubsidiariesMembersrt:ReportableLegalEntitiesMember2018-12-310000912752srt:ConsolidationEliminationsMember2018-12-310000912752us-gaap:SubsequentEventMembersbgi:DSGFirstLienTermLoanMembersbgi:TermLoanMember2022-03-010000912752sbgi:DSG5375SecondLienSecuredNotesMemberus-gaap:SubsequentEventMemberus-gaap:SeniorNotesMember2022-03-010000912752us-gaap:SubsequentEventMembersbgi:DSGSecondLienTermLoanMembersbgi:TermLoanMember2022-03-010000912752us-gaap:SubsequentEventMembersbgi:ExistingTermLoansMembersbgi:TermLoanMember2022-03-010000912752us-gaap:SubsequentEventMembersbgi:DSGSecondLienRevolvingCreditFacilityMember2022-03-010000912752us-gaap:SubsequentEventMemberus-gaap:SeniorNotesMembersbgi:DSG12750SecuredNotesDue2026Member2022-03-010000912752us-gaap:SubsequentEventMembersbgi:TermLoanMembersbgi:DSGTermLoanMember2022-03-010000912752us-gaap:SubsequentEventMembersbgi:DSGRevolvingCreditFacilityMember2022-03-010000912752us-gaap:SubsequentEventMemberus-gaap:BaseRateMembersbgi:DSGFirstLienTermLoanMembersbgi:TermLoanMember2022-03-012022-03-010000912752us-gaap:SubsequentEventMembersbgi:DSGFirstLienTermLoanMembersbgi:TermLoanMemberus-gaap:SecuredOvernightFinancingRateSofrOvernightIndexSwapRateMember2022-03-012022-03-010000912752us-gaap:SubsequentEventMemberus-gaap:BaseRateMembersbgi:DSGSecondLienTermLoanMembersbgi:TermLoanMember2022-03-012022-03-010000912752us-gaap:SubsequentEventMembersbgi:DSGSecondLienTermLoanMembersbgi:TermLoanMemberus-gaap:SecuredOvernightFinancingRateSofrOvernightIndexSwapRateMember2022-03-012022-03-010000912752us-gaap:SubsequentEventMembersbgi:DSGSecondLienRevolvingCreditFacilityMemberus-gaap:SecuredOvernightFinancingRateSofrOvernightIndexSwapRateMember2022-03-012022-03-010000912752us-gaap:SubsequentEventMembersbgi:DSGSecondLienRevolvingCreditFacilityMemberus-gaap:BaseRateMember2022-03-012022-03-010000912752us-gaap:SubsequentEventMembersbgi:DSGSecondLienTermLoanMembersbgi:TermLoanMembersbgi:SecuredOvernightFinancingRateSOFRSuccessorRateMember2022-03-012022-03-010000912752us-gaap:SubsequentEventMembersbgi:DSGSecondLienTermLoanMembersbgi:TermLoanMembersrt:MinimumMemberus-gaap:SecuredOvernightFinancingRateSofrOvernightIndexSwapRateMember2022-03-012022-03-010000912752us-gaap:SubsequentEventMembersbgi:DSGFirstLienTermLoanMembersbgi:TermLoanMemberus-gaap:DebtInstrumentRedemptionPeriodOneMember2022-03-010000912752us-gaap:SubsequentEventMembersbgi:DSGFirstLienTermLoanMembersbgi:TermLoanMember2022-03-012022-03-010000912752us-gaap:SubsequentEventMemberus-gaap:DebtInstrumentRedemptionPeriodTwoMembersbgi:DSGFirstLienTermLoanMembersbgi:TermLoanMember2022-03-010000912752us-gaap:SubsequentEventMembersbgi:DSGSecondLienTermLoanMembersbgi:TermLoanMemberus-gaap:FederalFundsEffectiveSwapRateMember2022-02-282022-02-2800009127522021-01-012021-03-3100009127522021-04-012021-06-3000009127522021-07-012021-09-3000009127522021-10-012021-12-3100009127522020-01-012020-03-3100009127522020-04-012020-06-3000009127522020-10-012020-12-31
UNITED STATES
SECURITIES AND EXCHANGE COMMISSION
WASHINGTON, D.C. 20549
FORM 10-K
(mark one)
☒ ANNUAL REPORT PURSUANT TO SECTION 13 OR 15(d) OF THE SECURITIES EXCHANGE ACT OF 1934
FOR THE FISCAL YEAR ENDED December 31, 2021
OR
☐ TRANSITION REPORT PURSUANT TO SECTION 13 OR 15(d) OF THE SECURITIES EXCHANGE ACT OF 1934
FOR THE TRANSITION PERIOD FROM TO .
COMMISSION FILE NUMBER: 000-26076
SINCLAIR BROADCAST GROUP, INC.
(Exact name of Registrant as specified in its charter)
| | | | | | | | |
| Maryland | | 52-1494660 |
| (State or other jurisdiction of incorporation or organization) | | (I.R.S. Employer Identification No.) |
10706 Beaver Dam Road
Hunt Valley, MD 21030
(Address of principal executive offices)
(410) 568-1500
(Registrant’s telephone number, including area code)
Securities registered pursuant to Section 12(b) of the Act:
| | | | | | | | |
| Title of each class | Trading Symbol | Name of each exchange on which registered |
| Class A Common Stock, par value $ 0.01 per share | SBGI | The NASDAQ Stock Market LLC |
Securities registered pursuant to Section 12(g) of the Act: None
Indicate by check mark if the registrant is a well-known seasoned issuer, as defined in Rule 405 of the Securities Act. Yes ý No ☐
Indicate by check mark if the registrant is not required to file reports pursuant to Section 13 or Section 15(d) of the Act. Yes ☐ No ý
Indicate by check mark whether the registrant (1) has filed all reports required to be filed by Section 13 or 15(d) of the Securities Exchange Act of 1934 during the preceding 12 months (or for such shorter period that the registrant was required to file such reports), and (2) has been subject to such filing requirements for the past 90 days. Yes ý No ☐
Indicate by check mark whether the registrant has submitted electronically every Interactive Data File required to be submitted and posted pursuant to Rule 405 of Regulation S-T (§ 232.405 of this chapter) during the preceding 12 months (or for such shorter period that the registrant was required to submit such files). Yes ý No ☐
Indicate by check mark whether the registrant is a large accelerated filer, an accelerated filer, a non-accelerated filer, a smaller reporting company, or an emerging growth company. See the definitions of “large accelerated filer,” “accelerated filer,” “smaller reporting company,” and "emerging growth company" in Rule 12b-2 of the Exchange Act.
| | | | | | | | | | | | | | | | | | | | | | | | | | | | | |
| Large accelerated filer | ☒ | Accelerated filer | ☐ | Non-accelerated filer | ☐ | Smaller reporting company | ☐ | Emerging growth company | ☐ |
If an emerging growth company, indicate by check mark if the registrant has elected not to use the extended transition period for complying with any new or revised financial accounting standards provided pursuant to Section 13(a) of the Exchange Act. ☐
Indicate by check mark whether the registrant has filed a report on and attestation to its management’s assessment of the effectiveness of its internal control over financial reporting under Section 404(b) of the Sarbanes-Oxley Act (15 U.S.C. 7262(b)) by the registered public accounting firm that prepared or issued its audit report. ☒
Indicate by check mark whether the registrant is a shell company (as defined in Rule 12b-2 of the Act). Yes ☐ No ý
At June 30, 2021, the aggregate market value of voting and non-voting common stock held by non-affiliates of the registrant was $1,655 million based on the closing sales price of $33.22 on the NASDAQ stock market on June 30, 2021, the last business day of the registrant’s most recently completed second fiscal quarter. The determination of affiliate status is solely for the purposes of this report and shall not be construed as an admission for the purposes of determining affiliate status.
Indicate the number of shares outstanding of each of the registrant’s classes of common stock, as of the latest practicable date.
| | | | | | | | |
| | Number of shares outstanding as of |
| Title of each class | | February 23, 2022 |
| Class A Common Stock | | 47,891,455 |
| Class B Common Stock | | 23,775,056 |
DOCUMENTS INCORPORATED BY REFERENCE:
Portions of our definitive Proxy Statement relating to our 2022 Annual Meeting of Shareholders are incorporated by reference into Part III (Items 10,11,12,13, and 14) of this Annual Report on Form 10-K. We anticipate that our Proxy Statement will be filed with the Securities and Exchange Commission within 120 days after the end of our fiscal year ended December 31, 2021.
SINCLAIR BROADCAST GROUP, INC.
FORM 10-K FOR THE YEAR ENDED DECEMBER 31, 2021
TABLE OF CONTENTS
FORWARD-LOOKING STATEMENTS
This report includes or incorporates forward-looking statements within the meaning of Section 27A of the Securities Act of 1933, as amended, and Section 21E of the Securities Exchange Act of 1934, as amended (the Exchange Act), and the U.S. Private Securities Litigation Reform Act of 1995. These statements include, but are not limited to, statements related to our expectations regarding the performance of our business, our financial results, our liquidity and capital resources, contingencies, our dividend policy, and other non-historical statements. When we use words such as “outlook,” “believes,” “expects,” “potential,” “continues,” “may,” “will,” “should,” “seeks,” “approximately,” “predicts,” “intends,” “plans,” “estimates,” “anticipates” or the negative version of these words or similar expressions, we are making forward-looking statements. Such forward-looking statements are subject to various risks, uncertainties and assumptions. Accordingly, there are or will be important factors that could cause actual outcomes or results to differ materially from those indicated in these statements including, but not limited to, those listed below in summary form and as more fully described under Item 1A. Risk Factors, Item 7. Management’s Discussion and Analysis of Financial Conditions and Results of Operations, and Item 7A, Quantitative and Qualitative Disclosures about Market Risk, as such factors may be updated from time to time in our periodic filings with the United States Securities and Exchange Commission (SEC), which are accessible on the SEC’s website at www.sec.gov. These factors should not be construed as exhaustive and should be read in conjunction with the other cautionary statements that are included in this report and in our other periodic filings with the SEC. Further, forward-looking statements speak only as of the date they are made, and we undertake no obligation to update or revise forward-looking statements to reflect changed assumptions, the occurrence of unanticipated events or changes to future operating results over time, unless required by law.
SUMMARY OF RISK FACTORS
Our business is subject to numerous risks and uncertainties that could affect our ability to successfully implement our business strategy and affect our financial results. You should carefully consider all of the information in this report and, in particular, the following principal risks and all of the other specific factors described in Item 1A. Risk Factors, before deciding whether to invest in our securities.
The following is a summary of the material risks relating to our operations, our broadcast and local sports segments, and our debt.
•The COVID-19 pandemic or the future outbreak or pandemic of any other highly infectious or contagious diseases, could have a material and adverse effect on or cause disruption to our business or financial condition, results of operations and cash flows, the economy, our advertisers, our leagues and teams, viewership, traditional multi-channel video programming distributors (MVPDs), such as cable and satellite providers; virtual MVPDs (vMVPDs, and together with MVPDs, "Distributors"), and their subscribers.
•Our strategic acquisitions and investments could pose various risks and increase our leverage.
•If the rate of decline in the number of subscribers to Distributor services increases or these subscribers shift to other services or bundles that do not include our programming networks, there may be a material adverse effect on our revenues.
•We may not be able to renegotiate distribution agreements at terms comparable to or more favorable than our current agreements and networks with which we are affiliated currently, or in the future, and they may require us to share revenue from distribution agreements with them.
•We face intense, wide-ranging competition for viewers and advertisers.
•Competition from other broadcasters or other content providers and changes in technology may cause a reduction in our advertising revenues and/or an increase in our operating costs.
•We depend on the appeal of our programming, which may be unpredictable, and increased programming costs may have a material negative effect on our business and our results of operations.
•Further change in the current retransmission consent regulations could have an adverse effect on our business, financial condition and results of operations.
•Theft of our intellectual property may have a material negative effect on us and our results of operations, and we may become subject to infringement or other claims relating to our consent or technology.
•We have experienced a cyber security breach in the past and may be vulnerable to future security breaches, data privacy, and other information technology failures that could have a material adverse effect on our financial performance and operating results and disrupt our operations.
•We could be adversely affected by labor disputes and legislation and other union activity.
•The effects of the economic environment could require us to record an asset impairment of goodwill and intangible assets.
•Unrelated third parties may bring claims against us based on the nature and content of information posted on our linear programming, social platforms and websites maintained by us.
•David D. Smith, Frederick G. Smith, J. Duncan Smith, and Robert E. Smith (collectively, the Smiths) exercise control over most matters submitted to a stockholder vote and may have interests that differ from other security holders. They may, therefore, take actions that are not in the interests of other security holders.
•Our advertising revenue can vary substantially from period to period based on many factors beyond our control. This volatility affects our operating results and may reduce our ability to repay debt, or service our debt, or reduce the market value of our securities.
•We purchase programming in advance based on expectations about future revenues. Actual revenues may be lower than our expectations. If this happens, we could experience losses that may make our securities less valuable.
•We internally originate programming in advance based on expectations about future revenues. Actual revenues could fluctuate and may be lower than our expectations. If this happens, we could experience losses that may make our securities less valuable.
•We may lose a large amount of programming if a network terminates its affiliation or program service arrangement with us, we are not able to negotiate arrangements at terms comparable to or more favorable than our current agreements, or if networks make programming available through services other than our local affiliates, which could increase our costs and/or reduce our revenue.
•We may be subject to investigations or fines from governmental authorities, such as, but not limited to penalties related to violations of Federal Communications Commission's (FCC) indecency, children's programming, sponsorship identification, closed captioning and other FCC rules and policies, the enforcement of which has increased in recent years, and complaints related to such violations may delay our renewal applications with the FCC.
•Federal regulation of the broadcasting industry limits our operating flexibility, which may affect our ability to generate revenue or reduce our costs.
•The FCC's multiple ownership rules and federal antitrust regulation may limit our ability to operate multiple television stations in some markets and may result in a reduction in our revenue or prevent us from reducing costs. Changes in these rules may threaten our existing strategic approach to certain television markets.
•We have invested and will continue to invest in new technology initiatives which may not result in usable technology or intellectual property.
•The long-term success of our local sports segment is dependent on the successful execution of our direct-to-consumer (DTC) strategy, which is subject to a number of risks and uncertainties.
•Our media rights agreements with various professional sports teams have varying durations and terms and we may be unable to renew those agreements on acceptable terms or such rights may be lost for other reasons.
•Our local sports segment’s success depends on distribution revenue we receive, the loss of which or renewal of which on less favorable terms may have a material negative effect on us and our results of operations.
•If the number of subscribers to Distributor services decreases or these subscribers shift to other services or bundles that do not include our programming networks, there may be a material adverse effect on our revenues.
•Our joint venture arrangements are subject to a number of operational risks that could have a material adverse effect on our business, results of operations and financial condition.
•Our local sports segment is substantially dependent on the popularity of the Major League Baseball (MLB), National Basketball Association (NBA), and National Hockey League (NHL) teams whose local media rights we control.
•Our advertising revenue can vary substantially from period to period based on many factors beyond our control, which volatility may adversely affect our results of operations.
•We may be obligated to make certain payments to local teams during labor disputes.
•We may need to obtain FCC-regulated licenses for regional sports network video distribution.
•Our substantial debt could adversely affect our financial condition and prevent us from fulfilling our debt obligations.
•We may not be able to generate sufficient cash to service all of our debt and may be forced to take other actions to satisfy our obligations under our debt, which may not be successful.
•Despite our current level of debt, we and our subsidiaries may still be able to incur substantially more debt. This could further exacerbate the risks to our financial condition described herein.
•Our variable rate debt subjects us to interest rate risk, which could cause our debt service obligations to increase significantly.
•Commitments we have made to our lenders limit our ability to take actions that could increase the value of our securities and business or may require us to take actions that decrease the value of our securities and business.
•A failure to comply with covenants under debt instruments could result in a default under such debt instruments, acceleration of amounts due under our debt and loss of assets securing our loans.
•Financial and economic conditions may have an adverse impact on our industry, business, and results of operations or financial condition.
PART I
ITEM 1. BUSINESS
Sinclair Broadcast Group, Inc. (the Company, or sometimes referred to as "we" or "our") is a diversified media company with national reach and a strong focus on providing high-quality content on our local television stations, regional and national sports networks, and digital platforms. The content, distributed through our broadcast platform and third-party platforms, consists of programming provided by third-party networks and syndicators, local news, college and professional sports, and other original programming produced by us. Additionally, we own digital media products that are complementary to our extensive portfolio of television station and regional sports network related digital properties. Outside of our media related businesses, we operate technical services companies focused on supply and maintenance of broadcast transmission systems as well as research and development for the advancement of broadcast technology, and we manage other non-media related investments.
We are a Maryland corporation founded in 1986. Our principal executive offices are located at 10706 Beaver Dam Road, Hunt Valley, Maryland 21030. Our telephone number is (410) 568-1500 and our website address is www.sbgi.net. The information contained on, or accessible through, our website is not part of this annual report on Form 10-K and is not incorporated herein by reference.
Segments
As of December 31, 2021, we have two reportable segments: broadcast and local sports. Our broadcast segment is comprised of our television stations, which are owned and/or operated by our wholly-owned subsidiary, Sinclair Television Group, Inc. (STG) and its direct and indirect subsidiaries. Our local sports segment is comprised of our regional sports networks, which are owned and operated by our subsidiary, Diamond Sports Group, LLC (DSG) and its direct and indirect subsidiaries. We also earn revenues from our owned networks, original content, digital and internet services, technical services, and non-media investments. These businesses are included within other. Other is not a reportable segment but is included for reconciliation purposes.
Broadcast
As of December 31, 2021, our broadcast segment primarily consisted of our broadcast television stations. We own, provide programming and operating services pursuant to local marketing agreements (LMAs), or provide sales services and other non-programming operating services pursuant to other outsourcing agreements (such as joint sales agreements (JSAs) and shared services agreements (SSAs)) to 185 stations in 86 markets. These stations broadcast 634 channels, including 238 channels affiliated with primary networks or program service providers comprised of: FOX (56), ABC (40), CBS (31), NBC (25), CW (46), and MyNetworkTV (MNT) (40). The other 396 channels broadcast programming from programming services including Antenna TV, Azteca, Bounce, CHARGE!, Comet, Dabl, Decades, Estrella TV, GetTV, Grit, MeTV, Rewind, Stadium, TBD, Telemundo, This TV, UniMas, Univision, Weather, and two channels broadcasting independent programming. Solely for the purpose of this report, these 185 stations and 634 channels are referred to as “our” stations and channels, and the use of such term shall not be construed as an admission that we control such stations or channels. Refer to our Television Markets and Stations table later in this Item 1. for more information.
Our broadcast segment provides free over-the-air programming to television viewing audiences in the communities we serve through our local television stations. The programming that we provide on our primary channels consists of network provided programs, locally-produced news, local sporting events, programming from program service arrangements, syndicated entertainment programs, and internally originated programming. We provide live, local sporting events on many of our stations by acquiring the local television broadcast rights for these events or through our relationship with national networks.
We are one of the nation's largest producers of local news. We produce more than 2,500 hours of news per week at 126 stations in 81 markets. For the year ended December 31, 2021, our stations were awarded with 300 journalism awards, including 37 regional and one National RTDNA Edward R. Murrow awards and 77 regional Emmy awards.
Our broadcast segment derives revenue primarily from the sale of advertising inventory on our television stations and fees received from traditional multi-channel video programming distributors (MVPDs), which distribute multiple television channels through the internet without supplying their own data transport infrastructure; and other over-the-top (OTT) distributors that deliver live and on-demand programming over the internet, for the right to distribute our channels on their distribution platforms. We also earn revenues by selling digital advertisements on third-party platforms and providing digital content to non-linear devices via websites, mobile, and social media advertisements. Our objective is to meet the needs of our advertising customers by delivering significant audiences in key demographics. Our strategy is to achieve this objective by providing quality local news programming, popular network, syndicated and live sports programs, and other original content to our viewing audience. We attract most of our national television advertisers through national marketing representation firms. Our local television advertisers are primarily attracted through the use of a local sales force at each of our television stations, which is comprised of approximately 600 marketing consultants and 80 local sales managers company-wide.
Our operating results are subject to cyclical fluctuations from political advertising. Political spending has been significantly higher in the even-number years due to the cyclicality of political elections. In addition, every four years, political spending is typically elevated further due to the advertising related to the presidential election. Because of the political election cyclicality, there has been a significant difference in our operating results when comparing even-numbered years’ performance to the odd numbered years’ performance. Additionally, our operating results are impacted by the number and importance of individual political races and issues discussed on a national level as well as those within the local communities we serve. We believe political advertising will continue to be an important advertising category in our industry. Political advertising levels may increase further as political-activism, around social, political, economic and environmental causes, continues to draw attention and Political Action Committees (PACs), including so-called Super PACs, continue to increase spending.
Television Markets and Stations. As of December 31, 2021, our broadcast segment owns and operates or provides programming and/or sales and other shared services to television stations in the following 86 markets:
| | | | | | | | | | | | | | | | | | | | | | | | | | |
| Market | | Market Rank (a) | | Number of Channels | | Stations | | Network
Affiliation (b) |
| Washington, D.C. | | 7 | | 6 | | WJLA, WDCO-CD, WIAV-CD | | ABC |
| Seattle / Tacoma, WA | | 11 | | 6 | | KOMO, KUNS | | ABC |
| Minneapolis / St. Paul, MN | | 14 | | 5 | | WUCW | | CW |
| Portland, OR | | 21 | | 7 | | KATU, KUNP | | ABC |
| St. Louis, MO | | 23 | | 4 | | KDNL | | ABC |
| Raleigh / Durham, NC | | 24 | | 7 | | WLFL, WRDC | | CW, MNT |
| Pittsburgh, PA | | 26 | | 7 | | WPGH, WPNT | | FOX, MNT |
| Baltimore, MD | | 27 | | 8 | | WBFF, WNUV(c), WUTB(d) | | FOX, CW, MNT |
| Salt Lake City, UT | | 29 | | 10 | | KUTV, KMYU, KJZZ, KENV(d) | | CBS, MNT, IND |
| Nashville, TN | | 30 | | 10 | | WZTV, WUXP, WNAB(d) | | FOX, MNT, CW |
| San Antonio, TX | | 31 | | 10 | | KABB, WOAI, KMYS(d) | | FOX, NBC, CW |
| Columbus, OH | | 33 | | 9 | | WSYX, WWHO(d), WTTE(c) | | ABC, CW, MNT, FOX |
| Cincinnati, OH | | 35 | | 8 | | WKRC, WSTR(d) | | CBS, MNT, CW |
| Milwaukee, WI | | 36 | | 4 | | WVTV | | CW, MNT |
| Austin, TX | | 37 | | 2 | | KEYE | | CBS |
| Asheville, NC / Greenville, SC | | 38 | | 8 | | WLOS, WMYA(c) | | ABC, MNT |
| West Palm Beach / Ft Pierce, FL | | 39 | | 14 | | WPEC, WTVX, WTCN-CD, WWHB-CD | | CBS, CW, MNT |
| Las Vegas, NV | | 40 | | 9 | | KSNV, KVCW | | NBC, CW, MNT |
| Grand Rapids / Kalamazoo / Battle Creek, MI | | 41 | | 3 | | WWMT | | CBS, CW |
| Harrisburg / Lancaster / Lebanon / York, PA | | 42 | | 3 | | WHP | | CBS, MNT, CW |
| Oklahoma City, OK | | 44 | | 7 | | KOKH, KOCB | | FOX, CW |
| Birmingham / Tuscaloosa, AL | | 45 | | 15 | | WBMA-LD, WTTO, WDBB(c), WABM | | ABC, CW, MNT |
| Norfolk, VA | | 46 | | 4 | | WTVZ | | MNT |
| Greensboro / High Point / Winston-Salem, NC | | 47 | | 7 | | WXLV, WMYV | | ABC, MNT |
| Providence, RI / New Bedford, MA | | 51 | | 4 | | WJAR | | NBC |
| Buffalo, NY | | 52 | | 7 | | WUTV, WNYO | | FOX, MNT |
| Fresno / Visalia, CA | | 55 | | 12 | | KMPH, KMPH-CD, KFRE | | FOX, CW |
| Richmond, VA | | 56 | | 5 | | WRLH | | FOX, MNT |
| Mobile, AL / Pensacola, FL | | 57 | | 12 | | WEAR, WPMI(d), WFGX, WJTC(d) | | ABC, NBC, IND, MNT |
| Wilkes-Barre / Scranton, PA | | 58 | | 11 | | WOLF(c), WSWB(d), WQMY(c) | | FOX, CW, MNT |
| Albany, NY | | 59 | | 7 | | WRGB, WCWN | | CBS, CW |
| Little Rock / Pine Bluff, AR | | 60 | | 4 | | KATV | | ABC |
| Tulsa, OK | | 61 | | 5 | | KTUL | | ABC |
| Dayton, OH | | 64 | | 8 | | WKEF, WRGT(d) | | ABC, FOX, MNT |
| Spokane, WA | | 66 | | 4 | | KLEW | | CBS |
| Des Moines, IA | | 67 | | 4 | | KDSM | | FOX |
| Green Bay / Appleton, WI | | 68 | | 8 | | WLUK, WCWF | | FOX, CW |
| Wichita, KS | | 70 | | 19 | | KSAS, KOCW, KAAS, KAAS-LD, KSAS-LD, KMTW(c) | | FOX, MNT |
| Roanoke / Lynchburg, VA | | 71 | | 4 | | WSET | | ABC |
| Omaha, NE | | 72 | | 7 | | KPTM, KXVO(c) | | FOX , MNT, CW |
| Flint / Saginaw / Bay City, MI | | 73 | | 11 | | WSMH, WEYI(d), WBSF(d) | | FOX, NBC, CW |
| Rochester, NY | | 75 | | 7 | | WHAM(d), WUHF | | ABC, FOX, CW |
| Charleston / Huntington, WV | | 77 | | 8 | | WCHS, WVAH(d) | | ABC, FOX |
| Portland, ME | | 78 | | 7 | | WPFO(d), WGME | | FOX, CBS |
| Columbia, SC | | 79 | | 4 | | WACH | | FOX |
| Madison, WI | | 80 | | 4 | | WMSN | | FOX |
| | | | | | | | | | | | | | | | | | | | | | | | | | |
| Market | | Market Rank (a) | | Number of Channels | | Stations | | Network
Affiliation (b) |
| Toledo, OH | | 81 | | 4 | | WNWO | | NBC |
| Syracuse, NY | | 83 | | 6 | | WTVH(d), WSTM | | CBS, NBC, CW |
| Chattanooga, TN | | 85 | | 7 | | WTVC, WFLI(d) | | ABC, CW, FOX, MNT |
| Champaign / Springfield / Decatur, IL | | 88 | | 17 | | WICS, WICD, WRSP(d), WCCU(d), WBUI(d) | | ABC, FOX, CW |
| Savannah, GA | | 90 | | 5 | | WTGS | | FOX |
| Charleston, SC | | 91 | | 3 | | WCIV | | MNT, ABC |
| Cedar Rapids, IA | | 92 | | 8 | | KGAN, KFXA(d) | | CBS, FOX |
| El Paso, TX | | 93 | | 8 | | KFOX, KDBC | | FOX, CBS, MNT |
| Boise, ID | | 98 | | 8 | | KBOI, KYUU-LD | | CBS, CW Plus |
| South Bend-Elkhart, IN | | 99 | | 3 | | WSBT | | CBS, FOX |
| Tri-Cities, TN-VA | | 100 | | 7 | | WEMT(d), WCYB | | FOX, NBC, CW |
| Myrtle Beach / Florence, SC | | 101 | | 8 | | WPDE, WWMB(c) | | ABC, CW |
| Greenville / New Bern / Washington, NC | | 102 | | 8 | | WCTI, WYDO(d) | | ABC, FOX |
| Lincoln and Hastings-Kearney, NE | | 104 | | 9 | | KHGI, KWNB, KWNB-LD, KHGI-CD, KFXL | | ABC, FOX |
| Reno, NV | | 105 | | 9 | | KRXI, KRNV(d), KNSN(c) | | FOX, NBC, MNT |
| Tallahassee, FL | | 107 | | 8 | | WTWC, WTLF(d) | | NBC, CW Plus, FOX |
| Johnstown / Altoona, PA | | 108 | | 4 | | WJAC | | NBC, CW Plus |
| Eugene, OR | | 116 | | 18 | | KVAL, KCBY, KPIC(e), KMTR(d), KMCB(d), KTCW(d) | | CBS, NBC, CW Plus |
| Yakima / Pasco / Richland / Kennewick, WA | | 117 | | 18 | | KIMA, KEPR, KUNW-CD, KVVK-CD, KORX-CD | | CBS, CW Plus |
| Traverse City / Cadillac, MI | | 118 | | 12 | | WGTU(d), WGTQ(d), WPBN, WTOM | | ABC, NBC |
| Macon, GA | | 120 | | 3 | | WGXA | | ABC, FOX |
| Peoria / Bloomington, IL | | 121 | | 2 | | WHOI | | TBD |
| Bakersfield, CA | | 125 | | 8 | | KBFX-CD, KBAK | | FOX, CBS |
| Corpus Christi, TX | | 130 | | 4 | | KSCC | | FOX, MNT |
| Amarillo, TX | | 132 | | 10 | | KVII, KVIH | | ABC, CW Plus |
| Chico-Redding, CA | | 133 | | 18 | | KRCR, KCVU(d), KRVU-LD, KKTF-LD, KUCO-LD | | ABC, FOX, MNT |
| Medford / Klamath Falls, OR | | 135 | | 5 | | KTVL | | CBS, CW Plus |
| Columbia / Jefferson City, MO | | 136 | | 4 | | KRCG | | CBS |
| Beaumont / Port Arthur / Orange, TX | | 145 | | 8 | | KFDM, KBTV(d) | | CBS, CW Plus, FOX |
| Sioux City, IA | | 148 | | 13 | | KPTH, KPTP-LD, KBVK-LP, KMEG(d) | | FOX, MNT, CBS |
| Albany, GA | | 158 | | 4 | | WFXL | | FOX |
| Gainesville, FL | | 161 | | 8 | | WGFL(c), WNBW(c), WYME-CD(c) | | CBS, NBC, MNT |
| Missoula, MT | | 162 | | 8 | | KECI, KCFW | | NBC |
| Wheeling, WV / Steubenville, OH | | 163 | | 3 | | WTOV | | NBC, FOX |
| Abilene / Sweetwater, TX | | 167 | | 4 | | KTXS, KTES-LD | | ABC, CW Plus |
| Quincy, IL / Hannibal, MO / Keokuk, IA | | 174 | | 3 | | KHQA | | CBS, ABC |
| Butte-Bozeman, MT | | 187 | | 8 | | KTVM, KDBZ-CD | | NBC |
| Eureka, CA | | 194 | | 10 | | KAEF, KBVU(d), KECA-LD, KEUV-LP | | ABC, FOX, CW Plus, MNT |
| San Angelo, TX | | 196 | | 3 | | KTXE-LD | | ABC, CW Plus |
| Ottumwa, IA / Kirksville, MO | | 200 | | 3 | | KTVO | | ABC, CBS |
| Total Television Channels | | | | 634 | | | | |
(a)Rankings are based on the relative size of a station’s Designated Market Area (DMA) among the 210 generally recognized DMAs in the United States as estimated by Nielsen Media Research (Nielsen) as of September 2021.
(b)We broadcast programming from the following providers on our channels and the channels of our JSA/LMA partners:
| | | | | | | | | | | | | | | | | | | | |
| Affiliation | | Number of
Channels | | Number of
Markets | | Expiration Dates (1) |
| ABC | | 40 | | 30 | | August 31, 2022 |
| FOX | | 56 | | 41 | | December 31, 2023 through December 31, 2024 |
| CBS | | 31 | | 24 | | October 31, 2023 through December 31, 2024 |
| NBC | | 25 | | 17 | | December 31, 2024 |
| CW | | 46 | | 37 | | August 31, 2023 through August 31, 2024 |
| MNT | | 40 | | 31 | | August 31, 2023 |
| Total Major Network Affiliates | | 238 | | | | |
| | | | | | | | | | | | | | | | | | | | |
| Affiliation | | Number of
Channels | | Number of
Markets | | Expiration Dates (1) |
| Antenna TV | | 22 | | 20 | | January 1, 2024 |
| Azteca | | 2 | | 1 | | August 31, 2020 |
| Bounce | | 1 | | 1 | | October 31, 2023 |
| CHARGE! | | 81 | | 72 | | (2) |
| Comet | | 86 | | 71 | | (2) |
| Dabl | | 30 | | 29 | | October 31, 2022 |
| Decades | | 1 | | 1 | | January 31, 2022 |
| Estrella TV | | 1 | | 1 | | September 30, 2022 |
| GetTV | | 5 | | 5 | | June 30, 2017 |
| Grit | | 1 | | 1 | | December 31, 2019 |
| IND | | 2 | | 2 | | N/A |
| MeTV | | 19 | | 15 | | August 31, 2022 through August 1, 2024 |
| Rewind | | 4 | | 4 | | August 31, 2024 |
| Stadium | | 44 | | 41 | | January 1, 2024 |
| TBD | | 79 | | 68 | | (2) |
| Telemundo | | 1 | | 1 | | December 31, 2022 |
| This TV | | 1 | | 1 | | November 1, 2014 |
| UniMas | | 2 | | 1 | | December 31, 2022 |
| Univision | | 8 | | 5 | | November 30, 2022 |
| Weather | | 6 | | 4 | | December 31, 2017 |
| Total Other Affiliates | | 396 | | | | |
| | | | | | |
| Total Television Channels | | 634 | | | | |
(1)When we negotiate the terms of our network affiliations or program service arrangements, we generally negotiate on behalf of our owned stations affiliated with that entity simultaneously, except in certain circumstances. This results in substantially similar terms for our stations, including the expiration date of the network affiliations or program service arrangements. If the affiliation agreement expires, we may continue to operate under the existing affiliation agreement on the same terms and conditions until a new affiliation agreement is entered into.
(2)An owned and operated network, which is carried on our multicast distribution platform or the platform of our JSA/LMA partners. Thus, there is no expiration date.
(c)The license assets for these stations are currently owned by third parties. We provide programming, sales, operational, and administrative services to these stations pursuant to certain service agreements, such as LMAs.
(d)The license and programming assets for these stations are currently owned by third parties. We provide certain non-programming related sales, operational, and administrative services to these stations pursuant to service agreements, such as JSAs and SSAs.
(e)We provide programming, sales, operational, and administrative services to this station, of which 50% is owned by a third party.
Local sports
On August 23, 2019, we completed the acquisition of the controlling interests in certain regional sports network brands and Fox College Sports (the Acquired RSNs) from The Walt Disney Company (Disney). See Note 2. Acquisitions and Dispositions of Assets within the Consolidated Financial Statements for further discussion. In February 2019, we announced a joint venture with the Chicago Cubs that owns and operates Marquee Sports Network (Marquee), a regional sports network based in Chicago, Illinois. On August 29, 2019 we acquired a minority equity interest in the Yankee Entertainment and Sports Network (the YES Network), a regional sports network based in New York, New York. On March 31, 2021, the 21 Acquired RSNs were rebranded as 19 Bally Sports network brands (the Bally RSNs). We refer to the Bally RSNs and Marquee as "the RSNs". The RSNs and YES Network own the exclusive rights to air, among other sporting events, the games of professional sports teams in designated local viewing areas.
Through our RSNs and the YES Network, we own equity interests in the largest collection of regional sports networks in the United States, broadcasting approximately 5,000 professional sports games and producing approximately 25,700 hours of new content each year. As a result of the modified sports seasons due to the COVID-19 pandemic, a higher than average number of live sports games were played during the year ended December 31, 2021, therefore our RSNs and the YES Network broadcast approximately 5,500 professional sports games and produced approximately 30,000 hours of new content. Our RSNs and the YES Network are located in attractive, highly-populated geographic areas of the United States with significant local viewership and 45 of the most exciting professional sports teams. Our RSNs are a premier destination for local sports viewership, with premium live sports content reaching approximately 47 million subscribers nationally, excluding YES Network subscribers. Our RSNs and the YES Network have an extensive footprint that includes exclusive long-term agreements with 16 Major League Baseball (MLB) teams, 17 National Basketball Association (NBA) teams and 12 National Hockey League (NHL) teams. Within our RSN portfolio and the YES Network are 21 regional sports network brands (19 Bally RSNs, Marquee and YES Network). We generate revenues by distributing our networks to Distributors, and from the sale of advertising inventory.
As of December 31, 2021, our RSNs have relationships with the following professional teams.
| | | | | | | | | | | | | | |
| MLB Teams | | NBA Teams | | NHL Teams |
| Arizona Diamondbacks | | Atlanta Hawks | | Anaheim Ducks |
| Atlanta Braves | | Charlotte Hornets | | Arizona Coyotes |
| Chicago Cubs | | Cleveland Cavaliers | | Carolina Hurricanes |
| Cincinnati Reds | | Dallas Mavericks | | Columbus Blue Jackets |
| Cleveland Guardians | | Detroit Pistons | | Dallas Stars |
| Detroit Tigers | | Indiana Pacers | | Detroit Red Wings |
| Kansas City Royals | | Los Angeles Clippers | | Florida Panthers |
| Los Angeles Angels | | Memphis Grizzlies | | Los Angeles Kings |
| Miami Marlins | | Miami Heat | | Minnesota Wild |
| Milwaukee Brewers | | Milwaukee Bucks | | Nashville Predators |
| Minnesota Twins | | Minnesota Timberwolves | | St. Louis Blues |
| San Diego Padres | | New Orleans Pelicans | | Tampa Bay Lightning |
| St. Louis Cardinals | | Oklahoma City Thunder | | |
| Tampa Bay Rays | | Orlando Magic | | |
| Texas Rangers | | Phoenix Suns | | |
| | San Antonio Spurs | | |
As of December 31, 2021, we also hold a minority interest in the YES Network, which has long term agreements with the New York Yankees and Brooklyn Nets. We also own Fox College Sports which offers collegiate programming throughout the country.
Other
Owned Networks and Content
We own and operate Tennis Channel, a cable network which includes coverage of many of tennis' top tournaments and original professional sport and tennis lifestyle shows; the Tennis Channel International streaming service; Tennis Magazine, the sport’s largest print publication; and Tennis.com (collectively, Tennis), the most visited online tennis platform in the world.
We also own and operate various networks carried on distribution platforms owned by us or others, including: Comet, our science fiction network; CHARGE!, our adventure and action-based network; and TBD, the first multiscreen TV network in the U.S. market to bring premium internet-first content to TV homes across America. We also have a majority ownership interest in Stadium, a network that brings together professional sports highlights and college games.
Our internally developed content, in addition to our local news, includes Ring of Honor (ROH), our professional wrestling promotion; The National Desk (The National Desk) with a morning edition hosted by Jan Jeffcoat and an evening edition hosted by Meagan O'Halloran; and Full Measure with Sharyl Attkisson (Full Measure), our national Sunday morning investigative and political analysis program.
Digital and Internet
STIRR, our national free, ad-supported DTC streaming app, offers live and on-demand content spanning entertainment, sports, and news. In 2021, STIRR continued to see increased viewership and expanded its offering of live, local news, additional local station content, and other brand name TV franchises and rolled out the newly designed electronic program guide to increase viewer content discovery. Since launch, total app downloads have increased 25% to approximately 8 million. Viewer engagement increased in 2021 as average viewing time grew to over 61 minutes per session and Sessions Per User increased by 35%. Also in 2021, STIRR City, STIRR’s local news channel, launched in the Minneapolis/St. Paul, St. Louis, Raleigh/Durham and Pittsburgh markets, bringing the total number of STIRR City stations to 82.
We earn revenues from Compulse, a marketing technology and managed services company, by licensing the platform to other media companies and agencies, as well as executing their digital media initiatives across search, social, programmatic, email and more.
NewsON is a free, ad-supported app that provides instant access to live or on-demand local news broadcasts, including non-Sinclair affiliate partners. Sinclair Digital Ventures focuses on investment in emerging digital technologies, ad tech, and digital content companies that support, complement, or expand the Company's businesses.
In November 2020, we entered into agreements for a long-term, enterprise-wide strategic partnership with Bally's Corporation (Bally's) to combine Bally's vertically integrated, proprietary sports betting technology and expansive market access footprint with our premier portfolio of local broadcast stations, RSNs, Tennis Channel, STIRR and digital and over-the-air television network Stadium. This partnership is expected to enhance the gamification of live sports to provide audiences interactive viewing experiences and drive legalized sports betting monetization. In connection with the agreement, we also received various equity interests in Bally's and branding integrations, including naming rights under the Bally's brand. See Note 1. Nature of Operations and Summary of Significant Accounting Policies and Note 6. Other Assets within the Consolidated Financial Statements for further information.
Technical Services
We own subsidiaries which are dedicated to providing technical services to the broadcast industry, including: Acrodyne Technical Services, a provider of service and support for broadcast transmitters throughout the world; Dielectric, a designer and manufacturer of broadcast systems including all components from transmitter output to antenna; and ONE Media 3.0, whose purpose is to develop business opportunities, products, and services associated with the NEXTGEN TV broadcast transmission standard and TV platform. We have also partnered with several other companies in the design and deployment of NEXTGEN TV services including: Saankhya Labs to develop NEXTGEN TV technologies to be used in consumer devices; CAST.ERA, a joint venture with South Korea’s leading mobile operator, SK Telecom, to develop wireless, cloud infrastructure and artificial intelligence technologies; and BitPath, a joint venture with Nexstar Media Group, to deploy and exploit datacasting models using NEXTGEN capabilities.
Non-media Investments
We own various non-media related investments across multiple asset classes including private equity, mezzanine financing, and real estate investments.
Customers
In 2021, the broadcast and local sports segments had three customers, DirecTV, Charter Communications, and Comcast, that individually exceeded 10% of consolidated revenue. Any disruption in our relationship with these customers could have a material adverse effect on the broadcast segment, the local sports segment, and our results of operations.
Operating Strategy
Programming to Attract Viewership. We seek to target our programming offerings to attract viewership, to meet the needs of the communities in which we serve, and to meet the needs of our advertising customers.
Our stations seek to broadcast live, local, and national sporting events that would appeal to a large segment of the local community. Moreover, our stations produce local news at 126 stations in 81 markets. See News below for further discussion. Our stations also seek to develop original programming or obtain, at attractive prices, popular syndicated programming that is complementary to each station’s network programming.
Television advertising prices are based on ratings information measured and distributed by Nielsen and Comscore. Ratings methodologies have been changing rapidly due to advancements in technology and changes in the manners in which viewers consume news, sports, and entertainment. Certain new methodologies are currently not accredited by the Media Rating Council (MRC), an independent organization that monitors rating services, and may not reflect actual viewership levels.
Our RSNs invest in producing popular sports programming, and measure audience engagement and needs to determine what our sports fans value most and to continue to work to deliver premier sports content in the markets in which we operate.
Our RSNs invest in technologies that improve the viewer experience of our loyal sports fans and that will help tell the "story" of a sports game and make our offerings more appealing to the viewer. Additionally, our broad rights position us to benefit from new viewing technologies as they are developed, such as virtual, augmented, and mixed reality. As these technological capabilities develop, we will invest in bringing them to our premium live sports content.
News. Through local news, our mission is to serve our communities by sharing relevant information to alert, protect, and empower our audiences. We believe that the production and broadcasting of local news is an important link to the community and an aid to a station’s efforts to expand its viewership. In addition, local news programming can provide access to advertising sources targeted specifically to local news viewers. Our news stations also produce content on digital platforms such as websites, mobile applications, OTT distributors, and social media.
Our local news initiatives are an important part of our strategy. We have entered into local news sharing arrangements in which we receive news in seven markets from other in-market broadcasters. We believe that, in the markets where we have news share arrangements, such arrangements generally provide both higher viewer ratings and revenues for the station receiving the news and generate a profit for the news share provider. Generally, both parties and the local community are beneficiaries of these arrangements.
In addition to our traditional local news stories, we have utilized our national reach and physical presence in the nation's capital to provide our local viewers with broader national news stories which are relevant to our local viewers.
Our local news coverage is supported by our national news desk and Capitol Hill bureau. These teams focus on providing context and perspective to important stories in the daily news cycle. This content provides a significant point of difference with a focus on accountability reporting. Available on-air and online, the bureau not only expands our news presence, but gives our local station viewers an opportunity to hear the views of their members of Congress through programs such as "Connect to Congress," our weekly on-air and digital feature which provides an electronic video pathway for lawmakers to speak to their constituents. Our weekly investigative news program, Full Measure with Sharyl Attkisson, reinforces our mission to provide our fearless storytelling on significant topics of public importance.
Launched in January 2021, our original news program, The National Desk, provides viewers with a comprehensive, commentary-free look at the most impactful national news and regional stories throughout the day. The National Desk morning news edition is hosted by award-winning anchor Jan Jeffcoat with Cayle Thompson as the Live Desk anchor, giving viewers the news to start their day. In September 2021, The National Desk launched its evening edition, hosted by award-winning journalist Meagan O’Halloran with Eugene Ramirez as the Live Desk Anchor. The National Desk morning show and evening edition air on 76 of our stations in 65 markets and 64 of our stations in 60 markets, respectively, including MNT and CW, on STIRR, and across all of our news websites. Leveraging our expansive local news footprint, The National Desk elevates some of the most important stories occurring in cities and towns across the country. With reporters residing in the communities they cover, The National Desk has access to real stories from the perspectives of those they affect directly. The goal of The National Desk is to leverage these assets into a single news program for a national audience. The program also supplements expansive local coverage by bringing the most important national headlines to audiences. In December 2021, we launched TheNationalDesk.com featuring additional hours of breaking news, with content from The National Desk’s dedicated team of journalists as well as our newsrooms around the US.
We have a national investigative team of 15 journalists, plus more than 30 local investigative reporters. We plan to continue to grow our investigative footprint, and to provide in-depth stories not covered elsewhere.
We provide our viewers with "Town Halls," which bring together our viewers to discuss major local and national topics. In 2020, we produced 143 Town Halls, including debates and discussions on race relations and COVID-19. In 2021, we produced 162 Town Halls covering a variety of topics. We organized 14 political debates and our stations produced 12 discussions on crime, police funding, and the rights of the African American community, over 20 productions on COVID-19, and over 20 Baltimore Town Halls, focused in each Councilmanic District. Since launching our commitment to give a voice to our viewers, our Town Halls have produced over 990 hours to educate and address the needs of our audience.
In 2021, STIRR continued to see increased viewership and expanded its offering of live, local news, additional local station content, and other brand name TV franchises and rolled out the newly designed electronic program guide to increase viewer content discovery. Since launch, total app downloads have increased 25% to approximately 8 million. Viewer engagement increased in 2021 as average viewing time grew to over 61 minutes per session and Sessions Per User increased by 35%. Also in 2021, STIRR City, STIRR’s local news channel, launched in the Minneapolis/St. Paul, St. Louis, Raleigh/Durham and Pittsburgh markets, bringing the total number of STIRR City stations to 82. We also own NewsOn, a single app to watch live, local news on mobile and OTT devices.
Sports. Live sports have remained highly popular with fans and advertisers. Sports programming generally elicits strong emotional responses and attracts a loyal and passionate following among fans. Our premium live sports programming typically attracts viewership demographics that are highly desirable to advertisers. Every sports season is a new chapter in a story that has continued for decades and is popular across fans from multiple generations. As media has continued to trend toward on-demand consumption, sports events have remained an ‘‘appointment viewing’’ event. As such, live sports content is frequently the most watched programming in a local market on most nights.
Through our RSNs and the YES Network, we own equity interests in the largest collection of regional sports networks in the United States, located in attractive, highly-populated geographic areas with significant local viewership and 45 of the most exciting professional sports teams. Our RSNs are a premier destination for local sports viewership, with premium live sports content reaching approximately 47 million subscribers nationally, excluding YES Network subscribers. Our RSNs and the YES Network have an extensive footprint that includes exclusive long-term agreements with 16 MLB teams, 17 NBA teams and 12 NHL teams.
Tennis has certain telecast rights to the US Open, Wimbledon, Roland Garros (French Open), Australian Open, ATP World Tour events, WTA competitions, Laver Cup, and Billie Jean King Cup; and College and Junior events and exhibitions. Our stations also broadcast programming and other content provided by Tennis, and we provide access to certain events through our premium OTT offering, Tennis Channel Plus. Tennis also includes Tennis.com, the most visited online tennis platform in the world, and the Tennis Channel International streaming service, which has distribution in 8 countries, such as the U.K., India, the Netherlands and Greece. Tennis' complementary offerings allow us to provide greater and more in-depth tennis content to consumers on TV, internet, and print.
Additionally, some of our stations have the local television broadcast rights for certain sporting events, including MLB, NBA, NHL, National Football League (NFL) preseason, and certain other college and high school sports. Our CW and MNT stations generally face fewer preemption restrictions on broadcasting live local sporting events compared with our FOX, ABC, CBS, and NBC stations, which are required to broadcast a greater number of hours of programming supplied by the networks. In addition, our stations that are affiliated with FOX, ABC, CBS, and NBC have network arrangements to broadcast certain MLB, NBA, NHL, NFL, and Professional Golf Association (PGA) events, as well as other popular sporting events.
Control of Operating and Programming Costs. By employing a disciplined approach to managing programming acquisition and other costs, our stations have been able to achieve operating margins that we believe are very competitive within the television broadcast industry. We believe our national reach as of December 31, 2021 of approximately 39% of the country provides us with a strong position to negotiate with programming providers and, as a result, the opportunity to purchase high quality programming at more favorable prices. Moreover, we emphasize control of each of our station’s programming and operating costs through program-specific profit analysis, detailed budgeting, regionalization of staff, and detailed long-term planning models. We also control our programming costs by creating original high-quality programming that is distributed on our broadcast platform.
Our RSNs manage our programming rights costs to improve margins and increase our cash flow. We intend to balance our portfolio to ensure that losing one team’s rights will not materially harm the overall product offering. We intend to maintain our disciplined approach to non-programming expense management by seeking opportunities to increase our efficiency without jeopardizing our commitment to provide high quality sports content to our customers. We will seek to emphasize high quality production at low cost with a continuous focus on technological advancements and managing the cost of on-air talent retention, overhead, and salaries and compensation.
Developing Local Franchises. We believe the greatest opportunity for a sustainable and growing customer base lies within our local communities. Therefore, we have focused on developing a strong local sales force, which is comprised of approximately 600 marketing consultants and 80 local sales managers company-wide. Excluding political advertising revenue, distribution revenues, and other revenues, 56% and 60% of net time sales were local for the years ended December 31, 2021 and 2020, respectively. Our goal is to grow our local revenues by increasing our market share, developing new business opportunities, and offering marketing solutions across our platforms.
Attract and Retain High Quality Management. We believe that much of our success is due to our ability to attract and retain highly-skilled and motivated managers at corporate, stations, RSNs, and other businesses. We provide a combination of base salary, long-term incentive compensation including equity awards and, where appropriate, cash bonus pay designed to be competitive with comparable employers in our industry. A significant portion of the compensation available to certain members of our senior management and our sales force is based on their achievement of certain performance goals. We also encourage station and network managers and employees to utilize our diverse business to grow in their careers while remaining in the Sinclair family via internal promotion and relocation.
Multi-Channel Broadcasting. FCC rules allow television broadcasters to transmit additional digital channels within the spectrum allocated to each FCC license holder. This provides our stations' viewers with additional programming alternatives at no additional cost to them. We may consider other alternative programming formats that we could air using our multi-channel digital spectrum space with the goal towards achieving higher profits and community service. As of December 31, 2021, our stations have 449 multi-channels in our digital spectrum.
Distribution Agreements. We have distribution agreements with Distributors and other OTT distributors who compensate us for the right to retransmit our stations, RSNs, and other offerings on their respective distribution platforms. Our successful negotiations with Distributors and other OTT distributors have created agreements that produce meaningful sustainable revenue streams. We intend to maintain the strong relationships with our Distributors and other OTT distributors and believe our local news, sports and entertainment content positions us to continue to expand our agreements within all of these distribution platforms. However, we cannot guarantee that some Distributors and other OTT distributors will not drop carriage of our channels.
Improvement and Maintenance of Broadcast Infrastructure. Our Acrodyne and Dielectric subsidiaries are leaders in servicing and manufacturing broadcast infrastructure. As a result, we maintain a strong infrastructure through which we provide high quality uninterrupted content on our stations. These subsidiaries are critical in the build-out of the infrastructure behind NEXTGEN TV for both our stations and other broadcasters.
Developing New Business. We strive to develop new business models to complement or enhance our traditional television broadcast business. We have developed new ways to sell online, mobile text messaging, social media advertising, and audience extension services along with our traditional commercial broadcasting model. Additionally, we continue to leverage our national reach to provide new high-quality content to our local communities.
We continue to expand our digital distribution platforms through initiatives such as our video management system, which simplifies and automates our broadcast-to-digital streaming workflow and allows for dynamic replacement of broadcast ads with digital ads targeted to each individual viewer and allows us to ingest and redistribute content across our platform so that we can break news first. By using a single ad-serving system across all of our web sites, mobile apps, and other digital assets, we are able to streamline our sales workflow, optimize yield, and deliver comprehensive sales opportunities across our digital footprint. Additionally, we are deploying DTC and OTT initiatives, such as STIRR, as well as our own content applications.
As our consumers’ sports viewing habits continue to evolve, we need to be positioned to offer our products to our consumers in the manner in which they desire to interact with sports. Our mission is to build a transformative, participatory digital sports platform, anchored by the most exclusive and relevant live professional games that provides fans a year-round opportunity to engage with content and communities they are most passionate about. Through this platform, which will include rights granted to each of our RSNs, which rights are also made available to our Distributors, to stream games and affiliated content over the internet (commonly referred to as TV Everywhere), we intend to offer DTC products and services.
We have agreements with MLB, NBA and NHL whereby we have been granted in-market and outer market TV Everywhere rights for each of our RSNs. To have access to streaming, our customers must be authenticated by logging in either through our Bally Sports app or our Distributor’s app using the customers’ Distributor username and password. In addition, pursuant to the same agreements with the NBA and NHL described above, we have been granted in-market and outer market DTC rights for each of our RSNs to stream games and affiliated content over the internet. The DTC rights for MLB are held directly by the MLB teams, who may grant those rights to the RSNs as part of our team rights agreements (subject to approval by MLB as to the determination of fair market value secured by the applicable team for such rights). As of December 31, 2021, our RSNs have secured DTC rights for five MLB teams. We intend to leverage these DTC rights as part of our DTC strategy. As part of our DTC strategy, we intend to work with MLB and seek to acquire DTC rights from teams with whom we have existing rights agreements.
The primary product, a streaming subscription, is expected to launch in the first half of 2022 and would make available certain of the content currently broadcasted on our RSNs on a subscription basis. In addition, during the second half of 2022, we plan to offer a features-only subscription. This product would include content offerings that do not include live MLB, NBA, or NHL games. Both of these products are expected to be available in monthly and annual plans. Our goal is to offer our consumers greater freedom, choice, and flexibility in terms of the content they want to receive.
Building a participatory platform also positions us to offer products and services in large and growing markets, including ecommerce, merchandising, digital collectibles, non-fungible tokens (NFTs), and “watch & play” gaming-oriented partnerships.
Additionally, we have continued to develop business opportunities, products, and services associated with NEXTGEN TV as discussed under Development of Next Generation Wireless Platform below.
Our RSNs seek to maximize growth of our advertising revenue. We believe that through higher quality non-game programming and multiplatform offerings, we will be able to drive incremental improvements in our RSNs' advertising revenues. We believe political advertising, which historically has been a relatively small portion of our RSNs' advertising revenues, could be an avenue to grow advertising dollars given our RSNs' large viewing audiences. Our live sports content is appealing to both national and local advertisers and is diverse across industries. In addition, we believe that the legalization of sports betting provides incremental opportunities for the business to generate higher advertising revenue due to increased advertising spend from certain customers, increased viewer engagement ratings, creation of the Bally Sports app and optimization of digital impressions.
In November 2020, we entered into agreements for a long-term strategic partnership with Bally's to combine Bally's vertically integrated, proprietary sports betting technology and expansive market access footprint with our premier portfolio of local broadcast stations and RSNs, STIRR, Tennis Channel and digital and over-the-air television network Stadium. This will create further gamification of live sports that will provide audiences a first-of-its-kind personalized and interactive viewing experience.
Strategic Realignment of Media Portfolio. We routinely review potential media acquisitions, dispositions, and swaps, or develop original networks and content. We expect to continue to assess acquisition and investment opportunities to complement our existing stations, RSNs, and other businesses. As we evaluate potential acquisitions and investments, we intend to focus on making disciplined, accretive acquisitions and investments that will complement our existing portfolio of television stations and RSNs while providing increased scale. At any given time, we may be in discussions with one or more media owners.
Digital and Internet Expansion of Broadcast Segment. Our digital properties, Compulse, STIRR, and NewsOn are innovative products and extensions of our core broadcast business that allow us to compete for digital, internet, network, and print impressions and revenues. We continue to seek additional opportunities to invest in emerging digital technologies, ad tech, and digital content companies that support and expand our digital capabilities and non-linear footprint.
Development of Next Generation Wireless Platform. In 2017, the FCC approved the use of NEXTGEN TV, a next generation broadcast transmission standard. NEXTGEN TV is capable of merging broadcast and broadband content and data services using over-the-air spectrum and Internet-provided data connectivity, allowing a mature broadcast industry to reinvent itself due to its mobility, addressability, capacity, IP connectivity, and conditional access.
NEXTGEN TV will allow us to use our spectrum for more than just video-formatted data as we do today. As a data-agnostic Internet Protocol (IP) based pipe, we also will be able to distribute data including text, audio, video, and software. While our one-to-many architecture will remain a strength, we will be able to deliver “the last mile” from program/data origination to the consumer's receiver device across a more robust system, connect legacy ATSC 1.0 televisions to NEXTGEN TV using broadcast hot spots and wi-fi functionality, and provide compatible data-offload service offerings in conjunction with certain 5G platforms. Among the many emerging opportunities are hyper-local news, weather, and traffic; dynamic ad insertion; geographic and demographic-targeted advertising; customizable content; better measurement and analytics; the ability to interface with devices connected to the Internet; flexibility to add streams as needed; substantially enhanced picture quality with immersive audio; connectivity to automobiles, including 3D mapping, telematics and infotainment; geo-location services; enhanced GPS; distance e-learning; data wholesale models; and other content delivery networks. Conditional access capabilities also permit broadcasters to offer secure “skinny-bundle” pay services as well as various video-on-demand type offerings. In addition, NEXTGEN TV provides new emergency and information capabilities, including advanced alerting functions which can provide crucial rich media including evacuation routes and device wake-up features. All of these features will be available to mobile and portable devices, allowing us to reach viewers virtually anywhere. In January 2020, we announced the formation of CAST.ERA, a joint venture with SK Telecom, focused on cloud infrastructure for broadcasting, ultra-low latency OTT broadcasting, and targeted advertising.
In order to bring this technology to the market, we have partnered with technology leaders to develop broadcasting solutions and services in the U.S. and globally. We have also formed a joint venture with other broadcasters, BitPath, to promote spectrum efficiency and innovation, aggregate and monetize underutilized spectrum capacity over which to deliver national services, and create opportunities such as robust video and data exchange. We continue to work with other NEXTGEN TV stakeholders to build and test the single frequency network tower infrastructure, develop systems to allow the convergence of NEXTGEN TV and 5G data delivery, and design NEXTGEN TV receiver chips for mobile, portable and fixed devices. We expect the implementation and adoption of NEXTGEN TV to occur over the next three years. In 2020, we and the industry began deployment of NEXTGEN TV capabilities on some of our own television facilities and in conjunction with other station operators in our markets, as well as non-Sinclair markets. To date, NEXTGEN TV is broadcasting in more than 40 markets, including 23 of our markets, covering 45% of the U.S. population and is expected to reach 75% of U.S. households by the summer of 2022. When completed, the country will have a lower-cost, world class wireless IP data distribution network capable of supporting multiple business models.
Monetization of Certain Intellectual Property Rights. We have developed, on our own and through our ONE Media, LLC joint venture, several NEXTGEN TV-related patents that we intend to monetize directly, through third-party agents, or through a patent pool designed to consolidate similar patents owned by independent licensors for licensing to equipment manufacturers.
FEDERAL REGULATION OF TELEVISION BROADCASTING
The ownership, operation, and sale of television stations are subject to the jurisdiction of the FCC, which acts under the authority granted by the Communications Act of 1934, as amended (the Communications Act). Among other things, the FCC assigns frequency bands for broadcasting; determines the particular frequencies, locations, and operating power of stations; issues, renews, revokes, and modifies station licenses; regulates equipment used by stations; adopts and implements regulations and policies that directly or indirectly affect the ownership, operation, and employment practices of stations; and has the power to impose penalties for violations of its rules and regulations of the Communications Act.
The following is a summary of certain provisions of the Communications Act and specific FCC regulations and policies. Reference should be made to the Communications Act, FCC rules, and the public notices and rulings of the FCC for further information concerning the nature and extent of federal regulation of broadcast stations.
License Grant and Renewal
Television stations operate pursuant to broadcasting licenses that are granted by the FCC for maximum terms of eight years and are subject to renewal upon application to the FCC. During certain periods when renewal applications are pending, petitions to deny license renewals can be filed by interested parties, including members of the public.
Although historically renewal of a license is granted in the vast majority of cases, even when petitions to deny are filed, there can be no assurance that the license of any station will be renewed or, if renewed, that the renewal terms will be for the maximum term permitted.
In the last completed license renewal cycle, all of our stations' license renewal applications were granted for the maximum term permitted. The current television license renewal application cycle began on June 1, 2020. On September 1, 2020, an individual filed a petition to deny the license renewal application of our Baltimore, MD station, WBFF(TV), and the renewal applications of two Baltimore stations with which we have a JSA or LMA, WUTB(TV) and WNUV(TV). We filed an opposition to the petition on October 1, 2020 with respect to WBFF(TV), and the petition remains pending at this time. We cannot predict when the FCC will take action on the petition or what the outcome of such action will be. To date, we have timely filed all renewal applications due for our stations during this renewal application cycle.
Ownership Matters
General. The Communications Act prohibits the assignment of a broadcast license or the transfer of control of a broadcast licensee without the prior approval of the FCC. In determining whether to permit the assignment or transfer of control of, or the grant or renewal of, a broadcast license, the FCC considers a number of factors pertaining to the licensee, including compliance with various rules limiting common ownership of media properties, the “character” of the licensee and those persons holding “attributable” interests in that licensee and compliance with the Communications Act’s limitations on foreign ownership. The FCC has indicated that in order to approve an assignment or transfer of a broadcast license the FCC must make an affirmative determination that the proposed transaction serves the public interest, not merely that the transaction does not violate its rules or shares factual elements with other transactions previously approved by the FCC, and that it may deny a transaction if it determines that the transaction would not be in the public interest.
The FCC generally applies its ownership limits to “attributable” interests held by an individual, corporation, partnership or other association. In the case of corporations holding, or through subsidiaries controlling, broadcast licenses, the interests of officers, directors and those who, directly or indirectly, have the right to vote 5% or more of the corporation’s stock (or 20% or more of such stock in the case of insurance companies, investment companies and bank trust departments that are passive investors) are generally attributable. In addition, pursuant to what is known as the equity-debt-plus rule, a major programming supplier or same-market media entity will be an attributable owner of a station if the supplier or same-market media entity holds debt or equity, or both, in the station that is greater than 33% of the value of the station’s total debt plus equity. Further, the Communications Act generally prohibits foreign parties from having more than a 20% interest (voting or equity) in a broadcast licensee or more than a 25% interest in the parent of that licensee without receiving prior FCC approval to exceed these limits. Following a Declaratory Ruling in 2013 in which the FCC indicated that it was open to considering proposals for foreign investment in broadcast licenses that exceed the 25% benchmark on a case by case basis, on September 29, 2016, the FCC adopted a Report and Order which among other things, (i) simplified the foreign ownership approval process for broadcast licensees seeking to exceed the 25% benchmark and (ii) modified the methodology a licensee may use to determine compliance with the foreign ownership rules.
We and our subsidiaries are domestic entities, and the members of the Smith family (who, as of December 31, 2021, together hold approximately 80.3% of the common voting rights of Sinclair) are all United States citizens. Our articles of incorporation contain limitations on alien ownership and control that are substantially similar to those contained in the Communications Act. Pursuant to the articles of incorporation, we have the right to repurchase alien-owned shares at their fair market value to the extent necessary, in the judgment of the Board of Directors, to comply with the alien ownership restrictions.
Additional ownership rules as currently in effect are as follows:
Radio / Television Cross-Ownership Rule and Newspaper / Broadcast Cross-Ownership Rule. Until February 2018, the FCC’s rules (i) limited the combined number of television and radio stations a party could own in a market to up to two television stations and six radio stations, depending on the number of independent media voices in the market (radio/television cross ownership rule), and (ii) prohibited the common ownership of a radio or television broadcast station and a daily newspaper in the same market (newspaper/broadcast cross ownership rule). On November 20, 2017, the FCC released an Order on Reconsideration (Ownership Order on Reconsideration) that, among other changes, eliminated the radio/television cross-ownership rule and the newspaper/broadcast cross-ownership rule. The rule changes adopted in the Ownership Order on Reconsideration became effective on February 7, 2018. The Ownership Order on Reconsideration was vacated and remanded by the U.S. Court of Appeals for the Third Circuit in September 2019, but the Supreme Court ultimately reversed the Third Circuit’s decision on April 1, 2021 and the Ownership Order on Reconsideration is currently in effect.
National Ownership Rule. The national television viewing audience reach cap is 39%. Under this rule, where an individual or entity has an attributable interest in more than one television station in a market, the percentage of the national television viewing audience encompassed within that market is only counted once. Additionally, because VHF stations (channels 2 through 13) historically covered a larger portion of the market than UHF stations (channels 14 through 51), only half of the households in the market area of any UHF station are included when calculating an entity’s national television viewing audience (commonly referred to as the UHF discount). On December 18, 2017, the FCC released a Notice of Proposed Rulemaking to examine the national ownership rule, including the UHF discount. The rulemaking proceeding remains pending. We cannot predict the outcome of the rulemaking proceeding.
The majority of the stations we own and operate, or to which we provide programming services, are UHF. With the UHF discount, our current reach (for FCC purposes) is approximately 24% of U.S. households. See Item 1A. Risk Factors for further discussion of the risk related to the outcome of rules governing the UHF discount.
Local Television Ownership Rule. A party may own television stations in adjoining markets, even if there is a digital noise limited service contour overlap between the two stations’ broadcast signals, and generally may own two stations in the same market (local television ownership rule) only (i) if there is no digital overlap between the stations; or (ii) not more than one station is among the top-four rated stations in the market (the top-four rule). The Ownership Order on Reconsideration modified the top-four rule to permit parties to own up to two top-four rated stations in the same market on a case-by-case basis.
Local Marketing and Outsourcing Agreements
Certain of our stations have entered into agreements with other stations in the same market, through which we provide programming and operating services pursuant to LMAs or provide sales services and other non-programming operating services pursuant to outsourcing agreements, such as JSAs and SSAs. LMAs are attributable where a licensee holds an attributable interest in a television station and (i) programs more than 15% of the weekly broadcast hours and/or (ii) sells more than 15% of the weekly advertising time on another television station in the same market. LMAs existing prior to November 5, 1996, which include all of our LMAs, are currently grandfathered until further FCC action. If the FCC were to eliminate the grandfathering of these LMAs, we would have to terminate or modify these LMAs. JSAs and SSAs currently are not attributable.
In August 2016, the FCC completed both its 2010 and 2014 Quadrennial Regulatory Reviews of its media ownership rules and issued an order (Ownership Order) which left most of the existing multiple ownership rules intact, but amended the rules to provide for the attribution of JSAs under certain circumstances. Certain existing JSAs were later grandfathered until 2025. The subsequent Ownership Order on Reconsideration eliminated the JSA attribution rule. If we are required to terminate or modify our LMAs or JSAs, our business could be adversely affected in several ways, including losses on investments and termination penalties. For more information on the risks, see Changes in rules on local marketing agreements under "The FCC's multiple ownership rules and federal antitrust regulation may limit our ability to operate multiple television stations in some markets and may result in a reduction in our revenue or prevent us from reducing costs. Changes in these rules may threaten our existing strategic approach to certain television markets." within Item 1A. Risk Factors and Changes in the Rules of Television Ownership, Local Marketing Agreements, Joint Sales Agreements, Retransmission Consent Negotiations, and National
Ownership Cap under Note 13. Commitments and Contingencies within the Consolidated Financial Statements for further discussion.
Antitrust Regulation. The Department of Justice (DOJ) and the Federal Trade Commission have increased their scrutiny of the television industry and have reviewed matters related to the concentration of ownership within markets (including LMAs and outsourcing agreements) even when ownership or the LMA or other outsourcing agreement in question is permitted under the laws administered by the FCC or by FCC rules and regulations. The DOJ takes the position that an LMA or other outsourcing agreement entered into in anticipation of a station’s acquisition with the proposed buyer of the station constitutes a change in beneficial ownership of the station which, if subject to filing under the Hart-Scott-Rodino Antitrust Improvements Act, cannot be implemented until the waiting period required by that statute has ended or been terminated.
On January 4, 2019, the Company received three civil investigative demands (CIDs) from the Antitrust Division of the DOJ. We believe the DOJ has similar civil investigative demands to other companies in our industry. In each CID, the DOJ requested that the Company produce certain documents and materials relating to JSAs in a specific DMA. On July 1, 2021, the Department of Justice Antitrust Division advised the Company that it had closed the JSA investigation with respect to the Company without action.
Satellite Carriage
The Satellite Home Viewer Act (SHVA), as extended by The Satellite Home Viewer Improvement Act of 1999 (SHVIA), the Satellite Home Viewer Extension and Reauthorization Act (SHVERA), the Satellite Television Extension and Localism Act of 2010 (STELA) and the Satellite Television Extension and Localism Act Reauthorization (STELAR) among other things, (i) allows satellite carriers to provide local television signals by satellite within a station market, and requires them to carry all local signals that asserted carriage rights in any market where they carry any local signals, (ii) requires all television stations to elect to exercise certain “must-carry” or “retransmission consent” rights in connection with their carriage by satellite carriers, and (iii) authorizes satellite delivery of distant network signals, significantly viewed signals and local low-power television station signals into local markets under defined circumstances. In adopting fiscal year 2020 appropriations legislation, Congress allowed STELAR to sunset on December 31, 2019 but made permanent STELAR’s (1) requirements that broadcasters and Distributors negotiate retransmission content in good faith and (2) distant signal satellite license provisions for recreational vehicles, truckers, tailgaters and short markets.
Must-Carry / Retransmission Consent
Television broadcasters are required to make triennial elections to exercise either certain “must-carry” or “retransmission consent” rights in connection with their carriage by cable systems in each broadcaster’s local market. By electing to exercise must-carry rights, a broadcaster demands carriage and receives a specific channel on cable systems within its DMA. Must carry rights are not absolute and are dependent on a number of factors which may or may not be present in a particular case. Alternatively, if a broadcaster chooses to exercise retransmission consent rights, it can prohibit cable systems from carrying its signal or grant the appropriate cable system the authority to retransmit the broadcast signal for a fee or other consideration. We have elected to exercise our retransmission consent rights with respect to all of our stations. In February 2015, the FCC issued an order implementing certain statutorily required changes to its rules governing the duty to negotiate retransmission consent agreements in good faith. Under these rules, unless the stations are directly or indirectly under common de jure control as permitted under the FCC regulations, a station may not delegate authority to negotiate or approve a retransmission consent agreement to a station located in the same market or to a third party that negotiates together with another television station in the same market, nor may stations in the same market facilitate or agree to facilitate coordinated negotiation of retransmission consent terms for their stations in that market, including through the sharing of information. In May 2020, the FCC revised its good faith negotiation rules to specify that certain small MVPDs can meet the obligation to negotiate in good faith by negotiating with a large station group through a qualified MVPD buying group and that large station groups have an obligation to negotiate in good faith with such MVPD buying groups.
Further, in September 2015, the FCC released a Notice of Proposed Rulemaking in response to a Congressional directive in STELAR to examine the “totality of the circumstances test” for good-faith negotiations of retransmission consent. The proposed rulemaking sought comment on new factors and evidence to consider in its evaluation of claims of bad faith negotiation, including service interruptions prior to a “marquee sports or entertainment event,” restrictions on online access to broadcast programming during negotiation impasses, broadcasters’ ability to offer bundles of broadcast signals with other broadcast stations or cable networks, and broadcasters’ ability to invoke the FCC’s exclusivity rules during service interruptions. On July 14, 2016, the FCC's then-Chairman Wheeler announced that the FCC would not, at that time, proceed to adopt additional rules governing good faith negotiations of retransmission consent. No formal action has yet been taken on this Proposed Rulemaking, and we cannot predict if the FCC will terminate the Rulemaking or take other action.
Network Non-Duplication / Syndicated Exclusivity / Territorial Exclusivity
The FCC’s syndicated exclusivity rules allow local broadcast television stations to demand that cable operators black out syndicated non-network programming carried on “distant signals” (i.e., signals of broadcast stations, including so-called “superstations,” which serve areas substantially removed from the cable systems’ local community). The FCC’s network non-duplication rules allow local broadcast, network affiliated stations to require that cable operators black out duplicate network programming carried on distant signals. Both rules are subject to various exceptions and limitations. In a number of markets in which we own or program stations affiliated with a network, a station that is affiliated with the same network in a nearby market is carried on cable systems in our markets. Such significantly viewed signals are not subject to black out pursuant to the FCC’s network non-duplication rules. The carriage of two network stations on the same cable system could result in a decline of viewership, adversely affecting the revenues of our owned or programmed stations. In March 2014, the FCC issued a Report and Order and Further Notice of Proposed Rulemaking, requesting comments on whether it has authority to, and should, eliminate or modify its network non-duplication and/or syndicated exclusivity rules. This proceeding is pending and we cannot predict when or how the FCC will resolve that rulemaking. The FCC’s syndicated exclusivity rules allow local broadcast television stations to demand that cable operators black out syndicated non-network programming carried on “distant signals” (i.e., signals of broadcast stations, including so-called “superstations,” which serve areas substantially removed from the cable systems’ local community). The FCC’s network non-duplication rules allow local broadcast, network affiliated stations to require that cable operators black out duplicate network programming carried on distant signals. Both rules are subject to various exceptions and limitations. In a number of markets in which we own or program stations affiliated with a network, a station that is affiliated with the same network in a nearby market is carried on cable systems in our markets. Such significantly viewed signals are not subject to black out pursuant to the FCC’s network non-duplication rules. The carriage of two network stations on the same cable system could result in a decline of viewership, adversely affecting the revenues of our owned or programmed stations. In March 2014, the FCC issued a Report and Order and Further Notice of Proposed Rulemaking, requesting comments on whether it has authority to, and should, eliminate or modify its network non-duplication and/or syndicated exclusivity rules. This proceeding is pending and we cannot predict when or how the FCC will resolve that rulemaking.
Digital Television
FCC rules provide that television broadcast licensees may use their digital television (DTV) channels for a wide variety of services such as HD television, multiple standard definition television programming, audio, data, and other types of communications, subject to the requirement that each broadcaster provide at least one free video channel equal in quality to the current technical standard and further subject to the requirement that broadcasters pay a fee of 5% of gross revenues from any DTV ancillary or supplementary service for which there is a subscription fee or for which the licensee receives a fee from a third party. These rules could impact the profitability related to ancillary or supplementary services provided as discussed within Development of Next Generation Wireless Platform under Operating Strategy above. In addition, possible new rules with respect to multicasting as discussed within Other Pending Matters below could impact the way we currently use our DTV channels and the services we are able to offer on those channels.
Programming and Operations
The Communications Act requires broadcasters to serve the “public interest.” The FCC has relaxed or eliminated many of the more formalized procedures it had developed in the past to promote the broadcast of certain types of programming responsive to the needs of a station’s community of license. FCC licensees continue to be required, however, to present programming that is responsive to the needs and interests of their communities and to maintain certain records demonstrating such responsiveness. Complaints from viewers concerning a station’s programming may be considered by the FCC when it evaluates renewal applications of a licensee, although such complaints may be filed at any time and generally may be considered by the FCC at any time. Stations also must pay regulatory and application fees and follow various rules promulgated under the Communications Act that regulate, among other things, political advertising, sponsorship identifications, obscene and indecent broadcasts, and technical operations, including limits on radio frequency radiation. In addition, television licensees have obligations to create and follow employment outreach programs, provide a minimum amount of programming for children, comply with rules relating to the emergency alert system (EAS), maintain an online public inspection file, and abide by regulations specifying requirements to provide closed captions for its programming. FCC licensees are, in general, responsible for the content of their broadcast programming, including that supplied by television networks. Accordingly, there is a risk of being fined as a result of our broadcast programming, including network programming.
Other Pending Matters
Congress and the FCC have under consideration, and in the future may consider and adopt, new laws, regulations, and policies regarding a wide variety of matters that could affect, directly or indirectly, the operation, ownership, and profitability of our broadcast stations, result in the loss of audience share and advertising revenues for our broadcast stations, and affect our ability to acquire additional broadcast stations or finance such acquisitions.
On November 16, 2017, the FCC adopted a Report and Order and Further Notice of Proposed Rulemaking authorizing the voluntary deployment of NEXTGEN TV and adopting rules to afford broadcasters flexibility to deploy NEXTGEN TV based transmissions while minimizing impact on consumers and industry stakeholders and seeking comment on certain additional matters. The Report and Order took effect on March 5, 2018, except for certain rules that required approval from the Office of Management and Budget which became effective on July 17, 2018. On June 3, 2020, the Commission adopted the Second Report and Order and Order on Reconsideration, providing additional guidance to broadcasters deploying NEXTGEN TV. Rule changes associated with the Second Report and Order and Order on Reconsideration became effective on August 17, 2020. On November 9, 2020, the National Association of Broadcasters filed a Petition for Declaratory Ruling and Petition for Rulemaking requesting that the FCC (1) clarify that its existing regulatory framework for the hosting of simulcast primary programming streams also applies to simulcast multicast streams, and (2) expand the application of these rules to cover the transmission of ATSC 1.0 multicast streams regardless of whether those streams are simulcast in ATSC 3.0. On November 5, 2021, the FCC released a Second Further Notice of Proposed Rulemaking seeking comment on these multicast host station licensing issues. Comments are due by February 11, 2022 and reply comments are due by March 14, 2022. We cannot predict what the outcome of the proceeding will be.
Other matters that could affect our broadcast properties include technological innovations and developments generally affecting competition in the mass communications industry, such as DTC offerings, direct television broadcast satellite service, Class A television service, the continued establishment of wireless cable systems and low power television stations, digital television technologies, the internet and mobility, and portability of our broadcast signal to hand-held devices.
Congress authorized the FCC to conduct so-called “incentive auctions” to auction and re-purpose broadcast television spectrum for mobile broadband use. In the repacking process associated with the auction, the FCC reassigned some stations to new post-auction channels. Full-power and Class A stations were expected to complete the transition to their post-auction channels in one of ten phases between November 30, 2018 and July 3, 2020. All of our stations have transitioned to new channels. The legislation authorizing the incentive auction provides the FCC with a $1.75 billion fund to reimburse reasonable costs incurred by stations that are reassigned to new channels in the repack. Congress allocated an additional $1 billion to the reimbursement fund in the FCC Reauthorization Act of 2018. See Broadcast Incentive Auction under Note 2. Acquisitions and Dispositions of Assets within the Consolidated Financial Statements for further discussion of our participation, results, and post-auction process.
On December 13, 2018, the FCC released a Notice of Proposed Rulemaking to initiate the 2018 Quadrennial Regulatory Review of the FCC’s broadcast ownership rules, pursuant to the statutory requirement that the FCC review its media ownership rules every four years to determine whether they remain “necessary in the public interest as the result of competition.” The proposed rulemaking generally seeks comment on, among other things, whether the, the local television ownership rules (including the top-four rule and the eight voices test), should be retained, modified, or eliminated. With respect to the local television ownership rule specifically, among other things, the proposed rulemaking seeks comment on possible modifications to the rule’s operation, including the relevant product market, the numerical limit, the top-four prohibition; and the implications of multicasting, satellite stations, low power stations and the next generation standard. In addition, the proposed rulemaking examines further several diversity related proposals raised in the 2014 Quadrennial Regulatory Review. The extended public comment period closed on October 1, 2021, and the rulemaking remains pending.
Other Considerations
The preceding summary is not a complete discussion of all provisions of the Communications Act or other congressional acts or of the regulations and policies of the FCC, or in some cases, the DOJ. For further information, reference should be made to the Communications Act, other congressional acts and regulations, and public notices circulated from time to time by the FCC, or in some cases, the DOJ. There are additional regulations and policies of the FCC and other federal agencies that govern political broadcasts, advertising, equal employment opportunity, and other matters affecting our business and operations.
ENVIRONMENTAL REGULATION
Prior to our ownership or operation of our facilities, substances or waste that are, or might be considered, hazardous under applicable environmental laws may have been generated, used, stored, or disposed of at certain of those facilities. In addition, environmental conditions relating to the soil and groundwater at or under our facilities may be affected by the proximity of nearby properties that have generated, used, stored, or disposed of hazardous substances. As a result, it is possible that we could become subject to environmental liabilities in the future in connection with these facilities under applicable environmental laws and regulations. Although we believe that we are in substantial compliance with such environmental requirements and have not in the past been required to incur significant costs in connection therewith, there can be no assurance that our costs to comply with such requirements will not increase in the future or that we will not become subject to new governmental regulations, including those pertaining to potential climate change legislation, that may impose additional restrictions or costs on us. We presently believe that none of our properties have any condition that is likely to have a material adverse effect on our consolidated balance sheets, consolidated statements of operations, or consolidated statements of cash flows.
COMPETITION
Our stations and RSNs compete for audience share and advertising revenue with other television stations and cable networks in their markets, as well as with other advertising media such as Distributors, other OTT distributors, cable networks, video on-demand, radio, newspapers, magazines, outdoor advertising, transit advertising, telecommunications providers, direct mail, internet, and other digital media.
Stations and RSNs compete for audience share primarily on the basis of program popularity, which has a direct effect on advertising rates.
Our network affiliated stations are largely dependent upon the performance of network provided programs in order to attract viewers. Non-network time periods are programmed by the station primarily with syndicated programs purchased for cash, cash and barter, or barter-only, as well as through self-produced news, public affairs programs, live local sporting events, paid-programming, and other lifestyle and entertainment programming. We also compete for programming which involves negotiating with national program distributors or syndicators that sell first-run and rerun packages of programming. Our stations compete for access to those programs against in-market broadcast station competitors for syndicated products and with national cable networks. Public broadcasting stations generally compete with commercial broadcasters for viewers, but not for advertising dollars.
Competition in the television broadcasting industry occurs primarily in individual DMAs. Generally, a television broadcasting station in one DMA does not compete with stations in other DMAs. Our stations are located in highly competitive DMAs. Distributors can increase competition for viewership and broadcast television advertising inventory by carrying additional cable network channels within the same DMA as the broadcast television stations. Distributors sell advertising on these cable networks to local advertisers. These narrow cable network channels are typically low rated, and, as a result, advertisements are inexpensive to the local advertisers. Distributors may also connect two or more cable systems together, also called an interconnect, which gives advertisers the option to reach more households in a market with a single buy. In addition, certain of our DMAs are overlapped by over-the-air stations from adjacent DMAs and Distributors of stations from other DMAs, which tends to spread viewership and advertising expenditures over a larger number of television stations. In addition, there is significant increased competition with Google, Facebook, social media, OTT offerings and the multitude of other digital offerings that air video advertisements and sell programmatically to agencies and advertisers. Distributor and OTT offerings have the ability to either blanket the market or target their advertising which broadcast stations do not.
Because the loyalty of the sports viewing audience to a sports programming network is primarily driven by loyalty to a particular team or teams, access to adequate sources of sports programming is critical to the RSNs. The RSNs compete for telecast rights for teams or events with national or regional cable networks that specialize in or carry sports programming; television ‘‘superstations’’ which distribute sports and other programming by satellite; local and national commercial broadcast television networks; independent syndicators that acquire and resell such rights nationally, regionally and locally; mobile internet providers; and other OTT distributors. Some of these competitors may own or control, or are owned or controlled by, sports teams, leagues or sports promoters, which gives them an advantage in obtaining telecast rights for such teams or sports. Distributors may also contract directly with the sports teams in their local service areas for the right to distribute games on their systems. The RSNs may also compete with Internet-based distributors of sports programming. The increasing amount of sports programming available on a national basis, including pursuant to national rights arrangements, as part of league-controlled sports networks (e.g., NBA TV and NHL Network), and in out-of-market packages (e.g., NBA’s League Pass and NHL Center Ice), may have an adverse impact on the RSNs' competitive position as they compete for distribution and for viewers.
The RSNs also compete with other programming networks to secure desired programming, although some of the RSNs programming is generated internally through their efforts in original programming. Competition for programming will increase as the number of programming networks increases. Other programming networks that are affiliated with programming sources such as movie or television studios, film libraries or sports teams may have a competitive advantage over the RSNs in this area.
Advertising rates are based upon factors which include the size of the market in which the station and RSNs operate; a program or team's popularity among the viewers that an advertiser wishes to attract; the number of advertisers competing for the available time; the demographic makeup of the market served by the station and RSNs; the availability of alternative advertising media in the DMA; the aggressiveness and knowledge of the sales forces in the market to call on and understand their client’s need; and development of projects, features, and programs that tie advertiser messages to programming. We believe that our sales and programming strategies allow us to compete effectively for advertising revenues within the stations' and RSNs' markets.
Further, the competition of obtaining distribution is highly competitive. Our stations and RSNs face competition from other television stations and cable networks for the right to be carried by a particular distributor, and for the right to be carried on the service tier that will attract the most subscribers. Once one of our stations or RSNs obtains distribution, that network competes for viewers not only with the other channels available through the distributor, but also with over-the-air television, pay-per-view channels and video-on-demand channels, as well as online services, mobile services, radio, print, streaming services, and other sources of media and information, sporting events and entertainment. Important to our success in each area of competition the station and RSNs faces are the price the station or RSNs charges for its carriage; the quantity, quality and variety of programming offered and the effectiveness of its marketing efforts.
Our stations' and RSNs' ability to successfully compete with other television stations and cable networks for distribution may be hampered because the Distributors, through which distribution is sought, may be affiliated with other television stations or cable networks. Those Distributors may place their affiliated television station or cable network on a more desirable tier, thereby giving the affiliated television station or cable network a competitive advantage over our stations' or RSNs' own programming.
Moreover, technology advances and regulatory changes affecting programming delivery through fiber optic lines, video compression, and new wireless uses could lower entry barriers for new video channels and encourage the further development of increasingly specialized “niche” programming. Telecommunication companies are permitted to provide video distribution services, on a common carrier basis, as “cable systems” or as “open video systems,” each pursuant to different regulatory schemes. Additionally, OTT services allow consumers to consume programming on-demand through access to the Internet and without a subscription with a Distributor. We continue to compete with the OTT services for viewership.
DTV technology allows our stations to provide viewers multiple channels of digital television over each of our existing standard digital channels, to provide certain programming in HD television format and to deliver other channels of information in the forms of data and programming to the internet, PCs, smart phones, tablet computers, and mobile and streaming devices. These additional capabilities may provide us with additional sources of revenue, as well as additional competition.
The financial success of our stations' and RSNs' also depends in part upon unpredictable and volatile factors beyond our control, such as viewer preferences, the strength of the advertising market, the quality and appeal of competing programming and the availability of other entertainment activities.
The DTC products and services we intend to offer through our local sports segment represents a new consumer offering for which we have limited prior experience. There is intense competition among subscription services, including increasing competition in sports-related subscription offerings. As a result, our success will be dependent on a number of factors, including our ability to acquire DTC rights from the 11 MLB teams with which we currently do not have DTC rights; our ability to appropriately price our subscription offerings to optimize the DTC opportunity, while not contributing to further increases in the loss of subscribers to our RSNs; offering high quality content and programming as part of our subscription packages, including creating or acquiring new content to compliment live games; and ensuring a high level of consumer engagement, which is necessary for us to maximize participation-based revenue.
We believe we compete favorably against other television stations and cable networks because of our management skill and experience, our ability historically to generate revenue share greater than our audience share, our network affiliations and program service arrangements, and our local program acceptance. In addition, we believe that we benefit from the operation of multiple broadcast and network properties, affording us certain non-quantifiable economies of scale and competitive advantages in the purchase of programming.
ENVIRONMENTAL, SOCIAL AND GOVERNANCE ACTIVITIES AND PRACTICES
We have a long history of supporting environmental, social, and governance (ESG) activities and, in the past few years, we have taken steps to better measure and quantify our progress in these areas. In addition to our ESG Committee, which is made up of executive leadership, we have also formed working groups in the areas of sustainability, employee experience, and diversity and inclusion.
Human Capital
We believe that our ability to attract and retain the best employees is a cornerstone of our vision of connecting people with content everywhere. As of December 31, 2021, we had approximately 11,500 employees, including part-time and temporary employees. Approximately 1,800 employees are represented by labor unions under certain collective bargaining agreements.
In 2021, we were named one of the Baltimore Sun's 2021 Top Workplaces, an award granted annually to the most dynamic and supportive local companies, based solely on independent employee surveys. We were honored as a Top Workplaces award winner in the large employer category for companies with 400+ employees in the Baltimore region, as well as a 2021 Top Workplace for Managers as a place where employees can learn, grow, and be supported and mentored by their managers at various levels throughout the company.
Corporate Culture. We are committed to maintaining a safe, ethical, and harassment free workplace. We recognize that our success as a team, and in our communications with one another, is grounded in our ability to trust team members to be fully engaged and to do the right thing. We support trusting relationships by offering clear guidance, structure, resources, and accountability. To this end, we maintain governance policies that apply to all of our directors, officers, and employees, including a code of business conduct and ethics, employee safety program, and no harassment and open-door policies. These policies are intended to help identify, provide mechanisms for reporting, and provide a framework for solving potential issues. These policies are reviewed and updated by management, together with the Board, as our needs grow and change and upon stakeholder feedback and changes in applicable laws, regulations, and stock exchange requirements.
We value and support diversity and inclusion at all levels. Diversity and inclusion have been fundamental from our very beginning and we take pride in being an equal opportunity employer. Diversity, inclusion, equal employment opportunity, and strong anti-discrimination policies go hand-in-hand. Our Diversity and Inclusion Statement establishes clarity and alignment throughout our organization, at all levels, regarding how we connect with each other by embracing diversity and promoting inclusion among our employees, viewers, and customers. All employees are asked to honor the intent of our Diversity and Inclusion Statement in their daily activities and decisions and are required to take part in workplace diversity training.
Over several decades, our local television stations have built recruiting and outreach programs that encourage diversity in our workforce. Our activities are designed to ensure broad outreach to potential applicants by widely disseminating information concerning job vacancies, providing notification to community groups, attending diverse job fairs, participating in other various recruitment outreach activities, and providing training to managers on equal employment opportunity and illegal discrimination.
In the past year, we formed the Employee Experience and Diversity and Inclusion working groups, developed mission statements for these areas, and emphasized focus on best practices to attract, retain and develop employees. We increased our recruiting outreach efforts to historically black colleges and universities, launched an employee reward and recognition program, and are in the process of filling our diversity-focused position of Culture and Talent Development Manager.
Employee Engagement. We regularly gather feedback from employees to gain an understanding of and improve our employee experience and to foster an engaged workforce. This feedback is used to help create new, and refine existing, employee related programs and processes. Recently, we gathered results from a company-wide Remote Work Survey in order to gain insights about our business during the COVID-19 pandemic. 90% of responding employees agreed that they have been well-supported during the COVID-19 pandemic. In our 2021 "Sinclair Voice of the Employee Survey," 83% of our employees reported that they are happy in their job and 84% felt like they are able to balance their work and other priorities in life.
Our Innovation project is a strategic lever that drives revenue, reduces waste, and engages employees to serve our customers and shareholders as a pioneer in the industry. We believe that the "next big idea" could come from anyone, anywhere and so, in 2020 began an effort to gather innovation ideas from employees company-wide. At our fourth annual Innovation Summit in December 2021, we brought together over 150 innovators to learn, expand our thinking, celebrate, and spark new and different ideas.
Health, Safety, and Wellness. The health, safety, and wellness of our employees is vital to our success. We maintain and continuously enhance affordable health care and recently reduced the waiting period for benefits to begin for new employees, improved paid time off benefits, and expanded the use of sick leave to allow for when employees cannot work due to child or dependent care issues. We continuously work to improve our practices, policies, and benefits to make meaningful impacts on our employees professional and personal lives. We also sponsor an employee assistance program aimed at enhancing the physical well-being, as well as the financial and mental well-being, of our employees.
In response to the COVID-19 pandemic, we implemented safety protocols to protect our employees, including many of our employees continuing to work remotely while employees who cannot work remotely continue to follow strict Center for Disease Control protocols such as physical distancing, monitoring and daily reporting on the health and symptoms of employees and members of the employees’ households, wearing face coverings, limiting interaction, and limiting non-essential travel.
Compensation. Our employee compensation includes market-competitive pay, a 401(k) plan, an employee stock purchase plan, healthcare benefits, paid time off and family leave, and employer paid life and disability insurance. We continue to improve our compensation offerings. In the last few years, we increased the number of hours of eligible vacation time rollover, increased our 401(k) match for all employees, and increased our minimum hourly wage to $15 for all applicable employees, including all employees whose minimum wage was previously tied to state and federal mandates. In 2022, we again offered our employees the opportunity for additional time off through the Vacation Exchange Program. In response to the COVID-19 pandemic, in 2020 we allowed eligible employees to cash out up to 40 vacation hours to assist with family hardships and we established a multimillion-dollar emergency fund to provide support to our RSNs freelancers, as the cancellation of certain live sports deprived these freelancers of work.
Social Responsibility
As a local news broadcaster, we believe it is our responsibility to raise issues of local importance, through deep investigative reporting at our stations, and provide critical and relevant information to our viewers, including crucial news updates during potentially life-threatening situations when our viewers need them most. During 2021, our stations received 300 journalism awards, including 77 regional Emmy awards, and 37 Regional and one National RTDNA Edward R. Murrow awards which are awarded to recognize local and national news stories that uphold ethics, demonstrate technical expertise, and exemplify the importance and impact of journalism as a service to the community. We provide our viewers with "Town Halls," which bring together our viewers to discuss major local and national topics. In 2021, we produced 162 Town Halls covering a variety of topics. We organized 14 political debates and our stations produced 12 discussions on crime, police funding, and the rights of the African American community, over 20 productions on COVID-19, and over 20 Baltimore Town Halls, focused in each Councilmanic District. Since launching our commitment to give a voice to our viewers, our Town Halls have produced over 990 hours to educate and address the needs of our audience.
We believe it is our responsibility to get involved in our local communities. During 2021, we partnered with the Salvation Army to raise funds for those impacted by tornadoes through the "Sinclair Cares: Tornado Relief" campaign and to urge our viewers to help increase U.S. blood supplies by donating blood, time, or financial contributions through the "Sinclair Cares: Roll Up Your Sleeves" campaign. Our partnership with the Salvation Army will continue into 2022 with events to raise funds for local communities in need. Through the "Sinclair Cares: Supporting All Veterans" campaign, we partnered with Disabled American Veterans (DAV) to encourage our viewers and employees to support veterans in their communities or provide financial contributions to help DAV offer free support services to more than a million veterans across the U.S. each year. Our stations and regional sports networks also sponsor countless philanthropic campaigns and events such as health expos, parades, and blood drives in their local markets and contribute to local charities. We encourage not only our stations and regional sports networks, but also our employees to engage in the communities in which we serve and live. Through our continued partnership with the Salvation Army and over 360 local partner organizations in the communities in which we operate, and with the support of our local TV stations, regional sports networks, and digital properties, we helped to raise over $38 million in 2021 for non-profit organizations, schools, agencies, and local disaster relief, including our direct donations of more than $600 thousand; collected more than 3.4 million pounds of food; provided more than 1.5 million meals; and collected toys, backpacks, school supplies, units of bloods, and coats for those in need. In addition, we donated more than 1,500 hours, or approximately $13.0 million, of airtime.
In 2016, we established our Diversity Scholarship Fund to provide support to college students demonstrating a promising future in the broadcast industry. In 2021, we selected seven winning applicants for the scholarship. Since launching, Sinclair has distributed more than $100,000 to students from underrepresented minority groups who need financial assistance to complete their education.
Environmental Responsibility
Our business primarily relates to providing content to consumers digitally, so while we are not responsible for much in the way of direct emissions from controlled sources, we are a significant user of electricity and do recognize that we all have a role to play in protecting the environment. We have accelerated actions within our organization to lessen our use of electricity over time and to measure and eventually report on our electricity usage. Our sustainability group is tasked with finding ways to help lower our carbon footprint through lowering our electricity consumption, purchasing greener supplies, and recycling. One such initiative is the efforts we are undertaking in proactively replacing our existing lighting with LED lighting, which has the potential to provide approximately 14 Gigawatt hours of annualized energy savings. We are also in the process of replacing HVAC equipment and transmitters, which are also expected to generate meaningful electricity savings. Since 2017, we have installed 105 new, energy efficient television transmitters, which are typically 25% more energy efficient than the units that they replace and generate less waste heat, and are currently installing, or have plans to install, an additional 44 during 2022 and 2023. Throughout the organization, we are seeking to reduce the use of paper products and, whenever possible, recycling paper, electronics, and other items. We were one of only 19 organizations recently recognized by Office Depot for being a leader in green purchasing, recognizing our high degree of expenditures with eco-friendly attributes such as recycled content, energy-efficiency, and reduced use of harsh chemicals. In 2021, we launched a contest within the Company to collect ideas from all our employees on ways that we can positively impact the environment and promote sustainability. The winning idea, as voted on by the employees, was to implement a battery recycling program. We are starting a pilot program at a number of our stations to recycle batteries and, if the pilot proves successful, hope to roll out a battery recycling program across the Company by the end of 2022.
In addition to our direct efforts to reduce our impact on the environment, we produce high quality news to increase our viewers' general awareness of environmental issues and programs by providing them information on how they can participate in improving environmental sustainability.
Governance
Sinclair takes corporate governance and responsibilities to its stakeholders very seriously. We remain committed to finding the best representation to drive success in the organization in the years ahead. Diversity of thought, skills, background, and experience are important elements the Company looks for in its leadership team. In 2021, we took a number of actions to strengthen the governance of our company. We hired a Chief Compliance Officer and made some changes to our Board of Directors structure, including adding a regulatory committee and a nominating and corporate governance committee. We also announced our intent to increase the size of our Board by two members, from nine to eleven, to reflect further diversity and independence as we move forward in an evolving industry. One of the two positions was filled by Laurie Beyer in 2021, a new independent director and our first female Board member.
Cybersecurity is a governance risk that remains a high priority. Both before and after the ransomware incident in October 2021 described under Item 1A. Risk Factors - We have experienced a cyber security breach in the past and may be vulnerable to future security breaches, data privacy, and other information technology failures that could have a material adverse effect on our financial performance and operating results and disrupt our operations, we made investments and took steps to enhance our existing cybersecurity measures and governance. We hired our first Chief Information Security Officer to lead our information security program across all business functions. We implemented an endpoint detection and response tool, engaged an additional cybersecurity firm to provide continuous monitoring of our network, and deployed additional technical safeguards. We instituted security evaluation measures for our vendors, developed and deployed metrics and methods to measure the efficacy of our cyber security initiatives and data, and launched a new security training and awareness platform. We have recently increased the frequency of our security training, are strengthening our security incident management policies, and are currently shaping a data protection initiative for upcoming deployment in 2022. Since the ransomware incident, our Board of Directors formed a cybersecurity subcommittee to provide greater oversight of the Company’s cybersecurity measures and preparedness. The cybersecurity subcommittee has received regular updates from Company management regarding the status of the response efforts and future cybersecurity plans, enabling the subcommittee to provide oversight of those issues. The Company is continuing to execute its plans to strengthen its existing cybersecurity defenses and intends to make further investments.
AVAILABLE INFORMATION
We regularly use our website as a source of company information and it can be accessed at www.sbgi.net. We make available, free of charge through our website, our annual report on Form 10-K, quarterly reports on Form 10-Q, current reports on Form 8-K, and amendments to those reports filed or furnished pursuant to Section 13(a) or 15(d) of the Exchange Act as soon as reasonably practicable after such documents are electronically submitted to the SEC, who also makes these reports available at http://www.sec.gov. We intend to comply with the requirements of Item 5.05 of Form 8-K regarding amendments to and waivers under the code of business conduct and ethics applicable to our Chief Executive Officer, Principal Financial Officer and Principal Accounting Officer by providing such information on our website within four days after effecting any amendment to, or granting any waiver under, that code, and we will maintain such information on our website for at least twelve months. In addition, a replay of each of our quarterly earnings conference calls is available on our website until the subsequent quarter’s earnings call. The information contained on, or otherwise accessible through, our website is not a part of this annual report on Form 10-K and is not incorporated herein by reference.
ITEM 1A. RISK FACTORS
You should carefully consider the risks described below before investing in our securities. The risks described below, along with risks not currently known to us or that we currently believe are immaterial, may impair our business operations and our liquidity in an adverse way.
Risks relating to our operations
The COVID-19 pandemic or the future outbreak or pandemic of any other highly infectious or contagious diseases, could have a material and adverse effect on or cause disruption to our business or financial condition, results of operations and cash flows, the economy, our advertisers, our leagues and teams, viewership, Distributors, and their subscribers.
On March 11, 2020, the World Health Organization declared COVID-19 a global pandemic. Over the course of 2020, 2021, and continuing into 2022, the COVID-19 pandemic and measures put in place to prevent the spread of the virus has had a significant negative impact on the global economy, including many industries in which our customers operate, curtailing advertising revenue. The pandemic has also resulted in disruptions to professional sports resulting in fewer games produced during the year, which negatively impacted advertising and distribution revenue.
The impact of COVID-19 on future periods will depend significantly on the duration and potential cyclicality of the health crisis, the related public policy actions taken by federal, state, and local governments to limit the length and severity of the global economic slowdown, and the timing for, and success of, the COVID-19 vaccination program. COVID-19 (or a future pandemic) could have a material and adverse effect on or cause disruption to our business or financial condition, results of operations and cash flows due to, among other factors:
•the suspension, and possible cancellation, of some or all of the MLB, NBA and NHL regular seasons and/or playoffs, and tennis tournaments;
•the requirement of our RSNs to pay professional sports team minimum rights fees, but thereafter being unable to obtain rebates from sports teams for fewer games played;
•the need to reimburse Distributors’ affiliation fees related to canceled professional sporting events;
•loss of advertising revenue due to (i) postponement or cancellation of professional sporting events, (ii) reluctance of advertisers to purchase advertising spots due to reduced consumer spending as a result of shelter in place and stay at home orders, or lower audience engagement, (iii) potential reduced need for advertisers to advertise for certain goods or services with low supply, due to interruptions in the supply chain, and (iv) adverse business conditions affecting our customers, including our advertisers’ going out of business;
•the significant disruption to the operations of the professional sports leagues, Distributor subscriptions and carriage agreements, and the macroeconomy caused by COVID-19 may result in the recognition of further impairment charges on our definite-lived intangible assets;
•we may be unable to access debt and equity capital on favorable terms, if at all, or a severe disruption and instability in the global financial markets or deterioration in credit and financing conditions may affect our access to capital
necessary to fund business operations, pursue acquisition and development opportunities, refinance existing debt, and increase our future interest expense;
•the financial impact of COVID-19 could negatively affect our future ability to pay dividends, and comply with financial and other covenants of the term loans and revolving credit agreements of STG and DSG (individually, the STG Bank Credit Agreement and the DSG Bank Credit Agreement, and together, the Bank Credit Agreements), the indentures governing STG’s and DSG’s outstanding notes, and the accounts receivable securitization facility (A/R Facility), and the failure to comply with such covenants could result in a default that accelerates our obligation to repay such indebtedness;
•the potential effects of COVID-19 on our workforce, including the impact in our operations because employees either contract COVID-19 or leave the workforce, increased health care costs, increased wages due to wage inflation and an inability to attract and retain a quality workforce; and
•cybersecurity and operational risks as a result of work-from-home arrangements.
The extent to which COVID-19 impacts our operations and those of our sports team partners, Distributors and advertisers will depend on future developments, which are highly uncertain and cannot be predicted with confidence, including the scope, severity and duration of the outbreak, the actions taken to contain the outbreak or mitigate its impact, and the direct and indirect economic effects of the outbreak and containment measures, among others.
A prolonged imposition of mandated closures or other social-distancing guidelines may adversely impact the ability of our sports team partners, Distributors and advertisers to generate sufficient revenues, and could force them to default on their obligations to us or result in their bankruptcy or insolvency. The rapid development and fluidity of the pandemic precludes any prediction as to the ultimate adverse impact on us. Nevertheless, COVID-19 presents material uncertainty and risk with respect to our performance, business or financial condition, results from operations and cash flows.
Our strategic acquisitions and investments could pose various risks and increase our leverage.
We have pursued and intend to selectively continue to pursue strategic acquisitions and investments, subject to market conditions, our liquidity, and the availability of attractive acquisition and investment candidates, with the goal of improving our business. We may not be able to identify attractive acquisitions or investment targets, or we may not be able to fund additional acquisitions or investments in the future.
Acquisitions involve inherent risks, such as increasing leverage and debt service requirements and combining company cultures and facilities, which could have a material adverse effect on our results of operations and could strain our human resources. For example, as a result of our acquisition of the Acquired RSNs in August 2019, we borrowed approximately $8.2 billion, substantially increasing our leverage and debt service requirements. Additionally, we may not be able to successfully implement effective cost controls, achieve expected synergies, or increase revenues as a result of an acquisition. In addition, future acquisitions may result in our assumption of unexpected liabilities, may result in the diversion of management's attention from the operation of our core business and may limit our ability to generate higher returns elsewhere.
Certain acquisitions, such as television stations, are subject to the approval of the FCC and potentially, other regulatory authorities, such as the DOJ. The need for FCC and other regulatory approvals could restrict our ability to consummate future transactions and potentially require us to divest certain television stations or businesses if the FCC or other regulatory authority believes that a proposed acquisition would result in excessive concentration in a market, even if the proposed combinations may otherwise comply with FCC ownership limitations or other regulations. There can be no assurance that future acquisitions will be approved by the FCC or other regulatory authorities, or that a requirement to divest existing stations or businesses will not have an adverse outcome on the transaction.
If the rate of decline in the number of subscribers to Distributor services increases or these subscribers shift to other services or bundles that do not include our programming networks, there may be a material adverse effect on our revenues.
During the last few years, the number of subscribers to Distributor services in the United States has been declining, and the rate accelerated in 2021, as technological advancements have driven changes in consumer behavior and have empowered consumers to seek more control over when, where and how they consume news, sports and other entertainment, including through the so-called “cutting the cord” and other consumption strategies. The Distributor subscriber decline has led to a decline in subscribers from some of our stations and networks. For example, subscribers of the Acquired RSNs (excluding YES Network) fell by high single digits percent during the year ended December 31, 2021 on a same Distributor basis. In addition, Distributors have
introduced, marketed and/or modified tiers or bundles of programming that have impacted the number of subscribers that receive our programming networks, including tiers or bundles of programming that exclude our programming networks.
If Distributor service offerings are not attractive to consumers for any reason (pricing, increased competition from OTT and DTC services, increased dissatisfaction with the quality of Distributor services, poor economic conditions or other factors), more consumers may (i) cancel their Distributor service subscriptions, (ii) elect to instead subscribe to OTT services, which in some cases may be offered at lower prices, or (iii) elect to subscribe to Distributors with smaller bundles of programming which may not include our programming networks.
If the rate of decline in the number of Distributor service subscribers increases or if subscribers shift to OTT services or smaller bundles of programming that do not include our programming networks, this may have a material adverse effect on our revenues.
We may not be able to renegotiate distribution agreements at terms comparable to or more favorable than our current agreements and networks with which we are affiliated currently, or in the future, and they may require us to share revenue from distribution agreements with them.
As distribution agreements expire, we may not be able to renegotiate such agreements at terms comparable to or more favorable than our current agreements. This may cause revenues and/or revenue growth from our distribution agreements to decrease under the renegotiated terms despite the fact that our current distribution agreements include automatic annual fee escalators. In addition, certain networks or program service providers with which our stations are affiliated are currently, or in the future are expected to, require us to share revenue from distribution agreements with them as part of renewing expiring affiliation agreements or pursuant to certain rights contained in existing affiliation agreements. Generally, our distribution agreements and agreements with networks or program service providers are for different lengths of time and expire in different periods. If we are unable to negotiate a distribution agreement or the revenue received as part of those agreements declines over time, then we may be exposed to a reduction in or loss from distribution revenue net of revenue shared with networks and program service providers. We cannot predict the outcome or provide assurances as to the outcome of any future negotiations relating to our distribution agreements or what impact, if any, they may have on our financial condition and results of operations. See Television Markets and Stations within Item 1. Business for a listing of current expirations of our affiliation agreements.
We face intense, wide-ranging competition for viewers and advertisers.
We compete, in certain respects and to varying degrees, for viewers and advertisers with other programming networks, pay-per-view, video on demand, online streaming services, and other content offered by distributors. We also compete for viewers and advertisers with OTT and DTC, mobile media, radio, motion picture, home video, stadiums and arenas, and other sources of information and entertainment and advertising services. Important competitive factors are the prices we charge for our programming networks, the quantity, quality (in particular, the performance of the sports teams whose media rights we control) and variety of the programming offered and the effectiveness of marketing efforts.
With respect to advertising services, factors affecting the degree and extent of competition include prices, reach and audience demographics, among others. Some of our competitors are large companies that have greater financial resources available to them than we do, which could impact our viewership and the resulting advertising revenues.
Rivals that may have greater resources than we have include:
•other local free over-the-air broadcast television and radio stations;
•Distributors, such as telecommunication companies, cable providers and direct broadcast satellite providers;
•print media providers such as newspapers, direct mail and periodicals;
•internet search engines, internet service providers, social media platforms, websites, and mobile applications;
•OTT technologies;
•Distributor "skinny" packages;
•mobile television; and
•other emerging technologies.
Competition from other broadcasters or other content providers and changes in technology may cause a reduction in our advertising revenues and/or an increase in our operating costs.
New technology and the subdivision of markets
Distributors are developing or have developed new technology that allows them to transmit more channels on their existing equipment to highly targeted audiences, reducing the cost of creating channels and potentially leading to the division of the television industry into ever more specialized niche markets. Competitors who target programming to such sharply defined markets may gain an advantage over us for television advertising revenues. The decreased cost of creating channels may also encourage new competitors to enter our markets and compete with us for advertising revenue. In addition, technologies that allow viewers to digitally record, store, and play back television programming may decrease viewership of commercials as recorded by media measurement services such as Nielsen or Comscore and, as a result, lower our advertising revenues. The current ratings provided by Nielsen for use by broadcast stations for live viewing Digital Video Recording playback are limited to seven days past the original air date. Additionally, in most markets, no credit is given for online viewing. The effects of new ratings data methodologies, many of which are used in our markets, and the ability of such methodologies to be a reliable standard that can be used by advertisers is still under review for accreditation from the Media Rating Council (“MRC”). Local audience measurement has been severely impacted by the COVID-19 pandemic. Nielsen relies heavily on in-person recruitment and maintenance and social distancing guidelines have not allowed for proper sample maintenance. As a result, panels have become skewed, unbalanced, and less reliable. Due to this issue, MRC accreditation for certain data have been put on hiatus as Nielsen works to correct their local panels.
Distributors may include over-the-air antennas within their set-top boxes allowing them to provide free over-the-air signals to their subscribers which could result in decreases in our distribution revenues received for our signal being carried on their channels.
We cannot provide any assurances that we will remain competitive with these developing technologies.
We depend on the appeal of our programming, which may be unpredictable, and increased programming costs may have a material negative effect on our business and our results of operations.
We depend in part upon viewer preferences and audience acceptance of the programming on our stations and networks. These factors are often unpredictable and subject to influences that are beyond our control, such as the quality and appeal of competing programming, general economic conditions and the availability of other entertainment options. We may not be able to successfully predict interest in proposed new programming and viewer preferences could cause new programming not to be successful or cause our existing programming to decline in popularity. An increase in our costs associated with programming, including original programming, or a decrease in viewership of our programming, may materially negatively affect us and our results of operations.
In addition, we rely on third parties for broadcast, entertainment, news, sports and other programming for our stations and networks. We compete with other providers of programming to acquire the rights to distribute such programming. If we fail to continue to obtain broadcast, entertainment, news, sports and other programming for our stations and networks on reasonable terms for any reason, including as a result of competition, we could be forced to incur additional costs to acquire such programming or look for alternative programming, which may have a material negative effect on us and our results of operations.
Further change in the current retransmission consent regulations could have an adverse effect on our business, financial condition and results of operations.
Distributors lobby to change the regulations under which retransmission consent is negotiated before both Congress and the FCC in order to increase their bargaining leverage with television stations.
In September 2015, the FCC released a Notice of Proposed Rulemaking in response to a Congressional directive in STELA Reauthorization Act of 2014 to examine the “totality of the circumstances test” for good-faith negotiations of retransmission consent. The proposed rulemaking seeks comment on new factors and evidence to consider in its evaluation of claims of bad faith negotiation, including service interruptions prior to a “marquee sports or entertainment event,” restrictions on online access to broadcast programming during negotiation impasses, broadcasters’ ability to offer bundles of broadcast signals with
other broadcast stations or cable networks, and broadcasters’ ability to invoke the FCC’s exclusivity rules during service interruptions. On July 14, 2016, the FCC’s Chairman at the time announced that the FCC would not, at that time, proceed to adopt additional rules governing good faith negotiations of retransmission consent but did not formally terminate the rulemaking. No formal action has yet been taken on this Proposed Rulemaking, and we cannot predict if the Commission will terminate the rulemaking or take other action.
The FCC rules governing “good faith” retransmission consent negotiations provide that, among other things, it is a per se violation of the statutory duty to negotiate in good faith for a television broadcast station to negotiate retransmission consent jointly with another station in the same market if the stations are not commonly owned. In May 2020, the FCC revised its good faith negotiation rules to specify that certain small MVPDs can meet the obligation to negotiate in good faith by negotiating with a large station group through a qualified MVPD buying group and that large station groups have an obligation to negotiate in good faith with such MVPD buying groups.
As further described under Item 1. Business – Federal Regulation of Television Broadcasting, the FCC also has pending a Further Notice of Proposed Rulemaking which seeks additional comment on whether it has authority to, and should, eliminate or modify its network non-duplication and syndicated exclusivity rules.
The FCC’s prohibition on the possible elimination or modification of the network non-duplication and syndicated exclusivity protection rules and certain joint retransmission consent negotiations may affect our ability to sustain our current level of distribution revenues or grow such revenues in the future and could have an adverse effect on our business, financial condition and results of operations.
Theft of our intellectual property may have a material negative effect on us and our results of operations, and we may become subject to infringement or other claims relating to our consent or technology.
Our success depends in part on our ability to maintain and monetize the material intellectual property rights in our programming, technology, digital and other content. Our intellectual property rights may be infringed upon by unauthorized usage of original broadcast content, RSNs telecast feeds (including, without limitation, live and non-live content) and other content for which the RSNs and/or the applicable league/team hold copyright ownership or distribution rights. Such unauthorized usage may occur on any and all distribution platforms, including, without limitation, linear and streaming services. Additionally, our intellectual property rights may be further infringed upon by third-party unauthorized distribution of original broadcast content, game content and/or highlights on social media platforms on a live or near live basis. Third-party licensors of content may infringe upon our intellectual property rights by not complying with content distribution rules, local territory blackout rules and RSNs distribution exclusivity windows.
Theft, misappropriation or the invalidity of our intellectual property or the intellectual property that is licensed to us by licensors (including sports teams) could have a material negative effect on us and our results of operations by potentially reducing the revenue that we are able to obtain from the legitimate sale and distribution of our content, undermining lawful and revenue-generating distribution channels, limiting our ability to control the marketing of our content and inhibiting our ability to recoup expenses or profit from the costs we incur creating our programming content. Litigation may be necessary to enforce our intellectual property rights or protect our trade secrets. Any litigation of this nature, regardless of outcome, could cause us to incur significant costs and could divert management's attention from the operation of our business.
While our programming personnel regularly monitor third-party streaming platforms and social media pages in an effort to identify intellectual property infringement and work closely with content distributors and leagues to notify content protection representatives to take the necessary steps to protect our and their intellectual property rights, those protective measures cannot ensure that theft, misappropriation or the invalidity of our intellectual property or the intellectual property that is licensed to us by licensors will not occur.
In addition, from time to time, third parties may assert claims against us alleging intellectual property infringement or other claims relating to our programming, technology, digital or other content. If any such infringement claim results in the loss of certain of our intellectual property rights, it could have a materially negative impact our business and the results of our operations.
We have experienced a cyber security breach in the past and may be vulnerable to future security breaches, data privacy, and other information technology failures that could have a material adverse effect on our financial performance and operating results and disrupt our operations.
Our information technology systems are critically important to operating our business efficiently and effectively. We rely on our information technology systems to manage our data, communications, news, sports and advertising content, digital products, and other business processes. Despite our security measures (including, employee training, multi-factor authentication, security information and event management, firewalls and testing tools, and backup and recovery systems), on October 17, 2021, we identified the following: (i) certain servers and workstations in our environment were encrypted with ransomware, (ii) disruption of certain office and operational networks as a result of the encryption, and (iii) indications that data was taken from our network. Promptly upon detection of the security event, senior management was notified and we began to implement incident response measures to contain the incident, conduct an investigation, and plan for restoring operations. Legal counsel, a cybersecurity forensic firm, and other incident response professionals were engaged, and law enforcement and other governmental agencies were notified. The investigation into the incident remains ongoing.
The cybersecurity incident identified on October 17, 2021 resulted in the loss in the fourth quarter of 2021 of approximately $63 million of advertising revenue, primarily related to our broadcast segment, as well as approximately $11 million through the date of filing this Form 10-K in costs and expenses related to mitigation efforts, our ongoing investigation and the security improvements resulting therefrom. However, we did not pay the ransom that was being sought as a result of the cybersecurity incident.
These amounts exceed the limits under our insurance policies and thus, based on the known effects of the cyber incident, the Company estimates that the cyber incident has resulted in approximately $24 million of unrecoverable net loss through the date of filing this Form 10-K. However, there can be no assurance that the insurance policies will pay their full coverage or the timing of such reimbursements. In addition, the Company may incur additional cyber incident response costs, and the estimated unrecoverable net loss above does not include an estimate of any liability the Company may have in the event that litigation or regulatory proceedings result from the incident.
We recurringly identify cyber threats as well as vulnerabilities in our systems and work to address them. Despite our efforts to ensure the integrity of our software, computers, systems and information, we may not be able to anticipate, detect or recognize threats to our systems and assets, or to implement effective preventive measures against all cyber threats, especially because the techniques used are increasingly sophisticated, change frequently, are complex, and are often not recognized until launched. Cyber attacks can originate from a variety of sources, including external parties who are affiliated with foreign governments or are involved with organized crime or terrorist organizations. Third parties may also attempt to induce employees, customers or other users of our systems to disclose sensitive information or provide access to our systems or network, or to our data or that of our counterparties, and these types of risks may be difficult to detect or prevent. We expect cyber attack and breach incidents to continue, and we are unable to predict the direct or indirect impact of future attacks or breaches on our business operations.
Investigations of cyber attacks are inherently unpredictable, and it takes time to complete an investigation and have full and reliable information. While we are investigating a cyber attack, we do not necessarily know the extent of the harm or how best to remediate it, and we can repeat or compound certain errors or actions before we discover and remediate them.
The occurrence of a cyber attack, breach, unauthorized access, misuse, ransomware, computer virus or other malicious code or other cybersecurity event could jeopardize or result in the unauthorized disclosure, gathering, monitoring, misuse, corruption, loss or destruction of confidential and other information that belongs to us, our customers, our counterparties, our employees, and third-party service providers that is processed and stored in, and transmitted through, our computer systems and networks. The occurrence of such an event could also result in damage to our software, computers or systems, or otherwise cause interruptions or malfunctions in our, our customers’, our counterparties’ or third parties’ operations. This could result in significant financial losses, loss of customers and business opportunities, reputational damage, litigation, regulatory fines, penalties, significant intervention, reimbursement or other compensatory costs, significant costs to investigate the event, remediate vulnerabilities and modify our protective measures, or otherwise adversely affect our business, financial condition or results of operations. While we maintain insurance to cover losses related to cybersecurity risks and business interruption, such policies, as was the case with respect to the October 2021 cybersecurity incident, may not be sufficient to cover all losses of this incident or any future incidents.
We could be adversely affected by labor disputes and legislation and other union activity.
The cost of producing and distributing entertainment programming has increased substantially in recent years due to, among other things, the increasing demands of creative talent and industry-wide collective bargaining agreements. Although we generally purchase programming content from others rather than produce such content ourselves, our program suppliers engage the services of writers, directors, actors and on-air and other talent, trade employees, and others, some of whom are subject to these collective bargaining agreements. Approximately 1,800 of our employees and freelance employees are represented by labor unions under collective bargaining agreements. If we or our program suppliers are unable to renew expiring collective
bargaining agreements, it is possible that the affected unions could take action in the form of strikes or work stoppages. Failure to renew these agreements, higher costs in connection with these agreements or a significant labor dispute could adversely affect our business by causing, among other things, delays in production that lead to declining viewers, a significant disruption of operations, and reductions in the profit margins of our programming and the amounts we can charge advertisers for time. Our stations and RSNs also broadcast certain professional sporting events, and our viewership may be adversely affected by player strikes or lockouts, such as the current MLB lockout, which could adversely affect our advertising revenues, results of operations and result in rebates to our Distributors for not meeting minimum game thresholds. The amounts paid under our sports rights agreements could be negatively impacted by rising professional player salaries, collective bargaining agreements or changes in the league mandated salary caps. Further, any changes in the existing labor laws, including the possible enactment of the Employee Free Choice Act, may further the realization of the foregoing risks.
The effects of the economic environment could require us to record an asset impairment of goodwill, indefinite-lived and definite-lived intangible assets.
We are required to evaluate our goodwill, indefinite-lived and definite-lived intangible assets for impairment. We evaluate our goodwill and indefinite-lived intangible assets for impairment annually, or more frequently, if events or changes in circumstances indicate an impairment may exist. In the performance of our annual goodwill and indefinite-lived intangible asset impairment assessments we have the option to qualitatively assess whether it is more likely-than-not that the respective asset has been impaired. If we conclude that it is more-likely-than-not that a reporting unit or an indefinite-lived intangible asset is impaired, we apply the quantitative assessment, which involves comparing the estimated fair value of the reporting unit or indefinite-lived intangible asset to its respective carrying value. We estimate fair value using an income approach involving the performance of a discounted cash flow analysis. We evaluate our definite-lived intangible assets for impairment as events or changes in circumstances indicate that the carrying amount of such assets may not be recoverable. In the event we identify indicators that these assets are not recoverable, we evaluate the recoverability of definite-lived intangible assets by comparing the carrying amount of the assets within an asset group to the estimated undiscounted future cash flows associated with the asset group. An asset group represents the lowest level of cash flows generated by a group of assets that are largely independent of the cash flows of other assets. At the time that such evaluations indicate that the future undiscounted cash flows are not sufficient to recover the carrying value of the asset group, an impairment loss is determined by comparing the estimated fair value of the asset group to the carrying value. We estimate fair value using an income approach involving the performance of a discounted cash flow analysis. During the year ended December 31, 2020, with respect to our local sports segment, as a result of the loss of three Distributors, existing Distributors experiencing elevated levels of subscriber erosion which we believe was influenced, in part, by shifting consumer behaviors resulting from media fragmentation, the then-current economic environment, the COVID-19 pandemic and related uncertainties, we performed a quantitative impairment test related to goodwill and evaluated the recoverability of our definite-lived intangible assets, which resulted in the recording of non-cash impairment charges of approximately $4,264 million. During the year ended December 31, 2021, we did not identify any indicators that our definite-lived intangible assets may not be recoverable or that our goodwill or indefinite-lived assets were impaired. However, future losses of Distributors, continued elevated level of subscriber erosion, failure to execute on our DTC strategy and any other factors that cause a deterioration in our financial results could result in future impairments charges. For additional information regarding impairments to our goodwill and intangible assets, see Valuation of Goodwill and Indefinite-Lived Intangible Assets under Critical Accounting Policies and Estimates within Item 7. Management's Discussion and Analysis of Financial Condition and Results of Operations and Note 5. Goodwill, Indefinite-Lived Intangible Assets, and Other Intangible Assets within the Consolidated Financial Statements.
Unrelated third parties may bring claims against us based on the nature and content of information posted on websites maintained by us.
We host internet services that enable individuals to exchange information, generate content, comment on our content, and engage in various online activities. The law relating to the liability of providers of these online services for activities of their users is currently unsettled both within the United States and internationally. Claims may be brought against us for defamation, negligence, copyright or trademark infringement, unlawful activity, tort, including personal injury, fraud, or other theories based on the nature and content of information that may be posted online or generated by our users. Our defense of such actions could be costly and involve significant time and attention of our management and other resources.
Risks related to our concentrated voting stock ownership
The Smiths exercise control over most matters submitted to a stockholder vote and may have interests that differ from other security holders. They may, therefore, take actions that are not in the interests of other security holders.
As of December 31, 2021, David D. Smith, Frederick G. Smith, J. Duncan Smith, and Robert E. Smith hold shares representing approximately 80.3%of our common stock voting rights and, therefore, control the outcome of most matters submitted to a vote
of our stockholders, including, but not limited to, electing directors, adopting amendments to our certificate of incorporation, and approving corporate transactions. The Smiths hold substantially all of the Class B Common Stock, which have ten votes per share. Our Class A Common Stock has only one vote per share. Future transfers by holders of Class B Common Stock will generally result in those shares converting to Class A Common Stock, subject to limited exceptions, such as transfers effected for estate planning purposes. The conversion of Class B Common Stock to Class A Common Stock will have the effect, over time, of increasing the relative voting power of those holders of Class B Common Stock who retain their shares in the long term. In addition, the Smiths hold four of our board of directors' seats and, therefore, have the power to exert significant influence over our corporate management and policies. The Smiths have entered into a stockholders' agreement pursuant to which they have agreed to vote for each other as candidates for election to our board of directors until December 31, 2025.
Although in the past the Smiths have recused themselves from related person transactions, circumstances may occur in which the interests of the Smiths, as the controlling security holders, could be in conflict with the interests of other security holders and the Smiths would have the ability to cause us to take actions in their interest. In addition, the Smiths could pursue acquisitions, divestitures, or other transactions that, in their judgment, could enhance their equity investment, even though such transactions might involve risks to our other security holders. Further, the concentration of ownership the Smiths possess may have the effect of discouraging, delaying, or preventing a future change of control, which could deprive our stockholders of an opportunity to receive a premium for their shares as part of a sale of our company and might reduce the price of our shares.
(See Item 12. Security Ownership of Certain Beneficial Owners and Management and Related Stockholder Matters and Item 13. Certain Relationships and Related Transactions, which will be included as part of our Proxy Statement for our 2021 Annual Meeting.)
Significant divestitures by the Smiths could cause them to own or control less than 51% of the voting power of our shares, which in turn (i) could, as discussed under A failure to comply with covenants under debt instruments could result in a default under such debt instruments, acceleration of amounts due under our debt and loss of assets securing our loans within Item 1A. Risk Factors, under certain circumstances require us to offer to buy back some or all of our outstanding STG and DSG notes and could result in an event of default under each of the STG Bank Credit Agreement and the DSG Bank Credit Agreement and (ii) give Cunningham Broadcasting Corporation (Cunningham) the right to terminate the LMAs and other outsourcing agreements with Cunningham due to a "change in control." Any such termination of LMAs could have an adverse effect on our results of operations. The FCC's multiple ownership rules may limit our ability to operate multiple television stations in some markets and may result in a reduction in our revenue or prevent us from reducing costs. Changes in these rules may threaten our existing strategic approach to certain television markets. See the risk factor below regarding the FCC's multiple ownership rules.
Risks relating to our broadcast segment
Our advertising revenue can vary substantially from period to period based on many factors beyond our control. This volatility affects our operating results and may reduce our ability to repay debt or reduce the market value of our securities.
We rely on sales of advertising time for a significant portion of our broadcast segment revenues and, as a result, our operating results depend on the amount of advertising revenue we generate. If we generate less advertising revenue, it may be more difficult for us to repay debt and meet our debt service obligations, and the value of our business may decline. Our ability to sell advertising time depends on:
•the levels of automotive and services advertising, which historically have represented a large portion of our advertising revenue;
•the levels of political advertising, which are significantly higher in even-number years and elevated further every four years related to the presidential election (as was the case in 2020), historically have represented a large portion of our advertising revenue; for the year ended December 31, 2021 (a non-political year), political advertising represented 4% of our advertising revenue; for the year ended December 31, 2020 (a political year), political advertising represented 27% of our advertising revenue;
•the levels of political advertising, which are affected by political beliefs, public opinion, campaign finance laws, and the ability of political candidates and political action committees to raise and spend funds which are subject to seasonal fluctuations;
•the health of the economy in the areas where our television stations are located and in the nation as a whole;
•the popularity of our programming and that of our competition;
•the effects of declining live/appointment viewership as reported through rating systems and local television efforts to adopt and receive credit for same day viewing plus viewing on-demand thereafter;
•the effects of new rating methodologies;
•changes in the makeup of the population in the areas where our stations are located;
•the financial health of our underlying advertisers' businesses and demand for their products;
•the activities of our competitors, including increased competition from other forms of advertising-based mediums, such as other broadcast television stations, radio stations, Distributors, internet and broadband content providers and other print, outdoor, social media, and media outlets serving in the same markets;
•OTT and other emerging technologies and their potential impact on cord-cutting;
•the impact of Distributors and OTT distributors offering "skinny" programming bundles that may not include all programming of television broadcast stations and/or cable channels, such as Tennis Channel;
•changes in pricing and sellout levels;
•the financial health of our underlying customers' that we provide management services to;
•the effectiveness of our salespeople; and
•other factors that may be beyond our control.
There can be no assurance that our advertising revenue will not be volatile in the future or that such volatility will not have an adverse impact on our business, financial condition, or results of operations.
We purchase programming in advance based on expectations about future revenues. Actual revenues may be lower than our expectations. If this happens, we could experience losses that may make our securities less valuable.
One of our stations' most significant costs is network and syndicated programming. Our ability to generate revenue to cover this cost may affect the value of our securities. If a particular network or program is not popular in relation to its costs, we may not be able to sell enough advertising time to cover the cost.
We generally purchase syndicated programming content from others rather than producing such content ourselves, therefore, we have limited control over the costs of the programming. Often, we must purchase syndicated programming several years in advance and may have to commit to purchase more than one year's worth of programming. We may replace programs that are doing poorly before we have recaptured any significant portion of the costs we incurred or before we have fully amortized the costs. We also receive programming from networks with which we have network affiliation agreements. Generally, the agreements are for several years. The popularity of networks can affect revenue earned on those channels. Any of these factors could reduce our revenues or otherwise cause our costs to escalate relative to revenues. These factors are exacerbated during a weak advertising market.
We internally originate programming in advance based on expectations about future revenues. Actual revenues could fluctuate and may be lower than our expectations. If this happens, we could experience losses that may make our securities less valuable.
The production of internally originated programming requires a large up-front investment and the revenues derived from the airing of internally originated programming primarily depends upon its acceptance by the public, which is difficult to predict. The commercial success of original content also depends upon the quality and acceptance of other competing content released into the marketplace at or near the same time, the availability of a growing number of alternative forms of entertainment, general economic conditions and their effects on consumer spending, and other tangible and intangible factors, all of which can change and cannot be predicted with certainty. Any of these factors could reduce our revenues or otherwise cause our costs to escalate relative to revenues. These factors are exacerbated during a weak advertising market.
We may lose a large amount of programming if a network terminates its affiliation or program service arrangement with us, we are not able to negotiate arrangements at terms comparable to or more favorable than our current agreements, or if networks make programming available through services other than our local affiliates, which could increase our costs and/or reduce our revenue.
The networks produce and distribute programming in exchange for each station's commitment to air the programming at specified times and for commercial announcement time during programming and for cash fees. The amount and quality of programming provided by each network varies. See Television Markets and Stations within Item 1. Business for a detailed listing of our stations and channels as of December 31, 2021.
As network affiliation agreements come up for renewal, we (or licensees of the stations we provide programming and/or sales services to), may not be able to negotiate terms comparable to or more favorable than our current agreements. The non-renewal or termination of any of our network affiliation agreements would prevent us from being able to carry programming of the relevant network. This loss of programming would require us to obtain replacement programming, which may involve higher costs and which may not be as attractive to our target audiences, resulting in reduced revenues. Upon the termination of any of our network affiliation agreements, we would be required to establish a new network affiliation agreement for the affected station with another network or operate as an independent station.
We cannot predict the outcome of any future negotiations relating to our affiliation agreements or what impact, if any, they may have on our financial condition and results of operations. In addition, the impact of an increase in reverse network compensation payments, under which we compensate the network for programming pursuant to our affiliation agreements, may have a negative effect on our financial condition or results of operations. See Television Markets and Stations within Item 1. Business for a listing of current expirations of our affiliation agreements.
We may be subject to investigations or fines from governmental authorities, such as, but not limited to penalties related to violations of FCC indecency, children's programming, sponsorship identification, and other FCC rules and policies, the enforcement of which has increased in recent years, and complaints related to such violations may delay our renewal applications with the FCC.
We provide a significant amount of live news reporting that is provided by the broadcast networks or is controlled by our on-air news talent. Although both broadcast network and our on-air talent have generally been professional and careful in what they say, there is always the possibility that information may be reported that is inaccurate or even in violation of certain indecency rules promulgated by the FCC. In addition, entertainment and sports programming provided by broadcast syndicators and networks may contain content that is in violation of the indecency rules promulgated by the FCC. Because the interpretation by the courts and the FCC of the indecency rules is not always clear, it is sometimes difficult for us to determine in advance what may be indecent programming. We have insurance to cover some of the liabilities that may occur, but the FCC has enhanced its enforcement efforts relating to the regulation of indecency. Also, the FCC has various rules governing children's television programming, including commercial matter limitations, and sponsorship identification. We are subject to such rules regardless of whether the programming is produced by us or by third parties. Violation of the indecency, children's programming or sponsorship identification rules could potentially subject us to penalties, license revocation, or renewal or qualification proceedings. For example, as described under Litigation within FCC Litigation Matters under Note 13. Commitments and Contingencies within the Consolidated Financial Statements, on May 22, 2020, the FCC released an Order and Consent Decree pursuant to which we agreed to pay $48 million and implement a four year compliance plan to resolve various matters. There can be no assurance that future incidents that may lead to significant fines or other penalties by the FCC can be avoided.
From time to time, we may be the subject of an investigation from governmental authorities. For example, as described more fully under The FCC's multiple ownership rules and federal antitrust regulation may limit our ability to operate multiple television stations in some markets and may result in a reduction in our revenue or prevent us from reducing costs. Changes in these rules may threaten our existing strategic approach to certain television markets below, on January 4, 2019, the Company received three civil investigative demands (“CIDs”) from the Antitrust Division of the DOJ relating to JSAs in a certain DMAs. Although, on July 1, 2021, the Department of Justice Antitrust Division advised the Company that it had closed the JSA investigation with respect to the Company without action, there can be no assurance that in the future an investigation for a similar matter will not lead to an action or proceeding against us. In the event an action or proceeding is commenced, we may be subject to fines, penalties and changes in our business that could have a negative effect on our financial condition and results of operations.
Federal regulation of the broadcasting industry limits our operating flexibility, which may affect our ability to generate revenue or reduce our costs.
The FCC regulates our broadcast segment, just as it does all other companies in the broadcasting industry. We must obtain the FCC's approval whenever we need a new license, seek to renew, assign or modify a license, purchase a new station, sell an existing station, or transfer the control of one of our subsidiaries that hold a license. Our FCC licenses are critical to our broadcast segment operations; we cannot operate without them. We cannot be certain that the FCC will renew these licenses in the future or approve new acquisitions in a timely manner, if at all. If licenses are not renewed or acquisitions are not approved, we may lose revenue that we otherwise could have earned.
In addition, Congress and the FCC may, in the future, adopt new laws, regulations and policies regarding a wide variety of matters (including, but not limited to, technological changes in spectrum assigned to particular services) that could, directly or indirectly, materially and adversely affect the operation and ownership of our broadcast properties. (See Item 1. Business.)
The FCC's multiple ownership rules and federal antitrust regulation may limit our ability to operate multiple television stations in some markets and may result in a reduction in our revenue or prevent us from reducing costs. Changes in these rules may threaten our existing strategic approach to certain television markets.
Television station ownership
As discussed in National Ownership Rule under Ownership Matters under Federal Regulation of Television Broadcasting within Item 1. Business, in December 2017, the FCC released a Notice of Proposed Rulemaking to examine the National Ownership Rule, including the UHF discount, which remains pending. Because we are near the 39% cap without application of the UHF discount, changes to the UHF discount or National Ownership Rule could limit our ability to acquire television stations in additional markets.
As discussed in Local Marketing and Outsourcing Agreements under Federal Regulation of Television Broadcasting within Item 1. Business, in August 2016, the FCC issued the Ownership Order to provide for the attribution of JSAs where two television stations are located in the same market and a party with an attributable interest in one station sells more than 15% of the advertising time per week of the other station. JSAs that existed prior to March 31, 2014, were allowed to remain in place until October 1, 2025. In 2017, in its Ownership Order on Reconsideration, the FCC eliminated the JSA attribution rule. On appeal, the Third Circuit vacated and remanded the Ownership Order on Reconsideration. The Ownership Order on Reconsideration was vacated and remanded by the U.S. Court of Appeals for the Third Circuit in September 2019, but the Supreme Court ultimately reversed the Third Circuit’s decision on April 1, 2021 and the Ownership Order on Reconsideration (including elimination of the JSA attribution rule) is currently in effect. We have entered into outsourcing agreements (such as JSAs) whereby 34 stations provide various non-programming related services such as sales, operational and managerial services to or by other stations within the same markets. For additional information, refer to Television Markets and Stations within Item 1. Business. See Note 14. Variable Interest Entities within the Consolidated Financial Statements for further discussion of our JSAs which we consolidate as variable interest entities.
Certain of our stations have entered into LMAs pursuant to which we may provide programming to and sell advertising on a separately owned television station serving the same market. The FCC attributes LMAs to the programmer if the programmer provides more than 15% of a station’s weekly broadcast programming; provided, that, LMAs entered into prior to November 5, 1996, including ours, are currently exempt from attribution. The FCC may review these exempted LMAs in the future and if it determines to terminate or modify the exempt period and make all LMAs fully attributable we will be required to terminate or modify our exempted LMAs unless the FCC’s local ownership rules would permit us to own both stations. As of December 31, 2021, we provide services under exempted LMAs to eight television stations owned by third parties. See Note 14. Variable Interest Entities within the Consolidated Financial Statements for further discussion of our LMAs which we consolidate as variable interest entities.
As discussed in Other Pending Matters under Federal Regulation of Television Broadcasting within Item 1. Business, in December 2018, the FCC sought comment on whether certain of its ownership rules continue to be necessary in the public interest or whether they should be modified or eliminated. This proceeding remains open. Changes to these rules could result in the need to terminate or modify our LMAs, JSAs and other outsourcing agreements.
On January 4, 2019, the Company received three CIDs from the Antitrust Division of the DOJ. In each CID, the DOJ requested that the Company produce certain documents and materials relating to JSAs in a specific DMA. We believe the DOJ has issued similar civil investigative demands to other companies in our industry. On July 1,
2021, the Department of Justice Antitrust Division advised the Company that it had closed the JSA investigation with respect to the Company without action.
See Changes in the Rules of Television Ownership, Local Marketing Agreements, Joint Sales Agreements, Retransmission Consent Negotiations, and National Ownership Cap under Note 13. Commitments and Contingencies within the Consolidated Financial Statements.
If we are required to terminate or modify our LMAs, JSAs and other outsourcing agreements, our business could be affected in the following ways:
•Loss of revenues. If the FCC requires us to modify or terminate existing arrangements, we would lose some or all of the revenues generated from those arrangements. We would lose revenue because we will have fewer demographic options, a smaller audience distribution and lower revenue share to offer to advertisers.
•Increased costs. If the FCC requires us to modify or terminate existing arrangements, our cost structure would increase as we would potentially lose significant operating synergies and we may also need to add new employees. With termination of LMAs, we likely would incur increased programming costs because we will be competing with the separately owned station for syndicated programming.
•Losses on investments. As part of certain of our arrangements, we own the non-license assets used by the stations with which we have arrangements. If certain of these arrangements are no longer permitted, we would be forced to sell these assets, restructure our agreements or find another use for them. If this happens, the market for such assets may not be as good as when we purchased them and, therefore, we cannot be certain of a favorable return on our original investments.
•Termination penalties. If the FCC requires us to modify or terminate existing arrangements before the terms of the arrangements expire, or under certain circumstances, we elect not to extend the terms of the arrangements, we may be forced to pay termination penalties under the terms of certain of our arrangements. Any such termination penalties could be material.
•Alternative arrangements. If the FCC requires us to terminate the existing arrangements, we may enter into one or more alternative arrangements. Any such arrangements may be on terms that are less beneficial to us than the existing arrangements.
Failure of owner / licensee to exercise control
The FCC requires the owner / licensee of a station to maintain independent control over the programming and operations of the station. As a result, the owners / licensees of those stations with which we have outsourcing agreements can exert their control in ways that may be counter to our interests, including the right to preempt or terminate programming in certain instances. The preemption and termination rights cause some uncertainty as to whether we will be able to air all of the programming that we have purchased under our LMAs and therefore, uncertainty about the advertising revenue that we will receive from such programming. In addition, if the FCC determines that the owner / licensee is not exercising sufficient control, it may penalize the owner licensee by a fine, revocation of the license for the station or a denial of the renewal of that license. Any one of these scenarios, especially the revocation of or denial of renewal of a license, might result in a reduction of our cash flow or margins and an increase in our operating costs. In addition, penalties might also affect our qualifications to hold FCC licenses, putting our own licenses at risk.
The pendency and indeterminacy of the outcome of these ownership rules and the CIDs, which may limit our ability to provide services to additional or existing stations pursuant to licenses, LMAs, outsourcing agreements or otherwise, expose us to a certain amount of volatility, particularly if the outcomes are adverse to us. Further, resolution of these ownership rules and the CIDs has been and will likely continue to be a cost burden and a distraction to our management and the continued absence of a resolution may have a negative effect on our business.
We have invested and will continue to invest in new technology initiatives which may not result in usable technology or intellectual property.
We have heavily invested in the development of the NEXTGEN TV platforms as discussed in Development of Next Generation Wireless Platform under Operating Strategy within Item 1. Business. We do not know whether the outcome of our research and development will result in technology that will be usable on our distribution platform or available to license to third parties. Any failure to develop this technology could result in the loss of our investment. Our costs incurred related to the development of the NEXTGEN TV platform is recorded within non-media expenses within our consolidated statements of operations. Additionally, we have developed, on our own and through joint ventures, several NEXTGEN TV related patents that we will attempt to monetize directly, through third-party agents, or through a patent pool designed to consolidate similar patents owned by independent licensors for licensing to equipment manufacturers. We do not know whether our attempts at monetization will result in licensing arrangements that will be accepted by such equipment manufacturers or result in any royalty payments for our intellectual property rights.
Risks relating to our local sports segment
The long-term success of our local sports segment is dependent on the successful execution of our DTC strategy, which is subject to a number of risks and uncertainties.
The DTC products and services we intend to offer represent a new consumer offering for which we have limited prior experience. There is intense competition among subscription services, including increasing competition in sports-related subscription offerings. As a result, our success will be dependent on a number of factors, including:
•our ability to acquire DTC rights from the 11 MLB teams with which we currently do not have DTC rights;
•our ability to appropriately price our subscription offerings to optimize the DTC opportunity, while not contributing to further increases in the loss of Distributor subscribers to our RSNs;
•offering high quality content and programming as part of our subscription packages, including creating or acquiring new content to compliment live games;
•ensuring a high level of consumer engagement, which is necessary for us to maximize participation-based revenue; and
•our DTC technology being sufficient and operating effectively.
Failure to successfully execute our DTC strategy could have a material adverse effect on our financial condition and results of operations.
Our media rights agreements with various professional sports teams have varying durations and terms and we may be unable to renew those agreements on acceptable terms or such rights may be lost for other reasons.
Our ability to generate revenues is dependent upon media rights agreements with professional sports teams. As of December 31, 2021, we had a weighted average remaining life of nine years under our exclusive media rights agreements. Upon expiration, we may seek renewal of these agreements and, if we do, we may be outbid by competing programming networks or others for these agreements or the renewal costs could substantially exceed our costs under the current agreements. Even if we are to renew such agreements, our results of operations could be adversely affected if increases in sports programming rights costs outpace increases in distribution and advertising revenues. In addition, one or more of these sports teams may seek to establish their own programming network or join one of our competitor's networks or regional sports network and, in certain circumstances, we may not have an opportunity to bid for the media rights. Also, there is a risk that certain rights can be distributed via digital rights and the RSNs would not have the same monetization for such rights.
Moreover, the value of these agreements may also be affected by various league decisions and/or league agreements that we may not be able to control, including a decision to alter the number of games played during a season. The governing bodies of the MLB, NBA and NHL have imposed, and may impose in the future, various rules, regulations, guidelines, bulletins, directives, policies and agreements (collectively, “League Rules”), which could have a material negative effect on our business and results of operations. For example, the League Rules define the territories in which we may distribute games of the teams in the applicable league. Changes to the League Rules, or the adoption of new League Rules, could affect our media rights agreements with the various teams and as consequence have a material negative effect on our business and results of operations. For example, the leagues may give digital rights and/or may allocate more games for national feeds to other Distributors, and/or may incentivize team participation in league-controlled sports networks.
The value of these media rights can also be affected, or we could lose such rights entirely, if a team is liquidated, undergoes reorganization in bankruptcy or relocates to an area where it is not possible or commercially feasible for us to continue to distribute programming for such team. Any loss or diminution in the value of rights could impact the extent of the sports coverage offered by us and could materially negatively affect us and our results of operations. In addition, our affiliation agreements with Distributors typically include certain remedies in the event our networks fail to meet a minimum number of professional event telecasts, and, accordingly, any loss of rights could materially negatively affect our business and our results of operations.
Our local sports segment’s success depends on distribution revenue we receive, the loss of which or renewal of which on less favorable terms may have a material negative effect on us and our results of operations.
Our local sports segment’s success is dependent upon the existence and terms of our agreements with Distributors and other OTT distributors. Our existing agreements for our programming networks expire at various dates. Given the relatively short-term nature of our existing agreements, a number of agreements with Distributors are up for renewal and under negotiation at any given time. We cannot provide assurances that we will be able to renew these distribution agreements or obtain terms as attractive as our existing agreements in the event of a renewal. For example, in recent years, we have been unable to negotiate renewals of distribution agreements on satisfactory terms with three significant Distributors. Our affiliation agreements with Dish Network Corporation (Dish), YouTube TV, and Hulu expired on July 26, 2019, October 1, 2020 and October 23, 2020, respectively. For the twelve months ended June 30, 2019, revenue from Dish and its OTT service, Sling TV, accounted for 12% of the Acquired RSNs distribution revenue. For the twelve months ended September 30, 2020, revenue from YouTube TV and Hulu accounted for a combined 9% of the local sports segment’s distribution revenue. Our largest near-term distribution agreement in our local sports segment was originally scheduled to expire in February 2022 and is operating under a short-term extension while the parties continue negotiations. For the year ended December 31, 2021, distribution revenue from the Distributor under this agreement accounted for 28.8% of our local sports segment distribution revenues. In addition, some of the affiliation agreements also include so-called "most favored nations" provisions which require that certain terms (including, potentially, the material terms) of such agreements are no less favorable than those provided to any similarly situated Distributors. If triggered, these most favored nations provisions could cause the amounts earned under these agreements to decrease, which could result in our inability to achieve the originally anticipated benefits of such agreements.
Distribution revenue constitutes the substantial majority of our local sports segment revenues. For the year ended December 31, 2021, local sports segment distribution revenue constituted 86% of our local sports segment revenue and 43% of our consolidated total revenue. Changes in distribution revenue generally result from a combination of changes in rates and subscriber counts.
If the number of subscribers to Distributor services decreases or these subscribers shift to other services or bundles that do not include our programming networks, there may be a material adverse effect on our revenues.
During the last few years, the number of subscribers to Distributor services in the United States has been declining. We believe the decline has resulted from technological advancements that have driven changes in consumer behavior and have empowered consumers to seek more control over when, where and how they consume sports, including through the so-called “cutting the cord” and other consumption strategies. Reductions in the license fees that we receive per subscriber or in the number of subscribers for which we are paid, including as a result of a loss of, or reduction in carriage of, our programming networks, would adversely affect our distribution revenue. For example, Distributors may introduce, market and/or modify tiers of programming networks that could impact the number of subscribers that receive our programming networks, including tiers of programming that may exclude our networks. Any loss or reduction in carriage would also decrease the potential audience for our programming, which may adversely affect our advertising revenues.
Our distribution agreements generally require us to meet certain content criteria, such as minimum thresholds for professional event telecasts throughout the year on our networks. If we were unable to meet these criteria, we could become subject to remedies available to the Distributors, which may include fee reductions, rebates or refunds and/or termination of these agreements. Our ability to meet these requirements is primarily driven by the delivery of games by the professional sports leagues. The COVID-19 pandemic has resulted in significant disruptions to the normal operations of the professional sports leagues resulting in delays and uncertainty with respect to regularly scheduled games. For example, decisions made by the leagues during the second quarter of 2020 regarding the timing and format of the revised 2020 seasons have resulted, in some cases, in our inability to meet these minimum requirements and the need to reduce revenue based upon estimated rebates due to our distribution customers.
In addition, under certain circumstances, an existing agreement may expire and we may have not finalized negotiations of either a renewal of that agreement or a new agreement for certain periods of time. Our largest near-term distribution agreement in our
local sports segment was originally scheduled to expire in February 2022 and is operating under a short-term extension while the parties continue negotiations. For the year ended December 31, 2021, distribution revenue from the Distributor under this agreement accounted for 28.8% of our local sports segment distribution revenues. While Distributors may continue to carry the services in certain of these circumstances until the execution of definitive renewal or replacement agreements (or until we or the Distributor determine that carriage should cease), Distributors may instead elect to stop carrying, or "blackout," the services upon the expiration of an agreement. Whether Distributors continue to carry the services or not during the renegotiation of our agreement with them, an expiration of an existing agreement without a renewal or replacement thereof may materially adversely affect our business results of operations or financial condition.
Occasionally, we may have disputes with Distributors over the terms of our agreements. If not resolved through business discussions, such disputes could result in litigation or actual or threatened termination of an existing agreement.
In addition, the pay television industry is highly concentrated, with a relatively small number of Distributors serving a significant percentage of pay television subscribers that receive our programming networks, thereby affording the largest Distributors significant leverage in their relationship with programming networks, including us. A substantial majority of our local sports segment distribution revenue comes from our top three Distributors. Further consolidation in the industry could reduce the number of Distributors available to distribute our programming networks and increase the negotiating leverage of certain Distributors, which could adversely affect our revenue. In some cases, if a Distributor is acquired, the distribution agreement of the acquiring Distributor will govern following the acquisition. In those circumstances, the acquisition of a Distributor that is a party to one or more distribution agreements with us on terms that are more favorable to us than that of the acquirer could have a material negative impact on us and our results of operations.
Our joint venture arrangements are subject to a number of operational risks that could have a material adverse effect on our business, results of operations and financial condition.
We have invested in a number of our RSNs through joint ventures with certain teams, and we may form additional joint ventures in the future. As of December 31, 2021, we were joint venture partners with six teams in our RSNs that distribute content for each respective team. The nature of the joint ventures requires us to consult with and share certain decision-making powers with unaffiliated third parties. Further, differences in economic or business interests or goals among joint venture participants could result in delayed decisions, failures to agree on major issues and even litigation. If these differences cause the joint ventures to deviate from their business or strategic plans, or if our joint venture partners take actions contrary to our policies, objectives or the best interests of the joint venture, our results could be adversely affected.
Our participation in joint ventures is also subject to the risks that:
•we could experience an impasse on certain decisions because we do not have sole decision-making authority, which could require us to expend additional resources on resolving such impasses or potential disputes.
•we may not be able to maintain good relationships with our joint venture partners, which could limit our future growth potential and could have an adverse effect on our business strategies.
•our joint venture partners could have investment or operational goals that are not consistent with our corporate-wide objectives, including the timing, terms and strategies for investments or future growth opportunities.
•our joint venture partners might become bankrupt, fail to fund their share of required capital contributions or fail to fulfill their other obligations as joint venture partners, which could cause us to decide to infuse our own capital into any such venture on behalf of the related joint venture partner or partners despite other competing uses for such capital.
•some of our existing joint ventures require mandatory capital expenditures for the benefit of the applicable joint venture, which could limit our ability to expend funds on other corporate opportunities.
•some of our joint venture partners have exit rights that require us to purchase their interests upon the occurrence of certain events or the passage of certain time periods, which could impact our financial condition by requiring us to incur additional debt in order to complete such transactions or otherwise use cash that could have been spent on alternative investments.
•our joint venture partners may have competing interests in our markets that could create conflict of interest issues.
•any sale or other disposition of our interest in a joint venture or underlying assets of the joint venture may require consents from our joint venture partners, which we may not be able to obtain.
•certain corporate-wide or strategic transactions may also trigger other contractual rights held by a joint venture partner (including termination or liquidation rights) depending on how the transaction is structured, which could impact our ability to complete such transactions.
Our local sports segment is substantially dependent on the popularity of the MLB, NBA and NHL teams whose media rights we control.
Our local sports segment is dependent on the popularity of the MLB, NBA and NHL teams whose local media rights we control and, in varying degrees, those teams achieving on-field, on-court and on-ice success, which can generate fan enthusiasm, resulting in increased viewership and advertising revenues. Furthermore, success in the regular season may qualify a team for participation in the post-season, which generates increased interest in such team, thereby improving viewership and advertising revenues. Alternatively, if a team declines in popularity or fails to generate fan enthusiasm, this may negatively impact viewership and advertising revenues and the terms on which our affiliation agreements are renewed. There can be no assurance that any sports team will generate or maintain fan enthusiasm or compete in post-season play, and the failure to do so could result in a material negative effect on us and our results of operations.
Our advertising revenue can vary substantially from period to period based on many factors beyond our control, which volatility may adversely affect our results of operations.
We rely on sales of advertising time for a portion of our local sports segment revenues and, as a result, our operating results depend on the amount of advertising revenue we generate. Our ability to sell advertising time depends on:
•the success of the automotive and service industries, which historically have provided a significant portion of our local sports segment advertising revenue;
•the health of the economy in the areas where our networks are located and in the nation as a whole;
•the popularity of our programming and that of our competition;
•the popularity of the sports teams with which we own rights;
•the effects of declining live/appointment viewership as reported through rating systems and local television efforts to adopt and receive credit for same day viewing plus viewing on-demand thereafter;
•the effects of new rating methodologies;
•changes in the makeup of the population in the areas where our networks are located;
•the financial health of our underlying advertisers' businesses and demand for their products;
•the activities of our competitors, including increased competition from other forms of advertising-based mediums, such as radio stations, Distributors, internet and broadband content providers and other print, outdoor, social media, Internet and media outlets serving in the same markets;
•OTT and other emerging technologies and their potential impact on cord-cutting;
•the impact of Distributors and other OTT providers not offering our networks or offering "skinny" programming bundles that may not include all programming of our networks;
•changes in pricing and sellout levels;
•the effectiveness of our sales people;
•our ability to compete with Distributors that are selling the advertising time that we provide them, which they are able to bundle with other sports and other geographic locations;
•advertisers' desire to message to our viewer demographic;
•our ability to successfully implement a DTC and gamification strategy;
•Bally's ability to pay for naming rights and advertising commitments, as well as successfully increase the value of their company;
•the effectiveness of the Bally's Sports app and ability to monetize impressions; and
•other factors that may be beyond our control.
There can be no assurance that our advertising revenue will not be volatile in the future or that such volatility will not have an adverse impact on us, our financial condition, or our results of operations.
We may be obligated to make certain payments to local teams during labor disputes.
We may be impacted by union relations of professional sports leagues. On December 2, 2021, MLB owners locked out players following the expiration of its prior collective bargaining agreement with its players. While negotiations towards a new collective bargaining agreement have commenced, there can be no assurance that an agreement will be reached prior to the commencement of the 2022 MLB season or at all. Each of the NBA, the NHL and MLB has experienced labor difficulties in the past and may have labor issues, such as players' strikes or management lockouts, in the future. For example, the NBA has experienced labor difficulties, including lockouts during the 1998-99 and 2011-12 seasons, resulting in a shortened regular season in each case. The NHL has also experienced labor difficulties, including lockouts during the 1994-95 and 2012-13 seasons, resulting in a shortened regular season in each case, and a lockout beginning in September 2004, which resulted in the cancellation of the entire 2004-05 NHL season. MLB has also experienced labor difficulties, including players' strikes during the 1972, 1981 and 1994 seasons resulting in a shortened regular season in each case, and the loss of the entire post-season and the World Series in 1994.
Any labor disputes between professional sports leagues and players' unions may preclude us from airing or otherwise distributing scheduled games for which we have the rights to broadcast, resulting in decreased revenues or result in rebates to our Distributors for not meeting minimum game thresholds, which would adversely affect our business, revenue and results of operations. In addition, any labor disputes between professional sports leagues and players' unions may result in us having to broadcast games with substitute players, which would adversely affect our business, revenue, results of operations. Although many of our current programming rights agreements with local teams account for labor disputes with certain pro rata reductions in the rights fees owed thereunder, we have a contractual obligation in some cases to continue paying a certain portion of such rights fees notwithstanding any labor dispute.
We may need to obtain FCC-regulated licenses for RSNs video distribution.
Our RSNs require use of certain uplink and downlink facilities for video distribution. Such facilities are licensed by the FCC and subject to FCC regulations. We have entered into a lease agreement whereby a third party, as FCC licensee, provides us with services and the use of such uplink and downlink facilities. Upon termination or expiration of such agreement, we may need to acquire such authorizations from another licensee or obtain new authorizations. In either case, we would need to apply for and obtain prior FCC consent. From time to time, the FCC places limits or holds on applications related to such authorizations, and we cannot guarantee that the FCC will grant our applications.
Risks relating to our debt
Our substantial debt could adversely affect our financial condition and prevent us from fulfilling our debt obligations.
We have a high level of debt, totaling $12,340 million at December 31, 2021, compared to the book value of shareholders' deficit of $1,706 million on the same date.
Our high level of debt poses risks, including the following risks, particularly in periods of declining revenues:
•we may be unable to service our debt obligations, especially during negative economic, financial credit and market industry conditions;
•we may require a significant portion of our cash flow to pay principal and interest on our outstanding debt, especially during negative economic and market industry conditions;
•the amount available for execution of our DTC strategy, joint ventures, working capital, capital expenditures, dividends and other general corporate purposes may be limited because a significant portion of cash flow is used to pay principal and interest on outstanding debt;
•if our distribution and advertising revenues decline, we may not be able to service our debt;
•if we are unable to successfully execute our DTC strategy, we may not be able to service our debt;
•if we are unable to renew team sports media rights or renew on less favorable terms, we may not be able to service our debt;
•our lenders may not be as willing to lend additional amounts to us for future joint ventures, working capital needs, additional acquisitions or other purposes;
•rating agencies may downgrade our corporate family rating and/or debt ratings which could impair our ability to raise funds, refinance debt, or incur a higher financing cost;
•the cost to borrow from lenders may increase or market rates may increase;
•our ability to access the capital markets may be limited, and we may be unable to issue securities with pricing or other terms that we find attractive, if at all;
•if our cash flow were inadequate to make interest and principal payments, we might have to restructure or refinance our debt or sell an equity interest in one or more of our broadcast stations, our RSNs or the YES Network to reduce debt service obligations;
•we may be limited in our flexibility in planning for and reacting to changes in the industry in which we compete; and
•we may be more vulnerable to adverse economic conditions than less leveraged competitors and thus, less able to withstand competitive pressures.
Any of these events could reduce our ability to generate cash available for debt service, investment, repay, restructure or refinance our debt, seek additional debt or equity capital, make capital improvements or to respond to events that would enhance profitability.
We may not be able to generate sufficient cash to service all of our debt and may be forced to take other actions to satisfy our obligations under our debt, which may not be successful.
Our ability to make scheduled payments on or refinance our debt obligations depends on our financial condition and operating performance, which are subject to prevailing economic and competitive conditions and to certain financial, business, competitive, legislative, regulatory and other factors beyond our control. We may be unable to maintain a level of cash flows from operating activities sufficient to permit us to pay the principal, premium, if any, and interest on our debt.
If our cash flows and capital resources are insufficient to fund our debt service obligations, we could face substantial liquidity problems and could be forced to reduce or delay investments and capital expenditures, or to dispose of equity interests in our RSNs or the YES Network, other material assets or operations, seek additional debt or equity capital or restructure or refinance our debt. We may not be able to affect any such alternative measures, if necessary, on commercially reasonable terms or at all and, even if successful, those alternative actions may not allow us to meet our scheduled debt service obligations. The STG Bank Credit Agreement, the DSG Bank Credit Agreement, and each of the indentures that govern the STG and DSG notes restrict our ability to dispose of assets and use the proceeds from such dispositions and restrict our ability to raise debt or equity capital to be used to repay other debt when it becomes due. We may not be able to consummate those dispositions or to obtain proceeds in an amount sufficient to meet any debt service obligations then due.
If we cannot make scheduled payments on our debt, we will be in default and holders of our debt could declare all outstanding principal and interest to be due and payable, the lenders under the STG Bank Credit Agreement, the DSG Bank Credit
Agreement, and the A/R Facility could terminate their commitments to loan us money, the lenders could foreclose against the assets securing their obligations and we, STG and/or DSG could be forced into bankruptcy or liquidation.
Despite our current level of debt, we and our subsidiaries may still be able to incur substantially more debt. This could further exacerbate the risks to our financial condition described herein.
We and our subsidiaries may be able to incur additional indebtedness in the future. Although the terms of the debt instruments to which we are subject contain restrictions on the incurrence of additional debt, these restrictions are subject to a number of qualifications and exceptions, and the additional debt incurred in compliance with these restrictions could be substantial These restrictions also will not prevent us from incurring obligations that do not constitute indebtedness. If new debt is added to our current debt levels, the related risks that we and the guarantors now face could intensify.
Our variable rate debt subjects us to interest rate risk, which could cause our debt service obligations to increase significantly.
Interest rates may increase in the future. As a result, interest rates on the obligations under the STG Bank Credit Agreement, the DSG Bank Credit Agreement, or other variable rate debt offerings could be higher or lower than current levels. As of December 31, 2021, approximately $5,612 million principal amount of our debt relates to the STG Bank Credit Agreement and the DSG Bank Credit Agreement, in each case subject to variable interest rates. If interest rates increase, our debt service obligations on our variable rate debt would increase even though the amount borrowed remained the same, and our net income and cash flows, including cash available for servicing our debt, would correspondingly decrease. While we may in the future enter into interest rate hedging agreements with respect to our borrowings under certain credit agreements, such agreements are not expected to fully mitigate against interest rate risk.
Commitments we have made to our lenders limit our ability to take actions that could increase the value of our securities and business or may require us to take actions that decrease the value of our securities and business.
Our financing agreements prevent us from taking certain actions and require us to meet certain tests. These restrictions and tests may require us to conduct our business in ways that make it more difficult to repay unsecured debt or decrease the value of our securities and business. These restrictions and tests include the following:
•restrictions on the incurrence, assumption or guaranteeing of additional debt, or the issuance of disqualified stock or preferred stock;
•restrictions on the payment of dividends, other distributions or repurchases of equity;
•restrictions on certain investments and other restricted payments;
•restrictions on transactions with affiliates;
•restrictions on the creation, incurrence, assumption, or suffering the existence of liens;
•restrictions on the sale and disposition of certain assets to third parties;
•restrictions on the issuance of guarantees of and pledges for indebtedness;
•restrictions on consolidation, merger or sale of all or substantially all of our assets;
•restrictions on the ability of certain subsidiaries to limit their ability to pay dividends and make other payments to the Issuers or the guarantors;
•restrictions on the ability to designate restricted subsidiaries as unrestricted subsidiaries and on transfers of assets to unrestricted subsidiaries and other non-guarantor subsidiaries; and
•restrictions or costs to repay or refinance existing debt;
Future financing arrangements may contain additional restrictions and tests. In addition, the limited liability company agreement governing the terms of the preferred equity of Diamond Sports Holdings, LLC ("DSH"), the direct parent of Diamond Sports Intermediate Holdings LLC (“Holdings”) also restricts Holdings’ and all of its subsidiaries’ (including the
Issuers’) ability to pay dividends and make distributions relating to its capital stock, and future issuances of equity by Holdings or any other direct or indirect parent of the Issuers and may contain additional restrictions. All of these restrictive covenants may limit our ability to pursue certain opportunities, limit our ability to raise additional debt or equity financing to operate during general economic or business downturns, prevent us from taking action that could increase the value of our securities or require actions that decrease the value of our securities.
In addition, we may fail to meet the tests and thereby default on one or more of our obligations (particularly if the economy weakens and reduces our advertising revenues). If we default on our obligations, creditors could require immediate payment of the obligations or foreclose on collateral. If this happens, we could be forced to sell equity interests in our RSNs, the YES Network, TV stations or other assets or take other actions that could significantly reduce our value and we may not have sufficient assets or funds to pay our debt obligations.
A failure to comply with covenants under debt instruments could result in a default under such debt instruments, acceleration of amounts due under our debt and loss of assets securing our loans.
Certain of our debt agreements will contain cross-default provisions with other debt, which means that a default under certain of our debt instruments may cause a default under such other debt. As of December 31, 2021, a default under the DSG notes or DSG Bank Credit Agreement would not trigger a cross-default under the STG Bank Credit Agreement or the STG notes, or vice versa.
If we breach certain of our debt covenants, we will be unable to utilize the full borrowing capacity under our debt arrangements and our lenders could require us to repay the debt immediately, and, if the debt is secured, could immediately take possession of the property securing such debt. In addition, because certain of our debt agreements contain cross-default and cross-acceleration provisions with other debt, if any other debtholder of either STG or DSG were to declare its loan due and payable as a result of a default, the holders of the respective debt of STG (STG Bank Credit Agreement and STG notes) or DSG (DSG Bank Credit Agreement, DSG notes, and A/R Facility), might be able to require us to pay those debts immediately.
As a result, any default under debt covenants could have a material adverse effect on our financial condition and our ability to meet our obligations.
General risk factors
Financial and economic conditions may have an adverse impact on our industry, business, and results of operations or financial condition.
Financial and economic conditions could have an adverse effect on the fundamentals of our business, results of operations, and/or financial condition. Poor economic and industry conditions could have a negative impact on our industry or the industry of those customers who advertise on our stations, including, among others, the automotive industry and service businesses, each of which is a significant source of our advertising revenue. Additionally, financial institutions, capital providers, or other consumers may be adversely affected. Potential consequences of any financial and economic decline include:
•the financial condition of those companies that advertise on our stations, sports networks, and digital platforms, including, among others, the automobile manufacturers and dealers, may be adversely affected and could result in a significant decline in our advertising revenue;
•our ability to pursue the divestiture of certain assets at attractive values may be limited;
•the possibility that our business partners, such as counterparties to our outsourcing and news share arrangements and parties to joint ventures with the RSNs, could be negatively impacted and our ability to maintain these business relationships could also be impaired;
•our ability to refinance our existing debt on terms and at interest rates we find attractive, if at all, may be impaired;
•our ability to make certain capital expenditures may be significantly impaired;
•our ability to pursue the acquisition of attractive assets may be limited if we are unable to obtain any necessary additional capital on favorable terms, if at all;
•content providers may cut back on the amount of content we can acquire to program the RSNs or stations; and
•the possibility of our distribution customers losing subscribers, thereby impacting our distribution revenues.
ITEM 1B. UNRESOLVED STAFF COMMENTS
None.
ITEM 2. PROPERTIES
We own and lease facilities consisting of offices, studios, sales offices, and tower and transmitter sites throughout the U.S. Our owned and leased transmitter and tower sites are located in areas to provide maximum signal coverage to our stations’ markets. We believe that all of our properties, both owned and leased, are generally in good operating condition, subject to normal wear and tear, and are suitable and adequate for our current business operations. We believe that no one property represents a material amount of the total properties owned or leased.
ITEM 3. LEGAL PROCEEDINGS
We are a party to lawsuits, claims, and regulatory matters from time to time in the ordinary course of business. Actions currently pending are in various stages and no material judgments or decisions have been rendered by hearing boards or courts in connection with such actions.
ITEM 4. MINE SAFETY DISCLOSURES
None.
PART II
ITEM 5. MARKET FOR REGISTRANT’S COMMON EQUITY, RELATED STOCKHOLDER MATTERS AND ISSUER PURCHASES OF EQUITY SECURITIES
Our Class A Common Stock is listed for trading on the NASDAQ stock market under the symbol "SBGI". Our Class B Common Stock is not traded on a public trading market or quotation system.
As of February 23, 2022, there are approximately 40 shareholders of record of our Class A Common Stock. Many of our shares of Class A Common Stock are held by brokers and institutions on behalf of stockholders, we are unable to estimate the total number of stockholders represented by these record holders.
We intend to pay regular quarterly dividends to our stockholders, although all future dividends on our Common Stock, if any, will be at the discretion of our Board of Directors and will depend on several factors including our results of operations, cash requirements and surplus, financial condition, covenant restrictions, and other factors that the Board of Directors may deem relevant.
In February 2022, we declared a quarterly cash dividend of $0.25 per share.
See Note 3. Stock-Based Compensation Plans within the Consolidated Financial Statements for discussion of our stock-based compensation plans.
Comparative Stock Performance
The following line graph compares the yearly percentage change in the cumulative total shareholder return on our Class A Common Stock with the cumulative total return of the NASDAQ Composite Index and the cumulative total return of the NASDAQ Telecommunications Index (an index containing performance data of radio and television broadcast companies and communication equipment and accessories manufacturers) from December 31, 2016 through December 31, 2021. The performance graph assumes that an investment of $100 was made in the Class A Common Stock and in each Index on December 31, 2016 and that all dividends were reinvested. Total shareholder return is measured by dividing total dividends (assuming dividend reinvestment) plus share price change for a period by the share price at the beginning of the measurement period.
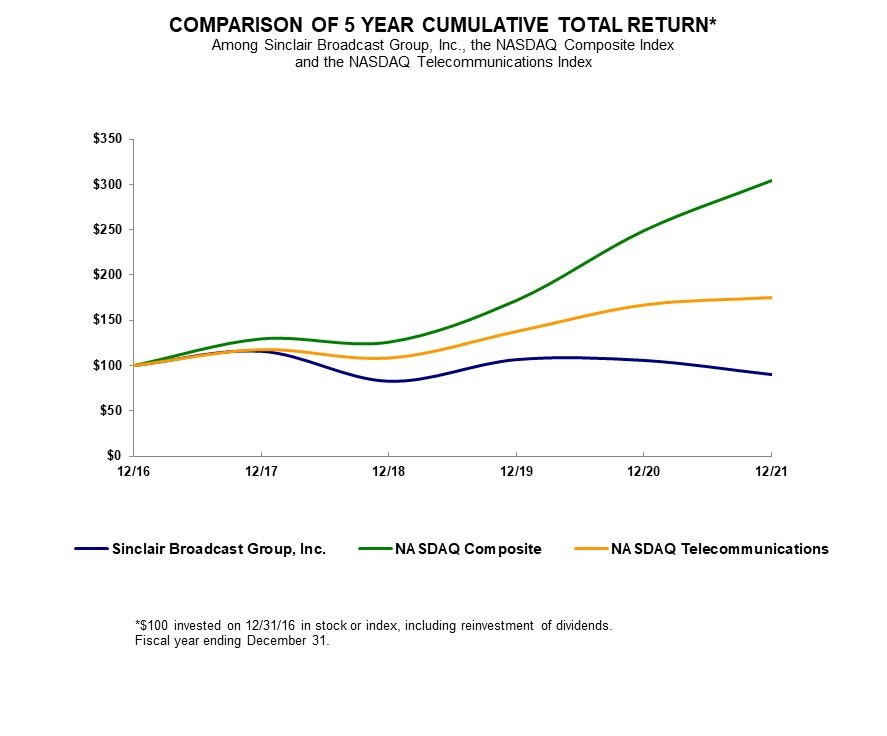
| | | | | | | | | | | | | | | | | | | | | | | | | | | | | | | | | | | | | | |
| Company/Index/Market | | 12/31/2016 | | 12/31/2017 | | 12/31/2018 | | 12/31/2019 | | 12/31/2020 | | 12/31/2021 |
| Sinclair Broadcast Group, Inc. | | 100.00 | | | 115.90 | | | 82.67 | | | 106.67 | | | 105.70 | | | 90.07 | |
| NASDAQ Composite Index | | 100.00 | | | 129.64 | | | 125.96 | | | 172.17 | | | 249.51 | | | 304.85 | |
| NASDAQ Telecommunications Index | | 100.00 | | | 117.62 | | | 108.29 | | | 137.49 | | | 166.70 | | | 174.78 | |
Stock Repurchases
The following table summarizes repurchases of our stock in the quarter ended December 31, 2021:
| | | | | | | | | | | | | | | | | | | | | | | | | | |
| Period | | Total Number of Shares Purchased (a) | | Average Price Per Share | | Total Number of Shares Purchased as Part of a Publicly Announced Program | | Approximate Dollar Value of Shares That May Yet Be Purchased Under the Program (in millions) |
| Class A Common Stock: (b) | | | | | | | | |
| 10/01/21 – 10/31/21 | | — | | | $ | — | | | — | | | $ | — | |
| 11/01/21 – 11/30/21 | | 438,553 | | | $ | 24.42 | | | 438,553 | | | $ | 869 | |
| 12/01/21 – 12/31/21 | | 2,000,032 | | | $ | 25.38 | | | 2,000,032 | | | $ | 819 | |
(a)All repurchases were made in open-market transactions.
(b)On August 4, 2020, the Board of Directors authorized an additional $500 million share repurchase authorization in addition to the previous repurchase authorization of $1 billion. There is no expiration date and currently, management has no plans to terminate this program. For the year ended December 31, 2021, we repurchased approximately 2.4 million shares for $61 million under a 10b5-1 plan. As of December 31, 2021, the total remaining purchase authorization was $819 million.
ITEM 6. [RESERVED]
ITEM 7. MANAGEMENT’S DISCUSSION AND ANALYSIS OF FINANCIAL CONDITION AND RESULTS OF OPERATIONS
Forward Looking Statements
We make statements in this section that are forward-looking statements within the meaning of the federal securities laws. For a complete discussion of forward-looking statements, see the section in this report entitled “Forward-Looking Statements.” Certain risks may cause our actual results, performance or achievements to differ materially from those expressed or implied by the following discussion. For a discussion of such risk factors, see Item 1A. Risk Factors.
Overview
The following Management’s Discussion and Analysis provides qualitative and quantitative information about our financial performance and condition and should be read in conjunction with the other sections in this annual report, including Item 1. Business and the Consolidated Financial Statements, including the accompanying notes to those statements. This discussion consists of the following sections:
Executive Overview — a description of our business, summary of significant events and financial highlights from 2021 and so far in 2022, and information about industry trends;
Critical Accounting Policies and Estimates — a discussion of the accounting policies that are most important in understanding the assumptions and judgments incorporated in the consolidated financial statements and a summary of recent accounting pronouncements;
Results of Operations — a summary of the components of our revenues by category and by network affiliation and a summary of other operating data and an analysis of our revenues and expenses for 2021, 2020, and 2019, including a comparison between 2021 and 2020 and certain expectations for 2022; and
Liquidity and Capital Resources — a discussion of our primary sources of liquidity and contractual cash obligations and an analysis of our cash flows from or used in operating activities, investing activities and financing activities.
EXECUTIVE OVERVIEW
We are a diversified media company with national reach and a strong focus on providing high-quality content on our local television stations, regional and national sports networks, and digital platforms. The content, distributed through our broadcast platform and third-party platforms, consists of programming provided by third-party networks and syndicators, local news, college and professional sports, and other original programming produced by us. Additionally, we own digital media products that are complementary to our extensive portfolio of television station and regional sports network related digital properties. Outside of our media related businesses, we operate technical services companies focused on supply and maintenance of broadcast transmission systems as well as research and development for the advancement of broadcast technology, and we manage other non-media related investments.
We have two reportable segments: broadcast and local sports. Our broadcast segment is comprised of our television stations. Our local sports segment is comprised of our RSNs and the YES Network. We also earn revenues from our owned networks, original content, digital and internet services, technical services, and non-media investments. These businesses are included within other. Corporate and unallocated expenses primarily include our costs to operate as a public company and to operate our corporate headquarters location. Other and corporate are not reportable segments.
STG, for which certain assets and results of operations are included in the broadcast segment and which is one of our wholly owned subsidiaries, is the primary obligor under the STG Bank Credit Agreement, the STG 5.125% unsecured notes due 2027, the STG 5.875% unsecured notes due 2026, the STG 5.500% unsecured notes due 2030, and the STG 4.125% secured notes due 2030 (the STG notes are collectively referred to as the STG Notes). We and substantially all of STG’s subsidiaries (and not DSG nor any of its subsidiaries) are guarantors under the STG debt instruments. DSG, for which certain assets and results of operations are included in the local sports segment and which is one of our subsidiaries, is the primary obligor under the DSG Bank Credit Agreement, the DSG 5.375% secured notes due 2026 and the DSG 12.750% secured notes due 2026 (collectively, the DSG Existing Secured Notes), and the DSG 6.625% unsecured notes due 2027 (collectively with the DSG Existing Secured Notes, the DSG Notes). DSG’s wholly-owned subsidiaries (and not us, STG, or any of STG's subsidiaries) are guarantors under the DSG debt instruments. Our Class A Common Stock and Class B Common Stock remain securities of SBG and not obligations or securities of STG or DSG.
For more information about our business, reportable segments, and our operating strategy, see Item 1. Business in this Annual Report.
Summary of Significant Events
Transactions
• In February 2021, we sold our stations WDKA in Paducah, KY and KBSI in Cape Girardeau, MO for $28 million.
• In February 2021, we acquired the remaining 73% interest we did not already own in ZypMedia, a leading demand-side platform specializing in executing local media campaigns for media companies and agencies in the United States.
• In May 2021, we completed the divestiture of the license assets of KGBT in Harlingen, TX.
• In June 2021, we completed the divestiture of our interests in Triangle Sign & Service, LLC (Triangle) for $12 million.
•In September 2021, we completed the divestiture of our radio stations in the Seattle, Washington market to Lotus Communications for an aggregate consideration of approximately $18 million in cash and advertising rights. The deal included News Radio KOMO 1000 AM & 97.7FM, KPLZ “Star” 101.5 FM, and Talk Radio KVI 570 AM..
Television and Digital Content
• In January 2021, we launched our headline news service The National Desk across our CW and MNT affiliates and several FOX affiliates, as well as on all station websites and STIRR. The service highlights the latest and most pressing news of the day in real time for viewers across the country.
• In April 2021, we announced that for the third year in a row, a Sinclair station was the winner of a prestigious Investigative Reporters & Editors award for its investigative reporting. Our Portland, ME station, WGME (CBS), received the award for its excellent investigative coverage of a flaw in the Veterans Crisis Line, which it identified and helped spur legislative action to correct it.
• In May 2021, The Press Club of Atlantic City honored Sinclair-owned WBFF FOX45 in Baltimore and WKRC Local 12 in Cincinnati with a total of four National Headliner Awards for the news teams’ investigative coverage of critical issues that significantly impact local communities.
• In July 2021, we announced that our Compulse business had transformed into a marketing, technology and managed services company, releasing our Compulse 360 software for digital media, offering omni-channel, digital solutions to enable clients to run local campaigns at scale.
• In July 2021, Tennis Channel extended its media rights agreement with Wimbledon through 2036, adding 12 years to its agreement.
•In August 2021, Tennis Channel launched Tennis Channel International (TCI) streaming service in the U.K. and an ad-supported streaming channel on Samsung TV Plus in India, bringing the total number of international markets to six, along with Austria, Germany, Greece and Switzerland.
•In September 2021, we expanded The National Desk news program to the late evening hours, providing viewers a late-day, comprehensive and commentary-free look at the most impactful national news and regional stories of the day.
•In December 2021, we launched TheNationalDesk.com, featuring round-the-clock breaking news, with content from The National Desk’s dedicated team of journalists as well as our newsrooms around the U.S. The site is available to all viewers, free of charge with no subscription, log in or authentication required.
•In January 2022, two new programs produced in coordination with Stadium, our 24/7 multi-platform sports network, premiered on Bally Sports’ 19 regional sports network brands and the Bally Sports app. “The Rally” is a discussion-based show presenting a young and diverse talent lineup, authentically debating and analyzing the trending sports topics of the day while harnessing the social media conversation and viewer commentary. The Bally Sports RSN brands’ first sports betting program “Live on the Line, Powered by BetMGM” is a partnership with BetMGM, a leading sports betting and iGaming operator. The program highlights national sports betting storylines with a regional appeal, by providing expert picks while looking ahead to the day’s matchups.
•In January 2022, Tennis Channel reached a multiyear agreement with the Women’s Tennis Association (WTA) to telecast year-round WTA matches in Germany, Austria, Switzerland, and the Netherlands through Tennis Channel’s subscription service and digital free ad-supported streaming TV (FAST) channels.
• For the year ended December 31, 2021, our newsrooms won a total of 300 journalism awards, including 37 Regional and one National RTDNA Edward R. Murrow awards and 77 regional Emmy awards.
Distribution, Network and Sports Rights Agreements
•In January 2021, we entered into a multi-year agreement with ViacomCBS across 13 CBS network affiliations reaching about 5% of the U.S. television households.
•In January 2021, we entered into a multi-year agreement with Verizon Communications, Inc. for the continued carriage on Verizon’s FiOS platform of our broadcast television stations and Tennis Channel.
•In February 2021, we entered into a binding term sheet with the Milwaukee Brewers, beginning with the 2021 MLB season, for Bally Sports Wisconsin to continue as the television home of the Brewers.
•In February 2021, we entered into a binding term sheet with the Miami Marlins for a multi-year media rights agreement, beginning with the 2021 MLB season, for Bally Sports Florida to continue as the television home of the Marlins.
•In March 2021, we rebranded 19 of our regional sports networks under the Bally Sports name, ushering in a new era in the way people watch and interact with live sports.
•In March 2021, fuboTV Inc. and Marquee announced a carriage agreement to bring Chicago Cubs game coverage to the fuboTV platform.
•In April 2021, the new Bally Sports app for authenticated users was launched, allowing viewers the ability to watch the entire programming line-up of their local Bally RSN, 24 hours a day, including live games, with a significantly greater amount of functionality and features compared to the app it replaced.
•In April 2021, we agreed to an over-arching distribution deal with Samsung TV for much of our content to be accessible to Samsung TV viewers via apps. Our content to be included includes free streaming platform STIRR, premium networks Tennis Channel (via TVE for authenticated subscribers) and Tennis Channel Plus (SVOD), as well as networks Comet TV and Charge!. Additional networks are expected to be available in the future, including Bally Sports (via TVE for authenticated subscribers) and NewsOn.
•In April 2021, we entered into a multi-year retransmission renewal with Cox for the carriage of our stations, Tennis Channel and our national networks on its platforms and extended carriage of the RSNs and YES Network.
•In September 2021, we renewed affiliation agreements with the CW Network for 24 owned and operated markets for multi-year terms. At the same time, the CW renewed affiliation agreements in another eight markets for stations to which we provide sales and other services for multi-year terms.
•In September 2021, we extended our programming agreement with MyNetworkTV through the 2022-2023 broadcast season.
•In September 2021, we entered into a new multi-year agreement with the Cleveland Cavaliers.
•In October 2021, we entered into a new multi-year agreement with the Detroit Red Wings.
•In October 2021, we entered into a new multi-year media rights agreement with the Detroit Tigers. The agreement includes direct to consumer and other digital rights.
•In October 2021, we entered into a multi-year renewal with Altice for the carriage of our broadcast stations, Tennis Channel, the Bally RSNs, and the YES Network on its Optimum and Suddenlink owned systems.
•In November 2021, we reached a new, multi-year carriage agreement with DISH Network Corporation, ensuring our local stations will remain on DISH TV, and the Tennis Channel will remain available on DISH TV and SLING TV.
•In December 2021, DSG entered into a multi-year renewal of its digital and outer market distribution rights agreement with the NHL. Under the agreement, the Bally RSNs are permitted to offer streaming content, including live games, on an authenticated and DTC basis, to the local territories of 12 NHL teams. The agreement was expanded to allow post-game highlights on our digital news platforms, alternative feeds, and use of the NHL’s proprietary Puck and Player Tracking data in the broadcasts of the games.
•In January 2022, DSG renewed its extended market and digital distribution rights agreement with the NBA. Under the agreement, the Bally RSNs are permitted to offer streaming content, including live games, on an authenticated and DTC basis, to the local territories of 16 NBA teams. The agreement also includes expanded content and highlight rights as well as access to the distribution of classic games in our local markets. The agreement has a term of one year with three successive one-year renewal offers, subject to compliance with the agreement.
•In January 2022, we entered into multi-year renewals of the NBC affiliations and Fox affiliations in a total of 20 of our markets. Our partners to which we provide sales and other services to under joint sales agreements or master service agreements also renewed NBC affiliations in four markets and Fox affiliations in seven markets.
•In the near term, we are seeking renewal of certain of our other distribution agreements. Our largest near-term distribution agreement in our local sports segment was originally scheduled to expire in February 2022 and is operating under a short-term extension while the parties continue negotiations. For the year ended December 31, 2021, distribution revenue from the Distributor under this agreement accounted for 28.8% of our local sports segment distribution revenues.
NEXTGEN TV
•In April 2021, CAST.ERA, a media technology joint venture between us and SK Telecom, announced it will launch a next generation broadcast solution this year that boosts television content quality utilizing SK Telecom's 5G cloud and AI technology.
•In January 2022, the NextGen Video Information Systems Alliance (NVISA) published new consumer-facing research, sponsored by our subsidiary, ONE Media 3.0, that offered the first insight into which features American consumers want most in a NextGen Broadcast-enabled emergency information service. These include a desire for geo-targeted alerts, the ability to screen for only selected alerts, options for updated alerts, and importantly, a robust/dependable system that does not crash when the Internet or cell system goes down. All of these features are embedded in the NextGen Broadcast service.
•In January 2022, MPEG LA, a pioneer in the formation and management of patent pools, completed the formation of the ATSC 3.0 Patent Pool, dramatically simplifying the efficient licensing of the new ATSC 3.0 broadcast technology in multiple-receive devices, easing the distribution and deployment process. Included in the ATSC 3.0 Patent Pool are various patents owned by our subsidiary, ONE Media.
•In 2021 and to date in 2022, we, in coordination with other broadcasters, and led by our joint venture, BitPath, have deployed NEXTGEN TV, powered by ATSC 3.0, in the twelve additional markets below. This brings the total number of our markets in which NEXTGEN TV has been deployed to 23:
| | | | | | | | | | | | | | | | | | | | |
| Month | | Market | | Number of Stations | | Our Stations |
| January 2021 | | Columbus, OH | | 4 | | WSYX (ABC/FOX), WWHO(a) (CW), WTTE(b) (TBD) |
| March 2021 | | Buffalo, NY | | 5 | | WNYO (MNT), WUTV (FOX) |
| March 2021 | | Syracuse, NY | | 3 | | WSTM (NBC), WTVH(a) (CBS) |
| May 2021 | | Grand Rapids, MI | | 6 | | WWMT (CBS) |
| June 2021 | | Baltimore, MD | | 6 | | WBFF (FOX), WNUV(b) (CW) |
| June 2021 | | Little Rock, AR | | 5 | | KATV (ABC) |
| September 2021 | | Cincinnati, OH | | 5 | | WKRC-TV (CBS) |
| September 2021 | | St. Louis, MO | | 5 | | KDNL-TV (ABC) |
| December 2021 | | Charleston, WV | | 5 | | WCHS-TV (ABC) |
| December 2021 | | Greensboro, NC | | 4 | | WXLV-TV (ABC), WMYV (MyNet) |
| December 2021 | | Washington, D.C. | | 6 | | WJLA (ABC), WIAV-CD (TBD) |
| January 2022 | | Green Bay, WI | | 5 | | WLUK-TV (FOX), WCWF (CW) |
(a)The license and programming assets for these stations are currently owned by a third party. We provide certain non-programming related sales, operational, and administrative services to these stations pursuant to service agreements, such as JSAs and SSAs.
(b)The license asset for this station is currently owned by a third party. We provide programming, sales, operational, and administrative services to this station pursuant to certain service agreements, such as LMAs.
Financing, Capital Allocation, and Shareholder Returns
•In April 2021, we amended the STG Bank Credit Agreement to raise the STG Term Loan B-3 in an aggregate principal amount of $740 million which matures in April 1, 2028, the proceeds of which were used to refinance a portion of STG's term loan.
•In November 2021, we purchased and assumed the lenders’ and the administrative agent’s rights and obligations under the existing A/R Facility of DSG's indirect subsidiary, Diamond Sports Finance SPV, LLC. We purchased the lenders’ outstanding loans and commitments under the A/R Facility by making a payment to the lenders as consideration for the purchase of the lenders’ respective rights and obligations under the A/R Facility equal to approximately $184.4 million, representing 101% of the aggregate outstanding principal amount of the loans under the A/R Facility, plus any accrued interest and outstanding fees and expenses, amended certain terms of the facility, and extended the maturity to September 2024.
•In January 2022, we entered into a Transaction Support Agreement with various lenders holding term loans under DSG’s existing credit facilities and various holders of DSG’s outstanding 5.375% Senior Secured Notes due 2026 (the "Existing DSG 5.375% Notes") and 12.750% Senior Secured Notes due 2026 (the "DSG 12.750% Notes"), on the principal terms of a new first lien money financing and recapitalization, whereby DSG intends to raise $635 million in new capital pursuant to a first-priority term loan (the "New DSG First Lien Term Loan") and to defer the cash payment of a portion of its management fee to STG over the next five years, which together are expected to provide approximately $1 billion of liquidity enhancement over the next five years to DSG and enable DSG to strengthen its balance sheet, fund the launch of its DTC product, and provide for future liquidity. See Note 20. Subsequent Events within the Consolidated Financial Statements.
•In February 2022, pursuant to the Transaction Support Agreement, DSG commenced a private exchange offer of new second-priority lien 5.375% Senior Secured Notes due 2026 (the “DSG 5.375% Second Lien Secured Notes”) to eligible holders of its outstanding first-priority lien 5.375% Senior Secured Notes due 2026. At the same time, DSG commenced a private exchange offer of new second-priority lien term loans to its lenders holding existing first-priority lien term loans. The note exchange expires on March 10, 2022, with an early tender deadline of February 28, 2022, while the loan exchange expires on February 28, 2022. The exchanges are conditioned on receiving requisite consent of the noteholders and lenders. The closing of the new $635 million first-priority lien term loan is conditioned on the successful completion of the exchanges and other customary closing conditions. See Note 20. Subsequent Events within the Consolidated Financial Statements.
•For the year ended December 31, 2021, we repurchased approximately 2.4 million shares of Class A Common Stock for $61 million. As of February 23, 2022, we repurchased an additional 2 million shares of Class A Common Stock for $55 million since January 1, 2022. The shares were repurchased under a 10b5-1 plan.
•For the year ended December 31, 2021, we paid dividends of $0.80 per share. In February 2022, we declared a quarterly cash dividend of $0.25 per share, an increase in our quarterly cash dividend of 25%.
Other Events
•In January 2021, we announced the hiring of Jeffrey Lewis as our Chief Compliance Officer, a newly-created position to supervise corporate compliance functions, including regulatory, code of conduct, competition, and privacy.
• In January 2021, we jointly revealed, with Bally's, the new Bally Sports logo and Bally Sports regional monikers for our owned and operated RSNs.
• In March 2021, we announced an enterprise-wide workforce reduction involving the termination of approximately 500 employees and incurred approximately $7 million of restructuring and related charges.
• In April 2021, we increased the size of our Board of Directors and named Laurie R. Beyer to serve as its newest independent board member.
• In April 2021, we announced that Bally Sports, Tennis Channel, and its High School Sports Division collectively, won nine Cynopsis Sports Media Awards, including "RSN of the Year."
•In April 2021, we signed a multi-year enterprise partnership agreement with Operative Media to enable us to consolidate all our sellable advertising assets across our platforms into a single ad sales system. The framework enables us to offer our customers a simplified and optimized solution to buying from our extensive ad inventory across all of our platforms.
• In May 2021, we announced the retirement of Barry Faber, President of Distribution and Network Relations, effective June 25, 2021.
• In June 2021, Fortune Magazine named the Company to the Fortune 500 for the first time, ranking it 465 on the list.
• In June 2021, at the Company's Annual Shareholders' Meeting, the Company's shareholders re-elected all ten Directors, ratified the appointment of PricewaterhouseCoopers LLP as the Company's independent registered public accounting firm for the fiscal year ending December 31, 2021, approved the amended and restated Employee Stock Purchase Plan, and approved an amendment to the Company's 1996 Long-Term Incentive Plan to increase the number of shares authorized for issuance thereunder.
•In June 2021, we selected seven winning applicants for our Broadcast Diversity Scholarship, awarding tuition assistance to students demonstrating a promising future in the broadcast industry.
• In June and July 2021, we partnered with the American Red Cross for the “Sinclair Cares: Roll Up Your Sleeves” campaign, to urge our viewers to help increase U.S. blood supplies by making a blood donation appointment, volunteering time, or providing financial contributions for the cause.
• In July 2021, we hired John McClure to the newly created role of Vice President and Chief Information Security Officer.
•In August 2021, we appointed William Bell as Head of Distribution and Network Relations.
•In September 2021, our television stations collectively raised nearly $0.7 million for local charities through regional back-to-school fundraising and supply donation initiatives. Our stations also donated over $0.6 million in promotional air time to support these initiatives.
•On October 17, 2021, we identified the following: (i) certain servers and workstations in our environment were encrypted with ransomware, (ii) disruption of certain office and operational networks as a result of the encryption, and (iii) indications that data was taken from our network. Promptly upon detection of the security event, senior management was notified and we began to implement incident response measures to contain the incident, conduct an investigation, and plan for restoring operations. Legal counsel, a cybersecurity forensic firm, and other incident response professionals were engaged, and law enforcement and other governmental agencies were notified. The investigation into the incident remains ongoing. The cybersecurity incident resulted in the loss in the fourth quarter of 2021 of approximately $63 million of advertising revenue, primarily related to our broadcast segment, as well as approximately $11 million through the date of filing this Form 10-K in costs and expenses related to mitigation efforts, our ongoing investigation and the security improvements resulting therefrom, however we paid no ransom. These amounts exceed the limits under our insurance policies and thus, based on the known effects of the cyber incident, the Company estimates that the cyber incident has resulted in approximately $24 million of unrecoverable net loss through the date of filing this Form 10-K.
•In October 2021, we partnered with the Disabled American Veterans for the "Sinclair Cares: Supporting American Veterans" campaign, encouraging our employees and viewers to volunteer or donate to help support veterans in their communities.
•In December 2021, we partnered with the American Red Cross for the “Sinclair Cares: Tornado Relief” campaign, raising $175,000 in total from viewers and Sinclair corporate donations to assist those affected by the devastating tornadoes in the South and Midwest.
•In December 2021, our television stations and RSNs collected 140,000 toys, tens of thousands pounds of food and several truckloads of clothing, sleeping bags, blankets and monetary donations for local charities through regional holiday drives. Regional recipients across the country include local community food banks, Toys for Tots, The Salvation Army, Bikes for Kids, The Forgotten Child Fund, Neediest Kids, Habitat for Humanity, The United Way and Central Arizona Shelter Services, among others.
•In January 2022, we began taking applications for our 2022 Diversity Scholarship, which has awarded more than $100,000 in scholarships over the last six years.
•In February 2022, we announced the promotion of Rob Weisbord to Chief Operating Officer and President of Broadcast.
Industry Trends
•During the last few years, the number of subscribers to Distributor services in the United States has generally been declining, as technological advancements have driven changes in consumer behavior and have empowered consumers to seek more control over when, where and how they consume news, sports and other entertainment, including through the so-called “cutting the cord” and other consumption strategies.
•The Distributor industry has continued to undergo significant consolidation, which gives top Distributors purchase power.
•Distributors have introduced, marketed and/or modified tiers or bundles of programming that have impacted the number of subscribers that receive our RSNs, including tiers or bundles of programming that exclude our RSNs. We expect these trends to continue for the foreseeable future. We believe the emergence of DTC and OTT offerings will provide us the opportunity to compete with these products and services offered by Distributors
•The vMVPDs have continued to gain increasing importance and have quickly become a critical segment of the market. These vMVPDs offer a limited number of networks at a lower price point as compared to the traditional cable offering.
•Political spending is significantly higher in the even-numbered years due to the cyclicality of political elections. In addition, every four years, political spending is typically elevated further due to the advertising related to the presidential election. 2020 proved to be a record year in political advertising.
•The FCC has permitted broadcast television stations to use their digital spectrum for a wide variety of services including multi-channel broadcasts. The FCC “must-carry” rules only apply to a station’s primary digital stream.
•Seasonal advertising increases within our broadcast segment occur in the second and fourth quarters due to the anticipation of certain seasonal and holiday spending by consumers.
•Seasonal advertising increases within our local sports segment occur in the second and third quarters due to a higher volume of sports games being played during this time, particularly the MLB season.
•Broadcasters have found ways to increase returns on their news programming initiatives while continuing to maintain locally produced content through the use of news sharing arrangements.
•Broadcasters have begun to expand their own DTC platforms.
•Advertising revenue related to the Summer Olympics occurs in even numbered years, with the exception of 2020 which was postponed due to COVID-19 and took place in Summer 2021, and the Super Bowl is aired on a different network each year. Both of these popularly viewed events can have an impact on our advertising revenues.
CRITICAL ACCOUNTING POLICIES AND ESTIMATES
This discussion and analysis of our financial condition and results of operations is based on our consolidated financial statements which have been prepared in accordance with accounting principles generally accepted in the United States. The preparation of these financial statements requires us to make estimates and judgments that affect the reported amount of assets, liabilities, revenues and expenses and related disclosure of contingent assets and liabilities. On an on-going basis, we evaluate our estimates including those related to revenue recognition, goodwill and intangible assets, program contract costs, sports programming rights, income taxes and variable interest entities. We base our estimates on historical experience and on various other assumptions that are believed to be reasonable under the circumstances, the results of which form the basis for making judgments about the carrying values of assets and liabilities that are not readily apparent from other sources. These estimates have been consistently applied for all years presented in this report and in the past we have not experienced material differences between these estimates and actual results. However, because future events and their effects cannot be determined with certainty, actual results could differ from our estimates and such differences could be material.
We consider the following accounting policies to be the most critical as they are important to our financial condition and results of operations, and require significant judgment and estimates on the part of management in their application. For a detailed discussion of the application of these and other accounting policies, see Note 1. Nature of Operations and Summary of Significant Accounting Policies within the Consolidated Financial Statements.
The COVID-19 pandemic continues to create significant uncertainty and disruption in the global economy and financial markets. It is reasonably possible that these uncertainties continue to impact our estimates related to, but not limited to, revenue recognition, goodwill and intangible assets, sports programming rights, and income taxes. As a result, many of our estimates and assumptions require increased judgment and carry a higher degree of variability and volatility. See Distribution Revenue in Revenue Recognition, Sports Programming Rights, and Impairment of Goodwill, Intangibles, and Other Assets under Note 1. Nature of Operations and Summary of Significant Accounting Policies within the Consolidated Financial Statements for further discussion on how COVID-19 has impacted distribution revenue, sports rights expense, and the value of goodwill and definite-lived intangible assets, respectively. Our estimates may further change in the future as the COVID-19 pandemic continues, new events occur, and additional information emerges, and such changes are recognized or disclosed in the consolidated financial statements.
Revenue Recognition. As discussed in Revenue Recognition under Note 1. Nature of Operations and Summary of Significant Accounting Policies within the Consolidated Financial Statements, we generate advertising revenue primarily from the sale of advertising spots/impressions on our broadcast television, RSNs, and digital platforms. Advertising revenue is recognized in the period in which the advertising spots/impressions are delivered. In arrangements where we provide audience ratings guarantees; to the extent that there is a ratings shortfall, we will defer a proportionate amount of revenue until the ratings shortfall is settled through the delivery of additional advertising. The term of our advertising arrangements is generally less than one year and the timing between when an advertisement is aired and when payment is realized is not significant. In certain circumstances, we require customers to pay in advance; payments received in advance of satisfying our performance obligations are reflected as deferred revenue.
We generate distribution revenue through fees received from Distributors and other OTT providers for the right to distribute our broadcast channels and cable networks on their distribution platforms. Distribution arrangements are generally governed by multi-year contracts and the underlying fees are based upon a contractual monthly rate per subscriber. These arrangements represent licenses of intellectual property; revenue is recognized as the signal is provided to our customers (as usage occurs) which corresponds with the satisfaction of our performance obligation. Revenue is calculated based upon the contractual rate multiplied by an estimated number of subscribers. Our customers will remit payments based upon actual subscribers a short time after the conclusion of a month, which generally does not exceed 120 days. Historical adjustments to subscriber estimates have not been material.
Certain of our distribution arrangements contain provisions that require the Company to deliver a minimum number of live professional sports games or tournaments during a defined period which usually corresponds with a calendar year. If the minimum threshold is not met, we may be obligated to refund a portion of the distribution fees received if shortfalls are not cured within a specified period of time. If we are unable to meet these minimum requirements, we reduce revenue based upon estimated rebates due to our distribution customers over the measurement period of the rebate. See Revenue Recognition within Note 1. Nature of Operations and Summary of Significant Accounting Policies.
Impairment of Goodwill, Indefinite-Lived Intangible Assets, and Other Long-Lived Assets. We evaluate our goodwill and indefinite-lived intangible assets for impairment annually, or more frequently, if events or changes in circumstances indicate an impairment may exist. As of December 31, 2021, our consolidated balance sheet includes $2,088 million and $150 million of goodwill and indefinite-lived intangible assets, respectively. We evaluate long-lived assets, including definite-lived intangible assets, for impairment whenever events or changes in circumstances indicate that the carrying value of our asset groups may not be recoverable.
In the performance of our annual goodwill and indefinite-lived intangible asset impairment assessments we have the option to qualitatively assess whether it is more likely-than-not that the respective asset has been impaired. If we conclude that it is more-likely-than-not that a reporting unit or an indefinite-lived intangible asset is impaired, we apply the quantitative assessment, which involves comparing the estimated fair value of the reporting unit or indefinite-lived intangible asset to its respective carrying value. See Impairment of Goodwill, Intangibles and Other Assets under Note 1. Nature of Operations and Summary of Significant Accounting Policies and Note 5. Goodwill, Indefinite-Lived Intangible Assets, and Other Intangible Assets within the Consolidated Financial Statements for further discussion of the significant judgments and estimates inherent in both qualitatively assessing whether impairment may exist and estimating the fair values of the reporting units and indefinite-lived intangible assets if a quantitative assessment is deemed necessary.
We are required to analyze our long-lived assets, including definite-lived intangible assets, for impairment. We evaluate our definite-lived intangible assets for impairment if events or changes in circumstances indicate that the carrying amount of such assets may not be recoverable. In the event we identify indicators that these assets are not recoverable, we evaluate the recoverability of definite-lived intangible assets by comparing the carrying amount of the assets within an asset group to the estimated undiscounted future cash flows associated with the asset group. An asset group represents the lowest level of cash flows generated by a group of assets that are largely independent of the cash flows of other assets. At the time that such evaluations indicate that the future undiscounted cash flows are not sufficient to recover the carrying value of the asset group, an impairment loss is determined by comparing the estimated fair value of the asset group to the carrying value. We estimate fair value using an income approach involving the performance of a discounted cash flow analysis.
Our RSNs included in the local sports segment were negatively impacted by the loss of three Distributors in 2020. In addition, our existing Distributors experienced elevated levels of subscriber erosion which we believe was influenced, in part, by shifting consumer behaviors resulting from media fragmentation, the current economic environment, the COVID 19 pandemic and related uncertainties. Most of these factors are also expected to have a negative impact on future projected revenue and margins of our RSNs. As a result of these factors, we performed an impairment test of the RSN reporting units' goodwill and long-lived asset groups during the third quarter of 2020 which resulted in a non-cash impairment charge on goodwill of $2,615 million, customer relationships of $1,218 million, and other definite-lived intangible assets of $431 million, included within impairment of goodwill and definite-lived intangible assets in our consolidated statements of operations within the Consolidated Financial Statements. See Note 5. Goodwill, Indefinite-Lived Intangible Assets, and Other Intangible Assets within the Consolidated Financial Statements for more information. During the year ended December 31, 2021, we did not identify any indicators that our definite-lived intangible assets may not be recoverable. For our annual goodwill and indefinite-lived intangibles impairment tests related to our broadcast and other reporting units in 2021, 2020, and 2019, we concluded that it was more-likely-than-not that goodwill was not impaired based on our qualitative assessments. For one reporting unit in 2019, we elected to perform a quantitative assessment and concluded that its fair value significantly exceeded the carrying value.
We believe we have made reasonable estimates and utilized appropriate assumptions in the performance of our impairment assessments. If future results are not consistent with our assumptions and estimates, including future events such as a deterioration of market conditions, loss of significant customers, failure to execute on DSG's DTC strategy, and significant increases in discount rates, among other factors, we could be exposed to impairment charges in the future. Any resulting impairment loss could have a material adverse impact on our consolidated balance sheets, consolidated statements of operations and consolidated statements of cash flows.
Program Contract Costs. As discussed in Broadcast Television Programming under Note 1. Nature of Operations and Summary of Significant Accounting Policies within the Consolidated Financial Statements, we record an asset and corresponding liability for programming rights when the program is available for its first showing or telecast. These costs are expensed over the period in which an economic benefit is expected to be derived. To ensure the related assets for the programming rights are reflected in our consolidated balance sheets at the lower of unamortized cost or fair value, management estimates future advertising revenue to be generated by the remaining program material available under the contract terms. Management’s judgment is required in determining the timing of expense for these costs, which is dependent on the economic benefit expected to be generated from the program and may significantly differ from the timing of related payments under the contractual obligation. If our estimates of future advertising revenues decline, amortization expense could be accelerated or fair value adjustments may be required.
Sports Programming Rights. As discussed in Sports Programming Rights under Note 1. Nature of Operations and Summary of Significant Accounting Policies within the Consolidated Financial Statements, we have multi-year program rights agreements that provide us with the right to produce and telecast professional sports games within a specified territory in exchange for an annual rights fee. A prepaid asset is recorded for rights acquired related to future games upon payment of the contracted fee. The assets recorded for the acquired rights are classified as current or non-current based on the period when the games are expected to be aired. Liabilities are recorded for any program rights obligations that have been incurred but not yet paid at period end. We amortize these programming rights as an expense over each season based upon contractually stated rates. Amortization is accelerated in the event that the stated contractual rates over the term of the rights agreement results in an expense recognition pattern that is inconsistent with the projected growth of revenue over the contractual term.
Fair Value Measurements of Investments in Bally's Securities. As discussed in Note 6. Other Assets and Note 18. Fair Value Measurements within the Consolidated Financial Statements, we entered into a commercial agreement with Bally’s Corporation on November 18, 2020. As part of this arrangement, the Company received warrants and options to acquire common equity in the business. These financial instruments are measured each period at fair value. The fair value of the options are derived utilizing a Black Scholes valuation model which utilizes a number of inputs which most significantly includes the trading price of the underlying common stock, the exercise price of the options and a discount for lack of marketability. The fair value of the warrants are primarily derived from the trading price of the underlying common stock, the exercise price of the warrants and a discount for lack of marketability. The determination of the fair value of these financial instruments requires the Company to exercise judgment.
Income Tax. As discussed in Income Taxes under Note 1. Nature of Operations and Summary of Significant Accounting Policies within the Consolidated Financial Statements, we recognize deferred tax assets and liabilities based on the differences between the financial statement carrying amounts and the tax bases of assets and liabilities. We provide a valuation allowance for deferred tax assets if we determine that it is more likely than not that some or all of the deferred tax assets will not be realized. In evaluating our ability to realize net deferred tax assets, we consider all available evidence, both positive and negative, including our past operating results, tax planning strategies, current and cumulative losses, and forecasts of future taxable income. In considering these sources of taxable income, we must make certain judgments that are based on the plans and estimates used to manage our underlying businesses on a long-term basis. As of December 31, 2021 and 2020, a valuation allowance has been provided for deferred tax assets related to certain temporary basis differences, interest expense carryforwards under the Internal Revenue Code (IRC) Section 163(j) and a substantial amount of our available state net operating loss carryforwards based on past operating results, including the RSN impairment, expected timing of the reversals of existing temporary basis differences, alternative tax strategies and projected future taxable income. Future changes in operating and/or taxable income or other changes in facts and circumstances could significantly impact the ability to realize our deferred tax assets which could have a material effect on our consolidated financial statements.
Management periodically performs a comprehensive review of our tax positions, and we record a liability for unrecognized tax benefits if such tax positions are more likely than not to be sustained upon examination based on their technical merits, including the resolution of any appeals or litigation processes. Significant judgment is required in determining whether positions taken are more likely than not to be sustained, and it is based on a variety of facts and circumstances, including interpretation of the relevant federal and state income tax codes, regulations, case law and other authoritative pronouncements. Based on this analysis, the status of ongoing audits and the expiration of applicable statute of limitations, liabilities are adjusted as necessary. The resolution of audits is unpredictable and could result in tax liabilities that are significantly higher or lower than for what we have provided. See Note 12. Income Taxes within the Consolidated Financial Statements, for further discussion of accrued unrecognized tax benefits.
Variable Interest Entities (VIEs). As discussed in Note 14. Variable Interest Entities within the Consolidated Financial Statements, we have determined that certain third-party licensees of stations for which we perform services pursuant to arrangements, including LMAs, JSAs, and SSAs, are VIEs and we are the primary beneficiary of those variable interests because, subject to the ultimate control of the licensees, we have the power to direct the activities which significantly impact the economic performance of the VIE through the services we provide and because we absorb losses and returns that would be considered significant to the VIEs. We have determined that certain RSN joint ventures are VIEs. We are the primary beneficiary of those RSN joint ventures because we have the power to direct the activities which significantly impact the economic performance of certain regional sports networks, including sales and certain operational services and because we absorb losses and returns that would be considered significant to the VIEs.
Transactions with Related Parties. We have determined that we conduct certain business-related transactions with related persons or entities. See Note 15. Related Person Transactions within the Consolidated Financial Statements for discussion of these transactions.
Recent Accounting Pronouncements
See Recent Accounting Pronouncements under Note 1. Nature of Operations and Summary of Significant Accounting Policies within the Consolidated Financial Statements for a discussion of recent accounting policies and their impact on our financial statements.
RESULTS OF OPERATIONS
Any references to the first, second, third or fourth quarters are to the three months ended March 31, June 30, September 30, or December 31, respectively, for the year being discussed. We have two reportable segments, broadcast and local sports, that are disclosed separately from our other and corporate activities.
Seasonality / Cyclicality
The operating results of our broadcast segment are usually subject to cyclical fluctuations from political advertising. In even numbered years, political spending is usually significantly higher than in odd numbered years due to advertising expenditures preceding local and national elections. Additionally, every four years, political spending is usually elevated further due to advertising expenditures preceding the presidential election (as was the case in 2020). Also, the second and fourth quarter operating results are usually higher than the first and third quarter operating results because advertising expenditures are increased in anticipation of certain seasonal and holiday spending by consumers.
The operating results of our local sports segment are usually subject to cyclical fluctuations based on the timing and overlap of the MLB, NBA, and NHL seasons. Usually, the second and third quarter operating results are higher than the first and fourth quarter operating results.
Consolidated Operating Data
The following table sets forth certain of our consolidated operating data for the years ended December 31, 2021, 2020, and 2019 (in millions).
| | | | | | | | | | | | | | | | | |
| | Years Ended December 31, |
| | 2021 | | 2020 | | 2019 |
| Media revenues (a) | $ | 6,083 | | | $ | 5,843 | | | $ | 4,046 | |
| Non-media revenues | 51 | | | 100 | | | 194 | |
| Total revenues | 6,134 | | | 5,943 | | | 4,240 | |
| Media programming and production expenses | 4,291 | | | 2,735 | | | 2,073 | |
| Media selling, general and administrative expenses | 908 | | | 832 | | | 732 | |
| Depreciation and amortization expenses (b) | 591 | | | 674 | | | 424 | |
| Amortization of program contract costs | 93 | | | 86 | | | 90 | |
| Non-media expenses | 57 | | | 91 | | | 156 | |
| Corporate general and administrative expenses | 170 | | | 148 | | | 387 | |
| Impairment of goodwill and definite-lived intangible assets | — | | | 4,264 | | | — | |
| Gain on asset dispositions and other, net of impairment | (71) | | | (115) | | | (92) | |
| Operating income (loss) | $ | 95 | | | $ | (2,772) | | | $ | 470 | |
| Net (loss) income attributable to Sinclair Broadcast Group | $ | (414) | | | $ | (2,414) | | | $ | 47 | |
(a)Media revenues include distribution revenue, advertising revenue, and other media related revenues.
(b)Depreciation and amortization includes depreciation and amortization of property and equipment and amortization of definite-lived intangible assets and other assets.
The Impact of COVID-19 on our Results of Operations
Overview
On March 11, 2020, the World Health Organization declared COVID-19 a pandemic, and by the end of the following day, each of the MLB, NBA, and NHL had suspended their seasons. On March 13, 2020, the United States declared a national state of emergency. As of December 31, 2021, the national state of emergency is still in effect, however substantially all states have reopened their economies, COVID-19 vaccinations are being distributed in mass quantities and all professional sports leagues are currently playing live games. However, with new variants of COVID-19 being detected across multiple countries, including the United States, there is still a heightened level of uncertainty of what the overall impact of COVID-19 will be on our business.
Broadcast segment
During the year ended December 31, 2021, as compared to the prior year, we experienced a decrease in advertising revenue primarily due to a decrease in political revenue as 2021 was a non-political year. See Revenues under the Broadcast Segment section below for further discussion.
Local sports segment
In March 2020, the NBA and NHL each postponed their 2019-2020 season and the MLB postponed the start of its 2020 season, however all leagues' returned to operation under reduced game counts and were able to complete these modified seasons during the early part of the fourth quarter of 2020. The NBA and NHL began their modified 2020-2021 seasons during the fourth quarter of 2020 and the first quarter of 2021, respectively, and the MLB began its 2021 season on April 1, 2021. Advertising revenue increased in the year ended December 31, 2021, as compared to the prior year, largely driven by an increased number of games played in 2021 when compared to 2020. Distribution revenue increased in the year ended December 31, 2021, as compared to 2020, primarily related to 2020 revenue being reduced due to the accrual of rebates to our Distributors resulting from the cancellation of professional sports games due to the COVID-19 pandemic. The MLB began their season on time in April 2021 and completed their full game schedule and the NBA and NHL began their 2021-2022 seasons in October 2021 under full game schedules. However, in light of the fourth quarter 2021 spike in COVID-19 cases, both the NHL and NBA have had to postpone and reschedule some of their games during their 2021-22 seasons. Of the total 11 NBA games postponed in the fourth quarter of 2021, 2 of which related to the RSNs, have been rescheduled for the first quarter 2022. Of the total 104 NHL games postponed during the 2021-22 season, 38 of which related to the RSNs, the majority were shifted from the fourth quarter 2021 to the first quarter 2022. The shift in these games to 2022 resulted in an increase in the estimated rebates to our Distributors of $8 million during the fourth quarter of 2021. Both leagues currently expect to finish their regular seasons on schedule, although there can be no assurance that the NBA or NHL will complete full seasons in the future. On December 2, 2021, MLB owners locked out players following the expiration of its prior collective bargaining agreement with its players. While negotiations towards a new collective bargaining agreement have commenced, there can be no assurance that an agreement will be reached prior to the commencement of the 2022 MLB season or at all, therefore there can be no assurance that the MLB will complete a full season in 2022 or in future years. Any reduction in the actual number of games played by the leagues may have an adverse impact on our operations and the cash flows of our local sports segment. See Distribution Revenue in Revenue Recognition and Sports Programming Rights under Note 1. Nature of Operations and Summary of Significant Accounting Policies within the Consolidated Financial Statements for further discussion on how COVID-19 has impacted distribution revenue and sports rights expense, respectively, including the need for us to provide rebates to our Distributors as well as seek rebate from or reduce future payments to certain of the sports teams.
Business continuity
Within the United States, our business has been designated an essential business, which allows us to continue to serve our customers, however, the COVID-19 pandemic has disrupted our operations. Certain of our facilities have experienced temporary disruptions as a result of the COVID-19 pandemic, and we cannot predict whether our facilities will experience more significant disruptions in the future and how long these disruptions will last. The COVID-19 pandemic has heightened the risk that a significant portion of our workforce will suffer illness or otherwise be unable to work. Furthermore, reductions in our workforce may become necessary as a result of declines in our business caused by the COVID-19 pandemic. If we take such actions, we cannot assure that we will be able to rehire our workforce once our business has recovered.
A discussion regarding our financial results and operations for the year ended December 31, 2021 compared to the year ended December 31, 2020 is presented below. A discussion of the year ended December 31, 2020 compared to the year ended December 31, 2019 can be found under Item 7 of Part II of our Annual Report on Form 10-K for the year ended December 31, 2020, filed with the SEC on March 1, 2021 (our "2020 Annual Report"), which is available free of charge on the SEC's website at www.sec.gov and our Investor Relations website at www.sbgi.net/investor-relations.
BROADCAST SEGMENT
The following table sets forth our revenue and expenses for our broadcast segment, previously referred to as our local news and marketing services segment, for the years ended December 31, 2021, 2020, and 2019 (in millions):
| | | | | | | | | | | | | | | | | | | | | | | | | | | | | |
| | | | | | | | Percent Change
Increase / (Decrease) |
| | 2021 | | 2020 | | 2019 | | ‘21 vs.‘20 | | ‘20 vs.‘19 |
| Revenue: | | | | | | | | | |
| Distribution revenue | $ | 1,475 | | | $ | 1,414 | | | $ | 1,341 | | | 4% | | 5% |
| Advertising revenue | 1,106 | | | 1,364 | | | 1,268 | | | (19)% | | 8% |
| Other media revenue (a) | 176 | | | 144 | | | 81 | | | 22% | | 78% |
| Media revenues | $ | 2,757 | | | $ | 2,922 | | | $ | 2,690 | | | (6)% | | 9% |
| | | | | | | | | |
| Operating Expenses: | | | | | | | | | |
| Media programming and production expenses | $ | 1,344 | | | $ | 1,257 | | | $ | 1,173 | | | 7% | | 7% |
| Media selling, general and administrative expenses | 593 | | | 553 | | | 553 | | | 7% | | —% |
| Amortization of program contract costs | 76 | | | 83 | | | 90 | | | (8)% | | (8)% |
| Corporate general and administrative expenses | 147 | | | 119 | | | 144 | | | 24% | | (17)% |
| Depreciation and amortization expenses | 247 | | | 239 | | | 246 | | | 3% | | (3)% |
| Gain on asset dispositions and other, net of impairment | (24) | | | (118) | | | (62) | | | (80)% | | 90% |
| Operating income | $ | 374 | | | $ | 789 | | | $ | 546 | | | (53)% | | 45% |
(a)Includes $111 million, $100 million, and $35 million for the years ended December 31, 2021, 2020 and 2019, respectively, of intercompany revenue related to certain services provided to the local sports segment and other under management services agreements, which is eliminated in consolidation.
Revenues
Distribution revenue. Distribution revenue, which includes payments from Distributors for our broadcast signals, increased $61 million in 2021, when compared to the same period in 2020, primarily due to an increase in rates, partially offset by a decrease in subscribers.
Advertising revenue. Advertising revenue decreased $258 million in 2021, when compared to the same period in 2020, primarily due to a decrease in political advertising revenue of $329 million, as 2020 was a political and presidential election year, and due to the effects of the cybersecurity incident that occurred during the fourth quarter of 2021, which we currently estimate resulted in a decrease in revenue of approximately $63 million. The decrease is partially offset by increases in various non-political advertising categories due to improved macroeconomic conditions, as the economy began to recover from the COVID-19 pandemic in 2021.
For the year ending December 31, 2022 we expect an increase in advertising revenue, when compared to 2021, primarily related to an increase in political revenue, as 2022 is a political election year.
The following table sets forth our affiliate percentages of advertising revenue for the years ended December 31, 2021, 2020, and 2019:
| | | | | | | | | | | | | | | | | | | | | | | | | | | |
| | # of | | Percent of Advertising Revenue for the
Twelve Months Ended December 31, | | |
| | Channels (a) | | 2021 | | 2020 | | 2019 | | | | |
| ABC | 40 | | 31% | | 28% | | 30% | | | | |
| FOX | 56 | | 24% | | 25% | | 25% | | | | |
| CBS | 31 | | 20% | | 22% | | 20% | | | | |
| NBC | 25 | | 14% | | 15% | | 13% | | | | |
| CW | 46 | | 5% | | 5% | | 6% | | | | |
| MNT | 40 | | 4% | | 4% | | 4% | | | | |
| Other | 396 | | 2% | | 1% | | 2% | | | | |
| Total | 634 | | | | | | | | | | |
(a)We broadcast other programming from the following providers on our channels including: Antenna TV, Azteca, Bounce, CHARGE!, Comet, Dabl, Decades, Estrella TV, GetTV, Grit, MeTV, Rewind, Stadium, TBD, Telemundo, This TV, UniMas, Univision, and Weather.
Other Media Revenue. Other media revenue increased $32 million in 2021, when compared to the same period in 2020. The increase is primarily due to an $11 million increase in intercompany revenue from the local sports and other segments related to providing certain services under a management services agreement, which are eliminated in our consolidated results.
Expenses
Media programming and production expenses. Media programming and production expenses increased $87 million during 2021, when compared to the same period in 2020, primarily related to an increase in fees pursuant to network affiliation agreements of $99 million, partially offset by a $19 million decrease in employee compensation costs.
Media selling, general and administrative expenses. Media selling, general and administrative expenses increased $40 million during 2021, when compared to the same period in 2020, primarily due a $17 million increase in employee compensation costs, a portion of which is related to severance and other termination benefits related to a reduction-in-force completed in the first quarter of 2021, a $13 million increase in technology costs, and $7 million primarily related to FCC penalties incurred by several consolidated VIEs, as discussed in Note 13. Commitments and Contingencies within the Consolidated Financial Statements.
Amortization of program contract costs. The amortization of program contract costs decreased $7 million during 2021, when compared to the same period in 2020, primarily related to the timing of amortization on long-term contracts and reduced renewal costs, partially offset by amortization related to new programming.
Corporate general and administrative expenses. See explanation under Corporate and Unallocated Expenses.
Depreciation and amortization expenses. Depreciation of property and equipment and amortization of definite-lived intangibles and other assets increased $8 million during 2021, when compared to the same period in 2020, primarily due to an increase in assets placed in-service.
Gain on asset dispositions and other, net of impairments. During 2021 and 2020, we recorded a gain of $24 million and $90 million, respectively, related to reimbursements from the FCC's National Broadband Plan spectrum repack process. For the year ended 2021, we recorded a gain on asset disposition of $12 million, related to the WDKA-TV/KBSI-TV transaction, and a loss of $12 million, related to the sale of our radio stations, primarily related to the write-down of the carrying value of the assets to estimate the selling price. For the year ended 2020, we recorded a gain of $29 million related to the sale of KGBT-TV and WDKY-TV. See Dispositions within Note 2. Acquisitions and Dispositions of Assets within the Consolidated Financial Statements for further discussion.
LOCAL SPORTS SEGMENT
Our local sports segment, previously referred to as our sports segment, reflects the results of our RSNs and a minority equity interest in the YES Network. The RSNs and YES Network own the exclusive rights to air, among other sporting events, the games of professional sports teams.
The following table sets forth our revenue and expenses for our local sports segment for the years ended December 31, 2021, 2020, and 2019 (in millions):
| | | | | | | | | | | | | | | | | | | | | | | | | |
| | | | | | | Percent Change
Increase / (Decrease) |
| 2021 | | 2020 | | 2019 (b) | | ‘21 vs.‘20 | | |
| Revenue: | | | | | | | (c) | | |
| Distribution revenue | $ | 2,620 | | | $ | 2,472 | | | $ | 1,029 | | | 6% | | |
| Advertising revenue | 409 | | | 196 | | | 103 | | | 109% | | |
| Other media revenue | 27 | | | 18 | | | 7 | | | 50% | | |
| Media revenue | $ | 3,056 | | | $ | 2,686 | | | $ | 1,139 | | | 14% | | |
| | | | | | | | | |
| Operating Expenses: | | | | | | | | | |
| Media programming and production expenses | $ | 2,793 | | | $ | 1,361 | | | $ | 769 | | | 105% | | |
| Media selling, general and administrative expenses (a) | 297 | | | 243 | | | 90 | | | 22% | | |
| Depreciation and amortization expenses | 316 | | | 410 | | | 157 | | | (23)% | | |
| Corporate general and administrative | 10 | | | 10 | | | 93 | | | —% | | |
| Gain on asset dispositions and other, net of impairment | (43) | | | — | | | — | | | n/m | | |
| Impairment of goodwill and definite-lived intangible assets | — | | | 4,264 | | | — | | | n/m | | |
| Operating (loss) income (a) | $ | (317) | | | $ | (3,602) | | | $ | 30 | | | (91)% | | |
| Income from equity method investments | $ | 49 | | | $ | 6 | | | $ | 18 | | | 717% | | |
| Other income, net | $ | 15 | | | $ | 160 | | | $ | 200 | | | (91)% | | |
(a)Includes $109 million, $98 million and $35 million for the years ended December 31, 2021, 2020 and 2019, respectively, of intercompany expense related to certain services provided by the broadcast segment under a management services agreement, which is eliminated in consolidation.
(b)Represents the activity from the closing date of the acquisition of the Acquired RSNs of August 23, 2019 through December 31, 2019.
(c)Marquee was launched in late February 2020, therefore although not called out in each section below, is a driver of the changes between the periods due to a full year of activity being included in the current period, versus only 10 months of activity in the prior period.
Distribution revenue. Distribution revenue, which is generated through fees received from Distributors for the right to distribute our RSNs, increased $148 million for the year ended December 31, 2021, when compared to the same period in 2020. During the year ended 2020, distribution revenue was reduced by $420 million, related to the accrual of rebates to our Distributors resulting from the cancellation of professional sports games due to the COVID-19 pandemic. Distribution revenue was increased during the year ended December 31, 2021 by $8 million, primarily related to a reduction of accrued rebates due to an increase in estimated games related to the NBA. See discussion under Revenue Recognition within Note 1. Nature of Operations and Summary of Significant Accounting Policies within the Consolidated Financial Statements for further discussion. Excluding the effect of these accrued rebates and related adjustments, distribution revenue declined by $280 million in 2021 when compared to the same period in 2020, and was primarily driven by the loss of three Distributors in 2020 and subscriber churn with remaining Distributors, partially offset by increases in rates. We expect distribution revenue to decrease for the year ending December 31, 2022 when compared to 2021 due to continued subscriber churn.
Advertising revenue. Advertising revenue is primarily generated from sales of commercial time within the RSNs' programming. Advertising revenue increased $213 million for the year ended December 31, 2021, when compared to the same period in 2020, primarily due to a higher number of games being played in 2021, when compared to 2020, due to the suspension of the league seasons in March 2020 and the resulting reduction of the number of games played in 2020. We expect advertising revenue for the year ending December 31, 2022 to increase when compared to 2021.
Media programming and production expenses. Media programming and production expenses are primarily related to amortization of our sports programming rights with MLB, NBA, and NHL teams, and the costs of producing and distributing content for our brands including live games, pre-game and post-game shows, and backdrop programming.
Media programming and production expenses increased $1,432 million for the year ended December 31, 2021, when compared to the same period in 2020, primarily driven by a $1,272 million increase in sports rights amortization expense, a $91 million increase in employee compensation cost related to freelance talent, and a $67 million increase in production expenses, all of which increased as a result of an increase in the number of games played compared to the same period in the prior year.
The increases in the number of games played in 2021, when compared to the same period in 2020, are primarily driven by the suspension of the 2019-2020 NBA and NHL seasons and the 2020 MLB season in early March 2020. The changes to the seasons were in response to the COVID-19 pandemic and resulted in a higher number of games during 2021, as compared to the prior year. We expect media programming and production expenses for the year ending December 31, 2022 to decrease when compared to 2021. See The Impact of COVID-19 on our Results of Operations for further discussion.
Media selling, general, and administrative expenses. Media selling, general, and administrative expenses increased $54 million for the year ended December 31, 2021, when compared to the same period in 2020, primarily related to a $22 million increase in information technology expenses, a $13 million increase in national sales commissions, an $11 million increase of management services agreement fees, and a $5 million increase in third-party fulfillment costs from our digital business.
Depreciation and amortization. Depreciation and amortization expense decreased $94 million for the year ended December 31, 2021, when compared to the same period in 2020, primarily due to a decrease in amortization expense due to lower intangible asset values as a result of an impairment in 2020.
Corporate general and administrative expenses. See explanation under Corporate and Unallocated Expenses.
Other income, net. See explanation under Corporate and Unallocated Expenses.
Gain on asset dispositions and other, net of impairments. For the year ended December 31, 2021, we recognized a gain of $43 million, related to the fair value of equipment that we received as part of an agreement with a communications provider in connection with the C-Band repack process in which we received equipment with a fair value of $58 million, at maximum cost to us of $15 million.
Income from equity method investments. For the year ended December 31, 2021 we recognized income from equity method investments of $49 million, which is primarily related to our minority ownership interest in the YES Network. The increase in the amount of income recognized when compared to the year ended December 31, 2020 was primarily due to an increase in the number of games played compared to the same period in the prior year.
OTHER
The following table sets forth our revenues and expenses for our owned networks and content, non-broadcast digital and internet solutions, technical services, and non-media investments (collectively, other) for the years ended December 31, 2021, 2020, and 2019 (in millions):
| | | | | | | | | | | | | | | | | | | | | | | | | | | | | |
| | | | | | | Percent Change
Increase / (Decrease) |
| 2021 | | 2020 | | 2019 | | ‘21 vs.‘20 | | ‘20 vs.‘19 |
| Revenue: | | | | | | | | | |
| Distribution revenue | $ | 193 | | | $ | 199 | | | $ | 130 | | | (3)% | | 53% |
| Advertising revenue | 217 | | | 131 | | | 110 | | | 66% | | 19% |
| Other media revenues | 13 | | | 7 | | | 13 | | | 86% | | (46)% |
| Media revenues (a) | $ | 423 | | | $ | 337 | | | $ | 253 | | | 26% | | 33% |
| Non-media revenues (b) | $ | 58 | | | $ | 114 | | | $ | 217 | | | (49)% | | (47)% |
| | | | | | | | | |
| Operating Expenses: | | | | | | | | | |
| Media expenses (c) | $ | 325 | | | $ | 254 | | | $ | 257 | | | 28% | | (1)% |
| Non-media expenses (d) | $ | 60 | | | $ | 98 | | | $ | 168 | | | (39)% | | (42)% |
| Amortization of program contract costs | $ | 17 | | | $ | 3 | | | $ | — | | | 467% | | n/m |
| Corporate general and administrative expenses | $ | 1 | | | $ | 1 | | | $ | 1 | | | —% | | —% |
| (Gain) loss on asset dispositions and other, net of impairments | $ | (4) | | | $ | 3 | | | $ | (4) | | | n/m | | n/m |
| Operating income | $ | 51 | | | $ | 65 | | | $ | 26 | | | (22)% | | 150% |
| Loss from equity method investments | $ | (4) | | | $ | (42) | | | $ | (53) | | | (90)% | | (21)% |
n/m — not meaningful
(a)Media revenues for the year ended December 31, 2021 include $39 million of intercompany revenues related to certain services provided to the broadcast segment, which are eliminated in consolidation.
(b)Non-media revenues for the years ended December 31, 2021, 2020, and 2019 include $7 million, $14 million, and $23 million, respectively, of intercompany revenues related to certain services provided to the broadcast segment, which are eliminated in consolidation.
(c)Media expenses for the years ended December 31, 2021 and 2020 includes $10 million and $2 million, respectively, of intercompany expenses primarily related to certain services provided by the broadcast segment, which are eliminated in consolidation..
(d)Non-media expenses for the years ended December 31, 2021, 2020, and 2019 include $3 million, $7 million, and $12 million, respectively, of intercompany expenses related to certain services provided by the broadcast segment, which are eliminated in consolidation.
Revenue. Media revenue increased $86 million during 2021, when compared to the same period in 2020, primarily due to an increase in advertising revenue related to our owned networks and digital initiatives. Non-media revenue decreased $56 million during 2021, when compared to the same period in 2020, primarily due to a decrease in broadcast equipment sales due to the winding down of the FCC's National Broadband Plan repack process and the sale of Triangle in the second quarter of 2021.
Expenses. Media expenses increased $71 million during 2021,when compared to the same period in 2020, primarily related to expenses associated with the increased sales within our owned networks and our digital initiatives, as well as increased content costs. Non-media expenses decreased $38 million during 2021, when compared to the same period in 2020, primarily due to a decrease in the costs of goods associated with our lower broadcast equipment sales and the sale of Triangle in the second quarter of 2021.
Amortization of program contract costs. The amortization of program contract costs increased $14 million during 2021,when compared to the same period in 2020, primarily related to increases in costs of the programming content related to our owned networks.
Corporate general and administrative expenses. See explanation under Corporate and Unallocated Expenses.
Gain on asset dispositions and other, net of impairments. During the year ended December 31, 2021, we sold our controlling interest in Triangle for $12 million. We recognized a gain on the sale of Triangle of $6 million, which is included in the gain on asset dispositions and other, net of impairment in our consolidated statements of operations.
CORPORATE AND UNALLOCATED EXPENSES
The following table presents our corporate and unallocated expenses for the years ended December 31, 2021, 2020, and 2019 (in millions):
| | | | | | | | | | | | | | | | | | | | | | | | | | | | | |
| | | | | | | | Percent Change
Increase/ (Decrease) |
| | 2021 | | 2020 | | 2019 | | ‘21 vs.‘20 | | ‘20 vs.‘19 |
| Corporate general and administrative expenses | $ | 170 | | | $ | 148 | | | $ | 387 | | | 15% | | (62)% |
| Interest expense including amortization of debt discount and deferred financing costs | $ | 618 | | | $ | 656 | | | $ | 422 | | | (6)% | | 55% |
| Loss on extinguishment of debt | $ | (7) | | | $ | (10) | | | $ | (10) | | | (30) | | — |
| Other (expense) income, net | $ | (14) | | | $ | 325 | | | $ | 6 | | | (104)% | | n/m |
| Income tax benefit | $ | 173 | | | $ | 720 | | | $ | 96 | | | (76)% | | 650% |
| Net income attributable to the redeemable noncontrolling interests | $ | (18) | | | $ | (56) | | | $ | (48) | | | (68) | | 17 |
| Net (income) loss attributable to the noncontrolling interests | $ | (70) | | | $ | 71 | | | $ | (10) | | | n/m | | n/m |
n/m — not meaningful
Corporate general and administrative expenses. The table above and the explanation that follows cover total consolidated corporate general and administrative expenses. Corporate general and administrative expenses increased in total by $22 million during 2021, when compared to the same period in 2020, primarily due to $16 million in employee compensation cost, a portion of which is related to severance and other termination benefits related to the reduction-in-force completed in the first quarter of 2021, and a $6 million increase to technology costs primarily related to the cyber security ransomware attack in the fourth quarter of 2021.
We expect corporate general and administrative expenses to decrease in 2022 when compared to 2021.
Interest expense. The table above and explanations that follows cover total consolidated interest expense. Interest expense decreased by $38 million during 2021 compared to 2020. The decrease is primarily due to a $24 million decrease in DSG interest expense and a $12 million decrease in STG interest expense, each related to decreases in LIBOR and refinancing of STG existing indebtedness that occurred in 2021.
We expect interest expense to increase in 2022 when compared to 2021.
Other income, net. Other income, net decreased by $339 million during 2021, when compared to the same period in 2020, primarily due to a measurement adjustment gain related to certain variable payment obligations of $159 million and an increase in the value of investments recorded at fair value of $158 million, both recorded in 2020. See Note 13. Commitments and Contingencies and Note 6. Other Assets within the Consolidated Financial Statements for further information.
Income tax benefit. The 2021 income tax benefit for our pre-tax loss of $499 million resulted in an effective tax rate of 34.7%. The 2020 income tax benefit for our pre-tax loss of $3,149 million resulted in an effective tax rate of 22.9%. The increase in the effective tax rate from 2020 to 2021 is primarily due to the greater benefit impact in 2021 from federal tax credits related to investments in sustainability initiatives.
As of December 31, 2021, we had a net deferred tax asset of $293 million as compared to a net deferred tax asset of $197 million as of December 31, 2020. The increase in net deferred tax asset primarily relates to the 2021 changes in fair value of certain equity securities and items related to fixed assets.
As of December 31, 2021, we had $15 million of gross unrecognized tax benefits, all of which, if recognized, would favorably affect our effective tax rate. We recognized $1 million of income tax expense for interest related to uncertain tax positions for the year ended December 31, 2021. See Note 12. Income Taxes within the Consolidated Financial Statements for further information.
Net income attributable to the redeemable noncontrolling interests. For the year ended December 31, 2021, net income attributable to the redeemable noncontrolling interests decreased $38 million, when compared to the same period in 2020, primarily due to a lower average preferred equity balance outstanding in 2021 compared to 2020, as a result of redemptions that occurred in 2020.
Net (income) loss attributable to the noncontrolling interests. For the year ended December 31, 2021, net income attributable to the noncontrolling interests increased $141 million, when compared to the same period in 2020, primarily as a result of the portion of the non-cash impairment charge on customer relationships, other definite-lived intangible assets and goodwill recorded in 2020 that was attributable to the noncontrolling interests.
LIQUIDITY AND CAPITAL RESOURCES
As of December 31, 2021, we had net working capital of approximately $1,269 million, including $816 million in cash and cash equivalent balances. Cash on hand, cash generated by our operations, and borrowing capacity under the Bank Credit Agreements are used as our primary sources of liquidity.
The Bank Credit Agreements each include a financial maintenance covenant, the first lien leverage ratio (as defined in the respective Bank Credit Agreements), which requires such applicable ratio not to exceed 4.5x and 6.25x, measured as of the end of each fiscal quarter, for STG and DSG, respectively. The respective financial maintenance covenant is only applicable if 35% or more of the capacity (as a percentage of total commitments) under the respective Revolving Credit Facility, measured as of the last day of each quarter, is utilized under such Revolving Credit Facility as of such date. Since there was no utilization under either of the Revolving Credit Facilities as of December 31, 2021, neither STG nor DSG was subject to the respective financial maintenance covenant under their applicable Bank Credit Agreement. As of December 31, 2021, the STG first lien leverage ratio was below 4.5x and the DSG first lien leverage ratio exceeded 6.25x. We expect that DSG's first lien leverage ratio will remain above 6.25x for at least the next 12 months, which will restrict our ability to fully utilize the DSG Revolving Credit Facility. We do not currently expect to have more than the 35% of the capacity of the DSG Revolving Credit Facility outstanding as of any quarterly measurement date during the next 12 months, therefore we do not expect DSG will be subject to the financial maintenance covenant. The Bank Credit Agreements contain other restrictions and covenants which the respective entities were in compliance with as of December 31, 2021 and expect to be over the next 12 months. See Note 20. Subsequent Events within the Consolidated Financial Statements.
On April 1, 2021, STG amended the STG Bank Credit Agreement to raise the STG Term Loan B-3 in an aggregate principal amount of $740 million, the proceeds of which were used to refinance a portion of STG's term loan maturing in January 2024. The STG Term Loan B-3 matures in April 2028 and bears interest at LIBOR (or successor rate) plus 3.00%.
The A/R Facility enables DSG to raise incremental funding for the ongoing business needs of the local sports segment. Prior to November 5, 2021, the maximum funding availability under the A/R Facility was the lesser of $250 million and the sum of the lowest aggregate loan balance since November 1, 2020 plus $50 million. On November 5, 2021, the Company purchased and assumed the lenders’ and the administrative agent’s rights and obligations under the A/R Facility by making a payment to the lenders equal to approximately $184.4 million, representing 101% of the aggregate outstanding principal amount of the loans under the A/R Facility, plus any accrued interest and outstanding fees and expenses. In connection therewith, the Company and Diamond Sports Finance SPV, LLC (DSPV) entered into an omnibus amendment to the A/R Facility to provide greater flexibility to DSG, including (i) increasing the maximum facility limit availability from up to $250 million to up to $400 million; (ii) eliminating the early amortization event related to DSG’s earnings before interest, taxes, depreciation and amortization (EBITDA), as defined in the agreement governing the A/R Facility, less interest expense covenant; (iii) extending the stated maturity date by one year from September 23, 2023 to September 23, 2024; and (iv) relaxing certain concentration limits thereby increasing the amounts of certain accounts receivable eligible to be sold. The other material terms of the A/R Facility remain unchanged. Transactions related to the A/R Facility are now intercompany transactions and, therefore, are eliminated in consolidation.
For the year ending December 31, 2022, we expect capital expenditures to be within the range of $131 million to $141 million, primarily related to technical, maintenance, and building projects at our stations and RSNs.
We have various contractual obligations which are recorded as liabilities in our consolidated financial statements, such as notes payable, finance leases, and commercial bank financing; operating leases; active television program contracts; and fixed and variable payment obligations. Certain other contractual obligations have not been recognized as liabilities in our consolidated financial statements, such as certain sports programming rights, future television program contracts, and network programming rights. Active television program contracts are included in the balance sheet as an asset and liability while future television program contracts are excluded until the cost is known, the program is available for its first showing or telecast, and the licensee has accepted the program. Industry protocol typically enables us to make payments for television program contracts on a three-month lag, which differs from the contractual timing. As of December 31, 2021, our significant contractual obligations include:
•Total debt, defined as current and long-term notes payable, finance leases, and commercial bank financing, including finance leases of affiliates, of $12,340 million, including current debt, due within the next 12 months, of $69 million.
•Interest due on our total debt in the next twelve months of $554 million, including interest estimated on our variable rate debt calculated at an effective weighted average interest rate of 3.08% as of December 31, 2021.
•Contractual amounts owed through the expiration date of the underlying agreement for sports programming rights, active and future television program contracts, and network programming rights of $16,210 million, including $2,816 million due within the next 12 months. Network programming agreements may include variable fee components such as subscriber levels, which in certain circumstances have been estimated and reflected in the previous amounts based on current subscriber amounts.
See Note 7. Notes Payable and Commercial Bank Financing, Note 8. Leases, Note 9. Program Contracts, and Note 13. Commitments and Contingencies within the Consolidated Financial Statements for further information.
We anticipate that existing cash and cash equivalents, cash flow from our operations, and borrowing capacity under the Bank Credit Agreements will be sufficient to satisfy our debt service obligations, capital expenditure requirements, and working capital needs for the next 12 months. However, certain factors, including but not limited to, the severity and duration of the COVID-19 pandemic and resulting effect on the economy, our advertisers, Distributors, and their subscribers, could affect our liquidity and our first lien leverage ratio which could affect our ability to access the full borrowing capacity under the Bank Credit Agreements. For our long-term liquidity needs, in addition to the sources described above, we may rely upon various sources, such as but not limited to, the issuance of long-term debt, the issuance of equity or other instruments convertible into or exchangeable for equity, or the sale of Company assets. However, there can be no assurance that additional financing or capital or buyers of our Company assets will be available, or that the terms of any transactions will be acceptable or advantageous to us.
DSG's ability to make scheduled payments on its debt obligations depends on its financial condition and operating performance, which are subject to prevailing economic and competitive conditions and to certain financial, business, competitive, legislative, regulatory and other factors beyond its control. The impact of the outbreak of COVID-19 continues to create significant uncertainty and disruption in the global economy and financial markets. Further, DSG's success is dependent upon, among other things, the terms of its agreements with Distributors, OTT and other streaming providers and the successful execution of its DTC strategy. Primarily as a result of losses of Distributors, increased subscriber churn and the COVID-19 pandemic, DSG has experienced operating losses since the second quarter of 2020 and we expect it will continue to incur operating losses in future periods. DSG has taken steps to mitigate the impacts of this uncertainty, including managing its controllable costs, amending its A/R Facility and entering into a Transaction Support Agreement with Sinclair and certain lenders holding term loans under the DSG Bank Credit Agreement and certain holders of, or investment advisors, sub-advisors, or managers of funds or accounts that hold, the existing DSG Notes which contemplates that, among other things, DSG would obtain the New DSG First Lien Term Loan which would mature in May 2026 and would rank first in lien priority on shared collateral ahead of DSG’s loans and/or commitments under the DSG Bank Credit Agreement and the Existing DSG 5.375% Notes. See Note 20. Subsequent Events within the Consolidated Financial Statements.
Sources and Uses of Cash
The following table sets forth our cash flows for the years ended December 31, 2021, 2020, and 2019 (in millions):
| | | | | | | | | | | | | | | | | |
| | 2021 | | 2020 | | 2019 |
| Net cash flows from operating activities | $ | 327 | | | $ | 1,548 | | | $ | 916 | |
| Cash flows used in investing activities: | | | | | |
| Acquisition of property and equipment | $ | (80) | | | $ | (157) | | | $ | (156) | |
| Acquisition of businesses, net of cash acquired | (4) | | | (16) | | | (8,999) | |
| Spectrum repack reimbursements | 24 | | | 90 | | | 62 | |
| Proceeds from the sale of assets | 43 | | | 36 | | | 8 | |
| | | | | |
| | | | | |
| Purchases of investments | (256) | | | (139) | | | (452) | |
| | | | | |
| | | | | |
| | | | | |
| | | | | |
| Other, net | 27 | | | 27 | | | 7 | |
| Net cash flows used in investing activities | $ | (246) | | | $ | (159) | | | $ | (9,530) | |
| Cash flows (used in) from financing activities: | | | | | |
| Proceeds from notes payable and commercial bank financing | $ | 357 | | | $ | 1,819 | | | $ | 9,956 | |
| Repayments of notes payable, commercial bank financing, and finance leases | (601) | | | (1,739) | | | (1,236) | |
| | | | | |
| Proceeds from the issuance of redeemable subsidiary preferred equity, net | — | | | — | | | 985 | |
| Repurchase of outstanding Class A Common Stock | (61) | | | (343) | | | (145) | |
| Dividends paid on Class A and Class B Common Stock | (60) | | | (63) | | | (73) | |
| Dividends paid on redeemable subsidiary preferred equity | (5) | | | (36) | | | (33) | |
| Redemption of redeemable subsidiary preferred equity | — | | | (547) | | | (297) | |
| Debt issuance costs | (1) | | | (19) | | | (199) | |
| | | | | |
| Distributions to noncontrolling interests | (95) | | | (32) | | | (27) | |
| Distributions to redeemable noncontrolling interests | (6) | | | (383) | | | (5) | |
| Other, net | (52) | | | (117) | | | (39) | |
| Net cash flows (used in) from financing activities | $ | (524) | | | $ | (1,460) | | | $ | 8,887 | |
Operating Activities
Net cash flows from operating activities decreased during the year ended December 31, 2021, when compared to the same period in 2020. The decrease is primarily related to higher payments for production and overhead costs, Distributor rebate payments, and payments for sports rights, partially offset by an increase in cash collections from Distributors.
Investing Activities
Net cash flows used in investing activities increased during the year ended December 31, 2021, when compared to the same period in 2020. The increase is primarily related to lower spectrum repack reimbursements and higher purchases of investments, offset by lower capital expenditures, the sale of WDKA and KBSI during the first quarter of 2021 and the sale of Triangle during the second quarter of 2021.
Financing Activities
Net cash flows used in financing activities decreased during the year ended December 31, 2021, when compared to the same period in 2020. The decrease is primarily related to lower repurchases of Class A Common Stock during 2021 as compared to 2020, as well as the redemption of the Redeemable Subsidiary Preferred Equity and distributions to the redeemable noncontrolling interests during 2020.
ITEM 7A. QUANTITATIVE AND QUALITATIVE DISCLOSURES ABOUT MARKET RISK
We are exposed to market risk from changes in interest rates and consider entering into derivative instruments primarily for the purpose of reducing the impact of changing interest rates on our floating rate debt and to reduce the impact of changing fair market values on our fixed rate debt. See Note 7. Notes Payable and Commercial Bank Financing within the Consolidated Financial Statements for further discussion. We did not have any outstanding derivative instruments during the three years ended December 31, 2021, 2020, and 2019.
We are exposed to risk from the changing interest rates of our variable rate debt issued under the Bank Credit Agreements. As of December 31, 2021, our total variable rate debt under the Bank Credit Agreements was $5,612 million. We estimate that adding 1% to respective interest rates would result in an increase in our interest expense of $56 million.
ITEM 8. FINANCIAL STATEMENTS AND SUPPLEMENTARY DATA
The financial statements and supplementary data required by this item are filed as exhibits to this report, are listed under Item 15(a)(1) and (2) and are incorporated by reference in this report.
ITEM 9. CHANGES IN AND DISAGREEMENTS WITH ACCOUNTANTS ON ACCOUNTING AND FINANCIAL DISCLOSURE
There were no changes in and/or disagreements with accountants on accounting and financial disclosure during the year ended December 31, 2021.
ITEM 9A. CONTROLS AND PROCEDURES
Evaluation of Disclosure Controls and Procedures and Internal Control over Financial Reporting
Our management, under the supervision and with the participation of our Chief Executive Officer and Chief Financial Officer, evaluated the design and effectiveness of our disclosure controls and procedures and our internal control over financial reporting as of December 31, 2021.
The term “disclosure controls and procedures,” as defined in Rules 13a-15(e) and 15d-15(e) under the Exchange Act, means controls and other procedures of a company that are designed to provide reasonable assurance that information required to be
disclosed by a company in the reports that it files or submits under the Exchange Act is recorded, processed, summarized and reported, within the time periods specified in the SEC’s rules and forms. Disclosure controls and procedures include, without limitation, controls and procedures designed to provide reasonable assurance that information required to be disclosed by a company in the reports that it files or submits under the Exchange Act is accumulated and communicated to our management, including its principal executive and principal financial officers, as appropriate, to allow timely decisions regarding required disclosure. Management recognizes that any controls and procedures, no matter how well designed and operated, can provide only reasonable assurance of achieving their objectives and management necessarily applies its judgment in evaluating the cost-benefit relationship of possible controls and procedures.
The term “internal control over financial reporting,” as defined in Rules 13a-15d-15(f) under the Exchange Act, means a process designed by, or under the supervision of our Chief Executive and Chief Financial Officers and effected by our Board of Directors, management and other personnel, to provide reasonable assurance regarding the reliability of financial reporting and the preparation of financial statements for external purposes in accordance with generally accepted accounting principles (GAAP) and includes those policies and procedures that:
•pertain to the maintenance of records that in reasonable detail accurately and fairly reflect the transactions and dispositions of our assets;
•provide reasonable assurance that transactions are recorded as necessary to permit preparation of financial statements in accordance with GAAP and that our receipts and expenditures are being made in accordance with authorizations of management or our Board of Directors; and
•provide reasonable assurance regarding prevention or timely detection of unauthorized acquisition, use or disposition of our assets that could have a material adverse effect on our financial statements.
Assessment of Effectiveness of Disclosure Controls and Procedures
Based on the evaluation of our disclosure controls and procedures as of December 31, 2021, our Chief Executive Officer and Chief Financial Officer concluded that, as of such date, our disclosure controls and procedures were effective at the reasonable assurance level.
Report of Management on Internal Control over Financial Reporting
Our management is responsible for establishing and maintaining adequate internal control over financial reporting. Under the supervision and with the participation of our management, including our Chief Executive Officer and Chief Financial Officer, we assessed the effectiveness of our internal control over financial reporting as of December 31, 2021 based on the criteria set forth in Internal Control - Integrated Framework issued by the Committee of Sponsoring Organizations of the Treadway Commission (2013 framework) (COSO). Based on our assessment, management has concluded that, as of December 31, 2021, our internal control over financial reporting was effective based on those criteria.
The effectiveness of our internal control over financial reporting as of December 31, 2021 has been audited by PricewaterhouseCoopers LLP, an independent registered public accounting firm, as stated in their report which is included herein.
Changes in Internal Control over Financial Reporting
There have been no changes in our internal control over financial reporting (as defined in Rules 13a-15(f) and 15d-15(f) under the Exchange Act) during the quarter ended December 31, 2021, that have materially affected, or are reasonably likely to materially affect, our internal control over financial reporting.
Limitations on the Effectiveness of Controls
Management, including our Chief Executive Officer and Chief Financial Officer, do not expect that our disclosure controls and procedures or our internal control over financial reporting will prevent all errors and all fraud. A control system, no matter how well designed and operated, can provide only reasonable, not absolute, assurance that the objectives of the control system are met. Further, the design of a control system must reflect the fact that there are resource constraints and the benefits of controls must be considered relative to their costs. Because of the inherent limitations in all control systems, no evaluation of controls can provide absolute assurance that all control issues and instances of fraud, if any, within our company have been detected. These inherent limitations include the realities that judgments in decision-making can be faulty and that breakdowns can occur because of simple error or mistake. Additionally, controls can be circumvented by the individual acts of some persons, by collusion of two or more people, or by management’s override of the control. The design of any system of controls also is based in part upon certain assumptions about the likelihood of future events and there can be no assurance that any design will succeed in achieving its stated goals under all potential future conditions; over time, controls may become inadequate because of changes in conditions, or the degree of compliance with the policies or procedures may deteriorate. Because of the inherent limitations in a cost-effective control system, misstatements due to error or fraud may occur and not be detected.
ITEM 9B. OTHER INFORMATION
None.
PART III
ITEM 10. DIRECTORS, EXECUTIVE OFFICERS AND CORPORATE GOVERNANCE
The information required by this Item will be included in our Proxy Statement for the 2022 Annual Meeting of Stockholders under the captions, “Directors, Executive Officers and Key Employees,” “Delinquent Section 16(a) Reports,” “Code of Business Conduct and Ethics” and “Corporate Governance,” which will be filed with the SEC no later than 120 days after the close of the fiscal year ended December 31, 2021 and is incorporated by reference in this report.
ITEM 11. EXECUTIVE COMPENSATION
The information required by this Item will be included in our Proxy Statement for the 2022 Annual Meeting of Stockholders under the captions, “Compensation Discussion and Analysis”, “Director Compensation for 2021,” “Compensation Committee Interlocks and Insider Participation,” and “Compensation Committee Report,” which will be filed with the SEC no later than 120 days after the close of the fiscal year ended December 31, 2021 and is incorporated by reference in this report.
ITEM 12. SECURITY OWNERSHIP OF CERTAIN BENEFICIAL OWNERS AND MANAGEMENT AND RELATED STOCKHOLDER MATTERS
The information required by this Item will be included in our Proxy Statement for the 2022 Annual Meeting of Stockholders under the caption, “Security Ownership of Certain Beneficial Owners and Management,” which will be filed with the SEC no later than 120 days after the close of the fiscal year ended December 31, 2021 and is incorporated by reference in this report.
ITEM 13. CERTAIN RELATIONSHIPS AND RELATED TRANSACTIONS, AND DIRECTOR INDEPENDENCE
The information required by this Item will be included in our Proxy Statement for the 2022 Annual Meeting of Stockholders under the captions, “Related Person Transactions” and “Director Independence,” which will be filed with the SEC no later than 120 days after the close of the fiscal year ended December 31, 2021 and is incorporated by reference in this report.
ITEM 14. PRINCIPAL ACCOUNTING FEES AND SERVICES
The information required by this Item will be included in our Proxy Statement for the 2022 Annual Meeting of Stockholders under the caption, “Disclosure of Fees Charged by Independent Registered Public Accounting Firm,” which will be filed with the SEC no later than 120 days after the close of the fiscal year ended December 31, 2021 and is incorporated by reference in this report.
PART IV
ITEM 15. EXHIBITS, FINANCIAL STATEMENT SCHEDULES
(a) (1) Financial Statements
The following financial statements required by this item are submitted in a separate section beginning on page F-1 of this report.
| | | | | | | | |
| Sinclair Broadcast Group, Inc. Financial Statements: | | Page: |
| | |
| | |
| | |
| | |
| | |
| | |
| | |
(a) (2) Financial Statements Schedules
All schedules are omitted because they are not applicable or the required information is shown in the Financial Statements or the accompanying notes.
(a) (3) Exhibits
The following exhibits are filed with this report:
| | | | | | | | |
| EXHIBIT NO. | | EXHIBIT DESCRIPTION |
| 3.1 | | |
| 3.2 | | |
| 4.1 | | |
| 4.2 | | |
| 4.3 | | |
| 4.4 | | |
| 4.5 | | |
| 4.6 | | |
| | | | | | | | |
| EXHIBIT NO. | | EXHIBIT DESCRIPTION |
| 4.7 | | |
| 4.8 | | |
| 4.9 | | |
| 4.10 | | |
| 4.11 | | |
| 4.12 | | |
| 10.1* | | |
| 10.2* | | |
| 10.3* | | |
| 10.4* | | |
| 10.5* | | |
| 10.6* | | |
| 10.7* | | |
| 10.8* | | |
| 10.9* | | |
| 10.10* | | |
| 10.11* | | |
| 10.12* | | |
| 10.13* | | |
| 10.14* | | |
| 10.15* | | |
| 10.16* | | |
| | | | | | | | |
| EXHIBIT NO. | | EXHIBIT DESCRIPTION |
| 10.17* | | |
| 10.18* | | |
| 10.19* | | |
| 10.20* | | |
| 10.21* | | |
| 10.22* | | |
| 10.23 | | |
| 10.24 | | |
| 10.25 | | |
| 10.26 | | |
| 10.27 | | |
| 10.28 | | |
| 10.29 | | |
| 10.30 | | |
| 10.31 | | |
| 10.32 | | |
| 10.33 | | |
| 10.34 | | Credit Agreement, dated as of August 23, 2019, by and among Diamond Sports Intermediate Holdings LLC, Diamond Sports Group, LLC, the guarantors party thereto, JP Morgan Chase Bank, N.A., as administrative agent and collateral agent, and the lenders party thereto. (Incorporated by reference from Exhibit 10.3 to Registrant's Current Report on Form 8-K filed on August 23, 2019.) |
| 10.35 | | First Amendment, dated as of December 20, 2019, to the Credit Agreement, dated as of August 23, 2019, among Diamond Sports Intermediate Holdings LLC, Diamond Sports Group, LLC, the guarantors party thereto, the lenders party thereto and JPMorgan Chase Bank, N.A., as administrative agent and collateral agent. (Incorporated by reference from Exhibit 10.35 to Registrant's Report on Form 10-K filed on March 1, 2021.) |
| | | | | | | | |
| EXHIBIT NO. | | EXHIBIT DESCRIPTION |
| 10.36 | | |
| 10.37 | | Seventh Amended and Restated Credit Agreement, dated as of August 23, 2019, by and among Sinclair Broadcast Group, Inc., Sinclair Television Group, Inc., the guarantors party thereto, JP Morgan Chase Bank, N.A., as administrative agent and collateral agent, and the lenders party thereto. (Incorporated by reference from Exhibit 10.4 to Registrant's Current Report on Form 8-K filed on August 23, 2019.) |
| 10.38 | | First Amendment, dated as of December 20, 2019, to the Seventh Amended and Restated Credit Agreement, dated as of August 23, 2019, among Sinclair Television Group, Inc., Sinclair Broadcast Group, Inc., the guarantors party thereto, the lenders party thereto and JPMorgan Chase Bank, N.A., as administrative agent and collateral agent. (Incorporated by reference from Exhibit 10.38 to Registrant's Report on Form 10-K filed on March 1, 2021.) |
| 10.39 | | Second Amendment, dated as of December 4, 2020, to the Seventh Amended and Restated Credit Agreement by and among Sinclair Television Group, Inc., Sinclair Broadcast Group, Inc., the guarantors party thereto, the lenders party thereto, JPMorgan Chase Bank, N.A., as the administrative agent. (Incorporated by reference from Exhibit 10.1 to Registrant's Current Report on Form 8-K filed on December 4, 2020.) |
| 10.40 | | Third Amendment, dated as of April 1, 2021, to the Seventh Amended and Restated Credit Agreement by and among Sinclair Television Group, Inc., Sinclair Broadcast Group, Inc., the guarantors party thereto, the lenders party thereto, and JPMorgan Chase Bank, N.A., as the administrative agent and collateral agent. (Incorporated by reference from Exhibit 10.1 to Registrant's Current Report on Form 8-K filed on April 1, 2021.) |
| 10.41 | | |
| 10.42 | | Amended and Restated Loan and Security Agreement, dated as of June 25, 2021, by and among Diamond Sports Finance SPV, LLC, Fox Sports Net, LLC, Credit Suisse AG, New York Branch, as administrative agent, Wilmington Trust, National Association, as collateral agent, paying agent and account bank, and the lenders party thereto. (Incorporated by reference from Exhibit 10.1 to Registrant's Current Report on Form 10-Q filed on November 9, 2021.) |
| 10.43 | | First Amendment to Loan and Security Agreement, dated as of September 15, 2021, by and among Diamond Sports Finance SPV, LLC, Diamond Sports Net, LLC (f/k/a Fox Sports Net, LLC), Credit Suisse AG, New York Branch, as administrative agent, Wilmington Trust, National Association, as collateral agent, paying agent and account bank, and the lenders party thereto. (Incorporated by reference from Exhibit 10.2 to Registrant's Current Report on Form 10-Q filed on November 9, 2021.) |
| 10.44 | | Assignment and Acceptance Agreement, dated as of November 5, 2021, by and between Credit Suisse AG, Cayman Islands Branch, as assignor, and Sinclair Broadcast Group, Inc., as assignee, and accepted by Credit Suisse AG, New York Branch, as administrative agent and Diamond Sports Finance SPV, LLC, as borrower. (Incorporated by reference from Exhibit 10.3 to Registrant's Current Report on Form 10-Q filed on November 9, 2021.) |
| 10.45 | | Omnibus Amendment to Amended and Restated Loan Agreement & Purchase Agreement, dated as of November 5, 2021, by and among Diamond Sports Finance SPV, LLC, Diamond Sports Net, LLC (f/k/a Fox Sports Net, LLC), Sinclair Broadcast Group, Inc., as administrative agent and lender, Wilmington Trust, National Association, as collateral agent, paying agent and account bank, and certain persons identified therein as originators. (Incorporated by reference from Exhibit 10.3 to Registrant's Current Report on Form 10-Q filed on November 9, 2021.) |
| 21** | | |
| 23** | | |
| 24 | | |
| 31.1*** | | |
| 31.2*** | | |
| 32.1*** | | |
| 32.2*** | | |
| | | | | | | | |
| EXHIBIT NO. | | EXHIBIT DESCRIPTION |
| 99.1 | | |
| 101 | | The Company's Consolidated Financial Statements and related Notes for the year ended December, 31, 2021 from this Annual Report on Form 10-K, formatted in iXBRL (Inline eXtensible Business Reporting Language).** |
* Management contracts and compensatory plans or arrangements required to be filed as an exhibit pursuant to Item 15(b) of Form 10-K.
** Filed herewith.
*** In accordance with Item 601(b)(32) of Regulation S-K, this Exhibit is not deemed “filed” for purposes of Section 18 of the Exchange Act or otherwise subject to the liabilities of that section. Such certifications will not be deemed incorporated by reference into any filing under the Securities Act or the Exchange Act, except to the extent that the registrant specifically incorporates it by reference.
(b) Exhibits
The exhibits required by this Item are listed under Item 15 (a) (3).
ITEM 16. FORM 10-K SUMMARY
Not applicable.
SIGNATURES
Pursuant to the requirements of Section 13 or 15(d) of the Securities Exchange Act of 1934, the registrant has duly caused this report on Form 10-K to be signed on its behalf by the undersigned, thereunto duly authorized on this 1st day of March 2022.
| | | | | | | | |
| | SINCLAIR BROADCAST GROUP, INC. |
| | |
| | By: | /s/ Christopher S. Ripley |
| | | Christopher S. Ripley |
| | | President and Chief Executive Officer |
POWER OF ATTORNEY
KNOW ALL MEN BY THESE PRESENTS, that each person whose signature appears below under the heading “Signature” constitutes and appoints Christopher S. Ripley as his true and lawful attorney-in-fact each acting alone, with full power of substitution and resubstitution, for him and in his name, place and stead in any and all capacities to sign any or all amendments to this 10-K and to file the same, with all exhibits thereto, and other documents in connection therewith, with the SEC, granting unto said attorney-in-fact full power and authority to do and perform each and every act and thing requisite and necessary to be done in and about the premises, as fully for all intents and purposes as he might or could do in person, hereby ratifying and confirming all that said attorney-in-fact, or their substitutes, each acting alone, may lawfully do or cause to be done in virtue hereof.
Pursuant to the requirements of the Securities Exchange Act of 1934, this report has been signed below by the following persons on behalf of the registrant and in the capacities and on the dates indicated.
| | | | | | | | | | | | | | |
| Signature | | Title | | Date |
| | | | | |
| /s/ Christopher S. Ripley | | President and Chief Executive Officer | | |
| Christopher S. Ripley | | | | March 1, 2022 |
| | | | |
| /s/ Lucy A. Rutishauser | | Executive Vice President and Chief Financial Officer | | |
| Lucy A. Rutishauser | | | | March 1, 2022 |
| | | | | |
| /s/ David R. Bochenek | | Senior Vice President and Chief Accounting Officer | | |
| David R. Bochenek | | | | March 1, 2022 |
| | | | | |
| /s/ David D. Smith | | Chairman of the Board and Executive Chairman | | |
| David D. Smith | | | | March 1, 2022 |
| | | | |
| /s/ Frederick G. Smith | | | | |
| Frederick G. Smith | | Director | | March 1, 2022 |
| | | | | |
| /s/ J. Duncan Smith | | | | |
| J. Duncan Smith | | Director | | March 1, 2022 |
| | | | | |
| /s/ Robert E. Smith | | | | |
| Robert E. Smith | | Director | | March 1, 2022 |
| | | | | |
| /s/ Lawrence E. McCanna | | | | |
| Lawrence E. McCanna | | Director | | March 1, 2022 |
| | | | | |
| /s/ Daniel C. Keith | | | | |
| Daniel C. Keith | | Director | | March 1, 2022 |
| | | | | |
| /s/ Martin R. Leader | | | | |
| Martin R. Leader | | Director | | March 1, 2022 |
| | | | | |
| /s/ Howard E. Friedman | | | | |
| Howard E. Friedman | | Director | | March 1, 2022 |
| | | | |
| /s/ Benson E. Legg | | | | |
| Benson E. Legg | | Director | | March 1, 2022 |
| | | | |
| /s/ Laurie R. Beyer | | | | |
| Laurie R. Beyer | | Director | | March 1, 2022 |
| | | | |
SINCLAIR BROADCAST GROUP, INC.
INDEX TO FINANCIAL STATEMENTS
Report of Independent Registered Public Accounting Firm
To the Board of Directors and Shareholders of Sinclair Broadcast Group, Inc.
Opinions on the Financial Statements and Internal Control over Financial Reporting
We have audited the accompanying consolidated balance sheets of Sinclair Broadcast Group, Inc. and its subsidiaries (the “Company”) as of December 31, 2021 and 2020, and the related consolidated statements of operations, comprehensive income, equity and redeemable noncontrolling interests and of cash flows for each of the three years in the period ended December 31, 2021, including the related notes (collectively referred to as the “consolidated financial statements”). We also have audited the Company's internal control over financial reporting as of December 31, 2021, based on criteria established in Internal Control - Integrated Framework (2013) issued by the Committee of Sponsoring Organizations of the Treadway Commission (COSO).
In our opinion, the consolidated financial statements referred to above present fairly, in all material respects, the financial position of the Company as of December 31, 2021 and 2020, and the results of its operations and its cash flows for each of the three years in the period ended December 31, 2021 in conformity with accounting principles generally accepted in the United States of America. Also in our opinion, the Company maintained, in all material respects, effective internal control over financial reporting as of December 31, 2021, based on criteria established in Internal Control - Integrated Framework (2013) issued by the COSO.
Basis for Opinions
The Company's management is responsible for these consolidated financial statements, for maintaining effective internal control over financial reporting, and for its assessment of the effectiveness of internal control over financial reporting, included in Report of Management on Internal Control over Financial Reporting appearing under Item 9A. Our responsibility is to express opinions on the Company’s consolidated financial statements and on the Company's internal control over financial reporting based on our audits. We are a public accounting firm registered with the Public Company Accounting Oversight Board (United States) (PCAOB) and are required to be independent with respect to the Company in accordance with the U.S. federal securities laws and the applicable rules and regulations of the Securities and Exchange Commission and the PCAOB.
We conducted our audits in accordance with the standards of the PCAOB. Those standards require that we plan and perform the audits to obtain reasonable assurance about whether the consolidated financial statements are free of material misstatement, whether due to error or fraud, and whether effective internal control over financial reporting was maintained in all material respects.
Our audits of the consolidated financial statements included performing procedures to assess the risks of material misstatement of the consolidated financial statements, whether due to error or fraud, and performing procedures that respond to those risks. Such procedures included examining, on a test basis, evidence regarding the amounts and disclosures in the consolidated financial statements. Our audits also included evaluating the accounting principles used and significant estimates made by management, as well as evaluating the overall presentation of the consolidated financial statements. Our audit of internal control over financial reporting included obtaining an understanding of internal control over financial reporting, assessing the risk that a material weakness exists, and testing and evaluating the design and operating effectiveness of internal control based on the assessed risk. Our audits also included performing such other procedures as we considered necessary in the circumstances. We believe that our audits provide a reasonable basis for our opinions.
Definition and Limitations of Internal Control over Financial Reporting
A company’s internal control over financial reporting is a process designed to provide reasonable assurance regarding the reliability of financial reporting and the preparation of financial statements for external purposes in accordance with generally accepted accounting principles. A company’s internal control over financial reporting includes those policies and procedures that (i) pertain to the maintenance of records that, in reasonable detail, accurately and fairly reflect the transactions and dispositions of the assets of the company; (ii) provide reasonable assurance that transactions are recorded as necessary to permit preparation of financial statements in accordance with generally accepted accounting principles, and that receipts and expenditures of the company are being made only in accordance with authorizations of management and directors of the company; and (iii) provide reasonable assurance regarding prevention or timely detection of unauthorized acquisition, use, or disposition of the company’s assets that could have a material effect on the financial statements.
Because of its inherent limitations, internal control over financial reporting may not prevent or detect misstatements. Also, projections of any evaluation of effectiveness to future periods are subject to the risk that controls may become inadequate because of changes in conditions, or that the degree of compliance with the policies or procedures may deteriorate.
Critical Audit Matters
The critical audit matter communicated below is a matter arising from the current period audit of the consolidated financial statements that was communicated or required to be communicated to the audit committee and that (i) relates to accounts or disclosures that are material to the consolidated financial statements and (ii) involved our especially challenging, subjective, or complex judgments. The communication of critical audit matters does not alter in any way our opinion on the consolidated financial statements, taken as a whole, and we are not, by communicating the critical audit matter below, providing a separate opinion on the critical audit matter or on the accounts or disclosures to which it relates.
Valuation of Bally's equity securities
As described in Notes 6 and 18 to the consolidated financial statements, as of December 31, 2021, the Company has investments in Bally’s equity securities in the form of options and warrants with a fair value of $282 million, which are categorized as level 3 investments under the fair value hierarchy. As disclosed by management, the fair value of the options is derived by management utilizing the Black Scholes valuation model. Using this model, management uses inputs related to the trading price of the underlying common stock and the exercise price of the options and applies a discount for lack of marketability. The fair value of the warrants is primarily derived from the trading price of the underlying common stock, the exercise price of the warrants and a discount for lack of marketability. The fair value of the equity securities are derived using significant inputs related to quoted trading prices of the underlying common equity and a discount for lack of marketability, which requires management to exercise judgment.
The principal considerations for our determination that performing procedures relating to the valuation of the Bally’s equity securities is a critical audit matter are (i) the significant judgment by management to determine the fair value of these securities, which included developing the significant assumption for discount for lack of marketability used in valuing these securities; (ii) a high degree of auditor judgment, subjectivity, and effort in performing procedures to evaluate management’s significant assumption related to the discount for lack of marketability; and (iii) the audit effort involved the use of professionals with specialized skill and knowledge.
Addressing the matter involved performing procedures and evaluating audit evidence in connection with forming our overall opinion on the consolidated financial statements. These procedures included testing the effectiveness of controls relating to the valuation of the Bally’s equity securities, including controls over the significant assumption. These procedures also included, among others, reading the commercial agreements and testing management’s process for determining the fair value of the Bally’s equity securities. Testing management’s process included (i) evaluating the appropriateness of the valuation methods, (ii) testing the completeness and accuracy of underlying data and inputs used in the methods, and (iii) evaluating the reasonableness of management’s significant assumption related to the discount for lack of marketability. Professionals with specialized skill and knowledge were used to assist in evaluating whether the significant assumption related to the discount for lack of marketability used by management was reasonable considering consistency with external market data.
/s/ PricewaterhouseCoopers LLP
Baltimore, Maryland
March 1, 2022
We have served as the Company’s auditor since 2009
SINCLAIR BROADCAST GROUP, INC.
CONSOLIDATED BALANCE SHEETS
(In millions, except share and per share data)
| | | | | | | | | | | |
| | As of December 31, |
| | 2021 | | 2020 |
| ASSETS | | | |
| CURRENT ASSETS: | | | |
| Cash and cash equivalents | $ | 816 | | | $ | 1,259 | |
Accounts receivable, net of allowance for doubtful accounts of $7 and $5, respectively | 1,245 | | | 1,060 | |
| Income taxes receivable | 152 | | | 230 | |
| Prepaid sports rights | 85 | | | 498 | |
| Prepaid expenses and other current assets | 173 | | | 170 | |
| Total current assets | 2,471 | | | 3,217 | |
| Property and equipment, net | 833 | | | 823 | |
| Operating lease assets | 207 | | | 197 | |
| Deferred tax assets | 293 | | | 197 | |
| Restricted cash | 3 | | | 3 | |
| Goodwill | 2,088 | | | 2,092 | |
| Indefinite-lived intangible assets | 150 | | | 171 | |
| Customer relationships, net | 3,904 | | | 4,286 | |
| Other definite-lived intangible assets, net | 1,184 | | | 1,338 | |
| Other assets | 1,408 | | | 1,058 | |
| Total assets (a) | $ | 12,541 | | | $ | 13,382 | |
| | | |
| LIABILITIES , REDEEMABLE NON-CONTROLLING INTERESTS, AND EQUITY | | | |
| Current liabilities: | | | |
| Accounts payable and accrued liabilities | $ | 655 | | | $ | 533 | |
| | | |
| Current portion of notes payable, finance leases, and commercial bank financing | 69 | | | 58 | |
| Current portion of operating lease liabilities | 35 | | | 34 | |
| Current portion of program contracts payable | 97 | | | 92 | |
| Other current liabilities | 346 | | | 317 | |
| Total current liabilities | 1,202 | | | 1,034 | |
| Notes payable, finance leases, and commercial bank financing, less current portion | 12,271 | | | 12,493 | |
| Operating lease liabilities, less current portion | 205 | | | 198 | |
| Program contracts payable, less current portion | 21 | | | 30 | |
| | | |
| Other long-term liabilities | 351 | | | 622 | |
| Total liabilities (a) | 14,050 | | | 14,377 | |
Commitments and contingencies (See Note 13) | | | |
| Redeemable noncontrolling interests | 197 | | | 190 | |
| Shareholders' Equity: | | | |
Class A Common Stock, $0.01 par value, 500,000,000 shares authorized, 49,314,303 and 49,252,671 shares issued and outstanding, respectively | 1 | | | 1 | |
Class B Common Stock, $0.01 par value, 140,000,000 shares authorized, 23,775,056 and 24,727,682 shares issued and outstanding, respectively, convertible into Class A Common Stock | — | | | — | |
| Additional paid-in capital | 691 | | | 721 | |
| Accumulated deficit | (2,460) | | | (1,986) | |
| Accumulated other comprehensive loss | (2) | | | (10) | |
| Total Sinclair Broadcast Group shareholders’ deficit | (1,770) | | | (1,274) | |
| Noncontrolling interests | 64 | | | 89 | |
| Total deficit | (1,706) | | | (1,185) | |
| Total liabilities, redeemable noncontrolling interests, and equity | $ | 12,541 | | | $ | 13,382 | |
The accompanying notes are an integral part of these consolidated financial statements.
(a)Our consolidated total assets as of December 31, 2021 and 2020 include total assets of variable interest entities (VIEs) of $217 million and $233 million, respectively, which can only be used to settle the obligations of the VIEs. Our consolidated total liabilities as of December 31, 2021 and 2020 include total liabilities of the VIEs of $62 million and $60 million, respectively, for which the creditors of the VIEs have no recourse to us. See Note 14. Variable Interest Entities.
SINCLAIR BROADCAST GROUP, INC.
CONSOLIDATED STATEMENTS OF OPERATIONS
FOR THE YEARS ENDED DECEMBER 31, 2021, 2020 AND 2019
(In millions, except share and per share data)
| | | | | | | | | | | | | | | | | |
| | 2021 | | 2020 | | 2019 |
| REVENUES: | | | | | |
| Media revenues | $ | 6,083 | | | $ | 5,843 | | | $ | 4,046 | |
| Non-media revenues | 51 | | | 100 | | | 194 | |
| Total revenues | 6,134 | | | 5,943 | | | 4,240 | |
| | | | | |
| OPERATING EXPENSES: | | | | | |
| Media programming and production expenses | 4,291 | | | 2,735 | | | 2,073 | |
| Media selling, general and administrative expenses | 908 | | | 832 | | | 732 | |
| Amortization of program contract costs | 93 | | | 86 | | | 90 | |
| Non-media expenses | 57 | | | 91 | | | 156 | |
| Depreciation of property and equipment | 114 | | | 102 | | | 97 | |
| Corporate general and administrative expenses | 170 | | | 148 | | | 387 | |
| Amortization of definite-lived intangible and other assets | 477 | | | 572 | | | 327 | |
| Impairment of goodwill and definite-lived intangible assets | — | | | 4,264 | | | — | |
| Gain on asset dispositions and other, net of impairment | (71) | | | (115) | | | (92) | |
| Total operating expenses | 6,039 | | | 8,715 | | | 3,770 | |
| Operating income (loss) | 95 | | | (2,772) | | | 470 | |
| | | | | |
| OTHER INCOME (EXPENSE): | | | | | |
| Interest expense including amortization of debt discount and deferred financing costs | (618) | | | (656) | | | (422) | |
| Loss on extinguishment of debt | (7) | | | (10) | | | (10) | |
| Income (loss) from equity method investments | 45 | | | (36) | | | (35) | |
| Other (expense) income, net | (14) | | | 325 | | | 6 | |
| Total other expense, net | (594) | | | (377) | | | (461) | |
| (Loss) income before income taxes | (499) | | | (3,149) | | | 9 | |
| INCOME TAX BENEFIT | 173 | | | 720 | | | 96 | |
| | | | | |
| | | | | |
| | | | | |
| NET (LOSS) INCOME | (326) | | | (2,429) | | | 105 | |
| Net income attributable to the redeemable noncontrolling interests | (18) | | | (56) | | | (48) | |
| Net (income) loss attributable to the noncontrolling interests | (70) | | | 71 | | | (10) | |
| NET (LOSS) INCOME ATTRIBUTABLE TO SINCLAIR BROADCAST GROUP | $ | (414) | | | $ | (2,414) | | | $ | 47 | |
| | | | | |
| EARNINGS PER COMMON SHARE ATTRIBUTABLE TO SINCLAIR BROADCAST GROUP: | | | | | |
| | | | | |
| Basic (loss) earnings per share | $ | (5.51) | | | $ | (30.20) | | | $ | 0.52 | |
| | | | | |
| Diluted (loss) earnings per share | $ | (5.51) | | | $ | (30.20) | | | $ | 0.51 | |
| Basic weighted average common shares outstanding (in thousands) | 75,050 | | | 79,924 | | | 92,015 | |
| Diluted weighted average common and common equivalent shares outstanding (in thousands) | 75,050 | | | 79,924 | | | 93,185 | |
| | | | | |
| | | | | |
| | | | | |
| | | | | |
The accompanying notes are an integral part of these consolidated financial statements.
SINCLAIR BROADCAST GROUP, INC.
CONSOLIDATED STATEMENTS OF COMPREHENSIVE INCOME
FOR THE YEARS ENDED DECEMBER 31, 2021, 2020 AND 2019
(In millions)
| | | | | | | | | | | | | | | | | |
| | 2021 | | 2020 | | 2019 |
| Net (loss) income | $ | (326) | | | $ | (2,429) | | | $ | 105 | |
| Adjustments to post-retirement obligations, net of taxes | 1 | | | (1) | | | (1) | |
| Share of other comprehensive gain (loss) of equity method investments | 7 | | | (7) | | | — | |
| Comprehensive (loss) income | (318) | | | (2,437) | | | 104 | |
| Comprehensive income attributable to redeemable noncontrolling interests | (18) | | | (56) | | | (48) | |
| Comprehensive (income) loss attributable to noncontrolling interests | (70) | | | 71 | | | (10) | |
| Comprehensive (loss) income attributable to Sinclair Broadcast Group | $ | (406) | | | $ | (2,422) | | | $ | 46 | |
The accompanying notes are an integral part of these consolidated financial statements
SINCLAIR BROADCAST GROUP, INC.
CONSOLIDATED STATEMENTS OF EQUITY (DEFICIT) AND REDEEMABLE NONCONTROLLING INTERESTS
FOR THE YEARS ENDED DECEMBER 31, 2021, 2020 AND 2019
(In millions, except share data)
| | | | | | | | | | | | | | | | | | | | | | | | | | | | | | | | | | | | | | | | | | | | | | | | | | | | | | | | | | | | | | |
| | | | | Sinclair Broadcast Group Shareholders | | | | |
| | Redeemable
Noncontrolling
Interests | | | Class A
Common Stock | | Class B
Common Stock | | Additional
Paid-In
Capital | | Retained Earnings | | Accumulated
Other
Comprehensive
Loss | | Noncontrolling
Interests | | Total Equity |
| | | | Shares | | Values | | Shares | | Values | | | | | |
| BALANCE, December 31, 2018 | $ | — | | | | 68,897,723 | | | $ | 1 | | | 25,670,684 | | | $ | — | | | $ | 1,121 | | | $ | 518 | | | $ | (1) | | | $ | (39) | | | $ | 1,600 | |
| Issuance of redeemable subsidiary preferred equity, net of issuance costs | 985 | | | | — | | | — | | | — | | | — | | | — | | | — | | | — | | | — | | | — | |
| | | | | | | | | | | | | | | | | | | | |
Dividends declared and paid on Class A and Class B Common Stock ($0.80 per share) | — | | | | — | | | — | | | — | | | — | | | — | | | (73) | | | — | | | — | | | (73) | |
| Class B Common Stock converted into Class A Common Stock | — | | | | 943,002 | | | — | | | (943,002) | | | — | | | — | | | — | | | — | | | — | | | — | |
| Repurchases of Class A Common Stock | — | | | | (4,555,487) | | | — | | | — | | | — | | | (145) | | | — | | | — | | | — | | | (145) | |
| Class A Common Stock issued pursuant to employee benefit plans | — | | | | 1,544,872 | | | — | | | — | | | — | | | 35 | | | — | | | — | | | — | | | 35 | |
| | | | | | | | | | | | | | | | | | | | |
| Noncontrolling interests acquired in a business combination | 380 | | | | — | | | — | | | — | | | — | | | — | | | — | | | — | | | 248 | | | 248 | |
| Distributions to noncontrolling interests, net | (38) | | | | — | | | — | | | — | | | — | | | — | | | — | | | — | | | (27) | | | (27) | |
| Redemption of redeemable subsidiary preferred equity, net of fees | (297) | | | | — | | | — | | | — | | | — | | | — | | | — | | | — | | | — | | | — | |
| | | | | | | | | | | | | | | | | | | | |
| Other comprehensive loss | — | | | | — | | | — | | | — | | | — | | | — | | | — | | | (1) | | | — | | | (1) | |
| Net income | 48 | | | | — | | | — | | | — | | | — | | | — | | | 47 | | | — | | | 10 | | | 57 | |
| BALANCE, December 31, 2019 | $ | 1,078 | | | | 66,830,110 | | | $ | 1 | | | 24,727,682 | | | $ | — | | | $ | 1,011 | | | $ | 492 | | | $ | (2) | | | $ | 192 | | | $ | 1,694 | |
The accompanying notes are an integral part of these consolidated financial statements.
SINCLAIR BROADCAST GROUP, INC.
CONSOLIDATED STATEMENTS OF EQUITY (DEFICIT) AND REDEEMABLE NONCONTROLLING INTERESTS
FOR THE YEARS ENDED DECEMBER 31, 2021, 2020 AND 2019
(In millions, except share data)
| | | | | | | | | | | | | | | | | | | | | | | | | | | | | | | | | | | | | | | | | | | | | | | | | | | | | | | | | | | | | | |
| | | | | Sinclair Broadcast Group Shareholders | | | | |
| | Redeemable Noncontrolling Interest | | | Class A
Common Stock | | Class B
Common Stock | | Additional
Paid-In
Capital | | Retained Earnings (Accumulated
Deficit) | | Accumulated
Other
Comprehensive
Loss | | Noncontrolling
Interests | | Total Equity (Deficit) |
| | | | Shares | | Values | | Shares | | Values | | | | | |
| BALANCE, December 31, 2019 | $ | 1,078 | | | | 66,830,110 | | | $ | 1 | | | 24,727,682 | | | $ | — | | | $ | 1,011 | | | $ | 492 | | | $ | (2) | | | $ | 192 | | | $ | 1,694 | |
| | | | | | | | | | | | | | | | | | | | |
Dividends declared and paid on Class A and Class B Common Stock ($0.80 per share) | — | | | | — | | | — | | | — | | | — | | | — | | | (64) | | | — | | | — | | | (64) | |
| | | | | | | | | | | | | | | | | | | | |
| Repurchases of Class A Common Stock | — | | | | (19,418,934) | | | — | | | — | | | — | | | (343) | | | — | | | — | | | — | | | (343) | |
| Class A Common Stock issued pursuant to employee benefit plans | — | | | | 1,841,495 | | | — | | | — | | | — | | | 53 | | | — | | | — | | | — | | | 53 | |
| Noncontrolling interests issued | 22 | | | | — | | | — | | | — | | | — | | | — | | | — | | | — | | | — | | | — | |
| | | | | | | | | | | | | | | | | | | | |
| | | | | | | | | | | | | | | | | | | | |
| Distributions to noncontrolling interests, net | — | | | | — | | | — | | | — | | | — | | | — | | | — | | | — | | | (32) | | | (32) | |
| Distributions to redeemable noncontrolling interests | (419) | | | | — | | | — | | | — | | | — | | | — | | | — | | | — | | | — | | | — | |
| | | | | | | | | | | | | | | | | | | | |
| Redemption of redeemable subsidiary preferred equity, net of fees | (547) | | | | — | | | — | | | — | | | — | | | — | | | — | | | — | | | — | | | — | |
| Other comprehensive loss | — | | | | — | | | — | | | — | | | — | | | — | | | — | | | (8) | | | — | | | (8) | |
| Net income (loss) | 56 | | | | — | | | — | | | — | | | — | | | — | | | (2,414) | | | — | | | (71) | | | (2,485) | |
| BALANCE, December 31, 2020 | $ | 190 | | | | 49,252,671 | | | $ | 1 | | | 24,727,682 | | | $ | — | | | $ | 721 | | | $ | (1,986) | | | $ | (10) | | | $ | 89 | | | $ | (1,185) | |
The accompanying notes are an integral part of these consolidated financial statements.
SINCLAIR BROADCAST GROUP, INC.
CONSOLIDATED STATEMENTS OF EQUITY (DEFICIT) AND REDEEMABLE NONCONTROLLING INTERESTS
FOR THE YEARS ENDED DECEMBER 31, 2021, 2020 AND 2019
(In millions, except share data)
| | | | | | | | | | | | | | | | | | | | | | | | | | | | | | | | | | | | | | | | | | | | | | | | | | | | | | | | | | | | | | |
| | | | | Sinclair Broadcast Group Shareholders | | | | |
| | Redeemable Noncontrolling Interests | | | Class A
Common Stock | | Class B
Common Stock | | Additional
Paid-In
Capital | | Accumulated
Deficit | | Accumulated
Other
Comprehensive Loss | | Noncontrolling
Interests | | Total Deficit |
| | | | Shares | | Values | | Shares | | Values | | | | | |
| BALANCE, December 31, 2020 | $ | 190 | | | | 49,252,671 | | | $ | 1 | | | 24,727,682 | | | $ | — | | | $ | 721 | | | $ | (1,986) | | | $ | (10) | | | $ | 89 | | | $ | (1,185) | |
| | | | | | | | | | | | | | | | | | | | |
| | | | | | | | | | | | | | | | | | | | |
| | | | | | | | | | | | | | | | | | | | |
Dividends declared and paid on Class A and Class B Common Stock ($0.80 per share) | — | | | | — | | | — | | | — | | | — | | | — | | | (60) | | | — | | | — | | | (60) | |
| Class B Common Stock converted into Class A Common Stock | — | | | | 952,626 | | | — | | | (952,626) | | | — | | | — | | | — | | | — | | | — | | | — | |
| Repurchases of Class A Common Stock | — | | | | (2,438,585) | | | — | | | — | | | — | | | (61) | | | — | | | — | | | — | | | (61) | |
| Class A Common Stock issued pursuant to employee benefit plans | — | | | | 1,547,591 | | | — | | | — | | | — | | | 31 | | | — | | | — | | | — | | | 31 | |
| | | | | | | | | | | | | | | | | | | | |
| | | | | | | | | | | | | | | | | | | | |
| Distributions to noncontrolling interests, net | (11) | | | | — | | | — | | | — | | | — | | | — | | | — | | | — | | | (95) | | | (95) | |
| | | | | | | | | | | | | | | | | | | | |
| | | | | | | | | | | | | | | | | | | | |
| | | | | | | | | | | | | | | | | | | | |
| Other comprehensive loss | — | | | | — | | | — | | | — | | | — | | | — | | | — | | | 8 | | | — | | | 8 | |
| Net income (loss) | 18 | | | | — | | | — | | | — | | | — | | | — | | | (414) | | | — | | | 70 | | | (344) | |
| BALANCE, December 31, 2021 | $ | 197 | | | | 49,314,303 | | | $ | 1 | | | 23,775,056 | | | $ | — | | | $ | 691 | | | $ | (2,460) | | | $ | (2) | | | $ | 64 | | | $ | (1,706) | |
The accompanying notes are an integral part of these consolidated financial statements.
SINCLAIR BROADCAST GROUP, INC.
CONSOLIDATED STATEMENTS OF CASH FLOWS
FOR THE YEARS ENDED DECEMBER 31, 2021, 2020 AND 2019
(In millions)
| | | | | | | | | | | | | | | | | |
| | 2021 | | 2020 | | 2019 |
| CASH FLOWS FROM OPERATING ACTIVITIES: | | | | | |
| Net (loss) income | $ | (326) | | | $ | (2,429) | | | $ | 105 | |
| Adjustments to reconcile net (loss) income to net cash flows from operating activities: | | | | | |
| Impairment of goodwill and definite-lived intangible assets | — | | | 4,264 | | | — | |
| Amortization of sports programming rights | 2,350 | | | 1,078 | | | 637 | |
| Amortization of definite-lived intangible and other assets | 477 | | | 572 | | | 327 | |
| Depreciation of property and equipment | 114 | | | 102 | | | 97 | |
| Amortization of program contract costs | 93 | | | 86 | | | 90 | |
| Stock-based compensation | 60 | | | 52 | | | 33 | |
| Deferred tax benefit | (92) | | | (604) | | | (5) | |
| Gain on asset disposition and other, net of impairment | (69) | | | (119) | | | (62) | |
| (Income) loss from equity method investments | (45) | | | 36 | | | 35 | |
| Loss (income) from investments | 38 | | | (152) | | | 6 | |
| Distributions from investments | 54 | | | 27 | | | 6 | |
| Sports programming rights payments | (1,834) | | | (1,345) | | | (578) | |
| Rebate payments to distributors | (202) | | | — | | | — | |
| Loss on extinguishment of debt | 7 | | | 10 | | | 10 | |
| Measurement adjustment gain on variable payment obligations | (15) | | | (159) | | | — | |
| Changes in assets and liabilities, net of acquisitions: | | | | | |
| (Increase) decrease in accounts receivable | (187) | | | 70 | | | 70 | |
| (Increase) decrease in prepaid expenses and other current assets | (86) | | | 48 | | | (27) | |
| Increase (decrease) in accounts payable and accrued and other current liabilities | 113 | | | (3) | | | 334 | |
Net change in current and long-term net income taxes payable/receivable | (52) | | | (127) | | | (127) | |
| Decrease in program contracts payable | (102) | | | (96) | | | (94) | |
| Increase (decrease) in other long-term liabilities | 3 | | | 198 | | | (1) | |
| Other, net | 28 | | | 39 | | | 60 | |
| Net cash flows from operating activities | 327 | | | 1,548 | | | 916 | |
| CASH FLOWS USED IN INVESTING ACTIVITIES: | | | | | |
| Acquisition of property and equipment | (80) | | | (157) | | | (156) | |
| Acquisition of businesses, net of cash acquired | (4) | | | (16) | | | (8,999) | |
| Spectrum repack reimbursements | 24 | | | 90 | | | 62 | |
| Proceeds from the sale of assets | 43 | | | 36 | | | 8 | |
| | | | | |
| Purchases of investments | (256) | | | (139) | | | (452) | |
| | | | | |
| | | | | |
| Other, net | 27 | | | 27 | | | 7 | |
| Net cash flows used in investing activities | (246) | | | (159) | | | (9,530) | |
| CASH FLOWS (USED IN) FROM FINANCING ACTIVITIES: | | | | | |
| Proceeds from notes payable and commercial bank financing | 357 | | | 1,819 | | | 9,956 | |
| Repayments of notes payable, commercial bank financing, and finance leases | (601) | | | (1,739) | | | (1,236) | |
| | | | | |
| Proceeds from the issuance of redeemable subsidiary preferred equity, net | — | | | — | | | 985 | |
| Repurchase of outstanding Class A Common Stock | (61) | | | (343) | | | (145) | |
| Dividends paid on Class A and Class B Common Stock | (60) | | | (63) | | | (73) | |
| Dividends paid on redeemable subsidiary preferred equity | (5) | | | (36) | | | (33) | |
| Redemption of redeemable subsidiary preferred equity | — | | | (547) | | | (297) | |
| Debt issuance costs | (1) | | | (19) | | | (199) | |
| | | | | |
| Distributions to noncontrolling interests, net | (95) | | | (32) | | | (27) | |
| Distributions to redeemable noncontrolling interests | (6) | | | (383) | | | (5) | |
| Other, net | (52) | | | (117) | | | (39) | |
| Net cash flows (used in) from financing activities | (524) | | | (1,460) | | | 8,887 | |
| NET (DECREASE) INCREASE IN CASH, CASH EQUIVALENTS, AND RESTRICTED CASH | (443) | | | (71) | | | 273 | |
| CASH, CASH EQUIVALENTS, AND RESTRICTED CASH, beginning of year | 1,262 | | | 1,333 | | | 1,060 | |
| CASH, CASH EQUIVALENTS, AND RESTRICTED CASH, end of year | $ | 819 | | | $ | 1,262 | | | $ | 1,333 | |
The accompanying notes are an integral part of these consolidated financial statements.
SINCLAIR BROADCAST GROUP, INC.
NOTES TO THE CONSOLIDATED FINANCIAL STATEMENTS
1. NATURE OF OPERATIONS AND SUMMARY OF SIGNIFICANT ACCOUNTING POLICIES:
Nature of Operations
Sinclair Broadcast Group, Inc. (the Company) is a diversified media company with national reach and a strong focus on providing high-quality content on our local television stations, regional sports networks, and digital platforms. The content, distributed through our broadcast platform and third-party platforms, consists of programming provided by third-party networks and syndicators, local news, college and professional sports, and other original programming produced by us. Additionally, we own digital media products that are complementary to our extensive portfolio of television station related digital properties. Outside of our media related businesses, we operate technical services companies focused on supply and maintenance of broadcast transmission systems as well as research and development for the advancement of broadcast technology, and we manage other non-media related investments.
As of December 31, 2021, we had two reportable segments for accounting purposes, broadcast and local sports. The broadcast segment consists primarily of our 185 broadcast television stations in 86 markets, which we own, provide programming and operating services pursuant to agreements commonly referred to as local marketing agreements (LMAs), or provide sales services and other non-programming operating services pursuant to other outsourcing agreements (such as JSAs and SSAs). These stations broadcast 634 channels as of December 31, 2021. For the purpose of this report, these 185 stations and 634 channels are referred to as “our” stations and channels. The local sports segment consists primarily of our Bally Sports network brands (Bally RSNs), the Marquee Sports Network (Marquee) joint venture, and a minority equity interest in the Yankee Entertainment and Sports Network, LLC ( YES Network). We refer to the Bally RSNs and Marquee as "the RSNs". The RSNs and YES Network own the exclusive rights to air, among other sporting events, the games of professional sports teams in designated local viewing areas.
Principles of Consolidation
The consolidated financial statements include our accounts and those of our wholly-owned and majority-owned subsidiaries, including the operating results of the Acquired RSNs acquired on August 23, 2019, as discussed in Note 2. Acquisitions and Dispositions of Assets, and VIEs for which we are the primary beneficiary. Noncontrolling interests represent a minority owner’s proportionate share of the equity in certain of our consolidated entities. Noncontrolling interests which may be redeemed by the holder, and the redemption is outside of our control, are presented as redeemable noncontrolling interests. All intercompany transactions and account balances have been eliminated in consolidation.
We consolidate VIEs when we are the primary beneficiary. We are the primary beneficiary of a VIE when we have the power to direct the activities of the VIE that most significantly impact the economic performance of the VIE and have the obligation to absorb losses or the right to receive returns that would be significant to the VIE. See Note 14. Variable Interest Entities for more information on our VIEs.
Investments in entities over which we have significant influence but not control are accounted for using the equity method of accounting. Income (loss) from equity method investments represents our proportionate share of net income or loss generated by equity method investees.
Use of Estimates
The preparation of financial statements in accordance with accounting principles generally accepted in the United States of America requires management to make estimates and assumptions that affect the reported amounts of assets, liabilities, revenues, and expenses in the consolidated financial statements and in the disclosures of contingent assets and liabilities. Actual results could differ from those estimates.
The impact of the outbreak of the novel coronavirus (COVID-19) continues to create significant uncertainty and disruption in the global economy and financial markets. It is reasonably possible that these uncertainties could further materially impact our estimates related to, but not limited to, revenue recognition, goodwill and intangible assets, program contract costs, sports programming rights, and income taxes. As a result, many of our estimates and assumptions require increased judgment and carry a higher degree of variability and volatility. Our estimates may change as new events occur and additional information emerges, and such changes are recognized or disclosed in our consolidated financial statements.
Recent Accounting Pronouncements
In June 2016, the FASB issued amended guidance on the accounting for credit losses on financial instruments. Among other provisions, this guidance introduces a new impairment model for most financial assets and certain other instruments. For trade and other receivables, held-to-maturity debt securities, loans and other instruments, entities will be required to use a forward-looking “expected loss” model that will replace the current “incurred loss” model that will generally result in the earlier recognition of allowances for losses. We adopted this guidance during the first quarter of 2020. The impact of the adoption did not have a material impact on our consolidated financial statements.
In August 2018, the FASB issued guidance which aligns the requirements for capitalizing implementation costs incurred in a hosting arrangement that is a service contract with the requirements for capitalizing implementation costs incurred to develop or obtain internal-use software, with the capitalized implementation costs of a hosting arrangement that is a service contract expensed over the term of the hosting arrangement. We adopted this guidance during the first quarter of 2020. The impact of the adoption did not have a material impact on our consolidated financial statements.
In October 2018, the FASB issued guidance for determining whether a decision-making fee is a variable interest. The amendments require organizations to consider indirect interests held through related parties under common control on a proportional basis rather than as the equivalent of a direct interest in its entirety, as currently required in generally accepted accounting principles (GAAP). We adopted this guidance during the first quarter of 2020. The impact of the adoption did not have a material impact on our consolidated financial statements.
In March 2019, the FASB issued guidance which requires that an entity test a film or license agreement within the scope of Subtopic 920-350 for impairment at the film group level, when the film or license agreement is predominantly monetized with other films and/or license agreements. We adopted this guidance during the first quarter of 2020. The impact of the adoption did not have a material impact on our consolidated financial statements.
In December 2019, the FASB issued guidance which is intended to simplify various aspects related to accounting for income taxes. ASU 2019-12 removes certain exceptions to the general principles in Topic 740 and also clarifies and amends existing guidance to improve consistent application. ASU 2019-12 will be effective for interim and annual periods beginning after December 15, 2020. Early adoption is permitted. We early adopted this guidance during the third quarter of 2020. The impact of the adoption did not have a material impact on our consolidated financial statements.
In March 2020, the FASB issued guidance providing optional expedients and exceptions for applying GAAP to derivative contracts, hedging relationships, and other transactions affected by the discontinuation of the London Interbank Offered Rate (LIBOR) or by another reference rate expected to be discontinued. The guidance was effective for all entities immediately upon issuance of the update and may be applied prospectively to applicable transactions existing as of or entered into from the date of adoption through December 31, 2022. This guidance did not have an impact on our consolidated financial statements.
In October 2021, the FASB issued guidance to improve the accounting for acquired revenue contracts with customers in a business combination by addressing diversity in practice. ASU 2021-08 requires that an acquiring entity recognize and measure contract assets and contract liabilities acquired in a business combination in accordance with Topic 606, as if it had originated the contracts. The guidance is effective for fiscal years beginning after December 15, 2022, including interim periods within those fiscal years. We are currently evaluating the impact of this guidance, but do not expect a material impact on our consolidated financial statements.
Cash and Cash Equivalents
We consider all highly liquid investments with an original maturity of three months or less when purchased to be cash equivalents.
Accounts Receivable
We regularly review accounts receivable and determine an appropriate estimate for the allowance for doubtful accounts based upon the impact of economic conditions on the merchant’s ability to pay, past collection experience, and such other factors which, in management’s judgment, deserve current recognition. In turn, a provision is charged against earnings in order to maintain the appropriate allowance level.
A rollforward of the allowance for doubtful accounts for the years ended December 31, 2021, 2020, and 2019 is as follows (in millions):
| | | | | | | | | | | | | | | | | |
| | 2021 | | 2020 | | 2019 |
| Balance at beginning of period | $ | 5 | | | $ | 8 | | | $ | 2 | |
| Charged to expense | 3 | | | 2 | | | 9 | |
| Net write-offs | (1) | | | (5) | | | (3) | |
| Balance at end of period | $ | 7 | | | $ | 5 | | | $ | 8 | |
As of December 31, 2021, three customers accounted for 15%, 15%, and 12%, respectively, of our accounts receivable, net. As of December 31, 2020, three customers accounted for 19%, 17%, and 15%, respectively, of our accounts receivable, net. For purposes of this disclosure, a single customer may include multiple entities under common control.
Broadcast Television Programming
We have agreements with programming syndicators for the rights to television programming over contract periods, which generally run from one to seven years. Contract payments are made in installments over terms that are generally equal to or shorter than the contract period. Pursuant to accounting guidance for the broadcasting industry, an asset and a liability for the rights acquired and obligations incurred under a license agreement are reported on the balance sheet when the cost of each program is known or reasonably determinable, the program material has been accepted by the licensee in accordance with the conditions of the license agreement, and the program is available for its first showing or telecast. The portion of program contracts which becomes payable within one year is reflected as a current liability in the accompanying consolidated balance sheets.
The rights to this programming are reflected in the accompanying consolidated balance sheets at the lower of unamortized cost or fair value. Program contract costs are amortized on a straight-line basis except for contracts greater than three years which are amortized utilizing an accelerated method. Program contract costs estimated by management to be amortized in the succeeding year are classified as current assets. Payments of program contract liabilities are typically made on a scheduled basis and are not affected by amortization or fair value adjustments.
Fair value is determined utilizing a discounted cash flow model based on management’s expectation of future advertising revenues, net of sales commissions, to be generated by the program material. We assess our program contract costs on a quarterly basis to ensure the costs are recorded at the lower of unamortized cost or fair value.
Sports Programming Rights
We have multi-year program rights agreements that provide the Company with the right to produce and telecast professional live sports games within a specified territory in exchange for a rights fee. A prepaid asset is recorded for rights acquired related to future games upon payment of the contracted fee. The assets recorded for the acquired rights are classified as current or non-current based on the period when the games are expected to be aired. Liabilities are recorded for any program rights obligations that have been incurred but not yet paid at period end. We amortize these programming rights as an expense over each season based upon contractually stated rates. Amortization is accelerated in the event that the stated contractual rates over the term of the rights agreement results in an expense recognition pattern that is inconsistent with the projected growth of revenue over the contractual term.
On March 12, 2020, the NBA, NHL, and MLB suspended or delayed the start of their seasons as a result of the COVID-19 pandemic. On that date, the Company suspended the recognition of amortization expense associated with prepaid program rights agreements with teams within these leagues. Amortization expense resumed for the NBA, NHL, and MLB over the modified seasons when the games commenced during the third quarter of 2020. The NBA and NHL also delayed the start of their 2020-2021 seasons until December 22, 2020 and January 13, 2021, respectively; sports rights expense associated with these seasons was recognized over the modified term of these seasons.
Certain rights agreements with professional teams contain provisions which require the rebate of rights fees paid by the Company if a contractually minimum number of live games are not delivered. The actual amount of rebates to be received will vary depending on changes in the final game counts of each league's respective season. Rights fees paid in advance of expense recognition, inclusive of any contractual rebates due to the Company, are included within prepaid sports rights in our consolidated balance sheets.
Impairment of Goodwill, Indefinite-lived Intangible Assets, and Other Long-lived Assets
We evaluate our goodwill and indefinite lived intangible assets for impairment annually in the fourth quarter, or more frequently, if events or changes in circumstances indicate that an impairment may exist. Our goodwill has been allocated to, and is tested for impairment at, the reporting unit level. A reporting unit is an operating segment or a component of an operating segment to the extent that the component constitutes a business for which discrete financial information is available and regularly reviewed by management. Components of an operating segment with similar characteristics are aggregated when testing goodwill for impairment.
In the performance of our annual assessment of goodwill for impairment, we have the option to qualitatively assess whether it is more likely than not that a reporting unit has been impaired. As part of this qualitative assessment, we weigh the relative impact of factors that are specific to the reporting units as well as industry, regulatory, and macroeconomic factors that could affect the significant inputs used to determine the fair value of the assets. We also consider the significance of the excess fair value over carrying value in prior quantitative assessments.
If we conclude that it is more likely than not that a reporting unit is impaired, or if we elect not to perform the optional qualitative assessment, we will determine the fair value of the reporting unit and compare it to the net book value of the reporting unit. If the fair value is less than the net book value, we will record an impairment to goodwill for the amount of the difference. We estimate the fair value of our reporting units utilizing the income approach involving the performance of a discounted cash flow analysis. Our discounted cash flow model is based on our judgment of future market conditions based on our internal forecast of future performance, as well as discount rates that are based on a number of factors including market interest rates, a weighted average cost of capital analysis, and includes adjustments for market risk and company specific risk.
Our indefinite-lived intangible assets consist primarily of our broadcast licenses and a trade name. For our annual impairment test for indefinite-lived intangible assets, we have the option to perform a qualitative assessment to determine whether it is more likely than not that these assets are impaired. As part of this qualitative assessment we weigh the relative impact of factors that are specific to the indefinite-lived intangible assets as well as industry, regulatory, and macroeconomic factors that could affect the significant inputs used to determine the fair value of the assets. We also consider the significance of the excess fair value over carrying value in prior quantitative assessments. When evaluating our broadcast licenses for impairment, the qualitative assessment is done at the market level because the broadcast licenses within the market are complementary and together enhance the single broadcast license of each station. If we conclude that it is more likely than not that one of our broadcast licenses is impaired, we will perform a quantitative assessment by comparing the aggregate fair value of the broadcast licenses in the market to the respective carrying values. We estimate the fair values of our broadcast licenses using the Greenfield method, which is an income approach. This method involves a discounted cash flow model that incorporates several variables, including, but not limited to, market revenues and long-term growth projections, estimated market share for the typical participant without a network affiliation, and estimated profit margins based on market size and station type. The model also assumes outlays for capital expenditures, future terminal values, an effective tax rate assumption and a discount rate based on a number of factors including market interest rates, a weighted average cost of capital analysis based on the target capital structure for a television station, and includes adjustments for market risk and company specific risk. If the carrying amount of the broadcast licenses exceeds the fair value, then an impairment loss is recorded to the extent that the carrying value of the broadcast licenses exceeds the fair value.
We evaluate our long-lived assets for impairment if events or changes in circumstances indicate that the carrying amount of such assets may not be recoverable. We evaluate the recoverability of long-lived assets by comparing the carrying amount of the assets within an asset group to the estimated undiscounted future cash flows associated with the asset group. An asset group represents the lowest level of cash flows generated by a group of assets that are largely independent of the cash flows of other assets. At the time that such evaluations indicate that the future undiscounted cash flows are not sufficient to recover the carrying value of the asset group, an impairment loss is determined by comparing the estimated fair value of the asset group to the carrying value. We estimate fair value using an income approach involving the performance of a discounted cash flow analysis.
Our RSNs included in the local sports segment were negatively impacted by the loss of three Distributors in 2020. In addition, our existing Distributors experienced elevated levels of subscriber erosion which we believe was influenced, in part, by shifting consumer behaviors resulting from media fragmentation, the current economic environment, the COVID-19 pandemic and related uncertainties. Most of these factors are also expected to have a negative impact on future projected revenues and margins of our RSNs. As a result of these factors, we performed an impairment test of the RSN reporting units' goodwill and long-lived asset groups during the third quarter of 2020 which resulted in a non-cash impairment charge for the year ended December 31, 2020 on goodwill of $2,615 million, customer relationships of $1,218 million, and other definite-lived intangible assets of $431 million, included within impairment of goodwill and definite-lived intangible assets in our consolidated statements of operations. During the year ended December 31, 2021, we did not identify any indicators that our definite-lived intangible assets may not be recoverable. See Note 5. Goodwill, Indefinite-Lived Intangible Assets, and Other Intangible Assets for more information.
We believe we have made reasonable estimates and utilized appropriate assumptions in the performance of our impairment assessments. If future results are not consistent with our assumptions and estimates, including future events such as a deterioration of market conditions, loss of significant customers, failure to execute on DSG's DTC strategy significant increases in discount rates, among other factors, we could be exposed to impairment charges in the future. Any resulting impairment loss could have a material adverse impact on our consolidated balance sheets, consolidated statements of operations and consolidated statements of cash flows.
When factors indicate that there may be a decrease in value of an equity method investment, we assess whether a loss in value has occurred. If that loss is deemed to be other than temporary, an impairment loss is recorded accordingly. For any equity method investments that indicate a potential impairment, we estimate the fair values of those investments using a combination of a market-based approach, which considers earnings and cash flow multiples of comparable businesses and recent market transactions, as well as an income approach involving the performance of a discounted cash flow analysis. See Note 6. Other Assets for more information.
Accounts Payable and Accrued Liabilities
Accounts payable and accrued liabilities consisted of the following as of December 31, 2021 and 2020 (in millions):
| | | | | | | | | | | |
| | 2021 | | 2020 |
| Compensation and employee benefits | $ | 142 | | | $ | 131 | |
| Interest | 126 | | | 127 | |
| Programming related obligations | 227 | | | 183 | |
| Legal, litigation, and regulatory | 6 | | | 2 | |
| Accounts payable and other operating expenses | 154 | | | 90 | |
| Total accounts payable and accrued liabilities | $ | 655 | | | $ | 533 | |
We expense these activities when incurred.
Income Taxes
We recognize deferred tax assets and liabilities based on the differences between the financial statement carrying amounts and the tax bases of assets and liabilities. We provide a valuation allowance for deferred tax assets if we determine that it is more likely than not that some or all of the deferred tax assets will not be realized. In evaluating our ability to realize net deferred tax assets, we consider all available evidence, both positive and negative, including our past operating results, tax planning strategies, current and cumulative losses, and forecasts of future taxable income. In considering these sources of taxable income, we must make certain judgments that are based on the plans and estimates used to manage our underlying businesses on a long-term basis. As of December 31, 2021 and 2020, a valuation allowance has been provided for deferred tax assets related to certain temporary basis differences, interest expense carryforwards under the Internal Revenue Code (IRC) Section 163(j) and a substantial amount of our available state net operating loss carryforwards based on past operating results, including the RSN impairment, expected timing of the reversals of existing temporary basis differences, alternative tax strategies and projected future taxable income. Future changes in operating and/or taxable income or other changes in facts and circumstances could significantly impact the ability to realize our deferred tax assets which could have a material effect on our consolidated financial statements.
Management periodically performs a comprehensive review of our tax positions, and we record a liability for unrecognized tax benefits if such tax positions are more likely than not to be sustained upon examination based on their technical merits, including the resolution of any appeals or litigation processes. Significant judgment is required in determining whether positions taken are more likely than not to be sustained, and it is based on a variety of facts and circumstances, including interpretation of the relevant federal and state income tax codes, regulations, case law and other authoritative pronouncements. Based on this analysis, the status of ongoing audits and the expiration of applicable statute of limitations, liabilities are adjusted as necessary. The resolution of audits is unpredictable and could result in tax liabilities that are significantly higher or lower than for what we have provided. See Note 12. Income Taxes, for further discussion of accrued unrecognized tax benefits.
Supplemental Information — Statements of Cash Flows
During the years ended December 31, 2021, 2020, and 2019, we had the following cash transactions (in millions):
| | | | | | | | | | | | | | | | | |
| | 2021 | | 2020 | | 2019 |
| Income taxes paid | $ | 16 | | | $ | 11 | | | $ | 32 | |
| Income tax refunds | $ | 44 | | | $ | 2 | | | $ | 2 | |
| Interest paid | $ | 583 | | | $ | 634 | | | $ | 283 | |
Non-cash investing activities included property and equipment purchases of $5 million, $6 million, and $10 million for the years ended December 31, 2021, 2020, and 2019, respectively; the receipt of equipment with a fair value of $58 million in connection with completing the repack process as more fully described in Note 2. Acquisitions and Dispositions of Assets for the year ended December 31, 2021; and the transfer of an asset for property of $7 million for the year ended December 31, 2020.
During the year ended December 31, 2020 the Company entered into a commercial agreement with Bally's and received equity interests in the business with a value of $199 million. See Note 6. Other Assets and Note 18. Fair Value Measurements for further discussion. Non-cash transactions related to sports rights were $22 million for the year ended December 31, 2020. During the year ended December 31, 2021, we received preferred shares in an investment valued at $6 million in exchange for an equivalent value of advertising spots.
Revenue Recognition
The following table presents our revenue disaggregated by type and segment for the years ended December 31, 2021, 2020, and 2019 (in millions):
| | | | | | | | | | | | | | | | | | | | | | | | | | | | | |
| For the year ended December 31, 2021 | Broadcast | | Local sports | | Other | | Eliminations | | Total |
| Distribution revenue | $ | 1,475 | | | $ | 2,620 | | | $ | 193 | | | $ | — | | | $ | 4,288 | |
| Advertising revenue | 1,106 | | | 409 | | | 217 | | | (41) | | | 1,691 | |
| Other media, non-media, and intercompany revenue | 176 | | | 27 | | | 71 | | | (119) | | | 155 | |
| Total revenues | $ | 2,757 | | | $ | 3,056 | | | $ | 481 | | | $ | (160) | | | $ | 6,134 | |
| | | | | | | | | |
| For the year ended December 31, 2020 | Broadcast | | Local sports | | Other | | Eliminations | | Total |
| Distribution revenue | $ | 1,414 | | | $ | 2,472 | | | $ | 199 | | | $ | — | | | $ | 4,085 | |
| Advertising revenue | 1,364 | | | 196 | | | 131 | | | (2) | | | 1,689 | |
| Other media, non-media, and intercompany revenue | 144 | | | 18 | | | 121 | | | (114) | | | 169 | |
| Total revenues | $ | 2,922 | | | $ | 2,686 | | | $ | 451 | | | $ | (116) | | | $ | 5,943 | |
| | | | | | | | | |
| For the year ended December 31, 2019 | Broadcast | | Local sports | | Other | | Eliminations | | Total |
| Distribution revenue | $ | 1,341 | | | $ | 1,029 | | | $ | 130 | | | $ | — | | | $ | 2,500 | |
| Advertising revenue | 1,268 | | | 103 | | | 110 | | | (1) | | | 1,480 | |
| Other media, non-media, and intercompany revenue | 81 | | | 7 | | | 230 | | | (58) | | | 260 | |
| Total revenues | $ | 2,690 | | | $ | 1,139 | | | $ | 470 | | | $ | (59) | | | $ | 4,240 | |
Distribution Revenue. We generate distribution revenue through fees received from Distributors for the right to distribute our stations, RSNs, and other properties. Distribution arrangements are generally governed by multi-year contracts and the underlying fees are based upon a contractual monthly rate per subscriber. These arrangements represent licenses of intellectual property; revenue is recognized as the signal or network programming is provided to our customers (as usage occurs) which corresponds with the satisfaction of our performance obligation. Revenue is calculated based upon the contractual rate multiplied by an estimated number of subscribers. Our customers will remit payments based upon actual subscribers a short time after the conclusion of a month, which generally does not exceed 120 days. Historical adjustments to subscriber estimates have not been material.
Certain of our distribution arrangements contain provisions that require the Company to deliver a minimum number of live professional sports games or tournaments during a defined period which usually corresponds with a calendar year. If the minimum threshold is not met, we may be obligated to refund a portion of the distribution fees received if shortfalls are not cured within a specified period of time. Our ability to meet these requirements is primarily driven by the delivery of games by the professional sports leagues. Prior to the COVID-19 pandemic, the Company had not historically paid any material rebates under these contractual provisions as it is unusual for there to be an event which is significant enough to preclude the Company from meeting or exceeding these thresholds. The COVID-19 pandemic has resulted in significant disruptions to the normal operations of the professional sports leagues resulting in delays and uncertainty with respect to regularly scheduled games. Decisions made by the leagues during the second quarter of 2020 regarding the timing and format of the revised 2020 season and decisions made by the NHL and NBA during the fourth quarter of 2020 and the first and third quarters of 2021 regarding the timing and format of their revised 2020-2021 seasons have resulted, in some cases, in our inability to meet these minimum game requirements and the need to reduce revenue based upon estimated rebates due to our Distributors. Accrued rebates as of December 31, 2021 and 2020 were $210 million and $420 million, respectively. The decrease in accrued rebates during the year ended December 31, 2021 includes $202 million of payments and $8 million of adjustments related to rebates accrued in 2020 due primarily to changes in estimated game counts. As of December 31, 2021, all rebates are reflected in other current liabilities in our consolidated balance sheets. We expect these rebates to be paid during 2022. There were no rebates accrued during the year ended December 31, 2021 that related to the 2020-2021 seasons, as we were not in a shortfall position in 2021. There can be no assurances that additional rebates will not be required if there are future postponements of the professional sports leagues, including the outcome of the current MLB lockout.
Advertising Revenue. We generate advertising revenue primarily from the sale of advertising spots/impressions within our broadcast television, RSNs, and digital platforms. Advertising revenue is recognized in the period in which the advertising spots/impressions are delivered. In arrangements where we provide audience ratings guarantees, to the extent that there is a ratings shortfall, we will defer a proportionate amount of revenue until the ratings shortfall is settled through the delivery of additional advertising. The term of our advertising arrangements is generally less than one year and the timing between when an advertisement is aired and when payment is due is not significant. In certain circumstances, we require customers to pay in advance; payments received in advance of satisfying our performance obligations are reflected as deferred revenue.
Practical Expedients and Exemptions. We expense sales commissions when incurred because the period of benefit for these costs is one year or less. These costs are recorded within media selling, general and administrative expenses. In accordance with ASC 606, we do not disclose the value of unsatisfied performance obligations for (i) contracts with an original expected length of one year or less and (ii) distribution arrangements which are accounted for as a sales/usage based royalty.
Arrangements with Multiple Performance Obligations. Our contracts with customers may include multiple performance obligations. For such arrangements, we allocate revenues to each performance obligation based on its relative standalone selling price, which is generally based on the prices charged to customers.
Deferred Revenues. We record deferred revenue when cash payments are received or due in advance of our performance, including amounts which are refundable. We classify deferred revenue as either current in other current liabilities or long-term in other long-term liabilities within our consolidated balance sheets, based on the timing of when we expect to satisfy our performance obligations. Deferred revenue was $235 million, $233 million, and $54 million as of December 31, 2021, 2020, and 2019, respectively, of which $164 million and $184 million as of December 31, 2021 and 2020, respectively, was reflected in other long-term liabilities in our consolidated balance sheets. Deferred revenue recognized during the years ended December 31, 2021 and 2020 that was included in the deferred revenue balance as of December 31, 2020 and 2019 was $45 million and $49 million, respectively.
On November 18, 2020, the Company and DSG entered into an enterprise-wide commercial agreement with Bally’s Corporation, including providing certain branding integrations in our RSNs, broadcast networks, and other properties. These branding integrations include naming rights associated with the majority of our RSNs (other than Marquee). The initial term of this arrangement is ten years and we began performing under this arrangement in 2021. The Company received non-cash consideration initially valued at $199 million which is reflected as a contract liability and recognized as revenue as the performance obligations under the arrangement are satisfied. See Note 6. Other Assets for more information.
For the year ended December 31, 2021, three customers accounted for 19%, 18%, and 14%, respectively, of our total revenues. For the year ended December 31, 2020, three customers accounted for 18%, 17%, and 12%, respectively, of our total revenues. For the year ended December 31, 2019, three customers accounted for 16%, 13%, and 10%, respectively, of our total revenues. For purposes of this disclosure, a single customer may include multiple entities under common control.
Advertising Expenses
Promotional advertising expenses are recorded in the period when incurred and are included in media production and other non-media expenses. Total advertising expenses, net of advertising co-op credits, were $22 million, $23 million, and $25 million for the years ended December 31, 2021, 2020, and 2019.
Financial Instruments
Financial instruments, as of December 31, 2021 and 2020, consisted of cash and cash equivalents, trade accounts receivable, accounts payable, accrued liabilities, stock options and warrants, and notes payable. The carrying amounts approximate fair value for each of these financial instruments, except for the notes payable. See Note 18. Fair Value Measurements for additional information regarding the fair value of notes payable.
Post-retirement Benefits
We maintain a supplemental executive retirement plan (SERP) which we inherited upon the acquisition of certain stations. As of December 31, 2021, the estimated projected benefit obligation was $18 million, of which $1 million is included in accrued expenses and $17 million is included in other long-term liabilities in our consolidated balance sheets. At December 31, 2021, the projected benefit obligation was measured using a 2.61% discount rate compared to a discount rate of 2.10% for the year ended December 31, 2020. For each of the years ended December 31, 2021 and 2020, we made $2 million in benefit payments. We recognized actuarial gains of $1 million and actuarial losses of $2 million through other comprehensive income for the years ended December 31, 2021 and 2020, respectively. For each of the years ended December 31, 2021 and 2020, we recognized $1 million of periodic pension expense, reported in other (expense) income, net in our consolidated statements of operations.
We also maintain other post-retirement plans provided to certain employees. The plans are voluntary programs that primarily allow participants to defer eligible compensation and they may also qualify to receive a discretionary match on their deferral. As of December 31, 2021, the assets and liabilities included in our consolidated balance sheets related to deferred compensation plans were $48 million and $38 million, respectively.
Reclassifications
Certain reclassifications have been made to prior years’ consolidated financial statements to conform to the current year’s presentation.
2. ACQUISITIONS AND DISPOSITIONS OF ASSETS:
During the years ended December 31, 2021, 2020, and 2019, we acquired certain businesses for an aggregate purchase price, net of cash acquired, of $9 billion, including working capital adjustments and other adjustments.
The following summarizes the acquisition activity during the years ended December 31, 2021, 2020, and 2019:
2021 Acquisitions
During the year ended December 31, 2021, we completed the acquisition of ZypMedia for approximately $7 million in cash. The acquired assets and liabilities were recorded at fair value as of the closing date of the transactions.
During the year ended December 31, 2021, we purchased 360IA, LLC for $5 million, with $2 million being paid in cash and the remaining to paid in $1 million increments on each of the first three anniversaries following the closing date.
2020 Acquisitions
During the year ended December 31, 2020, we completed the acquisition of the license asset and certain non-license assets of a radio station for $7 million and the license assets and certain non-license assets of two television stations for $9 million. The acquisitions were completed using cash on hand.
2019 Acquisitions
RSN Acquisition. In May 2019, DSG entered into a definitive agreement to acquire controlling interests in 21 Regional Sports Network brands and Fox College Sports (collectively, the Acquired RSNs), from Disney for $9.6 billion plus certain adjustments. On August 23, 2019, we completed the acquisition (the RSN Acquisition) for an aggregate purchase price, including cash acquired, and subject to an adjustment based upon finalization of working capital, net debt, and other adjustments, of $9,817 million, accounted for as a business combination under the acquisition method of accounting. The RSN Acquisition provides an expansion to our premium sports programming including the exclusive regional distribution rights to 42 professional teams consisting of 14 MLB teams, 16 NBA teams, and 12 NHL teams. The Acquired RSNs are reported within our local sports segment. See Note 17. Segment Data.
The transaction was funded through a combination of debt financing raised by Diamond Sports Group, LLC (DSG) and Sinclair Television Group, Inc. (STG), as described in Note 7. Notes Payable and Commercial Bank Financing, and redeemable subsidiary preferred equity, as described in Note 10. Redeemable Noncontrolling Interests.
The following table summarizes the fair value of acquired assets, assumed liabilities, and noncontrolling interests of the Acquired RSNs (in millions):
| | | | | |
| Cash and cash equivalents | $ | 824 | |
| Accounts receivable, net | 606 | |
| Prepaid expenses and other current assets | 175 | |
| Property and equipment, net | 25 | |
| Customer relationships, net | 5,439 | |
| Other definite-lived intangible assets, net | 1,286 | |
| Other assets | 52 | |
| Accounts payable and accrued liabilities | (181) | |
| Other long-term liabilities | (396) | |
| Goodwill | 2,615 | |
| Fair value of identifiable net assets acquired | $ | 10,445 | |
| Redeemable noncontrolling interests | (380) | |
| Noncontrolling interests | (248) | |
| Gross purchase price | $ | 9,817 | |
| Purchase price, net of cash acquired | $ | 8,993 | |
The final purchase price allocation presented above is based upon management's estimates of the fair value of the acquired assets, assumed liabilities, and noncontrolling interest at the time of acquisition using valuation techniques including income and cost approaches. The fair value estimates are based on, but not limited to, projected revenue, projected margins, and discount rates used to present value future cash flows. The adjustments made to the initial allocation were based on more detailed information obtained about the specific assets acquired and liabilities assumed and did not result in material changes to the amortization expense recorded in previous quarters.
The definite-lived intangible assets of $6,725 million are primarily comprised of customer relationships, which represent existing advertiser relationships and contractual relationships with Distributors of $5,439 million, the fair value of contracts with sports teams of $1,271 million, and tradenames/trademarks of $15 million. The intangible assets will be amortized over a weighted average useful life of 2 years for tradenames/trademarks, 13 years for customer relationships, and 12 for contracts with sports teams on a straight-line basis. The fair value of the sports team contracts will be amortized over the respective contract term. Acquired property and equipment will be depreciated on a straight-line basis over the respective estimated remaining useful lives. Goodwill is calculated as the excess of the consideration transferred over the fair value of the identifiable net assets acquired and represents the future economic benefits expected to arise from other intangible assets acquired that do not qualify for separate recognition, as well as expected future synergies. We estimate that $2.4 billion of goodwill, which represents our interest in the Acquired RSNs, will be deductible for tax purposes. See Note 5. Goodwill, Indefinite-Lived Intangible Assets, and Other Intangible Assets for discussion of the impairment of the acquired goodwill and definite-lived intangible assets during the year ended December 31, 2020.
Financial Results of Acquisitions
The following tables summarize the results of the net revenues and operating (loss) income included in the financial statements of the Company beginning on the acquisition date of each acquisition as listed below (in millions):
| | | | | | | | | | | | | | | | | |
| 2021 | | 2020 | | 2019 |
| Revenues: | | | | | |
| Acquired RSNs | $ | 2,834 | | | $ | 2,562 | | | $ | 1,139 | |
| Other acquisitions in 2020 | 4 | | | 3 | | | — | |
| Other acquisitions in 2021 | 8 | | | — | | | — | |
| Total net revenues | $ | 2,846 | | | $ | 2,565 | | | $ | 1,139 | |
| | | | | | | | | | | | | | | | | |
| 2021 | | 2020 | | 2019 |
| Operating (Loss) Income: | | | | | |
| Acquired RSNs (a) | $ | (395) | | | $ | (3,585) | | | $ | 70 | |
| Other acquisitions in 2020 | (9) | | | (2) | | | — | |
| Other acquisitions in 2021 | (45) | | | — | | | — | |
| Total operating (loss) income | $ | (449) | | | $ | (3,587) | | | $ | 70 | |
(a)Operating (loss) income for the years ended December 31, 2020 and 2019 includes transaction costs discussed below, and for the years ended December 31, 2021, 2020, and 2019 excludes $109 million, $98 million, and $35 million, respectively, of selling, general, and administrative expenses for services provided by broadcast to local sports, which are eliminated in consolidation.
In connection with the 2020 and 2019 acquisitions, for the years ended December 31, 2020 and 2019 we recognized $5 million and $96 million, respectively, of transaction costs which we expensed as incurred and classified as corporate general and administrative expenses in our consolidated statements of operations.
Unaudited Pro Forma Information
The following table sets forth unaudited pro forma results of operations, assuming that the RSN Acquisition, along with transactions necessary to finance the acquisition, occurred at the beginning of the year preceding the year of acquisition (in millions, except per data share):
| | | | | | | | | |
| | Unaudited | | | | |
| | 2019 | | | | |
| Total revenues | $ | 6,689 | | | | | |
| Net income | $ | 328 | | | | | |
| Net income attributable to Sinclair Broadcast Group | $ | 130 | | | | | |
| Basic earnings per share attributable to Sinclair Broadcast Group | $ | 1.41 | | | | | |
| Diluted earnings per share attributable to Sinclair Broadcast Group | $ | 1.39 | | | | | |
This pro forma financial information is based on historical results of operations, adjusted for the allocation of the purchase price and other acquisition accounting adjustments, and is not indicative of what our results would have been had we operated the Acquired RSNs for the period presented because the pro forma results do not reflect expected synergies. The pro forma adjustments reflect depreciation expense and amortization of intangible assets related to the fair value adjustments of the assets acquired and any adjustments to interest expense to reflect the debt financing of the transactions. Depreciation and amortization expense are higher than amounts recorded in the historical financial statements of the acquiree due to the fair value adjustments recorded for long-lived tangible and intangible assets in purchase accounting.
Dispositions
2021 Dispositions. In September 2021, we sold all of our radio broadcast stations, KOMO-FM, KOMO-AM, KPLZ-FM and KVI-AM in Seattle, WA, for consideration valued at $13 million. For the year ended December 31, 2021, we recorded a net loss of $12 million related to the sale, which is included within gain on asset dispositions and other, net of impairment in our consolidated statements of operations, and was primarily related to the write-down of the carrying value of the assets to estimate the selling price.
In June 2021, we sold our controlling interest in Triangle Sign & Service, LLC (Triangle) for $12 million. We recorded a gain on the sale of Triangle of $6 million, of which $3 million was attributable to noncontrolling interests, for the year ended December 31, 2021, which is included in the gain on asset dispositions and other, net of impairment and net (loss) income attributable to the noncontrolling interests, respectively, in our consolidated statements of operations.
In February 2021, we sold two of our television broadcast stations, WDKA-TV in Paducah, KY and KBSI-TV in Cape Girardeau, MO, for an aggregate sale price of $28 million. We recorded a gain of $12 million for the year ended December 31, 2021, which is included within gain on asset dispositions and other, net of impairment in our consolidated statements of operations.
2020 Dispositions. In January 2020, we agreed to sell the license and non-license assets of WDKY-TV in Lexington, KY and certain non-license assets associated with KGBT-TV in Harlingen, Texas for an aggregate purchase price of $36 million. The KGBT-TV and WDKY-TV transactions closed during the first and third quarters of 2020, respectively, and we recorded gains of $8 million and $21 million, respectively, for the year ended December 31, 2020, which are included within gain on asset dispositions and other, net of impairment in our consolidated statements of operations.
Broadcast Incentive Auction. In 2012, Congress authorized the Federal Communication Commission (FCC) to conduct so-called "incentive auctions" to auction and re-purpose broadcast television spectrum for mobile broadband use. Pursuant to the auction, television broadcasters submitted bids to receive compensation for relinquishing all or a portion of their rights in the television spectrum of their full-service and Class A stations. Low power stations were not eligible to participate in the auction and are not protected and therefore may be displaced or forced to go off the air as a result of the post-auction repacking process.
In the repacking process associated with the auction, the FCC has reassigned some stations to new post-auction channels. We do not expect reassignment to new channels to have a material impact on our coverage. We have received notification from the FCC that 100 of our stations have been assigned to new channels. Legislation has provided the FCC with a $3 billion fund to reimburse reasonable costs incurred by stations that are reassigned to new channels in the repack. We expect that the reimbursements from the fund will cover the majority of our expenses related to the repack. We recorded gains related to reimbursements for the spectrum repack costs incurred of $24 million, $90 million, and $62 million for the years ended December 31, 2021, 2020, and 2019, respectively, which are recorded within gain on asset dispositions and other, net of impairment in our consolidated statements of operations. For the years ended December 31, 2021, 2020, and 2019, capital expenditures related to the spectrum repack were $12 million, $61 million, and $66 million, respectively.
In December 2020, the FCC began a similar repacking process associated with a portion of the C-Band spectrum in order to free up this spectrum for the use of 5G wireless services. The repack is scheduled to be completed in two phases, the first ended on December 31, 2021 and the second will end on December 31, 2023. We entered into an agreement with a communications provider in which we received equipment to complete the repack process at a maximum cost to us of $15 million. For the year ended December 31, 2021, we recognized a gain of $43 million, which is recorded within gain on asset dispositions and other, net of impairment in our consolidated statements of operations, equal to the fair value of the equipment that we received of $58 million, less the maximum cost to us of $15 million.
3. STOCK-BASED COMPENSATION PLANS:
In June 1996, our Board of Directors adopted, upon approval of the shareholders by proxy, the 1996 Long-Term Incentive Plan (LTIP). The purpose of the LTIP is to reward key individuals for making major contributions to our success and the success of our subsidiaries and to attract and retain the services of qualified and capable employees. Under the LTIP, we have issued restricted stock awards (RSAs), stock grants to our non-employee directors, stock-settled appreciation rights (SARs), and stock options. A total of 19,000,000 shares of Class A Common Stock are reserved for awards under this plan. As of December 31, 2021, 7,099,237 shares were available for future grants. Additionally, we have the following arrangements that involve stock-based compensation: employer matching contributions (the Match) for participants in our 401(k) plan, an employee stock purchase plan (ESPP), and subsidiary stock awards. Stock-based compensation expense has no effect on our consolidated cash flows. For the years ended December 31, 2021, 2020, and 2019, we recorded stock-based compensation of $60 million, $51 million, and $33 million, respectively. Below is a summary of the key terms and methods of valuation of our stock-based compensation awards:
RSAs. RSAs issued in 2021, 2020, and 2019 have certain restrictions that lapse over two years at 50% and 50%, respectively. As the restrictions lapse, the Class A Common Stock may be freely traded on the open market. Unvested RSAs are entitled to dividends, and therefore, are included in weighted shares outstanding, resulting in a dilutive effect on basic and diluted earnings per share. The fair value assumes the closing value of the stock on the measurement date.
The following is a summary of changes in unvested restricted stock:
| | | | | | | | | | | |
| | RSAs | | Weighted-Average Price |
| Unvested shares at December 31, 2020 | 441,709 | | | $ | 28.86 | |
| 2021 Activity: | | | |
| Granted | 693,019 | | | 32.78 | |
| Vested | (615,736) | | | 33.25 | |
| Forfeited | (17,611) | | | 29.61 | |
| Unvested shares at December 31, 2021 | 501,381 | | | $ | 28.87 | |
For the years ended December 31, 2021, 2020, and 2019, we recorded compensation expense of $21 million, $23 million, and $9 million, respectively. The majority of the unrecognized compensation expense of $6 million as of December 31, 2021 will be recognized in 2022.
Stock Grants to Non-Employee Directors. In addition to fees paid in cash to our non-employee directors, on the date of each annual meetings of shareholders, each non-employee director receives a grant of unrestricted shares of Class A Common Stock. We issued 45,836 shares in 2021, 63,600 shares in 2020, and 24,000 shares in 2019. We recorded expense of $2 million for the year ended December 31, 2021 and $1 million for each of the years ended December 31, 2020 and 2019, which was based on the average share price of the stock on the date of grant. Additionally, these shares are included in the total shares outstanding, which results in a dilutive effect on our basic and diluted earnings per share.
SARs. These awards entitle holders to the appreciation in our Class A Common Stock over the base value of each SAR over the term of the award. The SARs have a 10-year term with vesting periods ranging from zero to four years. The base value of each SAR is equal to the closing price of our Class A Common Stock on the date of grant. For the years ended December 31, 2021, 2020, and 2019, we recorded compensation expense of $15 million, $6 million, and $4 million, respectively.
The following is a summary of the 2021 activity:
| | | | | | | | | | | |
| | SARs | | Weighted-Average Price |
| Outstanding SARs at December 31, 2020 | 3,205,562 | | | $ | 23.32 | |
| 2021 Activity: | | | |
| Granted | 1,343,693 | | | 33.05 | |
| Exercised | (2,254,008) | | | 20.99 | |
| Outstanding SARs at December 31, 2021 | 2,295,247 | | | $ | 31.29 | |
As of December 31, 2021, there was no aggregate intrinsic value of the SARs outstanding and the outstanding SARs have a weighted average remaining contractual life of 7 years as of.
Valuation of SARS. Our SARs were valued using the Black-Scholes pricing model utilizing the following assumptions:
| | | | | | | | | | | | | | | | | |
| | 2021 | | 2020 | | 2019 |
| Risk-free interest rate | 0.6 | % | | 1.2% - 1.6% | | 2.5 | % |
| Expected years to exercise | 5 years | | 5 years | | 5 years |
| Expected volatility | 48.2 | % | | 35.0 | % | | 33.8 | % |
| Annual dividend yield | 2.5 | % | | 2.4% - 2.9% | | 2.5 | % |
The risk-free interest rate is based on the U.S. Treasury yield curve, in effect at the time of grant, for U.S. Treasury STRIPS that approximate the expected life of the award. The expected volatility is based on our historical stock prices over a period equal to the expected life of the award. The annual dividend yield is based on the annual dividend per share divided by the share price on the grant date.
Options. As of December 31, 2021, there were options outstanding to purchase 375,000 shares of Class A Common Stock. These options are fully vested and have a weighted average exercise price of $31.25 and a weighted average remaining contractual term of 4 years. As of December 31, 2021, there was no aggregate intrinsic value for the options outstanding. There was no grant, exercise, or forfeiture activity during the year ended December 31, 2021. There was no expense recognized during the years ended December 31, 2021, 2020, and 2019.
During 2019, outstanding SARs and options increased the weighted average shares outstanding for purposes of determining dilutive earnings per share.
401(k) Match. The Sinclair Broadcast Group, Inc. 401(k) Profit Sharing Plan and Trust (the 401(k) Plan) is available as a benefit for our eligible employees. Contributions made to the 401(k) Plan include an employee elected salary reduction amount with a match calculation (The Match). The Match and any additional discretionary contributions may be made using our Class A Common Stock, if the Board of Directors so chooses. Typically, we make the Match using our Class A Common Stock.
The value of the Match is based on the level of elective deferrals into the 401(k) Plan. The number of our Class A Common shares granted under the Match is determined based upon the closing price on or about March 1st of each year for the previous calendar year’s Match. For the years ended December 31, 2021, 2020, and 2019, we recorded $20 million, $19 million, and $17 million, respectively, of stock-based compensation expense related to the Match. A total of 7,000,000 shares of Class A Common Stock are reserved for matches under the plan. As of December 31, 2021, 2,314,064 shares were available for future grants.
ESPP. The ESPP allows eligible employees to purchase Class A Common Stock at 85% of the lesser of the fair value of the common stock as of the first day of the quarter and as of the last day of that quarter, subject to certain limits as defined in the ESPP. The stock-based compensation expense recorded related to the ESPP for the years ended December 31, 2021, 2020, and 2019 was $2 million, $3 million, and $1 million, respectively. A total of 4,200,000 shares of Class A Common Stock are reserved for awards under the plan. As of December 31, 2021, 1,097,156 shares were available for future purchases.
4. PROPERTY AND EQUIPMENT:
Property and equipment are stated at cost, less accumulated depreciation. Depreciation is generally computed under the straight-line method over the following estimated useful lives:
| | | | | | | | |
| Buildings and improvements | | 10 - 30 years |
| Operating equipment | | 5 - 10 years |
| Office furniture and equipment | | 5 - 10 years |
| Leasehold improvements | | Lesser of 10 - 30 years or lease term |
| Automotive equipment | | 3 - 5 years |
| Property and equipment under finance leases | | Lease term |
Acquired property and equipment is depreciated on a straight-line basis over the respective estimated remaining useful lives.
Property and equipment consisted of the following as of December 31, 2021 and 2020 (in millions):
| | | | | | | | | | | |
| | 2021 | | 2020 |
| Land and improvements | $ | 72 | | | $ | 74 | |
| Real estate held for development and sale | 21 | | | 25 | |
| Buildings and improvements | 308 | | | 307 | |
| Operating equipment | 973 | | | 939 | |
| Office furniture and equipment | 129 | | | 123 | |
| Leasehold improvements | 60 | | | 59 | |
| Automotive equipment | 63 | | | 66 | |
| Finance lease assets | 61 | | | 59 | |
| Construction in progress | 34 | | | 36 | |
| | 1,721 | | | 1,688 | |
| Less: accumulated depreciation | (888) | | | (865) | |
| | $ | 833 | | | $ | 823 | |
5. GOODWILL, INDEFINITE-LIVED INTANGIBLE ASSETS, AND OTHER INTANGIBLE ASSETS:
Goodwill, which arises from the purchase price exceeding the assigned value of the net assets of an acquired business, represents the value attributable to unidentifiable intangible elements being acquired. The change in the carrying amount of goodwill at December 31, 2021 and 2020 was as follows (in millions):
| | | | | | | | | | | | | | | | | | | | | | | |
| | Broadcast | | Local sports | | Other | | Consolidated |
| Balance at December 31, 2019 | $ | 2,026 | | | 2,615 | | | $ | 75 | | | $ | 4,716 | |
| | | | | | | |
| Assets held for sale (b) | (9) | | | — | | | — | | | (9) | |
| Impairment | — | | | (2,615) | | | — | | | (2,615) | |
| Balance at December 31, 2020 | 2,017 | | | — | | | 75 | | | 2,092 | |
| Disposition (a) | (1) | | | — | | | (3) | | | (4) | |
| | | | | | | |
| | | | | | | |
| Balance at December 31, 2021 | $ | 2,016 | | | $ | — | | | $ | 72 | | | $ | 2,088 | |
(a)See Note 2. Acquisitions and Dispositions of Assets for discussion of dispositions made during 2021.
(b)Assets held for sale as of December 31, 2020 were sold during the year ended December 31, 2021. See Note 2. Acquisitions and Dispositions of Assets for discussion of dispositions during 2021 and 2020.
During the year ended December 31, 2020, we recorded a $2,615 million goodwill impairment charge related to our regional sports networks included within the local sports segment based upon an interim impairment test performed during the three-month period ended September 30, 2020. See Impairment of Goodwill and Definite-Lived Intangible Assets below for additional discussion surrounding this impairment charge. Our accumulated goodwill impairment as of December 31, 2021 and 2020 was $3,029 million, respectively.
For our annual goodwill impairment tests related to our broadcast and other reporting units in 2021, 2020, and 2019, we concluded that it was more-likely-than-not that goodwill was not impaired for the reporting units in which we performed a qualitative assessment. The qualitative factors reviewed during our annual assessments indicated stable or improving margins and favorable or stable forecasted economic conditions including stable discount rates and comparable or improving business multiples. For one reporting unit in 2019, we elected to perform a quantitative assessment and concluded that its fair value significantly exceeded the carrying value. Additionally, the results of prior quantitative assessments supported significant excess fair value over carrying value of our reporting units. We did not have any indicators of impairment in any interim period in 2021 or 2019, and therefore did not perform interim impairment tests for goodwill during those periods.
As of December 31, 2021 and 2020, the carrying amount of our indefinite-lived intangible assets was as follows (in millions):
| | | | | | | | | | | | | | | | | |
| Broadcast | | Other | | Consolidated |
| Balance at December 31, 2019 (a) | $ | 131 | | | $ | 27 | | | $ | 158 | |
| Acquisition / Disposition (c) | 13 | | | — | | | 13 | |
| Balance at December 31, 2020 (a) (b) | 144 | | | 27 | | | 171 | |
| Acquisition / Disposition (c) | (21) | | | — | | | (21) | |
| | | | | |
| Balance at December 31, 2021 (a) (b) | $ | 123 | | | $ | 27 | | | $ | 150 | |
(a)Our indefinite-lived intangible assets in our broadcast segment relate to broadcast licenses and our indefinite-lived intangible assets in other relate to trade names.
(b)Approximately $14 million of indefinite-lived intangible assets relate to consolidated VIEs as of December 31, 2021 and 2020.
(c)See Note 2. Acquisitions and Dispositions of Assets for discussion of acquisitions and dispositions during 2021 and 2020.
We did not have any indicators of impairment for our indefinite-lived intangible assets in any interim period in 2021 or 2020, and therefore did not perform interim impairment tests during those periods. We performed our annual impairment tests for indefinite-lived intangibles in 2021 and 2020 and as a result of our qualitative assessments, we recorded no impairment.
The following table shows the gross carrying amount and accumulated amortization of definite-lived intangibles (in millions):
| | | | | | | | | | | | | | | | | |
| | As of December 31, 2021 |
| | Gross Carrying Value | | Accumulated Amortization | | Net |
| Amortized intangible assets: | | | | | |
| Customer relationships | $ | 5,323 | | | $ | (1,419) | | | $ | 3,904 | |
| | | | | |
| Network affiliation | 1,436 | | | (861) | | | 575 | |
| Favorable sports contracts | 840 | | | (251) | | | 589 | |
| Other | 51 | | | (31) | | | 20 | |
| Total other definite-lived intangible assets, net (a) | $ | 2,327 | | | $ | (1,143) | | | $ | 1,184 | |
| | | | | | | | | | | | | | | | | |
| | As of December 31, 2020 |
| | Gross Carrying Value | | Accumulated Amortization | | Net |
| Amortized intangible assets: | | | | | |
| Customer relationships (b) | $ | 5,329 | | | $ | (1,043) | | | $ | 4,286 | |
| | | | | |
| Network affiliation | 1,438 | | | (775) | | | 663 | |
| Favorable sports contracts (b) | 840 | | | (174) | | | 666 | |
| Other | 35 | | | (26) | | | 9 | |
| Total other definite-lived intangible assets, net (a) | $ | 2,313 | | | $ | (975) | | | $ | 1,338 | |
(a)Approximately $47 million and $54 million of definite-lived intangible assets relate to consolidated VIEs as of December 31, 2021 and 2020, respectively.
(b)As of December 31, 2020, we recorded a total impairment loss relating to customer relationships and favorable sports contracts of $1,218 million and $431 million, respectively, which is reflected as a reduction within the Gross Carrying Value column.
Definite-lived intangible assets and other assets subject to amortization are being amortized on a straight-line basis over their estimated useful lives. The definite-lived intangible assets are amortized over a weighted average useful life of 13 years for customer relationships, 15 years for network affiliations, and 12 years for favorable sports contracts. The amortization expense of the definite-lived intangible and other assets for the years ended December 31, 2021, 2020, and 2019 was $554 million, $703 million, and $370 million, respectively, of which $77 million, $131 million, and $43 million, respectively, was associated with the amortization of favorable sports contracts and is presented within media programming and production expenses in our statements of operations.
The following table shows the estimated annual amortization expense of the definite-lived intangible assets for the next five years and thereafter (in millions):
| | | | | |
| 2022 | $ | 548 | |
| 2023 | 530 | |
| 2024 | 517 | |
| 2025 | 507 | |
| 2026 | 497 | |
| 2027 and thereafter | 2,489 | |
| $ | 5,088 | |
Impairment of Goodwill and Definite-Lived Intangible Assets
In conjunction with the interim third quarter 2020 impairment testing related to our RSNs discussed below, during the year ended December 31, 2020, we recorded a non-cash impairment charge associated with customer relationships and other definite-lived intangible assets of $1,218 million and $431 million, respectively, included in impairment of goodwill and definite-lived intangible assets in our consolidated statements of operations. After the recognition of these impairments there were no asset groups which have a heightened risk of impairment because the projected undiscounted cash flows of the individual asset groups were substantially greater than their carrying values. However, significant deterioration in the factors described below could result in future material impairments. There were no impairment charges recorded for the years ended December 31, 2021 and 2019, as there were no indicators of impairment.
The Company performed an interim goodwill and long-lived asset impairment test during the three-month period ending September 30, 2020. Our RSNs, included in the local sports segment, were negatively impacted by the loss of certain distributors. In addition, our existing distributors experienced elevated levels of subscriber erosion which we believe was influenced, in part, by shifting consumer behaviors resulting from media fragmentation, the current economic environment, the COVID 19 pandemic, and related uncertainties. These factors are also expected to have a negative impact on future projected revenue and margins of our RSNs.
The long-lived asset impairment test requires a comparison of undiscounted cash flows expected to be generated over the useful life of an asset group to the carrying value of the asset group. Assets are grouped at the lowest level for which identifiable cash flows are largely independent of the cash flows of other groups of assets and liabilities. We evaluated each of our RSNs individually as asset groups. We estimated the projected undiscounted cash flows over the remaining useful life of each asset group. The more sensitive inputs used in the undiscounted cash flow analysis include projected revenues and margins. We identified 10 RSNs which had carrying values in excess of the future undiscounted cash flows. For these RSNs, an impairment loss was measured as the amount by which the carrying value of the asset group exceeded the fair value. The calculated impairment was then allocated to the long-lived assets within the asset group, which primarily consists of definite lived intangible assets, based upon relative fair value.
The fair value of the asset groups, reporting units and definite lived intangible assets were determined based upon a discounted cash flow analysis which uses the present value of projected cash flows. The projected cash flows were based upon our estimates of future revenues and margins, among other inputs. The discount rates used in the valuation were based on a weighted-average cost of capital determined from relevant market comparisons and taking into consideration the risk specifically associated with our asset groups and underlying assets. Terminal values were determined based upon the final year of projected cash flows which reflected our estimate of stable perpetual growth. The more sensitive inputs used in the discounted cash flow analysis include projected revenues and margins, as well as the discount rates used to calculate the present value of future cash flows. Projected revenue was based on the consideration of historical experience of the business, market data surrounding subscriber projections and advertising growth, our ability to retain existing customers and our ability to obtain new customers. Our revenue projections could be negatively impacted by the further loss of key distributors, inability to obtain new or retain existing distributors on terms similar to those expiring, greater than expected consumer migration away from traditional linear distributors, or our inability to successfully execute on our DTC strategy and develop alternative revenue streams, among other factors. Our future margins may also be affected by our inability to renew sports rights agreements on terms favorable to us.
We tested the RSN reporting units' goodwill for impairment on an interim basis by comparing the fair value of each of the RSN reporting units to their revised carrying value after adjustments were made related to the impairments of the asset groups, as described above. To the extent that the carrying value of the respective reporting units exceeded the fair value, a goodwill impairment charge was recorded. The fair value of the reporting units was determined based upon a discounted cash flow analysis, as described above. For the year ended December 31, 2020, we recorded a non-cash goodwill impairment charge of $2,615 million, included in impairment of goodwill and definite-lived intangible assets in our consolidated statements of operations. As of December 31, 2021, there was no remaining goodwill within our local sports segment and the remaining balance of the customer relationship intangible asset was $3,380 million and the aggregate remaining balance of the other definite-lived intangible assets was $589 million within our local sports segment.
6. OTHER ASSETS:
Other assets as of December 31, 2021 and 2020 consisted of the following (in millions):
| | | | | | | | | | | |
| | 2021 | | 2020 |
| Equity method investments | $ | 517 | | | $ | 451 | |
| Other investments | 567 | | | 450 | |
| Post-retirement plan assets | 50 | | | 44 | |
| | | |
| Other | 274 | | | 113 | |
| Total other assets | $ | 1,408 | | | $ | 1,058 | |
Equity Method Investments
We have a portfolio of investments, including our investment in the YES Network and entities that are primarily focused on the development of real estate, sustainability initiatives, and other non-media businesses. For the years ended December 31, 2021, 2020, and 2019, none of our investments were individually significant.
Summarized Financial Information. As described under Principles of Consolidation within Note 1. Nature of Operations and Summary of Significant Accounting Policies, we record our proportionate share of net income generated by equity method investees in income (loss) from equity method investments in our consolidated statements of operations. The summarized results of operations and financial position of the investments accounted for under the equity method are as follows (in millions):
| | | | | | | | | | | | | | | | | |
| For the Years Ended December 31, |
| 2021 | | 2020 | | 2019 |
| Revenues, net | $ | 994 | | | $ | 611 | | | $ | 386 | |
| Operating income | $ | 316 | | | $ | 147 | | | $ | 47 | |
| Net income | $ | 465 | | | $ | 23 | | | $ | 13 | |
| | | | | | | | | | | |
| As of December 31, |
| 2021 | | 2020 |
| Current assets | $ | 468 | | | $ | 493 | |
| Noncurrent assets | $ | 4,259 | | | $ | 4,219 | |
| Current liabilities | $ | 184 | | | $ | 410 | |
| Noncurrent liabilities | $ | 2,030 | | | $ | 2,327 | |
YES Network Investment. We account for our investment in the YES Network as an equity method investment, which is recorded within other assets in our consolidated balance sheets, and in which our proportionate share of the net income generated by the investment is represented within income (loss) from equity method investments in our consolidated statements of operations. We recorded income of $41 million, $6 million, and $16 million related to our investment for the years ended December 31, 2021, 2020, and 2019, respectively. We did not identify any other than temporary impairments associated with our investment in the YES Network during the years ended December 31, 2021, 2020, and 2019.
Other Investments
We measure our investments, excluding equity method investments, at fair value or, in situations where fair value is not readily determinable, we have the option to value investments at cost plus observable changes in value, less impairment, Additionally, certain investments are measured at net asset value (NAV).
At December 31, 2021 and 2020, we held $402 million and $400 million, respectively, in investments measured at fair value and $147 million and $24 million, respectively, in investments measured at NAV. We recognized a fair value adjustment loss of $42 million and gains of $156 million and $2 million during the years ended December 31, 2021, 2020, and 2019, respectively, associated with these securities, which is reflected in other (expense) income, net in our consolidated statements of operations.
Investments accounted for utilizing the measurement alternative were $18 million, net of $7 million of cumulative impairments, as of December 31, 2021, and $26 million, net of $7 million of cumulative impairments, as of December 31, 2020. We recorded no impairments related to these investments for the years ended December 31, 2021 and 2020. We recorded a $7 million impairment related to two investments for the year ended December 31, 2019, which is reflected in other (expense) income, net in our consolidated statements of operations.
On November 18, 2020, we entered into a commercial agreement with Bally's. As part of this arrangement, we received warrants to acquire up to 8.2 million shares of Bally's Common stock for a penny per share, of which 3.3 million are exercisable upon meeting certain performance metrics. We also received options to purchase up to 1.6 million shares of Bally's common stock with exercise prices between $30 and $45 per share, exercisable after four years. In April 2021, we made an incremental investment of $93 million in Bally's in the form of non-voting perpetual warrants, convertible into 1.7 million shares of Bally's common stock at an exercise price of $0.01 per share, subject to certain adjustments. These investments are reflected at fair value within our financial statements. See Note 18. Fair Value Measurements for further discussion.
As of December 31, 2021 and 2020, our unfunded commitments related to certain equity investments totaled $111 million and $98 million, respectively, including $81 million and $27 million, respectively, related to investments measured at NAV.
7. NOTES PAYABLE AND COMMERCIAL BANK FINANCING:
Notes payable, finance leases, and commercial bank financing (including finance leases to affiliates) consisted of the following as of December 31, 2021 and 2020 (in millions):
| | | | | | | | | | | |
| | 2021 | | 2020 |
| STG Bank Credit Agreement: | | | |
| Term Loan B-1, due January 3, 2024 | $ | 379 | | | $ | 1,119 | |
| Term Loan B-2, due September 30, 2026 | 1,271 | | | 1,284 | |
| Term Loan B-3, due April 1, 2028 (a) | 736 | | | — | |
| DSG Bank Credit Agreement (b): | | | |
| Term Loan, due August 24, 2026 | 3,226 | | | 3,259 | |
| | | |
| STG Notes: | | | |
5.875% Unsecured Notes, due March 15, 2026 | 348 | | | 348 | |
5.125% Unsecured Notes, due February 15, 2027 | 400 | | | 400 | |
5.500% Unsecured Notes, due March 1, 2030 | 500 | | | 500 | |
4.125% Senior Secured Notes, due December 1, 2030 | 750 | | | 750 | |
| DSG Notes: | | | |
12.750% Senior Secured Notes, due December 1, 2026 (b) | 31 | | | 31 | |
5.375% Senior Secured Notes, due August 15, 2026 (b) | 3,050 | | | 3,050 | |
6.625% Unsecured Notes, due August 15, 2027 | 1,744 | | | 1,744 | |
| DSG Accounts Receivable Securitization Facility (c) | — | | | 177 | |
| Debt of variable interest entities | 9 | | | 17 | |
| Debt of non-media subsidiaries | 17 | | | 17 | |
| Finance leases | 28 | | | 30 | |
| Finance leases - affiliate | 9 | | | 8 | |
| Total outstanding principal | 12,498 | | | 12,734 | |
| Less: Deferred financing costs and discounts | (158) | | | (183) | |
| Less: Current portion | (66) | | | (56) | |
| Less: Finance leases - affiliate, current portion | (3) | | | (2) | |
| Net carrying value of long-term debt | $ | 12,271 | | | $ | 12,493 | |
(a)On April 1, 2021, STG amended the STG Bank Credit Agreement to raise term loans in an aggregate principal amount of $740 million (STG Term Loan B-3), the proceeds of which were used to refinance a portion of STG's term loan maturing in January 2024, as more fully described below under STG Bank Credit Agreement.
(b)On March 1, 2022, DSG completed a refinancing transaction relating to the DSG Bank Credit Agreement, the DSG 5.375% Secured Notes (defined below under DSG Notes) and the DSG 12.750% Secured Notes (defined below under DSG Notes). See Note 20. Subsequent Events for a discussion of the refinancing transaction.
(c)On November 5, 2021, SBG purchased and assumed the lenders’ and the administrative agent’s rights and obligations under the DSG Accounts Receivable Facility (A/R Facility). SBG purchased the lenders’ outstanding loans and commitments under the A/R Facility by making a payment to the lenders as consideration for the purchase of the lenders’ respective rights and obligations under the A/R Facility equal to approximately $184 million, representing 101% of the aggregate outstanding principal amount of the loans under the A/R Facility, plus any accrued interest and outstanding fees and expenses. Transactions related to the A/R Facility are now intercompany transactions and therefore, are eliminated in consolidation.
Debt under the STG Bank Credit Agreement, DSG Bank Credit Agreement, notes payable and finance leases as of December 31, 2021 matures as follows (in millions):
| | | | | | | | | | | | | | | | | | | |
| | Notes and
Bank Credit Agreements | | Finance Leases | | | | Total |
| 2022 | $ | 63 | | | $ | 8 | | | | | $ | 71 | |
| 2023 | 54 | | | 8 | | | | | 62 | |
| 2024 | 433 | | | 7 | | | | | 440 | |
| 2025 | 68 | | | 6 | | | | | 74 | |
| 2026 | 7,748 | | | 6 | | | | | 7,754 | |
| 2027 and thereafter | 4,095 | | | 14 | | | | | 4,109 | |
| Total minimum payments | 12,461 | | | 49 | | | | | 12,510 | |
| Less: Deferred financing costs, discounts, and premiums | (158) | | | — | | | | | (158) | |
| | | | | | | |
| Less: Amount representing future interest | — | | | (12) | | | | | (12) | |
| Net carrying value of debt | $ | 12,303 | | | $ | 37 | | | | | $ | 12,340 | |
Interest expense in our consolidated statements of operations was $618 million, $656 million, and $422 million for the years ended December 31, 2021, 2020, and 2019, respectively. Interest expense included amortization of deferred financing costs, debt discounts, and premiums of $30 million, $31 million, and $17 million for the years ended December 31, 2021, 2020, and 2019, respectively.
The stated and weighted average effective interest rates on the above obligations are as follows, for the years ended December 31, 2021 and 2020:
| | | | | | | | | | | | | | | | | | | | |
| | | | Weighted Average Effective Rate |
| | Stated Rate | | 2021 | | 2020 |
| STG Bank Credit Agreement: | | | | | | |
| Term Loan B | | LIBOR plus 2.25% | | 2.36% | | 2.94% |
| Term Loan B-2 | | LIBOR plus 2.50% | | 2.77% | | 3.29% |
| Term Loan B-3 | | LIBOR plus 3.00% | | 3.89% | | —% |
| Revolving Credit Facility (a) | | LIBOR plus 2.00% | | —% | | —% |
| DSG Bank Credit Agreement (b): | | | | | | |
| Term Loan | | LIBOR plus 3.25% | | 3.62% | | 4.21% |
| Revolving Credit Facility (c) | | LIBOR plus 3.00% | | —% | | —% |
| DSG Accounts Receivable Securitization Facility (d) | | LIBOR plus 4.97% | | —% | | 4.77% |
| STG Notes: | | | | | | |
5.875% Unsecured Notes | | 5.88% | | 6.09% | | 6.09% |
5.125% Unsecured Notes | | 5.13% | | 5.33% | | 5.33% |
5.500% Unsecured Notes | | 5.50% | | 5.66% | | 5.66% |
4.125% Secured Notes | | 4.13% | | 4.31% | | 4.31% |
| DSG Notes: | | | | | | |
12.750% Secured Notes (b) | | 12.75% | | 11.95% | | 11.95% |
5.375% Secured Notes (b) | | 5.38% | | 5.73% | | 5.73% |
6.625% Unsecured Notes | | 6.63% | | 7.00% | | 7.00% |
(a)We incur a commitment fee on undrawn capacity of 0.25%, 0.375%, or 0.50% if our first lien indebtedness ratio is less than or equal to 2.75x, less than or equal to 3.0x but greater than 2.75x, or greater than 3.0x, respectively. The STG Revolving Credit Facility is priced at LIBOR plus 2.00%, subject to decrease if the specified first lien leverage ratio (as defined in the STG Bank Credit Agreement) is less than or equal to certain levels. As of December 31, 2021 and 2020, there were no outstanding borrowings, $1 million in letters of credit outstanding, and $649 million available under the STG Revolving Credit Facility. See STG Bank Credit Agreement below for further information.
(b)On March 1, 2022 DSG completed a refinancing transaction relating to the DSG Bank Credit Agreement, the DSG 5.375% Secured Notes (defined below under DSG Notes) and the DSG 12.750% Secured Notes (defined below under DSG Notes). See Note 20. Subsequent Events for a discussion of the refinancing transaction.
(c)We incur a commitment fee on undrawn capacity of 0.25%, 0.375%, or 0.50% if our first lien indebtedness ratio is less than or equal to 3.25x, less than or equal to 3.75x but greater than 3.25x, or greater than 3.75x, respectively. The DSG Revolving Credit Facility is priced at LIBOR plus 3.00%, subject to decrease if the specified first lien leverage ratio (as defined in the DSG Bank Credit Agreement) is less than or equal to certain levels. As of December 31, 2021 and 2020, there were no outstanding borrowings, no letters of credit outstanding, and $228 million available under the DSG Revolving Credit Facility. See DSG Bank Credit Agreement below for further information.
(d)On November 5, 2021, SBG purchased and assumed the lenders’ and the administrative agent’s rights and obligations under the A/R Facility. SBG purchased the lenders’ outstanding loans and commitments under the A/R Facility by making a payment to the lenders as consideration for the purchase of the lenders’ respective rights and obligations under the A/R Facility equal to approximately $184 million, representing 101% of the aggregate outstanding principal amount of the loans under the A/R Facility, plus any accrued interest and outstanding fees and expenses. Transactions related to the A/R Facility are now intercompany transactions and, therefore, are eliminated in consolidation.
We recorded $4 million of debt issuance costs and original issuance discounts during the year ended December 31, 2021, $19 million of debt issuance costs and a $25 million original issuance premium during the year ended December 31, 2020, and $222 million of debt issuance costs and original issuance discounts during the year ended December 31, 2019. Debt issuance costs and original issuance discounts and premiums are presented as a direct deduction from, or addition to, the carrying amount of an associated debt liability, except for debt issuance costs related to our STG Revolving Credit Facility and DSG Revolving Credit Facility, which are presented within other assets in our consolidated balance sheets.
STG Bank Credit Agreement
We have a syndicated credit facility which includes both revolving credit and issued term loans (the STG Bank Credit Agreement).
On August 13, 2019, we issued a seven-year incremental term loan facility in an aggregate principal amount of $600 million (the STG Term Loan B-2b) with an original issuance discount of $3 million, which bears interest at LIBOR plus 2.50%. The proceeds from the Term Loan B-2b were used, together with cash on hand, to redeem, at par value, $600 million aggregate principal amount of STG's 5.375% Senior Notes due 2021 (the STG 5.375% Notes). We recognized a loss on the extinguishment of the STG 5.375% Notes of $2 million for the year ended December 31, 2019.
On August 23, 2019, we amended and restated the STG Bank Credit Agreement which provided additional operating flexibility and revisions to certain restrictive covenants. Concurrent with the amendment, we raised a seven-year incremental term loan facility of $700 million (the STG Term Loan B-2a, and, together with the STG Term Loan B-2b, the STG Term Loan B-2) with an original issuance discount of $4 million, which bears interest at LIBOR plus 2.50%.
Additionally, in connection with the amendment, we replaced STG's existing revolving credit facility with a new $650 million five-year revolving credit facility (the STG Revolving Credit Facility), priced at LIBOR plus 2.00%, subject to decrease if the specified first lien leverage ratio (as defined in the STG Bank Credit Agreement) is less than or equal to certain levels, which includes capacity for up to $50 million of letters of credit and for borrowings of up to $50 million under swingline loans. On December 4, 2020, we entered into an amendment to the STG Bank Credit Agreement to extend the maturity date of the STG Revolving Credit Facility to December 4, 2025.
On April 1, 2021, STG amended the STG Bank Credit Agreement to raise additional term loans in an aggregate principal amount of $740 million (STG Term Loan B-3), with an original issuance discount of $4 million, the proceeds of which were used to refinance a portion of the STG Term Loan B-1 maturing in January 2024. The STG Term Loan B-3 matures in April 2028 and bears interest at LIBOR (or successor rate) plus 3.00%.
The STG Term Loan B-2 and STG Term Loan B-3 amortize in equal quarterly installments in an aggregate amount equal to 1% of the original amount of such term loan, with the balance being payable on the maturity date.
The STG Bank Credit Agreement includes a financial maintenance covenant, the first lien leverage ratio (as defined in the STG Bank Credit Agreements), which requires such applicable ratio not to exceed 4.5x, measured as of the end of each fiscal quarter. The financial maintenance covenant is only applicable if 35% or more of the capacity (as a percentage of total commitments) under the STG Revolving Credit Facility, measured as of the last day of each quarter, is utilized under the STG Revolving Credit Facility as of such date. Since there was no utilization under the STG Revolving Credit Facility as of December 31, 2021, STG was not subject to the financial maintenance covenant under the STG Bank Credit Agreement. As of December 31, 2021, the STG first lien leverage ratio was below 4.5x. The STG Bank Credit Agreement contains other restrictions and covenants which we were in compliance with as of December 31, 2021.
STG Notes
On November 27, 2019, we issued $500 million of senior notes, which bear interest at a rate of 5.500% per annum and mature on March 1, 2030 (the STG 5.500% Notes). The net proceeds of the STG 5.500% Notes were used, plus cash on hand, to redeem $500 million aggregate principal amount of STG's 6.125% senior unsecured notes due 2022 (the STG 6.125% Notes) for a redemption price, including the outstanding principal amount of the STG 6.125% Notes, accrued and unpaid interest, and a make-whole premium, of $510 million. We recognized a loss on the extinguishment of the STG 6.125% Notes of $8 million for the year ended December 31, 2019.
Prior to December 1, 2024, we may redeem the STG 5.500% Notes, in whole or in part, at any time or from time to time at a price equal to 100% of the principal amount of the STG 5.500% Notes plus accrued and unpaid interest, if any, to the redemption date, plus a “make-whole” premium. In addition, on or prior to December 1, 2022, we may redeem up to 40% of the STG 5.500% Notes using the proceeds of certain equity offerings. Beginning on December 1, 2024, we may redeem some or all of the STG 5.500% Notes at any time or from time to time at certain redemption prices, plus accrued and unpaid interest, if any, to the date of redemption. If the notes are redeemed during the twelve-month period beginning December 1, 2024, 2025, 2026, and 2027 and thereafter, then the redemption prices for the STG 5.500% Notes are 102.750%, 101.833%, 100.917%, and 100%, respectively. Upon the sale of certain of STG’s assets or certain changes of control, the holders of the STG 5.500% Notes may require us to repurchase some or all of the STG 5.500% Notes.
STG’s obligations under the STG 5.500% Notes are guaranteed, jointly and severally, on a senior unsecured basis, by the Company and each wholly-owned subsidiary of STG or the Company that guarantees the STG Bank Credit Agreement and rank equally with all of STG’s other senior unsecured debt.
On May 21, 2020, we purchased $2.5 million aggregate principal amount of STG's 5.875% senior unsecured notes due 2026 (the STG 5.875% Notes) in open market transactions for consideration of $2.3 million. The STG 5.875% Notes acquired in May 2020 were canceled immediately following their acquisition. We recognized a gain on extinguishment of the STG 5.875% Notes of $0.2 million for the year ended December 31, 2020.
On December 4, 2020, we issued $750 million aggregate principal amount of senior secured notes, which bear interest at a rate of 4.125% per annum and mature on December 1, 2030 (the STG 4.125% Secured Notes). The net proceeds of the STG 4.125% Secured Notes were used, plus cash on hand, to redeem $550 million aggregate principal amount of STG's 5.625% senior unsecured notes due 2024 (the STG 5.625% Notes) for a redemption price, including the outstanding principal amount of the STG 5.625% Notes, accrued and unpaid interest, and a call premium, of $571 million and to prepay $200 million outstanding under the STG Term Loan B-1. We recognized a loss on extinguishment of the STG 5.625% Notes and prepayment of the STG Term Loan B-1 of $15 million for the year ended December 31, 2020.
Prior to December 1, 2025, we may redeem the STG 4.125% Secured Notes, in whole or in part, at any time or from time to time at a price equal to 100% of the principal amount of the STG 4.125% Secured Notes plus accrued and unpaid interest, if any, to the redemption date, plus a “make-whole” premium. In addition, on or prior to December 1, 2023, we may redeem up to 40% of the STG 4.125% Secured Notes using the proceeds of certain equity offerings. Beginning on December 1, 2025, we may redeem some or all of the STG 4.125% Secured Notes at any time or from time to time at certain redemption prices, plus accrued and unpaid interest, if any, to the date of redemption. If the notes are redeemed during the twelve-month period beginning December 1, 2025, 2026, 2027, and 2028 and thereafter, then the redemption prices for the STG 4.125% Secured Notes are 102.063%, 101.375%, 100.688%, and 100%, respectively. Upon the sale of certain of STG’s assets or certain changes of control, we may be required to repurchase some or all of the STG 4.125% Secured Notes.
STG’s obligations under the STG 4.125% Secured Notes are secured on a first-lien basis by substantially all tangible and intangible personal property of STG and each wholly-owned subsidiary of STG or the Company that guarantees the STG Bank Credit Agreement (the Guarantors) and on a pari passu basis with all of STG's and the Guarantor's existing and future debt that is secured by a first-priority lien on the collateral securing the STG 4.125% Secured Notes, including the debt under the STG Bank Credit Agreement, subject to permitted liens and certain other exceptions.
Upon issuance, the STG 5.875% Notes and STG 5.125% Notes were redeemable up to 35%. We may redeem 100% of these notes upon the date set forth in the indenture of each note. The price at which we may redeem the notes is set forth in the indenture of each note. Also, if we sell certain of our assets or experience specific kinds of changes of control, the holders of these notes may require us to repurchase some or all of the outstanding notes.
DSG Bank Credit Agreement
On August 23, 2019, DSG and Diamond Sports Intermediate Holdings LLC (Holdings), an indirect wholly owned subsidiary of the Company and an indirect parent of DSG, entered into a credit agreement (the DSG Bank Credit Agreement). Pursuant to the DSG Bank Credit Agreement, DSG raised a seven-year $3,300 million aggregate amount term loan (the DSG Term Loan), with an original issuance discount of $17 million, which bears interest at LIBOR plus 3.25%.
The DSG Term Loan amortizes in equal quarterly installments in an aggregate amount equal to 1% of the original amount of such term loan, with the balance being payable on the maturity date. Following the end of each fiscal year, we are required to prepay the DSG Term Loan in an aggregate amount equal to (a) 50% of excess cash flow for such fiscal year if the first lien leverage ratio is greater than 3.75 to 1.00, (b) 25% of excess cash flow for such fiscal year if the first lien leverage ratio is greater than 3.25 to 1.00 but less than or equal to 3.75 to 1.00, and (c) 0% of excess cash flow for such fiscal year if the first lien leverage ratio is equal to or less than 3.25 to 1.00.
Additionally, in connection with the DSG Bank Credit Agreement, DSG obtained a $650 million five-year revolving credit facility (the DSG Revolving Credit Facility, and, together with the DSG Term Loan, the DSG Credit Facilities), priced at LIBOR plus 3.00%, subject to reduction based on a first lien net leverage ratio, which includes capacity for up to $50 million of letters of credit and for borrowings of up to $50 million under swingline loans.
The DSG Bank Credit Agreement includes a financial maintenance covenant, the first lien leverage ratio (as defined in the DSG Bank Credit Agreements), which requires such applicable ratio not to exceed 6.25x, measured as of the end of each fiscal quarter. The financial maintenance covenant is only applicable if 35% or more of the capacity (as a percentage of total commitments) under the DSG Revolving Credit Facility, measured as of the last day of each quarter, is utilized under the DSG Revolving Credit Facility as of such date. Since there was no utilization under the DSG Revolving Credit Facility as of December 31, 2021, DSG was not subject to the financial maintenance covenant under the DSG Bank Credit Agreement. As of December 31, 2021, the DSG first lien leverage ratio was above 6.25x. We expect that the DSG first lien leverage ratio will remain above 6.25x for at least the next twelve months, which will restrict our ability to utilize the full DSG Revolving Credit Facility. We do not currently expect to have more than 35% of the capacity of the DSG Revolving Credit Facility outstanding as of any quarterly measurement date during the next twelve months, therefore we do not expect DSG will be subject to the financial maintenance covenant. The DSG Bank Credit Agreement contains other restrictions and covenants which we were in compliance with as of December 31, 2021.
DSG's obligations under the DSG Bank Credit Agreement are (i) jointly and severally guaranteed by Holdings and DSG’s direct and indirect, existing and future wholly-owned domestic restricted subsidiaries, subject to certain exceptions, and (ii) secured by first-priority lien on substantially all tangible and intangible assets (whether now owned or hereafter arising or acquired) of DSG and the guarantors, subject to certain permitted liens and other agreed upon exceptions. The DSG Credit Facilities are not guaranteed by the Company, STG, or any of STG’s subsidiaries.
On March 1, 2022, DSG completed a refinancing transaction relating to the DSG Bank Credit Agreement. See Note 20. Subsequent Events for a discussion of the refinancing transaction.
DSG Notes
On August 2, 2019, DSG issued $3,050 million principal amount of senior secured notes, which bear interest at a rate of 5.375% per annum and mature on August 15, 2026 (the DSG 5.375% Secured Notes), and issued $1,825 million principal amount of senior notes, which bear interest at a rate of 6.625% per annum and mature on August 15, 2027 (the DSG 6.625% Notes). The proceeds of the DSG 5.375% Secured Notes and DSG 6.625% Notes were used, in part, to fund the RSN Acquisition.
In March 2020 and June 2020, we purchased a total of $15 million aggregate principal amount of the DSG 6.625% Notes in open market transactions for consideration of $10 million. The DSG 6.625% Notes acquired in March 2020 and June 2020 were canceled immediately following their acquisition. We recognized a gain on extinguishment of the DSG 6.625% Notes of $5 million for year ended December 31, 2020.
On June 10, 2020, we exchanged $66.5 million aggregate principal amount of the DSG 6.625% Notes for cash payments of $10 million, including accrued but unpaid interest, and $31 million aggregate principal amount of newly issued senior secured notes, which bear interest at a rate of 12.750% per annum and mature on December 1, 2026 (the DSG 12.750% Secured Notes, and together with the DSG 5.375% Secured Notes, the DSG Existing Secured Notes, and together with the DSG 6.625% Notes, the DSG Notes).
Prior to August 15, 2022, we may redeem the DSG Notes, in whole or in part, at any time or from time to time, at a price equal to 100% of the principal amount of the applicable DSG Notes plus accrued and unpaid interest, if any, to the date of redemption, plus a ‘‘make-whole’’ premium. Beginning on August 15, 2022, we may redeem the DSG Notes, in whole or in part, at any time or from time to time at certain redemption prices, plus accrued and unpaid interest, if any, to the date of redemption. In addition, on or prior to August 15, 2022, we may redeem up to 40% of each series of the DSG Notes using the proceeds of certain equity offerings. If the notes are redeemed during the twelve-month period beginning August 15, 2022, 2023, and 2024 and thereafter, then the redemption prices for the DSG 5.375% Secured Notes are 102.688%, 101.344%, and 100%, respectively, the redemption prices for the DSG 6.625% Notes are 103.313%, 101.656%, and 100%, respectively, and the redemption prices for the DSG 12.750% Secured Notes are 102.688%, 101.344%, and 100%, respectively.
DSG’s obligations under the DSG Notes are jointly and severally guaranteed by Holdings, DSG’s direct parent, and certain wholly-owned subsidiaries of Holdings. The RSNs wholly-owned by Holdings and its subsidiaries will also jointly and severally guarantee the Issuers' obligations under the DSG Notes. The DSG Notes are not guaranteed by the Company, STG, or any of STG’s subsidiaries.
On March 1, 2022, DSG completed a refinancing transaction relating to the DSG 5.375% Secured Notes and the DSG 12.750% Secured Notes. See Note 20. Subsequent Events for a discussion of the refinancing transaction.
A/R Facility
On September 23, 2020 (the Closing Date), the Company's and DSG's indirect wholly-owned subsidiary, DSPV, entered into a $250 million A/R Facility which matures on September 23, 2023, in order to enable DSG to raise incremental funding for the ongoing business needs of DSG and its subsidiaries. On November 5, 2021, the Company purchased and assumed the lenders’ and the administrative agent’s rights and obligations under the A/R Facility by making a payment to the lenders equal to approximately $184 million, representing 101% of the aggregate outstanding principal amount of the loans under the A/R Facility, plus any accrued interest and outstanding fees and expenses. In connection therewith, the Company and DSPV entered into an omnibus amendment to the A/R Facility to provide greater flexibility to DSG, including, (i) increasing the maximum facility limit availability from up to $250 million to up to $400 million; (ii) eliminating the early amortization event related to DSG’s earnings before interest, taxes, depreciation and amortization (EBITDA), as defined in the agreement governing the A/R Facility, less interest expense covenant; (iii) extending the stated maturity date by one year from September 23, 2023 to September 23, 2024; and (iv) relaxing certain concentration limits thereby increasing the amounts of certain accounts receivable eligible to be sold. The other material terms of the A/R Facility remain unchanged. Transactions related to the A/R Facility are now intercompany transactions and, therefore, are eliminated in consolidation.
DSG's ability to make scheduled payments on its debt obligations depends on its financial condition and operating performance, which are subject to prevailing economic and competitive conditions and to certain financial, business, competitive, legislative, regulatory and other factors beyond its control. The impact of the outbreak of COVID-19 continues to create significant uncertainty and disruption in the global economy and financial markets. Further, DSG's success is dependent upon, among other things, the terms of its agreements with Distributors, OTT and other streaming providers and the successful execution of its DTC strategy. Primarily as a result of losses of Distributors, increased subscriber churn and the COVID-19 pandemic, DSG has experienced operating losses since the second quarter of 2020 and we expect it will continue to incur operating losses in future periods. DSG has taken steps to mitigate the impacts of this uncertainty, including managing its controllable costs, amending its A/R Facility and entering into a Transaction Support Agreement with the Company and certain lenders holding term loans under the DSG Bank Credit Agreement and certain holders of, or investment advisors, sub-advisors, or managers of funds or accounts that hold, the DSG Existing Secured Notes which contemplates that, among other things, DSG would obtain a new $635 million first-priority lien term loan credit facility which would mature in May 2026 and would rank first in lien priority on shared collateral ahead of DSG’s loans and/or commitments under the DSG Bank Credit Agreement and DSG Existing Secured Notes. See Note 20. Subsequent Events.
Debt of variable interest entities and guarantees of third-party debt
We jointly, severally, unconditionally, and irrevocably guarantee $39 million and $49 million of debt of certain third parties as of December 31, 2021 and 2020, respectively, of which $9 million and $16 million, net of deferred financing costs, related to consolidated VIEs is included in our consolidated balance sheets as of December 31, 2021 and 2020, respectively. These guarantees primarily relate to the debt of Cunningham as discussed under Cunningham Broadcasting Corporation within Note 15. Related Person Transactions. The credit agreements and term loans of these VIEs each bear interest of LIBOR plus 2.50%. As of December 31, 2021, we have determined that it is not probable that we would have to perform under any of these guarantees.
Finance leases
For more information related to our finance leases and affiliate finance leases see Note 8. Leases and Note 15. Related Person Transactions, respectively.
8. LEASES:
We determine if a contractual arrangement is a lease at inception. Our lease arrangements provide the Company the right to utilize certain specified tangible assets for a period of time in exchange for consideration. Our leases primarily relate to building space, tower space, and equipment. We do not separate non-lease components from our building and tower leases for the purposes of measuring our lease liabilities and assets. Our leases consist of operating leases and finance leases which are presented separately in our consolidated balance sheets. Leases with an initial term of 12 months or less are not recorded on the balance sheet.
We recognize a lease liability and a right of use asset at the lease commencement date based on the present value of the future lease payments over the lease term discounted using our incremental borrowing rate. Implicit interest rates within our lease arrangements are rarely determinable. Right of use assets also include, if applicable, prepaid lease payments and initial direct costs, less incentives received.
We recognize operating lease expense on a straight-line basis over the term of the lease within operating expenses. Expense associated with our finance leases consists of two components, including interest on our outstanding finance lease obligations and amortization of the related right of use assets. The interest component is recorded in interest expense and amortization of the finance lease asset is recognized on a straight-line basis over the term of the lease in depreciation of property and equipment.
Our leases do not contain any material residual value guarantees or material restrictive covenants. Some of our leases include optional renewal periods or termination provisions which we assess at inception to determine the term of the lease, subject to reassessment in certain circumstances.
The following table presents lease expense we have recorded in our consolidated statements of operations for the years ended December 31, 2021, 2020, and 2019 (in millions):
| | | | | | | | | | | | | | | | | |
| 2021 | | 2020 | | 2019 |
| Finance lease expense: | | | | | |
| Amortization of finance lease asset | $ | 3 | | | $ | 3 | | | $ | 3 | |
| Interest on lease liabilities | 3 | | | 4 | | | 4 | |
| Total finance lease expense | 6 | | | 7 | | | 7 | |
| Operating lease expense (a) | 60 | | | 64 | | | 47 | |
| Total lease expense | $ | 66 | | | $ | 71 | | | $ | 54 | |
(a)Includes variable lease expense of $7 million for each of the years ended December 31, 2021 and 2020 and $5 million for the year ended December 31, 2019 and short-term lease expense of $1 million for each of the years ended December 31, 2021, 2020, and 2019.
The following table summarizes our outstanding operating and finance lease obligations as of December 31, 2021 (in millions):
| | | | | | | | | | | | | | | | | |
| Operating Leases | | Finance Leases | | Total |
| 2022 | $ | 47 | | | $ | 8 | | | $ | 55 | |
| 2023 | 41 | | | 8 | | | 49 | |
| 2024 | 35 | | | 7 | | | 42 | |
| 2025 | 34 | | | 6 | | | 40 | |
| 2026 | 29 | | | 6 | | | 35 | |
| 2027 and thereafter | 121 | | | 14 | | | 135 | |
| Total undiscounted obligations | 307 | | | 49 | | | 356 | |
| Less imputed interest | (67) | | | (12) | | | (79) | |
| Present value of lease obligations | $ | 240 | | | $ | 37 | | | $ | 277 | |
The following table summarizes supplemental balance sheet information related to leases as of December 31, 2021 and December 31, 2020 (in millions, except lease term and discount rate):
| | | | | | | | | | | | | | | | | | | | | | | | | | |
| 2021 | | 2020 | |
| Operating Leases | | Finance Leases | | Operating Leases | | Finance Leases | |
| Lease assets, non-current | $ | 207 | | | $ | 18 | | (a) | $ | 197 | | | $ | 17 | | (a) |
| | | | | | | | |
| Lease liabilities, current | 35 | | | 5 | | | 34 | | | 5 | | |
| Lease liabilities, non-current | 205 | | | 32 | | | 198 | | | 33 | | |
| Total lease liabilities | $ | 240 | | | $ | 37 | | | $ | 232 | | | $ | 38 | | |
| | | | | | | | |
| Weighted average remaining lease term (in years) | 8.39 | | 7.71 | | 9.39 | | 8.39 | |
| Weighted average discount rate | 5.4 | % | | 7.9 | % | | 5.7 | % | | 8.4 | % | |
(a)Finance lease assets are reflected in property and equipment, net in our consolidated balance sheets.
The following table presents other information related to leases for the years ended December 31, 2021, 2020, and 2019 (in millions):
| | | | | | | | | | | | | | | | | |
| 2021 | | 2020 | | 2019 |
| Cash paid for amounts included in the measurement of lease liabilities: | | | | | |
| Operating cash flows from operating leases | $ | 52 | | | $ | 55 | | | $ | 38 | |
| Operating cash flows from finance leases | $ | 3 | | | $ | 3 | | | $ | 4 | |
| Financing cash flows from finance leases | $ | 5 | | | $ | 5 | | | $ | 5 | |
| Leased assets obtained in exchange for new operating lease liabilities | $ | 50 | | | $ | 20 | | | $ | 35 | |
| Leased assets obtained in exchange for new finance lease liabilities | $ | 4 | | | $ | 6 | | | $ | — | |
9. PROGRAM CONTRACTS:
Future payments required under television program contracts as of December 31, 2021 were as follows (in millions):
| | | | | |
| 2022 | $ | 97 | |
| 2023 | 14 | |
| 2024 | 6 | |
| 2025 | 1 | |
| 2026 | — | |
| |
| Total | 118 | |
| Less: Current portion | 97 | |
| Long-term portion of program contracts payable | $ | 21 | |
Each future period’s film liability includes contractual amounts owed, but what is contractually owed does not necessarily reflect what we are expected to pay during that period. While we are contractually bound to make the payments reflected in the table during the indicated periods, industry protocol typically enables us to make film payments on a three-month lag. Included in the current portion amount are payments due in arrears of $21 million. In addition, we have entered into non-cancelable commitments for future television program rights aggregating to $31 million as of December 31, 2021.
10. REDEEMABLE NONCONTROLLING INTERESTS:
We account for redeemable noncontrolling interests in accordance with ASC 480, Distinguishing Liabilities from Equity, and classify them as mezzanine equity in our consolidated balance sheets because their possible redemption is outside of the control of the Company. Our redeemable non-controlling interests consist of the following:
Redeemable Subsidiary Preferred Equity. On August 23, 2019, DSH, an indirect parent of DSG and indirect wholly-owned subsidiary of the Company, issued preferred equity (the Redeemable Subsidiary Preferred Equity) for $1,025 million.
The Redeemable Subsidiary Preferred Equity is redeemable by the holder in the following circumstances (1) in the event of a change of control with respect to DSH, the holder will have the right (but not the obligation) to require the redemption of the securities at a per unit amount equal to the liquidation preference per share plus accrued and unpaid dividends (2) in the event of the sale of new equity interests in DSG or direct and indirect subsidiaries to the extent of proceeds received and (3) beginning on August 23, 2027, so long as any Redeemable Subsidiary Preferred Equity remains outstanding, the holder, subject to certain minimum holding requirements, or investors holding a majority of the outstanding Redeemable Subsidiary Preferred Equity, may compel DSH and DSG to initiate a process to sell DSG and/or conduct an initial public offering.
We may redeem some or all of the Redeemable Subsidiary Preferred Equity from time to time thereafter at a price equal to $1,000 per unit plus the amount of dividends per unit previously paid in kind (the Liquidation Preference), multiplied by the applicable premium as follows (presented as a percentage of the Liquidation Preference): (i) on or after November 22, 2019 until February 19, 2020: 100%; (ii) on or after February 20, 2020 until August 22, 2020: 102%; (iii) on or after August 23, 2020 but prior to August 23, 2021: at a customary "make-whole" premium representing the present value of 103% plus all required dividend payments due on such Redeemable Subsidiary Preferred Equity through August 23, 2021; (iv) on or after August 23, 2021 until August 22, 2022: 103%; (v) on or after August 23, 2022 until August 22, 2023: 101%; and (vi) August 23, 2023 and thereafter: 100%, in each case, plus accrued and unpaid dividends.
The Redeemable Subsidiary Preferred Equity accrues an initial quarterly dividend equal to 1-Month LIBOR (with a 0.75% floor) plus 7.5% (8% if paid in kind) per annum on the sum of (i) $1,025 million (the Aggregate Liquidation Preference) plus (ii) the amount of aggregate accrued and unpaid dividends as of the end of the immediately preceding dividend accrual period, payable, at DSH's election, in cash or, to the extent not paid in cash, by automatically increasing the Aggregate Liquidation Preference, whether or not such dividends have been declared and whether or not there are profits, surplus, or other funds legally available for the payment of dividends. The Redeemable Subsidiary Preferred Equity dividend rate is subject to rate step-ups of 0.5% per annum, beginning on August 23, 2022; provided that, and subject to other applicable increases in the dividend rate described below, the cumulative dividend rate will be capped at 1-Month LIBOR plus 10.5% per annum until (a) on February 23, 2028, the Redeemable Subsidiary Preferred Equity dividend rate will increase by 1.50% with further increases of 0.5% on each six month anniversary thereafter and (b) the Redeemable Subsidiary Preferred Equity dividend rate will increase by 2% if we do not redeem the Redeemable Subsidiary Preferred Equity, to the extent elected by holders of the Redeemable Subsidiary Preferred Equity, upon a change of control; provided, in each case, that the cumulative dividend rate will be capped at 1-Month LIBOR plus 14% per annum.
Subject to limited exceptions, DSH shall not, and shall not permit its subsidiaries, directly or indirectly, to pay a dividend or make a distribution, unless DSH applies 75% of the amount of such dividend or distribution payable to DSH or its subsidiaries (with the amount payable calculated on a pro rata basis based on their direct or indirect common equity ownership by DSH) to make an offer to the holders of Redeemable Subsidiary Preferred Equity to redeem the Redeemable Subsidiary Preferred Equity (subject to certain redemption restrictions) at a price equal to 100% of the Liquidation Preference of such Redeemable Subsidiary Preferred Equity, plus accrued and unpaid dividends.
We redeemed no Redeemable Subsidiary Preferred Equity during the year ended December 31, 2021. During the year ended December 31, 2020, we redeemed 550,000 units of the Redeemable Subsidiary Preferred Equity for an aggregate redemption price equal to $550 million plus accrued and unpaid dividends, representing 100% of the unreturned capital contribution with respect to the units redeemed, plus accrued and unpaid dividends with respect to the units redeemed up to, but not including, the redemption date, and after giving effect to any applicable rebates.
Dividends accrued during the years ended December 31, 2021, 2020, and 2019 were $14 million, $36 million, and $33 million, respectively, and are reflected in net (loss) income attributable to the noncontrolling interests in our consolidated statements of operations. Dividends accrued during the 2nd, 3rd, and 4th quarters of 2021 were paid in kind and added to the liquidation preference. The balance of the Redeemable Subsidiary Preferred Equity, net of issuance costs, was $181 million and $170 million as of December 31, 2021 and 2020, respectively.
In connection with the Redeemable Subsidiary Preferred Equity, the Company provides a guarantee of collection of distributions.
Subsidiary Equity Put Right. A noncontrolling equity holder of one of our subsidiaries had the right to sell its interest to the Company at a fair market sale value of $376 million, plus any undistributed income, which was exercised and settled in January 2020.
A noncontrolling equity holder of one of our subsidiaries has the right to sell its interest to the Company at any time during the 30-day period following September 30, 2025. The value of this redeemable noncontrolling interest was $16 million and $20 million as of December 31, 2021 and 2020, respectively.
11. COMMON STOCK:
Holders of Class A Common Stock are entitled to one vote per share and holders of Class B Common Stock are entitled to ten votes per share, except for votes relating to “going private” and certain other transactions. Substantially all of the Class B Common Stock is held by David D. Smith, Frederick G. Smith, J. Duncan Smith and Robert E. Smith who entered into a stockholders’ agreement pursuant to which they have agreed to vote for each other as candidates for election to our board of directors until December 31, 2025. The Class A Common Stock and the Class B Common Stock vote together as a single class, except as otherwise may be required by Maryland law, on all matters presented for a vote. Holders of Class B Common Stock may at any time convert their shares into the same number of shares of Class A Common Stock. During 2021, 952,626 Class B Common Stock shares were converted into Class A Common Stock shares. During 2020, no Class B Common Stock shares were converted into Class A Common Stock shares.
Our Bank Credit Agreements and some of our subordinate debt instruments have restrictions on our ability to pay dividends on our common stock unless certain specific conditions are satisfied, including but not limited to:
•no event of default then exists under each indenture or certain other specified agreements relating to our debt; and
•after taking into account the dividends payment, we are within certain restricted payment requirements contained in each indenture.
During 2021 and 2020, our Board of Directors declared a quarterly dividend in the months of February, May, August, and November which were paid in March, June, September, and December, respectively. Total dividend payments for both the year ended December 31, 2021 and 2020 were $0.80 per share. In February 2022, our Board of Directors declared a quarterly dividend of $0.25 per share. Future dividends on our common shares, if any, will be at the discretion of our Board of Directors and will depend on several factors including our results of operations, cash requirements and surplus, financial condition, covenant restrictions, and other factors that the Board of Directors may deem relevant. The Class A Common Stock and Class B Common Stock holders have the same rights related to dividends.
On August 4, 2020, the Board of Directors authorized an additional $500 million share repurchase authorization in addition to the previous repurchase authorization of $1 billion. There is no expiration date and currently, management has no plans to terminate this program. For the year ended December 31, 2021, we repurchased approximately 2.4 million shares of Class A Common Stock for $61 million. As of December 31, 2021, the total remaining repurchase authorization was $819 million. As of February 23, 2022, we repurchased an additional 2 million shares of Class A Common Stock for $55 million since January 1, 2022. All shares were repurchased under a 10b5-1 plan.
12. INCOME TAXES:
The (benefit) provision for income taxes consisted of the following for the years ended December 31, 2021, 2020, and 2019 (in millions):
| | | | | | | | | | | | | | | | | |
| | 2021 | | 2020 | | 2019 |
| Current (benefit) provision for income taxes: | | | | | |
| Federal | $ | (78) | | | $ | (126) | | | $ | (89) | |
| State | 2 | | | 9 | | | (2) | |
| | (76) | | | (117) | | | (91) | |
| Deferred benefit for income taxes: | | | | | |
| Federal | (93) | | | (584) | | | (4) | |
| State | (4) | | | (19) | | | (1) | |
| | (97) | | | (603) | | | (5) | |
| Benefit for income taxes | $ | (173) | | | $ | (720) | | | $ | (96) | |
The following is a reconciliation of federal income taxes at the applicable statutory rate to the recorded provision:
| | | | | | | | | | | | | | | | | |
| | 2021 | | 2020 | | 2019 |
| Federal statutory rate | 21.0 | % | | 21.0 | % | | 21.0 | % |
| Adjustments: | | | | | |
| Federal tax credits (a) | 10.6 | % | | 1.7 | % | | (684.6) | % |
| Net Operating Loss Carryback (b) | 7.5 | % | | 1.9 | % | | — | % |
| State income taxes, net of federal tax benefit (c) | (4.2) | % | | 4.0 | % | | 56.6 | % |
| Noncontrolling interest (d) | 2.6 | % | | 0.7 | % | | (138.9) | % |
| Valuation allowance (e) | (1.5) | % | | (6.1) | % | | (237.1) | % |
| Change in unrecognized tax benefits (f) | (1.0) | % | | (0.2) | % | | 72.2 | % |
| Stock-based compensation | (0.2) | % | | (0.1) | % | | (15.9) | % |
| Non-deductible items (g) | (0.1) | % | | — | % | | 192.7 | % |
| Effect of consolidated VIEs (h) | 0.1 | % | | (0.1) | % | | 46.3 | % |
| Spectrum sales (i) | — | % | | — | % | | (386.7) | % |
| Capital loss carryback (j) | — | % | | — | % | | (26.0) | % |
| Other | (0.1) | % | | 0.1 | % | | (3.0) | % |
| Effective income tax rate | 34.7 | % | | 22.9 | % | | (1,103.4) | % |
(a)Our 2021, 2020, and 2019 income tax provisions include a benefit of $40 million, $42 million, and $57 million, respectively, related to investments in sustainability initiatives whose activities qualify for federal income tax credits through 2021.
(b)Our 2021 and 2020 income tax provisions include a benefit of $38 million and $61 million, respectively, as result of the CARES Act allowing for the 2020 federal net operating loss to be carried back to the pre-2018 years when the federal tax rate was 35%.
(c)Included in state income taxes are deferred income tax effects related to certain acquisitions, intercompany mergers, law changes, and/or impact of changes in apportionment.
(d)Our 2021, 2020, and 2019 income tax provisions include a $13 million, $23 million, and $12 million benefit, respectively, related to noncontrolling interest of various partnerships.
(e)Our 2021 income tax provision includes a net $8 million addition related to an increase in valuation allowance associated with the federal interest expense carryforwards under the IRC Section 163(j) and primarily offset by a decrease in valuation allowance on certain state deferred tax assets as a result of the changes in estimate of the state apportionment. Our 2020 income tax provision includes a $192 million addition related to an increase in valuation allowance primarily due to the change in judgement in the realizability of certain deferred tax assets resulting from the reduction in forecast of future operating income and the RSN impairment. Our 2019 income tax provision includes a $16 million benefit related to a release of valuation allowance on certain state net operating losses where utilization was expected as a result of a business combination.
(f)Our 2021, 2020, and 2019 income tax provisions include $1 million, $5 million, and $4 million additions, respectively, related to tax positions of prior tax years.
(g)Our 2019 income tax provision includes a $17 million addition primarily related to regulatory costs, executive compensation and other not tax-deductible expenses.
(h)Certain of our consolidated VIEs incur expenses that are not attributable to non-controlling interests because we absorb certain related losses of the VIEs. These expenses are not tax-deductible by us, and since these VIEs are treated as pass-through entities for income tax purposes, deferred income tax benefits are not recognized.
(i)Our 2019 income tax provision includes a benefit of $34 million related to the treatment of the gain from the sale of certain broadcast spectrum in connection with the Broadcast Incentive Auction.
(j)Our 2019 income tax provision includes a $2 million benefit related to capital losses that will be carried back to the pre-2018 tax years when the federal tax rate was 35%.
Temporary differences between the financial reporting carrying amounts and the tax bases of assets and liabilities give rise to deferred taxes. Total deferred tax assets and deferred tax liabilities as of December 31, 2021 and 2020 were as follows (in millions):
| | | | | | | | | | | |
| | 2021 | | 2020 |
| Deferred Tax Assets: | | | |
| Net operating losses: | | | |
| Federal | $ | 16 | | | $ | 22 | |
| State | 120 | | | 130 | |
| Goodwill and intangible assets | 6 | | | 9 | |
| Basis in DSH | 814 | | | 834 | |
| Tax Credits | 87 | | | 67 | |
| | | |
| Other | 108 | | | 53 | |
| | 1,151 | | | 1,115 | |
| Valuation allowance for deferred tax assets | (256) | | | (252) | |
| Total deferred tax assets | $ | 895 | | | $ | 863 | |
| | | |
| Deferred Tax Liabilities: | | | |
| Goodwill and intangible assets | $ | (397) | | | $ | (402) | |
| Property & equipment, net | (165) | | | (221) | |
| | | |
| Other | (40) | | | (43) | |
| Total deferred tax liabilities | (602) | | | (666) | |
| Net deferred tax assets | $ | 293 | | | $ | 197 | |
At December 31, 2021, the Company had approximately $76 million and $2.6 billion of gross federal and state net operating losses, respectively. Except for those without an expiration date, these losses will expire during various years from 2022 to 2041, and some of them are subject to annual limitations under the IRC Section 382 and similar state provisions. As discussed in Income Taxes under Note 1. Nature of Operations and Summary of Significant Accounting Policies, we establish valuation allowances in accordance with the guidance related to accounting for income taxes. As of December 31, 2021, a valuation allowance has been provided for deferred tax assets related to certain temporary basis differences, interest expense carryforwards under the IRC Section 163(j) and a substantial portion of our available state net operating loss carryforwards based on past operating results, expected timing of the reversals of existing temporary basis differences, alternative tax strategies, current and cumulative losses, and projected future taxable income. Although realization is not assured for the remaining deferred tax assets, we believe it is more likely than not that they will be realized in the future. During the year ended December 31, 2021, we increased our valuation allowance by $4 million to $256 million. The increase in valuation allowance was primarily due to uncertainty in the realizability of deferred tax assets related to interest expense carryforwards under the IRC Section 163(j), offset by a change in judgement in the realizability of certain state deferred tax assets. During the year ended December 31, 2020, we increased our valuation allowance by $187 million to $252 million. The increase in valuation allowance was primarily due to the change in judgement in the realizability of certain deferred tax assets resulting from the reduction in forecast of future operating income and the RSN impairment.
The following table summarizes the activity related to our accrued unrecognized tax benefits (in millions):
| | | | | | | | | | | | | | | | | |
| | 2021 | | 2020 | | 2019 |
| Balance at January 1, | $ | 11 | | | $ | 11 | | | $ | 7 | |
| Additions related to prior year tax positions | 1 | | | 5 | | | 4 | |
| Additions related to current year tax positions | 3 | | | 3 | | | — | |
| Reductions related to prior year tax positions | — | | | (1) | | | — | |
| Reductions related to settlements with taxing authorities | — | | | (4) | | | — | |
| Reductions related to expiration of the applicable statute of limitations | — | | | (3) | | | — | |
| Balance at December 31, | $ | 15 | | | $ | 11 | | | $ | 11 | |
We are subject to U.S. federal income tax as well as income tax of multiple state jurisdictions. Our 2016 through 2019 federal tax returns are currently under audit, and several of our subsidiaries are currently under state examinations for various years. Certain of our 2017 and subsequent federal and/or state tax returns remain subject to examination by various tax authorities. We do not anticipate the resolution of these matters will result in a material change to our consolidated financial statements. In addition, we do not believe that our liability for unrecognized tax benefits would be materially impacted, in the next twelve months, as a result of expected statute of limitations expirations, the application of limits under available state administrative practice exceptions, and the resolution of examination issues and settlements with federal and certain state tax authorities.
13. COMMITMENTS AND CONTINGENCIES:
Sports Programming Rights
We are contractually obligated to make payments to purchase sports programming rights. The following table presents our annual non-cancellable commitments relating to the local sports segment's sports programming rights agreements as of December 31, 2021. These commitments assume that sports teams fully deliver the contractually committed games, and do not reflect the impact of rebates expected to be paid by the teams.
| | | | | |
| (in millions) | |
| 2022 | $ | 1,819 | |
| 2023 | 1,773 | |
| 2024 | 1,707 | |
| 2025 | 1,573 | |
| 2026 | 1,373 | |
| 2027 and thereafter | 5,723 | |
| Total | $ | 13,968 | |
Other Liabilities
In connection with the RSN Acquisition, we assumed certain fixed payment obligations which are payable through 2027. We recorded these obligations in purchase accounting at estimated fair value. As of December 31, 2021 and 2020, $32 million and $31 million, respectively, was recorded within other current liabilities and $71 million and $97 million, respectively, was recorded within other long-term liabilities in our consolidated balance sheets. Interest expense of $6 million, $8 million, and $4 million was recorded for the years ended December 31, 2021, 2020, and 2019, respectively.
In connection with the RSN Acquisition, we assumed certain variable payment obligations which are payable through 2030. These contractual obligations are based upon the excess cash flow of certain RSNs. We recorded these obligations in purchase accounting at estimated fair value. As of December 31, 2021 and 2020, $8 million and $12 million, respectively, was recorded within other current liabilities and $23 million and $41 million, respectively, was recorded within other long-term liabilities in our consolidated balance sheets. These obligations are measured at the present value of the estimated amount of cash to be paid over the term of the contracts. We recorded measurement adjustment gains of $15 million and $159 million for the years ended December 31, 2021 and 2020, respectively, recorded within other (expense) income, net in our consolidated statements of operations.
Litigation
We are a party to lawsuits, claims, and regulatory matters from time to time in the ordinary course of business. Actions currently pending are in various stages and no material judgments or decisions have been rendered by hearing boards or courts in connection with such actions. Except as noted below, we do not believe the outcome of these matters, individually or in the aggregate, will have a material effect on the Company's financial statements.
FCC Litigation Matters
On May 22, 2020, the FCC released an Order and Consent Decree pursuant to which the Company agreed to pay $48 million to resolve the matters covered by a Notice of Apparent Liability for Forfeiture (NAL) issued in December 2017 proposing a $13 million fine for alleged violations of the FCC's sponsorship identification rules by the Company and certain of its subsidiaries, the FCC’s investigation of the allegations raised in the Hearing Designation Order issued in connection with the Company's proposed acquisition of Tribune, and a retransmission related matter. The Company submitted the $48 million payment on August 19, 2020. As part of the consent decree, the Company also agreed to implement a 4-year compliance plan. Two petitions were filed on June 8, 2020 seeking reconsideration of the Order and Consent Decree. The Company filed an opposition to the petitions on June 18, 2020, and the petitions remain pending.
On September 1, 2020, one of the individuals who filed a petition for reconsideration of the Order and Consent Decree filed a petition to deny the license renewal application of WBFF(TV), Baltimore, MD, and the license renewal applications of two other Baltimore, MD stations with which the Company has a JSA or LMA, Deerfield Media station WUTB(TV) and Cunningham station WNUV(TV). The Company filed an opposition to the petition on October 1, 2020, and the petition remains pending.
On September 2, 2020, the FCC adopted a Memorandum Opinion and Order and NAL against the licensees of several stations with whom the Company has LMAs, JSAs, and/or SSAs in response to a complaint regarding those stations’ retransmission consent negotiations. The NAL proposed a $0.5 million penalty for each station, totaling $9 million. The licensees filed a response to the NAL on October 15, 2020, asking the Commission to dismiss the proceeding or, alternatively, to reduce the proposed forfeiture to $25,000 per station. On July 28, 2021, the FCC issued a forfeiture order in which the $0.5 million penalty was upheld for all but one station. The Company is not a party to this forfeiture order; however, our consolidated financial statements include an accrual of additional expenses of $8 million for the above legal matters during the year ended December 31, 2021, as we consolidate these stations as VIEs.
Other Litigation Matters
On November 6, 2018, the Company agreed to enter into a proposed consent decree with the Department of Justice (DOJ). This consent decree resolves the DOJ’s investigation into the sharing of pacing information among certain stations in some local markets. The DOJ filed the consent decree and related documents in the U.S. District Court for the District of Columbia on November 13, 2018. The U.S. District Court for the District of Columbia entered the consent decree on May 22, 2019. The consent decree is not an admission of any wrongdoing by the Company and does not subject the Company to any monetary damages or penalties. The Company believes that even if the pacing information was shared as alleged, it would not have impacted any pricing of advertisements or the competitive nature of the market. The consent decree requires the Company to adopt certain antitrust compliance measures, including the appointment of an Antitrust Compliance Officer, consistent with what the DOJ has required in previous consent decrees in other industries. The consent decree also requires the Company's stations not to exchange pacing and certain other information with other stations in their local markets, which the Company’s management has already instructed them not to do.
The Company is aware of twenty-two putative class action lawsuits that were filed against the Company following published reports of the DOJ investigation into the exchange of pacing data within the industry. On October 3, 2018, these lawsuits were consolidated in the Northern District of Illinois. The consolidated action alleges that the Company and thirteen other broadcasters conspired to fix prices for commercials to be aired on broadcast television stations throughout the United States and engaged in unlawful information sharing, in violation of the Sherman Antitrust Act. The consolidated action seeks damages, attorneys’ fees, costs and interest, as well as injunctions against adopting practices or plans that would restrain competition in the ways the plaintiffs have alleged. The Court denied the Defendants’ motion to dismiss on November 6, 2020. Since then, the Plaintiffs have served the Defendants with written discovery requests, and the Court has set a pretrial schedule which now requires discovery to be completed by December 30, 2022 and briefing on class certification to be completed by May 15, 2023. The Company believes the lawsuits are without merit and intends to vigorously defend itself against all such claims.
Changes in the Rules of Television Ownership, Local Marketing Agreements, Joint Sales Agreements, Retransmission Consent Negotiations, and National Ownership Cap
Certain of our stations have entered into what have commonly been referred to as local marketing agreements or LMAs. One typical type of LMA is a programming agreement between two separately owned television stations serving the same market, whereby the licensee of one station programs substantial portions of the broadcast day and sells advertising time during such programming segments on the other licensee’s station subject to the latter licensee’s ultimate editorial and other controls. We believe these arrangements allow us to reduce our operating expenses and enhance profitability.
In 1999, the FCC established a local television ownership rule that made certain LMAs attributable. The FCC adopted policies to grandfather LMAs that were entered into prior to November 5, 1996 and permitted the applicable stations to continue operations pursuant to the LMAs until the conclusion of the FCC’s 2004 biennial review. The FCC stated it would conduct a case-by-case review of grandfathered LMAs and assess the appropriateness of extending the grandfathering periods. The FCC did not initiate any review of grandfathered LMAs in 2004 or as part of its subsequent quadrennial reviews. We do not know when, or if, the FCC will conduct any such review of grandfathered LMAs. Currently, all of our LMAs are grandfathered under the local television ownership rule because they were entered into prior to November 5, 1996. If the FCC were to eliminate the grandfathering of these LMAs, we would have to terminate or modify these LMAs.
In September 2015, the FCC released a Notice of Proposed Rulemaking in response to a Congressional directive in STELAR to examine the “totality of the circumstances test” for good-faith negotiations of retransmission consent. The proposed rulemaking seeks comment on new factors and evidence to consider in its evaluation of claims of bad faith negotiation, including service interruptions prior to a “marquee sports or entertainment event,” restrictions on online access to broadcast programming during negotiation impasses, broadcasters’ ability to offer bundles of broadcast signals with other broadcast stations or cable networks, and broadcasters’ ability to invoke the FCC’s exclusivity rules during service interruptions. On July 14, 2016, the FCC’s Chairman at the time announced that the FCC would not, at that time, proceed to adopt additional rules governing good faith negotiations of retransmission consent but did not formally terminate the rulemaking. No formal action has yet been taken on this Proposed Rulemaking, and we cannot predict if the Commission will terminate the rulemaking or take other action.
In August 2016, the FCC completed both its 2010 and 2014 quadrennial reviews of its media ownership rules and issued an order (Ownership Order) which left most of the existing multiple ownership rules intact, but amended the rules to provide for the attribution of JSAs under certain circumstances. Certain existing JSAs were later grandfathered until 2025. On November 20, 2017, the FCC released an Ownership Order on Reconsideration that, among other things, eliminated the JSA attribution rule. The Ownership Order on Reconsideration (including elimination of the JSA attribution rule) became effective on February 7, 2018. The Ownership Order on Reconsideration was vacated and remanded by the U.S. Court of Appeals for the Third Circuit in September 2019, but the Supreme Court ultimately reversed the Third Circuit’s decision on April 1, 2021 and the Ownership Order on Reconsideration is currently in effect.
On December 18, 2017, the Commission released a Notice of Proposed Rulemaking to examine the FCC’s national ownership cap, including the UHF discount. The UHF discount allows television station owners to discount the coverage of UHF stations when calculating compliance with the FCC’s national ownership cap, which prohibits a single entity from owning television stations that reach, in total, more than 39% of all the television households in the nation. All but 34 of the stations we currently own and operate, or to which we provide programming services are UHF. We cannot predict the outcome of the rulemaking proceeding. With the application of the UHF discount counting all our present stations we reach approximately 24% of U.S. households. Changes to the national ownership cap could limit our ability to make television station acquisitions.
On December 13, 2018, the FCC released a Notice of Proposed Rulemaking to initiate the 2018 Quadrennial Regulatory Review of the FCC’s broadcast ownership rules. The NPRM seeks comment on whether certain of its ownership rules continue to be necessary in the public interest or whether they should be modified or eliminated. With respect to the local television ownership rule specifically, among other things, the NPRM seeks comment on possible modifications to the rule’s operation, including the relevant product market, the numerical limit, the top-four prohibition; and the implications of multicasting, satellite stations, low power stations and the next generation standard. In addition, the NPRM examines further several diversity related proposals raised in the last quadrennial review proceeding. The public comment period began on April 29, 2019, and reply comments were due by May 29, 2019. On July 16, 2021, the FCC extended the comment deadline to September 2, 2021and extended the reply comment deadline to October 1, 2021. We cannot predict the outcome of the rulemaking proceeding. Changes to these rules could impact our ability to make radio or television station acquisitions.
14. VARIABLE INTEREST ENTITIES:
Certain of our stations provide services to other station owners within the same respective market through agreements, such as LMAs, where we provide programming, sales, operational, and administrative services, and JSAs and SSAs, where we provide non-programming, sales, operational, and administrative services. In certain cases, we have also entered into purchase agreements or options to purchase the license related assets of the licensee. We typically own the majority of the non-license assets of the stations, and in some cases where the licensee acquired the license assets concurrent with our acquisition of the non-license assets of the station, we have provided guarantees to the bank for the licensee’s acquisition financing. The terms of the agreements vary, but generally have initial terms of over five years with several optional renewal terms. Based on the terms of the agreements and the significance of our investment in the stations, we are the primary beneficiary when, subject to the ultimate control of the licensees, we have the power to direct the activities which significantly impact the economic performance of the VIE through the services we provide and we absorb losses and returns that would be considered significant to the VIEs. The fees paid between us and the licensees pursuant to these arrangements are eliminated in consolidation.
We are party to a joint venture associated with Marquee. Marquee is party to a long term telecast rights agreement which provides the rights to air certain live game telecasts and other content, which we guarantee. In connection with the RSN Acquisition, we became party to a joint venture associated with one other regional sports network. We participate significantly in the economics and have the power to direct the activities which significantly impact the economic performance of these regional sports networks, including sales and certain operational services. We consolidate these regional sports networks because they are variable interest entities and we are the primary beneficiary.
The carrying amounts and classification of the assets and liabilities of the VIEs mentioned above which have been included in our consolidated balance sheets as of December 31, 2021 and 2020 were as follows (in millions):
| | | | | | | | | | | |
| | 2021 | | 2020 |
| ASSETS | | | |
| Current assets: | | | |
| Cash and cash equivalents | $ | 43 | | | $ | 64 | |
| Accounts receivable, net | 83 | | | 70 | |
| Prepaid sports rights | 2 | | | 2 | |
| Other current assets | 4 | | | 5 | |
| | | |
| Total current asset | 132 | | | 141 | |
| | | |
| | | |
| Property and equipment, net | 17 | | | 16 | |
| Operating lease assets | 5 | | | 6 | |
| Goodwill and indefinite-lived intangible assets | 15 | | | 15 | |
| | | |
| Definite-lived intangible assets, net | 47 | | | 54 | |
| Other assets | 1 | | | 1 | |
| Total assets | $ | 217 | | | $ | 233 | |
| | | |
| LIABILITIES | | | |
| Current liabilities: | | | |
| Other current liabilities | $ | 62 | | | $ | 40 | |
| | | |
| | | |
| | | |
| | | |
| | | |
| Notes payable, finance leases, and commercial bank financing, less current portion | — | | | 10 | |
| Operating lease liabilities, less current portion | 4 | | | 5 | |
| Program contracts payable, less current portion | 2 | | | 4 | |
| Other long term liabilities | 4 | | | 17 | |
| Total liabilities | $ | 72 | | | $ | 76 | |
The amounts above represent the consolidated assets and liabilities of the VIEs described above, for which we are the primary beneficiary. Total liabilities associated with certain outsourcing agreements and purchase options with certain VIEs, which are excluded from above, were $127 million and $131 million as of December 31, 2021 and December 31, 2020, respectively, as these amounts are eliminated in consolidation. The assets of each of these consolidated VIEs can only be used to settle the obligations of the VIE. As of December 31, 2021, all of the liabilities are non-recourse to us except for the debt of certain VIEs. See Debt of variable interest entities and guarantees of third-party debt under Note 7. Notes Payable and Commercial Bank Financing for further discussion. The risk and reward characteristics of the VIEs are similar.
Other VIEs
We have several investments in entities which are considered VIEs. However, we do not participate in the management of these entities, including the day-to-day operating decisions or other decisions which would allow us to control the entity, and therefore, we are not considered the primary beneficiary of these VIEs.
The carrying amounts of our investments in these VIEs for which we are not the primary beneficiary were $175 million and $75 million as of December 31, 2021 and 2020, respectively, and are included in other assets in our consolidated balance sheets. See Note 6. Other Assets for more information related to our equity investments. Our maximum exposure is equal to the carrying value of our investments. The income and loss related to equity method investments and other equity investments are recorded in income (loss) from equity method investments and other (expense) income, net, respectively, in our consolidated statements of operations. We recorded a gain of $37 million and losses of $38 million and $50 million for the years ended December 31, 2021, 2020, and 2019, respectively, related to these investments.
15. RELATED PERSON TRANSACTIONS:
Transactions with our controlling shareholders
David, Frederick, J. Duncan and Robert Smith (collectively, the controlling shareholders) are brothers and hold substantially all of the Class B Common Stock and some of our Class A Common Stock. We engaged in the following transactions with them and/or entities in which they have substantial interests:
Leases. Certain assets used by us and our operating subsidiaries are leased from entities owned by the controlling shareholders. Lease payments made to these entities were $5 million for each of the years ended December 31, 2021, 2020, and 2019.
Finance leases payable related to the aforementioned relationships were $9 million, net of $1 million interest, and $8 million, net of $2 million interest, as of December 31, 2021 and 2020, respectively. The finance leases mature in periods through 2029. For further information on finance leases to affiliates, see Note 7. Notes Payable and Commercial Bank Financing.
Charter Aircraft. We lease aircraft owned by certain controlling shareholders. For all leases, we incurred aggregate expenses of $1 million for each of the years ended December 31, 2021 and 2020 and $2 million for the year ended December 31, 2019.
Cunningham Broadcasting Corporation
Cunningham owns a portfolio of television stations, including: WNUV-TV Baltimore, Maryland; WRGT-TV Dayton, Ohio; WVAH-TV Charleston, West Virginia; WMYA-TV Anderson, South Carolina; WTTE-TV Columbus, Ohio; WDBB-TV Birmingham, Alabama; WBSF-TV Flint, Michigan; WGTU-TV/WGTQ-TV Traverse City/Cadillac, Michigan; WEMT-TV Tri-Cities, Tennessee; WYDO-TV Greenville, North Carolina; KBVU-TV/KCVU-TV Eureka/Chico-Redding, California; WPFO-TV Portland, Maine; and KRNV-DT/KENV-DT Reno, Nevada/Salt Lake City, Utah (collectively, the Cunningham Stations). Certain of our stations provide services to these Cunningham Stations pursuant to LMAs or JSAs and SSAs. See Note 14. Variable Interest Entities, for further discussion of the scope of services provided under these types of arrangements. As of December 31, 2021, we have jointly, severally, unconditionally, and irrevocably guaranteed $37 million of Cunningham debt, of which $7 million, net of $0.2 million deferred financing costs, relates to the Cunningham VIEs that we consolidate.
All of the non-voting stock of the Cunningham Stations is owned by trusts for the benefit of the children of our controlling shareholders. We consolidate certain subsidiaries of Cunningham with which we have variable interests through various arrangements related to the Cunningham Stations.
The services provided to WNUV-TV, WMYA-TV, WTTE-TV, WRGT-TV and WVAH-TV are governed by a master agreement which has a current term that expires on July 1, 2023 and there are two additional five-year renewal terms remaining with final expiration on July 1, 2033. We also executed purchase agreements to acquire the license related assets of these stations from Cunningham, which grant us the right to acquire, and grant Cunningham the right to require us to acquire, subject to applicable FCC rules and regulations, 100% of the capital stock or the assets of these individual subsidiaries of Cunningham. Pursuant to the terms of this agreement we are obligated to pay Cunningham an annual fee for the television stations equal to the greater of (i) 3% of each station’s annual net broadcast revenue or (ii) $5 million. The aggregate purchase price of these television stations increases by 6% annually. A portion of the fee is required to be applied to the purchase price to the extent of the 6% increase. The cumulative prepayments made under these purchase agreements were $58 million and $54 million as of December 31, 2021 and 2020, respectively. The remaining aggregate purchase price of these stations, net of prepayments, was $54 million for both the years ended December 31, 2021 and 2020. Additionally, we provide services to WDBB-TV pursuant to an LMA, which expires April 22, 2025, and have a purchase option to acquire for $0.2 million. We paid Cunningham, under these agreements, $11 million for the year ended December 31, 2021 and $8 million for each of the years ended December 31, 2020 and 2019.
The agreements with KBVU-TV/KCVU-TV, KRNV-DT/KENV-DT, WBSF-TV, WEMT-TV, WGTU-TV/WGTQ-TV, WPFO-TV, and WYDO-TV expire between May 2023 and November 2029, and certain stations have renewal provisions for successive eight-year periods.
As we consolidate the licensees as VIEs, the amounts we earn or pay under the arrangements are eliminated in consolidation and the gross revenues of the stations are reported in our consolidated statements of operations. Our consolidated revenues include $144 million, $157 million, and $155 million for the years ended December 31, 2021, 2020, and 2019, respectively, related to the Cunningham Stations.
We have an agreement with Cunningham to provide master control equipment and provide master control services to a station in Johnstown, PA with which Cunningham has an LMA that expires in June 2022. Under the agreement, Cunningham paid us an initial fee of $1 million and pays us $0.2 million annually for master control services plus the cost to maintain and repair the equipment. In addition, we have an agreement with Cunningham to provide a news share service with the Johnstown, PA station for an annual fee of $0.5 million and increased by 3% on each anniversary and which expires in November 2024.
Atlantic Automotive Corporation
We sell advertising time to Atlantic Automotive Corporation (Atlantic Automotive), a holding company that owns automobile dealerships and an automobile leasing company. David D. Smith, our Executive Chairman, has a controlling interest in, and is a member of the Board of Directors of, Atlantic Automotive. We received payments for advertising totaling $0.1 million for the year ended December 31, 2021 and $0.2 million for each of the years ended December 31, 2020 and 2019.
Leased property by real estate ventures
Certain of our real estate ventures have entered into leases with entities owned by members of the Smith Family. Total rent received under these leases was $1 million for each of the years ended December 31, 2021, 2020, and 2019.
Equity method investees
YES Network. In August 2019, YES Network, an equity method investee, entered into a management services agreement with the Company, in which the Company provides certain services for an initial term that expires on August 29, 2025. The agreement will automatically renew for two 2-year renewal terms, with a final expiration on August 29, 2029. Pursuant to the terms of the agreement, the YES Network paid us a management services fee of $6 million, $5 million, and $2 million for the years ended December 31, 2021, 2020, and 2019, respectively.
We have a minority interest in certain mobile production businesses, which we account for as equity method investments. We made payments to these businesses for production services totaling $45 million, $19 million, and $12 million for the years ended December 31, 2021, 2020, and 2019, respectively.
We have a minority interest in a sports marketing company, which we account for as an equity method investment. We made payments to this business for marketing services totaling $17 million for the year ended December 31, 2021.
Programming rights
As of December 31, 2021, affiliates of six professional teams have non-controlling equity interests in certain of our RSNs. These agreements expire on various dates during the fiscal years ended 2025 through 2032. The Company paid $424 million, $168 million, net of rebates, and $73 million for the years ended December 31, 2021, 2020, and 2019, respectively, under sports programming rights agreements covering the broadcast of regular season games to professional teams who have non-controlling equity interests in certain of our RSNs.
Employees
Jason Smith, an employee of the Company, is the son of Frederick Smith, a Vice President of the Company and a member of the Company's Board of Directors. Jason Smith received total compensation of $0.2 million, consisting of salary and bonus, for each of the years ended December 31, 2021, 2020, and 2019, and was granted RSAs with respect to 2,239 and 355 shares, vesting over two years, for the years ended December 31, 2021 and 2020, respectively. Amberly Thompson, an employee of the Company, is the daughter of Donald Thompson, Executive Vice President and Chief Human Resources Officer of the Company. Amberly Thompson received total compensation of $0.2 million, consisting of salary and bonus, for each of the years ended December 31, 2021, 2020, and 2019. Edward Kim, an employee of the company, is the brother-in-law of Christopher Ripley, President and Chief Executive Officer of the Company. Edward Kim received total compensation of $0.2 million and $0.1 million, consisting of salary, for the years ended December 31, 2021 and 2020, respectively.
16. EARNINGS PER SHARE:
The following table reconciles income (numerator) and shares (denominator) used in our computations of earnings per share for the years ended December 31, 2021, 2020, and 2019 (in millions, except share amounts which are reflected in thousands):
| | | | | | | | | | | | | | | | | |
| | 2021 | | 2020 | | 2019 |
| Income (Numerator) | | | | | |
| Net (loss) income | $ | (326) | | | $ | (2,429) | | | $ | 105 | |
| Net income attributable to the redeemable noncontrolling interests | (18) | | | (56) | | | (48) | |
| Net (income) loss attributable to the noncontrolling interests | (70) | | | 71 | | | (10) | |
| Numerator for basic and diluted earnings per common share available to common shareholders | $ | (414) | | | $ | (2,414) | | | $ | 47 | |
| | | | | |
| Shares (Denominator) | | | | | |
| Basic weighted-average common shares outstanding | 75,050 | | | 79,924 | | | 92,015 | |
| Dilutive effect of stock settled appreciation rights and outstanding stock options | — | | | — | | | 1,170 | |
| Diluted weighted-average common and common equivalent shares outstanding | 75,050 | | | 79,924 | | | 93,185 | |
The net earnings per share amounts are the same for Class A and Class B Common Stock because the holders of each class are legally entitled to equal per share distributions whether through dividends or in liquidation.
The following table shows the weighted-average stock-settled appreciation rights and outstanding stock options (in thousands) that are excluded from the calculation of diluted earnings per common share as the inclusion of such shares would be anti-dilutive.
| | | | | | | | | | | | | | | | | |
| | 2021 | | 2020 | | 2019 |
| Weighted-average stock-settled appreciation rights and outstanding stock options excluded | 1,973 | | | 3,288 | | | 238 | |
17. SEGMENT DATA:
We measure segment performance based on operating income (loss). We have two reportable segments: broadcast and local sports. Our broadcast segment, previously referred to as our local news and marketing services segment, provides free over-the-air programming to television viewing audiences and includes stations in 86 markets located throughout the continental United States. Our local sports segment, previously referred to as our sports segment, provides viewers with live professional sports content and includes our regional sports network brands, Marquee, and a minority equity interest in the YES Network. Other and corporate are not reportable segments but are included for reconciliation purposes. Other primarily consists of original networks and content, including Tennis, non-broadcast digital and internet solutions, technical services, and other non-media investments. Corporate costs primarily include our costs to operate as a public company and to operate our corporate headquarters location. All of our businesses are located within the United States.
Segment financial information is included in the following tables for the years ended December 31, 2021, 2020, and 2019 (in millions):
| | | | | | | | | | | | | | | | | | | | | | | | | | | | | | | | |
| As of December 31, 2021 | | Broadcast | | Local sports | | Other & Corporate | | Eliminations | | Consolidated |
| Goodwill | | $ | 2,016 | | | $ | — | | | $ | 72 | | | $ | — | | | $ | 2,088 | |
| Assets | | 4,793 | | | 5,769 | | | 2,009 | | | (30) | | | 12,541 | |
| Capital expenditures | | 52 | | | 16 | | | 12 | | | — | | | 80 | |
| | | | | | | | | | | | | | | | | | | | | | | | | | | | | | | | |
| As of December 31, 2020 | | Broadcast | | Local sports | | Other & Corporate | | Eliminations | | Consolidated |
| Goodwill | | $ | 2,017 | | | $ | — | | | $ | 75 | | | $ | — | | | $ | 2,092 | |
| Assets | | 4,908 | | | 6,620 | | | 1,867 | | | (13) | | | 13,382 | |
| Capital expenditures | | 101 | | | 24 | | | 32 | | | — | | | 157 | |
| | | | | | | | | | | | | | | | | | | | | | | | | | | | | | | | |
| For the year ended December 31, 2021 | | Broadcast | | Local sports | | Other & Corporate | | Eliminations | | Consolidated |
| Revenue | | $ | 2,757 | | | $ | 3,056 | | | $ | 481 | | | $ | (160) | | (c) | $ | 6,134 | |
| Depreciation of property and equipment and amortization of definite-lived intangible assets and other assets | | 247 | | | 316 | | | 31 | | | (3) | | | 591 | |
| Amortization of sports programming rights (a) | | — | | | 2,350 | | | — | | | — | | | 2,350 | |
| Amortization of program contract costs | | 76 | | | — | | | 17 | | | — | | | 93 | |
| Corporate general and administrative expenses | | 147 | | | 10 | | | 13 | | | — | | | 170 | |
| Gain on asset dispositions and other, net of impairment | | (24) | | (b) | (43) | | (b) | (4) | | | — | | | (71) | |
| | | | | | | | | | |
| Operating income (loss) | | 374 | | (b) | (317) | | (b) | 39 | | | (1) | | | 95 | |
| Interest expense including amortization of debt discount and deferred financing costs | | 4 | | | 436 | | | 192 | | | (14) | | | 618 | |
| Income (loss) from equity method investments | | — | | | 49 | | | (4) | | | — | | | 45 | |
| | | | | | | | | | | | | | | | | | | | | | | | | | | | | | | | |
| For the year ended December 31, 2020 | | Broadcast | | Local sports | | Other & Corporate | | Eliminations | | Consolidated |
| Revenue | | $ | 2,922 | | | $ | 2,686 | | | $ | 451 | | | $ | (116) | | (c) | $ | 5,943 | |
| Depreciation of property and equipment and amortization of definite-lived intangible assets and other assets | | 239 | | | 410 | | | 27 | | | (2) | | | 674 | |
| Amortization of sports programming rights (a) | | — | | | 1,078 | | | — | | | — | | | 1,078 | |
| Amortization of program contract costs | | 83 | | | — | | | 3 | | | — | | | 86 | |
| Corporate general and administrative expenses | | 119 | | | 10 | | | 19 | | | — | | | 148 | |
| (Gain) loss on asset dispositions and other, net of impairment | | (118) | | (b) | — | | | 3 | | | — | | | (115) | |
| Impairment of goodwill and definite-lived intangible assets | | — | | | 4,264 | | | — | | | — | | | 4,264 | |
| Operating income (loss) | | 789 | | (b) | (3,602) | | | 47 | | | (6) | | | (2,772) | |
| Interest expense including amortization of debt discount and deferred financing costs | | 5 | | | 460 | | | 203 | | | (12) | | | 656 | |
| Income (loss) from equity method investments | | — | | | 6 | | | (42) | | | — | | | (36) | |
| | | | | | | | | | | | | | | | | | | | | | | | | | | | | | | | |
| For the year ended December 31, 2019 | | Broadcast | | Local sports | | Other & Corporate | | Eliminations | | Consolidated |
| Revenue | | $ | 2,690 | | | $ | 1,139 | | | $ | 470 | | | $ | (59) | | (c) | $ | 4,240 | |
| Depreciation of property and equipment and amortization of definite-lived intangible assets and other assets | | 246 | | | 157 | | | 22 | | | (1) | | | 424 | |
| Amortization of sports programming rights (a) | | — | | | 637 | | | — | | | — | | | 637 | |
| Amortization of program contract costs | | 90 | | | — | | | — | | | — | | | 90 | |
| Corporate general and administrative expenses | | 144 | | | 93 | | | 151 | | | (1) | | | 387 | |
| Gain on asset dispositions and other, net of impairment | | (62) | | (b) | — | | | (30) | | | — | | | (92) | |
| Operating income (loss) | | 546 | | (b) | 30 | | | (98) | | | (8) | | | 470 | |
| Interest expense including amortization of debt discount and deferred financing costs | | 5 | | | 200 | | | 230 | | | (13) | | | 422 | |
| Income (loss) from equity method investments | | — | | | 18 | | | (53) | | | — | | | (35) | |
(a)The amortization of sports programming rights is included within media programming and production expenses on our consolidated statements of operations.
(b)Includes gains of $67 million for the year ended December 31, 2021 related to the fair value of equipment that we received for the C-Band spectrum repack and reimbursements for spectrum repack costs, and gains of $90 million and $62 million for the years ended December 31, 2020 and 2019, respectively, related to reimbursements for spectrum repack costs. See Note 2. Acquisitions and Dispositions of Assets.
(c)Includes $111 million, $100 million, and $35 million of revenue for the years ended December 31, 2021, 2020, and 2019, respectively, for services provided by broadcast to local sports and other, which are eliminated in consolidation.
18. FAIR VALUE MEASUREMENTS:
Accounting guidance provides for valuation techniques, such as the market approach (comparable market prices), the income approach (present value of future income or cash flow), and the cost approach (cost to replace the service capacity of an asset or replacement cost). A fair value hierarchy using three broad levels prioritizes the inputs to valuation techniques used to measure fair value. The following is a brief description of those three levels:
•Level 1: Observable inputs such as quoted prices (unadjusted) in active markets for identical assets or liabilities.
•Level 2: Inputs other than quoted prices that are observable for the asset or liability, either directly or indirectly. These include quoted prices for similar assets or liabilities in active markets and quoted prices for identical or similar assets or liabilities in markets that are not active.
•Level 3: Unobservable inputs that reflect the reporting entity’s own assumptions.
The following table sets forth the carrying value and fair value of our financial assets and liabilities as of December 31, 2021 and 2020 (in millions):
| | | | | | | | | | | | | | | | | | | | | | | |
| | 2021 | | 2020 |
| | Carrying Value | | Fair Value | | Carrying Value | | Fair Value |
| Level 1: | | | | | | | |
| Investments in equity securities | $ | 5 | | | $ | 5 | | | $ | 68 | | | $ | 68 | |
| STG: | | | | | | | |
| Money market funds | 265 | | | 265 | | | 448 | | | 448 | |
| Deferred compensation assets | 48 | | | 48 | | | 42 | | | 42 | |
| Deferred compensation liabilities | 38 | | | 38 | | | 36 | | | 36 | |
| DSG: | | | | | | | |
| Money market funds | 101 | | | 101 | | | 292 | | 292 |
| | | | | | | |
| Level 2: | | | | | | | |
| Investments in equity securities (a) | 114 | | | 114 | | | — | | | — | |
| STG (b): | | | | | | | |
5.875% Senior Unsecured Notes due 2026 | 348 | | | 357 | | | 348 | | | 358 | |
| | | | | | | |
5.500% Senior Unsecured Notes due 2030 | 500 | | | 489 | | | 500 | | | 520 | |
5.125% Senior Unsecured Notes due 2027 | 400 | | | 391 | | | 400 | | | 408 | |
4.125% Senior Secured Notes due 2030 | 750 | | | 712 | | | 750 | | | 770 | |
| Term Loan B | 379 | | | 373 | | | 1,119 | | | 1,107 | |
| Term Loan B-2 | 1,271 | | | 1,239 | | | 1,284 | | | 1,264 | |
| Term Loan B-3 (c) | 736 | | | 722 | | | — | | | — | |
| | | | | | | |
| DSG (b): | | | | | | | |
12.750% Senior Secured Notes due 2026 | 31 | | | 17 | | | 31 | | | 28 | |
6.625% Senior Unsecured Notes due 2027 | 1,744 | | | 490 | | | 1,744 | | | 1,056 | |
5.375% Senior Secured Notes due 2026 | 3,050 | | | 1,525 | | | 3,050 | | | 2,483 | |
| Term Loan | 3,226 | | | 1,484 | | | 3,259 | | | 2,884 | |
| Accounts Receivable Securitization Facility | — | | | — | | | 177 | | | 177 | |
| Debt of variable interest entities (b) | 9 | | | 9 | | | 17 | | | 17 | |
| Debt of non-media subsidiaries (b) | 17 | | | 17 | | | 17 | | | 17 | |
| | | | | | | |
| Level 3: | | | | | | | |
| Investments in equity securities (d) | 282 | | | 282 | | | 332 | | | 332 | |
| | | | | | | |
| | | | | | | |
(a)Consists of unrestricted warrants to acquire marketable common equity securities. The fair value of the warrants are derived from the quoted trading prices of the underlying common equity securities less the exercise price.
(b)Amounts are carried in our consolidated balance sheets net of debt discount, premium, and deferred financing costs, which are excluded in the above table, of $158 million and $183 million as of December 31, 2021 and 2020, respectively.
(c)On April 1, 2021, STG amended the STG Bank Credit Agreement to raise term loans in an aggregate principle amount of $740 million, the net proceeds of which were used to refinance a portion of the STG Term Loan B-1 maturing in January 2024. Note 7. Notes Payable and Commercial Bank Financing for additional information.
(d)On November 18, 2020, we entered into a commercial agreement with Bally's and received warrants and options to acquire common equity in the business. During the years ended December 31, 2021 and 2020 we recorded a fair value adjustment loss of $50 million and gain of $133 million, respectively, related to these interests. The fair value of the warrants is primarily derived from the quoted trading prices of the underlying common equity adjusted for a 16% and 25% discount for lack of marketability (DLOM) as of December 31, 2021 and 2020, respectively. The fair value of the options is derived utilizing the Black Scholes valuation model. The most significant inputs include the trading price of the underlying common stock, the exercise price of the options, which range from $30 to $45 per share, and a DLOM of 16% and 25% as of December 31, 2021 and 2020, respectively. There are certain restrictions surrounding the sale and ownership of common stock through the second anniversary of the agreement. The Company is also precluded from owning more than 4.9% of the outstanding common shares of Bally's, inclusive of shares obtained through the exercise of the warrants and options described above. See Note 6. Other Assets for further discussion.
The following table summarizes the changes in financial assets measured at fair value on a recurring basis and categorized as Level 3 under the fair value hierarchy (in millions):
| | | | | |
| Options and Warrants |
| Fair value at December 31, 2019 | $ | — | |
| Acquisition | 199 | |
| |
| Measurement adjustments | 133 | |
| Fair value at December 31, 2020 | $ | 332 | |
| |
| |
| Measurement adjustments | (50) | |
| Fair value at December 31, 2021 | $ | 282 | |
19. CONDENSED CONSOLIDATING FINANCIAL STATEMENTS:
Sinclair Television Group, Inc. (STG), a wholly-owned subsidiary and the television operating subsidiary of Sinclair Broadcast Group, Inc. (SBG), is the primary obligor under STG's Bank Credit Agreement, 5.875% unsecured notes, 5.125% unsecured notes, 5.500% unsecured notes, and 4.125% secured notes. Our Class A Common Stock and Class B Common Stock as of December 31, 2021, were obligations or securities of SBG and not obligations or securities of STG. SBG is a guarantor under STG's Bank Credit Agreement, 5.875% unsecured notes, 5.125% unsecured notes, 5.500% unsecured notes, and 4.125% secured notes. As of December 31, 2021, our consolidated total debt of $12,340 million included $4,385 million of debt related to STG and its subsidiaries of which SBG guaranteed $4,347 million.
SBG, KDSM, LLC, a wholly-owned subsidiary of SBG, and STG’s wholly-owned subsidiaries (guarantor subsidiaries), have fully and unconditionally guaranteed, subject to certain customary automatic release provisions, all of STG’s obligations. Those guarantees are joint and several. There are certain contractual restrictions on the ability of SBG, STG or KDSM, LLC to obtain funds from their subsidiaries in the form of dividends or loans.
The following condensed consolidating financial statements present the consolidated balance sheets, consolidated statements of operations and comprehensive income, and consolidated statements of cash flows of SBG, STG, KDSM, LLC and the guarantor subsidiaries, the direct and indirect non-guarantor subsidiaries of SBG and the eliminations necessary to arrive at our information on a consolidated basis and are provided pursuant to the terms of certain of our debt agreements. Investments in the subsidiaries of SBG, STG, KDSM, LLC and the guarantor subsidiaries, the direct and indirect non-guarantor subsidiaries of SBG are presented in each column under the equity method of accounting. Certain information and footnote disclosures normally included in financial statements prepared in accordance with GAAP have been condensed or omitted. As such, these condensed consolidating financial statements should be read in conjunction with the accompanying notes to consolidated financial statements.
CONDENSED CONSOLIDATED BALANCE SHEET
AS OF DECEMBER 31, 2021
(In millions)
| | | | | | | | | | | | | | | | | | | | | | | | | | | | | | | | | | | |
| | Sinclair
Broadcast
Group,
Inc. | | Sinclair
Television
Group, Inc. | | Guarantor
Subsidiaries
and KDSM,
LLC | | Non-
Guarantor
Subsidiaries | | Eliminations | | Sinclair
Consolidated |
| Cash and cash equivalents | $ | 2 | | | $ | 316 | | | $ | 2 | | | $ | 496 | | | $ | — | | | $ | 816 | |
| Accounts receivable, net | — | | | — | | | 649 | | | 596 | | | — | | | 1,245 | |
| Other current assets | 10 | | | 82 | | | 293 | | | 136 | | | (111) | | | 410 | |
| Total current assets | 12 | | | 398 | | | 944 | | | 1,228 | | | (111) | | | 2,471 | |
| | | | | | | | | | | |
| Property and equipment, net | 1 | | | 31 | | | 664 | | | 161 | | | (24) | | | 833 | |
| | | | | | | | | | | |
| Investment in equity of consolidated subsidiaries | 451 | | | 3,448 | | | — | | | — | | | (3,899) | | | — | |
| Restricted cash | — | | | — | | | — | | | 3 | | | — | | | 3 | |
| Goodwill | — | | | — | | | 2,081 | | | 7 | | | — | | | 2,088 | |
| Indefinite-lived intangible assets | — | | | — | | | 136 | | | 14 | | | — | | | 150 | |
| Definite-lived intangible assets, net | — | | | — | | | 1,105 | | | 4,019 | | | (36) | | | 5,088 | |
| Other long-term assets | 331 | | | 1,956 | | | 427 | | | 1,853 | | | (2,659) | | | 1,908 | |
| Total assets | $ | 795 | | | $ | 5,833 | | | $ | 5,357 | | | $ | 7,285 | | | $ | (6,729) | | | $ | 12,541 | |
| | | | | | | | | | | |
| Accounts payable and accrued liabilities | $ | 31 | | | $ | 85 | | | $ | 295 | | | $ | 279 | | | $ | (35) | | | $ | 655 | |
| Current portion of long-term debt | — | | | 20 | | | 5 | | | 45 | | | (1) | | | 69 | |
| Other current liabilities | 2 | | | 6 | | | 155 | | | 392 | | | (77) | | | 478 | |
| Total current liabilities | 33 | | | 111 | | | 455 | | | 716 | | | (113) | | | 1,202 | |
| | | | | | | | | | | |
| Long-term debt | 915 | | | 4,317 | | | 33 | | | 8,488 | | | (1,482) | | | 12,271 | |
| Investment in deficit of consolidated subsidiaries | 1,605 | | | — | | | — | | | — | | | (1,605) | | | — | |
| Other long-term liabilities | 12 | | | 69 | | | 1,426 | | | 468 | | | (1,398) | | | 577 | |
| Total liabilities | 2,565 | | | 4,497 | | | 1,914 | | | 9,672 | | | (4,598) | | | 14,050 | |
| | | | | | | | | | | |
| Redeemable noncontrolling interests | — | | | — | | | — | | | 197 | | | — | | | 197 | |
| Total Sinclair Broadcast Group (deficit) equity | (1,770) | | | 1,336 | | | 3,443 | | | (2,644) | | | (2,135) | | | (1,770) | |
| Noncontrolling interests in consolidated subsidiaries | — | | | — | | | — | | | 60 | | | 4 | | | 64 | |
| Total liabilities, redeemable noncontrolling interests, and equity | $ | 795 | | | $ | 5,833 | | | $ | 5,357 | | | $ | 7,285 | | | $ | (6,729) | | | $ | 12,541 | |
CONDENSED CONSOLIDATED BALANCE SHEET
AS OF DECEMBER 31, 2020
(In millions)
| | | | | | | | | | | | | | | | | | | | | | | | | | | | | | | | | | | |
| | Sinclair
Broadcast
Group, Inc. | | Sinclair
Television
Group, Inc. | | Guarantor
Subsidiaries
and KDSM,
LLC | | Non-
Guarantor
Subsidiaries | | Eliminations | | Sinclair
Consolidated |
| Cash and cash equivalents | $ | — | | | $ | 458 | | | $ | — | | | $ | 801 | | | $ | — | | | 1,259 | |
| Accounts receivable, net | — | | | — | | | 558 | | | 502 | | | — | | | 1,060 | |
| Other current assets | 7 | | | 46 | | | 372 | | | 560 | | | (87) | | | 898 | |
| Total current assets | 7 | | | 504 | | | 930 | | | 1,863 | | | (87) | | | 3,217 | |
| | | | | | | | | | | |
| Property and equipment, net | 1 | | | 33 | | | 706 | | | 109 | | | (26) | | | 823 | |
| | | | | | | | | | | |
| Investment in equity of consolidated subsidiaries | 430 | | | 3,549 | | | — | | | — | | | (3,979) | | | — | |
| Restricted cash | — | | | — | | | — | | | 3 | | | — | | | 3 | |
| Goodwill | — | | | — | | | 2,082 | | | 10 | | | — | | | 2,092 | |
| Indefinite-lived intangible assets | — | | | — | | | 156 | | | 15 | | | — | | | 171 | |
| Definite-lived intangible assets | — | | | — | | | 1,256 | | | 4,409 | | | (41) | | | 5,624 | |
| Other long-term assets | 139 | | | 1,718 | | | 280 | | | 1,569 | | | (2,254) | | | 1,452 | |
| Total assets | $ | 577 | | | $ | 5,804 | | | $ | 5,410 | | | $ | 7,978 | | | $ | (6,387) | | | $ | 13,382 | |
| | | | | | | | | | | |
| Accounts payable and accrued liabilities | $ | 19 | | | $ | 70 | | | $ | 247 | | | $ | 284 | | | $ | (87) | | | $ | 533 | |
| Current portion of long-term debt | — | | | 13 | | | 5 | | | 41 | | | (1) | | | 58 | |
| Other current liabilities | 1 | | | 2 | | | 134 | | | 306 | | | — | | | 443 | |
| Total current liabilities | 20 | | | 85 | | | 386 | | | 631 | | | (88) | | | 1,034 | |
| | | | | | | | | | | |
| Long-term debt | 700 | | | 4,337 | | | 33 | | | 8,460 | | | (1,037) | | | 12,493 | |
| Investment in deficit of consolidated subsidiaries | 1,118 | | | — | | | — | | | — | | | (1,118) | | | — | |
| Other liabilities | 12 | | | 121 | | | 1,445 | | | 710 | | | (1,438) | | | 850 | |
| Total liabilities | 1,850 | | | 4,543 | | | 1,864 | | | 9,801 | | | (3,681) | | | 14,377 | |
| | | | | | | | | | | |
| Redeemable noncontrolling interests | — | | | — | | | — | | | 190 | | | — | | | 190 | |
| Total Sinclair Broadcast Group (deficit) equity | (1,273) | | | 1,261 | | | 3,546 | | | (2,098) | | | (2,710) | | | (1,274) | |
| Noncontrolling interests in consolidated subsidiaries | — | | | — | | | — | | | 85 | | | 4 | | | 89 | |
| Total liabilities, redeemable noncontrolling interests, and equity | $ | 577 | | | $ | 5,804 | | | $ | 5,410 | | | $ | 7,978 | | | $ | (6,387) | | | $ | 13,382 | |
CONDENSED CONSOLIDATED STATEMENT OF OPERATIONS AND COMPREHENSIVE INCOME
FOR THE YEAR ENDED DECEMBER 31, 2021
(In millions)
| | | | | | | | | | | | | | | | | | | | | | | | | | | | | | | | | | | |
| | Sinclair
Broadcast
Group, Inc. | | Sinclair
Television
Group, Inc. | | Guarantor
Subsidiaries
and KDSM,
LLC | | Non-
Guarantor
Subsidiaries | | Eliminations | | Sinclair
Consolidated |
| Net revenue | $ | — | | | $ | 111 | | | $ | 2,979 | | | $ | 3,251 | | | $ | (207) | | | $ | 6,134 | |
| | | | | | | | | | | |
| Media programming and production expenses | — | | | 4 | | | 1,425 | | | 2,916 | | | (54) | | | 4,291 | |
| Selling, general and administrative | 12 | | | 160 | | | 715 | | | 336 | | | (145) | | | 1,078 | |
| Depreciation, amortization and other operating expenses | 1 | | | 8 | | | 327 | | | 341 | | | (7) | | | 670 | |
| Total operating expenses | 13 | | | 172 | | | 2,467 | | | 3,593 | | | (206) | | | 6,039 | |
| | | | | | | | | | | |
| Operating (loss) income | (13) | | | (61) | | | 512 | | | (342) | | | (1) | | | 95 | |
| | | | | | | | | | | |
| Equity in (loss) earnings of consolidated subsidiaries | (350) | | | 435 | | | — | | | — | | | (85) | | | — | |
| Interest expense | (13) | | | (180) | | | (3) | | | (450) | | | 28 | | | (618) | |
| Other (expense) income | (63) | | | 16 | | | (24) | | | 111 | | | (16) | | | 24 | |
| Total other (expense) income, net | (426) | | | 271 | | | (27) | | | (339) | | | (73) | | | (594) | |
| | | | | | | | | | | |
| Income tax benefit (provision) | 25 | | | 35 | | | (44) | | | 157 | | | — | | | 173 | |
| Net (loss) income | (414) | | | 245 | | | 441 | | | (524) | | | (74) | | | (326) | |
| Net income attributable to the redeemable noncontrolling interests | — | | | — | | | — | | | (18) | | | — | | | (18) | |
| Net income attributable to the noncontrolling interests | — | | | — | | | — | | | (70) | | | — | | | (70) | |
| Net (loss) income attributable to Sinclair Broadcast Group | $ | (414) | | | $ | 245 | | | $ | 441 | | | $ | (612) | | | $ | (74) | | | $ | (414) | |
| Comprehensive (loss) income | $ | (414) | | | $ | 246 | | | $ | 441 | | | $ | (517) | | | $ | (74) | | | $ | (318) | |
CONDENSED CONSOLIDATED STATEMENT OF OPERATIONS AND COMPREHENSIVE INCOME
FOR THE YEAR ENDED DECEMBER 31, 2020
(In millions)
| | | | | | | | | | | | | | | | | | | | | | | | | | | | | | | | | | | |
| | Sinclair
Broadcast
Group, Inc. | | Sinclair
Television
Group, Inc. | | Guarantor
Subsidiaries
and KDSM,
LLC | | Non-
Guarantor
Subsidiaries | | Eliminations | | Sinclair
Consolidated |
| Net revenue | $ | — | | | $ | 100 | | | $ | 3,081 | | | $ | 2,946 | | | $ | (184) | | | $ | 5,943 | |
| | | | | | | | | | | |
| Media programming and production expenses | — | | | 3 | | | 1,284 | | | 1,519 | | | (71) | | | 2,735 | |
| Selling, general and administrative | 18 | | | 122 | | | 658 | | | 279 | | | (97) | | | 980 | |
| Impairment of goodwill and definite-lived intangible assets | — | | | — | | | — | | | 4,264 | | | — | | | 4,264 | |
| Depreciation, amortization and other operating expenses | 2 | | | 8 | | | 211 | | | 525 | | | (10) | | | 736 | |
| Total operating expenses | 20 | | | 133 | | | 2,153 | | | 6,587 | | | (178) | | | 8,715 | |
| | | | | | | | | | | |
| Operating (loss) income | (20) | | | (33) | | | 928 | | | (3,641) | | | (6) | | | (2,772) | |
| | | | | | | | | | | |
| Equity in (loss) earnings of consolidated subsidiaries | (2,409) | | | 877 | | | — | | | — | | | 1,532 | | | — | |
| Interest expense | (13) | | | (191) | | | (3) | | | (474) | | | 25 | | | (656) | |
| Other income (expense) | 27 | | | 4 | | | (41) | | | 303 | | | (14) | | | 279 | |
| Total other (expense) income, net | (2,395) | | | 690 | | | (44) | | | (171) | | | 1,543 | | | (377) | |
| | | | | | | | | | | |
| Income tax benefit | 1 | | | 51 | | | 3 | | | 665 | | | — | | | 720 | |
| Net (loss) income | (2,414) | | | 708 | | | 887 | | | (3,147) | | | 1,537 | | | (2,429) | |
| Net income attributable to the redeemable noncontrolling interests | — | | | — | | | — | | | (56) | | | — | | | (56) | |
| Net loss attributable to the noncontrolling interests | — | | | — | | | — | | | 71 | | | — | | | 71 | |
| Net (loss) income attributable to Sinclair Broadcast Group | $ | (2,414) | | | $ | 708 | | | $ | 887 | | | $ | (3,132) | | | $ | 1,537 | | | $ | (2,414) | |
| Comprehensive (loss) income | $ | (2,414) | | | $ | 707 | | | $ | 887 | | | $ | (3,154) | | | $ | 1,537 | | | $ | (2,437) | |
CONDENSED CONSOLIDATED STATEMENT OF OPERATIONS AND COMPREHENSIVE INCOME
FOR THE YEAR ENDED DECEMBER 31, 2019
| | | | | | | | | | | | | | | | | | | | | | | | | | | | | | | | | | | |
| | Sinclair
Broadcast
Group, Inc. | | Sinclair
Television
Group, Inc. | | Guarantor
Subsidiaries
and KDSM,
LLC | | Non-
Guarantor
Subsidiaries | | Eliminations | | Sinclair
Consolidated |
| Net revenue | $ | — | | | $ | 35 | | | $ | 2,841 | | | $ | 1,487 | | | $ | (123) | | | $ | 4,240 | |
| | | | | | | | | | | |
| Media programming and production expenses | — | | | — | | | 1,238 | | | 894 | | | (59) | | | 2,073 | |
| Selling, general and administrative | 147 | | | 147 | | | 663 | | | 202 | | | (40) | | | 1,119 | |
| Depreciation, amortization and other operating expenses | — | | | (20) | | | 278 | | | 334 | | | (14) | | | 578 | |
| Total operating expenses | 147 | | | 127 | | | 2,179 | | | 1,430 | | | (113) | | | 3,770 | |
| | | | | | | | | | | |
| Operating (loss) income | (147) | | | (92) | | | 662 | | | 57 | | | (10) | | | 470 | |
| | | | | | | | | | | |
| Equity in earnings of consolidated subsidiaries | 165 | | | 577 | | | — | | | — | | | (742) | | | — | |
| Interest expense | (5) | | | (216) | | | (4) | | | (216) | | | 19 | | | (422) | |
| Other income (expense) | 2 | | | (7) | | | (53) | | | 24 | | | (5) | | | (39) | |
| Total other income (expense), net | 162 | | | 354 | | | (57) | | | (192) | | | (728) | | | (461) | |
| | | | | | | | | | | |
| Income tax benefit (provision) | 32 | | | 66 | | | (21) | | | 19 | | | — | | | 96 | |
| Net income (loss) | 47 | | | 328 | | | 584 | | | (116) | | | (738) | | | 105 | |
| Net income attributable to redeemable noncontrolling interests | — | | | — | | | — | | | (48) | | | — | | | (48) | |
| Net income attributable to the noncontrolling interests | — | | | — | | | — | | | (10) | | | — | | | (10) | |
| Net income (loss) attributable to Sinclair Broadcast Group | $ | 47 | | | $ | 328 | | | $ | 584 | | | $ | (174) | | | $ | (738) | | | $ | 47 | |
| Comprehensive income (loss) | $ | 47 | | | $ | 327 | | | $ | 584 | | | $ | (116) | | | $ | (738) | | | $ | 104 | |
CONDENSED CONSOLIDATED STATEMENT OF CASH FLOWS
FOR THE YEAR ENDED DECEMBER 31, 2021
(In millions)
| | | | | | | | | | | | | | | | | | | | | | | | | | | | | | | | | | | |
| | Sinclair
Broadcast
Group, Inc. | | Sinclair
Television
Group, Inc. | | Guarantor
Subsidiaries
and KDSM,
LLC | | Non-
Guarantor
Subsidiaries | | Eliminations | | Sinclair
Consolidated |
| NET CASH FLOWS (USED IN) FROM OPERATING ACTIVITIES | $ | (5) | | | $ | (216) | | | $ | 583 | | | $ | (46) | | | $ | 11 | | | $ | 327 | |
| | | | | | | | | | | |
| CASH FLOWS USED IN INVESTING ACTIVITIES: | | | | | | | | | | | |
| Acquisition of property and equipment | — | | | (2) | | | (64) | | | (18) | | | 4 | | | (80) | |
| Acquisition of businesses, net of cash acquired | — | | | — | | | (4) | | | — | | | — | | | (4) | |
| | | | | | | | | | | |
| Proceeds from the sale of assets | — | | | — | | | 34 | | | 9 | | | — | | | 43 | |
| Purchases of investments | (9) | | | (9) | | | (46) | | | (192) | | | — | | | (256) | |
| | | | | | | | | | | |
| Spectrum repack reimbursements | — | | | — | | | 24 | | | — | | | — | | | 24 | |
| Other, net | (183) | | | — | | | (1) | | | 28 | | | 183 | | | 27 | |
| Net cash flows used in investing activities | (192) | | | (11) | | | (57) | | | (173) | | | 187 | | | (246) | |
| | | | | | | | | | | |
| CASH FLOWS FROM (USED IN) FINANCING ACTIVITIES: | | | | | | | | | | | |
| Proceeds from notes payable and commercial bank financing | — | | | 341 | | | — | | | 46 | | | (30) | | | 357 | |
| Repayments of notes payable, commercial bank financing and finance leases | — | | | (362) | | | (6) | | | (51) | | | (182) | | | (601) | |
| Dividends paid on Class A and Class B Common Stock | (60) | | | — | | | — | | | — | | | — | | | (60) | |
| | | | | | | | | | | |
| Repurchase of outstanding Class A Common Stock | (61) | | | — | | | — | | | — | | | — | | | (61) | |
| Dividends paid on redeemable subsidiary preferred equity | — | | | — | | | — | | | (5) | | | — | | | (5) | |
| | | | | | | | | | | |
| | | | | | | | | | | |
| Distributions to noncontrolling interests | — | | | — | | | — | | | (95) | | | — | | | (95) | |
| Distributions to redeemable noncontrolling interests | — | | | — | | | — | | | (6) | | | — | | | (6) | |
| Increase (decrease) in intercompany payables | 333 | | | 106 | | | (518) | | | 65 | | | 14 | | | — | |
| Other, net | (13) | | | — | | | — | | | (40) | | | — | | | (53) | |
| Net cash flows from (used in) financing activities | 199 | | | 85 | | | (524) | | | (86) | | | (198) | | | (524) | |
| | | | | | | | | | | |
| NET INCREASE (DECREASE) IN CASH, CASH EQUIVALENTS, AND RESTRICTED CASH | 2 | | | (142) | | | 2 | | | (305) | | | — | | | (443) | |
| CASH, CASH EQUIVALENTS, AND RESTRICTED CASH, beginning of period | — | | | 458 | | | — | | | 804 | | | — | | | 1,262 | |
| CASH, CASH EQUIVALENTS, AND RESTRICTED CASH, end of period | $ | 2 | | | $ | 316 | | | $ | 2 | | | $ | 499 | | | $ | — | | | $ | 819 | |
CONDENSED CONSOLIDATED STATEMENT OF CASH FLOWS
FOR THE YEAR ENDED DECEMBER 31, 2020
(In million)
| | | | | | | | | | | | | | | | | | | | | | | | | | | | | | | | | | | |
| | Sinclair
Broadcast
Group, Inc. | | Sinclair
Television
Group, Inc. | | Guarantor
Subsidiaries
and KDSM,
LLC | | Non-
Guarantor
Subsidiaries | | Eliminations | | Sinclair
Consolidated |
| NET CASH FLOWS (USED IN) FROM OPERATING ACTIVITIES | $ | (119) | | | $ | (75) | | | $ | 864 | | | $ | 875 | | | $ | 3 | | | $ | 1,548 | |
| | | | | | | | | | | |
| CASH FLOWS USED IN INVESTING ACTIVITIES: | | | | | | | | | | | |
| Acquisition of property and equipment | — | | | (8) | | | (130) | | | (26) | | | 7 | | | (157) | |
| Acquisition of businesses, net of cash acquired | — | | | — | | | (16) | | | — | | | — | | | (16) | |
| Proceeds from the sale of assets | — | | | — | | | 36 | | | — | | | — | | | 36 | |
| Purchases of investments | (43) | | | (8) | | | (43) | | | (45) | | | — | | | (139) | |
| | | | | | | | | | | |
| Spectrum repack reimbursements | — | | | — | | | 90 | | | — | | | — | | | 90 | |
| Other, net | 1 | | | — | | | (2) | | | 28 | | | — | | | 27 | |
| Net cash flows used in investing activities | (42) | | | (16) | | | (65) | | | (43) | | | 7 | | | (159) | |
| | | | | | | | | | | |
| CASH FLOWS FROM (USED IN) FINANCING ACTIVITIES: | | | | | | | | | | | |
| Proceeds from notes payable and commercial bank financing | — | | | 1,398 | | | — | | | 421 | | | — | | | 1,819 | |
| Repayments of notes payable, commercial bank financing and finance leases | — | | | (1,434) | | | (4) | | | (301) | | | — | | | (1,739) | |
| | | | | | | | | | | |
| Dividends paid on Class A and Class B Common Stock | (63) | | | — | | | — | | | — | | | — | | | (63) | |
| Repurchases of outstanding Class A Common Stock | (343) | | | — | | | — | | | — | | | — | | | (343) | |
| Dividends paid on redeemable subsidiary preferred equity | — | | | — | | | — | | | (36) | | | — | | | (36) | |
| Redemption of redeemable subsidiary preferred equity | — | | | — | | | — | | | (547) | | | — | | | (547) | |
| Debt issuance costs | — | | | (11) | | | — | | | (8) | | | — | | | (19) | |
| Distributions to noncontrolling interests | — | | | — | | | — | | | (32) | | | — | | | (32) | |
| Distributions to redeemable noncontrolling interests | — | | | — | | | — | | | (383) | | | — | | | (383) | |
| Increase (decrease) in intercompany payables | 565 | | | 239 | | | (798) | | | 4 | | | (10) | | | — | |
| Other, net | 2 | | | — | | | — | | | (119) | | | — | | | (117) | |
| Net cash flows from (used in) financing activities | 161 | | | 192 | | | (802) | | | (1,001) | | | (10) | | | (1,460) | |
| | | | | | | | | | | |
| NET INCREASE (DECREASE) IN CASH, CASH EQUIVALENTS, AND RESTRICTED CASH | — | | | 101 | | | (3) | | | (169) | | | — | | | (71) | |
| CASH, CASH EQUIVALENTS, AND RESTRICTED CASH, beginning of period | — | | | 357 | | | 3 | | | 973 | | | — | | | 1,333 | |
| CASH, CASH EQUIVALENTS, AND RESTRICTED CASH, end of period | $ | — | | | $ | 458 | | | $ | — | | | $ | 804 | | | $ | — | | | $ | 1,262 | |
CONDENSED CONSOLIDATED STATEMENT OF CASH FLOWS
FOR THE YEAR ENDED DECEMBER 31, 2019
(In millions)
| | | | | | | | | | | | | | | | | | | | | | | | | | | | | | | | | | | |
| Sinclair
Broadcast
Group, Inc. | | Sinclair
Television
Group, Inc. | | Guarantor
Subsidiaries
and KDSM,
LLC | | Non-
Guarantor
Subsidiaries | | Eliminations | | Sinclair
Consolidated |
| NET CASH FLOWS (USED IN) FROM OPERATING ACTIVITIES | $ | (5) | | | $ | (210) | | | $ | 734 | | | $ | 396 | | | $ | 1 | | | $ | 916 | |
| | | | | | | | | | | |
| CASH FLOWS USED IN INVESTING ACTIVITIES: | | | | | | | | | | | |
| Acquisition of property and equipment | — | | | (4) | | | (152) | | | (11) | | | 11 | | | (156) | |
| Acquisition of businesses, net of cash acquired | — | | | — | | | — | | | (8,999) | | | — | | | (8,999) | |
| Spectrum repack reimbursements | — | | | — | | | 62 | | | — | | | — | | | 62 | |
| Proceeds from the sale of assets | — | | | — | | | — | | | 8 | | | — | | | 8 | |
| Purchases of investments | (6) | | | (39) | | | (54) | | | (353) | | | — | | | (452) | |
| | | | | | | | | | | |
| Other, net | — | | | 3 | | | (1) | | | 5 | | | — | | | 7 | |
| Net cash flows used in investing activities | (6) | | | (40) | | | (145) | | | (9,350) | | | 11 | | | (9,530) | |
| | | | | | | | | | | |
| CASH FLOWS FROM (USED IN) FINANCING ACTIVITIES: | | | | | | | | | | | |
| Proceeds from notes payable and commercial bank financing | — | | | 1,793 | | | — | | | 8,163 | | | — | | | 9,956 | |
| Repayments of notes payable, commercial bank financing and finance leases | — | | | (1,213) | | | (4) | | | (19) | | | — | | | (1,236) | |
| Proceeds from the issuance of redeemable subsidiary preferred equity, net | — | | | — | | | — | | | 985 | | | — | | | 985 | |
| | | | | | | | | | | |
| Dividends paid on Class A and Class B Common Stock | (73) | | | — | | | — | | | — | | | — | | | (73) | |
| Dividends paid on redeemable subsidiary preferred equity | — | | | — | | | — | | | (33) | | | — | | | (33) | |
| Repurchase of outstanding Class A Common Stock | (145) | | | — | | | — | | | — | | | — | | | (145) | |
| Redemption of redeemable subsidiary preferred equity | — | | | — | | | — | | | (297) | | | — | | | (297) | |
| Debt issuance costs | — | | | (25) | | | — | | | (174) | | | — | | | (199) | |
| Distributions to noncontrolling interests | — | | | — | | | — | | | (27) | | | — | | | (27) | |
| Distributions to redeemable noncontrolling interests | — | | | — | | | — | | | (5) | | | — | | | (5) | |
| Increase (decrease) in intercompany payables | 227 | | | (905) | | | (601) | | | 1,291 | | | (12) | | | — | |
| Other, net | 2 | | | (5) | | | — | | | (36) | | | — | | | (39) | |
| Net cash flows from (used in) financing activities | 11 | | | (355) | | | (605) | | | 9,848 | | | (12) | | | 8,887 | |
| | | | | | | | | | | |
| NET (DECREASE) INCREASE IN CASH, CASH EQUIVALENTS, AND RESTRICTED CASH | — | | | (605) | | | (16) | | | 894 | | | — | | | 273 | |
| CASH, CASH EQUIVALENTS, AND RESTRICTED CASH, beginning of period | — | | | 962 | | | 19 | | | 79 | | | — | | | 1,060 | |
| CASH, CASH EQUIVALENTS, AND RESTRICTED CASH, end of period | $ | — | | | $ | 357 | | | $ | 3 | | | $ | 973 | | | $ | — | | | $ | 1,333 | |
20. SUBSEQUENT EVENTS:
On March 1, 2022, DSG consummated the following financing transactions (the “Transaction”):
•DSG First Lien Term Loan: $635 million of a newly funded first-priority lien term loan (the DSG First Lien Term Loan) pursuant to a new first-priority lien credit agreement (the DSG First Lien Credit Agreement), ranking first in lien priority on shared collateral ahead of (i) new second lien credit facilities issued in exchange for existing loans and/or commitments under the existing DSG Bank Credit Agreement, each of which will rank second in lien priority on shared collateral, (ii) 5.375% Second Lien Secured Notes due 2026 (the DSG 5.375% Second Lien Secured Notes) issued in exchange for the DSG 5.375% Secured Notes in an exchange offer, each of which will rank second in lien priority on shared collateral and (iii) loans and/or commitments under the DSG Bank Credit Agreement and DSG 5.375% Secured Notes that do not participate in or consent to the Transaction, each of which will rank third in lien priority on shared collateral.
•DSG First and Second Lien Credit Facilities and DSG 5.375% Second Lien Secured Notes: All lenders under the DSG Bank Credit Agreement that participates in the applicable Transaction and all holders of DSG 5.375% Secured Notes that participate in an exchange offer exchanged their applicable existing debt holdings for:
•In the case of existing term loans under the DSG Bank Credit Agreement, new second-priority lien term loans (the DSG Second Lien Term Loan), with the same or substantially the same maturity, pricing and other economic terms as the existing term loans under the DSG Bank Credit Agreement, but with more restrictive covenants and other terms substantially consistent with the DSG First Lien Term Loan, at an exchange rate of $100 of DSG Second Lien Term Loans for each $100 of existing term loans under the DSG Bank Credit Agreement.
•In the case of the existing DSG Revolving Credit Facility, a new second-priority lien revolving credit facility (the DSG Second Lien Revolving Credit Facility, together with the DSG Second Lien Term Loan, the DSG Second Lien Credit Facilities, and together with the DSG First Lien Term Loan, the DSG First and Second Lien Credit Facilities) with more restrictive covenants and other terms as compared with the existing DSG Revolving Credit Facility, which terms are substantially consistent with the DSG Second Lien Term Loan other than an extended term to May 2026, and were exchanged into the DSG Second Lien Revolving Credit Facility for a principal amount equal to 35.0% of such lender’s total revolving commitments existing under the existing DSG Revolving Credit Facility. The DSG Second Lien Credit Facilities were issued pursuant to a new second-priority lien credit agreement (the “DSG Second Lien Credit Agreement,” and together with the DSG First Lien Credit Agreement, the “DSG First and Second Lien Credit Agreements”). The DSG First and Second Lien Credit Agreements and the existing DSG Bank Credit Agreement are collectively referred to as the DSG Credit Agreements.
•In the case of the DSG 5.375% Secured Notes, the DSG 5.375% Second Lien Secured Notes.
•Non-Participating Lenders under the DSG Bank Credit Agreement and DSG 5.375% Secured Notes: All loans under the DSG Bank Credit Agreement that did not participate in the Transaction (the "DSG Third Lien Term Loan") and all DSG 5.375% Secured Notes that did not participate in an exchange offer rank third in lien priority on shared collateral behind each of the DSG First and Second Lien Credit Facilities and the DSG 5.375% Second Lien Secured Notes, and certain of the covenants, events of default and related definitions in the DSG Bank Credit Agreement and the indenture governing the DSG 5.375% Secured Notes were eliminated in a manner customary for covenant strips as part of exit consents for transactions of this type.
•Redemption of DSG 12.750% Secured Notes. DSG redeemed the 12.750% Secured Notes and satisfied and discharged the indenture governing the DSG 12.750% Secured Notes. The redemption price was equal to the sum of 100% of the principal amount of the DSG 12.750% Notes outstanding plus the Applicable Premium (as defined in the indenture governing the DSG 12.750% Secured Notes), together with accrued and unpaid interest on the principal amount being redeemed up to, but not including, March 2, 2022.
Immediately following the Transactions, DSG had $3,036 million of DSG 5.375% Second Lien Notes outstanding, $14 million of DSG 5.375% Secured Notes outstanding, $635 million outstanding under the DSG First Lien Term Loan, $3,449 million outstanding under the DSG Second Lien Term Loan, and $4 million outstanding under the DSG Third Lien Term Loan. In addition, we had $227.5 million of availability under the DSG Second Lien Revolving Credit Facility.
Borrowings under the DSG First and Second Lien Credit Facilities bear interest, at a rate per annum equal to an applicable margin of 7.00% in the case of base rate DSG First Lien Term Loan borrowings or 8.00%, plus customary credit spread adjustments in the case of Term SOFR rate DSG First Lien Term Loan borrowings; at a rate per annum equal to an applicable margin of 2.25% in the case of base rate DSG Second Lien Term Loan borrowings or 3.25% plus customary credit spread adjustments in the case of Term SOFR rate DSG Second Lien Term Loan borrowings; and 2.00% in the case of base rate DSG Second Lien Revolving Credit Facility borrowings or 3.00% plus customary credit spread adjustments in the case of Term SOFR rate DSG Second Lien Revolving Credit Facility borrowings, and, in the case of the DSG Second Lien Revolving Credit Facility, subject to decrease if the specified second lien net leverage ratio is less than or equal to certain levels, in each such case over either, at our option, (a) a base rate determined by reference to the highest of (1) the “Prime Rate” last quoted by The Wall Street Journal as the “Prime Rate” in the U.S. or, if The Wall Street Journal ceases to quote such rate, the highest per annum interest rate published by the Federal Reserve Board in Federal Reserve Statistical Release H.15 (519) (Selected Interest Rates) as the “bank prime loan” rate or, if such rate is no longer quoted therein, any similar rate quoted therein (as determined by the Administrative Agent) or any similar release by the Federal Reserve Board (as determined by the Administrative Agent), (2) the federal funds effective rate plus ½ of 1% and (3) the Term SOFR (or successor) rate for a one month interest period (including the applicable credit spread adjustment) plus 1.00% or (b) the Term SOFR rate determined by reference to the interest period relevant to such borrowing, subject to a 0% interest rate floor.
The DSG First and Second Lien Credit Agreements contain customary mandatory prepayment requirements, including with respect to excess cash flow, asset sale proceeds and proceeds from certain incurrences of indebtedness. DSG may voluntarily repay outstanding loans under the DSG First Lien Term Loan at a prepayment price equal to 100% of the principal amount of the DSG First Lien Term Loan being prepaid plus accrued and unpaid interest, if any, to the prepayment date plus (i) prior to the third anniversary of the closing date of DSG First Lien Term Loan, a make-whole premium (to be defined based on the net present value, calculated on the basis of a treasury rate + 50 basis points, of the interest payments that would have otherwise been paid up to such third anniversary date) plus a prepayment charge equal to 7.0% of the principal amount so prepaid, (ii) 7.0% of the amount so prepaid, if such prepayment occurs on or after the third anniversary of the closing date of the DSG First Lien Term Loan but prior to the date that is one year prior to the maturity date of the DSG First Lien Term Loan, and (iii) 0.0%, if such prepayment occurs on or after the date that is one year prior to the maturity date of the DSG First Lien Term Loan, and in each case subject to customary breakage costs with respect to Term SOFR rate loans. DSG may voluntarily repay outstanding loans under the DSG Second Lien Credit Facilities at any time without premium or penalty, other than customary breakage costs with respect to Term SOFR (or successor) loans.
The DSG First Lien Term Loan and the DSG Second Lien Term Loan both amortize in equal quarterly installments in an aggregate annual amount equal to 1.00% of the original principal amount of such term loans (commencing with the first full fiscal quarter after the closing date thereof), with the balance being payable on the respective maturity date of such term loans.
All obligations under the DSG First Lien Term Loan are secured, subject to permitted liens and other customary exceptions, by: (i) a perfected first priority pledge of (a) all the equity interests of DSG and each wholly owned restricted subsidiary of Holdings that is directly held by Holdings, DSG or a subsidiary guarantor, (b) subject to certain exceptions, the equity held by such entities in non-wholly owned restricted subsidiaries and (c) in certain limited circumstances, the equity held by such entities in non-subsidiary joint ventures and (ii) perfected first priority security interests in substantially all tangible and intangible personal property of Holdings and the subsidiary guarantors.
All obligations under the DSG Second Lien Credit Facilities (including with respect to certain cash management services provided by lenders or agents thereunder or affiliates thereof) are secured, subject to permitted liens and other customary exceptions, by: (i) a perfected second priority pledge of (a) all the equity interests of DSG and each wholly owned restricted subsidiary of Holdings that is directly held by Holdings, DSG or a subsidiary guarantor, (b) subject to certain exceptions, the equity held by such entities in non-wholly owned restricted subsidiaries and (c) in certain limited circumstances, the equity held by such entities in non-subsidiary joint ventures and (ii) perfected second priority security interests in substantially all tangible and intangible personal property of Holdings and the subsidiary guarantors.
The DSG First and Second Lien Credit Facilities are jointly and severally guaranteed by the guarantors party thereto, which currently includes Holdings and each of its wholly owned direct or indirect domestic subsidiaries. The DSG First and Second Lien Credit Facilities contain affirmative covenants including, among others: delivery of annual audited and quarterly unaudited financial statements; delivery of notices of defaults, material litigation and material ERISA events; submission to certain inspections; maintenance of property and customary insurance; payment of taxes; compliance with laws and regulations; a requirement that the DTC application and intellectual property developed as part of or derived from the DTC application shall be developed at and at all times be and remain owned by Holdings, DSG or guarantors and a requirement to maintain an independent board of DSG (including the selection solely by the required lenders under the DSG First Lien Term Loan of two of the independent board members). The DSG First and Second Lien Credit Facilities also contain negative covenants that, subject to certain exceptions, qualifications and “baskets,” generally limit the ability of (i) Holdings, DSG and its restricted subsidiaries to incur debt, create liens, make fundamental changes, enter into asset sales, make certain investments, pay dividends or distribute or redeem certain equity interests, prepay or redeem certain debt, enter into certain transactions with affiliates, amend the Management Agreement with Sinclair Television Group, Inc., transfer certain assets to or engage in certain types of transactions with unrestricted subsidiaries or other non-guarantor subsidiaries, transfer content rights, the DTC application and related intellectual property other than to Holdings, DSG and the guarantors, and forming and transferring assets to joint ventures and (ii) unrestricted subsidiaries to own or hold assets or engage in certain types of transactions as well as customary events of default, including relating to a change of control. The DSG First and Second Lien Credit Facilities also contain customary events of default, including relating to a change of control. If an event of default occurs, the lenders under the DSG First and Second Lien Credit Agreements will be entitled to take various actions, including the acceleration of amounts due under the DSG First and Second Lien Credit Agreements and all actions permitted to be taken by secured creditors under applicable law.
QUARTERLY FINANCIAL INFORMATION (UNAUDITED):
(In millions, except per share data)
| | | | | | | | | | | | | | | | | | | | | | | |
| | For the Quarter Ended |
| | 3/31/2021 | | 6/30/2021 | | 9/30/2021 | | 12/31/21 |
| Total revenues | $ | 1,511 | | | $ | 1,612 | | | $ | 1,535 | | | $ | 1,476 | |
| Operating income (loss) | $ | 35 | | | $ | (178) | | | $ | 73 | | | $ | 165 | |
| Net income (loss) | $ | 26 | | | $ | (328) | | | $ | 17 | | | $ | (41) | |
| Net (loss) income attributable to Sinclair Broadcast Group | $ | (12) | | | $ | (332) | | | $ | 19 | | | $ | (89) | |
| Basic (loss) earnings per common share | $ | (0.16) | | | $ | (4.41) | | | $ | 0.25 | | | $ | (1.18) | |
| Diluted (loss) earnings per common share | $ | (0.16) | | | $ | (4.41) | | | $ | 0.25 | | | $ | (1.18) | |
| | | | | | | | | | | | | | | | | | | | | | | |
| | For the Quarter Ended |
| | 3/31/2020 | | 6/30/2020 | | 9/30/2020 | | 12/31/20 |
| Total revenues | $ | 1,609 | | | $ | 1,283 | | | $ | 1,539 | | | $ | 1,512 | |
| Operating income (loss) | $ | 327 | | | $ | 492 | | | $ | (4,216) | | | $ | 625 | |
| Net income (loss) | $ | 151 | | | $ | 273 | | | $ | (3,367) | | | $ | 514 | |
| Net income (loss) attributable to Sinclair Broadcast Group | $ | 123 | | | $ | 252 | | | $ | (3,256) | | | $ | 467 | |
| Basic earnings (loss) per common share | $ | 1.36 | | | $ | 3.13 | | | $ | (43.53) | | | $ | 6.32 | |
| Diluted earnings (loss) per common share | $ | 1.35 | | | $ | 3.12 | | | $ | (43.53) | | | $ | 6.27 | |