EXHIBIT 99.2
| ¢ |
TABLE OF CONTENTS |
|||||||
| About CMHC |
2 | |||||||
| Messages from the Chairperson and the President |
3 | |||||||
| A Solid Foundation for Generations – In Their Own Words |
11 | |||||||
| ¢ |
CORPORATE GOVERNANCE |
21 | ||||||
| ¢ |
CORPORATE RESPONSIBILITY |
25 | ||||||
| ¢ |
MANAGEMENT’S DISCUSSION AND ANALYSIS |
35 | ||||||
| ¡ |
The Operating Environment in 2011 and Outlook for 2012 |
37 | ||||||
| ¡ |
Summary of Financial Results |
40 | ||||||
| ¡ |
Performance by Objective |
47 | ||||||
| ¡ |
Risk Management |
78 | ||||||
| ¡ |
Managing Human Resources and Internal Services – A Solid Organizational Foundation |
88 | ||||||
| ¡ |
2007 to 2012 Financial Highlights |
92 | ||||||
| ¢ |
CONSOLIDATED FINANCIAL STATEMENTS |
93 | ||||||
| ¢ |
OTHER INFORMATION |
159 | ||||||
| ¡ |
CMHC Board of Directors – Compensation, Attendance Record and Biographies |
160 | ||||||
| ¡ |
CMHC Management |
163 | ||||||
| ¡ |
CMHC Offices |
164 | ||||||
| ¡ |
Glossary |
165 | ||||||
| ¡ |
Definition of Select CMHC Performance Measures |
169 | ||||||
| ¡ |
Expected Outcomes and Indicators |
171 | ||||||
For a list of acronyms used throughout this document, see Glossary.


| ¢ | ABOUT CMHC | |||
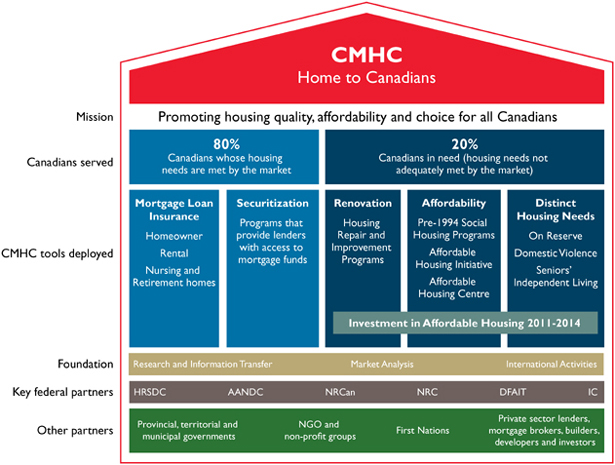
| OUR MISSION |
||||
| Promoting housing quality, affordability and choice for all Canadians | ||||
| OUR TOOLS |
||||
| CMHC has provided A Solid Foundation for Generations of Canadians. Our programs, products and services help Canadians with a wide range of housing needs as illustrated in the following diagram: | ||||
2 C A N A D A M O R T G A G E A N D H O U S I N G C O R P O R A T I O N


| A SOLID FOUNDATION FOR OUR VETERANS |
12 | |||
| A SOLID FOUNDATION FOR OUR SENIORS |
14 | |||
| A SOLID FOUNDATION FOR THE BABY BOOM GENERATION |
16 | |||
| A SOLID FOUNDATION FOR YOUNGER ADULTS AND THE NEXT GENERATION |
18 | |||
11

12


14 C A N A D A M O R T G A G E A N D H O U S I N G C O R P O R A T I O N


“Due to circumstances beyond my control, I found myself living in an apartment above a restaurant. It was just deplorable. I became so emotionally upset that I ended up in hospital. I was ecstatic when I moved in. It’s nice having a place to call my own, and I take pride in it. It’s beautiful, clean, quiet, safe and secure. With each passing day, I see great improvements in myself.”
Doug McConoughy, resident of Luther Place Apartments in Fredericton, New Brunswick, which was developed under the Affordable Housing Initiative


“The rent here is great. It’s an opportunity for me to save more money. My goal is to buy my own house.”
Sondra Austin, resident of Women Building Futures in Calgary developed under the Affordable Housing Initiative

20 C A N A D A M O R T G A G E A N D H O U S I N G C O R P O R A T I O N

CORPORATE STRUCTURE
CMHC is governed by a Board of Directors appointed by the Government of Canada and reports to Parliament through the Minister of Human Resources and Skills Development. CMHC Management is comprised of the President and Chief Executive Officer, heads of business areas and support functions and regional business centre General Managers. We have a workforce of approximately 2,000 employees. Our national office is located in Ottawa and our regional business centres are in Halifax, Montréal, Toronto, Calgary and Vancouver. Several smaller and rural communities are served by CMHC employees who live in these communities.
CMHC provides management, advisory and other services to the Canada Housing Trust and to the First Nations Market Housing Fund. It also manages and administers Granville Island, on behalf of the Government of Canada. Only the financial results of the Canada Housing Trust are consolidated with CMHC’s financial statements. (See Glossary for further information on these organizations.)
21
BOARD OF DIRECTORS AND ITS COMMITTEES
The legislative framework governing CMHC consists primarily of the Canada Mortgage and Housing Act (CMHC Act), the National Housing Act (NHA) and the Financial Administration Act (FAA). Pursuant to the CMHC Act, the stewardship of the Corporation is the responsibility of the Board of Directors which is comprised of the Chairperson, the President and Chief Executive Officer and eight other directors. The Chairperson and the President and Chief Executive Officer are appointed by the Governor in Council. The eight other directors are appointed by the Minister designated for the purposes of the CMHC Act and the NHA (the Minister for CMHC) with Governor in Council approval. With the exception of the President and Chief Executive Officer, all members of the Board are independent of CMHC Management. The Board of Directors meets a minimum of five times per year (at least two of these meetings are held in locations outside of Ottawa).
The Governance and Nominating Committee, the Audit Committee and the Human Resources Committee support the Board of Directors in carrying out its stewardship of CMHC. These committees examine matters in their respective areas that come
before the Board of Directors for consideration. Their terms of reference are posted on CMHC’s website at www.cmhc.ca and are reviewed on a regular basis by the Board to ensure that these committees continue to carry out their responsibilities effectively.
To gain regional perspective, the Board holds two of its regularly scheduled meetings outside the National Capital Region. These meetings are an opportunity for Board members to visit housing projects and to discuss housing issues with local stakeholders. This year, while in Winnipeg in May, the Board met with
| non-profit housing associations, lenders, home builders, public housing officials and Aboriginal community representatives. In August, the Board visited a number of unique housing developments in the Victoria area, including a project that CMHC’s Seed Funding helped to get off the ground. The project involved the conversion of office space into housing for homeless men and women. |
|


22

ANNUAL PUBLIC MEETINGS
In conjunction with the Board of Directors meeting in Victoria, CMHC held its third Annual Public Meeting on August 23, 2011. CMHC’s Annual Public Meeting provides an opportunity for the general public to learn about CMHC’s achievements and to raise questions or concerns. Presentations by the Chairperson and the President and Chief Executive Officer provided an overview of CMHC’s mandate and highlighted the Corporation’s results and accomplishments.
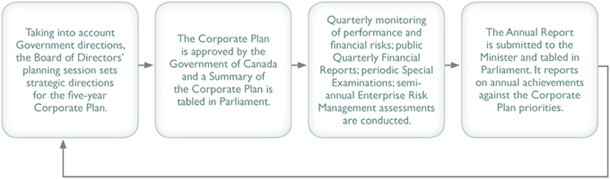
CORPORATE PLANNING AND REPORTING
Each year, as required by the FAA, CMHC submits a five-year corporate plan to its Minister for approval by the Government of Canada. The corporate plan is the centrepiece of the accountability regime for Crown corporations and encompasses all of CMHC’s activities, budgets and resource requirements.
The development of the Plan begins with a thorough examination of both the internal and external operating environments for the Corporation. This examination is the focus of the yearly planning session
where the Board of Directors assesses their implications for CMHC and develops the key strategic directions for the Corporation. External speakers provide perspectives on the economy and other issues at the planning session.
The Canadian and global economies were the focus for the Board at its planning session in March. The Board reaffirmed the Corporation’s three objectives and seven strategic priorities including directions in CMHC’s assisted housing, housing finance, research and information transfer, and international activities. It also provided direction on key initiatives that the Corporation would undertake in 2012 to address emerging issues. The Board submitted the 2012-2016 Corporate Plan to the Minister for CMHC in the fall and it was approved by the Government of Canada in December 2011.
On a quarterly basis, the Board reviews performance against plans prepared by CMHC Management and makes adjustments as required. The Board also reviews quarterly financial and risk management reports and semi-annual enterprise risk management reports.
In 2011, CMHC began publishing a quarterly financial report pursuant to new provisions in the FAA.

23
ASSESSING BOARD
PERFORMANCE
Conducting regular assessments of the Board’s performance and effectiveness is integral to best governance practices. Two types of assessments may be undertaken—a peer assessment, which involves Board members assessing and providing feedback on each other’s contributions, and an overall Board assessment, which examines the effectiveness of the Board in comparison to corporate governance elsewhere in the public sector.
In 2011, CMHC’s Board of Directors engaged an external consultant to assist in the coordination of a peer assessment for the preceding year. The results of the assessment indicated that CMHC has a solid Board with different, diverse backgrounds; that members demonstrate high levels of integrity and commitment, and are effective and cohesive. The assessment also noted that the Board committees and governance structure/process are working well. Finally, the assessment indicated that the Board is operating at a strategic level, has the information it needs to discharge its responsibilities, and enjoys a strong working relationship with CMHC Management.
An overall Board assessment will be undertaken in 2012.
BOARD COMPENSATION AND ATTENDANCE RECORD
Compensation paid to directors is set by Order in Council. The Chairperson and directors receive an annual retainer for their services to CMHC plus a fixed per diem for travel time, attending committee and Board meetings and other responsibilities as they arise. Meeting facilities can accommodate members who wish to participate through teleconference or videoconference. (See Other Information for Compensation and Attendance Record for each Board member.)
CMHC PENSION FUND
CMHC offers employees a defined-benefit pension plan as part of a competitive total compensation package. Established by the CMHC Board of Directors pursuant to the CMHC Act, the CMHC Pension Fund is managed and administered by Trustees through a Trust Agreement. The Trustees are responsible for setting investment objectives and policies, periodically reviewing the strategic asset allocation and monitoring investment results. The outcomes of Trustees’ meetings are regularly reported to the Board. The Board also receives an annual report on the Trustees’ activities and decisions, and the performance of the Fund.
24 C A N A D A M O R T G A G E A N D H O U S I N G C O R P O R A T I O N

Housing is our Business.
Making a difference in the lives of Canadians is what we do every day in every part of the country and housing has been our focus for more than 65 years.
Our employees are the foundation of our organization. We create a respectful, inclusive and supportive work environment where our employees are valued and encouraged to reach their full potential.
Our activities, including assisted housing programs, mortgage loan insurance, securitization, research and information transfer and programs to assist Canadian housing exporters, are our building blocks. We strive to perform these activities in a manner that maximizes our economic and social contributions and minimizes our environmental impacts.
Our governance structure provides the roof and ensures that we perform in a responsible, ethical and efficient manner.
25
INSIDE CMHC’S HOUSE
CMHC’s governance practices, activities and employees support its social, environmental and economic contributions on a daily basis.

26 C A N A D A M O R T G A G E A N D H O U S I N G C O R P O R A T I O N

RESPONSIBLE GOVERNANCE
Ethical business conduct
CMHC promotes a culture of ethical business conduct that is reinforced by a number of policies and guidelines. Among these are:
Our Values in Action is a statement and definition of CMHC’s corporate values, together with related behavioural standards which are expected to be upheld by Board members and all CMHC employees.

The Conflict of Interest Policy sets out CMHC’s requirements with respect to the avoidance and, where necessary, disclosure of real, apparent or potential conflicts of interest, together with a process for discussing and disclosing such conflicts of interest. This policy applies to Board members and all employees. CMHC Board members are also subject to federal conflict of interest legislation. All new employees are required to file a Conflict of Interest declaration within 60 days of their start date and at least annually thereafter or whenever there is a material change in circumstances. Certain CMHC employees are also subject to personal trading guidelines which impose trading restrictions on those who acquire, in the course of their official duties, information that is generally not available to the public.
The Disclosure of Wrongdoing in the Workplace Policy defines wrongdoing, articulates the role and responsibilities of CMHC’s Senior Officer for Disclosure and establishes a process for reporting wrongdoing in the workplace. No cases of wrongdoing in the workplace were reported to the Senior Officer for Disclosure in 2011.
All employees are required to attend an Ethics Awareness Session within the first 6 to 18 months of their start date. These sessions provide new hires with information and orientation on acceptable behaviours related to Our Values in Action, CMHC’s Conflict of Interest and Disclosure of Wrongdoing in the Workplace policies. These sessions include case studies to help employees better understand how the values and principles may apply in different situations and assist them when faced with an ethical question.

27
SOCIAL CONTRIBUTIONS
Strengthening communities
CMHC contributes to development of communities through programs administered on behalf of the Government of Canada as well as through our housing finance activities.
CMHC and its employees are committed to their communities through both Corporate and individual support of charitable organizations.
2011 Charitable Campaigns
CMHC employees have a longstanding reputation of supporting charities and volunteering in the community. Charitable activities draw on employees’ sense of community, their generosity of spirit, and their desire to reach out to those in need. The 2011 United Way Workplace Charitable Campaign is one example of how CMHC employees are actively donating to help others in Canada. During the past year, over 100 charitable activities organized across Canada by CMHC or by CMHC employees on their own raised over $500,000 in support of more than 40 different United Way partner organizations.
Habitat for Humanity Canada
CMHC and Habitat for Humanity have a long history of working together. The reason is simple: both organizations are motivated by the same basic belief that housing is fundamental to a good quality of life. CMHC is a Gold sponsor of this internationally renowned organization and the founding national sponsor of the Habitat for Humanity Aboriginal Housing Program which helps make the Habitat homeownership model available to more Aboriginal people.
CMHC’s collaboration on the Habitat for Humanity Aboriginal Housing Program has enabled more Aboriginal families to realize their dream of homeownership. To date, 35 Aboriginal families have moved into their Habitat homes and it is envisioned that many more will benefit from this program in the coming years.
28 C A N A D A M O R T G A G E A N D H O U S I N G C O R P O R A T I O N
Helping Canadians make informed and responsible financial decisions
Buying a house is one of the most important financial decisions that many Canadians make in their lifetime. As Canada’s national housing agency, CMHC recognizes its role in supporting Canadians throughout this sometimes complicated process.
For more than 65 years, CMHC has shared a wealth of knowledge and housing expertise in the form of useful tools and resources to help Canadians enjoy an informed and positive housing experience. Whether it be renting, buying, renovating or maintaining a home, CMHC is committed to supporting Canadians throughout their decision-making process and offers a variety of publications and online tools that support them in making informed and responsible housing decisions.
Over the past year, CMHC has renewed its focus in supporting financial literacy with respect to housing in Canada. CMHC is continuing its leadership role in building Canadians’ financial literacy through online resources and products provided to mortgage professionals so that they are in a better position to advise their clients on housing finance decisions.

ENVIRONMENTAL
CONTRIBUTIONS
EQuilibrium™ initiatives
CMHC’s EQuilibrium™ initiative showcases ways to reduce the environmental impact of housing and the benefits of sustainable community designs and technologies. Under this initiative:
| ¡ | 11 EQuilibrium™ demonstration homes have been opened for public viewing. Echo Haven in Calgary, Urban Ecology in Winnipeg, Abondance Montréal: le Soleil in Verdun, and Green Dream Home in Kamloops successfully completed their public demonstration phases in 2011. |
| ¡ | 4 EQuilibrium™ Communities initiatives have been announced. Projects under the EQuilibrium™ Communities Initiative, which seeks to demonstrate and accelerate the adoption of sustainable approaches to neighbourhood design, are also well underway in Toronto’s Regent Park revitalization project – Phase I, in the Ty-Histanis neighbourhood development project in Tofino, British Columbia, and at the Ampersand project in Ottawa. |
“Working with CMHC on the EQuilibrium™ housing initiative has helped Minto push the envelope on net zero energy homes through the Inspiration Home demonstration. Building on that experience, in the Ampersand neighbourhood, Minto is using EQuilibrium™ Communities funding to analyze options to integrate leading-edge energy and water-efficiency options into a vibrant, mixed-use, walk/transit-friendly neighbourhood.”
– Robert Smith, Director,
Innovation, The Minto Group
29
CMHC Green Home
The CMHC Green Home mortgage loan insurance product offers borrowers affordable options when purchasing an energy-efficient home or making energy-efficient improvements. Since its inception in 2004, CMHC Green Home has provided $6.6 million in premium rebates to more than 4,800 households choosing to purchase an environmentally-friendly home or make energy-efficient renovations.
Reducing CMHC’s footprint
For many years, CMHC has demonstrated its commitment to environmental stewardship in its internal operations with the creation of local green teams to promote environmentally responsible behaviour by employees in their day-to-day business activities. Some of these activities include participating in local environmental/commuter challenges, encouraging the use of public transit, bike share programs, and eliminating the use of plastics. Regional newsletters also serve to keep staff informed on initiatives that help reduce CMHC’s footprint.
To improve and better coordinate its history of environmentally friendly practices, CMHC adopted a comprehensive corporate-wide sustainable operations strategy in 2011 that is aligned with the Federal Sustainable Development Strategy. CMHC’s strategy is to establish targets, measure progress, and report on achievements that reduce its environmental footprint from internal operations. A National Green Team is in place to make recommendations to CMHC Management.
CMHC’s Environmental Footprint Internal Operations1
| 2010 Actual |
2011 Actual |
20122 Target |
Forecast improvement 2012 over 2011(%) | |||||
|
Paper consumption (total sheets) |
19,209,019 | 17,621,500 | 15,350,000 | 12.9 | ||||
|
Paper recycled (metric tonnes) |
109.18 | 110.77 | 135.54 | 22.4 | ||||
|
Electricity consumption (kWh) |
10,095,491 | 10,006,514 | 8,817,711 | 11.8 | ||||
|
Natural gas consumption (m3) |
380,586 | 433,339 | 474,724 | (9.5) | ||||
|
Building water consumption (m3) |
32,093 | 34,580 | 21,569 | 37.6 | ||||
|
Reduction in CO2 emissions from energy management program |
N/A | N/A | 221,051 | N/A |
| 1 | Reporting is for facilities where CMHC is responsible for environmental services and utility consumption. |
| 2 | The increase in natural gas consumption is a result of converting from electricity to natural gas to realize longer-term efficiencies. |
30 C A N A D A M O R T G A G E A N D H O U S I N G C O R P O R A T I O N
Granville Island environmental program
Granville Island, which is managed by CMHC on behalf of the Government of Canada, is very proud to have put in place in 2011 a new waste management program to support the City of Vancouver’s plan to become the greenest city in the world. Vancouver’s program includes a target of diverting 70% of waste from the landfill by 2015 and significant actions have been undertaken in Granville Island to achieve or exceed this ambitious objective. Specifically, CMHC’s commitment to managing Granville Island in a sustainable manner has led to:
| ¡ | the expansion of the organics recycling program in the Granville Island public market |
| ¡ | the expansion of recycling programs to include metals and used oils, including cooking oils and batteries |
| ¡ | the installation of smart meters to enable tenants to determine consumption patterns |
| ¡ | the facilitation of the installation of electric vehicle charging stations and car-sharing services. |
ECONOMIC CONTRIBUTIONS
Housing-related spending in 2011 accounted for one- fifth of total economic activity or GDP in Canada, with a contribution of over $346 billlion. Construction played an important role in energizing Canada’s labour market: 37,500 new positions were created in construction in 2011, accounting for 19% of job growth.
As the public mortgage loan insurer with a large percentage of the market, CMHC is able to positively influence the functioning of the residential mortgage market by implementing stringent underwriting standards and promoting consistency, quality assurance, fairness and due diligence across the lending industry. CMHC manages its capital to ensure that the Corporation is able to withstand adverse economic conditions and maintain its financial strength.
CMHC’s securitization activities also contribute to the health and stability of Canada’s housing finance system by ensuring that lenders have access to an adequate supply of low-cost funds for residential mortgages. By encouraging competition amongst lenders, the marketplace and all Canadians benefit.
CMHC mortgage loan insurance and securitization businesses adhere to sound business practices that ensure commercial viability without having to rely on the Government of Canada for support, even in less favourable economic times. In fact, over the past decade, CMHC has contributed over $16 billion to improving Canada’s fiscal position.
CMHC also promotes Canada’s housing products and system globally. Working with some 175 exporters, more than $138 million in export sales were facilitated by CMHC in 2011, generating or maintaining 1,526 jobs1 for Canadians and diversifying markets for local industries.
1 Industry Canada estimates that for every $90,900 in exports, one job is created or maintained.
31
EMPLOYEES AND WORKPLACE COMMUNITY
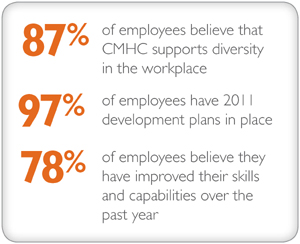
CMHC is an inclusive and respectful workplace that offers an opportunity to learn, develop and have a meaningful and rewarding career. For the third year in a row, in 2011, CMHC was selected as one of the Best Diversity Employers in Canada.
This award recognizes CMHC’s strong commitment to diversity. This is demonstrated through a number of initiatives, including strategies to enhance the recruitment and retention of Aboriginal peoples and persons with disabilities, a program for employees with special needs, and national and regional employee diversity committees.
CMHC recognizes employees who put their values in action. In fact, an employee engagement survey showed that 92% supported CMHC values in 2011. Valuing and respecting employees is a cornerstone of CMHC’s workplace community and a driving force behind our employee recognition program Thanks to You

introduced in 2011 to give employees a means to recognize and celebrate colleagues who demonstrate our corporate values through their actions.
Learning and development contributes to CMHC’s appealing corporate culture and engaged workforce. CMHC offers employees a variety of opportunities for professional and personal growth, including special assignments, in house and online training, as well as the opportunity to get involved in groups such as the President’s Advisory Council or diversity committees. Funds are allocated for continuous learning and

32 C A N A D A M O R T G A G E A N D H O U S I N G C O R P O R A T I O N
| employees are encouraged to identify training requirements in their development plans and | to use their active living subsidy and a new service provider for its longstanding Employee |
| discuss them with their managers.
The President’s Advisory Council and the employee engagement survey are vehicles for employees to provide input.
CMHC offers comprehensive services and tools to ensure employee wellness. In 2011, the Corporation introduced additional flexibilities for employees |
|
Assistance Program in order to enhance services for employees and their families.
Like many organizations, in response to demographic trends, CMHC has been renewing its workforce to ensure it has the talent needed to carry out its mandate. The testimonials below speak to our success in attracting and retaining a strong workforce. |

|
SIMON LAHOUD SENIOR ANALYST, BUSINESS SERVICE, QUEBEC BUSINESS SERVICE CENTRE
“My nine plus years at CMHC are marked with numerous accomplishments in fulfilling roles across multiple business lines (Policy & Research, Insurance, Affordable Housing), and continuing education such as my CFA designation. I am proud to be part of CMHC’s diverse workplace which promotes personal and professional growth, and allows employees to gain a wealth of knowledge and experience all under one roof.” |
33

|
FRANCESCA BUCCIARELLI SECTOR MANAGER, INFORMATION TECHNOLOGY
“I am thrilled to be able to participate in exciting new initiatives at CMHC such as delivering mobile applications, using social media technology to help our business and bringing in students to help CMHC while contributing to their work experience. These are just a few examples of many at CMHC that help create a dynamic, diverse and excellent work environment.”
STEPHANIE SPENCE MULTIPLE UNDERWRITER, ONTARIO MULTIPLES UNDERWRITING CENTRE
“Since coming to CMHC as a recent graduate in 2002, I have worked in Human Resources, Finance and Aboriginal Housing. The skills I learned allowed me to find positions in Community Development, in Aboriginal Housing and now, in Multiple Underwriting. CMHC encourages education and has helped me achieve my CRF designation and work towards my CGA. Hiring new graduates brings fresh perspectives, energy and enthusiasm to the organization which I hope is reflected in the job I do every day.” |
34 C A N A D A M O R T G A G E A N D H O U S I N G C O R P O R A T I O N

| THE OPERATING ENVIRONMENT IN 2011 AND OUTLOOK FOR 2012 |
37 | |||
| SUMMARY OF FINANCIAL RESULTS |
40 | |||
| PERFORMANCE BY OBJECTIVE |
47 | |||
| n Objective 1 – Help Canadians in need |
49 | |||
| ¡ Strategic Priority 1.1 Help Canadians in need access affordable, sound and suitable housing |
49 | |||
| ¡ Strategic Priority 1.2 Support Aboriginal Canadians to improve their living conditions |
52 | |||
| n Objective 2 – Facilitate access to more affordable, better quality housing for all Canadians |
58 | |||
| ¡ Strategic Priority 2.1 Ensure Canadians have access to mortgage loan insurance products and tools that meet their needs |
58 | |||
| ¡ Strategic Priority 2.2 Ensure an adequate supply of low-cost funds for mortgage lending through mortgage securitization |
67 | |||
| ¡ Strategic Priority 2.3 Provide comprehensive, timely and relevant market analysis information |
72 | |||
| n Objective 3 – Ensure the Canadian housing system remains one of the best in the world |
73 | |||
| ¡ Strategic Priority 3.1 Undertake comprehensive, timely and relevant research and information transfer activities to enable Canadian consumers and the housing sector to make informed decisions |
73 | |||
| ¡ Strategic Priority 3.2 Support and promote Canada’s world-class housing products, services and system internationally |
76 | |||
| RISK MANAGEMENT |
78 | |||
| MANAGING HUMAN RESOURCES AND INTERNAL SERVICES – A SOLID ORGANIZATIONAL FOUNDATION | 88 | |||
| 2007 TO 2012 FINANCIAL HIGHLIGHTS |
92 |
35
FORWARD-LOOKING STATEMENTS
CMHC’s Annual Report contains forward-looking statements regarding objectives, strategies and expected financial results. There are risks and uncertainties beyond the control of CMHC that include, but are not limited to, economic, financial and regulatory conditions, nationally and internationally. These factors, among others, may cause actual results to differ substantially from the expectations stated or implied in forward-looking statements.
36 C A N A D A M O R T G A G E A N D H O U S I N G C O R P O R A T I O N

THE OPERATING
ENVIRONMENT IN 2011
AND OUTLOOK FOR 2012
| This section presents external operating factors, including new housing starts and housing sales that impact CMHC’s operating environment and influence the attainment of our objectives and financial results.
As a federal Crown corporation which receives Parliamentary appropriations, CMHC also participates in Government fiscal restraint and deficit reduction measures. The results of the most recent strategic and operating review, which took place following Budget 2011, are expected to be announced in the Deficit Reduction Action Plan as part of Budget 2012.
More discussion on specific factors that impact CMHC’s operating environment, including regulatory changes, are discussed, as appropriate, in the Performance by Objective section of Management’s Discussion and Analysis.
It should also be noted that the sustainability of pension plans in Canada, particularly defined benefit plans, has recently come to the forefront of public discussion. With today’s low interest rates that are used to value plan liabilities, modest investment returns, increased life expectancies of pension plan participants and increased retirements particularly from the baby boomers, funding requirements have been increasing and the sustainability of workplace pension plans is being challenged. |

37
SOCIO-ECONOMIC FACTORS
The following socio-economic factors will influence housing markets and CMHC’s operating environment:
Population growth and
international migration
Between 2006 and 2011, Canada’s population grew by 5.9%, up slightly from the previous intercensal period (2001 to 2006) when it grew by 5.4%. Canada’s population growth between 2006 and 2011 was the highest among G8 countries. Every province and most territories saw their population increase between 2006 and 2011. The rate of population growth increased in all provinces and territories between 2006 and 2011, except in Ontario, the Northwest Territories and Nunavut.
Better prospects for the Canadian economy, relative to other economies, are expected to attract more immigrants which, in turn, will push net migration up in 2012. Total net international migration is estimated to have decreased to 233,846 in 2011, down from 244,573 in 2010. By 2012, however, net migration is expected to rebound to 253,800. This will have a positive impact on housing demand.
The low birth rate is the major factor in the slowing of growth in the natural population (births minus deaths). Without commensurate migration increases, this will lessen the demand for additional housing stock in the medium to long term.
Economic growth
Economic growth slowed to 2.5% in 2011 compared to 3.3% in 2010. The economy is expected to grow by 2.1% in 2012.
Interest and mortgage rates
The Bank of Canada has kept its target for the overnight interest rate at 1.0% since September 2010 and has indicated that it is likely to remain at 1.0% for 2012. Mortgage rates, particularly short-term
mortgage rates and variable mortgage rates, are expected to remain at low levels. Accordingly, CMHC forecasts that posted mortgage rates will remain relatively flat through late 2012. During 2012, the one-year posted mortgage rate is expected to be in the 3.3 to 3.6% range, while the five-year posted mortgage rate is forecast to be within 5.1 to 5.4%. The low interest rate environment is supportive of housing demand.
Employment
The unemployment rate declined from 8.0% in 2010 to 7.5% in 2011, while 2012 will see a rate of about 7.0%. In the 12 months to December 2011, employment grew by 1.2% (+199,000), primarily in Prince Edward Island and Alberta. Over this period, full-time employment rose by 1.5% (+207,700), part-time work declined 0.3% (-8,600) and total actual hours worked increased by 1.4%. The compositional change in full-time positions will support Canada’s housing sector. Employment is expected to grow by 1.6% in 2012.
Income
Incomes grew in 2011 because of the economic recovery and the resulting improvements in the labour market. Income will continue to grow at a moderate pace in 2012 and be supportive of housing.
HOUSING INDICATORS
Housing starts
Starts in 2011 were 193,950, up from 189,930 in 2010. The largest percentage increases occurred in Prince Edward Island, Saskatchewan and Ontario. In 2012, total housing starts are expected to decline to 190,000 in line with underlying demographic fundamentals.
Single-detached starts were 82,392 in 2011, down from 92,554 in 2010 but are expected to increase to 82,700 in 2012. The outlook for 2012 is most positive in Alberta, British Columbia, Quebec and Nova Scotia.
38 C A N A D A M O R T G A G E A N D H O U S I N G C O R P O R A T I O N
Housing Starts
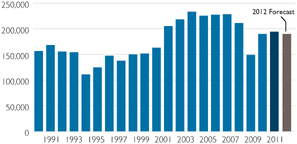
Multi-unit housing starts were 111,558 in 2011, up from 97,376 in 2010 but are expected to be 107,300 in 2012. Only four of ten provinces are forecast to experience positive growth in 2012. Those provinces are Saskatchewan, Alberta, British Columbia and Manitoba.
Sales of existing homes
Average MLS® Sale Price ($)

Sales of existing homes through the Multiple Listing Service®1 totalled 456,749 in 2011. They are expected to increase slightly in 2012 to 457,300. The MLS® average price continued to increase in 2011 to $363,365 while a modest increase to $368,900 is expected in 2012.
Most market conditions are expected to be in balanced market territory in 2012. In comparison to sellers’ market conditions, balanced market conditions typically lead to more moderate housing starts activity.
Vacancy rates
Modest rental construction and strong rental market demand due to high immigration will be partly offset by increased competition from the condominium market. As a result, vacancy rates across Canada’s metropolitan centres will remain relatively stable in 2012.
House prices
There has been considerable attention paid to house prices in Canada in recent months. Concern would be warranted where house prices exceed levels that would be suggested by underlying demographic, economic and financial factors (migration, income, interest rates, wealth, etc.) and where the growth rate of prices is accelerating. When house prices are out of line with these fundamentals and are growing at an accelerated rate, it can be the result of a significant increase in speculative activity in the housing market, a key ingredient for a bubble. Based on these and other characteristics, clear evidence of a bubble is lacking, but CMHC continues to monitor very closely housing prices and underlying factors such as demographic and economic fundamentals and financial conditions across all major urban centres, including condominium markets.
In conclusion, there are both upside and downside risks to the outlook. Some upsides include the potential that the U.S. could recover stronger than forecasted, thus increasing U.S. employment and economic growth. This could, in turn, boost employment growth in Canada and lead to stronger than anticipated housing demand. Some downsides include slower than expected recovery for the U.S. and reduced economic growth in emerging economies and a downturn in parts of Europe. Such events could result in slower employment growth in Canada which could lead to lower demand for housing.
| 1 | Multiple Listing Service® (MLS®) is a registered trademark owned by the Canadian Real Estate Association. |
39
SUMMARY
OF FINANCIAL RESULTS
| CMHC reports on the following principal business activities and consolidates the accounts of Canada Housing Trust, a separate special purpose entity: | ||||||
| n |
Housing Programs: Expenditures and operating expenses are funded by Parliamentary appropriations. | |||||
| n |
Lending: Revenues are earned from interest income on the loan portfolio which is funded through borrowings. | |||||
| Housing Programs and the Lending Activity provide support for Canadians in need and are operated on a breakeven basis. | ||||||
| n |
Mortgage Loan Insurance: Revenues are earned from premiums, fees and investment income. Expenses consist of operating expenses and net claim expenses. The Corporation’s Net Income is primarily derived from this activity. | |||||
| n |
Securitization: Securitization revenues are earned from guarantee fees and interest income. Expenses consist primarily of interest expenses. | |||||
| Mortgage Loan Insurance and Securitization Activities facilitate access to more affordable and better quality housing and ensure an adequate supply of mortgage funds to the housing market. These activities are operated on a commercial basis. | ||||||
| n |
Canada Housing Trust (CHT): CHT revenue is earned primarily from investment income. Revenue derived from investment income is used to cover operating expenditures and Canada Mortgage Bond (CMB) interest expense. | |||||
40 C A N A D A M O R T G A G E A N D H O U S I N G C O R P O R A T I O N
BALANCE SHEET HIGHLIGHTS
| 2011 | ||||||||||||||||||||
| ($M) | 1 January 20101 Actual |
31 December 2010 Actual |
2012 Plan |
|||||||||||||||||
| Plan | Actual | |||||||||||||||||||
|
Assets |
267,687 | 287,940 | 281,435 | 291,890 | 290,027 | |||||||||||||||
|
Liabilities |
258,998 | 277,499 | 270,139 | 279,799 | 276,337 | |||||||||||||||
|
Contributed Capital |
25 | 25 | 25 | 25 | 25 | |||||||||||||||
|
Accumulated Other Comprehensive Income (AOCI) |
194 | 601 | 224 | 902 | 499 | |||||||||||||||
|
Retained Earnings (other)2 |
1,962 | 907 | 930 | 1,437 | 3,282 | |||||||||||||||
|
Appropriated Retained Earnings |
6,508 | 8,908 | 10,117 | 9,727 | 9,884 | |||||||||||||||
|
Total Equity of Canada |
8,689 | 10,441 | 11,296 | 12,091 | 13,690 | |||||||||||||||
| 1 | CMHC converted to IFRS effective 1 January 2011 (with comparatives for the year commencing 1 January 2010). Refer to Note 28 of the audited Consolidated Financial Statements for a detailed reconciliation of the transition. |
| 2 | Includes Unappropriated Retained Earnings, Reserve Fund for Lending and Inter-entity eliminations |
Assets and Liabilities
As at 31 December 2011, Assets and Liabilities were $292 billion and $280 billion, respectively. These exceeded plan by $11 billion and $10 billion, respectively, and were both 1% higher than the prior year. These variances were mainly due to greater issuances in Canada Mortgage Bonds (CMB) resulting from higher than expected investor demand globally.
Equity of Canada
The Equity of Canada is made up of three components:
| ¡ | Contributed Capital |
The contributed capital of CMHC is determined by the Governor in Council. It is currently set at $25 million.
| ¡ | Accumulated Other Comprehensive Income (AOCI) |
AOCI is the accumulated unrealized gains or losses caused by the change in the fair valuation of investments in the Mortgage Loan Insurance and Securitization Activities. As at 31 December 2011, it was $902 million, $678 million higher than planned. This variance is due to fluctuations in Other Comprehensive Income (OCI) explained later in this section.
| ¡ | Retained Earnings |
Total Retained Earnings were $11,164 million of which $9,727 million is appropriated for capitalization of both the Mortgage Loan Insurance and Securitization Activities in accordance with CMHC’s Capital Management Framework. The residual $1,437 million Retained Earnings (other) is comprised of Unappropriated Retained Earnings, Reserve Fund for Lending and Inter-entity Eliminations. Total Retained Earnings variances are mainly driven by fluctuations in Net Income whereas component variances mainly arise as a result of the amounts that have been set aside for capitalization purposes. Further explanation is provided below as well as in the financial analysis sections of the strategic priorities.
Within the Public Accounts of Canada, CMHC’s annual consolidated Net Income reduces the Government’s annual deficit and the consolidated Retained Earnings and Accumulated Other Comprehensive Income reduce the Government’s accumulated deficit. Over the last decade, CMHC has contributed over $16 billion towards reducing the Government’s accumulated deficit through both its Net Income and Income Taxes.
41
The CMHC Act and National Housing Act govern the use of the Corporation’s Retained Earnings. In particular, the Retained Earnings related to Mortgage Loan Insurance and Securitization Activities may only be used for: i) the capitalization of these activities; ii) for payment of a dividend to the Government of Canada; iii) for the purposes of the National Housing Act or CMHC Act; iv) any other purpose authorized by Parliament relating to housing; and v) for retention. A portion of Retained Earnings from the Mortgage Loan Insurance and Securitization Activities is used for capitalization.
Retained Earnings of the Mortgage Loan Insurance Activity are appropriated for capitalization in accordance with CMHC’s Capital Management Framework which is based on guidelines developed by the Office of the Superintendent of Financial Institutions (OSFI). CMHC has Appropriated Retained Earnings as well as AOCI representing its capital holding target of 200% Minimum Capital Test (MCT).
Retained Earnings related to the Securitization Activity are also appropriated for capitalization based on regulatory and economic capital principles. CMHC has Appropriated Retained Earnings as well as AOCI representing 100% of its target capital.
CMHC also retains earnings in its Lending Activity in order to address interest rate risk exposure on pre-payable loans as well as credit risk exposure on the Municipal Infrastructure Lending Program loans. These Retained Earnings, referred to as the Reserve Fund, also include amounts representing unrealized fair market value changes on the Lending Activity investments and the Lending Activity’s portion of actuarial gains and losses from CMHC’s post-employment benefits.
The Reserve Fund for Lending is subject to a statutory limit of $240 million. Should the limit be exceeded, CMHC would be required to pay any excess to the Government of Canada.
At year-end 2011, the Corporation’s Total Equity of Canada was $12,091 million or 7% above planned. The variance was mainly driven by higher than planned Net Income from the Mortgage Loan Insurance and Securitization Activities as explained in the financial analysis sections of strategic priorities 2.1 and 2.2.
Growth in the Corporation’s Total Equity reflects successive years of high business volumes and success in managing the impact of defaults during the recent economic downturn.
STATEMENT OF INCOME AND COMPREHENSIVE INCOME HIGHLIGHTS
| ($M) | 2010 Actual |
2011 |
2012 Plan |
|||||||||||||
| Plan | Actual | |||||||||||||||
|
Revenues |
14,454 | 14,479 | 13,914 | 14,286 | ||||||||||||
|
Expenses |
12,474 | 12,670 | 11,832 | 12,349 | ||||||||||||
|
Income Taxes |
540 | 466 | 553 | 440 | ||||||||||||
|
Net Income |
1,440 | 1,343 | 1,529 | 1,497 | ||||||||||||
|
Other Comprehensive Income |
311 | 41 | 120 | - | ||||||||||||
|
Comprehensive Income |
1,751 | 1,384 | 1,649 | 1,497 | ||||||||||||
|
Resource Management |
||||||||||||||||
|
Operating Expenses (included in Expenses above) |
406 | 440 | 420 | 427 | ||||||||||||
|
Staff (Full Time Equivalent) |
2,069 | 2,040 | 1,975 | 1,947 | ||||||||||||
42 C A N A D A M O R T G A G E A N D H O U S I N G C O R P O R A T I O N
Revenues
As at 31 December 2011, Revenues were $13,914 million, $565 million (4%) below plan. This variance was mainly caused by lower than planned Housing Programs appropriations resulting from faster delivery of CEAP and AHI funding in 2010. This was further supplemented by lower than planned Interest Income from NHA MBS due to lower than expected interest rates on issuances. These variances were partially offset by higher than planned gains on the sale of investments.
When compared to the prior year, Total Revenues decreased by $540 million (4%). This decrease was primarily the result of lower Housing Programs expenses funded by appropriations as CEAP ended 31 March 2011 which was partially offset by higher gains on sales of investments and higher interest income from NHA MBS due to a higher amount of issuances.
Both the decrease in Housing Programs appropriations and Interest Income variances, actual to plan and actual to prior year, led to a corresponding decrease in Total Expenses and therefore had no impact on Net Income.
Expenses
In 2011, Expenses were $11,832 million, $838 million (7%) below plan mainly due to lower than planned Housing Programs Expenses and lower than planned Interest Expenses, as previously explained. This was further supplemented by lower than planned Net Claims due to better than expected economic conditions.
When compared to the prior year, Total Expenses decreased by $642 million (5%) primarily due to lower Housing Programs Expenses which was partially offset by higher Interest Expenses from an increase in CMB issuances.
Revenue and expense variances, actual to plan and actual to prior year, are further explained in the financial analysis sections under their respective strategic priorities.
Net Income
As a result of the above variances, Net Income of $1,529 million exceeded plan by $186 million (14%) as at 31 December 2011 and exceeded the prior year amount by $89 million (6%).
Other Comprehensive Income
CMHC’s Other Comprehensive Income (OCI) is comprised of unrealized gains/losses caused by changes in the fair valuation of investments in Mortgage Loan Insurance and Securitization Activities and net actuarial gains/losses from CMHC’s post-employment benefits. Under IFRS, actuarial gains and losses in post-employment benefits are recognized in OCI and are accumulated in Retained Earnings.
In 2011, total OCI was $120 million, $79 million higher than expected mainly due to $367 million in higher than planned unrealized fair value fluctuations caused by market appreciation on investment securities and $88 million in higher than planned re-classification of realized investment gains to Net Income. These variances were partially offset by higher than planned net actuarial losses from post-employment benefits of $200 million due to unexpected fluctuation in the discount rate assumptions and a lower than anticipated return on pension fund assets.
The foregoing net actuarial losses from post-employment benefits were also the main contributing factors for the $191 million decrease in OCI between 2010 and 2011.
43
Resource Management
As at 31 December 2011, Total Operating Expenses were $20 million below plan largely due to cost containment measures as applied by CMHC Management as well as lower than planned staff-year consumption resulting from lower Mortgage Loan Insurance Activity.
CMHC PENSION PLAN
The most recent actuarial valuation of the registered Pension Plan (“the Plan”) was as at 31 December 2011. The actuarial valuation reports that the Plan has a deficit of $13.9 million on a going concern basis, which is a calculation that assumes the Plan continues indefinitely (surplus of $25.7 million as at 31 December 2010). The change is primarily due to low investment returns over the last four years in aggregate, reflecting the market volatility and uncertainty of the current environment. A second valuation in the report, referred to as a solvency valuation, assumes a hypothetical immediate termination of the Plan and that the Corporation no longer makes any contributions. This valuation uses current low interest rates to value the Plan. Due to the current economic environment and low levels of interest rates, this valuation reports a solvency deficit of $730.3 million ($412.1 million deficit as at 31 December 2010). The change is solely because interest rates declined further in 2011, which increased the actuarial value of the liabilities on a solvency basis.
In April 2011, regulations under the Pension Benefits Standards Act, 1985 (PBSA) came into effect that support the funding measures contained in Bill C-9 of 2010. The regulations included provisions for Crown corporations to reduce solvency special payments, subject to certain limitations. These provisions exist to make funding requirements less sensitive to financial
market volatility. As is permitted under and subject to the PBSA and its regulations, CMHC is seeking the necessary approvals to reduce its special payments related to the solvency deficit as further described in Note 21 of the 2011 Consolidated Financial Statements.
DISCLOSURE OF CHANGES IN ACCOUNTING POLICIES AND CHANGEOVER TO IFRS
CMHC’s financial statements for 2011 have been prepared in accordance with International Financial Reporting Standards (IFRS). Previously, they were prepared in accordance with Canadian Generally Accepted Accounting Principles (CGAAP). While IFRS uses a conceptual framework similar to CGAAP, there are significant differences in recognition, measurement and disclosures. For a description of the significant accounting policies the Corporation has adopted under IFRS, including the estimates and judgments considered most significant in applying those accounting policies, refer to Note 2 (significant accounting policies) and Note 4 (estimates and judgments) of CMHC’s 2011 Consolidated Financial Statements.
The adoption of IFRS resulted in certain changes to the Corporation’s consolidated balance sheets and income statements previously reported under CGAAP. To help users of the financial statements better understand the impact of the adoption of IFRS on the Corporation, we have provided reconciliations from CGAAP to IFRS for Total Assets, Liabilities, and Equity, as well as Net Income, Comprehensive Income and cash flow for the comparative reporting periods. Refer to Note 28 of the 2011 Consolidated Financial Statements for the reconciliations between IFRS and CGAAP at the date of transition, 1 January 2010 and for the year ended 31 December 2010.
44 C A N A D A M O R T G A G E A N D H O U S I N G C O R P O R A T I O N
IFRS 1 First-time Adoption of International Financial Reporting Standards
Adoption of IFRS requires the application of IFRS 1, First-time Adoption of International Financial Reporting Standards, which provides guidance for an entity’s initial adoption of the new standards. IFRS 1 gives entities adopting these standards for the first time a number of optional and mandatory exceptions, in certain cases, to the full retrospective application of IFRS. The optional exemptions available under IFRS 1 that were elected on transition to IFRS were disclosed in the MD&A in the Corporation’s 2010 Annual Report. The elections previously disclosed are consistent with the elections disclosed in these consolidated financial statements. Refer to Note 28 of the 2011 Consolidated Financial Statements for a detailed description of the IFRS 1 exemptions the Corporation elected to apply.
CRITICAL ACCOUNTING POLICIES AND ESTIMATES
Judgments in Applying
Accounting Policies
A summary of CMHC’s significant accounting policies is found in Note 2 of the Consolidated Financial Statements. In the process of applying these accounting policies, Management is required to make various judgments that can significantly affect the amounts recognized in the financial statements. The judgments having the most significant effects on the financial statements are:
| ¡ | Derecognition: In assessing whether transfers of NHA MBS from Issuers to the Corporation under the CMB program (CHT) and IMPP (CMHC) qualify for derecognition, significant judgment is applied in determining whether substantially all the risks and rewards of ownership of the NHA MBS have been transferred. |
| ¡ | Consolidation: Per SIC-12, significant judgment is applied in the assessment of whether the substance of the relationship between CMHC and CHT (a special purpose entity) indicates that CMHC controls the Trust. |
| ¡ | Impairment of Available for Sale Financial Instruments: Significant judgment is applied in assessing if losses that have been experienced are significant and prolonged and the asset is not expected to recover its cost. |
Critical Accounting Estimates
The preparation of the audited Consolidated Financial Statements requires Management to make estimates and assumptions. These estimates and assumptions affect the reported amounts of Assets, Liabilities, Comprehensive Income and related disclosure. These estimates and underlying assumptions are reviewed on an ongoing basis. Where actual results differ from these estimates and assumptions, the impact will be recorded in future periods. Key areas where Management has made estimates and assumptions include those related to the Provision for Claims, Unearned Premiums, Fair Value of Financial Instruments, and Post-Employment Benefits. For a detailed description of CMHC’s critical judgements and estimates, see Note 4 of the Consolidated Financial Statements.
45
FUTURE ACCOUNTING CHANGES
The following new standards and amendments have been issued by the International Accounting Standards Board (“the IASB”) which have been assessed as having a possible impact on CMHC in the future:
| Standard or Amendment |
Effective for | |
| annual periods | ||
| beginning on | ||
| or after | ||
|
IFRS 9 Financial Instruments |
1 January 2015 | |
|
IFRS 10 Consolidated Financial Statements |
1 January 2013 | |
|
IFRS 11 Joint Arrangements |
1 January 2013 | |
|
IFRS 12 Disclosure of Interest in Others |
1 January 2013 | |
|
IFRS 13 Fair Value Measurement |
1 January 2013 | |
|
Amendments to IAS 19 Employee Benefits |
1 January 2013 | |
|
Amendments to IAS 1 Presentation of Financial Statements |
1 July 2012 | |
|
Amendments to IAS 32 Financial Instruments: Presentation |
1 January 2014 | |
|
Amendments to IFRS 7 Financial Instruments: Disclosure |
1 January 2013 |
Amendments to IAS 19 – Employee Benefits update the existing standard by eliminating the “corridor method” and improve the recognition, presentation and disclosure requirements for defined benefit plans.
As CMHC has adopted the change to the corridor method upon implementation of IFRS, this component of the amendment will not affect the Corporation’s Consolidated Financial Statements. CMHC’s preliminary analysis of the other changes in IAS 19 indicates that the amendments will result in a change in Pension Plan expenses reflected in Net Income with a corresponding offset in actuarial gains and losses recognized in Other Comprehensive Income. This change is due to the use of the discount rate to calculate the estimated return of the Pension Plan rather than the use of the expected rate of return which was previously allowed. These amendments also include enhanced disclosure requirements.
In 2012, the Corporation will determine the impact of the remaining future accounting changes: IFRS 7 Financial Instruments Disclosure, IFRS 10 Consolidated Financial Statements, IFRS 11 Joint Arrangements, IFRS 12 Disclosure of Interest in Others, IFRS 13 Fair Value Measurement as well as, IAS 1 and IAS 32, on its Consolidated Financial Statements.
46 C A N A D A M O R T G A G E A N D H O U S I N G C O R P O R A T I O N
PERFORMANCE BY OBJECTIVE
| CMHC’s Corporate Plan Framework is comprised of three objectives and seven strategic priorities. Subsequent to the release of CMHC’s 2011-2015 Summary of the Corporate Plan in March 2011, the Framework was amended by the Board of Directors in August pursuant to the Government’s approval of changes to CMHC’s Program Activity Architecture.
Under the new Framework, housing research and information transfer activities and sustainable development activities, previously under strategic priorities 2.3 and 3.1, respectively, are amalgamated into a new strategic priority 3.1 – Undertake comprehensive, timely and relevant research and information transfer activities to enable Canadian consumers and the housing sector to make informed decisions. Strategic priority 2.3 is now focused on market analysis activities.
In addition to the foregoing Summary of Financial Results, financial analysis is provided for Housing Programs, Lending Activity, Mortgage Loan Insurance Activity, and Securitization Activity and the Canada Housing Trust within the discussion of their respective strategic priorities. (See illustration on CMHC’s Corporate Plan Framework.)
Funding for Housing Programs is provided by the Government of Canada through Parliamentary appropriations. Most of this funding is for assisted housing under strategic priorities 1.1 and 1.2; however, Government funding also supports CMHC’s market analysis, research and information transfer and export promotion activities under strategic priorities 2.3, 3.1 and 3.2 as depicted. CMHC does not receive Parliamentary appropriations for mortgage loan insurance and securitization guarantee programs which are operated on a commercial basis under strategic priorities 2.1 and 2.2, respectively.
Expected outcomes and indicators for each strategic priority are presented on page 171.
While key directions and initiatives for 2012 are presented in this annual report, CMHC’s 2012-2016 Summary of the Corporate Plan provides additional details on CMHC’s future plans. This Summary was tabled in Parliament on March 15, 2012. It is available on CMHC’s website at www.cmhc.ca or by calling 1-800-668-2642. |
47

48 C A N A D A M O R T G A G E A N D H O U S I N G C O R P O R A T I O N

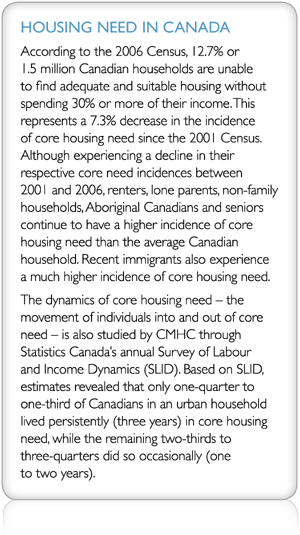
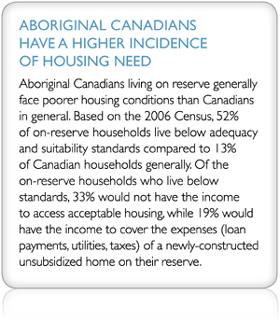
OBJECTIVE 1 HELP CANADIANS IN NEED
Under this objective, CMHC pursues two strategic priorities. Under strategic priority 1.1, CMHC supports the provision of assisted housing and the renovation of housing for low-income households living off reserve. Under strategic priority 1.2, CMHC works with First Nations on reserve to improve housing and living conditions.
| STRATEGIC PRIORITY |
1.1 | HELP CANADIANS IN NEED ACCESS AFFORDABLE, SOUND AND SUITABLE HOUSING |
| RESOURCES • Operating expenses: $61 million • Staff-Years: 410 |
| Performance Measures |
2010 Actual |
2011 | 2012 Plan |
|||||||||||||
| Plan | Actual | |||||||||||||||
|
Housing Programs expenses excluding operating expenses ($M) |
3,040 | 2,286 | 1 | 2,044 | 2,023 | |||||||||||
|
Estimated number of households assisted through long-term social housing commitments |
613,500 | 603,600 | 604,200 | 597,800 | ||||||||||||
|
Affordable Housing Initiative (AHI) expenditures ($M) |
175.3 | 49.5 | 41.6 | 2 | 8.3 | |||||||||||
|
Renovation programs expenditures (value of loans forgiven over time) ($M) |
121.7 | 56.6 | 57.7 | 4.1 | ||||||||||||
|
Investment in Affordable Housing (IAH) 2011-2014 ($M) |
N/A | 11.4 | 27.8 | 399.1 | ||||||||||||
|
Affordable housing units facilitated by CMHC’s Affordable Housing Centre |
2,873 | 2,140 | 2,838 | 2,715 | ||||||||||||
|
Direct Lending ($M) |
1,316.7 | 1,373.3 | 1,392.1 | 829.6 | ||||||||||||
| 1 | Includes the Investment in Affordable Housing funding which was authorized after the approval of the 2011-2015 Corporate Plan |
| 2 | While actual AHI expenditures in 2011 were below plan, all funding under the two-year extension of the AHI (2009-10 to 2010-11) has been committed. |
PERFORMANCE ANALYSIS
In 2011, CMHC continued to provide federal assistance under various programs to meet the housing needs of Canadians. This assistance includes funding for long-term social housing commitments, the creation of new affordable housing units and the renovation of housing for low-income Canadians. CMHC also provided advice and financial assistance to sponsor groups who are working across the country to develop new affordable housing projects.
The estimated number of households assisted through long-term social housing commitments relates primarily to off-reserve social housing projects that were created between 1946 and 1993. In 2011, approximately $1.7 billion in federal dollars supported
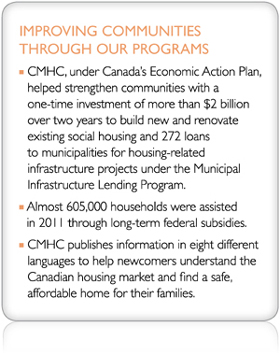
this housing which is home to almost 605,000 households across Canada. The majority of these projects are in programs administered by provinces and territories. Also included in this measure are households assisted on reserve under the Non-Profit Rental Housing Program (strategic priority 1.2) where new long-term social housing commitments continue to be made.
Housing Programs expenses include Parliamentary appropriations for activities under strategic priorities 1.1, 1.2, 2.3, 3.1 and 3.2. They include CEAP-related expenditures (until March 2011) and reflect the new Investment in Affordable Housing (IAH) 2011-2014 funding which was authorized subsequent to the approval of the 2011-2015 Corporate Plan ($253.1 million per fiscal year from 2011-12 to 2013-14).
49
In 2011, total Housing Programs expenses were approximately 10% below plan due to faster than expected spending in earlier years under the Affordable Housing Initiative and Canada’s Economic Action Plan (CEAP). For the Investment in Affordable Housing (IAH) 2011-2014, spending was delayed as discussions on new agreements were finalized.
The performance measures entitled Affordable Housing Initiative and renovation programs expenditures include funding provided by the Government of Canada prior to 1 April 2011. The performance measure entitled Investment in Affordable Housing (IAH) 2011-2014 includes funding for provinces/territories that signed new agreements based on the framework finalized in July of 2011. It also includes funding for renovation programs off reserve and the Affordable Housing Initiative for provinces/territories that decided to maintain existing delivery arrangements.
New flexibilities introduced to address housing need
The federal-provincial-territorial housing partnership continued to evolve in 2011 as a new framework was implemented, providing for a combined investment of $1.4 billion to reduce the number of Canadians in housing need.
Under the new Investment in Affordable Housing 2011-2014 Framework, provinces and territories have responsibility for the design and delivery of affordable housing programs to address specific housing needs and priorities in their jurisdictions.
Provinces and territories can now invest in a range of programs and initiatives to support:
| ¡ | the construction of new affordable housing |
| ¡ | the renovation of existing housing |
| ¡ | assistance towards homeownership |
| ¡ | the provision of shelter allowances or rent supplements |
| ¡ | accommodations for victims of family violence. |
Federal investments will be matched by provinces, territories and other contributors. Governments will report to their citizens on progress toward reducing the number of households in housing need.
The Framework formed the basis for new bilateral agreements signed this year with British Columbia, Alberta, Saskatchewan, Manitoba, Ontario, New Brunswick, Nova Scotia, Newfoundland and Labrador as well as Nunavut and Northwest Territories. In Ontario, the Province requested that CMHC continue to make new funding commitments under the existing renovation programs through to 31 March 2012. The Province of Quebec is expected to sign a new agreement early in 2012.
50 C A N A D A M O R T G A G E A N D H O U S I N G C O R P O R A T I O N
Extension agreements for the Affordable Housing Initiative (AHI) were also signed in 2011 with Yukon and Prince Edward Island (PEI) where the province/ territory decided to maintain the existing delivery arrangements for affordable housing programs. The renovation program agreement with PEI was also extended in 2011. As a result, CMHC continued making new commitments under the renovation programs off reserve in Yukon, PEI and Ontario in 2011.
Funding related to the two-year extension (2009-2011) of the AHI and renovation programs continued to be provided in 2011. Under the AHI, 1,737 units were funded, bringing the total to 51,843 units since its inception. Some 5,715 households benefitted from assistance under renovation programs off reserve in 2011.
Canada’s Economic Action Plan – bringing benefits to Canadians
By March 31, 2011, all federal housing investments of $2 billion under Canada’s Economic Action Plan (CEAP) were committed. Off reserve, these

investments totalled some $1.475 billion, resulting in approximately 13,000 social housing construction or renovation projects. Most of this funding was cost-matched and delivered by provinces and territories under agreements with CMHC. Combined, the federal, provincial and territorial funding represents an unprecedented one-time investment in social housing.
CMHC also made $2 billion in low-cost loans to municipalities under the Municipal Infrastructure Lending Program (MILP), providing a total of 272 loans for housing-related infrastructure.
CMHC experts help make affordable housing ideas a reality
CMHC continued to provide Seed Funding and Proposal Development Funding (see Glossary for program descriptions) to affordable housing sponsors who are developing projects that generally do not entail long-term federal subsidies. This financial assistance, along with the advice and expertise of CMHC’s Affordable Housing Centre, facilitated the development of 2,838 units in 2011. That brings the total number of units facilitated by the Centre to approximately 59,270.
In November, CMHC and its partners held 31events across the country to celebrate National Housing Day and recognize the dedicated people and organizations that developed unique approaches to addressing their community’s needs for affordable housing. Their stories were shared with over 3,600 participants and demonstrated how, by working together, private builders, non-profit housing providers, provincial and municipal governments, and charitable organizations can make more affordable housing available to Canadians.
51
| STRATEGIC PRIORITY |
1.2 | SUPPORT ABORIGINAL CANADIANS TO IMPROVE THEIR LIVING CONDITIONS |
| RESOURCES • Operating expenses: $19 million • Staff-Years: 135 |
| Performance Measures |
2010 |
2011 | 2012 | |||||||||||||
| Actual | Plan | Actual | Plan | |||||||||||||
|
New units committed under the On-Reserve Non-Profit Rental Housing Program |
766 | 620 | 604 | 548 | ||||||||||||
|
Renovation program expenditures (value of loans that are forgiven over time) ($M) |
16.7 | 15.6 | 12.6 | 15.5 | ||||||||||||
|
Per cent of housing programs and services delivered through First Nations or Aboriginal organizations |
91 | 85 | 90 | 85 | ||||||||||||
|
Market-based on-reserve units facilitated through insured financing or Aboriginal capacity support |
182 | 125 | 156 | N/A | ||||||||||||
PERFORMANCE ANALYSIS
As noted under strategic priority 1.1, Canada’s Economic Action Plan (CEAP) represented an unprecedented one-time investment in social housing. Under CEAP, CMHC and Aboriginal Affairs and Northern Development Canada (AANDC) invested $400 million to help thousands of First Nations households access more affordable, sound and suitable housing. These investments in housing also stimulated economic development in First Nations communities. CMHC directly delivered $250 million of the funding, resulting in over 2,400 projects in First Nations communities. A further $200 million in funding was delivered by the three Territories to address the unique housing needs in the North. This additional investment resulted in 210 construction or renovation projects.
CMHC committed funding for 604 new units under the On-Reserve Non-Profit Rental Housing Program in 2011, providing much needed new rental housing on reserve. There are now 29,600 units being subsidized under the program.
Through various capacity development initiatives, CMHC helps First Nations to acquire the skills, training and resources needed to support their goal of becoming more self sufficient in housing. In 2011, 90% of CMHC’s Aboriginal housing programs were delivered through First Nations or Aboriginal organizations.
52 C A N A D A M O R T G A G E A N D H O U S I N G C O R P O R A T I O N

During the year, CMHC held approximately 240 training sessions on housing quality and housing management. Topics included indoor air quality, the prevention and remediation of mold, and training related to housing management. Support is also provided to organizations that represent First Nation housing managers, building inspectors and financial managers.
CMHC also provided funding through its renovation programs to repair 1,015 homes on reserve. Program expenditures were below target in 2011 as renovation work was delayed or cancelled due to severe weather conditions such as flooding and fires resulting in community evacuations.
Addressing mold in
First Nations’ housing
CMHC continued to collaborate with Aboriginal Affairs and Northern Development Canada (AANDC), Health Canada and the Assembly of First Nations on the National Strategy to Address Mold in First Nation Communities. Three guides were created and published to develop awareness and capacity among First Nations on how to identify, assess, remediate and prevent moisture and mold problems indoors.
In addition, CMHC published the Household
Investigation Tool for Mold to be used as part of broader community self-assessments.
CMHC also published three case studies on First Nations that are successfully addressing mold problems in their communities. The Membertou First Nation, an urban community in Nova Scotia, trains community members to undertake day-to-day home repairs and perform inspections and basic renovations. The community has a core group of skilled workers able to deal with mold in existing houses and prevent mold in new houses. The Wikwemikong Unceded Indian Reserve, a First Nations community in Ontario, has developed champions within the local housing construction community to identify and repair mold damage. This approach results in overall cost reductions, a simplified building process and increased interest in new building methods. The Tsartlip First Nation, a coastal community in British Columbia, built capacity within the community in the areas of home investigation, mold remediation and construction of better homes. These case studies raise awareness of house construction issues, showcase what can be done by communities, demonstrate the importance of house maintenance and occupant behaviour and show the benefits that increased capacity provides in terms of employment and training of community members.

53
FINANCIAL ANALYSIS OF HOUSING PROGRAMS
AND LENDING ACTIVITY UNDER STRATEGIC PRIORITIES 1.1 AND 1.2
CMHC’s authority to spend public funds under Housing Programs is provided by the Government of Canada through annual Parliamentary appropriations. The majority of Housing Programs funding supports programs to address the housing needs of Canadians living off reserve and First Nations people living on reserve (strategic priorities 1.1 and 1.2).
In addition, other activities supported by this funding are included under strategic priorities 2.3, 3.1 and 3.2, more specifically market analysis, research and information transfer and international activities. Additional details of CMHC’s Housing Programs expenses in 2011 are provided below as well as analysis of CMHC’s Lending activities.
Housing Programs
Annually, the Corporation spends approximately $2 billion in support of housing programs (excluding CEAP). Approximately $1.7 billion of the $2 billion is spent in support of existing social housing under long-term arrangements and of this amount, $1 billion is paid to provinces and territories that administer the housing portfolio under Social Housing Agreements with CMHC.
CEAP provided funding for a two-year period which terminated 31 March 2011. This funding increased Housing Programs expenses from 2009 to 2011. CMHC was responsible for delivering $1.925 billion of the $2.075 billion invested by the Government of Canada for the creation of new affordable housing and the renovation and retrofit of existing social housing off and on reserve. The balance of the $2.075 billion, $150 million, was delivered by AANDC for housing on reserve.
| ($M) |
2010 Actual |
2011 | 2012 Plan |
|||||||||||||||||
| Plan | Actual | Variance | ||||||||||||||||||
| Housing Programs Expenses | 3,040 | 2,165 | 1 | 2,044 | (121) | 2,023 | ||||||||||||||
| Operating Expenses | 115 | 125 | 119 | (6) | 115 | |||||||||||||||
| Total Appropriations |
3,155 | 2,290 | 2,163 | (127) | 2,138 | |||||||||||||||
| 1 | 2011 Plan excludes funding for the Investment in Affordable Housing (IAH) 2011-2014 |
Total appropriations spending in 2011 was $2,163 million, consisting of $2,044 million in Housing Programs Expenses and $119 million in Operating Expenses. Program expenses of $2,044 million were below the 2011 plan by $121 million primarily due to the faster delivery of CEAP and AHI funding in 2010 offset somewhat by higher than planned spending under the Investment in Affordable Housing in 2011. The 2011 Plan was approved prior to the authorization of the IAH funding and therefore excludes planned spending for IAH. Full take-up of CEAP funding over the two-year period was achieved.
Reporting on use of appropriations
Housing Programs Parliamentary appropriations and related expenses are recorded in CMHC’s Consolidated Statement of Income and Comprehensive Income on an accrual basis and are not to exceed the maximum authorized by Parliament. Those expenses incurred, but not yet reimbursed, are recorded on the Consolidated Balance Sheet as Due from the Government of Canada.
CMHC manages the Housing Programs financial authority on a fiscal year basis (31 March year-end). The following table reconciles the amount of appropriations authorized by Parliament as available to the Corporation during the Government of Canada fiscal year with the total amount recognized year-to-date by the Corporation in its calendar year.
54 C A N A D A M O R T G A G E A N D H O U S I N G C O R P O R A T I O N

| ($M) |
Twelve months ended December 31 |
|||||||
|
2011 |
2010 | |||||||
|
Amounts provided for Housing Programs: |
||||||||
|
Amounts authorized in 2010-11 (2009-10) |
| |||||||
|
Main estimates |
3,131 | 2,045 | ||||||
|
Supplementary estimates A1 |
- | 1,025 | ||||||
|
Supplementary estimates B1 |
- | 71 | ||||||
|
Supplementary estimates C1 |
2 | - | ||||||
|
Total fiscal year appropriations |
3,133 | 3,141 | ||||||
|
Less: Portion recognized in calendar 2010 (2009) |
(2,164) | (2,037) | ||||||
|
Less: Appropriations lapsed
for |
(170) | (113) | ||||||
|
2010-11 (2009-10) portions recognized in 2011 (2010) |
799 | 991 | ||||||
|
Amounts authorized in 2011-12 (2010-11) |
| |||||||
|
Main estimates |
1,907 | 3,131 | ||||||
|
Supplementary estimates A1, 2 |
256 | - | ||||||
|
Supplementary estimates B1 |
- | - | ||||||
|
Supplementary estimates C1 |
- | 2 | ||||||
|
Total fiscal year appropriations |
2,163 | 3,133 | ||||||
|
Less: Portion to be recognized in subsequent quarters |
(689) | (799) | ||||||
|
Forecasted lapse for
2011-12 |
(110) | (170) | ||||||
|
2011-12 (2010-11) portions recognized in 2011 (2010) |
1,364 | 2,164 | ||||||
|
Total appropriations recognized – twelve months ended 31 December |
2,163 | 3,155 | ||||||
| 1 | Supplementary Estimates are additional appropriations voted on by Parliament during the Government’s fiscal year. |
| 2 | In September 2008, a five-year investment, from 2009-2014, of more than $1.9 billion in housing and homelessness was announced to address the needs of low-income Canadians, those at risk of homelessness and the homeless. Of this amount, $253.1 million per year was designated specifically for investments in affordable housing. The 2011-12 portion of this investment is included above. |
| 3 | Of the $170 million 2010-11 lapse, $73 million represents a lapse against Housing Programs, and $97 million represents a reduction based on the results from the 2009 Strategic Review. The Strategic Review results were managed through a frozen allotment which does not reduce reference levels but “freezes” the funding so that it is not available for other purposes. |
Total appropriations authorized by Parliament for fiscal year 2011-2012 are $2,163 million. The total spending against this reference level as at 31 December 2011 was $1,364 million (63%). It is forecasted that by the end of fiscal year 2011-2012, $110 million will lapse as a result of lower interest and inflation rates and changes in spending patterns among the various program activities funded under the Housing Programs. This forecast is subject to change as the Government of Canada fiscal year progresses.
Lending Activity
CMHC makes loans under the National Housing Act (NHA) to federally-subsidized social housing sponsors, First Nations, provinces, territories and municipalities. CMHC’s loan portfolio is comprised of a mix of renewable and non-renewable loans for the purposes of both market and social housing. Where a loan is social housing in nature, it may be on reserve or off reserve.
Through its lending activities, CMHC is able to lower the cost of government assistance required to be provided for social housing projects. These loans can be offered at lower interest rates because CMHC borrows funds through the Crown Borrowing Program. The majority of Lending Activity revenues are earned from interest income on the loan portfolio.
Over two years, CEAP provided $2 billion in direct low-cost loans to municipalities through CMHC to fund housing-related infrastructure projects across the country. By the end of the program on 31 March 2011, the full $2 billion in available lending authority had been approved to municipalities resulting in 272 low-cost loans.
55
| ($M) | 2010 Actual |
2011 | 2012 Plan |
|||||||||||||||||
| Plan | Actual | Variance | ||||||||||||||||||
|
Interest Income |
665 | 730 | 695 | (35) | 667 | |||||||||||||||
|
Net gains (losses) from financial instruments |
(2) | (13) | (23) | (10) | (11) | |||||||||||||||
|
Other Income (Expenses) |
17 | 13 | 21 | 8 | 14 | |||||||||||||||
|
Interest Expenses |
648 | 697 | 650 | (47) | 635 | |||||||||||||||
|
Operating Expenses |
20 | 27 | 19 | (8) | 26 | |||||||||||||||
|
Income Taxes |
(1) | - | 11 | 11 | - | |||||||||||||||
|
Net Income |
13 | 6 | 13 | 7 | 9 | |||||||||||||||
As at 31 December 2011, total Net Income from the Lending Activity was $13 million, $7 million higher than plan mainly due to a $20 million interest loss recovery. This was partially offset by a $10 million higher than planned Net Unrealized Losses from Financial Instruments resulting from significantly lower than expected interest rates. Compared to the prior year, Net Income remained relatively stable.
As described in Note 2 of the Consolidated Financial Statements, CMHC is reimbursed for interest losses incurred by the Corporation as a result of prepayment and re-pricing. This reimbursement is included in Interest Earned on Loans and Investments in Housing Programs and recovered from the Government of Canada through Housing Programs appropriations.
CMHC retains earnings from the Lending Activity in its Reserve Fund. The components of this Reserve Fund are shown in the table below.
| ($M) | 2010 Actual |
2011 | 2012 Plan |
|||||||||||||||||
| Plan | Actual | Variance | ||||||||||||||||||
|
Reserve for Unrealized Gains and (Losses) |
(30) | (64) | (101) | (37) | 52 | |||||||||||||||
|
Reserve Fund for All Other Lending-Related Items |
98 | 104 | 105 | 1 | 112 | |||||||||||||||
|
Total Reserve Fund for Lending |
68 | 40 | 4 | (36) | 164 | |||||||||||||||
The objective of the Reserve for Unrealized Gains and Losses is to absorb unrealized fair market valuation changes of financial instruments as well as other unrealized gains and losses incurred from the Lending Activity. When compared to plan, the Reserve for Unrealized Gains and Losses was lower than expected mainly due to higher than planned net actuarial losses on post-employment benefits. These actuarial losses are a result of lower than anticipated discount rates and lower returns on pension fund assets.
The Reserve for All Other Lending-Related Items is kept by the Corporation as part of its strategy to address interest rate risk exposure on pre-payable loans as well as credit risk exposure on the MILP loans. This Reserve has remained relatively stable when compared to the prior year.
56 C A N A D A M O R T G A G E A N D H O U S I N G C O R P O R A T I O N
LOOKING AHEAD
| STRATEGIC PRIORITY | 1.1 |
HELP CANADIANS IN NEED ACCESS AFFORDABLE, SOUND AND SUITABLE HOUSING
CMHC will continue its activities to improve access to affordable housing that is sound, suitable and sustainable. The implementation of the new Investment in Affordable Housing (IAH) 2011-2014 will be a key area of focus over the next three years. CMHC will continue to deliver renovation programs off reserve and AHI investments in those jurisdictions which have chosen to extend existing delivery arrangements.
Project operating agreements for social housing programs delivered between 1946 and 1993 are beginning to expire. These operating agreements generally expire as mortgages on the properties are paid off. As a result, project owners and government funding agencies will have fulfilled their obligations under these agreements. A working group with provincial/ territorial and CMHC representation is continuing to assess the sustainability of existing social housing as operating agreements expire.
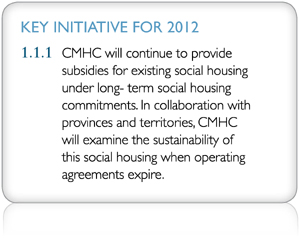
| STRATEGIC PRIORITY | 1.2 |
SUPPORT ABORIGINAL CANADIANS TO IMPROVE THEIR LIVING CONDITIONS
CMHC will continue to provide federal funding for housing programs on reserve to build new and to rehabilitate existing housing. Working with First Nation communities to enhance their capacity to manage programs and maintain housing will also be a focus. Capacity development is a collaborative effort between CMHC, AANDC, the First Nations Market Housing Fund (FNMHF) and First Nations themselves.
Home builders, property managers and residents all need to be involved in mold prevention and remediation. The National Strategy to Address Mold in First Nation Communities will continue to serve as a means to coordinate efforts and to share innovative approaches to preventing or remediating the presence of mold.

57
| OBJECTIVE 2 | FACILITATE ACCESS TO MORE AFFORDABLE, BETTER QUALITY HOUSING FOR ALL CANADIANS |
Under objective 2, CMHC pursues three strategic priorities in order to facilitate access to affordable, better quality housing for all Canadians.
CMHC’s mortgage loan insurance activities under strategic priority 2.1 help to ensure that Canadians across the country have access to housing financing options. Under strategic priority 2.2, CMHC’s securitization guarantee programs help to reduce mortgage costs by ensuring that both large and small financial institutions have access to a reliable supply of low-cost funds for mortgage lending. The Corporation’s mortgage loan insurance and securitization activities are operated on a commercial basis, at no cost to Canadian taxpayers.
Under strategic priority 2.3, CMHC undertakes housing market analysis activities which help individual Canadians as well as the housing industry make informed housing and business decisions.
| STRATEGIC PRIORITY |
2.1 | ENSURE CANADIANS HAVE ACCESS TO MORTGAGE LOAN INSURANCE PRODUCTS AND TOOLS THAT MEET THEIR NEEDS |
| RESOURCES • Operating expenses: $181 million1 • Staff-Years: 951 |
| Performance Measures |
2010 Actual |
2011 |
2012 Plan |
|||||||||||||
| Plan | Actual | |||||||||||||||
|
Total insured volumes (units) |
643,991 | 706,664 | 630,957 | 550,335 | ||||||||||||
|
Total insured volumes ($M) |
106,095 | 120,826 | 105,953 | 94,501 | ||||||||||||
|
Per cent of the total of rental and high ratio homeowner units approved to address less-served markets and/or to support specific government priorities |
43.9 | 33.0 | 46.5 | 33.0 | ||||||||||||
|
Operating expense ratio (per cent) |
10.7 | 11.2 | 10.8 | 11.2 | ||||||||||||
PERFORMANCE ANALYSIS
In Canada, federally-regulated lenders are required to insure residential mortgage loans against default when borrowers have less than a 20% down payment. These mortgages are referred to as high ratio loans. Mortgage loan insurance is available from CMHC and from private mortgage loan insurers. The requirement for mortgage loan insurance on high ratio loans protects lenders in the event of borrower default, allowing qualified borrowers to obtain mortgage
financing at rates comparable to those with higher down payments. This enables borrowers to access housing of their choice and contributes to a strong and stable housing system.
CMHC’s portfolio insurance on low ratio mortgage loans with down payments of 20% or more is not mandatory but supports lenders’ risk and capital management strategies, as well as mortgage market liquidity in Canada by providing lenders with securitization-ready assets.
| 1 | Includes issuance costs from the Mortgage Loan Insurance Activity which are deferred and amortized for financial statement purposes |
58 C A N A D A M O R T G A G E A N D H O U S I N G C O R P O R A T I O N

CMHC has operated its mortgage loan insurance business on a commercial basis at no cost to Canadian taxpayers since the mid-1990s. The premiums and fees collected and interest earned must cover related claims and other expenses, as well as provide a reasonable rate of return to the Government of Canada. Over the past decade, CMHC’s insurance business has contributed over $13 billion to improving the Government’s fiscal position.
Prudent underwriting practices and excellent client service have enabled the Corporation to maintain its position of strength in the marketplace in good economic times and bad. Economic and housing market stability are further reinforced by CMHC’s work with industry partners to improve financial literacy through online tools and publications, helping to ensure that Canadians make informed and responsible decisions regarding their housing options.
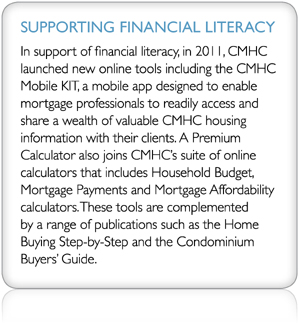
The number of insured loans was below target
CMHC’s insured loan volumes are influenced by the economy, housing markets, competitive pressures, and the regulatory environment. Total insured volumes for 2011 of 630,957 were approximately 11% below planned volumes of 706,664 due to a weaker than anticipated homeownership market, the impact of changes to the Government’s guarantee parameters, and a slight drop in CMHC’s market share.
In a continued effort to maintain a strong and stable Canadian housing market, the Government of Canada introduced a series of adjustments to the parameters in January 2011 that Canadian mortgage insurers must abide by in order to maintain the Government’s guarantee backstopping their insured loans. These changes in the mortgage lending rules, which included lowering the maximum amortization period for high ratio mortgages and the maximum loan permitted when refinancing a home, reduced the size of the high ratio homeowner mortgage loan insurance market.
The changes initially resulted in a decrease in both homeowner purchase and refinance volumes. At year-end, homeowner purchase volumes had more than recovered, while homeowner refinance volumes were running at approximately 22% below the levels experienced prior to the implementation of the changes.
Both homeowner and rental insurance volumes are expected to remain stable or decline marginally in 2012 and remain stable thereafter, in line with market expectations.
59
Serving gaps in the marketplace
CMHC contributes to Canada’s strong housing finance system, in part by ensuring that the gaps in the marketplace left by the private sector insurers are addressed. Our public mandate to provide qualified Canadians in all parts of the country with access to all forms of housing sets us apart from private sector competitors which have the ability to select the markets they operate in and not serve those areas of the country or housing forms they deem to be less profitable. The 10% difference in the government guarantee between CMHC and private insurers compensates CMHC for this difference.
CMHC continues to be the only mortgage loan insurer for large multi-unit residential properties, including nursing and retirement homes. Our exclusive support for these forms of housing is critically important to the supply and maintenance of a range of housing options in Canada. CMHC is also the primary insurer for housing in rural areas and smaller Canadian markets. Each year, we target 33% of our total rental and high ratio homeowner volumes to be in areas or for housing options that are less well served or not served at all by the private sector. We have exceeded this target consistently over the years and again in 2011 when 46.5% of our total rental and high ratio business addressed gaps in the marketplace left by private sector competitors.
Approved units addressing market gaps (multi-unit residential properties and high ratio1 homeowner properties in rural areas and smaller communities)
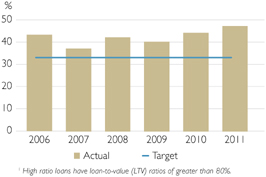
In 2011, the regional breakdown of our total multi-unit residential properties and high ratio homeowner business was as follows:
Distribution of approved units
for multi-unit residential properties and
% high ratio1 homeowner properties
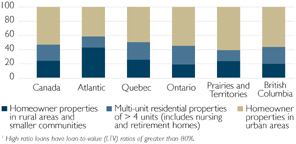
Total insurance-in-force – managing risk prudently
CMHC’s total insurance-in-force, which represents the risk exposure of the CMHC Mortgage Loan Insurance Activity, increased to approximately $567 billion in 2011, approximately 10% higher than the total insurance-in-force of $514 billion at the end of 2010. Approximately $286 billion of the 2011 insurance-in-force results from high ratio homeowner activity; that is, loans with an original loan to value greater than 80%. A further $38 billion results from insuring multi-unit properties. The balance of $243 billion results from low ratio portfolio insurance activity; that is, loans with an original loan to value of 80% or less.
| Insurance-in-force |
2010 Actual |
2011 |
2012 Plan |
|||||||||||||
| Plan | Actual | |||||||||||||||
|
Total ($B) |
514 | 533 | 567 | 557 | ||||||||||||
|
High ratio homeowner |
274 | 299 | 286 | 291 | ||||||||||||
|
Low ratio portfolio |
209 | 205 | 243 | 230 | ||||||||||||
|
Multi-unit residential |
31 | 29 | 38 | 36 | ||||||||||||
Since the liquidity crisis began in the fall of 2008, CMHC’s low ratio portfolio insurance volumes increased from $103 billion at the end of 2007 to $243 billion at the end of 2011. Portfolio insurance provides lenders with the ability to purchase insurance on pools of previously uninsured low ratio mortgages.
60 C A N A D A M O R T G A G E A N D H O U S I N G C O R P O R A T I O N
In late 2011, CMHC received an unexpected level of requests for large amounts of CMHC portfolio insurance. As a result, a portfolio insurance allocation process was established. The allocation process will ensure equitable access to portfolio insurance within CMHC’s annual limits. There is no impact on the availability of CMHC’s high ratio and multi-unit mortgage loan insurance. Additionally, this will not impact the cost of buying a house.
The 2012 plan was based on reaching $545 billion of insurance-in-force by the end of 2011. This was exceeded largely as a result of low ratio portfolio insurance activity. In future years, the insurance-in-force amount will increase as insurance is provided to qualified homebuyers, multi-unit borrowers and through allocated amounts of portfolio insurance. This is off-set by insured mortgages being paid off, which serves to decrease the insurance-in-force amount. CMHC expects mortgage repayments to continue at a rate of approximately $60 billion a year.
The profile of CMHC’s insurance-in-force demonstrates the nature and level of risk associated with CMHC’s mortgage loan insurance business. CMHC manages its insurance business in a financially prudent manner, including following OSFI guidelines in setting capital levels. In particular, CMHC has a capital holding target of 200% MCT, with an actual holding level of 226% MCT at the end of 2011, more than twice the minimum capital required by OSFI.
All applications for CMHC mortgage loan insurance are carefully reviewed and assessed by lenders prior to submission and again independently by CMHC prior to approval. CMHC’s due diligence includes an assessment of a combination of property, market and borrower risk factors including the level and source of down payment and stringent credit requirements demonstrating the borrower’s ability to manage financial obligations.
The total of outstanding insured amounts of all CMHC-insured loans may not exceed $600 billion. This limit was increased from $450 billion in 2008. CMHC continues to manage its mortgage loan insurance business in accordance with this $600 billion limit.
Average equity in CMHC’s insured portfolio was 44% in 2011
The vast majority of CMHC-insured mortgages currently have loan-to-value ratios of 80% or less based on updated property values. The average equity in CMHC’s insured portfolio in 2011 has remained constant from 2010 at 44%.
| Distribution of homeowner insurance-in-force by loan-to-value (LTV) ratio based on updated property values (%) |
||||||||||||||||
| 2010 | 2011 | |||||||||||||||
| High ratio | Low ratio | |||||||||||||||
| Overall | homeowner | portfolio | Overall | |||||||||||||
|
£ 50% |
22 | 9 | 36 | 22 | ||||||||||||
| > 50.01 £ 60% |
12 | 5 | 18 | 12 | ||||||||||||
| > 60.01 £ 70% |
15 | 11 | 21 | 16 | ||||||||||||
| > 70.01 £ 80% |
21 | 26 | 24 | 25 | ||||||||||||
| > 80.01 £ 90% |
21 | 32 | 1 | 17 | ||||||||||||
| > 90.01 £ 95% |
7 | 14 | 0 | 7 | ||||||||||||
| > 95% |
2 | 3 | 0 | 1 | ||||||||||||
| Average |
||||||||||||||||
| loan-to-value |
56 | 67 | 44 | 56 | ||||||||||||
| Average equity |
44 | 33 | 56 | 44 | ||||||||||||
In selecting conservative mortgage terms, borrowers have demonstrated that they are aware of, and sensitive to, the risks in the current environment when managing their mortgages. About 75% of the high ratio loans approved in 2011 were fixed rate mortgages (76% in 2010) and about 88% were for more than three years (85% in 2010), thereby limiting the impact on borrowers of possible increases in interest rates.
Average amortization period at time of approval is 25 years
Borrowers have also been conservative with their chosen amortization period. While they can choose a period of up to 30 years, the average amortization at the time of approval for all CMHC-insured homeowner and multi-unit loans is well below this.
61
| Insurance-in-force by amortization (years) | ||||||||
| 2010 | 2011 | |||||||
| High and | ||||||||
| low ratio | Multi-unit | |||||||
| Overall | homeowner | residential | Overall | |||||
| Average amortization period | 24 | 25 | 24 | 25 | ||||
In addition, some 33% of CMHC-insured high ratio borrowers are consistently ahead of their scheduled amortization by at least one mortgage payment per year and this figure rises to 64% when we look at those who are ahead of their payment schedule by any amount. Accelerated payments shorten the overall amortization period, reduce interest costs, increase equity in the home at a faster rate and lower risk over time.
The average outstanding loan amount per household for all homeowner loans was $162,157 at the end of 2011, reflecting the regular amortization of loan balances as well as accelerated payments by borrowers.
| Distribution of insurance-in-force by loan amount (%) | ||||||||||||||||||||
| 2010 | 2011 | |||||||||||||||||||
| Overall |
High ratio home- owner |
Low ratio portfolio |
Multi-unit residential |
Overall |
||||||||||||||||
|
Over $550,000 |
4 | 4 | 6 | - | 5 | |||||||||||||||
|
Over $400,000 to $550,000 |
7 | 8 | 8 | - | 8 | |||||||||||||||
|
Over $250,000 to $400,000 |
25 | 31 | 26 | 1 | 26 | |||||||||||||||
|
Over $100,000 to $250,000 |
47 | 47 | 46 | 18 | 45 | |||||||||||||||
|
Over $60,000 to $100,000 |
10 | 7 | 9 | 34 | 9 | |||||||||||||||
|
Under $60,000 |
7 | 3 | 5 | 47 | 7 | |||||||||||||||
|
Average loan amount per household ($) |
137,349 | 171,470 | 150,707 | 50,361 | 141,290 | |||||||||||||||
Average credit scores on the rise
Canadian credit scores generally range between 300 and 900. The higher the score, the more favourably lenders look upon the borrower as a credit risk. To qualify for a CMHC-insured or privately-insured mortgage loan backstopped by the Government of Canada, a minimum credit score of 600 is required.
CMHC has been able to maintain its strong market position and manage its risk through prudent underwriting practices. This is demonstrated by an average credit score of 724 for CMHC’s high ratio homeowner insurance-in-force in 2011. The high average credit score also demonstrates a strong ability among homebuyers with CMHC-insured mortgages to manage their debts.
| Distribution of homeowner loan borrowers by credit score | ||||||||||||||||
| at origination (%) insurance-in-force as at year end | ||||||||||||||||
| 2010 | 2011 | |||||||||||||||
| High ratio homeowner |
Low ratio portfolio |
High ratio homeowner |
Low ratio portfolio |
|||||||||||||
|
No score |
2 | 3 | 1 | 1 | ||||||||||||
|
= 0 < 600 |
1 | 1 | 1 | 1 | ||||||||||||
|
³ 600 < 660 |
10 | 6 | 9 | 5 | ||||||||||||
|
³ 660 < 700 |
15 | 11 | 16 | 10 | ||||||||||||
|
³ 700 |
72 | 79 | 73 | 83 | ||||||||||||
|
Average |
||||||||||||||||
| credit score |
722 | 749 | 724 | 752 | ||||||||||||
| Distribution of homeowner loan borrowers by credit score | ||||||||||||||||
| at origination (%) approved during the year | ||||||||||||||||
| 2010 | 2011 | |||||||||||||||
| High ratio homeowner |
Low ratio portfolio |
High ratio homeowner |
Low ratio portfolio |
|||||||||||||
|
No score |
0 | 0 | 0 | 0 | ||||||||||||
|
= 0 < 600 |
0 | 1 | 0 | 1 | ||||||||||||
|
³ 600 < 660 |
9 | 4 | 8 | 3 | ||||||||||||
|
³ 660 < 700 |
17 | 9 | 16 | 8 | ||||||||||||
|
³ 700 |
74 | 86 | 76 | 88 | ||||||||||||
|
Average |
||||||||||||||||
| credit score |
731 | 753 | 734 | 757 | ||||||||||||
62 C A N A D A M O R T G A G E A N D H O U S I N G C O R P O R A T I O N
Geographic diversification
Consistent with its mandate, CMHC provides mortgage insurance in all Canadian markets, helping to spread portfolio risk nationwide across all provinces and territories each with a distinct economic outlook.
| Distribution of insurance-in-force by province/territory (%) | ||||||||||||||||||||
| 2010 | 2011 | |||||||||||||||||||
| Overall | High ratio homeowner |
Low ratio portfolio |
Multi-unit residential |
Overall | ||||||||||||||||
|
Ontario |
43.0 | 38.0 | 46.8 | 38.1 | 41.9 | |||||||||||||||
|
British Columbia |
16.3 | 12.5 | 20.4 | 13.5 | 16.0 | |||||||||||||||
|
Alberta |
15.3 | 16.6 | 14.8 | 11.7 | 15.6 | |||||||||||||||
|
Quebec |
15.7 | 19.9 | 10.8 | 27.2 | 16.5 | |||||||||||||||
|
Nova Scotia |
2.3 | 2.7 | 1.7 | 3.1 | 2.3 | |||||||||||||||
|
Saskatchewan |
2.0 | 2.7 | 1.9 | 1.5 | 2.2 | |||||||||||||||
|
Manitoba |
2.1 | 3.1 | 1.7 | 2.8 | 2.4 | |||||||||||||||
|
New Brunswick |
1.6 | 2.2 | 0.8 | 1.0 | 1.5 | |||||||||||||||
|
Newfoundland and Labrador |
1.1 | 1.5 | 0.8 | 0.3 | 1.1 | |||||||||||||||
|
Prince Edward Island |
0.3 | 0.3 | 0.2 | 0.2 | 0.2 | |||||||||||||||
|
Territories |
0.3 | 0.5 | 0.1 | 0.6 | 0.3 | |||||||||||||||
Low arrears rates
The strength of CMHC’s mortgage loan insurance portfolio is further demonstrated in its arrears rate. At 0.41%, CMHC’s arrears rate is in line with the industry trend as reported by the Canadian Bankers Association (CBA). The arrears rate has declined since 2010. CMHC expects arrears to moderate in 2012 and going forward as economic conditions continue to improve.
Arrears Rates (%)
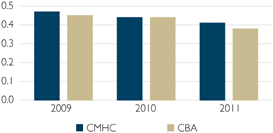
CMHC calculates the arrears rate as the ratio of all loans that are more than 90 days past due to the number of outstanding insured loans. The ratio includes all arrears whether or not legal action has been initiated by the lender and whether or not work-outs have been approved by CMHC. The base represents outstanding insured loans. CMHC’s ratio is the same as that used by CBA for reporting arrears rates at an industry level. Some other published industry measures remove some arrears or use all insured loans, whether currently outstanding or not, as a base. CMHC’s arrears rate, while more conservative than these other measures, provides a more meaningful representation of the performance of the business.
63
FINANCIAL ANALYSIS OF THE MORTAGE LOAN INSURANCE ACTIVITY UNDER STRATEGIC PRIORITY 2.1
Revenues from the Mortgage Loan Insurance Activity are comprised of insurance premiums, application fees for insuring loans for multi-unit properties and income earned on its investment portfolio. Premiums and fees are received at the inception of the mortgage insurance policy and are recognized as revenue over the period covered by the insurance contract using actuarially determined factors that reflect the long-term pattern for default risk. These factors are reviewed annually by CMHC’s appointed external actuary.
As CMHC is mandated to operate its mortgage loan insurance business on a commercial basis, the premiums and fees it collects and the interest it earns must cover the related claims and other expenses. They must also provide a reasonable rate of return to the Government of Canada. CMHC’s Mortgage Loan Insurance Activity is operated at no cost to Canadian taxpayers.
| ($M) | 2010 | 2011 | 2012 | |||||||||||||||||
| (except otherwise indicated) | Actual | Plan | Actual | Variance | Plan | |||||||||||||||
|
Premiums, Fees and Other Income earned |
1,743 | 1,891 | 1,798 | (93) | 1,796 | |||||||||||||||
|
Investment Income |
590 | 611 | 602 | (9) | 615 | |||||||||||||||
|
Net Unrealized Gains (Losses) from Financial Instruments |
11 | - | (81) | (81) | - | |||||||||||||||
|
Net Realized Gains (Losses) from Financial Instruments |
95 | 62 | 251 | 189 | 133 | |||||||||||||||
|
Interest Expense |
- | - | 3 | 3 | - | |||||||||||||||
|
Operating Expenses |
186 | 212 | 193 | (19) | 201 | |||||||||||||||
|
Net Claims, comprised of: |
||||||||||||||||||||
|
Losses on Claims |
678 | 805 | 617 | (188) | 658 | |||||||||||||||
|
Change in Provision for Claims |
(181) | (15) | (55) | (40) | (33) | |||||||||||||||
|
Income Taxes |
481 | 403 | 476 | 73 | 387 | |||||||||||||||
|
Net Income |
1,275 | 1,159 | 1,336 | 177 | 1,331 | |||||||||||||||
|
Average Claim Paid ($K) |
61 | 64 | 61 | (3) | 64 | |||||||||||||||
|
Premiums and Fees Received (total): |
1,941 | 2,212 | 1,653 | (559) | 1,671 | |||||||||||||||
|
Homeowner |
88% | 90% | 86% | (4%) | 87% | |||||||||||||||
|
Multi-unit > 4 |
12% | 10% | 14% | 4% | 13% | |||||||||||||||
|
Operating Expense Ratio (per cent) |
10.7% | 11.2% | 10.8% | (0.4%) | 11.2% | |||||||||||||||
|
Severity Ratio1 (per cent) |
32.7% | 32.0% | 32.4% | 0.4% | 33% | |||||||||||||||
|
Mortgage Loan Insurance Retained Earnings |
|
9,061 |
|
|
10,079 |
|
|
10,299 |
|
|
220 |
|
|
11,921 |
| |||||
|
Mortgage Loan Insurance Appropriated Capital: |
||||||||||||||||||||
|
Appropriated Retained Earnings |
8,201 | 9,414 | 9,028 | (386) | 9,154 | |||||||||||||||
|
Accumulated Other Comprehensive Income |
587 | 219 | 884 | 665 | 491 | |||||||||||||||
|
Total Appropriated Capital |
8,788 | 9,633 | 9,912 | 279 | 9,645 | |||||||||||||||
|
Unappropriated Retained Earnings |
860 | 665 | 1,271 | 606 | 2,767 | |||||||||||||||
|
Total Equity |
9,648 | 10,298 | 11,183 | 885 | 12,412 | |||||||||||||||
|
Capital Available to Minimum Capital Required (100% MCT) |
220% | 214% | 226% | 12% | 257% | |||||||||||||||
| 1 | The Severity Ratio is the ratio of the loss on claim compared to the original insured loan amount. |
64 C A N A D A M O R T G A G E A N D H O U S I N G C O R P O R A T I O N
Mortgage Loan Insurance Net Income for 2011 was $1,336 million, $61 million (5%) higher than 2010, and $177 million higher than planned.
The variance to plan is largely caused by significantly higher than planned Realized Gains from Financial Instruments and lower than planned Net Claims. These variances were partially offset by lower than planned Premiums and Fees as well as higher than planned Unrealized Losses from Financial Instruments.
Due in part to federal adjustments to the mortgage insurance guarantee parameters in 2011, lower premium receipts led to lower than planned premiums and fees earned. The decrease was tempered by a change in the premium earning recognition patterns. The patterns were changed to more closely reflect the emerging nature of claim occurrence experience.
In 2011, Net Realized Gains on Financial Instruments were $251 million, $156 million (164%) higher than 2010, and $189 million (305%) higher than planned, reflecting the impact of significantly higher fixed-income security prices (which represent about 80% of the total investment portfolio) than was expected in the plan.
Net Claims are comprised of two components: Losses on Claims and the change in the Provision for Claims. Losses on Claims decreased by $61 million in 2011 compared to 2010 and were significantly lower than plan as the impact of economic conditions was more favourable than forecast. As employment levels continue to improve, CMHC expects arrears to moderate throughout 2012. Due to the approximately one-year lag between arrears and claims, claims levels are expected to remain near historic norms in 2012. For the most part, the anticipated increase in Losses
on Claims is in line with higher levels of insurance-in-force and expected increases in average mortgage amounts coming to claim.
The Provision for Claims is an estimate of losses on mortgages that are already in arrears but have not been reported as a claim by the lender. It is an estimate because many of these mortgages will benefit from work-outs allowing borrowers to remain in their homes. As a result of the better than expected economic conditions in 2011 mentioned above, as well as the support CMHC provides to lenders to help borrowers in financial difficulty, fewer mortgages in arrears went to claim than expected. The result was a $40 million larger than planned decrease in Provision for Claims.
The severity ratio is the ratio of the loss on claims compared to the original insured loan amount. The severity ratio on loans that went to claim was only impacted slightly by the recession and remains close to long-run averages.
Insurance Retained Earnings are set aside for capitalization purposes based on a 200% MCT (Minimum Capital Test) holding level target established by CMHC’s Board of Directors. On the basis of this target, CMHC’s Mortgage Loan Insurance Activity is fully capitalized with Appropriated Retained Earnings of $9,028 million and AOCI of $884 million. Appropriated Retained Earnings were lower than plan due to lower than planned business volumes in 2010 and in the first half of 2011, resulting in lower capital appropriations required to achieve CMHC’s capital holding target (200% MCT). In addition, significantly higher than planned AOCI reduced required capital appropriations.
65
Unappropriated Retained Earnings were higher than planned due to lower capital appropriations, higher than planned AOCI and higher than planned net income.
Total Mortgage Loan Insurance Available Capital, consisting of Total Equity adjusted for Deferred Acquisition Costs, resulted in a 226% MCT at year-end, well over twice the minimum capital required by OSFI.
Effective 1 January 2012, new elements have been introduced by OSFI to the capital management guidelines related to mortgage loan insurance companies. These elements include refining the asset risk factors applied to balance sheet assets and adding a new capital factor for interest rate risk related to interest rate-sensitive assets and liabilities. These new elements are estimated to have the effect of reducing the 31 December 2011 MCT level of 226% MCT to 211% MCT as at 1 January 2012, which is greater than CMHC’s target holding level of twice the minimum capital required by OSFI.
LOOKING AHEAD
CMHC will continue to responsibly provide homeowner and rental mortgage loan insurance in all parts of the country, including in areas or markets not served or well served by private mortgage insurers, while strengthening our relationships with lenders through key account management strategies and related initiatives. We will enhance our quality assurance system and assist lenders in better understanding risks as well as opportunities. Research into the impact of regulatory reforms in Canada and elsewhere will be undertaken.
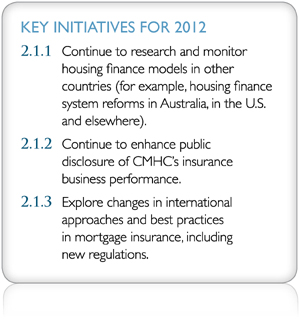
66 C A N A D A M O R T G A G E A N D H O U S I N G C O R P O R A T I O N

| STRATEGIC PRIORITY |
2.2 | ENSURE AN ADEQUATE SUPPLY OF LOW-COST FUNDS FOR MORTGAGE LENDING THROUGH MORTGAGE SECURITIZATION |
| RESOURCES • Operating expenses: $9 million1 • Staff-Years: 61 |
CMHC’s securitization programs contribute to a strong and stable Canadian housing finance system by providing lenders and, in turn, borrowers access to low-cost funds for residential mortgages.
CMHC’s securitization programs guarantee the timely payment of interest and principal of National Housing Act Mortgage-Backed Securities (NHA MBS) issued by financial institutions and of Canada Mortgage Bonds (CMB) issued by the Canada Housing Trust (CHT). These activities are commercial in nature and do not receive Parliamentary appropriations.
Under the NHA MBS program, Approved Issuers pool insured residential mortgages into marketable NHA MBS which provide investors with opportunities to hold high-quality, secure investments in Canadian residential mortgages. This enhances the efficiency of and increases competition in the mortgage market which contributes to lower funding costs for mortgages. Through the CMB program, CHT sells CMB to domestic and international investors with the proceeds used to purchase NHA MBS. This further enhances the supply of low-cost mortgage funds for Canadians.
The NHA MBS and CMB programs are highly successful and important pillars of Canadian financial institutions’ diversified mortgage funding platforms. The programs’ reliable low-cost funding framework is especially beneficial to smaller mortgage lenders who
lack the scale of their larger counterparts but who, through CMHC’s securitization programs, can access residential mortgage funding. In the end, Canadians seeking mortgage financing benefit from these programs through enhanced competition in the mortgage market.
| 1 | Includes issuance costs from the Securitization Activity which are deferred and amortized for financial statement purposes |
67
| Performance Measures |
2010 |
2011 | 2012 | |||||||||||||
| Actual | Plan | Actual | Plan | |||||||||||||
|
Annual securities guaranteed ($M) |
95,069 | 52,000 | 116,725 | 64,000 | ||||||||||||
|
§ Market NHA MBS |
47,484 | 20,000 | 75,475 | 24,000 | ||||||||||||
|
§ CMB |
39,380 | 32,000 | 41,250 | 40,000 | ||||||||||||
|
§ NHA MBS for IMPP |
8,205 | N/A | N/A | N/A | ||||||||||||
|
Operating expense ratio (per cent) |
4.1 | < 9 | 4.4 | < 9 | ||||||||||||
|
Per cent of outstanding residential mortgages securitized |
26 | 21 | 271 | 21 | ||||||||||||
| 1 | Information as at October 2011 |
PERFORMANCE ANALYSIS
For the year ended 31 December 2011, a total of $117 billion in low-cost mortgage funds was provided to mortgage lenders through securities guaranteed by CMHC. This exceeds the 2011 plan of $52 billion by $65 billion.
The CMB program provided $41 billion against a plan of $32 billion in funding to mortgage lenders despite challenging capital market conditions. As an issuer in the global marketplace, the CMB program is not immune from broader market volatility and prudence is followed to right-size CMB issuance(s), balancing funding demand with investor expectations and preserving the cost-effectiveness of the program.
The NHA MBS program provided $75 billion against a plan of $20 billion in market NHA MBS. In addition to NHA MBS market transactions sold to investors, issuers are increasingly using market NHA MBS for liquidity, collateral and balance sheet purposes.
With the $117 billion guaranteed in 2011, CMHC’s total outstanding guarantees-in-force is $362 billion as at 31 December 2011 compared with $326 billion for the same period last year.
Importance of CMHC’s securitization programs
Since the introduction of CMHC’s securitization guarantee programs, approximately $900 billion in insured residential mortgages have been securitized.
Of this total, approximately 44% ($393 billion) was in the form of market NHA MBS issued by Approved Issuers for sale to investors (outside of CMB) and/or used for balance sheet management or collateral for liquidity facilities/programs. This demonstrates the importance of the NHA MBS program in providing a robust framework for Approved Issuers to transform insured residential mortgage loan assets into high-quality secure investments. Similarly, the CMB program plays a crucial role in further enhancing the supply of low-cost mortgage funding for program participants, particularly small institutions.
NHA MBS Volumes ($B)
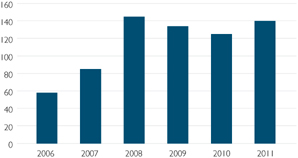
68 C A N A D A M O R T G A G E A N D H O U S I N G C O R P O R A T I O N
In 2011, the percentage of residential mortgages securitized through CMHC’s securitization programs was 27% of the outstanding residential mortgage loans.
The reliability and cost-effectiveness of CMHC’s securitization programs were clearly demonstrated during the global financial crisis which occurred between the fall of 2007 and the spring of 2010. This is reflected in the volume of insured residential mortgages securitized and the relative spread differential between these programs and the major wholesale funding source of large financial institutions compared to the Government of Canada five-year yield.
Comparative Spreads to 5-year Canadas
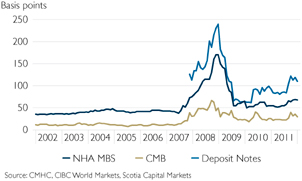
Support for small lenders and competition in the mortgage market
Small lenders are important in maintaining a competitive Canadian mortgage market as they compete with the established larger lenders on the basis of costs, products and terms. During the recent global financial crisis, both large and small lenders found it more difficult to access liquidity and funding as their traditional sources were frozen, with implications for the flow of mortgage credit in Canada.
CMHC’s securitization programs in general, and the CMB program in particular, played an important role in providing access to reliable and cost-effective funding to both large and small lenders during those challenging times.
Prior to the global financial crisis, small lenders accounted for approximately 14% of insured residential mortgages securitized though CMHC’s securitization programs. With the increase in the number of small lenders who sought access to CMHC’s programs, the participation rate increased from 14% to approximately 22% as at December 2011. Under the CMB program, the increase in the participation of small lenders is even more pronounced, moving from 19% in 2006 to 40% as at December 2011.
Distribution of CMB Volumes
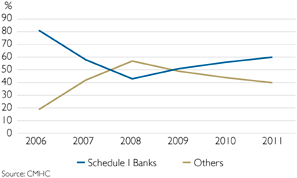
The reliability and the volume of funding that CMHC’s securitization programs provide to small lenders ensure that they continue to play an important role in maintaining the competitiveness of the Canadian residential mortgage market.
Meeting the mortgage needs of Canadians
CMHC has responded to the wider range of mortgage choices sought by Canadians through the introduction of NHA MBS pool types that allowed lenders to offer and securitize new mortgage products. Expanding CMB terms and offerings to include 10-year and Floating Rate Notes also facilitated cost-effective funding to support a wider range of term structures that enables mortgage lenders to address the current and emerging mortgage choices of Canadians.
69
Prudent risk management
Since the inception of CMHC’s securitization programs, there has never been a loss under these programs. They fulfill CMHC’s objective of enhancing the supply of reliable low-cost funding for mortgage lending in Canada and the competitiveness of the mortgage industry without additional risk to the Government of Canada and, by extension, to the Canadian taxpayer.
Risk exposures under the timely payment guarantee are managed through robust risk mitigating practices including stringent approval criteria for program participants. Moreover, the commercial nature of
CMHC’s securitization programs contributes to CMHC’s Net Income and, as such, helps to improve the Government’s fiscal position.
Enhancements to securitization products and programs
Enhancements to securitization products, policies, and operations were undertaken in 2011 to improve the programs’ efficiency and effectiveness and, in particular, to enhance the ability of smaller lenders to access our securitization programs.
FINANCIAL ANALYSIS OF THE SECURITIZATION ACTIVITY
AND CANADA HOUSING TRUST UNDER STRATEGIC PRIORITY 2.2
| 00000000000 | 00000000000 | 00000000000 | 00000000000 | 00000000000 | ||||||||||||||||
| ($M) | 2010 Actual |
2011 |
2012 Plan |
|||||||||||||||||
| Plan | Actual | Variance | ||||||||||||||||||
| SECURITIZATION |
||||||||||||||||||||
|
Interest Income from NHA MBS - Loans and Receivables |
1,753 | 1,956 | 1,747 | (209) | 1,685 | |||||||||||||||
|
Fees and Other Income |
208 | 202 | 229 | 27 | 179 | |||||||||||||||
|
Income from Investment Securities |
38 | 44 | 41 | (3) | 46 | |||||||||||||||
|
Net Gains (Losses) from Financial Instruments |
6 | - | 27 | 27 | (1) | |||||||||||||||
|
Interest Expense |
1,753 | 1,956 | 1,747 | (209) | 1,685 | |||||||||||||||
|
Operating Expenses |
9 | 9 | 10 | 1 | 12 | |||||||||||||||
|
Income Taxes |
68 | 63 | 76 | 13 | 53 | |||||||||||||||
|
Net Income |
175 | 174 | 211 | 37 | 159 | |||||||||||||||
|
Securitization Appropriated Capital: |
||||||||||||||||||||
|
Appropriated Retained Earnings |
707 | 703 | 699 | (8) | 730 | |||||||||||||||
|
Accumulated Other Comprehensive Income |
40 | 27 | 57 | 17 | 15 | |||||||||||||||
|
Total Appropriated Capital |
747 | 730 | 756 | 9 | 745 | |||||||||||||||
|
Unappropriated Retained Earnings |
38 | 202 | 252 | 214 | 367 | |||||||||||||||
|
Securitization Retained Earnings |
745 | 905 | 951 | 223 | 1,097 | |||||||||||||||
|
% of Equity against Target Capital |
105% | 128% | 133% | 28% | 149% | |||||||||||||||
|
CANADA HOUSING TRUST |
||||||||||||||||||||
|
Interest Income from NHA MBS - Loans and Receivables |
6,236 | 6,718 | 6,527 | (191) | 7,053 | |||||||||||||||
|
Fees and Other Income |
166 | 137 | 175 | 38 | 168 | |||||||||||||||
|
Interest Expense |
6,228 | 6,713 | 6,518 | (195) | 7,046 | |||||||||||||||
|
Operating Expenses |
174 | 142 | 184 | 42 | 175 | |||||||||||||||
|
Net Income |
- | - | - | - | - | |||||||||||||||
70 C A N A D A M O R T G A G E A N D H O U S I N G C O R P O R A T I O N
Securitization interest income and interest expense were both $209 million below plan largely due to earlier than planned repayments on the Insured Mortgage Purchase Program (IMPP). The interest income and interest expense variances largely offset each other. Net Income from Securitization was $211 million which was $37 million higher than plan. The variance is due to higher than planned net gains from investments, as well as higher than planned fees as a result of greater than planned volumes of NHA MBS and CMB issued.
CMHC’s Securitization capitalization methodology is based on regulatory and economic capital principles. Total Securitization Retained Earnings at 31 December 2011 were $951 million of which $699 million was appropriated for capitalization. As at 31 December 2011, the Securitization Activity had Appropriated Retained Earnings and AOCI representing 100% of its Target Capital. Target Capital increased from $747 million in 2010 to $756 million in 2011 due to an increase in NHA MBS guaranteed.
At $6,527 million and $6,518 million, CHT’s interest income and interest expense were $191 million and $195 million below plan, respectively, largely due to lower than planned interest rates on CMB issuances.
LOOKING AHEAD
The adoption of International Financial Reporting Standards (IFRS) and new rules under the Basel Committee on Banking Supervision (BCBS) are having an impact on lenders’ capital management liquidity strategies. We expect CMHC’s securitization guarantee programs to remain an important component of these strategies as lenders diversify their funding platforms.
Although CMHC’s securitization programs have proven resilient during the economic downturn, they are not immune to broader market disruptions. We will analyze emerging regulatory issues, propose program enhancements, as appropriate, and work with the industry in order to be responsive to their needs.
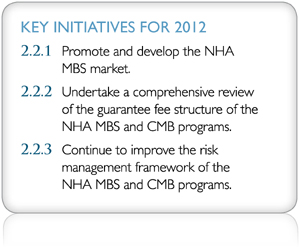
71
| STRATEGIC PRIORITY | 2.3 | PROVIDE COMPREHENSIVE, TIMELY AND RELEVANT MARKET ANALYSIS INFORMATION | ||
| RESOURCES • Operating expenses: $42 million • Staff-Years: 312 |
| 00000000000000 | 00000000000000 | 00000000000000 | 00000000000000 | |||||
| 2011 | ||||||||
| Performance Measures | 2010 | 2012 | ||||||
| Actual | Plan | Actual | Plan | |||||
|
Per cent of subscribers to market analysis publications who found them useful |
92 | 93 | 93 | 93 | ||||
|
Per cent of attendees at Housing Outlook Conferences who found them useful |
99.7 | 95 | 99.1 | 95 | ||||
|
Forecast accuracy of housing starts (per cent) |
-13.2% |
Within 10% |
-9.9 |
Within 10% | ||||
|
Ranking of housing starts forecast accuracy among forecasters |
7th among 17 |
Rank within |
10th
among 15 |
Rank within top quartile | ||||
PERFORMANCE ANALYSIS
CMHC is the only comprehensive source of local and national housing market information in Canada and provides regular analyses and forecasts at the local, provincial and national levels as well as customized research for internal and external clients. Market analysis presentations reached a total audience of 30,000 housing industry members, including 5,000 who attended 19 Housing Outlook Conferences. Overwhelmingly, both subscribers to our market analysis publications and participants at our housing outlook conferences consistently find these services useful. In order to continue to improve service to market analysis clients, CMHC is enhancing its databases and web interfaces to allow for increased flexibility and customization in accessing data.

“For decades CMHC has produced respected reports on rental vacancies and rents in the purpose-built rental universe. But instead of resting on its laurels, CMHC has been very responsive in expanding the reports to include even more extensive information, including data on the growing secondary rental markets across Canada. As a major stakeholder, CFAA is very pleased with CMHC’s approach to producing the data which we and our members need.”
– John Dickie, President, Canadian
Federation of Apartment Associations (CFAA),
user of CMHC’s market analysis information
Continued economic volatility affected the achievement of our target for forecast accuracy of housing starts in 2011. While we achieved our target of being within 10% of actual starts, we did not rank within the top quartile, coming 10th among 15 forecasters.
LOOKING AHEAD
While Canada’s housing markets have remained relatively stable and resilient in the face of global economic uncertainty, CMHC is continuing to re ne models and techniques to monitor and evaluate house prices.
Debt-to-income ratios have risen. CMHC is continuing to monitor the financial health of households and their ability to meet their financial obligations.
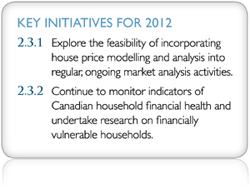
72 C A N A D A M O R T G A G E A N D H O U S I N G C O R P O R A T I O N

| OBJECTIVE 3 | ENSURE THE CANADIAN HOUSING SYSTEM REMAINS ONE OF THE BEST IN THE WORLD |
Under this objective, CMHC pursues two strategic priorities: research and information transfer under 3.1 and the promotion of housing industry exports abroad under 3.2. Both priorities strengthen the housing industry by advancing sustainable technologies and practices. CMHC’s research and information transfer activities also assist Canadians to make informed housing decisions.
| STRATEGIC PRIORITY | 3.1 | UNDERTAKE COMPREHENSIVE, TIMELY AND RELEVANT RESEARCH AND INFORMATION TRANSFER ACTIVITIES TO ENABLE CANADIAN CONSUMERS AND THE HOUSING SECTOR TO MAKE INFORMED DECISIONS | ||
| RESOURCES • Operating expenses: $10 million • Staff-Years: 54 |
| 00000000000 | 00000000000 | 00000000000 | 00000000000 | |||||
| 2011 | ||||||||
| Performance Measures | 2010 | 2012 | ||||||
| Actual | Plan | Actual | Plan | |||||
|
Per cent of attendees at information transfer seminars who found them useful |
95 | 90 | 92 | 90 | ||||
|
Per cent of recipients of newly published Research Highlights who found them useful |
72 | 70 | 70 | 70 | ||||
|
Per cent of recipients of newly published About Your House fact sheets who found them useful |
87 | 80 | 86 | 80 | ||||
PERFORMANCE ANALYSIS
The period from 1946 to 1965 was characterized by a rapid expansion of Canada’s housing production capability in response to the post-war housing shortage and the subsequent economic growth and baby boom of the 1950s and 1960s.1 CMHC, known as Central Mortgage and Housing Corporation until 1979, had a major role in the design and delivery of post-war housing, in municipal planning and infrastructure funding and, generally, in the development of the Canadian housing system.
Over the decades since, many innovations in Canadian housing have occurred. CMHC continues to be one of the premier sources of socio-economic and technical housing research and information products in Canada.
In 2011, we distributed close to one million copies of housing information products, including those downloaded from our website, that helped both the industry and consumers make informed decisions. More importantly, our information products are consistently highly rated. As mentioned under strategic priority 2.1, a number of online resources and publications have been developed recently in support of efforts to increase consumer financial literacy.
This year’s Canadian Housing Observer includes additional data on residential mortgage lending activities within the context of recommendations of the Financial Stability Board (FSB). The purpose of this data is to allow lenders to benchmark their practices and to allow market observers, such as
| 1 | Source: Three Decades of Innovation in Housing Technology 1966-1996, Canada Mortgage and Housing Corporation. |
73
regulators, to identify or monitor the evolution of risk in the mortgage market. Additional information on household indebtedness, seniors’ housing and the evolution of social housing in Canada is also provided.
The Observer, coupled with the extensive online data resources, provides Canada’s housing sector with an indispensable tool for identifying, monitoring and addressing housing trends and issues. For example, the online version of the Observer enables users to customize local data tables for over 100 municipalities across Canada.
“CMHC’s publications and online resources are an invaluable source of material for the construction-related programs of the Algonquin Centre for Construction Excellence. They help our faculty stay professionally current, keep many aspects of our curriculum up to date, and provide our students with relevant information for their career in the construction industry. We always look forward to new products or updates to existing ones that are generated from CMHC’s research on new methods of construction or new technologies. With the recent opening of our new Algonquin Centre for Construction Excellence and our focus on applied research, we look forward to contributing to the research that is ongoing at CMHC, and further help enhance improvements to, and efficiencies in, the built environment.”
– Claude Brulé, Dean,
Faculty of Technology and Trades,
Algonquin College, Ottawa
Expanding our information to help immigrants settle in Canada
Most newcomers to Canada know about our biggest cities. Less well known are the many other Canadian cities ready to welcome them. In 2011, we worked on enhancing our online information product for new and prospective immigrants, Settling in Canada, to cover an additional ten cities. These ten cities, along with the ones already covered, brings the total to 21. This online product provides data on population, housing and employment.
Sustainable Housing and Communities
In the 1970s, CMHC built or sponsored a number of significant demonstration projects to illustrate the advantage of medium-density housing. Forty years later, EQuilibrium™ housing and community-based demonstration projects are helping to advance the adoption of sustainable technologies and practices in the residential sector, as is our contribution to work on the National Building Code and Natural Resources Canada’s residential energy rating systems.
In 2011, the third house under CMHC’s Northern Sustainable Housing Initiative was opened. The house, owned by the Northwest Territories Housing Corporation, is both culturally appropriate and designed to use at least 50% less energy than an equivalent house built under the 1997 Model National Energy Code for Houses.
74 C A N A D A M O R T G A G E A N D H O U S I N G C O R P O R A T I O N
“Last February 22, 39 young Haitians left their island to attend La Cité collégiale and learn the latest techniques in residential reconstruction. Registered in the Minto Trades Centre – Alphonse Desjardins campus of La Cité collégiale from the end of February to the end of May, these 39 youths followed intensive courses in construction, using methods and materials adapted for the climate and resources of their country.
At the beginning of June, the students returned to Haiti accompanied by four Cité collégiale professors who offered intense training to Haitian construction professors.
This training project was made possible by the Department of Foreign Affairs and International Trade’s Canada-Haiti Academic Projects Scholarship pilot initiative. The development of this project was also made possible by the exceptional involvement of the Canada Mortgage and Housing Corporation who, thanks to their generous gift of training materials and knowledge transfer, made it possible for the young Haitians to deepen their knowledge of residential construction techniques.”
– Serge Brousseau, Vice-president of
Planning, Innovation and Accountability,
La Cité collégiale, Ottawa
LOOKING AHEAD
Research to gain a better understanding of housing need will continue. Important areas of research are the housing needs of the aging population and of Aboriginal people, and improving the sustainability of existing housing.
As part of its research and information transfer mandate, CMHC will contribute to Government of Canada objectives of improving the financial literacy of Canadians, specifically in the area of housing finance.
Building upon the lessons learned through our EQuilibrium™ initiatives, CMHC will continue to develop information on sustainable technologies and practices that can be widely applied to housing today. Collaboration with others in the promotion of sustainable housing remains an important strategy going forward.
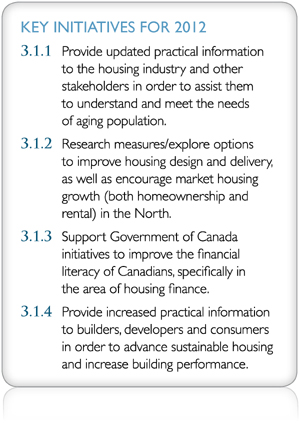
75
| STRATEGIC PRIORITY | 3.2 | SUPPORT AND PROMOTE CANADA’S WORLD-CLASS HOUSING PRODUCTS, SERVICES AND SYSTEM INTERNATIONALLY |
| RESOURCES • Operating expenses: $11 million • Staff-Years: 52 |
| 00000000000 | 00000000000 | 00000000000 | 00000000000 | |||||||||||||
| 2011 | ||||||||||||||||
| Performance Measures | 2010 | 2012 | ||||||||||||||
| Actual | Plan | Actual | Plan | |||||||||||||
|
Overall satisfaction rate of key housing export clients (per cent) |
83.5 | 85 | 86 | 85 | ||||||||||||
|
Value of CMHC-facilitated sales reported by key housing export clients ($M) |
103.3 | 120 | 138.8 | 120 | ||||||||||||
PERFORMANCE ANALYSIS
CMHC has a longstanding history of representing the Government of Canada on the international stage on matters related to housing. Our association with multilateral organizations such as UN-HABITAT has led to a sharing of expertise with countries around the world for several decades. In 1999, the National Housing Act was amended to further enable the Corporation to promote housing exports. In the years since, CMHC has helped open doors for hundreds of Canadian housing exporters and has facilitated over $1 billion in export sales for its key clients, leading to the creation of over 10,000 jobs for Canadians. We have consistently met our facilitated-sales targets. This year, in the face of tremendous challenges in the world economy and a high Canadian dollar, we have again met our target. In fact, our facilitated sales this year actually exceeded those of previous years.
In 2011, we worked closely with some 175 clients who are active housing exporters across Canada. These companies are committed to exporting and have products or services that are suitable to the markets being targeted. They include manufacturers of building products, energy efficient housing systems
and technologies as well as professional services providers such as architects, engineers, planners and project managers.
In 2011, our target markets were the United States, the United Kingdom/Ireland, France, Mexico/Caribbean, Russia, China, Japan and South Korea. While CMHC achieved its facilitated-sales target, many of these markets continue to experience economic difficulties. Due to these difficulties, our plans to promote factory-built housing in European markets were set aside.
CMHC-facilitated housing export sales by market

76 C A N A D A M O R T G A G E A N D H O U S I N G C O R P O R A T I O N

Our relationships with international organizations in our export markets are extremely important. For example, CMHC is a member of the Construction Working Group of the Canada-Russia Intergovernmental Economic Commission, a bilateral mechanism that provides a forum for both public and private sector representatives to exchange ideas and cooperate on housing issues. In addition, our longstanding relationship with Russian counterparts led to the signing of a Memorandum of Understanding (MOU) with the Russian Housing Development Foundation which is responsible for infrastructure and affordable housing. This MOU will open doors and foster business opportunities for Canadian companies exporting to or working in Russia.
In 2010, CMHC launched a training program on sustainable community planning to showcase Canadian expertise internationally. The program offers workshops on topics such as energy planning and water and waste management. We are proud that, this year, the introductory module of this program became an accredited course for continuing education credits by the American Institute of Architects and the U.S. Green Building Council. From the time of its launch in September, over 1,000 international participants had successfully completed the online course, far exceeding expectations.
77
RISK MANAGEMENT
| This section describes CMHC’s overall Enterprise Risk Management framework, the management of specific financial risks related to Lending Activity, Mortgage Loan Insurance Activity, Securitization Activity, and strategies related to insurance and securitization investment portfolios. |
| ENTERPRISE RISK MANAGEMENT (ERM)
CMHC is exposed to a variety of risks in its operating environment that could have an impact on the achievement of its objectives. The ability to respond adequately to expected and unanticipated change is critical to the organization’s success. Within this context, CMHC has an Enterprise Risk Management (ERM) framework which helps to guide the organization in its risk management activities. This framework establishes a governance structure, specifies our appetite for risk and defines, assesses and categorizes the risks that the organization is exposed to. The ERM framework and governance structure encourages a risk-aware culture where risk management is an integral part of our strategic and operational decision-making. It helps ensure that we are identifying the main risks as well as opportunities facing the Corporation, and facilitates the understanding, discussion, evaluation and management of risks at all levels of the organization.
ERM Governance
The Board of Directors is responsible for the overall corporate governance of CMHC which includes oversight of the Corporation’s ERM framework. The following diagram and accompanying details highlight the key stakeholders and their major responsibilities. |
The Board oversees the risk management activities at CMHC and establishes acceptable risk parameters through a risk appetite statement. The President and Chief Executive Officer (CEO) is accountable for ensuring that all significant risks are appropriately identified and managed within CMHC.
The President and CEO provides the Board assurance that these activities are being completed in an annual ERM Letter of Representation, included on page 87.
All members of CMHC Management play an integral role in ERM activities through their responsibilities for identifying, assessing, monitoring and reporting potential risks that may put the organization outside the tolerances expressed in the risk appetite statement. The Chief Risk Officer (CRO) is accountable for developing and maintaining an effective risk management framework for the organization. The CRO assists the President and CEO in developing and communicating the organization’s risk management objectives, risk appetite and risk management framework.
ALCO (Asset-Liability Management Committee) is a senior level committee, which draws on internal and external specialized expertise in financial management. It is involved in reviewing and approving all ERM reports prior to their presentation to the Board.
The CRO, CMHC Management and ALCO are assisted in their risk management efforts by the ERM | |
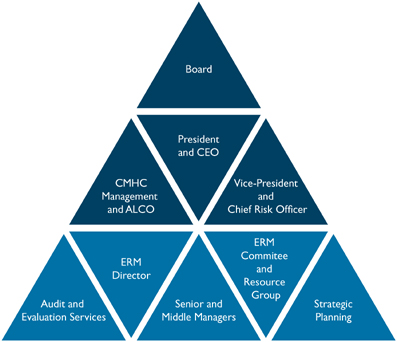
| ||
78 C A N A D A M O R T G A G E A N D H O U S I N G C O R P O R A T I O N

Committee and the Director, ERM. The ERM Committee is comprised of senior level managers and is chaired by the Director, ERM. The committee members represent the major business and risk management units and have a strong technical understanding of risks in their business units. The ERM Committee also obtains advice and support from additional subject matter experts as required. The ERM Committee is actively involved in the process of identifying and assessing risks.
The other groups and individuals shown in the ERM governance diagram all play a role in ensuring that risks are identified and assessed in a consistent manner and are mitigated as appropriate. Processes are also in place to ensure that risk identification and mitigation strategies are an integral part of the corporate planning and regular performance reporting processes.
Risk Appetite Statement
CMHC’s ERM framework includes a risk appetite statement which is designed to ensure a consistent understanding of risk exposures which are acceptable or unacceptable to the Corporation. The risk appetite statement begins with the following:
“CMHC is exposed to a variety of risks as it strives to achieve the objectives set out in its corporate and business plans. This high-level risk appetite statement describes the level at which risks should be avoided and where strategies must be implemented to manage risk.”
The statement then indicates that, during the Corporation’s five-year corporate planning horizon, it wants a very high level of confidence that:
| ¡ | spending on government-funded programs will not vary from approved funding by more than a specified percentage; |
| ¡ | exposures to financial risk expressed as a percentage of capital in the three primary business lines – mortgage loan insurance, securitization and lending – will not exceed specified risk levels; |
| ¡ | variances of operating expenses to budget will not exceed a specified maximum variance. |
The risk appetite statement also contains a subjective risk tolerance statement for the five-year planning horizon which states that:
“It is considered unacceptable that CMHC would experience a significant negative impact to the reputation of CMHC or to its ability to achieve key objectives in the business and corporate plans.”
The risk appetite statement concludes with a statement that a minimum percentage of the annual priority corporate objectives should also be achieved.
Changes to risk categories under the ERM Framework
CMHC Management continually assesses internal and external risks through the ERM framework. Effective 1 January 2011, a number of changes to risk categories and definitions were approved by the Board.

79
Previously, CMHC’s risk management framework grouped 13 risks under three broad categories: strategic, infrastructure and specific risks. These categories were changed to strategic, operational and financial risks. In addition, some changes were made to detailed risk categories including the addition of liquidity, capital adequacy and pricing risks.
Strategic Risks
Strategic risks include mandate, business environment, reputational and relational, and organizational risks. These risks mainly arise from the external environment in which CMHC operates and they expose the Corporation to potentially negative consequences if CMHC does not deal with these external factors effectively.
While these risks by nature cannot be controlled, the likelihood and magnitude of their impact can be mitigated through effective strategic risk management processes. CMHC Management, the Audit Committee and the Board of Directors oversee the governance and management processes for identifying, monitoring, mitigating and reporting strategic risks across the Corporation. The ERM group coordinates the review and assessment of these risks on a semi-annual basis. The ERM group works with business lines and key support groups to ensure that all significant strategic risks are identified.
Operational Risks
Operational risks include people, process, technology, security and catastrophic, and legal and regulatory risks. All of CMHC’s business activities are exposed to these risks. Operational risks can result in financial losses but primarily affect the ability to achieve corporate objectives and may impact CMHC’s reputation. Over the years, CMHC has continued to successfully manage these risks, ensuring an adequate alignment with its mandate and corporate objectives. Operational risks are mainly the responsibility of the business lines and are managed by each division within CMHC. Corporate support areas, including finance,
legal, human resources, information technology, administrative services and risk management develop policies, tools and processes to manage specific operational risks across the organization and ensure a consistent approach across business lines. The ERM reporting process allows an enterprise-wide review and assessment of the current risks in these areas on a semi-annual basis.
Financial Risks
Within the framework, these include credit, market, liquidity, capital adequacy and pricing risks. The nature of financial risks and risk mitigation strategies associated with CMHC Lending, Mortgage Loan Insurance and Securitization Activities are described later in this section.
The Risk Oversight Cycle
In addition to identifying and managing risks as part of the daily decision-making and risk management efforts, the Corporation has two structured processes which ensure the quality, consistency and consolidation of risk management activities. On an annual basis, the following two activities occur:
| 1. | The Audit Committee and the Board review and approve the ERM policy to ensure that it continues to be appropriate and reflects relevant best practices. |
| 2. | The corporate planning process involves the ERM group and CMHC Management in identifying potential new and emerging risks and opportunities which are then used to inform the Board’s discussions and decision-making on the corporate plan. |
In addition, on a semi-annual basis, an ERM report is provided to the Board which reports on the individual tolerances expressed in the risk appetite statement. It also identifies the most significant risks and potentially significant new and emerging risks in each of the 14 risk categories. The ERM Committee and an ERM resource group are involved in the process
80 C A N A D A M O R T G A G E A N D H O U S I N G C O R P O R A T I O N
of identifying and assessing risks. CMHC Management and ALCO review and approve the semi-annual ERM report prior to presentation to the Audit Committee and Board.
Risk Monitoring and Reporting
The CRO works closely with Management to assess changes in the environment that affect the level of risks associated with each of the risk categories and subcategories in the ERM framework. CMHC Management and the Board are kept informed of significant risks and mitigating strategies through a variety of reporting mechanisms. Quarterly financial risk reporting provides Management, the Audit Committee and the Board with details on significant financial risks and on compliance with operational and financial risk policies. The semi-annual ERM reporting package also includes details on risk mitigation strategies. Other reports to the Board include details on actuarial valuations and stress testing results.
FINANCIAL RISKS
The nature of risks and risk mitigation strategies associated with CMHC Lending, Mortgage Loan Insurance and Securitization Activities are described in further detail below.
Lending Activity
Under Objective 1: Help Canadians in need, CMHC provides loans to federally-subsidized social housing sponsors. These loans can be offered to social housing sponsors at lower interest rates because CMHC borrows funds through the Crown Borrowing Program. The main sources of risks to the Corporation in providing these loans are credit risk, prepayment risk and interest rate risk.
Credit risk
Credit risk is defined as the risk of loss due to the failure of counterparties to meet their contractual obligations. CMHC’s loan portfolio consists of loans in support of social housing programs that are either under the administration of provinces or territories or administered by CMHC directly, including those on reserve. The majority of credit risk is mitigated by either CMHC mortgage loan insurance or through recoveries from the federal, provincial, or territorial governments.
In order to manage credit risk, project level annual reports, which include audited financial statements submitted by social housing sponsors, provide CMHC with a means to detect and to intervene, as appropriate, when a project faces financial difficulty posing a credit risk to CMHC. A feasibility analysis is performed to determine the value of the property and any other collateral. Work-outs or restructuring, which may involve additional financing or assistance, are determined on a case-by-case basis.
CMHC’s Lending Activity is assured full collection of principal and accrued interest on the majority of the loans. The following illustration shows the source of guarantee/insurance on the total loan portfolio, as applicable.
Total Loan Portfolio and Source of Loans
Guarantee/Insurance, as applicable
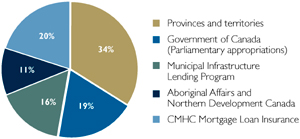
81
Nineteen per cent of assured loans are eligible for recovery from the Government of Canada through funds that CMHC receives through Parliamentary appropriations.
CMHC’s Mortgage Loan Insurance Activity covers 20%, 34% is recoverable from provinces and territories, and 11% is recoverable from Aboriginal Affairs and Northern Development Canada because these loans carry an AANDC Ministerial Loan Guarantee.
MILP loans represent 16% of the loans provided by CMHC. As at 31 December 2011, no impaired loans have been identified and no provision for loss has been recorded.
Prepayment risk
CMHC is subject to prepayment risk in some of its Lending Activities. For 2011, prepayments totalled $26 million. These prepayments were $3 million higher than experienced in 2010. Prepayments create asset-liability mismatches that must be actively managed to ensure that they do not expose the Corporation to undue levels of interest rate risk. CMHC monitors and reports these risks through quarterly scenario analyses modelled using average historical prepayment experience and on a worst case basis.
Reserve Fund for Lending Activity
Contributed Capital by the Government of Canada is $25 million. Pursuant to the CMHC Act, a Reserve Fund is established to hold profits and losses from CMHC’s lending activities. CMHC is authorized to retain up to $240 million in the Reserve Fund. Included in this limit is an amount of $115 million designated specifically to absorb fluctuations in net income arising from unrealized gains and losses incurred by the Lending Activity, with the remaining $125 million to cover general options, credit risk and prepayment/re-pricing losses.
Interest rate risk
The Corporation is exposed to interest rate risk when asset and liability principal and interest cash flows have different interest payments or maturity dates. The severity of this risk is largely dependent upon the size and direction of interest rate changes and on the size and maturity schedules of mismatched positions. Interest rate risk is mitigated through the matching of assets and liabilities and through the use of derivatives. In the Direct Lending portfolio, 97.8% of the loans are hedged. Interest rate risk is monitored and managed against internal risk tolerance limits set by ALCO. Interest rate sensitivity analyses are performed by calculating the magnitude of cash flow fluctuations caused by changes in interest rates. At a 95% confidence level, the negative change in the net interest margin for the next 12 months cannot exceed the limit of $1.5 million. This limit has never been exceeded.
Mortgage Loan Insurance Activity
The main risk of financial loss to the Corporation from its Mortgage Loan Insurance Activity is represented by the amount of future claims associated with insured mortgages relative to insurance premiums received. Economic conditions are the principal determinants that affect the incidence and magnitude of claim amounts. Changes in income, employment and, to a much lesser extent, changes in interest rates can impact a borrower’s ability to continue making mortgage payments.
Homeowner
Risks related to homeowner mortgage loan insurance are assessed through CMHC’s state-of-the-art automated underwriting system, emili. Incorporated within emili are borrower, market, property, and fraud risk assessment models. Together, these automated models provide CMHC underwriters, located in all
82 C A N A D A M O R T G A G E A N D H O U S I N G C O R P O R A T I O N
regions of the country, with the tools to effectively assess applications for mortgage loan insurance. If necessary, underwriters can then take further steps to determine if risk-mitigating actions are required to effectively reduce the overall risk to a level that is acceptable and prudent. The most effective risk mitigating actions are continually researched and updated for underwriters. Management monitors and, if necessary, adjusts its risk assessment models based on actual claims experience and local market conditions. These automated models also provide the required information framework for the design of new or modified mortgage loan insurance products and their appropriate pricing.
Large rental properties
(in excess of four units)
Risks associated with rental mortgage loan insurance are also assessed through detailed and thorough underwriting processes that include analysis and risk assessment of the borrower, market, property and loan characteristics. A standardized risk assessment tool is employed by underwriters to assign a risk rating to each of these major risk components.
Based on the risk rating and complexity of the application, the underwriters take risk mitigating actions that effectively ensure the risk being assumed is at a level that is acceptable and prudent. The risk ratings, along with the size of the loan and policy considerations, determine the appropriate approval authority.
Portfolio
Risk assessment for loans submitted for portfolio insurance is analogous to that of homeowner insurance. Low ratio homeowner loans (loans with LTVs of less than 80%) are bundled into pools by lenders and assessed by CMHC through an automated underwriting system similar to emili which is used for high ratio loans. The assessments include an analysis
and risk assessment of the borrowers, markets and property characteristics of the mortgages. Individual pools are then priced accordingly.
Quality assurance, capital management and stress testing of CMHC’s Mortgage Loan Insurance Activity
Through our Quality Assurance Framework, CMHC further manages insurance risks by assessing lenders’ insured loan portfolios and working with lenders on a regular basis to maintain quality standards in the underwriting and servicing of their mortgage portfolios.
CMHC is required to meet a number of governance and accountability requirements under the Financial Administration Act and the CMHC Act. CMHC follows prudent regulations as set out by the Office of the Superintendent of Financial Institutions (OSFI). OSFI uses the Minimum Capital Test (MCT) to measure the capital adequacy of an insurer. The percentage MCT is the minimum ratio of the capital available to the capital required. Total Mortgage Loan Insurance Available Capital consisting of Total Equity adjusted for Deferred Acquisition Costs, resulted in 226% MCT at year-end. Capital required is calculated by applying OSFI risk factors to insurance assets and liabilities. CMHC has a capital holding target of 200% MCT and, as such, maintains twice the minimum capital required by OSFI.
Key OSFI capital targets and the relative risk tolerances set by CMHC Management and the Board of Directors are defined as follows:
| ¡ | Minimum Regulatory Capital |
100% Minimum Capital Test (MCT). Below this level, an insurance company would no longer be allowed to write new business. A level below 0% MCT indicates insolvency. The acceptable level of risk has been set by CMHC at a 99% confidence level for not falling below the 100% MCT level and a 99.5% confidence level for the solvency test of 0% MCT.
83
| ¡ | Internal Capital Target |
OSFI expects each insurer to establish an internal capital target in order to provide adequate time for Management to resolve financial problems that may arise, while minimizing the need for regulatory intervention. CMHC has determined that an internal capital target level of 150% MCT is appropriate. The capital holding target of 200% MCT mentioned above reduces the likelihood of falling below this internal capital target.
CMHC conducts stress testing of its mortgage insurance business on an annual basis to evaluate how various economic and business scenarios could potentially affect financial performance, its capital levels, and its risk tolerance thresholds.
CMHC uses a Dynamic Financial Analysis (DFA) model to conduct its annual stress testing exercise. Using 10,000 consistent economic and business scenarios, the stress testing model simulates the impact of each of these scenarios on the 2012-2016 Corporate Plan. Each scenario includes ten years of new business which then runs off over the next 20 years. The scenarios include 30 years of outcomes for real GDP growth, the unemployment rate, the five-year mortgage rate, and investment returns for up to 40 asset classes.
The economic variables are used to generate outcomes for the volume of mortgage insurance written, short-term changes in claims, house price inflation and the value of invested assets. Investment income and asset modelling are integrated with the modelling of the Mortgage Loan Insurance Activity within the DFA model. The stress testing analysis looks at the 10,000 economic and business scenarios coupled with plausible adverse business scenarios, and assesses their financial impact on CMHC’s Mortgage Loan Insurance Activity results.
The results of the most recent stress testing exercise of the Mortgage Loan Insurance Acitivity undertaken for the 2012-2016 Corporate Plan indicate that CMHC continues to be within the acceptable levels of risks set out in its Capital Management Framework and risk appetite statement. For all economic and adverse business scenarios tested, the confidence level of capital not falling below 0% MCT is greater than 99.5%. The results of the annual stress testing are within the requirements of the Capital Management Framework.
Scenarios beyond the 99.5% confidence level for adverse impacts represent the tail risk. The scenarios in the tail are the 50 worst of the 10,000 economic scenarios used in the stress testing. These scenarios are extremely unlikely. They are analyzed, however, to fully understand the impacts on the mortgage loan insurance portfolio under extremely negative financial conditions. These extreme scenarios reflect negative GDP growth, elevated unemployment and significant house price depreciation lasting for a number of years with the assumption of no corrective action being taken by CMHC during the period.
In summary, the Mortgage Loan Insurance Activity is well positioned to weather severe economic scenarios. Stress tests indicate that solvency is not a concern for the Mortgage Loan Insurance Activity. Consistent with not only past analyses but CMHC current practices over the recent uncertain economic situation, the Corporation continues to focus on monitoring and proactively managing the performance of all facets of its mortgage insurance business.
External actuarial valuation
An annual independent external actuarial valuation ensures that policy liabilities related to all policy holder obligations in force are appropriate and in accordance with accepted actuarial practice.
84 C A N A D A M O R T G A G E A N D H O U S I N G C O R P O R A T I O N
Securitization Activity
The major risk of financial loss to the Corporation arising from CMHC’s guarantee is making timely payments when an issuer is unable to honour its commitments and the assets backing the securities are insufficient.
For NHA MBS, the risk associated with issuer default is mitigated by both quality assessment and monitoring of the issuers and by a minimum spread requirement between the security coupon and the lowest mortgage rate in the pool. In the event of issuer default, the minimum spread is made available to a third-party issuer for the continued servicing of both underlying mortgages and the NHA MBS payments. All securitized mortgages have full mortgage default insurance coverage.
For CMB and the IMPP, in addition to the NHA MBS mitigations above, the risk associated with swap counterparty default is mitigated through program requirements for collateralization and the ability to replace swap counterparties in the event that counterparty credit ratings are below specific ratings thresholds. All principal run-off investments must also be rated R-1 (High) or AAA within CHT (for CMB) and government-guaranteed for IMPP.
MORTGAGE LOAN INSURANCE AND SECURITIZATION INVESTMENT PORTFOLIOS
Premiums from Mortgage Loan Insurance Activity and fees from the Securitization Activity are invested in separate investment portfolios. The main sources of risk from the respective investment activities relate to credit and market risk. Credit risk is generally defined as the risk of loss due to the failure of a counterparty
to fulfill its contractual obligations. It arises mainly from investments in fixed income securities. Market risk is generally defined as the risk of loss as a result of fluctuations in capital market conditions. It arises mainly from changes in interest rates, foreign exchange rates and equity prices.
Mortgage Loan Insurance Portfolio
Mortgage loan insurance premiums are received by CMHC at the time of mortgage origination and are subsequently invested. CMHC uses its mortgage loan insurance investment portfolio to cover obligations associated with its provision of insurance covering lenders against borrower default on residential mortgages.
The investment objective for the portfolio is to maximize investment returns within the context of the liabilities, regulatory environment, capital objectives and risk appetite of the Corporation. Investment activities are subject to the risk considerations and constraints outlined in CMHC’s risk management policies.
The size of the mortgage loan insurance investment portfolio has grown over the last few years and this trend is expected to continue. In 2011, the portfolio grew by $1.3 billion, from $17.6 billion to $18.9 billion, due primarily to growth in the value of fixed income investments and positive net cash inflows.
The allocation of investments in the portfolio as at 31 December 2011 is shown in the following graph:
Asset Allocation of the Mortgage Loan Insurance
Investment Portfolio
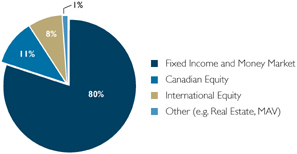
85
Approximately 63% of the total fixed income and money market assets supporting the Mortgage Loan Insurance Activity at year-end were invested in securities issued or explicitly guaranteed by the Government of Canada or Canadian provinces.
Performance information, including absolute and risk-adjusted measures, relative to benchmarks, is tracked and monitored in aggregate and at the individual asset class levels of the portfolio. In 2011, the total return for the mortgage loan insurance portfolio was 6.62% which was 0.18% above the total return of the benchmark index.
Securitization
Guarantee fees are received by CMHC at the time of securitization and are subsequently invested. CMHC maintains its securitization investment portfolio to backstop its guarantee obligations.
The overall long-term objective for the securitization investment portfolio is to provide reasonable capacity to meet liquidity needs of the Timely Payment Guarantee and to preserve capital. A secondary objective is to enhance investment returns which will help to build capital over the long term. Investment activities are subject to the risk considerations and constraints outlined in CMHC’s risk management policies.
The size of the securitization investment portfolio has grown over the last few years and this trend is expected to continue. In 2011, the portfolio grew by $0.4 billion, from $1.2 billion to $1.6 billion, due primarily to positive net cash inflows and growth in the value of fixed income investments.
The allocation of investments in the Securitization portfolio as at 31 December 2011 is shown in the following graph:
Asset Allocation of Securitization Investment Portfolio
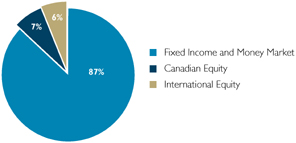
Approximately 93.4% of the total fixed income and money market assets supporting the Securitization Activity at year-end was invested in securities issued by, or explicitly guaranteed by, the Government of Canada or Canadian provinces.
Performance information, including absolute and risk-adjusted measures relative to benchmarks, is tracked and monitored in aggregate and at the individual asset class levels of the portfolio. In 2011, the total return for the securitization portfolio was 6.79%, which was 0.35% above the performance of the benchmark index.
Following a Strategic Asset Allocation review performed in 2011, the securitization investment portfolio will transition out of Canadian equities and Canadian fixed income corporate investments.
86 C A N A D A M O R T G A G E A N D H O U S I N G C O R P O R A T I O N
87
MANAGING OUR HUMAN RESOURCES AND INTERNAL SERVICES – A SOLID ORGANIZATIONAL FOUNDATION
| CMHC’s workforce of approximately 2,000 employees forms the bedrock of our organization. Progressive human resource strategies and practices, along with supportive corporate services ranging from administrative to financial and information systems, are critical to their ability to carry out CMHC’s mandate. Planning and monitoring the performance of CMHC’s internal services form part of our overall performance management framework. Internal services provide performance reports quarterly to CMHC Management with certain elements reported to the Board of Directors. | ||||
| The following highlights some of the key internal services. | ||||
HUMAN RESOURCES
CMHC’s talent management framework was updated in 2011 to set the key directions for the Corporation’s human resources in the years ahead. Talent management allows the Corporation to attract, motivate and retain the pool of talented and diverse employees needed to achieve its key business objectives. It also helps create an inclusive environment that maximizes employees’ engagement and contribution, provides them with opportunities to learn and develop, and rewards their performance. A number of performance measures allow CMHC to track the success of its talent management initiatives. In 2011, targets for the representation rate of Aboriginal people and visible minorities were achieved. While the representation rate of persons with disabilities increased slightly, the target was not achieved. Meeting this target will remain a priority for 2012.
| Performance Measures |
2011 | |||||||
|
2010 Actual |
Plan | Actual | 2012 Plan | |||||
| Retention of regular employees recruited 3 to 5 years ago (per cent) |
96 | 93 | 94 | 93 | ||||
| Level of employee engagement (per cent) | 95 | 90 | 95 | 90 | ||||
| Critical and vulnerable positions with succession plans underway (per cent) | 100 | 100 | 100 | 100 | ||||
| Employees with development plans in place in CMHC’s online performance management system (per cent) | 96 | 90 | 97 | 90 | ||||
| Employees in bilingual positions meeting language requirements (per cent) | 91 | 90 | 92 | 90 | ||||
| Aboriginal people | ||||||||
| Representation rates for Aboriginal people, visible minorities and persons with disabilities reflect or exceed the labour representation rates in the latest Census (per cent) | 2.9 | 3.0 | 3.0 | 3.1 | ||||
| Visible minorities | ||||||||
| 15.5 | 15.9 | 15.8 | 15.9 | |||||
| Persons with disabilities | ||||||||
| 4.2 | 4.7 | 4.3 | 4.7 | |||||
88 C A N A D A M O R T G A G E A N D H O U S I N G C O R P O R A T I O N
CMHC’s overall employee engagement remains high at 95% and well above industry norms. The results of the annual employee engagement survey confirm that employees strongly believe in the Corporation’s goals and objectives, fully support its values and are willing to put in a great deal of effort to help CMHC succeed.

CMHC was selected as one of the Top Employers in the National Capital Region for 2011 for the fourth year. This award reflects the many programs, services and supports CMHC offers its employees to help them develop and enhance their skills, plan their careers, balance work/life issues and plan for retirement. CMHC is honoured to be recognized among other industry leaders for its commitment to offering an exceptional workplace for its employees. CMHC was also selected as one of the Best Diversity Employers in Canada for 2011, for the third year in a row.

CMHC maintained its commitment to Canada’s official languages. With over 90% of employees in bilingual positions meeting the language requirements, the Corporation retained its capacity to serve Canadians and its employees in the official language of their choice. Ongoing third party monitoring indicates a near perfect performance with respect to making the active bilingual offer and provision of services in both official languages in CMHC offices across the country.
Building on its success during the 2010 Vancouver Olympic Games, CMHC has worked to celebrate Canada’s linguistic duality with the Fédération des francophones de la Colombie-Britannique, the Department of Canadian Heritage and the many groups holding festivals and events on Granville Island. As a result, francophone culture has been incorporated in the island’s programming and showcased at events such as the Canada Day Celebration, Granville Island’s winter programs, the Vancouver International Writers Festival and the Vancouver International Children’s Festival.
Renewal of CMHC’s workforce
Like many organizations, CMHC will see many of its baby boomer employees retire over the next few years. After a dip during the recent economic downturn, retirements bounced back in 2011 with 71 employees retiring; which is in line with expectations for the next five years. Placed in the context of a workforce of approximately 2,000 employees with a strong retention rate, the Corporation can absorb and manage this annual volume of retirements with proper planning.
A key cornerstone of our talent management framework is succession planning – making provisions for the development, replacement and strategic application of key people over time. A Succession Management Advisory Committee, comprised of members of CMHC’s Management, supports the Board of Directors’ Human Resources Committee in its responsibilities. The critical and/or vulnerable positions are identified and an assessment of key competencies, technical knowledge and professional experience is conducted. Development plans are put in place to address possible gaps as necessary with potential candidates that are evaluated and assessed to determine their readiness for the position.
89
The Corporation mitigates corporate risk by ensuring the transfer of corporate knowledge and the continuity of services using many mechanisms like skills, abilities and behaviours training, special projects and temporary assignments. The cultivation of talent from within the organization also ensures continuity. In this context, CMHC’s leadership competency profile was enhanced in 2011 to reflect the skills, abilities and behaviours required of CMHC leaders to ensure an effective and sustainable organization able to achieve desirable outcomes for Canadians, today and tomorrow.
Looking ahead, workforce renewal will continue to be a major focus for the Corporation as we manage the transition brought about by increasing retirements. Our policies and programs will continue to build leadership at all levels of the Corporation, provide opportunities for growth and career progression for our employees and will be responsive to changing government priorities and directions.
CORPORATE SERVICES
Corporate Services encompasses a number of functions including financial planning and accounting, information technology, and administrative services. Both internal and external factors impact these functions.
In 2011, many organizations, including a number of federal Crown corporations, transitioned from CGAAP to IFRS issued by the International Accounting Standards Board (IASB). CMHC’s first audited financial statements under IFRS for the year ending 31 December 2011 are found in this annual report. The conversion plan put into place well in advance of the conversion date of 1 January 2011 was overseen by an IFRS steering committee which provided regular updates to CMHC Management, the Board of Directors and its Audit Committee. Going forward, CMHC will monitor and respond to new and emerging standards issued by the IASB.
This year also marked the first time CMHC reported quarterly financial results pursuant to amendments to the Financial Administration Act, effective 1 April 2011. These reports were posted on CMHC’s website 60 days after the end of the second and third quarters of this year and serve to complement information released in CMHC’s annual report. From these reports, Canadians are able to determine how federal program funding is being managed as well as the status of CMHC’s commercial Mortgage Loan Insurance and Securitization Activities.
Information technology is critical to CMHC’s operations and key systems, including emili, CMHC’s electronic mortgage loan insurance interface with lenders. These technologies have proven to be highly reliable. Other systems which impact the technology index are CMHC’s financial information management systems, human resources management system and website. (For a definition of the index see Other Information – Definition of Select Performance Measures on page 169.)
| Performance Measure |
2010 Actual |
2011 |
2012 Plan | |||||
|
Plan |
Actual | |||||||
| Technology index for key systems (per cent) | 99.9 | 98.8 | 99.9 | 99.8 | ||||
In 2011, CMHC developed multi-year plans that encompass all of its information technology systems to ensure they continue to meet business requirements. CMHC continued to focus on its response to rapidly changing technologies and the increasing need for more effective and integrated business systems to support operational requirements. CMHC’s core infrastructure systems strategy was updated in 2011 to ensure that it continues to evolve and progress to meet future needs and remains viable over the long term.
90 C A N A D A M O R T G A G E A N D H O U S I N G C O R P O R A T I O N
COMMUNICATIONS AND CORPORATE MARKETING
CMHC’s communications and corporate marketing strategies and initiatives serve to enhance awareness and understanding of the Corporation’s mandate, activities, and product and service offerings. In 2011, there were 9,763,133 visits to the CMHC corporate website (including visits to the Newcomers to Canada, Canada’s Economic Action Plan and Everything You Need micro-sites), with an average visit duration of 11 minutes and 28 seconds.
CMHC’s micro-site for Newcomers to Canada, which provides information on housing in several languages, received over 200,000 visits, demonstrating a need to serve an increasingly diverse population. To increase accessibility to the site, CMHC developed content integration activities with some 12 municipalities or other organizations serving newcomers such as the Alberta Association of Immigrants, the Halton Multicultural Council and the Financial Consumer Agency of Canada. These activities involved creating links to CMHC’s micro-site as well as the provision of our publications and information for their websites or facilities.
CMHC also supported federal announcements related to housing investments and, in particular, those related to the signing of agreements with provinces and territories under the new Investment in Affordable Housing 2011-2014 Framework.
CMHC’s website and online offerings will continue to be among the primary tools used to provide Canadians with access to our information and services. In 2011, both consumers and industry clients, including mortgage professionals, were given additional online tools to help them make housing finance and loan insurance decisions. In recognition of the trend towards mobile device use, CMHC also launched its first mobile app, The CMHC Mobile KIT for Mortgage Professionals, providing this client group quick and convenient access to tools and information relevant to their business. Going forward, CMHC will continue to explore further enhancements to its website and examine the potential use of social media sites to engage Canadians.
91
2007 TO 2012 FINANCIAL HIGHLIGHTS
| Corporate Results1 |
2007 |
2008 | 2009 | 2010 | 2011 | 2012 | ||||||||||||||||||||||
| Actual | Actual | Actual | Actual | Plan | Actual | Plan | ||||||||||||||||||||||
| Total Assets ($M) |
148,168 | 203,461 | 272,821 | 287,940 | 281,435 | 291,890 | 290,027 | |||||||||||||||||||||
| Total Liabilities ($M) |
141,174 | 195,291 | 263,558 | 277,499 | 270,139 | 279,799 | 276,337 | |||||||||||||||||||||
| Reserve Fund ($M) |
121 | 185 | 151 | 68 | 40 | (9) | 164 | |||||||||||||||||||||
| Total Equity of Canada ($M) |
6,994 | 8,170 | 9,263 | 10,441 | 11,296 | 12,091 | 13,690 | |||||||||||||||||||||
| Total Revenues ($M) |
9,320 | 11,738 | 13,164 | 14,454 | 14,479 | 13,914 | 14,286 | |||||||||||||||||||||
| Total Operating Expenses ($M)2 |
347 | 385 | 416 | 406 | 440 | 420 | 427 | |||||||||||||||||||||
| Total Expenses ($M) |
7,746 | 9,319 | 11,939 | 12,474 | 12,670 | 11,832 | 12,349 | |||||||||||||||||||||
| Net Income ($M) |
1,070 | 1,778 | 931 | 1,440 | 1,343 | 1,529 | 1,497 | |||||||||||||||||||||
| Other Comprehensive Income ($M) |
(200) | (604) | 483 | 311 | 41 | 120 | - | |||||||||||||||||||||
| Comprehensive Income ($M) |
870 | 1,174 | 1,414 | 1,751 | 1,384 | 1,649 | 1,497 | |||||||||||||||||||||
|
Staff-Years |
1,888 | 1,945 | 1,999 | 2,069 | 2,040 | 1,975 | 1,947 | |||||||||||||||||||||
| Mortgage Loan Insurance |
|
|||||||||||||||||||||||||||
| Total insured volumes (units) |
695,971 | 798,309 | 1,048,736 | 643,991 | 706,664 | 630,957 | 550,335 | |||||||||||||||||||||
| Insurance-in-force ($B) |
345 | 408 | 473 | 514 | 533 | 567 | 557 | |||||||||||||||||||||
| High ratio homeowner | 219 | 232 | 246 | 271 | 299 | 286 | 282 | |||||||||||||||||||||
| Low ratio portfolio | 103 | 148 | 196 | 209 | 205 | 243 | 239 | |||||||||||||||||||||
| Multi-unit residential | 23 | 28 | 31 | 34 | 29 | 38 | 36 | |||||||||||||||||||||
| Premiums and Fees Received ($M) |
1,740 | 2,132 | 2,464 | 1,941 | 2,212 | 1,653 | 1,671 | |||||||||||||||||||||
| Investments (including cash) ($M) |
12,026 | 12,974 | 15,901 | 17,597 | 18,902 | 19,112 | 19,826 | |||||||||||||||||||||
| Unappropriated Retained Earnings ($M) |
1,942 | 1,778 | 2,009 | 860 | 665 | 1,271 | 2,767 | |||||||||||||||||||||
| Appropriated Retained Earnings ($M) |
4,258 | 5,423 | 5,937 | 8,201 | 9,414 | 9,028 | 9,154 | |||||||||||||||||||||
| Net Insurance Claims Expense ($M) |
315 | 372 | 1,112 | 497 | 790 | 562 | 625 | |||||||||||||||||||||
| Net Income ($M) |
1,022 | 999 | 742 | 1,275 | 1,159 | 1,336 | 1,331 | |||||||||||||||||||||
| Other Comprehensive Income ($M) |
(187) | (527) | 411 | 323 | 28 | 198 | (13) | |||||||||||||||||||||
| Comprehensive Income ($M) |
835 | 472 | 1,153 | 1,598 | 1,187 | 1,534 | 1,318 | |||||||||||||||||||||
| Securitization |
|
|||||||||||||||||||||||||||
| Annual Securities Guaranteed ($M) |
57,981 | 104,625 | 135,447 | 95,069 | 52,000 | 116,725 | 64,000 | |||||||||||||||||||||
| Securitization Guarantees-in-force ($M) |
165,332 | 233,958 | 300,320 | 325,802 | 309,800 | 362,308 | 339,300 | |||||||||||||||||||||
| Borrowings from the Government of Canada ($M) |
N/A | 24,872 | 61,260 | 59,200 | 58,527 | 55,401 | 52,947 | |||||||||||||||||||||
| Fees Received ($M) |
131 | 228 | 291 | 222 | 238 | 257 | 151 | |||||||||||||||||||||
| Investments (including cash) ($M)3 |
533 | 25,559 | 62,260 | 60,440 | 59,816 | 57,012 | 54,518 | |||||||||||||||||||||
| Unappropriated Retained Earnings ($M) |
305 | 938 | 409 | 38 | 202 | 252 | 367 | |||||||||||||||||||||
| Appropriated Retained Earnings ($M) |
N/A | N/A | 538 | 707 | 703 | 699 | 730 | |||||||||||||||||||||
| Net Income ($M) |
58 | 633 | 69 | 175 | 174 | 211 | 159 | |||||||||||||||||||||
| Other Comprehensive Income ($M) |
(7) | (24) | 27 | 25 | 9 | 12 | 6 | |||||||||||||||||||||
| Comprehensive Income ($M) |
51 | 609 | 96 | 200 | 183 | 223 | 165 | |||||||||||||||||||||
| Housing Programs |
|
|||||||||||||||||||||||||||
| Housing Programs Expenses (excluding operating expenses)4 ($M) |
1,912 | 2,288 | 2,505 | 3,040 | 2,165 | 2,044 | 2,023 | |||||||||||||||||||||
| Affordable Housing Initiative Expenditures ($M)4 |
95 | 98 | 120 | 175 | 50 | 42 | 8.3 | |||||||||||||||||||||
| Investment in Affordable Housing ($M) |
N/A | N/A | N/A | N/A | 11.4 | 27.8 | 399.1 | |||||||||||||||||||||
| Estimated Households Assisted through long-term Commitments |
626,300 | 623,700 | 620,000 | 613,500 | 603,600 | 604,200 | 597,800 | |||||||||||||||||||||
| New Commitments (units) under Renovations Programs |
19,049 | 21,506 | 18,000 | 18,158 | 4,038 | 6,730 | 2,794 | |||||||||||||||||||||
| On-reserve4 | 1,171 | 1,063 | 1,193 | 1,283 | 710 | 1,015 | 1,109 | |||||||||||||||||||||
| Off-reserve4 | 17,878 | 20,443 | 16,807 | 16,875 | 3,328 | 5,715 | 1,685 | |||||||||||||||||||||
| New commitments On-Reserve Non-Profit Units5 |
1,442 | 945 | 822 | 766 | 620 | 604 | 548 | |||||||||||||||||||||
| Lending |
|
|||||||||||||||||||||||||||
| Loans and Investments in Housing Programs ($M) |
12,341 | 12,340 | 11,727 | 12,381 | 13,282 | 12,666 | 11,503 | |||||||||||||||||||||
| Borrowings from Capital Markets ($M) |
8,295 | 5,979 | 4,448 | 3,054 | 2,071 | 2,218 | 1,775 | |||||||||||||||||||||
| Borrowings from the Government of Canada ($M) |
4,446 | 7,746 | 8,593 | 10,756 | 12,500 | 12,146 | 11,390 | |||||||||||||||||||||
| Net Income ($M) |
(19) | 64 | (16) | 13 | 6 | 13 | 9 | |||||||||||||||||||||
| CHT |
|
|||||||||||||||||||||||||||
| Assets ($M) |
120,122 | 150,669 | 182,206 | 196,638 | 190,568 | 201,795 | 204,221 | |||||||||||||||||||||
| Liabilities ($M) |
120,122 | 150,669 | 182,240 | 196,638 | 190,568 | 201,795 | 204,221 | |||||||||||||||||||||
| 1 | 2007 through 2009 Actual is accounted for under CGAAP; 2010 onward is accounted for under IFRS |
| 2 | Total Operating Expenses are included in Total Expenses |
| 3 | Includes investments in NHA MBS: Loans and Receivables |
| 4 | 2011 Plan does not reflect funding for housing programs which was authorized subsequent to the preparation of the 2011-2015 Corporate Plan ($253.1 million per fiscal year for 2011-12 to 2013-14) |
| 5 | Excludes CEAP units |
92 C A N A D A M O R T G A G E A N D H O U S I N G C O R P O R A T I O N

| MANAGEMENT’S RESPONSIBILITY FOR FINANCIAL REPORTING |
94 | |||
| INDEPENDENT AUDITORS’ REPORT |
95 | |||
| CONSOLIDATED BALANCE SHEET |
96 | |||
| CONSOLIDATED STATEMENT OF INCOME AND |
||||
| COMPREHENSIVE INCOME |
97 | |||
| CONSOLIDATED STATEMENT OF EQUITY OF CANADA |
98 | |||
| CONSOLIDATED STATEMENT OF CASH FLOWS |
99 | |||
| NOTES TO CONSOLIDATED FINANCIAL STATEMENTS |
100 | |||
93
MANAGEMENT’S RESPONSIBILITY FOR FINANCIAL REPORTING
Year ended 31 December 2011
CMHC Management is responsible for the integrity and objectivity of the Consolidated Financial Statements and related financial information presented in this annual report. The Consolidated Financial Statements have been prepared in accordance with International Financial Reporting Standards and, consequently, include amounts which are based on the best estimates and judgment of Management. The financial information contained elsewhere in this annual report is consistent with that in the Consolidated Financial Statements.
In carrying out its responsibilities, Management maintains appropriate financial systems and related internal controls within CMHC and controls, as guarantor of Canada Housing Trust, to provide reasonable assurance that financial information is reliable, assets are safeguarded, transactions are properly authorized and are in accordance with the relevant legislation, by-laws of the Corporation and government directives, resources are managed
efficiently and economically, and operations are carried out effectively. The system of internal controls is supported by internal audit, which conducts periodic audits of different aspects of the operations.
The Board of Directors, acting through the Audit Committee whose members are not officers of the Corporation, oversees Management’s responsibilities for financial reporting, internal control systems, and the controls as guarantor of Canada Housing Trust. The Board of Directors, upon the recommendation of the Audit Committee, has approved the Consolidated Financial Statements.
Ernst & Young LLP, and Michael Ferguson, FCA, Auditor General of Canada, have audited the Consolidated Financial Statements. The auditors have full access to, and meet periodically with, the Audit Committee to discuss their audit and related matters.

Karen Kinsley, FCA
President and Chief Executive Officer

P. Marc Joyal, CA
Vice-President, Corporate Services and
Chief Financial Officer
23 March 2012
94 C A N A D A M O R T G A G E A N D H O U S I N G C O R P O R A T I O N

|

|
INDEPENDENT AUDITORS’ REPORT
To the Minister of Human Resources and Skills Development
Report on the Consolidated Financial Statements
We have audited the accompanying consolidated financial statements of Canada Mortgage and Housing Corporation, which comprise the consolidated balance sheets as at 31 December 2011, 31 December 2010 and 1 January 2010, and the consolidated statements of income and comprehensive income, consolidated statements of equity of Canada and consolidated statements of cash flows for the years ended 31 December 2011 and 31 December 2010, and a summary of significant accounting policies and other explanatory information.
Management’s Responsibility for the Consolidated Financial Statements
Management is responsible for the preparation and fair presentation of these consolidated financial statements in accordance with International Financial Reporting Standards, and for such internal control as management determines is necessary to enable the preparation of consolidated financial statements that are free from material misstatement, whether due to fraud or error.
Auditor’s Responsibility
Our responsibility is to express an opinion on these consolidated financial statements based on our audits. We conducted our audits in accordance with Canadian generally accepted auditing standards. Those standards require that we comply with ethical requirements and plan and perform the audit to obtain reasonable assurance about whether the consolidated financial statements are free from material misstatement.
An audit involves performing procedures to obtain audit evidence about the amounts and disclosures in the consolidated financial statements. The procedures selected depend on the auditor’s judgment, including the assessment of the risks of material misstatement of the consolidated financial statements, whether due to fraud or error. In making those risk assessments, the auditor considers internal control relevant to the entity’s preparation and fair presentation of the consolidated financial statements in order to design audit procedures that are appropriate in the circumstances, but not for the purpose of expressing an opinion on the effectiveness of the entity’s internal control. An audit also includes evaluating the appropriateness of accounting policies used and the reasonableness of accounting estimates made by management, as well as evaluating the overall presentation of the consolidated financial statements.
We believe that the audit evidence we have obtained in our audits is sufficient and appropriate to provide a basis for our audit opinion.
Opinion
In our opinion, the consolidated financial statements present fairly, in all material respects, the financial position of Canada Mortgage and Housing Corporation as at 31 December 2011, 31 December 2010 and 1 January 2010, and its financial performance and its cash flows for the years ended 31 December 2011 and 31 December 2010 in accordance with international Financial Reporting Standards.
Report on Other Legal and Regulatory Requirements
As required by the Financial Administration Act, we report that, in our opinion, the accounting principles in International Financial Reporting Standards have been applied, after giving retrospective effect to the adoption of the new standards as explained in Note 28 to the consolidated financial statements, on a basis consistent with that of the preceding year.
Further, in our opinion, the transactions of Canada Mortgage and Housing Corporation that have come to our notice during our audits of the consolidated financial statements have, in all significant respects, been in accordance with Part X of the Financial Administration Act and regulations, the Canada Mortgage and Housing Corporation Act, the National Housing Act, the by-laws of the Canada Mortgage and Housing Corporation, and the directive issued pursuant to Section 89 of the Financial Administration Act.

Michael Ferguson, FCA
Auditor General of Canada

Ernst & Young LLP
Chartered Accountants
Licensed Public Accountants
23 March 2012
Ottawa, Canada


95
CONSOLIDATED BALANCE SHEET
| (in millions of Canadian dollars) | Notes | 31 December 2011 | 31 December 2010 | 1 January 2010 | ||||||||||||
| ASSETS |
||||||||||||||||
| Cash and Cash Equivalents |
1,401 | 985 | 835 | |||||||||||||
| Securities Purchased Under Resale Agreements |
- | - | 127 | |||||||||||||
| Investment Securities: |
5 | |||||||||||||||
| Designated at Fair Value through Profit or Loss |
903 | 711 | 878 | |||||||||||||
| Held for Trading |
397 | - | - | |||||||||||||
| Available for Sale |
17,549 | 16,359 | 14,347 | |||||||||||||
| Investment in NHA Mortgage-Backed Securities: |
||||||||||||||||
| Loans and Receivables |
6 | 256,655 | 254,993 | 237,282 | ||||||||||||
| Loans: |
7 | |||||||||||||||
| Designated at Fair Value through Profit or Loss |
7,132 | 7,294 | 7,533 | |||||||||||||
| Other |
4,726 | 4,214 | 3,255 | |||||||||||||
| Investments in Housing Programs |
808 | 873 | 939 | |||||||||||||
| Accrued Interest Receivable |
983 | 1,280 | 1,284 | |||||||||||||
| Deferred Income Tax Assets |
15 | 78 | - | - | ||||||||||||
| Derivatives |
8 | 169 | 116 | 111 | ||||||||||||
| Due from the Government of Canada |
9 | 403 | 531 | 476 | ||||||||||||
| Accounts Receivable and Other Assets |
10 | 686 | 584 | 620 | ||||||||||||
| 291,890 | 287,940 | 267,687 | ||||||||||||||
| LIABILITIES |
||||||||||||||||
| Securities Sold Under Repurchase Agreements |
5 | 272 | 60 | 51 | ||||||||||||
| Borrowings: |
||||||||||||||||
| Canada Mortgage Bonds |
11, 12 | 199,373 | 193,636 | 174,062 | ||||||||||||
| Capital Market Borrowings |
12 | 2,203 | 3,040 | 4,438 | ||||||||||||
| Borrowings from the Government of Canada: |
12 | |||||||||||||||
| Designated at Fair Value through Profit or Loss |
6,584 | 5,717 | 4,477 | |||||||||||||
| Other |
60,963 | 64,239 | 65,374 | |||||||||||||
| Accrued Interest Payable |
860 | 1,056 | 1,068 | |||||||||||||
| Derivatives |
8 | 72 | 107 | 263 | ||||||||||||
| Accounts Payable and Other Liabilities |
13 | 1,172 | 1,178 | 841 | ||||||||||||
| Provision for Claims |
14 | 1,041 | 1,096 | 1,276 | ||||||||||||
| Unearned Premiums and Fees |
11, 14 | 7,259 | 7,357 | 7,123 | ||||||||||||
| Deferred Income Tax Liabilities |
15 | - | 13 | 25 | ||||||||||||
| 279,799 | 277,499 | 258,998 | ||||||||||||||
| Commitments and Contingent Liabilities |
25 | |||||||||||||||
| EQUITY OF CANADA |
||||||||||||||||
| Contributed Capital |
25 | 25 | 25 | |||||||||||||
| Accumulated Other Comprehensive Income (Loss) |
902 | 601 | 194 | |||||||||||||
| Retained Earnings |
16 | 11,164 | 9,815 | 8,470 | ||||||||||||
| 12,091 | 10,441 | 8,689 | ||||||||||||||
| 291,890 | 287,940 | 267,687 | ||||||||||||||
The accompanying notes to these Consolidated Financial Statements are an integral part of these statements.
These Consolidated Financial Statements were approved by the Board of Directors on 23 March 2012:
|
Dino Chiesa Chairperson, Board of Directors |
Sophie Joncas, CA Chairperson, Audit Committee |


96 C A N A D A M O R T G A G E A N D H O U S I N G C O R P O R A T I O N
CONSOLIDATED STATEMENT OF INCOME AND COMPREHENSIVE INCOME
Year Ended 31 December
| (in millions of Canadian dollars) | Notes | 2011 | 2010 | |||||||||
| REVENUES |
||||||||||||
| Interest Income from NHA Mortgage-Backed Securities – Loans and Receivables |
8,274 | 7,989 | ||||||||||
| Premiums and Fees |
11, 14 | 2,002 | 1,925 | |||||||||
| Interest Earned on Loans and Investments in Housing Programs |
658 | 641 | ||||||||||
| Income from Investment Securities |
622 | 589 | ||||||||||
| Net Realized Gains from Financial Instruments |
17 | 197 | 38 | |||||||||
| Net Unrealized Gains (Losses) from Financial Instruments |
17 | (118) | 6 | |||||||||
| Other Income |
116 | 111 | ||||||||||
| 11,751 | 11,299 | |||||||||||
| Parliamentary Appropriations for: |
9 | |||||||||||
| Housing Programs |
2,044 | 3,040 | ||||||||||
| Operating Expenses |
119 | 115 | ||||||||||
| 2,163 | 3,155 | |||||||||||
| 13,914 | 14,454 | |||||||||||
| EXPENSES |
||||||||||||
| Interest Expense |
12 | 8,806 | 8,531 | |||||||||
| Housing Programs |
9 | 2,044 | 3,040 | |||||||||
| Net Claims |
562 | 497 | ||||||||||
| Operating Expenses |
26 | 420 | 406 | |||||||||
| 11,832 | 12,474 | |||||||||||
| INCOME BEFORE INCOME TAXES |
2,082 | 1,980 | ||||||||||
| INCOME TAXES |
15 | |||||||||||
| Current |
595 | 543 | ||||||||||
| Deferred |
(42) | (3) | ||||||||||
| 553 | 540 | |||||||||||
| NET INCOME |
1,529 | 1,440 | ||||||||||
| OTHER COMPREHENSIVE INCOME (LOSS) |
||||||||||||
| Net Unrealized Gains (Losses) from Available for Sale |
15 | |||||||||||
| Financial Instruments (net of tax) |
427 | 425 | ||||||||||
| Reclassification of Prior Years’ Net Unrealized (Gains) Losses Realized in the Period in |
(126) | (18) | ||||||||||
| Net Actuarial Gains (Losses) on Post-employment Benefits (net of tax) |
21 | (181) | (96) | |||||||||
| 120 | 311 | |||||||||||
| COMPREHENSIVE INCOME |
1,649 | 1,751 | ||||||||||
The accompanying notes to these Consolidated Financial Statements are an integral part of these statements.
97
CONSOLIDATED STATEMENT OF EQUITY OF CANADA
Year Ended 31 December
| Appropriated | ||||||||||||||||||||||||||||||||||||
| (in millions of Canadian dollars) |
Contributed Capital |
Unappropriated | Mortgage Loan Insurance |
Securitization | Reserve Fund for Lending |
Total Retained Earnings |
Accumulated Other Comprehensive (Loss) |
Total Retained Earnings and Accumulated Other Comprehensive Income |
Total Equity of Canada |
|||||||||||||||||||||||||||
|
Balance at Beginning of Year 2011 |
25 | 839 | 8,201 | 707 | 68 | 9,815 | 601 | 10,416 | 10,441 | |||||||||||||||||||||||||||
|
Income Tax Benefit on Earnings Set Aside for Capitalization |
- | 1 | - | - | - | 1 | - | 1 | 1 | |||||||||||||||||||||||||||
|
Net Income |
- | 1,529 | - | - | - | 1,529 | - | 1,529 | 1,529 | |||||||||||||||||||||||||||
|
Other Comprehensive Income (Loss) |
- | (104) | - | - | (77) | (181) | 301 | 120 | 120 | |||||||||||||||||||||||||||
|
Set Aside for Capitalization |
- | (819) | 827 | (8) | - | - | - | - | - | |||||||||||||||||||||||||||
| Balance at End of Year 2011 |
25 | 1,446 | 9,028 | 699 | (9) | 11,164 | 902 | 12,066 | 12,091 | |||||||||||||||||||||||||||
| Balance at Beginning of Year 2010 | 25 | 1,863 | 5,937 | 571 | 99 | 8,470 | 194 | 8,664 | 8,689 | |||||||||||||||||||||||||||
|
Income Tax Benefit on Earnings Set Aside for Capitalization |
- | 1 | - | - | - | 1 | - | 1 | 1 | |||||||||||||||||||||||||||
|
Net Income |
- | 1,427 | - | - | 13 | 1,440 | - | 1,440 | 1,440 | |||||||||||||||||||||||||||
|
Other Comprehensive Income (Loss) |
- | (52) | - | - | (44) | (96) | 407 | 311 | 311 | |||||||||||||||||||||||||||
| Set Aside for Capitalization | - | (2,400) | 2,264 | 136 | - | - | - | - | - | |||||||||||||||||||||||||||
| Balance at End of Year 2010 |
25 | 839 | 8,201 | 707 | 68 | 9,815 | 601 | 10,416 | 10,441 | |||||||||||||||||||||||||||
The accompanying notes to these Consolidated Financial Statements are an integral part of these statements.
98 C A N A D A M O R T G A G E A N D H O U S I N G C O R P O R A T I O N
CONSOLIDATED STATEMENT OF CASH FLOWS
Year Ended 31 December
| (in millions of Canadian dollars) | Notes | 2011 | 2010 | |||||||||
| CASH FLOWS PROVIDED BY (USED IN) OPERATING ACTIVITIES |
||||||||||||
| Net Income |
1,529 | 1,440 | ||||||||||
| Items Not Affecting Cash or Cash Equivalents: |
||||||||||||
| Amortization of Premiums and Discounts on Financial Instruments |
60 | 31 | ||||||||||
| Deferred Income Taxes |
(91) | (12) | ||||||||||
| Change in Fair Value of Financial Instruments Carried at Fair Value |
19 | (9) | ||||||||||
| (Gain) Loss on Sale of Securities |
17 | (197) | (38) | |||||||||
| Net Change in Non-cash Operating Assets and Liabilities: |
||||||||||||
| Accounts Receivable and Other Assets |
(164) | 49 | ||||||||||
| Accrued Interest Receivable |
(4) | (23) | ||||||||||
| Due from the Government of Canada |
128 | (54) | ||||||||||
| Unearned Premiums and Fees |
(98) | 235 | ||||||||||
| Provision for Claims |
(54) | (181) | ||||||||||
| Accounts Payable and Other Liabilities |
94 | 410 | ||||||||||
| Accrued Interest Payable |
104 | 16 | ||||||||||
| Derivatives |
18 | 4 | ||||||||||
| Other |
(256) | (373) | ||||||||||
| Net Change from Loans and Investments in Housing Programs |
(180) | (691) | ||||||||||
| Net Change in NHA MBS Loans and Receivables |
(1,691) | (17,713) | ||||||||||
| Repayments of Capital Market Borrowings |
12 | (933) | (1,511) | |||||||||
| Borrowings from the Government of Canada Designated at Fair Value through Profit or Loss and Other: |
12 | |||||||||||
| Issuances |
3,928 | 9,982 | ||||||||||
| Repayments |
(6,494) | (9,893) | ||||||||||
| Canada Mortgage Bonds : |
12 | |||||||||||
| Issuances |
41,515 | 39,172 | ||||||||||
| Repayments |
(36,025) | (19,400) | ||||||||||
| 1,208 | 1,441 | |||||||||||
| CASH FLOWS PROVIDED BY (USED IN) INVESTING ACTIVITIES |
||||||||||||
| Investment Securities: |
||||||||||||
| Sales and Maturities |
17,612 | 14,155 | ||||||||||
| Purchases |
(18,616) | (15,582) | ||||||||||
| Change in Securities Purchased Under Resale Agreements |
- | 127 | ||||||||||
| (1,004) | (1,300) | |||||||||||
| CASH FLOWS PROVIDED BY (USED IN) FINANCING ACTIVITIES |
||||||||||||
| Change in Securities Sold Under Repurchase Agreements |
212 | 9 | ||||||||||
| 212 | 9 | |||||||||||
| Increase (Decrease) in Cash and Cash Equivalents |
416 | 150 | ||||||||||
| Cash and Cash Equivalents |
||||||||||||
| Beginning of Year |
985 | 835 | ||||||||||
| End of Year |
1,401 | 985 | ||||||||||
| Represented by: |
||||||||||||
| Cash |
(60) | (10) | ||||||||||
| Cash Equivalents |
1,461 | 995 | ||||||||||
| 1,401 | 985 | |||||||||||
| Supplementary Disclosure of Cash Flow from Operating Activities |
||||||||||||
| Amount of Interest Received During the Year |
9,331 | 8,684 | ||||||||||
| Amount of Interest Paid During the Year |
9,228 | 8.729 | ||||||||||
| Amount of Dividends Received During the Year |
84 | 75 | ||||||||||
| Amount of Income Taxes Paid During the Year |
696 | 442 | ||||||||||
The accompanying notes to these Consolidated Financial Statements are an integral part of these statements.
99
NOTES TO CONSOLIDATED FINANCIAL STATEMENTS
Year Ended 31 December 2011
| 1. | CORPORATE MANDATE |
These Consolidated Financial Statements include the accounts of Canada Mortgage and Housing Corporation (CMHC) and Canada Housing Trust (CHT), a special purpose entity. Within the Public Accounts of Canada, the annual Consolidated Net Income reduces the Government’s annual deficit; the Consolidated Retained Earnings and Accumulated Other Comprehensive Income reduce the Government’s accumulated deficit.
CMHC was established in Canada as a Crown corporation in 1946 by the Canada Mortgage and Housing Corporation Act (the “CMHC Act”) to carry out the provisions of the National Housing Act (the “NHA”). It is also subject to Part X of the Financial Administration Act (the “FAA”) by virtue of being listed in Part 1 of Schedule III, is wholly owned by the Government of Canada, and is an agent Crown corporation.
In September 2008, CMHC, together with a number of other Crown corporations, was issued a directive (P.C. 2008-1598) pursuant to Section 89 of the FAA requiring due consideration by CMHC to the personal integrity of those it lends to or provides benefits to. During 2009, the Corporation completed the implementation of the requirements of Section 89(6) of the FAA and notified the Minister of Human Resources and Skills Development that the directive has been met.
CMHC’s mandate is to promote the construction, repair and modernization of housing, the improvement of housing and living conditions, housing affordability and choice, the availability of low-cost financing for housing, and the national well-being of the housing sector. The mandate is carried out through the following four activities:
Mortgage Loan Insurance: CMHC provides mortgage insurance against borrower default on residential mortgages.
Securitization: CMHC guarantees the timely payment of principal and interest for investors in securities based on insured mortgages. The CMHC guarantee is a direct and unconditional obligation of CMHC as an agent of Canada. It carries the full faith and credit of Canada, and constitutes a direct and unconditional obligation of and by the Government of Canada.
Housing Programs: CMHC receives Parliamentary appropriations to fund housing programs.
Lending: CMHC makes loans and investments in housing programs that are funded by borrowings from the Government of Canada and from Capital Markets. A significant number of these loans and investments are supported with housing program payments.
Canada Housing Trust was established in 2001 as a special-purpose trust, separate from CMHC. CHT’s functions are limited to the acquisition of interests in eligible housing loans such as NHA Mortgage-Backed Securities (NHA MBS), the issuance of Canada Mortgage Bonds (CMB), as well as the purchase of highly rated investments and certain related financial hedging activities. The CMB are guaranteed by CMHC under its Securitization Activity. The beneficiaries of the Trust, after payment of all obligations, are one or more charitable organizations.
100 C A N A D A M O R T G A G E A N D H O U S I N G C O R P O R A T I O N
| 2. | SIGNIFICANT ACCOUNTING POLICIES |
These Consolidated Financial Statements have been prepared in accordance with International Financial Reporting Standards (IFRS). They are stated in millions of Canadian dollars, except otherwise indicated, which is the consolidated entity’s (Corporation’s) functional currency.
The significant accounting policies used in the preparation of these Consolidated Financial Statements are summarized on the following pages and conform to IFRS effective as at 31 December 2011 as issued by the International Accounting Standards Board (IASB).
In February 2008, the Accounting Standards Board of the Canadian Institute of Chartered Accountants (CICA) affirmed its intention to replace CGAAP with IFRS. The Corporation adopted IFRS commencing 1 January 2011, with comparative figures for the year commencing 1 January 2010. The Corporation followed the provisions of IFRS 1, First-time Adoption of IFRS, in preparing its opening IFRS balance sheet. Certain of the IFRS accounting policies used for this opening balance sheet differed from its CGAAP policies applied as at 31 December 2010. The effect of transitioning from CGAAP to IFRS is explained in Note 28.
The following are the significant accounting policies:
Basis of Presentation
These Consolidated Financial Statements include the accounts of CMHC and, as required by Standing Interpretation Committee Interpretation 12: Consolidation - Special Purpose Entities (SIC-12), the accounts of CHT, a special purpose entity to which CMHC has exposure to its risks and rewards. The Nordea International Equity Fund (Nordea) is consolidated as required by IAS 27: Consolidated and separate financial statements on the basis that CMHC controls the fund and is included in the investment portfolio within the Mortgage Loan Insurance and Securitization Activities.
Inter-entity balances and transactions have been eliminated in the Consolidated Financial Statements.
These Consolidated Financial Statements have been prepared on a going concern basis using an historical cost basis except for the following material items in the Consolidated Balance Sheet:
| ¡ | Fair Value through Profit or Loss (“FVTPL”) financial assets and liabilities are measured at fair value as are Available for Sale (“AFS”) financial assets; |
| ¡ | Investment Property is measured at fair value; and |
| ¡ | Accrued benefit liabilities for post-employment benefit plans are recognized at the present value of the defined benefit obligations. |
Financial Instruments
The Corporation classifies its financial assets in the following categories: Financial Assets at Fair Value through Profit or Loss, Loans and Receivables, Held to Maturity and Available for Sale. Two classifications are used for financial liabilities: Financial Liabilities at Fair Value through Profit or Loss and Other Financial Liabilities.
The Corporation further categorizes financial instruments at Fair Value through Profit or Loss as either Held for Trading or Designated at Fair Value through Profit or Loss (refer to Note 17 for further information).
The classification is determined by Management at initial recognition based on intent.
101
| Classification | Accounting Treatment | |
|
Designated at Fair Value through Profit or Loss (FVTPL) |
International Accounting Standards (IAS) 39 Financial Instruments: Recognition and Measurement provides an entity the option of classifying a financial instrument as Designated at Fair Value through Profit or Loss when doing so results in more relevant information because either:
a) it eliminates or significantly reduces a measurement or recognition inconsistency that would otherwise arise from measuring the assets or liabilities or recognizing the gains or losses on them on different bases; or
b) the financial instrument belongs to a group managed and evaluated on a fair value basis in accordance with documented risk management or investment strategies and information about the group is provided internally to Key Management Personnel.
This designation is irrevocable.
Financial instruments Designated at Fair Value through Profit or Loss are initially recognized at fair value. They are subsequently measured at fair value. Unrealized gains and losses arising from changes in the fair value are recorded in Net Unrealized Gains (Losses) from Financial Instruments. Gains and losses realized on disposition are recorded in Net Realized Gains (Losses) from Financial Instruments. Transaction costs are expensed as incurred.
| |
|
Held for Trading (HFT) |
HFT financial instruments are either derivatives or financial instruments acquired or incurred principally for the purpose of selling or repurchasing in the near term.
HFT financial instruments are initially recognized at fair value. They are subsequently measured at fair value. Unrealized gains and losses arising from changes in the fair value are recorded in Net Unrealized Gains (Losses) from Financial Instruments. Gains and losses realized on disposition are recorded in Net Realized Gains (Losses) from Financial Instruments. Transaction costs are expensed as incurred.
| |
|
Available for Sale (AFS) |
AFS financial assets are non-derivative financial assets which are designated as such, or which have not been designated in any other classification.
AFS financial assets are initially recognized at fair value plus transaction costs. They are subsequently measured at fair value. Unrealized gains and losses arising from changes in the fair value are recorded in Other Comprehensive Income (OCI) until the financial asset is sold, derecognized, or determined to be impaired at which time they are transferred to the Statement of Income and reported in Net Realized Gains (Losses) from Financial Instruments.
Accumulated Other Comprehensive Income (AOCI) consists only of unrealized gains and losses for AFS financial instruments.
| |
|
Loans and Receivables |
Loans and Receivables are non-derivative financial assets with fixed or determinable payments that are not quoted in an active market except for those that Management has the intent to sell in the near term, which must be Designated at Fair Value through Profit or Loss or those where there may not be a recovery of substantially all of its initial investment other than because of credit deterioration, which are classified as AFS.
Loans and Receivables are initially recognized at fair value plus transaction costs. They are subsequently measured at amortized cost using the effective interest method. When Loans and Receivables are determined to be impaired, the changes in their estimated realizable value are recorded in Net Income.
| |
|
Held to Maturity (HTM) |
HTM financial assets are non-derivative financial assets with fixed or determinable payments and a fixed maturity, other than Loans and Receivables, that Management has the positive intention and ability to hold to maturity.
HTM financial assets are initially recognized at fair value plus transaction costs. They are subsequently measured at amortized cost using the effective interest method. Gains and losses arising from changes in fair value on HTM financial assets that are determined to be impaired are recorded in Net Realized Gains (Losses) from Financial Instruments with interest income recorded until they are determined to be impaired. Impairment charges and reversals of impairment charges are recorded in Other Income.
| |
|
Other Financial Liabilities |
Other Financial Liabilities are non-derivative financial liabilities which have not been Designated at Fair Value.
Other Financial Liabilities are initially recognized at fair value plus transaction costs. They are subsequently measured at amortized cost using the effective interest method with interest expense recorded in Interest Expense.
|
102 C A N A D A M O R T G A G E A N D H O U S I N G C O R P O R A T I O N
Settlement date accounting is used for purchases and sales of financial assets and financial liabilities. Realized gains and losses on sales are recognized on a weighted average cost basis.
The Corporation assesses at each Consolidated Balance Sheet date whether there is objective evidence that a financial asset is impaired. Impairment occurs if it is determined that significant or prolonged losses have been experienced and the Corporation is not expected to recover its cost. Factors reviewed to determine whether impairment exists include significant or prolonged declines in fair value, financial reorganization, corporate restructuring, bankruptcies and other indications of liquidity problems, or the disappearance of an active market for the asset because of financial difficulties. For financial assets classified as HTM or Loans and Receivables that are identified as impaired, their carrying amounts are reduced to their estimated realizable amounts and the credit impairment is recorded in Net Realized Gains (Losses) from Financial Instruments. If an AFS financial asset is determined to be impaired, the cumulative unrealized loss previously recorded in AOCI is removed from equity and recognized in income for the period through Net Realized Gains (Losses) from Financial Instruments. If the fair value of an impaired debt instrument classified as AFS subsequently increases, the impairment loss reversal is limited to the impairment previously recognized in Net Income. Subsequent increases in the fair value of an impaired equity instrument classified as AFS are recorded in OCI.
For the majority of Loans, losses are mitigated by CMHC’s assurance of full collection of principal and accrued interest through provisions in the Social Housing Agreements, provisions in the National Housing Act, Ministerial Loan Guarantees or the loans are underwritten though CMHC’s Mortgage Loan Insurance Activity in which case provisions for claims are established. Loans that have not been underwritten or covered by a third party guarantee are assessed on a regular basis to determine if a provision for loss is necessary.
Cash and Cash Equivalents
Cash and Cash Equivalents are comprised of cash and short-term highly liquid investments with an original term to maturity of 98 days or less that are readily convertible to known amounts of cash. Cash Equivalents funded by Securities Sold Under Repurchase Agreements are classified as HTM. Cash Equivalents in the Lending Activity are Designated at Fair Value. Cash Equivalents in the Mortgage Loan Insurance and Securitization Activities are classified as AFS. Cash Equivalents must have a minimum credit rating of R-1 (Low) or equivalent as determined by S&P, Moody’s or DBRS at the time they are purchased. Interest income on these investments is recorded in Income from Investment Securities.
Investment Securities
Investment Securities in the Lending Activity are comprised of fixed income securities and are Designated at Fair Value through Profit or Loss. Investment Securities in the Mortgage Loan Insurance and Securitization Activities are comprised of fixed income and equity securities and are classified as AFS, HFT or Designated at Fair Value through Profit or Loss. Interest income on fixed income investments is recorded in Income from Investment Securities using the effective interest method. Dividend income on equity investments is recorded in Income from Investment Securities when the right to the dividend is established.
Securities Purchased Under Resale Agreements and Sold Under Repurchase Agreements
Securities Purchased Under Resale Agreements (Reverse Repurchase Agreements) consist of the purchase of securities, typically government treasury bills or bonds, with the commitment to resell the securities to the original seller at a specified price and future date in the near term. They are treated as collateralized lending transactions and are classified as HTM.
Securities Sold Under Repurchase Agreements (Repurchase Agreements) consist of the sale of securities with the commitment to repurchase the securities from the original buyer at a specified price and future date in the near term.
103
Securities Sold Under Repurchase Agreements are classified as Other Financial Liabilities. Proceeds received from Securities Sold Under Repurchase Agreements are generally invested in Securities Purchased Under Resale Agreements or Cash Equivalents for the purpose of generating additional income. Such transactions are entered into simultaneously with matching terms to maturity.
The associated interest earned and interest expenses are recorded in Income from Investment Securities and Interest Expense, respectively.
Investment in NHA Mortgage-Backed Securities – Loans and Receivables
Investment in NHA Mortgage-Backed Securities – Loans and Receivables represent the transfer of NHA MBS securities issued by Canadian financial institutions (Issuers) to CMHC, under the IMPP, or CHT, under the CMB program, where substantially all of the risks and rewards of the transferred NHA MBS are retained by the issuers through swap agreements with CMHC or CHT. Although these securities legally represent an undivided interest in a pool of residential mortgages insured under the NHA and are backed by a timely payment guarantee by CMHC, the transfer is accounted for as a financing transaction by the Corporation.
As a result, the Corporation accounts for the transfers as secured financing, Investment in NHA Mortgage-Backed Securities – Loans and Receivables, collateralized by the NHA MBS and associated high quality reinvestment securities. The NHA MBS, reinvestment assets and swaps are not recognized on the Corporation’s Balance Sheet. The collateral is, however, held in the name of CMHC or CHT and represents the sole source of principal repayments for the Investments in NHA Mortgage-Backed Securities – Loans and Receivables. The amounts due from the swap counterparties represent the interest earned on Investment in NHA Mortgage-Backed Securities – Loans and Receivables.
Loans
Designated at Fair Value through Profit or Loss: Loans that are part of portfolios which are economically hedged are Designated at Fair Value through Profit or Loss.
Other: Loans are classified as Loans and Receivables. Where loans contain forgiveness clauses, they are recorded net of the forgiveness that is reimbursed through Parliamentary appropriations when the loans are advanced.
Interest income is recognized using the effective interest method in Interest Earned on Loans and Investments in Housing Programs.
CMHC is reimbursed through Parliamentary appropriations for interest rate losses resulting from certain loans for housing programs containing interest rate clauses that are lower than the associated interest cost on the related borrowings. These loans were issued from 1946 to 1984 through provisions of the National Housing Act. Parliamentary appropriations are voted on an annual basis by Parliament and CMHC has over a 30 year history of past collection of interest losses through appropriations. CMHC measures these loans at amortized cost which assumes the continued receipt of appropriations going forward. If the appropriations are not received in a future year the valuation of these loans would change.
Investments in Housing Programs
The following categories are included in Investments in Housing Programs.
Loans: Loans under Investments in Housing Programs represent loans made under various pre-1996 housing programs that were transferred to the Provinces/Territories under the Social Housing Agreements (SHAs). For some housing programs, the Provinces/Territories are gradually acquiring CMHC’s interest in the housing portfolio by making payments to CMHC. Loans under Investments in Housing Programs are classified as Loans and Receivables. Interest income on these loans is recorded in Interest Earned on Loans and Investments in Housing Programs on an accrual basis using the effective interest method.
104 C A N A D A M O R T G A G E A N D H O U S I N G C O R P O R A T I O N
Investments: Investments under Investments in Housing Programs represent CMHC’s ownership interest in various housing projects, mostly made under Federal-Provincial Agreements, which are treated as Property, Plant and Equipment and carried at net book value. Amortization is calculated on a declining balance method over the life of the investment which best represents the agreed term over which these projects will be used to render the program services. CMHC’s portion of amortization, net operating losses and disposal losses are reimbursed through Parliamentary appropriations.
Derivatives
The Corporation enters into derivatives such as interest rate swaps, cross currency interest rate swaps, interest rate futures and equity index futures in order to manage its exposures to market risks. Swaps are only contracted with creditworthy counterparties that maintain a minimum rating of A- or equivalent as determined by S&P, Moody’s or DBRS and are not used for speculative purposes.
Derivatives are classified as HFT as they have not been designated as eligible hedges for accounting purposes and are carried at fair value on the Consolidated Balance Sheet. Derivatives with a positive fair value are reported as assets, while derivatives with a negative fair value are reported as liabilities.
Derivatives may be embedded in other financial instruments and are treated as separate derivatives when their economic characteristics and risks are not closely related to those of the host instrument, the terms of the embedded derivative are the same as those of a stand-alone derivative, and the combined contract is not HFT or Designated at Fair Value through Profit and Loss.
The net of interest income and expenses is recorded in Interest Expense as earned and incurred.
Mortgage Loan Insurance
Product Classification: CMHC classifies its mortgage loan insurance as an insurance contract where the lender faces uncertainty with regard to potential borrower default on a mortgage and therefore pays a premium to transfer the risk to CMHC. If the borrower defaults, the claim is significantly larger than the actual premium. Such contracts remain insurance contracts until the underlying insured mortgages are fully repaid and are measured in accordance with IFRS 4, Insurance Contracts.
Premium Revenue: Mortgage loan insurance premiums are due at the inception of the mortgage being insured at which time they are deferred and recognized as income over the period covered by the insurance contract using factors determined by the Appointed Actuary. These factors reflect the long-term pattern for default risk of the underlying mortgages.
Unearned Premiums: Unearned Premiums represent the unexpired portion of the policy premiums at the Consolidated Balance Sheet date and therefore relate to claims that may occur from the Consolidated Balance Sheet date to the termination of the insurance policies. Annually, the Appointed Actuary compares the unearned premiums to an estimate of total future claims on a discounted basis to ensure the amount is sufficient. Should such amount not be sufficient, a provision for premium deficiency is recorded.
Provision for Claims: The Provision for Claims represents an estimate for expected claims and the related settlement expenses, net of the related expected property sale proceeds, for defaults from the mortgage insurance business that have occurred on or before the Consolidated Balance Sheet date. The provision takes into consideration the estimate of the expected ultimate cost of claims reported but not paid and Claims Incurred But Not Reported (IBNR) at the Consolidated Balance Sheet date, the time value of money and in accordance with accepted actuarial practice includes an explicit provision for adverse deviation. The estimate of IBNR is generally subject to a greater degree of uncertainty than that for reported claims.
105
Insurance Policy Liability Adequacy: Liability adequacy tests are performed annually as part of the Actuarial Valuation to ensure the adequacy of insurance policy liabilities net of Deferred Acquisition Costs (DAC) assets with respect to the Provision for Claims and Unearned Premiums. Current best estimates of future contractual cash flows, claims handling and administration costs, and investment returns from the assets backing the liabilities are taken into account in the tests. Where a deficiency is highlighted by the test, DAC assets are written off first, and insurance liabilities increased when these are written off in full. Any premium deficiency is immediately recognized in Net Income. The liability adequacy test for the Corporation has identified that no provision for premium deficiency is required.
The process of determining the provision necessarily involves risks that the actual results will deviate, perhaps significantly, from the estimates made.
The loss on actual mortgage defaults and the change in the estimated Provision for Claims are recorded in Net Claims in the year in which they occur.
The provision for Social Housing Mortgages and Index Linked Mortgages (ILM) is based on the assumptions that the cumulative premiums received and related investment income will be sufficient to meet future claim payouts. Due to the uniqueness of these programs, their provision is established as the fund balance plus a margin for adverse deviation.
Fees: Application fees that are designed to recover part or all acquisition costs associated with issuing mortgage loan insurance policies are deferred and amortized on the same basis as the related premiums.
Deferred Acquisition Costs: A portion of acquisition costs relating to the Unearned Premiums is deferred and amortized over the estimated lives of the relevant contracts.
Non-Current Assets Held for Sale
Real estate acquired by the Mortgage Loan Insurance Activity through loan default is classified as Non-Current Assets Held for Sale when its carrying amount will be recovered principally through a sale transaction rather than through continuing use. The criteria for Held for Sale classification includes Management’s commitment to a plan to sell the selected assets and the expectation that such a sale will be completed within a 12 month period. Events or circumstances beyond the entity’s control may extend the period to complete the sale beyond one year. Such assets continue to be classified as Held for Sale as Management remains committed to its plan to sell the asset. Non-Current Assets Held for Sale are measured at the lower of their carrying amount and their fair value less cost to sell. Impairment losses and any subsequent reversals are recognized in Net Income in the period in which they occur. Non-Current Assets Held for Sale are not depreciated.
Timely Payment Guarantees
Classification: Financial guarantee contracts are defined as those that require the issuer to make specified payments to reimburse the holder for a loss it incurs because a specified debtor fails to make payment when due. CMHC classifies its timely payment guarantee for NHA MBS and CMB as a financial guarantee contract. Such contracts remain financial guarantee contracts until all rights and obligations are extinguished or expire and are measured in accordance with IAS 39 Financial Instruments: Recognition and Measurement.
Recognition and Measurement: Timely payment guarantee fees are initially recognized in Unearned Premiums and Fees at fair value (the premium received) plus transaction costs. Subsequently, they are measured at the amount initially recognized less the amortization of guarantee fee revenue. Should the estimated amount required to settle the timely payment guarantee obligations exceed this amount, a provision is recognized.
Application and Compensatory fees are recognized as revenues in the period where the related services are rendered. Direct costs associated with issuing timely payment guarantees are recognized in Operating Expenses as incurred.
106 C A N A D A M O R T G A G E A N D H O U S I N G C O R P O R A T I O N
Income Taxes
CMHC is a prescribed federal Crown corporation under Reg. 7100 of the Income Tax Act (ITA) and is subject to federal income tax as a prescribed corporation for purposes of subsection 27(2) of the ITA. It is not subject to provincial income tax. CHT is subject to federal and provincial income taxes on the amount of taxable income for the period and is permitted a deduction for all amounts paid or payable to CHT’s beneficiaries in determining income for tax purposes. As all taxable income was distributed to the beneficiaries, no provision for income taxes has been reflected for CHT in these Consolidated Financial Statements. Nordea is a mutual fund trust pursuant to subsection 132(6) of the ITA. Nordea is subject to income tax on Net Income and net realized capital gains that are not paid or payable to unitholders at the end of the taxation year. Nordea is required to distribute all net taxable income and sufficient realized capital gains to unitholders so that it is not subject to income tax. Accordingly, no provision for income taxes is included in the Consolidated Financial Statements in respect of Nordea.
The Corporation uses the liability method of accounting for income taxes. Under this method, Deferred Income Tax Assets and Liabilities are recognized based on the estimated tax effect of temporary differences between the carrying value of assets and liabilities on the financial statements and their respective tax bases. The Corporation uses substantively enacted income tax rates at the Consolidated Balance Sheet date that are expected to be in effect when the asset is realized or the liability is settled. A valuation allowance is established, if necessary, to reduce the Deferred Income Tax Asset to an amount that is probable to be realized.
Canada Mortgage Bonds
CMB, which are issued by CHT and guaranteed by CMHC, are interest-bearing bullet bonds. Coupon interest payments are made semi-annually for fixed rate CMB and quarterly for floating rate CMB. Principal repayments on the bonds are made at the end of the term. CMB are classified as Other Financial Liabilities. The Approved MBS Sellers reimburse CHT for the cost of arranging financing, including the fees paid to CMHC as Guarantor and Financial Services Advisor, underwriters and others for the distribution of CMB. These reimbursements are recorded in Other Income.
CMHC may purchase and resell CMB in the market for investment purposes. These purchases are treated as retirements of debt, with the difference between the purchase price and the carrying value of the CMB being recognized as a gain or loss in income. Gains and losses on subsequent sales are treated as a re-issuance of the debt and amortized over the remaining life of the CMB sold.
Capital Market Borrowings
Borrowings from the Capital Markets represent borrowings incurred between 1993 and April 2008. These borrowings are Designated at Fair Value through Profit or Loss.
Borrowings from the Government of Canada
Borrowings Designated at Fair Value through Profit or Loss: Since April 2008, the Lending Activity has been borrowing under terms of the Crown Borrowing Agreement. These borrowings, excluding those relating to the Municipal Infrastructure Lending Program (MILP), are Designated at Fair Value through Profit or Loss. Expenses related to these borrowings are recognized in Interest Expense in the year incurred.
Other Government of Canada Borrowings: Other Government of Canada Borrowings represent borrowings incurred prior to 1993 in the Lending Activity as well as those under the terms of the Crown Borrowing Agreement relating to the MILP and the Insured Mortgage Purchase Program (IMPP) which are included in the Lending Activity and Securitization Activity, respectively. They are classified as Other Financial Liabilities.
107
Housing Programs
Parliamentary appropriations for Housing Programs, and the related expenses, are recorded on an accrual basis. They are recognized in the year in which the related expenses are incurred. Appropriations and related expenses are presented in the Consolidated Statement of Income and Comprehensive Income as Housing Programs revenues and expenses, respectively. Those expenses incurred but not yet reimbursed are recorded in the Consolidated Balance Sheet as Due from the Government of Canada.
Post-employment Benefits
CMHC provides a defined benefit pension plan that is registered under federal legislation, supplemental pension plans, and other post-employment benefits consisting mainly of severance pay, life insurance and medical insurance.
Pension benefits are based on length of service and average earnings of the best five-year period as classified under defined benefit pension arrangements. The pension benefits are adjusted annually by a percentage equivalent to the total average change in the Consumer Price Index during the previous year. The defined benefit plan asset or liability recognized is the present value of the obligations under the plans, less unamortized past service costs, and plan assets. Defined benefit plan assets are limited to the total of unamortized past service costs and the present value of any economic benefits available in the form of reductions in future contributions to the plan.
Net benefit plan costs are the current service cost, interest cost on the defined benefit obligation, the amortization of deferred past service costs, and the expected investment return on plan assets. These costs are recognized in Operating Expenses. Actuarial gains and losses are recognized in Other Comprehensive Income as incurred, and flow into Retained Earnings on the Consolidated Balance Sheet.
Past service costs are deferred and amortized on a straight-line basis over the average period until the benefits become vested. To the extent that the benefits are already vested immediately following the introduction of, or changes to, a defined benefit plan, the past service costs are recognized immediately.
Investment Property
Investment Properties, which are included in Accounts Receivable and Other Assets are properties held to earn rental income or for capital appreciation, or both. Investment Property is initially recognized at cost plus transactions costs. Subsequent to initial recognition, it is measured at fair value. Fair value is determined based on valuations performed by independent and internal property appraisers who hold recognized and relevant professional qualifications. Gains or losses arising from changes in fair value are recognized in Net Income in the period in which they arise. Investment property rental income and expenses are recorded in Other Income. For certain investment properties, expenses are recoverable from the Minister and these are recorded in Housing Programs appropriations.
Related Party Transactions
Related party transactions are recorded according to the relevant IFRS standard applicable to the transaction.
Foreign Currency Translations
Monetary assets and liabilities denominated in foreign currencies are translated into Canadian dollars at exchange rates prevailing at the Consolidated Balance Sheet date. Exchange gains and losses resulting from the translation of foreign denominated balances are included in Net Unrealized Gains (Losses). Purchases and sales of foreign securities and the related income are translated into Canadian dollars at the exchange rates prevailing on the respective dates of the transactions.
108 C A N A D A M O R T G A G E A N D H O U S I N G C O R P O R A T I O N
Contingent Liabilities
Contingent liabilities are possible obligations whose existence will be confirmed only by uncertain future events or present obligations where the transfer of economic benefit is uncertain or cannot be reliably measured. Contingent liabilities are not recognized but are disclosed in Note 25.
Lease Transactions
Leases are classified as either operating or finance, based on the substance of the transaction at inception of the lease. Classification is re-assessed if the terms of the lease are changed.
CMHC as Lessor: Leases whereby a significant portion of the risks and rewards of ownership are retained by CMHC are classified as operating leases. The leased assets are included within Property, Plant and Equipment or Investment Property (included in Accounts Receivable and Other Assets on the Consolidated Balance Sheet) and depreciation is provided on the depreciable amount of these assets on a systematic basis over their estimated useful lives. Lease income is recognized on a straight-line basis over the period of the lease unless another systematic basis is more appropriate.
CMHC as Lessee: Leases whereby substantially all the risks and rewards of ownership are transferred to CMHC are classified as finance leases. Assets meeting finance lease criteria are capitalized at the lower of the present value of the related lease payments or the fair value of the leased asset at the inception of the lease. Minimum lease payments are apportioned between the finance charge and the liability.
Leases which do not transfer substantially all the risks and rewards of ownership to CMHC are classified as operating leases. Payments under an operating lease are recognized in Net Income on a straight-line basis over the lease term.
| 3. | FUTURE ACCOUNTING CHANGES |
IFRS 9
On 12 November 2009, the IASB issued IFRS 9 Financial instruments (IFRS 9) with further revisions on 28 October 2010 to replace IAS 39 Financial Instruments: Recognition and Measurement.
IFRS 9 uses a single approach to determine whether a financial asset is measured at amortized cost or fair value, based on how an entity manages its financial instruments in the context of its business model and the contractual cash flow characteristics of the financial assets.
On 20 December 2011, the IASB changed the mandatory effective date of IFRS 9 to 1 January 2015 rather than 1 January 2013 as is currently the case.
The Corporation has not yet determined the impact of IFRS 9 on its Consolidated Financial Statements.
IFRS 10, 11, 12
On 13 May 2011, the IASB issued IFRS 10 Consolidated Financial Statements (IFRS 10), IFRS 11 Joint Arrangements (IFRS 11) and IFRS 12 Disclosure of Interests in Other Entities (IFRS 12). The new requirements are effective 1 January 2013.
IFRS 10 replaces IAS 27 Consolidated and Separate Financial Statements and SIC-12 Consolidation – Special Purpose Entities and provides a single consolidation model that identifies control as the basis for consolidation.
IFRS 11 replaces IAS 31 Interests in Joint Ventures and SIC-13 Jointly Controlled Entities-Non-Monetary Contributions by Venturers and establishes principles for the financial reporting of joint arrangement.
109
IFRS 12 combines, enhances and replaces the disclosure requirements for subsidiaries, joint arrangements, associates and unconsolidated structured entities.
The Corporation has not yet determined the impacts these new standards on its Consolidated Financial Statements.
IFRS 13
On 13 May 2011, the IASB issued IFRS 13 Fair Value Measurement (IFRS 13). IFRS 13 defines fair value, sets out in a single framework for measuring fair value and requires disclosures about fair value measurements. While IFRS 13 does not introduce any new requirements, it determines the measurement and disclosure requirements when IFRS requires items to be measured at fair value.
The new requirements are effective 1 January 2013. The Corporation has not yet determined the impacts of this new standard on its Consolidated Financial Statements.
IAS 1
On 16 June 2011, the IASB issued amendments to IAS 1 Presentation of Financial Statements. The amendments require the components of Other Comprehensive Income be presented in two categories. Items will be grouped together based on whether or not they will not be classified to profit or loss in the future.
The new requirements are effective 1 July 2012. The Corporation does not foresee a major impact from this new standard on its Consolidated Financial Statements.
IAS 19
On 16 June 2011, the IASB issued amendments to IAS 19 Employee Benefits. Amendments to IAS 19 eliminate the “corridor method” and improve the recognition, presentation and disclosure requirements for the defined benefit plans. As the Corporation has adopted the change from the corridor method upon implementation of IFRS, this component of the amendment will not affect the Corporation’s Consolidated Financial Statements. The Corporation’s preliminary analysis of the other changes indicates that the amendments will result in an overall change in pension expenses reflected in Net Income with a corresponding offset in actuarial gains and losses recognized in Other Comprehensive Income. This change is due to the discount rate being applied to the plan assets to calculate the estimated return by the plan rather than the expected rate of return that was previously allowed. These amendments also include enhanced disclosure requirements.
The new requirements are effective 1 January 2013.
IAS 32 and IFRS 7
On 16 December 2011 the IASB issued amendments to IAS 32 Financial Instruments: Presentation to clarify the application of the offsetting requirements. The amendments are effective for annual periods beginning on or after 1 January 2014, with earlier application permitted. On 16 December 2011 the IASB published new disclosures requirements jointly with the FASB that enable users of the financial statements to better compare financial statements prepared in accordance with IFRS and US GAAP. The new requirements are effective for annual periods beginning on or after 1 January 2013.
110 C A N A D A M O R T G A G E A N D H O U S I N G C O R P O R A T I O N
| 4. | CRITICAL JUDGMENTS IN APPLYING ACCOUNTING POLICIES AND MAKING ESTIMATES |
Judgments in Applying Accounting Policies
In the process of applying the Corporation’s accounting policies, Management is required to make various judgments, apart from those involving estimations, that can significantly affect the amounts it recognizes in the Consolidated Financial Statements. The judgments having the most significant effect on the amounts recognized in the Consolidated Financial Statements are:
| ¡ | Consolidation – significant judgments are applied in the assessment of whether the substance of the relationship between CMHC and Canada Housing Trust (a special purpose entity) indicates that, as per SIC-12, CMHC controls that special purpose entity. CMHC guarantees the timely payment of principal and interest on the Canada Mortgage Bonds, which exposes it to the majority of risks of Canada Housing Trust and as a result, CMHC consolidates the Canada Housing Trust. Significant judgments are also applied in the assessment of whether the substance of the relationship between CMHC and Nordea indicates that CMHC controls it. As CMHC is the principal investor in the fund, Nordea is reliant on CMHC’s continued investment. As a result, CMHC consolidates Nordea International Equity fund; |
| ¡ | Derecognition – in assessing whether transfers of NHA MBS from Issuers to the Corporation under the CMB program (CHT) and IMPP (CMHC) qualify for derecognition, significant judgment is applied in determining whether substantially all the risks and rewards of ownership of the NHA MBS have been transferred; and |
| ¡ | Impairment of Available for Sale Financial Instruments – significant judgments are applied in assessing if losses that have been experienced are significant and prolonged and the asset is not expected to recover to its cost. |
Use of Estimates and Assumptions
The preparation of these Consolidated Financial Statements requires Management to make estimates and assumptions. These estimates and assumptions affect the reported amounts of assets, liabilities, comprehensive income and related disclosures. Key areas where Management has made estimates and assumptions include those related to Provision for Claims, Unearned Premiums, Fair Value of Financial Instruments, and Post-employment Benefits. Where actual results differ from these estimates and assumptions, the impact will be recorded in future periods.
Provision for Claims
The Provision for Claims represents an estimate for expected claims and the related settlement expenses, net of the related expected property sale proceeds, for defaults from the mortgage insurance business that have occurred on or before the Consolidated Balance Sheet date. In calculating the estimated liability, an estimate of losses on defaults that have been incurred but not reported is made using historical experience and the time value of money, which considers prevailing legal, economic, social and regulatory trends. See Note 14 for further details.
Unearned Premiums
Mortgage loan insurance premiums are deferred and recognized as revenue over the period covered by the insurance contracts using actuarially determined factors that are reviewed annually as part of the Actuarial Valuation. The premium earning factors are derived from claim occurrence patterns based on the principle that premiums will be earned at the same rate as claims are incurred. See Note 14 for further details.
111
Financial Instruments
Financial instruments carried at fair value are measured based on quoted market prices observable in the market or amounts derived from cash flow models or other valuation methodologies. The fair value measurement hierarchy described in Note 17 reflects the significance of the inputs used in making these measurements.
Post-employment Benefits
The annual cost of pension and other post-employment benefits earned by employees is actuarially determined using the projected unit credit method prorated on service and Management’s best estimate of expected long-term pension plan investment performance, compensation increases, retirement ages of employees, mortality of members and expected health care costs. These assumptions are of a long-term nature, which is consistent with the nature of post-employment benefits. Actual results could differ from these estimates. See Note 21 for further details.
| 5. | SECURITIES |
The following table shows the maturity structure and average yield for Investment Securities.
| Remaining Term to Maturity | ||||||||||||||||||||||||||||
| Within | 1 to 3 | 3 to 5 | Over 5 | |||||||||||||||||||||||||
| (in millions) | 1 Year | Years | Years | Years | 31 December 2011 | 31 December 2010 | 1 January 2010 | |||||||||||||||||||||
| Designated at Fair Value through Profit or Loss |
||||||||||||||||||||||||||||
| Corporate/Other Entities |
- | 35 | 147 | 118 | 300 | 358 | 617 | |||||||||||||||||||||
| Government of Canada |
- | - | - | - | - | - | - | |||||||||||||||||||||
| Provinces/Municipalities |
- | 137 | 466 | - | 603 | 353 | 261 | |||||||||||||||||||||
| Sovereign and Related Entities |
- | - | - | - | - | - | - | |||||||||||||||||||||
| Total Designated at Fair Value through Profit or Loss |
- | 172 | 613 | 118 | 903 | 711 | 878 | |||||||||||||||||||||
| Yield(1) |
- | 2.49% | 3.64% | 0.00% | 2.74% | 2.33% | 1.12% | |||||||||||||||||||||
| Held for Trading |
||||||||||||||||||||||||||||
| Foreign Equities |
- | - | - | - | 397 | - | - | |||||||||||||||||||||
| Total Held for Trading |
- | - | - | - | 397 | - | - | |||||||||||||||||||||
| Yield(2) |
- | - | - | - | 1.26% | - | - | |||||||||||||||||||||
| Available for Sale |
||||||||||||||||||||||||||||
| Fixed Income |
||||||||||||||||||||||||||||
| Corporate/Other Entities |
69 | 1,002 | 1,028 | 2,797 | 4,896 | 5,033 | 4,215 | |||||||||||||||||||||
| Government of Canada |
361 | 1,590 | 815 | 838 | 3,604 | 2,954 | 3,057 | |||||||||||||||||||||
| Provinces/Municipalities |
126 | 364 | 417 | 4,562 | 5,469 | 4,327 | 3,519 | |||||||||||||||||||||
| Sovereign and Related Entities |
11 | 72 | - | 113 | 196 | 534 | 494 | |||||||||||||||||||||
| Total Fixed Income |
567 | 3,028 | 2,260 | 8,310 | 14,165 | 12,848 | 11,285 | |||||||||||||||||||||
| Yield(1) |
1.51% | 2.59% | 3.05% | 4.25% | 3.54% | 4.01% | 4.07% | |||||||||||||||||||||
| Equities |
||||||||||||||||||||||||||||
| Canadian Equities |
2,121 | 1,966 | 1,688 | |||||||||||||||||||||||||
| U.S. Equities |
858 | 761 | 686 | |||||||||||||||||||||||||
| Foreign Equities |
405 | 784 | 688 | |||||||||||||||||||||||||
| Total Equities |
3,384 | 3,511 | 3,062 | |||||||||||||||||||||||||
| Yield(2) |
2.54% | 2.52% | 2.41% | |||||||||||||||||||||||||
| Total Available for Sale |
17,549 | 16,359 | 14,347 | |||||||||||||||||||||||||
| (1) | Represents the weighted-average yield, which is determined by applying the weighted-average of the effective yields of individual securities. |
| (2) | Represents the average yield, which is determined by applying the earned dividend amount of equities to the average cost. |
112 C A N A D A M O R T G A G E A N D H O U S I N G C O R P O R A T I O N
The following table shows the unrealized gains (losses) on Investment Securities recorded at fair value.
| 2011 | 2010 | |||||||||||||||||||||||
| Gross | Gross | |||||||||||||||||||||||
| Amortized | Unrealized | Unrealized | Fair | Amortized | Fair | |||||||||||||||||||
| (in millions) | Cost(1) | Gains | Losses | Value | Cost(1) | Value | ||||||||||||||||||
| Investment Securities: |
||||||||||||||||||||||||
| Fixed Income |
||||||||||||||||||||||||
| Designated at Fair Value |
861 | 42 | - | 903 | 697 | 711 | ||||||||||||||||||
| Available for Sale |
13,061 | 1,105 | (1) | 14,165 | 12,325 | 12,848 | ||||||||||||||||||
| Equities |
||||||||||||||||||||||||
| Held for Trading |
486 | - | (89) | 397 | - | - | ||||||||||||||||||
| Available for Sale |
3,232 | 307 | (155) | 3,384 | 3,153 | 3,511 | ||||||||||||||||||
| (1) | Amortized cost for Equities is cost. |
CMHC has Investment Securities of $272 million (31 December 2010 - $60 million, 1 January 2010 - $52 million) that are part of Securities Sold Under Repurchase Agreements. The terms of these transactions do not exceed three months (93 days), the credit rating of the instruments must be at a minimum of R-1 (mid) and be issued by a financial institution. CMHC continues to earn interest income and recognizes in OCI changes in fair values on these Investment Securities during the period.
The cumulative loss from Available for Sale fixed income and equity investments of $156 million (2010 - $108 million) included in Accumulated Other Comprehensive Income, has not been recognized as an impairment loss in Net Income. During 2011, $30 million (2010 - nil) was recognized in Net Realized Gains (Losses) from Financial Instruments and no reversals of previously realized fixed income investment security impairments occurred during the year.
| 6. | INVESTMENT IN NHA MORTGAGE-BACKED SECURITIES – LOANS AND RECEIVABLES |
Under the IMPP, CMHC has purchased insured NHA MBS, through reverse auction, from Canadian financial institutions (Issuers) using funds borrowed from the Government of Canada. With each auction, swap agreements were entered into where CMHC is to pay all interest received on NHA MBS and reinvestment securities, net of its expenses, to swap counterparties and CMHC is to receive payments equal to the interest due on its IMPP-related borrowings.
CHT purchases insured NHA MBS from approved MBS Sellers using funds supplied from the issuance of CMB. In addition, interest rate swap agreements are entered into where CHT is to pay all interest received on NHA MBS and reinvestment securities, net of its expenses, to swap counterparties and CHT is to receive payments equal to the interest due on its Canada Mortgage Bond (CMB) borrowings.
In order to meet the principal obligations of the Government of Canada and CMB borrowings, the principal payments and prepayments from the underlying NHA MBS are held in an account in the name of CMHC or CHT, managed and reinvested in eligible assets by the swap counterparties pursuant to contractual agreements. Eligible assets include Investment Securities, Cash Equivalents and Securities Purchased Under Resale Agreements. Under the terms of certain auctions under the IMPP, CMHC remits directly to the Government of Canada the monthly principal payments and prepayments on the underlying NHA MBS rather than to the swap counterparties for reinvestment.
113
The following table summarizes the maturity structure, based on undiscounted contractual maturities of principal and average yield, for Investment in NHA MBS – Loans and Receivables.
| Remaining Term to Maturity | ||||||||||||||||||||||||||||
| Within | 1 to 3 | 3 to 5 | Over 5 | |||||||||||||||||||||||||
| (in millions) | 1 Year | Years | Years | Years | 31 December 2011 | 31 December 2010 | 1 January 2010 | |||||||||||||||||||||
| IMPP(1) |
||||||||||||||||||||||||||||
| Investment in |
||||||||||||||||||||||||||||
| NHA MBS – |
||||||||||||||||||||||||||||
| Loans and |
||||||||||||||||||||||||||||
| Receivables |
1,800 | 51,473 | 2,129 | - | 55,402 | 59,200 | 61,261 | |||||||||||||||||||||
| Yield |
2.08% | 3.12% | 3.10% | - | 3.09% | 3.02% | 2.75% | |||||||||||||||||||||
| CHT |
||||||||||||||||||||||||||||
| Investment in |
||||||||||||||||||||||||||||
| NHA MBS – |
||||||||||||||||||||||||||||
| Loans and |
||||||||||||||||||||||||||||
| Receivables |
37,700 | 71,700 | 63,350 | 28,005 | 200,755 | 195,530 | 175,550 | |||||||||||||||||||||
| Yield |
4.30% | 2.96% | 2.24% | 3.37% | 3.04% | 3.40% | 3.46% | |||||||||||||||||||||
| Total |
39,500 | 123,173 | 65,479 | 28,005 | 256,157 | 254,730 | 236,811 | |||||||||||||||||||||
| (1) | For certain auctions under the IMPP, CMHC receives principal payments, both scheduled and unscheduled, from the underlying NHA MBS. The maturities for these loans are estimated based on assumptions regarding mortgage prepayments (1% annually), liquidations (4% annually) and conversion rates (10% annually) of the underlying MBS. Prepayments and liquidations are mortgage principal repayments that are received sooner than the stated amortization period of the mortgage. Conversion rates refer to the conversion of a variable rate mortgage to a fixed rate mortgage. These are percentage rate assumptions on principal amounts outstanding, determined by CMHC, and based on historical performance/trends. |
| 7. | LOANS |
Loans
CMHC provides loans either independently or jointly with provincial, territorial, and municipal authorities. Loans were issued for terms up to 50 years. The following table presents the contractual maturity profile of these loans.
| (in millions) | 31 December 2011 | 31 December 2010 | 1 January 2010 | |||||||||||
| 2010 |
- | - | 1,281 | |||||||||||
| 2011 |
- | 1,527 | 1,501 | |||||||||||
| 2012 |
965 | 904 | 965 | |||||||||||
| 2013 |
1,200 | 1,274 | 1,372 | |||||||||||
| 2014 |
911 | 950 | 1,011 | |||||||||||
| 2015 |
1,471 | 1,465 | 583 | |||||||||||
| 2016 |
1,490 | 388 | 418 | |||||||||||
| 2017 and Thereafter |
5,821 | 5,000 | 3,657 | |||||||||||
| Total |
11,858 | 11,508 | 10,788 | |||||||||||
Approximately $9,544 million, representing 80% (31 December 2010 - $9,835 million, or 85%, 1 January 2010 - $10,235 million, or 95%) of the loans, are supported with housing program payments outlined in Note 9.
A loan is considered past due when a counterparty has not made a payment by the contractual due date. The following table presents the amortized cost of loans that are past due.
| Within | 1 to 3 | 3 to 5 | 31 December 2011 | 31 December 2010 | 1 January 2010 | |||||||||||||||||||
| (in millions) | 1 Year | Years | Years | Total | Total | Total | ||||||||||||||||||
| Loans past due |
50 | 11 | 16 | 77 | 79 | 166 | ||||||||||||||||||
114 C A N A D A M O R T G A G E A N D H O U S I N G C O R P O R A T I O N
At 31 December 2011, CMHC is assured full collection of principal and accrued interest on 84% (31 December 2010 - 89%, 1 January 2010 - 99%) of the loans. The guarantee/insurance on these loans is provided by various sources as presented in the following table:
| 31 December 2011 | 31 December 2010 | 1 January 2010 | ||||||||||
| Provinces and Territories |
34% | 38% | 43% | |||||||||
| (provisions in the Social Housing Agreements) |
||||||||||||
| Government of Canada (provisions in the NHA) |
19% | 20% | 23% | |||||||||
| Aboriginal Affairs and Northern Development Canada |
||||||||||||
| (Ministerial Loan Guarantees) |
11% | 10% | 10% | |||||||||
| CMHC’s Mortgage Loan Insurance Activity(1) |
20% | 21% | 23% | |||||||||
| Municipal Infrastructure Lending Program(2) |
16% | 11% | 1% | |||||||||
| (1) | Provision for losses on loans underwritten by CMHC’s Mortgage Loan Insurance Activity is included in the determination of Provision for Claims and Unearned Premiums |
| (2) | MILP loans are assessed on a regular basis to determine if a provision for loss is necessary. As at 31 December 2011, no impaired loans have been identified and no provision for loss has been recorded (31 December 2010 – nil, 1 January 2010 – nil). |
As described in Note 2, CMHC receives interest loss recoveries on certain loans containing interest rate clauses lower than the interest cost on the related borrowings. Of the future cash flows to be received on these loans, approximately 1% (with a fair value of $81 million) will be recovered from the Government of Canada and the remainder will be recovered directly from the borrowers. The following table presents the estimated recoveries on these loans from the Government for the next five years.
| (in millions) | 2012 | 2013 | 2014 | 2015 | 2016 | |||||||||||||||
| Interest Loss Recoveries |
11 | 11 | 10 | 9 | 9 | |||||||||||||||
Investments in Housing Programs
The following table presents the contractual maturity profile of Investments in Housing Programs.
| (in millions) | 31 December 2011 | 31 December 2010 | 1 January 2010 | |||||||||
| 2010 |
- | - | 5 | |||||||||
| 2011 |
- | 7 | 17 | |||||||||
| 2012 |
7 | 17 | 26 | |||||||||
| 2013 |
14 | 22 | 29 | |||||||||
| 2014 |
22 | 30 | 35 | |||||||||
| 2015 |
27 | 35 | 39 | |||||||||
| 2016 |
41 | 50 | 53 | |||||||||
| 2017 and Thereafter |
697 | 712 | 735 | |||||||||
| Total |
808 | 873 | 939 | |||||||||
The amount of $808 million, representing 100% (31 December 2010 - $873 million, or 100%, 1 January 2010 - $939 million, or 100%) of the Investments in Housing Programs, are supported with housing program payments outlined in Note 9.
115
At 31 December 2011, CMHC is assured full collection of its loan principal and accrued interest as well as the amortization of its investments. The following table presents the source of these guarantees.
| 31 December 2011 | 31 December 2010 | 1 January 2010 | ||||||||||||
| Loans |
||||||||||||||
| Provinces and Territories (provisions in the Social Housing Agreements) |
96% | 96% | 96% | |||||||||||
| Investments |
||||||||||||||
| Government of Canada (provisions in the NHA) |
4% | 4% | 4% | |||||||||||
| 8. | DERIVATIVES |
Derivatives are financial contracts whose value is derived from price movements in one or more underlying securities, indices or other instruments or derivatives. The Corporation uses derivatives (interest rate swaps, cross currency interest rate swaps, interest rate futures and equity index futures) in connection with its risk management activities.
Interest rate swaps are transactions in which two parties exchange interest cash flows on a specified notional amount for a predetermined period based on agreed-upon fixed and floating rates. Notional amounts are not exchanged. The value of these swaps is derived from movements in interest rates. They are used to manage reinvestment risk, refinancing risk, or mismatches in the timing of receipts from assets versus payments of liabilities.
Cross currency interest rate swaps are transactions in which two parties exchange currencies and interest cash flows on a specified notional amount for a predetermined period. The notional amount is exchanged at inception and at maturity. The value of these swaps is derived from movements in foreign exchange and interest rates. They are used to manage foreign exchange risk arising from foreign denominated debt.
Interest rate and equity index futures are contractual obligations to buy or sell a financial instrument on a future date at a specified price established by an organized financial market. The credit risk is reduced as changes in the futures’ contract value are settled daily. Futures are used to manage asset allocation in the Mortgage Loan Insurance and Securitization Activities.
The table below provides the notional amounts of the Corporation’s derivative transactions. Notional amounts, which are off-balance sheet, serve as a point of reference for calculating payments and do not represent the fair value, or the potential gain or loss associated with the credit or market risk of such instruments. The Corporation does not have derivatives embedded in other financial instruments (host contracts) which require separation.
| 31 December 2011 | 31 December 2010 | 1 January 2010 | ||||||||||||||||||||||||||||||||||||||
| Fair Value | Fair Value | Fair Value | ||||||||||||||||||||||||||||||||||||||
| Average | ||||||||||||||||||||||||||||||||||||||||
| Term to | Notional | Notional | Notional | |||||||||||||||||||||||||||||||||||||
| (in millions) | Maturity | Amount | Asset | Liability | Amount | Asset | Liability | Amount | Asset | Liability | ||||||||||||||||||||||||||||||
| Interest Rate Swaps |
4 years | 12,262 | 169 | 72 | 13,110 | 116 | 27 | 14,156 | 111 | 33 | ||||||||||||||||||||||||||||||
| Cross Currency Interest |
||||||||||||||||||||||||||||||||||||||||
| Rate Swaps |
- | - | - | - | 833 | - | 80 | 2,344 | - | 230 | ||||||||||||||||||||||||||||||
| Total |
12,262 | 169 | 72 | 13,943 | 116 | 107 | 16,500 | 111 | 263 | |||||||||||||||||||||||||||||||
116 C A N A D A M O R T G A G E A N D H O U S I N G C O R P O R A T I O N
| 9. | HOUSING PROGRAMS |
CMHC receives Parliamentary appropriations to fund the following program expenditures, including operating expenses, in support of Housing Programs.
| september30000000 | september30000000 | |||||||
| (in millions) | 2011 | 2010 | ||||||
| Assisted Housing Programs |
1,547 | 1,546 | ||||||
| Housing Repair and Improvement Programs |
190 | 707 | ||||||
| On-Reserve Housing Programs |
167 | 198 | ||||||
| Affordable Housing Initiative |
135 | 582 | ||||||
| Research and Information Dissemination that Addresses Distinct Housing Needs, Including those of Aboriginal Canadians |
1 | 1 | ||||||
| Research and Information Dissemination to Promote Desirable Housing Market Outcomes and Improve Building Performance |
2 | 3 | ||||||
| Research and Information Dissemination to Promote Sustainable Housing and Communities, as well as Lead the Development and Implementation of Federal Housing Policy |
2 | 3 | ||||||
| Total Housing Programs Expenses |
2,044 | 3,040 | ||||||
| Operating Expenses |
119 | 115 | ||||||
| Total Appropriations |
2,163 | 3,155 | ||||||
Of the total amount expensed on Housing Programs, $1,006 million (2010 - $1,025 million), was provided for programs transferred to Provinces/Territories under SHAs. The amount is included under Assisted Housing Programs in the table above. This funding to the Provinces/Territories may become repayable to CMHC if the amounts are not used in accordance with the terms and conditions of the SHAs.
Under the SHAs, the Province/Territory assumes CMHC’s financial and other obligations with respect to these programs in exchange for a pre-determined annual funding. The accountability framework requires the Province/Territory to provide an audited Annual Statement of Funding and Expenditures and an Annual Program Performance Report.
Housing Programs Expenses also include related party transactions between the Government of Canada and CMHC for the reimbursement of:
| ¡ | Interest rate losses resulting from certain loans containing interest rate clauses that are lower than the associated interest cost on the related borrowings; |
| ¡ | Net operating losses on certain investments in housing programs and real estate properties; and |
| ¡ | Net default losses on certain loans and net disposal losses on certain investments in housing programs and real estate properties. |
The following table summarizes the nature of these expenses reimbursed by the Government of Canada.
| september300000 | september300000 | |||||||
| (in millions) | 2011 | 2010 | ||||||
| Interest Rate Losses |
59 | 45 | ||||||
| Net Operating Losses |
2 | 3 | ||||||
| Net Default and Disposal Losses |
1 | 1 | ||||||
| Total |
62 | 49 | ||||||
The total reimbursements for interest losses includes $20 million (2010 - nil), towards the losses incurred by CMHC as a result of the prepayment and repricing activity.
117
The reimbursement for interest rate losses is included in Interest Earned on Loans and Investments in Housing Programs. Net operating, default and disposal losses are recorded as Due from the Government of Canada and Housing Programs expenses on an accrual basis. The reimbursement of operating costs is shown in the Consolidated Statement of Income and Comprehensive Income as Parliamentary Appropriations for Operating Expenses.
The following table presents the change in the Due from the Government of Canada account. The outstanding balance as of 31 December 2011 is mainly composed of Housing Programs expenses incurred but not yet reimbursed.
| september30000000 | september30000000 | |||||||
| (in millions) | 2011 | 2010 | ||||||
| Due from (to) the Government of Canada |
||||||||
| Balance at Beginning of Year |
531 | 476 | ||||||
| Total Appropriations |
2,163 | 3,155 | ||||||
| Total Appropriations Received |
(2,300) | (3,093) | ||||||
| Reimbursements |
9 | (7) | ||||||
| Balance at End of Year |
403 | 531 | ||||||
Of the total balance, $269 million is expected to be recovered within 12 months of the Consolidated Balance Sheet date.
| 10. | ACCOUNTS RECEIVABLE AND OTHER ASSETS |
The following table presents the composition of Accounts Receivable and Other Assets.
| (in millions) | 31 December 2011 | 31 December 2010 | 1 January 2010 | |||||||||
| Accounts Receivable |
33 | 34 | 47 | |||||||||
| Income Taxes Receivable |
59 | - | 133 | |||||||||
| Investment Property (Note 22) |
191 | 146 | 119 | |||||||||
| Non-Current Assets Held for Sale |
80 | 99 | 49 | |||||||||
| Property, Plant and Equipment |
53 | 54 | 55 | |||||||||
| Deferred Acquisition Costs |
109 | 103 | 89 | |||||||||
| Other |
161 | 148 | 128 | |||||||||
| Total |
686 | 584 | 620 | |||||||||
| 11. | SECURITIZATION |
CMHC guarantees the timely payment of principal and interest of NHA MBS for investors in securities issued by Approved Issuers (primarily lending institutions) on the basis of housing loans through the NHA MBS program and the CMB issued by CHT.
CMHC determined that at the Consolidated Balance Sheet date, the best estimate of the amount required to settle the timely payment guarantee obligation is less than the balance of unearned timely payment guarantees included in Unearned Premiums and Fees. As such, no additional provision for claims is required. This is based on historical results and program design whereby only insured mortgages are eligible for securitization. As at 31 December 2011, the carrying amount for timely payment guarantees is $528 million (31 December 2010 - $483 million, 1 January 2010 - $448 million), of which $184 million is expected to be recognized as revenues within 12 months of the Consolidated Balance Sheet date. Revenues recognized for timely payment guarantees were $211 million (2010 - $187 million).
118 C A N A D A M O R T G A G E A N D H O U S I N G C O R P O R A T I O N
Guarantees-in-force
At 31 December 2011, guarantees-in-force totalled $362 billion (31 December 2010 - $326 billion, 1 January 2010 - $300 billion). This includes $161 billion – including $49 billion in NHA MBS of which CMHC is entitled to payments for the timely payment guarantee – of CMHC guaranteed NHA MBS (31 December 2010 - $130 billion, 1 January 2010 – $124 billion) and $201 billion (Par Value) – including $2 billion in investments held by CMHC in CMB issued by CHT – of CMHC guaranteed CMB issued by CHT (31 December 2010 - $196 billion, 1 January 2010 - $176 billion).
Based on the maturity profile of the $362 billion in guaranteed NHA MBS and CMB, CMHC’s related guarantees, stated in term of the outstanding principal guaranteed, are scheduled to expire as follows:
| NHA MBS and | ||||
| (in millions) | CMB Guaranteed | |||
| 2012 |
53,905 | |||
| 2013 |
72,149 | |||
| 2014 |
71,100 | |||
| 2015 |
66,723 | |||
| 2016 |
67,005 | |||
| 2017 and Thereafter |
31,426 | |||
| Total |
362,308 | |||
Under Section 15 of the NHA, the aggregate outstanding amount of principal guarantees may not exceed $600 billion (31 December 2010 - $600 billion, 1 January 2010 - $600 billion).
| 12. | BORROWINGS |
Canada Mortgage Bonds
The following table summarizes the carrying value and yield for the CMHC-guaranteed CMB issued by CHT based on maturity date.
| 31 December 2011 | 31 December 2010 | 1 January 2010 | ||||||||||||||||||
| (in millions) | Carrying Value | Yield (1) | Carrying Value | Carrying Value | ||||||||||||||||
| 2010 |
- | - | - | 19,348 | ||||||||||||||||
| 2011 |
- | - | 36,101 | 35,742 | ||||||||||||||||
| 2012 |
37,737 | 4.30% | 37,458 | 37,412 | ||||||||||||||||
| 2013 |
35,254 | 3.41% | 34,942 | 35,080 | ||||||||||||||||
| 2014 |
35,918 | 2.53% | 35,528 | 35,745 | ||||||||||||||||
| 2015 |
30,527 | 2.51% | 30,750 | - | ||||||||||||||||
| 2016 |
32,059 | 1.98% | 2,000 | - | ||||||||||||||||
| 2017 - 2021 |
27,878 | 3.36% | 16,857 | 10,735 | ||||||||||||||||
| Total |
199,373 | 3.04% | 193,636 | 174,062 | ||||||||||||||||
| (1) | Represents the weighted-average yield, which is determined by applying the weighted average effective yields of individual fixed rate bonds and the weighted-average yields to reset of floating rate bonds. |
119
The interest expense related to Canada Mortgage Bonds is $6,406 million (2010 - $6,130 million). During the year, CHT issued Canada Mortgage Bonds in the amount of $41,515 million (2010 - $39,172 million) and had maturities in the amount of $36,025 million (2010 - $19,400 million).
Borrowing Authorities
The Minister of Finance approves CMHC’s Borrowing Plan annually and establishes limits and parameters for borrowings. The Borrowing Authorities provide a maximum debt outstanding limit for 2011 of $78 billion. This limit includes Capital Market Borrowings and Borrowings from the Government of Canada that were incurred since April 2008 in the Lending and Securitization Activities. CMHC’s legislative authority, which does not apply to borrowings of CHT, requires that the total indebtedness of the Capital Market Borrowings outstanding at any time not exceed $20 billion.
Capital Market Borrowings
The following table summarizes the carrying value and yield for Capital Market Borrowings based on maturity date.
| 31 December 2011 | 31 December 2010 | 1 January 2010 | ||||||||||||||||||
| (in millions) | Carrying Value | Yield (1) | Carrying Value | Carrying Value | ||||||||||||||||
| 2010 |
- | - | - | 1,342 | ||||||||||||||||
| 2011 |
- | - | 871 | 942 | ||||||||||||||||
| 2012 |
305 | 5.53% | 314 | 323 | ||||||||||||||||
| 2013 |
372 | 4.83% | 374 | 376 | ||||||||||||||||
| 2014 |
- | - | - | - | ||||||||||||||||
| 2015 |
713 | 4.25% | 696 | 686 | ||||||||||||||||
| 2016 |
505 | 4.45% | 491 | 485 | ||||||||||||||||
| 2017 - 2021 |
308 | 4.35% | 294 | 284 | ||||||||||||||||
| Total |
2,203 | 4.60% | 3,040 | 4,438 | ||||||||||||||||
| (1) | Represents the weighted-average yield, which is determined by applying the weighted-average effective yields of individual fixed rate borrowings and the weighted-average yields to reset of floating rate notes. |
Included in Capital Market Borrowings is medium-term debt. Medium-term Capital Market Borrowings includes bonds, floating rate and fixed rate notes, with an original term to maturity ranging from two to ten years.
The interest expense related to Capital Market Borrowings is $120 million (2010 - $170 million). During the year, CMHC had Capital Market Borrowings maturities in the amount of $933 million (2010 - $1,511 million).
The carrying amount at 31 December 2011 of Capital Market Borrowings is $176 million higher (31 December 2010 - $80 million higher, 1 January 2010 - $37 million lower) than the contractual amount due at maturity. CMHC’s liabilities are backed by the full faith and credit of the Government of Canada and there is no significant change in value that can be attributed to changes in credit risk.
120 C A N A D A M O R T G A G E A N D H O U S I N G C O R P O R A T I O N
Borrowings from the Government of Canada
The following table summarizes the carrying value and yield for Borrowings from the Government of Canada based on contractual repayments for borrowings made prior to 1993 and based on maturity date for all other borrowings.
| 31 December 2011 | 31 December 2010 | 1 January 2010 | ||||||||||||||||||||||||||||||||||
| Designated | Designated | Designated | ||||||||||||||||||||||||||||||||||
| at Fair Value | at Fair Value | at Fair Value | ||||||||||||||||||||||||||||||||||
| through Profit | through Profit | through Profit | ||||||||||||||||||||||||||||||||||
| (in millions) | or Loss | Yield (1) | Other (2) | Yield (1) | or Loss | Other | or Loss | Other | ||||||||||||||||||||||||||||
| 2010 |
- | - | - | - | - | - | 651 | 2,591 | ||||||||||||||||||||||||||||
| 2011 |
- | - | - | - | 885 | 1,660 | 314 | 2,021 | ||||||||||||||||||||||||||||
| 2012 |
912 | 2.90% | 2,214 | 3.06% | 827 | 1,405 | 831 | 2,108 | ||||||||||||||||||||||||||||
| 2013 |
1,282 | 3.03% | 24,157 | 3.69% | 1,276 | 26,136 | 1,265 | 27,383 | ||||||||||||||||||||||||||||
| 2014 |
833 | 2.14% | 27,929 | 2.71% | 810 | 29,131 | 790 | 28,220 | ||||||||||||||||||||||||||||
| 2015 |
971 | 2.55% | 2,446 | 3.56% | 932 | 2,273 | 17 | 205 | ||||||||||||||||||||||||||||
| 2016 |
1,186 | 2.14% | 268 | 6.26% | 5 | 226 | - | 150 | ||||||||||||||||||||||||||||
| 2017 - 2021 |
1,400 | 3.14% | 1,705 | 6.77% | 982 | 1,473 | 609 | 1,113 | ||||||||||||||||||||||||||||
| Thereafter |
- | - | 2,244 | 7.88% | - | 1,935 | - | 1,583 | ||||||||||||||||||||||||||||
| Total |
6,584 | 2.69% | 60,963 | 3.46% | 5,717 | 64,239 | 4,477 | 65,374 | ||||||||||||||||||||||||||||
| (1) | Represents the weighted-average yield, which is determined by applying the weighted-average effective yields of individual fixed rate borrowings and the weighted- average yields to reset of floating rate notes. |
| (2) | CMHC repays certain IMPP-related Other Borrowings as it receives principal payments and prepayments on the associated NHA MBS. The maturities for these borrowings are estimated based on assumptions regarding mortgage prepayments, liquidations and conversions of the underlying MBS, which are described in Note 6. |
Included in Borrowings from the Government of Canada – Designated at Fair Value through Profit or Loss is short-term and medium-term debt. Short-term debt outstanding of $94 million (31 December 2010 - $576 million, 1 January 2010 - $651 million) has an original term to maturity less than 365 days, and a yield of 0.83% (31 December 2010 - 0.96%, 1 January 2010 - 0.16%). Medium-term debt includes fixed rate notes, with an original term to maturity ranging from two to ten years.
The interest expense related to Borrowings from the Government of Canada – Designated at Fair Value through Profit or Loss is $166 million (2010 - $135 million), and for Borrowings from the Government of Canada – Other is $2,151 million (2010 - $2,135 million). During the period, CMHC had new borrowings in the amount of $3,928 million (2010 - $9,982 million), and repayments in the amount of $6,494 million (2010 - $9,893 million) relating to its Borrowings from the Government of Canada.
The carrying amount at 31 December 2011 of Borrowings from the Government of Canada - Designated at Fair Value through Profit or Loss is $231 million (31 December 2010 - $61 million, 1 January 2010 - $17 million) higher than the contractual amount due at maturity. CMHC’s liabilities are backed by the full faith and credit of the Government of Canada and there is no significant change in value that can be attributed to changes in credit risk.
Borrowings from the Government of Canada include borrowings under the terms of the Crown Borrowing Agreement that are issued at the Government of Canada rate. On the day of exchange, these borrowings are adjusted to market value and the associated gains/losses are amortized through profit or loss on a straight-line basis over the term of the borrowings.
121
| 13. | ACCOUNTS PAYABLE AND OTHER LIABILITIES |
The following table presents the composition of Accounts Payable and Other Liabilities.
| (in millions) | 31 December 2011 | 31 December 2010 | 1 January 2010 | |||||||||
| Accrued Housing Programs Expenses |
339 | 495 | 399 | |||||||||
| Defined Benefit Liability for Post-employment Benefits (Note 21) | 603 | 404 | 277 | |||||||||
| Deferred Gains |
60 | 44 | 34 | |||||||||
| Income Taxes Payable |
- | 103 | - | |||||||||
| Obligation Under Capital Lease |
11 | 13 | 15 | |||||||||
| Other Miscellaneous Liabilities |
159 | 119 | 116 | |||||||||
| Total |
1,172 | 1,178 | 841 | |||||||||
| 14. | MORTGAGE LOAN INSURANCE |
Role of the Appointed Actuary
The actuary is appointed by CMHC’s Management to carry out a valuation of the policy liabilities (Provision for Claims and Unearned Premiums) of the Mortgage Loan Insurance Activity as at 30 September. The factors and techniques used in the valuation are in accordance with Canadian accepted actuarial practice, applicable legislation, and associated regulations. The appointed actuary also performs a roll-forward of the Provision for Claims from the date of the actuarial valuation to 31 December.
As a result of the most recent Actuarial Valuation, the earnings factors were changed to more closely reflect the emerging nature of the claim occurrence experience. Premiums and Fees revenue on the Consolidated Statement of Income and Comprehensive Income is $19 million higher in 2011 while Unearned Premiums and Fees on the Consolidated Balance Sheet as at 31 December 2011 is $19 million lower than it would have been had this change not been implemented. Due to the change, Unearned Premiums and Fees is expected to be $33 million lower at 31 December 2012 and $29 million lower at 31 December 2013, resulting in Premiums and Fees revenue being $14 million higher in 2012 and $4 million lower in 2013.
Premiums and Fees
The following table presents the composition of Premiums and Fees:
| (in millions) | 2011 | 2010 | ||||||
| Earned Premiums |
1,766 | 1,714 | ||||||
| Earned Application Fees |
25 | 24 | ||||||
| Premiums and Fees |
1,791 | 1,738 | ||||||
122 C A N A D A M O R T G A G E A N D H O U S I N G C O R P O R A T I O N
Unearned Premiums and Fees
The following table presents the changes in the Unearned Premiums and Fees balance:
| (in millions) | 2011 | 2010 | ||||||
| Balance at Beginning of Year |
6,874 | 6,675 | ||||||
| Premium Deferred on Contracts Written in the Year |
1,622 | 1,910 | ||||||
| Premiums Earned |
(1,766) | (1,714) | ||||||
| Application Fees Deferred on Contracts Written in the Year |
14 | 16 | ||||||
| Application Fees Earned |
(13) | (13) | ||||||
| Balance at End of Year |
6,731 | 6,874 | ||||||
Deferred Acquisition Costs
The following table presents the changes in the Deferred Acquisition Costs balance:
| (in millions) | 2011 | 2010 | ||||||
| Balance at Beginning of Year |
103 | 89 | ||||||
| Acquisition Costs Deferred |
34 | 39 | ||||||
| Amortization of Deferred Acquisition Costs |
(28) | (25) | ||||||
| Balance at End of Year |
109 | 103 | ||||||
Provision for Claims
The Provision for Claims includes amounts set aside for IBNR claims, claims reported but not paid and for Social Housing Mortgage and Index Linked Mortgage claims. The following table presents the changes in the Provision for Claims balance:
| (in millions) | 2011 | 2010 | ||||||
| Balance at Beginning of Year |
1,096 | 1,276 | ||||||
| Losses on Claims during the Year |
(617) | (678) | ||||||
| Provision for claims incurred during the Year |
562 | 498 | ||||||
| Balance at End of Year |
1,041 | 1,096 | ||||||
Of the $1,041 million in the Provision for Claims at 31 December 2011, $726 million is expected to be paid during the next 12 months and the remainder to be paid in 2013 and thereafter.
The Provision for Claims is based on known facts and interpretation of circumstances, and is influenced by a large variety of factors.
There is a limitation to the accuracy of policy liability estimates as provided in the valuation report prepared by CMHC’s Appointed Actuary. There is inherent uncertainty in any estimate of ultimate liabilities including for premium deficiency, IBNR, Claims in Process, Social Housing Mortgages and Index Linked Mortgages because CMHC’s ultimate liability for claims is subject to the outcome of events yet to occur.
In addition to a risk of underestimating or overestimating the total amount of claim liabilities, there is a risk that the timing of the future payment of liabilities or the return on investments will differ materially from the assumptions underlying the valuation of insurance policy liabilities.
123
The most significant factors affecting the frequency of claims as a result of borrower default are an increase of the incidence of unemployment, a decrease in house price inflation and increasing mortgage rates.
The key method used by CMHC for estimating insurance policy liabilities is the actuarial present value basis.
Significant Factors
The following factors affect the key actuarial assumptions.
Claim emergence: Claim emergence encompasses claim frequency and claim occurrence patterns. It is based on historical trends in claims and arrears reporting.
Claim severity: Claim severity, or average loss on claims, is dependent on the dollar value of claims, losses on sales of real estate properties, administrative expenses, payment delays and sale delays. These factors are generally based on historical experience.
Economic conditions: Recent past and projected economic factors, such as unemployment rates, mortgage interest rates, and changes in house prices, affect the forecast of future claim levels.
The Provision for Claims consists of estimates of incurred losses and related expenses. Actual incurred amounts may not develop exactly as projected and may in fact vary significantly from the projections. Provisions are reviewed and evaluated at the end of each quarter in light of emerging claim experience and changing circumstances. The resulting changes in the estimated Provision for Claims are recorded in Net Claims in the year in which they are determined.
CMHC determines Provisions for Claims and Unearned Premiums at 31 December using valuation factors from the 30 September valuation, taking into account changes in economic circumstances, premiums received and claims paid in the intervening period.
CMHC considers that the liability for Mortgage Loan Insurance Activities recognized in the Consolidated Balance Sheet is sufficient. However, actual experience will differ from the expected outcome.
Sensitivity Analysis
The following table presents the sensitivity of the level of insurance contract liabilities disclosed in this note to movements in the economic factors used to calculate them. The percentage change in variables is applied to a range of existing actuarial modelling assumptions to derive the possible impact on Income before Income Taxes. The disclosure is not intended to explain the impact of a percentage change in the insurance assets and liabilities disclosed above.
The results of sensitivity testing are set out below, showing the impact on Income before Income Taxes. For each scenario the impact of a change in a single factor is shown, with other assumptions unchanged.
| (in millions) | 2011 | 2010 | ||||||
| 100 bps Increase in Unemployment Rate |
(75) | (75) | ||||||
| 100 bps Decrease in Rate of House Price Inflation |
(17) | (20) | ||||||
| 100 bps Increase in Mortgage Rates |
(42) | (20) | ||||||
These sensitivities are hypothetical and should be viewed in that light. The relationship of a change in assumption to the change in value may not be linear. Changes in one factor may result in changes in another which might magnify or counteract the sensitivities.
CMHC’s method for sensitivity testing has not changed significantly from the prior year.
124 C A N A D A M O R T G A G E A N D H O U S I N G C O R P O R A T I O N
Claims Development:
The following table shows the development of claims over a period of time and the estimated ultimate cost of claims for 2007 through 2011. In 2011, in the year of adoption of IFRS, only five years are required to be disclosed. This will be increased in each succeeding year, until ten years of information is presented. The table shows how the estimates of Incurred But Not Reported claims for each year develop over time.
| (in millions) | 2007 | 2008 | 2009 | 2010 | 2011 | Total | ||||||||||||||||||
| Expected Losses on Claims in the year |
229 | 276 | 357 | 886 | 726 | 2,474 | ||||||||||||||||||
| Actual Losses on Claims in the year |
217 | 248 | 512 | 678 | 617 | 2,272 | ||||||||||||||||||
| Differences |
(12) | (28) | 155 | (208) | (109) | (202) | ||||||||||||||||||
Mortgage Loan Insurance Risk Management
CMHC assumes the risk of loss from borrower default through mortgage insurance contracts entered into with lenders, exposing CMHC to the uncertainty surrounding the timing, frequency and severity of claims. CMHC manages its exposure to this risk of loss through prudent product design, underwriting and default management practices, and the establishment of adequate capital reserves.
A concentration of risk may arise from insurance contracts issued in a particular geographical area where local economic conditions are significantly different from average. The relative impact of the outcome is mitigated as a result of CMHC’s distribution of business across different geographic areas.
Insurance-in-force
At 31 December 2011, insurance-in-force, which represents the risk exposure of the CMHC Mortgage Loan Insurance Activity, totalled $567 billion (31 December 2010 - $514 billion, 1 January 2010 - $473 billion).
Under Section 11 of the NHA, the total of outstanding insured amounts of all insured loans may not exceed $600 billion (31 December 2010 - $600 billion, 1 January 2010 - $600 billion).
| 15. | INCOME TAXES |
The following is a reconciliation of the statutory tax rate of the Corporation to the effective tax rate.
| (in millions) | 2011 | 2010 | ||||||
| Income before Income Taxes |
2,082 | 1,980 | ||||||
| Statutory Tax Rate |
26.5% | 28% | ||||||
| Income Taxes computed at Statutory Tax Rate |
552 | 554 | ||||||
| Change in Tax Rates on Income Taxes |
11 | 1 | ||||||
| Permanent Differences |
(17) | (13) | ||||||
| Other |
7 | (2) | ||||||
| Income Tax Expense |
553 | 540 | ||||||
| Effective Tax Rate |
26.58% | 27.27% | ||||||
125
The following table presents the total income taxes.
| (in millions) | 2011 | 2010 | ||||||
| Other Comprehensive Income: |
||||||||
| Net Unrealized Gains (Losses) on Available for Sale Financial Instruments |
152 | 165 | ||||||
| Reclassification Prior Years’ Net Unrealized (Gains) Losses Realized in the period |
(57) | (13) | ||||||
| Net Actuarial Gain (Losses) on Employee Benefit Plans |
(38) | (19) | ||||||
| Income Tax Expense (Benefit) on Other Comprehensive Income |
57 | 133 | ||||||
| Income Tax Expense on Consolidated Statement of Equity of Canada |
(1) | (1) | ||||||
| Income Tax Expense on Consolidated Net Income |
553 | 540 | ||||||
| Total |
609 | 672 | ||||||
The following table presents the tax-effected temporary differences which result in deferred income tax assets and liabilities.
| Change | ||||||||||||||||||||||||||||
| through | Change | Change | ||||||||||||||||||||||||||
| Income | through | through | Other | |||||||||||||||||||||||||
| (in millions) | 1 January 2010 | 31 December 2010 | Statement | OCI | Equity | Reversals | 31 December 2011 | |||||||||||||||||||||
| Deferred Income Tax Assets |
||||||||||||||||||||||||||||
| Fair Value of Financial Instruments |
49 | 53 | 45 | (11) | - | 14 | 101 | |||||||||||||||||||||
| Post-employment Benefits |
48 | 69 | (3) | 38 | - | - | 104 | |||||||||||||||||||||
| Unamortized Premiums on Capital Market Borrowings |
2 | 2 | - | - | - | - | 2 | |||||||||||||||||||||
| Other |
4 | 2 | 2 | - | - | - | 4 | |||||||||||||||||||||
| Total Deferred Income Tax Assets |
103 | 126 | 44 | 27 | - | 14 | 211 | |||||||||||||||||||||
| Deferred Income Tax Liabilities |
||||||||||||||||||||||||||||
| Fair Value of Investment Properties |
- | (1) | (1) | - | - | - | (2) | |||||||||||||||||||||
| Fair Value of Real Estate (Lending) |
(17) | (20) | (1) | - | - | - | (21) | |||||||||||||||||||||
| Deferred Gains on Disposal of Financial Instruments |
(9) | (8) | - | - | - | 2 | (6) | |||||||||||||||||||||
| Deferred Issuance Costs |
(13) | (7) | 2 | - | - | - | (5) | |||||||||||||||||||||
| Deferred Application and Compensatory Fees |
(14) | (14) | - | - | - | 14 | - | |||||||||||||||||||||
| Provision for Claims |
(75) | (89) | (2) | - | (8) | - | (99) | |||||||||||||||||||||
| Total Deferred Income Tax Liabilities |
(128) | (139) | (2) | - | (8) | 16 | (133) | |||||||||||||||||||||
| Net Deferred Income Tax Assets (Liabilities) |
(25) | (13) | 42 | 27 | (8) | 30 | 78 | |||||||||||||||||||||
The deferred income tax assets (liabilities) have been recognized in full as the Corporation believes it is probable that these items will be realized in the normal course of its operations.
126 C A N A D A M O R T G A G E A N D H O U S I N G C O R P O R A T I O N
| 16. | CAPITAL MANAGEMENT |
For capital management purposes and as provided for in the CMHC Act and the NHA, CMHC considers its capital to be Accumulated Other Comprehensive Income, Retained Earnings, comprised of Appropriated Retained Earnings, Unappropriated Retained Earnings and the Lending’s Reserves as well as the Contributed Capital.
CMHC’s primary objective with respect to capital management is to ensure that it has adequate capital to deliver its mandate while remaining financially self-sustaining and also to follow prudent business practices and guidelines existing in the private sector as appropriate. CMHC capital management policy is included in its Corporate Plan which is approved annually by the Governor in Council.
There are no externally imposed minimal capital requirements on CMHC. Appropriated Retained Earnings represents the portion of cumulative Net Income from the Mortgage Loan Insurance and Securitization Activities that has been set aside for capitalization purposes. The Appropriated Retained Earnings of the Mortgage Loan Insurance Activity are based on CMHC’s Capital Management Framework which is based on guidelines developed by the Office of the Superintendent of Financial Institutions (OSFI) and the Appropriated Retained Earnings of the Securitization Activity are based on regulatory and economic capital principles.
OSFI’s minimum regulatory capital requirement is 100% of its Minimum Capital Test (MCT). OSFI expects regulated insurers to establish a target capital level and a capital holding level based on acceptable levels of risk. The Board has selected an internal capital target of 150% MCT and a capital holding level of 200% MCT. The selection of the capital holding level is to ensure that the likelihood of falling below the internal capital target is minimized. CMHC is currently meeting its capital holding level.
Unappropriated Retained Earnings represent the cumulative Net Income and Net Actuarial Gains (Losses) on Post-employment benefits generated by the Mortgage Loan Insurance and Securitization Activities that has not been set aside for capitalization purposes.
CHT has no capital to manage as all income is distributed to the beneficiaries of the trust.
CMHC places all other retained earnings in its Reserve Fund for Lending. The components of this Reserve are outlined in the following table. There is an externally imposed limit on each of the components. Should the overall limit be exceeded, CMHC would be required to pay the excess to the Government of Canada.
| 31 December 2011 | 31 December 2010 | 1 January 2010 | ||||||||||||||||||||||||||
| Authorized | Authorized | Authorized | ||||||||||||||||||||||||||
| (in millions) | Limit | Balance | Limit | Balance | Limit | Balance | ||||||||||||||||||||||
| Reserve for Unrealized Gains and Losses |
115 | (101) | 115 | (30) | 115 | (4) | ||||||||||||||||||||||
| Reserve for All Other Lending-Related Items |
125 | 105 | 125 | 98 | 125 | 103 | ||||||||||||||||||||||
| Eliminations |
n/a | (13) | n/a | - | n/a | - | ||||||||||||||||||||||
| Reserve Fund for Lending |
240 | (9) | 240 | 68 | 240 | 99 | ||||||||||||||||||||||
CMHC has managed its capital as approved in its 2011 Corporate Plan Summary in accordance with the CMHC Act and the NHA. There have been no changes in what is considered to be capital or the objectives of managing capital during the year.
127
| 17. | FINANCIAL INSTRUMENTS |
Determination of Fair Value
All financial instruments are recognized initially at fair value. Fair value is the amount of the consideration that would be agreed upon in an arm’s length transaction between knowledgeable, willing parties who are under no compulsion to act. Accrued interest is separately disclosed for all financial instruments.
Fair values are estimated using the following fair value methods. The fair value measurement hierarchy reflects the observability of the most significant inputs used in making these measurements.
Fair Value Hierarchy:
Level 1:
Financial assets quoted in active markets are measured based on the bid price of an identical asset. Financial liabilities quoted in active markets are measured based on the ask price of an identical liability.
Level 2:
Financial assets and liabilities not quoted in active markets that are measured based on discounted cash flow or other valuation methodologies making maximum use of directly or indirectly observable market data.
Level 3:
Financial assets and liabilities not quoted in active markets that are measured based on discounted cash flow analysis techniques or other valuation methodologies where significant inputs are not based on observable market data. Examples of these inputs are discount rates which include assumptions related to credit and liquidity risk premiums which are unobservable in the market.
The following table represents the fair value hierarchy in which fair value measurements are categorized for assets and liabilities recorded on the Consolidated Balance Sheet. During the year ended 31 December 2011, there were no significant transfers between Level 1 and Level 2.
| 31 December 2011 | ||||||||||||||||
| (in millions) | Level 1 | Level 2 | Level 3 | Total | ||||||||||||
| Assets |
||||||||||||||||
| Cash and Cash Equivalents |
617 | 512 | - | 1,129 | ||||||||||||
| Investment Securities: |
||||||||||||||||
| Designated at Fair Value through Profit or Loss |
584 | 200 | 119 | 903 | ||||||||||||
| Held for Trading |
397 | - | - | 397 | ||||||||||||
| Available for Sale |
17,353 | 188 | 8 | 17,549 | ||||||||||||
| Loans: |
||||||||||||||||
| Designated at Fair Value through Profit or Loss |
- | 7,132 | - | 7,132 | ||||||||||||
| Derivatives |
- | 169 | - | 169 | ||||||||||||
| Assets not Recorded at Fair Value |
264,611 | |||||||||||||||
| Total Assets |
18,951 | 8,201 | 127 | 291,890 | ||||||||||||
| Liabilities |
||||||||||||||||
| Borrowings: |
||||||||||||||||
| Capital Market Borrowings |
2,203 | - | - | 2,203 | ||||||||||||
| Borrowings from the Government of Canada: |
||||||||||||||||
| Designated at Fair Value through Profit or Loss |
- | 6,584 | - | 6,584 | ||||||||||||
| Derivatives |
- | 72 | - | 72 | ||||||||||||
| Liabilities and Equity not Recorded at Fair Value |
283,031 | |||||||||||||||
| Total Liabilities and Equity |
2,203 | 6,656 | - | 291,890 | ||||||||||||
128 C A N A D A M O R T G A G E A N D H O U S I N G C O R P O R A T I O N
| 31 December 2010 | ||||||||||||||||
| (in millions) | Level 1 | Level 2 | Level 3 | Total | ||||||||||||
| Assets |
||||||||||||||||
| Cash and Cash Equivalents |
247 | 677 | - | 924 | ||||||||||||
| Investment Securities: |
||||||||||||||||
| Designated at Fair Value through Profit or Loss |
205 | 394 | 112 | 711 | ||||||||||||
| Held for Trading |
- | - | - | - | ||||||||||||
| Available for Sale |
16,288 | 71 | - | 16,359 | ||||||||||||
| Loans: |
||||||||||||||||
| Designated at Fair Value through Profit or Loss |
- | 7,294 | - | 7,294 | ||||||||||||
| Derivatives |
- | 116 | - | 116 | ||||||||||||
| Assets not Recorded at Fair Value |
262,536 | |||||||||||||||
| Total Assets |
16,740 | 8,552 | 112 | 287,940 | ||||||||||||
| Liabilities |
||||||||||||||||
| Borrowings: |
||||||||||||||||
| Capital Market Borrowings |
3,040 | - | - | 3,040 | ||||||||||||
| Borrowings from the Government of Canada: |
||||||||||||||||
| Designated at Fair Value through Profit or Loss |
- | 5,717 | - | 5,717 | ||||||||||||
| Derivatives |
- | 107 | - | 107 | ||||||||||||
| Liabilities and Equity not Recorded at Fair Value |
279,076 | |||||||||||||||
| Total Liabilities and Equity |
3,040 | 5,824 | - | 287,940 | ||||||||||||
| 1 January 2010 | ||||||||||||||||
| (in millions) | Level 1 | Level 2 | Level 3 | Total | ||||||||||||
| Assets |
||||||||||||||||
| Cash and Cash Equivalents |
380 | 403 | - | 783 | ||||||||||||
| Investment Securities: |
||||||||||||||||
| Designated at Fair Value through Profit or Loss |
785 | - | 93 | 878 | ||||||||||||
| Held for Trading |
- | - | - | - | ||||||||||||
| Available for Sale |
14,347 | - | - | 14,347 | ||||||||||||
| Loans: |
||||||||||||||||
| Designated at Fair Value through Profit or Loss |
- | 7,533 | - | 7,533 | ||||||||||||
| Derivatives |
- | 111 | - | 111 | ||||||||||||
| Assets not Recorded at Fair Value |
244,035 | |||||||||||||||
| Total Assets |
15,512 | 8,047 | 93 | 267,687 | ||||||||||||
| Liabilities |
||||||||||||||||
| Borrowings: |
||||||||||||||||
| Capital Market Borrowings |
4,438 | - | - | 4,438 | ||||||||||||
| Borrowings from the Government of Canada: |
||||||||||||||||
| Designated at Fair Value through Profit or Loss |
- | 4,477 | - | 4,477 | ||||||||||||
| Derivatives |
- | 263 | - | 263 | ||||||||||||
| Liabilities and Equity not Recorded at Fair Value |
258,509 | |||||||||||||||
| Total Liabilities and Equity |
4,438 | 4,740 | - | 267,687 | ||||||||||||
129
The following table presents the change in the fair value measurement of Level 3 Investment Securities.
| (in millions) | 2011 | 2010 | ||||||
| Balance at Beginning of Year |
112 | 93 | ||||||
| Purchases |
3 | - | ||||||
| Transfers In (Out) |
4 | - | ||||||
| Unrealized Gains (Losses) in Net Income(1) |
8 | 19 | ||||||
| Realized Losses in Net Income(2) |
- | - | ||||||
| Cash Receipts on Settlements |
- | - | ||||||
| Balance at End of Year |
127 | 112 | ||||||
| Gains (Losses) for Positions Held at 31 December(1) |
8 | 19 | ||||||
| (1) | Included in Net Unrealized Gains (Losses) from Financial Instruments. |
| (2) | Included in Net Realized Gains (Losses) from Financial Instruments. |
CMHC’s valuation for Level 3 Investment Securities was based on its assessment of the prevailing conditions at 31 December 2011, which may change materially in subsequent periods. The most significant factor which may have an impact on the future value of these assets is the discount rates. A 100 bps decrease (increase) in the discount factor would result in a $6 million increase ($6 million decrease) in Income before Income Taxes.
Financial Instruments Carried at Amortized Cost
Using the valuation methods described above, the following table presents the fair values of financial instruments carried at amortized cost, except where amortized cost is a reasonable approximation of fair value.
| 31 December 2011 | 31 December 2010 | 1 January 2010 | ||||||||||||||||||||||||||
| (in millions) | Fair Value |
Amortized Cost |
Fair Value |
Amortized Cost |
Fair Value |
Amortized Cost |
||||||||||||||||||||||
| Investment in NHA Mortgage-Backed Securities – |
266,477 | 256,655 | 261,316 | 254,993 | 243,408 | 237,282 | ||||||||||||||||||||||
| Securities Purchased Under Resale Agreements(2) |
- | - | - | - | 127 | 127 | ||||||||||||||||||||||
| Loans – Other(2) |
6,005 | 4,726 | 5,167 | 4,214 | 4,139 | 3,255 | ||||||||||||||||||||||
| Loans – Investments in Housing Programs(2) |
1,477 | 808 | 1,478 | 873 | 1,531 | 939 | ||||||||||||||||||||||
| Canada Mortgage Bonds(1) |
206,974 | 199,373 | 198,146 | 193,636 | 178,826 | 174,062 | ||||||||||||||||||||||
| Borrowings from the Government of Canada – |
65,317 | 60,963 | 67,790 | 64,239 | 68,397 | 65,374 | ||||||||||||||||||||||
| (1) | Fair value determined based on Level 1 Criteria. |
| (2) | Fair value determined based on Level 2 Criteria. |
Classification of Cash and Cash Equivalents
The following table presents a breakdown of Cash and Cash Equivalents by Financial Instrument classification.
| (in millions) | 31 December 2011 | 31 December 2010 | 1 January 2010 | |||||||||||
| Designated at Fair Value through Profit or Loss |
347 | 511 | 213 | |||||||||||
| Available for Sale |
782 | 413 | 570 | |||||||||||
| Held to Maturity |
272 | 61 | 52 | |||||||||||
| Total |
1,401 | 985 | 835 | |||||||||||
130 C A N A D A M O R T G A G E A N D H O U S I N G C O R P O R A T I O N
Gains and Losses from Financial Instruments
The unrealized gains and losses arising from changes in fair value related to financial instruments classified as HFT and those Designated at Fair Value through Profit or Loss are presented in the following table.
| (in millions) | 2011 | 2010 | ||||||
| Held for Trading |
||||||||
| Equities |
(89) | - | ||||||
| Derivatives |
5 | (75) | ||||||
| Total Held for Trading |
(84) | (75) | ||||||
| Designated at Fair Value through Profit or Loss |
||||||||
| Investment Securities – Designated at Fair Value |
28 | 20 | ||||||
| Loans – Designated at Fair Value through Profit or Loss |
99 | (40) | ||||||
| Capital Market Borrowings |
6 | 125 | ||||||
| Borrowings from the Government of Canada – Designated at Fair Value through Profit or Loss |
(180) | (52) | ||||||
| Total Designated at Fair Value through Profit or Loss |
(47) | 53 | ||||||
| Gains (Losses) from Related Party Transactions |
13 | 28 | ||||||
| Total Net Unrealized Gains (Losses) from Financial Instruments |
(118) | 6 | ||||||
All items Designated at Fair Value through Profit and Loss, with the exception of certain Investment Securities held within the Mortgage Loan Insurance and Securitization Activities, relate to the Lending Activity. For certain portfolios of loans and associated borrowings, the Lending Activity uses Derivatives to manage refinancing, reinvestment and currency risks, as well as mismatches between the timing of receipts from assets and payments of liabilities. Classifying the Loans, and associated Capital Market Borrowings and Borrowings from the Government of Canada, as Designated at Fair Value through Profit or Loss significantly reduces the measurement inconsistency that would otherwise arise from measuring them at amortized cost and measuring the Derivatives at fair value.
Certain Investment Securities within the Mortgage Loan Insurance and Securitization Activities are also classified as Designated at Fair Value as they are managed and reported to Management on a fair value basis.
There has been no change in the fair value of Loans – Designated at Fair Value through Profit or Loss as a result of changes in credit risk. These loans are assured the full collection of principal and interest through a third-party or are underwritten by the Mortgage Loan Insurance Activity as detailed in Note 7.
The realized gains and losses related to financial instruments are presented in the table below.
| (in millions) | 2011 | 2010 | ||||||
| Held for Trading |
1 | 6 | ||||||
| Available for Sale |
219 | 61 | ||||||
| Retirement of Debt |
(23) | (29) | ||||||
| Total Net Realized Gains (Losses) from Financial Instruments |
197 | 38 | ||||||
131
Interest Income and Interest Expense
The following table outlines the total interest income and expense calculated using the effective interest method for financial instruments.
| 2011 | 2010 | |||||||||||||||||
| (in millions) | Income | Expense | Income | Expense | ||||||||||||||
| Available for Sale Financial Assets |
506 | - | 494 | - | ||||||||||||||
| Held to Maturity Financial Assets |
3 | - | 1 | - | ||||||||||||||
| Investment in NHA MBS - Loans and Receivables |
8,274 | - | 7,989 | - | ||||||||||||||
| Securities Purchased Under Resale Agreements |
1 | - | - | - | ||||||||||||||
| Loans – Other |
338 | - | 232 | - | ||||||||||||||
| Loans – Investments in Housing Programs |
79 | - | 97 | - | ||||||||||||||
| Securities Sold Under Repurchase Agreements |
- | 3 | - | - | ||||||||||||||
| Canada Mortgage Bonds |
- | 6,406 | - | 6,130 | ||||||||||||||
| Borrowings from the Government of Canada – Other |
- | 2,151 | - | 2,135 | ||||||||||||||
| Total Interest for Financial Instruments not at Fair Value through Profit or Loss |
9,201 | 8,560 | 8,813 | 8,265 | ||||||||||||||
| Total Financial Instruments at Fair Value through Profit or Loss |
267 | 246 | 329 | 266 | ||||||||||||||
| Total Dividends |
86 | - | 77 | - | ||||||||||||||
| Total Interest |
9,554 | 8,806 | 9,219 | 8,531 | ||||||||||||||
| 18. | MARKET RISK |
Market risk is the risk of adverse financial impact arising from changes in underlying market factors, including interest rates, foreign exchange rates, and equity prices.
Interest Rate Risk
Interest rate risk is the risk that the fair value or future cash flows of a financial instrument will fluctuate because of changes in market interest rates.
The investment portfolios for the Mortgage Loan Insurance and Securitization Activities are managed taking into consideration the Strategic Asset Allocation (SAA) analysis and review process which assesses alternative risk/return investment strategies and limiting price sensitivity to interest rate changes relative to benchmark indices and by appropriate asset diversification. Interest rate risk associated with the Lending Activity is managed through asset and liability matching, use of swap derivatives and capital market strategies.
Some of CMHC’s Loans and Investments in Housing Programs contain prepayment and/or repricing options. As CMHC does not have the right to prepay its Borrowings from the Government of Canada without penalty, it is exposed to interest rate risk.
132 C A N A D A M O R T G A G E A N D H O U S I N G C O R P O R A T I O N
Currency Risk
Currency risk is the risk that the fair value or future cash flows of a financial instrument will fluctuate because of changes in foreign exchange rates.
All currency exposure arising from foreign denominated debt issuance is economically hedged in accordance with Corporate policy. As part of its SAA policy, the Corporation has assumed currency exposure to further its Mortgage Loan Insurance and Securitization investment portfolio diversification.
In addition, CMHC has currency exposure through foreign currency denominated equity pooled funds classified as Held for Trading. The table below indicates the currencies to which CMHC has significant exposure as at 31 December 2011 and the impact on Income before Income Taxes of a 10% shift in their value relative to the Canadian dollar:
| (in millions) | Currency Risk Exposed Holdings |
10% Increase in Foreign Currency |
10% Decrease in Foreign Currency |
|||||||||
| Euro Currency Unit |
99 | 10.9 | (9.0) | |||||||||
| British Pound |
96 | 10.6 | (8.7) | |||||||||
| Japanese Yen |
66 | 7.4 | (6.0) | |||||||||
| Swiss Franc |
48 | 5.3 | (4.3) | |||||||||
As at 31 December 2011, had the Canadian dollar strengthened or weakened by 10% in relation to all currencies, with all other variables held constant, assets classified as Held for Trading in the Mortgage Loan Insurance and Securitization portfolios would have increased or decreased, respectively, by approximately $40 million.
Other Price Risk
This is the risk that the fair value of future cash flows of a financial instrument will fluctuate because of changes in market prices. CMHC is exposed to other price risk through fluctuations in prices of equity investments. The majority of equity investment assets are actively managed against selected benchmarks derived from a SAA. CMHC limits its exposure by using tolerance ranges around the benchmarks for various diversification and exposure measures.
Sensitivity Analysis
Value at Risk: Market risk for investment securities in the Mortgage Loan Insurance and Securitization portfolios are evaluated through the use of a Value at Risk (VaR) model. VaR is a statistical estimation that measures the maximum potential market loss of a portfolio over a specified holding period with a given level of confidence. The calculation of VaR is based on the Delta-normal method which may underestimate the occurrence of large losses because of its reliance on a normal distribution. The following table shows the VaR for the Mortgage Loan Insurance and Securitization investment portfolios as at 31 December, with a 95% confidence level over a two-week holding period. The analysis is based on one-year historical data of prices, volatilities and correlations of the various bond and equity markets.
133
Interest Rate Sensitivity: The financial instruments Designated at Fair Value through Profit or Loss and classified as HFT in the Lending Activity portfolio are exposed to interest rate movements. For Loans – Designated at Fair Value through Profit or Loss, the impacts of interest rate shifts on the portfolio are not symmetrical. A -200 bps interest rate shift would result in an increase in value of $403 million (2010 - $394 million) whereas a +200 bps interest rate shift would result in a decrease in value of $380 million (2010 - $378 million). For all remaining loans, a -200 bps interest rate shift would result in an increase in value of $1,203 million (2010 - $1,017 million) whereas a +200 bps interest rate shift would result in a decrease in value of $858 million (2010 - $774 million). The following table shows the maximum exposure of the Lending Activity portfolio’s net interest margin to interest rate movements with a 95% confidence over a one year period as at 31 December. The maximum exposure is limited by CMHC policy to $1.5 million.
| 2011 | 2010 | |||||||||
| (in millions) | Total Comprehensive Income |
Total Comprehensive Income |
||||||||
| Value at Risk |
174 | 158 | ||||||||
| Maximum Exposure |
1 | 0.9 | ||||||||
Investment in NHA Mortgage-Backed Securities – Loans and Receivables
IMPP and CHT are exposed to both interest rate risk and prepayment/reinvestment risk. Prepayment/reinvestment risk is the risk that NHA MBS may experience varying degrees of prepayment throughout the term and these prepayments must be reinvested immediately.
To mitigate these risks, CMHC and CHT enter into swap agreements with approved financial institutions. Under these agreements, both interest rate and prepayment/reinvestment risks are transferred to swap counterparties. These swap counterparties manage reinvestment assets in accordance with pre-established investment guidelines. CMHC and CHT pay all interest received from the underlying assets to the swap counterparties and the swap counterparties pay CMHC and CHT an amount equal to the coupon payments on the Borrowings from the Government of Canada and Canada Mortgage Bonds, respectively. As a result of these swap agreements, changes in interest rates or prepayments/reinvestments have no impact on the Statement of Income and Comprehensive Income.
| 19. | CREDIT RISK |
Credit risk is the risk of loss arising from a counterparty’s inability to fulfill its contractual obligations. The Corporation is exposed to credit risk from various sources, including from its investment, lending, derivative, advances to mortgage-insured social housing projects in difficulty and mortgage receivable transactions.
Credit risk associated with the Corporation’s fixed income investments and derivatives is managed through the implementation of policies which include minimum counterparty credit ratings and investment portfolio diversification limits by issuer, credit rating and by industry sector, and through the use of appropriate legal agreements.
Concentration risk is the amount of credit risk the Corporation is exposed to in relation to specific counterparty and/or sectors. CMHC risk management policies address concentration risk from activities where the amount of potential loss can be measured (direct investments, lending and derivative transactions credit risk) at both the individual counterparty level and at the sector level and by credit rating.
134 C A N A D A M O R T G A G E A N D H O U S I N G C O R P O R A T I O N
CMHC’s largest concentration of credit risk by individual counterparty is to the Government of Canada (31 December 2011- $4,280 million, 31 December 2010 - $3,590 million), and the largest concentration of credit risk by sector is to the provincial sector (31 December 2011 - $5,952 million, 31 December 2010 - $4,733 million).
Credit Quality
The following table presents the credit quality of the Corporation’s Cash Equivalents and Investment Securities based on an internal credit rating system.
| 2011 | 2010 | |||||||||||||||||||||||||||||||||
| (in millions) | AAA | AA- to AA+ |
A- to A+ |
Lower than A- |
AAA | AA- to AA+ |
A- to A+ |
Lower than A- |
||||||||||||||||||||||||||
| Cash Equivalents |
1,410 | 50 | - | - | 488 | 363 | 143 | - | ||||||||||||||||||||||||||
| Investment Securities(1): |
||||||||||||||||||||||||||||||||||
| Designated at Fair Value |
168 | 441 | 175 | 119 | 202 | 397 | - | 112 | ||||||||||||||||||||||||||
| Available for Sale |
5,290 | 3,312 | 4,932 | 631 | 4,806 | 3,067 | 4,289 | 686 | ||||||||||||||||||||||||||
| (1) | Includes fixed income investments only |
Maximum Exposure to Credit Risk
Loans and Investments in Housing Programs: CMHC’s maximum exposure to credit risk is the carrying amount of Loans and Investments in Housing Programs.
Investment Assets: CMHC’s maximum exposure to credit risk is the carrying amount of investment assets held on the Consolidated Balance Sheet.
Securities Purchased Under Resale Agreements: By their nature, these balances have a low credit risk as they are largely secured by obtaining collateral from counterparties. Collateral agreements provide for the posting of collateral by the counterparty when CMHC’s exposure to that entity exceeds a certain ratings-based threshold. Securities held as eligible collateral include debt obligations issued by or guaranteed by the Government of Canada, including Crown corporations and CHT. Collateral held to offset mark-to-market exposures from these transactions should not be used for any other purpose than to offset such exposure. In the event of counterparty default, CMHC has the right to liquidate collateral held. The fair value of collateral held by CMHC as at 31 December 2011 was nil (31 December 2010 - nil).
Derivatives: CMHC limits its credit risk associated with derivative transactions by dealing with swap counterparties whose credit ratings are in accordance with its Funding, Investment and Risk Management Policies, which are approved by the Board of Directors and are in accordance with Department of Finance Guidelines; through the use of International Swaps Derivatives Association (ISDA) master netting agreements for derivatives which have been entered into with all counterparties; and where appropriate, through the use of ratings-based collateral thresholds in the Credit Support Annexes. The master netting agreements give CMHC a legally enforceable right to reduce derivative exposure through the provision of a single net settlement of all financial instruments covered by the agreement with the same counterparty in the event of default.
135
The following table presents the Corporation’s credit exposure of derivatives by term to maturity (excluding those related to NHA Mortgage-Backed Securities – Loans and Receivables).
| Replacement value(1) | Potential | Total Credit Exposure | ||||||||||||||||||||||||||
| Future | ||||||||||||||||||||||||||||
| Within | 1 to 3 | 3 to 5 | Over 5 | Credit | ||||||||||||||||||||||||
| (in millions) | 1 Year | Years | Years | Years | Exposure(2) | 2011 | 2010 | |||||||||||||||||||||
| Interest Rate Swaps |
14 | 31 | 54 | 81 | 15 | 195 | 171 | |||||||||||||||||||||
| Cross Currency Interest Rate Swaps |
- | - | - | - | - | - | 3 | |||||||||||||||||||||
| Total |
14 | 31 | 54 | 81 | 15 | 195 | 174 | |||||||||||||||||||||
| (1) | Represents the total current fair value including accrued interest of all outstanding contracts with a positive fair value, after factoring in the impact of master netting agreements. |
| (2) | Represents an add-on that is an estimate of the potential change in the market value of the transaction up to maturity which is calculated in relation to the notional principal of the contracts by applying factors consistent with guidelines issued by the Office of the Superintendent of Financial Institutions. |
The fair value of the collateral related to derivatives held by CMHC (including those related to NHA MBS Loans Receivable - IMPP) as at 31 December 2011 was $739 million (31 December 2010 - $428 million).
Allowance for Credit Losses
In the event of mortgage default, the Corporation may take an assignment of the insured mortgage and pay the insured lender the loan balance, rather than proceed with the acquisition of the property through title transfer claim. In addition, in an effort to minimize future insurance claims resulting from insured mortgages provided to market or assisted housing rental projects, the Corporation may make advances to the project in order to help it return to a state where the borrower can manage their mortgage obligations. The allowance for credit losses is established to provide for estimated amounts that may not be recovered. Factors that are considered in assessing the estimated realizable amount include, but are not limited to, underlying asset valuation, and any changes in market and economic outlook. The allowance for credit losses is included as a reduction to Accounts Receivable and Other Assets and any change in the allowance is included in Net Claims. At 31 December 2011, the allowance was $230 million (31 December 2010 - $162 million) relating to financial assets of $271 million (31 December 2010 - $201 million). The following table shows the changes in the allowance for credit losses.
| 000000000000 | 000000000000 | |||||||
| (in millions) | 2011 | 2010 | ||||||
| Balance at Beginning of Year |
162 | 141 | ||||||
| Recoveries |
(4) | (3) | ||||||
| Write-offs |
- | - | ||||||
| Provision for Credit Losses |
72 | 24 | ||||||
|
Balance at End of Year |
230 | 162 | ||||||
136 C A N A D A M O R T G A G E A N D H O U S I N G C O R P O R A T I O N
Investment in NHA Mortgage-Backed Securities – Loans and Receivables
As described in Note 6, the Corporation holds collateral which serves as the sole source of repayment for the Investment in NHA MBS – Loans and Receivables. The fair value of this collateral is as follows:
| 00000000000000 | 00000000000000 | |||||||
| (in millions) | 2011 | 2010 | ||||||
| NHA Mortgage-Backed Securities(2) – IMPP |
50,012 | 56,474 | ||||||
| Reinvestment Securities(1) - IMPP |
6,156 | 3,456 | ||||||
| NHA Mortgage-Backed Securities(2) – CHT |
178,313 | 159,895 | ||||||
| Reinvestment Securities(1) - CHT |
26,567 | 38,014 | ||||||
|
Total |
261,048 | 257,839 | ||||||
| (1) | Fair value determined based on Level 1 Criteria as per fair value hierarchy |
| (2) | Fair value determined based on Level 2 Criteria as per fair value hierarchy |
The credit risk associated with NHA Mortgage-Backed Securities is mitigated by the guarantee of timely payment of principal and interest, described in Note 11.
IMPP reinvestment securities are limited to high quality assets, as follows: cash, Government of Canada obligations, Canada Mortgage Bonds, NHA MBS and eligible repurchase agreements of Government of Canada securities. CHT reinvestment securities are rated R-1 (high) or AAA by at least two rating agencies.
CHT is also exposed to credit-related risk in the event of default of swap counterparties. This risk is mitigated by transacting with highly rated swap counterparties and collateralization requirements based on credit ratings. The fair value of swap collateral held by CHT as at 31 December 2011 was $363 million (31 December 2010 - $191 million).
| 20. | LIQUIDITY RISK |
Liquidity risk is the risk that the Corporation will encounter difficulty in meeting obligations associated with financial liabilities. The Corporation has a liquidity risk policy which includes appropriate limits to ensure sufficient resources to meet current and projected cash requirements.
The Mortgage Loan Insurance and Securitization investment portfolios are managed to ensure that there is sufficient cash flow to meet projected claims. Sources of liquidity include: fees, premiums, investment income and proceeds from sales and maturities of investments. Within the CMB Program, the Corporation’s liquidity risk refers to the risk that CMHC may not be able to provide the funding required, in a timely fashion to satisfy a call on its timely payment guarantee obligation. Policies in place to mitigate this risk include ensuring high credit quality investments as permitted by the Trust Agreement and swap counterparties and the establishment of maturity monitoring guidelines. Liquidity sources in the event of an immediate need to fulfill the timely payment guarantee include overdraft facilities and cash and short-term investments in marketable securities as well as a $350 million line of credit with the Central Paying Agent.
137
The Lending Activity investment portfolio is managed to ensure that there is sufficient cash flow to meet funding needs in case of contingencies causing operational disruptions, unanticipated needs, and to facilitate use of the Crown Borrowing Program. The asset/liability management strategy ensures that the assets are maintained at the same level as the liabilities. Derivatives are used to hedge mismatches in the timing of cash flows. Further sources of liquidity associated with this portfolio include overdraft facilities and cash and short-term investments in marketable securities. For any additional liquidity requirements, CMHC can access the Crown Borrowing Program and lines of credit upon approval by the Department of Finance.
The Corporation’s commercial paper program remains available to meet cash requirements on a daily basis, subject to approval by the Minister of Finance on a transaction by transaction basis. The Corporation also mitigates liquidity risk through the use of ISDA master netting agreements reducing the amount of cash required to satisfy derivative obligations.
The following table presents the undiscounted contractual cash flows payable by the Corporation, including accrued interest, under financial liabilities by remaining contractual maturities.
| 000000000 | 000000000 | 000000000 | 000000000 | 000000000 | 000000000 | 000000000 | ||||||||||||||||||||||
| Within 1 | 1 to 3 | 3 to12 | 1 to 5 | Over 5 | ||||||||||||||||||||||||
| (in millions) | Month | Months | Months | Years | Years | 2011 | 2010 | |||||||||||||||||||||
| Securities Sold Under Repurchase Agreements |
101 | 171 | - | - | - | 272 | 60 | |||||||||||||||||||||
| Canada Mortgage Bonds |
- | 597 | 42,868 | 145,995 | 31,409 | 220,869 | 215,916 | |||||||||||||||||||||
| Capital Market Borrowings |
- | 16 | 369 | 1,671 | 281 | 2,337 | 3,315 | |||||||||||||||||||||
| Borrowings from the Government of Canada |
642 | 916 | 3,902 | 62,415 | 7,516 | 75,391 | 79,844 | |||||||||||||||||||||
| Derivatives |
2 | 3 | 16 | 56 | 1 | 78 | 110 | |||||||||||||||||||||
|
Total |
745 | 1,703 | 47,155 | 210,137 | 39,207 | 298,947 | 299,245 | |||||||||||||||||||||
Commitments related to Loans and Investments in Housing Programs are outlined in Note 25. Financial guarantees are outlined in Note 11.
Lines of Credit
At 31 December 2011, CMHC had $300 million (31 December 2010 - $300 million) of overnight overdraft facility available with its banker that had not been drawn. In addition, CMHC had, upon DOF approval, $200 million (31 December 2010 - $450 million) in unused, uncommitted lines of credit. The lines of credit provided for loans are based on Canadian prime rate and have no expiry date. During the year, CMHC has not drawn from these lines of credit.
| 21. | POST EMPLOYMENT BENEFITS |
CMHC provides a registered defined benefit Pension Plan (“the Plan”), supplemental pension plans and other post-employment benefits. The total defined benefit liability is included in Accounts Payable and Other Liabilities.
Total cash payments for post-employment benefits were $54 million (2010 - $24 million). They include contributions by CMHC to its defined benefit pension plan and payments under the unfunded supplemental pension plans. They also include disbursements for unfunded other post-employment benefits which consist of payments to a third-party service provider on behalf of retired employees and payments made directly to employees, their beneficiaries or estates.
138 C A N A D A M O R T G A G E A N D H O U S I N G C O R P O R A T I O N
The actuarial valuation of CMHC’s registered Pension Plan as at 31 December 2010, completed in the fourth quarter of 2011, reported that the Plan was fully funded on a going concern basis, but was in a solvency deficit. The 31 December 2011 valuation reports a deficit position on both a going concern basis and a solvency basis. As is permitted under the Pension Benefits Standards Act, 1985 (PBSA) and its related Regulations, the Corporation is currently seeking approval to reduce the solvency special payments determined by the valuations. The reductions would be from $72.0 million to nil with respect to the solvency special payment as a result of the 2010 valuation, and from $126.7 million to $22.1 million in 2012 with respect to the annual solvency special payments in 2012 through 2016 as a result of the 2011 valuation. These provisions exist to make funding requirements less sensitive to financial market volatility. The Corporation will also be required to make going concern special payments of $1.4 million annually for 15 years beginning in 2012 to amortize the going concern deficit. As such, the total special payments are expected to be nil in 2011 and $23.5 million in 2012.
CMHC continues to make full normal contributions and to monitor the Pension Fund. The next actuarial valuation will be undertaken as at year-end 2012, with the results to be reported in the 2012 Annual Report Financial Statements.
Information about the defined benefit plans is as follows:
|
Pension Plans |
Other Post-employment Benefits |
|||||||||||||||||
| (in millions) | 2011 | 2010 | 2011 | 2010 | ||||||||||||||
| Defined Benefit Obligation |
||||||||||||||||||
| Balance, Beginning of Year |
1,414 | 1,256 | 170 | 153 | ||||||||||||||
| Current Service Cost |
25 | 22 | 4 | 4 | ||||||||||||||
| Employees’ Contributions |
12 | 11 | - | - | ||||||||||||||
| Interest Cost |
72 | 72 | 9 | 9 | ||||||||||||||
| Benefits Paid |
(65) | (61) | (6) | (4) | ||||||||||||||
| Actuarial Loss (Gain) |
141 | 114 | 6 | 9 | ||||||||||||||
| Past Service Costs |
- | - | - | (1) | ||||||||||||||
| Balance, End of Year |
1,599 | 1,414 | 183 | 170 | ||||||||||||||
| Fair Value of Plan Assets |
||||||||||||||||||
| Balance, Beginning of Year |
1,178 | 1,129 | - | - | ||||||||||||||
| Expected Return on Plan Assets |
76 | 70 | - | - | ||||||||||||||
| Actuarial (Loss) Gain |
(71) | 9 | - | - | ||||||||||||||
| Employer’s Contributions |
48 | 20 | 6 | 4 | ||||||||||||||
| Employees’ Contributions |
12 | 11 | - | - | ||||||||||||||
| Benefits Paid |
(65) | (61) | (6) | (4) | ||||||||||||||
| Balance, End of Year |
1,178 | 1,178 | - | - | ||||||||||||||
| Funded Status - Plan Surplus (Deficit) |
(421) | (236) | (183) | (170) | ||||||||||||||
| Unamortized Past Service Costs |
- | - | 1 | 2 | ||||||||||||||
| Defined Benefit Asset (Liability) |
(421) | (236) | (182) | (168) | ||||||||||||||
The Actuarial (Loss) Gain on plan assets is the difference between the actual and expected return on plan assets. The Actual Return on Plan Assets was $5 million (2010 - $79 million).
139
The Funded Status, as well as the experience adjustments arising on the defined benefit obligation and plan assets, are summarized as follows:
| 00000000000 | 00000000000 | |||||||
|
(in millions) |
2011 | 2010 | ||||||
| Pension Plans |
||||||||
| Fair Value of Plan Assets |
1,178 | 1,178 | ||||||
| Defined Benefit Obligation |
1,599 | 1,414 | ||||||
| Funded Status – Plan Surplus (Deficit) |
(421) | (236) | ||||||
| Experience Gains (Losses) on Defined Benefit Obligation |
(14) | (1) | ||||||
| Experience Gains (Losses) on Plan Assets |
(71) | 9 | ||||||
| Other Post-employment Benefits |
||||||||
| Fair Value of Plan Assets |
- | - | ||||||
| Defined Benefit Obligation |
183 | 170 | ||||||
| Funded Status – Plan Surplus (Deficit) |
(183) | (170) | ||||||
| Experience Gains (Losses) on Defined Benefit Obligation |
12 | 7 | ||||||
| Experience Gains (Losses) on Plan Assets |
- | - | ||||||
The defined benefit obligation relating to plans which are wholly or partially funded and those which are wholly unfunded is as follows:
| Pension Plans | Other Post-employment Benefits | |||||||||||||||||||||||||
| 31 December | 31 December | 1 January | 31 December | 31 December | 1 January | |||||||||||||||||||||
| (in millions) | 2011 | 2010 | 2010 | 2011 | 2010 | 2010 | ||||||||||||||||||||
| Wholly or Partially Funded |
1,547 | 1,368 | 1,217 | - | - | - | ||||||||||||||||||||
| Wholly Unfunded |
52 | 46 | 39 | 183 | 170 | 153 | ||||||||||||||||||||
| Defined Benefit Obligation |
1,599 | 1,414 | 1,256 | 183 | 170 | 153 | ||||||||||||||||||||
The plan assets and the defined benefit obligation were measured for accounting purposes as at 31 December 2011. In performing this measurement, the following assumptions were adopted.
|
31 December 2011 |
31 December 2010 | 1 January 2010 | ||||||||||
| Defined Benefit Obligation: |
||||||||||||
| Discount Rate |
4.50% | 5.10% | 5.75% | |||||||||
| Rate of Compensation Increase |
3.00% | 3.00% | 3.00% | |||||||||
| Benefit Costs: |
||||||||||||
| Discount Rate |
5.10% | 5.75% | 6.25% | |||||||||
| Rate of Compensation Increase |
3.00% | 3.00% | 3.00% | |||||||||
| Expected Rate of Return on Plan Assets |
6.10% | 6.25% | 6.80% | |||||||||
The Expected Rate of Return on plan assets was determined based on historical rates of return by asset class, current market indicators and the current and expected allocation of plan assets.
A 7.2% (2010 - 7.5%) increase in health care costs was assumed for 2011, with 0.2% (2010 - 0.2%) average decreases per year thereafter to an ultimate trend rate of 4.5% which is expected to be achieved by 2029.
140 C A N A D A M O R T G A G E A N D H O U S I N G C O R P O R A T I O N
The following table shows the impact of changes in the assumptions.
| Increase (Decrease) | Increase (Decrease) in Net | |||||||
| in Defined Benefit | Benefit Costs Recognized | |||||||
| (in millions) | Obligation | in Operating Expense | ||||||
| 50 bps Increase/Decrease in Discount Rate |
(124)/135 | (2)/3 | ||||||
| 50 bps Increase/Decrease in Rate of Compensation Increase |
17/(16) | 2/(2) | ||||||
| 50 bps Increase/Decrease in Long-term Rate of Return on Plan Assets |
- | (6)/6 | ||||||
| 100 bps Increase/Decrease in Health Care Cost Trend Rates |
23/(18) | 2/(2) | ||||||
CMHC’s annual net benefit plan costs recognized in Operating Expenses are as follows:
| Pension Plans | Other Post-employment Benefits | |||||||||||||||||
| (in millions) | 2011 | 2010 | 2011 | 2010 | ||||||||||||||
| Current Service Cost, Net of Employees’ Contributions |
25 | 22 | 4 | 4 | ||||||||||||||
| Interest Cost |
72 | 72 | 9 | 9 | ||||||||||||||
| Expected Return on Plan Assets (Gain) Loss |
(76) | (70) | - | - | ||||||||||||||
| Amortization of Past Service Costs |
- | - | - | - | ||||||||||||||
| Defined Benefit Plan Expense |
21 | 24 | 13 | 13 | ||||||||||||||
The net benefit plan costs recognized as decreases to Other Comprehensive Income, relating to Net Actuarial Gains (Losses) before tax, are $212 million (2010 - $105 million) for Pension Plans and $6 million (2010 - $9 million) for Other Post-employment Benefits.
The cumulative amount of Net Actuarial Gains (Losses), before tax, recognized in Other Comprehensive Income since 1 January 2010 (the date of transition to IFRS) is $332 million.
Information on defined benefit pension plan assets is as follows:
| 0000000000 | 0000000000 | |||||||
| Percentage of Fair Value
of Total Plan Assets |
||||||||
| (in millions) | 2011 | 2010 | ||||||
| Short-term Investments(1) |
1.35% | 3.00% | ||||||
| Bonds and Debentures(2) |
22.55% | 21.59% | ||||||
| Equities |
62.73% | 63.36% | ||||||
| Real Return Securities(3) |
2.81% | 2.44% | ||||||
| Real Estate |
10.56% | 9.61% | ||||||
| Total |
100.00% | 100.00% | ||||||
| (1) | Includes $12 million or 0.98% (2010 – $34 million or 2.89%) in its related parties. |
| (2) | Includes $20 million or 1.67% (2010 – $34 million or 2.93%) in the Corporation (Canada Mortgage Bonds) and $57 million or 4.87% (2010 – $47 million or 3.98%) in its related parties. |
| (3) | Includes $29 million or 2.48% (2010 – $25 million or 2.14%) in its related parties. |
The interest paid by CMHC to the pension plan amounted to $1 million in 2011 (2010 - $1.3 million). In 2011, there was a net charge in the amount of $4.7 million (2010 - $4.6 million) from CMHC to the pension plans for administrative services.
In 2012, CMHC expects to make post-employment benefit contributions of approximately $50 million.
141
| 22. | INVESTMENT PROPERTY |
The following table presents the changes in the fair value of investment properties included in Accounts Receivable and Other Assets:
| (in millions) | 2011 | 2010 | ||||||
| Balance at Beginning of Year |
146 | 119 | ||||||
| Capitalized Expenditures on Existing Investment Property |
1 | 2 | ||||||
| Additions |
36 | 11 | ||||||
| Disposals |
- | - | ||||||
| Unrealized Fair Value Gains (Losses) |
8 | 14 | ||||||
| Balance at End of Year |
191 | 146 | ||||||
Of the balance of Investment Property at 31 December 2011, $116 million is held by the Lending Activity and $75 million is held by the Mortgage Loan Insurance Activity.
Fair Value
Of the total fair value of Investment Properties, 80% (31 December 2010 - 55%, 1 January 2010 - 33%) is based on valuations performed by independent valuators and 20% (31 December 2010 - 45%, 1 January 2010 - 67%) is based on internal valuations.
The income approach is primarily applied in determining the fair value of rent-producing properties. Under the income approach, fair value is based upon the present value of expected future cash flows of each property using a discount rate reflective of the characteristics of the property. The market approach is applied primarily in determining the fair value of vacant land. Under the market approach, fair value is based upon market transactions involving comparable property.
The income approach was used to measure $57 million (31 December 2010 - $41 million, 1 January 2010 - $34 million) of the total fair value of Investment Property, while the market approach was used to measure $134 million (31 December 2010 - $105 million, 1 January 2010 - $85 million). Discount rates between 6.25% and 9% were used in applying the income approach.
Certain Lending Activity Investment Properties have been provided to lessees under long-term operating leases. The terms of these leases allow the lessees to develop and/or operate a rental property. The lessees are entitled to the property’s income and are responsible for its operating and capital costs. The fair value of these properties, $19 million (31 December 2010 - $20 million, 1 January 2010 - $19 million) is based on the present value of the lease payments CMHC will receive over the lease term plus the present value of the expected future cash flows commencing upon the property’s reversion to CMHC. The remaining terms of the associated operating leases are between 6 and 20 years. The valuations of properties leased out under long-term operating leases were reduced by $16 million (2010 - $11 million) to reflect the impact of those leases on the properties’ fair value.
142 C A N A D A M O R T G A G E A N D H O U S I N G C O R P O R A T I O N
| 23. | SEGMENTED INFORMATION |
As described in Note 1, the Consolidated Financial Statements include the accounts of CMHC’s four activities (Mortgage Loan Insurance, Securitization, Housing Programs and Lending Activity), each of which provides different programs in support of CMHC’s objectives, and the Canada Housing Trust. The financial results of each activity are determined using the accounting policies described in Note 2. The Lending Activity includes certain corporate items that are not allocated to each activity. The Housing Programs Activity includes reimbursements to the Lending Activity as described in Note 9. These reimbursements are not eliminated in the following table. Revenues are attributed to, and assets are located in, Canada.
|
Mortgage Loan |
Securitization | Housing | Lending | Canada | Eliminations | Total | ||||||||||||||||||||||||||||||||||||||||||||||||||
| Insurance | Programs | Housing Trust | ||||||||||||||||||||||||||||||||||||||||||||||||||||||
| (in millions of dollars) | 2011 | 2010 | 2011 | 2010 | 2011 | 2010 | 2011 | 2010 | 2011 | 2010 | 2011 | 2010 | 2011 | 2010 | ||||||||||||||||||||||||||||||||||||||||||
| REVENUES | ||||||||||||||||||||||||||||||||||||||||||||||||||||||||
| Interest Income from NHA MBS – Loans and Receivables | - | - | 1,747 | 1,753 | - | - | - | - | 6,527 | 6,236 | - | - | 8,274 | 7,989 | ||||||||||||||||||||||||||||||||||||||||||
| Premiums and Fees | 1,791 | 1,738 | 211 | 187 | - | - | - | - | - | - | - | 2,002 | 1,925 | |||||||||||||||||||||||||||||||||||||||||||
| Interest Earned on Loans and Investments in Housing Programs | - | - | - | - | - | - | 658 | 641 | - | - | - | - | 658 | 641 | ||||||||||||||||||||||||||||||||||||||||||
| Income from Investment Securities | 602 | 590 | 41 | 38 | - | - | 37 | 24 | - | - | (58) | (63) | 622 | 589 | ||||||||||||||||||||||||||||||||||||||||||
| Net Realized Gains (Losses) from Financial Instruments | 251 | 95 | 31 | 6 | - | - | - | - | - | - | (85) | (63) | 197 | 38 | ||||||||||||||||||||||||||||||||||||||||||
| Net Unrealized Gains (Losses) from Financial Instruments | (81) | 11 | (4) | - | - | - | (23) | (2) | - | - | (10) | (3) | (118) | 6 | ||||||||||||||||||||||||||||||||||||||||||
| Parliamentary Appropriations and Other Income | 7 | 5 | 18 | 21 | 2,163 | 3,155 | 21 | 17 | 175 | 166 | (105) | (98) | 2,279 | 3,266 | ||||||||||||||||||||||||||||||||||||||||||
| 2,570 | 2,439 | 2,044 | 2,005 | 2,163 | 3,155 | 693 | 680 | 6,702 | 6,402 | (258) | (227) | 13,914 | 14,454 | |||||||||||||||||||||||||||||||||||||||||||
| EXPENSES | ||||||||||||||||||||||||||||||||||||||||||||||||||||||||
| Interest Expense | 3 | - | 1,747 | 1,753 | - | - | 650 | 648 | 6,518 | 6,228 | (112) | (98) | 8,806 | 8,531 | ||||||||||||||||||||||||||||||||||||||||||
| Operating Expenses | 193 | 186 | 10 | 9 | 119 | 115 | 19 | 20 | 184 | 174 | (105) | (98) | 420 | 406 | ||||||||||||||||||||||||||||||||||||||||||
| Housing Programs and Net Claims | 562 | 497 | - | - | 2,044 | 3,040 | - | - | - | - | - | - | 2,606 | 3,537 | ||||||||||||||||||||||||||||||||||||||||||
| 758 | 683 | 1,757 | 1,762 | 2,163 | 3,155 | 669 | 668 | 6,702 | 6,402 | (217) | (196) | 11,832 | 12,474 | |||||||||||||||||||||||||||||||||||||||||||
| Income Taxes | 476 | 481 | 76 | 68 | - | - | 11 | (1) | - | - | (10) | (8) | 553 | 540 | ||||||||||||||||||||||||||||||||||||||||||
| NET INCOME (LOSS) | 1,336 | 1,275 | 211 | 175 | - | - | 13 | 13 | - | - | (31) | (23) | 1,529 | 1,440 | ||||||||||||||||||||||||||||||||||||||||||
| Total Revenues | 2,570 | 2,439 | 2,044 | 2,005 | 2,163 | 3,155 | 693 | 680 | 6,702 | 6,402 | (258) | (227) | 13,914 | 14,454 | ||||||||||||||||||||||||||||||||||||||||||
| Inter-segment Revenues(1) | (47) | (56) | - | - | - | - | (21) | (10) | (190) | (161) | 258 | 227 | - | - | ||||||||||||||||||||||||||||||||||||||||||
| External Revenues | 2,523 | 2,383 | 2,044 | 2,005 | 2,163 | 3,155 | 672 | 670 | 6,512 | 6,241 | - | - | 13,914 | 14,454 | ||||||||||||||||||||||||||||||||||||||||||
| (1) | Inter-segment Revenues relate to the following: |
| ¡ | the Mortgage Loan Insurance and Lending Activities earn Income from Investment Securities on holdings of CMB; and |
| ¡ | the Securitization Activity receives CMB guarantee fees and advisory fees from CHT, and earns Income from Investment Securities on holdings of Capital Market Borrowings. |
143
|
Mortgage Loan Insurance |
Securitization | Housing Programs | ||||||||||||||||||||||||||||||||||
| 31 December | 31 December | 1 January | 31 December | 31 December | 1 January | 31 December | 31 December | 1 January | ||||||||||||||||||||||||||||
| (in millions) | 2011 | 2010 | 2010 | 2011 | 2010 | 2010 | 2011 | 2010 | 2010 | |||||||||||||||||||||||||||
| ASSETS |
||||||||||||||||||||||||||||||||||||
| Investment Securities: |
||||||||||||||||||||||||||||||||||||
| Designated at Fair Value through Profit or Loss |
66 | 62 | 52 | 1 | 1 | 1 | - | - | - | |||||||||||||||||||||||||||
| Held for Trading |
375 | - | - | 22 | - | - | - | - | - | |||||||||||||||||||||||||||
| Available for Sale |
17,629 | 17,066 | 15,249 | 1,502 | 1,201 | 957 | - | - | - | |||||||||||||||||||||||||||
| Investment in NHA MBS: |
||||||||||||||||||||||||||||||||||||
| Loans and Receivables |
- | - | - | 55,401 | 59,200 | 61,261 | - | - | - | |||||||||||||||||||||||||||
| Loans: |
||||||||||||||||||||||||||||||||||||
| Designated at Fair Value through Profit or Loss |
- | - | - | - | - | - | - | - | - | |||||||||||||||||||||||||||
| Other |
- | - | - | - | - | - | - | - | - | |||||||||||||||||||||||||||
| Investments in Housing Programs |
- | - | - | - | - | - | - | - | - | |||||||||||||||||||||||||||
| Other Assets |
1,557 | 998 | 1,189 | 122 | 240 | 179 | - | - | - | |||||||||||||||||||||||||||
| 19,627 | 18,126 | 16,490 | 57,048 | 60,642 | 62,398 | - | - | - | ||||||||||||||||||||||||||||
| LIABILITIES |
||||||||||||||||||||||||||||||||||||
| Borrowings: |
||||||||||||||||||||||||||||||||||||
| Canada Mortgage Bonds |
- | - | - | - | - | - | - | - | - | |||||||||||||||||||||||||||
| Capital Market Borrowings |
- | - | - | - | - | - | - | - | - | |||||||||||||||||||||||||||
| Borrowings from the Government of Canada |
- | - | - | 55,401 | 59,200 | 61,260 | - | - | - | |||||||||||||||||||||||||||
| Unearned Premiums and Fees |
6,731 | 6,874 | 6,675 | 528 | 483 | 448 | - | - | - | |||||||||||||||||||||||||||
| Other Liabilities |
1,713 | 1,604 | 1,765 | 111 | 174 | 106 | - | - | - | |||||||||||||||||||||||||||
| 8,444 | 8,478 | 8,440 | 56,040 | 59,857 | 61,814 | - | - | - | ||||||||||||||||||||||||||||
| EQUITY OF CANADA |
11,183 | 9,648 | 8,050 | 1,008 | 785 | 584 | - | - | - | |||||||||||||||||||||||||||
| (1) | The Balance Sheet Eliminations remove inter-company holdings of CMB and Capital Market Borrowings, as well as inter-segment accounts arising from the allocation of operating cost, without mark-up. |
144 C A N A D A M O R T G A G E A N D H O U S I N G C O R P O R A T I O N
| 000000 | 000000 | 000000 | 000000 | 000000 | 000000 | 000000 | 000000 | 000000 | 000000 | 000000 | ||||||||||||||||||||||||||||||||||||
|
Lending |
Canada Housing Trust | Eliminations(1) | Total | |||||||||||||||||||||||||||||||||||||||||||
| 31 December | 31 December | 1 January | 31 December | 31 December | 1 January | 31 December | 31 December | 1 January | 31 December | 31 December | 1 January | |||||||||||||||||||||||||||||||||||
| 2011 | 2010 | 2010 | 2011 | 2010 | 2010 | 2011 | 2010 | 2010 | 2011 | 2010 | 2010 | |||||||||||||||||||||||||||||||||||
| 1,325 | 1,028 | 1,029 | - | - | - | (489) | (380) | (204) | 903 | 711 | 878 | |||||||||||||||||||||||||||||||||||
| - | - | - | - | - | - | - | - | - | 397 | - | - | |||||||||||||||||||||||||||||||||||
| - | - | - | - | - | - | (1,582) | (1,908) | (1,859) | 17,549 | 16,359 | 14,347 | |||||||||||||||||||||||||||||||||||
| - | - | - | 201,254 | 195,793 | 176,020 | - | - | 1 | 256,655 | 254,993 | 237,282 | |||||||||||||||||||||||||||||||||||
| 7,132 | 7,294 | 7,533 | - | - | - | - | - | - | 7,132 | 7,294 | 7,533 | |||||||||||||||||||||||||||||||||||
| 4,726 | 4,214 | 3,255 | - | - | - | - | - | - | 4,726 | 4,214 | 3,255 | |||||||||||||||||||||||||||||||||||
| 808 | 873 | 939 | - | - | - | - | - | - | 808 | 873 | 939 | |||||||||||||||||||||||||||||||||||
| 1,459 | 1,420 | 1,439 | 541 | 845 | 871 | 41 | (7) | (225) | 3,720 | 3,496 | 3,453 | |||||||||||||||||||||||||||||||||||
| 15,450 | 14,829 | 14,195 | 201,795 | 196,638 | 176,891 | (2,030) | (2,295) | (2,287) | 291,890 | 287,940 | 267,687 | |||||||||||||||||||||||||||||||||||
| - | - | - | 201,254 | 195,793 | 176,020 | (1,881) | (2,157) | (1,958) | 199,373 | 193,636 | 174,062 | |||||||||||||||||||||||||||||||||||
| 2,218 | 3,054 | 4,448 | - | - | - | (15) | (14) | (10) | 2,203 | 3,040 | 4,438 | |||||||||||||||||||||||||||||||||||
| 12,146 | 10,756 | 8,591 | - | - | - | - | - | - | 67,547 | 69,956 | 69,851 | |||||||||||||||||||||||||||||||||||
| - | - | - | - | - | - | - | - | - | 7,259 | 7,357 | 7,123 | |||||||||||||||||||||||||||||||||||
| 1,057 | 926 | 1,033 | 541 | 845 | 871 | (5) | (39) | (251) | 3,417 | 3,510 | 3,524 | |||||||||||||||||||||||||||||||||||
| 15,421 | 14,736 | 14,072 | 201,795 | 196,638 | 176,891 | (1,901) | (2,210) | (2,219) | 279,799 | 277,499 | 258,998 | |||||||||||||||||||||||||||||||||||
| 29 | 93 | 123 | - | - | - | (129) | (85) | (68) | 12,091 | 10,441 | 8,689 | |||||||||||||||||||||||||||||||||||
145
| 24. | RELATED PARTY TRANSACTIONS |
The Corporation’s related parties include the Government of Canada and its departments; agencies and Crown corporations; CMHC’s Key Management Personnel and their close family members; CMHC’s defined benefit pension plan, CHT and Nordea.
All material related party transactions and outstanding balances are either disclosed below or in relevant notes.
In accordance with IAS 24, transactions or balances between the entities that have been eliminated on consolidation are not reported.
Government of Canada and its Departments, Agencies and Crown Corporations
The Corporation is related in terms of common ownership to all Government of Canada departments, agencies and Crown corporations. The Corporation enters into transactions with certain of these entities in the normal course of business.
| a) | The following tables summarize income earned and receivable as well as the total amount invested in instruments issued or guaranteed by the Government of Canada. |
| (in millions) |
2011 |
2010 | ||||||
| Investment Income – Cash Equivalents |
5 | 4 | ||||||
| Investment Income – Investment Securities |
69 | 69 | ||||||
| (in millions) |
31 December 2011 |
31 December 2010 | 1 January 2010 | |||||||||
| Cash Equivalents |
677 | 256 | 403 | |||||||||
| Investment Securities |
3,592 | 2,954 | 3,057 | |||||||||
| Interest Receivable – Investment Securities |
14 | 11 | 9 | |||||||||
| b) | CMHC pays the Government of Canada fees in recognition of the Government’s financial backing of the Mortgage Loan Insurance and Securitization Activities. The fees, which are recorded as a reduction of Other Income, amount to $11 million (2010 - $10 million) for the Securitization Activity, and nil (2010 - nil) for the Mortgage Loan Insurance Activity. The fee for the Mortgage Loan Insurance Activity is nil because CMHC’s Earnings Set Aside for Capitalization equals 100% of its target capital level calculated in accordance with guidelines set out by OSFI. |
Key Management Personnel
The following table presents the compensation of CMHC’s Key Management, defined as those persons having authority and responsibility for planning, directing and controlling its activities, being the Board of Directors, the President and Vice-Presidents.
|
2011 |
2010 | |||||||||||||||||||||||||
| President | President | |||||||||||||||||||||||||
| Board of | and Vice- | Board of | and Vice- | |||||||||||||||||||||||
| (in thousands) | Directors | Presidents | Total | Directors | Presidents | Total | ||||||||||||||||||||
| Short-term Benefits |
172 | 2,484 | 2,656 | 209 | 2,314 | 2,523 | ||||||||||||||||||||
| Post-employment Benefits |
- | 477 | 477 | - | 366 | 366 | ||||||||||||||||||||
| Total |
172 | 2,961 | 3,133 | 209 | 2,680 | 2,889 | ||||||||||||||||||||
146 C A N A D A M O R T G A G E A N D H O U S I N G C O R P O R A T I O N
Receivable balances outstanding with members of the Key Management Personnel as at 31 December 2011 are nil.
| 25. | COMMITMENTS AND CONTINGENT LIABILITIES |
| a) | Commitments outstanding for Loans and Investments in Housing Programs, net of forgiveness, amounted to $140 million at 31 December 2011 (31 December 2010 - $524 million, 1 January 2010 - $370 million) and are normally advanced within a two-year period. |
| b) | Commitments outstanding for advances to mortgage insured assisted housing projects in financial difficulty amounted to $72 million at 31 December 2011 (31 December 2010 - $84 million, 1 January 2010 - $80 million) and are normally advanced within a ten-year period. Advances in the amount of $70 million are expected to be made over the next five years and the remainder to be advanced beyond five years. |
| c) | Total estimated remaining contractual financial obligations are as follows: |
| (in millions) | 2012 | 2013 | 2014 | 2015 | 2016 |
2017 and |
||||||||||||||||||
| Housing Programs(1) |
1,674 | 1,597 | 1,562 | 1,552 | 1,531 | 12,036 | ||||||||||||||||||
| Operating Leases |
22 | 12 | 9 | 7 | 6 | 25 | ||||||||||||||||||
| Finance Leases |
4 | 4 | 4 | 3 | - | - | ||||||||||||||||||
|
Total |
1,700 | 1,613 | 1,575 | 1,562 | 1,537 | 12,061 | ||||||||||||||||||
| (1) | Total remaining contractual financial obligations for Housing Programs extend for periods up to 28 years (2010 – 29 years). |
| d) | In addition to the lines of credit disclosed in Note 20, CMHC has a $88 million (31 December 2010 - $76 million, 1 January 2010 - $70 million) letter of credit outstanding. |
| e) | There are legal claims of $20 million (31 December 2010 - $27 million, 1 January 2010 - $9 million) against CMHC. Due to the uncertainty of the outcome of these claims, no provision for loss has been recorded. CMHC does not expect the ultimate resolution of any of the proceedings to which CMHC is party to have a significant adverse effect on its financial position. |
| 26. | OPERATING EXPENSES |
The following table presents the composition of Operating Expenses.
| (in millions) |
2011 |
2010 | ||||||
| Personnel Costs |
235 | 235 | ||||||
| Depreciation of Premises and Equipment |
2 | 2 | ||||||
| Other Administrative Goods and Services |
183 | 169 | ||||||
|
Total Operating Expenses |
420 | 406 | ||||||
147
| 27. | CURRENT AND NON-CURRENT ASSETS AND LIABILITIES |
|
31 December 2011 |
31 December 2010 | 1 January 2010 | ||||||||||||||||||||||||||||||||||||||
| Within | After | Within | After | Within | After | |||||||||||||||||||||||||||||||||||
| (in millions) | 1 year | 1 year | Total | 1 year | 1 year | Total | 1 year | 1 year | Total | |||||||||||||||||||||||||||||||
| ASSETS |
||||||||||||||||||||||||||||||||||||||||
| Cash and Cash Equivalents |
1,401 | - | 1,401 | 985 | - | 985 | 835 | - | 835 | |||||||||||||||||||||||||||||||
| Securities Purchased Under Resale Agreements |
- | - | - | - | - | - | 127 | - | 127 | |||||||||||||||||||||||||||||||
| Investment Securities: |
||||||||||||||||||||||||||||||||||||||||
| Designated at Fair Value through Profit or Loss |
- | 903 | 903 | 180 | 531 | 711 | 457 | 421 | 878 | |||||||||||||||||||||||||||||||
| Held for Trading |
- | 397 | 397 | - | - | - | - | - | - | |||||||||||||||||||||||||||||||
| Available for Sale |
567 | 16,982 | 17,549 | 774 | 15,585 | 16,359 | 96 | 14,251 | 14,347 | |||||||||||||||||||||||||||||||
| Investment in NHA |
||||||||||||||||||||||||||||||||||||||||
| Mortgage-Backed Securities: |
||||||||||||||||||||||||||||||||||||||||
| Loans and Receivables |
39,534 | 217,121 | 256,655 | 37,475 | 217,518 | 254,993 | 21,787 | 215,495 | 237,282 | |||||||||||||||||||||||||||||||
| Loans (DFV, Other and Investments in Housing Programs) |
972 | 11,694 | 12,666 | 1,534 | 10,847 | 12,381 | 1,286 | 10,441 | 11,727 | |||||||||||||||||||||||||||||||
| Accrued Interest Receivable |
983 | - | 983 | 1,280 | - | 1,280 | 1,284 | - | 1,284 | |||||||||||||||||||||||||||||||
| Deferred Income Tax Assets |
- | 78 | 78 | - | - | - | - | - | - | |||||||||||||||||||||||||||||||
| Derivatives |
2 | 167 | 169 | 10 | 106 | 116 | 6 | 105 | 111 | |||||||||||||||||||||||||||||||
| Due from the Government of Canada |
269 | 134 | 403 | 375 | 156 | 531 | 328 | 148 | 476 | |||||||||||||||||||||||||||||||
| Accounts Receivable and Other Assets |
138 | 548 | 686 | 73 | 511 | 584 | 214 | 406 | 620 | |||||||||||||||||||||||||||||||
| 43,866 | 248,024 | 291,890 | 42,686 | 245,254 | 287,940 | 26,420 | 241,267 | 267,687 | ||||||||||||||||||||||||||||||||
| LIABILITIES |
||||||||||||||||||||||||||||||||||||||||
| Securities Sold Under Repurchase Agreements |
272 | - | 272 | 60 | - | 60 | 51 | - | 51 | |||||||||||||||||||||||||||||||
| Borrowings: |
||||||||||||||||||||||||||||||||||||||||
| Canada Mortgage Bonds |
37,737 | 161,636 | 199,373 | 36,101 | 157,535 | 193,636 | 19,348 | 154,714 | 174,062 | |||||||||||||||||||||||||||||||
| Capital Market Borrowings |
305 | 1,898 | 2,203 | 871 | 2,169 | 3,040 | 1,342 | 3,096 | 4,438 | |||||||||||||||||||||||||||||||
| Borrowings from the Government of Canada: |
||||||||||||||||||||||||||||||||||||||||
| Designated at Fair Value through Profit or Loss |
912 | 5,672 | 6,584 | 885 | 4,832 | 5,717 | 651 | 3,826 | 4,477 | |||||||||||||||||||||||||||||||
| Other |
2,214 | 58,749 | 60,963 | 1,661 | 62,578 | 64,239 | 2,591 | 62,783 | 65,374 | |||||||||||||||||||||||||||||||
| Accrued Interest Payable |
860 | - | 860 | 1,056 | - | 1,056 | 1,068 | - | 1,068 | |||||||||||||||||||||||||||||||
| Derivatives |
3 | 69 | 72 | 83 | 24 | 107 | 200 | 63 | 263 | |||||||||||||||||||||||||||||||
| Accounts Payable and Other Liabilities |
397 | 775 | 1,172 | 578 | 600 | 1,178 | 372 | 469 | 841 | |||||||||||||||||||||||||||||||
| Provision for Claims |
726 | 315 | 1,041 | 802 | 294 | 1,096 | 959 | 317 | 1,276 | |||||||||||||||||||||||||||||||
| Unearned Premiums and Fees |
1,814 | 5,445 | 7,259 | 1,776 | 5,581 | 7,357 | 1,708 | 5,415 | 7,123 | |||||||||||||||||||||||||||||||
| Deferred Income Tax Liabilities |
- | - | - | - | 13 | 13 | - | 25 | 25 | |||||||||||||||||||||||||||||||
| 45,240 | 234,559 | 279,799 | 43,873 | 233,626 | 277,499 | 28,290 | 230,708 | 258,998 | ||||||||||||||||||||||||||||||||
| NET |
(1,374) | 13,465 | 12,091 | (1,187) | 11,628 | 10,441 | (1,870) | 10,559 | 8,689 | |||||||||||||||||||||||||||||||
148 C A N A D A M O R T G A G E A N D H O U S I N G C O R P O R A T I O N
| 28. | TRANSITION TO INTERNATIONAL FINANCIAL REPORTING STANDARDS (IFRS) |
First-time Adoption of IFRS
The Corporation adopted IFRS, as issued by the IASB, effective 1 January 2010 in accordance with IFRS 1, First-time Adoption of International Financial Reporting Standards. Prior to adopting IFRS, the Corporation prepared its Consolidated Financial Statements in accordance with CGAAP. IFRS 1 requires an explicit and unreserved statement of compliance with IFRS to be made in the first annual financial statements prepared using IFRS. The Consolidated Financial Statements for the year ending 31 December 2011 are the Corporation’s first annual IFRS Consolidated Financial Statements.
IFRS Mandatory Exception
In preparing the comparative information in accordance with IFRS, the Corporation did not use hindsight to create or revise estimates previously made under CGAAP.
IFRS Elective Exemptions
IFRS 1 allows certain optional exemptions in preparing the first IFRS financial statements. The Corporation elected to use the following IFRS 1 exemptions:
| ¡ | Employee Benefits – all cumulative net actuarial losses at 1 January 2010 were recognized in Retained Earnings. Disclosure of the present value of the defined benefit obligation, fair value of plan assets, surplus or deficit, and experience adjustments for CMHC’s defined benefit plans for the previous four annual periods will be made as the amounts are determined for each period prospectively from 1 January 2010; |
| ¡ | Insurance Contracts – five years of claims development information is disclosed in the year of adoption. This will be increased in each succeeding additional year until the full ten years of claims development information is included; and |
| ¡ | Leases – IFRIC 4, Determining Whether an Arrangement Contains a Lease, was applied to arrangements existing at 1 January 2010 using facts and circumstances existing at that date. |
Effects of the Transition to IFRS
Certain of the 2010 comparative information presented in the Consolidated Financial Statements was previously prepared and reported in accordance with CGAAP. Reconciliations of the 2010 Consolidated Financial Statements previously presented in accordance with CGAAP to the 2010 comparative information in these Consolidated Financial Statements are presented in the following tables. The reconciling items represent the significant differences between the Corporation’s previous accounting policies under CGAAP and its current accounting policies under IFRS, and are described in detail in the following tables.
149
Reconciliation of Cash Flow Statement Reported Under CGAAP to IFRS
|
(in millions) |
Notes | |||||||
| Cash and Cash Equivalents under CGAAP – 31 December 2009 |
4,242 | |||||||
| Financial Instruments |
||||||||
| Derecognition |
(a) (i) | (3,407) | ||||||
| Cash and Cash Equivalents under IFRS – 1 January 2010 |
835 | |||||||
|
(in millions) |
Notes | |||||||
| Cash and Cash Equivalents under IFRS – 1 January 2010 |
835 | |||||||
| Increase in Cash and Cash Equivalents under CGAAP |
2,279 | |||||||
| Financial Instruments |
||||||||
| Derecognition |
(a) (i) | (2,129) | ||||||
| Increase in Cash and Cash Equivalents during 2010 as reported under IFRS |
150 | |||||||
| Cash and Cash Equivalents under IFRS – 31 December 2010 |
985 | |||||||
Reconciliation of Equity Reported Under CGAAP to IFRS
|
(in millions) |
Notes | 31 December 2010 | 1 January 2010 | |||||||||
| Equity of Canada Under CGAAP |
11,435 | 9,263 | ||||||||||
| Differences (Decreasing) Increasing Previously Reported Equity of Canada: |
||||||||||||
| Financial Instruments |
||||||||||||
| Derecognition |
(a) (i) | (1,077) | (598) | |||||||||
| Related Party Transactions |
(a) (ii) | 30 | 2 | |||||||||
| Employee Benefits |
||||||||||||
| Actuarial Gains and Losses |
(b) (i) | (350) | (246) | |||||||||
| Past Service Costs |
(b) (ii) | (20) | (29) | |||||||||
| Transitional Asset |
(b) (iii) | (12) | 15 | |||||||||
| Other |
(b) (iv) | - | (4) | |||||||||
| Investment Property |
(c) | 81 | 69 | |||||||||
| Revenue Recognition |
(d) | 51 | 49 | |||||||||
| Income Taxes |
(e) | 303 | 168 | |||||||||
| (994) | (574) | |||||||||||
| Equity of Canada Under IFRS |
10,441 | 8,689 | ||||||||||
150 C A N A D A M O R T G A G E A N D H O U S I N G C O R P O R A T I O N
Reconciliation of Net Income Reported Under CGAAP to IFRS
|
(in millions) |
Notes |
Year ended |
||||||
| Net Income Under CGAAP |
1,768 | |||||||
| Differences Increasing (Decreasing) Previously Reported Net Income: |
||||||||
| Financial Instruments |
||||||||
| Derecognition |
(a) (i) | (484) | ||||||
| Related Party Transactions |
(a) (ii) | 28 | ||||||
| Employee Benefits |
||||||||
| Actuarial Gains and Losses |
(b) (i) | 14 | ||||||
| Past Service Costs |
(b) (ii) | 9 | ||||||
| Transitional Asset |
(b) (iii) | (27) | ||||||
| Other |
4 | |||||||
| Investment Property |
(c) | 12 | ||||||
| Revenue Recognition |
(d) | 2 | ||||||
| Income Taxes |
(e) | 114 | ||||||
| (328) | ||||||||
| Net Income under IFRS |
1,440 | |||||||
Reconciliation of Comprehensive Income Reported Under CGAAP to IFRS
|
(in millions) |
Notes |
Year ended |
||||||
| Comprehensive Income Under CGAAP |
2,171 | |||||||
| Differences Increasing (Decreasing) Previously Reported |
||||||||
| Net Income |
(328) | |||||||
| Differences Increasing (Decreasing) Previously Reported |
||||||||
| Other Comprehensive Income: |
||||||||
| Derecognition |
(a) (i) | 4 | ||||||
| Employee Benefits – Actuarial Gains and Losses |
(b) (i) | (96) | ||||||
| (420) | ||||||||
| Comprehensive Income under IFRS |
1,751 | |||||||
151
Reconciliation of Consolidated Balance Sheet Reported Under CGAAP to IFRS
As at 1 January 2010
| IFRS Adjustments | ||||||||||||||||||||||||||||
| Financial Instruments | ||||||||||||||||||||||||||||
| Related Party | Employee | Investment | Revenue | |||||||||||||||||||||||||
| CGAAP | Derecognition | Transactions | Benefits | Properties | Recognition | IFRS | ||||||||||||||||||||||
| (in millions) | Balance | (a) | (a) | (b) | (c) | (d) | Balance | |||||||||||||||||||||
| ASSETS |
||||||||||||||||||||||||||||
| Cash and Cash Equivalents |
4,242 | (3,407) | - | - | - | - | 835 | |||||||||||||||||||||
| Securities Purchased Under Resale Agreements |
32,370 | (32,243) | - | - | - | - | 127 | |||||||||||||||||||||
| Investment Securities: |
||||||||||||||||||||||||||||
| Designated at Fair Value through Profit or Loss |
1,273 | (395) | - | - | - | - | 878 | |||||||||||||||||||||
| Available for Sale |
14,347 | - | - | - | - | - | 14,347 | |||||||||||||||||||||
| Held to Maturity |
54 | (54) | - | - | - | - | - | |||||||||||||||||||||
| Investment in NHA Mortgage-Backed Securities: |
||||||||||||||||||||||||||||
| Loans and Receivables |
- | 237,282 | - | - | - | - | 237,282 | |||||||||||||||||||||
| Designated at Fair Value through Profit or Loss |
143,791 | (143,791) | - | - | - | - | - | |||||||||||||||||||||
| Held to Maturity |
59,000 | (59,000) | - | - | - | - | - | |||||||||||||||||||||
| Loans: |
||||||||||||||||||||||||||||
| Designated at Fair Value through Profit or Loss |
7,533 | - | - | - | - | - | 7,533 | |||||||||||||||||||||
| Other |
3,255 | - | - | - | - | - | 3,255 | |||||||||||||||||||||
| Investments in Housing Programs |
939 | - | - | - | - | - | 939 | |||||||||||||||||||||
| Accrued Interest Receivable |
812 | 472 | - | - | - | - | 1,284 | |||||||||||||||||||||
| Derivatives |
4,047 | (3,936) | - | - | - | - | 111 | |||||||||||||||||||||
| Due from the Government of Canada |
476 | - | - | - | - | - | 476 | |||||||||||||||||||||
| Accounts Receivable and Other Assets |
682 | (8) | - | (118) | 69 | (5) | 620 | |||||||||||||||||||||
| 272,821 | (5,080) | - | (118) | 69 | (5) | 267,687 | ||||||||||||||||||||||
| LIABILITIES |
||||||||||||||||||||||||||||
| Securities Sold Under Repurchase Agreements |
51 | - | - | - | - | - | 51 | |||||||||||||||||||||
| Borrowings: |
||||||||||||||||||||||||||||
| Canada Mortgage Bonds |
177,763 | (3,701) | - | - | - | - | 174,062 | |||||||||||||||||||||
| Capital Market Borrowings |
4,438 | - | - | - | - | - | 4,438 | |||||||||||||||||||||
| Borrowings from the Government of Canada: |
||||||||||||||||||||||||||||
| Designated at Fair Value through Profit or Loss |
4,477 | - | - | - | - | - | 4,477 | |||||||||||||||||||||
| Other |
65,376 | - | (2) | - | - | - | 65,374 | |||||||||||||||||||||
| Accrued Interest Payable |
1,108 | (40) | - | - | - | - | 1,068 | |||||||||||||||||||||
| Derivatives |
996 | (733) | - | - | - | - | 263 | |||||||||||||||||||||
| Accounts Payable and Other Liabilities |
694 | - | - | 147 | - | - | 841 | |||||||||||||||||||||
| Provision for Claims |
1,276 | - | - | - | - | - | 1,276 | |||||||||||||||||||||
| Unearned Premiums and Fees |
7,177 | - | - | - | - | (54) | 7,123 | |||||||||||||||||||||
| Deferred Income Tax Liabilities |
202 | (162) | 1 | (46) | 17 | 13 | 25 | |||||||||||||||||||||
| 263,558 | (4,636) | (1) | 101 | 17 | (41) | 258,998 | ||||||||||||||||||||||
| EQUITY OF CANADA |
||||||||||||||||||||||||||||
| Contributed Capital |
25 | - | - | - | - | - | 25 | |||||||||||||||||||||
| Accumulated Other Comprehensive Income |
207 | (13) | - | - | - | - | 194 | |||||||||||||||||||||
| Retained Earnings |
9,031 | (431) | 1 | (219) | 52 | 36 | 8,470 | |||||||||||||||||||||
| 9,263 | (444) | 1 | (219) | 52 | 36 | 8,689 | ||||||||||||||||||||||
| 272,821 | (5,080) | - | (118) | 69 | (5) | 267,687 | ||||||||||||||||||||||
152 C A N A D A M O R T G A G E A N D H O U S I N G C O R P O R A T I O N
Reconciliation of Consolidated Balance Sheet Reported Under CGAAP to IFRS
As at 31 December 2010
| IFRS Adjustments | ||||||||||||||||||||||||||||
| Financial Instruments | ||||||||||||||||||||||||||||
| Related Party | Employee | Investment | Revenue | |||||||||||||||||||||||||
| CGAAP | Derecognition | Transactions | Benefits | Properties | Recognition | IFRS | ||||||||||||||||||||||
| (in millions) | Balance | (a) | (a) | (b) | (c) | (d) | Balance | |||||||||||||||||||||
| ASSETS |
||||||||||||||||||||||||||||
| Cash and Cash Equivalents |
6,521 | (5,536) | - | - | - | - | 985 | |||||||||||||||||||||
| Securities Purchased Under Resale Agreements |
34,208 | (34,208) | - | - | - | - | - | |||||||||||||||||||||
| Investment Securities: |
||||||||||||||||||||||||||||
| Designated at Fair Value through Profit or Loss |
1,651 | (940) | - | - | - | - | 711 | |||||||||||||||||||||
| Available for Sale |
16,359 | - | - | - | - | - | 16,359 | |||||||||||||||||||||
| Held to Maturity |
124 | (124) | - | - | - | - | - | |||||||||||||||||||||
| Investment in NHA Mortgage-Backed Securities: |
||||||||||||||||||||||||||||
| Loans and Receivables |
- | 254,993 | - | - | - | - | 254,993 | |||||||||||||||||||||
| Designated at Fair Value through Profit or Loss |
159,895 | (159,895) | - | - | - | - | - | |||||||||||||||||||||
| Held to Maturity |
55,742 | (55,742) | - | - | - | - | - | |||||||||||||||||||||
| Loans: |
||||||||||||||||||||||||||||
| Designated at Fair Value through Profit or Loss |
7,294 | - | - | - | - | - | 7,294 | |||||||||||||||||||||
| Other |
4,214 | - | - | - | - | - | 4,214 | |||||||||||||||||||||
| Investments in Housing Programs |
873 | - | - | - | - | - | 873 | |||||||||||||||||||||
| Accrued Interest Receivable |
851 | 429 | - | - | - | - | 1,280 | |||||||||||||||||||||
| Derivatives |
4,311 | (4,195) | - | - | - | - | 116 | |||||||||||||||||||||
| Due from the Government of Canada |
531 | - | - | - | - | - | 531 | |||||||||||||||||||||
| Accounts Receivable and Other Assets |
644 | (7) | - | (128) | 81 | (6) | 584 | |||||||||||||||||||||
| 293,218 | (5,225) | - | (128) | 81 | (6) | 287,940 | ||||||||||||||||||||||
| LIABILITIES |
||||||||||||||||||||||||||||
| Securities Sold Under Repurchase Agreements |
60 | - | - | - | - | - | 60 | |||||||||||||||||||||
| Borrowings: |
||||||||||||||||||||||||||||
| Canada Mortgage Bonds |
197,488 | (3,852) | - | - | - | - | 193,636 | |||||||||||||||||||||
| Capital Market Borrowings |
3,040 | - | - | - | - | - | 3,040 | |||||||||||||||||||||
| Borrowings from the Government of Canada: |
||||||||||||||||||||||||||||
| Designated at Fair Value through Profit or Loss |
5,717 | - | - | - | - | - | 5,717 | |||||||||||||||||||||
| Other |
64,269 | - | (30) | - | - | - | 64,239 | |||||||||||||||||||||
| Accrued Interest Payable |
1,092 | (36) | - | - | - | - | 1,056 | |||||||||||||||||||||
| Derivatives |
360 | (253) | - | - | - | - | 107 | |||||||||||||||||||||
| Accounts Payable and Other Liabilities |
925 | - | - | 253 | - | - | 1,178 | |||||||||||||||||||||
| Provision for Claims |
1,096 | - | - | - | - | - | 1,096 | |||||||||||||||||||||
| Unearned Premiums and Fees |
7,414 | - | - | - | - | (57) | 7,357 | |||||||||||||||||||||
| Deferred Income Tax Liabilities |
322 | (283) | 7 | (66) | 20 | 13 | 13 | |||||||||||||||||||||
| 281,783 | (4,424) | (23) | 187 | 20 | (44) | 277,499 | ||||||||||||||||||||||
| EQUITY OF CANADA |
||||||||||||||||||||||||||||
| Contributed Capital |
25 | - | - | - | - | - | 25 | |||||||||||||||||||||
| Accumulated Other Comprehensive Income |
610 | (9) | - | - | - | - | 601 | |||||||||||||||||||||
| Retained Earnings |
10,800 | (792) | 23 | (315) | 61 | 38 | 9,815 | |||||||||||||||||||||
| 11,435 | (801) | 23 | (315) | 61 | 38 | 10,441 | ||||||||||||||||||||||
| 293,218 | (5,225) | - | (128) | 81 | (6) | 287,940 | ||||||||||||||||||||||
153
Reconciliation of Consolidated Statement of Income and Comprehensive Income Reported Under CGAAP to IFRS
Year ended 31 December 2010
| IFRS Adjustments | ||||||||||||||||||||||||||||
| Financial Instruments | ||||||||||||||||||||||||||||
| Related Party | Employee | Investment | Revenue | |||||||||||||||||||||||||
| CGAAP | Derecognition | Transactions | Benefits | Properties | Recognition | IFRS | ||||||||||||||||||||||
| (in millions) | Balance | (a) | (a) | (b) | (c) | (d) | Balance | |||||||||||||||||||||
| REVENUES |
||||||||||||||||||||||||||||
| Interest Income from NHA Mortgage- Backed Securities: |
||||||||||||||||||||||||||||
| Loans and Receivables |
7,729 | 260 | - | - | - | - | 7,989 | |||||||||||||||||||||
| Premiums and Fees |
1,922 | - | - | - | - | 3 | 1,925 | |||||||||||||||||||||
| Interest Earned on Loans and Investments in Housing Programs |
641 | - | - | - | - | - | 641 | |||||||||||||||||||||
| Income from Investment Securities |
842 | (253) | - | - | - | - | 589 | |||||||||||||||||||||
| Net Realized Gains (Losses) from Financial Instruments |
101 | (63) | - | - | - | - | 38 | |||||||||||||||||||||
| Net Unrealized Gains (Losses) from Financial Instruments |
434 | (456) | 28 | - | - | - | 6 | |||||||||||||||||||||
| Other Income |
92 | - | - | - | 19 | - | 111 | |||||||||||||||||||||
| 11,761 | (512) | 28 | - | 19 | 3 | 11,299 | ||||||||||||||||||||||
| Parliamentary Appropriations for: |
||||||||||||||||||||||||||||
| Housing Programs |
3,040 | - | - | - | - | - | 3,040 | |||||||||||||||||||||
| Operating Expenses |
115 | - | - | - | - | - | 115 | |||||||||||||||||||||
| 3,155 | - | - | - | - | - | 3,155 | ||||||||||||||||||||||
| 14,916 | (512) | 28 | - | 19 | 3 | 14,454 | ||||||||||||||||||||||
| EXPENSES |
||||||||||||||||||||||||||||
| Interest Expense |
8,552 | (28) | - | - | 7 | - | 8,531 | |||||||||||||||||||||
| Housing Programs |
3,040 | - | - | - | - | - | 3,040 | |||||||||||||||||||||
| Net Claims |
497 | - | - | - | - | - | 497 | |||||||||||||||||||||
| Operating Expenses |
405 | - | - | - | - | 1 | 406 | |||||||||||||||||||||
| 12,494 | (28) | - | - | 7 | 1 | 12,474 | ||||||||||||||||||||||
| INCOME BEFORE INCOME TAXES |
2,422 | (484) | 28 | - | 12 | 2 | 1,980 | |||||||||||||||||||||
| INCOME TAXES |
||||||||||||||||||||||||||||
| Current |
542 | - | - | 1 | - | - | 543 | |||||||||||||||||||||
| Deferred |
112 | (124) | 7 | (1) | 3 | - | (3) | |||||||||||||||||||||
| 654 | (124) | 7 | - | 3 | - | 540 | ||||||||||||||||||||||
| NET INCOME |
1,768 | (360) | 21 | - | 9 | 2 | 1,440 | |||||||||||||||||||||
| OTHER COMPREHENSIVE INCOME (LOSS) |
||||||||||||||||||||||||||||
| Net Unrealized Gains from Available for Sale Financial Instruments (net of tax) |
421 | 4 | - | - | - | - | 425 | |||||||||||||||||||||
| Reclassification Adjustment for Net (Gains) Included in Net Income (net of tax) |
(18) | - | - | - | - | - | (18) | |||||||||||||||||||||
| Net Actuarial Losses on Employee Benefit Plans (net of tax) |
- | - | - | (96) | - | - | (96) | |||||||||||||||||||||
| 403 | 4 | - | (96) | - | - | 311 | ||||||||||||||||||||||
| COMPREHENSIVE INCOME |
2,171 | (356) | 21 | (96) | 9 | 2 | 1,751 | |||||||||||||||||||||
154 C A N A D A M O R T G A G E A N D H O U S I N G C O R P O R A T I O N
Differences between CGAAP and IFRS Accounting Policies
The reconciling items in the preceding tables represent the significant differences between the Corporation’s previous accounting policies under CGAAP and its current accounting policies under IFRS. The policy differences are explained in the following narratives. The explanations are not a complete summary of all the differences between CGAAP and IFRS.
(a) Financial Instruments
(i) Derecognition
CGAAP – Investments in NHA Mortgage-Backed Securities in the Securitization Activity were classified as HTM financial instruments and initially recognized at fair value plus transaction costs. Subsequent to initial recognition they were measured at amortized cost using the effective interest method. Investments in NHA Mortgage-Backed Securities held by CHT were Designated at Fair Value and initially recognized at fair value. Subsequent to initial recognition they were measured at fair value.
Swaps entered into in connection with the Investments in NHA Mortgage-Backed Securities in the Securitization Activity were classified as Held for Trading. Gains and losses arising from changes in the fair value of the swaps were recorded in Net Unrealized Gains (Losses) from Financial Instruments, and gains and losses realized on disposition were recorded in Net Realized Gains (Losses) from Financial Instruments. Transactions costs for the swaps were expensed as incurred.
IFRS – Purchases of NHA MBS under the IMPP and by CHT not qualifying for derecognition by the NHA MBS Issuer are considered by CMHC to be secured financing provided to the Issuers, collateralized by the NHA MBS and associated reinvestment securities. These transactions are classified as Investment in NHA Mortgage-Backed Securities – Loans and Receivables and initially recognized at fair value plus transaction costs. Subsequent to initial recognition they are measured at amortized cost using the effective interest method. The NHA MBS, reinvestment assets and swaps entered into in connection with purchases of NHA Mortgage-Backed Securities not qualifying for derecognition by the Issuer are not recognized on CMHC’s Consolidated Balance Sheet. As a result, compared to the previously reported CGAAP amounts:
| ¡ | Investments in NHA Mortgage-Backed Securities – Held to Maturity and Designated at Fair Value Through Profit or Loss and related reinvestment assets (Cash and Cash Equivalents, Investment Securities, Securities Purchased Under Resale Agreements) were replaced at 1 January 2010 and 31 December 2010 by Investment in NHA Mortgage-Backed Securities – Loans and Receivables; |
| ¡ | Accrued Interest Receivable increased at 1 January 2010 by $472 million (31 December 2010 - $429 million), the net effect of recognizing interest on Investments in NHA Mortgage-Backed Securities – Loans and Receivables and derecognizing interest on Investments in NHA Mortgage-Backed Securities and related reinvestment assets and swaps; |
| ¡ | Derivatives assets decreased at 1 January 2010 by $3,936 million (31 December 2010 - $4,195 million), Derivatives liabilities decreased at 1 January 2010 by $733 million (31 December 2010 - $253 million), and Accrued Interest Payable decreased at 1 January 2010 by $40 million; 31 December 2010 - $36 million), due to derecognizing the swaps; |
| ¡ | Net Income for the period ending 31 December 2010 decreased by $360 million; and Other Comprehensive Income increased by $4 million; and |
| ¡ | Retained Earnings at 1 January 2010 decreased by $431 million (31 December 2010 - $792 million) and Accumulated Other Comprehensive Income decreased by $13 million (31 December 2010 - $9 million), the net of tax impacts of the differences for Financial Instruments – Derecognition. |
155
(ii) Related Party Transactions
CGAAP – Borrowings from the Government of Canada classified as Other Financial Liabilities were initially recognized, as related party transactions, at the exchange amount, which is the amount of consideration received as established and agreed to with the Government. These transactions were subsequently measured at amortized cost.
IFRS – Borrowings from the Government of Canada classified as Other Financial Liabilities are initially recognized at fair value and subsequently measured at amortized cost. Differences between the exchange amount and the fair value of the borrowings are recorded as gains/losses in Net Unrealized Gains (Losses) from Financial Instruments on initial recognition. The adjustments are amortized over the life of the borrowings. As a result, compared to the previously reported CGAAP amounts:
| ¡ | Borrowings from the Government of Canada – Other decreased at 1 January 2010 by $2 million (31 December 2010 - $30 million); |
| ¡ | Net Income for the period ending 31 December 2010 increased by $21 million; and |
| ¡ | Retained Earnings at 1 January 2010 increased by $1 million (31 December 2010 - $23 million), the net of tax impact of the differences for Financial Instruments – Related Party Transactions. |
(b) Employee Benefits
(i) Actuarial Gains and Losses
CGAAP – For defined benefit plans, the excess of Net Actuarial Gains and Losses over 10% of the greater of the benefit obligation and the fair value of the plan assets was amortized to Net Income on a straight-line basis over the expected average remaining service period of active employees under the plans. The unamortized balance of Net Actuarial Gains and Losses was not recognized.
IFRS – For defined benefit plans, Actuarial Gains and Losses are recognized in Other Comprehensive Income as incurred, and are accumulated in Retained Earnings. As a result, compared to the previously reported CGAAP amounts:
| ¡ | Accounts Receivable and Other Assets decreased at 1 January 2010 by $220 million (31 December 2010 - $310 million), and Accounts Payable and Other Liabilities increased at 1 January 2010 by $26 million (31 December 2010 - $40 million). These adjustments record the Net Actuarial Losses for defined benefit plans at 1 January 2010, which were $246 million (31 December 2010 - $350 million); |
| ¡ | Net Income for the period ending 31 December 2010 increased by $10 million; and Other Comprehensive Income decreased by $96 million; and |
| ¡ | Retained Earnings decreased at 1 January 2010 by $206 million (31 December 2010 - $293 million), the net of tax impact of the differences for Employee Benefits – Actuarial Gains and Losses. |
(ii) Past Service Costs
CGAAP – For defined benefit plans, Past Service Costs were amortized to Net Income on a straight-line basis over the expected average remaining service period of active employees under the plans. The unamortized balance of Past Service Costs was not recognized.
156 C A N A D A M O R T G A G E A N D H O U S I N G C O R P O R A T I O N
IFRS – For defined benefit plans, Past Service Costs are recognized in Net Income on a straight-line basis over the average period until the benefits become vested. If the benefits are already vested upon introduction of, or changes to, a defined benefit plan, Past Service Costs are recognized in Net Income immediately. As a result, compared to the previously reported CGAAP amounts:
| ¡ | Accounts Receivable and Other Assets decreased at 1 January 2010 by $18 million (31 December 2010 - $9 million) and Accounts Payable and Other Liabilities increased at 1 January 2010 by $11 million (31 December 2010 - $11 million). These adjustments record the vested Past Service Costs which at 1 January 2010 were $29 million (31 December 2010 - $20 million); |
| ¡ | Net Income for the period ending 31 December 2010 increased by $7 million; and |
| ¡ | Retained Earnings decreased at 1 January 2010 by $22 million (31 December 2010 - $15 million), the net of tax impact of the differences for Employee Benefits – Past Service Costs. |
(iii) Transitional Asset and Obligation
CGAAP – For defined benefit plans, the Transitional Asset (Obligation) was determined as at 1 January 2000, the date at which CMHC first applied CICA Section 3461, Employee Future Benefits. The Transitional Asset (Obligation) was amortized to Net Income on a straight-line basis over the expected average remaining service period of active employees under the plans. The unamortized balance of Transitional Asset (Obligation) was not recognized.
IFRS – There is no Transitional Asset (Obligation) for defined benefit plans under IFRS. As a result, compared to the previously reported CGAAP amounts:
| ¡ | Accounts Receivable and Other Assets increased at 1 January 2010 by $31 million (31 December 2010 - nil) and Accounts Payable and Other Liabilities increased at 1 January 2010 by $16 million (31 December 2010 - $12 million). These adjustments record the net Transitional Asset for defined benefit plans, which at 1 January 2010 was $15 million (31 December 2010 - $12 million); |
| ¡ | Net Income for the period ending 31 December 2010 decreased by $21 million; and |
| ¡ | Retained Earnings increased at 1 January 2010 by $11 million (decreased 31 December 2010 - $9 million), the net of tax impact of the differences for Employee Benefits – Transitional Asset and Obligation. |
Presentation Reclassification of Defined Benefit Plan Liability
Under CGAAP, an Accrued Benefit Asset was recognized for the defined benefit pension plan. The different recognition and measurement policies under IFRS for post-employment benefits results in a Defined Benefit Liability position being recognized for the defined benefit pension plan. Accordingly, the amount by which the present value of the defined benefit pension plan obligation exceeded the fair value of plan assets at 1 January 2010, $89 million (31 December 2010 - $192 million), was reclassified from Accounts Receivable and Other Assets to Accounts Payable and Other Liabilities.
(iv) Other
An additional liability for certain short-term employee benefits was recognized under IFRS, resulting in an increase in Accounts Payable and Other Liabilities at 1 January 2010 of $5 million (31 December 2010 - nil). Retained Earnings decreased at 1 January 2010 by $4 million (31 December 2010 - nil), the net of tax impact of this difference. Net Income for the period ending 31 December 2010 increased by $4 million.
157
(c) Investment Property
CGAAP – Investment Property was measured at cost less accumulated amortization and any impairment losses.
IFRS – Investment Property is measured at fair value. As a result, compared to the previously reported CGAAP amounts:
| ¡ | Accounts Receivable and Other Assets increased at 1 January 2010 by $69 million (31 December 2010 - $81 million), the amount by which the fair value of Investment Property exceeded cost, less accumulated amortization and any impairment losses; |
| ¡ | Net Income for the period ending 31 December 2010 increased by $9 million; and |
| ¡ | Retained Earnings increased at 1 January 2010 by $52 million (31 December 2010 - $61 million), the net of tax impact of the differences for Investment Property. |
(d) Revenue Recognition
CGAAP – Application fees and compensatory fees for CMHC’s timely payment guarantees on NHA MBS were deferred and recognized as Revenues over the term of the security issue on a straight-line basis. Costs directly related to the issuance and ongoing administration of timely payment guarantees were deferred and recognized as Operating Expenses over the term of the security issue.
IFRS – Application fees are recognized as Revenues upon processing of the associated application. Compensatory fees are recognized as Revenues in the month to which the fees relate. Costs directly related to the issuance and ongoing administration of timely payment guarantees are recognized in Operating Expenses as incurred. As a result, compared to the previously reported CGAAP amounts:
| ¡ | Accounts Receivable and Other Assets decreased at 1 January 2010 by $5 million (31 December 2010 - $6 million) and Unearned Premiums and Fees decreased at 1 January 2010 by $54 million (31 December 2010 - $57 million); |
| ¡ | Net Income for the period ending 31 December 2010 increased by $2 million; and |
| ¡ | Retained Earnings increased at 1 January 2010 by $36 million (31 December 2010 - $38 million), the net of tax impact of the differences for Revenue Recognition. |
(e) Income Taxes
Differences for income taxes include the effect of recording the deferred tax effect of differences between CGAAP and IFRS.
(f) Recognition and measurement of Insurance Contracts
The objective of IFRS 4, Insurance Contracts is to specify the financial reporting for insurance contracts by an entity that issues such contracts until the IASB completes its continuing project for the implementation of a revised standard for insurance contracts. Except for limited requirements specified in the standard, it focuses on disclosure that identifies and explains the amounts in an insurer’s financial statements arising from insurance contracts and helps users of those financial statements to understand the amount, timing and uncertainty of future cash flows from insurance contracts. Consequently, until the revised standard is issued, the Corporation will continue its current practice for measuring and recording insurance contracts.
158 C A N A D A M O R T G A G E A N D H O U S I N G C O R P O R A T I O N

| CMHC BOARD OF DIRECTORS | 160 | |||
| CMHC MANAGEMENT | 163 | |||
| CMHC OFFICES | 164 | |||
| GLOSSARY | 165 | |||
| DEFINITION OF SELECT CMHC PERFORMANCE MEASURES | 169 | |||
| EXPECTED OUTCOMES AND INDICATORS | 171 | |||
159
CMHC BOARD OF DIRECTORS
COMPENSATION AND ATTENDANCE RECORD
| Attendance/Meetings | ||||||||||||
| Committee | ||||||||||||
| Governance and | Human | Pension Fund | ||||||||||
| Member | Compensation ($) | Board of Directors | Nominating | Audit | Resources | Trustees | ||||||
|
Dino Chiesa |
30,920 | 6/6 | 5/5 | |||||||||
|
Karen Kinsley1 |
N/A | 6/6 | 5/5 | 4/4 | 3/3 | 3/3 | ||||||
|
Harold Calla2 |
2,185 | 1/12 | N/A2 | |||||||||
|
Michael Gendron |
20,200 | 6/6 | 4/4 | |||||||||
|
Brian Johnston |
20,200 | 6/6 | 3/4 | |||||||||
|
Sophie Joncas |
20,200 | 6/6 | 4/5 | 4/4 | ||||||||
|
E. Anne MacDonald |
21,200 | 6/6 | 3/3 | |||||||||
|
James A. Millar |
19,200 | 6/6 | 5/5 | 3/3 | ||||||||
|
André G. Plourde |
18,200 | 5/6 | 3/3 | |||||||||
|
Rennie Pieterman |
19,700 | 6/6 | 3/3 | |||||||||
| 1 | Attendance at Audit and Human Resources committees as a non-member |
| 2 | Resigned February 4, 2011 |
BIOGRAPHIES
These are also available on CMHC’s website at www.cmhc.ca.
Dino Chiesa
Chairperson
Dino Chiesa has been Chair of the Board of Directors of CMHC since March 2005 and a member of the Board since June 2001. Mr. Chiesa is Principal, Chiesa Group commercial property investors, and Chair of Leisureworld Care-giving Centres. He has previously served as Vice-Chair of the Board of Trustees of the Canadian Apartment Properties Real Estate Investment Trust (CAP REIT), CEO of Residential Equities Real Estate Investment Trust, Assistant Deputy Minister of Ontario’s Ministry of Municipal Affairs and Housing, Chief Executive Officer of the Ontario
Housing Corporation, and an employee with CMHC from 1975 to 1987. Mr. Chiesa presently serves on the Board of the Social Housing Services Corporation Financial Inc., the founding Board of the largest reserve fund for social housing in Canada. He participates on the boards of various community-based organizations and private corporations, is past Chair for Villa Charities Inc., and is a member of the Advisory Board for the Schulich School of Business at York University and of the President’s Expert Advisory Committee on Real Estate and Development Strategy for Ryerson University. Dino Chiesa holds a Bachelor of Economics from McMaster University.
160 C A N A D A M O R T G A G E A N D H O U S I N G C O R P O R A T I O N

Karen Kinsley
President and Chief Executive Officer
Karen Kinsley was appointed President and Chief Executive Officer in June 2003. In 2011, she was reappointed for another two-year term. Ms. Kinsley joined CMHC in 1987. She was appointed Vice-President, Finance, in 1990 and Treasurer in June 1995. In November 1996, Ms. Kinsley became the Vice-President, Corporate Services and Chief Financial Officer, and in May 2000, was appointed Vice-President, Insurance and Securitization. Prior to joining CMHC, Ms. Kinsley was Vice-President and Treasurer with two real estate development companies. Karen Kinsley holds a Bachelor of Commerce degree from the University of Ottawa and is a member of the Canadian Institute of Chartered Accountants. She has been elected a Fellow of the Institute of Chartered Accountants of Ontario (FCA). In 2010, Ms. Kinsley also received the Certified Director designation (ICD.D) from the Institute of Corporate Directors.
Michael Gendron
Michael Gendron was appointed to the Board of Directors of CMHC in June 2010. A chartered accountant, Mr. Gendron is Chief Financial Officer and part owner of Mancap Ventures Inc., a privately-owned venture capital company with majority equity interest in a number of home building and support companies based in Edmonton, Alberta. Mr. Gendron was previously a partner in several local public accounting firms in Edmonton in which he served as external accountant and business advisor to businesses in a variety of industries, and operated a training organization primarily involved in preparing people to enter or re-enter the workplace. Mr. Gendron has served on a number of boards, including most recently as Chair of the Finance Committee for the Alberta New Home Warranty Program (2007-2009). In addition to his chartered accountant designation, Mr. Gendron holds a Bachelor of Education from the University of Western Ontario (Althouse College), a Bachelor of Commerce from the University of Windsor and a Bachelor of Arts from the University of Western Ontario.
Brian Johnston
Brian Johnston was appointed to the Board of Directors of CMHC in January 2008. A chartered accountant by profession, Mr. Johnston is the President of Monarch Corporation, one of Canada’s oldest and largest real estate companies. In addition to his responsibilities at Monarch Corporation, Mr. Johnston is an active member within the home building industry. He is currently a Board Director of Tarion Warranty Corporation (Chair of Investment Committee), the C.D. Howe Institute (Chair of Audit Committee), EnerQuality Corporation (Chair of Audit Committee) and is a past President of the Ontario Home Builders’ Association. Brian Johnston holds a Bachelor of Commerce degree from the University of Toronto.
Sophie Joncas
Sophie Joncas was appointed to the Board of Directors of CMHC in August 2001. A chartered accountant, Ms. Joncas is an Administrator with Production Quarters, a television production company, and a professor in economics and finance at the Académie de l’entrepreneurship Québécois inc. Her professional experience in the public and private sectors, including construction and real estate firms, has enabled her to assist companies with their business and strategic planning needs. She has also worked in the private sector as Director of Finance and Administration and as a professional auditor. Sophie Joncas holds a Bachelor of Science in Accounting and a Master in Business Administration from the Université du Québec à Montréal. She is a member of the Ordre des comptables agréés du Québec, President of the Chartered Accountants of the Montérégie Region and was President of the Association des gens d’affaires de St-Hubert for 2001.

161
E. Anne MacDonald
Anne MacDonald was appointed to the Board of Directors of CMHC in September 2007. Ms. MacDonald is a lawyer by profession. She was admitted to the Nova Scotia Bar Association in 1977, and has operated a general law practice in the Town of Pictou, Nova Scotia, since 1979. Ms. MacDonald has extensive knowledge of provincial and municipal law. Her primary areas of law practice include real estate, wills, probate, municipal law and family law. She was also the solicitor for the Town of Pictou for 25 years and assisted the town in acquiring and managing its real estate properties. A long-time resident of Pictou, Ms. MacDonald has been actively involved in her community, both as a volunteer and member of various associations. Ms. MacDonald is currently a member of the Nova Scotia Barristers’ Society, the Caribou Women’s Institute, and actively participates in and supports community organizations and charities. Anne MacDonald obtained a Bachelor of Arts from Acadia University and a Bachelor of Laws from Dalhousie University.
James A. Millar
Jim Millar was appointed to the Board of Directors of CMHC in April 2007. Mr. Millar is an Associate with the Sussex Circle, an Ottawa-based consulting group providing advice on strategy, policy, organization and finance to senior clients in government, business and the voluntary sector. Mr. Millar joined CMHC in 1998 as Team Leader of the Total Compensation Review (TCR) and Chairperson of the TCR Advisory Committee. Later that year, he was appointed General Manager, Human Resources and Organizational Development Directorate and, in October 2000, was appointed Vice-President, Human Resources and Pension Fund. In May 2002, he was named Vice-President, Strategic Planning, Risk Management and Communications, and appointed Vice-President, Risk Management and Communications, in February 2004. A career public
servant, Mr. Millar worked in several government departments, including the Privy Council Office, Manpower and Immigration, the Public Service Commission, and Transport Canada. In 1989, he joined the Department of the Prime Minister and Cabinet, Government of Australia, as Assistant Secretary, Trade and Industry on an interchange assignment. Jim Millar obtained a Bachelor of Arts (Honours) in Economics and Political Science from Bishop’s University and a Master of Public Administration from Carleton University.
Rennie Pieterman
Rennie Pieterman was appointed to the Board of Directors of CMHC in June 2010. A partner at Practical Plumbing Co. Ltd., Ms. Pieterman served eight years on the Board of Directors of the London Home Builders’ Association, including as President in 2003. She has been a member of the Association’s Renovators’ Council since 1994. Ms. Pieterman is also an active member of the Board of the Hyde Park Business Association and the Board of the Bibles for Missions Thrift Stores in London and chair of its volunteer committee.
André G. Plourde
André G. Plourde was appointed to the Board of Directors of CMHC in April 2008. Mr. Plourde has been President of Montréal Real Estate Group Inc. since 2001, an important commercial real estate brokerage firm in Montréal. Mr. Plourde is active within the commercial real estate industry as a member of the Urban Development Institute of Québec and the Organisme d’autoréglementation du courtage immobilier du Québec (OACIQ). André G. Plourde obtained a Bachelor of Business Administration degree from the Université du Québec à Montréal. Mr. Plourde is Vice-Chairman of the Board of the Children’s Diabetic Foundation.
162 C A N A D A M O R T G A G E A N D H O U S I N G C O R P O R A T I O N
CMHC MANAGEMENT
As at December 31, 2011
Karen Kinsley
President and Chief Executive Officer
NATIONAL OFFICE
Charles Chenard
Executive Director, Corporate Marketing
Peter De Barros
Executive Director, Communications
Serge Gaudet
Director, Audit and Evaluation Services
Sébastien Gignac
General Counsel and Corporate Secretary
P. Marc Joyal
Vice-President, Corporate Services and Chief Financial Officer
Mark McInnis
Vice-President, Insurance Underwriting, Servicing and Policy
Terry Robinson
Director, CMHC International
Pierre Serré
Vice-President, Insurance Product and Business Development
Douglas Stewart
Vice-President, Policy and Planning and Acting Vice-President, Assisted Housing
Gail Tolley
Vice-President, Human Resources
Wojo Zielonka
Chief Risk Officer
REGIONAL BUSINESS CENTRE GENERAL MANAGERS
Sylvie Crispo
General Manager, Quebec Business Centre
Peter Friedmann
General Manager, Ontario Business Centre, and Managing Director, Securitization
Christina Haddad
General Manager, Atlantic Business Centre
Charles B. MacArthur
General Manager, British Columbia Business Centre
Gordon R. McHugh
General Manager, Prairie and Territories Business Centre
163
CMHC OFFICES
NATIONAL OFFICE
700 Montreal Road
Ottawa, Ontario K1A 0P7
613-748-2000
REGIONAL BUSINESS CENTRES
Atlantic
1894 Barrington Street, 9th Floor
Halifax, Nova Scotia B3J 2A8
902-426-3530
Quebec
1100 René-Lévesque Blvd West, 1st Floor
Montréal, Quebec H3B 5J7
514-283-2222
Ontario
100 Sheppard Avenue East, Suite 300
Toronto, Ontario M2N 6Z1
416-221-2642
Prairies and Territories
1000 – 7th Avenue SW, Suite 200
Calgary, Alberta T2P 5L5
403-515-3000
British Columbia
1111 West Georgia Street, Suite 200
Vancouver, British Columbia V6E 4S4
604-731-5733
164 C A N A D A M O R T G A G E A N D H O U S I N G C O R P O R A T I O N
GLOSSARY
| Acronyms: | ||
| AANDC |
Aboriginal Affairs and Northern Development Canada | |
| AHI |
Affordable Housing Initiative | |
| CBA |
Canadian Bankers Association | |
| CEAP |
Canada’s Economic Action Plan | |
| CGAAP |
Canadian Generally Accepted Accounting Principles | |
| CHT |
Canada Housing Trust | |
| CMB |
Canada Mortgage Bond | |
| DFAIT |
Department of Foreign Affairs and International Trade | |
| ERP |
Emergency Repair Program | |
| FAA |
Financial Administration Act | |
| FNMHF |
First Nations Market Housing Fund | |
| FSB |
Financial Stability Board | |
| HASI |
Home Adaptations for Seniors’ Independence | |
| HRSDC |
Human Resources and Skills Development Canada | |
| IAH |
Investment in Affordable Housing | |
| IC |
Industry Canada | |
| IFRS |
International Financial Reporting Standards | |
| IMPP |
Insured Mortgage Purchase Program | |
| LTV |
Loan-to-value | |
| MAV |
Master Asset Vehicle | |
| MCT |
Minimum Capital Test | |
| MILP |
Municipal Infrastructure Lending Program | |
| NGO |
Non-governmental organization | |
| NHA MBS |
National Housing Act Mortgage-Backed Securities | |
| NRC |
National Research Council | |
| NRCan |
Natural Resources Canada | |
| OSFI |
Office of the Superintendent of Financial Institutions | |
| |
Proposal Development Funding | |
| RRAP |
Residential Rehabilitation Assistance Program | |
| SEP |
Shelter Enhancement Program | |
Actuarial Gains/Losses on Post-Employment Benefits: The gain/loss arising from the effects of changes in actuarial assumptions as well as the difference between estimates and actual experience in a company’s pension plan.
Affordable Housing Initiative (AHI): Under the Affordable Housing Initiative, the federal government, through CMHC, provides funding to increase the supply of affordable housing off reserve, in collaboration with provinces and territories. Provinces and territories design and deliver the housing programs. The existing AHI agreements have been extended in two jurisdictions (Yukon and Prince Edward Island).
Canada Housing Trust (CHT): The CHT is a legal entity separate from CMHC. CHT acquires interests in eligible insured housing loans, such as National Housing Act Mortgage-Backed Securities and issues Canada Mortgage Bonds (CMBs). The CHT also purchases highly rated investments and undertakes
certain related financial hedging activities for the purpose of managing business risks. CMBs are guaranteed by CMHC. CMHC also acts as the financial services advisor to the CHT, determining market demand for bond issuance, and engaging an underwriting syndicate to underwrite bond issues. CMHC receives a fee from CHT for its services as guarantor and financial services advisor. The day-to-day activities of the CHT are administered through a separate corporate entity serving as the trust administrator. As required under IFRS, CHT’s financial results are consolidated with CMHC’s financial statements because CMHC is exposed to CHT’s risks and rewards.
Canada Mortgage Bonds (CMB): Bullet maturity bonds that are fixed rate with a semi-annual coupon and floating rate notes with a quarterly coupon that are issued by the Canada Housing Trust (CHT) and guaranteed by CMHC.
165
CMHC Affordable Housing Centre: CMHC’s centre of excellence for information, guidance and other tools to facilitate the production of affordable housing by non-profit organizations, private sector proponents and others.
Core Housing Need: A household is in core housing need if its housing does not meet one or more of the adequacy, suitability or affordability housing standards and it would have to spend 30% or more of its before-tax income to pay the median rent (including utility costs) of alternative local market housing that meets all three of these standards.
| n | Adequate housing does not require any major repairs, according to residents. |
| n | Suitable housing has enough bedrooms for the size and make-up of resident households, according to National Occupancy Standard (NOS) requirements. Enough bedrooms based on NOS requirements means one bedroom for each cohabiting adult couple; unattached household member 18 years of age and over; same-sex pair of children under age 18; and additional boy or girl in the family, unless there are two opposite sex children under 5 years of age, in which case they are expected to share a bedroom. A household of one individual can occupy a bachelor unit, (i.e., a unit with no bedroom). |
| n | Affordable housing costs less than 30% of before-tax household income. For renters, shelter costs include rent and any payments for electricity, fuel, water and other municipal services. For owners, shelter costs include mortgage payments (principal and interest), property taxes, and any condominium fees, along with payments for electricity, fuel, water and other municipal services. |
Direct Lending: CMHC provides low-cost loans directly to federally-assisted social housing sponsors seeking to continue financing their housing projects and to First Nations to finance new housing production.
emili: A proprietary online automated mortgage insurance risk and approval system developed by CMHC. It provides a virtually instantaneous risk assessment of mortgage loan insurance applications.
EQuilibrium™ Communities Initiative: Goals of the joint CMHC/Natural Resources Canada EQuilibrium™ Communities Initiative:
| n | to accelerate sustainable community planning and development in Canada by demonstrating implementation methodologies and by facilitating improvements to performance levels; and, |
| n | to showcase how sustainable communities offer opportunities to achieve these improved levels of performance by integrating land use, housing, transportation and energy efficiency. |
EQuilibrium™ Sustainable Housing Demonstration Initiative: Goals of CMHC’s EQuilibrium™ Sustainable Housing Demonstration Initiative:
| n | to promote environmentally-friendly, healthy housing across Canada; |
| n | to enhance the capacity of Canada’s home builders, developers, architects and engineers to design and build EQuilibrium™ homes and communities across the country; |
| n | to educate consumers on the benefits of owning an EQuilibrium™ home and achieve market acceptance of EQuilibrium™ homes and sustainable communities; and, |
| n | to enhance Canada’s domestic and international leadership and business opportunities in sustainable housing design, construction services and technologies. |
First Nations Market Housing Fund (FNMHF): The FNMHF, an independent trust, is overseen by nine trustees appointed by the Minister for CMHC and the Minister of Aboriginal Affairs and Northern Development. CMHC, on behalf of the Government of Canada, contributed $300 million to the Fund under a Funding Agreement with the Trustees of the FNMHF. In 2008, the FNMHF engaged CMHC to administer its operations for its initial five years. The FNMHF operates a credit enhancement facility for housing loans on First Nation reserves as well as supports First Nation capacity development. The financial results of the FNMHF are not consolidated with CMHC’s financial statements but are consolidated with the Government of Canada’s.
166 C A N A D A M O R T G A G E A N D H O U S I N G C O R P O R A T I O N
Granville Island: Granville Island is a cultural, recreational and commercial development in the heart of Vancouver owned by the Government of Canada. CMHC receives a fee to cover its costs to manage and administer Granville Island. Granville Island’s finances are not consolidated with CMHC’s.
Insured Mortgage Purchase Program (IMPP): In October 2008, as a measure to maintain the availability of longer-term credit in Canada, the Government of Canada authorized CMHC to purchase $25 billion in National Housing Act Mortgage-Backed Securities (NHA MBS) from Canadian financial institutions through a competitive auction process. Since the initial announcement, the potential size of the program was increased to $125 billion. IMPP remained available until the end of March 2010.
Investment in Affordable Housing (IAH) 2011-2014: A new framework for the Investment in Affordable Housing was announced on July 4, 2011 which provides for $1.4 billion in combined F/P/T funding towards reducing the number of Canadians in housing need. This became the basis for bilateral IAH agreements between CMHC, on behalf of the federal government, and provinces and territories. Where provinces and territories choose not to enter into an IAH arrangement, federal funding for housing will be provided through extensions of existing arrangements with respect to AHI and/or renovation programs.
Municipal Infrastructure Lending Program (MILP): Under Canada’s Economic Action Plan, CMHC delivered MILP which provided $2 billion in direct low-cost loans to municipalities over a two-year period to March 31, 2011, to fund housing-related municipal infrastructure.
National Housing Act Mortgage-Backed Securities (NHA MBS): A security which represents an undivided interest in a pool of residential mortgages insured under the NHA or by a licensed private sector insurer and which has the full timely-payment guarantee of the Government of Canada through CMHC. The scheduled principal repayments by the borrower and agreed rate of interest on the mortgages in an NHA MBS pool are paid to investors monthly. In addition, depending on
the particular issue of NHA MBS, these payments can vary from month to month if, for example, borrowers make unscheduled payments such as advance payments of principal on a mortgage. Securities under the NHA MBS program are issued by Approved Issuers (primarily lending institutions).
Proposal Development Funding (PDF): An interest-free loan of up $100,000 to support activities carried out during the early stages of developing an affordable housing project. PDF is available for projects that are expected to be developed without long-term federal government subsidies. Eligible costs include soil load-bearing tests, environmental site assessments, project drawings and specifications, development permits and certain professional and consulting fees. The loan is repayable upon the first advance of mortgage funding and a portion of the loan may be forgiven if it meets criteria for affordable housing as defined by CMHC.
Realized Gains/Losses on Financial Instruments: The gain/loss actually incurred when an investment is sold.
Renovation programs: Renovation programs help low-income households, landlords, persons with disabilities, senior households, and Aboriginal people undertake much-needed repairs and/or accessibility modifications to their housing units. Renovation programs delivered by CMHC include:
| n | Residential Rehabilitation Assistance Program (RRAP): A program which provides financial assistance to low-income households who live on and off reserve to enable them to repair their homes or to adapt them to accommodate the needs of residents with disabilities, as well as to assist landlords to repair or adapt rental dwellings, or to convert non-residential properties into affordable residential units. |
| n | Shelter Enhancement Program (SEP): A program which provides financial assistance to repair, rehabilitate and improve existing shelters, both on and off reserve, for victims of family violence. The program also assists in the acquisition or construction of new shelters and second stage housing. |
167
| n | Emergency Repair Program (ERP): A program which provides financial assistance to low-income homeowners or occupants in rural areas off reserve to undertake emergency repairs required for the continued safe occupancy of their house. |
| n | Home Adaptations for Seniors’ Independence (HASI): A program which provides financial assistance to low-income seniors to carry out minor adaptations to assist them to live independently in their own homes. |
Beginning April 1, 2011, in most jurisdictions, the federal investment in affordable housing, including funding for renovation programs off reserve, is being cost-matched and delivered by provinces and territories through agreements for the Investment in Affordable Housing (IAH) 2011-2014. CMHC continues to deliver renovation programs off reserve where a province or territory has decided not to sign the IAH agreement (Yukon and Prince Edward Island) as well as in Ontario, where the Province asked CMHC to continue to make new commitments under the renovation programs until March 31, 2012.
CMHC delivers the renovation programs on reserve.
Schedule I Banks: Schedule I banks are domestic banks and are authorized under the Bank Act to accept deposits, which may be eligible for deposit insurance provided by the Canada Deposit Insurance Corporation.
Schedule II Banks: Schedule II banks are foreign bank subsidiaries authorized under the Bank Act to accept deposits, which may be eligible for deposit insurance provided by the Canada Deposit Insurance Corporation. Foreign bank subsidiaries are controlled by eligible foreign institutions.
Seed Funding: Consists of a contribution and a loan up to a maximum of $20,000 when combined to support activities carried out in the early stages of developing affordable housing project proposals. Eligible expenses include costs for housing market studies, need and demand analyses, the preparation of business plans, preliminary financial viability analyses, preliminary project designs, as well as the costs to incorporate an entity. The loan portion of Seed Funding is repayable upon the first advance of mortgage funding.
Unrealized Gains/Losses on Financial Instruments: The gain/loss recorded on an investment when the fair value of the investment increases/decreases.
168 C A N A D A M O R T G A G E A N D H O U S I N G C O R P O R A T I O N
DEFINITION OF SELECT
CMHC PERFORMANCE MEASURES
The following provides CMHC’s definition of certain performance measures:
|
Objective 1: Help Canadians in need
| ||
|
Strategic Priority 1.1
| ||
|
Housing Programs expenses: Expenses primarily related to existing social housing programs. These programs include: public housing programs, non-profit housing programs, rent supplement programs, the Rural and Native Housing Program, Urban Native Housing Program and co-operative housing programs. New commitments under these programs ceased in 1993, except for the On-Reserve Non-Profit Rental Housing Program. Also includes expenditures under the Affordable Housing Initiative, CMHC’s renovation programs, CMHC’s research, market analysis and export promotion activities, as well as spending related to commitments under Canada’s Economic Action Plan and the Investment in Affordable Housing (IAH) 2011-2014.
Estimated number of households assisted through long-term social housing agreements: Primarily households who live in social housing developed between 1946 and 1993. Also includes households living in units on reserve administered under the On-Reserve Non-Profit Rental Housing Program. New units continue to be committed under this program.
Investment in Affordable Housing (IAH) 2011-2014: A new framework for the Investment in Affordable Housing was announced on July 4, 2011 which provides for $1.4 billion in combined F/P/T funding towards reducing the number of Canadians in housing need. This became the basis for bilateral IAH agreements between CMHC, on behalf of the federal government, and provinces and territories. Where provinces and territories choose not to enter into a bilateral arrangement under the new Framework (Yukon and PEI), federal funding for housing will be provided through extensions of existing arrangements with respect to AHI and/or renovation programs. The IAH measure includes expenditures associated with the bilateral agreements for the IAH as well as extensions to existing arrangements.
Renovation program expenditures: Federal expenditures disbursed under CMHC’s renovation programs (see Glossary): off reserve for expenditures against commitments made prior to April 1, 2011; on-reserve for expenditures against commitments made to December 31, 2011. The financial assistance is in the form of a fully forgivable loan provided the owner maintains continued ownership and occupancy of the dwelling, or the landlord in the case of a rental property, places a ceiling on the rents that may be charged after repair and limits increases during the term of an operating agreement.
Affordable housing units facilitated by CMHC’s Affordable Housing Centre: Affordable housing units for which project sponsors have been provided with Seed Funding or Proposal Development Funding, and/or CMHC’s Affordable Housing Centre staff have provided advice in the development of these units. Some of these units also qualified for CMHC mortgage loan insurance underwriting flexibilities which encourage affordable housing.
| ||
|
Strategic Priority 1.2
| ||
|
Per cent of housing programs and services delivered through First Nations or Aboriginal organizations: The average of the following:
n Per cent of RRAP accounts on reserve delivered by Aboriginal agents
n Per cent of commitments under the On-Reserve Non-Profit Rental Housing Program for which inspections and physical condition reviews are carried out under the Native Inspection Services Initiative based on number of units
n Per cent of Aboriginal Capacity Development service contract dollars paid to Aboriginal service providers.
|
169
|
Objective2: Facilitate access to more affordable, better quality housing for all Canadians
| ||
|
Strategic Priority 2.1
| ||
|
Total insured volume (units) and Total insured volume ($): Units and value of insured loans that were finalized for both homeownership and rental units as well as portfolio insurance.
Operating expense ratio (per cent): The ratio of operating expenses to total premiums and fee revenue earned.
(Operating expenses) / (earned premiums + fees) *100
| ||
|
Strategic Priority 2.2
| ||
|
Annual securities guaranteed: NHA Mortgage-Backed Securities (NHA MBS) for which CMHC issued guarantees during the year. Once guaranteed, NHA MBS may be issued directly into the capital market, purchased by the Canada Housing Trust under the Canada Mortgage Bonds Program, or purchased under the Insured Mortgage Purchase Program until March 2010.
Operating expense ratio (per cent): The ratio of operating expenses to revenue earned.
(Operating expenses + Canada Mortgage Bonds related expenses)/(guarantee fees earned + application and compensatory fees earned + Financial Services Advisors’ fees earned from Canada Housing Trust) *100
| ||
|
Strategic Priority 2.3
| ||
|
Forecast accuracy of housing starts: The difference expressed as a percentage between CMHC’s initial starts forecast for Canada and the actual annual starts for the same year.
Ranking of housing starts forecast accuracy among forecasters: Ranking of the accuracy of CMHC’s annual housing starts forecast among other industry forecasters where the most accurate forecaster ranks first.
|
|
INTERNAL SERVICES
| ||
|
Human Resources
| ||
|
Level of employee engagement: The overall level of engagement is based on the results of a survey of CMHC employees conducted by Towers Watson (formerly Towers Perrin ISR) in comparison to industry benchmarks. To be fully engaged, employees must have: rational understanding of the organization’s strategic goals, values, and how they fit; emotional attachment to their organization; the motivation and willingness to invest discretionary effort to go above and beyond to help the organization succeed.
| ||
|
Information Technology
| ||
|
Technology index for key systems (per cent) Weighted average of monthly availability of key corporate systems.
|
170 C A N A D A M O R T G A G E A N D H O U S I N G C O R P O R A T I O N
EXPECTED OUTCOMES
AND INDICATORS
171
172 C A N A D A M O R T G A G E A N D H O U S I N G C O R P O R A T I O N
173
174 C A N A D A M O R T G A G E A N D H O U S I N G C O R P O R A T I O N
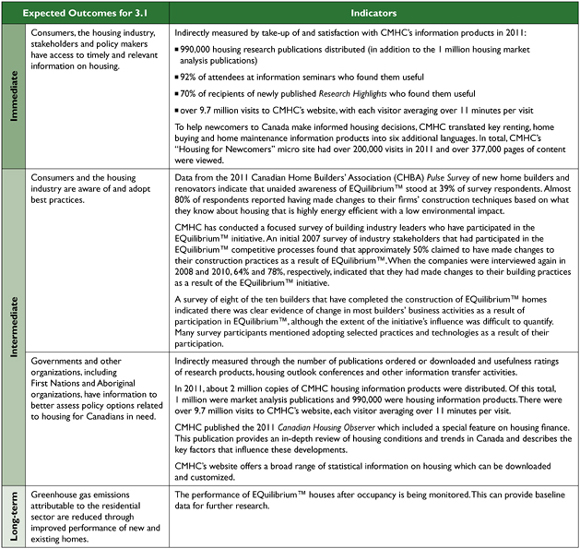
175

©2012 Canada Mortgage and Housing Corporation
Cat. No.: NHI-1/2011E
Printed in Canada