
Semiannual Report
March 31, 2023
MFS® Mid Cap Value Fund

MDV-SEM
MFS® Mid Cap Value Fund
CONTENTS
| 1 | |
| 2 | |
| 4 | |
| 11 | |
| 13 | |
| 14 | |
| 15 | |
| 24 | |
| 36 | |
| 37 | |
| 37 | |
| 37 | |
| 37 | |
| 37 |
| back cover |
The report is prepared for the
general information of shareholders. It is authorized for distribution to prospective investors only when preceded or accompanied by a current prospectus.
NOT FDIC INSURED
• MAY LOSE VALUE • NO BANK GUARANTEE
Portfolio Composition

| (g) | The Global Industry Classification Standard (GICS®) was developed by and/or is the exclusive property of MSCI, Inc. and S&P Global Market Intelligence Inc. (“S&P Global Market Intelligence”). GICS is a service mark of MSCI and S&P Global Market Intelligence and has been licensed for use by MFS. MFS has applied its own internal sector/industry classification methodology for equity securities and non-equity securities that are unclassified by GICS. |
Cash & Cash
Equivalents includes any cash, investments in money market funds, short-term securities, and other assets less liabilities. Please see the Statement of Assets and Liabilities for additional information related to the
fund’s cash position and other assets and liabilities.
Percentages are based on
net assets as of March 31, 2023.
The portfolio is actively
managed and current holdings may be different.
1
Expense Table
Fund expenses borne by the
shareholders during the period,
October 1, 2022 through March 31, 2023
October 1, 2022 through March 31, 2023
As a shareholder of the fund, you
incur two types of costs: (1) transaction costs, including sales charges (loads) on certain purchase or redemption payments, and (2) ongoing costs, including management fees; distribution and service (12b-1) fees; and
other fund expenses. This example is intended to help you understand your ongoing costs (in dollars) of investing in the fund and to compare these costs with the ongoing costs of investing in other mutual funds.
The example is based on an
investment of $1,000 invested at the beginning of the period and held for the entire period October 1, 2022 through March 31, 2023.
Actual Expenses
The first line for each share class
in the following table provides information about actual account values and actual expenses. You may use the information in this line, together with the amount you invested, to estimate the expenses that you paid over
the period. Simply divide your account value by $1,000 (for example, an $8,600 account value divided by $1,000 = 8.6), then multiply the result by the number in the first line under the heading entitled
“Expenses Paid During Period” to estimate the expenses you paid on your account during this period.
Hypothetical Example for
Comparison Purposes
The second line for each share class
in the following table provides information about hypothetical account values and hypothetical expenses based on the fund’s actual expense ratio and an assumed rate of return of 5% per year before expenses,
which is not the fund’s actual return. The hypothetical account values and expenses may not be used to estimate the actual ending account balance or expenses you paid for the period. You may use this information
to compare the ongoing costs of investing in the fund and other funds. To do so, compare this 5% hypothetical example with the 5% hypothetical examples that appear in the shareholder reports of the other funds.
Please note that the expenses shown
in the table are meant to highlight your ongoing costs only and do not reflect any transactional costs, such as sales charges (loads). Therefore, the second line for each share class in the table is useful in
comparing ongoing costs only, and will not help you determine the relative total costs of owning different funds. In addition, if these transactional costs were included, your costs would have been higher.
2
Expense Table - continued
| Share Class | Annualized Expense Ratio | Beginning Account Value 10/01/22 | Ending Account Value 3/31/23 | Expenses Paid During Period (p) 10/01/22-3/31/23 | |
| A | Actual | 0.99% | $1,000.00 | $1,124.98 | $5.24 |
| Hypothetical (h) | 0.99% | $1,000.00 | $1,020.00 | $4.99 | |
| B | Actual | 1.74% | $1,000.00 | $1,121.26 | $9.20 |
| Hypothetical (h) | 1.74% | $1,000.00 | $1,016.26 | $8.75 | |
| C | Actual | 1.74% | $1,000.00 | $1,120.75 | $9.20 |
| Hypothetical (h) | 1.74% | $1,000.00 | $1,016.26 | $8.75 | |
| I | Actual | 0.74% | $1,000.00 | $1,126.69 | $3.92 |
| Hypothetical (h) | 0.74% | $1,000.00 | $1,021.24 | $3.73 | |
| R1 | Actual | 1.74% | $1,000.00 | $1,120.74 | $9.20 |
| Hypothetical (h) | 1.74% | $1,000.00 | $1,016.26 | $8.75 | |
| R2 | Actual | 1.24% | $1,000.00 | $1,123.60 | $6.57 |
| Hypothetical (h) | 1.24% | $1,000.00 | $1,018.75 | $6.24 | |
| R3 | Actual | 0.99% | $1,000.00 | $1,125.07 | $5.25 |
| Hypothetical (h) | 0.99% | $1,000.00 | $1,020.00 | $4.99 | |
| R4 | Actual | 0.74% | $1,000.00 | $1,126.51 | $3.92 |
| Hypothetical (h) | 0.74% | $1,000.00 | $1,021.24 | $3.73 | |
| R6 | Actual | 0.62% | $1,000.00 | $1,127.38 | $3.29 |
| Hypothetical (h) | 0.62% | $1,000.00 | $1,021.84 | $3.13 |
| (h) | 5% class return per year before expenses. |
| (p) | “Expenses Paid During Period” are equal to each class’s annualized expense ratio, as shown above, multiplied by the average account value over the period, multiplied by 182/365 (to reflect the one-half year period). Expenses paid do not include any applicable sales charges (loads). If these transaction costs had been included, your costs would have been higher. |
3
Portfolio of Investments
3/31/23 (unaudited)
The Portfolio of Investments is a
complete list of all securities owned by your fund. It is categorized by broad-based asset classes.
| Issuer | Shares/Par | Value ($) | ||
| Common Stocks – 97.5% | ||||
| Aerospace & Defense – 3.9% | ||||
| Howmet Aerospace, Inc. | 3,392,726 | $143,749,800 | ||
| KBR, Inc. | 3,690,735 | 203,174,962 | ||
| L3Harris Technologies, Inc. | 493,188 | 96,783,213 | ||
| Leidos Holdings, Inc. | 1,534,197 | 141,238,176 | ||
| $584,946,151 | ||||
| Airlines – 0.9% | ||||
| Alaska Air Group, Inc. (a) | 1,251,965 | $52,532,452 | ||
| Delta Air Lines, Inc. (a) | 2,200,186 | 76,830,495 | ||
| $129,362,947 | ||||
| Apparel Manufacturers – 1.8% | ||||
| PVH Corp. | 1,116,991 | $99,590,918 | ||
| Skechers USA, Inc., “A” (a) | 2,601,908 | 123,642,668 | ||
| VF Corp. | 1,906,443 | 43,676,609 | ||
| $266,910,195 | ||||
| Automotive – 2.4% | ||||
| Aptiv PLC (a) | 718,346 | $80,591,238 | ||
| Lear Corp. | 614,351 | 85,695,821 | ||
| LKQ Corp. | 3,582,910 | 203,365,971 | ||
| $369,653,030 | ||||
| Brokerage & Asset Managers – 2.9% | ||||
| Cboe Global Markets, Inc. | 778,703 | $104,533,091 | ||
| Evercore Partners, Inc. | 685,237 | 79,062,645 | ||
| Invesco Ltd. | 3,237,097 | 53,088,391 | ||
| Raymond James Financial, Inc. | 1,540,598 | 143,691,575 | ||
| TPG, Inc. | 1,911,485 | 56,063,855 | ||
| $436,439,557 | ||||
| Business Services – 1.4% | ||||
| Amdocs Ltd. | 1,441,497 | $138,426,957 | ||
| Global Payments, Inc. | 698,110 | 73,469,096 | ||
| $211,896,053 | ||||
| Chemicals – 0.9% | ||||
| Eastman Chemical Co. | 1,657,902 | $139,827,455 | ||
4
Portfolio of Investments (unaudited)
– continued
| Issuer | Shares/Par | Value ($) | ||
| Common Stocks – continued | ||||
| Computer Software – 1.1% | ||||
| Black Knight, Inc. (a) | 1,009,080 | $58,082,645 | ||
| Check Point Software Technologies Ltd. (a) | 447,332 | 58,153,160 | ||
| Dun & Bradstreet Holdings, Inc. | 4,561,675 | 53,554,064 | ||
| $169,789,869 | ||||
| Computer Software - Systems – 1.5% | ||||
| Seagate Technology Holdings PLC | 978,442 | $64,694,585 | ||
| Verint Systems, Inc. (a) | 1,111,773 | 41,402,427 | ||
| Zebra Technologies Corp., “A” (a) | 380,986 | 121,153,548 | ||
| $227,250,560 | ||||
| Construction – 4.3% | ||||
| Essex Property Trust, Inc., REIT | 386,624 | $80,858,543 | ||
| Fortune Brands Innovations, Inc. | 1,092,446 | 64,159,354 | ||
| Masco Corp. | 2,477,829 | 123,197,658 | ||
| Mid-America Apartment Communities, Inc., REIT | 384,160 | 58,023,527 | ||
| Stanley Black & Decker, Inc. | 965,033 | 77,762,359 | ||
| Toll Brothers, Inc. | 2,455,678 | 147,414,350 | ||
| Vulcan Materials Co. | 540,829 | 92,784,623 | ||
| $644,200,414 | ||||
| Consumer Products – 1.0% | ||||
| International Flavors & Fragrances, Inc. | 998,728 | $91,843,027 | ||
| Newell Brands, Inc. | 5,344,265 | 66,482,657 | ||
| $158,325,684 | ||||
| Containers – 2.6% | ||||
| Avery Dennison Corp. | 459,167 | $82,158,751 | ||
| Crown Holdings, Inc. | 1,014,977 | 83,948,748 | ||
| Graphic Packaging Holding Co. | 4,677,192 | 119,221,624 | ||
| WestRock Co. | 3,714,862 | 113,191,845 | ||
| $398,520,968 | ||||
| Electrical Equipment – 3.4% | ||||
| Berry Global, Inc. | 1,856,693 | $109,359,218 | ||
| Johnson Controls International PLC | 3,049,717 | 183,653,958 | ||
| Sensata Technologies Holding PLC | 2,135,059 | 106,795,651 | ||
| TE Connectivity Ltd. | 819,924 | 107,533,032 | ||
| $507,341,859 | ||||
| Electronics – 3.9% | ||||
| Corning, Inc. | 2,944,778 | $103,891,768 | ||
| Flex Ltd. (a) | 4,555,218 | 104,815,566 | ||
| Marvell Technology, Inc. | 2,415,618 | 104,596,259 | ||
5
Portfolio of Investments (unaudited)
– continued
| Issuer | Shares/Par | Value ($) | ||
| Common Stocks – continued | ||||
| Electronics – continued | ||||
| NXP Semiconductors N.V. | 751,581 | $140,151,067 | ||
| ON Semiconductor Corp. (a) | 1,696,584 | 139,662,795 | ||
| $593,117,455 | ||||
| Energy - Independent – 5.0% | ||||
| Chesapeake Energy Corp. | 1,069,498 | $81,324,628 | ||
| Devon Energy Corp. | 2,229,659 | 112,843,042 | ||
| Diamondback Energy, Inc. | 913,442 | 123,469,955 | ||
| Hess Corp. | 1,302,393 | 172,358,690 | ||
| Pioneer Natural Resources Co. | 692,946 | 141,527,291 | ||
| Valero Energy Corp. | 895,745 | 125,046,002 | ||
| $756,569,608 | ||||
| Energy - Renewables – 0.9% | ||||
| AES Corp. | 5,825,197 | $140,270,744 | ||
| Engineering - Construction – 0.7% | ||||
| Quanta Services, Inc. | 625,145 | $104,174,163 | ||
| Food & Beverages – 2.8% | ||||
| Coca-Cola Europacific Partners PLC | 1,717,580 | $101,663,560 | ||
| Ingredion, Inc. | 1,396,573 | 142,073,371 | ||
| J.M. Smucker Co. | 692,934 | 109,047,024 | ||
| Kellogg Co. | 1,084,785 | 72,637,204 | ||
| $425,421,159 | ||||
| Food & Drug Stores – 0.5% | ||||
| Albertsons Cos., Inc., “A” | 3,870,408 | $80,427,078 | ||
| Gaming & Lodging – 1.4% | ||||
| Hyatt Hotels Corp. (a) | 766,847 | $85,725,826 | ||
| International Game Technology PLC | 4,729,539 | 126,751,645 | ||
| $212,477,471 | ||||
| General Merchandise – 0.7% | ||||
| Dollar Tree, Inc. (a) | 762,766 | $109,495,059 | ||
| Insurance – 8.4% | ||||
| American International Group, Inc. | 1,773,166 | $89,296,640 | ||
| Arthur J. Gallagher & Co. | 868,668 | 166,184,875 | ||
| Assurant, Inc. | 1,016,002 | 121,991,360 | ||
| Cincinnati Financial Corp. | 646,928 | 72,507,690 | ||
| Equitable Holdings, Inc. | 5,088,102 | 129,186,910 | ||
| Everest Re Group Ltd. | 480,710 | 172,103,794 | ||
| Hanover Insurance Group, Inc. | 438,372 | 56,330,802 | ||
| Hartford Financial Services Group, Inc. | 2,813,048 | 196,041,315 | ||
6
Portfolio of Investments (unaudited)
– continued
| Issuer | Shares/Par | Value ($) | ||
| Common Stocks – continued | ||||
| Insurance – continued | ||||
| Voya Financial, Inc. | 1,791,892 | $128,048,602 | ||
| Willis Towers Watson PLC | 611,628 | 142,130,115 | ||
| $1,273,822,103 | ||||
| Leisure & Toys – 1.9% | ||||
| Brunswick Corp. | 1,545,070 | $126,695,740 | ||
| Electronic Arts, Inc. | 650,153 | 78,310,929 | ||
| Mattel, Inc. (a) | 4,511,062 | 83,048,651 | ||
| $288,055,320 | ||||
| Machinery & Tools – 5.5% | ||||
| Eaton Corp. PLC | 1,142,875 | $195,820,202 | ||
| Ingersoll Rand, Inc. | 1,941,581 | 112,961,182 | ||
| ITT, Inc. | 1,080,349 | 93,234,119 | ||
| PACCAR, Inc. | 1,828,635 | 133,856,082 | ||
| Regal Rexnord Corp. | 1,023,737 | 144,070,508 | ||
| Wabtec Corp. | 1,503,661 | 151,959,981 | ||
| $831,902,074 | ||||
| Major Banks – 0.9% | ||||
| Regions Financial Corp. | 4,441,466 | $82,433,609 | ||
| State Street Corp. | 686,302 | 51,946,198 | ||
| $134,379,807 | ||||
| Medical & Health Technology & Services – 2.9% | ||||
| AmerisourceBergen Corp. | 940,209 | $150,536,863 | ||
| ICON PLC (a) | 452,183 | 96,581,767 | ||
| Laboratory Corp. of America Holdings | 372,347 | 85,423,849 | ||
| Universal Health Services, Inc. | 871,308 | 110,743,247 | ||
| $443,285,726 | ||||
| Medical Equipment – 3.4% | ||||
| Agilent Technologies, Inc. | 636,398 | $88,039,299 | ||
| Dentsply Sirona, Inc. | 1,997,135 | 78,447,463 | ||
| Maravai Lifesciences Holdings, Inc., “A” (a) | 1,665,964 | 23,340,156 | ||
| PerkinElmer, Inc. | 593,943 | 79,148,844 | ||
| STERIS PLC | 424,367 | 81,172,920 | ||
| Teleflex, Inc. | 187,760 | 47,561,486 | ||
| Zimmer Biomet Holdings, Inc. | 923,937 | 119,372,660 | ||
| $517,082,828 | ||||
| Natural Gas - Distribution – 0.4% | ||||
| Atmos Energy Corp. | 534,952 | $60,107,207 | ||
7
Portfolio of Investments (unaudited)
– continued
| Issuer | Shares/Par | Value ($) | ||
| Common Stocks – continued | ||||
| Natural Gas - Pipeline – 1.3% | ||||
| Plains GP Holdings LP | 6,762,855 | $88,728,658 | ||
| Targa Resources Corp. | 1,552,095 | 113,225,330 | ||
| $201,953,988 | ||||
| Network & Telecom – 0.9% | ||||
| Motorola Solutions, Inc. | 453,560 | $129,777,123 | ||
| Oil Services – 0.5% | ||||
| Halliburton Co. | 2,419,492 | $76,552,727 | ||
| Other Banks & Diversified Financials – 4.2% | ||||
| Columbia Banking System, Inc. | 3,471,038 | $74,349,634 | ||
| Discover Financial Services | 655,135 | 64,753,543 | ||
| East West Bancorp, Inc. | 1,076,234 | 59,730,987 | ||
| M&T Bank Corp. | 934,818 | 111,776,188 | ||
| Northern Trust Corp. | 1,389,783 | 122,481,576 | ||
| Prosperity Bancshares, Inc. | 1,163,407 | 71,572,799 | ||
| SLM Corp. | 7,321,609 | 90,714,736 | ||
| Zions Bancorp NA | 1,489,737 | 44,587,828 | ||
| $639,967,291 | ||||
| Pharmaceuticals – 0.5% | ||||
| Organon & Co. | 3,044,048 | $71,596,009 | ||
| Pollution Control – 1.1% | ||||
| GFL Environmental, Inc. | 2,468,940 | $85,030,294 | ||
| Republic Services, Inc. | 624,889 | 84,497,490 | ||
| $169,527,784 | ||||
| Real Estate – 6.0% | ||||
| Brixmor Property Group, Inc., REIT | 4,537,057 | $97,637,467 | ||
| Host Hotels & Resorts, Inc., REIT | 5,006,554 | 82,558,076 | ||
| Jones Lang LaSalle, Inc. (a) | 465,327 | 67,700,425 | ||
| Life Storage, Inc., REIT | 1,253,592 | 164,333,375 | ||
| Spirit Realty Capital, Inc., REIT | 1,676,107 | 66,776,103 | ||
| STAG Industrial, Inc., REIT | 1,855,451 | 62,751,353 | ||
| Sun Communities, Inc., REIT | 767,889 | 108,180,202 | ||
| VICI Properties, Inc., REIT | 4,877,232 | 159,095,308 | ||
| W.P. Carey, Inc., REIT | 1,281,729 | 99,269,911 | ||
| $908,302,220 | ||||
8
Portfolio of Investments (unaudited)
– continued
| Issuer | Shares/Par | Value ($) | ||
| Common Stocks – continued | ||||
| Restaurants – 2.0% | ||||
| Aramark | 2,989,277 | $107,016,117 | ||
| U.S. Foods Holding Corp. (a) | 2,212,644 | 81,735,069 | ||
| Wendy's Co. | 5,458,681 | 118,890,072 | ||
| $307,641,258 | ||||
| Specialty Chemicals – 3.9% | ||||
| Ashland, Inc. | 942,484 | $96,802,532 | ||
| Axalta Coating Systems Ltd. (a) | 4,094,289 | 124,016,014 | ||
| Celanese Corp. | 795,445 | 86,616,006 | ||
| Corteva, Inc. | 2,251,798 | 135,805,937 | ||
| DuPont de Nemours, Inc. | 2,019,602 | 144,946,835 | ||
| $588,187,324 | ||||
| Specialty Stores – 1.4% | ||||
| Builders FirstSource, Inc. (a) | 686,188 | $60,919,771 | ||
| Ross Stores, Inc. | 838,974 | 89,040,310 | ||
| Urban Outfitters, Inc. (a) | 2,093,921 | 58,043,490 | ||
| $208,003,571 | ||||
| Telecommunications - Wireless – 0.5% | ||||
| Liberty Broadband Corp. (a) | 952,335 | $77,805,770 | ||
| Trucking – 1.1% | ||||
| Knight-Swift Transportation Holdings, Inc. | 1,546,734 | $87,514,210 | ||
| XPO Logistics, Inc. (a) | 2,262,962 | 72,188,488 | ||
| $159,702,698 | ||||
| Utilities - Electric Power – 6.7% | ||||
| CenterPoint Energy, Inc. | 3,639,557 | $107,221,349 | ||
| CMS Energy Corp. | 1,972,843 | 121,093,103 | ||
| Edison International | 1,273,664 | 89,907,942 | ||
| Eversource Energy | 1,271,289 | 99,491,077 | ||
| PG&E Corp. (a) | 13,776,170 | 222,760,669 | ||
| Pinnacle West Capital Corp. | 1,505,725 | 119,313,649 | ||
| Public Service Enterprise Group, Inc. | 2,253,694 | 140,743,190 | ||
| Sempra Energy | 799,867 | 120,907,896 | ||
| $1,021,438,875 | ||||
| Total Common Stocks (Identified Cost, $11,667,796,571) | $14,775,509,182 | |||
| Preferred Stocks – 0.5% | ||||
| Consumer Products – 0.5% | ||||
| Henkel AG & Co. KGaA (Identified Cost, $78,908,002) | 890,912 | $69,623,937 | ||
9
Portfolio of Investments (unaudited)
– continued
| Issuer | Shares/Par | Value ($) | ||
| Investment Companies (h) – 1.7% | ||||
| Money Market Funds – 1.7% | ||||
| MFS Institutional Money Market Portfolio, 4.56% (v) (Identified Cost, $262,124,500) | 262,135,224 | $262,187,651 | ||
| Other Assets, Less Liabilities – 0.3% | 38,577,659 | |||
| Net Assets – 100.0% | $15,145,898,429 | |||
| (a) | Non-income producing security. | |||
| (h) | An affiliated issuer, which may be considered one in which the fund owns 5% or more of the outstanding voting securities, or a company which is under common control. At period end, the aggregate values of the fund's investments in affiliated issuers and in unaffiliated issuers were $262,187,651 and $14,845,133,119, respectively. | |||
| (v) | Affiliated issuer that is available only to investment companies managed by MFS. The rate quoted for the MFS Institutional Money Market Portfolio is the annualized seven-day yield of the fund at period end. |
| The following abbreviations are used in this report and are defined: | |
| REIT | Real Estate Investment Trust |
See Notes to Financial Statements
10
Financial Statements
Statement of Assets and
Liabilities
At 3/31/23 (unaudited)
This statement represents your
fund’s balance sheet, which details the assets and liabilities comprising the total value of the fund.
| Assets | |
| Investments in unaffiliated issuers, at value (identified cost, $11,746,704,573) | $14,845,133,119 |
| Investments in affiliated issuers, at value (identified cost, $262,124,500) | 262,187,651 |
| Receivables for | |
| Investments sold | 17,775,503 |
| Fund shares sold | 85,568,936 |
| Dividends | 23,826,832 |
| Other assets | 37,571 |
| Total assets | $15,234,529,612 |
| Liabilities | |
| Payables for | |
| Fund shares reacquired | $85,129,530 |
| Payable to affiliates | |
| Investment adviser | 488,507 |
| Administrative services fee | 3,537 |
| Shareholder servicing costs | 2,382,206 |
| Distribution and service fees | 40,883 |
| Payable for independent Trustees' compensation | 16,398 |
| Accrued expenses and other liabilities | 570,122 |
| Total liabilities | $88,631,183 |
| Net assets | $15,145,898,429 |
| Net assets consist of | |
| Paid-in capital | $12,022,681,401 |
| Total distributable earnings (loss) | 3,123,217,028 |
| Net assets | $15,145,898,429 |
| Shares of beneficial interest outstanding | 539,652,341 |
11
Statement of Assets and Liabilities (unaudited) – continued
| Net assets | Shares outstanding | Net asset value per share (a) | |
| Class A | $1,757,164,702 | 64,128,835 | $27.40 |
| Class B | 6,735,709 | 262,222 | 25.69 |
| Class C | 90,707,756 | 3,561,479 | 25.47 |
| Class I | 3,724,884,391 | 131,919,844 | 28.24 |
| Class R1 | 12,943,057 | 520,192 | 24.88 |
| Class R2 | 69,597,732 | 2,608,837 | 26.68 |
| Class R3 | 771,827,609 | 28,300,642 | 27.27 |
| Class R4 | 367,105,869 | 13,318,795 | 27.56 |
| Class R6 | 8,344,931,604 | 295,031,495 | 28.28 |
| (a) | Maximum offering price per share was equal to the net asset value per share for all share classes, except for Class A, for which the maximum offering price per share was $29.07 [100 / 94.25 x $27.40]. On sales of $50,000 or more, the maximum offering price of Class A shares is reduced. A contingent deferred sales charge may be imposed on redemptions of Class A, Class B, and Class C shares. Redemption price per share was equal to the net asset value per share for Classes I, R1, R2, R3, R4, and R6. |
See Notes to Financial Statements
12
Financial Statements
Statement of Operations
Six months ended 3/31/23
(unaudited)
This statement describes how much
your fund earned in investment income and accrued in expenses. It also describes any gains and/or losses generated by fund operations.
| Net investment income (loss) | |
| Income | |
| Dividends | $193,306,024 |
| Dividends from affiliated issuers | 4,663,384 |
| Other | 325,681 |
| Income on securities loaned | 1,727 |
| Foreign taxes withheld | (236,065) |
| Total investment income | $198,060,751 |
| Expenses | |
| Management fee | $46,674,389 |
| Distribution and service fees | 3,795,892 |
| Shareholder servicing costs | 4,401,989 |
| Administrative services fee | 319,008 |
| Independent Trustees' compensation | 60,748 |
| Custodian fee | 101,634 |
| Shareholder communications | 386,925 |
| Audit and tax fees | 22,706 |
| Legal fees | 34,787 |
| Miscellaneous | 334,150 |
| Total expenses | $56,132,228 |
| Reduction of expenses by investment adviser and distributor | (1,006,024) |
| Net expenses | $55,126,204 |
| Net investment income (loss) | $142,934,547 |
| Realized and unrealized gain (loss) | |
| Realized gain (loss) (identified cost basis) | |
| Unaffiliated issuers | $31,728,202 |
| Affiliated issuers | (5,297) |
| Foreign currency | (21,940) |
| Net realized gain (loss) | $31,700,965 |
| Change in unrealized appreciation or depreciation | |
| Unaffiliated issuers | $1,575,522,854 |
| Affiliated issuers | 20,439 |
| Translation of assets and liabilities in foreign currencies | 28,509 |
| Net unrealized gain (loss) | $1,575,571,802 |
| Net realized and unrealized gain (loss) | $1,607,272,767 |
| Change in net assets from operations | $1,750,207,314 |
See Notes to Financial Statements
13
Financial Statements
Statements of Changes in Net
Assets
These statements describe the
increases and/or decreases in net assets resulting from operations, any distributions, and any shareholder transactions.
| Six months ended | Year ended | |
| 3/31/23 (unaudited) | 9/30/22 | |
| Change in net assets | ||
| From operations | ||
| Net investment income (loss) | $142,934,547 | $193,213,552 |
| Net realized gain (loss) | 31,700,965 | 838,567,013 |
| Net unrealized gain (loss) | 1,575,571,802 | (2,668,226,180) |
| Change in net assets from operations | $1,750,207,314 | $(1,636,445,615) |
| Total distributions to shareholders | $(784,048,457) | $(900,270,010) |
| Change in net assets from fund share transactions | $457,386,313 | $1,483,450,716 |
| Total change in net assets | $1,423,545,170 | $(1,053,264,909) |
| Net assets | ||
| At beginning of period | 13,722,353,259 | 14,775,618,168 |
| At end of period | $15,145,898,429 | $13,722,353,259 |
See Notes to Financial Statements
14
Financial Statements
Financial Highlights
The financial highlights table is
intended to help you understand the fund's financial performance for the semiannual period and the past 5 fiscal years. Certain information reflects financial results for a single fund share. The total returns in the
table represent the rate that an investor would have earned (or lost) on an investment in the fund share class (assuming reinvestment of all distributions) held for the entire period.
| Class A | Six months ended | Year ended | ||||
| 3/31/23 (unaudited) | 9/30/22 | 9/30/21 | 9/30/20 | 9/30/19 | 9/30/18 | |
| Net asset value, beginning of period | $25.61 | $30.27 | $21.56 | $23.63 | $24.10 | $22.99 |
| Income (loss) from investment operations | ||||||
| Net investment income (loss) (d) | $0.22 | $0.29 | $0.21 | $0.23 | $0.24 | $0.18 |
| Net realized and unrealized gain (loss) | 2.99 | (3.15) | 8.70 | (1.79) | 0.53 | 1.71 |
| Total from investment operations | $3.21 | $(2.86) | $8.91 | $(1.56) | $0.77 | $1.89 |
| Less distributions declared to shareholders | ||||||
| From net investment income | $(0.38) | $(0.29) | $(0.20) | $(0.23) | $(0.19) | $(0.10) |
| From net realized gain | (1.04) | (1.51) | — | (0.28) | (1.05) | (0.68) |
| Total distributions declared to shareholders | $(1.42) | $(1.80) | $(0.20) | $(0.51) | $(1.24) | $(0.78) |
| Net asset value, end of period (x) | $27.40 | $25.61 | $30.27 | $21.56 | $23.63 | $24.10 |
| Total return (%) (r)(s)(t)(x) | 12.50(n) | (10.44) | 41.55 | (6.87) | 3.98 | 8.37 |
| Ratios (%) (to average net assets) and Supplemental data: | ||||||
| Expenses before expense reductions | 1.00(a) | 1.00 | 1.02 | 1.07 | 1.08 | 1.08 |
| Expenses after expense reductions | 0.99(a) | 0.99 | 1.01 | 1.06 | 1.06 | 1.07 |
| Net investment income (loss) | 1.60(a) | 0.97 | 0.75 | 1.04 | 1.05 | 0.78 |
| Portfolio turnover | 10(n) | 17 | 19 | 19 | 27 | 26 |
| Net assets at end of period (000 omitted) | $1,757,165 | $1,563,018 | $1,616,315 | $1,141,479 | $1,199,095 | $1,131,758 |
See Notes to Financial Statements
15
Financial Highlights – continued
| Class B | Six months ended | Year ended | ||||
| 3/31/23 (unaudited) | 9/30/22 | 9/30/21 | 9/30/20 | 9/30/19 | 9/30/18 | |
| Net asset value, beginning of period | $23.94 | $28.40 | $20.22 | $22.18 | $22.67 | $21.73 |
| Income (loss) from investment operations | ||||||
| Net investment income (loss) (d) | $0.11 | $0.04 | $(0.01) | $0.06 | $0.06 | $0.00(w) |
| Net realized and unrealized gain (loss) | 2.81 | (2.94) | 8.20 | (1.69) | 0.50 | 1.62 |
| Total from investment operations | $2.92 | $(2.90) | $8.19 | $(1.63) | $0.56 | $1.62 |
| Less distributions declared to shareholders | ||||||
| From net investment income | $(0.13) | $(0.05) | $(0.01) | $(0.05) | $(0.00)(w) | $— |
| From net realized gain | (1.04) | (1.51) | — | (0.28) | (1.05) | (0.68) |
| Total distributions declared to shareholders | $(1.17) | $(1.56) | $(0.01) | $(0.33) | $(1.05) | $(0.68) |
| Net asset value, end of period (x) | $25.69 | $23.94 | $28.40 | $20.22 | $22.18 | $22.67 |
| Total return (%) (r)(s)(t)(x) | 12.13(n) | (11.16) | 40.52 | (7.55) | 3.17 | 7.59 |
| Ratios (%) (to average net assets) and Supplemental data: | ||||||
| Expenses before expense reductions | 1.75(a) | 1.75 | 1.77 | 1.81 | 1.83 | 1.83 |
| Expenses after expense reductions | 1.74(a) | 1.74 | 1.76 | 1.80 | 1.81 | 1.82 |
| Net investment income (loss) | 0.85(a) | 0.13 | (0.04) | 0.28 | 0.30 | 0.02 |
| Portfolio turnover | 10(n) | 17 | 19 | 19 | 27 | 26 |
| Net assets at end of period (000 omitted) | $6,736 | $7,309 | $11,291 | $10,677 | $16,670 | $19,816 |
See Notes to Financial Statements
16
Financial Highlights – continued
| Class C | Six months ended | Year ended | ||||
| 3/31/23 (unaudited) | 9/30/22 | 9/30/21 | 9/30/20 | 9/30/19 | 9/30/18 | |
| Net asset value, beginning of period | $23.78 | $28.24 | $20.12 | $22.09 | $22.57 | $21.65 |
| Income (loss) from investment operations | ||||||
| Net investment income (loss) (d) | $0.11 | $0.05 | $(0.00)(w) | $0.06 | $0.06 | $0.00(w) |
| Net realized and unrealized gain (loss) | 2.79 | (2.93) | 8.15 | (1.69) | 0.51 | 1.60 |
| Total from investment operations | $2.90 | $(2.88) | $8.15 | $(1.63) | $0.57 | $1.60 |
| Less distributions declared to shareholders | ||||||
| From net investment income | $(0.17) | $(0.07) | $(0.03) | $(0.06) | $— | $— |
| From net realized gain | (1.04) | (1.51) | — | (0.28) | (1.05) | (0.68) |
| Total distributions declared to shareholders | $(1.21) | $(1.58) | $(0.03) | $(0.34) | $(1.05) | $(0.68) |
| Net asset value, end of period (x) | $25.47 | $23.78 | $28.24 | $20.12 | $22.09 | $22.57 |
| Total return (%) (r)(s)(t)(x) | 12.12(n) | (11.16) | 40.55 | (7.58) | 3.22 | 7.53 |
| Ratios (%) (to average net assets) and Supplemental data: | ||||||
| Expenses before expense reductions | 1.75(a) | 1.75 | 1.77 | 1.81 | 1.83 | 1.83 |
| Expenses after expense reductions | 1.74(a) | 1.74 | 1.76 | 1.80 | 1.82 | 1.82 |
| Net investment income (loss) | 0.86(a) | 0.17 | (0.02) | 0.28 | 0.30 | 0.01 |
| Portfolio turnover | 10(n) | 17 | 19 | 19 | 27 | 26 |
| Net assets at end of period (000 omitted) | $90,708 | $85,829 | $108,116 | $87,086 | $119,427 | $133,345 |
See Notes to Financial Statements
17
Financial Highlights – continued
| Class I | Six months ended | Year ended | ||||
| 3/31/23 (unaudited) | 9/30/22 | 9/30/21 | 9/30/20 | 9/30/19 | 9/30/18 | |
| Net asset value, beginning of period | $26.38 | $31.13 | $22.16 | $24.27 | $24.72 | $23.56 |
| Income (loss) from investment operations | ||||||
| Net investment income (loss) (d) | $0.27 | $0.38 | $0.30 | $0.29 | $0.30 | $0.25 |
| Net realized and unrealized gain (loss) | 3.08 | (3.25) | 8.93 | (1.84) | 0.54 | 1.75 |
| Total from investment operations | $3.35 | $(2.87) | $9.23 | $(1.55) | $0.84 | $2.00 |
| Less distributions declared to shareholders | ||||||
| From net investment income | $(0.45) | $(0.37) | $(0.26) | $(0.28) | $(0.24) | $(0.16) |
| From net realized gain | (1.04) | (1.51) | — | (0.28) | (1.05) | (0.68) |
| Total distributions declared to shareholders | $(1.49) | $(1.88) | $(0.26) | $(0.56) | $(1.29) | $(0.84) |
| Net asset value, end of period (x) | $28.24 | $26.38 | $31.13 | $22.16 | $24.27 | $24.72 |
| Total return (%) (r)(s)(t)(x) | 12.67(n) | (10.23) | 41.90 | (6.64) | 4.24 | 8.66 |
| Ratios (%) (to average net assets) and Supplemental data: | ||||||
| Expenses before expense reductions | 0.75(a) | 0.75 | 0.77 | 0.82 | 0.83 | 0.83 |
| Expenses after expense reductions | 0.74(a) | 0.74 | 0.76 | 0.81 | 0.82 | 0.82 |
| Net investment income (loss) | 1.86(a) | 1.25 | 1.03 | 1.28 | 1.31 | 1.04 |
| Portfolio turnover | 10(n) | 17 | 19 | 19 | 27 | 26 |
| Net assets at end of period (000 omitted) | $3,724,884 | $3,383,518 | $3,056,701 | $1,651,249 | $1,772,356 | $1,389,171 |
See Notes to Financial Statements
18
Financial Highlights – continued
| Class R1 | Six months ended | Year ended | ||||
| 3/31/23 (unaudited) | 9/30/22 | 9/30/21 | 9/30/20 | 9/30/19 | 9/30/18 | |
| Net asset value, beginning of period | $23.28 | $27.68 | $19.74 | $21.69 | $22.22 | $21.31 |
| Income (loss) from investment operations | ||||||
| Net investment income (loss) (d) | $0.11 | $0.05 | $(0.00)(w) | $0.06 | $0.06 | $0.01 |
| Net realized and unrealized gain (loss) | 2.71 | (2.85) | 7.98 | (1.66) | 0.49 | 1.58 |
| Total from investment operations | $2.82 | $(2.80) | $7.98 | $(1.60) | $0.55 | $1.59 |
| Less distributions declared to shareholders | ||||||
| From net investment income | $(0.18) | $(0.09) | $(0.04) | $(0.07) | $(0.03) | $— |
| From net realized gain | (1.04) | (1.51) | — | (0.28) | (1.05) | (0.68) |
| Total distributions declared to shareholders | $(1.22) | $(1.60) | $(0.04) | $(0.35) | $(1.08) | $(0.68) |
| Net asset value, end of period (x) | $24.88 | $23.28 | $27.68 | $19.74 | $21.69 | $22.22 |
| Total return (%) (r)(s)(t)(x) | 12.07(n) | (11.11) | 40.46 | (7.56) | 3.20 | 7.60 |
| Ratios (%) (to average net assets) and Supplemental data: | ||||||
| Expenses before expense reductions | 1.75(a) | 1.75 | 1.77 | 1.82 | 1.83 | 1.83 |
| Expenses after expense reductions | 1.74(a) | 1.74 | 1.76 | 1.80 | 1.82 | 1.82 |
| Net investment income (loss) | 0.85(a) | 0.19 | (0.00)(w) | 0.28 | 0.30 | 0.03 |
| Portfolio turnover | 10(n) | 17 | 19 | 19 | 27 | 26 |
| Net assets at end of period (000 omitted) | $12,943 | $11,824 | $13,789 | $10,476 | $13,348 | $13,538 |
See Notes to Financial Statements
19
Financial Highlights – continued
| Class R2 | Six months ended | Year ended | ||||
| 3/31/23 (unaudited) | 9/30/22 | 9/30/21 | 9/30/20 | 9/30/19 | 9/30/18 | |
| Net asset value, beginning of period | $24.92 | $29.51 | $21.01 | $23.04 | $23.49 | $22.42 |
| Income (loss) from investment operations | ||||||
| Net investment income (loss) (d) | $0.18 | $0.19 | $0.13 | $0.17 | $0.17 | $0.11 |
| Net realized and unrealized gain (loss) | 2.92 | (3.06) | 8.51 | (1.75) | 0.52 | 1.67 |
| Total from investment operations | $3.10 | $(2.87) | $8.64 | $(1.58) | $0.69 | $1.78 |
| Less distributions declared to shareholders | ||||||
| From net investment income | $(0.30) | $(0.21) | $(0.14) | $(0.17) | $(0.09) | $(0.03) |
| From net realized gain | (1.04) | (1.51) | — | (0.28) | (1.05) | (0.68) |
| Total distributions declared to shareholders | $(1.34) | $(1.72) | $(0.14) | $(0.45) | $(1.14) | $(0.71) |
| Net asset value, end of period (x) | $26.68 | $24.92 | $29.51 | $21.01 | $23.04 | $23.49 |
| Total return (%) (r)(s)(t)(x) | 12.41(n) | (10.72) | 41.24 | (7.08) | 3.70 | 8.11 |
| Ratios (%) (to average net assets) and Supplemental data: | ||||||
| Expenses before expense reductions | 1.25(a) | 1.25 | 1.27 | 1.32 | 1.33 | 1.33 |
| Expenses after expense reductions | 1.24(a) | 1.24 | 1.26 | 1.30 | 1.31 | 1.32 |
| Net investment income (loss) | 1.36(a) | 0.66 | 0.48 | 0.78 | 0.80 | 0.50 |
| Portfolio turnover | 10(n) | 17 | 19 | 19 | 27 | 26 |
| Net assets at end of period (000 omitted) | $69,598 | $64,335 | $83,472 | $66,086 | $82,671 | $97,398 |
See Notes to Financial Statements
20
Financial Highlights – continued
| Class R3 | Six months ended | Year ended | ||||
| 3/31/23 (unaudited) | 9/30/22 | 9/30/21 | 9/30/20 | 9/30/19 | 9/30/18 | |
| Net asset value, beginning of period | $25.50 | $30.15 | $21.48 | $23.54 | $24.01 | $22.91 |
| Income (loss) from investment operations | ||||||
| Net investment income (loss) (d) | $0.22 | $0.28 | $0.21 | $0.23 | $0.23 | $0.18 |
| Net realized and unrealized gain (loss) | 2.98 | (3.13) | 8.67 | (1.78) | 0.53 | 1.70 |
| Total from investment operations | $3.20 | $(2.85) | $8.88 | $(1.55) | $0.76 | $1.88 |
| Less distributions declared to shareholders | ||||||
| From net investment income | $(0.39) | $(0.29) | $(0.21) | $(0.23) | $(0.18) | $(0.10) |
| From net realized gain | (1.04) | (1.51) | — | (0.28) | (1.05) | (0.68) |
| Total distributions declared to shareholders | $(1.43) | $(1.80) | $(0.21) | $(0.51) | $(1.23) | $(0.78) |
| Net asset value, end of period (x) | $27.27 | $25.50 | $30.15 | $21.48 | $23.54 | $24.01 |
| Total return (%) (r)(s)(t)(x) | 12.51(n) | (10.46) | 41.55 | (6.85) | 3.95 | 8.37 |
| Ratios (%) (to average net assets) and Supplemental data: | ||||||
| Expenses before expense reductions | 1.00(a) | 1.00 | 1.02 | 1.07 | 1.08 | 1.08 |
| Expenses after expense reductions | 0.99(a) | 0.99 | 1.01 | 1.06 | 1.07 | 1.07 |
| Net investment income (loss) | 1.60(a) | 0.96 | 0.75 | 1.04 | 1.05 | 0.77 |
| Portfolio turnover | 10(n) | 17 | 19 | 19 | 27 | 26 |
| Net assets at end of period (000 omitted) | $771,828 | $574,212 | $606,828 | $405,406 | $405,908 | $401,520 |
See Notes to Financial Statements
21
Financial Highlights – continued
| Class R4 | Six months ended | Year ended | ||||
| 3/31/23 (unaudited) | 9/30/22 | 9/30/21 | 9/30/20 | 9/30/19 | 9/30/18 | |
| Net asset value, beginning of period | $25.78 | $30.47 | $21.69 | $23.77 | $24.24 | $23.11 |
| Income (loss) from investment operations | ||||||
| Net investment income (loss) (d) | $0.25 | $0.36 | $0.28 | $0.28 | $0.29 | $0.24 |
| Net realized and unrealized gain (loss) | 3.02 | (3.18) | 8.76 | (1.79) | 0.53 | 1.72 |
| Total from investment operations | $3.27 | $(2.82) | $9.04 | $(1.51) | $0.82 | $1.96 |
| Less distributions declared to shareholders | ||||||
| From net investment income | $(0.45) | $(0.36) | $(0.26) | $(0.29) | $(0.24) | $(0.15) |
| From net realized gain | (1.04) | (1.51) | — | (0.28) | (1.05) | (0.68) |
| Total distributions declared to shareholders | $(1.49) | $(1.87) | $(0.26) | $(0.57) | $(1.29) | $(0.83) |
| Net asset value, end of period (x) | $27.56 | $25.78 | $30.47 | $21.69 | $23.77 | $24.24 |
| Total return (%) (r)(s)(t)(x) | 12.65(n) | (10.26) | 41.92 | (6.64) | 4.23 | 8.69 |
| Ratios (%) (to average net assets) and Supplemental data: | ||||||
| Expenses before expense reductions | 0.75(a) | 0.75 | 0.77 | 0.82 | 0.83 | 0.83 |
| Expenses after expense reductions | 0.74(a) | 0.74 | 0.76 | 0.81 | 0.82 | 0.82 |
| Net investment income (loss) | 1.80(a) | 1.19 | 1.00 | 1.29 | 1.29 | 1.02 |
| Portfolio turnover | 10(n) | 17 | 19 | 19 | 27 | 26 |
| Net assets at end of period (000 omitted) | $367,106 | $533,949 | $607,641 | $437,597 | $373,705 | $428,566 |
See Notes to Financial Statements
22
Financial Highlights – continued
| Class R6 | Six months ended | Year ended | ||||
| 3/31/23 (unaudited) | 9/30/22 | 9/30/21 | 9/30/20 | 9/30/19 | 9/30/18 | |
| Net asset value, beginning of period | $26.44 | $31.20 | $22.20 | $24.31 | $24.76 | $23.60 |
| Income (loss) from investment operations | ||||||
| Net investment income (loss) (d) | $0.28 | $0.40 | $0.33 | $0.32 | $0.33 | $0.28 |
| Net realized and unrealized gain (loss) | 3.09 | (3.25) | 8.96 | (1.84) | 0.54 | 1.75 |
| Total from investment operations | $3.37 | $(2.85) | $9.29 | $(1.52) | $0.87 | $2.03 |
| Less distributions declared to shareholders | ||||||
| From net investment income | $(0.49) | $(0.40) | $(0.29) | $(0.31) | $(0.27) | $(0.19) |
| From net realized gain | (1.04) | (1.51) | — | (0.28) | (1.05) | (0.68) |
| Total distributions declared to shareholders | $(1.53) | $(1.91) | $(0.29) | $(0.59) | $(1.32) | $(0.87) |
| Net asset value, end of period (x) | $28.28 | $26.44 | $31.20 | $22.20 | $24.31 | $24.76 |
| Total return (%) (r)(s)(t)(x) | 12.70(n) | (10.14) | 42.14 | (6.52) | 4.39 | 8.80 |
| Ratios (%) (to average net assets) and Supplemental data: | ||||||
| Expenses before expense reductions | 0.63(a) | 0.63 | 0.64 | 0.68 | 0.68 | 0.69 |
| Expenses after expense reductions | 0.62(a) | 0.62 | 0.63 | 0.66 | 0.68 | 0.68 |
| Net investment income (loss) | 1.97(a) | 1.31 | 1.13 | 1.44 | 1.45 | 1.18 |
| Portfolio turnover | 10(n) | 17 | 19 | 19 | 27 | 26 |
| Net assets at end of period (000 omitted) | $8,344,932 | $7,498,359 | $8,659,522 | $6,048,320 | $5,084,448 | $4,127,556 |
| (a) | Annualized. |
| (d) | Per share data is based on average shares outstanding. |
| (n) | Not annualized. |
| (r) | Certain expenses have been reduced without which performance would have been lower. |
| (s) | From time to time the fund may receive proceeds from litigation settlements, without which performance would be lower. |
| (t) | Total returns do not include any applicable sales charges. |
| (w) | Per share amount was less than $0.01 and total return or ratio was less than 0.01%, as applicable. |
| (x) | The net asset values and total returns have been calculated on net assets which include adjustments made in accordance with U.S. generally accepted accounting principles required at period end for financial reporting purposes. |
See Notes to Financial Statements
23
Notes to Financial Statements
(unaudited)
(1) Business and
Organization
MFS Mid Cap Value Fund (the fund) is
a diversified series of MFS Series Trust XI (the trust). The trust is organized as a Massachusetts business trust and is registered under the Investment Company Act of 1940, as amended, as an open-end management
investment company.
The fund is an investment company
and accordingly follows the investment company accounting and reporting guidance of the Financial Accounting Standards Board (FASB) Accounting Standards Codification Topic 946 Financial Services - Investment
Companies.
(2) Significant Accounting
Policies
General — The preparation of financial statements in conformity with U.S. generally accepted accounting principles requires management to make estimates and assumptions that affect the
reported amounts of assets and liabilities, and disclosure of contingent assets and liabilities at the date of the financial statements and the reported amounts of increases and decreases in net assets from operations
during the reporting period. Actual results could differ from those estimates. In the preparation of these financial statements, management has evaluated subsequent events occurring after the date of the fund’s
Statement of Assets and Liabilities through the date that the financial statements were issued.
Balance Sheet Offsetting — The fund's accounting policy with respect to balance sheet offsetting is that, absent an event of default by the counterparty or a termination of the agreement, the International
Swaps and Derivatives Association (ISDA) Master Agreement, or similar agreement, does not result in an offset of reported amounts of financial assets and financial liabilities in the Statement of Assets and
Liabilities across transactions between the fund and the applicable counterparty. The fund's right to setoff may be restricted or prohibited by the bankruptcy or insolvency laws of the particular jurisdiction to which
a specific master netting agreement counterparty is subject. Balance sheet offsetting disclosures, to the extent applicable to the fund, have been included in the fund’s Significant Accounting Policies note
under the captions for each of the fund’s in-scope financial instruments and transactions.
Investment Valuations — Subject to its oversight, the fund's Board of Trustees has delegated primary responsibility for determining or causing to be determined the value of the fund’s investments to MFS as
the fund's adviser, pursuant to the fund’s valuation policy and procedures which have been adopted by the adviser and approved by the Board. In accordance with Rule 2a-5 under the Investment Company Act of
1940, the Board of Trustees designated the adviser as the “valuation designee” of the fund. If the adviser, as valuation designee, determines that reliable market quotations are not readily available for
an investment, the investment is valued at fair value as determined in good faith by the adviser in accordance with the adviser’s fair valuation policy and procedures.
Under the fund's valuation policy
and procedures, equity securities, including restricted equity securities, are generally valued at the last sale or official closing price on their primary market or exchange as provided by a third-party pricing
service. Equity securities, for which there were no sales reported that day, are generally valued at the last quoted daily bid quotation on their primary market or exchange as provided by a
24
Notes to Financial
Statements (unaudited) - continued
third-party pricing service. Short-term instruments
with a maturity at issuance of 60 days or less may be valued at amortized cost, which approximates market value.
Open-end investment companies are generally valued
at net asset value per share. The values of foreign securities and other assets and liabilities expressed in foreign currencies are converted to U.S. dollars using the mean of bid and asked prices for rates provided
by a third-party pricing service.
Under the fund’s valuation
policy and procedures, market quotations are not considered to be readily available for debt instruments, floating rate loans, and many types of derivatives. These investments are generally valued at fair value based
on information from third-party pricing services or otherwise determined by the adviser in accordance with the adviser’s fair valuation policy and procedures. Securities and other assets generally valued on the
basis of information from a third-party pricing service may also be valued at a broker/dealer bid quotation. In determining values, third-party pricing services can utilize both transaction data and market information
such as yield, quality, coupon rate, maturity, type of issue, trading characteristics, spreads and other market data. An investment may also be valued at fair value if the adviser determines that the
investment’s value has been materially affected by events occurring after the close of the exchange or market on which the investment is principally traded (such as foreign exchange or market) and prior to the
determination of the fund’s net asset value, or after the halt of trading of a specific security where trading does not resume prior to the close of the exchange or market on which the security is principally
traded. Events that occur after foreign markets close (such as developments in foreign markets and significant movements in the U.S. markets) and prior to the determination of the fund’s net asset value may be
deemed to have a material effect on the value of securities traded in foreign markets. Accordingly, the fund’s foreign equity securities may often be valued at fair value. The adviser generally relies on
third-party pricing services or other information (such as the correlation with price movements of similar securities in the same or other markets; the type, cost and investment characteristics of the security; the
business and financial condition of the issuer; and trading and other market data) to assist in determining whether to fair value and at what value to fair value an investment. The value of an investment for purposes
of calculating the fund’s net asset value can differ depending on the source and method used to determine value. When fair valuation is used, the value of an investment used to determine the fund’s net
asset value may differ from quoted or published prices for the same investment. There can be no assurance that the fund could obtain the fair value assigned to an investment if it were to sell the investment at the
same time at which the fund determines its net asset value per share.
Various inputs are used in
determining the value of the fund's assets or liabilities. These inputs are categorized into three broad levels. In certain cases, the inputs used to measure fair value may fall into different levels of the fair value
hierarchy. In such cases, an investment's level within the fair value hierarchy is based on the lowest level of input that is significant to the fair value measurement. The fund's assessment of the significance of a
particular input to the fair value measurement in its entirety requires judgment, and considers factors specific to the investment. Level 1 includes unadjusted quoted prices in active markets for identical assets or
liabilities. Level 2 includes other significant observable market-based inputs (including quoted prices for similar securities, interest rates, prepayment speed, and credit risk). Level 3 includes significant
25
Notes to Financial
Statements (unaudited) - continued
unobservable inputs, which may include the
adviser's own assumptions in determining the fair value of investments. The following is a summary of the levels used as of March 31, 2023 in valuing the fund's assets and liabilities:
| Financial Instruments | Level 1 | Level 2 | Level 3 | Total |
| Equity Securities | $14,845,133,119 | $— | $— | $14,845,133,119 |
| Mutual Funds | 262,187,651 | — | — | 262,187,651 |
| Total | $15,107,320,770 | $— | $— | $15,107,320,770 |
For further information regarding
security characteristics, see the Portfolio of Investments.
Foreign Currency Translation — Purchases and sales of foreign investments, income, and expenses are converted into U.S. dollars based upon currency exchange rates prevailing on the respective dates of such
transactions or on the reporting date for foreign denominated receivables and payables. Gains and losses attributable to foreign currency exchange rates on sales of securities are recorded for financial statement
purposes as net realized gains and losses on investments. Gains and losses attributable to foreign exchange rate movements on receivables, payables, income and expenses are recorded for financial statement purposes as
foreign currency transaction gains and losses. That portion of both realized and unrealized gains and losses on investments that results from fluctuations in foreign currency exchange rates is not separately
disclosed.
Security Loans — Under its Securities Lending Agency Agreement with the fund, State Street Bank and Trust Company, as lending agent, loans the securities of the fund to certain qualified
institutions (the “Borrowers”) approved by the fund. Security loans can be terminated at the discretion of either the lending agent or the fund and the related securities must be returned within the
earlier of the standard trade settlement period for such securities or within three business days. The loans are collateralized by cash and/or U.S. Treasury and federal agency obligations in an amount typically at
least equal to the market value of the securities loaned. On loans collateralized by cash, the cash collateral is invested in a money market fund. The market value of the loaned securities is determined at the close
of business of the fund and any additional required collateral is delivered to the fund on the next business day. The lending agent provides the fund with indemnification against Borrower default. In the event of
Borrower default, the lending agent will, for the benefit of the fund, either purchase securities identical to those loaned or, when such purchase is commercially impracticable, pay the fund the market value of the
loaned securities. In return, the lending agent assumes the fund's rights to the related collateral. If the collateral value is less than the cost to purchase identical securities, the lending agent is responsible for
the shortfall, but only to the extent that such shortfall is not due to a decline in collateral value resulting from collateral reinvestment for which the fund bears the risk of loss. A portion of the income generated
upon investment of the collateral is remitted to the Borrowers, and the remainder is allocated between the fund and the lending agent. On loans collateralized by U.S. Treasury and/or federal agency obligations, a fee
is received from the Borrower, and is allocated between the fund and the lending agent. Income from securities lending is separately reported in the Statement of Operations. The dividend and interest income earned on
the securities loaned is accounted for in the same manner as other dividend and interest income. At March 31, 2023, there were no securities on loan or collateral outstanding.
26
Notes to Financial
Statements (unaudited) - continued
Indemnifications — Under the fund's organizational documents, its officers and Trustees may be indemnified against certain liabilities and expenses arising out of the performance of their duties to
the fund. Additionally, in the normal course of business, the fund enters into agreements with service providers that may contain indemnification clauses. The fund's maximum exposure under these agreements is unknown
as this would involve future claims that may be made against the fund that have not yet occurred.
Investment Transactions and
Income — Investment transactions are recorded on the trade date. Dividends received in cash are recorded on the ex-dividend date. Certain dividends from foreign securities will be recorded when the fund is informed of the dividend if such information is
obtained subsequent to the ex-dividend date. Dividend payments received in additional securities are recorded on the ex-dividend date in an amount equal to the value of the security on such date. In determining the net gain or loss on securities sold, the cost of securities is determined on the identified cost basis.
The fund may receive proceeds from
litigation settlements. Any proceeds received from litigation involving portfolio holdings are reflected in the Statement of Operations in realized gain/loss if the security has been disposed of by the fund or in
unrealized gain/loss if the security is still held by the fund. Any other proceeds from litigation not related to portfolio holdings are reflected as other income in the Statement of Operations.
Tax Matters and Distributions — The fund intends to qualify as a regulated investment company, as defined under Subchapter M of the Internal Revenue Code, and to distribute all of its taxable income, including
realized capital gains. As a result, no provision for federal income tax is required. The fund’s federal tax returns, when filed, will remain subject to examination by the Internal Revenue Service for a three
year period. Management has analyzed the fund’s tax positions taken on federal and state tax returns for all open tax years and does not believe that there are any uncertain tax positions that require
recognition of a tax liability. Foreign taxes, if any, have been accrued by the fund in the accompanying financial statements in accordance with the applicable foreign tax law. Foreign income taxes may be withheld by
certain countries in which the fund invests. Additionally, capital gains realized by the fund on securities issued in or by certain foreign countries may be subject to capital gains tax imposed by those
countries.
Distributions to shareholders are
recorded on the ex-dividend date. Income and capital gain distributions are determined in accordance with income tax regulations, which may differ from U.S. generally accepted accounting principles. Certain capital
accounts in the financial statements are periodically adjusted for permanent differences in order to reflect their tax character. These adjustments have no impact on net assets or net asset value per share. Temporary
differences which arise from recognizing certain items of income, expense, gain or loss in different periods for financial statement and tax purposes will reverse at some time in the future.
Book/tax differences primarily
relate to passive foreign investment companies, wash sale loss deferrals, treating a portion of the proceeds from redemptions as a distribution for tax purposes, and redemptions in-kind.
27
Notes to Financial
Statements (unaudited) - continued
The tax character of distributions
made during the current period will be determined at fiscal year end. The tax character of distributions declared to shareholders for the last fiscal year is as follows:
| Year ended 9/30/22 | |
| Ordinary income (including any short-term capital gains) | $329,136,352 |
| Long-term capital gains | 571,133,658 |
| Total distributions | $900,270,010 |
The federal tax cost and the tax
basis components of distributable earnings were as follows:
| As of 3/31/23 | |
| Cost of investments | $12,030,949,623 |
| Gross appreciation | 3,640,100,077 |
| Gross depreciation | (563,728,930) |
| Net unrealized appreciation (depreciation) | $3,076,371,147 |
| As of 9/30/22 | |
| Undistributed ordinary income | 172,161,831 |
| Undistributed long-term capital gain | 484,103,291 |
| Other temporary differences | (34,806) |
| Net unrealized appreciation (depreciation) | 1,500,827,855 |
The aggregate cost above includes
prior fiscal year end tax adjustments, if applicable.
Multiple Classes of Shares of
Beneficial Interest — The fund offers multiple classes of shares, which differ in their respective distribution, service, and program manager fees. The fund's income, realized and unrealized gain (loss),
and common expenses are allocated to shareholders based on the daily net assets of each class. Dividends are declared separately for each class. Differences in per share dividend rates are generally due to differences
in separate class expenses. Class B and Class C shares will convert to Class A shares approximately eight years after purchase. Effective March 21, 2022, all Class 529B and Class 529C shares were converted into Class
529A shares. Effective
28
Notes to Financial
Statements (unaudited) - continued
May 20, 2022, all Class 529A shares were redeemed.
The fund’s distributions declared to shareholders as reported in the Statements of Changes in Net Assets are presented by class as follows:
| Six months ended 3/31/23 | Year ended 9/30/22 | ||
| Class A | $87,214,524 | $96,432,800 | |
| Class B | 334,894 | 598,337 | |
| Class C | 4,230,868 | 5,990,286 | |
| Class I | 189,526,069 | 186,285,313 | |
| Class R1 | 622,469 | 786,024 | |
| Class R2 | 3,416,487 | 4,613,017 | |
| Class R3 | 34,689,929 | 35,510,416 | |
| Class R4 | 31,142,709 | 36,974,321 | |
| Class R6 | 432,870,508 | 532,361,947 | |
| Class 529A | — | 634,419 | |
| Class 529B | — | 8,727 | |
| Class 529C | — | 74,403 | |
| Total | $784,048,457 | $900,270,010 |
(3) Transactions with
Affiliates
Investment Adviser — The fund has an investment advisory agreement with MFS to provide overall investment management and related administrative services and facilities to the fund. The management fee is computed daily and paid monthly at the following annual rates based on the fund's average daily net assets:
| Up to $1 billion | 0.75% |
| In excess of $1 billion and up to $2.5 billion | 0.70% |
| In excess of $2.5 billion and up to $5 billion | 0.65% |
| In excess of $5 billion and up to $10 billion | 0.60% |
| In excess of $10 billion and up to $20 billion | 0.55% |
| In excess of $20 billion | 0.50% |
MFS has agreed in writing to reduce
its management fee by a specified amount if certain MFS mutual fund assets exceed thresholds agreed to by MFS and the fund's Board of Trustees. MFS has also agreed in writing to waive at least 0.01% of its management
fee as part of this agreement. The agreement to waive at least 0.01% of the management fee will continue until modified by the fund's Board of Trustees, but such agreement will continue at least until January 31,
2024. For the six months ended March 31, 2023, this management fee reduction amounted to $1,005,858, which is included in the reduction of total expenses in the Statement of Operations. The management fee incurred for
the six months ended March 31, 2023 was equivalent to an annual effective rate of 0.60% of the fund's average daily net assets.
Distributor — MFS Fund Distributors, Inc. (MFD), a wholly-owned subsidiary of MFS, as distributor, received $157,228 for the six months ended March 31, 2023, as its portion of the initial sales
charge on sales of Class A shares of the fund.
The Board of Trustees has adopted a
distribution plan for certain share classes pursuant to Rule 12b-1 of the Investment Company Act of 1940.
29
Notes to Financial
Statements (unaudited) - continued
The fund's distribution plan
provides that the fund will pay MFD for services provided by MFD and financial intermediaries in connection with the distribution and servicing of certain share classes. One component of the plan is a distribution fee
paid to MFD and another component of the plan is a service fee paid to MFD. MFD may subsequently pay all, or a portion, of the distribution and/or service fees to financial intermediaries.
Distribution Plan Fee Table:
| Distribution Fee Rate (d) | Service Fee Rate (d) | Total Distribution Plan (d) | Annual Effective Rate (e) | Distribution and Service Fee | |
| Class A | — | 0.25% | 0.25% | 0.25% | $ 2,196,390 |
| Class B | 0.75% | 0.25% | 1.00% | 1.00% | 37,686 |
| Class C | 0.75% | 0.25% | 1.00% | 1.00% | 467,023 |
| Class R1 | 0.75% | 0.25% | 1.00% | 1.00% | 65,539 |
| Class R2 | 0.25% | 0.25% | 0.50% | 0.50% | 176,726 |
| Class R3 | — | 0.25% | 0.25% | 0.25% | 852,528 |
| Total Distribution and Service Fees | $3,795,892 |
| (d) | In accordance with the distribution plan for certain classes, the fund pays distribution and/or service fees equal to these annual percentage rates of each class’s average daily net assets. The distribution and service fee rates disclosed by class represent the current rates in effect at the end of the reporting period. Any rate changes, if applicable, are detailed below. |
| (e) | The annual effective rates represent actual fees incurred under the distribution plan for the six months ended March 31, 2023 based on each class's average daily net assets. MFD has voluntarily agreed to rebate a portion of each class's 0.25% service fee attributable to accounts for which there is no financial intermediary specified on the account except for accounts attributable to MFS or its affiliates' seed money. For the six months ended March 31, 2023, this rebate amounted to $78, $20, and $68 for Class A, Class C, and Class R2 shares, respectively, and is included in the reduction of total expenses in the Statement of Operations. |
Certain Class A shares are subject
to a contingent deferred sales charge (CDSC) in the event of a shareholder redemption within 18 months of purchase. Class B shares are subject to a CDSC in the event of a shareholder redemption within six years of
purchase. Class C shares are subject to a CDSC in the event of a shareholder redemption within 12 months of purchase. All contingent deferred sales charges are paid to MFD and during the six months ended March 31,
2023, were as follows:
| Amount | |
| Class A | $24,031 |
| Class B | 1,042 |
| Class C | 2,890 |
Shareholder Servicing Agent — MFS Service Center, Inc. (MFSC), a wholly-owned subsidiary of MFS, receives a fee from the fund for its services as shareholder servicing agent calculated as a percentage of the
average daily net assets of the fund as determined periodically under the supervision of the fund's Board of Trustees. For the six months ended March 31, 2023, the fee was $190,063, which equated to 0.0025% annually
of the fund's average daily net assets. MFSC also receives reimbursement from the fund for out-of-pocket expenses, sub-accounting and other shareholder servicing
30
Notes to Financial
Statements (unaudited) - continued
costs which may be paid to affiliated and
unaffiliated service providers. Class R6 shares do not incur sub-accounting fees. For the six months ended March 31, 2023, these out-of-pocket expenses, sub-accounting and other shareholder servicing costs amounted to
$4,211,926.
Administrator — MFS provides certain financial, legal, shareholder communications, compliance, and other administrative services to the fund. Under an administrative services agreement, the fund
reimburses MFS the costs incurred to provide these services. The fund is charged an annual fixed amount of $17,500 plus a fee based on average daily net assets. The administrative services fee incurred for the six
months ended March 31, 2023 was equivalent to an annual effective rate of 0.0042% of the fund's average daily net assets.
Trustees’ and Officers’
Compensation — The fund pays compensation to independent Trustees in the form of a retainer, attendance fees, and additional compensation to Board and Committee chairpersons. The fund does not
pay compensation directly to Trustees or officers of the fund who are also officers of the investment adviser, all of whom receive remuneration from MFS for their services to the fund. Certain officers and Trustees of
the fund are officers or directors of MFS, MFD, and MFSC.
Other — The fund invests in the MFS Institutional Money Market Portfolio which is managed by MFS and seeks current income consistent with preservation of capital and liquidity. This money
market fund does not pay a management fee to MFS but does incur investment and operating costs.
The fund is permitted to engage in
purchase and sale transactions with funds and accounts for which MFS serves as investment adviser or sub-adviser (“cross-trades”) pursuant to a policy adopted by the Board of Trustees. This policy has been
designed to ensure that cross-trades conducted by the fund comply with Rule 17a-7 under the Investment Company Act of 1940. During the six months ended March 31, 2023, the fund engaged in sale transactions pursuant to
this policy, which amounted to $2,651,120. The sales transactions resulted in net realized gains (losses) of $576,069.
The adviser has voluntarily
undertaken to reimburse the fund from its own resources on a quarterly basis for the cost of investment research embedded in the cost of the fund’s securities trades. This agreement may be rescinded at any time.
For the six months ended March 31, 2023, this reimbursement amounted to $325,681, which is included in “Other” income in the Statement of Operations.
(4) Portfolio Securities
For the six months ended March 31,
2023, purchases and sales of investments, other than in-kind transactions and short-term obligations, aggregated $1,587,627,838 and $1,520,524,957, respectively.
31
Notes to Financial
Statements (unaudited) - continued
(5) Shares of Beneficial
Interest
The fund's Declaration of Trust
permits the Trustees to issue an unlimited number of full and fractional shares of beneficial interest. Transactions in fund shares were as follows:
| Six months ended 3/31/23 | Year ended 9/30/22 | ||||
| Shares | Amount | Shares | Amount | ||
| Shares sold | |||||
| Class A | 5,135,757 | $143,342,199 | 13,262,109 | $397,668,703 | |
| Class B | 1,317 | 33,675 | 14,456 | 408,282 | |
| Class C | 348,010 | 9,092,039 | 654,393 | 18,492,710 | |
| Class I | 19,289,677 | 556,200,248 | 57,862,646 | 1,784,249,282 | |
| Class R1 | 59,797 | 1,514,788 | 153,103 | 4,169,846 | |
| Class R2 | 280,184 | 7,636,109 | 624,891 | 18,183,127 | |
| Class R3 | 7,337,996 | 203,703,587 | 8,184,812 | 240,440,547 | |
| Class R4 | 2,011,891 | 56,706,586 | 5,984,537 | 180,219,192 | |
| Class R6 | 28,407,523 | 818,546,700 | 63,203,019 | 1,959,482,403 | |
| Class 529A | — | — | 89,111 | 2,682,132 | |
| Class 529B | — | — | 548 | 15,502 | |
| Class 529C | — | — | 1,702 | 47,968 | |
| 62,872,152 | $1,796,775,931 | 150,035,327 | $4,606,059,694 | ||
| Shares issued to shareholders in reinvestment of distributions | |||||
| Class A | 2,920,265 | $80,745,336 | 2,880,701 | $88,437,532 | |
| Class B | 12,730 | 330,720 | 20,317 | 586,743 | |
| Class C | 154,285 | 3,974,369 | 196,258 | 5,630,643 | |
| Class I | 6,288,821 | 179,042,735 | 5,545,672 | 175,021,411 | |
| Class R1 | 24,740 | 622,469 | 27,992 | 786,024 | |
| Class R2 | 124,378 | 3,350,747 | 151,104 | 4,524,061 | |
| Class R3 | 1,260,535 | 34,689,929 | 1,161,599 | 35,510,092 | |
| Class R4 | 1,088,995 | 30,263,176 | 1,150,255 | 35,485,381 | |
| Class R6 | 13,669,604 | 389,720,411 | 15,220,378 | 480,963,955 | |
| Class 529A | — | — | 20,806 | 626,890 | |
| Class 529B | — | — | 314 | 8,727 | |
| Class 529C | — | — | 2,666 | 74,342 | |
| 25,544,353 | $722,739,892 | 26,378,062 | $827,655,801 | ||
32
Notes to Financial
Statements (unaudited) - continued
| Six months ended 3/31/23 | Year ended 9/30/22 | ||||
| Shares | Amount | Shares | Amount | ||
| Shares reacquired | |||||
| Class A | (4,966,422) | $(138,746,202) | (8,494,822) | $(252,361,400) | |
| Class B | (57,089) | (1,488,339) | (127,126) | (3,532,701) | |
| Class C | (549,336) | (14,184,805) | (1,070,998) | (29,797,434) | |
| Class I | (21,920,556) | (631,782,993) | (33,325,658) | (1,017,551,865) | |
| Class R1 | (72,304) | (1,835,147) | (171,211) | (4,659,529) | |
| Class R2 | (376,870) | (10,184,184) | (1,023,887) | (29,682,054) | |
| Class R3 | (2,815,359) | (78,057,470) | (6,954,151) | (207,995,396) | |
| Class R4 | (10,490,921) | (306,362,354) | (6,370,136) | (190,438,387) | |
| Class R6 | (30,651,549) | (879,488,016) | (72,402,278) | (2,199,726,317) | |
| Class 529A | — | — | (461,957) | (12,889,784) | |
| Class 529B | — | — | (5,327) | (147,283) | |
| Class 529C | — | — | (53,470) | (1,482,629) | |
| (71,900,406) | $(2,062,129,510) | (130,461,021) | $(3,950,264,779) | ||
| Net change | |||||
| Class A | 3,089,600 | $85,341,333 | 7,647,988 | $233,744,835 | |
| Class B | (43,042) | (1,123,944) | (92,353) | (2,537,676) | |
| Class C | (47,041) | (1,118,397) | (220,347) | (5,674,081) | |
| Class I | 3,657,942 | 103,459,990 | 30,082,660 | 941,718,828 | |
| Class R1 | 12,233 | 302,110 | 9,884 | 296,341 | |
| Class R2 | 27,692 | 802,672 | (247,892) | (6,974,866) | |
| Class R3 | 5,783,172 | 160,336,046 | 2,392,260 | 67,955,243 | |
| Class R4 | (7,390,035) | (219,392,592) | 764,656 | 25,266,186 | |
| Class R6 | 11,425,578 | 328,779,095 | 6,021,119 | 240,720,041 | |
| Class 529A | — | — | (352,040) | (9,580,762) | |
| Class 529B | — | — | (4,465) | (123,054) | |
| Class 529C | — | — | (49,102) | (1,360,319) | |
| 16,516,099 | $457,386,313 | 45,952,368 | $1,483,450,716 | ||
The fund is one of several mutual
funds in which certain MFS funds may invest. The MFS funds do not invest in the underlying funds for the purpose of exercising management or control. At the end of the period, the MFS Growth Allocation Fund, the MFS
Moderate Allocation Fund, and the MFS Aggressive Growth Allocation Fund, were the owners of record of approximately 3%, 3%, and 2%, respectively, of the value of outstanding voting shares of the fund. In addition, the
Conservative Allocation Fund, the MFS Lifetime 2025 Fund, the MFS Lifetime 2030 Fund, the MFS Lifetime 2035 Fund, the MFS Lifetime 2040 Fund, the MFS Lifetime 2045 Fund, the MFS Lifetime 2050 Fund, the MFS Lifetime
2055 Fund, the MFS Lifetime 2060 Fund, the MFS Lifetime 2065 Fund, and the MFS Lifetime Income Fund were each the owners of record of less than 1% of the value of outstanding voting shares of the fund.
33
Notes to Financial
Statements (unaudited) - continued
Effective June 1, 2019, purchases of
the fund’s Class B and Class 529B shares were closed to new and existing investors subject to certain exceptions. Effective after the close of business on March 18, 2022, all sales of Class 529B and Class 529C
shares were suspended, and Class 529B and Class 529C shares were converted into Class 529A shares of the fund effective March 21, 2022. Effective after the close of business on May 13, 2022, all sales and redemptions
of Class 529A shares were suspended, and all Class 529A shares were redeemed on May 20, 2022. On March 30, 2023, the fund announced that effective after the close of business on September 29, 2023, purchases of Class
R1 and Class R2 shares will be closed to new eligible investors.
(6) Line of Credit
The fund and certain other funds
managed by MFS participate in a $1.45 billion unsecured committed line of credit of which $1.2 billion is reserved for use by the fund and certain other MFS U.S. funds. The line of credit is provided by a syndicate of
banks under a credit agreement. Borrowings may be made for temporary financing needs. Interest is charged to each fund, based on its borrowings, generally at a rate equal to the highest of 1) Daily Simple SOFR
(Secured Overnight Financing Rate) plus 0.10%, 2) the Federal Funds Effective Rate, or 3) the Overnight Bank Funding Rate, each plus an agreed upon spread. A commitment fee, based on the average daily unused portion
of the committed line of credit, is allocated among the participating funds. The line of credit expires on March 14, 2024 unless extended or renewed. In addition, the fund and other funds managed by MFS have
established unsecured uncommitted borrowing arrangements with certain banks for temporary financing needs. Interest is charged to each fund, based on its borrowings, at rates equal to customary reference rates plus an
agreed upon spread. For the six months ended March 31, 2023, the fund’s commitment fee and interest expense were $38,901 and $0, respectively, and are included in “Miscellaneous” expense in the
Statement of Operations.
(7) Investments in Affiliated
Issuers
An affiliated issuer may be
considered one in which the fund owns 5% or more of the outstanding voting securities, or a company which is under common control. For the purposes of this report, the following were affiliated issuers:
| Affiliated Issuers | Beginning Value | Purchases | Sales Proceeds | Realized Gain (Loss) | Change in Unrealized Appreciation or Depreciation | Ending Value |
| MFS Institutional Money Market Portfolio | $296,114,977 | $698,466,214 | $732,408,682 | $(5,297) | $20,439 | $262,187,651 |
| Affiliated Issuers | Dividend Income | Capital Gain Distributions |
| MFS Institutional Money Market Portfolio | $4,663,384 | $— |
(8) Redemptions In-Kind
On each of the dates listed below,
the fund recorded a redemption in-kind of portfolio securities and cash. The redeeming shareholder generally received a pro rata share of the securities held by the fund. The distribution of such securities generated
a realized
34
Notes to Financial
Statements (unaudited) - continued
gain for the fund, which is included in Net
realized gain (loss) in the Statement of Operations. For tax purposes, no gains or losses were recognized with respect to the portfolio securities redeemed in-kind.
| Redemption In-Kind Date | Portfolio Securities and Cash Amount | Realized Gain (Loss) | ||
| February 1, 2023 | $239,560,333 | $107,563,295 | ||
| February 22, 2023 | $12,309,710 | $5,045,314 | ||
| March 13, 2023 | $22,755,391 | $8,270,859 |
(9) LIBOR Transition
Certain of the fund's investments,
including investments in certain debt instruments and derivatives (if any), as well as borrowings by the fund and certain other contractual arrangements of the fund, may be based on the London Interbank Offered Rate
(“LIBOR”). In 2017, the regulatory authority that oversees financial services firms in the United Kingdom announced plans to transition away from LIBOR by the end of 2021. In March 2021, the administrator
of LIBOR announced the extension of the publication of the more commonly used U.S. dollar LIBOR settings to the end of June 2023. Although the full impacts of the transition away from LIBOR are not fully known, the
transition may result in, among other things, an increase in volatility or illiquidity of the markets for instruments that currently rely on LIBOR to determine interest rates and this could have an adverse impact on
the fund's performance. With respect to the fund's accounting for investments, including investments in certain debt instruments and derivatives, as well as borrowings by the fund and any other contractual
arrangements of the fund that undergo reference rate-related modifications as a result of the transition, management will rely upon the relief provided by FASB Codification Topic 848 – Reference Rate Reform
(Topic 848). The guidance in Topic 848 permits the fund to account for those modified contracts as a continuation of the existing contracts. The situation remains fluid, and management believes, based on best
available information, that the impact of the transition will not be material to the fund.
(10) Subsequent Event
On May 5, 2023, the fund recorded
redemption proceeds for a distribution in-kind of portfolio securities and cash that were valued at $22,122,592. The redeeming shareholder generally receives a pro rata share of the securities held by the fund. The
distribution of such securities generated a realized gain (loss) of $8,808,036 for the fund.
35
Statement Regarding Liquidity Risk Management
Program
The fund has adopted and
implemented a liquidity risk management program (the “Program”) as required by Rule 22e-4 under the Investment Company Act of 1940, as amended. The fund’s Board of Trustees (the “Board”)
has designated MFS as the administrator of the Program. The Program is reasonably designed to assess and manage the liquidity risk of the fund. Liquidity risk is the risk that the fund could not meet requests to
redeem shares issued by the fund without significant dilution of remaining investors' interests.
MFS provided a written report to the
Board for consideration at its March 2023 meeting that addressed the operation of the Program and provided an assessment of the adequacy and effectiveness of the Program during the period from January 1, 2022 to
December 31, 2022 (the “Covered Period”). The report concluded that during the Covered Period the Program had operated effectively in all material respects and had adequately and effectively been
implemented to assess and manage the fund’s liquidity risk. MFS also reported that there were no liquidity events that impacted the fund or its ability to timely meet redemptions without dilution to existing
shareholders during the Covered Period.
There can be no assurance that the
Program will achieve its objectives in the future. Further information on liquidity risk, and other principal risks to which an investment in the fund may be subject, can be found in the prospectus.
36
Proxy Voting Policies and
Information
MFS votes proxies on behalf of the
fund pursuant to proxy voting policies and procedures that are available without charge, upon request, by calling 1-800-225-2606, by visiting mfs.com/proxyvoting, or by visiting the SEC’s Web site at http://www.sec.gov.
Information regarding how the fund
voted proxies relating to portfolio securities during the most recent twelve-month period ended June 30 is available by August 31 of each year without charge by visiting mfs.com/proxyvoting, or by visiting the SEC’s Web site at http://www.sec.gov.
Quarterly Portfolio
Disclosure
The fund files a complete schedule
of portfolio holdings with the SEC for the first and third quarters of each fiscal year as an exhibit to its reports on Form N-PORT. The fund's Form N-PORT reports are available on the SEC's Web site at http://www.sec.gov. A shareholder can obtain the portfolio holdings report for the first and third quarters of the fund's fiscal year at mfs.com/openendfunds by choosing the fund's name and then scrolling to the “Resources” section and clicking on the “Prospectus and Reports” tab.
Further Information
From time to time, MFS may post
important information about the fund or the MFS Funds on the MFS Web site (mfs.com). This information is available at https://www.mfs.com/announcements or at mfs.com/openendfunds by choosing the fund’s name and then scrolling to the “Resources” section and clicking on the “Announcements” tab, if any.
Information About Fund
Contracts and Legal Claims
The fund has entered into
contractual arrangements with an investment adviser, administrator, distributor, shareholder servicing agent, and custodian who each provide services to the fund. Unless expressly stated otherwise, shareholders are
not parties to, or intended beneficiaries of these contractual arrangements, and these contractual arrangements are not intended to create any shareholder right to enforce them against the service providers or to seek
any remedy under them against the service providers, either directly or on behalf of the fund.
Under the Trust’s By-Laws and
Declaration of Trust, any claims asserted against or on behalf of the MFS Funds, including claims against Trustees and Officers, must be brought in state and federal courts located within the Commonwealth of
Massachusetts.
Provision of Financial
Reports and Summary Prospectuses
The fund produces financial reports
every six months and updates its summary prospectus and prospectus annually. To avoid sending duplicate copies of materials to households, only one copy of the fund’s annual and semiannual report and summary
prospectus may be mailed to shareholders having the same last name and residential address on the fund’s records. However, any shareholder may contact MFSC (please see back cover for address and telephone
number) to request that copies of these reports and summary prospectuses be sent personally to that shareholder.
37


Semiannual Report
March 31, 2023
MFS® Blended Research®
Core Equity Fund
Core Equity Fund

UNE-SEM
MFS® Blended Research®
Core Equity Fund
Core Equity Fund
CONTENTS
| 1 | |
| 2 | |
| 4 | |
| 10 | |
| 12 | |
| 13 | |
| 14 | |
| 23 | |
| 33 | |
| 34 | |
| 34 | |
| 34 | |
| 34 | |
| 34 |
| back cover |
The report is prepared for the
general information of shareholders. It is authorized for distribution to prospective investors only when preceded or accompanied by a current prospectus.
NOT FDIC INSURED
• MAY LOSE VALUE • NO BANK GUARANTEE
Portfolio Composition
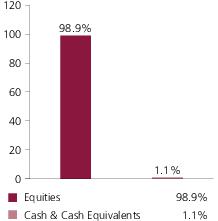
| (g) | The Global Industry Classification Standard (GICS®) was developed by and/or is the exclusive property of MSCI, Inc. and S&P Global Market Intelligence Inc. (“S&P Global Market Intelligence”). GICS is a service mark of MSCI and S&P Global Market Intelligence and has been licensed for use by MFS. MFS has applied its own internal sector/industry classification methodology for equity securities and non-equity securities that are unclassified by GICS. |
Cash & Cash
Equivalents includes any cash, investments in money market funds, short-term securities, and other assets less liabilities. Please see the Statement of Assets and Liabilities for additional information related to the
fund’s cash position and other assets and liabilities.
Percentages are based on
net assets as of March 31, 2023.
The portfolio is actively
managed and current holdings may be different.
1
Expense Table
Fund expenses borne by the
shareholders during the period,
October 1, 2022 through March 31, 2023
October 1, 2022 through March 31, 2023
As a shareholder of the fund, you
incur two types of costs: (1) transaction costs, including sales charges (loads) on certain purchase or redemption payments, and (2) ongoing costs, including management fees; distribution and service (12b-1) fees; and
other fund expenses. This example is intended to help you understand your ongoing costs (in dollars) of investing in the fund and to compare these costs with the ongoing costs of investing in other mutual funds.
The example is based on an
investment of $1,000 invested at the beginning of the period and held for the entire period October 1, 2022 through March 31, 2023.
Actual Expenses
The first line for each share class
in the following table provides information about actual account values and actual expenses. You may use the information in this line, together with the amount you invested, to estimate the expenses that you paid over
the period. Simply divide your account value by $1,000 (for example, an $8,600 account value divided by $1,000 = 8.6), then multiply the result by the number in the first line under the heading entitled
“Expenses Paid During Period” to estimate the expenses you paid on your account during this period.
Hypothetical Example for
Comparison Purposes
The second line for each share class
in the following table provides information about hypothetical account values and hypothetical expenses based on the fund’s actual expense ratio and an assumed rate of return of 5% per year before expenses,
which is not the fund’s actual return. The hypothetical account values and expenses may not be used to estimate the actual ending account balance or expenses you paid for the period. You may use this information
to compare the ongoing costs of investing in the fund and other funds. To do so, compare this 5% hypothetical example with the 5% hypothetical examples that appear in the shareholder reports of the other funds.
Please note that the expenses shown
in the table are meant to highlight your ongoing costs only and do not reflect any transactional costs, such as sales charges (loads). Therefore, the second line for each share class in the table is useful in
comparing ongoing costs only, and will not help you determine the relative total costs of owning different funds. In addition, if these transactional costs were included, your costs would have been higher.
2
Expense Table - continued
| Share Class | Annualized Expense Ratio | Beginning Account Value 10/01/22 | Ending Account Value 3/31/23 | Expenses Paid During Period (p) 10/01/22-3/31/23 | |
| A | Actual | 0.74% | $1,000.00 | $1,137.75 | $3.94 |
| Hypothetical (h) | 0.74% | $1,000.00 | $1,021.24 | $3.73 | |
| B | Actual | 1.49% | $1,000.00 | $1,133.64 | $7.93 |
| Hypothetical (h) | 1.49% | $1,000.00 | $1,017.50 | $7.49 | |
| C | Actual | 1.49% | $1,000.00 | $1,133.54 | $7.93 |
| Hypothetical (h) | 1.49% | $1,000.00 | $1,017.50 | $7.49 | |
| I | Actual | 0.49% | $1,000.00 | $1,139.08 | $2.61 |
| Hypothetical (h) | 0.49% | $1,000.00 | $1,022.49 | $2.47 | |
| R1 | Actual | 1.49% | $1,000.00 | $1,133.74 | $7.93 |
| Hypothetical (h) | 1.49% | $1,000.00 | $1,017.50 | $7.49 | |
| R2 | Actual | 0.99% | $1,000.00 | $1,136.24 | $5.27 |
| Hypothetical (h) | 0.99% | $1,000.00 | $1,020.00 | $4.99 | |
| R3 | Actual | 0.74% | $1,000.00 | $1,137.76 | $3.94 |
| Hypothetical (h) | 0.74% | $1,000.00 | $1,021.24 | $3.73 | |
| R4 | Actual | 0.49% | $1,000.00 | $1,139.22 | $2.61 |
| Hypothetical (h) | 0.49% | $1,000.00 | $1,022.49 | $2.47 | |
| R6 | Actual | 0.39% | $1,000.00 | $1,139.96 | $2.08 |
| Hypothetical (h) | 0.39% | $1,000.00 | $1,022.99 | $1.97 |
| (h) | 5% class return per year before expenses. |
| (p) | “Expenses Paid During Period” are equal to each class’s annualized expense ratio, as shown above, multiplied by the average account value over the period, multiplied by 182/365 (to reflect the one-half year period). Expenses paid do not include any applicable sales charges (loads). If these transaction costs had been included, your costs would have been higher. |
3
Portfolio of Investments
3/31/23 (unaudited)
The Portfolio of Investments is a
complete list of all securities owned by your fund. It is categorized by broad-based asset classes.
| Issuer | Shares/Par | Value ($) | ||
| Common Stocks – 98.9% | ||||
| Aerospace & Defense – 1.8% | ||||
| General Dynamics Corp. | 62,173 | $14,188,500 | ||
| Honeywell International, Inc. | 16,729 | 3,197,247 | ||
| Textron, Inc. | 18,002 | 1,271,481 | ||
| $18,657,228 | ||||
| Airlines – 0.3% | ||||
| United Airlines Holdings, Inc. (a) | 66,020 | $2,921,385 | ||
| Apparel Manufacturers – 0.2% | ||||
| NIKE, Inc., “B” | 12,970 | $1,590,641 | ||
| Automotive – 1.4% | ||||
| Aptiv PLC (a) | 23,994 | $2,691,887 | ||
| General Motors Co. | 78,860 | 2,892,585 | ||
| LKQ Corp. | 55,719 | 3,162,610 | ||
| Tesla, Inc. (a) | 28,419 | 5,895,806 | ||
| $14,642,888 | ||||
| Biotechnology – 1.4% | ||||
| Biogen, Inc. (a) | 39,335 | $10,936,310 | ||
| Gilead Sciences, Inc. | 33,033 | 2,740,748 | ||
| $13,677,058 | ||||
| Broadcasting – 1.1% | ||||
| Omnicom Group, Inc. | 54,248 | $5,117,756 | ||
| Walt Disney Co. (a) | 58,989 | 5,906,569 | ||
| $11,024,325 | ||||
| Brokerage & Asset Managers – 1.0% | ||||
| Charles Schwab Corp. | 25,937 | $1,358,580 | ||
| Raymond James Financial, Inc. | 95,687 | 8,924,727 | ||
| $10,283,307 | ||||
| Business Services – 2.7% | ||||
| Accenture PLC, “A” | 51,634 | $14,757,514 | ||
| GoDaddy, Inc. (a) | 141,535 | 11,000,100 | ||
| PayPal Holdings, Inc. (a) | 13,035 | 989,878 | ||
| $26,747,492 | ||||
| Cable TV – 1.0% | ||||
| Charter Communications, Inc., “A” (a) | 29,334 | $10,490,132 | ||
4
Portfolio of Investments (unaudited)
– continued
| Issuer | Shares/Par | Value ($) | ||
| Common Stocks – continued | ||||
| Computer Software – 10.0% | ||||
| Adobe Systems, Inc. (a) | 47,731 | $18,394,095 | ||
| Atlassian Corp. (a) | 38,369 | 6,567,622 | ||
| Microsoft Corp. | 246,413 | 71,040,868 | ||
| Palo Alto Networks, Inc. (a) | 22,903 | 4,574,645 | ||
| $100,577,230 | ||||
| Computer Software - Systems – 7.2% | ||||
| Apple, Inc. | 415,975 | $68,594,278 | ||
| Seagate Technology Holdings PLC | 33,179 | 2,193,795 | ||
| ServiceNow, Inc. (a) | 4,561 | 2,119,588 | ||
| $72,907,661 | ||||
| Construction – 0.2% | ||||
| Sherwin-Williams Co. | 10,512 | $2,362,782 | ||
| Consumer Products – 1.2% | ||||
| Colgate-Palmolive Co. | 155,968 | $11,720,995 | ||
| Consumer Services – 2.7% | ||||
| Airbnb, Inc., “A” (a) | 10,208 | $1,269,875 | ||
| Booking Holdings, Inc. (a) | 7,454 | 19,771,064 | ||
| Expedia Group, Inc. (a) | 60,822 | 5,901,559 | ||
| $26,942,498 | ||||
| Electrical Equipment – 0.5% | ||||
| TE Connectivity Ltd. | 37,169 | $4,874,714 | ||
| Electronics – 7.5% | ||||
| Applied Materials, Inc. | 153,978 | $18,913,118 | ||
| Corning, Inc. | 118,405 | 4,177,328 | ||
| Lam Research Corp. | 25,786 | 13,669,674 | ||
| NVIDIA Corp. | 31,366 | 8,712,534 | ||
| NXP Semiconductors N.V. | 60,339 | 11,251,715 | ||
| Texas Instruments, Inc. | 100,343 | 18,664,802 | ||
| $75,389,171 | ||||
| Energy - Independent – 2.1% | ||||
| Marathon Petroleum Corp. | 54,086 | $7,292,415 | ||
| Valero Energy Corp. | 96,486 | 13,469,446 | ||
| $20,761,861 | ||||
| Energy - Integrated – 0.2% | ||||
| Exxon Mobil Corp. | 18,479 | $2,026,407 | ||
| Engineering - Construction – 0.3% | ||||
| EMCOR Group, Inc. | 17,890 | $2,908,735 | ||
5
Portfolio of Investments (unaudited)
– continued
| Issuer | Shares/Par | Value ($) | ||
| Common Stocks – continued | ||||
| Food & Beverages – 2.6% | ||||
| Archer Daniels Midland Co. | 185,547 | $14,780,674 | ||
| Mondelez International, Inc. | 47,682 | 3,324,389 | ||
| PepsiCo, Inc. | 31,925 | 5,819,928 | ||
| Tyson Foods, Inc., “A” | 44,482 | 2,638,672 | ||
| $26,563,663 | ||||
| Gaming & Lodging – 0.1% | ||||
| Marriott International, Inc., “A” | 7,747 | $1,286,312 | ||
| Health Maintenance Organizations – 2.0% | ||||
| Cigna Group | 56,078 | $14,329,611 | ||
| Humana, Inc. | 4,662 | 2,263,215 | ||
| UnitedHealth Group, Inc. | 6,637 | 3,136,580 | ||
| $19,729,406 | ||||
| Insurance – 4.7% | ||||
| Ameriprise Financial, Inc. | 31,196 | $9,561,574 | ||
| Berkshire Hathaway, Inc., “B” (a) | 17,696 | 5,463,994 | ||
| Equitable Holdings, Inc. | 255,600 | 6,489,684 | ||
| Everest Re Group Ltd. | 29,556 | 10,581,639 | ||
| Hartford Financial Services Group, Inc. | 28,234 | 1,967,627 | ||
| MetLife, Inc. | 233,956 | 13,555,411 | ||
| $47,619,929 | ||||
| Internet – 6.0% | ||||
| Alphabet, Inc., “A” (a) | 221,307 | $22,956,175 | ||
| Alphabet, Inc., “C” (a) | 240,842 | 25,047,568 | ||
| Gartner, Inc. (a) | 3,751 | 1,221,963 | ||
| Meta Platforms, Inc., “A” (a) | 53,427 | 11,323,319 | ||
| $60,549,025 | ||||
| Leisure & Toys – 1.1% | ||||
| Brunswick Corp. | 94,606 | $7,757,692 | ||
| Polaris, Inc. | 33,765 | 3,735,422 | ||
| $11,493,114 | ||||
| Machinery & Tools – 1.8% | ||||
| Carrier Global Corp. | 22,263 | $1,018,532 | ||
| Eaton Corp. PLC | 38,973 | 6,677,634 | ||
| Ingersoll Rand, Inc. | 40,242 | 2,341,280 | ||
| Timken Co. | 67,861 | 5,545,601 | ||
| Wabtec Corp. | 28,600 | 2,890,316 | ||
| $18,473,363 | ||||
6
Portfolio of Investments (unaudited)
– continued
| Issuer | Shares/Par | Value ($) | ||
| Common Stocks – continued | ||||
| Major Banks – 3.9% | ||||
| Bank of America Corp. | 194,151 | $5,552,718 | ||
| JPMorgan Chase & Co. | 175,848 | 22,914,753 | ||
| Wells Fargo & Co. | 292,139 | 10,920,156 | ||
| $39,387,627 | ||||
| Medical & Health Technology & Services – 1.8% | ||||
| Cardinal Health, Inc. | 13,168 | $994,184 | ||
| IQVIA Holdings, Inc. (a) | 4,487 | 892,419 | ||
| McKesson Corp. | 39,944 | 14,222,061 | ||
| Veeva Systems, Inc. (a) | 9,250 | 1,700,058 | ||
| $17,808,722 | ||||
| Medical Equipment – 2.4% | ||||
| Abbott Laboratories | 19,163 | $1,940,445 | ||
| Boston Scientific Corp. (a) | 34,699 | 1,735,991 | ||
| Danaher Corp. | 9,345 | 2,355,314 | ||
| Hologic, Inc. (a) | 20,696 | 1,670,167 | ||
| Medtronic PLC | 97,056 | 7,824,655 | ||
| Thermo Fisher Scientific, Inc. | 14,380 | 8,288,201 | ||
| $23,814,773 | ||||
| Metals & Mining – 0.3% | ||||
| United States Steel Corp. | 110,412 | $2,881,753 | ||
| Natural Gas - Distribution – 0.1% | ||||
| UGI Corp. | 24,691 | $858,259 | ||
| Natural Gas - Pipeline – 1.8% | ||||
| Cheniere Energy, Inc. | 64,105 | $10,102,948 | ||
| Targa Resources Corp. | 107,156 | 7,817,030 | ||
| $17,919,978 | ||||
| Network & Telecom – 1.2% | ||||
| Equinix, Inc., REIT | 16,220 | $11,695,269 | ||
| Oil Services – 0.1% | ||||
| NOV, Inc. | 57,741 | $1,068,786 | ||
| Other Banks & Diversified Financials – 2.8% | ||||
| Mastercard, Inc., “A” | 6,307 | $2,292,027 | ||
| SLM Corp. | 695,700 | 8,619,723 | ||
| Visa, Inc., “A” | 75,838 | 17,098,435 | ||
| $28,010,185 | ||||
7
Portfolio of Investments (unaudited)
– continued
| Issuer | Shares/Par | Value ($) | ||
| Common Stocks – continued | ||||
| Pharmaceuticals – 6.8% | ||||
| Eli Lilly & Co. | 26,053 | $8,947,121 | ||
| Johnson & Johnson | 130,538 | 20,233,390 | ||
| Merck & Co., Inc. | 219,925 | 23,397,821 | ||
| Pfizer, Inc. | 106,061 | 4,327,289 | ||
| Vertex Pharmaceuticals, Inc. (a) | 36,866 | 11,615,370 | ||
| $68,520,991 | ||||
| Railroad & Shipping – 1.4% | ||||
| CSX Corp. | 477,278 | $14,289,703 | ||
| Real Estate – 1.9% | ||||
| Extra Space Storage, Inc., REIT | 27,503 | $4,481,064 | ||
| Simon Property Group, Inc., REIT | 63,027 | 7,057,133 | ||
| VICI Properties, Inc., REIT | 236,715 | 7,721,643 | ||
| $19,259,840 | ||||
| Restaurants – 0.2% | ||||
| Texas Roadhouse, Inc. | 21,794 | $2,355,060 | ||
| Specialty Chemicals – 2.2% | ||||
| Chemours Co. | 297,719 | $8,913,707 | ||
| Linde PLC | 22,321 | 7,933,776 | ||
| Univar Solutions, Inc. (a) | 149,259 | 5,228,543 | ||
| $22,076,026 | ||||
| Specialty Stores – 6.9% | ||||
| Amazon.com, Inc. (a) | 236,695 | $24,448,227 | ||
| Builders FirstSource, Inc. (a) | 35,340 | 3,137,485 | ||
| Home Depot, Inc. | 36,267 | 10,703,117 | ||
| O'Reilly Automotive, Inc. (a) | 17,237 | 14,633,868 | ||
| Walmart Stores, Inc. | 110,509 | 16,294,552 | ||
| $69,217,249 | ||||
| Telecommunications - Wireless – 0.4% | ||||
| SBA Communications Corp., REIT | 7,566 | $1,975,256 | ||
| T-Mobile US, Inc. (a) | 13,898 | 2,012,986 | ||
| $3,988,242 | ||||
| Tobacco – 0.4% | ||||
| Altria Group, Inc. | 100,802 | $4,497,785 | ||
| Trucking – 0.9% | ||||
| United Parcel Service, Inc., “B” | 46,132 | $8,949,147 | ||
8
Portfolio of Investments (unaudited)
– continued
| Issuer | Shares/Par | Value ($) | ||
| Common Stocks – continued | ||||
| Utilities - Electric Power – 2.3% | ||||
| Edison International | 52,405 | $3,699,269 | ||
| Evergy, Inc. | 17,323 | 1,058,782 | ||
| Exelon Corp. | 31,628 | 1,324,897 | ||
| PG&E Corp. (a) | 349,336 | 5,648,763 | ||
| PPL Corp. | 33,183 | 922,155 | ||
| Vistra Corp. | 445,219 | 10,685,256 | ||
| $23,339,122 | ||||
| Total Common Stocks (Identified Cost, $705,772,217) | $996,159,839 | |||
| Investment Companies (h) – 1.1% | ||||
| Money Market Funds – 1.1% | ||||
| MFS Institutional Money Market Portfolio, 4.56% (v) (Identified Cost, $11,447,894) | 11,447,862 | $11,450,152 | ||
| Other Assets, Less Liabilities – (0.0)% | (291,193) | |||
| Net Assets – 100.0% | $1,007,318,798 | |||
| (a) | Non-income producing security. | |||
| (h) | An affiliated issuer, which may be considered one in which the fund owns 5% or more of the outstanding voting securities, or a company which is under common control. At period end, the aggregate values of the fund's investments in affiliated issuers and in unaffiliated issuers were $11,450,152 and $996,159,839, respectively. | |||
| (v) | Affiliated issuer that is available only to investment companies managed by MFS. The rate quoted for the MFS Institutional Money Market Portfolio is the annualized seven-day yield of the fund at period end. |
| The following abbreviations are used in this report and are defined: | |
| REIT | Real Estate Investment Trust |
See Notes to Financial Statements
9
Financial Statements
Statement of Assets and
Liabilities
At 3/31/23 (unaudited)
This statement represents your
fund’s balance sheet, which details the assets and liabilities comprising the total value of the fund.
| Assets | |
| Investments in unaffiliated issuers, at value (identified cost, $705,772,217) | $996,159,839 |
| Investments in affiliated issuers, at value (identified cost, $11,447,894) | 11,450,152 |
| Receivables for | |
| Fund shares sold | 795,101 |
| Dividends | 802,422 |
| Receivable from investment adviser | 40,004 |
| Other assets | 2,901 |
| Total assets | $1,009,250,419 |
| Liabilities | |
| Payables for | |
| Fund shares reacquired | $1,590,429 |
| Payable to affiliates | |
| Administrative services fee | 867 |
| Shareholder servicing costs | 219,479 |
| Distribution and service fees | 6,082 |
| Payable for independent Trustees' compensation | 2,516 |
| Accrued expenses and other liabilities | 112,248 |
| Total liabilities | $1,931,621 |
| Net assets | $1,007,318,798 |
| Net assets consist of | |
| Paid-in capital | $710,094,962 |
| Total distributable earnings (loss) | 297,223,836 |
| Net assets | $1,007,318,798 |
| Shares of beneficial interest outstanding | 37,017,783 |
10
Statement of Assets and Liabilities (unaudited) – continued
| Net assets | Shares outstanding | Net asset value per share (a) | |
| Class A | $208,872,625 | 7,745,006 | $26.97 |
| Class B | 7,679,790 | 299,851 | 25.61 |
| Class C | 23,342,547 | 932,173 | 25.04 |
| Class I | 476,739,324 | 17,329,343 | 27.51 |
| Class R1 | 1,397,708 | 55,379 | 25.24 |
| Class R2 | 35,727,136 | 1,412,585 | 25.29 |
| Class R3 | 42,302,884 | 1,575,012 | 26.86 |
| Class R4 | 8,332,899 | 307,051 | 27.14 |
| Class R6 | 202,923,885 | 7,361,383 | 27.57 |
| (a) | Maximum offering price per share was equal to the net asset value per share for all share classes, except for Class A, for which the maximum offering price per share was $28.62 [100 / 94.25 x $26.97]. On sales of $50,000 or more, the maximum offering price of Class A shares is reduced. A contingent deferred sales charge may be imposed on redemptions of Class A, Class B, and Class C shares. Redemption price per share was equal to the net asset value per share for Classes I, R1, R2, R3, R4, and R6. |
See Notes to Financial Statements
11
Financial Statements
Statement of Operations
Six months ended 3/31/23
(unaudited)
This statement describes how much
your fund earned in investment income and accrued in expenses. It also describes any gains and/or losses generated by fund operations.
| Net investment income (loss) | |
| Income | |
| Dividends | $8,917,165 |
| Dividends from affiliated issuers | 196,339 |
| Other | 16,984 |
| Foreign taxes withheld | (17,196) |
| Total investment income | $9,113,292 |
| Expenses | |
| Management fee | $1,990,441 |
| Distribution and service fees | 572,582 |
| Shareholder servicing costs | 450,657 |
| Administrative services fee | 78,813 |
| Independent Trustees' compensation | 8,718 |
| Custodian fee | 27,217 |
| Shareholder communications | 33,266 |
| Audit and tax fees | 32,138 |
| Legal fees | 2,617 |
| Miscellaneous | 93,817 |
| Total expenses | $3,290,266 |
| Reduction of expenses by investment adviser and distributor | (374,616) |
| Net expenses | $2,915,650 |
| Net investment income (loss) | $6,197,642 |
| Realized and unrealized gain (loss) | |
| Realized gain (loss) (identified cost basis) | |
| Unaffiliated issuers | $16,035,578 |
| Affiliated issuers | (2,573) |
| Net realized gain (loss) | $16,033,005 |
| Change in unrealized appreciation or depreciation | |
| Unaffiliated issuers | $105,923,125 |
| Affiliated issuers | 1,638 |
| Net unrealized gain (loss) | $105,924,763 |
| Net realized and unrealized gain (loss) | $121,957,768 |
| Change in net assets from operations | $128,155,410 |
See Notes to Financial Statements
12
Financial Statements
Statements of Changes in Net
Assets
These statements describe the
increases and/or decreases in net assets resulting from operations, any distributions, and any shareholder transactions.
| Six months ended | Year ended | |
| 3/31/23 (unaudited) | 9/30/22 | |
| Change in net assets | ||
| From operations | ||
| Net investment income (loss) | $6,197,642 | $9,665,695 |
| Net realized gain (loss) | 16,033,005 | 75,268,087 |
| Net unrealized gain (loss) | 105,924,763 | (224,323,367) |
| Change in net assets from operations | $128,155,410 | $(139,389,585) |
| Total distributions to shareholders | $(84,303,357) | $(171,984,596) |
| Change in net assets from fund share transactions | $34,359,020 | $91,952,199 |
| Total change in net assets | $78,211,073 | $(219,421,982) |
| Net assets | ||
| At beginning of period | 929,107,725 | 1,148,529,707 |
| At end of period | $1,007,318,798 | $929,107,725 |
See Notes to Financial Statements
13
Financial Statements
Financial Highlights
The financial highlights table is
intended to help you understand the fund's financial performance for the semiannual period and the past 5 fiscal years. Certain information reflects financial results for a single fund share. The total returns in the
table represent the rate that an investor would have earned (or lost) on an investment in the fund share class (assuming reinvestment of all distributions) held for the entire period.
| Class A | Six months ended | Year ended | ||||
| 3/31/23 (unaudited) | 9/30/22 | 9/30/21 | 9/30/20 | 9/30/19 | 9/30/18 | |
| Net asset value, beginning of period | $25.78 | $34.76 | $28.49 | $26.52 | $29.79 | $26.59 |
| Income (loss) from investment operations | ||||||
| Net investment income (loss) (d) | $0.15 | $0.23 | $0.24 | $0.28 | $0.33 | $0.31 |
| Net realized and unrealized gain (loss) | 3.36 | (3.91) | 8.10 | 3.08 | (0.93) | 3.79 |
| Total from investment operations | $3.51 | $(3.68) | $8.34 | $3.36 | $(0.60) | $4.10 |
| Less distributions declared to shareholders | ||||||
| From net investment income | $(0.27) | $(0.22) | $(0.26) | $(0.38) | $(0.39) | $(0.33) |
| From net realized gain | (2.05) | (5.08) | (1.81) | (1.01) | (2.28) | (0.57) |
| Total distributions declared to shareholders | $(2.32) | $(5.30) | $(2.07) | $(1.39) | $(2.67) | $(0.90) |
| Net asset value, end of period (x) | $26.97 | $25.78 | $34.76 | $28.49 | $26.52 | $29.79 |
| Total return (%) (r)(s)(t)(x) | 13.77(n) | (13.53) | 30.69 | 12.88 | (0.62) | 15.72 |
| Ratios (%) (to average net assets) and Supplemental data: | ||||||
| Expenses before expense reductions | 0.82(a) | 0.81 | 0.81 | 0.82 | 0.82 | 0.81 |
| Expenses after expense reductions | 0.74(a) | 0.74 | 0.74 | 0.74 | 0.74 | 0.74 |
| Net investment income (loss) | 1.09(a) | 0.73 | 0.74 | 1.04 | 1.29 | 1.10 |
| Portfolio turnover | 20(n) | 43 | 57 | 63 | 53 | 64 |
| Net assets at end of period (000 omitted) | $208,873 | $182,294 | $221,508 | $243,181 | $251,505 | $303,929 |
See Notes to Financial Statements
14
Financial Highlights – continued
| Class B | Six months ended | Year ended | ||||
| 3/31/23 (unaudited) | 9/30/22 | 9/30/21 | 9/30/20 | 9/30/19 | 9/30/18 | |
| Net asset value, beginning of period | $24.43 | $33.22 | $27.30 | $25.47 | $28.68 | $25.62 |
| Income (loss) from investment operations | ||||||
| Net investment income (loss) (d) | $0.04 | $(0.01) | $(0.00)(w) | $0.08 | $0.13 | $0.09 |
| Net realized and unrealized gain (loss) | 3.19 | (3.70) | 7.76 | 2.94 | (0.87) | 3.66 |
| Total from investment operations | $3.23 | $(3.71) | $7.76 | $3.02 | $(0.74) | $3.75 |
| Less distributions declared to shareholders | ||||||
| From net investment income | $— | $— | $(0.03) | $(0.18) | $(0.19) | $(0.12) |
| From net realized gain | (2.05) | (5.08) | (1.81) | (1.01) | (2.28) | (0.57) |
| Total distributions declared to shareholders | $(2.05) | $(5.08) | $(1.84) | $(1.19) | $(2.47) | $(0.69) |
| Net asset value, end of period (x) | $25.61 | $24.43 | $33.22 | $27.30 | $25.47 | $28.68 |
| Total return (%) (r)(s)(t)(x) | 13.36(n) | (14.20) | 29.70 | 12.03 | (1.33) | 14.84 |
| Ratios (%) (to average net assets) and Supplemental data: | ||||||
| Expenses before expense reductions | 1.57(a) | 1.56 | 1.55 | 1.57 | 1.57 | 1.56 |
| Expenses after expense reductions | 1.49(a) | 1.49 | 1.49 | 1.49 | 1.49 | 1.49 |
| Net investment income (loss) | 0.35(a) | (0.03) | (0.01) | 0.29 | 0.54 | 0.33 |
| Portfolio turnover | 20(n) | 43 | 57 | 63 | 53 | 64 |
| Net assets at end of period (000 omitted) | $7,680 | $9,268 | $15,538 | $15,562 | $18,064 | $21,577 |
See Notes to Financial Statements
15
Financial Highlights – continued
| Class C | Six months ended | Year ended | ||||
| 3/31/23 (unaudited) | 9/30/22 | 9/30/21 | 9/30/20 | 9/30/19 | 9/30/18 | |
| Net asset value, beginning of period | $23.94 | $32.65 | $26.85 | $25.06 | $28.27 | $25.26 |
| Income (loss) from investment operations | ||||||
| Net investment income (loss) (d) | $0.04 | $(0.01) | $(0.00)(w) | $0.07 | $0.13 | $0.09 |
| Net realized and unrealized gain (loss) | 3.12 | (3.62) | 7.65 | 2.90 | (0.88) | 3.61 |
| Total from investment operations | $3.16 | $(3.63) | $7.65 | $2.97 | $(0.75) | $3.70 |
| Less distributions declared to shareholders | ||||||
| From net investment income | $(0.01) | $— | $(0.04) | $(0.17) | $(0.18) | $(0.12) |
| From net realized gain | (2.05) | (5.08) | (1.81) | (1.01) | (2.28) | (0.57) |
| Total distributions declared to shareholders | $(2.06) | $(5.08) | $(1.85) | $(1.18) | $(2.46) | $(0.69) |
| Net asset value, end of period (x) | $25.04 | $23.94 | $32.65 | $26.85 | $25.06 | $28.27 |
| Total return (%) (r)(s)(t)(x) | 13.35(n) | (14.20) | 29.76 | 12.02 | (1.37) | 14.86 |
| Ratios (%) (to average net assets) and Supplemental data: | ||||||
| Expenses before expense reductions | 1.57(a) | 1.56 | 1.55 | 1.57 | 1.57 | 1.56 |
| Expenses after expense reductions | 1.49(a) | 1.49 | 1.49 | 1.49 | 1.49 | 1.49 |
| Net investment income (loss) | 0.35(a) | (0.03) | (0.02) | 0.29 | 0.54 | 0.33 |
| Portfolio turnover | 20(n) | 43 | 57 | 63 | 53 | 64 |
| Net assets at end of period (000 omitted) | $23,343 | $27,015 | $45,369 | $44,725 | $53,788 | $70,299 |
See Notes to Financial Statements
16
Financial Highlights – continued
| Class I | Six months ended | Year ended | ||||
| 3/31/23 (unaudited) | 9/30/22 | 9/30/21 | 9/30/20 | 9/30/19 | 9/30/18 | |
| Net asset value, beginning of period | $26.29 | $35.38 | $28.96 | $26.94 | $30.23 | $26.96 |
| Income (loss) from investment operations | ||||||
| Net investment income (loss) (d) | $0.18 | $0.31 | $0.33 | $0.35 | $0.40 | $0.38 |
| Net realized and unrealized gain (loss) | 3.43 | (3.98) | 8.24 | 3.13 | (0.94) | 3.85 |
| Total from investment operations | $3.61 | $(3.67) | $8.57 | $3.48 | $(0.54) | $4.23 |
| Less distributions declared to shareholders | ||||||
| From net investment income | $(0.34) | $(0.34) | $(0.34) | $(0.45) | $(0.47) | $(0.39) |
| From net realized gain | (2.05) | (5.08) | (1.81) | (1.01) | (2.28) | (0.57) |
| Total distributions declared to shareholders | $(2.39) | $(5.42) | $(2.15) | $(1.46) | $(2.75) | $(0.96) |
| Net asset value, end of period (x) | $27.51 | $26.29 | $35.38 | $28.96 | $26.94 | $30.23 |
| Total return (%) (r)(s)(t)(x) | 13.91(n) | (13.31) | 31.03 | 13.15 | (0.39) | 16.00 |
| Ratios (%) (to average net assets) and Supplemental data: | ||||||
| Expenses before expense reductions | 0.57(a) | 0.56 | 0.56 | 0.57 | 0.57 | 0.56 |
| Expenses after expense reductions | 0.49(a) | 0.49 | 0.49 | 0.49 | 0.49 | 0.49 |
| Net investment income (loss) | 1.34(a) | 0.98 | 0.99 | 1.29 | 1.52 | 1.34 |
| Portfolio turnover | 20(n) | 43 | 57 | 63 | 53 | 64 |
| Net assets at end of period (000 omitted) | $476,739 | $449,442 | $533,711 | $465,900 | $392,729 | $498,169 |
See Notes to Financial Statements
17
Financial Highlights – continued
| Class R1 | Six months ended | Year ended | ||||
| 3/31/23 (unaudited) | 9/30/22 | 9/30/21 | 9/30/20 | 9/30/19 | 9/30/18 | |
| Net asset value, beginning of period | $24.17 | $32.92 | $27.10 | $25.18 | $28.39 | $25.38 |
| Income (loss) from investment operations | ||||||
| Net investment income (loss) (d) | $0.04 | $(0.01) | $(0.00)(w) | $0.13 | $0.13 | $0.09 |
| Net realized and unrealized gain (loss) | 3.16 | (3.66) | 7.71 | 2.80 | (0.87) | 3.62 |
| Total from investment operations | $3.20 | $(3.67) | $7.71 | $2.93 | $(0.74) | $3.71 |
| Less distributions declared to shareholders | ||||||
| From net investment income | $(0.08) | $— | $(0.08) | $— | $(0.19) | $(0.13) |
| From net realized gain | (2.05) | (5.08) | (1.81) | (1.01) | (2.28) | (0.57) |
| Total distributions declared to shareholders | $(2.13) | $(5.08) | $(1.89) | $(1.01) | $(2.47) | $(0.70) |
| Net asset value, end of period (x) | $25.24 | $24.17 | $32.92 | $27.10 | $25.18 | $28.39 |
| Total return (%) (r)(s)(t)(x) | 13.37(n) | (14.20) | 29.76 | 11.79 | (1.33) | 14.84 |
| Ratios (%) (to average net assets) and Supplemental data: | ||||||
| Expenses before expense reductions | 1.57(a) | 1.56 | 1.55 | 1.58 | 1.57 | 1.56 |
| Expenses after expense reductions | 1.49(a) | 1.49 | 1.49 | 1.49 | 1.49 | 1.49 |
| Net investment income (loss) | 0.34(a) | (0.02) | (0.01) | 0.49 | 0.54 | 0.33 |
| Portfolio turnover | 20(n) | 43 | 57 | 63 | 53 | 64 |
| Net assets at end of period (000 omitted) | $1,398 | $1,159 | $1,333 | $1,084 | $10,895 | $13,185 |
See Notes to Financial Statements
18
Financial Highlights – continued
| Class R2 | Six months ended | Year ended | ||||
| 3/31/23 (unaudited) | 9/30/22 | 9/30/21 | 9/30/20 | 9/30/19 | 9/30/18 | |
| Net asset value, beginning of period | $24.27 | $33.02 | $27.16 | $25.32 | $28.58 | $25.58 |
| Income (loss) from investment operations | ||||||
| Net investment income (loss) (d) | $0.11 | $0.14 | $0.15 | $0.20 | $0.26 | $0.23 |
| Net realized and unrealized gain (loss) | 3.15 | (3.66) | 7.70 | 2.94 | (0.90) | 3.65 |
| Total from investment operations | $3.26 | $(3.52) | $7.85 | $3.14 | $(0.64) | $3.88 |
| Less distributions declared to shareholders | ||||||
| From net investment income | $(0.19) | $(0.15) | $(0.18) | $(0.29) | $(0.34) | $(0.31) |
| From net realized gain | (2.05) | (5.08) | (1.81) | (1.01) | (2.28) | (0.57) |
| Total distributions declared to shareholders | $(2.24) | $(5.23) | $(1.99) | $(1.30) | $(2.62) | $(0.88) |
| Net asset value, end of period (x) | $25.29 | $24.27 | $33.02 | $27.16 | $25.32 | $28.58 |
| Total return (%) (r)(s)(t)(x) | 13.62(n) | (13.74) | 30.33 | 12.60 | (0.87) | 15.47 |
| Ratios (%) (to average net assets) and Supplemental data: | ||||||
| Expenses before expense reductions | 1.07(a) | 1.06 | 1.05 | 1.07 | 1.07 | 1.06 |
| Expenses after expense reductions | 0.99(a) | 0.99 | 0.99 | 0.99 | 0.99 | 0.99 |
| Net investment income (loss) | 0.84(a) | 0.47 | 0.49 | 0.79 | 1.04 | 0.85 |
| Portfolio turnover | 20(n) | 43 | 57 | 63 | 53 | 64 |
| Net assets at end of period (000 omitted) | $35,727 | $34,446 | $48,557 | $45,533 | $52,605 | $73,655 |
See Notes to Financial Statements
19
Financial Highlights – continued
| Class R3 | Six months ended | Year ended | ||||
| 3/31/23 (unaudited) | 9/30/22 | 9/30/21 | 9/30/20 | 9/30/19 | 9/30/18 | |
| Net asset value, beginning of period | $25.68 | $34.66 | $28.40 | $26.44 | $29.69 | $26.49 |
| Income (loss) from investment operations | ||||||
| Net investment income (loss) (d) | $0.15 | $0.23 | $0.24 | $0.28 | $0.33 | $0.31 |
| Net realized and unrealized gain (loss) | 3.34 | (3.89) | 8.08 | 3.06 | (0.92) | 3.78 |
| Total from investment operations | $3.49 | $(3.66) | $8.32 | $3.34 | $(0.59) | $4.09 |
| Less distributions declared to shareholders | ||||||
| From net investment income | $(0.26) | $(0.24) | $(0.25) | $(0.37) | $(0.38) | $(0.32) |
| From net realized gain | (2.05) | (5.08) | (1.81) | (1.01) | (2.28) | (0.57) |
| Total distributions declared to shareholders | $(2.31) | $(5.32) | $(2.06) | $(1.38) | $(2.66) | $(0.89) |
| Net asset value, end of period (x) | $26.86 | $25.68 | $34.66 | $28.40 | $26.44 | $29.69 |
| Total return (%) (r)(s)(t)(x) | 13.78(n) | (13.53) | 30.71 | 12.84 | (0.60) | 15.73 |
| Ratios (%) (to average net assets) and Supplemental data: | ||||||
| Expenses before expense reductions | 0.82(a) | 0.81 | 0.81 | 0.82 | 0.82 | 0.81 |
| Expenses after expense reductions | 0.74(a) | 0.74 | 0.74 | 0.74 | 0.74 | 0.74 |
| Net investment income (loss) | 1.10(a) | 0.73 | 0.73 | 1.05 | 1.28 | 1.11 |
| Portfolio turnover | 20(n) | 43 | 57 | 63 | 53 | 64 |
| Net assets at end of period (000 omitted) | $42,303 | $38,202 | $50,589 | $59,630 | $77,311 | $113,415 |
See Notes to Financial Statements
20
Financial Highlights – continued
| Class R4 | Six months ended | Year ended | ||||
| 3/31/23 (unaudited) | 9/30/22 | 9/30/21 | 9/30/20 | 9/30/19 | 9/30/18 | |
| Net asset value, beginning of period | $25.96 | $34.99 | $28.65 | $26.66 | $29.96 | $26.72 |
| Income (loss) from investment operations | ||||||
| Net investment income (loss) (d) | $0.18 | $0.30 | $0.32 | $0.35 | $0.40 | $0.38 |
| Net realized and unrealized gain (loss) | 3.39 | (3.93) | 8.16 | 3.09 | (0.95) | 3.82 |
| Total from investment operations | $3.57 | $(3.63) | $8.48 | $3.44 | $(0.55) | $4.20 |
| Less distributions declared to shareholders | ||||||
| From net investment income | $(0.34) | $(0.32) | $(0.33) | $(0.44) | $(0.47) | $(0.39) |
| From net realized gain | (2.05) | (5.08) | (1.81) | (1.01) | (2.28) | (0.57) |
| Total distributions declared to shareholders | $(2.39) | $(5.40) | $(2.14) | $(1.45) | $(2.75) | $(0.96) |
| Net asset value, end of period (x) | $27.14 | $25.96 | $34.99 | $28.65 | $26.66 | $29.96 |
| Total return (%) (r)(s)(t)(x) | 13.92(n) | (13.33) | 31.06 | 13.15 | (0.39) | 16.02 |
| Ratios (%) (to average net assets) and Supplemental data: | ||||||
| Expenses before expense reductions | 0.57(a) | 0.56 | 0.56 | 0.57 | 0.57 | 0.56 |
| Expenses after expense reductions | 0.49(a) | 0.49 | 0.49 | 0.49 | 0.49 | 0.49 |
| Net investment income (loss) | 1.34(a) | 0.97 | 0.99 | 1.28 | 1.54 | 1.34 |
| Portfolio turnover | 20(n) | 43 | 57 | 63 | 53 | 64 |
| Net assets at end of period (000 omitted) | $8,333 | $7,219 | $12,391 | $16,640 | $23,253 | $44,630 |
See Notes to Financial Statements
21
Financial Highlights – continued
| Class R6 | Six months ended | Year ended | ||||
| 3/31/23 (unaudited) | 9/30/22 | 9/30/21 | 9/30/20 | 9/30/19 | 9/30/18 | |
| Net asset value, beginning of period | $26.35 | $35.45 | $29.02 | $26.99 | $30.29 | $27.01 |
| Income (loss) from investment operations | ||||||
| Net investment income (loss) (d) | $0.20 | $0.34 | $0.36 | $0.38 | $0.43 | $0.41 |
| Net realized and unrealized gain (loss) | 3.44 | (3.99) | 8.24 | 3.14 | (0.94) | 3.86 |
| Total from investment operations | $3.64 | $(3.65) | $8.60 | $3.52 | $(0.51) | $4.27 |
| Less distributions declared to shareholders | ||||||
| From net investment income | $(0.37) | $(0.37) | $(0.36) | $(0.48) | $(0.51) | $(0.42) |
| From net realized gain | (2.05) | (5.08) | (1.81) | (1.01) | (2.28) | (0.57) |
| Total distributions declared to shareholders | $(2.42) | $(5.45) | $(2.17) | $(1.49) | $(2.79) | $(0.99) |
| Net asset value, end of period (x) | $27.57 | $26.35 | $35.45 | $29.02 | $26.99 | $30.29 |
| Total return (%) (r)(s)(t)(x) | 14.00(n) | (13.22) | 31.13 | 13.28 | (0.25) | 16.13 |
| Ratios (%) (to average net assets) and Supplemental data: | ||||||
| Expenses before expense reductions | 0.46(a) | 0.46 | 0.45 | 0.46 | 0.46 | 0.45 |
| Expenses after expense reductions | 0.39(a) | 0.39 | 0.39 | 0.38 | 0.38 | 0.38 |
| Net investment income (loss) | 1.44(a) | 1.08 | 1.09 | 1.40 | 1.64 | 1.45 |
| Portfolio turnover | 20(n) | 43 | 57 | 63 | 53 | 64 |
| Net assets at end of period (000 omitted) | $202,924 | $180,063 | $219,533 | $180,306 | $171,658 | $220,856 |
| (a) | Annualized. |
| (d) | Per share data is based on average shares outstanding. |
| (n) | Not annualized. |
| (r) | Certain expenses have been reduced without which performance would have been lower. |
| (s) | From time to time the fund may receive proceeds from litigation settlements, without which performance would be lower. |
| (t) | Total returns do not include any applicable sales charges. |
| (w) | Per share amount was less than $0.01. |
| (x) | The net asset values and total returns have been calculated on net assets which include adjustments made in accordance with U.S. generally accepted accounting principles required at period end for financial reporting purposes. |
See Notes to Financial Statements
22
Notes to Financial Statements
(unaudited)
(1) Business and
Organization
MFS Blended Research Core Equity
Fund (the fund) is a diversified series of MFS Series Trust XI (the trust). The trust is organized as a Massachusetts business trust and is registered under the Investment Company Act of 1940, as amended, as an
open-end management investment company.
The fund is an investment company
and accordingly follows the investment company accounting and reporting guidance of the Financial Accounting Standards Board (FASB) Accounting Standards Codification Topic 946 Financial Services - Investment
Companies.
(2) Significant Accounting
Policies
General — The preparation of financial statements in conformity with U.S. generally accepted accounting principles requires management to make estimates and assumptions that affect the
reported amounts of assets and liabilities, and disclosure of contingent assets and liabilities at the date of the financial statements and the reported amounts of increases and decreases in net assets from operations
during the reporting period. Actual results could differ from those estimates. In the preparation of these financial statements, management has evaluated subsequent events occurring after the date of the fund’s
Statement of Assets and Liabilities through the date that the financial statements were issued.
Balance Sheet Offsetting — The fund's accounting policy with respect to balance sheet offsetting is that, absent an event of default by the counterparty or a termination of the agreement, the International
Swaps and Derivatives Association (ISDA) Master Agreement, or similar agreement, does not result in an offset of reported amounts of financial assets and financial liabilities in the Statement of Assets and
Liabilities across transactions between the fund and the applicable counterparty. The fund's right to setoff may be restricted or prohibited by the bankruptcy or insolvency laws of the particular jurisdiction to which
a specific master netting agreement counterparty is subject. Balance sheet offsetting disclosures, to the extent applicable to the fund, have been included in the fund’s Significant Accounting Policies note
under the captions for each of the fund’s in-scope financial instruments and transactions.
Investment Valuations — Subject to its oversight, the fund's Board of Trustees has delegated primary responsibility for determining or causing to be determined the value of the fund’s investments to MFS as
the fund's adviser, pursuant to the fund’s valuation policy and procedures which have been adopted by the adviser and approved by the Board. In accordance with Rule 2a-5 under the Investment Company Act of
1940, the Board of Trustees designated the adviser as the “valuation designee” of the fund. If the adviser, as valuation designee, determines that reliable market quotations are not readily available for
an investment, the investment is valued at fair value as determined in good faith by the adviser in accordance with the adviser’s fair valuation policy and procedures.
Under the fund's valuation policy
and procedures, equity securities, including restricted equity securities, are generally valued at the last sale or official closing price on their primary market or exchange as provided by a third-party pricing
service. Equity securities, for which there were no sales reported that day, are generally valued at the last quoted daily bid quotation on their primary market or exchange as provided by a
23
Notes to Financial
Statements (unaudited) - continued
third-party pricing service. Short-term instruments
with a maturity at issuance of 60 days or less may be valued at amortized cost, which approximates market value.
Open-end investment companies are generally valued
at net asset value per share.
Under the fund’s valuation
policy and procedures, market quotations are not considered to be readily available for debt instruments, floating rate loans, and many types of derivatives. These investments are generally valued at fair value based
on information from third-party pricing services or otherwise determined by the adviser in accordance with the adviser’s fair valuation policy and procedures. Securities and other assets generally valued on the
basis of information from a third-party pricing service may also be valued at a broker/dealer bid quotation. In determining values, third-party pricing services can utilize both transaction data and market information
such as yield, quality, coupon rate, maturity, type of issue, trading characteristics, spreads and other market data. An investment may also be valued at fair value if the adviser determines that the
investment’s value has been materially affected by events occurring after the close of the exchange or market on which the investment is principally traded (such as foreign exchange or market) and prior to the
determination of the fund’s net asset value, or after the halt of trading of a specific security where trading does not resume prior to the close of the exchange or market on which the security is principally
traded. Events that occur after foreign markets close (such as developments in foreign markets and significant movements in the U.S. markets) and prior to the determination of the fund’s net asset value may be
deemed to have a material effect on the value of securities traded in foreign markets. Accordingly, the fund’s foreign equity securities may often be valued at fair value. The adviser generally relies on
third-party pricing services or other information (such as the correlation with price movements of similar securities in the same or other markets; the type, cost and investment characteristics of the security; the
business and financial condition of the issuer; and trading and other market data) to assist in determining whether to fair value and at what value to fair value an investment. The value of an investment for purposes
of calculating the fund’s net asset value can differ depending on the source and method used to determine value. When fair valuation is used, the value of an investment used to determine the fund’s net
asset value may differ from quoted or published prices for the same investment. There can be no assurance that the fund could obtain the fair value assigned to an investment if it were to sell the investment at the
same time at which the fund determines its net asset value per share.
Various inputs are used in
determining the value of the fund's assets or liabilities. These inputs are categorized into three broad levels. In certain cases, the inputs used to measure fair value may fall into different levels of the fair value
hierarchy. In such cases, an investment's level within the fair value hierarchy is based on the lowest level of input that is significant to the fair value measurement. The fund's assessment of the significance of a
particular input to the fair value measurement in its entirety requires judgment, and considers factors specific to the investment. Level 1 includes unadjusted quoted prices in active markets for identical assets or
liabilities. Level 2 includes other significant observable market-based inputs (including quoted prices for similar securities, interest rates, prepayment speed, and credit risk). Level 3 includes significant
unobservable inputs, which may include the adviser's own assumptions in determining the fair value of investments. The following is a summary of the levels used as of March 31, 2023 in valuing the fund's assets and
liabilities:
24
Notes to Financial
Statements (unaudited) - continued
| Financial Instruments | Level 1 | Level 2 | Level 3 | Total |
| Equity Securities | $996,159,839 | $— | $— | $996,159,839 |
| Mutual Funds | 11,450,152 | — | — | 11,450,152 |
| Total | $1,007,609,991 | $— | $— | $1,007,609,991 |
For further information regarding
security characteristics, see the Portfolio of Investments.
Indemnifications — Under the fund's organizational documents, its officers and Trustees may be indemnified against certain liabilities and expenses arising out of the performance of their duties to
the fund. Additionally, in the normal course of business, the fund enters into agreements with service providers that may contain indemnification clauses. The fund's maximum exposure under these agreements is unknown
as this would involve future claims that may be made against the fund that have not yet occurred.
Investment Transactions and
Income — Investment transactions are recorded on the trade date. Dividends received in cash are recorded on the ex-dividend date. Certain dividends from foreign securities will be recorded when the fund is informed of the dividend if such information is
obtained subsequent to the ex-dividend date. Dividend payments received in additional securities are recorded on the ex-dividend date in an amount equal to the value of the security on such date. In determining the net gain or loss on securities sold, the cost of securities is determined on the identified cost basis.
The fund may receive proceeds from
litigation settlements. Any proceeds received from litigation involving portfolio holdings are reflected in the Statement of Operations in realized gain/loss if the security has been disposed of by the fund or in
unrealized gain/loss if the security is still held by the fund. Any other proceeds from litigation not related to portfolio holdings are reflected as other income in the Statement of Operations.
Tax Matters and Distributions — The fund intends to qualify as a regulated investment company, as defined under Subchapter M of the Internal Revenue Code, and to distribute all of its taxable income, including
realized capital gains. As a result, no provision for federal income tax is required. The fund’s federal tax returns, when filed, will remain subject to examination by the Internal Revenue Service for a three
year period. Management has analyzed the fund’s tax positions taken on federal and state tax returns for all open tax years and does not believe that there are any uncertain tax positions that require
recognition of a tax liability. Foreign taxes, if any, have been accrued by the fund in the accompanying financial statements in accordance with the applicable foreign tax law. Foreign income taxes may be withheld by
certain countries in which the fund invests. Additionally, capital gains realized by the fund on securities issued in or by certain foreign countries may be subject to capital gains tax imposed by those
countries.
Distributions to shareholders are
recorded on the ex-dividend date. Income and capital gain distributions are determined in accordance with income tax regulations, which may differ from U.S. generally accepted accounting principles. Certain capital
accounts in the financial statements are periodically adjusted for permanent differences in order to reflect their tax character. These adjustments have no impact on net assets or net
25
Notes to Financial
Statements (unaudited) - continued
asset value per share. Temporary differences which
arise from recognizing certain items of income, expense, gain or loss in different periods for financial statement and tax purposes will reverse at some time in the future.
Book/tax differences primarily
relate to wash sale loss deferrals and treating a portion of the proceeds from redemptions as a distribution for tax purposes.
The tax character of distributions
made during the current period will be determined at fiscal year end. The tax character of distributions declared to shareholders for the last fiscal year is as follows:
| Year ended 9/30/22 | |
| Ordinary income (including any short-term capital gains) | $55,927,177 |
| Long-term capital gains | 116,057,419 |
| Total distributions | $171,984,596 |
The federal tax cost and the tax
basis components of distributable earnings were as follows:
| As of 3/31/23 | |
| Cost of investments | $719,888,849 |
| Gross appreciation | 311,460,111 |
| Gross depreciation | (23,738,969) |
| Net unrealized appreciation (depreciation) | $287,721,142 |
| As of 9/30/22 | |
| Undistributed ordinary income | 6,533,934 |
| Undistributed long-term capital gain | 65,041,468 |
| Net unrealized appreciation (depreciation) | 181,796,381 |
The aggregate cost above includes
prior fiscal year end tax adjustments, if applicable.
Multiple Classes of Shares of
Beneficial Interest — The fund offers multiple classes of shares, which differ in their respective distribution and service fees. The fund's income, realized and unrealized gain (loss), and common
expenses are allocated to shareholders based on the daily net assets of each class. Dividends are declared separately for each class. Differences in per share dividend rates are generally due to differences in
separate class expenses. Class B and Class C shares will convert to
26
Notes to Financial
Statements (unaudited) - continued
Class A shares approximately eight years after
purchase. The fund’s distributions declared to shareholders as reported in the Statements of Changes in Net Assets are presented by class as follows:
| Six months ended 3/31/23 | Year ended 9/30/22 | ||
| Class A | $16,347,473 | $33,423,401 | |
| Class B | 710,934 | 2,234,558 | |
| Class C | 2,156,249 | 6,661,137 | |
| Class I | 40,443,381 | 80,514,448 | |
| Class R1 | 103,323 | 199,693 | |
| Class R2 | 3,113,174 | 7,300,378 | |
| Class R3 | 3,306,361 | 7,378,223 | |
| Class R4 | 670,757 | 1,603,043 | |
| Class R6 | 17,451,705 | 32,669,715 | |
| Total | $84,303,357 | $171,984,596 |
(3) Transactions with
Affiliates
Investment Adviser — The fund has an investment advisory agreement with MFS to provide overall investment management and related administrative services and facilities to the fund. The management fee is computed daily and paid monthly at the following annual rates based on the fund's average daily net assets:
| Up to $1 billion | 0.40% |
| In excess of $1 billion and up to $2.5 billion | 0.375% |
| In excess of $2.5 billion | 0.35% |
MFS has agreed in writing to reduce
its management fee by a specified amount if certain MFS mutual fund assets exceed thresholds agreed to by MFS and the fund's Board of Trustees. MFS has also agreed in writing to waive at least 0.01% of its management
fee as part of this agreement. The agreement to waive at least 0.01% of the management fee will continue until modified by the fund's Board of Trustees, but such agreement will continue at least until January 31,
2024. For the six months ended March 31, 2023, this management fee reduction amounted to $65,526, which is included in the reduction of total expenses in the Statement of Operations. The management fee incurred for
the six months ended March 31, 2023 was equivalent to an annual effective rate of 0.39% of the fund's average daily net assets.
The investment adviser has agreed in
writing to pay a portion of the fund’s total annual operating expenses, excluding interest, taxes, extraordinary expenses, brokerage and transaction costs, certain tax reclaim recovery expenses (including
contingency fees and closing agreement expenses), and investment-related expenses, such that total fund operating expenses do not exceed the following rates annually of each class’s average daily net assets:
| Classes | ||||||||
| A | B | C | I | R1 | R2 | R3 | R4 | R6 |
| 0.74% | 1.49% | 1.49% | 0.49% | 1.49% | 0.99% | 0.74% | 0.49% | 0.41% |
27
Notes to Financial
Statements (unaudited) - continued
This written agreement will continue
until modified by the fund’s Board of Trustees, but such agreement will continue at least until January 31, 2024. For the six months ended March 31, 2023, this reduction amounted to $309,048, which is included
in the reduction of total expenses in the Statement of Operations.
Distributor — MFS Fund Distributors, Inc. (MFD), a wholly-owned subsidiary of MFS, as distributor, received $17,438 for the six months ended March 31, 2023, as its portion of the initial sales
charge on sales of Class A shares of the fund.
The Board of Trustees has adopted a
distribution plan for certain share classes pursuant to Rule 12b-1 of the Investment Company Act of 1940.
The fund's distribution plan
provides that the fund will pay MFD for services provided by MFD and financial intermediaries in connection with the distribution and servicing of certain share classes. One component of the plan is a distribution fee
paid to MFD and another component of the plan is a service fee paid to MFD. MFD may subsequently pay all, or a portion, of the distribution and/or service fees to financial intermediaries.
Distribution Plan Fee Table:
| Distribution Fee Rate (d) | Service Fee Rate (d) | Total Distribution Plan (d) | Annual Effective Rate (e) | Distribution and Service Fee | |
| Class A | — | 0.25% | 0.25% | 0.25% | $ 248,878 |
| Class B | 0.75% | 0.25% | 1.00% | 1.00% | 44,457 |
| Class C | 0.75% | 0.25% | 1.00% | 1.00% | 131,678 |
| Class R1 | 0.75% | 0.25% | 1.00% | 1.00% | 6,451 |
| Class R2 | 0.25% | 0.25% | 0.50% | 0.50% | 90,350 |
| Class R3 | — | 0.25% | 0.25% | 0.25% | 50,768 |
| Total Distribution and Service Fees | $572,582 |
| (d) | In accordance with the distribution plan for certain classes, the fund pays distribution and/or service fees equal to these annual percentage rates of each class’s average daily net assets. The distribution and service fee rates disclosed by class represent the current rates in effect at the end of the reporting period. Any rate changes, if applicable, are detailed below. |
| (e) | The annual effective rates represent actual fees incurred under the distribution plan for the six months ended March 31, 2023 based on each class's average daily net assets. MFD has voluntarily agreed to rebate a portion of each class's 0.25% service fee attributable to accounts for which there is no financial intermediary specified on the account except for accounts attributable to MFS or its affiliates' seed money. For the six months ended March 31, 2023, this rebate amounted to $7, $1, and $34 for Class A, Class C, and Class R3 shares, respectively, and is included in the reduction of total expenses in the Statement of Operations. |
Certain Class A shares are subject
to a contingent deferred sales charge (CDSC) in the event of a shareholder redemption within 18 months of purchase. Class B shares are subject to a CDSC in the event of a shareholder redemption within six years of
28
Notes to Financial
Statements (unaudited) - continued
purchase. Class C shares are subject to a CDSC in
the event of a shareholder redemption within 12 months of purchase. All contingent deferred sales charges are paid to MFD and during the six months ended March 31, 2023, were as follows:
| Amount | |
| Class A | $165 |
| Class B | 1,158 |
| Class C | 264 |
Shareholder Servicing Agent — MFS Service Center, Inc. (MFSC), a wholly-owned subsidiary of MFS, receives a fee from the fund for its services as shareholder servicing agent calculated as a percentage of the
average daily net assets of the fund as determined periodically under the supervision of the fund's Board of Trustees. For the six months ended March 31, 2023, the fee was $21,988, which equated to 0.0044% annually of
the fund's average daily net assets. MFSC also receives reimbursement from the fund for out-of-pocket expenses, sub-accounting and other shareholder servicing costs which may be paid to affiliated and unaffiliated
service providers. Class R6 shares do not incur sub-accounting fees. For the six months ended March 31, 2023, these out-of-pocket expenses, sub-accounting and other shareholder servicing costs amounted to
$428,669.
Administrator — MFS provides certain financial, legal, shareholder communications, compliance, and other administrative services to the fund. Under an administrative services agreement, the fund
reimburses MFS the costs incurred to provide these services. The fund is charged an annual fixed amount of $17,500 plus a fee based on average daily net assets. The administrative services fee incurred for the six
months ended March 31, 2023 was equivalent to an annual effective rate of 0.0158% of the fund's average daily net assets.
Trustees’ and Officers’
Compensation — The fund pays compensation to independent Trustees in the form of a retainer, attendance fees, and additional compensation to Board and Committee chairpersons. The fund does not
pay compensation directly to Trustees or officers of the fund who are also officers of the investment adviser, all of whom receive remuneration from MFS for their services to the fund. Certain officers and Trustees of
the fund are officers or directors of MFS, MFD, and MFSC.
Other — The fund invests in the MFS Institutional Money Market Portfolio which is managed by MFS and seeks current income consistent with preservation of capital and liquidity. This money
market fund does not pay a management fee to MFS but does incur investment and operating costs.
The adviser has voluntarily
undertaken to reimburse the fund from its own resources on a quarterly basis for the cost of investment research embedded in the cost of the fund’s securities trades. This agreement may be rescinded at any time.
For the six months ended March 31, 2023, this reimbursement amounted to $16,984, which is included in “Other” income in the Statement of Operations.
(4) Portfolio Securities
For the six months ended March 31,
2023, purchases and sales of investments, other than short-term obligations, aggregated $198,269,364 and $245,913,878, respectively.
29
Notes to Financial
Statements (unaudited) - continued
(5) Shares of Beneficial
Interest
The fund's Declaration of Trust
permits the Trustees to issue an unlimited number of full and fractional shares of beneficial interest. Transactions in fund shares were as follows:
| Six months ended 3/31/23 | Year ended 9/30/22 | ||||
| Shares | Amount | Shares | Amount | ||
| Shares sold | |||||
| Class A | 619,454 | $16,433,236 | 990,399 | $30,081,119 | |
| Class B | 321 | 8,003 | 6,688 | 202,936 | |
| Class C | 25,218 | 633,599 | 42,186 | 1,213,794 | |
| Class I | 1,768,191 | 48,410,123 | 3,516,308 | 109,656,456 | |
| Class R1 | 5,351 | 132,912 | 5,777 | 167,334 | |
| Class R2 | 76,942 | 1,924,451 | 193,336 | 5,789,614 | |
| Class R3 | 123,292 | 3,253,085 | 312,403 | 9,584,825 | |
| Class R4 | 16,169 | 435,719 | 40,101 | 1,258,205 | |
| Class R6 | 988,435 | 27,095,936 | 812,356 | 24,679,550 | |
| 3,623,373 | $98,327,064 | 5,919,554 | $182,633,833 | ||
| Shares issued to shareholders in reinvestment of distributions | |||||
| Class A | 564,362 | $14,944,317 | 936,278 | $29,904,719 | |
| Class B | 28,062 | 707,447 | 71,839 | 2,188,229 | |
| Class C | 86,514 | 2,131,696 | 221,632 | 6,613,497 | |
| Class I | 1,479,412 | 39,929,339 | 2,442,390 | 79,402,101 | |
| Class R1 | 4,160 | 103,323 | 6,628 | 199,693 | |
| Class R2 | 125,279 | 3,113,173 | 242,296 | 7,300,378 | |
| Class R3 | 125,383 | 3,306,361 | 231,874 | 7,378,223 | |
| Class R4 | 25,188 | 670,757 | 49,939 | 1,603,043 | |
| Class R6 | 627,419 | 16,965,409 | 971,665 | 31,637,404 | |
| 3,065,779 | $81,871,822 | 5,174,541 | $166,227,287 | ||
| Shares reacquired | |||||
| Class A | (510,670) | $(13,677,425) | (1,227,486) | $(37,845,712) | |
| Class B | (107,854) | (2,738,126) | (166,955) | (4,919,117) | |
| Class C | (307,955) | (7,625,107) | (525,182) | (15,114,557) | |
| Class I | (3,015,511) | (83,048,710) | (3,946,382) | (125,810,643) | |
| Class R1 | (2,065) | (51,436) | (4,975) | (149,216) | |
| Class R2 | (208,967) | (5,172,523) | (486,651) | (14,665,225) | |
| Class R3 | (161,422) | (4,424,223) | (516,141) | (16,379,379) | |
| Class R4 | (12,397) | (331,826) | (166,115) | (5,437,774) | |
| Class R6 | (1,087,981) | (28,770,490) | (1,142,623) | (36,587,298) | |
| (5,414,822) | $(145,839,866) | (8,182,510) | $(256,908,921) | ||
30
Notes to Financial
Statements (unaudited) - continued
| Six months ended 3/31/23 | Year ended 9/30/22 | ||||
| Shares | Amount | Shares | Amount | ||
| Net change | |||||
| Class A | 673,146 | $17,700,128 | 699,191 | $22,140,126 | |
| Class B | (79,471) | (2,022,676) | (88,428) | (2,527,952) | |
| Class C | (196,223) | (4,859,812) | (261,364) | (7,287,266) | |
| Class I | 232,092 | 5,290,752 | 2,012,316 | 63,247,914 | |
| Class R1 | 7,446 | 184,799 | 7,430 | 217,811 | |
| Class R2 | (6,746) | (134,899) | (51,019) | (1,575,233) | |
| Class R3 | 87,253 | 2,135,223 | 28,136 | 583,669 | |
| Class R4 | 28,960 | 774,650 | (76,075) | (2,576,526) | |
| Class R6 | 527,873 | 15,290,855 | 641,398 | 19,729,656 | |
| 1,274,330 | $34,359,020 | 2,911,585 | $91,952,199 | ||
The fund is one of several mutual
funds in which certain MFS funds may invest. The MFS funds do not invest in the underlying funds for the purpose of exercising management or control. At the end of the period, the MFS Lifetime 2040 Fund, the MFS
Lifetime 2030 Fund, the MFS Lifetime 2035 Fund, the MFS Lifetime 2050 Fund, the MFS Lifetime 2045 Fund, the MFS Lifetime Income Fund, and the MFS Lifetime 2055 Fund were each the owners of record of approximately 3%,
2%, 2%, 2%, 2%, 1%, and 1%, respectively, of the value of outstanding voting shares of the fund. In addition, the MFS Lifetime 2025 Fund, the MFS Lifetime 2060 Fund, and the MFS Lifetime 2065 Fund were each the owners
of record of less than 1% of the value of outstanding voting shares of the fund.
Effective June 1, 2019, purchases of
the fund’s Class B shares were closed to new and existing investors subject to certain exceptions. On March 30, 2023, the fund announced that effective after the close of business on September 29, 2023,
purchases of Class R1 and Class R2 shares will be closed to new eligible investors.
(6) Line of Credit
The fund and certain other funds
managed by MFS participate in a $1.45 billion unsecured committed line of credit of which $1.2 billion is reserved for use by the fund and certain other MFS U.S. funds. The line of credit is provided by a syndicate of
banks under a credit agreement. Borrowings may be made for temporary financing needs. Interest is charged to each fund, based on its borrowings, generally at a rate equal to the highest of 1) Daily Simple SOFR
(Secured Overnight Financing Rate) plus 0.10%, 2) the Federal Funds Effective Rate, or 3) the Overnight Bank Funding Rate, each plus an agreed upon spread. A commitment fee, based on the average daily unused portion
of the committed line of credit, is allocated among the participating funds. The line of credit expires on March 14, 2024 unless extended or renewed. In addition, the fund and other funds managed by MFS have
established unsecured uncommitted borrowing arrangements with certain banks for temporary financing needs. Interest is charged to each fund, based on its borrowings, at rates equal to customary reference rates plus an
agreed upon spread. For the six months ended March 31, 2023, the fund’s commitment fee and interest expense were $2,557 and $0, respectively, and are included in “Miscellaneous” expense in the
Statement of Operations.
31
Notes to Financial
Statements (unaudited) - continued
(7) Investments in Affiliated
Issuers
An affiliated issuer may be
considered one in which the fund owns 5% or more of the outstanding voting securities, or a company which is under common control. For the purposes of this report, the following were affiliated issuers:
| Affiliated Issuers | Beginning Value | Purchases | Sales Proceeds | Realized Gain (Loss) | Change in Unrealized Appreciation or Depreciation | Ending Value |
| MFS Institutional Money Market Portfolio | $6,208,959 | $67,036,678 | $61,794,550 | $(2,573) | $1,638 | $11,450,152 |
| Affiliated Issuers | Dividend Income | Capital Gain Distributions |
| MFS Institutional Money Market Portfolio | $196,339 | $— |
(8) LIBOR Transition
Certain of the fund's investments,
including investments in certain debt instruments and derivatives (if any), as well as borrowings by the fund and certain other contractual arrangements of the fund, may be based on the London Interbank Offered Rate
(“LIBOR”). In 2017, the regulatory authority that oversees financial services firms in the United Kingdom announced plans to transition away from LIBOR by the end of 2021. In March 2021, the administrator
of LIBOR announced the extension of the publication of the more commonly used U.S. dollar LIBOR settings to the end of June 2023. Although the full impacts of the transition away from LIBOR are not fully known, the
transition may result in, among other things, an increase in volatility or illiquidity of the markets for instruments that currently rely on LIBOR to determine interest rates and this could have an adverse impact on
the fund's performance. With respect to the fund's accounting for investments, including investments in certain debt instruments and derivatives, as well as borrowings by the fund and any other contractual
arrangements of the fund that undergo reference rate-related modifications as a result of the transition, management will rely upon the relief provided by FASB Codification Topic 848 – Reference Rate Reform
(Topic 848). The guidance in Topic 848 permits the fund to account for those modified contracts as a continuation of the existing contracts. The situation remains fluid, and management believes, based on best
available information, that the impact of the transition will not be material to the fund.
32
Statement Regarding Liquidity Risk Management
Program
The fund has adopted and
implemented a liquidity risk management program (the “Program”) as required by Rule 22e-4 under the Investment Company Act of 1940, as amended. The fund’s Board of Trustees (the “Board”)
has designated MFS as the administrator of the Program. The Program is reasonably designed to assess and manage the liquidity risk of the fund. Liquidity risk is the risk that the fund could not meet requests to
redeem shares issued by the fund without significant dilution of remaining investors' interests.
MFS provided a written report to the
Board for consideration at its March 2023 meeting that addressed the operation of the Program and provided an assessment of the adequacy and effectiveness of the Program during the period from January 1, 2022 to
December 31, 2022 (the “Covered Period”). The report concluded that during the Covered Period the Program had operated effectively in all material respects and had adequately and effectively been
implemented to assess and manage the fund’s liquidity risk. MFS also reported that there were no liquidity events that impacted the fund or its ability to timely meet redemptions without dilution to existing
shareholders during the Covered Period.
There can be no assurance that the
Program will achieve its objectives in the future. Further information on liquidity risk, and other principal risks to which an investment in the fund may be subject, can be found in the prospectus.
33
Proxy Voting Policies and
Information
MFS votes proxies on behalf of the
fund pursuant to proxy voting policies and procedures that are available without charge, upon request, by calling 1-800-225-2606, by visiting mfs.com/proxyvoting, or by visiting the SEC’s Web site at http://www.sec.gov.
Information regarding how the fund
voted proxies relating to portfolio securities during the most recent twelve-month period ended June 30 is available by August 31 of each year without charge by visiting mfs.com/proxyvoting, or by visiting the SEC’s Web site at http://www.sec.gov.
Quarterly Portfolio
Disclosure
The fund files a complete schedule
of portfolio holdings with the SEC for the first and third quarters of each fiscal year as an exhibit to its reports on Form N-PORT. The fund's Form N-PORT reports are available on the SEC's Web site at http://www.sec.gov. A shareholder can obtain the portfolio holdings report for the first and third quarters of the fund's fiscal year at mfs.com/openendfunds by choosing the fund's name and then scrolling to the “Resources” section and clicking on the “Prospectus and Reports” tab.
Further Information
From time to time, MFS may post
important information about the fund or the MFS Funds on the MFS Web site (mfs.com). This information is available at https://www.mfs.com/announcements or at mfs.com/openendfunds by choosing the fund’s name and then scrolling to the “Resources” section and clicking on the “Announcements” tab, if any.
Information About Fund
Contracts and Legal Claims
The fund has entered into
contractual arrangements with an investment adviser, administrator, distributor, shareholder servicing agent, and custodian who each provide services to the fund. Unless expressly stated otherwise, shareholders are
not parties to, or intended beneficiaries of these contractual arrangements, and these contractual arrangements are not intended to create any shareholder right to enforce them against the service providers or to seek
any remedy under them against the service providers, either directly or on behalf of the fund.
Under the Trust’s By-Laws and
Declaration of Trust, any claims asserted against or on behalf of the MFS Funds, including claims against Trustees and Officers, must be brought in state and federal courts located within the Commonwealth of
Massachusetts.
Provision of Financial
Reports and Summary Prospectuses
The fund produces financial reports
every six months and updates its summary prospectus and prospectus annually. To avoid sending duplicate copies of materials to households, only one copy of the fund’s annual and semiannual report and summary
prospectus may be mailed to shareholders having the same last name and residential address on the fund’s records. However, any shareholder may contact MFSC (please see back cover for address and telephone
number) to request that copies of these reports and summary prospectuses be sent personally to that shareholder.
34
