falseFY20230000910638P1Yhttp://fasb.org/us-gaap/2023#NonoperatingIncomeExpenseone yearhttp://fasb.org/us-gaap/2023#GoodwillAndIntangibleAssetImpairmenthttp://fasb.org/us-gaap/2023#GoodwillAndIntangibleAssetImpairmentP1Yhttp://fasb.org/us-gaap/2023#AccruedLiabilitiesCurrenthttp://fasb.org/us-gaap/2023#AccruedLiabilitiesCurrenthttp://fasb.org/us-gaap/2023#OtherLiabilitiesNoncurrenthttp://fasb.org/us-gaap/2023#OtherLiabilitiesNoncurrent0.0278364http://fasb.org/us-gaap/2023#OtherComprehensiveIncomeLossNetOfTaxhttp://fasb.org/us-gaap/2023#OtherComprehensiveIncomeLossNetOfTaxhttp://fasb.org/us-gaap/2023#OtherComprehensiveIncomeLossNetOfTaxP90D0.33330.33330.3333iso4217:USDxbrli:sharesiso4217:USDxbrli:sharesxbrli:pureiso4217:EURddd:milestoneddd:buildingddd:dayddd:voteddd:trancheddd:segmentddd:installmentddd:shareholder00009106382023-01-012023-12-3100009106382023-06-3000009106382024-08-0500009106382023-10-012023-12-3100009106382023-12-3100009106382022-12-310000910638us-gaap:ProductMember2023-01-012023-12-310000910638us-gaap:ProductMember2022-01-012022-12-310000910638us-gaap:ProductMember2021-01-012021-12-310000910638us-gaap:ServiceMember2023-01-012023-12-310000910638us-gaap:ServiceMember2022-01-012022-12-310000910638us-gaap:ServiceMember2021-01-012021-12-3100009106382022-01-012022-12-3100009106382021-01-012021-12-3100009106382021-12-3100009106382020-12-310000910638us-gaap:CommonStockMember2020-12-310000910638us-gaap:AdditionalPaidInCapitalMember2020-12-310000910638us-gaap:TreasuryStockCommonMember2020-12-310000910638us-gaap:RetainedEarningsMember2020-12-310000910638us-gaap:AccumulatedOtherComprehensiveIncomeMember2020-12-310000910638us-gaap:CommonStockMember2021-01-012021-12-310000910638us-gaap:AdditionalPaidInCapitalMember2021-01-012021-12-310000910638us-gaap:RetainedEarningsMember2021-01-012021-12-310000910638us-gaap:AccumulatedOtherComprehensiveIncomeMember2021-01-012021-12-310000910638us-gaap:TreasuryStockCommonMember2021-01-012021-12-310000910638us-gaap:CommonStockMember2021-12-310000910638us-gaap:AdditionalPaidInCapitalMember2021-12-310000910638us-gaap:TreasuryStockCommonMember2021-12-310000910638us-gaap:RetainedEarningsMember2021-12-310000910638us-gaap:AccumulatedOtherComprehensiveIncomeMember2021-12-310000910638us-gaap:CommonStockMember2022-01-012022-12-310000910638us-gaap:AdditionalPaidInCapitalMember2022-01-012022-12-310000910638us-gaap:RetainedEarningsMember2022-01-012022-12-310000910638us-gaap:AccumulatedOtherComprehensiveIncomeMember2022-01-012022-12-310000910638us-gaap:CommonStockMember2022-12-310000910638us-gaap:AdditionalPaidInCapitalMember2022-12-310000910638us-gaap:TreasuryStockCommonMember2022-12-310000910638us-gaap:RetainedEarningsMember2022-12-310000910638us-gaap:AccumulatedOtherComprehensiveIncomeMember2022-12-310000910638us-gaap:CommonStockMember2023-01-012023-12-310000910638us-gaap:AdditionalPaidInCapitalMember2023-01-012023-12-310000910638us-gaap:RetainedEarningsMember2023-01-012023-12-310000910638us-gaap:AccumulatedOtherComprehensiveIncomeMember2023-01-012023-12-310000910638us-gaap:CommonStockMember2023-12-310000910638us-gaap:AdditionalPaidInCapitalMember2023-12-310000910638us-gaap:TreasuryStockCommonMember2023-12-310000910638us-gaap:RetainedEarningsMember2023-12-310000910638us-gaap:AccumulatedOtherComprehensiveIncomeMember2023-12-310000910638us-gaap:CustomerConcentrationRiskMemberus-gaap:AccountsReceivableMemberddd:OneCustomerMember2022-01-012022-12-310000910638srt:MinimumMember2023-12-310000910638srt:MaximumMember2023-12-310000910638ddd:WematterABMember2023-07-010000910638ddd:WematterABMember2023-07-012023-07-010000910638ddd:WematterABMember2023-01-012023-12-310000910638us-gaap:TradeNamesMemberddd:WematterABMember2023-07-010000910638us-gaap:DevelopedTechnologyRightsMemberddd:WematterABMember2023-07-010000910638us-gaap:CustomerRelationshipsMemberddd:WematterABMember2023-07-010000910638us-gaap:TradeNamesMemberddd:WematterABMember2023-07-012023-07-010000910638us-gaap:DevelopedTechnologyRightsMemberddd:WematterABMember2023-07-012023-07-010000910638us-gaap:CustomerRelationshipsMemberddd:WematterABMember2023-07-012023-07-010000910638ddd:IndustrialSegmentMemberddd:WematterABMember2023-01-012023-12-310000910638ddd:IndustrialSegmentMember2023-01-012023-12-310000910638ddd:WematterABMember2022-01-012022-12-310000910638ddd:DpPolarGmbHMember2022-10-040000910638ddd:DpPolarGmbHMember2022-10-042022-10-040000910638us-gaap:InProcessResearchAndDevelopmentMemberddd:DpPolarGmbHMember2022-10-040000910638us-gaap:TradeNamesMemberddd:DpPolarGmbHMember2022-10-040000910638ddd:KumovisGmbHMember2022-04-010000910638ddd:KumovisGmbHMember2022-04-012022-04-010000910638ddd:KumovisGmbHMember2022-01-012022-12-310000910638ddd:KumovisGmbHMemberddd:KumovisGmbHMember2022-04-010000910638ddd:ProductTechnologyMemberddd:KumovisGmbHMember2022-04-010000910638us-gaap:TradeNamesMemberddd:KumovisGmbHMember2022-04-010000910638ddd:TitanAdditiveLLCMember2022-04-010000910638ddd:TitanAdditiveLLCMember2022-04-012022-04-010000910638ddd:TitanAdditiveLLCMember2022-01-012022-12-310000910638ddd:ProductTechnologyMemberddd:TitanAdditiveLLCMember2022-04-010000910638us-gaap:TradeNamesMemberddd:TitanAdditiveLLCMember2022-04-010000910638ddd:VolumetricBiotechnologiesIncMember2021-12-010000910638ddd:VolumetricBiotechnologiesIncMember2021-12-012021-12-010000910638ddd:ProductTechnologyMemberddd:VolumetricBiotechnologiesIncMember2021-12-010000910638us-gaap:CustomerRelationshipsMemberddd:VolumetricBiotechnologiesIncMember2021-12-010000910638ddd:OqtonIncMember2021-11-012021-11-010000910638ddd:OqtonIncMember2021-01-012021-12-310000910638ddd:OqtonIncMember2021-11-010000910638ddd:ProductTechnologyMemberddd:OqtonIncMember2021-11-010000910638us-gaap:TradeNamesMemberddd:OqtonIncMember2021-11-010000910638ddd:WuxiEasywayMember2018-12-310000910638ddd:WuxiEasywayMember2019-01-210000910638ddd:WuxiEasywayMember2019-01-212019-01-210000910638ddd:WuxiEasywayMember2022-01-012022-12-310000910638ddd:WuxiEasywayMember2022-12-310000910638us-gaap:DisposalGroupDisposedOfBySaleNotDiscontinuedOperationsMemberddd:OnDemandManufacturingMember2021-09-012021-09-300000910638us-gaap:DisposalGroupDisposedOfBySaleNotDiscontinuedOperationsMemberddd:OnDemandManufacturingMember2021-01-012021-12-310000910638us-gaap:DisposalGroupDisposedOfBySaleNotDiscontinuedOperationsMemberddd:SimbionixUSACorporationMember2021-08-242021-08-240000910638us-gaap:DisposalGroupDisposedOfBySaleNotDiscontinuedOperationsMemberddd:SimbionixUSACorporationMember2021-01-012021-12-310000910638us-gaap:DisposalGroupDisposedOfBySaleNotDiscontinuedOperationsMemberddd:GIBBSCamCimatronMember2021-01-012021-01-010000910638us-gaap:DisposalGroupDisposedOfBySaleNotDiscontinuedOperationsMemberddd:GIBBSCamCimatronMember2021-01-012021-12-3100009106382024-01-012023-12-3100009106382025-01-012023-12-310000910638us-gaap:CollaborativeArrangementMember2023-01-012023-12-310000910638us-gaap:CollaborativeArrangementMember2022-01-012022-12-310000910638us-gaap:CollaborativeArrangementMember2021-01-012021-12-310000910638us-gaap:CustomerConcentrationRiskMemberus-gaap:RevenueFromContractWithCustomerMemberddd:OneCustomerMember2023-01-012023-12-310000910638us-gaap:CustomerConcentrationRiskMemberus-gaap:RevenueFromContractWithCustomerMemberddd:OneCustomerMember2022-01-012022-12-310000910638us-gaap:CustomerConcentrationRiskMemberus-gaap:RevenueFromContractWithCustomerMemberddd:OneCustomerMember2021-01-012021-12-310000910638srt:AmericasMember2023-01-012023-12-310000910638srt:AmericasMember2022-01-012022-12-310000910638srt:AmericasMember2021-01-012021-12-310000910638us-gaap:EMEAMember2023-01-012023-12-310000910638us-gaap:EMEAMember2022-01-012022-12-310000910638us-gaap:EMEAMember2021-01-012021-12-310000910638srt:AsiaPacificMember2023-01-012023-12-310000910638srt:AsiaPacificMember2022-01-012022-12-310000910638srt:AsiaPacificMember2021-01-012021-12-310000910638country:US2023-01-012023-12-310000910638country:US2022-01-012022-12-310000910638country:US2021-01-012021-12-310000910638country:DE2023-01-012023-12-310000910638country:DE2022-01-012022-12-310000910638country:DE2021-01-012021-12-310000910638us-gaap:InventoriesMember2022-01-012022-12-310000910638us-gaap:CapitalAdditionsMember2022-01-012022-12-310000910638us-gaap:BuildingMember2023-12-310000910638us-gaap:BuildingMember2022-12-310000910638srt:MinimumMemberus-gaap:BuildingMember2023-12-310000910638srt:MaximumMemberus-gaap:BuildingMember2023-12-310000910638us-gaap:MachineryAndEquipmentMember2023-12-310000910638us-gaap:MachineryAndEquipmentMember2022-12-310000910638srt:MinimumMemberus-gaap:MachineryAndEquipmentMember2023-12-310000910638srt:MaximumMemberus-gaap:MachineryAndEquipmentMember2023-12-310000910638us-gaap:ComputerSoftwareIntangibleAssetMember2023-12-310000910638us-gaap:ComputerSoftwareIntangibleAssetMember2022-12-310000910638srt:MinimumMemberus-gaap:ComputerSoftwareIntangibleAssetMember2023-12-310000910638srt:MaximumMemberus-gaap:ComputerSoftwareIntangibleAssetMember2023-12-310000910638ddd:OfficeFurnitureAndEquipmentMember2023-12-310000910638ddd:OfficeFurnitureAndEquipmentMember2022-12-310000910638srt:MinimumMemberddd:OfficeFurnitureAndEquipmentMember2023-12-310000910638srt:MaximumMemberddd:OfficeFurnitureAndEquipmentMember2023-12-310000910638us-gaap:LeaseholdImprovementsMember2023-12-310000910638us-gaap:LeaseholdImprovementsMember2022-12-310000910638us-gaap:ConstructionInProgressMember2023-12-310000910638us-gaap:ConstructionInProgressMember2022-12-310000910638us-gaap:PropertyPlantAndEquipmentMember2023-01-012023-12-310000910638us-gaap:PropertyPlantAndEquipmentMember2022-01-012022-12-310000910638us-gaap:PropertyPlantAndEquipmentMember2021-01-012021-12-310000910638us-gaap:CustomerRelationshipsMember2023-12-310000910638us-gaap:CustomerRelationshipsMember2022-12-310000910638us-gaap:CustomerRelationshipsMember2023-01-012023-12-310000910638ddd:AcquiredTechnologyMember2023-12-310000910638ddd:AcquiredTechnologyMember2022-12-310000910638ddd:AcquiredTechnologyMember2023-01-012023-12-310000910638us-gaap:TradeNamesMember2023-12-310000910638us-gaap:TradeNamesMember2022-12-310000910638us-gaap:TradeNamesMember2023-01-012023-12-310000910638us-gaap:PatentsMember2023-12-310000910638us-gaap:PatentsMember2022-12-310000910638us-gaap:PatentsMember2023-01-012023-12-310000910638us-gaap:PatentedTechnologyMember2023-12-310000910638us-gaap:PatentedTechnologyMember2022-12-310000910638us-gaap:PatentedTechnologyMember2023-01-012023-12-310000910638us-gaap:OtherIntangibleAssetsMember2023-12-310000910638us-gaap:OtherIntangibleAssetsMember2022-12-310000910638us-gaap:OtherIntangibleAssetsMember2023-01-012023-12-310000910638ddd:AcquiredTechnologyAndTradeNamesMember2023-07-012023-09-3000009106382023-07-012023-09-300000910638ddd:HealthcareSegmentMember2022-12-310000910638ddd:IndustrialSegmentMember2022-12-310000910638ddd:HealthcareSegmentMember2023-01-012023-12-310000910638ddd:HealthcareSegmentMember2023-12-310000910638ddd:IndustrialSegmentMember2023-12-310000910638ddd:SaudiArabianIndustrialInvestmentsCompanyMember2022-03-310000910638ddd:SaudiArabianIndustrialInvestmentsCompanyMember2022-12-310000910638ddd:SaudiArabianIndustrialInvestmentsCompanyMember2023-02-280000910638ddd:SaudiArabianIndustrialInvestmentsCompanyMember2023-04-300000910638ddd:SaudiArabianIndustrialInvestmentsCompanyMember2023-12-310000910638us-gaap:RelatedPartyMemberddd:SaudiArabianIndustrialInvestmentsCompanyMember2023-01-012023-12-310000910638us-gaap:RelatedPartyMemberddd:SaudiArabianIndustrialInvestmentsCompanyMember2023-12-310000910638ddd:TheradaptiveIncMember2023-06-300000910638us-gaap:PreferredStockMemberddd:TheradaptiveIncMemberus-gaap:SeriesAPreferredStockMember2023-06-300000910638ddd:TheradaptiveIncMember2023-01-012023-12-310000910638ddd:EntachIncMember2022-03-310000910638us-gaap:WarrantMemberddd:EntachIncMember2022-03-310000910638ddd:EntachIncMember2023-12-310000910638ddd:EntachIncMember2022-12-310000910638ddd:EntachIncMember2023-01-012023-12-310000910638srt:MinimumMember2023-01-012023-12-310000910638srt:MaximumMember2023-01-012023-12-310000910638us-gaap:ConvertibleDebtMemberddd:ConvertibleSeniorNotesDue2026Member2021-11-160000910638us-gaap:ConvertibleDebtMemberddd:ConvertibleSeniorNotesDue2026Member2021-11-162021-11-1600009106382021-11-1600009106382023-12-012023-12-310000910638srt:ScenarioForecastMember2024-01-012024-12-310000910638srt:ScenarioForecastMember2025-01-012025-12-310000910638srt:ScenarioForecastMember2026-01-012026-12-310000910638us-gaap:ConvertibleDebtMemberddd:ConvertibleSeniorNotesDue2026Member2023-12-310000910638us-gaap:ConvertibleDebtMemberddd:ConvertibleSeniorNotesDue2026Member2023-12-012023-12-310000910638us-gaap:ConvertibleDebtMemberddd:ConvertibleSeniorNotesDue2026Member2023-01-012023-12-310000910638us-gaap:SubsequentEventMemberddd:ConvertibleSeniorNotesDue2026Memberus-gaap:ConvertibleDebtMember2024-03-080000910638ddd:KumovisGmbHMember2022-04-010000910638us-gaap:PhantomShareUnitsPSUsMemberddd:SystemicBioPhantomUnitPlanMember2023-01-012023-12-310000910638ddd:VolumetricMember2023-12-310000910638ddd:VolumetricMember2021-12-012021-12-010000910638us-gaap:PerformanceSharesMember2021-12-010000910638ddd:VolumetricMember2023-01-012023-12-310000910638ddd:VolumetricMember2022-01-012022-12-310000910638ddd:IncentiveAwardsMember2023-01-012023-12-310000910638ddd:IncentiveAwardsMember2022-01-012022-12-310000910638ddd:IncentiveAwardsMember2021-01-012021-12-310000910638ddd:VolumetricBiotechnologiesIncMember2023-01-012023-12-310000910638ddd:VolumetricBiotechnologiesIncMember2022-01-012022-12-310000910638ddd:VolumetricBiotechnologiesIncMember2021-01-012021-12-310000910638ddd:DpPolarGmbHMember2023-01-012023-12-310000910638ddd:DpPolarGmbHMember2022-01-012022-12-310000910638ddd:DpPolarGmbHMember2021-01-012021-12-310000910638us-gaap:RestrictedStockUnitsRSUMember2022-12-310000910638us-gaap:RestrictedStockUnitsRSUMember2023-01-012023-12-310000910638us-gaap:RestrictedStockUnitsRSUMember2023-12-310000910638ddd:RestrictedStockMarketConditionsMember2023-01-012023-12-310000910638ddd:RestrictedStockPerformanceMeasuresMember2023-01-012023-12-310000910638ddd:SystemicBioPhantomUnitPlanMember2023-12-310000910638srt:MinimumMemberus-gaap:PhantomShareUnitsPSUsMemberddd:SystemicBioPhantomUnitPlanMember2023-10-012023-12-310000910638srt:MaximumMemberus-gaap:PhantomShareUnitsPSUsMemberddd:SystemicBioPhantomUnitPlanMember2023-10-012023-12-310000910638us-gaap:PhantomShareUnitsPSUsMember2023-12-310000910638us-gaap:PhantomShareUnitsPSUsMember2023-01-012023-12-310000910638ddd:StockOptionsAndRestrictedStockAwardsMemberddd:TwoThousandFifteenPlanMember2023-01-012023-12-310000910638us-gaap:ShareBasedCompensationAwardTrancheTwoMember2023-01-012023-12-310000910638us-gaap:ShareBasedCompensationAwardTrancheThreeMember2023-01-012023-12-310000910638us-gaap:ShareBasedCompensationAwardTrancheOneMember2023-01-012023-12-310000910638ddd:OnDemandManufacturingSimbionixUSAAndGIBBSCamCimatronMember2022-01-012022-12-310000910638us-gaap:DomesticCountryMember2023-12-310000910638us-gaap:StateAndLocalJurisdictionMember2023-12-310000910638us-gaap:ValuationAllowanceOfDeferredTaxAssetsMember2022-12-310000910638us-gaap:ValuationAllowanceOfDeferredTaxAssetsMember2023-01-012023-12-310000910638us-gaap:ValuationAllowanceOfDeferredTaxAssetsMember2023-12-310000910638us-gaap:ValuationAllowanceOfDeferredTaxAssetsMember2021-12-310000910638us-gaap:ValuationAllowanceOfDeferredTaxAssetsMember2022-01-012022-12-310000910638us-gaap:ValuationAllowanceOfDeferredTaxAssetsMember2020-12-310000910638us-gaap:ValuationAllowanceOfDeferredTaxAssetsMember2021-01-012021-12-310000910638us-gaap:RestrictedStockMember2021-01-012021-12-310000910638ddd:RestrictedStockAndRestrictedStockUnitMember2023-01-012023-12-310000910638ddd:RestrictedStockAndRestrictedStockUnitMember2022-01-012022-12-310000910638ddd:RestrictedStockAndRestrictedStockUnitMember2021-01-012021-12-310000910638us-gaap:StockOptionMember2023-01-012023-12-310000910638us-gaap:StockOptionMember2022-01-012022-12-310000910638us-gaap:StockOptionMember2021-01-012021-12-310000910638ddd:DpPolarGmbHMember2023-01-012023-12-310000910638us-gaap:RestrictedStockMember2022-01-012022-12-310000910638ddd:DpPolarGmbHMember2022-01-012022-12-310000910638us-gaap:SeniorNotesMemberddd:ConvertibleSeniorNotesDue2026Member2021-11-160000910638us-gaap:SeniorNotesMemberddd:ConvertibleSeniorNotesDue2026Member2021-11-162021-11-160000910638us-gaap:AccumulatedForeignCurrencyAdjustmentIncludingPortionAttributableToNoncontrollingInterestMember2020-12-310000910638us-gaap:AccumulatedDefinedBenefitPlansAdjustmentIncludingPortionAttributableToNoncontrollingInterestMember2020-12-310000910638us-gaap:AccumulatedGainLossCashFlowHedgeIncludingNoncontrollingInterestMember2020-12-310000910638ddd:AccumulatedUnrealizedLossOnShortTermInvestmentIncludingPortionAttributableToNoncontrollingInterestMember2020-12-310000910638us-gaap:AociIncludingPortionAttributableToNoncontrollingInterestMember2020-12-310000910638us-gaap:AccumulatedForeignCurrencyAdjustmentIncludingPortionAttributableToNoncontrollingInterestMember2021-01-012021-12-310000910638us-gaap:AccumulatedDefinedBenefitPlansAdjustmentIncludingPortionAttributableToNoncontrollingInterestMember2021-01-012021-12-310000910638us-gaap:AccumulatedGainLossCashFlowHedgeIncludingNoncontrollingInterestMember2021-01-012021-12-310000910638ddd:AccumulatedUnrealizedLossOnShortTermInvestmentIncludingPortionAttributableToNoncontrollingInterestMember2021-01-012021-12-310000910638us-gaap:AccumulatedForeignCurrencyAdjustmentIncludingPortionAttributableToNoncontrollingInterestMember2021-12-310000910638us-gaap:AccumulatedDefinedBenefitPlansAdjustmentIncludingPortionAttributableToNoncontrollingInterestMember2021-12-310000910638us-gaap:AccumulatedGainLossCashFlowHedgeIncludingNoncontrollingInterestMember2021-12-310000910638ddd:AccumulatedUnrealizedLossOnShortTermInvestmentIncludingPortionAttributableToNoncontrollingInterestMember2021-12-310000910638us-gaap:AociIncludingPortionAttributableToNoncontrollingInterestMember2021-12-310000910638us-gaap:AccumulatedForeignCurrencyAdjustmentIncludingPortionAttributableToNoncontrollingInterestMember2022-01-012022-12-310000910638us-gaap:AccumulatedDefinedBenefitPlansAdjustmentIncludingPortionAttributableToNoncontrollingInterestMember2022-01-012022-12-310000910638us-gaap:AccumulatedGainLossCashFlowHedgeIncludingNoncontrollingInterestMember2022-01-012022-12-310000910638ddd:AccumulatedUnrealizedLossOnShortTermInvestmentIncludingPortionAttributableToNoncontrollingInterestMember2022-01-012022-12-310000910638us-gaap:AccumulatedForeignCurrencyAdjustmentIncludingPortionAttributableToNoncontrollingInterestMember2022-12-310000910638us-gaap:AccumulatedDefinedBenefitPlansAdjustmentIncludingPortionAttributableToNoncontrollingInterestMember2022-12-310000910638us-gaap:AccumulatedGainLossCashFlowHedgeIncludingNoncontrollingInterestMember2022-12-310000910638ddd:AccumulatedUnrealizedLossOnShortTermInvestmentIncludingPortionAttributableToNoncontrollingInterestMember2022-12-310000910638us-gaap:AociIncludingPortionAttributableToNoncontrollingInterestMember2022-12-310000910638us-gaap:AccumulatedForeignCurrencyAdjustmentIncludingPortionAttributableToNoncontrollingInterestMember2023-01-012023-12-310000910638us-gaap:AccumulatedDefinedBenefitPlansAdjustmentIncludingPortionAttributableToNoncontrollingInterestMember2023-01-012023-12-310000910638us-gaap:AccumulatedGainLossCashFlowHedgeIncludingNoncontrollingInterestMember2023-01-012023-12-310000910638ddd:AccumulatedUnrealizedLossOnShortTermInvestmentIncludingPortionAttributableToNoncontrollingInterestMember2023-01-012023-12-310000910638us-gaap:AccumulatedForeignCurrencyAdjustmentIncludingPortionAttributableToNoncontrollingInterestMember2023-12-310000910638us-gaap:AccumulatedDefinedBenefitPlansAdjustmentIncludingPortionAttributableToNoncontrollingInterestMember2023-12-310000910638us-gaap:AccumulatedGainLossCashFlowHedgeIncludingNoncontrollingInterestMember2023-12-310000910638ddd:AccumulatedUnrealizedLossOnShortTermInvestmentIncludingPortionAttributableToNoncontrollingInterestMember2023-12-310000910638us-gaap:AociIncludingPortionAttributableToNoncontrollingInterestMember2023-12-310000910638us-gaap:OperatingSegmentsMemberddd:HealthcareSegmentMember2023-01-012023-12-310000910638us-gaap:OperatingSegmentsMemberddd:HealthcareSegmentMember2022-01-012022-12-310000910638us-gaap:OperatingSegmentsMemberddd:IndustrialSegmentMember2023-01-012023-12-310000910638us-gaap:OperatingSegmentsMemberddd:IndustrialSegmentMember2022-01-012022-12-310000910638us-gaap:OperatingSegmentsMember2023-01-012023-12-310000910638us-gaap:OperatingSegmentsMember2022-01-012022-12-310000910638us-gaap:CorporateNonSegmentMember2023-01-012023-12-310000910638us-gaap:CorporateNonSegmentMember2022-01-012022-12-310000910638country:US2023-12-310000910638country:US2022-12-310000910638country:BE2023-12-310000910638country:BE2022-12-310000910638ddd:OtherForeignEntitiesMember2023-12-310000910638ddd:OtherForeignEntitiesMember2022-12-310000910638ddd:ExportControlsAndGovernmentContractsComplianceMember2023-02-012023-02-280000910638ddd:DirectorateOfDefenseTradeControlsMemberddd:ExportControlsAndGovernmentContractsComplianceMember2023-02-012023-02-280000910638ddd:BureauOfIndustryAndSecurityOfTheDepartmentOfCommerceMemberddd:ExportControlsAndGovernmentContractsComplianceMember2023-02-012023-02-280000910638ddd:USDepartmentOfJusticeMemberddd:ExportControlsAndGovernmentContractsComplianceMember2023-02-012023-02-280000910638ddd:ExportControlsAndGovernmentContractsComplianceMember2023-01-012023-12-310000910638ddd:DirectorateOfDefenseTradeControlsMemberddd:ExportControlsAndGovernmentContractsComplianceMember2023-01-012023-12-310000910638us-gaap:SubsequentEventMemberddd:ExportControlsAndGovernmentContractsComplianceMemberddd:DirectorateOfDefenseTradeControlsMember2024-01-012024-07-260000910638us-gaap:FinancialStandbyLetterOfCreditMember2023-06-020000910638us-gaap:FinancialStandbyLetterOfCreditMember2023-06-022023-06-020000910638us-gaap:FinancialStandbyLetterOfCreditMemberus-gaap:SubsequentEventMember2024-06-012024-06-300000910638ddd:SecuritiesClassActionMember2023-01-012023-12-310000910638us-gaap:SubsequentEventMember2024-05-012024-05-310000910638us-gaap:MoneyMarketFundsMember2023-12-310000910638us-gaap:FairValueInputsLevel1Memberus-gaap:MoneyMarketFundsMember2022-12-310000910638us-gaap:CashAndCashEquivalentsMemberus-gaap:FairValueInputsLevel1Memberus-gaap:MoneyMarketFundsMember2022-12-310000910638us-gaap:ShortTermInvestmentsMemberus-gaap:FairValueInputsLevel1Memberus-gaap:MoneyMarketFundsMember2022-12-310000910638us-gaap:FairValueInputsLevel2Memberus-gaap:CertificatesOfDepositMember2022-12-310000910638us-gaap:CashAndCashEquivalentsMemberus-gaap:FairValueInputsLevel2Memberus-gaap:CertificatesOfDepositMember2022-12-310000910638us-gaap:ShortTermInvestmentsMemberus-gaap:FairValueInputsLevel2Memberus-gaap:CertificatesOfDepositMember2022-12-310000910638us-gaap:FairValueInputsLevel2Memberus-gaap:CommercialPaperMember2022-12-310000910638us-gaap:CashAndCashEquivalentsMemberus-gaap:FairValueInputsLevel2Memberus-gaap:CommercialPaperMember2022-12-310000910638us-gaap:ShortTermInvestmentsMemberus-gaap:FairValueInputsLevel2Memberus-gaap:CommercialPaperMember2022-12-310000910638us-gaap:FairValueInputsLevel2Memberddd:ShortTermBondMutualFundMember2022-12-310000910638us-gaap:CashAndCashEquivalentsMemberus-gaap:FairValueInputsLevel2Memberddd:ShortTermBondMutualFundMember2022-12-310000910638us-gaap:ShortTermInvestmentsMemberus-gaap:FairValueInputsLevel2Memberddd:ShortTermBondMutualFundMember2022-12-310000910638us-gaap:FairValueInputsLevel2Memberus-gaap:AllOtherCorporateBondsMember2022-12-310000910638us-gaap:CashAndCashEquivalentsMemberus-gaap:FairValueInputsLevel2Memberus-gaap:AllOtherCorporateBondsMember2022-12-310000910638us-gaap:ShortTermInvestmentsMemberus-gaap:FairValueInputsLevel2Memberus-gaap:AllOtherCorporateBondsMember2022-12-310000910638us-gaap:CashAndCashEquivalentsMember2022-12-310000910638us-gaap:ShortTermInvestmentsMember2022-12-310000910638us-gaap:AllOtherCorporateBondsMember2022-12-310000910638us-gaap:FairValueInputsLevel2Member2022-01-012022-12-3100009106382023-05-312023-05-310000910638ddd:EmployeeSeveranceTerminationBenefitsAndOtherRestructuringMember2022-12-310000910638ddd:EmployeeSeveranceTerminationBenefitsAndOtherRestructuringMember2023-01-012023-12-310000910638ddd:EmployeeSeveranceTerminationBenefitsAndOtherRestructuringMember2023-12-310000910638us-gaap:CostOfSalesMember2023-01-012023-12-310000910638us-gaap:SellingGeneralAndAdministrativeExpensesMember2023-01-012023-12-310000910638us-gaap:ResearchAndDevelopmentExpenseMember2023-01-012023-12-310000910638us-gaap:FacilityClosingMember2021-01-012021-12-310000910638ddd:VolumetricBiotechnologiesIncMember2021-12-310000910638us-gaap:SubsequentEventMemberddd:VolumetricBiotechnologiesIncMember2024-02-242024-02-240000910638us-gaap:SubsequentEventMemberddd:VolumetricBiotechnologiesIncMember2024-02-240000910638us-gaap:SubsequentEventMemberddd:VolumetricBiotechnologiesIncMember2024-03-290000910638us-gaap:SubsequentEventMemberddd:VolumetricBiotechnologiesIncMember2024-03-292024-03-290000910638us-gaap:SubsequentEventMemberddd:VolumetricBiotechnologiesIncMember2024-04-292024-04-290000910638us-gaap:SubsequentEventMemberddd:VolumetricBiotechnologiesIncMember2024-04-290000910638us-gaap:SubsequentEventMemberddd:VolumetricBiotechnologiesIncMember2024-07-082024-07-080000910638us-gaap:SubsequentEventMemberddd:ConvertibleSeniorNotesDue2026Memberus-gaap:ConvertibleDebtMember2024-03-082024-03-080000910638ddd:SaudiArabianIndustrialInvestmentsCompanyMemberus-gaap:SubsequentEventMember2024-05-012024-05-31
UNITED STATES
SECURITIES AND EXCHANGE COMMISSION
Washington, D.C. 20549
__________________
FORM 10-K
☒ ANNUAL REPORT PURSUANT TO SECTION 13 OR 15(d) OF THE SECURITIES EXCHANGE ACT OF 1934
For the fiscal year ended December 31, 2023
OR
☐ TRANSITION REPORT PURSUANT TO SECTION 13 OR 15(d) OF THE SECURITIES EXCHANGE ACT OF 1934
For the transition period from ____________to____________
Commission File No. 001-34220
__________________________
3D SYSTEMS CORPORATION
(Exact name of Registrant as Specified in its Charter)
__________________________
| | | | | |
Delaware | 95-4431352 |
(State or Other Jurisdiction of
Incorporation or Organization) | (I.R.S. Employer
Identification No.) |
333 Three D Systems Circle
Rock Hill, South Carolina 29730
(Address of Principal Executive Offices and Zip Code)
(Registrant’s Telephone Number, Including Area Code): (803) 326-3900
_________________________
Securities registered pursuant to Section 12(b) of the Act:
| | | | | | | | | | | | | | |
| Title of each class | | Trading Symbol | | Name of each exchange on which registered |
| Common Stock, par value $0.001 per share | | DDD | | New York Stock Exchange |
Securities registered pursuant to Section 12(g) of the Act: None
Indicate by check mark if the registrant is a well-known seasoned issuer, as defined in Rule 405 of the Securities Act. Yes ☐ No ☒
Indicate by check mark if the registrant is not required to file reports pursuant to Section 13 or Section 15(d) of the Act. Yes ☐ No ☒
Indicate by check mark whether the registrant: (1) has filed all reports required to be filed by Section 13 or 15(d) of the Securities Exchange Act of 1934 during the preceding 12 months (or for such shorter period that the registrant was required to file such reports), and (2) has been subject to such filing requirements for the past 90 days. Yes ☐ No ☒
Indicate by check mark whether the registrant has submitted electronically every Interactive Data File required to be submitted pursuant to Rule 405 of Regulation S-T (§232.405 of this chapter) during the preceding 12 months (or for such shorter period that the registrant was required to submit such files). Yes ☐ No ☒
Indicate by check mark whether the registrant is a large accelerated filer, an accelerated filer, a non-accelerated filer, a smaller reporting company, or an emerging growth company. See the definitions of “large accelerated filer,” “accelerated filer,” “smaller reporting company,” and “emerging growth company” in Rule 12b-2 of the Exchange Act.
| | | | | | | | | | | | | | |
| Large accelerated filer | ☒ | | Accelerated filer | ☐ |
| Non-accelerated filer | ☐ | | Smaller reporting company | ☐ |
| Emerging growth company | ☐ | | | |
If an emerging growth company, indicate by check mark if the registrant has elected not to use the extended transition period for complying with any new or revised financial accounting standards provided pursuant to Section 13(a) of the Exchange Act.☐
Indicate by check mark whether the registrant has filed a report on and attestation to its management’s assessment of the effectiveness of its internal control over financial reporting under Section 404(b) of the Sarbanes-Oxley Act (15 U.S.C. 7262(b)) by the registered public accounting firm that prepared or issued its audit report. ☒
If securities are registered pursuant to Section 12(b) of the Act, indicate by check mark whether the financial statements of the registrant included in the filing reflect the correction of an error to previously issued financial statements. ☐
Indicate by check mark whether any of those error corrections are restatements that required a recovery analysis of incentive-based-compensation received by any of the registrant’s executive officers during the relevant recovery period pursuant to §240.10D-1(b). ☐
Indicate by check mark whether the registrant is a shell company (as defined in Rule 12b-2 of the Exchange Act.) Yes ☐ No ☒
The aggregate market value of the registrant’s Common Stock held by non-affiliates of the registrant on June 30, 2023 was $1,275,574,266. For purposes of this computation, it has been assumed that the shares beneficially held by directors and executive officers of the registrant were “held by affiliates.” This assumption is not to be deemed an admission by these persons that they are affiliates of the registrant.
The number of shares of the registrant's Common Stock outstanding as of August 5, 2024: 133,575,083.
3D SYSTEMS CORPORATION
Annual Report on Form 10-K
For the Year Ended December 31, 2023
TABLE OF CONTENTS
This Annual Report on Form 10-K (“Form 10-K”) contains forward-looking statements, within the meaning of the Private Securities Litigation Reform Act of 1995, that involve risks and uncertainties. Many of the forward-looking statements are located in Part II, Item 7 of this Form 10-K under the heading “Management’s Discussion and Analysis of Financial Condition and Results of Operations.” Forward-looking statements involve known and unknown risks, uncertainties and other factors that may cause our actual results, performance or achievements to be materially different from historical results or from any future results expressed or implied by such forward-looking statements. In many cases, you can identify forward-looking statements by terms such as “believes,” “belief,” “expects,” “may,” “will,” “estimates,” “intends,” “anticipates,” or “plans” or the negative of these terms or other comparable terminology. Forward-looking statements are based upon management’s beliefs, assumptions and current expectations concerning future events and trends, using information currently available, and are necessarily subject to uncertainties, many of which are outside our control. Although we believe that the expectations reflected in the forward-looking statements are reasonable, forward-looking statements are not, and should not be relied upon as a guarantee of future performance or results, nor will they necessarily prove to be accurate indications of the times at or by which any such performance or results will be achieved. A number of important factors could cause actual results to differ materially from those expressed in or implied by the forward-looking statements. Factors that could cause such differences include, but are not limited to, those discussed in Part I, Item 1A of this Form 10-K under the heading “Risk Factors.” All subsequent written and oral forward-looking statements attributable to the Company or to individuals acting on our behalf are expressly qualified in their entirety by this discussion. The Company assumes no obligation to revise or update any forward-looking statements for any reason, except as required by law.
PART I
Item 1. Business
General
3D Systems Corporation (“3D Systems” or the “Company” or “we,” "our" or “us”) markets our products and services through subsidiaries in North America and South America (collectively referred to as “Americas”), Europe and the Middle East (collectively referred to as “EMEA”) and Asia Pacific and Oceania (collectively referred to as “APAC”). We provide comprehensive 3D printing and digital manufacturing solutions, including 3D printers for plastics and metals, materials, software, and services, including maintenance, advanced manufacturing and applications engineering. Our solutions support advanced applications in two key industry verticals: Healthcare Solutions (which includes dental, medical devices, personalized health services and regenerative medicine) and Industrial Solutions (which includes aerospace, defense, transportation and general manufacturing). We have over 35 years of experience and expertise, which have proven vital to our development of an ecosystem and end-to-end digital workflow solutions that enable customers to optimize product designs, transform workflows, bring innovative products to market and drive new business models.
Business Strategy
Accelerating Additive Manufacturing Adoption
We partner with customers to enable them to adopt and scale additive manufacturing in their production environments. We believe that our additive manufacturing capabilities can help customers solve a number of design and manufacturing challenges – such as improved lead times, enhanced design freedom, part consolidation and the ability for mass customization. We believe that we have both the scale and the breadth of technologies, encompassing hardware platforms, materials and software, that our customers require for the successful implementation of additive manufacturing into their design and manufacturing processes. Using a strong application focus in each of our two business segments, our Applications Innovation Group integrates our printer hardware, materials, software and professional and technical services in unique combinations to solve a customer’s product need. Once complete, we can scale the process for the customer to a certain production level through our Advanced Manufacturing solutions, and, with increasing demand, we can enable a customer to continue scaling to high volumes within their own production facilities. This transfer of the workflow involves providing the printing systems, materials and software, along with the process definition and other technical expertise, that enables a seamless transfer of capability to the manufacturer. We expect the result of this approach to drive recurring revenue streams as customers adopt additive manufacturing solutions and consume materials to produce parts, utilize software to manage the print process and manufacturing operations, and make use of our service offerings for application development, maintenance and upgrades. Our proficiency in providing industry focused application and solution development for customers includes a number of internal assets and capabilities, including:
a.A full range of additive manufacturing hardware technologies and materials to address needs in metals and plastics (including biocompatible materials for medical use), wax and bioprinting
b.An Application Innovation Group that includes industry and technology application experts, customer innovation and advanced manufacturing centers and post-sale service and support
c.A software suite that enables end-to-end additive manufacturing including design, simulation, process management and manufacturing execution
d.Scale that includes significant and diverse experience in production parts and applications combined with a global reach to service our customers worldwide
During 2023 we made targeted investments and partnerships designed to broaden and enhance our product offering of 3D printing solutions and to expand addressable markets for our Industrial Solutions and Healthcare Solutions segments. Among these investments was the acquisition of Wematter AB (publ) (“Wematter”). Wematter is an affordable, turnkey, closed-loop selective laser sintering solution accessible for smaller manufacturing environments that addresses a wide range of applications including industrial, medical devices and equipment and academic markets. In addition, during 2023, we acquired a minority ownership interest in Theradaptive, Inc. (“Theradaptive”), a biopharmaceutical company focused on targeted regenerative therapeutics through a proprietary protein-engineering platform that can be used to coat implants and devices and to achieve hyper-local delivery for patients. In addition to our investment in Theradaptive, we entered into a partnership with Theradaptive to act as its exclusive 3D printing partner.
We believe that the above-described investments during 2023, will accelerate the adoption of additive manufacturing in our target industrial and healthcare end-markets and open up profitable future growth opportunities for our company. Realizing the full benefit of these growth-oriented initiatives will require us to make additional investments in operations and development activities during 2024 and beyond.
Investing in Regenerative Medicine
As an early and continuing innovator in additive manufacturing, we have significant experience in bringing this technology to new markets. Within our Healthcare Solutions segment, a portion of our business focuses on opportunities for additive manufacturing to be applied to regenerative medicine. To date, our efforts in the area of regenerative medicine have consisted primarily of pre-commercial bio-technology research and development ("R&D") in the areas described below.
Each year, end-stage organ failure kills millions of people, and the supply of donated organs is insufficient to meet the needs of patients seeking transplantation. Accordingly, our first area of focus is the use of additive manufacturing for human organ transplantation. In 2017, we entered into an arrangement that combined our 3D printing expertise and capabilities in human tissue engineering with the regenerative medicine and biotechnology expertise of a key strategic partner, with a long-term goal of developing the capability to 3D print lungs that will allow patients with end-stage lung disease to receive transplants that will enable them to enjoy long and active lives. In 2021, this program was expanded to also focus on developing the capability to print scaffolds for livers and kidneys, for which research continued through the start of 2024. Beginning in the first quarter of 2024, due to changes to our arrangement with and funding from our key strategic partner, the Company’s continuing organ program returned to focusing on developing the capability to print human lung scaffolds, for which the related R&D efforts will continue to be primarily funded by our key strategic partner. Given the loss of funding for research on kidney and livers from our key strategic partner, those programs were discontinued during the first quarter of 2024.
Our second area of focus involves utilizing our bio-printing technology to manufacture non-organ human tissue scaffolds for use in transplantation and surgical reconstruction applications (the "Tissue Program"). We believe that continued progress in this area could result in significantly improved health outcomes for patients, as well as open up attractive new growth markets and therapeutic applications for 3D printed, vascularized soft-tissue scaffolds. The Tissue Program is currently an internal R&D program that combines our 3D printing, materials, and bio-printing capabilities and expertise.
Our third area of focus seeks to utilize our bio-printing capabilities to design and manufacture 3D-printed vascularized “organs-on-chips” for use in drug development by pharmaceutical industry customers. Currently, drug development is an expensive and time-consuming process, and many drug therapies that appear promising during pre-clinical trials fail during human clinical trials. We believe that “organs-on-chips” can accelerate the drug development process and reduce the cost of pre-clinical drug testing, as well as reduce the pharmaceutical industry’s reliance on animal testing. During 2023, our wholly-owned biotech company, Systemic Bio, continued its R&D work in this area and entered into its first commercial contracts with pharmaceutical industry customers. We plan to continue to provide internal funding to support Systemic Bio during the early stages of its growth, including for product development and customer acquisition activities.
Products
We offer our customers a comprehensive range of 3D printers, materials, software, and digital design tools.
3D Printers and Materials
Our 3D printers transform digital data input generated by 3D design software, Computer Aided Design (“CAD”) software or other 3D design tools, into printed parts using several unique print engines that employ proprietary, additive layer by layer building processes with a variety of materials. As part of our solutions-oriented strategy, we offer a broad range of 3D printing technologies including Stereolithography (SLA), Selective Laser Sintering, Direct Metal Printing, MultiJet Printing, ColorJet Printing, polymer extrusion, and extrusion and SLA based bioprinting. Our printers utilize a wide range of materials, the majority of which are proprietary materials that we develop, blend, and market. Our comprehensive range of materials includes plastic, nylon, metal, composite, elastomeric, wax, polymeric dental materials and biocompatible materials. We augment and complement our portfolio of engineered materials with materials that we purchase or develop with third parties under private label and distribution arrangements.
We work closely with our customers to optimize the performance of our materials in their applications. Our expertise in materials science and formulation, combined with our processes, software and equipment, enables us to provide unique solutions and help our customers select the material that best meets their needs with optimal cost and performance results.
As part of our solutions approach, our currently offered printers, with the exception of direct metal printers and bioprinters, have built-in intelligence to make them integrated, closed systems. For these integrated printers, we furnish materials specifically designed for use in those printers, which are packaged in smart cartridges and utilize material delivery systems. These integrated materials are designed to enhance system functionality, productivity, reliability and materials' shelf life, in addition to providing our customers with a built-in quality management system and a fully integrated workflow solution.
Software and Related Products
We provide digital design tools, including software, scanners and haptic devices. We offer solutions for product design, simulation, mold and die design, 3D scan-to-print, reverse engineering, production machining, metrology, inspection and manufacturing workflows. These products are designed to enable a seamless workflow for customers and are marketed under brand names such as Geomagic®. We also offer 3D Sprint and 3DXpert, proprietary software to prepare and optimize CAD data and manage the additive manufacturing processes. These software products provide automated support building and placement, build platform management, print simulation and print queue management capabilities. The outcome is the ability to improve the quality of prints, optimize design structure, shorten design to manufacturing lead time and minimize manufacturing costs.
Since the acquisition of Oqton, Inc. ("Oqton") in 2021, we have also offered an intelligent, cloud-based MOS platform to customers that need to integrate a broad range of advanced manufacturing and automation technologies, including additive manufacturing (AM) solutions, in their production workflows. 3D System’s legacy stand-alone software applications are integrated into Oqton’s legacy MOS, so that we can offer our customers a complete cloud-based software solution to automate and control their entire digital manufacturing process from order to delivery.
Services
Maintenance and Training Services
We provide a variety of customer services, local application support and field support on a worldwide basis for our products, including installation of new printers at customers’ sites, maintenance agreements, periodic hardware upgrades and software updates. We also provide services to assist our customers and partners in developing new applications for our technologies to facilitate the use of our technology for specific applications, to train customers on the use of our printers and to maintain our printers at customers’ sites. We provide these services, spare parts and field support either directly or through a network of reseller partners. We employ customer-support sales engineers to support our worldwide customer base, and we seek to continue to strengthen and enhance our partner network and service offerings.
Our 3D printers are sold with a warranty period ranging from 90 days to one year. After the warranty period, we generally offer service contracts that enable our customers to continue service and maintenance coverage. These service contracts are offered with various levels of support and options, and are priced accordingly. One entitlement of our service contracts is our service engineers provide regularly scheduled preventive maintenance visits to customer sites. Additionally, we provide training to our partners to enable them to also perform these services. Another contract entitlement on select printer models is proactive remote troubleshooting capability through our 3DConnect Service IoT platform. From time to time, we also offer upgrade kits for certain of our printers that enable our existing customers to take advantage of new or enhanced printer capabilities. In some cases, we have discontinued upgrade support and maintenance agreements for certain of our older legacy printers.
Advanced Manufacturing
As part of our strategy to help customers adopt additive manufacturing, we offer advanced manufacturing services through facilities in the Americas and EMEA regions. These facilities supplement customer manufacturing environments by allowing them to test and ramp production using our solutions before transitioning production to their environment and also providing them with flexible manufacturing capacity on an as-needed basis. This allows us to provide application and production expertise and refine the production process as part of our solutions approach. As the process is validated and volumes ramp, customers may choose to move production to their facilities using equipment, materials, software and services that they purchase from us. These facilities operate under stringent quality systems and are also utilized by customers in regulated industries such as healthcare and aerospace & defense for sustained outsourced production of hundreds of thousands of parts per year.
Software Services
In addition to our software license products, we offer software maintenance and cloud-software subscriptions, which includes updates and support for our licensed software products. Our licensed software is sold with a maintenance service that generally covers a period of one year. After this initial period, we offer single and multi-year maintenance contracts that enable our customers to continue coverage. These software service contracts typically include free software updates and various levels of technical support. In addition, we offer Oqton's legacy MOS as a cloud based-manufacturing operating system designed to automate digital production workflows and to enable machine monitoring, end-to-end manufacturing visibility and production traceability. For our cloud subscription solutions, customer support and software updates are included as part of the solution.
Healthcare Solutions Services
As part of our precision healthcare solutions services, we provide surgical planning, modeling, prototyping and manufacturing services. We offer printing and finishing of medical and dental devices, anatomical models and surgical guides and tools, as well as modeling, design and planning services, including VSP™ surgical planning solutions.
Global Operations
We operate in the Americas, EMEA and APAC regions, and market our products and services in those areas as well as to other parts of the world.
In maintaining operations outside the United States (the “U.S.”), we expose our business to risks inherent in such operations, including currency exchange rate fluctuations. Information on foreign exchange risk appears in Part I, Item 1A, “Risk Factors,” Part II, Item 7A, “Quantitative and Qualitative Disclosures about Market Risk” and Part II, Item 8, “Financial Statements and Supplementary Data” of this Form 10-K.
Marketing and Customers
Our Go-to-Market strategy focuses on an integrated approach that is directed at providing comprehensive design to manufacturing solutions meeting the broad spectrum of our customer needs. We utilize a wide range of marketing tools to generate demand and create awareness for our products and services worldwide. Our marketing and communications teams support our demand generation activities by providing marketing campaigns, digital presence and outreach, and event and targeted vertical seminar engagements.
We promote and sell our solutions globally through a direct sales force, channel partners and, in certain geographies, appointed distributors. Our customer success organization includes sales professionals, application engineers, vertical specialists, and other support teams throughout the Americas, EMEA and APAC regions. These teams are responsible for providing complete service to our customers and channel partners from a technical consultation to the sale of our software, printer, and services products.
Our application engineers collaborate closely with our customers to solve complex design and additive manufacturing challenges, leveraging our technology, software, materials and services to develop advanced applications across our Healthcare Solutions and Industrial Solutions segments. Additionally, our Customer Innovation Centers provide access to the resources necessary to develop, validate, and commercialize customer applications.
We sell our software solutions, including our Oqton MOS software, through a dedicated software sales team. Our software may be sold to customers with 3D printing equipment from competitive equipment manufacturers and, in some cases, we resell our software through these manufacturers.
Our customers include major companies as well as small and midsize businesses in a broad range of industries, including medical, dental, automotive, aerospace, durable goods, government, defense, technology, jewelry, electronics, education, consumer goods, energy, biotechnology and others. For the years ended December 31, 2023, 2022, and 2021, one customer accounted for approximately 15%, 23% and 22% of our consolidated revenue, respectively. We expect to maintain our relationship with this customer.
Seasonality
Historically, our results of operations were subject to seasonal factors. Stronger demand for our products historically occurred in our fourth quarter primarily due to our customers’ capital expenditure budget cycles and our sales compensation incentive programs. Our first and third quarters historically were our weakest quarters for overall unit demand. The first quarter was typically a slow quarter for capital expenditures in general.
Production and Suppliers
In order to carry out the assembly and refurbishment of our 3D printer hardware, we utilize a combination of in-house operations and a limited outsourcing arrangement with a contract manufacturing company in Belgium from which we purchase finished printers pursuant to forecasts and customer orders that we supply. This supplier carries out quality control procedures on our printers prior to their shipment to customers and has responsibility for procuring the components and sub-assemblies either from us or third-party suppliers, which are sourced from a geographically diverse mix of countries. While the outsourced supplier of a small mix of our printers has responsibility for the supply chain and inventory of components for the printers they assemble, the components, parts and sub-assemblies that are used in our printers are generally available from several potential suppliers. During 2023, we continued our work to in-source the manufacturing of multiple printing platforms from contract manufacturing partners in order to realize improvements in production quality, cost efficiency, and inventory management, which resulted in the termination of outsourcing arrangements in the U.S. and Switzerland.
We produce materials at our facilities in Rock Hill, South Carolina, Marly, Switzerland and Soesterberg, Netherlands. We also have arrangements with third parties who blend certain materials according to our specifications that we sell under our own brand names, and we purchase certain complementary materials from third parties for resale to our customers.
Our equipment assembly and materials blending activities, advanced manufacturing services and certain R&D activities are subject to compliance with applicable federal, state and local provisions regulating the storage, use and discharge of materials into the environment. Our facilities engaged in such activities are subject to periodic compliance audits by applicable regulatory authorities. We believe that we are in compliance, in all material respects, with such regulations as currently in effect, and we expect continued compliance with them will not have a material adverse effect on our capital expenditures, results of operations or financial position.
As a company with global operations, we are subject to the laws of the U.S. and multiple foreign jurisdictions in which we operate and the rules and regulations of various governing bodies, which may differ among jurisdictions. Compliance with these laws, rules and regulations has not had, and is not expected to have, a material effect on our capital expenditures, results of operations or competitive position.
Research and Development
The 3D printing industry continues to experience rapid technological change and developments in hardware, software and materials. Consequently, we have ongoing R&D programs to develop new products and to enhance our portfolio of products and services, as well as to improve and expand the capabilities of our solutions. Our efforts are often augmented by development arrangements with research institutions, including universities, customers, suppliers, assembly and design firms, engineering companies, materials companies, governments and other partners.
We are also engaged in various R&D efforts related to regenerative medicine. These efforts include the application of 3D printing technologies to the development of transplantable organs and non-organ human applications. These efforts are expected to result in new products that we will market directly or in conjunction with development or channel partners.
In addition to our internally developed technology platforms, we have acquired products and technologies developed by others by acquiring business entities that held ownership rights to such products and technologies. In other instances, we have licensed or purchased the intellectual property rights of technologies developed by third parties through agreements that may obligate us to pay a license fee or royalty, typically based upon a dollar amount per unit or a percentage of the revenue generated by such products.
Intellectual Property
We regard our technology platforms and materials as proprietary and seek to protect them through copyrights, patents, trademarks and trade secrets. At December 31, 2023 and 2022 we held 1,381 and 1,358 patents worldwide, respectively. At December 31, 2023 and 2022, we had 350 and 360 pending patent applications worldwide, respectively. The principal issued patents covering aspects of our various technologies will expire at varying times through the year 2034.
In addition, we are a party to various licenses that have had the effect of broadening the range of the patents, patent applications and other intellectual property available to us.
We have also entered into licensing or cross-licensing arrangements with various companies in the U.S. and other countries that enable those companies to utilize our technologies in their products or that enable us to use their technologies in our products. Under certain of these licenses, we are entitled to receive, or we are obligated to pay, royalties for the sale of licensed products in the U.S. or in other countries. The amount of such royalties was not material to any of our annual results of operations or financial position for the three-year period ended December 31, 2023.
We believe that, while our patents and licenses provide us with a competitive advantage, our success also depends on our marketing, business development, applications know-how and ongoing R&D efforts. Accordingly, we believe the expiration of any of the patents, patent applications, or licenses discussed above would not be material to our business or financial position.
Competition
We compete with other suppliers of 3D printers, materials, software and healthcare solutions as well as with suppliers of conventional manufacturing solutions. We compete with these suppliers for customers as well as channel partners for certain of our products. Development of new technologies or techniques not encompassed by the patents that we own or license may result in additional future competition.
Our competitors operate both globally and regionally, and many of them have well-recognized brands and product lines.
We believe principal competitive factors include the functionality and breadth of our technology and materials, process and application know-how, total cost of operation of the solution, product reliability and the ability to provide a complete solution to meet customer needs. We believe that our future success depends on our ability to provide high-quality solutions, introduce new products and services to meet evolving customer needs and market opportunities, and to extend our technologies to new applications. Accordingly, our ongoing R&D programs are intended to enable us to continue technology advancement and develop innovative new solutions for the marketplace.
Sustainability
We deliver leading additive solutions for industrial and healthcare applications using innovative 3D printing technologies, powered by the expertise of our global team. Innovation is core to who we are and how we work. Our solutions enable our customers to meet key product needs and advance their business models. Looking to the future, sustainability will be an integral part of our innovation to address the evolving needs of our customers.
The effects of climate change and the heightened social, economic, and health challenges around the globe are transforming our business. We are considering these important topics as we design and execute our sustainability strategy. Our sustainability strategy is organized into four pillars: Empowering Innovation, Evolving the Future of Manufacturing, Advancing Customer Solutions, and Upholding Responsible Business Practices.
Empowering Innovation
We are focused on empowering innovation through our people to drive industry-leading solutions to maintain a competitive edge in additive manufacturing. We have instituted core talent strategies to prioritize the development of people, the diversity of talent to expand technology innovation, and the engagement of our global workforce. These strategies include investing in technical employee training and on-demand development resources, rewarding significant achievements in innovation, enabling cross-functional collaboration between our engineering, operations, and customer-facing teams, and creating opportunities for our diverse global workforce to connect.
Evolving the Future of Manufacturing
We offer a broad portfolio of additive manufacturing products and services and are evolving the future of manufacturing for our customers. Innovation and speed to market are critical for our customers, and leveraging additive manufacturing capabilities enables our customers to shorten their innovation cycle while reducing their environmental impact. Our products and customer solutions allow customers to optimize their supply chain to reduce lead times, enabling localized production to reduce logistics and transportation cost and environmental impact, advancing material design to address customer needs, and utilizing digitization for prototyping to reduce waste.
Advancing Customer Solutions
We provide solutions to empower our customers to address their evolving sustainability priorities. Our unique offerings of hardware, software, materials, and services provide application-specific solutions powered by the expertise of our global team of application engineers. We are maturing our product development activities to address our customers’ key environmental priorities, such as extending product lifespans, addressing material recyclability, and increasing energy and resource efficiency of our products and materials.
Upholding Responsible Business Practices
We believe we operate in a responsible and ethical manner and leverage corporate governance standards to operate with resiliency and sustain long-term value of our Company. We leverage this foundation to influence our sustainability strategy, including utilizing our governance structure for oversight of our sustainability program. We believe we operate responsible business practices across our sites with the goals of creating a safe, secure, healthy, and injury-free workplace, prioritizing product quality and safety in our design and manufacturing, and being responsible stewards of the environment by collecting and measuring environmental data to understand our carbon footprint.
Human Capital
At 3D Systems, our mission is to deliver leading additive solutions for industrial and healthcare applications. In support of this purpose, we are focused on empowering innovation through our people by sourcing top engineering and technology talent, advancing talent strategies to drive employee development and career progression, and seeking to ensure a safe and healthy work environment across our global sites.
As of December 31, 2023, we had 1,925 full-time and part-time employees, compared to 2,032 full-time and part-time employees as of December 31, 2022. We continue to evaluate our headcount needs as we streamline our organization and manage operating costs through our restructuring activities. Refer to the discussion of "Fiscal Year 2023 Restructuring Activities" in Part II, Item 7. "Management’s Discussion and Analysis of Financial Condition and Results of Operations," as well as Note 25 to our consolidated financial statements, for details regarding our previously announced and ongoing restructuring plan, which includes planned headcount reductions.
Our U.S. employees are not covered by collective bargaining agreements; however, some employees outside the U.S. are subject to local statutory employment and labor arrangements. We have not experienced any material work stoppages and believe that our relations with our employees are satisfactory.
Talent Management & Engagement
Our Company is advancing additive manufacturing through ongoing product innovation, and as such we recognize the importance of the retention, growth, and development of our employees – employees are necessary to achieving our long-term success. Our goal is to foster a workplace culture and employee experience that drives innovation with purpose, profitable growth, and delivers ‘extraordinary’ to our customers. To do so, we have established programs for acquiring strategic talent, developing our teams to build key capabilities and skills, and engaging, motivating, and retaining our employees to do their best work. We engage directly with employees to provide updates on our strategic priorities and Company progress, as well as solicit feedback through regular communications, global all-hands meetings, and business town hall updates. To address the evolving needs of our business, we perform strategic workforce and succession planning as well as ongoing evaluation of our organizational design, culture, and values.
Inclusion and Belonging
Employees span the Americas (56%), EMEA (35%), and APAC (9%) with approximately 44% of our employees located outside the U.S. This global representation promotes diversity of thought, experiences, culture, and backgrounds that enhances our ability to deliver innovative solutions to our customers, in support of our company value to ‘build great teams.’ We execute talent programs throughout the year in support of our commitment to maintain and engage our diverse workforce. Our talent sourcing activities focus on building our future talent pipeline and attracting top, diverse talent.
Throughout an employee’s career with 3D Systems, we are focused on fostering an engaged, inclusive, and purpose-driven culture through various company-wide programs. We are committed to fostering an environment where inclusion and belonging are central to how we work across our global teams and support employees with equitable opportunities to grow, contribute, develop, and thrive. Additionally, we extend our focus of inclusion within our local communities and strive to make a positive impact by serving our underserved populations through our 3D Gives Back volunteer program.
Compensation & Benefits
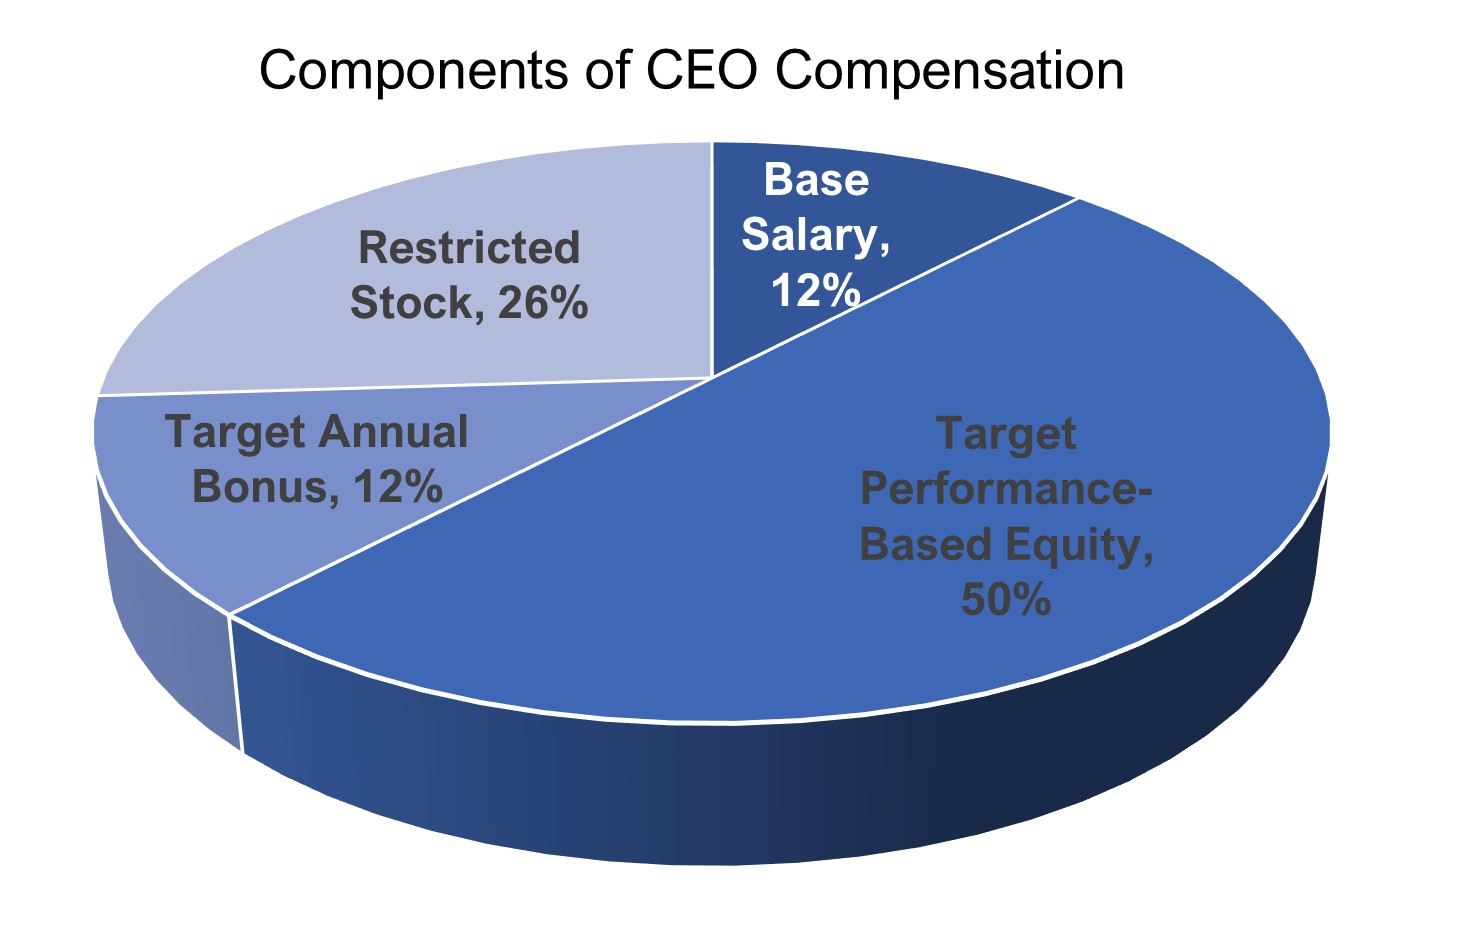
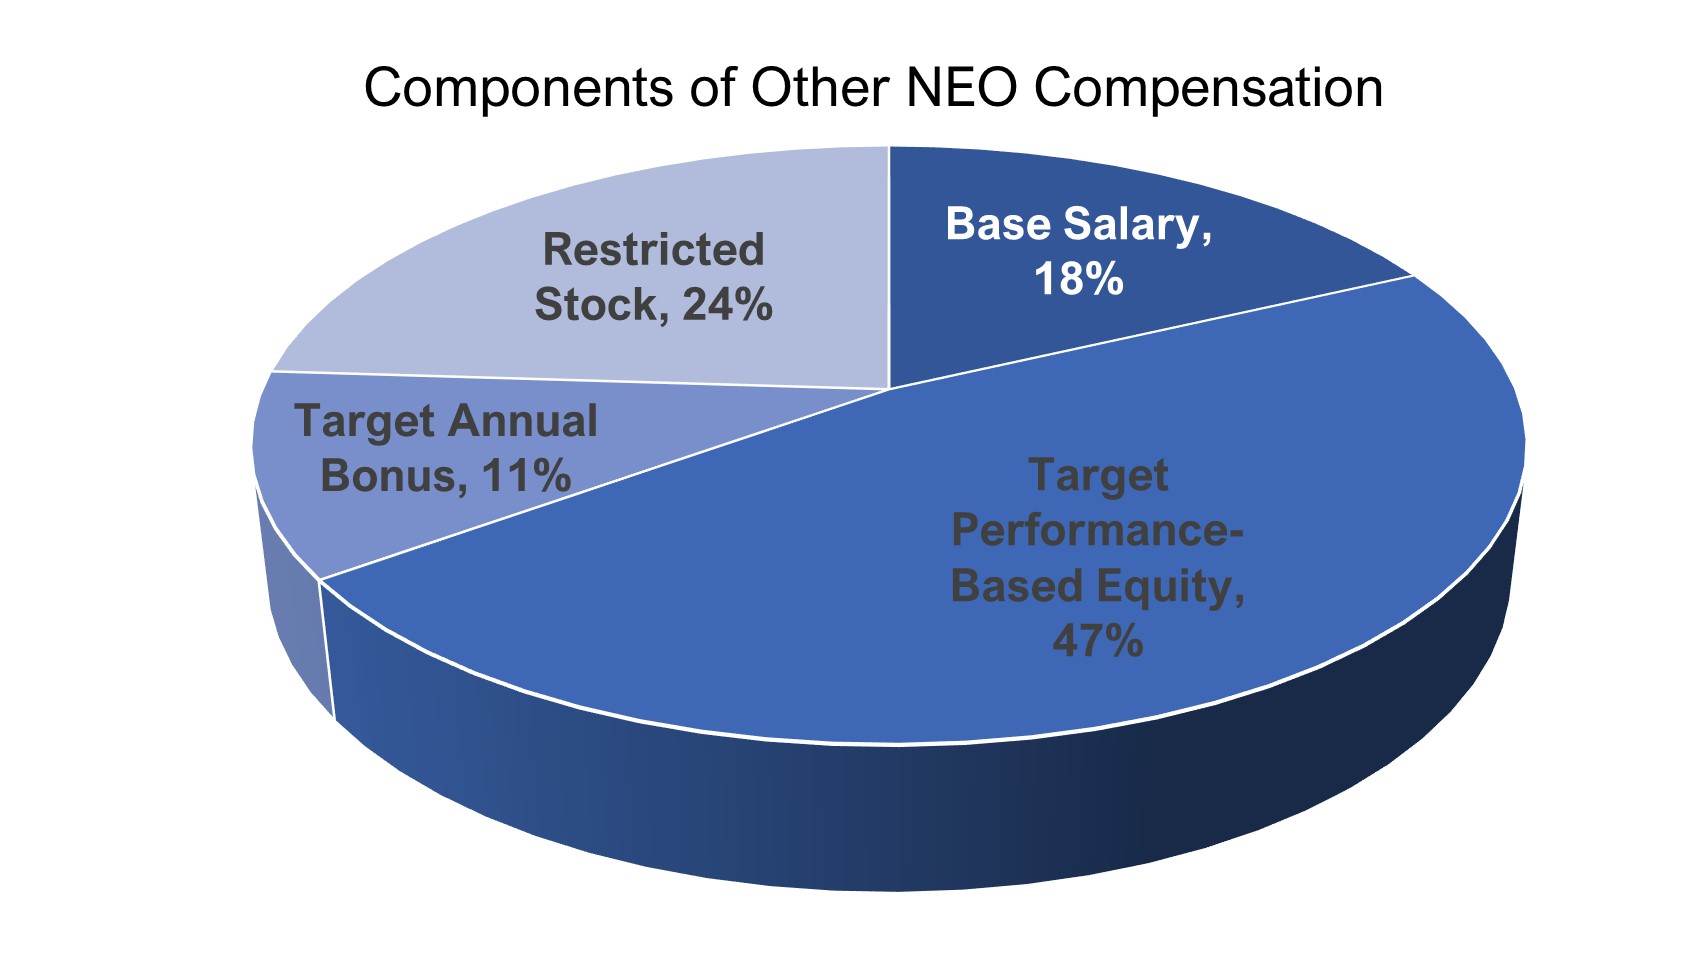
We design our compensation programs to be competitive and equitable to support employees in sharing in the success of 3D Systems. We tailor our compensation programs to attract and retain top talent to drive success in our current business priorities and emerging strategies. Additionally, we recognize that employees thrive when they have the resources to meet their needs and the time and support to succeed in their professional and personal lives. In support of this, we offer a wide variety of market competitive benefits to employees around the world. The Compensation Committee of the Board of Directors oversees the design of executive compensation and equity plans, which are designed to align executive pay to the delivery of long-term shareholder value.
Workplace Health & Safety
We are committed to creating a safe, secure, healthy, and injury-free work environment for our employees, customers, partners, and visitors. Our focus is on reducing significant safety risks and driving a strong safety culture through communication, awareness, and visible leadership. To assist in achieving this commitment, we provide substantial safety trainings and necessary equipment at all facilities, educating and encouraging our employees to proactively identify and eliminate unsafe actions and conditions. We have specific safety programs in place for those working in potentially high-hazard environments. We monitor injury and illness health and safety metrics across our organization to continually evaluate our safety programs to meet the needs of our teams.
Available Information
Refer to our website to learn more about our company culture, code of conduct, values, and sustainability initiatives. Our website address is www.3DSystems.com. The information contained on our website is neither a part of, nor incorporated by reference into, this Form 10-K or any other document that we file with or furnish to the Securities and Exchange Commission (“SEC”). We make available, free of charge through our website, our Annual Reports on Form 10-K, Quarterly Reports on Form 10-Q, Current Reports on Form 8-K, amendments to those reports and other documents that we file with the SEC, as soon as reasonably practicable after we electronically file them with, or furnish them to, the SEC.
Many of our corporate governance materials, including our Code of Conduct, Code of Ethics for Senior Financial Executives and Directors, Corporate Governance Guidelines, current charters of each of the standing committees of the Board of Directors and our corporate charter documents and by-laws are available on our website.
Information about our Executive Officers
The information appearing in the table below sets forth the position or positions held by each of our executive officers and his or her age as of August 13, 2024. All of our executive officers serve at the pleasure of the Board of Directors. There are no family relationships among any of our executive officers or directors.
| | | | | |
| Name and Current Position | Age as of August 13, 2024 |
| Jeffrey A. Graves | 63 |
| President and Chief Executive Officer | |
| Jeffrey D. Creech | 61 |
| Executive Vice President and Chief Financial Officer | |
| Charles W. Hull | 85 |
| Executive Vice President and Chief Technology Officer for Regenerative Medicine | |
| Reji Puthenveetil | 56 |
| Executive Vice President, Additive Solutions and Chief Commercial Officer | |
| Phyllis Nordstrom | 46 |
Executive Vice President, Chief People Officer and Chief Administrative Officer | |
| Joseph Zuiker | 60 |
Executive Vice President, Engineering and Operations | |
Andrew W. B. Wright | 55 |
Senior Vice President, General Counsel and Secretary | |
Jeffrey A. Graves, President and Chief Executive Officer. Dr. Graves was appointed the Company’s President and Chief Executive Officer in May 2020. Prior to joining the Company, from 2012 to May 2020, Dr. Graves served as Chief Executive Officer, President and Director of MTS Systems Corporation, a global supplier of test, simulation, and measurement systems. From 2005 until 2012, Dr. Graves served as President and Chief Executive Officer of C&D Technologies, Inc., a technology company that produces and markets systems for the power conversion and storage of electrical power. Dr. Graves also held leadership roles with Kemet Corporation, an electronic component manufacturing company, as Chief Operating Officer from 2001 to 2003 and Chief Executive Officer from 2003 to 2005. Previously, he held a number of leadership and technical roles with General Electric, Rockwell Automation and Howmet Corporation. In addition to serving on the Company's Board of Directors, Dr. Graves serves on the board of directors of Integra Lifesciences Holdings Corporation.
Jeffrey D. Creech, Executive Vice President and Chief Financial Officer. Jeffrey D. Creech, Executive Vice President and Chief Financial Officer. Mr. Creech was appointed the Company’s Executive Vice President and Chief Financial officer in December 2023. Prior to joining the company, from 2022 to 2023, Mr. Creech was a Senior Director of The Finley Group, a niche consulting firm engaged primarily in the support, assistance, and remediation of companies in financial distress. Prior to joining the Finley Group, Mr. Creech was Chief Operating Officer and Chief Financial Officer at Nutramax Laboratories, a privately held manufacturer of human and animal health and dietary supplements, from April 2019 to November 2021, where his primary responsibilities included oversight of all financial and operational activities, human resources, and information technology. Prior to his tenure at Nutramax, from May 2017 to September 2018, Mr. Creech served as President of Springs Creative Products Group, a specialized textile operation, where his role included oversight, at an executive level, of most aspects of the Company’s operations.
Charles W. Hull, Executive Vice President, Chief Technology Officer for Regenerative Medicine. Mr. Hull is a founder of the Company and served as a member of our Board of Directors from 1993 to May 2022 when he was designated Director Emeritus. He has served as Chief Technology Officer since 1997, as Executive Vice President since 2000 and as Chief Technology Officer for Regenerative Medicine since 2021. Mr. Hull has also previously served in various other executive capacities at the Company since 1986, including Chief Executive Officer, Vice Chairman of the Board of Directors and President and Chief Operating Officer.
Reji Puthenveetil, Executive Vice President, Additive Solutions and Chief Commercial Officer. Mr. Puthenveetil has served as Executive Vice President, Additive Solutions and Chief Commercial Officer since January 2024. He previously served as Executive Vice President, Industrial Solutions since July 2020. In January 2024, Mr. Puthenveetil was appointed Executive Vice President, Additive Solutions. Prior to joining the Company, Mr. Puthenveetil spent 25 years as a management consultant for Group Newhouse helping companies, such as Lockheed Martin, Xcel Energy, Kia Motors, and Thales Group.
Phyllis Nordstrom, Executive Vice President, Chief People Officer and Chief Administrative Officer. Ms. Nordstrom has served as Executive Vice President, Chief People and Culture Officer and Chief Compliance Officer since August 2021. Effective December 2022, she was further appointed as the Company’s Chief Administrative Officer. Prior to joining 3D Systems, from May 2016 through July 2021, Ms. Nordstrom was Senior Vice President and Chief Risk & Compliance Officer at MTS Systems Corporation, where she was the leader of business ethics, corporate compliance, corporate sustainability, and internal audit and risk management. Over her 22-year career, Ms. Nordstrom has also held multiple leadership roles at PricewaterhouseCoopers, Target, and US Bank.
Joseph Zuiker, Executive Vice President, Engineering and Operations. Dr. Zuiker has served as Executive Vice President of Engineering and Operations since December 2022. Prior to joining 3D Systems, Dr. Zuiker served as Vice President of Engineering, Operations, and Order Fulfillment for MTS Systems Corporation where he worked from July 2017 until December 2022. Prior to joining MTS Systems, he was Senior Director of Technology for Halliburton Corporation’s Sperry Drilling from September 2011 to July 2016. Dr. Zuiker also worked for General Electric from December 1995 to August 2011 in various roles of increasing responsibility, including General Manager of GE Gasification Technology, General Manager of GE Hydro Technology, and Six Sigma Master Black Belt.
Andrew W. B. Wright, Senior Vice President, General Counsel and Secretary. Mr. Wright has served as Senior Vice President, General Counsel and Secretary since June 2024. Prior to joining 3D Systems, from November 2017 to June 2024, he was General Counsel and Secretary for Akoustis Technologies, Inc. Prior to joining Akoustis, from August 2013 to November 2017, he held Assistant General Counsel and Associate General Counsel roles at Toshiba Global Commerce Solutions, Inc. Prior to joining Toshiba Global Commerce Solutions, from January 1998 to August 2013, he held multiple roles of increasing responsibility within the IBM Corporation legal department supporting IBM Systems and Technology Group and IBM Software Group. Prior to joining IBM Corporation, from August 1994 to December 1997, Mr. Wright worked at Parker, Poe, Adams & Bernstein L.L.P.
Item 1A. Risk Factors
You should carefully read the following discussion of significant factors, events and uncertainties when evaluating our business and the forward-looking information contained in this Form 10-K. The events and consequences discussed in these risk factors could materially and adversely affect our business, operating results, liquidity and financial condition. While we believe we have identified and discussed below the key risk factors affecting our business, these risk factors do not identify all the risks we face, and there may be additional risks and uncertainties that we do not presently know or that we do not currently believe to be significant that may have a material adverse effect on our business, operating results, liquidity or financial condition in the future.
Operational & Financial Risk Factors
Current macro-economic trends have been adversely affecting, and could continue to adversely affect, our business, results of operations and financial condition due to their impact on the industries in which we and our customers operate, and due to the unknown speed, extent and nature of the reversal of those trends.
Certain global macro-economic trends have been adversely impacting the global economic environment and have contributed towards inflationary pressures on many goods, commodities and services globally. The high rates of inflation globally have caused governments and central banks to act to curb inflation, including by raising interest rates, which is intended to temper economic activity and which, if more powerful than intended, could trigger recessionary conditions in individual countries or regions, or globally. These macro-economic trends have been impacting our target markets and our results of operations. For example, rising interest rates, which are meant to slow down inflation, have been worsening credit/financing conditions for our customers and adversely impacting their ability to purchase our products.
While we believe that we are well-positioned to withstand the current adverse macro-economic trends, given our balance sheet (primarily due to our reserves of cash and cash equivalents) and our emphasis on operational efficiencies and execution, we continue to monitor the situation, assessing further implications for our operations, supply chain, liquidity, cash flow and customer orders, in an effort to mitigate potential new adverse consequences should they arise. However, there is no assurance that we will succeed at doing so.
Current or future downturns could also have a material adverse impact on our business partners’ stability and financial strength. Given the uncertainties associated with these trends in the current macro-economic environment, it is difficult to fully assess the magnitude of their effects on our, and our business partners’, business, financial condition and results of operations. The trends associated with the current economic environment may also have the effect of amplifying many of the other risks described herein.
The loss of, continued reduction or substantial decline in revenue from larger clients could have a material adverse effect on our revenues, profitability and liquidity.
We have experienced revenue concentration with a large customer that for the years ended December 31, 2023, 2022, and 2021 represented approximately 15%, 23% and 22% of our consolidated revenue, respectively. During the year ended December 31, 2023, the revenue recognized from this large customer declined approximately 41% as compared to the year ended December 31, 2022. Generally, our contracts do not contain guarantees of minimum duration, revenue levels, or profitability. This customer may terminate its contracts or may materially further reduce its requested levels of products or services at any time. The further loss of revenue from, deterioration of the financial condition of, or a significant change to the business of this customer could have a material adverse effect on our business, financial condition, and results of operations. Additionally, this concentration exposes us to concentrated credit risk, as a significant portion of our accounts receivable may be from a single customer. If we are unable to collect our receivables, or are required to take additional reserves, our results of operations and cash flow from operations will be adversely affected.
Changes in business conditions may cause goodwill and other intangible assets to become impaired.
Goodwill and other intangible assets are subject to an impairment test on an annual basis and when circumstances indicate that an impairment is more likely than not. Such circumstances include a significant adverse change in the business climate or a decision to dispose of a business or product line. We face some uncertainty in our business environment due to a variety of challenges, including changes in customer demand and a recent decline in our market capitalization as a result of a decrease in our stock price. While we recorded an impairment charge of $279.8 million related to our goodwill during 2023, we may experience additional unforeseen circumstances that adversely affect the value of our goodwill or intangible assets and trigger an evaluation of the amount of the recorded goodwill and intangible assets. Future write-offs of goodwill or other intangible assets as a result of an impairment in the business could materially adversely affect our results of operations and financial condition.
Our uneven sales cycle makes planning and inventory management difficult and future financial results less predictable.
Our quarterly sales often have reflected a pattern in which a disproportionate percentage of each quarter’s total sales occur towards the end of the quarter, in particular for sales of hardware and software products. This uneven sales pattern makes predicting net revenue, earnings, cash flow from operations and working capital for each financial period difficult, increases the risk of unanticipated variations in our quarterly results and financial condition and places pressure on our inventory management and logistics systems. If predicted demand is substantially greater than orders, there may be excess inventory. Alternatively, if orders substantially exceed predicted demand, we may not be able to fulfill all of the orders received in each quarter and such orders may be canceled. Furthermore, depending on when they occur in a quarter, developments such as an information systems failure, component pricing movements, component shortages or global logistics disruptions could adversely impact our inventory levels and results of operations in a manner that is disproportionate to the number of days in the quarter affected.
The variety of products that we sell could cause significant quarterly fluctuations in our gross profit margins, and those fluctuations in margins could cause fluctuations in operating income or loss and net income or loss.
We continuously work to expand and improve our products, materials and services offerings, geographic areas in which we operate and the distribution channels we use to reach various target product applications and customers. This variety of products, applications, channels and regions involves a range of gross profit margins that can cause substantial quarterly fluctuations in gross profit and gross profit margins depending upon the mix of product shipments from quarter to quarter. Additionally, the introduction of new products or services may further heighten quarterly fluctuations in gross profit and gross profit margins due to manufacturing ramp-up and start-up costs. We may experience significant quarterly fluctuations in gross profit margins or operating income or loss due to the impact of the mix of products, offerings, geographic areas and distribution channels we use to sell our products, materials and offerings from period to period.
Our products and services may experience quality problems from time to time that can result in decreased sales and operating margin, product returns, product liability, and warranty or other claims that could result in significant expenses and harm to our reputation.
We sell complex hardware and software products, materials and services that can contain undetected design and manufacturing defects or errors when first introduced or as enhancements are released that, despite testing, are not discovered until after the product has been installed and used by customers. Sophisticated software and applications, such as those sold by us, may contain “bugs” that can unexpectedly interfere with the software’s intended operation. Defects may also occur in components and products we purchase from third parties. There can be no assurance we will be able to detect and fix all defects in the hardware, software, materials and services we sell. Failure to do so could result in lost revenue, product returns, product liability, delayed market acceptance of those products and services, claims from distributors, end-users or others, increased end-user service and support costs, and significant warranty claims and other expenses to correct the defects. Additionally, such quality problems may result in a diversion of management time and attention and harm to our reputation.
We also sell end-use parts to customers in the aerospace, medical, and semiconductor industries and 3D printing systems to customers in the aerospace industry, which carry with them a greater potential for liability claims against us. In the case of end-use parts, our sales to customers in the aerospace, medical, and semiconductor industries, in particular, makes us more susceptible to product and other liability claims, which characterize operations in those industries. Sales of our 3D printing systems to customers in the aerospace industry similarly carry with them potential liability claims if the parts produced by those systems do not function properly. Any such claims that are not adequately covered by insurance or for which insurance is not available may adversely affect our results of operations and financial condition.
We depend on external vendors and suppliers for the components and spare parts for our 3D printers and for chemicals and packaging used in our materials. Supply and logistical disruptions occur periodically for many of our supply chain partners. If these relationships were to terminate or these or other disruptions, such as extreme weather events, worsen, our business could be disrupted while we locate alternative sources of supply and our expenses may increase.
We purchase components and sub-assemblies for our printers from third-party suppliers that we provide to our customers as spare parts. Additionally, we purchase raw chemicals and packaging that are used in our materials, as well as certain of those materials, from third-party suppliers.
While there are typically several potential suppliers of parts for our products, we currently choose to use only one or a limited number of suppliers for several of these items, including our lasers, materials and certain jetting components. Our reliance on a single or limited number of suppliers involves many risks, including, among others, the following:
•Potential shortages of some key components;
•Disruptions in the operations of these suppliers;
•Product performance shortfalls; and
•Reduced control over delivery schedules, assembly capabilities, quality and costs.
Increased occurrence of extreme weather events, increased temperature, and related disruptions may impact our ability to reliably procure key inputs from third-party suppliers, which could increase our costs and interrupt supply and adversely impact our business.
Periodic delays on the inbound supply chain at our partners and our own facilities have also created challenges. We continue to identify alternative solutions, but an inability to source from alternative suppliers in a timely manner could impact on our ability to fulfill demand.
While we believe that, if necessary, we can obtain all the components necessary for our spare parts and materials from other manufacturers, we require any new supplier to become “qualified” pursuant to our internal procedures, which could involve evaluation processes of varying durations. Our spare parts and raw chemicals used in our materials production are subject to various lead times. In addition, at any time, certain suppliers may decide to discontinue production of a part or raw material that we use, or may not have supplies available due to supplier business disruption. Any unanticipated change in the sources of our supplies, or unanticipated supply limitations, could increase production or related costs and consequently reduce margins.
If our forecasts exceed actual orders, we may hold large inventories of slow-moving or unusable parts, which could have an adverse effect on our cash flow, profitability and results of operations. Inversely, we may lose orders if our forecast is low and we are unable to meet demand. There is considerable uncertainty on the business impact from labor and supply limitations on our vendors, suppliers, and partners. If disruptions to global businesses continue or worsen it could have a material adverse effect on our financial condition and results of operations.
We are subject to environmental, health and safety laws and regulations related to our operations and the use of our systems and materials, including requirements imposed due to use of our products by our customers, which could subject us to compliance costs and/or potential liability in the event of non-compliance.
The export of our products internationally subjects us to environmental laws and regulations concerning the import and export of chemicals and hazardous substances such as the United States Toxic Substances Control Act, or TSCA, and the Registration, Evaluation, Authorization and Restriction of Chemical Substances, or REACH. These laws and regulations require the testing and registration of some chemicals that we ship along with, or that form a part of, our systems and other products. If we fail to comply with these or similar laws and regulations, we may be required to make significant expenditures to reformulate the chemicals that we use in our products and materials or incur costs to register such chemicals to gain and/or regain compliance. Additionally, we could be subject to significant fines or other civil and criminal penalties should we not achieve such compliance.
We are furthermore subject to extensive environmental, health and safety laws, regulations and permitting requirements in multiple jurisdictions due to our use of chemicals and production of waste materials as part of our operations and in connection with the operation of our systems by our customers. In certain cases, the required compliance with health or safety regulations is imposed by our customers themselves. These laws, regulations and requirements (which include the Directive on Waste Electrical and Electronic Equipment of the European Union (EU) and the EU Directive on Restriction of Use of Certain Hazardous Substances) govern, among other things, the generation, use, storage, registration, handling and disposal of chemicals and waste materials, the presence of specified substances in electrical products, the emission and discharge of hazardous materials into the ground, air or water, the cleanup of contaminated sites, including any contamination that results from spills due to our failure to properly dispose of chemicals and other waste materials and the health and safety of our employees. Under these laws, regulations and requirements, we could also be subject to liability for improper disposal of chemicals and waste materials, including those resulting from the use of our systems and accompanying materials by end-users. These or future laws and regulations could potentially require the expenditure of significant amounts for compliance and/or remediation. If our operations fail to comply with such laws or regulations, we may be subject to fines and other civil, administrative or criminal sanctions, including the revocation of permits and licenses necessary to continue our business activities. In addition, we may be required to pay damages or civil judgments in respect of third-party claims, including those relating to personal injury (including exposure to hazardous substances that we generate, use, store, handle, transport, manufacture or dispose of), property damage or contribution claims. Some environmental laws allow for strict, joint and several liabilities for remediation costs, regardless of fault. We may be identified as a potentially responsible party under such laws. If we fail to comply with any such regulations or are subject to related liability, such developments could have a material adverse effect on our business, financial condition and results of operations.
If we do not generate net cash flow from operations and if we are unable to raise additional capital, our financial condition could be adversely affected and we may not be able to execute our business strategy.
We cannot assure you that we will generate cash from operations or identify and secure other potential sources to fund future working capital needs and meet capital expenditure requirements.
If we are unable to generate such cash flow, we may be required to adopt one or more alternatives, such as selling assets, restructuring or incurring additional debt or obtaining additional equity capital on terms that may be onerous or highly dilutive. Our ability to obtain additional capital or refinance any indebtedness will depend on, among other things, the capital markets, our financial condition at such time and the terms and conditions of any such financing or indebtedness. We may not be able to engage in any of these activities or engage in these activities on desirable terms.
The lack of additional capital resulting from any inability to generate cash flow from operations or to raise equity or debt financing could force us to substantially curtail or cease operations and would, therefore, have an adverse effect on our business and financial condition. Furthermore, we cannot assure you that any necessary funds, if available, would be available on attractive terms or that they would not have a significantly dilutive effect on our existing stockholders. If our financial condition were to worsen and we become unable to attract additional equity or debt financing or enter into other strategic transactions, we would not be able to execute our business strategy and we could default on our debt obligations, become insolvent or be forced to declare bankruptcy.
Our business could be adversely impacted in the event of a failure of our information technology infrastructure or a successful cyber-attack.
We extensively rely on information technology systems and networks to operate our Company and meet our business objectives. Due to evolving cybersecurity threats, it has and will continue to be difficult to prevent, detect, mitigate, and remediate cybersecurity incidents. We experience cybersecurity threats, threats to our information technology infrastructure, and unauthorized attempts to gain access to our sensitive information. We face threats that vary from those common to most industries, to more advanced and persistent threats from highly organized adversaries who target us because of the products and services we provide. We also rely on information technology and third-party vendors to support our operations, including our secure processing of personal, confidential, sensitive, proprietary and other types of information. To date, risks from cybersecurity threats, including as a result of previous cybersecurity incidents, have not materially affected us, including our business strategy, results of operations, or financial condition, but we face ongoing risks from cybersecurity threats that may from time to time in the future cause material adverse impacts on our business strategy, results of operations, or financial condition. Despite ongoing efforts to continually improve our and our vendors’ ability to protect against cybersecurity threats and the implementation of various safeguards, including increasing our cyber insurance, regularly conducting company-wide cybersecurity awareness training, and establishing a dedicated team of personnel to address cyber-based threats, we may not be able to fully protect all information systems, and such incidents may lead to reputational harm, revenue and customer loss, and legal action, among other consequences.
We are subject to numerous laws, regulations, and contractual obligations designed to protect our regulated data, and that of our customers. These include complex and evolving laws, rules, regulations, and standards in many jurisdictions, as well as contractual obligations, relating to cybersecurity and data privacy. Such laws, rules, regulations, and standards pose increasingly complex compliance challenges and potential costs. Any loss of sensitive information and failure to comply with these requirements or other applicable laws and regulations in this area, could result in significant regulatory non-compliance exposure or other penalties and legal liabilities.
We may also need to expend additional resources to adapt our cybersecurity program to the evolving threat landscape and to investigate and remediate vulnerabilities or other identified risks. Given the persistence, sophistication, volume, and novelty of threats we face, we may not be successful in preventing or mitigating cybersecurity threats that could have a material adverse effect on us. The costs related to cybersecurity threats or other disruptions may also not be fully insured or indemnified by other means. Such events could result in the loss of competitive advantages derived from our R&D efforts or other intellectual property, which could result in early obsolescence of our products and services. The occurrence of any of these events could adversely affect our internal operations, the services we provide to our customers, impact our financial results and reputation, or result in litigation, fines, and penalties.
Servicing and/or refinancing our debt may require a significant amount of cash, and we may not have sufficient cash or the ability to raise the funds necessary to settle conversions of the 0% convertible senior notes due 2026 ("the Notes") in cash, repay the Notes at maturity, or repurchase the Notes as required following a fundamental change.
As of December 31, 2023, we had approximately $324.9 million outstanding of the Notes, which amount has been further reduced to $214.4 million in connection with the repurchase of $110.5 million of outstanding Notes on March 8, 2024. Our ability to service and/or refinance our remaining indebtedness, including the Notes, or to make cash payments in connection with any conversions of the Notes, depends on our future performance, which is subject to economic, financial, competitive, and other factors beyond our control. Our business may not generate cash flow from operations in the future sufficient to service our debt and make necessary capital expenditures. If we are unable to generate such cash flow, we may be required to adopt one or more alternatives, such as selling assets, restructuring debt, or obtaining additional debt financing or equity capital on terms that may be onerous or highly dilutive. Our ability to refinance our indebtedness will depend on the capital markets and our financial condition at such time. We may not be able to engage in any of these activities or engage in these activities on desirable terms, which could result in a default on our debt obligations. In addition, any of our future debt agreements may contain restrictive covenants that may prohibit us from adopting any of these alternatives. The Company’s failure to file this Form 10-K and provide it to the trustee by April 1, 2024 represents a default under the terms of the Indenture. In addition, the Company’s failure to file its Form 10-Q for the three months ended March 31, 2024 and provide it to the trustee by May 30, 2024 represented an incremental default under the terms of the Indenture. These defaults will become an event of default under the terms of the Indenture if the Company fails to file this Form 10-K and its Form 10-Q for the three months ended March 31, 2024 prior to the end of the cure period provided for by the Indenture. Accordingly, our failure to comply with these or other covenants of the Indenture could result in an event of default which, if not cured or waived, could result in the acceleration of our debt or cause us to incur special interest payments. For further information regarding the non-compliance with the terms of the Indenture, refer to Note 26 to the consolidated financial statements included in Item 8 of this Form 10-K.
In the event the conditional conversion feature of the Notes is triggered, holders of Notes will be entitled to convert the Notes at any time during specified periods at their option. If one or more holders elect to convert their Notes, we would be required to settle any converted principal through the payment of cash, which could adversely affect our liquidity. In addition, even if holders do not elect to convert their Notes, we could be required under applicable accounting rules to reclassify all or a portion of the outstanding principal of the Notes as a current rather than long-term liability, which would result in a material reduction of our net working capital.
In addition, holders of the Notes have the right to require us to repurchase all or a portion of their Notes upon the occurrence of a fundamental change (as defined in the applicable indenture governing the Notes) at a repurchase price equal to 100% of the principal amount of the Notes to be repurchased. If the Notes have not previously been converted or repurchased, we will be required to repay such Notes in cash at maturity.
Our ability to make required cash payments in connection with conversions of the Notes, repurchase the Notes in the event of a fundamental change, or to repay or refinance the Notes at maturity will depend on market conditions and our future performance, which is subject to economic, financial, competitive, and other factors beyond our control. As a result, we may not have enough available cash or be able to obtain financing at the time we are required to repurchase or repay the Notes or pay cash with respect to Notes being converted.
Our operations and business performance could suffer if we are unable to attract and retain senior management or other key employees.
Our success depends largely on our ability to attract, hire, develop, and retain senior management and key employees, such as engineers, scientists, and other key skilled employees supporting our products and services.
Our senior management team is critical to the leadership of our business operations and the development and execution of our business strategy. When changes occur within senior management or within key employee roles, we are required to manage the continuity of our business, and typically incur incremental costs including search costs, relocation costs, and timing associated with onboarding and knowledge transfer. High demand exists for senior management and other key employees with experience in additive manufacturing and certain technical skills, and there can be no assurance that we will be able to attract and retain such talent. We experience intense competition for qualified talent.
While we aim to provide competitive compensation packages to attract and retain senior management and key employees and engage in regular succession planning for these positions, larger competitors with more resources available to them can make it difficult for us to successfully compete for key talent. If we cannot attract and retain sufficiently qualified talent, such as engineers, scientists, and other key technically skilled employees, or have an adequate succession plan in place, we may be unable to develop, commercialize, and sell new or existing products and services. Furthermore, increasing competition for critical technical skills in the regions surrounding our facilities could require us to pay more to hire and retain key employees, thereby increasing labor costs.
Business Strategy Risk Factors
We have made, and may make in the future, strategic acquisitions and divestitures that may involve significant risks and uncertainties. We may not realize the anticipated benefits of past or future acquisitions and integration of these acquisitions may disrupt our business and divert management attention. Likewise, our potential future divestitures may be unsuccessful and negatively impact our business.
From time to time, we evaluate acquisition candidates that fit our business objectives. Acquisitions involve certain risks and uncertainties, including, among others, the following:
•The inability to successfully improve operating efficiency and reduce costs through our restructuring initiative;
•Difficulty in integrating newly acquired businesses and operations in an efficient and cost-effective manner, which may also impact our ability to realize the potential benefits associated with the acquisition;
•The risk that significant unanticipated costs or other problems associated with integration may be encountered;
•The challenges in achieving strategic objectives, cost savings and other anticipated benefits;
•The risk that our marketplaces do not evolve as anticipated and that the technologies acquired do not prove to be those needed to be successful in the marketplaces that we serve;
•The risk that we assume significant liabilities that exceed the limitations of any applicable indemnification provisions or the financial resources of any indemnifying party;
•The inability to maintain a relationship with key customers, vendors and other business partners of the acquired businesses;
•The difficulty in maintaining controls, procedures and policies during the transition and integration;
•The potential loss of key employees of the acquired businesses;
•The risk of diverting management attention from our existing operations;
•Difficulties in coordinating geographically disparate organizations and corporate cultures and integrating management personnel with different business backgrounds;
•The potential failure of the due diligence process to identify significant problems, liabilities or other challenges of an acquired company or technology;
•The risk that we incur significant costs associated with such acquisition activity that may negatively impact our operating results before the benefits of such acquisitions are realized, if at all;
•The entry into marketplaces where we have no or limited direct prior experience and where competitors have stronger marketplace positions;
•The exposure to litigation or other claims in connection with our assuming claims or litigation risks from terminated employees, customers, former shareholders or other third parties; and
•The risk that historical financial information may not be representative or indicative of our results as a combined company.
Historically, we have grown organically and from acquisitions, and we intend to continue to grow in such manner. Our infrastructure will require, among other things, continued development of our financial and management controls and management information systems, management of our sales channel, continued capital expenditures, the ability to attract and retain qualified management personnel and the training of new personnel. We cannot be sure that our infrastructure, systems, procedures, business processes and managerial controls will be adequate to support the growth in our operations. Any delays in, or problems associated with, implementing, or transitioning to, new or enhanced systems, procedures, or controls to accommodate and support the requirements of our business and operations and to effectively and efficiently integrate acquired operations may adversely affect our ability to meet customer requirements, manage our product inventory, and record and report financial and management information on a timely and accurate basis. These potential negative effects could prevent us from realizing the benefits of an acquisition transaction or other growth opportunity.
Likewise, we have in the past, and may in the future, divest certain business operations. Divestitures involve a number of risks, including the diversion of management's attention, significant costs and expenses, goodwill and other intangible asset impairment charges, the loss of customer relationships and cash flow, and the disruption of operations in the affected business. Failure to timely complete or consummate a divestiture may negatively affect valuation of the affected business or result in restructuring charges.
In the event of an unsuccessful acquisition or divestiture, our competitive position, revenues, results of operations and financial condition could be adversely affected.
We believe that our future success depends on our ability to deliver products and services that meet changing technology and customer needs.
Our business may be affected by rapid technological change, changes in user and customer requirements and preferences, frequent new product and service introductions embodying new technologies and the emergence of new standards and practices, any of which could render our existing products and proprietary technology obsolete. Accordingly, our ongoing R&D programs are intended to enable us to maintain technological leadership. We believe that to remain competitive we must continually enhance and improve the functionality and features of our products, services and technologies. However, there is a risk that we may not be able to:
•Develop or obtain leading technologies useful in our business;
•Enhance our existing products;
•Develop new product, service and technology capabilities that address the increasingly sophisticated and varied needs of prospective customers, particularly in the area of printer speeds, materials functionality and environmental impacts.
•Respond to technological advances and emerging industry standards and practices on a cost-effective and timely basis; or
•Recruit or retain key technology employees.
If we are unable to meet changing technology and customer needs, our competitive position, revenue, results of operations and financial condition could be adversely affected.
The success of our regenerative medicine efforts depends on developing and commercializing products, either ourselves or in conjunction with development partners, that are subject to technical and market risks.
Our regenerative medicine business requires us to develop products that enable the application of additive manufacturing to human organ transplantation, non-organ human applications and organ models used for drug discovery and development. These initiatives may require significant investment and technical achievement of viable product candidates may not be achieved. Despite significant investment requirements, our regenerative medicine efforts may result in only nominal revenue with no guarantee of future revenue growth. Our development efforts remain subject to risks including but not limited to, ongoing funding commitments from our development partners and unanticipated technical or other hurdles to commercialization. For example, in the first quarter of 2024, revised funding arrangements with our key strategic partner refocused the Company’s continuing organ program on developing the capability to print human lung scaffolds, and away from developing the capability to print scaffolds for livers and kidneys. Any products developed through our research efforts are subject to safety, regulatory and efficacy risks that may result in delays to commercialization, cause us to incur additional expenses or fail to achieve commercialization. In addition, any products that achieve commercialization and regulatory approval are subject to market risks including reimbursement from third-party payers and competition from existing or new products that aim to address similar indications. In addition, difficulties in our research efforts may lead to disputes our strategic partners and other third parties, such as the dispute with former shareholders of Volumetric described under the heading “Termination of Volumetric Milestones Related to Potential Earnout Payments” in Note 23 to the consolidated financial statements.
Regulatory, Legislative and Legal Risk Factors
We are subject to U.S. and other anti-corruption laws, trade controls, economic sanctions, privacy regulations, and similar laws and regulations. Our failure to comply with these laws and regulations could subject us to civil, criminal and administrative penalties and harm our reputation.
Doing business on a worldwide basis requires us to comply with the laws and regulations of the U.S. government and various other foreign jurisdictions. These laws and regulations place restrictions on our operations, trade practices, partners and investments.
In particular, our operations are subject to U.S. and foreign anti-corruption and trade control laws and regulations, such as the Foreign Corrupt Practices Act (“FCPA”) and United Kingdom Bribery Act (the “Bribery Act”), export controls and economic sanctions programs, including those administered by the U.S. Treasury Department’s Office of Foreign Assets Control (“OFAC”), the State Department's Directorate of Defense Trade Controls (“DDTC”) and the Bureau of Industry and Security (“BIS”) of the Department of Commerce. As a result of doing business in foreign countries and with foreign customers, we are exposed to a heightened risk of violating anti-corruption and trade control laws and sanctions regulations.
As part of our business, we may deal with state-owned business enterprises, the employees of which are considered foreign officials for purposes of the FCPA’s prohibition on providing anything of value to foreign officials for the purposes of obtaining or retaining business or securing any improper business advantage. In addition, the provisions of the Bribery Act extend beyond bribery of foreign public officials and also apply to transactions with individuals that a government does not employ. Some of the international locations in which we operate lack a developed legal system and have higher than normal levels of corruption. Our continued expansion outside the U.S., including in Brazil, China, India and developing countries, and
our development of new partnerships worldwide, could increase the risk of FCPA, OFAC or Bribery Act violations in the future.
As an exporter, we must comply with various laws and regulations relating to the export of products and technology from the U.S. and other countries having jurisdiction over our operations. In the U.S., these laws include the International Traffic in Arms Regulations (“ITAR”) administered by the DDTC, the Export Administration Regulations (“EAR”) administered by the BIS and trade sanctions against embargoed countries and destinations administered by OFAC. The EAR governs products, parts, technology and software which present military or weapons proliferation concerns, so-called “dual use” items, and ITAR governs military items listed on the United States Munitions List. Prior to shipping certain items, we must obtain an export license or verify that license exemptions are available. Any failures to comply with these laws and regulations could result in fines, adverse publicity and restrictions on our ability to export our products, and repeat failures could carry more significant penalties.
Violations of anti-corruption and trade control laws and sanction regulations are punishable by civil penalties, including fines, denial of export privileges, injunctions, asset seizures, debarment from government contracts and revocations or restrictions of licenses, as well as criminal fines and imprisonment and could harm our reputation, create negative shareholder sentiment and affect our share value. We have established policies and procedures designed to assist our compliance with applicable U.S. and international anti-corruption and trade control laws and regulations, including the FCPA, the Bribery Act and trade controls and sanctions programs administered by OFAC, the DDTC and BIS, and have trained our employees to comply with these laws and regulations. However, there can be no assurance that all of our employees, consultants, agents or other associated persons will not take actions in violation of our policies and these laws and regulations. Additionally, there can be no assurance that our policies and procedures will effectively prevent us from violating these regulations in every transaction in which we may engage or provide a defense to any alleged violation. In particular, we may be held liable for the actions that our joint venture partners take inside or outside of the United States, even though our partners may not be subject to these laws. Such a violation, even if our policies prohibit it, could have an adverse effect on our reputation, business, financial condition and results of operations. In addition, various state and municipal governments, universities and other investors maintain prohibitions or restrictions on investments in companies that do business with sanctioned countries, persons and entities, which could adversely affect our reputation, business, financial condition and results of operations.
Many governments, regulators, investors, employees, customers, and other stakeholders are increasingly focused on environmental considerations relating to businesses, including climate change and greenhouse gas emissions, as well as use of plastic materials. We monitor new and changing international, federal, and state environmental reporting obligations. As new or increased regulations take effect, these changing requirements may impose significant operational costs to comply, and expand compliance requirements for our products, our operations, and our supply chain, which could negatively impact our competitive position.
In addition, we have operations globally and are subject to various privacy and data protection laws, which encompasses the collection, use, disclosure, and storage of personal information and personally identifiable health information. This requires us to dedicate resources to implement controls and infrastructure to protect personal and health information needed to conduct our business activities. Failure to do so could subject us to potential regulatory fines, penalties, litigation, and could negatively impact our business and reputation.
We are subject to complex government laws and regulations relating to certain product sets and failure to meet the stringent requirements could impact our business operations and financial position.
Our medical device business is subject to extensive global regulations and enforcement, including in the Food and Drug Administration (FDA) in the U.S., and other governmental authorities for which our product is distributed. There are complex approvals for medical devices to be placed on the market, as well as ongoing responsibilities under these regulations. Failure to comply with the applicable regulation for which the medical device applies could result in corrective actions, recalls, removal of local authority approvals, ceasing business activities, fines, and criminal prosecution.
Failure to comply with the terms of our settlement agreements with the U.S. Departments of State, Commerce, and Justice could have a material and adverse impact on our business, results of operations and financial condition, and, even if we comply with those settlement agreements, the costs and burdens of compliance could be significant, and we may face additional investigations and proceedings from other governmental entities or third parties related to the same or similar conduct underlying the agreements.
In October 2017, we received an administrative subpoena from the BIS requesting the production of records in connection with possible violations of U.S. export control laws, including with regard to our former Quickparts.com, Inc. subsidiary. In addition, while collecting information responsive to the above-referenced subpoena, our internal investigation identified potential violations of the ITAR administered by the DDTC and potential violations of the EAR administered by the BIS. On June 8, 2018 and thereafter, we submitted voluntary disclosures to BIS and DDTC identifying potentially unauthorized exports between 2012 and 2017, including to China, of controlled items including technical data. In connection with these matters, in August 2020, we received two federal grand jury subpoenas issued by the U.S. District Court for the Northern District of Texas. The Company responded to these two subpoenas and fully cooperated with the U.S. Department of Justice (“DOJ“) in the related investigation.
During the year ended December 31, 2023, the Company engaged in settlement discussions with DDTC, BIS, and DOJ to settle the potential export control violations described above. On February 27, 2023, the Company settled these matters with all three agencies. See Note 23, “Commitments and Contingencies,” to our consolidated financial statements included in Part II, Item 8, “Financial Statements and Supplementary Data” of this Form 10-K for additional information.
Compliance with the terms of these agreements, which impose remedial measures such as a Special Compliance Officer to monitor the Company’s export compliance programs, could continue to impose significant costs and burdens on us. If we fail to comply with the terms of these agreements, DDTC, BIS and/or DOJ may impose substantial monetary penalties, which could have a material adverse effect on our business, financial condition and results of operations.
Since 2018, we have implemented new compliance procedures to identify and prevent potential violations of export controls laws, trade sanctions and government contracting laws and regulations and created a Compliance Committee of the Board of Directors to further enhance board oversight of compliance risks. As we continue to implement additional compliance enhancements, we may discover additional potential violations of export controls laws, trade sanctions and/or government contracting laws. If we identify any additional potential violations, we will submit voluntary disclosures to the relevant agencies and cooperate with such agencies on any related investigations. However, if we are found to have violated one or more export control laws, trade sanctions or government contracting laws, we could be subject to various civil or criminal penalties, significant compliance, litigation, settlement costs or other losses, which could divert management’s attention from other business concerns, resulting in a material adverse effect on our business, results of operations and financial condition. We may also be subject to negative publicity related to these matters, which could harm our reputation, reduce demand for our products, solutions and services, result in employee attrition and negatively impact our stock price.
As a result of the delayed filing of this Form 10-K and the Form 10-Q for the quarter ended March 31, 2024, the Company has experienced risks and costs and could experience additional risks and costs in the future, including with respect to the SEC's ongoing investigation.
As a result of the circumstances giving rise to the delayed filing of this Form 10-K and the Form 10-Q for the quarter ended March 31, 2024, the Company experienced risks and costs and could experience additional risks and costs in the future. The audit of the financial statements included in this Form 10-K was time-consuming, required the Company to incur additional incremental expenses and affected management’s attention and resources. Further, the measures to strengthen internal controls being implemented continued to require and will likely require in the future greater management time and Company resources to implement and monitor. Although we have now filed this Form 10-K, our failure to file it in a timely manner and our ongoing failure to timely file our Form 10-Q for the quarter ended March 31, 2024 may lead to further investigation and scrutiny by the SEC, which has been conducting a formal investigation of the Company since April 2022 as a follow on to the previously disclosed SEC voluntary request for documents. Although the Company is currently cooperating with the SEC, the Company cannot predict the ultimate outcome of the SEC’s investigation. Any allegations or adverse findings by the SEC could harm our reputation, negatively impact our stock price and have a material adverse effect on our business, financial condition and results of operations, and the expense and distraction to management of cooperating with and responding to the SEC could have a material adverse effect on the Company even if the investigation is ultimately closed or resolved in a manner favorable to the Company. See also the risk factor below entitled “We are no longer eligible to use a Form S-3 registration statement, which could impair our capital-raising activities.”
We derive a significant portion of our revenue from business conducted outside the U.S. and are subject to the risks of doing business outside the U.S.
We face many risks inherent in conducting business activities outside the U.S. that, unless managed properly, may adversely affect our profitability, including our ability to collect amounts due from customers. While most of our operations outside the U.S. are conducted in highly developed countries, our operations could be adversely affected by, among others, the following:
•Unexpected changes in laws, regulations and policies of non-U.S. governments relating to investments and operations, as well as U.S. laws affecting the activities of U.S. companies abroad;
•Changes in regulatory requirements, including export controls, tariffs and embargoes, other trade restrictions, competition, environmental, corporate practices and data privacy concerns;
•Political policies, political or civil unrest, terrorism or epidemics and other similar outbreaks;
•Fluctuations in currency exchange rates;
•Limited protection for the enforcement of contract and intellectual property rights in some countries;
•Difficulties in staffing and managing foreign operations;
•Operating in countries with a higher incidence of corruption and fraudulent business practices;
•Potentially adverse changes in taxation;
•The impact of public health epidemics on employees and the global economy; and
•Other factors, depending upon the specific country in which we conduct business.
These uncertainties may make it difficult for us and our customers to accurately plan future business activities and may lead our customers in certain countries to delay purchases of our products and services. More generally, these geopolitical, social and economic conditions could result in increased volatility in global financial markets and economies.
The consequences of terrorism or armed conflicts are unpredictable, and we may not be able to foresee events that could have an adverse effect on our market opportunities or our business. We are uninsured for losses and interruptions caused by terrorism, acts of war and similar events.
While the geographic areas outside the U.S. in which we operate are generally not considered to be highly inflationary, our foreign operations are sensitive to fluctuations in currency exchange rates arising from, among other things, certain intercompany transactions that are generally denominated in U.S. dollars rather than their respective functional currencies.
Moreover, our operations are exposed to market risk from changes in interest rates and foreign currency exchange rates and commodity prices, which may adversely affect our results of operations and financial condition. We seek to minimize these risks through regular operating and financing activities and, when we consider it to be appropriate, through the use of derivative financial instruments. However, our efforts to minimize our exposure to market risks from changes in interest rates, foreign currency exchange rates and commodity prices may prove to be insufficient or unsuccessful.
We may incur substantial costs enforcing or acquiring intellectual property rights and defending against third-party claims as a result of litigation or other proceedings.
In connection with the enforcement of our own intellectual property rights, the acquisition of third-party intellectual property rights or disputes related to the validity or alleged infringement of third-party intellectual property rights, including patent rights, we have been, and may in the future be, subject to claims, negotiations or complex, protracted litigation. Intellectual property disputes and litigation may be costly and can be disruptive to our business operations by diverting the attention and energy of management and key technical personnel, and by increasing our costs of doing business. Although we have successfully defended or resolved past litigation and disputes, we may not prevail in any ongoing or future litigation and disputes, which could adversely affect our results of operations and financial condition.
Third-party intellectual property claims asserted against us could subject us to significant liabilities, require us to enter into royalty and licensing arrangements on unfavorable terms, prevent us from assembling or licensing certain of our products, subject us to injunctions restricting our sale of products, cause severe disruptions to our operations or the marketplaces in which we compete or require us to satisfy indemnification commitments with our customers, including contractual provisions under various license arrangements. In addition, we may incur significant costs in acquiring the necessary third-party intellectual property rights for use in our products. Any of these could seriously harm our business, operating results, liquidity and financial condition.
We may not be able to protect our intellectual property rights and confidential information, including our digital content, from third-party infringers or unauthorized copying, use or disclosure.
Although we defend our intellectual property rights and endeavor to combat unlicensed copying and use of our digital content and intellectual property rights through a variety of techniques, preventing unauthorized use or infringement of our rights (“piracy attacks”) is inherently difficult. If our intellectual property becomes subject to piracy attacks, our business may be harmed.
Additionally, we endeavor to protect the secrecy of our digital content, confidential information and trade secrets. If unauthorized disclosure of our trade secrets occurs, we could potentially lose trade secret protection. The loss of trade secret protection could make it easier for third parties to compete with our products by copying previously confidential features, which could adversely affect our business, results of operations, revenue and operating margins. We also seek to protect our confidential information and trade secrets through the use of non-disclosure agreements. However, there is a risk that our confidential information and trade secrets may be disclosed or published without our authorization, and in these situations it may be difficult and/or costly for us to enforce our rights.
Changes in, or interpretation of, tax rules and regulations may impact our effective tax rate and future profitability.
We are a U.S. based, multinational company subject to taxation in multiple U.S. and foreign tax jurisdictions. Our future effective tax rates could be adversely affected by changes in statutory tax rates or interpretation of tax rules and regulations in jurisdictions in which we do business, changes in the amount of revenue or earnings in the countries with varying statutory tax rates, or by changes in the valuation of deferred tax assets and liabilities.
In addition, we are subject to audits and examinations of previously filed income tax returns by the Internal Revenue Service and other domestic and foreign tax authorities. We regularly assess the potential impact of such examinations to determine the adequacy of our provision for income taxes and have reserved for potential adjustments that we expect may result from the current examinations. We believe such estimates to be reasonable; however, there is no assurance that the final determination of any examination will not have an adverse effect on our operating results and financial position.
Material weaknesses in our internal control over financial reporting could result in material misstatements in our financial statements not being prevented or detected, which could affect investor confidence in the accuracy and completeness of our financial statements and could negatively impact our stock price and financial condition.
As a public company, we are required to comply with Section 404 of the Sarbanes-Oxley Act. If we fail to abide by the applicable requirements of Section 404, regulatory authorities, such as the SEC, could subject us to sanctions or investigation, and our independent registered public accounting firm may not be able to certify as to the effectiveness of our internal control over financial reporting pursuant to an audit of our internal controls. Even effective internal controls can provide only reasonable assurance with respect to the preparation and fair presentation of financial statements. Accordingly, our internal control over financial reporting may not prevent or detect misstatements because of their inherent limitations, including the possibility of human error, the circumvention or overriding of controls, or fraud.
Management, including our Chief Executive Officer and Chief Financial Officer, assessed the effectiveness of the Company’s internal control over financial reporting as of December 31, 2023. Based on its assessment, management has concluded that the Company did not maintain effective internal control over financial reporting as of December 31, 2023, due to the following material weaknesses.
1.The revenue process, including the review of contract terms input into the Company's information systems that support the determination of revenue recognition, the accounting for, and the monitoring of the timing of revenue recognition;
2.The financial close, accounting, and reporting processes, as specifically related to management’s review of internally prepared reports and analyses utilized in these processes in reviewing certain financial statement disclosures;
3.The design and implementation of controls over the review of revenue pricing and the implementation of a related accounting information system;
4.Management’s review of the accounting treatment for certain technical matters related to certain transactions and financial statement accounts; and
5.The maintenance of an effective control environment; specifically, as it relates to: (a) senior management's commitment to the control environment principles, and (b) maintaining sufficient qualified resources with the appropriate level of knowledge, experience, and training necessary to support accounting and financial reporting processes and controls.
Certain of the material weaknesses described above (items 1 and 2) were initially identified at December 31, 2020 and continued to exist at December 31, 2023. As further described in Item 9A, Management's Report on Internal Control over Financial Reporting, we began implementing a remediation plan in January 2021 designed to improve our internal control over financial reporting through the development and implementation of more formal policies, processes and documentation procedures relating to our financial reporting, the hiring of additional accounting personnel, and the training of personnel on proper execution of designed control procedures.
While we believe our remediation plans should remediate the material weaknesses, we cannot provide assurance of when the material weaknesses will be remediated, nor can we be certain of whether additional actions will be required or the costs of any such actions. Moreover, we cannot provide assurance that additional material weaknesses will not arise in the future. While the material weaknesses discussed in Item 9A, "Management's Report on Internal Control over Financial Reporting", did not result in material misstatements of our annual or interim consolidated financial statements, any failure to remediate the material weaknesses, or the identification of new material weaknesses in our internal control over financial reporting, could result in material misstatements in our financial statements that may continue undetected, negatively impacting the public perception of the Company and our securities and cause us to fail to meet our reporting and financial obligations or incur significant additional costs to remediate the material weaknesses, each of which could negatively affect our stock price, harm our ability to raise capital on favorable terms in the future or otherwise have a negative impact on our financial condition.
We are no longer eligible to use a Form S-3 registration statement, which could impair our capital-raising activities.
As a result of our failure to timely file this Form 10-K for the fiscal year ended December 31, 2023, and our Form 10-Q for the quarter ended March 31, 2024, with the SEC, we are no longer eligible to use a Form S-3 registration statement. Further, as a result of this late Form 10-K filing and the late Form 10-Q filing, we are also no longer a “well-known seasoned issuer,” as such term is used in the SEC’s regulations, which otherwise would allow us to, among other things, file automatically effective Form S-3 registration statements. Our eligibility to use a Form S-3 registration statement may not be restored until June 1, 2025, and then only if we have not had any other filing delinquency that would preclude Form S-3 eligibility and satisfy all other requirements for Form S-3 eligibility. During any period when we are not eligible to use Form S-3 or qualify as a “well-known seasoned issuer,” our capital-raising ability may be impaired. Under these circumstances, we would be required to conduct the offering on an exempt basis, such as in accordance with Rule 144A, or file a registration statement on Form S-1. Using a Form S-1 registration statement for a public offering would likely take significantly longer than using a registration statement on Form S-3 and increase our transaction costs, and could, to the extent we are not able to conduct offerings using alternative methods, adversely impact our ability to raise capital or complete acquisitions of other companies in a timely manner.
Item 1B. Unresolved Staff Comments
None.
Item 1C. Cybersecurity
We recognize the critical importance of maintaining the safety and security of our systems and data. We have implemented a layered cybersecurity program to assess, identify, and manage risks from cybersecurity threats that may result in material adverse effects on the confidentiality, integrity, and availability of our information systems.
Governance
As part of the Company’s risk management activities, we prioritize the identification and management of risks which includes risks related to cybersecurity.
Board of Directors
Our Board has delegated to the Audit Committee the oversight of cybersecurity risks, including overseeing the actions management has taken to monitor or mitigate such exposure. The Audit Committee reviews the measures implemented by the Company to identify and mitigate data protection and cybersecurity risks on a periodic basis. As part of such reviews, the Audit Committee receives reports and presentations from members of the team responsible for overseeing the Company’s cybersecurity program, including the Chief Information Officer (CIO), which address a wide range of topics including recent developments, evolving standards, vulnerability assessments, third-party and independent reviews, the threat environment, and technological trends. The Audit Committee and such members of our management team also report to the Board at least annually on cybersecurity matters. We have defined guidelines by which certain cybersecurity incidents are escalated within the Company and, where appropriate, reported promptly to the Audit Committee and the Board, as well as ongoing updates regarding any such incident.
Management
At the management level, our CIO and Head of Cybersecurity, have extensive cybersecurity knowledge and skills gained from work experience at the Company and other publicly traded companies. They lead the team responsible for implementing, monitoring, and maintaining cybersecurity, including data protection practices across our business. The Head of Cybersecurity receives reports on cybersecurity threats from both our internal and external partners on a regular basis. The Chief Administrative Officer and Chief Executive Officer receive regular reports from the Head of Cybersecurity and the CIO on the cyber program and measures implemented by the Company to identify and mitigate cybersecurity risks. Our CIO and Head of Cybersecurity work closely with our Company’s Legal and Compliance teams to oversee compliance with legal, regulatory, and contractual security requirements, and also attend meetings with the Audit Committee and the Board that include cybersecurity updates.
Internal Cybersecurity Team
Our internal Cybersecurity Team, led by the Head of Cybersecurity, is responsible for the implementation, monitoring, and maintenance of our cybersecurity program, including the Company’s data protection practices. Reporting to our Head of Cybersecurity are a number of experienced and trained information security professionals who have previous work experience and educational backgrounds in information technology and security, and who also have industry recognized cybersecurity certifications. In addition to our internal cybersecurity capabilities, we also utilize a number of third-party experts to assist with assessing, identifying, and managing our cybersecurity risks.
Risk Management and Strategy
Assessing, identifying and managing cybersecurity risks are integral to our risk management activities. Our cybersecurity program leverages people, processes, and technology to identify and respond to cybersecurity threats in a timely manner. We maintain continuous monitoring of our network and also assess, identify, and manage risks from cybersecurity threats through various mechanisms, which may include incident response planning, risk assessments, control gap analyses, threat modeling, penetration tests, and vulnerability scanning.
Our cybersecurity assessment analyses have identified and prioritized steps to further enhance our cybersecurity practices. We maintain cyber insurance, regularly conduct company-wide cybersecurity awareness training, and have a dedicated team of Company personnel to address cybersecurity threats. We intend to implement additional security measures and processes to enhance our detection and response to cybersecurity incidents as appropriate.
We have adopted a Cybersecurity Incident Response Plan (the “IRP”) to provide a standardized framework for responding to and escalating security incidents. The IRP sets out a coordinated approach to investigating, containing, documenting, and mitigating incidents, including reporting findings and keeping senior management and other key stakeholders informed and involved as needed.
Material Cybersecurity Risks, Threats & Incidents
To date, risks from cybersecurity threats, including as a result of previous cybersecurity incidents, have not materially affected us, including our business strategy, results of operations, or financial condition, but we face certain ongoing risks from cybersecurity threats that, if realized, are reasonably likely to have such an affect. Additional information on cybersecurity risks we face can be found in Part I, Item 1A “Risk Factors” of this Report under the heading “Our business could be adversely impacted in the event of a failure of our information technology infrastructure or a successful cybersecurity incident,” which should be read in conjunction with the foregoing information.
Item 2. Properties
Our headquarters are located in Rock Hill, South Carolina. As of December 31, 2023, we own minimal facilities, and we lease facilities in the U.S., EMEA, and APAC. Our leased facilities support our Healthcare Solutions segment, Industrial Solutions segment, and Corporate functions and consist of office space, manufacturing facilities, and warehouse or storage space that supports the distribution of our products.
Item 3. Legal Proceedings
Information relating to legal proceedings is included under the header "Litigation" in Note 23 to the consolidated financial statements in Item 8 of this Form 10-K, which is incorporated by reference into this Item 3.
Item 4. Mine Safety Disclosures
Not applicable.
PART II
Item 5. Market for Registrant’s Common Equity, Related Stockholder Matters and Issuer Purchases of Equity Securities
Our common stock is listed on the New York Stock Exchange (“NYSE”) under the trading symbol “DDD.”
As of August 5, 2024, our outstanding common stock was held by approximately 1,186 stockholders of record. This figure does not reflect the beneficial ownership of shares held in a nominee's name.
Dividends
We do not currently pay, and have not paid, any dividends on our common stock, and we currently intend to retain any future earnings for use in our business. Any future determination as to the declaration of dividends on our common stock will be made at the discretion of the Board of Directors and will depend on our earnings, operating and financial condition, capital requirements, and other factors deemed relevant by the Board of Directors, including the applicable requirements of the Delaware General Corporation Law, which provides that dividends are payable only out of surplus or current net profits.
The payment of dividends on our common stock may be restricted by the provisions of credit agreements or other financing documents that we may enter into or the terms of securities that we may issue from time to time. Currently, no such agreements or documents limit our declaration of dividends or payments of dividends.
Issuance of Unregistered Securities and Issuer Purchases of Equity Securities
We did not repurchase any of our equity securities in the open market during 2023; however, shares of common stock were surrendered to us for payment of tax withholding obligations in connection with the vesting of restricted stock awards and units pursuant to our Amended and Restated 2015 Incentive Stock Plan. For information regarding the securities authorized for issuance under our equity compensation plans, see “Security Ownership of Certain Beneficial Owners and Management and Related Stockholder Matters–Equity Compensation Plans” in Item 12 of this Form 10-K. Also, see Note 17 to the consolidated financial statements in Item 8 of this Form 10-K.
Issuer purchases of equity securities
| | | | | | | | | | | | | | |
| Total number of shares (or units) purchased | | Average price paid per share (or unit) | |
| October 1, 2023 - October 31, 2023 | 83,032 | | | $ | 4.25 | | |
| November 1, 2023 - November 30, 2023 | 7,063 | | | 4.66 | | |
| December 1, 2023 - December 31, 2023 | 12,649 | | | 5.81 | | |
| Total | 102,744 | | a | $ | 4.47 | | b |
a.Represents shares of common stock surrendered to us for payment of tax withholding obligations in connection with the vesting of restricted stock awards and units.
b.The average price paid reflects the average market value of shares withheld for tax purposes.
Stock Performance Graph
The graph below shows, for the five years ended December 31, 2023, the cumulative total return on an investment of $100 assumed to have been made on December 31, 2018 in our common stock. For purposes of the graph, cumulative total return assumes the reinvestment of all dividends. The graph compares such return with those of comparable investments assumed to have been made on the same date in (a) the NYSE Composite Index, and (b) the S&P Small-Cap 600 Information Technology Index, which are published market indices with which we are sometimes compared.
Although total return for the assumed investment assumes the reinvestment of all dividends on December 31 of the year in which such dividends were paid, we paid no cash dividends on our common stock during the periods presented.
COMPARISON OF 5-YEAR CUMULATIVE TOTAL RETURN
| | | | | | | | | | | | | | | | | | | | | | | | | | | | | | | | | | | | | | |
| | December 31, 2018 | | December 31, 2019 | | December 31, 2020 | | December 31, 2021 | | December 31, 2022 | | December 31, 2023 |
| 3D Systems Corporation | | $ | 100 | | | $ | 86 | | | $ | 103 | | | $ | 212 | | | $ | 73 | | | $ | 62 | |
| NYSE Composite Index | | 100 | | | 126 | | | 135 | | | 162 | | | 147 | | | 167 | |
| S&P Small-Cap 600 Information Technology Index | | 100 | | | 140 | | | 178 | | | 226 | | | 176 | | | 213 | |
Item 6. Reserved
Item 7. Management’s Discussion and Analysis of Financial Condition and Results of Operations
The following discussion and analysis should be read together with our consolidated financial statements, and notes thereto, included in Item 8 of this Form 10-K. Certain statements contained in this discussion may constitute forward-looking statements within the meaning of the Private Securities Litigation Reform Act of 1995. These statements involve a number of risks, uncertainties and other factors that could cause actual results to differ materially from those reflected in any forward-looking statements, as discussed more fully in this Form 10-K. See “Risk Factors” in Part I, Item 1A and “Forward-Looking Statements.” All amounts are in thousands, except share and per share amounts, or as otherwise indicated.
For discussion related to our results of operations and changes in financial condition for fiscal 2022 compared to fiscal 2021, refer to Part II, Item 7. "Management’s Discussion and Analysis of Financial Condition and Results of Operations" ("MD&A") in our fiscal 2022 Form 10-K. Our fiscal 2022 Form 10-K was filed with the SEC on March 16, 2023.
Business Overview
3D Systems Corporation (“3D Systems” or the “Company” or “we,” "our" or “us”) markets our products and services through subsidiaries in North America and South America (collectively referred to as “Americas”), Europe and the Middle East (collectively referred to as “EMEA”) and Asia Pacific and Oceania (collectively referred to as “APAC”). We provide comprehensive 3D printing and digital manufacturing solutions, including 3D printers for plastics and metals, materials, software, and services, including maintenance, advanced manufacturing and applications engineering. Our solutions support advanced applications in two key industry verticals: Healthcare Solutions and Industrial Solutions. We have over 35 years of experience and expertise, which have proven vital to our development of an ecosystem and end-to-end digital workflow solutions that enable customers to optimize product designs, transform workflows, bring innovative products to market and drive new business models.
The Company has two reportable segments: Healthcare Solutions and Industrial Solutions. Our reportable segments are based upon the industry verticals that they serve. For Healthcare Solutions, those industry verticals include dental, medical devices, personalized health services and regenerative medicine. For Industrial Solutions, those industry verticals include aerospace, defense, transportation and general manufacturing. We architect solutions specific to customers’ needs through a combination of materials, hardware platforms, software, professional services and advanced manufacturing – creating a path to integrating additive manufacturing into traditional production environments. As a result, manufacturers achieve design freedom, increase agility, scale production and improve their overall total cost of operation. Our technologies and process knowledge enable over a million production parts to be made through additive manufacturing each day.
Recent Developments
Fiscal Year 2023 Restructuring Activities
Restructuring Plan Objectives and Phases
In February 2023, the Company announced the first phase of its multi-faceted restructuring initiative to improve operating efficiencies throughout the organization and drive long-term value creation. The objective of this first phase was to improve manufacturing efficiencies related to our European metal printer operations. Actions taken under this initiative include the insourcing of certain metal printer platforms into the Company’s Riom, France manufacturing facility, co-locating the manufacturing and engineering of the insourced metal printer products in order to improve cycle time from development to production.
In May 2023, the Company announced the next phase of its multi-faceted restructuring initiative, which primarily consisted of a reduction in headcount representing approximately 6% of the Company's workforce. The majority of this targeted workforce reduction related to corporate and business support functions predominately located in the U.S. and Europe.
In October 2023, the Company announced the latest phase of its multi-faceted restructuring initiative, which is primarily targeted at continuing to rationalize headcount, as well as the rationalization of geographic locations (i.e., leased facilities), in all functions across the Company and the reduction of certain third-party costs. This initiative also includes certain strategic actions that have been taken or are being contemplated with respect to certain of the Company’s previously acquired businesses.
We currently expect the execution of our restructuring initiatives to result in the recognition of aggregate charges in the range of $8.5 million to $10.0 million, inclusive of $8.2 million which has been recognized in our consolidated statement of operations for the year ended December 31, 2023. These charges relate to employee severance and termination benefit costs that are generally recognized when probable and estimable because they are typically being determined consistent with the Company’s past practices or statutory law. We may incur additional cash expenditures related to our planned facility exits and relocation activities, which will be recognized as incurred.
We currently expect the execution of our restructuring plan, including the cash settlement of associated liabilities, to be substantially complete by December 31, 2024. Further, we expect our combined restructuring initiatives to deliver aggregate annualized savings of between $50.0 million and $65.0 million, commencing as of our fiscal year beginning January 1, 2025. Refer to the subsequent discussion of the status of our initiatives for additional details regarding the factors that will impact the timing of our realization of such savings.
Status of Our Initiatives
Headcount
The Company has substantially completed the initial phase of headcount reductions announced in May 2023. Actions related to the incremental headcount reductions announced in October 2023 commenced in November 2023 and are expected to continue throughout 2024. We expect to realize the resulting cost savings in our reported results as our headcount reduction efforts advance and are ultimately completed.
Facilities Rationalization
During the three months ended December 31, 2023, the Company (1) commenced the process of identifying leased facilities that it may exit and (2) began developing and executing plans to exit and potentially sublease such facilities. The decision-making, planning and execution activities will continue throughout 2024. To-date, we have identified certain facilities that we have committed to exiting. However, the Company’s consolidated financial statements as of and for the year ended December 31, 2023 do not include material transactions resulting from such decisions because the Company generally had not ceased use of such facilities as of December 31, 2023. In addition, we have identified several additional facilities that we continue to evaluate for opportunities to exit.
The amount and timing of both cost savings and cash savings that ultimately will be realized from facility exits will be dependent upon the finalization of decisions regarding facilities to be exited, how quickly we can exit the facilities that we identify, the impact of market conditions on our ability to sublease the identified facilities, the time it will take to execute a sublease, the amount of our committed lease payments that we are able to recover via sublease, and the level of expenditures that may be required to prepare a facility for sublease. To the extent that the Company is able to sublease a facility, we expect to realize future cash savings; however, a sublease may also result in the recognition of a non-cash impairment charge related to a right-of-use asset and any associated leasehold improvements to the extent that the sublease income is less than our remaining lease payments on the primary lease. In certain cases, if we elect to abandon a facility – for example, because the remaining term of a lease or market conditions do not provide an opportunity for a sublease – we may realize a reduction in selling, general and administrative expense due to lower amortization expense for periods subsequent to our exit of such facility; however, we may not achieve equivalent cash savings.
Costs Incurred and Settled During the Period
The following table provides details regarding restructuring charges recorded during the period, the portion of such costs that were settled with cash as of December 31, 2023, and the remaining accrued liability reported in our consolidated balance sheet as of December 31, 2023:
| | | | | | | | | | | | | | | | | | | | | | | | | | | | |
| (in thousands) | | Accrued liability as of December 31, 2022 | | Costs incurred during 2023 | | | | Amounts settled with cash | | Accrued liability as of December 31, 2023 |
| Severance, termination benefits and other employee costs | | $ | — | | | $ | 8,242 | | | | | $ | 4,309 | | | $ | 3,933 | |
| | | | | | | | | | |
| | | | | | | | | | |
The severance, termination benefits and other employee costs that the Company incurred during the year ended December 31, 2023 are reflected in our consolidated statement of operations as follows:
| | | | | | | | | |
| (in thousands) | | Year Ended December 31, 2023 | |
Total cost of sales | | $ | 1,401 | | |
Selling, general and administrative | | 5,598 | | |
Research and development | | 1,243 | | |
Total(1) | | $ | 8,242 | | |
(1) These severance and termination costs are not included in the Company’s Adjusted EBITDA measure of segment profitability that is reported to our Chief Operating Decision Maker. If these costs were included in our measure of segment profitability, the reported results of our Healthcare Solutions segment and Industrial Solutions segment would have included approximately $1.4 million and $2.7 million respectively, and the remaining costs relate to Corporate.
In addition to the severance and termination costs reported above, the Company has recognized incremental impairment charges totaling $0.6 million related to certain fixed assets that have been retired in connection with the Company’s restructuring activities.
Other Strategic Business Decisions and Cost Saving Initiatives
dp polar GmbH ("dp polar")
During the three months ended December 31, 2023, the Company decided that, for the foreseeable future, it would cease the development of the in-process research and development ("IPR&D") acquired in connection with our October 2022 acquisition of dp polar, discussed below. As a result of this decision, the Company recorded impairment charges totaling $9.4 million related to the carrying value of the intangible assets attributable to this asset group (refer to Note 8). Based upon the decision to cease the development of dp polar’s IPR&D and the resulting impairment of dp polar’s long-lived assets that were previously subject to amortization, the Company expects to recognize lower amortization expense in selling, general and administrative (“SG&A”) expense in future periods.
Oqton
Since the quarter ended September 30, 2023, the Company has been evaluating strategic alternatives related to Oqton MOS, for which we previously disclosed that it is more likely than not that the business will be sold or otherwise disposed of. In connection with the expectation to sell or otherwise dispose of Oqton MOS, management assessed whether the carrying value of this asset group’s long-lived assets was recoverable and, ultimately, recorded impairment charges totaling $13.6 million for the year ended December 31, 2023 (refer to Note 8). The Company expects to immediately realize lower amortization expense recorded to SG&A expense as a result of the impairment of Oqton MOS’s intangible assets that were previously subject to amortization.
During May 2024, the Company completed the sale of the portion of the Oqton MOS business that was focused on the dental market ("Oqton Dental") in exchange for a de minimis amount of cash, resulting in the transfer of a limited portion of Oqton MOS's personnel. The transfer of personnel is expected to provide cost savings from the date of the disposal of Oqton Dental. The Company continues to evaluate strategic alternatives related to the remaining portion of Oqton that the Company continues to hold.
Acquisitions/Investments (See Note 3 and Note 10 to the Consolidated Financial Statements for further details)
The Company has made the following significant acquisitions and investments during our fiscal years ended December 31, 2023 and 2022.
Wematter AB
On July 1, 2023, the Company completed the acquisition of Wematter AB (“Wematter”), a Swedish 3D printer manufacturer, for which post-acquisition results are included in our Industrial Solutions segment. The acquisition broadens 3D Systems’ Selective Laser Sintering (SLS) portfolio. Consideration for this acquisition consisted of approximately $10.2 million in cash, subject to customary post-closing adjustments. The Company also may be required to pay an additional €2.0 million in cash, contingent upon the achievement of certain post-closing performance conditions and the continued employment of certain key employees of Wematter for two years after the closing date of the acquisition. As of December 31, 2023, management does not believe that achievement of the post-closing performance conditions is probable.
Theradaptive, Inc.
In June of 2023, we made an $8.0 million investment in Theradaptive, Inc. ("Theradaptive") via the purchase of Series A Preferred Stock, pursuant to which we hold an approximate 9.15%, or 8.25% fully-diluted, ownership interest in Theradaptive. Theradaptive is currently developing a protein that encourages bone growth. This biotechnology could be applied to 3D printed metal splints for patients who otherwise may require amputation of a limb because the lost bone is too vast to replace with a splint. The Company has accounted for its investment in Theradaptive on a cost basis, subject to assessment for impairment, as the fair value of Theradaptive's equity is not readily determinable, and the investment is not subject to the equity method of accounting due to the Company's lack of significant influence. The investment in Theradaptive is not expected to materially impact our future financial position, results of operations, or cash flows.
dp polar GmbH
On October 4, 2022, we completed the acquisition of dp polar, a German-based designer and manufacturer of a manufacturing system designed for high-speed mass production of customized components, for $25.9 million, which includes $19.6 million paid in cash at closing, $7.1 million paid at closing via the issuance of the Company’s common stock, and an estimated post-closing purchase price adjustment of $0.8 million due to the Company from the sellers. An additional payment of $2.2 million, consisting of the issuance of 249,865 shares of the Company’s common stock, could be required if a key individual from dp polar's management team continues to provide service to the Company through December 31, 2024. As discussed above, because dp polar has not generated any revenue subsequent to being acquired, and is not expected to generate any revenue in the foreseeable future, the Company has decided to cease developing the acquired dp polar IPR&D for the foreseeable future.
Kumovis GmbH
On April 1, 2022, we completed the acquisition of 93.75% of Kumovis GmbH ("Kumovis") for an all-cash purchase price of $37.9 million. $3.6 million of the purchase price was deferred for up to fifteen months from the closing date and was paid in July 2023. Kumovis, which is part of the Healthcare Solutions segment, utilizes polyether ether keton or “PEEK” materials, which have properties that lend it to many medical applications that fit into our personalized healthcare solutions operations, including many implant applications. Certain of Kumovis's applications remain subject to FDA approval before they will result in the recognition of revenue.
Titan Additive LLC
On April 1, 2022, we completed the acquisition of 100% of Titan Additive LLC ("Titan") for an all-cash purchase price of $39.0 million. Titan, which is part of the Industrial Solutions segment, is a pellet-based extrusion platform that addresses customer applications requiring large build volumes, superior performance, and improved productivity at significantly lower cost. We believe the acquisition of Titan will open up new markets in the Industrial Solutions segment.
National Additive Manufacturing Innovation ("NAMI") Joint Venture
In March 2022, the Saudi Arabian Industrial Investments Company (“Dussur”) and 3D Systems signed an agreement to form a joint venture intended to expand the use of additive manufacturing within the Kingdom of Saudi Arabia and surrounding geographies, including the Middle East and North Africa. The joint venture is to enable the development of Saudi Arabia's domestic additive manufacturing production capabilities, consistent with the Kingdom’s ‘Vision 2030,’ which is focused on diversification of the economy and long-term sustainability. Upon entering into the agreement with Dussur, 3D Systems committed to an initial investment in the joint venture of approximately $6.5 million, of which $3.4 million had been deposited into an escrow account as of December 31, 2022 and, accordingly, was reported as restricted cash within other assets on the December 31, 2022 balance sheet. In February 2023, the Company became a shareholder in the joint venture and owns 49% of the joint venture's common stock. During April 2023, the $3.4 million held in escrow, as well as the additional amount of approximately $3.1 million owed to the joint venture, was deposited into a bank account of the joint venture for use in its operations. The impact of this investment on the Company’s future financial position and cash flows is expected to be limited to cash outflow(s) related to future investments, if required. Additional future investments are contingent upon the achievement of certain milestones by the joint venture or separate agreement by the parties to the joint venture to invest additional capital. Refer to Note 26 for details regarding the Company's incremental investment in NAMI subsequent to December 31, 2023.
The Company accounts for the joint venture under the equity method of accounting, which requires the Company to recognize its proportionate share of the joint venture's reported net income or loss. Due to the timing of when the joint venture's reported financial information is expected to be available, the Company records amounts required to be recognized pursuant to the equity method of accounting on a one quarter lag.
Enhatch Inc.
In March 2022, we made a $10.0 million investment for an approximate 26.6% ownership interest in Enhatch Inc. (“Enhatch”), the developer of the Intelligent Surgery Ecosystem. We simultaneously entered into a collaboration and supply agreement with Enhatch. We also obtained warrants to purchase additional shares of Enhatch and the right to purchase, in the future, the remaining shares of Enhatch that 3D Systems does not own, if certain revenue targets are achieved. Enhatch's Intelligent Surgery Ecosystem provides technologies which streamline and scale the design and delivery of patient-specific medical devices by automating the process. Incorporating these capabilities into 3D Systems’ workflow for patient-specific solutions, which includes advanced software, expert treatment planning services, custom implants, instrumentation design, and industry-leading production processes, will help more efficiently meet the growing demand for personalized medical devices.
Investing in Regenerative Medicine
Within our Healthcare Solutions segment, a portion of our business focuses on opportunities for additive manufacturing to be applied to regenerative medicine. To date, our efforts in the area of regenerative medicine have consisted primarily of pre-commercial bio-technology R&D in the areas described below.
Our first area of focus is the use of additive manufacturing for human organ transplantation, with a long-term goal of helping patients with end-stage disease receive transplants that will enable them to enjoy long and active lives. This program combines our 3D printing expertise and capabilities in human tissue engineering with the regenerative medicine and biotechnology expertise of a key strategic partner. Through the start of 2024, our program focused on developing the capability to print organ scaffolds for human lungs, kidneys and livers. However, beginning in the first quarter of 2024, due to changes to our arrangement with and funding from our key strategic partner, the Company’s continuing organ program shifted its focus to developing the capability to print human lung scaffolds, for which the related R&D efforts will continue to be primarily funded by our key strategic partner. Refer to the discussions of (A) “Regenerative medicine earnout payments and performance-based stock units” within the “Critical Accounting Estimates” section of this MD&A discussion and (B) Note 26 for additional information regarding the impact of the changes to this program during the first quarter of 2024.
Our second area of focus involves utilizing our bio-printing technology to manufacture non-organ human tissue scaffolds for use in transplantation and surgical reconstruction applications. We believe that continued progress in this area could result in significantly improved health outcomes for patients, as well as open up attractive new growth markets and therapeutic applications for 3D printed, vascularized soft-tissue scaffolds.
Our third area of focus seeks to utilize our bio-printing capabilities to design and manufacture 3D-printed vascularized “organs-on-chips” for use in drug development by pharmaceutical industry customers through our wholly-owned biotech company, Systemic Bio. We believe that “organs-on-chips” can accelerate the drug development process and reduce the cost of pre-clinical drug testing, as well as reduce the pharmaceutical industry’s reliance on animal testing. Systemic Bio combines 3D Systems’ legacy expertise in high-resolution 3D printing with advanced capabilities in bioprinting and biomaterials to design and market 3D-printed, vascularized “organs-on-chips.” During the year ended December 31, 2023, Systemic Bio entered into its first commercial contracts with pharmaceutical industry customers.
Background
We earn revenue from the sale of products and services through our Healthcare Solutions and Industrial Solutions segments. The product categories include 3D printers and corresponding materials, digitizers, software licenses, 3D scanners and haptic devices. The majority of materials used in our 3D printers are proprietary. The services categories include maintenance contracts and services on 3D printers, software maintenance, software as a service subscriptions and healthcare solutions services.
Given the relatively high price of certain 3D printers and a corresponding lengthy selling cycle, as well as relatively low unit volume of the higher-priced printers in any particular period, a shift in the timing and concentration of orders and shipments from one period to another can materially affect reported revenue in any given period.
In addition to changes in sales volumes, there are two other primary drivers of changes in revenue from one period to another: (1) the combined effect of changes in product mix and average selling prices and (2) the impact of fluctuations in foreign currencies. As used in this Management’s Discussion and Analysis of Financial Condition and Results of Operations, the price and mix effects relate to changes in revenue that are not able to be specifically related to changes in unit volume or foreign exchange.
How We Assess the Performance of Our Business
We manage operations through the two business segments described above. In addition to our consolidated GAAP financial measures, we review Adjusted EBITDA.
We believe Adjusted EBITDA is a helpful supplemental measure to assist us and investors in evaluating our operating results, as Adjusted EBITDA excludes certain items for which the fluctuation from period to period does not necessarily correspond to changes in the operations of our business. Adjusted EBITDA represents net income (loss), plus income tax (provision) benefit, interest and other income (expense), net, stock-based compensation expense, amortization of intangible assets, depreciation expense, and certain other non-GAAP adjustments. We believe that the adjustments applied in presenting Adjusted EBITDA are appropriate to provide additional information to investors about our operating and financial performance without the effects of (1) certain material non-cash items and (2) certain items that we do not believe to be core to our operations.
Management and our Board of Directors regularly use Adjusted EBITDA in evaluating our operating and financial performance and in establishing discretionary annual compensation. This measure is provided in addition to, and should not be considered to be a substitute for, or superior to, comparable measures determined in accordance with GAAP. In addition, we believe that Adjusted EBITDA is frequently used by investors and other interested parties in the evaluation of other issuers, many of which also present Adjusted EBITDA when reporting their results in an effort to augment investors' understanding of their operating and financial results; however, similarly titled measures provided by other issuers may not be calculated in the same manner and/or using the same adjustments.
Adjusted EBITDA should not be considered as an alternative to net income (loss) or any other performance measure derived in accordance with GAAP. Adjusted EBITDA has limitations as an analytical tool, and you should not consider such measure either in isolation or as a substitute for analyzing our results as reported under GAAP.
For further information regarding Adjusted EBITDA, see “Reconciliation of non-GAAP Measures” below.
Consolidated Financial Results for the Years Ended December 31, 2023 and 2022
| | | | | | | | | | | | |
| Year Ended December 31, | |
| (in thousands) | 2023 | | 2022 | |
| Revenue: | | | | |
| Products | $ | 328,731 | | | $ | 395,396 | | |
| Services | 159,338 | | | 142,635 | | |
| Total revenue | 488,069 | | | 538,031 | | |
| Cost of sales: | | | | |
| Products | 203,258 | | | 237,386 | | |
| Services | 88,390 | | | 86,412 | | |
| Total cost of sales | 291,648 | | | 323,798 | | |
| Gross profit | 196,421 | | | 214,233 | | |
| Operating expenses: | | | | |
| Selling, general and administrative | 210,172 | | | 244,181 | | |
| Research and development | 89,466 | | | 87,071 | | |
| | | | |
| Intangible and Goodwill Impairments | 302,787 | | | — | | |
| Total operating expenses | 602,425 | | | 331,252 | | |
| Loss from operations | (406,004) | | | (117,019) | | |
| Interest and other income (expense), net | 43,692 | | | (3,790) | | |
| (Loss) income before income taxes | (362,312) | | | (120,809) | | |
| Benefit (provision) for income taxes | 641 | | | (2,140) | | |
| Loss on equity method investment, net of income taxes | (1,282) | | | — | | |
| Net (loss) income before redeemable non-controlling interest | (362,953) | | | (122,949) | | |
| Less: net loss attributable to redeemable non-controlling interest | (265) | | | (238) | | |
| Net (loss) income attributable to 3D Systems Corporation | $ | (362,688) | | | $ | (122,711) | | |
| | | | |
Other Financial Data: | | | | |
Adjusted EBITDA | $ | (26,258) | | | $ | (5,781) | | |
Operating Results for the year ended December 31, 2023 compared to the year ended December 31, 2022
Consolidated revenue
The following table sets forth changes in our products and services revenue for the year ended December 31, 2023 and 2022.
| | | | | | | | | | | | | | | | | | | | | | | | | | | | | | | | | | | |
| (Dollars in thousands) | Products | | Services | | Total |
Revenue — year ended December 31, 2022 | $ | 395,396 | | | 73.5 | % | | $ | 142,635 | | | 26.5 | % | | $ | 538,031 | | | 100.0 | % |
| Change in revenue: | | | | | | | | | | | |
| Volume | (70,454) | | | (17.8) | % | | 15,980 | | | 11.2 | % | | (54,474) | | | (10.1) | % |
| | | | | | | | | | | |
| Price/mix | 2,724 | | | 0.7 | % | | — | | | — | % | | 2,724 | | | 0.5 | % |
| Foreign currency translation | 1,065 | | | 0.3 | % | | 723 | | | 0.5 | % | | 1,788 | | | 0.3 | % |
| Net change | (66,665) | | | (16.9) | % | | 16,703 | | | 11.7 | % | | (49,962) | | | (9.3) | % |
Revenue — year ended December 31, 2023 | $ | 328,731 | | | 67.4 | % | | $ | 159,338 | | | 32.6 | % | | $ | 488,069 | | | 100.0 | % |
Products revenue
For the year ended December 31, 2023, products revenue decreased by $66.7 million, or 16.9%, as compared to the year ended December 31, 2022. Lower sales volume resulted in a $70.5 million, or 17.8%, decrease in reported product revenue relative to the prior year period, of which $62.9 million of such decrease is attributable to our Healthcare Solutions segment. The lower sales volume within our Healthcare Solutions segment was primarily due to lower sales to the dental market, including lower printer sales to a key customer. Product sales volume in our Healthcare Solutions segment also decreased due to lower printer sales to customers in the medical devices and other non-dental markets. A decrease in product sales volume within our Industrial Solutions segment resulted in a revenue decrease of $7.6 million compared to the prior year. This decrease was significantly driven by lower printer sales to customers in the jewelry market, which was primarily due to a delay in the Company's release of a new printer model.
The decrease in product revenue due to lower sales volume was partially offset by favorable impacts of price/mix and foreign currency translation. For our Healthcare Solutions segment, price/mix had a favorable impact of $6.7 million, which includes favorable pricing of sales to a key customer due to their lower purchase volume. The favorable impact of price/mix on our Healthcare Solutions revenue was partially offset by an unfavorable price/mix impact of $4.0 million on our Industrial Solutions revenue, which was due to discounted pricing on certain product classes in response to competition and to increase future revenues.
Services revenue
For the year ended December 31, 2023, services revenue increased by $16.7 million, or 11.7%, as compared to the year ended December 31, 2022. Higher sales volume resulted in a $16.0 million, or 11.2%, increase in reported services revenue relative to the prior year period, of which $7.6 million and $8.4 million of the increase relates to our Healthcare Solutions segment and our Industrial Solutions segment, respectively. The volume increase in our Healthcare Solutions' services revenue was partially due to incremental variable consideration (revenue) being deemed probable of being earned under a regenerative medicine collaboration and licensing agreement that was amended during the year ended December 31, 2023. In connection with the amendment to this collaboration and licensing agreement, the Company concluded that three additional milestone-based payments included in the contract, totaling $6.5 million in the aggregate, became probable of being earned. The inclusion of these additional milestone payments in the contract transaction price resulted in the recognition of additional Healthcare Solutions' services revenue during the year ended December 31, 2023, inclusive of a $4.5 million aggregate cumulative catch-up adjustment to the revenue recorded under the contract. Revenue related to the collaboration and licensing agreement is recognized over time and, accordingly, the remaining revenue attributable to the three additional milestone payments is expected to be recognized over the remaining duration of the contract. The remaining increase in our Healthcare Solutions' services revenue primarily relates to higher personalized healthcare solutions revenue.
For our Industrial Solutions segment, the $8.4 million increase in services revenue attributable to higher sales volume primarily relates to increases in revenue generated from parts manufacturing and hardware maintenance services.
Total revenue
Total consolidated revenue for the year ended December 31, 2023 decreased by $50.0 million or 9.3% to $488.1 million, compared to $538.0 million for the year ended December 31, 2022. This decrease was primarily driven by the $70.5 million impact of lower product sales volumes, offset by the $16.0 million impact of the increase in services sale volume. Refer to the detailed discussions above. To a lesser extent, total consolidated revenue for the year ended December 31, 2023 was positively impacted by changes in products sales price/mix and changes in foreign exchange rates.
Consolidated gross profit
| | | | | | | | | | | | | | | | | | | | | | | | | | | | | | | | | | | | | | | | | | | | |
| Year Ended December 31, | | | | | | | |
| 2023 | | 2022 | | Change in Gross Profit | | Change in Gross Profit Margin |
| (Dollars in thousands) | Gross Profit | | Gross Profit Margin | | Gross Profit | | Gross Profit Margin | | $ | | % | | Percentage Points | % |
| Products | $ | 125,473 | | | 38.2 | % | | $ | 158,010 | | | 40.0 | % | | $ | (32,537) | | | (20.6) | % | | (1.8) | % | (4.5) | % |
| Services | 70,948 | | | 44.5 | % | | 56,223 | | | 39.4 | % | | 14,725 | | | 26.2 | % | | 5.1 | % | 12.9 | % |
| Total | $ | 196,421 | | | 40.2 | % | | $ | 214,233 | | | 39.8 | % | | $ | (17,812) | | | (8.3) | % | | 0.4 | % | 1.0 | % |
| | | | | | | | | | | | | | |
| | | | | | | | | | | | | | |
| | | | | | | | | | | | | | |
Gross profit for the year ended December 31, 2023 decreased $17.8 million, or 8.3%, to $196.4 million, compared to $214.2 million for the year ended December 31, 2022. Gross profit margin for the year ended December 31, 2023 increased to 40.2%, as compared to 39.8% for the year ended December 31, 2022, primarily driven by the increase in our services gross profit margin (as discussed in greater detail below).
Products gross profit and gross profit margin
For the year ended December 31, 2023, gross profit from products sales decreased by $32.5 million, or 20.6%, as compared to the year ended December 31, 2022. This decrease was primarily driven by lower products sales revenue.
Services gross profit and gross profit margin
For the year ended December 31, 2023, gross profit from services sales increased $14.7 million, or 26.2%, as compared to the year ended December 31, 2022. The increase in gross profit from services sales was primarily driven by the $16.7 million, or 11.7%, increase in services revenue. In general, the increases in services revenue in both our Industrial Solutions segment and Healthcare Solutions segment contributed significantly to the increase in our services gross profit and gross profit margin due to the fixed nature of certain costs (e.g., salaries) incurred to provide our services. Accordingly, the costs incurred to provide our services generally do not increase proportionately with increases in services revenue.
In addition, the increase in our services revenue includes the $4.5 million of incremental variable consideration revenue recognized by our Healthcare Solutions segment on a cumulative catch-up basis, upon concluding that additional milestone-based payments related to a collaboration and licensing revenue agreement are probable of being earned. As there were no direct costs (e.g., costs of goods sold) associated with this incremental collaboration and licensing revenue, the entire $4.5 million contributed to an increase in our reported gross profit, as well as to a 1.6% increase and 0.5% increase in our services gross profit margin and consolidated gross profit margin, respectively.
Consolidated selling, general and administrative expense
Selling, general and administrative ("SG&A") expense for the year ended December 31, 2023 decreased $34.0 million, or 13.9%, to $210.2 million, compared to $244.2 million for the year ended December 31, 2022. Reported SG&A expense for the year ended December 31, 2023 was impacted by the Company’s acquisition of Wematter on July 1, 2023, as costs attributable to Wematter's operations are not included in our reported results for the year ended December 31, 2022. In addition, SG&A expense for the year ended December 31, 2023 is impacted by the acquisitions of Titan and Kumovis on April 1, 2022 and dp polar on October 4, 2022, as each of these acquired businesses was consolidated for the full year ended December 31, 2023, as compared to only part of our fiscal year ended December 31, 2022. For the year ended December 31, 2023, our SG&A expense increased $1.4 million due to the inclusion of the operating results of these acquisitions for a greater portion of fiscal year 2023, as compared to fiscal year 2022. This $1.4 million increase primarily relates to additional compensation expense and amortization expense.
The primary drivers of the $34.0 million decrease in SG&A expense for fiscal year 2023 — despite the $1.4 million increase in SG&A expense due to recent acquisitions – include:
| | | | | |
Primary drivers (in thousands) | Increase / (Decrease) |
Volumetric earnout | $ | (33,162) | |
Government settlement on export control compliance matters | (14,644) | |
| Amortization | (3,747) | |
Ordinary compensation and benefits (inclusive of stock compensation) | (1,167) | |
Other legal and outside services | 11,143 | |
Severance | 5,356 | |
| Other | 2,212 | |
Total change | $ | (34,009) | |
Volumetric earnout expense decreased by $33.2 million for the year ended December 31, 2023, as the Company reversed $17.3 million of previously recognized earnout expense during the year ended December 31, 2023, as compared to recognizing $15.9 million of earnout expense during the year ended December 31, 2022. Prior to (and through the first half of) the year ended December 31, 2023, the Company was accruing for a potential earnout payment of $65 million, representing compensation expense, based upon the expected achievement of a non-financial, science-based milestone outlined in the Volumetric acquisition agreement. Expense related to the potential earnout payment was being recognized on a straight-line basis through the anticipated date of achievement of the related milestone. However, during the year ended December 31, 2023, the Company concluded that the non-financial milestone to which the potential earnout payment of $65 million relates was no longer probable of being achieved due to a reduction in the budgeted funding for the related R&D efforts and, accordingly, all previously recognized compensation expense was reversed. Refer to our discussion of "Critical Accounting Estimates" and Note 17 to the consolidated financial statements included in Item 8 of this Form 10-K for additional details.
The $14.6 million decrease in SG&A expense related to our settlement with the U.S. government on export control compliance matters is due to the accrual of our full liability related to these matters during the year ended December 31, 2022. Refer to Note 23 to the consolidated financial statements included in Item 8 of this Form 10-K for additional details.
Amortization expense decreased by $3.7 million for the year ended December 31, 2023 due to the impairment charges recorded against intangible assets included in our dp polar and Oqton MOS asset groups during the year ended December 31, 2023. These impairment charges reduced the amortizable asset balance for the impacted intangible assets to $0. Refer to our discussion of "Other Strategic Business Decisions and Cost Saving Initiatives" and Note 8 to the consolidated financial statements included in Item 8 of this Form 10-K for additional details. In addition, amortization expense decreased as a result of certain intangible assets becoming fully amortized prior to the end of the first quarter of the current year ended December 31, 2023.
Ordinary compensation and benefits costs decreased by $1.2 million for the year ended December 31, 2023, as a $4.8 million decrease in bonus and share-based compensation (excluding the Volumetric earnout expense subject to settlement in shares of our common stock and discussed above) more than offset the increase in costs attributable to ordinary salaries, wages, and employee benefits due to our acquisitions and increase in personnel dedicated to our regenerative medicine activities.
Other legal and outside services expense increased by $11.1 million for the year ended December 31, 2023 due to (1) an increase in costs attributable to consultants and contract workers supporting various functions within the Company, including certain internal transformation efforts, (2) an increase in audit and accounting fees, and (3) an increase in legal fees (excluding the year-over-year impact of the settlement with the U.S. government on export control compliance matters, as discussed above).
Severance expense increased by $5.4 million for the year ended December 31, 2023 due to termination benefit costs that have been recognized for both completed and ongoing headcount reductions across various support functions of the Company. Refer to our discussion of "Fiscal Year 2023 Restructuring Activities" and Note 25 to the consolidated financial statements included in Item 8 of this Form 10-K for additional details.
Consolidated research and development expense
R&D expense for the year ended December 31, 2023 increased $2.4 million, or 2.8%, to $89.5 million, as compared to $87.1 million for the same period last year. Reported R&D expense for the year ended December 31, 2023 was impacted by the Company’s acquisition of Wematter on July 1, 2023, as costs attributable to Wematter's operations are not included in our reported results for the year ended December 31, 2022. In addition, R&D expense for the year ended December 31, 2023 is impacted by the acquisitions of Titan and Kumovis on April 1, 2022 and dp polar on October 4, 2022, as each of these acquired businesses was consolidated for the full year ended December 31, 2023, as compared to only part of our fiscal year ended December 31, 2022. For the year ended December 31, 2023, our R&D expense increased $2.8 million due to the inclusion of the operating results of these acquisitions for a greater portion of fiscal year 2023, as compared to fiscal year 2022. This $2.8 million increase includes the impact of our acquisitions on compensation expense.
The primary drivers of the $2.4 million increase in R&D expense for fiscal year 2023 are a $1.1 million net impact of an increase in employee compensation and benefit costs, partially offset by lower external workforce costs, and a $1.0 million increase in severance costs. Ordinary compensation and benefit costs and certain other R&D costs increased due to the impact of our acquisitions and the ramp up of personnel in our wholly-owned bio-tech subsidiary, Systemic Bio, which is focused on the design and manufacture of 3D-printed vascularized “organs-on-chips” for use in drug development by pharmaceutical industry customers. Refer to our discussion of "Investing in Regenerative Medicine" for additional details.
The increase in severance costs is primarily attributable to termination benefit costs that have been recognized for both completed and ongoing headcount reductions within our R&D function. Refer to our discussion of "Fiscal Year 2023 Restructuring Activities" and Note 25 to the consolidated financial statements included in Item 8 of this Form 10-K for additional details.
Impairments of goodwill and intangible assets
During the year ended December 31, 2023, we recorded aggregate impairment charges of $302.8 million related to intangible assets (inclusive of goodwill); whereas, similar impairment charges were not recorded during the year ended December 31, 2022. The following table summarizes the nature of the intangible assets for which impairment charges were recorded during the year ended December 31, 2023:
| | | | | |
Nature of Impairment Charge (in thousands) | Amount of Charge |
Goodwill | $ | 279,808 | |
Indefinite-life intangible asset (dp polar IPR&D) | 5,554 | |
Finite-life intangible assets | 17,425 | |
Total impairment charges | $ | 302,787 | |
The $279.8 million goodwill impairment charge recorded for the year ended December 31, 2023 reflects the impairment of 100% of the goodwill that had been assigned to our Industrial Solutions reporting unit based upon the result of our annual goodwill impairment test. This outcome of our annual goodwill impairment test is reflective of the significant and sustained drop in the Company's stock price and market capitalization leading up to and as of the testing date, as well as the significantly higher carrying value (including the goodwill balance) of our Industrial Solutions reporting unit compared to our Healthcare Solutions reporting unit. Refer to Note 9 to the consolidated financial statements included in Item 8 of this Form 10-K for additional details.
For the year ended December 31, 2023, we recognized impairment charges related to (1) our indefinite-life intangible asset balance, consisting solely of dp polar's IPR&D, and (2) certain of our finite-life intangible assets, consisting of intangible assets included in our Oqton MOS and dp polar asset groups. These impairment charges were triggered by the Company's decision to cease the development of dp polar's IPR&D for the foreseeable future and the Company's conclusion that it will more likely than not sell or otherwise dispose of Oqton MOS. Based upon a determination that the dp polar and Oqton MOS intangible assets were no longer expected to produce or contribute to the production of positive cash flows for the Company, the Company recorded impairment charges to write their carrying values down to $0. Refer to our discussion of "Other Strategic Business Decisions and Cost Saving Initiatives" and Note 8 to the consolidated financial statements included in Item 8 of this Form 10-K for additional details.
Consolidated operating loss
Our operating loss for the year ended December 31, 2023 was $406.0 million, compared to a $117.0 million operating loss for the year ended December 31, 2022. The increase in our operating loss was primarily attributable to the $302.8 million of non-cash impairment charges recorded (1) against the carrying value of our goodwill and (2) to write-off the intangible assets that were included in our dp polar and Oqton asset groups. The $17.8 million decrease in our reported gross profit and $2.4 million increase in our reported R&D expense was more than offset by the $34.0 million decrease in our reported SG&A expense. Refer to the discussions of our financial statement line items above for additional details.
Non-Operating Income (Loss) for the Year Ended December 31, 2023 compared to the Year Ended December 31, 2022
Interest and other income (expense), net
The following table sets forth the components of interest and other income (expense), net for the year ended December 31, 2023 and 2022.
| | | | | | | | | | | | | | | | | | | | | | | | | | | | |
| | Year Ended | | |
| (in thousands) | | December 31, 2023 | | December 31, 2022 | | |
| Interest and other income (expense), net | | | | | | |
Foreign exchange loss, net | | $ | (4,825) | | | $ | (4,424) | | | |
Interest income, net | | 16,210 | | | 6,541 | | | |
Other income (expense), net | | 32,307 | | | (5,907) | | | |
Total interest and other income (expense), net | | $ | 43,692 | | | $ | (3,790) | | | |
For the year ended December 31, 2023, interest income, net increased $9.7 million, as compared to the year ended December 31, 2022. This increase was due to higher interest income earned on cash and cash equivalents, which was driven by higher market interest rates during the year ended December 31, 2023.
For the year ended December 31, 2023, other income (expense) increased primarily due to the $32.2 million gain recorded upon the repurchase of a portion of our outstanding convertible debt securities during the year ended December 31, 2023. Refer to Note 13 to the consolidated financial statements included in Item 8 of this Form 10-K for additional details. In addition, a $2.8 million impairment charge was recorded with respect to the Company's investment in Enhatch during the year ended December 31, 2022. There were no similar impairments recognized with respect to the Company's investments during the year ended December 31, 2023. Refer to Note 10 to the consolidated financial statements included in Item 8 of this Form 10-K for additional details.
Net loss
The following table sets forth our net loss for the years ended December 31, 2023, and 2022.
| | | | | | | | | | | |
| Year Ended December 31, |
| (in thousands, except per share amounts) | 2023 | | 2022 |
Loss before income taxes | $ | (362,312) | | | $ | (120,809) | |
Benefit (provision) for income taxes | 641 | | | (2,140) | |
Loss on equity method investment, net of income taxes | (1,282) | | | — | |
Net loss before redeemable non-controlling interest | (362,953) | | | (122,949) | |
Less: net loss attributable to redeemable non-controlling interest | (265) | | | (238) | |
Net loss attributable to 3D Systems Corporation | $ | (362,688) | | | $ | (122,711) | |
| | | |
Net loss per common share: | | | |
| Basic | $ | (2.79) | | | $ | (0.96) | |
| Diluted | $ | (2.79) | | | $ | (0.96) | |
For the year ended December 31, 2023, we reported a tax benefit of $0.6 million, as compared to a tax provision of $2.1 million for the year ended December 31, 2022. The Company's effective tax rates for the years ended December 31, 2023 and 2022 were significantly below blended U.S. and foreign jurisdictions' statutory tax rates due to (1) the Company's reported losses and (2) the maintenance of a valuation allowance against the Company's deferred tax assets based upon the Company's conclusion that it is more likely than not that its deferred tax assets will not be realized in various tax jurisdictions.
The increase in the net loss attributable to 3D Systems for the year ended December 31, 2023, as compared to the net loss attributable to 3D Systems for the year ended December 31, 2022, was primarily driven by the period-over period increase in the Company's consolidated operating loss reported for the year ended December 31, 2023, partially offset by the non-operating income reported for the year ended December 31, 2023, as compared to a non-operating loss reported for the year ended December 31, 2022. In addition, the Company reported a loss on equity method investment, net of income taxes, for the year ended December 31, 2023; whereas, the Company did not hold this investment that is accounted for under the equity method of accounting as of the year ended December 31, 2022.
Non-GAAP Earnings
Adjusted EBITDA
Our Adjusted EBITDA decreased from negative $5.8 million for the year ended December 31, 2022 to negative $26.3 million for the year ended December 31, 2023. This decrease of $20.5 million in our Adjusted EBITDA was driven by a $289.0 million increase in our reported operating loss for the year ended December 31, 2023, adjusted for the period-over-period changes in certain operating costs that are included in the determination of our GAAP operating loss, but are excluded from our calculation of Adjusted EBITDA. As shown in the reconciliation of our reported Net Loss attributable to 3D Systems Corporation to Adjusted EBITDA (below), GAAP costs for which period-over-period variances materially impacted our reported operating loss for the year ended December 31, 2023, as compared to the year ended December 31, 2022, but are excluded from the calculation of Adjusted EBITDA for each of those respective periods, include impairment charges, amortization expense, stock-based compensation expense, acquisition and divestiture-related expense, legal expenses, and restructuring expense.
Reconciliation of Non-GAAP Measures
The table that follows provides a reconciliation of the reported Net Loss attributable to 3D Systems Corporation to Adjusted EBITDA. Refer to the discussion of "How We Assess the Performance of Our Business" for additional information regarding Adjusted EBITDA, and why management believes this measure provides useful information regarding the Company's results of operations.
| | | | | | | | | | | | | | | | | | | | | | | | | | | |
| | | | Year Ended | |
| (in thousands) | | | | | | December 31, 2023 | | December 31, 2022 | |
| Net loss attributable to 3D Systems Corporation | | | | | | $ | (362,688) | | | $ | (122,711) | | |
| Interest income, net | | | | | | (16,210) | | | (6,541) | | |
| (Benefit) provision for income taxes | | | | | | (641) | | | 2,140 | | |
| Depreciation expense | | | | | | 21,346 | | | 21,096 | | |
| Amortization expense | | | | | | 12,067 | | | 15,480 | | |
| Stock-based compensation expense | | | | | | 23,504 | | 42,489 | |
| Acquisition and divestiture-related expense | | | | | | (1,070) | | | 12,360 | |
| Legal expenses | | | | | | 8,053 | | 19,062 | |
| Restructuring expense | | | | | | 11,487 | | | 733 | | |
| Net loss attributable to redeemable non-controlling interest | | | | | | (265) | | | (238) | | |
| Loss on equity method investment, net of income taxes | | | | | | 1,282 | | — | | |
| Goodwill and other assets impairment charges | | | | | | 304,359 | | 18 | |
| Gain on repurchase of debt | | | | | | (32,181) | | | — | | |
| Other non-operating expense | | | | | | 4,699 | | | 10,331 | |
| Adjusted EBITDA | | | | | | $ | (26,258) | | | $ | (5,781) | | |
Segment Financial Results of Operations for the Years Ended December 31, 2023 and 2022
Effective as of January 1, 2023, and for periods subsequent thereto, Adjusted EBITDA reflects the measure of profitability used by the Company’s chief operating decision maker (“CODM”) to evaluate the performance of the Company’s reportable segments. In addition, as of January 1, 2023, the Company's methodology for allocating certain costs between its segments was revised to more closely reflect changes in the Company's business and estimates of the usage of shared resources by the Company's segments. Prior year amounts have been reclassified to conform with current year presentation.
The following table presents the revenue and Adjusted EBITDA amounts reported by each of our segments, as well as non-allocated corporate costs, for the years ended December 31, 2023 and 2022:
| | | | | | | | | | | | | | | | | | | | | | | | | | | | | | | | | | | |
| Revenue | | Adjusted EBITDA |
| Year Ended | | Year Ended |
| (in thousands) | December 31, 2023 | | December 31, 2022 | | Change | | December 31, 2023 | | December 31, 2022 | | Change |
| Healthcare Solutions | $ | 213,216 | | | $ | 260,988 | | | $ | (47,772) | | | $ | 38,520 | | | $ | 55,783 | | | $ | (17,263) | |
| Industrial Solutions | 274,853 | | | 277,043 | | | (2,190) | | | 19,128 | | | 24,214 | | | (5,086) | |
| Corporate and Other | — | | | — | | | — | | | (83,906) | | | (85,778) | | | 1,872 | |
| Total Company | $ | 488,069 | | | $ | 538,031 | | | $ | (49,962) | | | $ | (26,258) | | | $ | (5,781) | | | $ | (20,477) | |
Healthcare Solutions
Revenue
For the year ended December 31, 2023, Healthcare Solutions revenue decreased $47.8 million, or 18.3%, as compared to the year ended December 31, 2022. This decrease in segment revenue was primarily due to a $48.2 million, or 31.9%, decrease in sales to the dental market, including lower printer sales to a key customer. Total product revenue for the segment decreased by $55.6 million, primarily reflective of our lower sales to the dental market, but also inclusive of lower printer sales to customers in the medical devices and other non-dental markets.
The decrease in product sales for the segment was partially offset by a $7.8 million increase in services revenue for the segment. The increase in services revenue was partially driven by the recognition of incremental variable consideration revenue, inclusive of a $4.5 million cumulative catch-up adjustment, that relates directly to the inclusion of $6.5 million of additional milestone payments (representing variable consideration) in the total transaction price of a regenerative medicine collaboration and licensing revenue agreement during the current year ended December 31, 2023. The additional milestone-based payments were deemed probable of being earned under revised contract terms that took effect upon the execution of an amendment to the collaboration and licensing revenue agreement during the year ended December 31, 2023. Our Healthcare Solutions' services revenue also increased due to higher personalized healthcare solutions revenue.
Adjusted EBITDA
For the year ended December 31, 2023, Adjusted EBITDA for our Healthcare Solutions segment decreased $17.3 million, or 30.9%, as compared to the year ended December 31, 2022, primarily due to (1) our lower sales to the dental market, including the segment's lower printer sales to a key customer, (2) the decrease in product sales into other markets, and (2) the increase in R&D costs incurred related to regenerative medicine, partially offset by increases in services revenue and a favorable impact of price/mix on the segment's product revenue.
Industrial Solutions
Revenue
For the year ended December 31, 2023, Industrial Solutions revenue decreased $2.2 million, or 0.8%, as compared to the year ended December 31, 2022. This decrease in segment revenue is primarily attributable to a $11.1 million decrease in products revenue reflective of (1) lower printer sales to customers in the jewelry market, resulting from a delay in the Company's release of a new printer model, and (2) an unfavorable impact of price/mix, primarily due to discounted pricing on certain product classes in response to competition and to increase future revenue. The decrease in product revenue was partially offset by an $8.9 million increase in services revenue related to parts manufacturing and hardware maintenance services.
Adjusted EBITDA
For the year ended December 31, 2023, Adjusted EBITDA for our Industrial Solutions segment decreased $5.1 million, or 21.0%, as compared to the year ended December 31, 2022, which was primarily driven by a $2.0 million unfavorable impact of the Company's recent acquisitions and the unfavorable impact of both volume and price/mix on product revenue, partially offset by (1) the increase in services revenue and (2) lower operating expenses, when excluding the impact of acquisitions.
Corporate and Other
Adjusted EBITDA
For the year ended December 31, 2023, Corporate and Other Adjusted EBITDA was relatively flat, as compared to the year ended December 31, 2022, as a reduction in certain internal administration and corporate R&D costs, as well as a favorable foreign exchange impact, was partially offset by an increase in outside services and consulting costs.
Liquidity and Capital Resources
The following table sets forth the Company's operating working capital at December 31, 2023, and 2022.
| | | | | | | | | | | | | | | | | | | | | | | |
| | | Change |
| (Dollars in thousands) | December 31, 2023 | | December 31, 2022 | | $ | | % |
| Cash and cash equivalents | $ | 331,525 | | | $ | 388,134 | | | $ | (56,609) | | | (14.6) | % |
| Short-term investments | — | | | 180,603 | | | (180,603) | | | (100.0) | % |
| Accounts receivable, net | 101,497 | | | 93,886 | | | 7,611 | | | 8.1 | % |
| Inventories | 152,188 | | | 137,832 | | | 14,356 | | | 10.4 | % |
| 585,210 | | | 800,455 | | | (215,245) | | | (26.9) | % |
| Less: | | | | | | | |
| | | | | | | |
| Current operating lease liabilities | 9,924 | | | 8,343 | | | 1,581 | | | 19.0 | % |
| Accounts payable | 49,757 | | | 53,826 | | | (4,069) | | | (7.6) | % |
| Accrued and other liabilities | 49,460 | | | 56,264 | | | (6,804) | | | (12.1) | % |
| 109,141 | | | 118,433 | | | (9,292) | | | (7.8) | % |
| Operating working capital | $ | 476,069 | | | $ | 682,022 | | | $ | (205,953) | | | (30.2) | % |
We assess our liquidity in terms of our ability to generate cash to fund our operating, investing and financing activities. In doing so, we review and analyze our current cash on hand, the number of days our sales are outstanding, inventory turns, capital expenditure commitments and accounts payable turns. Our cash requirements, excluding acquisitions, primarily consist of funding working capital and capital expenditures. Differences between the amounts of working capital item changes in the cash flow statement and the balance sheet changes for the corresponding items are primarily the result of foreign currency translation adjustments, acquisitions and divestitures.
At December 31, 2023, cash and cash equivalents and short-term investments totaled $331.5 million and decreased $237.2 million since December 31, 2022. This decrease resulted primarily from the repayment of long-term debt of $100.6 million, cash used in operations of $80.7 million, acquisitions and other investments, net of cash acquired of $29.2 million, and capital expenditures of $27.2 million.
We expect that cash flow from operations, cash and cash equivalents, and other sources of liquidity, such as issuing equity or debt securities, subject to market conditions, will be available and sufficient to meet all foreseeable cash requirements.
Cash held outside the U.S. at December 31, 2023 was $65.8 million, or 19.8% of total cash and cash equivalents, compared to $58.4 million, or 15.0% of total cash and cash equivalents at December 31, 2022. As our previously unremitted earnings have been subjected to U.S. federal income tax, we expect any repatriation of these earnings to the U.S. would not incur significant federal and state taxes. However, these dividends are subject to foreign withholding taxes that are estimated to result in the Company incurring tax costs in excess of the cost to obtain cash through other means. Cash equivalents are comprised of funds held in money market instruments and are reported at their current carrying value, which approximates fair value due to the short-term nature of these instruments. We strive to minimize our credit risk by investing primarily in investment grade, liquid instruments and limit exposure to any one issuer depending upon credit quality. See “Cash flow” discussion below.
Cash flow
The Company currently funds its operations — including working capital requirements, capital expenditures, investments and acquisitions — by using cash on hand cash; cash equivalents; cash flow from operations, which can vary widely from quarter to quarter; and financing activities, as necessary. We expect that cash flow from operations, cash and cash equivalents, and other sources of liquidity, such as issuing equity or debt securities, subject to market conditions, will be available and sufficient to meet all foreseeable cash requirements. The following is a summary of the changes in the Company’s cash flows, followed by a brief discussion of these changes:
| | | | | | | | | | | | | | | | | | | | |
| | Year Ended | | |
| (in thousands) | | December 31, 2023 | | December 31, 2022 | | Change |
Net cash used in operating activities | | $ | (80,695) | | | $ | (70,021) | | | $ | (10,674) | |
| Cash flow provided by (used in) investing activities | | 124,784 | | | (308,355) | | | 433,139 | |
| Cash flow used in financing activities | | (106,469) | | | (13,815) | | | (92,654) | |
Cash flow from operations
For the year ended December 31, 2023, cash used in operating activities was $80.7 million due to the reported loss from operations and the $35.4 million increase in working capital (excluding cash, cash equivalents and short-term investments) from December 31, 2022. Cash used in operating activities for the year ended December 31, 2022 was $70.0 million. The $10.7 million increase in cash used in operating activities during the year ended December 31, 2023 is primarily due to an increase in cash outflows for working capital. Such increase is primarily the result of: (1) a higher inventory balance due to the continued in-sourcing of activities from contract manufacturers, as well as due to lower revenue; (2) a decrease in accrued and other liabilities resulting from lower incentive compensation accruals and the payment of certain legal accruals; and (3) an increase in accounts receivable due to the timing of revenue recognized versus the payments received from customers.
Cash used in operating activities for the year ended December 31, 2022 was $70.0 million due to the reported loss from operations and the $49.6 million increase in working capital (excluding cash, cash equivalents and short-term investments) from December 31, 2021. The higher working capital primarily related to an increase in inventory balances to manage supply chain challenges and as a result of the purchase of $23.9 million of inventory from a contract manufacturer in connection with our decision to terminate the manufacturing services arrangement. In addition, there was a decrease in accrued liabilities primarily due to lower incentive compensation accruals, partially offset by a reduction in accounts receivable due to lower revenue.
Cash flow from investing activities
For the year ended December 31, 2023, cash provided by investing activities was $124.8 million compared to $308.4 million of cash used in investing activities for the year ended December 31, 2022. The investing cash inflows in 2023 included sales and maturities of short-term investments of $180.9 million, offset by cash used for acquisitions of $29.2 million and capital expenditures of $27.2 million.
For the year ended December 31, 2022, cash used in investing activities was $308.4 million, which included investments of $384.4 million of excess cash in short-term investments offset by $200.3 million proceeds from the sales and maturities of such investments, cash used for acquisitions of $103.7 million, and capital expenditures of $20.9 million.
Cash flow from financing activities
For the year ended December 31, 2023, the cash flow used in financing activities was $106.5 million primarily due to the repayment of long-term debt of $100.6 million and taxes paid related to the net-share settlement of equity awards of $5.2 million.
For the year ended December 31, 2022, the cash flow used in financing activities was $13.8 million primarily due to taxes paid related to the net-share settlement of equity awards of $10.9 million and the $2.3 million payment for the acquisition of a non-controlling interest.
Off-Balance Sheet Arrangements
We have no off-balance sheet arrangements and do not utilize any “structured debt,” “special purpose” or similar unconsolidated entities for liquidity or financing purposes.
Material Cash Requirements
The Company's material cash requirements consist of the following contractual and other obligations:
Indebtedness
At December 31, 2023, we had $324.9 million of outstanding 0% convertible notes which mature in November of 2026. Management may consider pursuing additional long-term financing when it is appropriate in light of cash requirements for operations or other strategic opportunities, which could result in higher financing costs.
Purchase Commitments
We have purchase commitments under legally enforceable agreements for goods and services with defined terms as to quantity, price and timing of delivery. The Company has purchase commitments in excess of a year primarily related to printer assemblies, inventory, capital expenditures, and software licenses. As of December 31, 2023, such purchase commitments totaled $14.7 million, with approximately $8.0 million expected to be purchased within the next twelve months. In addition to ordinary purchase commitments, as of December 31, 2023, the Company had approximately $1.7 million of purchase commitments for inventory as a result of the termination of a manufacturing services agreement (refer to Note 6 to the consolidated financial statements in Item 8 of this Form 10-K).
Leases
The Company had operating and financing lease obligations (inclusive of interest) of $107.8 million at December 31, 2023, primarily related to real estate and equipment leases, of which approximately $17.2 million in payments are expected over the next twelve months. For more information on the Company's leases, refer to Note 11 to the consolidated financial statements in Item 8 of this Form 10-K.
National Additive Manufacturing Innovation ("NAMI") Joint Venture
In March 2022, Dussur and 3D Systems signed an agreement to form a joint venture intended to expand the use of additive manufacturing within the Kingdom of Saudi Arabia and surrounding geographies, including the Middle East and North Africa. The joint venture is to enable the development of Saudi Arabia's domestic additive manufacturing production capabilities, consistent with the Kingdom’s ‘Vision 2030,’ which is focused on diversification of the economy and long-term sustainability. In February 2023, the Company became a shareholder in the joint venture and now owns 49% of its common stock. 3D Systems was committed to an initial investment of approximately $6.5 million of cash into the joint venture, all of which has been funded as of December 31, 2023. The future impact that participation in the joint venture will have on the Company’s financial position and cash flows is not expected to be material other than any potential cash outflow(s) that may be required to fund future investments in the joint venture. Additional future investments in the joint venture are contingent upon the achievement of certain milestones by the joint venture or separate agreement by the parties to the joint venture to invest additional capital. Refer to Note 26 for details regarding the Company's incremental investment in NAMI subsequent to December 31, 2023.
Sources of Funding to Satisfy Material Cash Requirements
The Company believes that it has the financial resources needed to meet its cash requirements during the next twelve months. Cash requirements for periods beyond the next twelve months will depend on, among other things, the Company’s profitability and its ability to manage working capital requirements.
Other Contractual Commitments
Convertible Note
As of December 31, 2023, we were in compliance with all covenants of the outstanding 0% convertible notes due November 2026. Subsequent to December 31, 2023, the Company has become non-compliant with certain terms of the Indenture related to the outstanding 0% convertible notes due 2026. Refer to Note 26 for details regarding the Company's non-compliance with the Indenture subsequent to December 31, 2023.
Indemnification
In the normal course of business we periodically enter into agreements to indemnify customers or suppliers against claims of intellectual property infringement made by third parties arising from the use of our products. Historically, costs related to these indemnification provisions have not been significant. We are unable to estimate the maximum potential impact of these indemnification provisions on our future results of operations.
To the extent permitted under Delaware law, we indemnify our directors and officers for certain events or occurrences, when the director or officer is, or was, serving at our request in such capacity, subject to limited exceptions. The maximum potential amount of future payments we could be required to make under these indemnification obligations is unlimited; however, we have directors’ and officers’ insurance coverage that may enable us to recover future amounts paid, subject to a deductible and to the policy limits. There is no assurance that the policy limits will be sufficient to cover all damages, if any.
Critical Accounting Estimates
We prepare our consolidated financial statements in accordance with U.S. Generally Accepted Accounting Principles ("GAAP"). In doing so, we have to make estimates and assumptions that affect the amounts we reported as assets, liabilities, revenues, expenses, gains and losses, as well as related disclosures of contingent assets and liabilities. In some cases, we reasonably could have applied different estimates and/or assumptions. In some cases, changes in our accounting estimates are reasonably likely to occur from period to period. Accordingly, actual results could differ materially from our estimates. To the extent that there are material differences between our estimates and actual results, our financial condition or results of operations will be affected. We base our estimates on past experience and other assumptions that we believe are reasonable under the circumstances, and we evaluate these estimates on an ongoing basis. We refer to accounting estimates of this type as critical accounting estimates, which we discuss further below. We have reviewed our critical accounting estimates with the Audit Committee of our Board of Directors.
See Note 2 to the consolidated financial statements in Item 8 of this Form 10-K for a summary of our significant accounting policies.
Revenue recognition
Revenue is recognized for the amount of consideration we expect to receive in exchange for products or services when control of those promised products or services is transferred to customers, which generally occurs when the goods have been shipped or delivered to the customer, risk of loss has transferred to the customer, and we have a present right to payment.
We enter into contracts that include various combinations of products and services that are generally capable of being distinct and are accounted for as separate performance obligations. For such arrangements, we allocate revenue to each performance obligation based on its relative standalone selling price (“SSP”). Judgment is required to determine the SSP for each distinct performance obligation in a contract. For the majority of items, we estimate SSP using historical transaction data. We use a range of amounts to estimate SSP when we sell each of the products and services separately and need to determine whether there is a discount to be allocated based on the relative SSP of the various products and services. In instances where SSP is not directly observable, such as when the product or service is not sold separately, we determine the SSP using information that may include market conditions and other observable inputs.
In some circumstances, we have more than one SSP for individual products and services due to the stratification of those products and services by customers, geographic region or other factors. In these instances, we may use information such as the size of the customer and geographic region in determining the SSP. The determination of SSP is an ongoing process, and information is reviewed regularly in order to ensure SSP reflects the most current information or trends.
The nature of our sales and marketing incentives may lead to consideration that is variable. Judgment is exercised at contract inception to determine the expected value of the contract and resulting transaction price. Ongoing assessments are performed to determine if updates are needed to the original estimates.
We enter into collaborative arrangements that we may be required to account for in accordance with Accounting Standards Codification ("ASC") Topic 606, “Revenue from Contracts with Customers," because our collaboration partner meets the definition of a customer. When these arrangements provide an opportunity for the Company to earn milestone payments based upon the achievement of agreed-upon contract objectives, we must assess if and when it is appropriate to include those milestone payments, which represent variable consideration, in the contract's transaction price. This assessment, which impacts the timing and the amount of revenue recognized under a collaborative arrangement accounted for in accordance with ASC 606, requires management to conclude that it is probable that a significant reversal of the amount of cumulative revenue recognized with respect to a collaborative agreement will not occur as a result of including one or more milestone payments in the arrangement's transaction price, including when any uncertainty associated with the achievement of such milestones is ultimately resolved. The evaluation of when it is appropriate to include amounts earned upon the achievement of milestones in a contract's transaction price requires the application of significant assumptions and judgments, which management reassesses at the end of each reporting period.
See Note 2 and Note 5 to the consolidated financial statements in Item 8 of this Form 10-K for further discussion.
Allowance for doubtful accounts
In evaluating the collectability of our accounts receivable, we assess a number of factors, including specific customers’ abilities to meet their financial obligations to us, the length of time receivables are past due, historical collection experience, current economic conditions, and reasonable and supportable forecasts. Based on these assessments, we may record a reserve for specific customers, as well as a general reserve and allowance for expected credit losses. If circumstances related to specific customers change, or economic conditions deteriorate such that our past collection experience is no longer relevant, our estimate of the recoverability of our accounts receivable could be further reduced from the levels provided for in the consolidated financial statements.
We evaluate specific accounts for which we believe a customer may have an inability to meet their financial obligations (for example, aging over 90 days past due or bankruptcy). In these cases, we use our judgment, based on available facts and circumstances, and record a specific reserve for that customer to reduce the receivable to an amount we expect to collect. These specific reserves are re-evaluated and adjusted as additional information is received that impacts the amount reserved.
Income taxes
We are subject to income taxes in the U.S. and foreign jurisdictions. Significant judgment is required in evaluating our uncertain tax positions and determining our provision for income taxes.
Although we believe we have adequately reserved for our uncertain tax positions, no assurance can be given that the final tax outcome of these matters will not be different. We adjust these reserves in light of changing facts and circumstances, such as the closing of a tax audit or the refinement of an estimate. To the extent that the final tax outcome of these matters is different than the amounts recorded, such differences will affect the provision for income taxes and the effective tax rate in the period in which such determination is made.
The provision for income taxes includes the effect of reserve provisions and changes to reserves that are considered appropriate, as well as the related net interest and penalties. In addition, we are subject to the continuous examination of our income tax returns by the Internal Revenue Service (“IRS”) and other tax authorities which may assert assessments against us. We regularly assess the likelihood of adverse outcomes resulting from these examinations and assessments to determine the adequacy of our provision for income taxes.
See Note 2 and Note 19 to the consolidated financial statements in Item 8 of this Form 10-K for further discussion.
Inventories
Inventories are stated at the lower of cost or net realizable value, with cost being determined using standard costing, which approximates the first-in, first-out method.
The inventory reserve is a critical estimate as there is rapid technological change in our industry impacting the market for our products, and there is significant judgment in estimating the amount of spare parts to keep on hand to service previously sold printers for periods of up to 10 or more years.
See Note 6 to the consolidated financial statements in Item 8 of this Form 10-K for further discussion.
Business combinations and purchase accounting
We apply purchase accounting to transactions that meet the definition of business combinations. When applying purchase accounting, we are required to estimate the fair value of the assets acquired and liabilities assumed in a business combination as of the acquisition date, for which the Company engages a third-party valuation specialist to assist. The application of purchase price accounting oftentimes results in the identification and valuation of intangible assets that may not have been previously recognized on the balance sheet of the acquired company. The amount of purchase price paid in excess of the net assets acquired is recorded as goodwill.
The fair values of acquired assets and assumed liabilities are estimated in accordance with accounting standards which define fair value as the price that would be received to sell an asset or paid to transfer a liability in an orderly transaction between market participants. Management must apply judgment when identifying the intangible assets acquired as part of a business combination, as well as when determining the appropriate valuation technique to be applied to all acquired assets and assumed liabilities. Management also must make significant estimates and assumptions when determining the inputs for inclusion in the related valuation models. The fair values of the net assets acquired are determined primarily using Level 3 inputs (inputs that are unobservable to the marketplace participant).
The most significant estimates and assumptions relate to the determination of (1) the fair values of identified intangible assets (e.g., developed technology and trade names) and (2) the period and pattern of amortization for intangible assets that are assigned a definite life. The fair values of acquired intangible assets primarily have been determined based on projected cash flows attributable to the operations of the acquiree. The projected cash flows include various assumptions, including estimated revenue growth rates, operating margins, R&D expenditures, capital expenditures, royalty rates, and appropriate risk-adjusted discount rates used to discount the projected cash flows. The usage of different assumptions would result in the assignment of different fair values to the acquired identifiable intangible assets and, accordingly, also impact the amount of purchase consideration assigned to goodwill. Similarly, changes in the planned usage of the acquired identifiable intangible assets and/or their estimated economic lives, if any, could impact the recoverability of the assets and/or amortization period and expense attributable to the assets in the future.
Goodwill & other long-lived assets, including intangible assets
Long-lived assets, including intangible assets
We review long-lived assets (or asset groups), including intangible assets subject to amortization, for impairment whenever events or changes in circumstances indicate that the carrying value of an asset (or asset group) may not be recoverable. We assess the recoverability of the carrying value of assets (or asset groups) held for use based upon a review of undiscounted projected cash flows. Impairment losses, where identified, are measured as the excess of the carrying value of a long-lived asset (or asset group) over its estimated fair value, as determined using discounted projected cash flows.
See Note 7 and Note 8 to the consolidated financial statements in Item 8 of this Form 10-K for discussion of the long-lived asset impairment charges recognized during the years ended December 31, 2023 and 2022.
Goodwill
Goodwill represents the purchase price paid in excess of the fair value of net tangible and intangible assets acquired in a business combination. We review goodwill for impairment annually and, between annual impairment assessments, when circumstances indicate that the likelihood of an impairment is greater than 50%. Such circumstances may include a significant adverse change in the business climate for one of our reporting units or a decision to dispose of a reporting unit or a significant portion of a reporting unit. The test for goodwill impairment compares the fair value of each of our reporting units to its respective carrying value. This process requires a significant level of estimation and use of judgment by management – particularly to (1) estimate the fair value of each of our reporting units and (2) determine the carrying value of each of our reporting units, since we do not maintain separate balance sheets for our reporting units.
We estimate the fair value of our reporting units based primarily on the discounted projected cash flows of their underlying operations, which requires us to make assumptions about estimated cash flows, including long-term revenue and expense forecasts, profit margins, discount rates and terminal growth rates. We develop these assumptions based on the market risks unique to each reporting unit. We separately use reasonable and consistent allocation methodologies and approaches to allocate asset and liability balances to our reporting units when an account balance is not directly attributable to a specific reporting unit.
See Note 9 to the consolidated financial statements in Item 8 of this Form 10-K for discussion of the goodwill impairment charge recognized during the year ended December 31, 2023. Our annual goodwill impairment tests performed for the years ended December 31, 2022 and 2021 did not result in the recognition of a goodwill impairment charge.
Regenerative medicine earnout payments and performance-based stock units
Upon acquiring Volumetric on December 1, 2021, the Company became subject to potential aggregate acquisition-related earnout payments of up to $355.0 million that will be due to Volumetric’s former owners (“Sellers”) if seven individually assessed non-financial milestones are achieved. Each of the seven non-financial milestones, which individually triggers a specific earnout payment if achieved prior to an agreed upon date of either December 31, 2030 or December 31, 2035, is based upon specific advances in regenerative medicine related to lungs or tissue organs. For each milestone, payment is only due to the extent that the Sellers continue to be employed by the Company at the time that a milestone is achieved. As the earnout payments require the continued employment of Volumetric’s Sellers, the Company recognizes each individual earnout payment as compensation expense over the period commencing on the date that the related milestone is deemed probable of achievement through the anticipated date of achievement.
In addition, the Company has granted performance-based stock units (“PSUs”), with vesting terms that are based upon four individually-assessed, non-financial milestones, to other employees who work on advancements in regenerative medicine related to lungs and tissue organs. The PSUs associated with each individual milestone are recognized as compensation expense over the period commencing on the date that the respective milestone is deemed probable of being met through the anticipated date of achievement.
As the milestones that trigger the Volumetric earnout payments and the vesting of the PSUs are (1) based upon scientific and technological advancements that are expected to require multiple years of R&D to achieve and (2) subject to significant known and unknown risks and uncertainties, management must apply significant assumptions and judgment at each balance sheet date to assess both the probability of achievement and expected timing of achievement. A change in management’s assumptions or estimates regarding the probability and/or timing of achievement of a milestone in connection with management’s quarterly reassessment can materially impact the amount of compensation expense recognized for the respective and future periods as follows:
•A change in assumptions that results in a milestone first being deemed probable of achievement will result in the recognition of incremental compensation expense in the Company’s consolidated statement of operations in the respective period;
•A change in assumption regarding the timing of achievement of a milestone will result in the acceleration or deceleration of the recognition of future compensation expense; and/or
•A change in assumption that results in a milestone no longer being deemed probable of achievement will result in a full reversal of previously recognized expense in the respective period.
Prior to the year ended December 31, 2023, the Company had been recognizing compensation expense related to (1) one Volumetric milestone-based payment, for which the potential amount due to the Sellers would be $65.0 million, and (2) one PSU milestone (“the RegMed Awards”), for which the aggregate grant date fair value of the outstanding and unvested awards was $4.5 million as of December 31, 2022, as the related Volumetric earnout and RegMed Award milestone was deemed probable of achievement. During the year ended December 31, 2023, the Company decided to reduce its budgeted funding for the R&D related to the Volumetric earnout and RegMed Award milestone, which resulted in the Company concluding that it was no longer probable that the milestone would be achieved by the end of the term of the Volumetric earnout arrangement or prior to the expiration and cancellation of the RegMed Awards. In concluding that the Volumetric and RegMed Award milestone would no longer be achieved, the Company reversed all of the previously accrued compensation expense, one half of which was expected to be settled with common shares, which had an income statement impact of $18.4 million for the year ended December 31, 2023.
As a result of the reversal of all previously recognized expense during the year ended December 31, 2023, the Company has not recognized any compensation expense related to (1) the $355.0 million of potential Volumetric earnout payments provided for in the Volumetric acquisition agreement or (2) the outstanding RegMed Awards with an aggregate grant date fair value of $17.2 million. The Company has not recognized any of this expense because none of the related non-financial milestones were deemed probable of achievement as of December 31, 2023.
Additionally, in February 2024, the Volumetric Sellers were informed that four of the seven milestones included in the Volumetric acquisition agreement were terminated. The termination of these milestones, which related to kidney and liver research, was based upon a determination that their achievement was no longer financially viable due to the loss of the funding required from the Company's key strategic partner for the related R&D efforts. As a result of the termination of the four milestones in February 2024, for periods subsequent to December 31, 2023, the Company's maximum liability for the Volumetric earnout payments related to the remaining three milestones is $175,000.
Furthermore, on April 29, 2024, the key employees from Volumetric who were required to be employed at the time of achievement of each science-based milestone outlined in the Volumetric acquisition agreement in order for each related acquisition earnout payment to become payable resigned from their positions with the Company. As a result of the resignation of the key employees for whom continued employment was required for any of the remaining earnout payments to become payable, the parties to which the remaining three earnout payments totaling $175,000 were potentially payable were notified that such amount was no longer eligible to be earned. For further information concerning the termination of the Volumetric milestones related to potential earnout payments, refer to Note 26 to the consolidated financial statements included in Item 8 of this Form 10-K.
Further changes to management’s assumptions regarding the probability and/or timing of achievement of the RegMed Award milestones or, alternatively, changes to the arrangements or circumstances that provide for compensation to be paid upon the achievement of the RegMed Award milestones, could significantly impact the amount of compensation expense recognized by the Company in the future.
Loss contingencies
We record an estimated loss from a contingency when information indicates that it is probable that a liability has been incurred at the date of the financial statements and the amount of the loss can be reasonably estimated. Accounting for contingencies requires us to use our judgment, and the ultimate resolution of our exposure related to these matters may change as further facts and circumstances become known.
See Note 23 to the consolidated financial statements in Item 8 of this Form 10-K for further discussion.
Recent Accounting Pronouncements
See Note 2 to the consolidated financial statements in Item 8 of this Form 10-K for a discussion of recent accounting pronouncements.
Item 7A. Quantitative and Qualitative Disclosures about Market Risk
We are exposed to market risks related to fluctuations in foreign currency exchange rates and commodity prices, each of which may adversely affect our results of operations and financial condition. We seek to minimize these risks through regular operating and financing activities and, when we consider it to be appropriate, through the use of derivative financial instruments. We do not purchase, hold or sell derivative financial instruments for trading or speculative purposes.
Foreign exchange rates
Because we conduct our operations in many areas of the world and our transactions are denominated in a variety of currencies, our results of operations, as reported in U.S. dollars, may be significantly affected by fluctuations in rates of exchange between currencies. These fluctuations could be significant. In 2023, approximately 43.0% of our net sales and a significant portion of our costs are attributable to entities with functional currencies other than the U.S. dollar. We generally are unable to adjust our non-dollar local currency sales prices to reflect changes in exchange rates between the dollar and the relevant local currency. As a result, changes in exchange rates between the U.S. Dollar and the Euro, Japanese Yen, British Pound, South Korean Won or other currencies in which we receive sale proceeds have a direct impact on our reported operating results. These impacts are partially offset by expenses incurred in the same currency as the sales. There is normally a time lag between our sales and collection of the related sales proceeds, exposing us to additional currency exchange rate risk.
When practicable, we endeavor to match assets and liabilities in the same currency on our U.S. balance sheet, as well as the balance sheets of our subsidiaries, in order to reduce the risks attributable to conducting transactions in a variety of currencies. We also, when we consider it appropriate, enter into foreign currency contracts to hedge exposures arising from these transactions. As of December 31, 2023 and 2022, we had no foreign currency exchange contracts outstanding.
For the year ended December 31, 2023, a hypothetical change of 10% in foreign currency exchange rates would have caused changes in revenue and total operating expenses of approximately $21.0 million and $32.4 million, respectively, assuming all other variables remained constant.
Commodity prices
We are exposed to price volatility related to raw materials and energy products used in conjunction with our printer assembly and print materials blending processes. Generally, we acquire such components at market prices and do not use financial instruments to hedge commodity prices. For the year ended December 31, 2023, a hypothetical 10% change in commodity prices for raw materials would have caused a change to cost of sales of approximately $16.2 million.
Item 8. Financial Statements and Supplementary Data
Our consolidated financial statements and the related notes, together with the Report of Independent Registered Public Accounting Firm thereon, are set forth below beginning on page F-1 and are incorporated herein by reference.
Item 9. Changes in and Disagreements with Accountants on Accounting and Financial Disclosure
Not applicable.
Item 9A. Controls and Procedures
Evaluation of Disclosure Controls and Procedures
Under the supervision and with the participation of our management, including our Chief Executive Officer and Chief Financial Officer, we evaluated the effectiveness of our disclosure controls and procedures (as that term is defined in Rules 13a-15(e) and 15d-15(e) under the Securities Exchange Act of 1934, as amended (the “Exchange Act”)) as of December 31, 2023, which is the end of the period covered by this Annual Report on Form 10-K. Based on this evaluation, our Chief Executive Officer and Chief Financial Officer concluded that the Company’s disclosure controls and procedures were not effective as of December 31, 2023 to ensure that information required to be disclosed by the Company in reports we file or submit under the Exchange Act is (i) recorded, processed, summarized, evaluated and reported, as applicable, within the time periods specified in the United States Securities and Exchange Commission’s (“SEC”) rules and forms and (ii) accumulated and communicated to the Company’s management, including the Company’s Chief Executive Officer and Chief Financial Officer, as appropriate to allow timely decisions regarding required disclosures due to the material weaknesses described below.
Notwithstanding the existence of the material weaknesses described below, management believes that the consolidated financial statements included in this Annual Report on Form 10-K fairly present, in all material respects, our financial position, results of operations and cash flows as of and for the periods presented, in conformity with generally accepted accounting principles.
Management’s Report on Internal Control over Financial Reporting
Management of the Company is responsible for establishing and maintaining adequate internal control over financial reporting (as such term is defined in Exchange Act Rules 13a-15(f) and 15d-15(f)) and for performing an assessment of the effectiveness of internal control over financial reporting as of December 31, 2023. The Company’s internal control over financial reporting is a process designed by, or under the supervision of, our Chief Executive Officer and Chief Financial Officer to provide reasonable assurance regarding the reliability of financial reporting and the preparation of financial statements for external purposes in accordance with GAAP. The Company’s internal control over financial reporting includes those policies and procedures that (i) pertain to assets of the Company; (ii) provide reasonable assurance that transactions are recorded as necessary to permit preparation of financial statements in accordance with GAAP, and that receipts and expenditures of the Company are being made only in accordance with authorizations of management and directors of the Company; and (iii) provide reasonable assurance regarding prevention or timely detection of unauthorized acquisition, use, or disposition of the Company’s assets that could have a material effect on the financial statements.
Management’s assessment of and conclusion on the effectiveness of the Company’s internal control over financial reporting as of December 31, 2023, did not include the internal controls of Wematter AB (“Wematter”), which was acquired on July 1, 2023. We began consolidating the results of Wematter in the 2023 consolidated financial statements of the Company as a result of the acquisition, which represented approximately 0.7% of the Company’s total assets as of December 31, 2023, and 0.0% of the Company’s total revenue for the year ended December 31, 2023. Due to the timing of this acquisition and as permitted by SEC guidance, management excluded Wematter from its December 31, 2023 assessment of the Company’s internal control over financial reporting.
Because of its inherent limitations, internal control over financial reporting may not prevent or detect all misstatements. Also, projections of any evaluation of effectiveness to future periods are subject to the risk that controls may become inadequate because of changes in conditions or that the degree of compliance with the policies or procedures may deteriorate.
A material weakness is a deficiency, or a combination of deficiencies, in internal control over financial reporting, such that there is a reasonable possibility that a material misstatement of a company’s annual or interim consolidated financial statements will not be prevented or detected on a timely basis.
Management, including our Chief Executive Officer and Chief Financial Officer, assessed the effectiveness of the Company’s internal control over financial reporting as of December 31, 2023. In making this assessment, management used the criteria set forth by the Committee of Sponsoring Organizations of the Treadway Commission (COSO) the Internal Control - Integrated Framework (2013). Based on its assessment, management has concluded that the Company did not maintain effective internal controls over financial reporting as of December 31, 2023. Specifically, management concluded that the Company did not effectively design, implement and maintain formal accounting policies, procedures and controls over significant accounts and disclosures in order to achieve complete, accurate and timely financial accounting, reporting and disclosures with respect to:
1.The revenue process, including the review of contract terms input into the Company's information systems that support the determination of revenue recognition, the accounting for, and the monitoring of the timing of revenue recognition;
2.The financial close, accounting, and reporting processes, as specifically related to management’s review of internally prepared reports and analyses utilized in these processes in reviewing certain financial statement disclosures;
3.The design and implementation of controls over the review of revenue pricing and the implementation of a related accounting information system;
4.Management’s review of the accounting treatment for certain technical matters related to certain transactions and financial statement accounts; and
5.The maintenance of an effective control environment; specifically, as it relates to: (a) senior management's commitment to the control environment principles, and (b) maintaining sufficient qualified resources with the appropriate level of knowledge, experience, and training necessary to support accounting and financial reporting processes and controls.
Although these material weaknesses did not result in a material misstatement of our consolidated financial statements for the periods presented, there is a possibility they could lead to a material misstatement of account balances or disclosures. Accordingly, management has concluded that these control deficiencies constitute material weaknesses.
Management’s Plan for Remediation
Certain of the material weaknesses described above (items 1 and 2) were initially identified at December 31, 2020 and continued to exist at December 31, 2023. The remediation plan we commenced in January 2021 served to address a number of the control deficiencies previously identified; however, additional deficiencies were identified in the year ended December 31, 2023, indicating the resulting material weaknesses were not fully remediated.
The ongoing remediation plan is designed to improve our internal control over financial reporting and remediate the related control deficiencies that led to these material weaknesses. In response to these deficiencies, management, with the oversight of the Audit Committee of the Board of Directors, has identified and is implementing steps to remediate the material weaknesses described above.
During the three years ended December 31, 2023, the Company completed the implementation of the following remedial measures designed to address the material weaknesses initially identified at December 31, 2020, and to continue to improve our internal control over financial reporting:
•Established a formal controls governance committee in the first quarter of 2022 to manage and enhance the oversight and execution of internal controls. The controls governance committee consists of members of senior leadership, which meets monthly or more frequently as needed.
•Retained an external firm with expertise in the design and execution of internal controls over financial reporting to examine our overall internal controls framework, including the design of our controls and procedures and implementation of our remediation activities.
•Retained an external firm with deep expertise in internal controls monitoring and testing to perform Internal Audit activities.
•Retained an external firm with technical accounting expertise to support the Finance function.
•Enhanced the global control environment, including expanded internal controls testing of additional business process and information technology controls in 2022 and 2023.
•Implemented software platforms to manage and administer account reconciliations and ownership of individual control points.
•Conducted extensive cross-functional internal controls training for all levels of the Company.
•Enhanced the design of our internal disclosure processes to provide greater representation across functions and improve opportunities to identify matters requiring accounting disposition or disclosures.
•Hired new senior leadership at the Chief Accounting Officer and Chief Financial Officer levels with leadership experience and appropriate technical expertise to continue enhancements to the Company’s controls framework and strengthen the Company’s level of technical expertise.
•Initiated a robust finance transformation initiative designed to improve and enhance the financial close process, with an emphasis on process improvements and the implementation and enhancement of key technologies designed to improve the automation and execution of internal controls in the accounting environment.
Ongoing internal control remediation efforts with respect to (a) the two material weaknesses initially identified at December 31, 2020 and (b) the additional material weaknesses identified at December 31, 2023 are expected to include the following:
•Perform a comprehensive evaluation of our key business processes and internal controls in areas where we have identified material weaknesses in order to enhance the design of certain controls and improve our overall control environment, with an emphasis on those business processes related to order entry and revenue accounting.
•Perform additional education and training on process requirements for control performers to address effective execution of management review control activities.
•Enhance review processes to support the design and timely execution of control activities related to changes or updates within IT systems impacting key internal control processes.
•Hire and retain financial professionals with relevant knowledge and experience in financial reporting and technical accounting matters.
•Enhance senior leadership’s oversight and monitoring of the internal control environment and effectiveness of the Company’s remediation activities.
We are committed to the remediation of all material weaknesses and expect to successfully implement enhanced control processes. However, as we continue to evaluate and work to improve our internal control over financial reporting, management may determine that additional measures to address control deficiencies or modifications to the remediation plan are necessary. Therefore, we cannot assure you as to the timing, scope, or costs of the ongoing remediation process. Moreover, we cannot assure you that additional material weaknesses will not arise in the future as we work to improve our control environment.
Attestation Report of Independent Registered Public Accounting Firm
The effectiveness of our internal control over financial reporting as of December 31, 2023 has been audited by BDO USA, P.C., an independent registered public accounting firm, as stated in their report included in Item 8 of this Form 10-K.
Changes in Internal Control Over Financial Reporting
Other than the management remediation plan described above, there were no changes in the Company’s internal controls over financial reporting during the quarter ended December 31, 2023 that have materially affected, or are reasonably likely to materially affect, the Company’s internal control over financial reporting.
Item 9B. Other Information
During the three months ended December 31, 2023, none of our directors or officers (as defined in Rule 16a-1(f) of the Securities Exchange Act of 1934, as amended) adopted or terminated a Rule 10b5-1 trading arrangement or a non-Rule 10b5-1 trading arrangement (in each case, as defined in Item 408(a) of Regulation S-K) for the purchase or sale of the Company’s securities.
Item 9C. Disclosure Regarding Foreign Jurisdictions that Prevent Inspections
None.
PART III
All numbers presented in Part III are presented in dollars, except per share amounts, or as otherwise indicated.
Item 10. Directors, Executive Officers and Corporate Governance
Information Regarding Directors
Set forth below is certain information with respect to our current directors.
| | | | | |
Malissia R. Clinton
Age: 55
Director Since: 2019
Board Committees: •Compensation •Compliance •Corporate Governance and Sustainability
|
Position, Principal Occupation and Professional Experience: Ms. Clinton has served as Executive Vice President and General Counsel of Meritage Homes Corporation, the fifth-largest public homebuilder in the United States, since April 2022 and previously served as Senior Vice President, General Counsel and Secretary at The Aerospace Corporation, a nonprofit corporation that provides technical guidance and advice on all aspects of space missions, from 2009 through March 2022. She worked at Northrop Grumman from 2002 to 2009, including as Senior Counsel for Special Projects beginning in 2007. Prior to joining Northrop Grumman, Ms. Clinton worked at TRW Space Technology, a division of TRW, Inc., as Counsel in its Telecommunication Programs and Avionic Systems division. She began her career as an Associate at Tuttle & Taylor.
Other Current Public Directorships: None.
Prior Public Company Directorships (within the last five years): Progyny, Inc.
Other Directorships: Arizona State University Foundation and Pacaso.
|
William E. Curran Age: 75 Director Since: 2008 Board Committees: • Audit • Compensation • Compliance
| Position, Principal Occupation and Professional Experience: Currently retired, Mr. Curran was the President and Chief Executive Officer at Philips Electronics North America Corp. from July 1999 to August 2002. Prior to that he served as Chief Financial Officer from February 1996 to July 1999. Previously, he served as Chief Operating Officer of Philips Medical North America, a medical device manufacturer, from February 1993 to February 1996. Other Current Public Directorships: None. Prior Public Company Directorships (within the last five years): Profound Medical Corp.
Other Directorships, Trusteeships and Memberships: Resonant Medical and Ventracor.
|
Claudia N. Drayton
Age: 56
Director Since: 2021
Board Committees: •Audit •Corporate Governance and Sustainability
|
Position, Principal Occupation and Professional Experience: Ms. Drayton served as the Chief Financial Officer ("CFO") of Quantum-Si, a life sciences tools company commercializing a unique protein sequencing platform, from April 2021 to June 2023. Previously, she served as Chief Financial Officer at CHF Solutions (now Nuwellis, Inc.), an early-stage medical device company, from January 2015 to April 2021. Prior to joining CHF Solutions, Ms. Drayton spent 15 years with Medtronic plc. Before joining Medtronic, Ms. Drayton was an audit and business advisory manager at Arthur Andersen LLP.
Other Current Public Directorships: Brookdale Senior Living Inc. Prior Public Company Directorships (within the last five years): None.
|
| | | | | |
Thomas W. Erickson
Age: 73
Director Since: 2015
Board Committees: •Compensation •Corporate Governance and Sustainability
|
Position, Principal Occupation and Professional Experience: Mr. Erickson has been President and Chief Executive Officer ("CEO") of ECG Ventures, Inc., an investment firm, since 1988 and Chair of the Board of Dermatologists of Central States, LLC (DOCS) since 2022. Mr. Erickson has previously served as Chair and Interim President and Chief Executive Officer of National Medical Health Card Systems, Inc.; Chair of the Board of PathWays, Inc.; Chair of the Board of TransHealthcare, Inc.; Chair and Interim Chief Executive Officer of LifeCare Holdings, Inc.; Interim President and Chief Executive Officer of Luminex Corporation; Chair of the Board of Inmar, Inc.; Chair of the Board and Interim President and Chief Executive Officer of Western Dental Services, Inc.; and Interim President and Chief Executive Officer of Omega Healthcare Investors, Inc. Mr. Erickson was also co-founder, President and Chief Executive Officer of CareSelect Group, Inc. Other Current Public Directorships: None.
Prior Public Company Directorships (within the last five years): American Renal Associates Holdings, Inc. and Luminex Corporation. Other Directorships, Trusteeships and Memberships: Dermatologists of Central States, LLC, MGA Home Care, LLC, MW Industries, LP and Pearl Street Dental Management, LLC.
|
Jeffrey A. Graves
Age: 63
Director Since: 2020
|
Position, Principal Occupation and Professional Experience: Dr. Graves has served as the Company’s President and Chief Executive Officer ("CEO") since May 2020. From 2012 to May 2020, he was CEO, President and Director of MTS Systems Corporation, a global supplier of test, simulation, and measurement systems. From 2005 until 2012, he served as President and CEO of C&D Technologies, Inc. Dr. Graves also held leadership roles with Kemet Corporation as Chief Operating Officer from 2001 to 2003 and CEO from 2003 to 2005. Previously he held several leadership and technical roles with GE, Rockwell, and Howmet Corporation. Other Current Public Directorships: Integra Lifesciences Holdings Corporation.
Prior Public Company Directorships (within the last five years): Hexcel Corporation, FARO Technologies, Inc. and MTS Systems Corporation.
|
Jim D. Kever
Age: 71
Director Since: 1996
Board Committees: •Compensation •Corporate Governance and Sustainability
|
Position, Principal Occupation and Professional Experience: Mr. Kever has been a Principal in Voyent Partners, LLC, a venture capital firm, since 2001. He previously served as President and Co-Chief Executive Officer of the Transaction Services Division of WebMD Corporation (formerly Envoy Corporation) from 1995 to 2001. Prior to 1995 he served as Envoy Corporation’s Executive Vice President, Secretary and General Counsel. Other Current Public Directorships: None.
Prior Public Company Directorships (within the last five years): Luminex Corporation. |
| | | | | |
Charles G. McClure, Jr.
Age: 70
Director Since: 2017
Chair Since: 2018
Board Committees: •Compliance
|
Position, Principal Occupation and Professional Experience: Mr. McClure has served as a Managing Partner of Michigan Capital Advisors, a private investment firm, since 2014 and has more than 35 years of experience in the transportation industry. Prior to founding Michigan Capital Advisors, Mr. McClure served as Chair of the Board, Chief Executive Officer and President of Meritor, Inc. from 2004 through 2013. From 2002 through 2004, Mr. McClure served as Chief Executive Officer, President and a member of the Board of Federal Mogul Corp. Mr. McClure joined Federal Mogul in 2001 as president, Chief Operating Officer and a member of the Board. Before joining Federal Mogul, Mr. McClure served as President, Chief Executive Officer and a member of the Board of Detroit Diesel. He joined Detroit Diesel in 1997 after 14 years in a variety of management positions with Johnson Controls. Other Current Public Directorships: DTE Energy Company and Crane Company.
Prior Public Company Directorships (within the last five years): None. Other Directorships, Trusteeships and Memberships: Henry Ford Health Systems, Invest Detroit, Penske Corp and Detroit Regional Partnership.
|
Kevin S. Moore
Age: 69
Director Since: 1999
Board Committees: •Audit •Compensation
|
Position, Principal Occupation and Professional Experience: Mr. Moore has been with The Clark Estates, Inc., a private investment firm and a major company stockholder, for more than 30 years, where he is currently Vice Chairman. Other Current Public Directorships: None.
Prior Public Company Directorships (within the last five years): None. Other Directorships, Trusteeships and Memberships: Aspect Holdings, LLC, The Clark Foundation, The National Baseball Hall of Fame & Museum, Inc. and Bassett Healthcare Network and Bassett Medical Center.
|
Vasant Padmanabhan
Age: 58
Director Since: 2020
Board Committees: •Compliance •Technology Applications |
Position, Principal Occupation and Professional Experience: Dr. Padmanabhan has served as President, Global Ear, Nose & Throat Business Unit, President Global Research & Development and as a member of the Executive Committee for Smith+Nephew, a global medical devices business operating in the markets for advanced surgical devices, since August 2016. Prior to joining Smith+Nephew, Dr. Padmanabhan served as Senior Vice President for Thoratec Corporation from June 2014 until its acquisition by St. Jude Medical, Inc. in October 2015. Prior to joining Thoratec, Dr. Padmanabhan served in several roles of increasing responsibility for 18 years with Medtronic plc in their Cardiac Rhythm Management business, including as Vice President of Product Development for the Implantable Defibrillator Business and as Vice President of Connected Care R&D and Operations. Other Current Public Directorships: None.
Prior Public Company Directorships (within the last five years): None. Other Directorships, Trusteeships and Memberships: Trice Medical
|
| | | | | |
John J. Tracy
Age: 69
Director Since: 2017
Board Committees: •Compliance •Technology Applications |
Position, Principal Occupation and Professional Experience: Dr. Tracy retired from The Boeing Company in 2016 as its Chief Technology Officer and Senior Vice President, Engineering, Operations, and Technology with more than 37 years of aerospace-industry experience. Prior to that he served as Vice President, Engineering and Mission Assurance for Boeing Integrated Defense Systems and Vice President Structural Technologies, Prototyping and Quality of Phantom Works at The Boeing Company, after serving in roles of increasing responsibility at Hercules, McDonnell Douglas and The Boeing Company. Dr. Tracy is a member of the National Academy of Engineering. Other Current Public Directorships: None. Prior Public Company Directorships (within the last five years): None.
|
Code of Conduct and Code of Ethics
Our Code of Conduct applies to all of our employees worldwide, including all of our officers. We separately maintain a Code of Ethics that applies to our CEO, CFO, principal accounting officer, and all other senior financial executives and to directors of the Company when acting in their capacity as directors.
These documents are designed to set high standards of business conduct and ethics for our activities and to help directors, officers, and employees resolve ethical issues. The purpose of our Code of Conduct and our Code of Ethics is to provide assurance to the greatest possible extent that our business is conducted in a consistently legal and ethical manner. Employees may submit concerns or complaints regarding ethical issues on a confidential basis by means of our 3D Systems Open Line, which includes a toll-free telephone number and website. Communications through the 3D Systems Open Line are monitored on a daily basis, and all messages are reported to the Chief Compliance Officer and the Chair of the Compliance Committee.
We intend to disclose amendments to, or waivers from, any provision of the Code of Ethics that applies to our CEO, CFO, or principal accounting officer, and persons performing similar functions and that relates to any element of the Code of Ethics described in Item 406(b) of Regulation S-K by posting such information on our website (www.3DSystems.com).
Audit Committee and Audit Committee Financial Expert
The members of the Audit Committee are William E. Curran (Chair), Claudia N. Drayton and Kevin S. Moore. All members of the Audit Committee are “independent” in accordance with New York Stock Exchange (“NYSE”) and U.S. Securities and Exchange Commission (“SEC”) rules. Our Board has determined that each member of the Audit Committee qualifies as an “audit committee financial expert” as defined by SEC rules.
Delinquent Section 16(A) Reports
Section 16(a) of the Exchange Act requires our executive officers and directors and any person owning 10 percent or more of the outstanding shares of our Common Stock to file reports with the SEC to report their beneficial ownership of and transactions in our securities and to furnish us with copies of those reports. Based upon a review of those reports submitted to us, no executive officer, director, or 10 percent beneficial owner failed to file, on a timely basis, the reports required by Section 16(a) of the Exchange Act for the year ended December 31, 2023, except that Jeffrey Creech, our Executive Vice President and Chief Financial Officer, filed a late filing on December 19, 2023, to report shares granted as a new-hire award on December 13, 2023, and Harriss Currie, our President of Regenerative Medicine, filed a late filing on December 20, 2023, to report shares granted as a new-hire award on December 15, 2023. Both of these late filings were in connection with the time required to acquire their respective SEC filing codes.
Item 11. Executive Compensation
Director Compensation
We use a combination of cash and equity-based compensation to attract and retain qualified candidates to serve on our Board of Directors. In setting director compensation, we consider the significant amount of time that our directors expend in fulfilling their duties, the skill level required by us of members of our Board, and the overall level and mix of compensation compared to industry- and size-relevant peers by referencing data compiled by the Compensation Committee’s independent compensation consultant.
Director Compensation for 2023
The following table sets forth information concerning all compensation of each of our non-employee directors for their services as a director during the year ended December 31, 2023.
| | | | | | | | | | | | | | | | | | | | | | | | | | |
Name | | Fee Earned or Paid in Cash | | Stock Awards (1) | | All Other Compensation | | Total |
Malissia Clinton | | $ | 90,000 | | | $ | 150,000 | | | $ | — | | | $ | 240,000 | |
William E. Curran | | 105,000 | | | 150,000 | | | — | | | 255,000 | |
Claudia N. Drayton | | 68,113 | | | 150,000 | | | — | | | 218,113 | |
Thomas W. Erickson | | 78,764 | | | 150,000 | | | — | | | 228,764 | |
Jim D. Kever | | 70,000 | | | 150,000 | | | — | | | 220,000 | |
Charles G. McClure, Jr. | | 250,000 | | | 150,000 | | | — | | | 400,000 | |
Kevin S. Moore | | 95,000 | | | 150,000 | | | — | | | 245,000 | |
Vasant Padmanabhan | | 66,236 | | | 150,000 | | | — | | | 216,236 | |
John J. Tracy | | 90,000 | | | 150,000 | | | — | | | 240,000 | |
(1) Represents the aggregate grant date fair value of the stock awards granted in 2023 to each non-employee director computed in accordance with stock-based compensation accounting rules (Financial Standards Accounting Board (“FASB”) ASC Topic 718). The amounts in this column reflect the award of 18,094 shares of Common Stock made to each director in office as their annual equity award under the 2015 Incentive Plan on May 16, 2023. The value of the restricted stock awards was determined by multiplying the number of shares awarded by the closing price of our Common Stock on the date of grant ($8.29 per share).
Director Fees
Director compensation is set by the Board, based upon the recommendation of the Corporate Governance and Sustainability Committee through the periodic review and approval of the Non-Employee Director Compensation Policy. We pay the following cash compensation to our non-employee directors:
| | | | | | | | | | | | | | |
Annual Retainers to Non-Employee Directors | | Chair | | Member |
Board of Directors(1) | | $ | 250,000 | | | $ | 50,000 | |
| Audit Committee | | 30,000 | | | 15,000 | |
| Compensation Committee | | 30,000 | | | 15,000 | |
| Compliance Committee | | 20,000 | | | 10,000 | |
| Corporate Governance and Sustainability Committee | | 10,000 | | | 5,000 | |
| Technology Applications Committee | | 30,000 | | | 10,000 | |
(1) The Chair of the Board of Directors does not receive fees for service on any committee.
Non-employee directors also receive annual equity awards. We also reimburse directors for their expenses of attendance at meetings of the Board of Directors or its committees.
Dr. Graves, who is an employee of the Company, received no additional compensation for service as a director in 2023.
Director Equity Awards
Pursuant to the Non-Employee Director Compensation Policy, our directors receive annual grants of immediately vested stock equal to $150,000 in total value under the 2015 Incentive Plan upon their re-election by stockholders to serve as directors. In addition, new directors, upon their election to the Board, receive an immediately vested restricted stock award equal to such number of shares having a value equal to $75,000 and a prorated annual award for the year in which he or she is elected to the Board. All shares of Common Stock issued to directors as compensation for their services as directors are fully vested when issued.
Stock Ownership and Holding Requirements for Non-Employee Directors
Consistent with the Board-adopted Qualifications for Nomination to the Board (publicly disclosed as Addendum A to the Corporate Governance and Sustainability Committee Charter), each non-employee director is expected to hold during his or her term of office a meaningful number of shares of Common Stock. As such, our Corporate Governance Guidelines require our non-employee directors to acquire and maintain an equity stake in the Company with a minimum value equivalent to five times the annual cash retainer paid to non-employee directors (as set forth in the Non-Employee Director Compensation Policy) by the later of 2025 or within 5 years of joining the Board.
Each of our non-employee directors are required to retain all shares of Common Stock that have been awarded to them under the 2015 Incentive Plan until the minimum holding requirement is met; however, they may sell up to 50% of the shares of Common Stock covered by any award to satisfy any tax obligation arising from such grant or grants. In addition, non-employee directors are required to retain all shares of Common Stock that were awarded to them under the 2004 Restricted Stock Plan for Non-Employee Directors (which was depleted in 2019) as long as they remain a director of the Company; however, they may (a) sell up to 50% of an award to cover the tax obligation arising from such grant or grants and (b) make certain transfers of shares received under the 2004 Restricted Stock Plan for Non-Employee Directors to members of their immediate family or to a trust or other form of indirect ownership established by the director for his or her benefit or for the benefit of the members of his or her immediate family.
Shares for the purposes of determining compliance with our stock ownership policy are defined as Common Stock held outright (by the director or his or her spouse), restricted stock units, restricted stock awards, and shares or share equivalents held in a Company savings plan or deferred compensation plan. Stock options, stock appreciation rights, and PSUs are excluded from the definition of shares.
All directors currently comply with their respective ownership requirements or are retaining 50% of all net shares (post-tax) that vest until achieving their minimum share ownership requirement.
Deferred Director Fees
In December 2022, the Board adopted the 3D Systems Corporation Non-Employee Director Deferral Plan to allow non-employee directors to defer receipt of all or a portion of their equity compensation in a tax efficient manner.
Executive Compensation Matters
Compensation Discussion and Analysis
This Compensation Discussion and Analysis provides detailed information and analysis regarding the compensation of our named executive officers (“NEOs”) as reported in the “Summary Compensation Table” and the other tables located in this “Executive Compensation Matters” section.
Our Named Executive Officers for 2023
| | | | | |
Name | Title |
Dr. Jeffrey A. Graves | President, Chief Executive Officer and Director |
Jeffrey Creech(1) | Executive Vice President and Chief Financial Officer |
Reji Puthenveetil | Executive Vice President, Additive Solutions and Chief Commercial Officer |
Menno Ellis(2) | Executive Vice President, Health Care Solutions |
Phyllis Nordstrom | Executive Vice President, Chief People Officer and Chief Administrative Officer
|
Andrew Johnson(3) | Executive Vice President, Chief Corporate Development Officer, Chief Legal Officer and Secretary and Former Interim Chief Financial Officer |
Michael Turner(4) | Former Executive Vice President and Chief Financial Officer |
(1) Mr. Creech was appointed as the Company’s Executive President and Chief Financial Officer on December 13, 2023, succeeding Mr. Johnson, who served as the Company’s Interim Chief Financial Officer from October 16, 2023, to December 12, 2023.
(2) Mr. Ellis’s role and position with the Company were eliminated, effective April 30, 2024, as part of certain organizational changes in connection with the Company’s ongoing multi-faceted restructuring initiative.
(3) Mr. Johnson resigned his role and position within the Company, effective April 30, 2024, to pursue other career opportunities.
(4) Mr. Turner resigned as the Company’s Executive Vice President and Chief Financial Officer, effective October 15, 2023.
Compensation Considerations
Sound Pay Practices
Below we highlight certain of our key practices that we consider good governance features of our executive compensation program.
Executive Compensation Program Features
Executive Compensation Program Includes:
•Maintain an Independent Compensation Committee — Our Compensation Committee consists solely of independent directors who establish our compensation practices.
•Retain an Independent Compensation Advisor — Our Compensation Committee has engaged its own compensation consultant to provide information, analysis and other advice on executive compensation independent of management.
•Stockholder Engagement — We regularly engage with our stockholders on our compensation program and implement enhancements based on feedback received.
•Annual Executive Compensation Review — At least once a year, our Board conducts a review of our compensation strategy, and during fiscal year 2023, we did an in-depth review of our compensation program and updated our peer group for purposes of evaluating compensation and making compensation decisions for fiscal year 2023.
•Limits on Maximum Payouts under Incentive Plans — In 2023, our annual bonus program was capped at 150% of target opportunity and our performance-share units were capped at 250% of target opportunity.
•Transparent Disclosure of Incentive Plan Targets and Achievement — We disclose performance measures, metrics and results used to determine both annual bonuses and performance-share unit awards.
•Compensation At-Risk — Our executive compensation program is designed so that a significant portion of the compensation of our executive officers is “at risk” based on corporate performance, to align the interests of our executive officers and stockholders. This “at risk” compensation included our annual bonus, restricted stock awards and performance-share units awarded in fiscal year 2023, which are discussed in additional detail below.
•Stock Ownership Guidelines — We maintain minimum stock ownership guidelines and stock holding requirements applicable to our executive officers and the non-employee independent members of our Board. As of December 31, 2023, each of our executive officers had either satisfied such guidelines or had time remaining to do so under the guidelines.
•Compensation Recovery (“Clawback”) Policy — In 2023, we adopted a new clawback policy that provides for recoupment of performance-based compensation in connection with restatements of financial results that reduce previously earned payouts, regardless of individual culpability, in compliance with the NYSE’s new rules.
•Conduct an Annual Stockholder Advisory Vote on NEO Compensation — We conduct an annual stockholder advisory vote on the compensation of our NEOs. Our Board considers the results of this advisory vote during the course of its deliberations on executive compensation.
•Compensation-Related Risk Assessment — We conduct regular risk assessments of our compensation programs and practices, and a full risk assessment was completed by our independent compensation consultant during fiscal year 2023 and reviewed by our Compensation Committee. We structure our executive compensation programs to try to minimize the risk of inappropriate risk-taking by our NEOs.
•“Double-Trigger” Change in Control Arrangements.
Executive Compensation Program Does Not Include or Prohibits:
•Guaranteed Bonuses — We do not provide guaranteed annual bonuses to our executive officers.
•Defined Benefit Retirement Plans — We do not currently offer, nor do we have plans to offer, defined benefit pension plans or any non-qualified deferred compensation plans or arrangements to our NEOs other than arrangements that are available generally to all employees. Our NEOs are eligible to participate in our 401(k) retirement plan on the same basis as our other employees.
•Hedging or Pledging of Company Securities — Our Policy Statement Governing Insider Trading prohibits any director, officer, employee or consultant of the Company from engaging in hedging activity and also prohibits any director or officer from holding Company securities in a margin account or pledging securities as collateral for a loan.
•Excise Tax Gross-Ups — We do not offer our NEOs excise tax gross-ups on severance or change-in-control payments.
•Stock Option Re-pricing— We do not permit options to purchase shares of our Common Stock to be repriced to a lower exercise price without the approval of our stockholders.
Compensation Philosophy
Our compensation philosophy is centered on pay for performance to drive long-term value for our stockholders. We believe that deep industry experience and technical knowledge is essential to our ability to innovate and provide full-service solutions to our customers and that the expertise of our executives and employees are critical factors to the Company’s success. The competition for talent across the industries in which we operate is intense, and we maintain focus on attracting, rewarding, and retaining a highly qualified executive team. Our executive compensation program and practices reflect the Board’s commitment to strong corporate governance and the recognition of achievements that create sustainable Company value.
We pursue this philosophy by designing our executive compensation program incorporating the following principles:
•Alignment with long-term stockholders’ interests. We believe our executives’ interests are more directly aligned with our stockholders’ interests when compensation programs emphasize an appropriate balance of short- and long- term financial performance, are impacted by our stock price performance and require meaningful ownership of our stock.
•Market competitive at target performance levels. We believe an executive’s total compensation should be competitive at the target performance level in order to attract qualified executives, motivate performance and retain, develop and reward executives with the abilities and skills needed to foster long-term value creation.
•Achievement of financial goals and strategic objectives. We believe an effective way to create value over the long term is to make a significant portion of an executive’s overall compensation dependent on the achievement of our short- and long-term financial goals and strategic objectives and on the value of our stock.
•Reward superior performance. We believe that although an executive’s total compensation should be tied to achievement of financial goals and strategic objectives and should be competitive at the target performance level, performance that exceeds target should be appropriately rewarded. We also believe there should be downside risk of below-target payouts if our financial performance is below target and if we do not achieve our financial goals and strategic objectives.
•Incorporate evolving marketplace risks and trends. We believe that as our industry evolves and our opportunities for competitive business advantages change over time, we must likewise evolve in order to continue to create value. Our compensation programs must be tailored to our strategic priorities (which may require changing the performance measures in our incentive plans) and our current outlook (which may impact how we calibrate incentive plan payouts to various levels of performance).
The key elements of our compensation programs for our NEOs include:
Chief Executive Officer Reported Target Compensation vs. Realized + Realizable Compensation
A significant percentage of the compensation program of our NEOs, including our CEO, is performance-based and/or at-risk. The table below details differences between target total direct compensation and the sum of realized and realizable compensation for each of fiscal years 2021, 2022 and 2023. The information provided in the table below is intended to supplement, not replace, the information contained in the Summary Compensation Table regarding our CEO’s compensation for fiscal years 2021, 2022, and 2023, as presented and calculated in compliance with SEC rules.
| | | | | | | | | | | | | | | | | | | | | | | | | | | | | | | | | | | | | | |
| 2021 | 2022 | 2023 | 2021 - 2023 Total |
| (A) | (B) | | (A) | (B) | | (A) | (B) | | (A) | (B) | |
| Compensation Component | Target Total Direct Compensation | Realized + Realizable Compensation | (B) as a % of (A) | Target Total Direct Compensation | Realized + Realizable Compensation | (B) as a % of (A) | Target Total Direct Compensation | Realized + Realizable Compensation | (B) as a % of (A) | Target Total Direct Compensation | Realized + Realizable Compensation | (B) as a % of (A) |
| Salary | $ | 837,400 | | $ | 837,400 | | 100 | % | $ | 849,800 | | $ | 849,800 | | 100 | % | $ | 849,800 | | $ | 849,800 | | 100 | % | $ | 2,537,000 | | $ | 2,537,000 | | 100 | % |
| Short-Term Incentives | 849,800 | | 1,274,697 | | 150 | % | 850,000 | | — | | — | % | 850,000 | | — | | — | % | 2,549,800 | | 1,274,697 | | 50 | % |
| Long-Term Incentives | 6,378,697 | | 2,259,670 | | 35 | % | 4,765,861 | | 875,715 | | 18 | % | 5,268,229 | | 1,201,693 | | 23 | % | 16,412,787 | | 4,337,078 | | 26 | % |
| Total Direct Compensation | $ | 8,065,897 | | $ | 4,371,767 | | 54 | % | $ | 6,465,661 | | $ | 1,725,515 | | 27 | % | $ | 6,968,029 | | $ | 2,051,493 | | 29 | % | $ | 21,499,587 | | $ | 8,148,775 | | 38 | % |
The sum of realized and realizable compensation over these three years is only 38% of target total direct compensation, demonstrating the sensitivity of our compensation program to achievement of performance goals and its alignment with shareholder value creation.
For purposes of the above table, terms are defined as follows:
| | | | | | | | | | | |
Compensation Component | Target Total Direct Compensation | Realized Compensation | Realizable Compensation |
Salary | As reported in each year’s Summary Compensation Table | As reported in each year’s Summary Compensation Table | — |
Short-Term Incentives | Targeted amount, as reported under “Estimated Future Payouts Under Non-Equity Incentive Plan Awards” in each year’s Grant of Plan-Based Awards Table | Amounts actually paid, as reported in the “Non-Equity Incentive Plan Compensation” column in each year’s Summary Compensation Table | — |
Long-term Incentives | The grant date fair value of awards, as reported in each year’s Summary Compensation Table | For Restricted Stock Awards granted in 2021, 2022 or 2023 that have vested as of 12/31/23, the number of shares vested multiplied by the closing price of our stock on the date of vesting | For Restricted Stock Awards granted in 2021, 2022 or 2023 that have not vested as of 12/31/23, the number of shares that have not yet vested multiplied by the closing price of our stock on 12/31/23 ($6.35).
For PSUs granted in 2021, 2022 or 2023 that have not vested as of 12/31/23, the number of shares that would be earned if performance-based criteria were assessed as of 12/31/23 multiplied by our closing price on 12/31/23 ($6.35). |
Key Compensation Actions in 2023
Our Compensation Committee, which consists entirely of independent directors, sets the compensation of our NEOs. For 2023, the Compensation Committee took the following actions with respect to the compensation of our NEOs:
•Reviewed the base salaries for our NEOs as part of our standard annual review cycle, maintaining flat salaries for all NEOs except Ms. Nordstrom, who received an increase in connection with the expansion of her responsibilities upon appointment as Chief People Officer and Chief Administrative Officer in December 2022. Mr. Creech was excluded from this annual review due to his December 2023 hire date; his employment agreement provides for a minimum base annual salary of $425,000, pro-rated for 2023.
•Reviewed the 2023 Annual Bonus Program percentage of base salary targets for our NEOs, maintaining the target percentages from 2022 for all NEOs (100% of base salary for Dr. Graves and 60% of base salary for each of our NEOs except Mr. Creech, who did not participate in the fiscal 2023 Annual Bonus Program due to his December 2023 hire date).
•Approved Annual Bonus Program metrics for 2023, weighting funding of the bonus program pool 50% towards revenue achievement and 50% towards adjusted EBITDA achievement for Dr. Graves and 40% towards revenue achievement, 40% towards adjusted EBITDA achievement and 20% towards individual goal achievement for each of our other NEOs, except Mr. Creech, who did not participate in the fiscal 2023 Annual Bonus Program due to his December 2023 hire date.
•Awarded no bonus payout to any NEO under the 2023 Annual Bonus Program based on the Company’s 2023 performance against established revenue and adjusted EBITDA metrics. Mr. Turner was not eligible for a payout due to his October 2023 resignation date. Mr. Creech was not eligible for a payout due to his December 2023 hire date.
•Approved Long-Term Incentive (“LTI”) compensation, consisting of a combination of restricted stock awards (50% weighting) and performance share unit awards (50% weighting) to provide strong links to long-term stockholder value creation and promote alignment with investors. Mr. Creech was excluded due to his December 2023 hire date.
•Forfeiture of all Mr. Turner’s outstanding unvested equity awards, including restricted stock and PSUs upon his resignation in October 2023.
•Awarded Mr. Johnson a one-time payment of $70,000 in December 2023 in connection with his service as Interim Chief Financial Officer from October 16, 2023, to December 12, 2023.
•Entered into an employment agreement with Mr. Creech in connection with his appointment as Executive Vice President and Chief Financial Officer that provided for a base salary of $425,000 (pro-rated for 2023), a bonus objective of not less than 60% of Mr. Creech’s base salary beginning in 2024, and a time-based restricted stock award for a number of shares of our Common Stock calculated with a numerator equal to $500,000 and a denominator equal to the 20-trading day trailing average closing price of our Common Stock ended on December 12, 2023 that will vest in three equal annual installments during the continuation of Mr. Creech’s employment with the Company.
Compensation Consultant and Compensation Peer Group
For 2023, the Compensation Committee directly engaged Meridian Compensation Partners, LLC (“Meridian”) and considered its guidance in the establishment of the 2023 executive compensation program. Meridian provided no services to the Company other than to the Compensation Committee.
Based on its consideration of the various factors set forth in the rules promulgated by the SEC and the NYSE, the Compensation Committee has determined that the work performed by Meridian did not raise any conflict-of-interest concerns.
In August 2022, Meridian assisted the Compensation Committee in developing a peer group to serve as a market reference for establishing and evaluating the 2023 compensation programs for our NEOs. Our 2023 peer group was composed of 17 publicly traded, industry-specific companies. Companies selected were 0.5x to 2.0x our revenue and 0.4x to 4.0x our market capitalization at the time of selection. These companies were selected after the consideration of the following criteria:
•quantitative criteria, including revenue size and growth, margins, market capitalization, headcount and R&D spend;
•qualitative criteria, including service and product offerings and end markets served; and
•likely competitors for executive talent
The 2023 peer group included:
| | | | | | | | |
Altair Engineering |
Globus Medical, Inc. (new addition) |
Penumbra, Inc. (new addition) |
AngioDynamics, Inc. (new addition) |
LivaNova PLC |
Proto Labs, Inc |
Avid Technology |
Mercury Systems, Inc. |
Rogers Corporation |
CONMED Corporation |
Natus Medical Incorporated |
Stratasys Ltd. |
ESCO Technologies |
Novanta Inc. |
Tandem Diabetes Care |
FARO Technologies, Inc. |
NuVasive, Inc. (new addition) | |
Relative to our 2022 peer group, four companies (ADTRAN Holdings, Inc., Extreme Networks, Inc., Veeco Instruments Inc. and Viavi Solutions Inc.) were removed to develop our 2023 peer group roster, in part to improve our alignment with the peer- group median for size and valuation statistics and in part to shift the peer group roster to include greater representation from companies serving healthcare end markets. At the time of selection, our 12-month trailing revenues approximated the 33rd percentile relative to the 2023 peer group, while our 12-month average market capitalization approximated the 41st percentile.
The Compensation Committee uses peer group data as a reference point (if available for a comparable position) and/or other compensation market data, including surveys such as the Radford Global Compensation Database. Relative to compensation market data, the Compensation Committee targets each element of executive compensation generally near the 50th percentile. Variation in competitive positioning by executive will occur based on various factors including experience, the scope and complexity of the executive’s position relative to what is typical in the market, tenure, and other contributions.
Say-on-Pay
We provide stockholders with an advisory vote (“say-on-pay”) on the compensation of our NEOs. We currently hold this say-on-pay vote on an annual basis. Our say-on-pay proposal received support of more than 93% of votes cast at each of our last five Annual Meetings of Stockholders, including 96% at our 2023 Annual Meeting of Stockholders (“2023 Annual Meeting”). The Compensation Committee considered the stockholders’ strong support of our say-on-pay vote at the 2023 Annual Meeting when designing our executive compensation program. The Compensation Committee will consider the results of future advisory votes on executive compensation as our compensation philosophy continues to evolve and compensation decisions are made each year.
Determining Executive Compensation
The Compensation Committee is responsible for setting the compensation of all officers of the Company subject to Section 16 of the Exchange Act (“executive officers”) and each direct report of the CEO, including the NEOs.
The Compensation Committee reviews the CEO’s recommendation for each of the other NEO’s compensation during the first quarter of each year. The purpose of this annual review is:
•to determine the amount of any annual incentive compensation to be awarded to each NEO for the preceding calendar year;
•to determine any adjustments to be made to the annual salary of each NEO for the current year; and
•to approve our incentive compensation program for the current year and establish target incentive compensation amounts for the current calendar year for each of the NEOs.
As part of this review, our CEO gives the Compensation Committee a recommendation for incentive compensation payouts for the prior year, salary adjustments for the current year, and target incentive compensation amounts for the current year for each of the other NEOs. These recommendations are developed using our market-based job architecture for all employees to ensure appropriate levels of pay at each employee classification across the Company. Our CEO uses the market-based job architecture and evaluation of each individual NEO’s contribution to strategic objectives to guide his compensation recommendations to the Compensation Committee. The Compensation Committee reviews those recommendations and modifies them to the extent it considers appropriate. As part of this process, the Compensation Committee approves the payout amount of any annual incentive compensation to be awarded to each individual with respect to the preceding calendar year, approves the amount of any adjustments to be made to the annual salary of each such individual for the current year, approves the terms of our incentive compensation program for the current calendar year, and establishes target incentive bonus and equity awards for the current year for each of our NEOs and each of the other individuals whose compensation it oversees. The Compensation Committee may also approve adjustments to compensation for specific individuals at other times during any year when there are significant changes in the responsibilities of such individuals or under other circumstances that the Compensation Committee considers appropriate.
Our CEO’s compensation is determined under similar principles but follows a different process designed to comply with applicable law and stock exchange listing requirements. After discussing the CEO’s self-evaluation with him and receiving the views of other independent directors, the Compensation Committee evaluates his performance and reviews that evaluation with him. Based on that evaluation and review, in conjunction with consideration of the Company’s performance (including stockholder returns) and competitive market data specific to our peer group as compiled by Meridian, the Compensation Committee determines his compensation and personal annual objectives for the coming calendar year. Our CEO is excused from meetings of the Compensation Committee and the independent members of the Board during voting or deliberations regarding his compensation.
While Meridian advised the Compensation Committee on the form and amount of compensation, the Compensation Committee (or the Board, in the case of the CEO) made all decisions regarding the compensation of our NEOs.
Elements of Executive Compensation
Our executive compensation program is designed to focus executive behavior on achievement of both our short- and long-term objectives and strategy to encourage the creation of sustainable, long-term value. We provide a mix of compensation elements that support our goals of attracting and retaining top executive talent and incentivizing key performance objectives for both the short and long term. The elements of executive compensation are designed to drive behavior that supports sustained stockholder return and pay-for-performance outcomes over time. To that end, our executive compensation program consists of the following principal elements:
•annual base salaries;
•when earned, incentive awards under our Annual Bonus Program; and
•when earned, long-term equity compensation under our 2015 Incentive Plan.
Initial base salary and target annual bonus award levels and initial equity awards for new executives are negotiated with the individual during the search process and include consideration of prior compensation history, outstanding incentive awards that the new executive must abandon in order to join the Company, and benchmarking information and recommendations provided by the independent compensation consultant. Annual bonus compensation levels are standardized by title to promote internal parity.
In reviewing annual base salaries, target annual bonus awards, and annual long-term equity compensation targets, the Compensation Committee reviews each executive’s compensation history with the Company (including prior equity awards or grants), benchmarking information and recommendations provided by the independent compensation consultant, and internal parity. The Compensation Committee is guided by its own judgment and those sources of information (including, when deemed appropriate, compensation surveys) that the Compensation Committee considers relevant and the recommendations of its independent compensation consultant.
The Compensation Committee believes that the prudent use of judgement in determining compensation will generally be in our best interests and those of our stockholders. Accordingly, the Compensation Committee does not rely exclusively upon fixed formulas, and, from time to time in exercising its judgement, the Compensation Committee may approve changes in compensation that it considers to be appropriate to reward performance or otherwise to provide incentives toward achieving our objectives.
The Compensation Committee seeks to strike a balance that it considers to be appropriate in its discretion between fixed elements of compensation, such as base salaries, and variable performance-based elements represented by annual bonus awards and long-term equity compensation. As a general matter, the Compensation Committee believes that our NEOs should have at least one-third of their annual cash compensation opportunity at risk under variable performance-based elements of our incentive compensation program, including our Annual Bonus Program.
The charts below illustrate the relative weighting of our NEO compensation components at target in 2023. Dr. Graves’ compensation is displayed for “Components of CEO Compensation,” and the average of our other NEOs (excluding Mr. Creech, whose compensation package did not include all compensation elements for 2023) is displayed for “Components of Other NEO Compensation.”
•Target Annual Bonus represents target opportunities for each NEO under the 2023 Annual Bonus Program. See “2023 Annual Bonus Program” for further details.
•Performance Stock Units represents the grant date fair value of PSUs, which may be earned based on TSR performance over a three-year performance period.
•Restricted Stock Awards represents the grant date fair value of time-based restricted stock, which vests ratably over three years.
•A one-time payment of $70,000 to Mr. Johnson for his service as Interim Chief Financial Officer from October 16, 2023, to December 12, 2023, is excluded.
Base Salaries
Annual base salaries are intended to provide a base level of compensation to executives, including our NEOs, for serving as senior leaders of the Company and are aligned with the level of experience, capabilities, and scope of responsibilities of the executive. We pay annual salaries to provide executives a base level of compensation for services rendered during the year. Base salaries are also designed to help achieve our objectives of attracting and retaining executive talent. Adjustments to base salaries are based on the Company’s market-based job architecture, which takes into consideration the responsibilities of the executives, the Compensation Committee’s evaluation of the market demand for executives with similar capability and experience, and each individual NEO’s progress towards assigned strategic imperatives and concrete personal objectives.
2023 Salaries
The following table shows the 2023 annual base salary amounts for each NEO.
| | | | | | | | | | | | | | | | | | | | |
Name | | 2022 Year-End Base Salary | | 2023 Year-End Base Salary ($) | | Aggregate % Increase |
| Jeffrey A. Graves | | $ | 850,000 | | | $ | 850,000 | | | — | % |
Jeffrey Creech (1) | | n/a | | 425,000 | | | n/a |
| Reji Puthenveetil | | 412,000 | | | 412,000 | | | — | % |
| Menno Ellis | | 412,000 | | | 412,000 | | | — | % |
| Phyllis Nordstrom | | 371,000 | | | 450,000 | | | 21.3 | % |
| Andrew M. Johnson | | 400,000 | | | 400,000 | | | — | % |
Michael Turner (2) | | 450,000 | | | n/a | | n/a |
(1) Mr. Creech was appointed as the Company’s Executive Vice President and Chief Financial Officer on December 13, 2023.
(2) Mr. Turner resigned from the Company effective October 15, 2023.
The Compensation Committee maintained 2023 base salaries for all NEOs at the same levels in effect at the end of 2022, excepting Ms. Nordstrom, who received an increase in connection with the expansion of her responsibilities upon appointment as Chief People Officer and Chief Administrative Officer in December 2022.
Annual Bonus Program
Our Annual Bonus Program is designed to motivate our executives, including our NEOs, to achieve defined financial performance targets and, for NEOs other than Dr. Graves, individual achievement of strategic goals that are designed to position the Company as an industry leader. Both the defined financial performance targets and individual strategic goals are measured and evaluated on an annual basis.
This program is adopted annually and designed with our strategic objectives in mind. Under the Annual Bonus Program for Dr. Graves, 100% of our plan payouts are tied to the achievement of pre-determined corporate financial objectives established during the Company’s annual financial planning process. For other NEOs, 80% of our plan payouts are tied to the achievement of these same pre-determined corporate financial objectives while 20% are tied to the achievement of individual strategic goals established by Dr. Graves. The 20% weighting to the achievement of individual strategic goals is a new feature added in 2023.
Annual bonus awards are not guaranteed and are not awarded unless the pre-determined corporate financial objectives are achieved at pre-defined levels. Even if the pre-determined corporate financial objectives are achieved, our Compensation Committee retains discretion to reduce the funding of the Company-wide Annual Bonus Program pool or any individual participant’s award. This pay-for-performance plan aligns executive performance with the Company’s annual financial performance.
As an overriding condition, a failure to perform in accordance with our Code of Conduct or Code of Ethics may serve as a basis for a participant in this program not to receive a bonus payout. We consider this aspect of our Annual Bonus Program to be consistent with sound principles of corporate governance.
As part of its goal-setting process, the Compensation Committee establishes current-year target incentive awards for each NEO with the following principles in mind:
•Targets are used to determine the amount of any annual bonus that our NEOs can expect to receive if we achieve our financial objectives and they achieve their individual strategic goals, as applicable, for the year in question. In setting these target bonus awards, the Compensation Committee considers each NEO’s level of responsibility, competitive market data and the recommendations of our CEO.
•Target bonus awards are set at levels that are designed to link a substantial portion of each NEO’s total annual compensation opportunity to attaining the corporate objectives and individual strategic goals. Although generally higher, the Compensation Committee aims for at least one-third of each NEO’s annual cash compensation opportunity to be at risk. See “Grants of Plan-Based Awards in 2023” for a summary of target bonus awards for the NEOs applicable to 2023.
•No minimum incentive awards are guaranteed to NEOs. The pool for the annual incentive plan is not funded unless the Company achieves certain pre-determined financial objectives.
•Base target amounts represent the bonus awards that could be awarded assuming achievement of 100% of the pre-determined financial objectives and, as applicable, individual strategic goals.
•Maximum amounts represent the maximum amount that may generally be awarded to each NEO under the program for the year in question. Our maximum annual incentive awards were equal to 150% of the target annual bonus awards for each of our NEOs during 2023.
Financial objectives are determined based upon our annual business plan for the year. This business plan is developed by management and approved by the Board of Directors. The Compensation Committee maintains the ability to adjust performance objectives for extraordinary items and other items as it deems appropriate based on pre-approved guidelines the Compensation Committee has set regarding the potential impact to performance objectives due to extraordinary transactions.
With respect to financial measures, 100% of each NEO’s bonus related to each financial measure would generally be deemed to have been earned if the target for that financial measure is fully achieved.
Due to his December 2023 hire date, Mr. Creech did not participate in the Annual Bonus Program for 2023.
2023 Annual Bonus Program
Consistent with the compensation philosophy, in February 2023, the Compensation Committee approved an annual bonus program for 2023 (the “2023 Annual Bonus Program”). The 2023 target bonus awards for each NEO were set at 60% of his or her 2023 base salaries, except for Dr. Graves, whose 2023 target incentive award was set at 100% of his 2023 base salary. The 2023 threshold and maximum annual bonus award for all NEOs were set at 50% and 150%, respectively, of the target annual bonus award.
The Compensation Committee approved the following performance objectives, selected to reflect the Company’s focus on top-line revenue growth and alignment with investor focus and strategic business plan priorities, for the funding of the 2023 Annual Bonus Program:
•40% of the funding of the 2023 Annual Bonus Program (50% for Dr. Graves) was based on actual achievement relative to our annual revenue budget;
•40% of the funding of the 2023 Annual Bonus Program (50% for Dr. Graves) was based on actual achievement relative to our annual budgeted level of adjusted EBITDA; and
•20% of the funding of the 2023 Annual Bonus Program (0% for Dr. Graves) was based on actual achievement relative to individual strategic goals.
Adjusted EBITDA is a non-GAAP measure defined as net income, plus income tax (provision)/benefit, interest and other income/(expense), net, stock-based compensation expense, amortization of intangibles, depreciation expense and other non-recurring and/or non-cash items.
Revenue and adjusted EBITDA objectives are independent of each other and could be earned irrespective of achievement of the other objective. The Compensation Committee established threshold, target and maximum performance goals for each of these financial measures under the 2023 Annual Bonus Program in February 2023. Our target performance for each of these financial measures for 2023 were consistent with the Company’s consolidated budget approved by the Board. The table below sets forth the specific financial performance goals and related payout factors established by the Compensation Committee under the 2023 Annual Bonus Program.
| | | | | | | | | | | | | | |
| Performance Goals for 2023(1) | Payout Factor (% of Target Bonus)(2) |
| Achievement Levels | Revenue ($) | Adjusted EBITDA ($) | CEO | Other NEOs |
| Maximum | ≥ 617.0 | ≥ 8.6 | 150% | 150% x 80% weighting = 120% |
| Target | 560.9 | 4.3 | 100% | 100% x 80% weighting = 80% |
| Threshold | 504.8 | 0 | 50% | 50% x 80% weighting = 40% |
| Below Threshold | < 504.8 | < 0.0 | —% | 0% x 80% weighting = 0% |
(1) All performance goals are expressed in millions.
(2) Payouts for performance between the stated achievement are calculated using linear interpolation.
For 2023 individual strategic goals specific to each NEO other than Dr. Graves, there were only three possible payout options. The table below sets the payout factors approved by the Compensation Committee under the 2023 Annual Bonus Program.
| | | | | |
| Achievement Levels Relative to Individual Strategic Goals | Payout Factor (% of Target Bonus) |
| Exceeds | 150% x 20% weighting = 30% |
| Meets | 100% x 20% weighting = 20% |
| Inconsistent | 25% x 20% weighting = 5% |
| Below Inconsistent | 0% x 20% weighting = 0% |
No payout is possible relative to individual strategic goals if there is no payout for financial performance goals.
Our performance under the 2023 Annual Bonus Program fell below threshold for both revenue and adjusted EBITDA. Therefore, the Compensation Committee determined no payout should be made to any NEO under the 2023 Annual Bonus Program irrespective of achievement by an NEO of his or her individual strategic goals.
| | | | | | | | | | | | | | | | | | | | |
| Performance Goal | Performance Achieved ($) | Payout Factor | Weighting | Payout Earned (% of Target Bonus) |
| | | CEO | Other NEOs | CEO | Other NEOs |
| Revenue | 488.1 million | — | % | 50 | % | 40 | % | — | % | — | % |
| Adjusted EBITDA | <0.0 | — | % | 50 | % | 40 | % | — | % | — | % |
| Individual Strategic Goals | Irrelevant due to Below Threshold Financial Achievement | — | % | — | % | 20 | % | — | % | — | % |
| Total | | | | | — | % | — | % |
Long-Term Equity Compensation
Our long-term equity compensation program is designed to attract, retain and motivate our executives, including our NEOs, and to align their interests with those of our stockholders and the Company’s long-term strategic objectives. Our equity program is a key component in our strategy to hire and retain top talent in a highly competitive environment.
The Compensation Committee administers our 2015 Incentive Plan. Under that plan, the Compensation Committee is authorized to grant restricted stock awards, restricted stock units (“RSUs”), stock options, stock appreciation rights and other awards that are provided for under the 2015 Incentive Plan to our employees and the employees of our subsidiaries as the Compensation Committee determines to be eligible for awards. Awards granted to a participant are based upon a number of factors, including the recipient’s position, salary and performance, as well as our overall corporate performance.
The 2015 Incentive Plan is intended to provide an effective method of motivating performance from key employees, including our NEOs, and for creating an alignment of interests in participants with the interests of our stockholders. Awards are made under the 2015 Incentive Plan as long-term incentive compensation to NEOs and other key employees when the Compensation Committee believes such awards are appropriate. The Compensation Committee makes awards both to reward performance and to motivate the recipient’s long-term performance. In order to continue providing meaningful long-term incentives to NEOs and employees, we routinely look to replenish shares available under the 2015 Incentive Plan.
Long-Term Incentive Compensation Program
The Compensation Committee divides long-term equity grants for executives equally between restricted stock awards with time-based vesting conditions and PSUs. Time based awards are used to drive retention of executive talent, while PSUs drive alignment of executive realized compensation with long-term stockholder value. The PSUs typically are granted in the first quarter of the performance year upon completion of the budgeting process to support the selection of appropriate performance targets. Historically, PSU awards can only be earned by the NEOs upon our achievement of pre-determined levels of financial performance.
In determining 2023 LTI target award amounts, the Compensation Committee considered corporate performance, competitive market data for each individual, the level of the individual’s responsibility, prior compensation and retentive impact of that prior compensation and individual contributions to the Company.
The values below are the target long-term equity compensation amounts approved by the Compensation Committee for each of our NEOs, which are then converted into a number of shares of a combination of restricted stock and target PSUs using an approved formula based on stock price. For the accounting grant date fair value of such awards, see the “Summary Compensation Table” below.
| | | | | | | | | | | | | | | | | | | | |
| | | | Awards in Shares |
| Name | | 2023 LTI Award at Target(1) | | Performance Stock Units (50% weighting) ($10.28 conversion price(2)) | | Restricted Stock Awards (50% weighting) ($10.04 conversion price(3)) |
| Jeffrey A. Graves | | $ | 3,800,000 | | | $ | 184,824 | | | $ | 189,243 | |
| Jeffrey Creech | | — | | | — | | | — | |
| Reji Puthenveetil | | 1,350,000 | | | 65,661 | | | 67,231 | |
| Menno Ellis | | 1,350,000 | | | 65,661 | | | 67,231 | |
| Phyllis Nordstrom | | 1,000,000 | | | 48,638 | | | 49,800 | |
| Andrew Johnson | | 1,000,000 | | | 48,638 | | | 49,800 | |
| Michael Turner | | 1,500,000 | | | 72,957 | | | 74,701 | |
(1) See “2023 Long-Term Incentive Awards” for further details on these 2023 LTI awards.
(2) Conversion price of $10.28 represents the average closing price of our Common Stock for the 60 trading days ending March 31, 2023. The 2023 LTI awards had different calculation periods in order to facilitate the measurement of the PSUs to end at a quarter end on March 31, 2026.
(3) Conversion price of $10.04 represents the average closing price of our Common Stock for the 20 trading days ending April 13, 2023.
Mr. Turner forfeited all outstanding unvested equity awards, including restricted stock and PSUs, upon his resignation in October 2023.
Mr. Creech did not receive a 2023 LTI award but under the terms of his employment agreement on December 13, 2023, was awarded 94,696 shares of time-based restricted stock, with the size of the award calculated using a numerator equal to $500,000 and a denominator equal to the 20-trading day trailing average closing price of the Company’s Common Stock ended on December 12, 2023, or $5.28.
Mr. Johnson forfeited all outstanding unvested equity awards, including restricted stock and PSUs, upon his resignation on April 30, 2024. Upon Mr. Ellis’s separation from the Company on April 30, 2024, Mr. Ellis forfeited all outstanding unvested equity awards, including restricted stock and PSUs.
Long-Term Equity Features
Restricted stock awards and PSU awards issued pursuant to the 2015 Incentive Plan remain subject to forfeiture until the vesting of such shares pursuant to the terms of the applicable award.
Shares of restricted stock and PSUs issued pursuant to the 2015 Incentive Plan may not be sold, transferred, or encumbered by the employee before they vest or are earned, as applicable. The compensation associated with these awards is expensed over the vesting period. The shares covered by restricted stock awards are considered outstanding upon issuance following the acceptance of each award for the purpose of calculating diluted earnings per common share, and holders of shares issued pursuant to restricted stock awards are entitled to vote such shares and to receive any dividends declared in respect of our Common Stock upon vesting of the award shares. Shares covered by PSUs are not considered outstanding until vested except for the purpose of calculating diluted earnings per common share. The holders of PSUs are not entitled to vote shares or receive any dividends declared with respect to the shares covered by such awards.
2023 Long-Term Incentive Awards
In February 2023, the Compensation Committee made LTI awards of restricted stock and PSUs under the 2015 Incentive Plan to executives, including the NEOs, to reflect the contributions that those individuals have made to our operations and financial condition, to provide motivation toward achieving our future strategic objectives and to further align the interests of those individuals with our stockholders. Restricted stock awards vest ratably over three years on each anniversary of the date of grant, subject to continued employment. The PSUs only vest if both performance and service-based criteria are met.
The Compensation Committee approved the use of relative total stockholder return (“TSR”) as the performance objective for the 2023 PSUs awarded to our NEOs. This market-based measure reflects the desire to focus executives on the execution of the Company’s long-term strategic objective of increasing stockholder value. TSR will be assessed relative to the Total 3D Printing Index published by Solactive (Bloomberg Ticker: 3DPRNT Index) (“3DPRNT”). The Company’s TSR will be calculated by subtracting the beginning stock price of $10.28 (i.e., the average closing price of the Company’s Common Stock over the 60 trading days ending March 31, 2023) from the ending stock price (i.e., the average closing price of the Company’s Common Stock over the 60 trading days ending on March 31, 2026), adding any dividends paid during the period for the performance period from April 1, 2023 through March 31, 2026, and then dividing the result by the Company’s beginning stock price. Similarly, 3DPRNT’s TSR will be calculated by subtracting the 3DPRNT beginning stock price of $109.22 (i.e., the average closing price of 3DPRNT’s stock price over the 60 trading days immediately prior to April 1, 2023, as reported in U.S. dollars on Bloomberg) from the 3DPRNT ending stock price (i.e., the average closing price of 3DPRNT’s stock price over the 60 trading days ending on March 31, 2026, as reported in U.S. dollars on Bloomberg) for the performance period of April 1, 2023 to March 31, 2026, adding any dividends during the period, and then dividing the result by the 3DPRNT beginning stock price. The target PSUs will be adjusted for performance between 0% and 250% based on the comparison of the TSR of the Company relative to the TSR of 3DPRNT during the performance period as follows:
| | | | | | | | | | | |
| Achievement | Company TSR –3DPRNT TSR = | Example: if Company TSR is 50%, 3DPRNT TSR Must be… | Performance Adjusting |
| Below Threshold | More than 25 Percentage Points below 0 OR Company TSR is negative | More than 75% | —% |
| Threshold | 25 Percentage Points Below 0 | 75% | 50% |
| Target | 0 Percentage Points | 50% | 100% |
| Midpoint of Target and Maximum | 50 Percentage Points | —% | 200% |
| Maximum | 100 Percentage Points | (50)% | 250% |
At the end of the performance period, if the performance-based criteria are met, all PSUs earned will convert into immediately vested stock.
In April 2026, the Compensation Committee will certify performance under the 2023 PSUs and determine, within a range of 0-250% of target, the number of shares earned.
Employment Agreements and Other Agreements with NEOs
The Company entered into employment agreements with each of our NEOs. Each of these agreements was determined based on negotiations with the applicable NEO and took into account his or her background and qualifications and the nature of his or her position. We believe that these compensation packages are appropriate in light of the intense competition for top executives in our industry and among similarly situated companies, and that the terms of these arrangements are consistent with our executive compensation goals, including the balancing of short-term and long-term compensation to properly motivate our NEOs.
Our employment agreements with each of Dr. Graves, Messrs. Creech, Puthenveetil, Ellis, Johnson and Turner and Ms. Nordstrom provide for an initial two-year employment term that automatically extends for additional one-year periods unless terminated by the NEO or us upon at least 30 days’ prior written notice of intention not to renew. The agreements may also be terminated by us or the NEO for other reasons and, subject to the conditions set forth in the employment agreements, provide for certain payments and benefits in connection with certain termination events or a change of control as described under “Potential Benefits upon Termination or Change of Control” below.
Dr. Jeffrey A. Graves
Dr. Graves’ employment agreement provides for a minimum base annual salary of $825,000 and a target bonus opportunity equal to 100% of his base salary, with the exact amount of any such bonus to be based upon the achievement of performance goals to be determined by the Compensation Committee. The employment agreement entitles Dr. Graves to participate in all other benefits generally available to our other executive employees, including participation in the Company’s health benefit plans and equity award programs. Pursuant to Dr. Graves’ employment agreement he was granted the following initial equity awards:
•a restricted stock award for shares of Common Stock with a value of $2,000,000 that vested 20%, 40%, and 40% on December 31, 2020, December 31, 2021, and December 31, 2023, respectively, and
•a long-term equity grant with a value of $2,500,00 equally divided between a time-based restricted stock award that vested in three equal annual installments on each of the first, second, and third anniversaries of May 26, 2020, the date of grant, and a PSU award, which may be earned during the three-year period ending on May 26, 2023 based on the achievement at threshold (25%), target (50%), and maximum (75%) TSR, which would earn 50%, 100%, and 150% of the PSU, respectively, subject to his continued employment.
Dr. Graves’ employment agreement automatically extended for an additional one-year period in May 2023.
Jeffrey Creech
Mr. Creech’s employment agreement provides for a minimum base annual salary of $425,000 and a target bonus opportunity of not less than 60% of his base salary, with the exact amount of any such bonus to be based upon the achievement of performance goals to be determined by the Compensation Committee. The employment agreement entitles Mr. Creech to participate in all other benefits generally available to our other executive employees, including participation in the Company’s health benefit plans and equity award programs. Pursuant to Mr. Creech’s employment agreement he was granted the following equity award:
•a time-based restricted stock award for shares of Common Stock with a value of $500,000 that is scheduled to vest in three equal annual installments on each of the first, second and third anniversaries of December 13, 2023, the date of grant, subject to his continued employment.
Reji Puthenveetil
Mr. Puthenveetil’s employment agreement provides for a minimum base annual salary of $400,000 and a target bonus opportunity of not less than 50% of his base salary, with the exact amount of any such bonus to be based upon the achievement of performance goals to be determined by the Compensation Committee. The employment agreement entitles Mr. Puthenveetil to participate in all other benefits generally available to our other executive employees, including participation in the Company’s health benefit plans and equity award programs. Pursuant to Mr. Puthenveetil’s employment agreement he was granted the following initial equity awards:
•a long-term equity grant with a value of $1,000,00 equally divided between a time-based restricted stock award, that vests in three equal annual installments on each of the first, second and third anniversaries of October 1, 2020, and a PSU award, which may be earned during the three-year period ending on October 1, 2023 based on the achievement at threshold (25%), target (50%), and maximum (75%) TSR, which would earn 50%, 100%, and 150% of the PSU, respectively, and
•a 2021 long-term equity award for shares of Common Stock with a value equal to $1,000,000, equally divided between time-based restricted stock and PSU, issued pursuant to the service and performance criteria set by the Compensation Committee as part of its 2021 executive compensation program.
Mr. Puthenveetil’s employment agreement automatically extended for an additional one-year period in October 2023.
Menno Ellis
Mr. Ellis’ employment agreement provides for a minimum base annual salary of $330,000. Mr. Ellis is also entitled to receive cash performance bonuses, with the exact amount of any such bonus to be based upon the achievement of performance goals to be determined by the Compensation Committee. The employment agreement entitles Mr. Ellis to participate in all other benefits generally available to our other executive employees, including participation in the Company’s health benefit plans and equity award programs. His agreement also provides that his primary work location will be his home office in Dallas, Texas.
Mr. Ellis’ employment agreement automatically extended for an additional one-year period in November 2023.
Mr. Ellis’s role and position within the Company were eliminated, effective April 30, 2024. In connection with his departure
Mr. Ellis received (i) a severance payment in the amount of $412,000, and (ii) Company-paid monthly premium payments for COBRA health and dental insurance coverage such that Mr. Ellis’ contributions to such plans remain the same as if he were employed by the Company until the earlier of (1) 12 months following his separation date and (2) the date Mr. Ellis is no longer eligible for COBRA coverage. Mr. Ellis forfeited all outstanding unvested equity awards, including restricted stock and PSUs, upon his separation. Mr. Ellis continues to provide executive transition consulting services to the Company at the rate of $375 per hour (plus expenses) under a Consulting Agreement dated May 1, 2024 with The Kaminda Group, an entity controlled by Mr. Ellis.
Phyllis Nordstrom
Ms. Nordstrom’s employment agreement provides for a minimum base annual salary of $350,000 and a target bonus opportunity of not less than 60% of her base salary, with the exact amount of any such bonus to be based upon the achievement of performance goals to be determined by the Compensation Committee. The employment agreement entitles Ms. Nordstrom to participate in all other benefits generally available to our other executive employees, including participation in the Company’s health benefit plans and equity award programs. Pursuant to Ms. Nordstrom’s employment agreement she was granted the following equity awards:
•a time-based restricted stock award for shares of Common Stock with a value of $500,000 that vests in three equal annual installments on each of the first, second and third anniversaries of August 30, 2021, the date of grant, subject to her continued employment; and
•a time-based restricted stock award for shares of Common Stock with a value of $100,000 which vested and became exercisable in full on the first anniversary of August 30, 2021, the date of grant.
Ms. Nordstrom’s employment agreement provides for the guarantee of Ms. Nordstrom’s 2021 Performance Bonus at its target amount and pro-rated based on the Effective Date. It also provides that the Company shall provide or reimburse Ms. Nordstrom for certain expenses relating to her relocation to the Charlotte, North Carolina metro area, in accordance with Company’s US Domestic Relocation Policy and consistent with the Company’s relocation benefits for executives.
Ms. Nordstrom’s employment agreement automatically extended for a one-year period in August 2023.
Andrew M. Johnson
Mr. Johnson’s employment agreement provides for a minimum base annual salary of $333,000. Mr. Johnson is also entitled to receive cash performance bonuses, with the exact amount of any such bonus to be based upon the achievement of performance goals to be determined by the Compensation Committee. The employment agreement entitles Mr. Johnson to participate in all other benefits generally available to our other executive employees, including participation in the Company’s health benefit plans and equity award programs.
Mr. Johnson’s employment agreement automatically extended for an additional one-year period in June 2023.
Mr. Johnson resigned from his role and position within the Company, effective April 30, 2024. In connection with this resignation, Mr. Johnson received (i) a severance amount equal to $400,000, paid in 12 monthly installments following his separation date, (ii) Company-paid monthly premium payments for COBRA health and dental insurance coverage such that Mr. Johnson’s contributions to such plans remain the same as if he were employed by the Company until the earlier of (1) 12 months following the Separation Date and (2) the date Mr. Johnson is no longer eligible for COBRA coverage, and (iii) a one-time $300,000 cash retention bonus. Mr. Johnson forfeited all outstanding unvested equity awards, including restricted stock and PSUs, upon his resignation on April 30, 2024. Mr. Johnson continues to provide executive transition consulting services to the Company at the rate of $250 per hour (plus expenses) under a Consulting Agreement dated May 1, 2024.
Michael Turner
Mr. Turner’s employment agreement provided for a minimum base annual salary of $450,000 and a target bonus opportunity of not less than 60% of his base salary, with the exact amount of any such bonus to be based upon the achievement of performance goals to be determined by the Compensation Committee. The employment agreement entitled Mr. Turner to participate in all other benefits generally available to our other executive employees, including participation in the Company’s health benefit plans and equity award programs. Pursuant to Mr. Turner’s employment agreement he was granted the following equity awards:
•a signing bonus of $225,000, provided that he was not terminated for cause within the first 24 months of his employment with the Company, and
•a time-based restricted stock award for shares of Common Stock with a value of $1,500,000 that scheduled to vest in three equal annual installments on each of the first, second and third anniversaries of August 29, 2023, the date of grant, subject to his continued employment.
On September 18, 2023, Mr. Turner notified the Company of his resignation as Executive Vice President and Chief Financial Officer of the Company, effective October 15, 2023. In connection with his departure, Mr. Turner forfeited his participation in the fiscal 2023 Annual Bonus Program and all outstanding unvested equity awards, including restricted stock and PSU. Mr. Turner retained his signing bonus on his departure as consideration for ongoing consulting services to the Company.
Change of Control Severance Policy
On February 22, 2018, the Compensation Committee adopted the Company’s Change of Control Severance Policy (the “COC Severance Policy”). The COC Severance Policy is intended to provide eligible officers with reasonable financial security in their employment and position with the Company without distraction from uncertainties regarding their employment created by the possibility of a potential or actual change of control. The COC Severance Policy applies to our CEO and all Executive Vice Presidents and Senior Vice Presidents, which includes all our NEOs. For a more detailed discussion of the benefits payable to our NEOs under the COC Severance Policy, see “Potential Benefits upon Termination or Change of Control” below.
Other Compensation Matters
Benefits and Perquisites
We provide our employees, including the NEOs, with a benefit program that we believe is reasonable, competitive, and consistent with the objectives of our compensation program. As a matter of policy, the Compensation Committee does not award personal benefits or perquisites to our NEOs that are unrelated to our business and strives to mitigate the use of non-performance-based forms of compensation. However, under certain circumstances, the Compensation Committee has approved certain personal benefits or perquisites that are either provided to a NEO by contract or that it deemed to be in our interests to induce executives to commence or maintain employment with us. Those amounts are reported in the “Summary Compensation Table” below.
Our executives, including the NEOs, are eligible to participate in employee benefit programs that we provide to our employees generally, which include a group insurance program providing group health, dental, vision, life and long-term disability insurance. Other benefits include a Section 401(k) plan, health savings accounts, flexible spending accounts for health and dependent care expenses, sick leave, holiday time, and vacation time. Our NEOs are eligible for a comprehensive annual executive physical, a benefit that is capped at $5,000 annually.
We also reimburse certain commuting expenses for executives. For Mr. Puthenveetil, these commuting expenses included rent reimbursement for temporary housing in Rock Hill, South Carolina, certain past mileage expenses and a tax gross-up for federal, state and other income taxes resulting from imputed income relating to these commuting expenses.
For Ms. Nordstrom, these commuting expenses included airfare between Minneapolis, Minnesota and Charlotte, North Carolina, lodging, and car rental charges and a tax-gross up for federal, state and other income taxes resulting from imputed income related to these commuting expenses.
We also maintain an employee relocation policy, offering different tiers of benefits based on job level, for employees who are requested to relocate their primary residence in connection with their employment. For a further discussion, see Note 5 to the “Summary Compensation Table” below. Relocation assistance is necessary to induce executives to join the Company.
We believe the cost of providing perquisites in 2023 was reasonable and represents a relatively small percentage of each NEO’s overall compensation package.
Executive Stock Ownership Guidelines
Our executive officers and certain other senior members of management are required to maintain a minimum equity stake in the Company. This policy reflects the Board’s belief that our most senior executives should maintain a significant personal financial stake in the Company to promote long-term stockholder value. In addition, the policy helps align executive and stockholder interests, which reduces the incentive for excessive short-term risk taking. Each of our NEOs and certain other senior officers are required to acquire and maintain ownership of shares of our Common Stock equal to a specified multiple of his or her base salary, as shown in the table below. Each officer subject to a share ownership requirement must retain 50% of all net shares (post-tax) that vest until achieving his or her minimum share ownership requirement.
| | | | | |
| Title | Minimum Stock Ownership Requirement |
| Chief Executive Officer | 6x annual base salary |
| Chief Financial Officer | 3x annual base salary |
| Other Executive Officers (EVPs) | 2x annual base salary |
| Other Senior Officers (SVPs) | 1x annual base salary |
Shares owned for the purposes of determining compliance with our stock ownership policy are defined as shares of Common Stock held outright (by the executive or his/her spouse), restricted stock units, restricted stock awards, and shares or share equivalents held in a Company savings plan or deferred compensation plan. Stock options, stock appreciation rights, and PSUs are excluded from the definition of shares owned.
All NEOs currently comply with their respective ownership requirements or are retaining 50% of all net shares (post-tax) that vest until achieving their minimum share ownership requirement. Our NEOs are expected to achieve the required stock-ownership levels within five years from the time they are appointed to or promoted to an executive position of Senior Vice President or higher.
Policy on Hedging and Transactions
Our Policy Statement Governing Insider Trading (the “Insider Trading Policy”) prohibits any director, officer, employee, or consultant of the Company or any of its subsidiaries or affiliates from engaging in short-term or speculative transactions in our securities. This policy includes within its coverage short sales, which for directors and executive officers of the Company are prohibited by Section 16 of the Exchange Act. It also prohibits transactions in publicly traded options, such as puts, calls, and other derivative securities, or purchase financial investments (including prepaid variable forward contracts, equity sweeps, collars, and exchange funds), or the engagement in transactions that hedge or offset, or are designed to hedge or offset, any decrease in the market value of our Common Stock.
The Insider Trading Policy also prohibits any director or executive officer from holding Company securities in a margin account or pledging (or hypothecating) Company securities as collateral for a loan.
The Insider Trading Policy requires that our directors and executive officers pre-clear any transactions in our securities with our Chief Legal Officer or Assistant General Counsel.
Clawbacks of Incentive Compensation
Each of our NEOs is subject to our clawback policy. In response to the SEC’s adoption of final clawback rules and the NYSE’s publication of corresponding listing standards, the Board recently amended and restated our clawback policy to comply with final stock exchange listing standards, effective October 2, 2023.
Under the terms of this policy, following an accounting restatement of the Company’s financial statements, due to material noncompliance with any financial reporting requirement under securities laws, the Board or an appropriate Board committee must clawback any “excess compensation” received by an executive officer (current or former) during the applicable look-back period regardless of whether the executive officer engaged in misconduct or was otherwise directly or indirectly responsible for the accounting restatement. The Company will not indemnify any executive officer against the loss of any excess compensation as a result of the application of the clawback policy.
The Company will disclose publicly recoupment of any excessive compensation pursuant to this policy.
Risk Assessment of Compensation Policies and Practices
Our Compensation Committee has reviewed our incentive compensation programs, discussed the concept of risk
as it relates to our compensation program, considered various mitigating factors, and reviewed these items with its independent consultant, Meridian Compensation Partners, LLC (“Meridian”). In addition, our Compensation Committee asked Meridian to conduct an independent risk assessment of our executive compensation program. Based on these reviews and discussions, the Compensation Committee does not believe our compensation program creates risks that are reasonably likely to have a material adverse effect on our business.
Compensation Committee Report
The Compensation Committee has reviewed and discussed with management the section titled “Compensation Discussion and Analysis” found in this Item 11. Based on such review and discussion, the Compensation Committee has recommended to the Board of Directors that such section be included in this Form 10-K.
Compensation Committee:
Kevin S. Moore, Chair
Malissia Clinton
William E. Curran
Thomas Erickson
Jim D. Kever
Compensation Committee Interlocks and Insider Participation
None of our current executive officers served during 2023 as a director of any entity with which any of our outside directors is associated or whose executive officers served as one of our directors, and none of the members of the Compensation Committee has been an officer or employee of the Company or any of our subsidiaries.
Compensation Tables and Narratives
Summary Compensation Table
The following table presents information regarding the compensation of each of the NEOs for services rendered during 2023, 2022, and 2021
| | | | | | | | | | | | | | | | | | | | | | | | | | |
Name and Principal Position (1) | Year | Salary (2) | Bonus (3) | Stock Awards (4) | Option Awards | Non-Equity Incentive Plan Compensation | All Other Compensation (5) | Total |
| | ($) | ($) | ($) | ($) | ($) | ($) | ($) |
| Jeffrey Graves | 2023 | 849,800 | — | 5,268,229 | — | — | 417,601 | 6,535,630 |
| President and Chief Executive Officer | 2022 | 849,800 | — | 4,765,861 | — | — | 71,501 | 5,687,162 |
| 2021 | 837,400 | — | 6,378,697 | — | 1,274,697 | 83,434 | 8,574,228 |
| | | | | | | | — |
| Jeffrey Creech | 2023 | 13,077 | — | 589,956 | — | — | — | 603,033 |
| Executive Vice President and Chief Financial Officer | | | | | | | | — |
| | | | | | | | — |
| Reji Puthenveetil | 2023 | 412,000 | — | 1,871,604 | — | — | 28,512 | 2,312,116 |
| Executive Vice President - Additive Solutions and Chief Commercial Officer | 2022 | 412,000 | — | 1,693,130 | — | — | 59,643 | 2,164,773 |
| 2021 | 406,000 | — | 2,319,545 | — | 370,792 | 38,687 | 3,135,024 |
| | | | | | | | — |
| Menno Ellis | 2023 | 412,000 | — | 1,871,604 | — | — | 8,469 | 2,292,073 |
Executive Vice President, Health Care Solutions | 2022 | 412,000 | — | 1,693,130 | — | — | 3,191 | 2,108,321 |
| 2021 | 406,000 | — | 2,319,545 | — | 370,792 | 8,400 | 3,104,737 |
| | | | | | | | — |
| Phyllis Nordstrom | 2023 | 428,731 | — | 1,386,371 | — | — | 281,638 | 2,096,740 |
| Executive Vice President, Chief People Officer and Chief Administrative Officer | | | | | | | | — |
| | | | | | | | — |
| Andrew Johnson | 2023 | 470,000 | — | 1,386,371 | — | — | 8,400 | 1,864,771 |
| Executive Vice President, Chief Corporate Development Officer, Chief Legal Counsel, and Interim Chief Financial Officer | 2022 | 396,042 | 100,000 | 1,128,725 | — | — | 8,400 | 1,633,167 |
| 2021 | 379,650 | — | 2,251,252 | — | 346,761 | 8,400 | 2,986,063 |
| | | | | | | | — |
| Michael Turner | 2023 | 363,461 | — | 699,948 | — | — | 4,795 | 1,068,204 |
| Former Executive Vice President and Chief Financial Officer | 2022 | 147,115 | 225,000 | 1,322,155 | — | — | — | 1,694,270 |
(1) This column includes the name and principal position of each NEO during the fiscal year ended December 31, 2023.
(2) The amounts in the salary column represent the salary paid to each NEO with respect to each year during which he or she was a NEO.
(3) No bonuses were awarded to our NEOs in 2023.
(4) The amounts reported in this column for 2023 represent the aggregate grant date fair value computed in accordance with ASC Topic 718 of restricted stock awards and PSU awards. The value of restricted stock awards is determined by multiplying the number of shares awarded by the closing price of our Common Stock on the date of grant. The value of the PSU awards, which have a market-based performance metric and a three-year performance period, was determined using a Monte Carlo simulation technique under the option pricing method assuming target performance. For these PSUs, achievement of the highest level of performance conditions would result in the NEOs receiving 250% of the target amounts. These amounts are: Dr. Graves, $8,737,555; Mr. Puthenveetil, $3,104,124; Mr. Ellis, $3,104,124; Ms. Nordstrom, $2,299,361; Mr. Johnson, $2,299,361; and Mr. Turner, $3,449,042. See “2023 Long-Term Incentive Awards” above.
(5) The amounts shown for 2023 in the “All Other Compensation” column are composed of the following components:
| | | | | | | | | | | | | | | | | | | | | | | | | | | | | | | | |
| Name | | 401K Match | | Relocation Expenses | | Rent and Travel Expenses | | Relocation, Rent and Travel Expenses Tax Gross Up | | Total All Other Compensation |
| Jeffrey Graves | | $ | 8,400 | | | $ | 221,582 | | | $ | — | | | $ | 187,619 | | | $ | 417,601 | |
| Jeffrey Creech | | — | | | — | | | — | | | — | | | — | |
| Reji Puthenveetil | | 4,200 | | | — | | | 18,420 | | | 5,892 | | | 28,512 | |
| Menno Ellis | | 8,469 | | | — | | | — | | | — | | | 8,469 | |
| Phyllis Nordstrom | | 8,400 | | | 150,000 | | | 39,627 | | | 83,611 | | | 281,638 | |
| Andrew Johnson | | 8,400 | | | — | | | — | | | — | | | 8,400 | |
| Michael Turner | | 4,795 | | | — | | | — | | | — | | | 4,795 | |
Mr. Graves relocation expenses relate primarily to reimbursement of commission expenses in connection with selling the home where he lived prior to joining the Company in 2020. Mr. Puthenveetil’s rent expenses relate to the reimbursement of lease payments for an apartment near the Company’s headquarters in Rock Hill, South Carolina. Ms. Nordstrom’s relocation expenses relate to a lump sum payment made in 2023 in connection with Ms. Nordstrom’s planned relocation to the Rock Hill, South Carolina area. In each case, the Company agreed to provide a gross up amount to the executive for tax planning purposes.
Grants of Plan-Based Awards in 2023
The following table sets forth information with respect to plan-based awards granted in 2023. The threshold, target, and maximum amounts represent the incentive awards for the 2023 Annual Bonus Program and the PSUs that could be awarded assuming achievement of the pre-determined performance metric over the three-year performance period (such achievement to be certified by the Compensation Committee subsequent to the completion of the performance period). No annual bonus award payouts were earned by the NEOs with respect to 2023 Annual Bonus Program.
For further details about our employment agreements with our NEOs, see “Employment Agreements and Other Agreements with NEOs.”
| | | | | | | | | | | | | | | | | | | | | | | | | | | | | | | | |
| | | Estimated Future Payouts Under Non-Equity Incentive Plan Awards | Estimated Future Payments Under Equity Incentive Plan Awards (1) | All Other Stock Awards: Number of Shares or Units | Grant Date Fair Value of Stock and Option Awards (2) |
| | | Threshold | Base Target | Maximum | Threshold | Base Target | Maximum |
| Name | Program | Grant Date | ($) | ($) | ($) | (#) | (#) | (#) | (#) | (#) |
| Dr. Jeffrey Graves | 2023 Bonus Program | 2/22/2023 | $ | 425,000 | | $ | 850,000 | | $ | 1,275,000 | | | | | | |
| 2023 LTI RSAs | 4/14/2023 | | | | | | | 189,243 | 1,773,207 |
| 2023 LTI Performance Shares | 4/3/2023 | | | | 92,412 | 184,824 | 462,060 | | 3,495,022 |
| | | | | | | | | | |
| Jeffrey Creech | New Hire Award | 12/13/2023 | | | | | | | 94,696 | 589,956 |
| | | | | | | | | | |
| Reji Puthenveetil | 2023 Bonus Program | 2/22/2023 | 123,600 | 247,200 | 370,800 | | | | | |
| 2023 LTI RSAs | 4/14/2023 | | | | | | | 67,231 | 629,954 |
| 2023 LTI Performance Shares | 4/3/2023 | | | | 32,831 | 65,661 | 164,153 | | 1,241,650 |
| | | | | | | | | | |
| Menno Ellis | 2023 Bonus Program | 2/22/2023 | 123,600 | 247,200 | 370,800 | | | | | |
| 2023 LTI RSAs | 4/14/2023 | | | | | | | 67,231 | 629,954 |
| 2023 LTI Performance Shares | 4/3/2023 | | | | 32,831 | 65,661 | 164,153 | | 1,241,650 |
| | | | | | | | | | |
| Phyllis Nordstrom | 2023 Bonus Program | 2/22/2023 | 135,000 | 270,000 | 405,000 | | | | | |
| 2023 LTI RSAs | 4/14/2023 | | | | | | | 49,800 | 466,626 |
| 2023 LTI Performance Shares | 4/3/2023 | | | | 24,319 | 48,638 | 121,595 | | 919,745 |
| | | | | | | | | | |
| Andrew Johnson | 2023 Bonus Program | 2/22/2023 | 120,000 | 240,000 | 360,000 | | | | | |
| 2023 LTI RSAs | 4/14/2023 | | | | | | | 49,800 | 466,626 |
| 2023 LTI Performance Shares | 4/3/2023 | | | | 24,319 | 48,638 | 121,595 | | 919,745 |
| | | | | | | | | | |
Michael Turner (3) | 2023 Bonus Program | 2/22/2023 | 135,000 | 270,000 | 405,000 | | | | | |
| 2023 LTI RSAs | 4/14/2023 | | | | | | | 74,701 | 699,948 |
| 2023 LTI Performance Shares | 4/3/2023 | | | | 36,479 | 72,957 | 182,393 | | 1,379,617 |
(1) The amounts in these columns represent PSUs that vest in full on or about April 3, 2026, based on achievement of TSR over a three-year performance period.
(2) The amounts included in the “Grant Date Fair Value of Stock and Option Awards” column represent the aggregate grant date fair value computed in accordance with ASC Topic 718.
(3) Mr. Turner resigned from the Company effective October 15, 2023. In connection with his departure, Mr. Turner forfeited his participation in the 2023 Annual Bonus Program and all outstanding unvested equity awards.
Outstanding Equity Awards at Year-End 2023
The following table presents information with respect to equity awards made to each of our NEOs that were outstanding on December 31, 2023.
| | | | | | | | | | | | | | | | | | | | | | | | | | | | | | | | |
| | Option Awards | Stock Awards |
| | Equity Incentive Plan Awards: Number of Securities Underlying Unexercised Unearned Options (1) | Option Exercise Price | Option Expiration Date | Number of Shares or Units of Stock That Have Not Vested | | Market Value of Shares or Units of Stock That Have Not Vested (2) | Equity Incentive Plan Awards: Number of Unearned Shares, Units or Other Rights That Have Not Vested | | Equity Incentive Plan Awards: Market or Payout Value of Unearned Shares, Units or Other Rights That Have Not Vested (2) |
| Name | Grant Date | (#) | ($) | | (#) | | ($) | (#) | | ($) |
| Jeffrey Graves | 1/12/2021 | — | — | — | 35,248 | (3) | 223,825 | — | | — |
| 1/12/2021 | — | — | — | — | | — | 158,622 | (6) | 1,007,250 |
| 3/15/2022 | — | — | — | 76,582 | (4) | 486,296 | — | | — |
| 4/1/2022 | — | — | — | — | | — | 110,144 | (6) | 699,414 |
| 4/3/2023 | — | — | — | | | | 184,824 | (6) | 1,173,632 |
| 4/14/2023 | — | — | — | 189,243 | | 1,201,693 | — | | — |
| | | | | | | | | | |
| Jeffrey Creech | 12/13/2023 | — | — | — | 94,696 | (5) | 601,320 | — | | — |
| | | | | | | | | | |
| Reji Puthenveetil | 1/12/2021 | — | — | — | 12,818 | (3) | 81,394 | — | | — |
| 1/12/2021 | — | — | — | — | | — | 57,681 | (6) | 366,274 |
| 3/15/2022 | — | — | — | 27,206 | (4) | 172,758 | — | | — |
| 4/1/2022 | — | — | — | — | | — | 39,130 | (6) | 248,476 |
| 4/3/2023 | — | — | — | | | | 65,661 | (6) | 416,947 |
| 4/14/2023 | — | — | — | 67,231 | (5) | 426,917 | — | | — |
| | | | | | | | | | |
| Menno Ellis | 12/1/2016 | 100,000 | 13 | 12/1/2026 | — | | — | — | | — |
| 12/1/2016 | — | — | — | — | | — | 20,000 | (7) | 127,000 |
| 1/12/2021 | — | — | — | 12,818 | (3) | 81,394 | — | | — |
| 1/12/2021 | — | — | — | — | | — | 57,681 | (6) | 366,274 |
| 3/15/2022 | — | — | — | 27,206 | (4) | 172,758 | — | | — |
| 4/1/2022 | — | — | — | — | | — | 39,130 | (6) | 248,476 |
| 4/3/2023 | — | — | — | | | | 65,661 | (6) | 416,947 |
| 4/14/2023 | — | — | — | 67,231 | (5) | 426,917 | — | | — |
| | | | | | | | | | |
| Phyllis Nordstrom | 8/30/2021 | — | — | — | 5,685 | (3) | 36,100 | — | | — |
| 3/15/2022 | — | — | — | 15,114 | (3) | 95,974 | — | | — |
| 4/1/2022 | — | — | — | | | | 21,739 | (6) | 138,043 |
| 12/2/2022 | — | — | — | 7,114 | (3) | 45,174 | — | | — |
| 4/3/2023 | — | — | — | | | | 48,638 | (6) | 308,851 |
| | | | | | | | | | | | | | | | | | | | | | | | | | | | | | | | |
| 4/14/2023 | — | — | — | 49,800 | (5) | 316,230 | — | | — |
| | | | | | | | | | |
| Andrew Johnson | 7/26/2016 | 160,000 | 13 | 7/26/2026 | — | | — | — | | — |
| 7/26/2016 | — | — | — | — | | — | 40,000 | (7) | 254,000 |
| 1/12/2021 | — | — | — | 10,894 | (3) | 69,177 | — | | — |
| 1/12/2021 | — | — | — | — | | — | 49,029 | (6) | 311,334 |
| 3/15/2022 | — | — | — | 18,137 | (4) | 115,170 | — | | — |
| 4/1/2022 | — | — | — | — | | — | 26,086 | (6) | 165,646 |
| 4/3/2023 | — | — | — | | | | 48,638 | (6) | 308,851 |
| 4/14/2023 | — | — | — | 49,800 | (5) | 316,230 | — | | — |
| | | | | | | | | | |
| Michael Turner | 8/29/2022 | — | — | — | 85,910 | (4) | 545,529 | — | | — |
| 4/3/2023 | — | — | — | | | | 72,957 | (6) | 463,277 |
| 4/14/2023 | — | — | — | 74,701 | (5) | 474,351 | — | | — |
(1) Option awards in this column vest upon the satisfaction of certain share price performance conditions.
(2) Value calculated based on the $6.35 closing price of our common stock on December 29, 2023.
(3) The outstanding balance of this award vests on the third anniversary of the grant date.
(4) The outstanding balance of this award vests in equal installments on the second and third anniversary of the grant date.
(5) Award vests in equal installments over a three-year period on the first, second and third anniversaries of the grant date.
(6) Amount represents the number of performance-based restricted stock unit awards based on achievement of target performance over a 3-year performance period other than those with January 12, 2021, grant dates, which are shown at maximum, in each case based on performance against the relevant metrics during 2023.
(7) Restricted stock awards that vest upon the satisfaction of certain share price and financial performance conditions.
Option Exercises and Stock Vested in 2023
No options were exercised by our NEOs in 2023. Shares of restricted Common Stock and RSUs held by the NEOs vested as follows during 2023:
| | | | | | | | |
| Number of Shares Acquired on Vesting | Value Realized on Vesting (1) |
| Name | (#) | ($) |
| Jeffrey Graves | 385,331 | | $ | 3,307,565 | |
| Jeffrey Creech | — | | — | |
| Reji Puthenveetil | 196,394 | | 975,941 | |
| Menno Ellis | 39,232 | | 395,646 | |
| Phyllis Nordstrom | 26,381 | | 224,997 | |
| Andrew Johnson | 30,040 | | 307,770 | |
| Michael Turner | 42,955 | | 263,314 | |
(1) Amounts reflect aggregate market value of our Common Stock based on the closing price of our Common Stock on the applicable vesting date.
Potential Benefits Upon Termination or Change in Control
Graves Employment Agreement
Under his employment agreement, Dr. Graves would, upon termination by the Company without “cause” or resignation for “constructive discharge” (in each case as defined in his agreement), become entitled to receive the following:
•An amount equal to 150% of his base salary, payable in 18 equal monthly installments;
•Any accrued but unpaid base salary as of the termination date;
•Any accrued but unused vacation time;
•Any accrued but unpaid performance bonus as of the termination date, on the same terms and at the same times as would have applied had his employment not terminated; and
•If he elects COBRA coverage for health and/or dental insurance, Company-paid monthly premium payments for such coverage such that his contributions to such plans will remain the same as if he was employed by the Company until the earliest of: (1) 18 months from the termination date or (2) the date he is no longer eligible for COBRA coverage.
In the event of termination by the Company without “cause” or resignation for “constructive discharge” within 180 days before or two years after a “change of control” (as defined in his employment agreement), Dr. Graves is entitled to receive a lump sum cash payment equal to: (i) two times the sum of his base salary and target annual bonus, (ii) a pro rata portion of his target annual bonus for the fiscal year in which the termination occurs, (iii) accelerated vesting of the unvested shares under all outstanding time-based equity award and conversion of outstanding PSUs into immediately accelerated restricted stock awards (“RSAs”), and (vi) the difference between the monthly COBRA rate and the active employee premium rate for the applicable group health coverage (i.e., medical, dental and vision) for 24 months.
Creech, Puthenveetil, Ellis, Nordstrom, Johnson and Turner Employment Agreements
Under their employment agreements, Messrs. Creech, Puthenveetil, Ellis, Johnson and Turner and Ms. Nordstrom would, upon termination by the Company without “cause” or resignation for “constructive discharge” (in each case as defined in their respective agreements), become entitled to receive the following:
•An amount equal to the NEO’s base salary, payable in 12 equal monthly installments;
•Any accrued but unpaid base salary as of the termination date;
•Any accrued but unpaid performance bonus as of the termination date, on the same terms and at the same times as would have applied had the NEO’s employment not terminated; and
•If the NEO elects COBRA coverage for health and/or dental insurance, Company-paid monthly premium payments for such coverage such that the NEO’s contributions to such plans will remain the same as if the NEO were employed by the Company until the earliest of: (1) 12 months from the termination date; or (2) the date the NEO is no longer eligible for COBRA coverage.
On September 18, 2023, Mr. Turner notified the Company of his voluntary resignation effective October 15, 2023. In connection with his resignation, Mr. Turner received no special benefits.
Mr. Johnson resigned from his role and position within the Company, effective April 30, 2024. In connection with his resignation, Mr. Johnson received (i) a severance amount equal to $400,000, paid in 12 monthly installments following his separation date, (ii) Company-paid monthly premium payments for COBRA health and dental insurance coverage such that Mr. Johnson’s contributions to such plans remain the same as if he were employed by the Company until the earlier of (1) 12 months following the Separation Date and (2) the date Mr. Johnson is no longer eligible for COBRA coverage, and (iii) a one-time $300,000 cash retention bonus. Mr. Johnson forfeited all outstanding unvested equity awards, including restricted stock and PSUs, upon his resignation on April 30, 2024. Mr. Johnson continues to provide executive transition consulting services to the Company at the rate of $250 per hour (plus expenses) under a Consulting Agreement dated May 1, 2024.
Mr. Ellis’s role and position within the Company were eliminated, effective April 30, 2024. In connection with his departure from the Company, Mr. Ellis received (i) a severance payment in the amount of $412,000, and (ii) Company-paid monthly premium payments for COBRA health and dental insurance coverage such that Mr. Ellis’ contributions to such plans remain the same as if he were employed by the Company until the earlier of (1) 12 months following his separation date and (2) the date Mr. Ellis is no longer eligible for COBRA coverage. Mr. Ellis forfeited all outstanding unvested equity awards, including restricted stock and PSUs, upon his separation. Mr. Ellis continues to provide executive transition consulting services to the Company at the rate of $375 per hour (plus expenses) under a Consulting Agreement dated May 1, 2024 with The Kaminda Group, an entity controlled by Mr. Ellis.
See “Change of Control Severance Policy” for a description of payments to be received by these NEOs upon a termination in connection with a change of control.
Change of Control Severance Policy
On February 22, 2018, the Compensation Committee adopted the Company’s the COC Severance Policy. The COC Severance Policy is intended to provide eligible officers with reasonable financial security in their employment and position with the Company, without distraction from uncertainties regarding their employment created by the possibility of a potential or actual change of control. The COC Severance Policy applies to our CEO and all Executive Vice Presidents and Senior Vice Presidents (each, a “Participant”), which includes all of our NEOs.
A Participant is entitled to benefits under the COC Severance Policy in the event of a termination of the Participant’s employment by the Company without “Cause” or by the Participant for “Constructive Discharge” either (a) on or before the second anniversary of the date of a “Change of Control” (as such terms are defined in the COC Severance Policy) or (b) in certain circumstances, within six months prior to the date that the Change of Control occurs (a “Qualifying Termination”). The COC Severance Policy does not change the terms of any plans or arrangements that may provide for severance benefits in case of a termination of employment not in connection with a Change of Control. The COC Severance Policy also includes provisions intended to avoid duplication of benefits with the severance benefits that otherwise may be payable under any other plan or arrangement upon a Qualifying Termination.
In the event of a Qualifying Termination, a Participant will receive a lump sum cash payment equal to: (i) a multiple (which is 2.0 for our CEO and 1.5 for all other Participants) times the sum of the Participant’s base salary and target annual bonus, (ii) a pro rata portion of the Participant’s target annual bonus for the fiscal year in which the termination occurs, and (iii) the difference between the monthly COBRA rate and the active employee premium rate for the applicable group health coverage (i.e., medical, dental and vision) as elected by the Participant (for the Participant and his or her eligible dependents) at the time of the Qualifying Termination multiplied by a number of months equal to 24 for our CEO and 18 for each other Participant. A Participant’s right to receive this payment and benefits is subject to his or her execution of a general release of claims against the Company. In addition, the COC Severance Policy provides that all outstanding performance-based equity awards granted after the effective date of the COC Severance Policy shall be converted in their entirety to timed-based equity awards upon the occurrence of a Change of Control based on the assumption that the performance goals are achieved at target. The vesting of performance-based equity awards that are converted to time-based equity awards shall occur upon the same vesting schedule upon which the former performance metrics would have been measured and shall vest in full upon a Qualifying Termination. Additionally, if a Participant incurs a Qualifying Termination, all outstanding time-based awards equity awards, including converted performance-based equity awards that are held by a Participant and were granted after the effective date of the COC Severance Policy shall become fully vested and all forfeiture restrictions shall lapse.
The following table reflects the amount of compensation that would be paid to each of our NEOs in the event of a termination of the executive officer’s employment under various scenarios. The amounts shown assume that such termination was effective as of December 31, 2023, and include estimates of the amounts that would be paid to each executive officer upon such NEO’s termination. The table only includes additional benefits that result from the termination and does not include any amounts or benefits earned, vested, accrued or owing under any plan for any other reason. None of our NEOs is entitled to any additional benefits in connection with a Change of Control without a related termination of employment.
| | | | | | | | | | | | | | | | | | | | |
Name (1) | | Without Cause or Good Reason (not in Connection with a Change in Control) (2) | | Death or Disability (3) | | Termination in Connection with a Change in Control (4) |
| Jeffrey Graves | | $ | 1,294,122 | | | $ | — | | | $ | 8,217,606 | |
| Jeffrey Creech | | 425,000 | | | — | | | 1,621,320 | |
| Reji Puthenveetil | | 426,629 | | | — | | | 2,723,510 | |
| Menno Ellis | | 430,381 | | | — | | | 2,729,138 | |
| Phyllis Nordstrom | | 504,546 | | | — | | | 2,048,041 | |
| Andrew Johnson | | 418,446 | | | — | | | 2,274,078 | |
(1) None of the NEOs will receive any special benefits in the event of voluntary separation without good reason or termination for cause. Under standard plan provisions, the NEOs will continue to be eligible for benefits under the Company’s medical and dental plans until the last day of the month in which termination occurs. Any bonus earned in the year of termination is forfeited.
(2) Amounts in this column represent the cash and benefits to be paid to the NEO in the event of termination by the Company without cause or resignation with good reason (each as defined in the NEO’s employment agreement). For Dr. Graves the severance benefits represent (i) 18 months of base salary and (ii) COBRA reimbursement for 18 months. For Messrs. Creech, Puthenveetil, Ellis, and Johnson and Ms. Nordstrom, severance benefits represent: (i) 12 months of base salary and (ii) COBRA reimbursement for 12 months. Mr. Creech was not yet enrolled in health benefits as of December 31, 2023.
(3) Amounts in this column represent the bonus for the year of termination that each NEO would have received in the event of termination by death or disability.
(4) The amounts in this row are payable in the event of termination by the Company without cause or resignation for “constructive discharge” within six months prior to or two years after a “change of control.” Certain amounts are duplicative of amounts payable in the event of termination by the Company without cause or resignation for “constructive discharge” not in connection with a change of control. For Dr. Graves the severance benefits represent (i) two times the sum of (x) the NEO’s then-current base salary and (y) the NEO’s target cash incentive bonus amount, (ii) payment of the bonus earned under the Annual Bonus Program, (iii) accelerated vesting of the unvested shares under outstanding time-based RSA awards (301,073 shares), (iv) the conversion of outstanding PSUs into immediately-accelerated RSAs (payout assumed at target share amount of 453,590 shares), and (v) COBRA reimbursement for 24 months.
For Messrs. Creech, Puthenveetil, Ellis, and Johnson, severance benefits represent: (i) two times the sum of (x) the NEO’s then-current base salary and (y) the NEO’s target cash incentive bonus amount, (ii) accelerated vesting of the unvested shares under outstanding time-based RSA awards (94,696, 107,255, 107,255 and 78,831 shares, respectively), (iii) the conversion of outstanding PSUs into immediately-accelerated RSAs (payout assumed at target share amount of 0, 162,472, 182,472 and 163,753 shares, respectively), and (iv) COBRA reimbursement for 18 months.
For Mr. Nordstrom, severance benefits represent: (i) two times the sum of (x) her then-current base salary and (y) her target cash incentive bonus amount, (ii) accelerated vesting of the unvested shares under outstanding time-based RSA awards (77,713 shares), (iii) the conversion of outstanding PSUs into immediately-accelerated RSAs (payout assumed at target share amount of 70,377 shares), and (iv) COBRA reimbursement for 18 months. In each case, the value of accelerated equity amounts was computed based on the closing price of our Common Stock on December 29, 2023, of $6.35.
CEO Pay Ratio
As required by applicable SEC rules, we must annually disclose the annual total compensation of our median employee (excluding the CEO), the annual total compensation of our CEO, and the ratio of the CEO compensation to the median employee compensation.
For 2023, our last completed fiscal year:
•the annual total compensation of our CEO, calculated from information reported in the Summary Compensation Table included elsewhere in this Item 11, was $6,535,630; and
•the annual total compensation of our median employee (excluding our CEO) was $80,353.
Based on this information, for 2023 the ratio of the annual total compensation of our CEO to the annual total compensation of our median employee was 81 to 1.
We identified our median employee in 2023 using a multistep process and took the following steps to determine the annual total compensation of that employee and our CEO for 2023:
•We determined that, as of December 31, 2023, our active, global employee population consisted of approximately 1,923 individuals (excluding the CEO). This population consisted of our full-time, part-time, and temporary employees employed with us as of that date.
•To identify the median employee from our employee population, we used annual base salary as of December 31, 2023.
•For the annual total compensation of our median employee, we identified and calculated the elements of that employee’s compensation for 2023 in accordance with the requirements of Item 402(c)(2)(x), which are the same requirements we used to determine the annual total compensation of our CEO.
The CEO pay ratio reported is a reasonable estimate calculated in a manner consistent with SEC rules based on the methodologies and assumptions described. SEC rules for identifying the median employee and determining the CEO pay ratio permit companies to employ a wide range of methodologies, estimates and assumptions. As a result, the CEO pay ratios reported by other companies, which may have employed other permitted methodologies or assumptions and which may have a significantly different work force structure from ours, are likely not comparable to our CEO pay ratio.
Item 12. Security Ownership of Certain Beneficial Owners and Management and Related Stockholder Matters
Equity Compensation Plan Security Ownership of Certain Beneficial Owners and Management
The following table sets forth (a) as of the date indicated in the applicable Schedule 13D or 13G with respect to each person identified as having filed a Schedule 13D or 13G and (b) as of July 2, 2024, with respect to the other persons listed in the table, the number of outstanding shares of Common Stock beneficially owned:
•by each person known to us to be the beneficial owner of more than five percent of our Common Stock;
•by each current director and each of our NEOs; and
•by all of our directors and executive officers as a group.
Except as otherwise indicated in the footnotes to the table, and subject to any applicable community property laws, each person has the sole voting and investment power with respect to the shares beneficially owned. The address of each person listed is in care of 3D Systems Corporation, 333 Three D Systems Circle, Rock Hill, South Carolina 29730, unless otherwise noted.
| | | | | | | | | | | | | | |
| | Number of Shares Beneficially Owned |
Name of Beneficial Owner | | Number of Shares | | Percentage of Shares Owned(1) |
5% Holders | | | | |
BlackRock, Inc.(2) | | 23,180,522 | | 17.35% |
The Vanguard Group(3) | | 14,118,982 | | 10.57% |
State Street Corporation(4) | | 6,965,400 | | 5.21% |
NEOs and Directors | | | | |
Jeffrey A. Graves(5) | | 783,849 | | * |
Jeffrey Creech(6) | | 94,696 | | * |
Reji Puthenveetil(7) | | 267,233 | | * |
Menno Ellis(8) | | 167,770 | | * |
Phyllis Nordstrom(9) | | 84,895 | | * |
Andrew Johnson(10) | | 177,422 | | * |
Michael Turner | | — | | * |
Malissia Clinton | | 62,785 | | * |
William Curran | | 142,503 | | * |
Claudia Drayton(11) | | 36,485 | | * |
Thomas Erickson | | 257,294 | | * |
Jim Kever | | 422,766 | | * |
Charles McClure | | 89,964 | | * |
Kevin Moore(12) | | 1,598,157 | | 1.20% |
Vasant Padmanabhan | | 55,031 | | * |
John Tracy | | 88,558 | | * |
All executive officers and directors as a group (18 persons)(13) | | 4,945,775 | | 3.70% |
| | | | |
| | | | |
| | | | |
| | | | |
| | | | |
| | | | |
| | | | |
| | | | |
* Less than one percent
(1) Percentage ownership is based on the number of shares of Common Stock outstanding and entitled to vote as of July 2, 2024, the record date for the Annual Meeting. Common Stock numbers include, with respect to the stockholder in question, Common Stock which the stockholder could acquire within 60 days of the record date.
(2) BlackRock, Inc. filed a Schedule 13G/A on January 22, 2024, indicating that it has sole voting power over 22,851,733 of these shares and sole dispositive power over 23,180,522 of these shares. The address for this beneficial owner is 50 Hudson Yards, New York, NY 10001.
(3) The Vanguard Group filed a Schedule 13G/A on February 13, 2024, indicating that it has shared voting power over 87,193 of these shares, sole dispositive power over 13,894,423 of these shares, and shared dispositive power over 224,559 of these shares. The address for this beneficial owner is 100 Vanguard Blvd., Malvern, PA 19355.
(4) State Street Corporation filed a Schedule 13G on January 24, 2024, indicating that it had shared voting power over 6,615,115 of these shares and shared dispositive power over 6,965,400 shares. The address for this beneficial owner is State Street Financial Center, 1 Congress Street, Suite 1, Boston, MA 02114-2016.
(5) Consists of (a) 619,396 shares of Common Stock that Dr. Graves holds directly, and (b) 164,453 shares of restricted stock subject to time-based vesting conditions. Excludes 294,968 PSUs, which may be earned upon the achievement of certain TSR over the applicable three-year performance period.
(6) Consists of 94,696 shares of restricted stock subject to time-based vesting conditions.
(7) Consists of (a) 208,811 shares of Common Stock that Mr. Puthenveetil holds directly, and (b) 58,422 shares of restricted stock subject to time-based vesting conditions. Excludes 104,791 PSUs, which may be earned upon the achievement of certain TSR over the applicable three-year performance period.
(8) Consists of 167,770 shares of Common Stock that Mr. Ellis holds directly.
(9) Consists of (a) 31,340 shares of Common Stock that Ms. Nordstrom holds directly and (b) 53,555 shares of restricted stock subject to time-based vesting conditions. Excludes 70,377 PSUs, which may be earned upon the achievement of certain TSR over the applicable three-year performance period.
(10) Consists of 177,422 shares of Common Stock that Mr. Johnson holds directly.
(11) Consists of (a) 27,438 shares of Common Stock that Ms. Drayton holds directly and (b) 9,047 shares of Common Stock that have been deferred pursuant to the Director Compensation Deferral Plan.
(12) Consists of (a) 41,850 shares of Common Stock that Mr. Moore owns directly, (b) 137,693 shares of Common Stock held in the name of Kevin S. Moore, Trustee, The Kevin Scott Moore 2011 Revocable Living Trust dated September 13, 2011, and (c) 1,418,614 shares beneficially owned by The Clark Estates, Inc., with respect to which Mr. Moore disclaims beneficial ownership as well as any pecuniary interest.
(13) Consists of (a) 4,945,775 shares of Common Stock that this group holds directly and (b) 461,089 shares of restricted stock subject to time-based vesting conditions and (c) 9,047 shares of Common Stock deferred pursuant to the Director Compensation Deferral Plan.
Equity Compensation Plans
The following table summarizes information about the equity securities authorized for issuance under our compensation plans as of December 31, 2023. For a description of these plans, see Note 17 to the consolidated financial statements in Item 8 of this Form 10-K.
| | | | | | | | | | | | | | | | | | | | |
| (in thousands, except exercise price) | | Number of securities to be issued upon exercise of outstanding stock options, warrants and rights | | Weighted average exercise price of outstanding options, warrants and rights a | | Number of securities remaining available for future issuance under equity compensation plans b |
| Equity compensation plans approved by stockholders: | | | | | | |
| Stock options | | 420 | | | $ | 13.26 | | | |
| Restricted stock units | | 3,088 | | | | | |
| Total | | 3,508 | | | | | 2,688 | |
a.The weighted-average exercise price is only applicable to stock options.
b.The number of securities remaining available for future issuance for stock options, restricted stock units, and stock awards for non-employee directors is approved in total and not individually with respect to these items.
Item 13. Certain Relationships and Related Transactions and Director Independence
In addition to the provisions of our Code of Conduct and Code of Ethics that deal with conflicts of interest and related party transactions, we have adopted a Related Party Transaction Policy that is designed to confirm our position that related party transactions should be avoided except when they are in our interests and to require that certain types of transactions that may create conflicts of interest or other relationships with related parties are approved in advance by (a) the Board of Directors and (b) the Corporate Governance and Sustainability Committee or a committee composed of directors who are independent and disinterested with respect to the matter under consideration. This policy applies to transactions meeting the following criteria:
•the amount involved will or may be expected to exceed $120,000 in any calendar year;
•we or any of our subsidiaries would be a participant; and
•any person who is or was in the current or immediately preceding calendar year an executive officer, director, director nominee, greater than five percent beneficial owner of our Common Stock or immediate family member of any of the foregoing has or will have a direct or indirect material interest.
In adopting this policy, the Board reviewed certain types of transactions and deemed them to be pre-approved even if the amount involved exceeds $120,000. These types of transactions include:
•employment arrangements with executive officers where such executive officer’s employment in that capacity and compensation for serving as an executive officer has been approved by the Board, the Compensation Committee, or another committee of independent directors;
•director compensation arrangements where such arrangement has been approved by the Corporate Governance and Sustainability Committee (or another committee of independent directors) and the Board;
•awards to executive officers and directors under compensatory plans and arrangements pursuant to our 2015 Incentive Plan, the exercise by any executive officer or director of any previously awarded stock option that is exercised in accordance with its terms, and any grants or awards made to any director or executive officer under any other equity compensation plan that has been approved by our stockholders;
•certain transactions with other companies where a related party has a de minimis relationship (as described in the policy) with the other company and the amount involved in the transaction does not exceed the greater of $1,000,000 or 2 percent of the other company’s total annual revenue;
•charitable contributions made by us to a charitable organization where a related party has a de minimis relationship and the amount involved does not exceed the greater of $1,000,000 or 2% of the charitable organization’s total annual receipts and charitable contributions under any matching program maintained by us that is available on a broad basis to employees generally; and
•other transactions where all security holders receive proportional benefits.
Under the terms of our Related Party Transaction Policy, when considering whether to approve a proposed related party transaction, factors to be considered include, among other things, whether such transaction is on terms no more favorable than terms generally available to an unaffiliated third-party under the same or similar circumstances and the extent of the related party’s interest in the transaction.
There were no related-party transactions in 2023.
Director Independence
Nine of our 10 directors are “independent” directors. Under the corporate governance standards of the NYSE, at least a majority of our directors and all of the members of the Audit Committee, Compensation Committee, and Corporate Governance and Sustainability Committee must be “independent” directors. The corporate governance standards of the NYSE provide that to qualify as an “independent” director, in addition to satisfying certain bright-line criteria, the Company’s Board of Directors (“Board”) must affirmatively determine that a director has no material relationship with us (either directly or as a partner, stockholder, or officer of an organization that has a relationship with the Company). The Board has affirmatively determined that directors Malissia R. Clinton, William E. Curran, Claudia N. Drayton, Thomas W. Erickson, Jim D. Kever, Charles G. McClure, Jr., Kevin S. Moore, Vasant Padmanabhan, and John J. Tracy satisfy the bright-line criteria of the corporate governance standards of the NYSE and that they have no material relationships with us. In making its determination, the Board and the Corporate Governance and Sustainability Committee reviewed the following relationships:
•Dr. Graves, our CEO, is an executive officer of the Company and, as such, is not an independent director.
•Dr. Padmanabhan is an executive officer of Smith+Nephew, a customer of the Company that purchased software and on-demand services in each of 2021, 2022, and 2023. The transactions had an aggregate value of less than $1 million in each year and were negotiated in arm’s length transactions under terms similar to those offered in other third-party transactions. Based on a review of the facts and circumstances of the transactions the Board determined (based on the recommendation of the Corporate Governance and Sustainability Committee) that Dr. Padmanabhan had no direct or indirect material interest in the transactions.
•Mr. Erickson is a non-executive member of the board of directors of MW Industries, the parent company of a customer of the Company that purchased healthcare services from the Company in each of 2021, 2022, and 2023 in arm’s length transactions similar to those offered in other third-party transactions. Mr. Erickson is not responsible for the 3D Systems’ account, and, based on a review of the facts and circumstances of the transactions, the Board determined (based on the recommendation of the Corporate Governance and Sustainability Committee) that Mr. Erickson had no direct or indirect material interest in the transactions. The relevant MW Industries’ subsidiary was sold in December 2023.
Item 14. Principal Accounting Fees and Services
The Audit Committee is responsible for appointing, setting the compensation of, and overseeing the work of our independent registered public accounting firm. As part of this responsibility, the Audit Committee is required to pre-approve the audit and non-audit services performed by the independent registered public accounting firm to assure that the provision of such services does not impair the independent registered public accounting firm’s independence.
The Audit Committee has established a policy to pre-approve all audit and permissible non-audit services. BDO USA, LLP (“BDO”) served as our independent registered public accounting firm for fiscal years 2023 and 2022. On December 4, 2023, the Audit Committee approved the appointment of Deloitte & Touche LLP as our independent registered public accounting firm for our fiscal year ending December 31, 2024 and notified BDO of its dismissal, effective as of the date BDO issued its audit reports on our financial statements for the fiscal year ended December 31, 2023, and our internal control over financial reporting as of December 31, 2023. All services provided by BDO for fiscal year 2023 were pre-approved by the Audit Committee.
The following table sets forth the aggregate fees that BDO billed us for professional services rendered for the years ended December 31, 2023, and December 31, 2022.
| | | | | | | | | | | |
(in thousands) | 2023 | | 2022 |
Audit Fees(1) | $ | 9,995 | | | $ | 3,406 | |
Audit-Related Fees(2) | $ | 100 | | | $ | 96 | |
Tax Fees(3) | $ | 4 | | | $ | 5 | |
| All Other Fees | $ | 3 | | | $ | — | |
| Total | $ | 10,102 | | | $ | 3,507 | |
(1) Audit fees include fees for audit services in connection with the Company’s annual financial statements, including the audit of internal control over financial reporting, the reviews of quarterly reports on Form 10-Q, statutory audits required internationally, comfort letters, consents, and other services relating to SEC filings.
(2) Audit-related fees include fees for services performed within the respective year primarily related to non-financial statement audits and attest services as well as pass-through legal fees.
(3) Tax fees include fees for services related to tax compliance, including tax return preparation and divestitures.
PART IV
Item 15. Exhibits, Financial Statement Schedules
| | | | | | |
| (a)(3) | Exhibits | |
| The following exhibits are included as part of this filing and incorporated herein by this reference: | |
| | |
| Share Purchase Agreement, dated November 2, 2020, by and among 3D Systems, Inc., 3D Systems Corporation and ST Acquisition Co. (Incorporated by reference to Exhibit 2.1 of the Registrant's Current Report on Form 8-K, filed November 4, 2020.) | |
| | |
| First Amendment to Share Purchase Agreement, dated December 31, 2020, by and among ST Acquisition Co., 3D Systems, Inc. and 3D Systems Corporation. (Incorporated by reference to Exhibit 2.1 of the Registrant's Current Report on Form 8-K, filed January 4, 2021.) | |
| | |
| Asset Purchase Agreement, dated June 1, 2021, by and among 3D Systems, Inc., Quickparts.com, Inc., 3D Systems Italia Srl, 3D Systems France Sarl, 3D Systems Europe Limited, 3D Systems GmbH, QP 3D Acquisition, Inc., and 3D Systems Corporation. (Incorporated by reference to Exhibit 2.1 of the Registrant’s Current Report on Form 8-K, filed on June 2, 2021.) | |
| | |
| | | | | | |
| First Amendment to the Asset Purchase Agreement, dated June 1, 2021, by and among 3D Systems, Inc., Quickparts.com Inc., 3D Systems Italia Srl, 3D Systems France Sarl, 3D Systems Europe Limited, 3D Systems GmbH, QP 3D Acquisition, Inc., and 3D Systems Corporation. (Incorporated by reference Exhibit 2.5 of the Registrant’s Quarterly Report on Form 10-Q for the quarter ended September 30, 2021, filed November 8, 2021.) | |
| | |
| Second Amendment to the Asset Purchase Agreement, dated June 1, 2021, by and among 3D Systems, Inc., Quickparts.com Inc., 3D Systems Italia Srl, 3D Systems France Sarl, 3D Systems Europe Limited, 3D Systems GmbH, QP 3D Acquisition, Inc., and 3D Systems Corporation. (Incorporated by reference to Exhibit 2.5 of the Registrant’s Annual Report on Form 10-K for the year ended December 31, 2021, filed on March 1, 2022.) | |
| | |
| Stock Purchase Agreement, dated July 28, 2021, by and between 3D Systems, Inc. and Surgical Science Sweden AB. (Incorporated by reference to Exhibit 2.1 of the Registrant’s Current Report on Form 8-K, filed on July 30, 2021.) | |
| | |
| Agreement and Plan of Merger, dated September 8, 2021, by and among 3D Systems Corporation, Oqton, Inc., 3DS Merger Sub 1, Inc., 3DS Merger Sub 2 Inc., and Shareholder Representative Services LLC, solely in its capacity as the representative, agent and attorney-in-fact of the Sellers. (Incorporated by reference to the Exhibit 2.1 of the Registrant’s Current Report on Form 8-K filed, on September 9, 2021.) | |
| | |
| First Amendment to the Agreement and Plan of Merger, dated October 29, 2021, by and among 3D Systems Corporation, Oqton, Inc., 3DS Merger Sub 1, Inc., 3DS Merger Sub 2 Inc., and Shareholder Representative Services LLC, solely in its capacity as the representative, agent and attorney-in-fact of the Sellers. (Incorporated by reference to Exhibit 2.3 of the Registrant’s Quarterly Report on Form 10-Q for the quarter ended September 30, 2021, filed on November 8, 2021.) | |
| | |
| Agreement and Plan of Merger, dated October 27, 2021, by and among 3D Systems Corporation, Volumetric Biotechnologies, Inc., Texans Merger Sub I, Inc., Texans Merger Sub II, Inc., and Fortis Advisors LLC, solely in its capacity as the Stockholders' Representative. (Incorporated by reference to Exhibit 2.1 of the Registrant's Current Report on Form 8-K, filed on October 28, 2021.) | |
| | |
| 3.1 | Certificate of Incorporation of Registrant. (Incorporated by reference to Exhibit 3.1 of the Registrant’s Form 8-B filed on August 16, 1993, and the amendment thereto, filed on Form 8-B/A on February 4, 1994.) | |
| | |
| 3.2 | Amendment to Certificate of Incorporation filed on May 23, 1995. (Incorporated by reference to Exhibit 3.2 of the Registrant’s Registration Statement on Form S-2/A, filed on May 25, 1995.) | |
| | |
| Certificate of Amendment of Certificate of Incorporation filed with Secretary of State of Delaware on May 19, 2004. (Incorporated by reference to Exhibit 3.1 of the Registrant’s Quarterly Report on Form 10-Q for the quarterly period ended June 30, 2004, filed on August 5, 2004.) | |
| | |
| Certificate of Amendment of Certificate of Incorporation filed with Secretary of State of Delaware on May 17, 2005. (Incorporated by reference to Exhibit 3.1 of the Registrant’s Quarterly Report on Form 10-Q for the quarterly period ended June 30, 2005, filed on August 1, 2005.) | |
| | |
| Certificate of Amendment of Certificate of Incorporation filed with the Secretary of State of Delaware on October 7, 2011. (Incorporated by reference to Exhibit 3.1 of the Registrant’s Current Report on Form 8-K, filed on October 7, 2011.) | |
| | |
| Certificate of Amendment of Certificate of Incorporation filed with the Secretary of State of Delaware on May 21, 2013. (Incorporated by reference to Exhibit 3.1 of the Registrant’s Current Report on Form 8-K, filed on May 22, 2013.) | |
| | |
| Amended and Restated By-Laws. (Incorporated by reference to Exhibit 3.1 of the Registrant’s Current Report on Form 8-K, filed on March 15, 2018.) | |
| | |
| Specimen Common Stock Certificate. (Incorporated by reference to Exhibit 4.1 of the Registrant’s Registration Statement on Form S-3 (Registration No. 333-182065), filed on June 12, 2012.) | |
| | |
| Description of Common Stock. (Incorporated by reference to Exhibit 4.2 of the Registrant's Annual Report on Form 10-K for the year ended December 31, 2019, filed on February 26, 2020.) | |
| | |
| | |
| Indenture, dated as of November 16, 2021, between 3D Systems Corporation and The Bank of New York Mellon Trust Company, N.A., as trustee. (Incorporated by reference to the Exhibit 4.1 of the Registrant’s Current Report on Form 8-K filed on November 17, 2021.) | |
| | |
| Form of 0% Convertible Notes due 2026 (included in Exhibit 4.3). (Incorporated by reference to the Exhibit 4.2 of the Registrant’s Current Report on Form 8-K filed on November 17, 2021.) | |
| | |
| | | | | | |
| Lease Agreement dated February 8, 2006 between the Registrant and KDC-Carolina Investments 3, LP. (Incorporated by reference to Exhibit 99.1 of the Registrant’s Current Report on Form 8-K, filed on February 10, 2006.) | |
| | |
| First Amendment to Lease Agreement dated August 7, 2006 between the Registrant and KDC-Carolina Investments 3, LP. (Incorporated by reference to Exhibit 10.1 of the Registrant’s Current Report on Form 8-K, filed on August 14, 2006.) | |
| | |
| Second Amendment to Lease Agreement effective as of October 6, 2006 to Lease Agreement dated February 8, 2006 between 3D Systems Corporation and KDC-Carolina Investments 3, LP. (Incorporated by reference to Exhibit 10.1 of the Registrant’s Current Report on Form 8-K, filed on October 10, 2006.) | |
| | |
| Third Amendment to Lease Agreement effective as of December 18, 2006 to Lease Agreement dated February 8, 2006 between 3D Systems Corporation and KDC-Carolina Investments 3, LP. (Incorporated by reference to Exhibit 10.1 of the Registrant’s Current Report on Form 8-K, filed on December 20, 2006.) | |
| | |
| Fourth Amendment to Lease Agreement effective as of February 26, 2007 to Lease Agreement dated February 8, 2006 between 3D Systems Corporation and KDC-Carolina Investments 3, LP. (Incorporated by reference to Exhibit 10.1 of the Registrant’s Current Report on Form 8-K, filed on March 1, 2007.) | |
| | |
| Fifth Amendment to Lease Agreement effective as of March 17, 2011 to Lease Agreement dated February 8, 2006 between 3D Systems Corporation and KDC-Carolina Investments 3, LP. (Incorporated by reference to Exhibit 10.1 of the Registrant’s Current Report on Form 8-K, filed on March 21, 2011.) | |
| | |
| Amended and Restated Lease Agreement dated February 25, 2021 between 3D Systems Corporation and 3D Fields, LLC. (Incorporated by reference to Exhibit 10.7 of the Registrant’s Annual Report on Form 10-K for the year ended December 31, 2020, filed on March 5, 2021.) | |
| | |
| Amendment No. 1, dated July 9, 2021, to the Amended and Restated Lease Agreement, dated February 25, 2021, between 3D Systems Corporation and 3D Fields, LLC. (Incorporated by reference to Exhibit 10.8 of the Registrant's Annual Report on Form 10-K for the year ended December 31, 2022, filed on March 16, 2023). | |
| | |
| Amendment No. 2, dated July 13, 2022, to the Amended and Restated Lease Agreement dated February 25, 2021 between 3D Systems Corporation and 3D Fields, LLC. (Incorporated by reference to Exhibit 10.9 of the Registrant's Annual Report on Form 10-K for the year ended December 31, 2022, filed on March 16, 2023). | |
| | |
| Credit Agreement, dated February 27, 2019, among 3D Systems Corporation, HSBC Bank USA, National Association, as Administrative Agent, Sole Lead Arranger and Sole Bookrunner, the guarantors party thereto, and the other lenders party thereto. (Incorporated by reference to Exhibit 10.10 of the Registrant's Annual Report on Form 10-K for the year ended December 31, 2018, filed on February 28, 2019). | |
| | |
| Security Agreement, dated February 27, 2019, among 3D Systems Corporation, 3D Holdings, LLC, 3D Systems, Inc., and HSBC Bank USA, National Association, as Administrative Agent. (Incorporated by reference to Exhibit 10.11 of the Registrant's Annual Report on Form 10-K for the year ended December 31, 2018, filed on February 28, 2019). | |
| | |
| First Amendment, dated September 30, 2019, to the Credit Agreement, dated February 27, 2019, among 3D Systems Corporation, HSBC Bank USA, National Association, as Administrative Agent, Sole Lead Arranger and Sole Bookrunner, the guarantors party thereto, and the other lenders party thereto. (Incorporated by reference to Exhibit 10.2 of the Registrant's Quarterly Report on Form 10-Q for the quarter ended September 30, 2019, filed on October 30, 2019). | |
| | |
| Second Amendment, dated October 9, 2020, to the Credit Agreement, dated February 27, 2019, among 3D Systems Corporation, HSBC Bank USA, National Association, as Administrative Agent, Swing Loan Lender and Issuing Lender, the guarantors party thereto, and the other lenders party thereto. (Incorporated by reference to Exhibit 10.1 of the Registrant’s Current Report on Form 8-K, filed October 14, 2020.) | |
| | |
| Amended and Restated 2015 Incentive Plan of 3D Systems Corporation. (Incorporated by reference to Exhibit 10.1 of the Registrant's Current Report on Form 8-K, filed on May 26, 2022.) | |
| | |
| Appendix A to the 2015 Incentive Plan of 3D Systems Corporation effective May 19, 2015. (Incorporated by reference to Exhibit 10.3 of the Registrant’s Quarterly Report on Form 10-Q for the quarter ended June 30, 2015, filed on August 6, 2015.) | |
| | |
| Form of Restricted Stock Award Agreement under the Amended and Restated 2015 Incentive Plan. (Incorporated by reference to Exhibit 4.5 of the Registrant’s Annual Report on Form 10-K for the year ended December 31, 2020, filed on March 5, 2021.) | |
| | |
| | | | | | |
| Form of Restricted Stock Unit Award Agreement under the Amended and Restated 2015 Incentive Plan. (Incorporated by reference to Exhibit 4.6 of the Registrant’s Annual Report on Form 10-K for the year ended December 31, 2020, filed on March 5, 2021.) | |
| | |
| Form of Stock Option Award Agreement under the Amended and Restated 2015 Incentive Plan. (Incorporated by reference to Exhibit 4.10 of the Registrant's Annual Report on Form 10-K for the year ended December 31, 2019, filed on February 26, 2020.) | |
| | |
| Form of Restricted Stock Award Agreement with Share Price Vesting Conditions. (Incorporated by reference to Exhibit 4.17 of the Registrant’s Annual Report on Form 10-K for the year ended December 31, 2016, filed on February 28, 2017.) | |
| | |
| Revised Form of Performance-Based Restricted Stock Unit Award Agreement under the Amended and Restated 2015 Incentive Plan. (Incorporated by reference to Exhibit 4.10 of the Registrant’s Annual Report on Form 10-K for the year ended December 31, 2020, filed on March 5, 2021.) | |
| | |
| Charles W. Hull Consulting Arrangement. (Incorporated by reference to Exhibit 10.1 of the Registrant’s Quarterly Report on Form 10-Q for the quarter ended June 30, 2010, filed on July 29, 2010.) | |
| | |
| Employment Agreement, dated August 4, 2016, between 3D Systems Corporation and Charles W. Hull. (Incorporated by reference to Exhibit 10.1 of the Registrant's Current Report on Form 8-K, filed August 8, 2016.) | |
| | |
| Employment Agreement, dated June 15, 2016, between 3D Systems Corporation and Andrew M. Johnson. (Incorporated by reference to Exhibit 10.2 of the Registrant’s Current Report on Form 8-K, filed on June 16, 2016.) | |
| | |
| 3D Systems Corporation Change of Control Severance Policy. (Incorporated by reference to Exhibit 10.1 of the Registrant's Current Report on Form 8-K, filed February 23, 2018.) | |
| | |
| Employment Agreement, dated May 11, 2020, between 3D Systems Corporation and Dr. Jeffrey A. Graves. (Incorporated by reference to Exhibit 10.1 of the Registrant’s Current Report on Form 8-K, filed May 14, 2020.) | |
| | |
| Employment Agreement, dated November 21, 2016, between 3D Systems Corporation and Menno Ellis. (Incorporated by reference to Exhibit 10.3 of the Registrant’s Quarterly Report on Form 10-Q for the quarter ended September 30, 2020, filed November 5, 2020.) | |
| | |
| Employment Agreement, dated October 1, 2020, between 3D Systems Corporation and Reji Puthenveetil. (Incorporated by reference to Exhibit 10.4 of the Registrant’s Quarterly Report on Form 10-Q for the quarter ended September 30, 2020, filed November 5, 2020.) | |
| | |
| Amendment No. 1 to the Employment Agreement, dated February 22, 2021, between 3D Systems Corporation and Reji Puthenveetil. (Incorporated by reference to Exhibit 10.30 of the Registrant’s Annual Report on Form 10-K for the year ended December 31, 2020, filed on March 5, 2021.) | |
| | |
| Consulting Agreement, dated October 1, 2020, between 3D Systems Corporation and Reji Puthenveetil. (Incorporated by reference to Exhibit 10.5 of the Registrant’s Quarterly Report on Form 10-Q for the quarter ended September 30, 2020, filed November 5, 2020.) | |
| | |
| Employment Agreement, dated June 28, 2021, between 3D Systems Corporation and David K. Leigh. (Incorporated by reference to Exhibit 10.1 of the Registrant’s Quarterly Report on Form 10-Q for the quarter ended June 30, 2021, filed August 9, 2021.) | |
| | |
| Employment Agreement, dated August 30, 2021, by and between 3D Systems Corporation and Phyllis Nordstrom. (Incorporated by reference to Exhibit 10.1 of the Registrant’s Quarterly Report on Form 10-Q for the quarter ended September 30, 2021, filed November 8, 2021.) | |
| | |
| Executive Employment Agreement dated August 4, 2022, by and between 3D Systems Corporation and Michael Turner. (Incorporated by reference to Exhibit 10.1 of the Registrant's Current Report on Form 8-K, filed on August 5, 2022.) | |
| | |
| Executive Employment Agreement dated December 7, 2022, by and between 3D Systems Corporation and Joseph Zuiker. (Incorporated by reference to Exhibit 10.1 of the Registrant's Current Report on Form 8-K, filed on December 9, 2022.) | |
| | |
| | | | | | |
| 3D Systems Corporation Non-Employee Director Deferred Compensation Plan, dated December 14, 2022. (Incorporated by reference to Exhibit 10.37 of the Registrant's Annual Report on Form 10-K for the year ended December 31, 2022, filed on March 16, 2023). | |
| | |
| Executive Employment Agreement dated December 12, 2023, by and between 3D Systems Corporation and Jeffrey Creech. (Incorporated by reference to Exhibit 10.1 of the Registrant's Current Report on Form 8-K, filed on December 14, 2023.) | |
| | |
| Separation Agreement, dated January 11, 2024, by and between 3D Systems Corporation and Andrew M. Johnson. (Incorporated by reference to Exhibit 10.1 of the Registrant's Current Report on Form 8-K, filed on January 11, 2024.) | |
| | |
| Consulting Agreement, dated May 1, 2024, by and between 3D Systems Corporation and Andrew M. Johnson. (Incorporated by reference to Exhibit 10.1 of the Registrant's Current Report on Form 8-K, filed on May 1, 2024.) | |
| | |
| Consulting Agreement, dated May 1, 2024, by and between 3D Systems Corporation and The Kaminda Group. (Incorporated by reference to Exhibit 10.2 of the Registrant's Current Report on Form 8-K, filed on May 1, 2024.) | |
| | |
| Letter from BDO USA, P.C. to the Securities and Exchange Commission dated December 5, 2023 (Incorporated by reference to Exhibit 16.1 of the Registrant's Current Report on Form 8-K, filed on December 6, 2023.)
| |
| | |
| Letter from BDO USA, P.C. to the Securities and Exchange Commission dated August 13, 2024 (Incorporated by reference to Exhibit 16.1 of the Registrant’s Current Report on Form 8-K/A, filed on August 13, 2024.) | |
| | |
| Subsidiaries of Registrant. | |
| | |
| Consent of Independent Registered Public Accounting Firm. | |
| | |
| Certification of Principal Executive Officer filed pursuant to Section 302 of the Sarbanes-Oxley Act of 2002, dated August 13, 2024. | |
| | |
| Certification of Principal Financial Officer filed pursuant to Section 302 of the Sarbanes-Oxley Act of 2002, dated August 13, 2024. | |
| | |
| Certification of Principal Executive Officer filed pursuant to 18 U.S.C. Section 1350, as adopted pursuant to Section 906 of the Sarbanes-Oxley Act of 2002, dated August 13, 2024. | |
| | |
| Certification of Principal Financial Officer filed pursuant to 18 U.S.C. Section 1350, as adopted pursuant to Section 906 of the Sarbanes-Oxley Act of 2002, dated August 13, 2024. | |
| | |
| 3D Systems Corporation Clawback Policy. | |
| | |
| 101.INS† | Inline XBRL Instance Document - the instance document does not appear in the Interactive Data file because the its XBRL tags are embedded within the Inline XBRL document. | |
| | |
| 101.SCH† | Inline XBRL Taxonomy Extension Scheme Document | |
| | |
| 101.CAL† | Inline XBRL Taxonomy Extension Calculation Linkbase Document | |
| | |
| 101.DEF† | Inline XBRL Taxonomy Extension Definition Linkbase Document | |
| | |
| 101.LAB† | Inline XBRL Taxonomy Extension Label Linkbase Document | |
| | |
| 101.PRE† | XBRL Taxonomy Extension Presentation Linkbase Document | |
| | |
| 104 | Cover Page Interactive Data File - this data file does not appear in the Interactive Data file because its XBRL tags are embedded within the Inline XBRL document. | |
| | |
* Management contract or compensatory plan or arrangement
† Exhibits filed herein. All exhibits not so designated are incorporated by reference to a prior filing, as indicated.
Item 16. Form 10-K Summary
None.
SIGNATURES
Pursuant to the requirements of Section 13 or 15(d) of the Securities Exchange Act of 1934, the Registrant has duly caused this report to be signed on our behalf by the undersigned, thereunto duly authorized.
| | | | | | | | |
| | 3D Systems Corporation |
| By: | /s/ DR. JEFFREY A. GRAVES |
| | Dr. Jeffrey A. Graves |
| | President, Chief Executive Officer and Director |
| Date: | August 13, 2024 |
Pursuant to the requirements of the Securities Exchange Act of 1934, this report has been signed below by the following persons on behalf of registrant and in the capacities and on the dates indicated. | | | | | | | | |
| Signature | Title | Date |
| | |
| /s/ DR. JEFFREY A. GRAVES | Chief Executive Officer, President and Director | August 13, 2024 |
| Dr. Jeffrey A. Graves | (principal executive officer) | |
| | |
/s/ JEFFREY D. CREECH | Executive Vice President, Chief Financial Officer | August 13, 2024 |
Jeffrey D. Creech | (principal financial officer) | |
| | |
| /s/ CHARLES W. HULL | Executive Vice President, Chief Technology | August 13, 2024 |
| Charles W. Hull | Officer and Director Emeritus | |
| | |
/s/ MARGARET E. WICKLUND | Senior Vice President, Chief Accounting Officer | August 13, 2024 |
Margaret E. Wicklund | (principal accounting officer) | |
| | |
| /s/ CHARLES G. MCCLURE, JR | Chairman of the Board of Directors | August 13, 2024 |
| Charles G. McClure, Jr. | | |
| | |
| /s/ MALISSIA R. CLINTON | Director | August 13, 2024 |
| Malissia R. Clinton | | |
| | |
| /s/ WILLIAM E. CURRAN | Director | August 13, 2024 |
| William E. Curran | | |
| | |
| /s/ CLAUDIA N. DRAYTON | Director | August 13, 2024 |
| Claudia N. Drayton | | |
| | |
| /s/ THOMAS W. ERICKSON | Director | August 13, 2024 |
| Thomas W. Erickson | | |
| | |
| /s/ JIM D. KEVER | Director | August 13, 2024 |
| Jim D. Kever | | |
| | |
| /s/ KEVIN S. MOORE | Director | August 13, 2024 |
| Kevin S. Moore | | |
| | |
| /s/ DR. VASANT PADMANABHAN | Director | August 13, 2024 |
| Dr. Vasant Padmanabhan | | |
| | |
| /s/ JOHN J. TRACY | Director | August 13, 2024 |
| Dr. John J. Tracy | | |
3D Systems Corporation
Index to Consolidated Financial Statements
| | | | | |
| Consolidated Financial Statements | |
| |
| |
| |
| |
| |
| |
| |
| |
| |
Report of Independent Registered Public Accounting Firm
Shareholders and Board of Directors
3D Systems Corporation
Rock Hill, South Carolina
Opinion on the Consolidated Financial Statements
We have audited the accompanying consolidated balance sheets of 3D Systems Corporation (the “Company”) as of December 31, 2023 and 2022, the related consolidated statements of operations, comprehensive (loss) income, stockholders’ equity, and cash flows for each of the three years in the period ended December 31, 2023, and the related notes (collectively referred to as the “consolidated financial statements”). In our opinion, the consolidated financial statements present fairly, in all material respects, the financial position of the Company at December 31, 2023 and 2022, and the results of its operations and its cash flows for each of the three years in the period ended December 31, 2023, in conformity with accounting principles generally accepted in the United States of America.
We also have audited, in accordance with the standards of the Public Company Accounting Oversight Board (United States) (“PCAOB”), the Company's internal control over financial reporting as of December 31, 2023, based on criteria established in Internal Control – Integrated Framework (2013) issued by the Committee of Sponsoring Organizations of the Treadway Commission (“COSO”) and our report dated August 13, 2024, expressed an adverse opinion thereon.
Basis for Opinion
These consolidated financial statements are the responsibility of the Company’s management. Our responsibility is to express an opinion on the Company’s consolidated financial statements based on our audits. We are a public accounting firm registered with the PCAOB and are required to be independent with respect to the Company in accordance with the U.S. federal securities laws and the applicable rules and regulations of the Securities and Exchange Commission and the PCAOB.
We conducted our audits in accordance with the standards of the PCAOB. Those standards require that we plan and perform the audit to obtain reasonable assurance about whether the consolidated financial statements are free of material misstatement, whether due to error or fraud.
Our audits included performing procedures to assess the risks of material misstatement of the consolidated financial statements, whether due to error or fraud, and performing procedures that respond to those risks. Such procedures included examining, on a test basis, evidence regarding the amounts and disclosures in the consolidated financial statements. Our audits also included evaluating the accounting principles used and significant estimates made by management, as well as evaluating the overall presentation of the consolidated financial statements. We believe that our audits provide a reasonable basis for our opinion.
Critical Audit Matters
The critical audit matters communicated below are matters arising from the current period audit of the consolidated financial statements that were communicated or required to be communicated to the audit committee and that: (1) relate to accounts or disclosures that are material to the consolidated financial statements and (2) involved our especially challenging, subjective, or complex judgments. The communication of critical audit matters does not alter in any way our opinion on the consolidated financial statements, taken as a whole, and we are not, by communicating the critical audit matters below, providing separate opinions on the critical audit matters or on the accounts or disclosures to which they relate.
Revenue from Collaboration Agreements
As described in Note 5 to the consolidated financial statements, the Company recognizes revenue when control of the promised products or services is transferred to customers in an amount that reflects the consideration the Company expects to receive in exchange for those products or services. The Company recognized revenue of approximately $17 million related to collaboration agreements with customers for the year ended December 31, 2023. The Company’s collaboration agreements may contain multiple performance obligations and may contain fees for licensing, research and development services, contingent milestone payments upon achievement of developmental contractual criteria, and/or royalty fees based on the licensees' product revenue.
We identified revenue recognition for a certain collaboration agreement with a customer (“the agreement”) as a critical audit matter. Management makes significant judgments in estimating variable consideration to determine appropriate revenue recognition for the agreement. Auditing management’s judgments and estimates required significant audit effort and auditor subjectivity.
The primary procedures we performed to address this critical audit matter included:
•Testing the design and operating effectiveness of internal controls relating to the estimation of variable consideration and the appropriateness of the inputs and assumptions to the revenue recognition calculations.
•Evaluating the reasonableness of management’s judgments and estimates to calculate variable consideration, and the timing of recognizing the related revenue subject to any constraints.
•Testing the inputs and assumptions used in the revenue recognition determination.
•Testing the mathematical accuracy of the revenue recognition calculations.
•Evaluating the appropriateness of the accounting treatment and the associated impact to revenue recognition of an amendment to the agreement.
•Confirming relevant terms of the agreement, including the absence of side agreements, directly with the customer.
Stand-Alone Selling Price and Implementation of Accounting Information System
As described in Item 9A. Controls and Procedures, management identified material weaknesses which included ineffective controls relating to the design and implementation of controls over the review of revenue pricing and the implementation of a related accounting information system.
We identified the stand-alone selling price (“SSP”) allocation calculations performed by the newly implemented accounting information system as a critical audit matter. The determination of SSP is a manual process performed outside of the system. Once calculated, SSP information is then uploaded to the newly implemented accounting information system, which utilizes this data to allocate the transaction price for contracts containing more than one performance obligation. Auditing the allocation of SSP required significant auditor effort due to the difficulties and delays involved in obtaining complete and accurate audit evidence required to perform our procedures.
The primary procedures we performed to address this critical audit matter included:
•Evaluating the design of internal controls relating to pricing information and SSP determinations.
•Evaluating the appropriateness of the system implementation and the calculations performed by it in accordance with the revenue recognition standard.
•Testing the completeness and accuracy of data uploaded to the system by: (i) testing the mathematical accuracy of the SSP calculations, and (ii) testing the completeness and accuracy of list price information and the underlying data used in the SSP calculations.
•Evaluating the impact of audit findings identified through testing of revenue recognition for the year ended December 31, 2023.
/s/ BDO USA, P.C.
We have served as the Company's auditor since 2003.
Charlotte, North Carolina
August 13, 2024
Report of Independent Registered Public Accounting Firm
Shareholders and Board of Directors
3D Systems Corporation
Rock Hill, South Carolina
Opinion on Internal Control over Financial Reporting
We have audited 3D Systems Corporation’s (the “Company’s”) internal control over financial reporting as of December 31, 2023, based on criteria established in Internal Control – Integrated Framework (2013) issued by the Committee of Sponsoring Organizations of the Treadway Commission (the “COSO criteria”). In our opinion, the Company did not maintain, in all material respects, effective internal control over financial reporting as of December 31, 2023, based on the COSO criteria.
We do not express an opinion or any other form of assurance on management’s statements referring to any corrective actions taken by the Company after the date of management’s assessment.
We also have audited, in accordance with the standards of the Public Company Accounting Oversight Board (United States) (“PCAOB”), the consolidated balance sheets of the Company as of December 31, 2023 and 2022, the related consolidated statements of operations, comprehensive (loss) income, stockholders’ equity, and cash flows for each of the three years in the period ended December 31, 2023, and the related notes (collectively referred to as “the consolidated financial statements”) and our report dated August 13, 2024, expressed an unqualified opinion thereon.
Basis for Opinion
The Company’s management is responsible for maintaining effective internal control over financial reporting and for its assessment of the effectiveness of internal control over financial reporting, included in the accompanying “Item 9A, Management’s Report on Internal Control over Financial Reporting”. Our responsibility is to express an opinion on the Company’s internal control over financial reporting based on our audit. We are a public accounting firm registered with the PCAOB and are required to be independent with respect to the Company in accordance with U.S. federal securities laws and the applicable rules and regulations of the Securities and Exchange Commission and the PCAOB.
We conducted our audit of internal control over financial reporting in accordance with the standards of the PCAOB. Those standards require that we plan and perform the audit to obtain reasonable assurance about whether effective internal control over financial reporting was maintained in all material respects. Our audit included obtaining an understanding of internal control over financial reporting, assessing the risk that a material weakness exists, and testing and evaluating the design and operating effectiveness of internal control based on the assessed risk. Our audit also included performing such other procedures as we considered necessary in the circumstances. We believe that our audit provides a reasonable basis for our opinion.
As indicated in the accompanying Item 9A, Management’s Report on Internal Control over Financial Reporting, management’s assessment of and conclusion on the effectiveness of internal control over financial reporting did not include the internal controls of Wematter AB “Wematter” which was acquired on July 1, 2023, which is included in the consolidated balance sheet of the Company as of December 31, 2023, the related consolidated statements of operations, comprehensive (loss) income, stockholders’ equity, and cash flows for the year ended December 31, 2023, and the related notes. Wematter constituted 0.7% of total assets as of December 31, 2023, and 0.0% of revenues for the year then ended. Management did not assess the effectiveness of internal control over financial reporting of Wematter because of the timing of the acquisition which was completed on July 1, 2023. Our audit of internal control over financial reporting of the Company also did not include an evaluation of the internal control over financial reporting of Wematter.
A material weakness is a deficiency, or a combination of deficiencies, in internal control over financial reporting, such that there is a reasonable possibility that a material misstatement of the company’s annual or interim financial statements will not be prevented or detected on a timely basis. Material weaknesses regarding management’s failure to design and maintain controls have been identified and described in management’s assessment. The material weaknesses related to:
1.The revenue process, including the review of contract terms input into the Company’s information systems that support the determination of revenue recognition, the accounting for, and the monitoring of the timing of revenue recognition;
2.The financial close, accounting, and reporting processes, as specifically related to management’s review of internally prepared reports and analyses in these processes in reviewing certain financial statement disclosures;
3.The design and implementation of controls over the review of revenue pricing and the implementation of a related accounting information system;
4.Management’s review of the technical accounting treatment for certain technical matters related to certain transactions and financial statement accounts; and,
5.The maintenance of an effective control environment; specifically, as it relates to: (a) senior management's commitment to the control environment principles, and (b) maintaining sufficient qualified resources with the appropriate level of knowledge, experience, and training necessary to support accounting and financial reporting processes and controls.
These material weaknesses were considered in determining the nature, timing, and extent of audit tests applied in our audit of the 2023 consolidated financial statements, and this report does not affect our report dated August 13, 2024 on those financial statements.
Definition and Limitations of Internal Control over Financial Reporting
A company’s internal control over financial reporting is a process designed to provide reasonable assurance regarding the reliability of financial reporting and the preparation of financial statements for external purposes in accordance with generally accepted accounting principles. A company’s internal control over financial reporting includes those policies and procedures that (1) pertain to the maintenance of records that, in reasonable detail, accurately and fairly reflect the transactions and dispositions of the assets of the company; (2) provide reasonable assurance that transactions are recorded as necessary to permit preparation of financial statements in accordance with generally accepted accounting principles, and that receipts and expenditures of the company are being made only in accordance with authorizations of management and directors of the company; and (3) provide reasonable assurance regarding prevention or timely detection of unauthorized acquisition, use, or disposition of the company’s assets that could have a material effect on the financial statements.
Because of its inherent limitations, internal control over financial reporting may not prevent or detect misstatements. Also, projections of any evaluation of effectiveness to future periods are subject to the risk that controls may become inadequate because of changes in conditions, or that the degree of compliance with the policies or procedures may deteriorate.
/s/ BDO USA, P.C.
Charlotte, North Carolina
August 13, 2024
3D SYSTEMS CORPORATION
CONSOLIDATED BALANCE SHEETS | | | | | | | | | | | |
| (in thousands, except par value) | December 31, 2023 | | December 31, 2022 |
| ASSETS | | | |
| Current assets: | | | |
| Cash and cash equivalents | $ | 331,525 | | | $ | 388,134 | |
| Short-term investments | — | | | 180,603 | |
Accounts receivable, net of reserves — $3,389 and $3,114 | 101,497 | | | 93,886 | |
| Inventories | 152,188 | | | 137,832 | |
| Prepaid expenses and other current assets | 42,612 | | | 33,790 | |
| | | |
| | | |
| Total current assets | 627,822 | | | 834,245 | |
Property and equipment, net | 64,461 | | | 58,072 | |
| Intangible assets, net | 62,724 | | | 90,230 | |
| Goodwill | 116,082 | | | 385,312 | |
Operating lease right-of-use assets | 58,406 | | | 39,502 | |
| Finance lease right-of-use assets | 12,174 | | | 3,244 | |
| Long-term deferred income tax assets | 4,230 | | | 7,038 | |
| | | |
| Other assets | 44,761 | | | 28,970 | |
| Total assets | $ | 990,660 | | | $ | 1,446,613 | |
| LIABILITIES, REDEEMABLE NON-CONTROLLING INTEREST AND EQUITY | | | |
| Current liabilities: | | | |
| | | |
Current operating lease liabilities | $ | 9,924 | | | $ | 8,343 | |
| Accounts payable | 49,757 | | | 53,826 | |
| Accrued and other liabilities | 49,460 | | | 56,264 | |
| | | |
| Customer deposits | 7,599 | | | 6,911 | |
| Deferred revenue | 30,448 | | | 26,464 | |
| | | |
| Total current liabilities | 147,188 | | | 151,808 | |
| | | |
| Long-term debt, net of deferred financing costs | 319,356 | | | 449,510 | |
Long-term operating lease liabilities | 56,795 | | | 38,499 | |
| Long-term deferred income tax liabilities | 5,162 | | | 7,631 | |
| | | |
| Other liabilities | 33,400 | | | 47,461 | |
| Total liabilities | 561,901 | | | 694,909 | |
Commitments and contingencies (Note 23) | | | |
| Redeemable non-controlling interest | 2,006 | | | 1,760 | |
| Stockholders’ equity: | | | |
Common stock, $0.001 par value, authorized 220,000 shares; shares issued 133,619 and 131,207 as of December 31, 2023 and 2022, respectively | 134 | | | 131 | |
| Additional paid-in capital | 1,577,519 | | | 1,547,597 | |
| | | |
| Accumulated deficit | (1,106,650) | | | (743,962) | |
| Accumulated other comprehensive loss | (44,250) | | | (53,822) | |
| Total stockholders’ equity | 426,753 | | | 749,944 | |
| Total liabilities, redeemable non-controlling interest and stockholders’ equity | $ | 990,660 | | | $ | 1,446,613 | |
See accompanying notes to consolidated financial statements.
3D SYSTEMS CORPORATION
CONSOLIDATED STATEMENTS OF OPERATIONS
| | | | | | | | | | | | | | | | | | | |
| Year Ended December 31, | | |
| (in thousands, except per share amounts) | 2023 | | 2022 | | 2021 | | |
| Revenue: | | | | | | | |
| Products | $ | 328,731 | | | $ | 395,396 | | | $ | 428,742 | | | |
| Services | 159,338 | | | 142,635 | | | 186,897 | | | |
| Total revenue | 488,069 | | | 538,031 | | | 615,639 | | | |
| Cost of sales: | | | | | | | |
| Products | 203,258 | | | 237,386 | | | 245,169 | | | |
| Services | 88,390 | | | 86,412 | | | 106,692 | | | |
| Total cost of sales | 291,648 | | | 323,798 | | | 351,861 | | | |
| Gross profit | 196,421 | | | 214,233 | | | 263,778 | | | |
| Operating expenses: | | | | | | | |
| Selling, general and administrative | 210,172 | | | 244,181 | | | 227,697 | | | |
| Research and development | 89,466 | | | 87,071 | | | 69,150 | | | |
Impairments of goodwill and intangible assets | 302,787 | | | — | | | — | | | |
| Total operating expenses | 602,425 | | | 331,252 | | | 296,847 | | | |
| Loss from operations | (406,004) | | | (117,019) | | | (33,069) | | | |
Interest and other income (expense), net | 43,692 | | | (3,790) | | | 352,609 | | | |
(Loss) income before income taxes | (362,312) | | | (120,809) | | | 319,540 | | | |
Benefit (provision) for income taxes | 641 | | | (2,140) | | | 2,512 | | | |
Loss on equity method investment, net of income taxes | (1,282) | | | — | | | — | | | |
| Net (loss) income before redeemable non-controlling interest | (362,953) | | | (122,949) | | | 322,052 | | | |
Less: net loss attributable to redeemable non-controlling interest | (265) | | | (238) | | | — | | | |
| Net (loss) income attributable to 3D Systems Corporation | $ | (362,688) | | | $ | (122,711) | | | $ | 322,052 | | | |
| | | | | | | |
| Net (loss) income per common share: | | | | | | | |
| Basic | $ | (2.79) | | | $ | (0.96) | | | $ | 2.62 | | | |
| Diluted | $ | (2.79) | | | $ | (0.96) | | | $ | 2.55 | | | |
| | | | | | | |
| Weighted average shares outstanding: | | | | | | | |
| Basic | 129,944 | | | 127,818 | | | 122,867 | | | |
| Diluted | 129,944 | | | 127,818 | | | 126,334 | | | |
See accompanying notes to consolidated financial statements.
3D SYSTEMS CORPORATION
CONSOLIDATED STATEMENTS OF COMPREHENSIVE (LOSS) INCOME | | | | | | | | | | | | | | | | | |
| Year Ended December 31, |
| (in thousands) | 2023 | | 2022 | | 2021 |
| Net (loss) income before redeemable non-controlling interest | $ | (362,953) | | | $ | (122,949) | | | $ | 322,052 | |
| Other comprehensive (loss) income, net of taxes: | | | | | |
Pension plan adjustment | (386) | | | 2,942 | | | 682 | |
| Derivative financial instruments | — | | | — | | | 721 | |
| Foreign currency translation | 9,630 | | | (18,730) | | | (39,546) | |
Unrealized gain (loss) on short-term investments | 108 | | | (3,557) | | | — | |
Amounts reclassified from accumulated other comprehensive income (loss) | 220 | | | 3,229 | | | — | |
| Foreign currency translation reclassification - sales of businesses | — | | | — | | | 8,912 | |
Total other comprehensive income (loss), net of taxes: | 9,572 | | | (16,116) | | | (29,231) | |
| Total comprehensive (loss) income, net of taxes | (353,381) | | | (139,065) | | | 292,821 | |
| Less: comprehensive loss attributable to redeemable non-controlling interest | (265) | | | (238) | | | — | |
| Comprehensive (loss) income attributable to 3D Systems Corporation | $ | (353,116) | | | $ | (138,827) | | | $ | 292,821 | |
See accompanying notes to consolidated financial statements.
3D SYSTEMS CORPORATION
CONSOLIDATED STATEMENTS OF CASH FLOWS | | | | | | | | | | | | | | | | | |
| Year Ended December 31, |
| (in thousands) | 2023 | | 2022 | | 2021 |
| Cash flows from operating activities: | | | | | |
| Net (loss) income before redeemable non-controlling interest | $ | (362,953) | | | $ | (122,949) | | | $ | 322,052 | |
| Adjustments to reconcile net (loss) income to net cash (used in) provided by operating activities: | | | | | |
| Depreciation, amortization and accretion of debt discount | 36,053 | | | 38,686 | | | 34,623 | |
| Stock-based compensation | 23,504 | | | 42,415 | | | 55,153 | |
| | | | | |
| Loss on short-term investments | 6 | | | 3,146 | | | — | |
| Non-cash operating lease expense | 9,267 | | | 6,366 | | | 5,681 | |
| Provision for inventory obsolescence and revaluation | 6,350 | | | 2,586 | | | (2,909) | |
| Loss on hedge accounting de-designation and termination | — | | | — | | | 721 | |
| Provision for bad debts | 595 | | | 562 | | | 232 | |
| Loss (gain) on the disposition of businesses, property, equipment and other assets | 6 | | | 104 | | | (350,846) | |
| Gain on debt extinguishment | (32,181) | | | — | | | — | |
Benefit for deferred income taxes and reserve adjustments | (2,412) | | | (2,518) | | | (11,679) | |
Loss on equity method investment | 1,282 | | | — | | | — | |
Impairments of assets | 304,698 | | | 4,095 | | | 1,676 | |
| Changes in operating accounts: | | | | | |
| Accounts receivable | (6,186) | | | 8,144 | | | (11,912) | |
| Inventories | (20,555) | | | (51,082) | | | 7,866 | |
| Prepaid expenses and other current assets | (7,961) | | | 8,229 | | | (8,106) | |
| Accounts payable | (5,526) | | | (3,787) | | | 27,159 | |
| Deferred revenue and customer deposits | 1,245 | | | (6,947) | | | (3,325) | |
| Accrued and other liabilities | (12,933) | | | 10,702 | | | (12,389) | |
| All other operating activities | (12,994) | | | (7,773) | | | (5,850) | |
| Net cash (used in) provided by operating activities | (80,695) | | | (70,021) | | | 48,147 | |
| Cash flows from investing activities: | | | | | |
| Purchases of property and equipment | (27,183) | | | (20,907) | | | (18,791) | |
| Purchases of short-term investments | — | | | (384,388) | | | — | |
| Sales and maturities of short-term investments | 180,925 | | | 200,314 | | | — | |
| Proceeds from sale of assets and businesses, net of cash sold | 194 | | | 325 | | | 421,485 | |
| Acquisitions and other investments, net of cash acquired | (29,152) | | | (103,699) | | | (139,685) | |
| Other investing activities | — | | | — | | | (2,454) | |
Net cash provided by (used in) investing activities | 124,784 | | | (308,355) | | | 260,555 | |
| Cash flows from financing activities: | | | | | |
| | | | | |
| | | | | |
| Proceeds from borrowings | — | | | — | | | 460,000 | |
| Debt issuance costs | — | | | — | | | (13,466) | |
| Repayment of borrowings/long-term debt | (100,614) | | | — | | | (21,392) | |
| | | | | |
| Purchase of non-controlling interests | — | | | (2,300) | | | (6,300) | |
| Taxes paid related to net-share settlement of equity awards | (5,211) | | | (10,864) | | | (12,619) | |
| | | | | |
| Other financing activities | (644) | | | (651) | | | (423) | |
| Net cash (used in) provided by financing activities | (106,469) | | | (13,815) | | | 405,800 | |
| Effect of exchange rate changes on cash, cash equivalents and restricted cash | 3,516 | | | (5,804) | | | (9,243) | |
| Net (decrease) increase in cash, cash equivalents and restricted cash | (58,864) | | | (397,995) | | | 705,259 | |
Cash, cash equivalents and restricted cash at the beginning of the year a | 391,975 | | | 789,970 | | | 84,711 | |
Cash, cash equivalents and restricted cash at the end of the year a | $ | 333,111 | | | $ | 391,975 | | | $ | 789,970 | |
| | | | | | | | | | | | | | | | | |
| Supplemental cash flow information | | | | | |
| Lease assets obtained in exchange for new lease liabilities | $ | 38,037 | | | $ | 6,037 | | | $ | 4,502 | |
| Cash interest payments | 478 | | | 196 | | | 1,138 | |
| Cash income tax payments, net | 3,898 | | | 5,330 | | | 4,709 | |
Transfer of equipment from inventory to property and equipment, net b | 2,098 | | | (2,004) | | | 1,738 | |
| | | | | |
| | | | | |
| Stock issued for acquisition | — | | | 7,091 | | | 99,044 | |
| | | | | |
| | | | | |
(a)The amounts for cash and cash equivalents shown above include restricted cash of $119, $114 and $313 as of December 31, 2023, 2022 and 2021, respectively, which are included in prepaid expenses and other current assets. In addition, included in cash and cash equivalents above as of December 31, 2023 and 2022 is $1,467 and $3,727 of restricted cash, which is included in other assets.
(b)Inventory is transferred to property and equipment at cost when we require additional machines for training or demonstration or for placement into on demand manufacturing services locations.
See accompanying notes to consolidated financial statements.
3D SYSTEMS CORPORATION
CONSOLIDATED STATEMENTS OF STOCKHOLDERS' EQUITY
Years Ended December 31, 2023, 2022 and 2021
| | | | | | | | | | | | | | | | | | | | | | | | | | | | | | | | | | | | | | | | | | | |
| Common Stock | | | | | | | | | | | | |
| (in thousands, except par value) | Shares | | Par Value $0.001 | | Additional Paid-In Capital | | Treasury Stock | | Accumulated Deficit | | Accumulated Other Comprehensive Income (Loss) | | | | Total Stockholders' Equity |
| December 31, 2020 | 127,626 | | | $ | 128 | | | $ | 1,404,964 | | | $ | (22,590) | | | $ | (943,303) | | | $ | (8,476) | | | | | $ | 430,723 | |
| Issuance (repurchase) of stock | 813 | | | — | | | (12,620) | | | — | | | — | | | — | | | | | (12,620) | |
| Shares issued to acquire assets and businesses | 3,430 | | | 3 | | | 99,041 | | | — | | | — | | | — | | | | | 99,044 | |
| Stock-based compensation expense | — | | | — | | | 32,412 | | | — | | | — | | | — | | | | | 32,412 | |
| Net income attributable to 3D Systems Corp. | — | | | — | | | — | | | — | | | 322,052 | | | — | | | | | 322,052 | |
| Pension plan adjustment | — | | | — | | | — | | | — | | | — | | | 181 | | | | | 181 | |
| Gain on pension plan - unrealized | — | | | — | | | — | | | — | | | — | | | 501 | | | | | 501 | |
| De-designation of derivative instrument | — | | | — | | | — | | | — | | | — | | | 721 | | | | | 721 | |
| Retirement of treasury shares | (3,494) | | | (3) | | | (22,587) | | | 22,590 | | | — | | | — | | | | | — | |
| Foreign currency translation adjustment | — | | | — | | | — | | | — | | | — | | | (30,633) | | | | | (30,633) | |
| December 31, 2021 | 128,375 | | | 128 | | | 1,501,210 | | | — | | | (621,251) | | | (37,706) | | | | | 842,381 | |
| Shares issued, vested & expired under equity incentive plans | 2,783 | | | 3 | | | — | | | — | | | — | | | — | | | | | 3 | |
| Shares withheld related to net-share settlement of equity awards | (746) | | | (1) | | | (10,863) | | | — | | | — | | | — | | | | | (10,864) | |
| Shares issued to acquire assets and businesses | 795 | | | 1 | | | 7,090 | | | — | | | — | | | — | | | | | 7,091 | |
| Stock-based compensation expense | — | | | — | | | 50,756 | | | — | | | — | | | — | | | | | 50,756 | |
| Net (loss) attributable to 3D Systems Corp. | — | | | — | | | — | | | — | | | (122,711) | | | — | | | | | (122,711) | |
| Pension plan adjustment | — | | | — | | | — | | | — | | | — | | | 2,942 | | | | | 2,942 | |
| | | | | | | | | | | | | | | |
| | | | | | | | | | | | | | | |
| | | | | | | | | | | | | | | |
| Unrealized loss on short-term investments | — | | | — | | | — | | | — | | | — | | | (328) | | | | | (328) | |
| Redeemable non-controlling interest redemption value in excess of carrying value | — | | | — | | | (596) | | | — | | | — | | | — | | | | | (596) | |
| Foreign currency translation adjustment | — | | | — | | | — | | | — | | | — | | | (18,730) | | | | | (18,730) | |
| December 31, 2022 | 131,207 | | | 131 | | | 1,547,597 | | | — | | | (743,962) | | | (53,822) | | | | | 749,944 | |
| Shares issued, vested & expired under equity incentive plans | 3,033 | | | 3 | | | — | | | — | | | — | | | — | | | | | 3 | |
| Shares withheld related to net-share settlement of equity awards | (621) | | | — | | | (5,211) | | | — | | | — | | | — | | | | | (5,211) | |
| | | | | | | | | | | | | | | |
| Stock-based compensation expense | — | | | — | | | 35,612 | | | — | | | — | | | — | | | | | 35,612 | |
| Net (loss) attributable to 3D Systems Corp. | — | | | — | | | — | | | — | | | (362,688) | | | — | | | | | (362,688) | |
| Pension plan adjustment | — | | | — | | | — | | | — | | | — | | | (386) | | | | | (386) | |
| | | | | | | | | | | | | | | |
| | | | | | | | | | | | | | | |
| | | | | | | | | | | | | | | |
| Unrealized loss on short-term investments | — | | | — | | | — | | | — | | | — | | | 328 | | | | | 328 | |
| Redeemable non-controlling interest redemption value in excess of carrying value | — | | | — | | | (479) | | | — | | | — | | | — | | | | | (479) | |
| Foreign currency translation adjustment | — | | | — | | | — | | | — | | | — | | | 9,630 | | | | | 9,630 | |
| December 31, 2023 | 133,619 | | | $ | 134 | | | $ | 1,577,519 | | | $ | — | | | $ | (1,106,650) | | | $ | (44,250) | | | | | $ | 426,753 | |
See accompanying notes to consolidated financial statements.
3D SYSTEMS CORPORATION
NOTES TO THE CONSOLIDATED FINANCIAL STATEMENTS
(1) Overview and Basis of Presentation
Nature of Business
3D Systems Corporation (“3D Systems” or the “Company” or “we” or “our” or “us”) provides comprehensive 3D printing and digital manufacturing solutions, including 3D printers for plastics and metals, materials, software, and services, including maintenance, advanced manufacturing and applications engineering. We market our products and services through subsidiaries in North America and South America (collectively referred to as "Americas"), Europe and the Middle East (collectively referred to as "EMEA"), and Asia Pacific and Oceania (collectively referred to as "APAC"). Our solutions support advanced applications in two key verticals: Healthcare Solutions (which includes, dental, medical devices, personalized health services and regenerative medicine) and Industrial Solutions (which includes aerospace, defense, transportation and general manufacturing).
Basis of Presentation
The consolidated financial statements have been prepared in accordance with accounting principles generally accepted in the United States (“GAAP”). The consolidated financial statements include the accounts of the Company, including all majority and wholly-owned subsidiaries and entities in which a controlling interest is maintained. All significant intercompany accounts and transactions have been eliminated in consolidation. Certain prior period amounts have been reclassified to conform to the current year presentation.
A non-controlling interest in a subsidiary reflects an ownership interest in a majority-owned subsidiary that is not attributable to the Company. For the periods presented, the Company's financial statements include a redeemable non-controlling interest (“RNCI”), which has been reported in temporary equity in the consolidated balance sheets. The net loss attributable to the RNCI is presented as an adjustment to the Company's consolidated net (loss) income to arrive at net (loss) income attributable to 3D Systems Corporation in the consolidated statements of operations and consolidated statements of comprehensive (loss) income. Furthermore, adjustments to record the RNCI at its redemption value are recorded to additional paid-in capital, and the excess redemption value is recognized as a reduction to net income, or increase to net loss, attributable to 3D Systems’ shareholders for purposes of reporting earnings or loss per share. See Note 15 for a summary of the activity related to the reported RNCI balance during the periods presented.
Our annual reporting period is the calendar year. All dollar and share amounts and other amounts presented in the accompanying footnotes are presented in thousands, except for per share information.
(2) Significant Accounting Policies
Use of Estimates
The preparation of financial statements in conformity with GAAP requires us to make estimates and assumptions that affect (1) the reported amounts of assets and liabilities and the disclosure of contingent assets and liabilities as of the balance sheet dates and (2) the reported amounts of revenues and expenses during the reporting periods. We base our estimates on historical experience, currently available information and various other assumptions that we believe are reasonable under the circumstances. Actual results could differ from these estimates.
Revenue Recognition
We account for revenue in accordance with Accounting Standards Codification ("ASC") Topic 606, “Revenue from Contracts with Customers.” Collaborative revenue contracts, for which the collaboration partner meets the definition of a customer, are recorded in accordance with ASC Topic 606; otherwise, the collaborative arrangements are recorded in accordance with ASC 808, "Collaborative Arrangements". See Note 5 for further discussion.
Cash and Cash Equivalents
Cash and cash equivalents consist of cash and highly liquid investments with maturities of three months or less when acquired. At times, cash and cash equivalents balances may be in excess of FDIC insurance limits.
3D SYSTEMS CORPORATION
NOTES TO THE CONSOLIDATED FINANCIAL STATEMENTS
Short-Term Investments
At times, the Company has invested a portion of its excess cash in short-term investments. The Company's short-term investment accounting policy is that securities with maturities greater than 90 days at the time of purchase that are available for operations in the next 12 months are classified as short-term investments. The Company’s short-term investments primarily consist of investment grade bonds, certificates of deposit, commercial paper, and short maturity bond funds, all with a remaining maturity of generally less than twelve months at the date of purchase and classified as available-for-sale. Interest and dividends on these investments are recorded into income when earned.
Available-for-sale securities, which consist of debt securities, are carried at fair value with unrealized gains and losses, net of related tax, reported in other comprehensive (loss) income. Adjustments to the fair value of investments classified as available-for-sale are recorded as an increase or decrease in accumulated other comprehensive income (loss) in shareholders’ equity. Impairment of available-for-sale securities that is attributable to credit losses is recognized as an allowance for credit losses, net of taxes, in the consolidated statement of operations in the period in which a credit loss is identified. The Company periodically evaluates its investment for credit losses.
Variable Interest Entities (VIEs)
Upon making an investment in an entity, we assess whether the entity is a VIE. The determination of whether an entity in which we hold a direct or indirect variable interest is a VIE is based on several factors, including whether the entity’s total equity investment at risk upon inception is sufficient to finance the entity’s activities without additional subordinated financial support. We make judgments regarding the sufficiency of the equity at risk based first on a qualitative analysis, and then a quantitative analysis, if necessary.
We analyze any investments in VIEs to determine if we are the primary beneficiary. We perform this assessment at the time that we become involved with a VIE and reevaluate our conclusion upon the occurrence of a reconsideration event. In evaluating whether we are the primary beneficiary, we evaluate our direct and indirect economic interests in the entity. Determining which reporting entity, if any, is the primary beneficiary of a VIE is primarily a qualitative approach focused on identifying which reporting entity has both (1) the power to direct the activities of a VIE that most significantly impact such entity’s economic performance and (2) the obligation to absorb losses or the right to receive benefits from such entity that could potentially be significant to such entity. Performance of such analysis requires the exercise of judgment, and we consider a variety of factors in identifying the entity that holds the power to direct matters that most significantly impact a VIE’s economic performance including, but not limited to, the ability to direct a VIE’s operating decisions and activities. In addition, we consider the rights of other investors to participate in those decisions.
We concluded that our investments in Theradaptive and the National Additive Manufacturing Innovation ("NAMI") joint venture are each investments in a VIE. These entities in which we have invested are not consolidated because we concluded that the Company is not the primary beneficiary. As of December 31, 2023, our maximum exposure to losses associated with these VIEs is limited to the $13,247 carrying value of our investments in the VIEs, which is included in other assets on our consolidated balance sheets. Refer to Note 10 for additional details regarding our investments in Theradaptive and NAMI. We have no other investments in unconsolidated entities that have been determined to be VIEs.
Non-Current Investments
We recognize investments in equity securities without a readily determinable fair value at cost minus impairment. We assess these investments for potential impairment if an event occurs or circumstances change that would indicate the carrying amount may be impaired. Impairments of equity securities without a readily determinable fair value are recorded to interest and other income (expense), net in the consolidated statements of operations in the period in which they become impaired. Declines in the fair value of investments in debt securities due to credit losses are recorded as an allowance for credit losses in the consolidated statement of operations in the period in which a credit loss is identified.
For the years ended December 31, 2023, 2022, and 2021, we recorded impairment charges of $0, $2,900 and $0, respectively, related to non-current investments. The aggregate carrying amount of all non-current investments totaled $26,829 and $13,668 at December 31, 2023 and 2022, respectively, and is included in other assets on our consolidated balance sheets.
Equity Method of Accounting
The Company accounts for its investment in a joint venture using the equity method of accounting because it does not have a controlling interest and is not the primary beneficiary; however, the Company has the ability to exert significant influence.
3D SYSTEMS CORPORATION
NOTES TO THE CONSOLIDATED FINANCIAL STATEMENTS
Under the equity method of accounting, this initial investment was recorded at cost, and the investment is subsequently adjusted for the Company’s proportionate share of the net earnings or losses and other comprehensive income or loss of the investee. Intra-entity profits or losses associated with the Company’s equity method investment are eliminated until realized by the investee in transactions with third parties. Income or loss from this investment is recorded as a separate line item in the consolidated statements of operations on a three-month lag. We evaluate material events occurring during the three-month lag period to determine whether the effects of such events should be disclosed in our financial statements. The Company evaluates its investment in the joint venture for impairment whenever events or changes in circumstances indicate that the carrying amount of the investment may not be recoverable. Refer to Note 10.
Accounts Receivable and Allowance for Doubtful Accounts
Trade accounts receivable are recorded at the invoiced amount and do not bear interest. In evaluating the collectability of accounts receivable, we assess a number of factors, including specific customers’ ability to meet their financial obligations to us, the length of time receivables are past due, historical collection experience, current economic conditions, and reasonable and supportable forecasts. Based on these assessments, we may record a reserve for specific customers, as well as a general reserve and allowance for expected credit losses. If circumstances related to specific customers change, or economic conditions deteriorate such that our past collection experience is no longer relevant, our estimate of the recoverability of accounts receivable could be further reduced from the levels provided for in the consolidated financial statements. As of December 31, 2023, no single customer represented more than 10% of our consolidated accounts receivable balance. As of December 31, 2022, one customer represented greater than 10% of our consolidated accounts receivable balance.
The following presents the changes in the balance of our allowance for doubtful accounts:
| | | | | | | | | | | | | | | | | | | | | | | | | | | | | | | | |
| Year | | Item | | Balance at beginning of year | | Additions charged to expense | | Other (a) | | Balance at end of year |
| 2023 | | Allowance for doubtful accounts | | $ | 3,114 | | | $ | 595 | | | $ | (320) | | | $ | 3,389 | |
| 2022 | | Allowance for doubtful accounts | | 2,445 | | | 562 | | | 107 | | | 3,114 | |
| 2021 | | Allowance for doubtful accounts | | 4,392 | | | 232 | | | (2,179) | | | 2,445 | |
(a)Other includes the impact of write-offs, recoveries, divestitures and foreign currency translation adjustments.
Inventories
Inventories are stated at the lower of cost or net realizable value, with cost reflecting standard cost, which approximates the first-in, first-out method. Capitalized inventory costs include materials, labor, and manufacturing overhead that relate to the acquisition of raw materials and production into finished goods. The Company regularly reviews inventory for excess and obsolescence and records a provision to write down inventory to its net realizable value when carrying value is in excess of such value.
Property and Equipment
Property and equipment are recorded at cost and are depreciated over their estimated useful lives using the straight-line method. Upon retirement or sale, the cost of assets disposed of and the related accumulated depreciation are removed from the accounts and any resulting gain or loss is included in the determination of net income or loss. Repairs and maintenance costs are expensed as incurred.
Long-Lived Assets and Goodwill
Long-Lived Assets
We review long-lived assets for impairment whenever events or changes in circumstances indicate that the carrying value of the asset may not be recoverable. Recoverability is assessed for the carrying value of assets held for use based on a review of undiscounted projected cash flows. Impairment losses, where identified, are measured as the excess of the carrying value of a long-lived asset over its estimated fair value as determined by discounted projected cash flows. Refer to Note 7 for details regarding impairment charges that were recorded related to tangible long-lived assets with finite lives for the years ended December 31, 2023, 2022, and 2021.
3D SYSTEMS CORPORATION
NOTES TO THE CONSOLIDATED FINANCIAL STATEMENTS
Intangible Assets (Excluding Goodwill)
Intangible assets include patents, trade names, customer relationships, acquired technology, and IPR&D. Intangible assets with a finite life are (1) amortized on a straight-line basis, with estimated useful lives typically ranging from 2 to 20 years, and (2) assessed for impairment whenever events or changes in circumstances indicate that their carrying value may not be recoverable, consistent with the Company's accounting policy for other long-lived assets with a finite life. Amortization is recognized within selling, general and administrative expense on the consolidated statements of operations.
Acquired IPR&D represents the fair value assigned to those research and development ("R&D") projects that were acquired in a business combination for which the related products have not received regulatory approval or commercial viability and have no alternative future use. IPR&D is capitalized at its fair value as an indefinite-lived intangible asset, and any development costs incurred after the acquisition are expensed as incurred. The fair value of IPR&D is determined by estimating the future cash flows of each project and discounting the net cash flows back to their present values. Upon achieving regulatory approval or commercial viability for the related product, the indefinite-lived intangible asset is accounted for as a finite-lived asset and is amortized on a straight-line basis over the estimated useful life. If the project is not completed or is terminated or abandoned, the Company may have to recognize an impairment related to the IPR&D, which is charged to expense. Indefinite-lived intangible assets are tested for impairment annually in the fourth quarter of the fiscal year and whenever events or changes in circumstances indicate that the carrying amount may be impaired. Impairment is calculated as the excess of the asset’s carrying value over its fair value. Fair value is generally determined using a discounted future cash flow analysis. IPR&D with no alternative future use acquired outside of a business combination is expensed immediately.
During the year ended December 31, 2023, we recorded impairment charges totaling $22,979 related to intangible assets. Refer to Note 8 for additional details. No impairment charges were recorded for intangible assets for the years ended December 31, 2022 and 2021.
Goodwill
Goodwill is the excess of the cost of an acquired entity over the amounts assigned to the assets acquired and liabilities assumed in a business combination. Goodwill is not amortized. Goodwill is tested for impairment annually, and is tested for impairment between annual tests if an event occurs or circumstances change that would indicate the carrying amount may be impaired. Impairment testing for goodwill is performed at the reporting unit level, with all goodwill assigned to a reporting unit.
During the fourth quarter of 2023, we elected to change the annual goodwill impairment testing date for each of our reporting units from November 30th to November 1st and, accordingly, we have performed our impairment tests for the current fiscal year as of November 1, 2023. The Company does not believe that this change to the annual impairment testing date represents a material change in the method of applying an accounting principle. This voluntary change is preferable because it provides management with sufficient time to complete goodwill impairment tests in advance of the Company’s year-end financial reporting and provides additional time for the execution of key controls and management review over the significant estimates and judgements inherent in the performance of the test. This change to the goodwill impairment testing date has not been applied retrospectively as it is impracticable to do so without applying hindsight when developing key assumptions and estimates required to perform the test.
The testing of goodwill for impairment requires the Company to make several estimates related to projected future cash flows to determine the fair value of the reporting units to which goodwill has been assigned. The Company determines whether each reporting unit's fair value exceeds its carrying amount, including goodwill, utilizing a discounted cash flow analysis and other valuation techniques, as deemed appropriate. Internal operational budgets and long-range strategic plans are used as a basis for the cash flow analysis. The Company also utilizes assumptions related to working capital, capital expenditures, and terminal growth rates. The discount rate applied to the cash flow analysis is based on the weighted average cost of capital (“WACC”) for each reporting unit. An impairment is recognized when the carrying amount of the reporting unit’s net assets exceeds the estimated fair value of the reporting unit.
For a summary of our goodwill by reporting unit and discussion of the goodwill impairment charge recorded for the year ended December 31, 2023, see Note 9. No impairment charges were recorded related to goodwill for the years ended December 31, 2022 and 2021.
3D SYSTEMS CORPORATION
NOTES TO THE CONSOLIDATED FINANCIAL STATEMENTS
Contingencies
We follow the provisions of ASC 450, “Contingencies,” which requires that an estimated loss from a loss contingency be accrued by a charge to income if (1) it is probable that an asset has been impaired or that a liability has been incurred and (2) the amount of the loss can be reasonably estimated. Legal costs related to the defense or settlement of a loss contingency are expensed when such costs are incurred and, accordingly, future legal costs expected to be incurred are not accrued as part of the liability recorded when a loss contingency has been deemed probable and estimable.
Foreign Currency Translation and Transactions
The local currency in which a subsidiary operates is generally considered its functional currency for those subsidiaries domiciled outside the United States ("foreign subsidiaries"). The functional currency financial statements of foreign subsidiaries are translated to U.S. dollars ("USD") in connection with the preparation of the Company's consolidated financial statements. Assets and liabilities of foreign subsidiaries are translated to USD at month-end exchange rates applicable to the reporting period. Income and expense items are translated to USD monthly using monthly average exchange rates. The effects of translating a foreign subsidiary's financial statements are recorded as currency translation adjustments and reported as a component of accumulated other comprehensive income (loss) in shareholders’ equity.
Foreign currency transactions are those transactions whose terms are denominated in a currency other than an entity's functional currency. Foreign currency transactions that remain unsettled as of the end of a reporting period must be remeasured into the entity's functional currency, resulting in the recognition of a gain or loss when a change in exchange rate has occurred subsequent to the date on which the transaction was originally recognized or was most recently remeasured. The Company recognizes foreign currency transaction gains and losses within interest and other income (expense), net on its consolidated statements of operations. See Note 18.
Derivative Financial Instruments
We are exposed to market risk from changes in interest rates, foreign currency exchange rates and commodity prices, which may adversely affect our results of operations and financial condition. We seek to minimize these risks through regular operating and financing activities and, when we consider it to be appropriate, through the use of derivative financial instruments. We do not purchase, hold or sell derivative financial instruments for trading or speculative purposes.
We may use derivative financial instruments to manage our exposure to changes in interest rates on outstanding debt instruments. For those financial instruments that qualify for cash flow hedge accounting treatment under ASC 815, “Derivatives and Hedging,”, and where we elect to prepare and maintain the documentation required to qualify for cash flow hedge accounting treatment, gains and losses (realized or unrealized) are recognized in accumulated other comprehensive income (loss) and are reclassified into earnings when the underlying transaction is recognized in net earnings. Depending on the fair value at the end of the reporting period, derivatives are recorded either in prepaid and other current assets or in accrued and other liabilities on the consolidated balance sheets.
We and our subsidiaries conduct business in various countries using both functional currencies and other currencies to effect cross-border transactions. As a result, we and our subsidiaries are subject to the risk that fluctuations in foreign currency exchange rates between the dates that non-functional currency transactions are entered into and their respective settlement dates will result in a foreign currency exchange gain or loss. When practicable, we endeavor to match assets and liabilities in the same currency on our U.S. balance sheet and those of our subsidiaries in order to reduce these risks. We may enter into foreign currency exchange contracts to hedge the exposure arising from foreign currency transactions.
For our hedges of foreign currency exchange rates and commodity prices, we have elected to not prepare and maintain the documentation to qualify for hedge accounting treatment under ASC 815, “Derivatives and Hedging.” Accordingly, changes in fair value are recognized in interest and other income (expense), net on the consolidated statements of operations and, depending on the fair value at the end of the reporting period, derivatives are recorded either in prepaid expenses and other current assets or in accrued and other liabilities on the consolidated balance sheets.
We are exposed to credit risk if the counterparties to our derivative transactions are unable to perform their obligations. However, we seek to minimize such risk by entering into transactions with counterparties that are believed to be creditworthy financial institutions.
As of December 31, 2023 and 2022, we did not hold any derivative or hedging financial instruments.
3D SYSTEMS CORPORATION
NOTES TO THE CONSOLIDATED FINANCIAL STATEMENTS
Research and Development Costs
R&D costs, consisting primarily of employee compensation, operating supplies, facility costs and depreciation, are expensed as incurred. When the Company is reimbursed by a collaboration partner for work the Company performs, it records the costs incurred as R&D expense and the related reimbursement as a reduction to R&D expense in its consolidated statements of operations.
Earnings (Loss) Per Share
Basic earnings (loss) per share is calculated using the weighted-average number of common shares outstanding during each period. Diluted earnings per share is calculated based upon the inclusion of additional dilutive and potentially dilutive shares, which include shares issuable upon exercise of outstanding stock options, upon vesting of employee restricted stock-based awards, upon the accrual of incentive compensation to be paid in shares (if any performance-based conditions have been satisfied as of the end of the reporting period), and to settle the portion of the convertible notes that may be settled in shares (where the conversion of such instruments would be dilutive). See Note 20.
Advertising Costs
Advertising costs are expensed as incurred and recorded in selling, general and administrative expense. Advertising costs, including trade shows, were $7,124, $7,255 and $5,486 for the years ended December 31, 2023, 2022 and 2021, respectively.
Pension Costs
We sponsor a retirement benefit for one of our non-U.S. subsidiaries in the form of a defined benefit pension plan. Accounting standards require the cost of providing this pension benefit be measured on an actuarial basis. Actuarial gains and losses resulting from both normal year-to-year changes in valuation assumptions and differences between assumptions and actual experience are deferred and amortized. The application of these accounting standards require us to make assumptions and judgements that can significantly affect these measurements. Our critical assumptions in performing these actuarial valuations include the selection of the discount rate to determine the present value of the pension obligations, which affects the amount of pension expense recorded in any given period. Changes in the discount rate could have a material effect on our reported pension obligations and related pension expense. See Note 14.
Equity Compensation Plans
We recognize compensation expense for our stock-based compensation programs, which provide for the issuance of stock options, restricted stock, restricted stock units (“RSU”), performance-based awards and market-based awards. The fair value of service-based awards is estimated at the grant date and recognized as expense ratably over the requisite service period of the award.
The fair value of performance-based awards is estimated on the grant date and expensed over an implicit or explicit service period when the performance condition is deemed probable of achievement. Performance-based awards that cliff vest are expensed ratably using the straight-line method; whereas, performance-based awards with graded vesting features are expensed using the graded vesting method. Stock compensation expense recorded for performance-based awards is reversed if the performance condition is no longer deemed probable of achievement or ultimately is not met. Some RSUs are granted with a performance measure derived from non-GAAP-based management targets or non-financial targets. Depending on our performance with respect to these metrics, the number of RSUs earned may be less than, equal to or greater than the original number of RSUs awarded, subject to a payout range.
The fair value of awards with market conditions ("market-based awards") is determined using a Monte Carlo valuation model and is expensed over an implicit or explicit service period regardless of whether the market condition is probable of achievement or not. Market-based awards that cliff vest are expensed ratably using the straight-line method; whereas, market-based awards with graded vesting features are expensed using the graded vesting method. Stock compensation expense is not reversed if the market condition is not met.
For all share-based payment awards, we recognize forfeitures when they occur.
3D SYSTEMS CORPORATION
NOTES TO THE CONSOLIDATED FINANCIAL STATEMENTS
Income Taxes
We and the majority of our domestic subsidiaries file a consolidated U.S. federal income tax return, while four of our domestic entities file separate U.S. federal income tax returns. Our non-U.S. subsidiaries file income tax returns in their respective jurisdictions.
Income taxes are accounted for under the asset and liability method. Deferred income tax assets and liabilities are recognized for the future tax consequences attributable to differences between the financial statement carrying amounts of existing assets and liabilities and their respective tax bases and for tax benefit carryforwards. Our deferred income tax assets and liabilities at the end of each period are determined using enacted tax rates.
We establish a valuation allowance for those jurisdictions in which the expiration date of tax benefit carryforwards or projected taxable earnings leads us to conclude that it is “more likely than not” that a deferred tax asset will not be realized. This evaluation process includes the consideration of all available evidence regarding historical results and future projections, including the estimated timing of reversals of existing taxable temporary differences and potential tax planning strategies. Once a valuation allowance is established, it is maintained until a change in factual circumstances gives rise to sufficient income of the appropriate character and timing that will allow a partial or full utilization of the deferred tax asset.
In accordance with ASC 740, “Income Taxes,” the impact of an uncertain tax position on our income tax returns is recognized at the largest amount that is more likely than not to be required to be recognized upon audit by the relevant taxing authority.
We include interest and penalties accrued in the consolidated financial statements as a component of income tax expense. For the years ended December 31, 2023, 2022 and 2021, interest and penalties reported in income tax expense totaled $39, $76, and $55.
See Note 19 for further discussion.
Operating and Finance Leases
We determine if an arrangement contains a lease at inception. We record both operating leases and finance leases on our balance sheet and do not separate non-lease components from our real estate leases. We exclude leases with a term of one year of less from our balance sheet.
Some leases include the option to purchase the leased asset, terminate the lease or extend the lease for one or more years. These options are considered in the determination of the estimated lease term when it is reasonably certain that an option will be exercised. Our leases do not contain any material residual value guarantees or material restrictive covenants.
Most of our leases do not provide an implicit rate; therefore, we use our incremental borrowing rate based on information available at the lease commencement date to determine the present value of the future lease payments.
Certain of our leases include variable costs. Variable costs include non-lease components that are incurred based upon actual terms, rather than contractually fixed amounts. In addition, variable costs are incurred for lease payments that are indexed to a change in rate or index. Because the right-of-use ("ROU") assets recorded on the balance sheet are determined based upon factors considered at the lease commencement date, subsequent changes in the rate or index that were not contemplated in the ROU asset balances at lease commencement result in variable expenses being recorded when these expenses are incurred during the lease term. See Note 11.
3D SYSTEMS CORPORATION
NOTES TO THE CONSOLIDATED FINANCIAL STATEMENTS
Recent Accounting Pronouncements
Recently Issued Accounting Pronouncements Not Yet Adopted
In November 2023, the Financial Accounting Standards Board (“FASB”) issued Accounting Standards Update ("ASU") No. 2023-07, "Segment Reporting (Topic 280) - Improvements to Reportable Segment Disclosures." This ASU expands upon existing reportable segment disclosure requirements by requiring the disclosure of significant reportable segment expenses that are regularly provided to the Chief Operating Decision Maker (“CODM”) and included within each reported measure of a segment's profit or loss, as well as conforming interim period disclosures with annual period disclosures. This ASU also requires disclosure of the title and position of the individual identified as the CODM and an explanation of how the CODM uses the reported measures of a segment’s profit or loss in assessing segment performance and deciding how to allocate resources. The ASU is effective for annual periods beginning after December 15, 2023, and interim periods within fiscal years beginning after December 15, 2024. Adoption of the ASU should be applied retrospectively to all prior periods presented in the financial statements. Early adoption is also permitted. Upon adoption, this ASU is expected to result in the inclusion of additional segment-related disclosures in the footnotes to our consolidated financial statements. We are evaluating the provisions of this ASU and currently expect to adopt the new annual disclosure requirements as of the fourth quarter of our fiscal year ending December 31, 2024.
In December 2023, the FASB issued ASU No. 2023-09, "Income Taxes (Topic 740) - Improvements to Income Tax Disclosures." The ASU requires disaggregated information about a reporting entity’s effective tax rate reconciliation, as well as additional information on income taxes paid. The ASU is effective on a prospective basis for annual periods beginning after December 15, 2024. Early adoption is also permitted for annual financial statements that have not yet been issued or made available for issuance. Upon adoption, this ASU is expected to result in the inclusion of additional tax-related disclosures in the footnotes to our consolidated financial statements.
Recently Adopted Accounting Standards
In October 2021, the Financial Accounting Standard Board ("FASB") issued ASU 2021-08, "Business Combinations (Topic 805) - Accounting for Contract Assets and Contract Liabilities from Contracts with Customers", which amends ASC 805 to add contract assets and contract liabilities to the list of exceptions to the recognition and measurement principles that apply to business combinations and to “require that an entity (acquirer) recognize and measure contract assets and contract liabilities acquired in a business combination in accordance with ASC 606.” While primarily related to contract assets and contract liabilities that were accounted for by the acquiree in accordance with ASC 606, “the amendments also apply to contract assets and contract liabilities from other contracts to which the provisions of ASC 606 apply, such as contract liabilities from the sale of nonfinancial assets within the scope of Subtopic 610-20.” For public business entities, the amendments in this ASU became effective for fiscal years beginning after December 15, 2022, including interim periods within those fiscal years. Early adoption of the amendments was permitted. The Company early adopted this standard in the first quarter of 2022, and it did not have an impact on its results of operations, cash flows or financial position.
In August 2020, the FASB issued ASU 2020-06, "Debt - Debt with Conversion and Other Options (Subtopic 470-20)," and "Derivatives and Hedging - Contracts in Entity’s Own Equity (Subtopic 815-40)," which simplifies the accounting for convertible instruments by reducing the number of accounting models available for convertible instruments. This guidance also eliminates the treasury stock method to calculate diluted earnings per share for convertible instruments and requires the use of the if-converted method. For public companies, this guidance became effective for fiscal years beginning after December 15, 2021 and interim periods within those fiscal years. Early adoption was permitted. The Company early adopted the standard as of January 1, 2021 and applied this guidance to the convertible senior notes issued in November 2021. See Note 14.
In December 2019, the FASB issued ASU 2019-12, “Income Taxes (Topic 740) - Simplifying the Accounting for Income Taxes,” which simplifies the accounting for income taxes by eliminating some exceptions to the general approach in ASC 740, "Income Taxes." It also clarifies certain aspects of the existing guidance to promote more consistent application. This standard became effective for calendar-year public business entities in 2021 and interim periods within that year, and early adoption was permitted. The Company adopted this guidance during the first quarter of 2021. The implementation did not have a material effect on our financial position, results of operations or cash flows.
No other new accounting pronouncements issued or effective during the periods reflected in our statements of operations have had or are expected to have a significant impact on our consolidated financial statements.
3D SYSTEMS CORPORATION
NOTES TO THE CONSOLIDATED FINANCIAL STATEMENTS
(3) Acquisitions
Wematter
On July 1, 2023, the Company completed the acquisition of Wematter AB (“Wematter”), a Swedish 3D printer manufacturer that will broaden 3D Systems’ Selective Laser Sintering (SLS) portfolio. The acquisition resulted in the Company acquiring 100% of the outstanding voting interest of Wematter. Consideration for this acquisition consisted of approximately $10,224 in cash, subject to customary post-closing adjustments. The Company also may be required to pay an additional €2,000 in cash, contingent upon the achievement of certain post-closing performance conditions and the continued employment of certain key Wematter employees for two years after the closing date of the acquisition. This €2,000 is required to be recognized as compensation expense over the key employees required service period if deemed probable of being earned. As of December 31, 2023, management does not believe that achievement of the post-closing performance conditions is probable. Finally, the Company incurred $866 of acquisition-related expenses during the year ended December 31, 2023, which are reported in selling, general and administrative expenses in our consolidated statement of operations. Wematter's reported results are included in our Industrial Solutions segment and reporting unit.
In a separate transaction, the Company had extended a loan to Wematter during the three months ended June 30, 2023. We determined that this loan, representing a preexisting contractual relationship, was effectively settled upon the close of the acquisition of Wematter. No gain or loss was recognized in connection with the effective settlement, as the carrying value of the loan was not materially different from the pricing of similar current market transactions. The effective settlement of this loan receivable results in an increase of $942 to the consideration transferred in connection with this transaction (i.e., above the cash consideration paid) and a corresponding increase to goodwill.
We accounted for the acquisition of Wematter using the acquisition method, as prescribed by ASC 805, “Business Combinations” (“ASC 805”). In accordance with valuation methodologies described in ASC 820, “Fair Value Measurement” (“ASC 820”), the acquired assets and assumed liabilities were recorded at their estimated fair values as of the date of the Wematter acquisition.
Shown below is the final purchase price allocation, which summarizes the fair values of the assets acquired and liabilities assumed at the date of acquisition:
| | | | | | | | | | | | | | |
| (in thousands) | | | | |
Current assets, including cash acquired of $148 | | | | $ | 835 | |
| Intangible assets: | | | | |
Trade names | | $ | 1,487 | | | |
Product technology | | 2,580 | | | |
Customer relationships | | 348 | | | |
| Total intangible assets | | | | 4,415 | |
| Goodwill | | | | 6,528 | |
| Other assets | | | | 475 | |
| Liabilities: | | | | |
| Accounts payable and accrued liabilities | | $ | 794 | | | |
Long-term liabilities | | 293 | | | |
| Total liabilities | | | | 1,087 | |
| Net assets acquired | | | | $ | 11,166 | |
3D SYSTEMS CORPORATION
NOTES TO THE CONSOLIDATED FINANCIAL STATEMENTS
The goodwill recognized is attributable to synergies that are expected to enhance and expand the Company’s overall product portfolio and opportunities in new and existing markets, future products that have yet to be determined and Wematter’s assembled workforce. This goodwill will not be deductible for tax purposes.
The following table presents the finite-lived intangible assets acquired and their respective estimated useful lives:
| | | | | |
| Useful Life |
Trade names | 5 |
Product technology | 15 |
Customer relationships | 10 |
During the three months ended December 31, 2023, the Company updated its preliminary valuation of the acquisition-date fair values of acquired assets and assumed liabilities. As a result of incremental valuation procedures performed, the preliminary acquisition-date fair value that previously had been assigned to the acquired product technology intangible asset increased by $349. This increase in fair value was offset by a corresponding decrease in the acquisition-date fair value of goodwill. The purchase price allocation and the estimated useful lives of intangible assets are final as of December 31, 2023.
The post-acquisition revenue of Wematter reported in our consolidated statement of operations for the year ended December 31, 2023 is $72. The post-acquisition loss of Wematter reported in our consolidated statement of operations for the year ended December 31, 2023 is $8,435, which includes the impact of the allocation of $6,398 of the total Industrial Solutions goodwill impairment charge of $279,808 (Refer Note 9) to the Wematter legal entity.
Unaudited Pro Forma Financial Information
The following unaudited pro forma financial information summarizes the combined results of the Company and Wematter as if the acquisition had occurred on January 1, 2022. The pro forma results have been prepared for comparative purposes only, and do not necessarily represent what the results of operations would have been had the acquisition been completed on January 1, 2022. In addition, these pro forma results are not intended to be a projection of future operating results and do not reflect synergies that might be achieved.
The unaudited pro forma financial information includes adjustments for the pro forma impact of our preliminary purchase price allocation, including the amortization of newly acquired intangible assets; the impact of transaction costs; and the alignment of accounting policies. Transaction costs have been included in the pro forma results for the period ended December 31, 2022, consistent with the pro forma assumption that the acquisition occurred on January 1, 2022. Pro forma revenue information has not been presented, as pre-acquisition revenue reported by Wematter was not material and, accordingly, the impact on our reported consolidated revenue also would not have been material.
| | | | | | | | | | | | | | | | |
| | | | Year Ended December 31, |
| (in thousands) | | | | 2023 | | 2022 |
Pro forma net (loss) income attributable to 3D Systems Corporation | | | | $ | (362,890) | | | $ | (127,635) | |
dp polar
On October 4, 2022, we completed the acquisition of 100% of dp polar GmbH (“dp polar”), a German-based designer and manufacturer of a manufacturing system designed for high-speed mass production of customized components, for $25,866 (including customary post-closing adjustments), which includes $19,604 paid in cash at closing, $7,091 paid at closing via the issuance of the Company’s common stock, and an $829 estimated post-closing purchase price adjustment due to the Company from the sellers. In addition, the Company incurred $165 of acquisition-related expenses during the year ended December 31, 2022, which are reported in selling, general and administrative expenses in our consolidated statements of operations. See Note 17 for the discussion of an earnout arrangement with a key individual from dp polar.
3D SYSTEMS CORPORATION
NOTES TO THE CONSOLIDATED FINANCIAL STATEMENTS
The Company acquired dp polar for access to dp polar's patented continuous printing process. Central to dp polar’s patented continuous printing process is a large-scale, segmented, rotating print platform that eliminates the start/stop operations of virtually all additive manufacturing platforms. With dp polar’s technology and patented polar coordinate control, the print heads remain stationary above the rotating platform, providing a continuous print process. We accounted for the acquisition of dp polar using the acquisition method, as prescribed by ASC 805. In accordance with valuation methodologies described in ASC 820, the acquired assets and assumed liabilities were recorded at their estimated fair values as of the date of the dp polar acquisition.
Shown below is the final purchase price allocation, which summarizes the fair values of the assets acquired and liabilities assumed at the date of acquisition:
| | | | | | | | | | | | | | |
| (in thousands) | | | | |
Current assets, including cash acquired of $243 | | | | $ | 301 | |
| Intangible assets: | | | | |
| In-process research and development | | $ | 4,989 | | | |
| Trade name | | 3,930 | | | |
| Total intangible assets | | | | 8,919 | |
| Goodwill | | | | 17,090 | |
| Other assets | | | | 765 | |
| Liabilities: | | | | |
| Accounts payable and accrued liabilities | | $ | 364 | | | |
Deferred tax liability | | 845 | | | |
| Total liabilities | | | | 1,209 | |
| Net assets acquired | | | | $ | 25,866 | |
The goodwill recognized was attributable to synergies which were expected to enhance and expand the Company’s overall product portfolio and opportunities in new and existing markets, future products that have yet to be determined and dp polar’s assembled workforce. This goodwill will not be deductible for tax purposes.
Kumovis
On April 1, 2022, we completed the acquisition of 93.75% of Kumovis GmbH ("Kumovis") for an all-cash purchase price of $37,875, plus an estimated fair value of RNCI of $1,559. $3,628 of the cash payment was deferred for up to fifteen months from the closing date and was paid in July 2023. Kumovis, which is part of the Healthcare Solutions segment and reporting unit, utilizes polyether ether keton or “PEEK” materials, which has properties that lend it to many medical applications that fit into our personalized healthcare solutions operations, including many implant applications. The Company incurred $126 of acquisition-related expenses during the year ended December 31, 2022, which are reported in selling, general and administrative expenses in our consolidated statements of operations.
In conjunction with the Kumovis acquisition, the Company and the non-controlling shareholders entered into a put/call option agreement, whereby, at a later date, the Company has the option to purchase from the non-controlling shareholders, and the non-controlling shareholders have the option to sell to the Company, the remaining 6.25% ownership interest in Kumovis for an exercise price calculated based on the achievement of pre-determined revenue and gross profit targets. Fifty percent of the Kumovis common shares related to the put/call can be exercised upon the achievement of an initial revenue and gross profit target, while the remaining 50% can be exercised upon the achievement of a second revenue and gross profit target. If one or both sets of targets have not been met within 5.75 years from the acquisition date, there is a floor strike price that must be exercised. Up to 50% of the exercise price can be paid in Company common stock at the election of 3D Systems. This arrangement results in the recognition of RNCI, for which an estimated fair value of $1,559 was recorded as of the acquisition date.
3D SYSTEMS CORPORATION
NOTES TO THE CONSOLIDATED FINANCIAL STATEMENTS
We accounted for the acquisition of Kumovis using the acquisition method, as prescribed by ASC 805. In accordance with valuation methodologies described in ASC 820, the acquired assets and assumed liabilities were recorded at their estimated fair values as of the date of the Kumovis acquisition. The table below reflects the fair value of both the consideration transferred and the RNCI attributable to this acquisition.
| | | | | |
| (in thousands) | |
| Cash paid at acquisition | $ | 34,098 | |
| Deferred cash consideration | 3,628 | |
| Estimated fair value of RNCI | 1,559 | |
Post-closing net working capital adjustment | 149 | |
| Total fair value of consideration transferred | $ | 39,434 | |
Shown below is the final purchase price allocation, which summarizes the fair values of the assets acquired and liabilities assumed at the date of acquisition:
| | | | | | | | | | | | | | |
| (in thousands) | | | | |
Current assets, including cash acquired of $125 | | | | $ | 1,407 | |
| Intangible assets: | | | | |
| Product technology | | $ | 20,770 | | | |
| Trade name | | 5,802 | | | |
| Total intangible assets | | | | 26,572 | |
| Goodwill | | | | 17,618 | |
| Other assets | | | | 705 | |
| Liabilities: | | | | |
| Accounts payable and accrued liabilities | | $ | 332 | | | |
| Deferred revenue | | 70 | | | |
| Deferred tax liability | | 6,466 | | | |
| Total liabilities | | | | 6,868 | |
| Net assets acquired | | | | $ | 39,434 | |
The goodwill recognized is attributable to synergies which are expected to enhance and expand the Company’s overall product portfolio and opportunities in new and existing markets, future products that have yet to be determined and Kumovis’s assembled workforce. This goodwill will not be deductible for tax purposes.
Titan
On April 1, 2022, we completed the acquisition of 100% of Titan Additive LLC ("Titan") for an all-cash purchase price of $39,040. Titan, which is part of the Industrial Solutions segment and reporting unit, is a pellet-based extrusion platform that addresses customer applications requiring large build volumes, superior performance, and improved productivity at significantly lower cost. We believe the acquisition of Titan will open up new markets in the Industrial Solutions segment and reporting unit. The Company incurred $612 of acquisition-related expenses during the year ended December 31, 2022, which are reported in selling, general and administrative expenses in the consolidated statements of operations.
We accounted for the acquisition of Titan using the acquisition method, as prescribed by ASC 805. In accordance with valuation methodologies described in ASC 820, the acquired assets and assumed liabilities were recorded at their estimated fair values as of the date of the Titan acquisition.
3D SYSTEMS CORPORATION
NOTES TO THE CONSOLIDATED FINANCIAL STATEMENTS
Shown below is the final purchase price allocation, which summarizes the fair values of the assets acquired and liabilities assumed at the date of acquisition:
| | | | | | | | | | | | | | |
| (in thousands) | | | | |
| Current assets | | | | $ | 661 | |
| Intangible assets: | | | | |
| Product technology | | $ | 15,940 | | | |
| Trade name | | 5,580 | | | |
| Total intangible assets | | | | 21,520 | |
| Goodwill | | | | 17,430 | |
| Other assets | | | | 68 | |
| Liabilities: | | | | |
| Accounts payable and accrued liabilities | | $ | 229 | | | |
| Deferred revenue | | 410 | | | |
| Total liabilities | | | | 639 | |
| Net assets acquired | | | | $ | 39,040 | |
The goodwill recognized is attributable to synergies which are expected to enhance and expand the Company’s overall product portfolio and opportunities in new and existing markets, future products that have yet to be determined and Titan’s assembled workforce. This goodwill is deductible for tax purposes.
Volumetric
On December 1, 2021, we acquired Volumetric Biotechnologies, Inc. (“Volumetric”) for $40,173, of which $24,814 was paid in cash, and the remainder was paid via the issuance of 720 shares of the Company's common stock having a fair value on the date of issuance of $15,359. We also incurred approximately $1,306 of acquisition-related expenses during the year ended December 31, 2021, which are reported in selling, general and administrative expenses in our consolidated statements of operations. Additional payments of up to $355,000 are possible upon (1) the attainment of seven non-financial milestones, each of which requires achievement prior to either December 31, 2030 or December 31, 2035, and (2) the continued employment of certain key individuals from Volumetric. Any additional payments made will be paid approximately half in cash and half in shares of the Company’s common stock. The additional payments are considered compensation expense, which will be recorded ratably from the time a milestone is deemed probable of achievement through the estimated timing of achievement. Any compensation expense recorded will be reversed if a milestone is no longer deemed probable of achievement. Refer to Note 17 for additional details regarding amounts related to these milestone payments that have been reported in our consolidated financial statements.
Volumetric’s mission is to develop the ability to manufacture human organs using bioprinting methods and the underlying technologies required to create these highly complex biological structures. With this acquisition, 3D Systems seeks to expand our capabilities and capacity in 3D printing related to bio-printing and regenerative medicine. Combining 3D Systems' regenerative medicine group with Volumetric’s highly complementary skill sets of biological expertise and cellular engineering is expected to accelerate our core regenerative medicine strategies, which include the bio-printing of human organs, additional non-organ applications and bio-printing technologies for research labs.
We accounted for the acquisition of Volumetric using the acquisition method, as prescribed by ASC 805. In accordance with valuation methodologies described in ASC 820, the acquired assets and assumed liabilities were recorded at their estimated fair values as of the date of acquisition.
3D SYSTEMS CORPORATION
NOTES TO THE CONSOLIDATED FINANCIAL STATEMENTS
Shown below is the final purchase price allocation, which summarizes the fair values of the acquired assets and liabilities assumed at the date of acquisition:
| | | | | | | | | | | | | | |
| (in thousands) | | | | |
Current assets, including cash acquired of $389 | | | | $ | 3,143 | |
| Intangible assets: | | | | |
| Product technology | | $ | 1,100 | | | |
| Distributor relationship | | 400 | | | |
| Total intangible assets | | | | 1,500 | |
| Goodwill | | | | 37,492 | |
| Other assets | | | | 1,194 | |
| Liabilities: | | | | |
| Accounts payable and accrued liabilities | | $ | 3,156 | | | |
| Total liabilities | | | | 3,156 | |
| Net assets acquired | | | | $ | 40,173 | |
The goodwill recognized is attributable to synergies which are expected to enhance and expand the Company’s overall product portfolio and opportunities in new and existing markets, future products that have yet to be determined and Volumetric’s assembled workforce. Goodwill will not be deductible for tax purposes.
Volumetric is part of the Healthcare Solutions reporting unit and segment.
Oqton
On November 1, 2021, we acquired Oqton, Inc. (“Oqton”) for $187,775, of which $107,078 was paid in cash, and the remainder was paid via the issuance of 2,553 shares of the Company’s common stock having a fair value at the date of issuance of $80,697. We also incurred approximately $1,780 of acquisition related expenses during the year ended December 31, 2021, which are reported in selling, general and administrative expenses in our consolidated statements of operations.
Oqton is a software company that creates an intelligent, cloud-based Manufacturing Operating System ("MOS") platform tailored for flexible production environments that increasingly utilize a range of advanced manufacturing and automation technologies, including additive manufacturing solutions, in their production workflows. The cloud-based solution leverages the Industrial Internet of Things, artificial intelligence, and machine learning technologies to deliver a solution for customers to automate their digital manufacturing workflows, scale their operations and enhance their competitive position.
We accounted for the acquisition of Oqton using the acquisition method, as prescribed by ASC 805. In accordance with valuation methodologies described in ASC 820, the acquired assets and assumed liabilities were recorded at their estimated fair values as of the date of the acquisition.
3D SYSTEMS CORPORATION
NOTES TO THE CONSOLIDATED FINANCIAL STATEMENTS
Shown below is the final purchase price allocation, which summarizes the fair values of the assets acquired and liabilities assumed at the date of acquisition:
| | | | | | | | | | | | | | |
| (in thousands) | | | | |
Current assets, including cash acquired of $7,603 | | | | $ | 8,344 | |
| Intangible assets: | | | | |
| Product technology | | $ | 12,600 | | | |
| Trade name | | 7,300 | | | |
| Total intangible assets | | | | 19,900 | |
| Goodwill | | | | 165,904 | |
| Other assets | | | | 760 | |
| Liabilities: | | | | |
| Accounts payable and accrued liabilities | | $ | 6,643 | | | |
| Deferred revenue | | 490 | | | |
| Total liabilities | | | | 7,133 | |
| Net assets acquired | | | | $ | 187,775 | |
The goodwill recognized is attributable to synergies which are expected to enhance and expand the Company’s overall product portfolio and opportunities in new and existing markets, future products that have yet to be determined and Oqton’s assembled workforce. This Goodwill is not deductible for tax purposes.
Oqton's operating results are reported in the Industrial Solutions segment and reporting unit.
Other
In May 2021, we purchased Allevi, Inc. ("Allevi") to expand regenerative medicine initiatives into medical and pharmaceutical R&D laboratories. Additionally, in June 2021, we closed the acquisition of a German software firm, Additive Works GmbH (“Additive”). Additive expands the simulation capabilities for rapid optimization of industrial-scale 3D printing processes. The purchase price for both acquisitions, individually and combined, as well as the impacts to the Company’s financial position, results of operations and cash flows, are not material.
Acquisitions of Non-controlling Interests
As of December 31, 2018, the Company owned approximately 70% of the capital and voting rights of Easyway, a service bureau and distributor of 3D printing and scanning products in China. The remaining 30% of the capital and voting rights of Easyway were acquired on January 21, 2019 for $13,500, which has been paid in installments. The Company made the final installment payment of $2,300 related to the acquisition of the remaining 30% interest in Easyway during 2022.
(4) Divestitures
ODM
In September 2021, we completed the sale of the Company’s On Demand Manufacturing business ("ODM") for $82,000, excluding certain customary closing adjustments. We recorded a gain on the sale of $38,490 within interest and other income (expense), net on the accompanying consolidated statement of operations for the year ended December 31, 2021. ODM was primarily included within the Industrial Solutions segment. At closing, the Company and the purchaser entered into a supply agreement and a transition services agreement, pursuant to which the Company agreed to provide certain information technology, corporate finance, tax, treasury, accounting, human resources and payroll, sales and marketing, operations, facilities and other customary services to support the purchaser in the ongoing operation of ODM for a period of time post-closing. At December 31, 2023 only the supply agreement was active.
3D SYSTEMS CORPORATION
NOTES TO THE CONSOLIDATED FINANCIAL STATEMENTS
Simbionix
On August 24, 2021, we completed the sale of 100% of the issued and outstanding equity interests of Simbionix USA Corporation, which owned our global medical simulation business, for $305,000, excluding certain closing adjustments and excluding $6,794 of cash transferred to the purchaser. We recorded a gain on the sale of $271,404 within interest and other income (expense), net on the accompanying consolidated statement of operations for the year ended December 31, 2021. Additionally, we recognized a gain of $2,431 upon the reclassification of accumulated foreign currency translation gains previously included in accumulated other comprehensive loss (“AOCL”), which is included within interest and other income (expense), net for the year ended December 31, 2021. Simbionix was included within the Healthcare Solutions segment.
Cimatron
On January 1, 2021, we completed the sale of 100% of the issued and outstanding equity interests of Cimatron Ltd. (“Cimatron”), the subsidiary that operated the Company’s Cimatron integrated CAD/CAM software for tooling business and its GibbsCAM CNC programming software business, for approximately $64,173, after certain adjustments and excluding $9,476 of cash transferred to the purchaser. We recorded a gain on the sale of $32,047 within interest and other income (expense), net on the accompanying consolidated statement of operations for the year ended December 31, 2021. Additionally, at the time of the sale, we recognized a gain of $6,481 upon the reclassification of accumulated foreign currency translation gains previously included in AOCL, which is included within interest and other income (expense), net for the year ended December 31, 2021. Cimatron was included within the Industrial Solutions segment.
(5) Revenue
Performance Obligations
A performance obligation is a promise in a contract to transfer a distinct good or service to the customer, and is the unit of account as defined in ASC 606. A contract’s transaction price is allocated to each distinct performance obligation and recognized as revenue when, or as, the performance obligation is satisfied.
At December 31, 2023, we had $97,823 of unrecognized revenue comprised of deferred revenue, customer order backlog and customer deposits. This $97,823 related to outstanding performance obligations excludes variable consideration totaling $46,000 which will not be included in contract transaction price for purposes of revenue recognition until management is able to conclude that it is probable that the inclusion of such amounts will not result in a subsequent significant reversal of the cumulative amount of revenue recognized. We expect to recognize approximately 93% of the $40,075 of deferred revenue and customer deposits as revenue within the next twelve months, and an additional 5% by the end of 2025 and the remaining balance thereafter.
Revenue Recognition
Revenue is recognized when control of the promised products or services is transferred to customers. Revenue is recognized in an amount that reflects the consideration we expect to receive in exchange for those products or services. We enter into contracts that can include various combinations of products and services, which are generally capable of being distinct and, accordingly, are accounted for as separate performance obligations. For such arrangements, we allocate revenue to each performance obligation based upon its relative stand-alone selling price (“SSP”). Revenue is recognized net of allowances for returns and any taxes collected from customers that are subsequently remitted to governmental authorities. The amount of consideration received and revenue recognized may vary based on changes in marketing incentive programs offered to our customers. Our marketing incentive programs take many forms, including volume discounts, trade-in allowances, rebates and other discounts.
A majority of our revenue is recognized at the point in time when products are shipped or services are delivered to customers.
3D SYSTEMS CORPORATION
NOTES TO THE CONSOLIDATED FINANCIAL STATEMENTS
Hardware and Materials
Revenue from hardware and material sales is recognized when control has transferred to the customer, which generally occurs when the goods have been shipped or delivered to the customer, risk of loss has transferred to the customer, and we have a present right to payment. In limited circumstances, when printer or other hardware sales include substantive customer acceptance provisions, revenue is recognized either when customer acceptance has been obtained, customer acceptance provisions have lapsed, or we have objective evidence that the criteria specified in the customer acceptance provisions have been satisfied.
Printers and certain other products include a warranty under which we provide maintenance for periods up to one year. For these initial product warranties, estimated costs are accrued at the time of the sale of the product. These cost estimates are established using historical information regarding the nature, frequency and average cost of claims for each type of printer or other product, as well as assumptions about future activity and events. Revisions to expense accruals are made as necessary based on changes in these historical and future factors.
Software
We also market and sell software tools that enable our customers to capture and customize content using our printers, design optimization and simulation software, and reverse engineering and inspection software. Our software does not require significant modification or customization, and the license provides the customer with a right to use the software as it exists when made available. Revenue from these software licenses is recognized either upon delivery of the product or of a key code which allows the customer to download the software. Customers may purchase post-sale support. Generally, the first year of support is included, but subsequent years are optional. This optional support is considered a separate obligation from the software. Accordingly, revenue is deferred at the time of sale and subsequently recognized ratably over future periods.
Services
We offer training, installation and non-contract maintenance services for our products. Additionally, we offer maintenance contracts customers can purchase at their option. For maintenance contracts, revenue is deferred at the time of sale based on the stand-alone selling prices of these services. Deferred revenue is recognized ratably over the term of the maintenance period on a straight-line basis and costs are expensed as incurred. Revenue from training, installation and non-contract maintenance services is recognized at the time of performance of the service.
We also sell software as a service, whereby the customer has the right to access the software. Revenue is recognized ratably over the related subscription period, as our performance obligation to provide access to the software is progressively fulfilled over the stated term of the contract.
On demand manufacturing and Healthcare Solutions service sales are included within services revenue, and revenue is recognized upon shipment or delivery of the parts or performance of the service, based on the terms of the arrangement. We disposed of the majority of our service revenue businesses including Cimatron, Simbionix, and ODM, which were minimally offset by the purchase of Oqton. See Note 3 and Note 4.
3D SYSTEMS CORPORATION
NOTES TO THE CONSOLIDATED FINANCIAL STATEMENTS
Collaboration and Licensing Agreements
We enter into collaboration and licensing agreements with third parties. The nature of the activities to be performed and the consideration exchanged under the agreements varies on a contract-by-contract basis. We evaluate these agreements to determine whether they meet the definition of a customer relationship for which revenue is recorded. These contracts may contain multiple performance obligations and may contain fees for licensing, R&D services, contingent milestone payments upon the achievement of contractual developmental criteria and/or royalty fees based on the licensees’ product revenue. We determine the revenue to be recognized for these agreements based on an evaluation of the distinct performance obligations; the identification and evaluation of material rights; the estimation of the amount of variable consideration to be included in transaction price, as well as the timing for the inclusion of such variable consideration; and the amount of transaction price assigned to and the pattern of transfer of control for each distinct performance obligation. This typically results in the recognition of revenue over time using a cost-to-cost percentage of completion model to measure the progress of the transfer of control. The Company recognized $17,040, $13,497, and $6,804 in revenue related to collaboration arrangements with customers for the years ended December 31, 2023, 2022, and 2021, respectively. The Company recognized $14,095, $11,063, and $5,888 in products cost of sales related to the collaboration arrangements with customers for the years ended December 31, 2023, 2022, and 2021, respectively. The majority of our collaboration arrangement revenue and related costs of sales relates to R&D being performed under a single regenerative medicine contract.
Our revenue recognized under collaboration and licensing agreements for year ended December 31, 2023 includes the effect of the Company increasing its estimate of the variable consideration included in the transaction price related to one of its licensing agreements. The increase in estimated recognizable variable consideration was due to (1) the execution of a modification to the related customer contract and (2) the Company's determination that incremental revenue attributable to milestone payments that are contingent upon the achievement of contractual developmental criteria would be earned under the modified contract. As a result, during the year ended December 31, 2023, the Company recognized a cumulative catch-up adjustment to record incremental services revenue of $4,452, which reduced our reported basic and diluted loss per share by $0.03 and $0.03, respectively, for year ended December 31, 2023.
Terms of Sale
Shipping and handling activities are treated as fulfillment costs rather than as an additional promised service. We accrue the costs of shipping and handling when the related revenue is recognized. Our incurred costs associated with shipping and handling are included in product cost of sales.
Creditworthiness is determined, and credit is extended, based upon an evaluation of each customer’s financial condition. New customers are generally required to complete a credit application and provide references and bank information to facilitate an analysis of creditworthiness.
Our terms of sale generally provide payment terms that are customary in the countries where we transact business. To reduce credit risk in connection with certain sales, we may, depending upon the circumstances, require significant deposits or payment in full prior to shipment. For maintenance services, we either bill customers on a time-and-materials basis or sell maintenance contracts that provide for payment in advance on either an annual or other periodic basis.
Significant Judgments
Allocation of Transaction Price
Our contracts with customers often include promises to transfer multiple products and services to a customer. For such arrangements, we allocate revenue to each performance obligation based on its relative SSP.
Judgment is required to determine the SSP for each distinct performance obligation in a contract. For the majority of items, we estimate SSP using historical transaction data. We use a range of amounts to estimate SSP when we sell each of the products and services separately and need to determine whether there is a discount to be allocated based on the relative SSP of the various products and services. In instances where SSP is not directly observable, such as when the product or service is not sold separately, we determine the SSP using information that may include market conditions and other observable inputs.
In some circumstances, we have more than one SSP for individual products and services due to the stratification of those products and services by customers, geographic region or other factors. In these instances, we may use information such as the size of the customer and geographic region in determining the SSP.
3D SYSTEMS CORPORATION
NOTES TO THE CONSOLIDATED FINANCIAL STATEMENTS
The determination of SSP is an ongoing process, and information is reviewed regularly in order to ensure SSP reflects the most current information or trends.
Variable Consideration
We must assess if and when it is appropriate to include variable consideration when determining transaction price. This assessment, which impacts the timing and the amount of revenue recognized under contracts accounted for in accordance with ASC 606, requires management to conclude that it is probable that a significant reversal of the amount of cumulative revenue recognized with respect to a contract will not occur when the uncertainty associated with the variable consideration is subsequently resolved.
The nature of our sales and marketing incentives may lead to consideration that is variable. Judgment is exercised at contract inception to determine the most likely outcome of the contract and resulting transaction price. Ongoing assessments are performed to determine if updates are needed to the original estimates.
Contracts Recognized Over Time
The Company recognizes the revenue attributable to certain contracts over time using a cost-to-cost percentage of completion model to measure progress. The application of this accounting requires the Company to estimate total costs that will be required to satisfy the related performance obligations. These estimates could change over the term of a contract.
Contract Balances
The timing of revenue recognition, billings and cash collections results in the recognition of billed accounts receivable and contract assets (including unbilled receivables) and customer deposits and deferred revenue (contract liabilities) on our consolidated balance sheets. Timing of revenue recognition may differ from the timing of invoicing to customers. We record accounts receivable when we have an unconditional right to recognize revenue at the time of invoicing, and unbilled receivables when revenue is recognized prior to invoicing. For most of our contracts, customers are invoiced when products are shipped or when services are performed resulting in billed accounts receivables for the remainder of the owed contract price. Unbilled receivables generally result from circumstances in which items have been shipped, revenue has been recognized, but the customer has not been charged. We also recognize a contract asset upon the recognition of revenue related to certain performance milestones that are deemed probable of achievement, but for which billing has not occurred and receipt of payment is conditioned upon factors other than the passage of time. In our on demand manufacturing business, which was sold in September of 2021, customers may have been required to pay in full before work begins on their orders, resulting in customer deposits. We typically bill in advance for installation, training and maintenance contracts, as well as for extended warranties, resulting in deferred revenue.
The increase in the contract assets balance as of December 31, 2023 (see table below) primarily relates to the increase in the estimated variable consideration included in the transaction price related to one of the Company's collaboration and licensing agreements (refer to the discussion above of Collaboration and Licensing Agreements), which has resulted in the recognition of incremental revenue for which the Company has the right to invoice upon achievement of each respective contractual milestone. Changes in contract asset and liability balances were not materially impacted by any other factors for the years ended December 31, 2023 and 2022, respectively.
Accounts receivable, contract asset and contract liability balances as of December 31, 2023, 2022 and 2021 were as follows:
| | | | | | | | | | | | | | | | | |
| December 31, |
| (in thousands) | 2023 | | 2022 | | 2021 |
Accounts receivable, net of reserves | $ | 101,497 | | | $ | 93,886 | | | $ | 106,540 | |
Contract assets(1) | 12,147 | | | 677 | | | 184 | |
Contract liabilities(2) | 40,075 | | | 38,349 | | | 45,552 | |
(1) Includes amounts reported in Prepaid expenses and other current assets and Other assets on the balance sheet, inclusive of $5,422 as of December 31, 2023 that is related to a long-term contract and is billable upon attainment of milestones.
(2) Includes amounts reported in Other liabilities on the balance sheet.
3D SYSTEMS CORPORATION
NOTES TO THE CONSOLIDATED FINANCIAL STATEMENTS
During the year ended December 31, 2023, we recognized revenue of $25,980 related to our contract liabilities at December 31, 2022. During the year ended December 31, 2022, we recognized revenue of $31,038 related to our contract liabilities at December 31, 2021. During the year ended December 31, 2021, we recognized revenue of $30,302 related to our contract liabilities at December 31, 2020.
Practical Expedients and Exemptions
We generally expense sales commissions when incurred because the amortization period would be one year or less. These costs are recorded within selling, general and administrative expenses.
Revenue Concentrations
For the years ended December 31, 2023, 2022, and 2021, one customer accounted for approximately 15%, 23%, and 22% of our consolidated revenue, respectively, which revenue relates to our Healthcare Solutions segment. We expect to maintain our relationship with this customer.
Revenue by geographic region for the years ended December 31, 2023, 2022, and 2021, which is determined based upon the geographic region in which a sale originates, was as follows:
| | | | | | | | | | | | | | | | | |
| Year Ended December 31, |
| (in thousands) | 2023 | | 2022 | | 2021 |
| Americas | $ | 282,742 | | | $ | 308,516 | | | $ | 344,619 | |
| EMEA | 164,673 | | | 167,114 | | | 201,684 | |
| APAC | 40,654 | | | 62,401 | | | 69,336 | |
| Total | $ | 488,069 | | | $ | 538,031 | | | $ | 615,639 | |
| United States (included in Americas above) | $ | 278,268 | | | $ | 304,503 | | | $ | 341,123 | |
Germany (included in EMEA above) | $ | 76,995 | | | $ | 80,108 | | | $ | 78,218 | |
(6) Inventories
Components of inventories at December 31, 2023 and 2022 are summarized as follows:
| | | | | | | | | | | |
| (in thousands) | 2023 | | 2022 |
| Raw materials | $ | 59,658 | | | $ | 59,907 | |
| Work in process | 4,708 | | | 4,972 | |
| Finished goods and parts | 87,822 | | | 72,953 | |
| Total inventories | $ | 152,188 | | | $ | 137,832 | |
The inventory reserve was $16,156 and $15,550 as of December 31, 2023 and 2022, respectively.
During the year ended December 31, 2023, we notified one of our contract manufacturers of our intent to terminate the existing manufacturing services arrangement and in-source the assembly and production process. The final exit agreement included a $450 exit fee that was expensed during the period. There is an associated commitment to purchase $1,692 of inventory from the assembly manufacturer as of December 31, 2023.
During the year ended December 31, 2022, we notified one of our contract manufacturers of our intent to terminate our existing manufacturing services arrangement and in-source the assembly and production process. The final exit agreement included a $1,670 exit fee that was expensed during the period. Exiting this agreement resulted in the purchase of $23,913 of inventory and $369 of fixed assets from the assembly manufacturer.
3D SYSTEMS CORPORATION
NOTES TO THE CONSOLIDATED FINANCIAL STATEMENTS
(7) Property and Equipment
Property and equipment at December 31, 2023 and 2022 are summarized as follows:
| | | | | | | | | | | | | | | | | | | | |
| (in thousands) | | 2023 | | 2022 | | Useful Life (in years) |
| Building | | $ | 94 | | | $ | 94 | | | 25-30 |
| Machinery and equipment | | 146,978 | | | 130,874 | | | 2-5 |
| Capitalized software | | 27,793 | | | 25,952 | | | 3-5 |
| Office furniture and equipment | | 6,342 | | | 5,540 | | | 1-5 |
| Leasehold improvements | | 37,242 | | | 34,567 | | | Life of lease a |
| Construction in progress | | 14,630 | | | 9,175 | | | N/A |
| Total property and equipment | | 233,079 | | | 206,202 | | | |
| Less: Accumulated depreciation and amortization | | (168,618) | | | (148,130) | | | |
| Total property and equipment, net | | $ | 64,461 | | | $ | 58,072 | | | |
a.Leasehold improvements are amortized on a straight-line basis over the shorter of (i) their estimated useful life or (ii) the estimated or contractual life of the related lease.
We include all depreciation from assets attributable to the generation of revenue in cost of sales on the consolidated statements of operations. Depreciation related to assets that are not attributable to the generation of revenue is included in the research and development and selling, general and administrative expense line items on the consolidated statements of operations. Depreciation on property and equipment is calculated on a straight-line basis. Depreciation expense on property and equipment for the years ended December 31, 2023, 2022 and 2021 was $21,346, $21,096 and $24,242, respectively.
For the years ended December 31, 2023, 2022 and 2021, we recognized impairment charges of $1,354, $18 and $788, respectively, on property and equipment, net in the selling, general and administrative line item on the consolidated statements of operations.
(8) Intangible Assets
Intangible Assets with Finite Lives
At December 31, 2023 and 2022, the Company's intangible assets with finite lives were as follows:
| | | | | | | | | | | | | | | | | | | | | | | | | | | | | | | | | | | | | | | | | |
| 2023 | | 2022 |
| (in thousands) | Gross | | Accumulated Amortization | | Net | | Gross | | Accumulated Amortization | | Net | | Weighted Average Useful Life Remaining (in years) |
| Intangible assets with finite lives: | | | | | | | | | | | | | |
| Customer relationships | $ | 54,565 | | | $ | (52,796) | | | $ | 1,769 | | | $ | 51,137 | | | $ | (48,695) | | | $ | 2,442 | | | 3.9 |
| Acquired technology | 47,515 | | | (13,268) | | | 34,247 | | | 55,480 | | | (10,707) | | | 44,773 | | | 8.6 |
| Trade names | 26,938 | | | (14,059) | | | 12,879 | | | 35,930 | | | (12,455) | | | 23,475 | | | 7.6 |
| Patent costs | 19,579 | | | (11,350) | | | 8,229 | | | 18,673 | | | (10,909) | | | 7,764 | | | 9.2 |
| Acquired patents | 16,503 | | | (14,822) | | | 1,681 | | | 17,499 | | | (15,661) | | | 1,838 | | | 12.9 |
| Other | 13,711 | | | (9,792) | | | 3,919 | | | 13,255 | | | (8,765) | | | 4,490 | | | 7.3 |
Total intangible assets with finite lives | $ | 178,811 | | | $ | (116,087) | | | $ | 62,724 | | | $ | 191,974 | | | $ | (107,192) | | | $ | 84,782 | | | 8.4 |
3D SYSTEMS CORPORATION
NOTES TO THE CONSOLIDATED FINANCIAL STATEMENTS
Indefinite-Life Intangible Assets (Excluding Goodwill)
As of December 31, 2022, the Company's total intangible assets reported on the consolidated balance sheet included an indefinite-life intangible asset balance of $5,448 related to IPR&D recorded in connection with the October 4, 2022 acquisition of dp polar. During the three months ended December 31, 2023, in connection with both the inability to reach economically favorable contract terms with dp polar's first potential customer and the Company's broader efforts to reduce operating costs (including the restructuring initiatives described in Note 25), the Company decided to cease the development of this IPR&D for the foreseeable future. As the IPR&D is not capable of generating revenue or positive cash flows without further development, the Company recorded a charge of $5,554 within impairments of goodwill and intangible assets on our consolidated statement of operations for the year ended December 31, 2023 to write off the carrying value of this foreign currency denominated asset as of the date of impairment.
Impairment of Intangible Assets with Finite Lives
dp polar
The Company's decision to cease the development of the dp polar IPR&D (as discussed above) represented a triggering event that required an assessment of whether the carrying value of the broader dp polar asset group was recoverable. dp polar represents an asset group because its identifiable cash flows are largely independent of the cash flows of other groups of assets and liabilities within the Company.
As dp polar is not capable of generating revenue or positive cash flows without the continued development of its IPR&D, the Company concluded that dp polar's long-lived assets, including the remaining carrying value of the trade name intangible asset recorded when dp polar was acquired, were fully impaired. Accordingly, the Company recorded a charge of $3,828 within impairments of goodwill and intangible assets on our consolidated statement of operations for the year ended December 31, 2023 to write-off dp polar's trade name.
Oqton MOS
During the three months ended September 30, 2023, the Company concluded that it is more likely than not that the Company will sell or otherwise dispose of Oqton MOS, a business which the Company acquired in 2021. Oqton MOS represents an asset group within the Industrial Solutions segment, as its identifiable cash flows are largely independent of the cash flows of other groups of assets and liabilities within the segment. Based upon the Company's expectation that it will sell or otherwise dispose of Oqton MOS, the long-term cash flow forecast for this asset group was revised as of September 30, 2023. The revised long-term cash flow forecast indicated that the carrying amounts of Oqton MOS's long-lived assets, consisting primarily of product technology and trade name intangible assets initially recorded when Oqton MOS was acquired, may not be recoverable. Accordingly, the carrying value of Oqton MOS's long-lived assets (i.e., the asset group) was tested for impairment based upon an estimate of the associated discounted future cash flows. This fair value measurement approach required the use of Level 3 fair value measurement inputs, as defined in Note 24. As the present value of the estimated future cash flows expected to result from the remaining use and eventual disposition of the asset group was less than the carrying value of the asset group as of September 30, 2023 when this impairment test was performed, the Company recognized intangible asset impairment charges totaling $13,597 related to the acquired technology and trade names included in the Oqton MOS asset group, which amount has been reported within impairments of goodwill and intangible assets on our consolidated statement of operations for the year ended December 31, 2023. The use of forecasted cash flows for purposes of this impairment test represents the application of Level 3 fair value measurement inputs, as defined in Note 24.
As of December 31, 2023, the Company was still evaluating the strategic alternatives available for the sale, disposal or exit of Oqton MOS. Accordingly, the assets and liabilities of this business continue to be classified as held and used as of December 31, 2023. Refer to Note 26 for details regarding the sale of Oqton Dental in May 2024.
Amortization of Intangible Assets with Finite Lives
Amortization expense related to our intangible assets with finite lives was $12,067, $15,480 and $10,469 for the years ended December 31, 2023, 2022 and 2021, respectively. Amortization expense is estimated to be $8,129 in 2024, $8,107 in 2025, $7,530 in 2026, $6,786 in 2027, and $6,298 in 2028.
3D SYSTEMS CORPORATION
NOTES TO THE CONSOLIDATED FINANCIAL STATEMENTS
(9) Goodwill
The following table reflects the changes in the carrying amount of goodwill by reporting unit for the year ended December 31, 2023:
| | | | | | | | | | | | | | | | | | | | | | | | | | | | | | | | | | | | | | | | | | | | | | | | | | | | | |
| Year Ended December 31, 2023 |
| Healthcare | | Industrial | | Consolidated |
| (in thousands) | Gross Goodwill | | Impairments | | Net Goodwill | | Gross Goodwill | | Impairments | | Net Goodwill | | Gross Goodwill | | Impairments | | Net Goodwill |
| | | | | | | | | | | | | | | | | |
| Balance at beginning of year | $ | 143,431 | | | $ | (32,055) | | | $ | 111,376 | | | $ | 316,265 | | | $ | (42,329) | | | $ | 273,936 | | | $ | 459,696 | | | $ | (74,384) | | | $ | 385,312 | |
Acquisitions | 1,005 | | | — | | | 1,005 | | | 7,386 | | | — | | | 7,386 | | | 8,391 | | | — | | | 8,391 | |
| | | | | | | | | | | | | | | | | |
Impairments | — | | | — | | | — | | | — | | | (279,808) | | | (279,808) | | | — | | | (279,808) | | | (279,808) | |
| Foreign currency translation adjustments | 3,701 | | | — | | | 3,701 | | | (1,514) | | | — | | | (1,514) | | | 2,187 | | | — | | | 2,187 | |
| Balance at end of year | $ | 148,137 | | | $ | (32,055) | | | $ | 116,082 | | | $ | 322,137 | | | $ | (322,137) | | | $ | — | | | $ | 470,274 | | | $ | (354,192) | | | $ | 116,082 | |
| | | | | | | | | | | | | | | | | |
The effect of foreign currency exchange in the table above reflects the impact on goodwill of amounts recorded in currencies other than the U.S. dollar on the financial statements of foreign subsidiaries and the resulting effect of foreign currency translation between the applicable functional currency and the U.S. dollar.
Goodwill Impairment
For purposes of our annual goodwill impairment test, our reporting units are Healthcare Solutions and Industrial Solutions. For the years ended December 31, 2023 and December 31, 2022, we completed the required annual goodwill impairment tests for each of our reporting units as of November 1, 2023 and November 30, 2022, respectively, as further discussed in Note 2. The goodwill impairment tests performed as of each testing date compared the fair value of each of our reporting units to its carrying value. We estimated the fair value of each reporting unit based upon projections of future revenues, expenses, and cash flows discounted to their present value. The use of forecasted cash flows for purposes of the annual goodwill impairment test represents the application of Level 3 fair value measurement inputs, as defined in Note 24.
As a result of our goodwill impairment test performed as of November 1, 2023, we determined that the carrying value of our Industrial Solutions reporting unit exceeded its fair value by an amount that was in excess of the goodwill assigned to the Industrial Solutions reporting unit. This result of our impairment test is primarily attributable to (1) the significant and sustained decline in the trading price of our common stock and our market capitalization leading up to and as of November 1, 2023 and (2) the significantly higher carrying value (including the goodwill balance) of the Industrial Solutions reporting unit, as compared to the Healthcare Solutions reporting unit. Consistent with the result of our annual goodwill impairment test, we recognized a goodwill impairment charge of $279,808 to write off the entire goodwill balance assigned to the Industrial Solutions reporting unit. This goodwill charge is reported within impairments of goodwill and intangible assets on our consolidated statement of operations for the year ended December 31, 2023. The estimated fair value of our Healthcare Solutions reporting unit was in excess of its carrying value as of November 1, 2023 and November 30, 2022, and the estimated fair value of our Industrial Solutions reporting unit was in excess of its carrying value as of November 30, 2022.
3D SYSTEMS CORPORATION
NOTES TO THE CONSOLIDATED FINANCIAL STATEMENTS
(10) Investments and Note Receivable
The Company holds various investments in equity and debt instruments that are included in other assets on our consolidated balance sheets. The following table summarizes our investment balances as of December 31, 2023 and December 31, 2022:
| | | | | | | | | | | | | | |
| (in thousands) | | December 31, 2023 | | December 31, 2022 |
| Equity investments under the equity method of accounting | | $ | 5,247 | | | $ | — | |
| Equity investments without readily determinable fair values | | 20,847 | | | 12,953 | |
Other(1) | | 200 | | | 200 | |
Total equity investments | | $ | 26,294 | | | $ | 13,153 | |
| | | | |
Long-term note receivable(2) | | $ | 535 | | | $ | 515 | |
| Total notes receivable | | $ | 535 | | | $ | 515 | |
(1) Reflects warrant investment carried at fair value. The fair value of these warrants is measured using Level 3 fair value measurement inputs. Refer to Note 24 for a description of these inputs.
(2) Includes interest amounts that have been accrued on, recorded to and reported as part of the notes receivable balances.
Equity Investments under the Equity Method of Accounting
National Additive Manufacturing Innovation ("NAMI") Joint Venture
In March 2022, we and the Saudi Arabian Industrial Investments Company ("Dussur") signed an agreement to form a joint venture intended to expand the use of additive manufacturing within the Kingdom of Saudi Arabia and surrounding geographies, including the Middle East and North Africa. The joint venture is to enable the development of Saudi Arabia’s domestic additive manufacturing production capabilities, consistent with the Kingdom’s ‘Vision 2030,’ which is focused on diversification of the economy and long-term sustainability. 3D Systems had committed to an initial investment in the joint venture of approximately $6,500, of which $3,435 had been deposited into an escrow account as of December 31, 2022 and, accordingly, was reported as restricted cash within other assets on the December 31, 2022 consolidated balance sheet. In February 2023, the Company officially became a shareholder in the joint venture, resulting in the Company holding a 49% ownership interest. During April 2023, the $3,435 held in escrow, as well as the additional amount of approximately $3,065 owed to the joint venture, was deposited into a bank account of the joint venture for use in its operations. The impact of this investment in NAMI on the Company’s future financial condition and cash flows is expected to be limited to the cash outflow(s) related to any future investments, if required. Additional future investments in the joint venture are contingent upon the achievement of certain milestones or separate agreement by the parties to the joint venture to invest additional capital. Refer to Note 26 for details regarding the Company's incremental investment in NAMI subsequent to December 31, 2023.
As of December 31, 2023, the Company continues to own 49% of the joint venture's common stock, and the joint venture is an unconsolidated VIE as disclosed in Note 2. The Company accounts for the joint venture under the equity method of accounting, which requires the Company to recognize its proportionate share of the joint venture's reported net income or loss. For the year ended December 31, 2023, the Company has recorded and separately reported a loss on equity method investment in the consolidated statements of operations. In addition, the Company's reported revenue and cost of sales for the year ended December 31, 2023 included related party revenue and associated related party cost of sales of $1,743 and $996, respectively, attributable to sales to NAMI. As of December 31, 2023, the outstanding related party receivable balance attributable to our sales to NAMI was $1,092.
3D SYSTEMS CORPORATION
NOTES TO THE CONSOLIDATED FINANCIAL STATEMENTS
Equity Investments without Readily Determinable Fair Values
Theradaptive
In June 2023, we made an $8,000 investment in Theradaptive, Inc. ("Theradaptive"), via the purchase of Series A Preferred Stock, pursuant to which we hold an approximate 9.15%, or 8.25% fully-diluted, ownership interest in Theradaptive. Theradaptive, which is an unconsolidated VIE as disclosed in Note 2, is currently developing a protein that encourages bone growth. This biotechnology could be applied to 3D printed metal splints for patients who otherwise may require amputation of a limb because the lost bone is too vast to replace with a splint. The Company has accounted for its investment in Theradaptive on a cost basis, subject to assessment for impairment, as (1) the fair value of Theradaptive's equity is not readily determinable and (2) the investment is not subject to the equity method of accounting due to the Company's lack of significant influence. The investment in Theradaptive is not expected to materially impact our future financial position, results of operations, or cash flows. No impairment charges were recognized with respect to this investment during the year ended December 31, 2023.
Enhatch
In March 2022, we made a $10,000 investment in convertible preferred shares for an approximate 26.6% ownership interest in Enhatch Inc. (“Enhatch”), the developer of the Intelligent Surgery Ecosystem. We simultaneously entered into a supply agreement with Enhatch. We also obtained warrants to purchase additional shares of Enhatch, as well as the right to purchase in the future (“call option”) the remaining shares of Enhatch that 3D Systems does not own if certain revenue targets are achieved. As of the original investment date, the fair values of the convertible preferred shares, inclusive of the embedded call option, and warrants were bifurcated and were $9,670 and $330, respectively. The investment, including the embedded call option and the warrants, is recorded in other assets on the consolidated balance sheets.
Enhatch’s Intelligent Surgery Ecosystem provides technologies which streamline and scale the design and delivery of patient-specific medical devices by automating the process. Incorporating these capabilities into 3D Systems’ workflow for patient-specific solutions, which includes advanced software, expert treatment planning services, custom implants and instrumentation design, and industry-leading production processes, will help more efficiently meet the growing demand for personalized medical devices.
As of December 31, 2023 and December 31, 2022, the reported carrying value of the Company's convertible preferred stock investment in Enhatch, inclusive of the call option, is $6,900, which reflects the cumulative impact of $2,770 of historical impairment charges that have been recognized since the date of the original investment. These impairment charges were recorded during the year ended December 31, 2022. No impairment charges were recognized with respect to this investment during the year ended December 31, 2023. During the year ended December 31, 2023, the Company made purchases of $182 from Enhatch .
(11) Leases
We have various lease agreements for our facilities, equipment and vehicles with remaining lease terms ranging from one to fifteen years. During the year ended December 31, 2023, two buildings that were under construction as of December 31, 2022 were completed and became available for use by the Company as leased premises. As a result, these leases were deemed to have commenced during the period.
Components of lease cost (income) for the years ended December 31, 2023, 2022, and 2021 were as follows:
| | | | | | | | | | | | | | | | | | | | |
| (in thousands) | | 2023 | | 2022 | | 2021 |
| Operating lease cost | | $ | 13,667 | | | $ | 9,135 | | | $ | 10,226 | |
| | | | | | |
| Finance lease cost - amortization expense | | 991 | | | 621 | | 714 |
| Finance lease cost - interest expense | | 478 | | | 196 | | 238 |
| Short-term lease cost | | 494 | | | 705 | | 76 |
| Variable lease cost | | 3,953 | | | 764 | | | 3,163 | |
| Sublease income | | (186) | | | (158) | | | (569) | |
| Total | | $ | 19,397 | | | $ | 11,263 | | | $ | 13,848 | |
3D SYSTEMS CORPORATION
NOTES TO THE CONSOLIDATED FINANCIAL STATEMENTS
As of December 31, 2023, our future minimum lease payments under operating leases and finance leases with initial or remaining lease terms in excess of one year were as follows:
| | | | | | | | | | | | | | |
| (in thousands) | | Finance Leases | | Operating Leases |
| Years ending December 31: | | | | |
| 2024 | | $ | 2,818 | | | $ | 14,375 | |
| 2025 | | 2,244 | | | 12,876 | |
| 2026 | | 2,155 | | | 12,242 | |
| 2027 | | 2,125 | | | 9,937 | |
| 2028 | | 2,115 | | | 9,351 | |
| Thereafter | | 6,786 | | | 30,794 | |
| Total lease payments (undiscounted) | | 18,243 | | | 89,575 | |
| Less: imputed interest | | (5,015) | | | (22,856) | |
| Present value of lease liabilities | | $ | 13,228 | | | $ | 66,719 | |
Supplemental cash flow information related to our leases for the years ending December 31, 2023, 2022 and 2021 was as follows:
| | | | | | | | | | | | | | | | | | | | |
| (in thousands) | | 2023 | | 2022 | | 2021 |
| Cash paid for amounts included in the measurement of lease liabilities: | | | | | | |
| Operating cash outflow for operating leases | | $ | 13,177 | | | $ | 10,268 | | | $ | 11,108 | |
| Operating cash outflow for finance leases | | $ | 478 | | | $ | 196 | | | $ | 238 | |
| Financing cash outflow for finance leases | | $ | 644 | | | $ | 652 | | | $ | 721 | |
The weighted-average remaining lease term and discount rate for our finance and operating leases as of December 31, 2023 and 2022 were as follows:
| | | | | | | | | | | | | | | | | | | | | | | |
| | 2023 | 2022 |
| | Finance | | Operating | Finance | | Operating |
| Weighted-average remaining lease term (in years) | | 8.0 | | 7.7 | 6.2 | | 7.7 |
| Weighted-average discount rate | | 8.96% | | 7.23% | 4.83% | | 6.49% |
(12) Accrued and Other Liabilities
Accrued and other liabilities at December 31, 2023 and 2022 are summarized as follows:
| | | | | | | | | | | |
| (in thousands) | 2023 | | 2022 |
| Compensation and benefits | $ | 13,196 | | | $ | 19,814 | |
| Accrued taxes | 10,373 | | | 10,694 | |
| Legal contingencies | 3,487 | | | 9,948 | |
| Product warranty liability | 2,106 | | | 3,677 | |
Current finance lease liabilities | 1,770 | | | 693 | |
Other accrued liabilities | 18,528 | | | 11,438 | |
| Total | $ | 49,460 | | | $ | 56,264 | |
3D SYSTEMS CORPORATION
NOTES TO THE CONSOLIDATED FINANCIAL STATEMENTS
Changes in the product warranty obligation for the years ended December 31, 2023, 2022 and 2021 are summarized below:
| | | | | | | | | | | | | | | | | | | | | | | | | | |
| (in thousands) | | Beginning Balance | | Settlements made | | Accruals for warranties issued | | Ending Balance |
| Year ended December 31, | | | | | | | | |
| 2023 | | $ | 3,677 | | | $ | (4,397) | | | $ | 2,826 | | | $ | 2,106 | |
| 2022 | | $ | 3,585 | | | $ | (5,961) | | | $ | 6,053 | | | $ | 3,677 | |
| 2021 | | $ | 2,348 | | | $ | (7,547) | | | $ | 8,784 | | | $ | 3,585 | |
Other liabilities at December 31, 2023 and 2022 are summarized as follows:
| | | | | | | | | | | |
| (in thousands) | 2023 | | 2022 |
| Long-term employee indemnity | $ | 4,790 | | | $ | 4,817 | |
| Long-term tax liability | 5,577 | | | 5,711 | |
| Defined benefit pension obligation | 5,852 | | | 5,050 | |
| Long-term deferred revenue | 2,028 | | | 4,974 | |
| Earnout liability | — | | | 17,244 | |
| Legal contingencies | 2,863 | | | 6,096 | |
| Other long-term liabilities | 832 | | | 289 | |
Long-term finance lease liabilities | 11,458 | | | 3,280 | |
| Total | $ | 33,400 | | | $ | 47,461 | |
The reduction in the earnout liability balance is the result of the reversal of all previously recognized expense attributable to a potential post-acquisition milestone-based payment related to the Company's 2021 acquisition of Volumetric. During the year ended December 31, 2023, the Company reversed the accrued compensation expense related to the potential earnout payment as the related milestone is no longer deemed probable of being achieved. Refer to Note 17 for additional details regarding the earnout arrangement and the financial impact of this milestone-based payment no longer being deemed probable of being paid.
(13) Borrowings
Convertible Notes
On November 16, 2021, the Company issued $460,000 in aggregate principal amount of 0% Convertible Senior Notes due November 15, 2026 (the “Notes”), pursuant to an Indenture dated November 16, 2021 (the “Indenture”) between the Company and The Bank of New York Mellon, N.A., as trustee. The net proceeds from the offering of the Notes were $446,534 after deducting the initial purchasers’ discounts and commissions and offering expenses payable by the Company in the amount of $13,466. The annual effective interest rate of the Notes is 0.594% when including purchasers' discounts and commissions and offering expenses incurred by the Company. The Notes are senior, unsecured obligations of the Company, will not bear regular interest, and the principal amount of the Notes will not accrete. The Notes will mature on November 15, 2026, unless earlier redeemed, repurchased or converted in accordance with their terms.
3D SYSTEMS CORPORATION
NOTES TO THE CONSOLIDATED FINANCIAL STATEMENTS
The Notes will be convertible at the option of the holders at any time prior to the close of business on the business day immediately preceding August 15, 2026, only under the following circumstances: (1) during any calendar quarter commencing after the calendar quarter ending on March 31, 2022 (and only during such quarter), if the last reported sale price of the Company’s common stock, par value $0.001 per share (the “Common Stock”), is equal to or greater than 130% of the conversion price for each of at least 20 trading days (whether or not consecutive) during a period of 30 consecutive trading days ending on, and including, the last trading day of the immediately preceding calendar quarter on each applicable trading day; (2) during the five business day period after any five consecutive trading day period (the “measurement period”) in which the trading price (as defined in the Indenture) per $1 principal amount of Notes for each trading day of the measurement period was less than 98% of the product of the last reported sale price per share of the Common Stock and the conversion rate on each such trading day; (3) if the Company calls such Notes for redemption at any time prior to the close of business on the second scheduled trading day immediately preceding the redemption date; and (4) upon the occurrence of specified corporate events, including a Fundamental Change (as defined in the Indenture), or distributions of the Common Stock. On or after August 15, 2026, until the close of business on the second scheduled trading day immediately preceding the maturity date, holders may convert all or any portion of their Notes at any time, at the option of the holder, regardless of the foregoing circumstances. Upon conversion, the Company will pay cash up to the aggregate principal amount of the Notes to be converted and pay or deliver, as the case may be, cash, shares of Common Stock, or a combination of cash and shares of Common Stock, at the Company’s election, in respect of the remainder, if any, of the Company’s conversion obligation in excess of the aggregate principal amount of the Notes being converted. The Notes have an initial conversion rate of 27.8364 shares of Common Stock per $1 principal amount of Notes (which is subject to adjustment in certain circumstances). This is equivalent to an initial conversion price of approximately $35.92 per share. The conversion rate is subject to customary adjustments under certain circumstances in accordance with the terms of the Indenture. Holders of the Notes have the right to require the Company to repurchase for cash all or a portion of their Notes at 100% of their principal amount, plus any accrued and unpaid special interest, upon the occurrence of a Fundamental Change. The Company is also required to increase the conversion rate for holders who convert their Notes in connection with a Fundamental Change or convert their Notes that are called for redemption, as the case may be, prior to the maturity date. The Company may not redeem the Notes prior to November 20, 2024. The Notes are redeemable, in whole or in part, for cash at the Company’s option at any time, and from time to time, on or after November 20, 2024 and before the 41st scheduled trading day immediately preceding the maturity date, but only if the last reported sale price per share of the Common Stock has been at least 130% of the conversion price then in effect for a specified period of time. As of December 31, 2023, none of the circumstances that would permit the holders of the Notes to exercise their conversion option had occurred.
The Notes are the Company’s senior unsecured obligations and will rank senior in right of payment to any of the Company’s existing and future indebtedness that is expressly subordinated in right of payment to the Notes; rank equal in right of payment to any of the Company’s future unsecured indebtedness that is not so subordinated; be effectively subordinated in right of payment to any of the Company’s existing and future secured indebtedness to the extent of the value of the collateral securing such indebtedness; and structurally subordinated to all existing and future indebtedness and other liabilities (including trade payables) of current or future subsidiaries of the Company. The Indenture also contains covenants, events of default and other provisions which are customary for offerings of convertible notes. As of December 31, 2023, we were in compliance with all covenants of the Indenture. Subsequent to December 31, 2023, the Company has become non-compliant with certain terms of the Indenture. Refer to Note 26 for additional details.
The Company incurred $2,640, $2,652, and $324 of interest expense attributable to debt issuance cost accretion for the years ended December 31, 2023, 2022, and 2021, respectively. In addition, the Company wrote off $2,335 of debt issuance costs in connection with the repurchase of a portion of the Notes in December 2023, as further discussed below. Debt issuance cost accretion of $1,907, $1,917, and $1,690 is expected to be incurred in 2024, 2025 and 2026, respectively.
Debt Extinguishment
In December 2023, the Company repurchased $135,130 of the Notes for $100,614 including transaction expenses. The repurchased notes were retired upon receipt, and the retirement of the debt obligations was accounted for as an extinguishment of debt. The repurchase of the notes at a discount resulted in the recognition of a gain of $32,181, after transaction expenses and the write-off of related debt issuance costs, which is reported in Interest and other income (expense), net on the Company’s consolidated statement of operations for the year ended December 31, 2023. As of December 31, 2023, there was $324,870 in aggregate principal amount of Notes outstanding and $5,514 of unamortized deferred issuance costs. At December 31, 2023, the estimated fair value of the Notes is $247,307. This is based on the quoted market price where the volume of activity is limited and not active and, thus, this is deemed a Level 2 fair value measurement.
3D SYSTEMS CORPORATION
NOTES TO THE CONSOLIDATED FINANCIAL STATEMENTS
Subsequent to December 31, 2023, the Company repurchased $110,492 aggregate principal amount of the Notes from certain holders. Refer to Note 26 for additional details.
(14) Employee Benefits
We sponsor a Section 401(k) plan (the “Plan”) covering substantially all of our eligible U.S. employees. The Plan entitles eligible employees to make contributions to the Plan after meeting certain eligibility requirements. Contributions are limited to the maximum contribution allowances permitted under the Internal Revenue Code. We match 50% of contributions on the first 6% of the participant’s eligible compensation.
For the years ended December 31, 2023, 2022 and 2021, we expensed $2,558, $2,254 and $2,039, respectively, for matching contributions related to the Plan.
International Retirement Plan
We sponsor a non-contributory defined benefit pension plan for certain employees of a non-U.S. subsidiary. We maintain outside of the plan insurance contracts that provide an annuity that is used to fund the current obligations under this plan. The following table provides a reconciliation of the changes in the projected benefit obligation for the years ended December 31, 2023 and 2022:
| | | | | | | | | | | | | | |
| (in thousands) | | 2023 | | 2022 |
| Reconciliation of benefit obligation: | | | | |
| Obligation as of January 1 | | $ | 5,215 | | | $ | 9,074 | |
| Service cost | | 59 | | | 103 | |
| Interest cost | | 220 | | | 99 | |
| Actuarial (gain) loss | | 541 | | | (3,387) | |
| Benefit payments | | (173) | | | (162) | |
| Effect of foreign currency exchange rate changes | | 165 | | | (512) | |
| Benefit obligation as of December 31 | | 6,027 | | | 5,215 | |
| Fair value of assets as of December 31 | | 3,691 | | | 3,463 | |
| Funded status as of December 31 | | $ | (2,336) | | | $ | (1,752) | |
We recognized the following amounts in the consolidated balance sheets at December 31, 2023 and 2022:
| | | | | | | | | | | | | | |
| (in thousands) | | 2023 | | 2022 |
| Other assets | | $ | 3,691 | | | $ | 3,463 | |
| Accrued and other liabilities | | (175) | | | (165) | |
| Other liabilities | | (5,852) | | | (5,050) | |
| Net liability | | $ | (2,336) | | | $ | (1,752) | |
Following are the projected benefit obligation and accumulated benefit obligation at December 31, 2023 and 2022:
| | | | | | | | | | | | | | |
| (in thousands) | | 2023 | | 2022 |
| Projected benefit obligation | | $ | 6,027 | | | $ | 5,215 | |
| Accumulated benefit obligation | | $ | 5,776 | | | $ | 4,984 | |
3D SYSTEMS CORPORATION
NOTES TO THE CONSOLIDATED FINANCIAL STATEMENTS
The following table shows the components of net periodic benefit costs and the amounts recognized in accumulated other comprehensive income (loss) for the years ended December 31, 2023, 2022 and 2021:
| | | | | | | | | | | | | | | | | | | | |
| (in thousands) | | 2023 | | 2022 | | 2021 |
| Net periodic benefit cost: | | | | | | |
| Service cost | | $ | 59 | | | $ | 103 | | | $ | 187 | |
| Interest cost | | 220 | | | 99 | | | 130 | |
Amortization of actuarial (gain) loss | | (46) | | | 45 | | | 259 | |
| Total net periodic pension cost | | 233 | | | 247 | | | 576 | |
| Other changes in plan assets and benefit obligations recognized in other comprehensive income (loss): | | | | | | |
| Net (gain) loss | | 541 | | | (3,387) | | | (234) | |
Amortization of prior years' unrecognized gain (loss) | | 46 | | | (45) | | | (259) | |
| Total recognized as other comprehensive income (loss), excluding tax | | 587 | | | (3,432) | | | (493) | |
| Total (gain) expense recognized in net periodic benefit cost and other comprehensive income (loss) | | $ | 820 | | | $ | (3,185) | | | $ | 83 | |
The following assumptions are used to determine the benefit obligations as of December 31, 2023 and 2022:
| | | | | | | | | | | | | | |
| | 2023 | | 2022 |
| Discount rate | | 3.6% | | 4.2% |
| Rate of compensation | | 3.0% | | 3.0% |
The following benefit payments, including expected future service cost, are expected to be paid:
| | | | | |
| (in thousands) | |
| Estimated future benefit payments for the years ending December 31: | |
| 2024 | $ | 185 | |
| 2025 | 187 | |
| 2026 | 218 | |
| 2027 | 244 | |
| 2028 | 273 | |
2029 through 2033 | 1,723 | |
(15) Redeemable Non-controlling Interest
Upon consummation of the Company's acquisition of Kumovis, existing shareholders of Kumovis retained a 6.25% ownership interest in Kumovis that the Company reports as RNCI due to put and call terms that could result in the Company redeeming this remaining ownership interest at a future date (see Note 3). The following table shows changes in the reported RNCI balance during the year ended December 31, 2023:
| | | | | | | | | |
| (in thousands) | | Year Ended December 31, 2023 | |
Balance at December 31, 2022 | | $ | 1,760 | | |
Net loss | | (265) | | |
Redemption value in excess of carrying value | | 479 | | |
Translation adjustments | | 32 | | |
Balance at December 31, 2023 | | $ | 2,006 | | |
3D SYSTEMS CORPORATION
NOTES TO THE CONSOLIDATED FINANCIAL STATEMENTS
The following table shows changes in the reported RNCI balance during the year ended December 31, 2022:
| | | | | | | | | |
| (in thousands) | | Year Ended December 31, 2022 | |
Balance at January 1, 2022 | | $ | — | | |
| Fair value at the date of acquisition | | 1,559 | | |
Net loss | | (238) | | |
| Redemption value in excess of carrying value | | 596 | | |
Translation adjustments | | (157) | | |
Balance at December 31, 2022 | | $ | 1,760 | | |
(16) Common Stock and Preferred Stock
Common Stock
The Company is authorized to issue 220,000 shares of common stock. The holders of the common stock are entitled to one vote for each share held at all meetings of stockholders (and for written actions in lieu of meetings).
Dividends may be declared and paid on common stock from funds lawfully available as and when determined by the Board of Directors and subject to any preferential dividend rights of any then outstanding preferred stock. Through the year ended December 31, 2023, no dividends have been declared.
Preferred Stock
The Company is authorized to issue 5,000 shares of preferred stock, all of which remained unissued at December 31, 2023 and 2022.
(17) Stock-Based Compensation
Stock Incentive Plans
2015 Incentive Plan
The Company is authorized to grant shares of restricted stock, restricted stock units (“RSUs”), stock appreciation rights, cash incentive awards and options to purchase shares of common stock to employees and non-employees inclusive of directors pursuant to its 2015 Incentive Plan (the “2015 Plan”). The 2015 Plan also designates that shares may be used for performance-based awards and market-based awards. The vesting period for awards granted under the 2015 Plan is generally determined by the Board of Directors at the date of the grant. Generally, the awards vest one third each year, over 3 years. The total number of shares of common stock reserved and available for distribution under the 2015 Plan and the total number of shares of common stock that can be issued pursuant to stock options is 25,235 shares. Stock-based compensation expense is generally included in selling, general and administrative expenses in the consolidated statements of operations.
Systemic Bio Phantom Unit Plan
During the year ended December 31, 2023, we granted phantom unit awards ("Phantom Units") under a new compensation plan designed for employees and non-employees performing services for Systemic Bio, a wholly-owned subsidiary of 3D Systems Corporation. All awards granted under the plan are subsidiary-level awards.
3D SYSTEMS CORPORATION
NOTES TO THE CONSOLIDATED FINANCIAL STATEMENTS
The Phantom Units granted under the plan include both a time-based vesting condition (generally 4 years, subject to acceleration in connection with specified liquidity events) and a market condition that is met if (1) the value of Systemic Bio exceeds a specified multiple of the capital invested in this subsidiary (the "hurdle") and (2) the business achieves a specified minimum internal rate of return. The market condition will be assessed upon (A) a trigger event (e.g., change-in-control, IPO, or plan expiration of December 31, 2030) and/or (B) an interim liquidity event (defined as January 1, 2028) that occurs prior to a trigger event. All awards granted under the plan are liability-classified due to our intention to settle these awards with cash; although, we have discretion to partially or fully settle these awards in equity upon vesting. Liability classification of the awards requires them to be remeasured at their estimated fair value at the end of each reporting period. Due to the presence of the market-condition and the fact that Systemic Bio does not have a readily available share price, the awards are valued using a Monte Carlo simulation with the assistance of a third-party valuation firm.
Other Compensation Arrangements that Include Share Settlement
Regenerative Medicine Earnout Payments and Performance-Based Stock Units
On December 1, 2021, the Company acquired Volumetric. Pursuant to the terms of the related acquisition agreement, the Company could be required to pay milestone-based payments of up to $355,000 in the aggregate, all of which would be incremental to the acquisition purchase price, upon (1) the achievement of seven discrete non-financial milestones that require attainment prior to either December 31, 2030 or December 31, 2035 and (2) the continued employment of certain key individuals from Volumetric. Each potential milestone-based payment is considered compensation expense, which the Company is required to recognize ratably from the point in time when a milestone is deemed probable of achievement through the estimated date of achievement. Each milestone payment, if earned, will be settled approximately half in cash and half in shares of the Company’s common stock and, accordingly, the portion of the Company’s accrued liability (see Note 12) that would ultimately be settled with the Company’s common stock is reflected in the disclosure of stock-based compensation expense included herein.
In addition, the Company has granted performance-based stock units (“PSUs”), with vesting terms that are based upon four individually-measured, non-financial milestones, to other employees who work on advancements in regenerative medicine related to human organs and non-organ human tissue. The PSUs associated with each individual milestone are required to be recognized as compensation expense over the period commencing on the date that the respective milestone is deemed probable of being met through the anticipated date of achievement.
Prior to the year ended December 31, 2023, the Company recognized compensation expense related to (1) one Volumetric milestone-based payment, for which the potential amount due to the sellers would be $65,000, and (2) one PSU milestone (“the RegMed Awards”), for which the aggregate grant date fair value of the outstanding and unvested awards was $4,536 as of December 31, 2022, as the related milestone was deemed probable of achievement. During the year ended December 31, 2023, the Company decided to reduce its budgeted funding for the R&D related to the Volumetric and RegMed Award milestones for which compensation expense was previously being recognized, which resulted in the Company concluding that it is no longer probable that the respective milestones would be achieved by the end of the term of the Volumetric earnout arrangement and prior to the expiration of the RegMed Awards. In concluding that the Volumetric and RegMed Award milestones would no longer be achieved, the Company reversed all of the previously accrued compensation expense, a portion of which was to be settled with common stock, which reduced selling, general and administrative expense, as well as the Company's reported loss, by $18,392 for the year ended December 31, 2023. The reversal of such accrued expense reduced our reported net loss per basic and diluted share of common stock by $0.14 for the year ended December 31, 2023.
Subsequent to December 31, 2023, events have occurred that have resulted in the Company fully cancelling the former Volumetric Shareholders' eligibility to earn any portion of the $355,000 attributable to the milestone-based payments outlined in the Volumetric acquisition agreement. Refer to Note 26 for additional details.
dp polar Earnout
On October 4, 2022, the Company acquired dp polar. The acquisition agreement included an earnout arrangement for $2,229 incremental to the acquisition purchase price, which would be settled via the issuance of 250 shares of the Company’s common stock. The issuance and vesting of these shares is contingent on certain service conditions of a key individual from dp polar through December 31, 2024. Management concluded that this potential obligation for the issuance of 250 shares of common stock should be accounted for as compensation expense recognized over the individual's service period and, accordingly, the related expense is reflected in the disclosure of stock-based compensation included herein. In April 2024, due to a change in the key individual's employment arrangement, all service conditions were met based on the terms of the initial earnout. All remaining cost related to the unvested shares was recorded in operating expense in the three months ended June 30, 2024.
3D SYSTEMS CORPORATION
NOTES TO THE CONSOLIDATED FINANCIAL STATEMENTS
Stock-Based Compensation Activity and Expense
The following table shows the stock-based compensation expense recognized during the years ended December 31, 2023, 2022, and 2021:
| | | | | | | | | | | | | | | | | | | | |
| (in thousands) | | 2023 | | 2022 | | 2021 |
| Stock-based compensation expense | | $ | 23,504 | | | $ | 42,415 | | | $ | 55,153 | |
| Tax benefit | | $ | — | | | $ | — | | | $ | — | |
Included in the above expenses for the years ended December 31, 2023, 2022, and 2021 are $0, $4,030, and $22,057 of expense, respectively, pertaining to annual incentive compensation which is paid in Company shares of common stock that are vested upon grant. Also, included in the above expenses for the years ended December 31, 2023, 2022, and 2021 are $(8,640), $7,959, and $683, respectively, of expense related to the Volumetric earnout arrangement discussed above and in Note 3. Finally, the above expenses for the years ended December 31, 2023, 2022, and 2021 include $1,015, $268 and $0, respectively, of expense related to the dp polar earnout arrangement discussed above and in Note 3.
Restricted Stock and Restricted Stock Units
A summary of our restricted stock and RSU activity for the year ended December 31, 2023 is as follows:
| | | | | | | | | | | | | | |
| (in thousands, except per share amounts) | | Number of Shares/Units | | Weighted Average Grant Date Fair Value |
| Outstanding at beginning of year — unvested | | 5,015 | | | $ | 18.19 | |
| Granted | | 4,439 | | | $ | 10.26 | |
| Canceled | | (1,118) | | | $ | 15.45 | |
| Vested | | (2,154) | | | $ | 13.09 | |
| Outstanding at end of year — unvested | | 6,182 | | | $ | 14.77 | |
Included in the above outstanding balance as of December 31, 2023 are 1,106 shares of restricted stock that vest under specified market conditions and 966 shares of restricted stock that remain subject to specified performance conditions in order to vest. Awards with specified market conditions were awarded to certain employees in 2023, 2022, and 2021.
Systemic Bio Phantom Unit Plan
During the year ended December 31, 2023, we granted 597 units under the Systemic Bio Phantom Unit Plan, 596 of which remained outstanding as of December 31, 2023. Compensation expense attributable to these awards is being recognized over 40.5 months or 48 months, based upon the recipient. As the awards include graded, time-based vesting and a market condition, compensation expense is being recognized under the graded vesting (accelerated attribution) method. Compensation expense and the associated liability recognized during the year ended December 31, 2023 was $544. Systemic Bio Phantom Units are excluded from the restricted stock and RSU summary table above.
At December 31, 2023, there was $41,161 of unrecognized stock-based compensation expense related to all unvested equity awards, which we expect to recognize over a weighted-average period of 1.9 years.
Stock Options
During the year ended December 31, 2016, we awarded certain employees market condition stock options under the 2015 Plan that vest under specified market conditions. Each employee was generally awarded two equal tranches of market condition stock options that immediately vest when our common stock trades at either $30 or $40 per share for ninety consecutive calendar days.
We recognize compensation expense related to stock options on a straight-line basis over the derived term of the awards. The fair value of stock options with market conditions is estimated using a binomial lattice Monte Carlo simulation model. Expense for awards with a market condition is not reversed if the market condition is not met.
3D SYSTEMS CORPORATION
NOTES TO THE CONSOLIDATED FINANCIAL STATEMENTS
Stock option activity for the year ended December 31, 2023 was as follows:
| | | | | | | | | | | | | | | | | | | | | | | | | | |
| | Year Ended December 31, 2023 |
| (in thousands, except per share amounts) | | Number of Shares | | Weighted Average Exercise | | Weighted Average Remaining Contractual Term (in years) | | Aggregate Intrinsic Value |
| Stock option activity: | | | | | | | | |
| Outstanding at beginning of year | | 420 | | | $ | 13.26 | | | 3.7 | | $ | — | |
| Granted | | — | | | — | | | — | | | — | |
| Exercised | | — | | | — | | | — | | | — | |
| Forfeited and expired | | — | | | — | | | — | | | — | |
| Outstanding at end of year | | 420 | | | $ | 13.26 | | | 2.7 | | $ | — | |
As of December 31, 2023 and 2022, none of the 420 outstanding stock options were exercisable, and there was no unrecognized stock-based compensation expense related to stock options.
(18) Interest and Other Income (Expense), Net
| | | | | | | | | | | | | | | | | | | | |
| | Year Ended December 31, |
| (in thousands) | | 2023 | | 2022 | | 2021 |
| Interest and other income (expense), net | | | | | | |
| Foreign exchange (loss) gain, net | | $ | (4,825) | | | $ | (4,424) | | | $ | 1,681 | |
| Interest income (expense), net | | 16,210 | | | 6,541 | | | (1,902) | |
Other income (expense), net | | 32,307 | | | (5,907) | | | 352,830 | |
Total interest and other income (expense), net | | $ | 43,692 | | | $ | (3,790) | | | $ | 352,609 | |
Interest income (expense), net includes (1) interest income of $19,511, $9,352, and $438 for the years ended December 31, 2023, 2022, and 2021, respectively, and (2) interest expense of $3,301, $2,811, and $2,340 for the years ended December 31, 2023, 2022, and 2021, respectively. Other income (expense), net for the year ended December 31, 2023 includes a $32,181 gain on extinguishment of debt resulting from the Company's repurchase of $135,130 of its outstanding Convertible Senior Notes. See Note 13 for additional information. Other income (expense), net for the year ended December 31, 2021 includes $350,853 of gains on the sales of ODM, Simbionix and Cimatron. See Note 4 for additional information.
(19) Income Taxes
The components of our income before income taxes for the years ended December 31, 2023, 2022 and 2021 are as follows:
| | | | | | | | | | | | | | | | | | | | |
| | Year Ended December 31, |
| (in thousands) | | 2023 | | 2022 | | 2021 |
| Income (loss) before income taxes: | | | | | | |
| Domestic | | $ | (239,971) | | | $ | (110,610) | | | $ | 308,514 | |
| Foreign | | (122,341) | | | (10,199) | | | 11,026 | |
| Total | | $ | (362,312) | | | $ | (120,809) | | | $ | 319,540 | |
3D SYSTEMS CORPORATION
NOTES TO THE CONSOLIDATED FINANCIAL STATEMENTS
The components of income tax provision for the years ended December 31, 2023, 2022 and 2021 are as follows:
| | | | | | | | | | | | | | | | | | | | |
| (in thousands) | | 2023 | | 2022 | | 2021 |
| Current: | | | | | | |
| U.S. federal | | $ | 135 | | | $ | 119 | | | $ | (8,675) | |
| State | | (50) | | | (498) | | | 2,097 | |
| Foreign | | 1,686 | | | 5,037 | | | 6,861 | |
| Total | | 1,771 | | | 4,658 | | | 283 | |
| | | | | | |
| Deferred: | | | | | | |
| U.S. federal | | — | | | — | | | — | |
| State | | — | | | — | | | — | |
| Foreign | | (2,412) | | | (2,518) | | | (2,795) | |
| Total | | (2,412) | | | (2,518) | | | (2,795) | |
| Total income tax (benefit) provision | | $ | (641) | | | $ | 2,140 | | | $ | (2,512) | |
The overall effective tax rate differs from the statutory federal tax rate for the years ended December 31, 2023, 2022 and 2021 as follows:
| | | | | | | | | | | | | | | | | | | | |
| | % of Pretax (Loss) Income |
| | 2023 | | 2022 | | 2021 |
| Tax provision based on the federal statutory rate | | 21.0 | % | | 21.0 | % | | 21.0 | % |
| Increase in valuation allowances | | (6.5) | | | (10.7) | | | (10.4) | |
| | | | | | |
| | | | | | |
| Change in carryforward attributes | | — | | | (1.9) | | | (0.7) | |
| Global intangible low-taxed income inclusion | | (0.4) | | | (0.5) | | | 1.2 | |
| Non-deductible expenses | | — | | | (1.6) | | | 1.4 | |
| Non-deductible earnout expense | | 1.0 | | | (2.8) | | | — | |
Goodwill impairment charge | | (14.6) | | | — | | | — | |
| Foreign income tax rate differential | | 0.5 | | | (0.3) | | | — | |
| Deemed income related to foreign operations | | (0.3) | | | (0.2) | | | — | |
| Tax rate change | | — | | | (1.2) | | | (0.7) | |
| Employee share-based payments | | (0.5) | | | (1.6) | | | (1.3) | |
| Other | | (0.7) | | | 0.4 | | | — | |
| Deferred and payable adjustments | | (1.3) | | | (1.7) | | | 1.4 | |
| Non-deductible penalties | | — | | | (2.5) | | | — | |
| State taxes, net of federal benefit, before valuation allowance | | 0.7 | | | 1.4 | | | 1.0 | |
| Return-to-provision adjustments | | 0.2 | | | (0.2) | | | (0.1) | |
| Other tax credits | | 1.1 | | | 0.8 | | | (0.5) | |
| Uncertain tax positions and audit settlements | | — | | | (0.2) | | | (3.0) | |
| Divestitures | | — | | | — | | | (10.1) | |
| Effective tax rate | | 0.2 | % | | (1.8) | % | | (0.8) | % |
The difference between our effective tax rate for 2023, and the federal statutory rate was 20.8 percentage points. The difference in the effective rate is primarily due to the net increase in valuation allowances and non-deductible goodwill impairment charges.
The difference between our effective tax rate for 2022, and the federal statutory rate was 22.8 percentage points. The difference in the effective rate is primarily due to valuation allowance changes and non-deductible expenses, including earnout expense and penalties.
3D SYSTEMS CORPORATION
NOTES TO THE CONSOLIDATED FINANCIAL STATEMENTS
The difference between our effective tax rate for 2021, and the federal statutory rate was 21.8 percentage points. The difference in the effective rate is primarily due to differences in book and stock bases related to the divestitures of Cimatron and Simbionix, valuation allowance changes, and adjustments to uncertain tax positions, provisions for GILTI, and non-deductible expenses.
In 2023, we recorded a full valuation allowance for Wematter and Layerwise, a foreign subsidiary of the Company. In 2022, and 2021, there were no significant changes to our valuation allowance assertions. We continue to review results of operations and forecast estimates to determine if it is more likely than not that the deferred tax assets will be realized.
The components of our net deferred income tax assets and net deferred income tax (liabilities) at December 31, 2023 and 2022 are as follows:
| | | | | | | | | | | | | | |
| (in thousands) | | 2023 | | 2022 |
| Deferred income tax assets: | | | | |
| Intangible assets | | $ | 13,830 | | | $ | 8,601 | |
| Stock options and restricted stock awards | | 5,409 | | | 6,091 | |
| Reserves and allowances | | 6,395 | | | 6,145 | |
| Net operating loss carryforwards | | 47,875 | | | 51,845 | |
| Tax credit carryforwards | | 25,286 | | | 19,649 | |
| Accrued liabilities | | 2,371 | | | 2,518 | |
| Deferred revenue | | 2,783 | | | 5,502 | |
| Lease tax assets | | 15,985 | | | 9,589 | |
| Research expenditures capitalization | | 30,601 | | | 11,140 | |
| Other | | 1,227 | | | 1,180 | |
| Valuation allowance | | (125,533) | | | (100,694) | |
| Total deferred income tax assets | | 26,229 | | | 21,566 | |
| | | | |
| Deferred income tax liabilities: | | | | |
| Intangible assets | | 8,688 | | | 9,090 | |
| Property and equipment | | 4,082 | | | 4,477 | |
| Lease tax liabilities | | 13,924 | | | 7,785 | |
| | | | |
| Other | | 467 | | | 807 | |
| Total deferred income tax liabilities | | 27,161 | | | 22,159 | |
| | | | |
Net deferred income tax liabilities | | $ | (932) | | | $ | (593) | |
At December 31, 2023, $47,875 of our deferred income tax assets was attributable to $347,035 of gross net operating loss carryforwards, which consisted of $80,645 of loss carryforwards for U.S. federal income tax purposes, $166,419 of loss carryforwards for U.S. state income tax purposes and $99,971 of loss carryforwards for foreign income tax purposes. $7,381 of gross net operating loss carryforwards for U.S. federal income tax purposes are acquisition related and are subject to potential measurement period adjustments under ASC 805.
The net operating loss carryforwards for U.S. federal income tax purposes do not expire. The net operating loss carryforwards for U.S. state income tax purposes begin to expire in 2023. In addition, certain net loss carryforwards for foreign income tax purposes begin to expire in 2024 and certain other loss carryforwards for foreign purposes do not expire.
At December 31, 2023, tax credit carryforwards deferred assets of $25,286 consisted of $15,093 of research and experimentation credit carryforwards for U.S. federal income tax purposes, $3,565 of research and experimentation tax credit carryforwards for U.S. state income tax purposes, and $6,628 of foreign tax credits for U.S. federal income tax purposes. Certain state research and experimentation and other state credits begin to expire in 2023. We have recorded a valuation allowance related to the U.S. federal and state tax credits.
3D SYSTEMS CORPORATION
NOTES TO THE CONSOLIDATED FINANCIAL STATEMENTS
Due to the transition tax, our previously unremitted earnings have been subjected to U.S. federal income tax, although, other additional taxes such as, withholding tax, could be applicable. We intend to permanently reinvest our earnings outside the U.S. and as such, have not provided for any additional taxes on approximately $95,352 of unremitted earnings. We believe the unrecognized deferred tax liability related to these earnings is approximately $4,485.
Including interest and penalties, we decreased our unrecognized benefits by $271 for the year ended December 31, 2023, and increased our unrecognized tax benefits by $1,733 for the year ended December 31, 2023. The increase was primarily related to the addition of unrecognized tax benefits around current year R&D credits generated. We do not anticipate any additional unrecognized tax benefits during the next 12 months that would result in a material change to our consolidated financial position. The total amount of unrecognized tax benefits that, if recognized, would affect the effective tax rate is $5,577. We include interest and penalties in the consolidated financial statements as a component of income tax expense.
| | | | | | | | | | | | | | | | | | | | |
| | Unrecognized Tax Benefits(1) |
| (in thousands) | | 2023 | | 2022 | | 2021 |
| Balance at January 1 | | $ | (17,150) | | | $ | (17,261) | | | $ | (25,902) | |
| Increases related to prior year tax positions | | (99) | | | (192) | | | (467) | |
| Decreases related to prior year tax positions | | 107 | | | 508 | | | 8,886 | |
Decreases related to prior year tax positions as a result of lapse of statute | | 271 | | | 145 | | | 371 | |
| Decreases related to settlement | | — | | | — | | | 1,043 | |
| Increases related to current year tax positions | | (1,733) | | | (269) | | | (553) | |
| Increases related to acquired tax positions | | — | | | (119) | | | (639) | |
| Decreases related to acquired tax positions | | — | | | 38 | | | — | |
| Balance at December 31 | | $ | (18,604) | | | $ | (17,150) | | | $ | (17,261) | |
(1) The unrecognized tax benefit balance as of December 31, 2023, 2022, and 2021 includes $323, $283, and $208 of interest and penalty, respectively.
Tax years 2013 through 2021 remain subject to examination by the U.S. Internal Revenue Service (“IRS”). State income tax returns are generally subject to examination for a period of three to four years after filing the respective tax returns. The tax years 2018 through 2022 remain open to examination by the various foreign taxing jurisdictions to which the Company is subject.
The following presents the changes in the balance of our deferred income tax asset valuation allowance:
| | | | | | | | | | | | | | | | | | | | | | | | | | | | | | | | |
| Year Ended | | Item | | Balance at beginning of year | | Additions (reductions) charged to expense | | Other(1) | | Balance at end of year |
| 2023 | | Deferred income tax asset valuation allowance | | $ | 100,694 | | | $ | 23,606 | | | $ | 1,233 | | | $ | 125,533 | |
| 2022 | | Deferred income tax asset valuation allowance | | $ | 91,165 | | | $ | 12,848 | | | $ | (3,319) | | | $ | 100,694 | |
| 2021 | | Deferred income tax asset valuation allowance | | $ | 123,113 | | | $ | (31,948) | | | $ | — | | | $ | 91,165 | |
(1) The Other portion of changes to our valuation allowance consists primarily of the impact of acquisitions and changes in foreign currency translation rates.
3D SYSTEMS CORPORATION
NOTES TO THE CONSOLIDATED FINANCIAL STATEMENTS
(20) Net Income (Loss) Per Share
Basic net income (loss) per share is calculated by dividing net income (loss) attributable to 3D Systems' common stock shareholders by the weighted average number of common shares outstanding during the applicable period. Diluted net income (loss) per share incorporates the additional shares issuable upon the assumed exercise of stock options, the vesting of restricted stock and restricted stock units, and the assumed conversion of debt, except in such case when (1) the inclusion of such shares or potential shares would be anti-dilutive or (2) when the vesting of restricted stock or restricted stock units is contingent upon one or more performance conditions that have not been met as of the balance sheet date.
| | | | | | | | | | | | | | | | | |
| Year Ended December 31, |
| (in thousands, except per share amounts) | 2023 | | 2022 | | 2021 |
| Numerator for basic and diluted net (loss) income per share: | | | | | |
| Net (loss) income attributable to 3D Systems Corporation | $ | (362,688) | | | $ | (122,711) | | | $ | 322,052 | |
| Redeemable non-controlling interest redemption value in excess of carrying value | (479) | | | (596) | | | — | |
| Net (loss) income attributable to common stock shareholders | $ | (363,167) | | | $ | (123,307) | | | $ | 322,052 | |
| Denominator for net (loss) income per share: | | | | | |
| Weighted average shares – basic | 129,944 | | | 127,818 | | | 122,867 | |
Dilutive effect of shares issuable under stock based compensation and other plans(1) | — | | | — | | | 3,467 | |
| Weighted average shares – diluted | 129,944 | | | 127,818 | | | 126,334 | |
| | | | | |
Net (loss) income per share – basic | $ | (2.79) | | | $ | (0.96) | | | $ | 2.62 | |
Net (loss) income per share – diluted | $ | (2.79) | | | $ | (0.96) | | | $ | 2.55 | |
(1) Equity awards for the years ended December 31, 2023 and 2022 are deemed anti-dilutive because we reported a net loss for these periods. The dilutive impact of equity awards for December 31, 2021 is 2,755 shares, for which the calculation requires certain assumptions regarding assumed proceeds that would hypothetically repurchase common shares upon the conversion and exercise of restricted shares and outstanding stock options, respectively, and an estimate of 712 shares for the payment of accrued incentive compensation that was to be settled in shares. The share estimate is based on the accrued incentive compensation balance at the end of 2021 divided by the 2021 average share price.
The following table presents the potentially dilutive shares that were excluded from the computation of diluted income (loss) per share attributable to common stockholders because their effect was considered anti-dilutive for the years ended December 31, 2023, 2022 and 2021, respectively.
| | | | | | | | | | | | | | | | | |
| Year Ended December 31, |
| (in thousands) | 2023 | | 2022 | | 2021 |
| Restricted stock and restricted stock units | 6,182 | | | 5,015 | | | 1,779 | |
| Stock options | 420 | | | 420 | | | — | |
| Total | 6,602 | | | 5,435 | | | 1,779 | |
For the year ended December 31, 2023, the table above excludes an estimate of 138 shares that are contingently issuable under the dp polar earnout agreement, as discussed in Note 3. As of December 31, 2023, there are no contingently issuable shares related to the Volumetric earnout arrangement discussed in Note 3 or the fiscal year 2023 annual bonus incentive compensation plan.
For the year ended December 31, 2022, the table above excludes the following: (1) an estimate of 718 shares contingently issuable upon the achievement of certain milestones in the Volumetric earnout arrangement discussed in Note 3; (2) an estimate of 341 shares for the payment of accrued incentive compensation that was settled in shares during the second quarter of 2023; and (3) an estimate of 22 shares related to the dp polar earnout arrangement discussed in Note 3 that are contingently issuable. These share estimates are based on the expense recognized through December 31, 2022 divided by the 2022 average share price of $12 per share.
3D SYSTEMS CORPORATION
NOTES TO THE CONSOLIDATED FINANCIAL STATEMENTS
On November 16, 2021, the Company issued $460.0 million in aggregate principal amount of 0% Convertible Senior Notes due November 15, 2026, as discussed in Note 13. The Notes’ impact to diluted shares is calculated using the if-converted method as prescribed in ASU 2020-06. The Notes will increase the diluted share count when the average share price over a quarterly or annual reporting period is greater than $35.92 per share, the conversion price of the Notes. For the years ended December 31, 2023, 2022, and 2021, the Notes were anti-dilutive on a stand-alone basis because (1) the average share price during these periods did not exceed the conversion price, and (2) we had a net loss for the years ended December 31, 2023 and 2022, respectively.
(21) Accumulated Other Comprehensive Loss
The changes in the balances of accumulated other comprehensive loss by component are as follows:
| | | | | | | | | | | | | | | | | | | | | | | | | | | | | |
| (in thousands) | Foreign currency translation adjustment | | Defined benefit pension plan | | Derivative financial instruments | | Unrealized loss on short-term investments | | Total |
| Balance at December 31, 2020 | $ | (4,831) | | | $ | (2,924) | | | $ | (721) | | | $ | — | | | $ | (8,476) | |
| Other comprehensive income (loss) | (30,633) | | | 682 | | | — | | | — | | | (29,951) | |
Amounts reclassified from accumulated other comprehensive income (loss) a | — | | | — | | | 721 | | | — | | | 721 | |
| Balance at December 31, 2021 | (35,464) | | | (2,242) | | | — | | | — | | | (37,706) | |
| Other comprehensive income (loss) | (18,730) | | | 2,777 | | | — | | | (3,557) | | | (19,510) | |
Amounts reclassified from accumulated other comprehensive income (loss) a | — | | | 165 | | | — | | | 3,229 | | | 3,394 | |
| Balance at December 31, 2022 | (54,194) | | | 700 | | | — | | | (328) | | | (53,822) | |
| Other comprehensive income (loss) | 9,630 | | | (354) | | | — | | | 108 | | | 9,384 | |
Amounts reclassified from accumulated other comprehensive income (loss) a | — | | | (32) | | | — | | | 220 | | | 188 | |
| Balance at December 31, 2023 | $ | (44,564) | | | $ | 314 | | | $ | — | | | $ | — | | | $ | (44,250) | |
a.Amount reclassified into interest and other income (expense), net on the statements of operations. See Note 24 for details regarding fair value measurements and unrealized gains (losses) on short-term investments.
The amounts presented in the table above are net of income taxes. Income tax effects of these items are released from accumulated other comprehensive loss contemporaneously with the related gross pretax amount. For additional information about foreign currency translation and derivative financial instruments, see Note 2. For additional information about the defined benefit pension plan, see Note 14.
(22) Segment Information
The Company has two reportable segments: Healthcare Solutions and Industrial Solutions. Our reportable segments are based upon the industry verticals that they serve and reflect how we report our financial results to the chief operating decision maker ("CODM"). The CODM does not review disaggregated asset information on the basis of the Company's segments; therefore, such information is not presented.
Effective as of January 1, 2023, and for periods subsequent thereto, Adjusted EBITDA reflects the measure of profitability used by the Company’s CODM to evaluate the performance of the Company’s reportable segments. In addition, as of January 1, 2023, the Company's methodology for allocating certain costs between its segments was revised to more closely reflect changes in the Company's business and estimates of the usage of shared resources by the Company's segments. Prior year segment results have been revised to conform with current year presentation in connection with the changes referenced above. Fiscal year 2021 segment results have not been presented as it was determined to be impracticable to restate them on a comparable basis.
3D SYSTEMS CORPORATION
NOTES TO THE CONSOLIDATED FINANCIAL STATEMENTS
The following tables set forth our operating results by segment for the years ended December 31, 2023 and 2022:
| | | | | | | | | | | | | | | | | | | | | | | |
| Revenue | | Adjusted EBITDA |
| Year Ended December 31, | | Year Ended December 31, |
| (in thousands) | 2023 | | 2022 | | 2023 | | 2022 |
| Healthcare Solutions | $ | 213,216 | | | $ | 260,988 | | | $ | 38,520 | | | $ | 55,783 | |
| Industrial Solutions | 274,853 | | | 277,043 | | | 19,128 | | | 24,214 | |
| Total Reportable segments | 488,069 | | | 538,031 | | | 57,648 | | | 79,997 | |
Corporate and Other(1) | — | | | — | | | (83,906) | | | (85,778) | |
| Total Company | $ | 488,069 | | | $ | 538,031 | | | $ | (26,258) | | | $ | (5,781) | |
(1) Corporate and Other is not an operating segment, but reflects expenses not directly attributable to and, accordingly, not allocated to our reportable segments. These expenses relate to corporate functions such as human resources, finance, and legal and include expenses such as salaries, benefits, and other related costs. Similar to the Company's operating segments, Corporate results are reported to and reviewed by the Company’s CODM on the basis of Adjusted EBITDA.
The following table provides a reconciliation of the Company’s reported net loss to the total of our reportable segment Adjusted EBITDA and Corporate and Other Adjusted EBITDA for the years ended December 31, 2023 and 2022:
| | | | | | | | | | | | | | | |
| | Year Ended December 31, | |
| (in thousands) | | 2023 | | 2022 | |
| Net loss attributable to 3D Systems Corporation | | $ | (362,688) | | | $ | (122,711) | | |
Interest income, net | | (16,210) | | | (6,541) | | |
(Benefit) provision for income taxes | | (641) | | | 2,140 | | |
| Depreciation expense | | 21,346 | | | 21,096 | | |
| Amortization expense | | 12,067 | | | 15,480 | | |
| Stock-based compensation expense | | 23,504 | | 42,489 | |
| Acquisition and divestiture-related expense | | (1,070) | | | 12,360 | |
| Legal expenses | | 8,053 | | 19,062 | |
| Restructuring expense | | 11,487 | | | 733 | | |
Net loss attributable to redeemable non-controlling interest | | (265) | | | (238) | | |
Loss on equity method investment, net of income taxes | | 1,282 | | — | | |
Goodwill and other assets impairment charges | | 304,359 | | 18 | |
Gain on repurchase of debt | | (32,181) | | | — | | |
Other non-operating expense | | 4,699 | | | 10,331 | |
| Adjusted EBITDA | | $ | (26,258) | | | $ | (5,781) | | |
The following table summarizes long-lived assets by geographic region as of December 31, 2023 and 2022:
| | | | | | | | | | | | | | | | | |
| | | December 31, |
| (in thousands) | | 2023 | | 2022 |
United States | | | $ | 94,734 | | | $ | 66,424 | |
Belgium | | 21,524 | | | 18,768 | |
Other foreign entities | | 18,783 | | | 15,626 | |
| Total | | $ | 135,041 | | | $ | 100,818 | |
3D SYSTEMS CORPORATION
NOTES TO THE CONSOLIDATED FINANCIAL STATEMENTS
(23) Commitments and Contingencies
We lease certain of our facilities and equipment under non-cancelable operating and finance leases. See Note 11.
The Company has certain purchase commitments under agreements with remaining terms in excess of one year, primarily related to printer assemblies, inventory, capital expenditures, and software licenses. As of December 31, 2023, such purchase commitments totaled $14,682, with approximately $8,023 of the purchase obligations expected to come due within the next twelve months.
Indemnification
In the normal course of business, we periodically enter into agreements to indemnify customers or suppliers against claims of intellectual property infringement made by third parties arising from the use of our products. Historically, costs related to these indemnification provisions have not been significant, and we are unable to estimate the maximum potential impact of these indemnification provisions on our future results of operations.
To the extent permitted under Delaware law, we indemnify our directors and officers for certain events or occurrences while the director or officer is, or was, serving at our request in such capacity, subject to limited exceptions. The maximum potential amount of future payments we could be required to make under these indemnification obligations is unlimited; however, we have directors and officers insurance coverage that may enable us to recover future amounts paid, subject to a deductible and the policy limits. There is no assurance that the policy limits will be sufficient to cover all damages, if any.
Other Commitments
Government Settlement
As previously disclosed, beginning in October 2017, the Company undertook an internal investigation relating to possible violations of U.S. export control laws, including the International Traffic in Arms Regulations administered by the Directorate of Defense Trade Controls of the Department of State (“DDTC”) and the Export Administration Regulations administered by the Bureau of Industry and Security of the Department of Commerce (“BIS”). In February 2023, the Company settled these matters with the U.S. Department of Justice (“DOJ”), DDTC and BIS. As a part of these settlement agreements, the Company agreed to pay $15,048 in civil monetary penalties to these agencies, with an additional $10,000 suspended penalty amount to be allocated to remedial compliance measures required by DDTC. The penalty amounts subject to payment were broken down as follows: DDTC, $10,000 (payable in three installments over a three-year period); BIS, $2,778; and DOJ, $2,270.
We initially accrued liabilities related to the foregoing matters during the year ended December 31, 2022, which included recording the $10,000 DDTC civil monetary penalty at a discount using the risk-free interest rate in effect at the time of recognition, due to the multiple annual periods over which the $10,000 would be paid. During the year ended December 31, 2023, we paid $8,548 of the liability that had been accrued in accordance with the government settlement agreements. The $10,000 suspended penalty has not been recognized as a liability as of December 31, 2023 and will be recognized as incurred for remedial compliance measures during the three-year term of the settlement agreement. The application of the Company’s spend on remedial compliance measures as a reduction to the original $10,000 suspended penalty must be approved by DDTC, which approval will be sought on an annual basis in accordance with the terms of the settlement agreement. Any portion not expended for compliance measures at the end of the three-year term of the settlement agreement will be paid by the Company to DDTC. As of December 31, 2023, the Company has spent $2,294 related to remedial compliance measures, which DDTC has approved for credit against the $10,000 suspended penalty in accordance with the terms of the related settlement agreement.
Subsequent to December 31, 2023, the Company paid $3,500 to DDTC in satisfaction of the second installment of its $10,000 settlement penalty. Refer to Note 26 for additional details
3D SYSTEMS CORPORATION
NOTES TO THE CONSOLIDATED FINANCIAL STATEMENTS
Letter of Credit
On June 2, 2023, we issued $1,161 of guarantees in the form of a standby letter of credit as security for a long-term real estate lease. The letter of credit had an initial maturity date of June 2024 and includes automatic one-year extensions, which are not to continue beyond July 1, 2033. The first automatic one-year extension occurred in June 2024, and the letter of credit now has a current maturity date of June 2025. We have not recorded any liability for this guarantee, as we believe the likelihood of having to perform under the letter of credit is remote. In connection with this transaction, we pledged an equal amount of cash to the issuing bank of this letter of credit. The cash pledged is recorded as restricted cash and included in other assets on our consolidated balance sheets.
Litigation
Securities Class Action
The Company and certain of its current and former executive officers have been named as defendants in a consolidated putative stockholder class action lawsuit pending in the United States District Court for the Eastern District of New York. The action is styled In re 3D Systems Securities Litigation, No. 1:21-cv-01920-NGG-TAM (E.D.N.Y.) (the “Securities Class Action”). On July 13, 2021, the Court appointed a Lead Plaintiff for the putative class and approved his choice of Lead Counsel. Lead Plaintiff filed his Consolidated Amended Complaint (the “Amended Complaint”) on September 13, 2021, alleging that defendants violated the Securities Exchange Act of 1934, as amended (the “Exchange Act”), and SEC Rule 10b-5 promulgated thereunder by making false and misleading statements and omissions, and that the current and former executive officers named as defendants are control persons under Section 20(a) of the Exchange Act. The Amended Complaint was filed on behalf of stockholders who purchased shares of the Company’s common stock between May 6, 2020 and March 5, 2021, and seeks monetary damages on behalf of the purported class. The defendants moved to dismiss the Amended Complaint on February 15, 2022, and the motion was fully briefed in May 2022. On October 28, 2022, the parties notified the District Court that they reached an agreement in principle resolving this action and, on December 19, 2022, Lead Plaintiff filed a motion seeking entry of an order preliminarily approving the settlement and establishing notice procedures. The District Court held a final fairness hearing on November 21, 2023 and subsequently entered the Order and Final Judgement approving the Securities Class Action settlement and dismissing the Securities Class Action claims with prejudice on January 4, 2024. The time for any party to appeal expired on February 5, 2024, and no appeals were filed. The matter is now concluded. In connection with the resolution of the Securities Class Action, we reached a settlement of $4,000, of which $749 was paid by the Company during the twelve months ended December 31, 2023 and the remaining $3,251 was paid by insurance during the twelve months ended December 31, 2023.
3D SYSTEMS CORPORATION
NOTES TO THE CONSOLIDATED FINANCIAL STATEMENTS
Derivative Actions
The Company has been named as a nominal defendant and certain of its current and former executive officers and directors have been named as defendants in derivative lawsuits pending in the United States District Court for the Eastern District of New York and the South Carolina Court of Common Pleas for the 16th Circuit, York County, and the Supreme Court of the State of New York, Kings County. The actions are styled Nguyen v. Joshi, et al., No. 21-cv-03389-NGG-TAM (E.D.N.Y.) (the “Nguyen Action”), Lesar v. Graves, et al., No. 2021CP4602308 (S.C., Ct. of Common Pleas for the 16th Judicial Cir., Cty. of York) (the “Lesar Action”), Scanlon v. Graves, et al., No. 2021CP4602312 (S.C., Ct. of Common Pleas for the 16th Judicial Cir., Cty. of York) (the “Scanlon Action”), Bohus v. Joshi, et al., No. 22-cv-2203-CBA-RML (E.D.N.Y.) (the “Bohus Action”), and Fernicola v. Clinton, et. al., No. 512613/2022 (N.Y., Kings County Supreme Court) (the “Fernicola Action”) (together, the "Derivative Actions"). The Complaints in the Nguyen and Bohus Actions, which were filed on June 15, 2021 and April 18, 2022, respectively, assert breach of fiduciary duty claims against all defendants and claims for contribution under the federal securities laws against certain of the defendants. The Complaints in the Lesar and Scanlon Actions, which were filed on July 26, 2021, assert breach of fiduciary duty and unjust enrichment claims against the defendants. The Complaint in the Fernicola Action was filed on May 2, 2022, and asserts claims for breach of fiduciary duty and waste of corporate assets against the director defendants. On August 27, 2021, the Nguyen Action was stayed until 30 days after the earlier of: (i) the close of discovery in the Securities Class Action, or (ii) the deadline for appealing a dismissal of the Securities Class Action with prejudice. On October 26, 2021, the Lesar Action and the Scanlon Action were consolidated into a single stockholder derivative action, styled as In Re 3D Systems Corp. Shareholder Derivative Litigation, No. 2021CP4602308 (S.C., Ct. of Common Pleas for the 16th Judicial Cir., Cty. Of York) (the “South Carolina Derivative Action”). On March 3, 2022, the South Carolina Derivative Action was stayed until 30 days after the earlier of: (i) the close of discovery in the Securities Class Action, or (ii) the deadline for appealing a dismissal of the Securities Class Action with prejudice. On June 16, 2022, the Bohus Action was consolidated with the Nguyen Action (the “E.D.N.Y. Derivative Action”). The E.D.N.Y. Derivative Action was stayed until 30 days after the earlier of: (i) the close of discovery in the Securities Class Action, or (ii) the deadline for appealing a dismissal of the Securities Class Action with prejudice. On August 15, 2022, the Fernicola Action was voluntarily dismissed without prejudice. The deadline for appealing the dismissal of the Securities Class Action expired on February 5, 2024 and no appeals were filed. Accordingly, the discovery stays in the South Carolina and E.D.N.Y. Derivative Actions lifted on March 6, 2024. On February 13, 2024, the parties to the Derivative Actions reached an agreement in principle resolving the actions. On April 30, 2024, the parties executed a Stipulation of Settlement. The settlement is subject to both preliminary and final approval by the Court of Common Pleas for the 16th Judicial Circuit, State of South Carolina, County of York ( the "South Carolina Court"). On May 14, 2024, Lead Plaintiffs' Counsel filed a motion seeking entry of an order preliminarily approving the settlement and establishing notice procedures. The South Carolina Court granted preliminary approval during a hearing held on July 11, 2024. The settlement remains subject to final approval by the Court. The final approval hearing is scheduled to occur in the South Carolina Court on October 21, 2024. The only monetary component of the Stipulation of Settlement is a $1,950 fee and expense award to counsel for plaintiffs in the Derivative Actions, all of which will be paid by insurance following final approval of the settlement by the Court.
Termination of Volumetric Milestones Related to Potential Earnout Payments
Subsequent to December 31, 2023, as result of the Company terminating former Volumetric Shareholders' eligibility to earn certain milestone-based payments that had been outlined in the Volumetric acquisition agreement, the former owners of Volumetric notified the Company that they were initiating dispute resolution under the provisions of the Volumetric acquisition agreement in an effort to recover 100% of the milestone-based payments that they previously had been eligible to earn. Refer to Note 26 for additional details regarding the events that have resulted in the termination of the former Volumetric Shareholders' eligibility to earn milestone-based payments outlined in the Volumetric acquisition agreement and the status of the resulting dispute resolution and other actions that have been initiated.
SEC Investigation
On April 15, 2022, the Company was informed that the SEC is conducting a formal investigation of the Company related to, among other things, the allegations in the Securities Class Action. The Company has subsequently received subpoenas from the SEC for the production of documents and information related to its investigation as a follow on to a previous voluntary request for documents. The Company is cooperating with the SEC in connection with its formal investigation.
3D SYSTEMS CORPORATION
NOTES TO THE CONSOLIDATED FINANCIAL STATEMENTS
Other
In May 2024, the Company became aware of a litigation matter involving claims against a Brazilian subsidiary of the Company made by a former contractor for breach of contract relating to allegedly unpaid commissions and compensation owed as a result of the termination of the contractor. The amount at issue in this matter is approximately $800. The Company believes that the claims are without merit and continues to defend itself vigorously.
We are involved in various other legal matters incidental to our business. Although we cannot predict the results of the litigation with certainty, we believe that the disposition of all of these various other legal matters will not have a material adverse effect, individually or in the aggregate, on our consolidated results of operations, consolidated cash flows or consolidated financial position.
Refer to Note 12 for details regarding our remaining short-term and long-term liabilities recorded for all legal contingencies and settlements as of December 31, 2023.
(24) Fair Value Measurements
Fair value is the exchange price to sell an asset or transfer a liability (an exit price) in an orderly transaction between market participants at the measurement date. Fair value measurements use market data or assumptions market participants would use in pricing the asset or liability, including assumptions about risk and the risks inherent in the inputs to the valuation technique. These inputs may be readily observable, corroborated by market data, or generally unobservable. Valuation techniques maximize the use of observable inputs and minimize use of unobservable inputs. The accounting guidance for fair value measurements and disclosures establishes a three-level fair value hierarchy:
•Level 1 - Inputs are based on quoted prices in active markets for identical assets and liabilities.
•Level 2 - Inputs are based on observable inputs other than quoted prices in active markets for identical or similar assets and liabilities.
•Level 3 - One or more inputs are unobservable and significant.
Financial and nonfinancial assets and liabilities are classified in their entirety based on the lowest level of input that is significant to the fair value measurement.
Cash equivalents and short-term investments are valued utilizing the market approach to measure fair value for financial assets and liabilities. The market approach uses prices and other relevant information generated by market transactions involving identical or comparable assets or liabilities. The carrying amounts of our cash and cash equivalents, accounts receivable, accounts payable, and accrued liabilities approximate fair value as of December 31, 2023 and 2022 because of the relatively short duration of these instruments.
3D SYSTEMS CORPORATION
NOTES TO THE CONSOLIDATED FINANCIAL STATEMENTS
Assets measured at fair value on a recurring basis as of December 31, 2023 include money market funds with a fair value of $255,984, which are included in cash and cash equivalents on the consolidated balance sheet, and for which Level 1 inputs are used to measure at fair value. As of December 31, 2023, the Company did not have any short-term investments measured at fair value.
Assets measured at fair value on a recurring basis as of December 31, 2022 are summarized below.
| | | | | | | | | | | | | | | | | | | | | | | | | | | | | | | | | | | | | |
| Fair Value Measurement as of December 31, 2022 |
| Fair Value Measurement | | Balance Sheet Classification |
| (in thousands) | Fair Value Level | | Cost Basis | | Unrealized Gains (Losses) | | Fair Value | | Cash and Cash Equivalents | | Short-term Investments and Marketable Securities | | |
| Money market funds | Level 1 | | $ | 232,018 | | | $ | — | | | $ | 232,018 | | | $ | 232,018 | | | $ | — | | | |
| Certificates of deposit | Level 2 | | 990 | | | 6 | | | 996 | | | — | | | 996 | | | |
| Commercial paper | Level 2 | | 1,281 | | | 6 | | | 1,287 | | | — | | | 1,287 | | | |
| Short-term bond mutual funds | Level 2 | | 100,242 | | | (99) | | | 100,143 | | | — | | | 100,143 | | | |
Corporate bonds(a) | Level 2 | | 78,418 | | | (241) | | | 78,177 | | | — | | | 78,177 | | | |
| | | | | | | | | | | | | |
| Total | | | $ | 412,949 | | | $ | (328) | | | $ | 412,621 | | | $ | 232,018 | | | $ | 180,603 | | | |
(a) Includes $745 and $743 of cost basis and fair market value, respectively, with a weighted average maturity of 1.3 years.
We did not have any transfers of assets and liabilities between Level 1, Level 2 and Level 3 of the fair value measurement hierarchy during the years ended December 31, 2023 and 2022.
(25) Restructuring and Exit Activity Costs
Restructuring Plan Objectives and Phases
In February 2023, the Company announced the first phase of its multi-faceted restructuring initiative to improve operating efficiencies throughout the organization and drive long-term value creation. The objective of this first phase was to improve manufacturing efficiencies related to our European metal printer operations. Actions taken under this initiative include the in-sourcing of certain metal printer platforms into the Company’s Riom, France manufacturing facility, co-locating the manufacturing and engineering of the in-sourced metal printer products in order to improve cycle time from development to production.
In May 2023, the Company announced the next phase of its multi-faceted restructuring initiative, which primarily consisted of a reduction in headcount representing approximately 6% of the Company's workforce. The majority of this targeted workforce reduction related to corporate and business support functions predominately located in the U.S. and Europe.
In October 2023, the Company announced the latest phase of its multi-faceted restructuring initiative, which is primarily targeted at continuing to rationalize headcount, as well as the rationalization of geographic locations (i.e., leased facilities), in all functions across the Company and the reduction of certain third-party costs.
We currently expect the execution of our restructuring initiatives to result in the recognition of aggregate charges in the range of $8,500 to $10,000, inclusive of $8,242 which has been recognized in our consolidated statement of operations for the year ended December 31, 2023. These charges relate to employee severance and termination benefit costs that are generally recognized when probable and estimable because they are typically being determined consistent with the Company’s past practices or statutory law. In addition, we will incur additional cash expenditures related to our planned facility exits and relocation activities, which will be recognized as incurred.
We currently expect the execution of our restructuring plan, including the cash settlement of associated liabilities, to be substantially complete by December 31, 2024.
3D SYSTEMS CORPORATION
NOTES TO THE CONSOLIDATED FINANCIAL STATEMENTS
Status of Our Initiatives
Headcount
The Company has substantially completed the initial phase of headcount reductions announced in May 2023. Actions related to the incremental headcount reductions announced in October 2023 commenced in November 2023 and are expected to continue throughout 2024.
Facilities Rationalization
During the three months ended December 31, 2023, the Company (1) commenced the process of identifying leased facilities that it may exit and (2) began developing and executing plans to exit and potentially sublease such facilities. The decision-making, planning and execution of these activities will continue throughout 2024. To date, we have identified certain facilities that we have committed to exiting. However, the Company’s consolidated financial statements as of and for the year ended December 31, 2023 do not include material transactions resulting from such decisions because the Company generally had not ceased use of such facilities as of December 31, 2023. In addition, we have identified several additional facilities that we continue to evaluate for opportunities to exit.
Costs Incurred and Settled During the Period
The following table provides details regarding restructuring charges recorded during the period, the portion of such costs that were settled with cash as of December 31, 2023, and the remaining accrued liability reported in our consolidated balance sheet as of December 31, 2023:
| | | | | | | | | | | | | | | | | | | | | | | | | | | | |
| (in thousands) | | Accrued liability as of December 31, 2022 | | Costs incurred during 2023 | | | | Amounts settled with cash | | Accrued liability as of December 31, 2023 |
| Severance, termination benefits and other employee costs | | $ | — | | | $ | 8,242 | | | | | $ | 4,309 | | | $ | 3,933 | |
| | | | | | | | | | |
| | | | | | | | | | |
The severance, termination benefits and other employee costs that have been incurred during the year ended December 31, 2023 are reflected in our consolidated statement of operations as follows:
| | | | | | | | | |
| (in thousands) | | Year Ended December 31, 2023 |
Total cost of sales | | $ | 1,401 | | |
Selling, general and administrative | | 5,598 | | |
Research and development | | 1,243 | | |
Total | | $ | 8,242 | | |
In addition to the severance and termination costs reported above, the Company has recognized incremental impairment charges totaling $628 related to certain fixed assets that have been retired in connection with the Company’s restructuring activities.
Restructuring Plan Announced August 2020
On August 5, 2020, we announced a restructuring plan, which focused on a reduction of our headcount and the closing of certain facilities. During the year ended December 31, 2021, we finalized all actions related to this plan and recognized related costs totaling $1,121 within selling, general and administrative in our consolidated statement of operations for the period.
3D SYSTEMS CORPORATION
NOTES TO THE CONSOLIDATED FINANCIAL STATEMENTS
(26) Subsequent Events
Termination of Volumetric Milestones Related to Potential Earnout Payments
Following the acquisition of Volumetric in 2021, the Company could have been required to pay up to $355,000 of acquisition-related earnout payments to the former owners of Volumetric if the Company were to achieve seven non-financial, science-based milestones prior to either December 31, 2030 or December 31, 2035 (refer to Note 3 and Note 17). After losing funding for research on kidneys and livers from the Company’s key strategic partner for the related R&D efforts, on February 24, 2024 the Company notified the former owners of Volumetric that it was terminating the four milestones relating to kidney and liver research because achievement was no longer financially viable. As a result of the termination of these four milestones, the Company's maximum liability for acquisition-related earnout payments was reduced to $175,000, which would be payable if each of the three remaining non-financial, science-based milestones were achieved within the timeframes set forth in the Volumetric acquisition agreement.
On March 29, 2024, the former owners of Volumetric notified the Company that they were initiating dispute resolution under the provisions of the Volumetric acquisition agreement in an effort to recover the $355,000. The parties did not reach a resolution during the 30-day negotiation period following the notice and entered into non-binding mediation in accordance with the terms of the Volumetric acquisition agreement.
Further, on April 29, 2024, two of the former Volumetric shareholders terminated their employment with the Company. The two former shareholders claim that their terminations were for good reason, which would preserve their rights to earn milestone payments under the merger agreement. The Company vigorously denies their claim that the termination was for good reason and contends that the former shareholders of Volumetric are now no longer eligible to achieve any of the remaining three non-financial, science-based milestones or earn any of the related $175,000 of milestone payments.
On July 8, 2024, the Company proposed a settlement of $1,500 with the former shareholders and key employees of Volumetric during mediation. The proposed settlement was accrued as expense during the three months ended March 31, 2024. On July 24, 2024, the former shareholders and key employees rejected the offer and proposed a counteroffer that the Company does not intend to accept. As of August 13, 2024, the mediation process between the parties remains ongoing.
Payment of Portion of Government Settlement Penalty
During February 2024, the Company paid $3,500 to DDTC in satisfaction of the second installment of its settlement penalty totaling $10,000 related to export controls and International Traffic in Arms Regulations. Refer to Note 23 for additional details regarding this government settlement.
Repurchases of Debt
On March 8, 2024, the Company repurchased $110,492 aggregate principal amount of its outstanding Notes from certain holders for an aggregate cash repurchase price of $87,218 including transaction expenses. Refer to Note 13 for additional details regarding debt extinguishment.
Convertible Notes Compliance
The Company’s failure to file this 2023 Form 10-K and provide it to the trustee by April 1, 2024 represents a default under the terms of the Indenture. In addition, the Company's failure to file its Form 10-Q for the three months ended March 31, 2024 and provide it to the trustee by May 30, 2024 represented an incremental default under the terms of the Indenture. These defaults will not become an event of default under the terms of the Indenture if the Company files this Form 10-K and its Form 10-Q for the three months ended March 31, 2024 prior to the end of the cure period provided for by the Indenture, which cure period has not yet been initiated by the trustee or holders of the Notes. The Company has not incurred any special interest as a result of this default, nor have the Notes become subject to any other actions by the holders.
Sale of Oqton Dental
During May 2024, the Company completed the sale of the portion of the Oqton MOS business that was focused on the dental market ("Oqton Dental") in exchange for a de minimis amount of cash, resulting in the transfer of a limited portion of Oqton MOS's personnel and a de minimis amount of fixed assets.
3D SYSTEMS CORPORATION
NOTES TO THE CONSOLIDATED FINANCIAL STATEMENTS
Incremental Investment in NAMI
In May 2024, the Company made an incremental investment of $2,450 in NAMI, the Company's joint venture with Dussur. Refer to Note 10 for additional details regarding this equity method investment.