UNITED STATES
SECURITIES AND EXCHANGE COMMISSION
WASHINGTON, D.C. 20549
___________________________________________________________________________________________________________________
FORM 10-K
___________________________________________________________________________________________________________________
þ | ANNUAL REPORT PURSUANT TO SECTION 13 OR 15(d) OF THE SECURITIES EXCHANGE ACT OF 1934 FOR THE FISCAL YEAR ENDED DECEMBER 31, 2017 |
OR
o | TRANSITION REPORT PURSUANT TO SECTION 13 OR 15(d) OF THE SECURITIES EXCHANGE ACT OF 1934 FOR THE TRANSITION PERIOD FROM __________ TO ________ |
COMMISSION FILE NUMBER 001-34295
___________________________________________________________________________________________________________________
SIRIUS XM HOLDINGS INC.
(Exact name of registrant as specified in its charter)
___________________________________________________________________________________________________________________
Delaware | 38-3916511 | |
(State or other jurisdiction of incorporation or organization) | (I.R.S. Employer Identification Number) | |
1290 Avenue of the Americas, 11th Floor | ||
New York, New York | 10104 | |
(Address of principal executive offices) | (Zip Code) | |
Registrant’s telephone number, including area code: (212) 584-5100
___________________________________________________________________________________________________________________
Securities registered pursuant to Section 12(b) of the Act:
Title of Each Class: | Name of Each Exchange on Which Registered: | |
Common Stock, par value $0.001 per share | The Nasdaq Global Select Market | |
Securities registered pursuant to Section 12(g) of the Act:
None
(Title of class)
___________________________________________________________________________________________________________________
Indicate by check mark if the registrant is a well-known seasoned issuer, as defined in Rule 405 of the Securities Act. Yes þ No o
Indicate by check mark if the registrant is not required to file reports pursuant to Section 13 or 15(d) of the Act. Yes o No þ
Indicate by check mark whether the registrant (1) has filed all reports required to be filed by Section 13 or 15(d) of the Securities Exchange Act of 1934 during the preceding 12 months (or for such shorter period that the registrant was required to file such reports) and (2) has been subject to such filing requirements for the past 90 days. Yes þ No o
Indicate by check mark whether the registrant has submitted electronically and posted on its corporate Web site, if any, every Interactive Data File required to be submitted and posted pursuant to Rule 405 of Regulation S-T during the preceding 12 months (or for such shorter period that the registrant was required to submit and post such files). Yes þ No o
Indicate by check mark if disclosure of delinquent filers pursuant to Item 405 of Regulation S-K is not contained herein, and will not be contained, to the best of the registrant's knowledge, in definitive proxy or information statements incorporated by reference in Part III of this Form 10-K or any amendment to this Form 10-K. þ
Indicate by check mark whether the registrant is a large accelerated filer, an accelerated filer, a non-accelerated filer, or a smaller reporting company. See the definitions of “large accelerated filer,” “accelerated filer,” “smaller reporting company” and “emerging growth company” in Rule 12b-2 of the Exchange Act.
Large accelerated filer þ | Accelerated filer o | Non-accelerated filer o | ||
(Do not check if a smaller reporting company) | ||||
Smaller reporting company o | Emerging growth company o | |||
If an emerging growth company, indicate by check mark if the registrant has elected not to use the extended transition period for complying with any new or revised financial accounting standards provided pursuant to Section 13(a) of the Exchange Act. o
Indicate by check mark whether the registrant is a shell company (as defined in Rule 12b-2 of the Act). Yes o No þ
The aggregate market value of the registrant’s common stock held by non-affiliates as of June 30, 2017 was $7,957,495,699. All executive officers and directors of the registrant have been deemed, solely for the purpose of the foregoing calculation, to be “affiliates” of the registrant.
The number of shares of the registrant’s common stock outstanding as of January 29, 2018 was 4,491,863,747.
DOCUMENTS INCORPORATED BY REFERENCE
Information included in our definitive proxy statement for our 2018 annual meeting of stockholders scheduled to be held on Tuesday, June 5, 2018 is incorporated by reference in Items 10, 11, 12, 13 and 14 of Part III of this report.
SIRIUS XM HOLDINGS INC. AND SUBSIDIARIES
2017 FORM 10-K ANNUAL REPORT
TABLE OF CONTENTS
Item No. | Description | ||
PART I
ITEM 1. | BUSINESS |
This Annual Report on Form 10-K presents information for Sirius XM Holdings Inc. (“Holdings”). The terms “Holdings,” “we,” “us,” “our,” and “our company” as used herein and unless otherwise stated or indicated by context, refer to Sirius XM Holdings Inc. and its subsidiaries, and “Sirius XM” refers to our wholly-owned subsidiary Sirius XM Radio Inc. Holdings has no operations independent of its wholly-owned subsidiary, Sirius XM.
Sirius XM Holdings Inc.
Sirius XM is a wholly-owned subsidiary of Holdings. Holdings was incorporated in the State of Delaware on May 21, 2013. Holdings has no operations independent of its subsidiary Sirius XM.
Relationship with Liberty Media
As of December 31, 2017, Liberty Media Corporation (“Liberty Media”) beneficially owned, directly and indirectly, approximately 70% of the outstanding shares of Holdings’ common stock. Liberty Media owns interests in a range of media, communications and entertainment businesses.
Sirius XM Radio Inc.
We transmit music, sports, entertainment, comedy, talk, news, traffic and weather channels, as well as infotainment services, in the United States on a subscription fee basis through our two proprietary satellite radio systems. Subscribers can also receive music and other channels, plus certain other features such as SiriusXM On Demand, over our Internet radio service, including through applications for mobile devices, home devices and other consumer electronic equipment. We also provide connected vehicle services. Our connected vehicle services are designed to enhance the safety, security and driving experience for vehicle operators while providing marketing and operational benefits to automakers and their dealers.
As of December 31, 2017, we had approximately 32.7 million subscribers. Our subscribers include:
• | subscribers under our regular and discounted pricing plans; |
• | subscribers that have prepaid, including payments made or due from automakers for subscriptions included in the sale or lease price of a vehicle; |
• | subscribers to our Internet services who do not also have satellite radio subscriptions; and |
• | certain subscribers to our weather, traffic and data services who do not also have satellite radio subscriptions. |
Our primary source of revenue is subscription fees, with most of our customers subscribing to annual, semi-annual, quarterly or monthly plans. We offer discounts for prepaid longer term subscription plans, as well as a multiple subscription discount. We also derive revenue from activation and other fees, the sale of advertising on select non-music channels, the direct sale of satellite radios and accessories, and other ancillary services, such as our weather, traffic and data services. We provide traffic services to approximately 7.5 million vehicles.
Our satellite radios are primarily distributed through automakers; retailers; and our website. We have agreements with every major automaker to offer satellite radios in their vehicles, through which we acquire the majority of our subscribers. We also acquire subscribers through marketing to owners and lessees of previously-owned vehicles that include factory-installed satellite radios that are not currently subscribing to our services. Satellite radio services are also offered to customers of certain rental car companies.
Acquisition and Investment Transactions in 2017
During the year ended December 31, 2017, we entered into several strategic transactions.
Acquisition of Automatic Labs. On April 18, 2017, Sirius XM acquired Automatic Labs Inc. (“Automatic”), a connected vehicle device and mobile application company, for an aggregate purchase price of $107.7 million, net of cash and restricted cash acquired.
2
Recapitalization of Sirius XM Canada. On May 25, 2017, Sirius XM completed a recapitalization of Sirius XM Canada Holdings Inc. (“Sirius XM Canada”), which is now a privately held corporation. Sirius XM now holds a 70% equity interest and 33% voting interest in Sirius XM Canada, with the remainder of the voting power and equity interests held by two of Sirius XM Canada’s previous shareholders. See “-About Sirius XM Canada” for more information about this recapitalization.
Investment in Pandora Media, Inc. On September 22, 2017, Sirius XM completed a $480 million investment in Pandora Media, Inc. (“Pandora”). Pandora operates an internet-based music discovery platform, offering a personalized experience for listeners. See “-About our Pandora Investment” for more information about this investment.
Programming
We offer a dynamic programming lineup of commercial-free music plus sports, entertainment, comedy, talk, and news, including:
• | an extensive selection of music genres, ranging from rock, pop and hip-hop to country, dance, jazz, Latin and classical; |
• | live play-by-play sports from major leagues and colleges; |
• | a multitude of talk and entertainment channels for a variety of audiences; |
• | a wide range of national, international and financial news; and |
• | exclusive limited run channels. |
Our diverse spectrum of programming, including our lineup of exclusive material, is a significant differentiator from terrestrial radio and other audio entertainment providers. We make changes to our programming lineup from time to time as we strive to attract new subscribers and offer content which appeals to a broad range of audiences and to our existing subscribers. The channel lineups for our services are available at siriusxm.com.
Internet Radio Service
We stream select music and non-music channels over the Internet. Our Internet radio service includes certain channels that are not available on our satellite radio service. Access to our Internet radio service is offered to subscribers for a fee. We also offer applications to allow consumers to access our Internet radio service on smartphones, tablets, computers, home devices and other consumer electronic equipment.
SiriusXM Internet Radio offers listeners enhanced programming discovery and the ability to connect with content currently playing across our commercial-free music, sports, comedy, news, talk and entertainment channels or available through SiriusXM On Demand. SiriusXM On Demand offers our Internet radio subscribers the ability to choose their favorite episodes from a catalog of content whenever they want.
We are developing significant enhancements to our Internet radio service. These enhancements will include a substantial redesign of our mobile app and are expected to be introduced in 2018. The redesign of our Internet radio service will include, among other things, additional functionality, video streaming, content discovery and other features designed to increase consumer engagement with our Internet radio product.
360L
In 2018, we are introducing a user interface, which we call “360L,” that combines our satellite and Internet services into a single, cohesive in-vehicle entertainment experience. 360L will allow us to take advantage of advanced in-dash infotainment systems. 360L is intended to leverage the ubiquitous signal coverage of our satellite infrastructure and low delivery costs with the two-way communication capability of a wireless Internet service to provide consumers seamless access to our content, including our live channels, on demand service and even more personalized music services. The wireless Internet connection included in 360L will enable enhanced search and recommendations functions, making discovery of our content in the vehicle easier than ever. 360L will also allow consumers to manage aspects of their subscriptions directly through their vehicles’ equipment and is expected to eventually provide us important data to better enable us to understand how our subscribers use our service and how we can more effectively market our service to consumers.
.
3
Distribution of Radios
Automakers
We distribute satellite radios through the sale and lease of new vehicles. We have agreements with every major automaker to offer satellite radios in their vehicles. Satellite radios are available as a factory or dealer-installed option in substantially all vehicle makes sold in the United States.
Most automakers include a subscription to our radio service in the sale or lease of their new vehicles. In certain cases, we receive subscription payments from automakers in advance of the activation of our service. We share with certain automakers a portion of the revenues we derive from subscribers using vehicles equipped to receive our service. We also reimburse various automakers for certain costs associated with the satellite radios installed in new vehicles, including in certain cases hardware costs, engineering expenses and promotional and advertising expenses.
Previously Owned Vehicles
We acquire subscribers through the sale and lease of previously owned vehicles with factory-installed satellite radios. We have entered into agreements with many automakers to market subscriptions to purchasers and lessees of vehicles which include satellite radios sold through their certified pre-owned programs. We also work directly with franchise and independent dealers on programs for non-certified vehicles.
We have developed systems and methods to identify purchasers and lessees of previously owned vehicles which include satellite radios and have established marketing plans to promote our services to these potential subscribers.
Retail
We sell satellite radios directly to consumers through our website. Satellite radios are also marketed and distributed through national, regional and internet retailers, such as amazon.com.
Our Satellite Radio Systems
Our satellite radio systems are designed to provide clear reception in most areas of the continental United States despite variations in terrain, buildings and other obstructions. We continually monitor our infrastructure and regularly evaluate improvements in technology.
Our satellite radio systems have three principal components:
• | satellites, terrestrial repeaters and other satellite facilities; |
• | studios; and |
• | radios. |
Satellites, Terrestrial Repeaters and Other Satellite Facilities
Satellites. We provide our service through a fleet of five orbiting geostationary satellites, two in the Sirius system, FM-5 and FM-6, and three in the XM system, XM-3, XM-4 and XM-5. Our XM-5 satellite serves as a spare for both the XM and Sirius systems.
We have entered into agreements for the design, construction and launch of two new satellites, SXM-7 and SXM-8, which we plan to launch into geostationary orbits in 2019 and 2020, respectively, as replacements for XM-3 and XM-4.
Satellite Insurance. We have procured insurance for SXM-7 and SXM-8 to cover the risks associated with each satellite's launch and first year in orbit. We do not have insurance policies covering our in-orbit satellites, as we consider the premium costs to be uneconomical relative to the risk of satellite failure.
Terrestrial Repeaters. In some areas with high concentrations of tall buildings, such as urban centers, signals from our satellites may be blocked and reception of satellite signals can be adversely affected. In other areas with a high density of next generation wireless systems our service may experience interference. In many of these areas, we have deployed terrestrial repeaters to supplement and enhance our signal coverage and, in many other areas, we are planning to deploy additional repeaters to reduce interference. We operate over 1,000 terrestrial repeaters across the United States as part of our systems.
4
Other Satellite Facilities. We control and communicate with our satellites from facilities in North America. Our satellites are monitored, tracked and controlled by a third party satellite operator.
Studios
Our programming originates from studios in New York City and Washington D.C. and, to a lesser extent, from smaller studios in Los Angeles, Nashville and a variety of venues across the country. Our corporate headquarters is based in New York City. Both our New York City and Washington D.C. offices house facilities for programming origination, transmission and personnel.
Radios
We do not manufacture radios. We have authorized manufacturers and distributors to produce and distribute radios, and have licensed our technology to various electronics manufacturers to develop, manufacture and distribute radios under certain brands. We do manage various aspects of the production of satellite radios. To facilitate the sale of radios, we may subsidize a portion of the radio manufacturing costs to reduce the hardware price to consumers.
Connected Vehicle Services
We provide connected vehicle services. Our connected vehicle services are designed to enhance the safety, security and driving experience for vehicle operators while providing marketing and operational benefits to automakers and their dealers. We offer a portfolio of location-based services through two-way wireless connectivity, including safety, security, convenience, maintenance and data services, remote vehicles diagnostics, and stolen or parked vehicle locator services. Our connected vehicle business provides services to several automakers and directly to consumers through aftermarket devices.
Subscribers to our connected vehicle services are not included in our subscriber count or subscriber-based operating metrics.
Other Services
Commercial Accounts. Our programming is available for commercial establishments. Commercial subscription accounts are available through providers of in-store entertainment solutions and directly from us. Commercial subscribers are included in our subscriber count.
Satellite Television Service. Certain of our music channels are offered as part of select programming packages on the DISH Network satellite television service. Subscribers to the DISH Network satellite television service are not included in our subscriber count.
Subscribers to the following services are not included in our subscriber count, unless the applicable service is purchased by the subscriber separately and not as part of a radio subscription to our services:
Travel Link. We offer Travel Link, a suite of data services that includes graphical weather, fuel prices, sports schedules and scores and movie listings.
Real-Time Traffic Services. We offer services that provide graphic information as to road closings, traffic flow and incident data to consumers with compatible in-vehicle navigation systems.
Real-Time Weather Services. We offer several real-time weather services designed for improving situational awareness in vehicles, boats and planes.
About Sirius XM Canada
In 2017, Sirius XM completed a recapitalization of Sirius XM Canada (the “Sirius Canada Transaction”) which is now a privately held corporation. Sirius XM holds a 70% equity interest and 33% voting interest in Sirius XM Canada, with the remainder of the voting and equity interests held by two of Sirius XM Canada’s previous shareholders.
The total consideration from Sirius XM to Sirius XM Canada, excluding transaction costs, was $308.5 million, which included $129.7 million in cash and we issued 35 million shares of our common stock with an aggregate value of $178.9
5
million to the holders of the shares of Sirius XM Canada acquired in the Sirius Canada Transaction. Sirius XM received common stock, non-voting common stock and preferred stock of Sirius XM Canada.
In connection with the Sirius Canada Transaction, Sirius XM also made a contribution in the form of a loan to Sirius XM Canada in the aggregate amount of $130.8 million. The loan is denominated in Canadian dollars, has a term of fifteen years, bears interest at a rate of 7.62% per annum and includes customary covenants and events of default, including an event of default relating to Sirius XM Canada’s failure to maintain specified leverage ratios. The terms of the loan require Sirius XM Canada to prepay a portion of the outstanding principal amount of the loan within sixty days of the end of each fiscal year in an amount equal to any cash on hand in excess of C$10,000 at the last day of the financial year if all target dividends have been paid in full.
In connection with the Sirius Canada Transaction, Sirius XM also entered into a Services Agreement and an Advisory Services Agreement with Sirius XM Canada. Each agreement has a thirty year term. Pursuant to the Services Agreement, Sirius XM Canada will pay Sirius XM 25% of its gross revenues on a monthly basis through December 31, 2021 and 30% of its gross revenues on a monthly basis thereafter. Pursuant to the Advisory Services Agreement, Sirius XM Canada will pay Sirius XM 5% of its gross revenues on a monthly basis. These agreements superseded and replaced the former agreements between Sirius XM Canada and its predecessors and Sirius XM.
As of December 31, 2017, Sirius XM Canada had approximately 2.8 million subscribers. Sirius XM Canada's subscribers are not included in our subscriber count or subscriber-based operating metrics.
About our Pandora Investment
Pursuant to an Investment Agreement with Pandora, in 2017, Sirius XM purchased 480,000 shares of Pandora’s Series A Convertible Preferred Stock, par value $0.0001 per share (the “Series A Preferred Stock”), for an aggregate purchase price of $480 million. The Series A Preferred Stock, including accrued but unpaid dividends, represents a stake of approximately 19% of Pandora's currently outstanding common stock, and approximately a 16% interest on an as-converted basis.
The Series A Preferred Stock is convertible at the option of the holders at any time into shares of common stock of Pandora (“Pandora Common Stock”) at an initial conversion price of $10.50 per share of Pandora Common Stock and an initial conversion rate of 95.2381 shares of Pandora Common Stock per share of Series A Preferred Stock, subject to certain customary anti-dilution adjustments. Holders of the Series A Preferred Stock are entitled to a cumulative dividend at the rate of 6.0% per annum, payable quarterly in arrears, if and when declared. Any conversion of Series A Preferred Stock may be settled by Pandora, at its option, in shares of Pandora Common Stock, cash or any combination thereof. However, unless and until Pandora’s stockholders have approved the issuance of greater than 19.99% of the outstanding Pandora Common Stock, the Series A Preferred Stock may not be converted into more than 19.99% of Pandora’s outstanding Pandora Common Stock as of June 9, 2017.
The investment includes a mandatory redemption feature on any date from and after September 22, 2022 whereby Sirius XM, at its option, may require Pandora to purchase the Series A Preferred Stock at a price equal to 100% of the liquidation preference plus accrued but unpaid dividends for, at the election of Pandora, cash, shares of Pandora Common Stock or a combination thereof.
We have appointed James E. Meyer, our Chief Executive Officer, David J. Frear, our Senior Executive Vice President and Chief Financial Officer, and Gregory B. Maffei, the Chairman of our Board of Directors, to Pandora's Board of Directors pursuant to our designation rights under the Investment Agreement. Mr. Maffei also serves as the Chairman of Pandora's Board of Directors.
Our right to designate directors will fall away once we and our affiliates fail to beneficially own shares of Series A Preferred Stock and/or Pandora Common Stock issued upon conversion thereof equal to (on an as-converted basis) at least 50% of the number of shares of Pandora Common Stock issuable upon conversion of the Series A Preferred Stock purchased under the Investment Agreement. Following the earlier to occur of (i) September 22, 2019 and (ii) the date on which we and our affiliates fail to beneficially own shares of Series A Preferred Stock and/or Pandora Common Stock that were issued upon conversion thereof equal to (on an as-converted basis) at least 75% of the number of shares of Pandora Common Stock issuable upon conversion of the Series A Preferred Stock purchased under the Investment Agreement, we have the right to designate only two directors.
We are subject to certain standstill restrictions, including, among other things, that we are restricted from acquiring additional securities of Pandora until December 9, 2018.
6
Except as to matters that may be voted upon separately by holders of the Series A Preferred Stock, we are entitled to vote as a single class with the holders of Pandora Common Stock on an as-converted basis (up to a maximum of 19.99% of the Pandora Common Stock outstanding on June 9, 2017, unless stockholder approval has been received). We are also entitled to a separate class vote with respect to certain amendments to Pandora’s organizational documents, issuances by Pandora of securities that are senior to, or equal in priority with, the Series A Preferred Stock and the incurrence of certain indebtedness by Pandora.
Upon certain change of control events involving Pandora, Pandora is required to repurchase all of the Series A Preferred Stock at a price equal to the greater of (1) an amount in cash equal to 100% of the liquidation preference thereof plus all accrued but unpaid dividends through June 9, 2022 (assuming such shares of Series A Preferred Stock remain outstanding through such date) and (2) the consideration the holders would have received if they had converted their shares of Series A Preferred Stock into Pandora Common Stock immediately prior to the change of control event (disregarding the 19.99% cap).
Beginning on September 22, 2020, if the volume weighted average price per share of Pandora Common Stock exceeds $18.375, as may be adjusted, for at least 20 trading days in any period of 30 consecutive trading days, Pandora may redeem all of the outstanding Series A Preferred Stock at a price equal to 100% of the liquidation preference thereof plus all accrued but unpaid dividends for, at the election of Pandora, cash, shares of Pandora Common Stock or a combination thereof, provided that, unless stockholder approval has been received, Pandora may not settle the redemption for shares of Pandora Common Stock to the extent the 19.99% cap would be exceeded.
Pursuant to a registration rights agreement entered into with Pandora, we have certain customary registration rights with respect to the Series A Preferred Stock and Pandora Common Stock issued upon conversion thereof.
Competition
Satellite Radio
We face significant competition for both listeners and advertisers in our satellite radio business, including from providers of radio and other audio services.
Traditional AM/FM Radio. Our services compete with traditional AM/FM radio. Traditional AM/FM radio has a well-established demand for its services and offers free broadcasts paid for by commercial advertising rather than by subscription fees. Many radio stations offer information programming of a local nature, such as local news and sports. The availability of traditional free AM/FM radio may reduce the likelihood that customers would be willing to pay for our subscription services and, by offering free broadcasts, it may impose limits on what we can charge for our services. Several traditional radio companies own large numbers of radio stations or other media properties.
Internet-Based Competitors. Internet radio services often have no geographic limitations and provide listeners with radio programming from across the country and around the world. Major online providers make high fidelity digital streams available through the Internet for free or, in some cases, for less than the cost of a satellite radio subscription. Certain of these services include advanced functionality, such as personalization, and allow the user to access large libraries of content. For some consumers, these services may compete with our services, at home, in vehicles, and wherever audio entertainment is consumed.
Advanced In-Dash Infotainment Systems. Nearly all automakers have deployed integrated multimedia systems in dashboards, including in many cases Apple CarPlay and Android Auto. These systems combine control of audio entertainment from a variety of sources, including AM/FM/HD radio broadcasts, satellite radio, Internet radio, smartphone applications and stored audio, with navigation and other advanced applications. Internet radio and other data are typically connected to the system through an Internet-enabled smartphone or wireless modem installed in the vehicle, and the entire system may be controlled by touchscreen or voice recognition. These systems may enhance the attractiveness of Internet-based competitors by making such applications more prominent, easier to access, and safer to use in vehicles.
Direct Broadcast Satellite and Cable Audio. A number of providers offer specialized audio services through either direct broadcast satellite or cable audio systems. These services are targeted to fixed locations, mostly in-home. The radio service offered by direct broadcast satellite and cable audio is often included as part of a package of digital services with video service, and video customers generally do not pay an additional monthly charge for the audio service.
Other Digital Media Services. The audio entertainment marketplace continues to evolve rapidly, with a steady emergence of new media platforms that compete with our services now or that could compete with those services in the future.
7
Traffic Services
A number of providers compete with our traffic services. In-dash navigation is threatened by smartphones that provide data services through a direct vehicle interface. Most of these smartphones offer GPS mapping with sophisticated data-based turn-by-turn navigation.
Connected Vehicle Services
Our connected vehicle services business operates in a highly competitive environment and competes with several providers, including Verizon Telematics, as well as products being developed by automakers for their vehicles. OnStar, a division of General Motors, also offers connected vehicle services in GM vehicles. We also compete with wireless devices such as mobile phones. We compete against other connected vehicle service providers for automaker arrangements on the basis of innovation, service quality and reliability, technical capabilities and systems customization, scope of service, industry experience, past performance and price.
Government Regulation
As operators of a privately-owned satellite system, we are regulated by the FCC under the Communications Act of 1934, principally with respect to:
• | the licensing of our satellite systems; |
• | preventing interference with or to other users of radio frequencies; and |
• | compliance with FCC rules established specifically for U.S. satellites and satellite radio services. |
Any assignment or transfer of control of our FCC licenses must be approved by the FCC. The FCC's order approving the merger of our wholly-owned subsidiary, Vernon Merger Corporation, with and into XM Satellite Radio Holdings Inc. in July 2008 (the “Merger”) requires us to comply with certain voluntary commitments we made as part of the FCC Merger proceeding. We believe we comply with those commitments.
In 1997, we were the winning bidders for FCC licenses to operate a satellite digital audio radio service and provide other ancillary services. Our FCC licenses for our Sirius satellites expire in 2022 and 2025. Our FCC licenses for our XM satellites expire in 2018, 2021 and 2022. We anticipate that, absent significant misconduct on our part, the FCC will renew our licenses to permit operation of our satellites for their useful lives, and grant licenses for any replacement satellites.
In some areas, we have installed terrestrial repeaters to supplement our satellite signal coverage. The FCC has established rules governing terrestrial repeaters and has granted us a license through 2027 to operate our repeater network.
In certain cases, we obtain FCC certifications for satellite radios, including satellite radios that include FM modulators. We believe our radios that are in production comply with all applicable FCC rules.
We are required to obtain export licenses or other approvals from the United States government to export certain equipment, services and technical data related to our satellites and their operations. The transfer of such equipment, services and technical data outside the United States or to foreign persons is subject to strict export control and prior approval requirements from the United States government (including prohibitions on the sharing of certain satellite-related goods and services with China).
Changes in law or regulations relating to communications policy or to matters affecting our services could adversely affect our ability to retain our FCC licenses or the manner in which we operate.
Copyrights to Programming
In connection with our satellite radio music programming, we must negotiate and enter into royalty arrangements with two sets of rights holders: Holders of copyrights in musical works (that is, the music and lyrics) and holders of copyrights in sound recordings (that is, the actual recording of a work).
Musical Works
Musical works rights holders, generally songwriters and music publishers, have been traditionally represented by performing rights organizations such as the American Society of Composers, Authors and Publishers (“ASCAP”), Broadcast
8
Music, Inc. (“BMI”) and SESAC, Inc. (“SESAC”). The market for rights relating to musical works is changing rapidly. Songwriters and music publishers have withdrawn from the traditional performing rights organizations, particularly ASCAP and BMI, and new entities, such as Global Music Rights LLC (“GMR”), have been formed to represent rights holders. These organizations negotiate fees with copyright users, collect royalties and distribute them to the rights holders. We have arrangements with ASCAP, SESAC and GMR, and are in negotiations with BMI for a new agreement. If we are unable to reach an agreement with BMI, a court will determine the royalty we will be required to pay BMI. The changing market for musical works may have an adverse effect on us, including increasing our costs or limiting the musical works available to us. To secure the rights to stream music content over the Internet, including to mobile devices, we also must obtain licenses from, and pay royalties to, copyright owners of musical compositions and sound recordings. We have arrangements with ASCAP, SESAC and GMR to license the musical compositions we stream over the Internet and are in negotiations with BMI for a new agreement.
Sound Recordings
Sound recording rights holders, typically large record companies, are primarily represented by SoundExchange, an organization which negotiates licenses, and collects and distributes royalties on behalf of record companies and performing artists. Under the Digital Performance Right in Sound Recordings Act of 1995 and the Digital Millennium Copyright Act of 1998, we may negotiate royalty arrangements with the owners of sound recordings fixed after February 15, 1972, or if negotiation is unsuccessful, the royalty rate is established by the Copyright Royalty Board (the “CRB”) of the Library of Congress.
On December 14, 2017, the CRB issued its determination regarding the royalty rate payable by us under the statutory license covering the performance of sound recordings fixed after February 15, 1972 over our satellite radio service, and the making of ephemeral (server) copies in support of such performances, for the five-year period starting January 1, 2018 and ending on December 31, 2022. Under the terms of the CRB’s decision, we are required to pay a royalty of 15.5% of gross revenues, subject to exclusions and adjustments, for the five-year period. The rate for 2017 was 11.0%.
The rates and terms permit us to reduce the payment due each month by the percentage of our transmissions of recordings that are directly licensed from copyright owners and the percentage of transmissions that comprise recordings fixed before February 15, 1972, which recordings are not subject to the Copyright Act. The revenue subject to royalty includes subscription revenue from our U.S. satellite digital audio radio subscribers, and advertising revenue from channels other than those channels that make only incidental performances of sound recordings. Exclusions from revenue subject to the statutory license fee include, among other things:
• | monies or other consideration attributable to the sale and/or license of equipment and/or other technology, including but not limited to bandwidth, sales of devices that receive our satellite radio services and any shipping and handling fees therefor; |
• | royalties paid to us for intellectual property rights; |
• | sales and use taxes; |
• | credit card, invoice, activation, swap and early termination fees charged to subscribers and reasonably related to the expenses to which they pertain; |
• | bad debt expense; and |
• | revenues attributable to our current and future data services offered for a separate charge (such as weather, traffic, destination information, messaging, sports scores, stock ticker information, extended program associated data, video and photographic images, and such other telematics and/or data services as may exist from time to time); channels, programming, products and/or other services offered for a separate charge where such channels use only incidental performances of sound recordings; channels, programming, products and/or other services provided outside of the United States; and channels, programming, products and/or other services for which the performance of the recordings is exempt from any license requirement or is separately licensed, including by a statutory license. |
Once the CRB has considered any rehearing motions and responses to such motions, and provided the Register of Copyrights with sixty days to review the determination for any legal error, the Librarian of Congress will publish the final determination in the Federal Register. The parties will have thirty days from that publication to appeal the decision to the U.S. Court of Appeals for the District of Columbia Circuit.
9
The licensing of certain sound recordings fixed after February 15, 1972 for use on the Internet is also subject to the Digital Performance Right in Sound Recordings Act of 1995 and the Digital Millennium Copyright Act of 1998 on terms established by the CRB. In 2017, we paid a per performance rate for the streaming of certain sound recordings on the Internet of $0.0022. In accordance with the CRB’s 2016 decision, this royalty rate increased in 2018 to $0.0023 per subscription performance and may increase further through 2020 based on changes in the consumer price index.
Our rights to perform certain copyrighted sound recordings that were fixed after February 15, 1972 are governed by United States federal law, the Copyright Act. In contrast, our rights to perform certain sound recordings that were fixed before February 15, 1972 are governed by state law. During 2015 and 2016, we settled suits with copyright owners for almost all of the pre-1972 sound recordings we use.
Trademarks
We have registered, and intend to maintain, the trademarks “Sirius”, “XM”, “SiriusXM” and “SXM” with the United States Patent and Trademark Office in connection with the services we offer. We are not aware of any material claims of infringement or other challenges to our right to use the “Sirius”, “XM”, “SiriusXM” or “SXM” trademarks in the United States. We also have registered, and intend to maintain, trademarks for the names of certain of our channels. We have also registered the trademarks “Sirius”, “XM” and “SiriusXM” in Canada. We have granted a license to use certain of our trademarks in Canada to Sirius XM Canada.
Personnel
As of December 31, 2017, we had 2,575 full-time employees. In addition, we rely upon a number of part-time employees, consultants, other advisors and outsourced relationships. None of our employees are represented by a labor union, and we believe that our employee relations are good.
Corporate Information and Available Information
Our executive offices are located at 1290 Avenue of the Americas, 11th floor, New York, New York 10104 and our telephone number is (212) 584-5100. Our internet address is www.siriusxm.com. Our annual, quarterly and current reports, and any amendments to those reports, filed or furnished pursuant to Section 13(a) or 15(d) of the Securities Exchange Act of 1934, as amended (the “Exchange Act”), may be accessed free of charge through our website after we have electronically filed or furnished such material with the SEC. Siriusxm.com (including any other reference to such address in this Annual Report) is an inactive textual reference only, meaning that the information contained on or accessible from the website is not part of this Annual Report on Form 10-K and is not incorporated in this report by reference.
Executive Officers of the Registrant
Certain information regarding our executive officers as of January 29, 2018 is provided below:
Name | Age | Position |
James E. Meyer | 63 | Chief Executive Officer |
Scott A. Greenstein | 58 | President and Chief Content Officer |
David J. Frear | 61 | Senior Executive Vice President and Chief Financial Officer |
Dara F. Altman | 59 | Executive Vice President and Chief Administrative Officer |
James A. Cady | 57 | Executive Vice President, Operations, Products and Connected Vehicle |
Stephen Cook | 62 | Executive Vice President, Sales and Automotive |
Patrick L. Donnelly | 56 | Executive Vice President, General Counsel and Secretary |
Joseph A. Verbrugge | 48 | Executive Vice President, Emerging Business |
Jennifer C. Witz | 49 | Executive Vice President, Chief Marketing Officer |
James E. Meyer has served as our Chief Executive Officer since December 2012. From May 2004 to December 2012, Mr. Meyer was our President, Operations and Sales. Prior to May 2004, Mr. Meyer was President of Aegis Ventures Incorporated, a consulting firm that provided general management services. From December 2001 until 2002, Mr. Meyer served as special advisor to the Chairman of Thomson S.A., a leading consumer electronics company. From January 1997 until December 2001, Mr. Meyer served as the Senior Executive Vice President for Thomson as well as a member of the executive
10
committee. From 1992 until 1996, Mr. Meyer served as Thomson's Senior Vice President of Product Management. Mr. Meyer is a director of Pandora Media, Inc. and Chairman of the Board of Directors and a director of TiVo Corporation.
Scott A. Greenstein has served as our President and Chief Content Officer since May 2004. Prior to May 2004, Mr. Greenstein was Chief Executive Officer of The Greenstein Group, a media and entertainment consulting firm. From 1999 until 2002, he was Chairman of USA Films, a motion picture production, marketing and distribution company. From 1997 until 1999, Mr. Greenstein was Co-President of October Films, a motion picture production, marketing and distribution company. Prior to joining October Films, Mr. Greenstein was Senior Vice President of Motion Pictures, Music, New Media and Publishing at Miramax Films, and held senior positions at Viacom Inc.
David J. Frear has served as our Senior Executive Vice President and Chief Financial Officer since June 2015. From June 2003 to June 2015, he served as our Executive Vice President and Chief Financial Officer. From 1999 to 2003, Mr. Frear was Executive Vice President and Chief Financial Officer of Savvis Communications Corporation, a global managed service provider, delivering internet protocol applications for business customers. Mr. Frear also served as a director of Savvis. From 1993 to 1998, Mr. Frear was Senior Vice President and Chief Financial Officer of Orion Network Systems Inc., an international satellite communications company that was acquired by Loral Space & Communications Ltd. in 1998. From 1990 to 1993, Mr. Frear was Chief Financial Officer of Millicom Incorporated, a cellular, paging and cable television company. Prior to joining Millicom, he was an investment banker at Bear, Stearns & Co., Inc. and Credit Suisse. Mr. Frear is a member of the board of directors of The NASDAQ Stock Market LLC, NASDAQ PHLX LLC, and NASDAQ BX, Inc., subsidiaries of Nasdaq, Inc., a leading provider of trading, clearing, exchange technology, listing, information and public company services, and Pandora Media, Inc.
Dara F. Altman has served as our Executive Vice President and Chief Administrative Officer since September 2008. From January 2006 until September 2008, Ms. Altman served as Executive Vice President, Business and Legal Affairs, of XM. Ms. Altman was Executive Vice President of Business Affairs for Discovery Communications from 1997 to 2005. From 1993 to 1997, Ms. Altman served as Senior Vice President and General Counsel of Reiss Media Enterprises, which owned Request TV, a national pay-per-view service. Before Request TV, Ms. Altman served as counsel for Home Box Office. Ms. Altman started her career as an attorney at the law firm of Willkie Farr & Gallagher LLP.
James A. Cady has served as our Executive Vice President, Operations, Products and Connected Vehicle, since July 2015 and, prior to July 2015, served as Senior Vice President and General Manager of our Connected Services Platform since February 2014. Mr. Cady was the Chief Executive Officer and President of Slacker, Inc., an internet music service provider, from August 2009 until February 2014. He was the President and Chief Operating Officer of Slacker, Inc. from May 2006 until August 2009. From September 2004 until May 2006, he served as the Chief Executive Officer and President of LightPointe Communications, Inc., a manufacturer of wireless data transmission equipment. Prior to that time, Mr. Cady served in a variety of roles at an assortment of technology companies, including WatchGuard Technologies Inc., a manufacturer of computer security solutions; Rio, a division of SONICblue, Incorporated; Diamond Multimedia Systems, a manufacturer of various multimedia components; Supra Corp., a producer of hardware for computers; Moore Company, a wholesale distributor of consumer electronics; and Atari Corp., a manufacturer of computer and video games.
Stephen Cook has served as our Executive Vice President, Sales and Automotive, since January 2013. Mr. Cook served as our Group Vice President and General Manager, Automotive Division, from July 2008 until January 2013. Mr. Cook served as Executive Vice President, Automotive, of XM from July 2006 to July 2008. He also served as XM's Executive Vice President, Sales and Marketing, from January 2002 until July 2006, and as XM's Senior Vice President, Sales and Marketing, from February 1999 until January 2002. Prior to joining XM, Mr. Cook was Chief Operating Officer for Conxus Communications. From 1990 to 1997, Mr. Cook held management positions with GTE's cellular operations. Prior to that time, Mr. Cook worked in brand management for Procter & Gamble.
Patrick L. Donnelly has served as our Executive Vice President, General Counsel and Secretary, since May 1998. From June 1997 to May 1998, he was Vice President and Deputy General Counsel of ITT Corporation, a hotel, gaming and entertainment company that was acquired by Starwood Hotels & Resorts Worldwide, Inc. in February 1998. From October 1995 to June 1997, he was assistant general counsel of ITT Corporation. Prior to October 1995, Mr. Donnelly was an attorney at the law firm of Simpson Thacher & Bartlett LLP.
Joseph A. Verbrugge has served as our Executive Vice President, Emerging Business, since April 2017. From December 2015 until April 2017, he was our Executive Vice President, Sales and Development. Mr. Verbrugge previously served as our Senior Vice President and General Manager, Automotive Remarketing and Retail Sales, from April 2012 until December 2015; as our Senior Vice President, Automotive Remarketing, from February 2010 until April 2012; and as our Senior Vice President, Automotive Partnerships, from September 2008 until February 2010. From January 2007 through September 2008, he was
11
Senior Vice President, Automotive Accounts/Partnerships and International Operations, of XM; from May 2006 until January 2007, Mr. Verbrugge served as Senior Vice President, Administration and International Operations of XM; from January 2005 until May 2006, he was Vice President, International Operations, of XM; and from September 2004 until January 2005 he served as Vice President, Special Projects, of XM. Prior to joining XM, Mr. Verbrugge was a consultant with The Dealy Strategy Group LLC, a management consulting firm specializing in international satellite communications and information services companies, from 1999 until 2004. From 1992 until 1995, Mr. Verbrugge was a bond representative with Aetna Life and Casualty Company, an insurance company.
Jennifer C. Witz has served as our Executive Vice President, Chief Marketing Officer, since August 2017. Ms. Witz joined us in March 2002 and, prior to her appointment as Executive Vice President, Chief Marketing Officer, served in a variety of senior financial and operating roles. From September 2005 to August 2017, she was our Senior Vice President, Finance, from May 2003 to September 2005, she was our Vice President, Finance, and from March 2002 to May 2003, she was our Senior Director, Finance. Before joining Sirius XM, Ms. Witz was Vice President, Planning and Development, at Viacom Inc., a global media company, and prior to that she was Vice President, Finance and Corporate Development, at Metro-Goldwyn-Mayer, Inc., an entertainment company focused on the production and global distribution of film and television content. Ms. Witz began her career in the Investment Banking Department at Kidder, Peabody & Co Inc.
ITEM 1A. | RISK FACTORS |
In addition to the other information in this Annual Report on Form 10-K, including the information under the caption Item 1. Business “Competition,” the following risk factors should be considered carefully in evaluating us and our business. This Annual Report on Form 10-K contains forward-looking statements within the meaning of the Private Securities Litigation Reform Act of 1995. Actual results and the timing of events could differ materially from those projected in forward-looking statements due to a number of factors, including those set forth below and elsewhere in this Annual Report on Form 10-K. See “Special Note About Forward-Looking Statements” following this Item 1A. Risk Factors.
We face substantial competition and that competition is likely to increase over time.
We face substantial competition from other providers of radio and audio services. Our ability to attract and retain subscribers depends on our success in creating and providing popular or unique music, entertainment, news and sports programming. Our subscribers can obtain certain similar content for free through terrestrial radio stations, Internet radio services and Internet streaming services. Audio content delivered via the Internet, including through mobile devices that are easily integrated in vehicles, is increasingly competitive with our services. A summary of various services that compete with us is contained in the section entitled “Item 1. Business - Competition” of this Annual Report on Form 10-K.
Competition could result in lower subscription, advertising or other revenue and an increase in our marketing, promotion or other expenses and, consequently, lower our earnings and free cash flow. We cannot assure you we will be able to compete successfully with our existing or future competitors or that competition will not have a material adverse impact on our operations and financial condition.
Our ability to retain subscribers or increase the number of subscribers is uncertain.
Our ability to retain our subscribers, or increase the number of subscribers to our service, is uncertain and subject to many factors, including:
• | the price of our service; |
• | the health of the economy; |
• | the sale or lease rate of new vehicles in the United States; |
• | the rate at which our existing self-pay subscribers buy and sell new and used vehicles in the United States; |
• | our ability to convince owners and lessees of new and previously owned vehicles that include satellite radios to purchase subscriptions to our service; |
• | the effectiveness of our marketing programs; |
• | the entertainment value of our programming and the products and packages we offer; |
• | our ability to respond to evolving consumer tastes; and |
• | actions by our competitors, such as other audio entertainment and information providers. |
12
As part of our business, we experience, and expect to experience in the future, subscriber turnover (i.e., churn).
If we are unable to retain current subscribers at expected rates, or the costs of retaining subscribers are higher than expected, our financial performance and operating results could be adversely affected. We cannot predict how successful we will be at retaining customers who purchase or lease vehicles that include a subscription to our satellite radio service. A substantial portion of our subscribers are on discounted pricing plans and our ability to retain these subscribers or migrate them to higher priced plans is uncertain. A substantial number of those subscribers periodically cancel their subscriptions when offered a subscription at a higher price.
Our profitability could be adversely affected if we are unable to consistently attract new subscribers and retain our current subscribers at prices and margins consistent with our past performance.
Our ability to profitably attract and retain subscribers as our marketing efforts reach more price-sensitive consumers is uncertain.
Our efforts to acquire subscribers purchasing or leasing used vehicles may attract subscribers of more limited economic means. For example, consumers purchasing or leasing used vehicles may be more price sensitive than consumers purchasing or leasing new vehicles, may convert from trial subscribers to self-paying subscribers at a lower rate, and may cancel their subscription more frequently than consumers purchasing or leasing new vehicles. Some of our marketing efforts may also attract more price sensitive subscribers; and our efforts to increase the penetration of satellite radios in new, lower-priced vehicle lines may result in the growth of more economy-minded subscribers. In addition, over time the changing demographics of our subscriber base, such as the expected increase in customers from the “millennial generation,” may increase the number of subscribers accustomed to consuming entertainment through free products.
If we fail to protect the security of personal information about our customers, we could be subject to costly government enforcement actions and private litigation and our reputation could suffer.
The nature of our business involves the receipt and storage of personal information about our subscribers including, in many cases, credit and debit card information. If we fail to protect the security of personal information about our customers or if we experience a significant data security breach, we could be exposed to costly government enforcement actions and private litigation and our reputation could suffer. In addition, our subscribers and potential customers could lose confidence in our ability to protect their personal information, which could cause them to discontinue usage of our services. Such events could lead to lost future sales and adversely affect our results of operations.
We have a program in place to detect and respond to data security incidents. However, because the techniques used to obtain unauthorized access, disable or degrade service, or sabotage systems change frequently and may be difficult to detect for long periods of time, we may be unable to anticipate these techniques or implement adequate preventive measures. In addition, hardware, software, or applications we develop or procure from third parties may contain defects in design or manufacture or other problems that could unexpectedly compromise information security. Unauthorized parties may also attempt to gain access to our systems or facilities, or those of third parties with whom we do business, through fraud, trickery, or other forms of deceiving our employees, contractors or other agents.
If hackers were able to circumvent our security measures, a release of proprietary information or personal information could occur or we could experience significant disruptions. If our systems become unavailable or suffer a security breach, we may be required to expend significant resources to address these problems, including notification under various data privacy regulations, and our reputation and operating results could suffer.
Our service may experience harmful interference from new wireless operations.
The development of new applications and services in spectrum adjacent to the frequencies licensed to us, as well as the combination of signals in other frequencies, may cause harmful interference to our satellite radio service in certain areas of the United States. Certain operations or combination of operations permitted by the FCC in spectrum, other than our licensed frequencies, results in the loss of signal to our service, and the reception of our satellite radio service can be adversely affected in certain areas. Elimination of this interference may not be possible in all cases. In other cases, our efforts to reduce this interference may require extensive engineering efforts and additions to our terrestrial infrastructure. These mitigation efforts may be costly and take several years to implement and may not be entirely effective. In certain cases, we are dependent on the FCC to assist us in preventing harmful interference to our service.
13
We engage in extensive marketing efforts and the continued effectiveness of those efforts are an important part of our business.
We engage in extensive marketing efforts across a broad range of media to attract and retain subscribers to our services. We employ a wide variety of communications tools as part of our marketing campaigns, including telemarketing efforts and email solicitations. The effectiveness of our marketing efforts is affected by a broad range of factors, including creative and execution factors. Our ability to reach consumers with radio and television advertising, direct mail materials, email solicitations and telephone calls is an important part of our efforts and a significant factor in the effectiveness of our marketing. If we are unable to reach consumers through email solicitations or telemarketing, including as a result of “spam” and email filters or call blocking technologies, our marketing efforts will be adversely affected. A decline in the effectiveness of our marketing efforts could have a material adverse impact on our operations and financial condition.
Consumer protection laws and their enforcement could damage our business.
Consumer protection laws cover nearly all aspects of our marketing efforts, including the content of our advertising, the terms of consumer offers and the manner in which we communicate with subscribers and prospective subscribers. The nature of our business requires us to expend significant resources to try to ensure that our marketing activities comply with federal and state laws, rules and regulations relating to consumer protection, including laws relating to telemarketing activities and privacy. There can be no assurance that these efforts will be successful or that we will not have to expend even greater resources in our compliance efforts.
Modifications to federal and state laws, rules and regulations concerning consumer protection, including decisions by federal and state courts and agencies interpreting these laws, could have an adverse impact on our ability to attract and retain subscribers to our services. There can be no assurance that new laws or regulations will not be enacted or adopted, preexisting laws or regulations will not be more strictly enforced or that our varied operations will comply with all applicable laws, which could have a material adverse impact on our operations and financial condition.
We may not realize the benefits of acquisitions or other strategic investments and initiatives.
Our business strategy includes selective acquisitions, other strategic investments and initiatives that allow us to expand our business. The success of any acquisition depends upon effective integration and management of acquired businesses and assets into our operations, which is subject to risks and uncertainties, including realizing the growth potential, the anticipated synergies and cost savings, the ability to retain and attract personnel, the diversion of management’s attention for other business concerns, and undisclosed or potential legal liabilities of the acquired business or assets.
The unfavorable outcome of pending or future litigation could have a material adverse impact on our operations and financial condition.
We are parties to several legal proceedings arising out of various aspects of our business, including class actions arising out of our marketing practices and subscription plans. The outcome of these proceedings may not be favorable, and one or more unfavorable outcomes could have a material adverse impact on our financial condition. See “Item 3. Legal Proceedings” below.
The market for music rights is changing and is subject to significant uncertainties.
We must maintain music programming royalty arrangements with, and pay license fees to, owners of rights in musical works. Traditionally, BMI, ASCAP and SESAC have negotiated for these copyright users, collected royalties and distributed them to songwriters and music publishers. These traditional arrangements are changing. Owners of rights in musical works have withdrawn from BMI, ASCAP and SESAC and new entities, such as GMR, have been formed to represent owners of musical works. In addition, Committees of Congress have held hearings on substantial revisions of the Copyright Act. The fracturing of the traditional system for licensing rights in musical works may have significant consequences to our business, including increasing licensing costs and reducing the availability of certain pieces for use on our services.
Under the Digital Performance Right in Sound Recordings Act of 1995 and the Digital Millennium Copyright Act of 1998, we also must pay royalties to copyright owners of sound recordings fixed after February 15, 1972. Those royalty rates may be established through negotiation or, if negotiation is unsuccessful, by the CRB. Owners of copyrights in sound recordings have created SoundExchange, a collective organization, to collect and distribute royalties. SoundExchange is exempt by statute from certain U.S. antitrust laws and exercises significant market power in the licensing of sound recordings. Under the terms of the CRB's recent decision governing sound recording royalties for satellite radio for the five-
14
year period ending on December 31, 2022, we will be required to pay a royalty based on our gross revenues, subject to certain exclusions, of 15.5% per year for each of the next five years. This is a substantial increase over the royalty rate of 11% of our gross revenues that we paid in 2017.
In addition, SoundExchange alleges that we systematically underpaid royalties for statutory licenses related to sound recordings for certain periods beginning in 2007. See “Item 3. Legal Proceedings” below.
Our business depends in large part upon the auto industry.
A substantial portion of our subscription growth has come from purchasers and lessees of new and previously owned automobiles in the United States. The sale and lease of vehicles with satellite radios is an important source of subscribers for our satellite radio service. We have agreements with every major automaker to include satellite radios in new vehicles, although these agreements do not require automakers to install specific or minimum quantities of radios in any given period.
Automotive production and sales are dependent on many factors, including the availability of consumer credit, general economic conditions, consumer confidence and fuel costs. To the extent vehicle sales by automakers decline, or the penetration of factory-installed satellite radios in those vehicles is reduced, subscriber growth for our satellite radio services may be adversely impacted.
Sales of previously owned vehicles represent a significant source of new subscribers for us. We have agreements with auto dealers and companies operating in the used vehicle market to provide us with data on sales of previously owned satellite radio enabled vehicles. The continuing availability of this information is important to our future growth.
General economic conditions can affect our business.
The purchase of a satellite radio subscription is discretionary, and our business and our financial condition can be negatively affected by general economic conditions. Poor general economic conditions could adversely affect subscriber churn, conversion rates and vehicle sales.
Existing or future laws and regulations could harm our business.
We are subject to many laws, including federal, state, local and foreign laws. These laws and regulations cover issues such as user privacy, behavioral advertising, automatic renewal of agreements, pricing, fraud, electronic waste, mobile and electronic device communications, quality of products and services, taxation, advertising, intellectual property rights and information security. The expansion of these laws, both in terms of their number and their applicability, could harm our business.
Failure of our satellites would significantly damage our business.
The lives of our satellites vary depending on a number of factors, including:
• | degradation and durability of solar panels; |
• | quality of construction; |
• | random failure of satellite components, which could result in significant damage to or loss of a satellite; |
• | amount of fuel the satellite consumes; and |
• | damage or destruction as a result of electrostatic storms, terrorist attacks, collisions with other objects in space or other events, such as nuclear detonations, occurring in space. |
In the ordinary course of operation, satellites experience failures of component parts and operational and performance anomalies. Components on our in-orbit satellites have failed; and from time to time we have experienced anomalies in the operation and performance of these satellites. These failures and anomalies are expected to continue in the ordinary course, and we cannot predict if any of these possible future events will have a material adverse effect on our operations or the life of our existing in-orbit satellites. Any material failure of our satellites could cause us to lose customers and could materially harm our reputation and our operating results. We hold no in-orbit insurance for our satellites. Additional information regarding our fleet of satellites is contained in the section entitled “Item 1. Business - Satellites, Terrestrial Repeaters and Other Satellite Facilities” of this Annual Report on Form 10-K.
15
In addition, our Sirius network of terrestrial repeaters communicates with a single third-party satellite. Our XM network of terrestrial repeaters communicates with a single XM satellite. If the satellites communicating with the applicable repeater network fail unexpectedly, the services would be disrupted for several hours or longer.
Interruption or failure of our information technology and communications systems could negatively impact our results and our brand.
We operate a complex and growing business. We offer a wide variety of subscription packages at different price points. Our business is dependent on the operation and availability of our information technology and communication systems and those of certain third party service providers. Any degradation in the quality, or any failure, of our systems could reduce our revenues, cause us to lose customers and damage our brand. Although we have implemented practices designed to maintain the availability of our information technology systems and mitigate the harm of any unplanned interruptions, we cannot anticipate all eventualities. We occasionally experience unplanned outages or technical difficulties. We could also experience loss of data or processing capabilities, which could cause us to lose customers and could materially harm our reputation and our operating results.
We rely on internal systems and external systems maintained by manufacturers, distributors and service providers to take, fulfill and handle customer service requests and host certain online activities. Any interruption or failure of our internal or external systems could prevent us from servicing customers or cause data to be unintentionally disclosed.
Our data centers and our information technology and communications systems are vulnerable to damage or interruption from natural disasters, malicious attacks, fire, power loss, telecommunications failures, computer viruses or other attempts to harm our systems.
Rapid technological and industry changes and new entrants could adversely impact our services.
The audio entertainment industry is characterized by rapid technological change, frequent product innovations, changes in customer requirements and expectations, evolving standards and new entrants offering products and services. If we are unable to keep pace with these changes, our business may not succeed. Products using new technologies could make our technologies less competitive in the marketplace.
Failure of third parties to perform could adversely affect our business.
Our business depends, in part, on various third parties, including:
• | manufacturers that build and distribute satellite radios; |
• | companies that manufacture and sell integrated circuits for satellite radios; |
• | programming providers and on-air talent; |
• | vendors that operate our call centers; and |
• | vendors that have designed or built, and vendors that support or operate, other important elements of our systems, including our satellites. |
If one or more of these third parties do not perform in a satisfactory or timely manner, including complying with our standards and practices relating to business integrity, personnel, cybersecurity and other values, our business could be adversely affected. In addition, a number of third parties on which we depend have experienced, and may in the future experience, financial difficulties or file for bankruptcy protection. Such third parties may not be able to perform their obligations to us in a timely manner, if at all, as a result of their financial condition or may be relieved of their obligations to us as part of seeking bankruptcy protection.
We design, establish specifications, source or specify parts and components, and manage various aspects of the logistics of the production of satellite radios. As a result of these activities, we may be exposed to liabilities associated with the design, manufacture and distribution of radios that the providers of an entertainment service would not customarily be subject to, such as liabilities for design defects, patent infringement and compliance with applicable laws, as well as the costs of returned product.
16
Failure to comply with FCC requirements could damage our business.
We hold FCC licenses and authorizations to operate commercial satellite radio services in the United States, including satellites, terrestrial repeaters and related authorizations. The FCC generally grants licenses and authorizations for a fixed term. Although we expect our licenses and authorizations to be renewed in the ordinary course upon their expiration, there can be no assurance that this will be the case. Any assignment or transfer of control of any of our FCC licenses or authorizations must be approved in advance by the FCC.
The operation of our satellite radio systems is subject to significant regulation by the FCC under authority granted through the Communications Act of 1934 and related federal law. We are required, among other things, to operate only within specified frequencies; to meet certain conditions regarding the interoperability of our satellite radios with those of other licensed satellite radio systems; to coordinate our satellite radio services with radio systems operating in the same range of frequencies in neighboring countries; and to coordinate our communications links to our satellites with other systems that operate in the same frequency band. Noncompliance by us with these requirements or other conditions or with other applicable FCC rules and regulations could result in fines, additional license conditions, license revocation or other detrimental FCC actions. There is no guarantee that Congress will not modify the statutory framework governing our services, or that the FCC will not modify its rules and regulations in a manner that would have a material impact on our operations.
We may from time to time modify our business plan, and these changes could adversely affect us and our financial condition.
We regularly evaluate our plans and strategy. These evaluations often result in changes to our plans and strategy, some of which may be material. These changes in our plans or strategy may include: the acquisition or termination of unique or compelling programming; the introduction of new features or services; significant new or enhanced distribution arrangements; investments in infrastructure, such as satellites, equipment or radio spectrum; and investments in, and/or acquisitions of, other businesses, including acquisitions that are not directly related to our satellite radio business.
We have a significant amount of indebtedness, and our debt contains certain covenants that restrict our operations.
As of December 31, 2017, we had an aggregate principal amount of approximately $6.8 billion of indebtedness outstanding, $300.0 million of which was outstanding under a $1.75 billion Senior Secured Revolving Credit Facility.
Our indebtedness increases our vulnerability to general adverse economic and industry conditions; requires us to dedicate a portion of our cash flow from operations to payments on indebtedness, reducing the availability of cash flow to fund capital expenditures, marketing and other general corporate activities; limits our ability to borrow additional funds; and may limit our flexibility in planning for, or reacting to, changes in our business and the audio entertainment industry.
Our studios, terrestrial repeater networks, satellite uplink facilities or other ground facilities could be damaged by natural catastrophes or terrorist activities.
An earthquake, hurricane, tornado, flood, terrorist attack or other catastrophic event could damage our studios, terrestrial repeater networks or satellite uplink facilities, interrupt our service and harm our business.
Any damage to the satellites that transmit to our terrestrial repeater networks would likely result in degradation of the affected service for some subscribers and could result in complete loss of service in certain or all areas. Damage to our satellite uplink facilities could result in a complete loss of our services until we could transfer operations to suitable back-up facilities.
Our principal stockholder has significant influence, including over actions requiring stockholder approval, and its interests may differ from the interests of other holders of our common stock.
As of December 31, 2017, Liberty Media beneficially owned approximately 70% of Holdings’ common stock and has the ability to influence our affairs, policies and operations. Two Liberty Media executives and one other member of the board of directors of Liberty Media are members of our board of directors. Our board of directors currently has thirteen members. Gregory B. Maffei, the President and Chief Executive Officer of Liberty Media, is the Chairman of Holdings’ board of directors. Our board of directors is responsible for, among other things, the appointment of executive management, future issuances of common stock or other securities, the payment of dividends, if any, the incurrence of debt, and the approval of various transactions.
17
Liberty Media can also determine the outcome of all matters requiring general stockholder approval, including the election of the board of directors and changes to our certificate of incorporation or by-laws. Liberty Media can also cause or prevent a change of control of Holdings and could preclude any unsolicited acquisition of our company. The concentration of ownership could deprive our stockholders of an opportunity to receive a premium for their common stock as part of a sale of our company and might ultimately affect the market price of our common stock. In certain cases, the interests of Liberty Media may not be aligned with the interests of other stockholders of Holdings.
We are a “controlled company” within the meaning of the NASDAQ listing rules and, as a result, qualify for, and rely on, exemptions from certain corporate governance requirements.
We are a “controlled company” for the purposes of the NASDAQ Stock Market listing rules. As such, we have elected not to comply with certain NASDAQ corporate governance requirements. Although a majority of our board of directors consists of independent directors, we do not have a compensation committee and nominating and corporate governance committee that consist entirely of independent directors.
Our business may be impaired by third-party intellectual property rights.
Development of our systems has depended upon the intellectual property that we have developed, as well as intellectual property licensed from third parties. If the intellectual property that we have developed or use is not adequately protected, others will be permitted to and may duplicate portions of our systems or services without liability. In addition, others may challenge, invalidate, render unenforceable or circumvent our intellectual property rights, patents or existing licenses or we may face significant legal costs in connection with defending and enforcing those intellectual property rights. Some of the know-how and technology we have developed, and plan to develop, is not now, nor will it be, covered by U.S. patents or trade secret protections. Trade secret protection and contractual agreements may not provide adequate protection if there is any unauthorized use or disclosure. The loss of necessary technologies could require us to substitute technologies of lower quality performance standards, at greater cost or on a delayed basis, which could harm us.
Other parties may have patents or pending patent applications, which will later mature into patents or inventions that may block or put limits on our ability to operate our system or license technologies. We may have to resort to litigation to enforce our rights under license agreements or to determine the scope and validity of other parties’ proprietary rights in the subject matter of those licenses. This may be expensive and we may not succeed in any such litigation.
Third parties may assert claims or bring suit against us for patent, trademark or copyright infringement, or for other infringement or misappropriation of intellectual property rights. Any such litigation could result in substantial cost, and diversion of effort and adverse findings in any proceeding could subject us to significant liabilities to third parties; require us to seek licenses from third parties; block our ability to operate our systems or license our technology; or otherwise adversely affect our ability to successfully develop and market our satellite radio systems.
While we currently pay a quarterly cash dividend to holders of our common stock, we may change our dividend policy at any time.
We currently pay a quarterly cash dividend to holders of our common stock, although we have no obligation to do so, and our dividend policy may change at any time without notice to our stockholders. The declaration and payment of dividends is at the discretion of our board of directors in accordance with applicable law after taking into account various factors, including our financial condition, operating results, current and anticipated cash needs, limitations imposed by our indebtedness, legal requirements and other factors that our board of directors deems relevant.
Special Note About Forward-Looking Statements
We have made various statements in this Annual Report on Form 10-K that may constitute “forward-looking statements” within the meaning of the Private Securities Litigation Reform Act of 1995. Forward-looking statements may also be made in our other reports filed with or furnished to the SEC, in our press releases and in other documents. In addition, from time to time, we, through our management, may make oral forward-looking statements. Forward-looking statements are subject to risks and uncertainties, including those identified above, which could cause actual results to differ materially from such statements. The words “will likely result,” “are expected to,” “will continue,” “is anticipated,” “estimated,” “believe,” “intend,” “plan,” “may,” “should,” “could,” “would,” “likely,” “projection,” “outlook” and similar expressions are intended to identify forward-looking statements. We caution you that the risk factors described above are not exclusive. There may also be other risks that we are unable to predict at this time that may cause actual results to differ materially from those in forward-looking statements. New factors emerge from time to time, and it is not possible for us to predict which will arise or to assess with any precision the
18
impact of each factor on our business or the extent to which any factor, or combination of factors, may cause actual results to differ materially from those contained in any forward-looking statements. Readers are cautioned not to place undue reliance on these forward-looking statements, which speak only as of the date on which they are made. We undertake no obligation to update publicly or revise any forward-looking statements, except as required by law.
ITEM 1B. | UNRESOLVED STAFF COMMENTS |
None.
ITEM 2. | PROPERTIES |
Below is a list of the principal properties that we own or lease:
Location | Purpose | Own/Lease | ||
New York, NY | Corporate headquarters, office facilities and studio/production facilities | Lease | ||
Washington, DC | Office, studio/production facilities and data center | Own | ||
Lawrenceville, NJ | Office and technical/engineering facilities | Lease | ||
Deerfield Beach, FL | Office and technical/engineering facilities | Lease | ||
Farmington Hills, MI | Office and technical/engineering facilities | Lease | ||
Nashville, TN | Studio/production facilities | Lease | ||
Vernon, NJ | Technical/engineering facilities | Own | ||
Ellenwood, GA | Technical/engineering facilities | Lease | ||
Fredericksburg, VA | Warehouse and technical/engineering facilities | Lease | ||
Los Angeles, CA | Office and studio/production facilities | Lease | ||
Irving, TX | Office and engineering facilities/call center | Lease | ||
San Francisco, CA | Office and engineering facilities | Lease | ||
We also lease other small facilities that we use as offices for our advertising sales personnel, studios and warehouse and maintenance space. These facilities are not material to our business or operations.
In addition, we lease or license space at approximately 560 locations for use in connection with the terrestrial repeater networks that support our satellite radio services. In general, these leases and licenses are for space on building rooftops and communications towers. None of these individual locations are material to our business or operations.
ITEM 3. | LEGAL PROCEEDINGS |
In the ordinary course of business, we are a defendant or party to various claims and lawsuits, including the following discussed below.
SoundExchange Royalty Claims. In August 2013, SoundExchange, Inc. filed a complaint in the United States District Court for the District of Columbia (“SoundExchange I”) alleging that we underpaid royalties for statutory licenses in violation of the regulations established by the Copyright Royalty Board for the 2007-2012 period. SoundExchange principally alleges that we improperly reduced our gross revenues subject to royalties by deducting revenue attributable to pre-1972 recordings and Premier package revenue that is not “separately charged” as required by the regulations. We believe that we properly applied the gross revenue exclusions contained in the regulations established by the Copyright Royalty Board. SoundExchange is seeking compensatory damages of not less than $50 million and up to $100 million or more, payment of late fees and interest, and attorneys’ fees and costs.
In August 2014, the United States District Court for the District of Columbia, in response to our motion to dismiss the complaint, stayed the case on the grounds that it properly should be pursued in the first instance before the Copyright Royalty Board rather than the District Court. In its opinion, the District Court concluded that the gross revenue exclusions in the regulations established by the Copyright Royalty Board for the 2007-2012 period were ambiguous and did not, on their face, make clear whether our royalty calculation approaches were permissible under the regulations. In December 2014, SoundExchange filed a petition with the Copyright Royalty Board requesting an order interpreting the applicable regulations.
19
On September 11, 2017, the Copyright Royalty Board issued a ruling concluding that we correctly interpreted the revenue exclusions applicable to pre-1972 recordings. Given the limitations on its jurisdiction, the Copyright Royalty Board deferred to further proceedings in the District Court the question of whether we properly applied those pre-1972 revenue exclusions when calculating our royalty payments. The Judges also concluded that we improperly claimed a revenue exclusion based on our Premier package upcharge, because, in the Judges’ view, the portion of the package that contained programming that did not include sound recordings was not offered for a “separate charge.” We have filed a notice of appeal of this ruling to the United States Court of Appeals for the District of Columbia Circuit. We expect that the ruling by the Copyright Royalty Board in this matter will be transmitted back to the District Court for further proceedings, such as adjudication of claims relating to damages and defenses, although those proceedings may be delayed pending the appeal of the Judges’ interpretive decision. We believe we have substantial defenses to SoundExchange claims that can be asserted in the District Court, and will continue to defend this action vigorously.
This matter is captioned SoundExchange, Inc. v. Sirius XM Radio, Inc., No.13-cv-1290-RJL (D.D.C.); the Copyright Royalty Board referral was adjudicated under the caption Determination of Rates and Terms for Preexisting Subscription Services and Satellite Digital Audio Radio Services, United States Copyright Royalty Board, No. 2006-1 CRB DSTRA. Information concerning SoundExchange I is publicly available in filings under the docket numbers.
On December 12, 2017, SoundExchange filed a second action against us under the Copyright Act in the United States District Court for the District of Columbia (“SoundExchange II”). This action includes claims that SoundExchange has also attempted to add to the SoundExchange I litigation through a proposed amended complaint. SoundExchange alleges that we have systematically underpaid it for our statutory license by impermissibly understating our gross revenues, as defined in the applicable regulations and, in certain cases, understating the compensable performances of recordings on our internet radio service. Specifically, the complaint in SoundExchange II alleges that: from at least 2013 through the present, we improperly excluded from gross revenues a portion of our revenues received from our Premier and All Access packages attributable to premium channels; at least between 2010 and 2012, we improperly excluded late fees received from subscribers from the calculation of gross revenues; at least between 2010 and 2012, we improperly excluded certain credits, adjustments and bad debt for which the underlying revenues had never been included in the first instance; at least between 2010 and 2012, we improperly deducted from gross revenues certain transaction fees and other expenses - for instance, credit card processing fees, collection fees and sales and use taxes - that are not permitted by the Copyright Royalty Board regulations; at least between 2010 and 2012, we improperly deducted amounts attributable to performances of recordings claimed to be directly licensed on both our satellite radio and internet radio services, even though they were not; at least between 2010 and 2012, we improperly excluded from royalty calculations performances of recordings less than thirty seconds long under the provisions of the Copyright Royalty Board regulations and the Webcaster Settlement Agreement; from 2010 through 2012, we excluded from royalty calculations performances of songs on our internet radio services that we claimed we were unable to identify; we owe associated late fees for the previously identified underpayments under the applicable Copyright Royalty Board regulations; and we have underpaid SoundExchange by an amount exceeding 10% of the royalty payment and we are therefore obligated to pay the reasonable costs of an audit. We believe that we properly applied in all material respects the regulations established by the Copyright Royalty Board. SoundExchange is seeking compensatory damages in an amount to be determined at trial from the alleged underpayments, unspecified late fees and penalties pursuant to the Copyright Royalty Board’s regulations and the Webcaster Settlement Agreement and costs, including reasonable attorney fees and expenses.
This matter is titled SoundExchange, Inc. v. Sirius XM Radio, Inc., No.17-cv-02666-RJL (D.D.C.). Information concerning SoundExchange II is publicly available in filings under the docket number.
As of December 31, 2017, we concluded a loss, in excess of our recorded liabilities, was considered remote at this time in connection with SoundExchange I or SoundExchange II. The assumptions underlying our conclusions may change from time to time and the actual loss may vary from the amounts recorded.
Telephone Consumer Protection Act Suits. On March 13, 2017, Thomas Buchanan, individually and on behalf of all others similarly situated, filed a class action complaint against us in the United States District Court for the Northern District of Texas, Dallas Division. The plaintiff in this action alleges that we violated the Telephone Consumer Protection Act of 1991 (the “TCPA”) by, among other things, making telephone solicitations to persons on the National Do-Not-Call registry, a database established to allow consumers to exclude themselves from telemarketing calls unless they consent to receive the calls in a signed, written agreement, and making calls to consumers in violation of our internal Do-Not-Call registry. The plaintiff is seeking various forms of relief, including statutory damages of $500 for each violation of the TCPA or, in the alternative, treble damages of up to $1,500 for each knowing and willful violation of the TCPA and a permanent injunction prohibiting us from making, or having made, any calls to land lines that are listed on the National Do-Not-Call registry or our internal Do-Not-Call registry. We believe we have substantial defenses to the claims asserted in this action, and we intend to defend this action vigorously.
20
Other Matters. In the ordinary course of business, we are a defendant in various other lawsuits and arbitration proceedings, including derivative actions; actions filed by subscribers, both on behalf of themselves and on a class action basis; former employees; parties to contracts or leases; and owners of patents, trademarks, copyrights or other intellectual property. None of these other matters, in our opinion, is likely to have a material adverse effect on our business, financial condition or results of operations.
ITEM 4. | MINE SAFETY DISCLOSURES |
Not applicable.
21
PART II
ITEM 5. | MARKET FOR REGISTRANT'S COMMON EQUITY, RELATED STOCKHOLDER MATTERS AND ISSUER PURCHASES OF EQUITY SECURITIES |
Our common stock is traded on the NASDAQ Global Select Market under the symbol “SIRI.” The following table sets forth the high and low per share sales price for our common stock, as reported by NASDAQ, and the quarterly cash dividends declared per share of common stock for the periods indicated below:
High | Low | Cash Dividends Declared | |||||||||
Year Ended December 31, 2016 | |||||||||||
First Quarter | $ | 4.04 | $ | 3.29 | $ | — | |||||
Second Quarter | $ | 4.05 | $ | 3.74 | $ | — | |||||
Third Quarter | $ | 4.44 | $ | 3.92 | $ | — | |||||
Fourth Quarter | $ | 4.65 | $ | 4.05 | $ | 0.010 | |||||
Year Ended December 31, 2017 | |||||||||||
First Quarter | $ | 5.53 | $ | 4.40 | $ | 0.010 | |||||
Second Quarter | $ | 5.50 | $ | 4.73 | $ | 0.010 | |||||
Third Quarter | $ | 5.89 | $ | 5.32 | $ | 0.010 | |||||
Fourth Quarter | $ | 5.79 | $ | 5.20 | $ | 0.011 | |||||
On January 29, 2018, the closing sales price of our common stock on the NASDAQ Global Select Market was $5.98 per share. On January 29, 2018, there were approximately 8,282 record holders of our common stock.
Our board of directors expects to declare regular quarterly dividends in an aggregate annual amount of $0.044 per share of common stock.
On January 23, 2018, our board of directors also declared a quarterly dividend on our common stock in the amount of $0.011 per share of common stock payable on February 28, 2018 to stockholders of record as of the close of business on February 7, 2018.
Issuer Purchases of Equity Securities
On January 23, 2018, our board of directors approved an additional $2.0 billion for repurchase of our common stock. The new approval increases the amount of common stock that we have been authorized to repurchase to an aggregate of $12.0 billion. Our board of directors did not establish an end date for this stock repurchase program. Shares of common stock may be purchased from time to time on the open market, pursuant to pre-set trading plans meeting the requirements of Rule 10b5-1 under the Exchange Act, in privately negotiated transactions, including transactions with Liberty Media and its affiliates, or otherwise. As of December 31, 2017, our cumulative repurchases since December 2012 under our stock repurchase program totaled 2.5 billion shares for approximately $9.4 billion, and approximately $0.6 billion remained available under our existing $10.0 billion stock repurchase program. The size and timing of our repurchases will be based on a number of factors, including price and business and market conditions.
The following table provides information about our purchases of equity securities registered pursuant to Section 12 of the Exchange Act during the quarter ended December 31, 2017:
Period | Total Number of Shares Purchased | Average Price Paid Per Share (a) | Total Number of Shares Purchased as Part of Publicly Announced Plans or Programs | Approximate Dollar Value of Shares that May Yet Be Purchased Under the Plans or Programs (a) | ||||||||||
October 1, 2017 - October 31, 2017 | 12,777,558 | $ | 5.58 | 12,777,558 | $ | 967,721,497 | ||||||||
November 1, 2017 - November 30, 2017 | 34,750,000 | $ | 5.41 | 34,750,000 | $ | 779,818,997 | ||||||||
December 1, 2017 - December 31, 2017 | 28,675,299 | $ | 5.47 | 28,675,299 | $ | 622,880,009 | ||||||||
Total | 76,202,857 | $ | 5.46 | 76,202,857 | ||||||||||
(a) | These amounts include fees and commissions associated with the shares repurchased. All of these repurchases were made pursuant to our share repurchase program. |
22
COMPARISON OF CUMULATIVE TOTAL RETURNS
Set forth below is a graph comparing the cumulative performance of our common stock with the Standard & Poor's Composite-500 Stock Index, or the S&P 500, and the NASDAQ Telecommunications Index from December 31, 2012 to December 31, 2017. The graph assumes that $100 was invested on December 31, 2012 in each of our common stock, the S&P 500 and the NASDAQ Telecommunications Index. In November 2016 we paid our first quarterly dividend. Our board of directors expects to declare regular quarterly dividends.
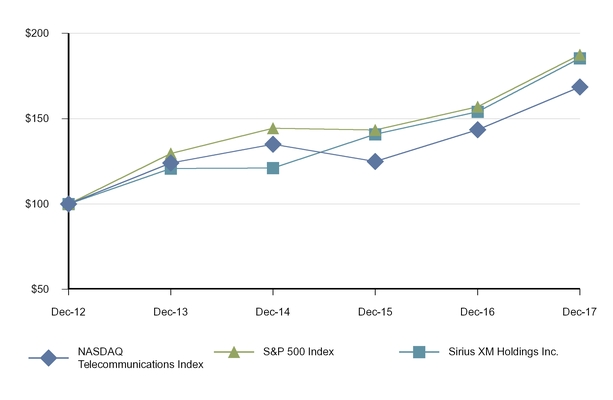
Stockholder Return Performance Table
NASDAQ Telecommunications Index | S&P 500 Index | Sirius XM Holdings Inc. | |||||||||
December 31, 2012 | $ | 100.00 | $ | 100.00 | $ | 100.00 | |||||
December 31, 2013 | $ | 124.02 | $ | 129.60 | $ | 120.76 | |||||
December 31, 2014 | $ | 135.07 | $ | 144.36 | $ | 121.11 | |||||
December 31, 2015 | $ | 124.94 | $ | 143.31 | $ | 140.83 | |||||
December 31, 2016 | $ | 143.52 | $ | 156.98 | $ | 153.98 | |||||
December 31, 2017 | $ | 168.54 | $ | 187.47 | $ | 185.47 | |||||
23
Equity Compensation Plan Information
Plan Category (shares in thousands) | Column (a) Number of Securities to be Issued upon Exercise of Outstanding Options, Warrants and Rights(1) | Column (b) Weighted-Average Exercise Price of Outstanding Options, Warrants and Rights(2) | Column (c) Number of Securities Remaining Available for Future Issuance under Equity Compensation Plans (excluding Securities Reflected in Column (a)) | |||||||
Equity compensation plans approved by security holders | 311,780 | $ | 3.76 | 171,388 | ||||||
Equity compensation plans not approved by security holders | — | — | — | |||||||
Total | 311,780 | $ | 3.76 | 171,388 | ||||||
__________
(1) | In addition to shares issuable upon exercise of stock options, amount also includes approximately 31,323 shares underlying restricted stock units, including performance-based restricted stock units (“PRSUs”) and dividend equivalents thereon. The number of shares to be issued in respect of PRSUs and dividend equivalents thereon have been calculated based on the assumption that the maximum levels of performance applicable to the PRSUs will be achieved. |
(2) | The weighted-average exercise price of outstanding options, warrants and rights relates solely to stock options, which are the only currently outstanding exercisable security. |
ITEM 6. SELECTED FINANCIAL DATA
The operating and balance sheet data included in the following selected financial data has been derived from our audited consolidated financial statements. This selected financial data should be read in conjunction with the audited Consolidated Financial Statements and related notes thereto included in Item 8 of this Annual Report on Form 10-K and “Management's Discussion and Analysis of Financial Condition and Results of Operations” included in Item 7 of this Annual Report on Form 10-K.
As of and for the Years Ended December 31, | |||||||||||||||||||
(in thousands, except per share data) | 2017 | 2016 (1) | 2015 | 2014 | 2013 (2) | ||||||||||||||
Statements of Comprehensive Income Data: | |||||||||||||||||||
Total revenue | $ | 5,425,129 | $ | 5,017,220 | $ | 4,570,058 | $ | 4,181,095 | $ | 3,799,095 | |||||||||
Net income | $ | 647,908 | $ | 745,933 | $ | 509,724 | $ | 493,241 | $ | 377,215 | |||||||||
Net income per share - basic (3) | $ | 0.14 | $ | 0.15 | $ | 0.09 | $ | 0.09 | $ | 0.06 | |||||||||
Net income per share - diluted (3) | $ | 0.14 | $ | 0.15 | $ | 0.09 | $ | 0.08 | $ | 0.06 | |||||||||
Weighted average common shares outstanding - basic | 4,637,553 | 4,917,050 | 5,375,707 | 5,788,944 | 6,227,646 | ||||||||||||||
Weighted average common shares outstanding - diluted | 4,723,535 | 4,964,728 | 5,435,166 | 5,862,020 | 6,384,791 | ||||||||||||||
Cash dividends declared per share | $ | 0.041 | $ | 0.010 | $ | — | $ | — | $ | — | |||||||||
Balance Sheet Data: | |||||||||||||||||||
Cash and cash equivalents | $ | 69,022 | $ | 213,939 | $ | 111,838 | $ | 147,724 | $ | 134,805 | |||||||||
Restricted investments | $ | 10,352 | $ | 9,888 | $ | 9,888 | $ | 5,922 | $ | 5,718 | |||||||||
Total assets (4) | $ | 8,329,374 | $ | 8,003,595 | $ | 8,046,662 | $ | 8,369,065 | $ | 8,826,959 | |||||||||
Long-term debt, net of current portion (4) | $ | 6,741,243 | $ | 5,842,764 | $ | 5,443,614 | $ | 4,487,419 | $ | 3,088,701 | |||||||||
Stockholders' (deficit) equity | $ | (1,523,874 | ) | $ | (792,015 | ) | $ | (166,491 | ) | $ | 1,309,837 | $ | 2,745,742 | ||||||
_______________________
(1) | For the year ended December 31, 2016, we recorded $293,896 as an increase to our Deferred tax assets and decrease to our Accumulated deficit as a result of the adoption of Accounting Standards Update 2016-09, Compensation-Stock Compensation (Topic 718). |
(2) | The selected financial data for 2013 includes the balances and approximately two months of activity related to the acquisition of the connected vehicle business of Agero, Inc. in November 2013. |
(3) | The 2017 net income per basic and diluted share includes the impact of $184,599 in income tax expense, or a decrease of approximately $0.04 per share, recorded in the fourth quarter of 2017 due to the reduction in our net deferred tax asset balance as a result of the Tax Cut and Jobs Act signed into law on December 22, 2017. For additional information refer to Note 16 to our consolidated financial statements in Item 8 of this Annual Report on Form 10-K. |
24
(4) | The 2013 – 2015 balances reflect the adoption of Accounting Standards Update 2015-03, Interest-Imputation of Interest (Subtopic 835-30): Simplifying the Presentation of Debt Issuance Costs, and Accounting Standards Update 2015-15, Presentation and Subsequent Measurement of Debt Issuance Costs Associated with Line-of-Credit Agreements. As a result of our adoption of these ASUs, Total Assets was reduced by $7,155, $6,444 and $17,821 for the years ended December 31, 2015, 2014 and 2013, respectively, and Long-term debt, net of current portion, was reduced by $7,155, $6,444 and $5,120 for the years ended December 31, 2015, 2014 and 2013, respectively. |
25
ITEM 7. | MANAGEMENT’S DISCUSSION AND ANALYSIS OF FINANCIAL CONDITION AND RESULTS OF OPERATIONS |
This Annual Report on Form 10-K contains forward-looking statements within the meaning of the Private Securities Litigation Reform Act of 1995. Actual results and the timing of events could differ materially from those projected in forward-looking statements due to a number of factors, including those described under “Item 1A - Risk Factors” and elsewhere in this Annual Report on Form 10-K. See “Special Note About Forward-Looking Statements.”
(All amounts referenced in this Item 7 are in thousands, except per subscriber and per installation amounts, unless otherwise stated.)
The following discussion and analysis of our financial condition and results of operations should be read in conjunction with our audited consolidated financial statements and related notes included elsewhere in this Annual Report on Form 10-K.
Executive Summary
We transmit music, sports, entertainment, comedy, talk, news, traffic and weather channels, as well as infotainment services, in the United States on a subscription fee basis through our two proprietary satellite radio systems. Subscribers can also receive music and other channels, plus features such as SiriusXM On Demand, over our Internet radio service, including through applications for mobile devices, home devices and other consumer electronic equipment. We also provide connected vehicle services. Our connected vehicle services are designed to enhance the safety, security and driving experience for vehicle operators while providing marketing and operational benefits to automakers and their dealers.
We have agreements with every major automaker (“OEMs”) to offer satellite radio in their vehicles, through which we acquire the majority of our subscribers. We also acquire subscribers through marketing to owners and lessees of previously owned vehicles that include factory-installed satellite radios that are not currently subscribing to our services. Our satellite radios are primarily distributed through automakers; retailers; and our website. Satellite radio services are also offered to customers of certain rental car companies.
As of December 31, 2017, we had approximately 32.7 million subscribers of which approximately 27.5 million were self-pay subscribers and approximately 5.2 million were paid promotional subscribers. Our subscriber totals include subscribers under our regular pricing plans; discounted pricing plans; subscribers that have prepaid, including payments either made or due from automakers for subscriptions included in the sale or lease price of a vehicle; subscribers to our Internet services who do not also have satellite radio subscriptions; and certain subscribers to our weather, traffic, and data services who do not also have satellite radio subscriptions. Subscribers and subscription related revenues and expenses associated with the Sirius XM Canada service, which had approximately 2.8 million subscribers as of December 31, 2017, and connected vehicle services are not included in our subscriber count or subscriber-based operating metrics.
Our primary source of revenue is subscription fees, with most of our customers subscribing to annual, semi-annual, quarterly or monthly plans. We offer discounts for prepaid, longer term subscription plans, as well as a multiple subscription discount. We also derive revenue from activation and other fees, the sale of advertising on select non-music channels, the direct sale of satellite radios and accessories, and other ancillary services, such as our weather, traffic and data services. We provide traffic services to approximately 7.5 million vehicles.
In certain cases, a subscription to our radio services is included in the sale or lease price of new vehicles or previously owned vehicles. The length of these subscriptions varies but is typically three to twelve months. We receive payments for these subscriptions from certain automakers. We also reimburse various automakers for certain costs associated with satellite radios installed in new vehicles and pay revenue share to various automakers.
As of December 31, 2017, Liberty Media beneficially owned, directly and indirectly, approximately 70% of the outstanding shares of our common stock. As a result, we are a “controlled company” for the purposes of the NASDAQ corporate governance requirements.
Recent Transactions
During the year ended December 31, 2017, we entered into several strategic transactions.
Acquisition of Automatic Labs. On April 18, 2017, Sirius XM acquired Automatic Labs Inc. (“Automatic”), a connected vehicle device and mobile application company, for an aggregate purchase price of $107,736, net of cash and restricted cash acquired.
26
Recapitalization of Sirius XM Canada. On May 25, 2017, Sirius XM completed a recapitalization (the “Transaction”) of Sirius XM Canada Holdings Inc. (“Sirius XM Canada”), which is now a privately held corporation.
Following the Transaction, Sirius XM holds a 70% equity interest and 33% voting interest in Sirius XM Canada, with the remainder of the voting power and equity interests held by two of Sirius XM Canada’s previous shareholders. The total consideration from Sirius XM to Sirius XM Canada, excluding transaction costs, during the year ended December 31, 2017 was $308,526, which included $129,676 in cash and we issued 35,000 shares of our common stock with an aggregate value of $178,850 to the holders of the shares of Sirius XM Canada acquired in the Transaction. Sirius XM received common stock, non-voting common stock and preferred stock of Sirius XM Canada. We own 590,950 shares of preferred stock of Sirius XM Canada, which has a liquidation preference of one Canadian dollar per share. Future dividends on the common stock of Sirius XM Canada are expected to be declared on a 6.0% annual basis.
In connection with the Transaction, Sirius XM also made a contribution in the form of a loan to Sirius XM Canada in the aggregate amount of $130,794. The loan is denominated in Canadian dollars and is considered a long-term investment with any unrealized gains or losses reported within Accumulated other comprehensive (loss) income. The loan has a term of fifteen years, bears interest at a rate of 7.62% per annum and includes customary covenants and events of default, including an event of default relating to Sirius XM Canada’s failure to maintain specified leverage ratios. The terms of the loan require Sirius XM Canada to prepay a portion of the outstanding principal amount of the loan within sixty days of the end of each fiscal year in an amount equal to any cash on hand in excess of C$10,000 at the last day of the financial year if all target dividends have been paid in full.
In connection with the Transaction, Sirius XM also entered into a Services Agreement and an Advisory Services Agreement with Sirius XM Canada. Each agreement has a thirty year term. Pursuant to the Services Agreement, Sirius XM Canada will pay Sirius XM 25% of its gross revenues on a monthly basis through December 31, 2021 and 30% of its gross revenues on a monthly basis thereafter. Pursuant to the Advisory Services Agreement, Sirius XM Canada will pay Sirius XM 5% of its gross revenues on a monthly basis. These agreements superseded and replaced the former agreements between Sirius XM Canada and its predecessors and Sirius XM.
Sirius XM Canada is accounted for as an equity method investment, and its results are not consolidated in our consolidated financial statements. Sirius XM Canada does not meet the requirements for consolidation as we do not have the ability to direct the most significant activities that impact Sirius XM Canada's economic performance.
Investment in Pandora Media, Inc. On September 22, 2017, Sirius XM completed a $480,000 investment in Pandora Media, Inc. (“Pandora”). Pursuant to an Investment Agreement with Pandora, Sirius XM purchased 480 shares of Pandora’s Series A Convertible Preferred Stock, par value $0.0001 per share (the “Series A Preferred Stock”), for an aggregate purchase price of $480,000. The Series A Preferred Stock, including accrued but unpaid dividends, represents a stake of approximately 19% of Pandora's currently outstanding common stock, and approximately a 16% interest on an as-converted basis. Pandora operates an internet-based music discovery platform, offering a personalized experience for listeners.
The Series A Preferred Stock is convertible at the option of the holders at any time into shares of common stock of Pandora (“Pandora Common Stock”) at an initial conversion price of $10.50 per share of Pandora Common Stock and an initial conversion rate of 95.2381 shares of Pandora Common Stock per share of Series A Preferred Stock, subject to certain customary anti-dilution adjustments. Holders of the Series A Preferred Stock are entitled to a cumulative dividend at the rate of 6.0% per annum, payable quarterly in arrears, if and when declared. Pandora has the option to pay dividends in cash when authorized by their Board and declared by Pandora or accumulate dividends in lieu of paying cash. Any conversion of Series A Preferred Stock may be settled by Pandora, at its option, in shares of Pandora Common Stock, cash or any combination thereof. However, unless and until Pandora’s stockholders have approved the issuance of greater than 19.99% of the outstanding Pandora Common Stock, the Series A Preferred Stock may not be converted into more than 19.99% of Pandora’s outstanding Pandora Common Stock as of June 9, 2017. The liquidation preference of the Series A Preferred Stock, including accrued dividends of $10,849, was $490,849 as of December 31, 2017.
The investment includes a mandatory redemption feature on any date from and after September 22, 2022 whereby Sirius XM, at its option, may require Pandora to purchase the Series A Preferred Stock at a price equal to 100% of the liquidation preference plus accrued but unpaid dividends for, at the election of Pandora, cash, shares of Pandora Common Stock or a combination thereof, and as such the investment qualifies as a debt security under Accounting Standards Codification (“ASC”) 320, Investments-Debt and Equity Securities. As the investment includes a conversion option, we have elected to account for this investment under the fair value option to reduce the accounting asymmetry that would otherwise arise when recognizing the changes in the fair value of available-for-sale investments. Under the fair value option, any gains (losses) associated with
27
the change in fair value will be recognized in Other income within our consolidated statements of comprehensive income. A $472 unrealized gain was recognized during the year ended December 31, 2017 as Other income in our consolidated statements of comprehensive income associated with this investment. The fair value of our investment including accrued dividends as of December 31, 2017 was $480,472 and is recorded as a related party long-term asset within our consolidated balance sheets. This investment does not meet the requirements for the equity method of accounting as it does not qualify as in-substance common stock.
We have appointed James E. Meyer, our Chief Executive Officer, David J. Frear, our Senior Executive Vice President and Chief Financial Officer, and Gregory B. Maffei, the Chairman of our Board of Directors, to Pandora's Board of Directors pursuant to our designation rights under the Investment Agreement. Mr. Maffei also serves as the Chairman of Pandora's Board of Directors.
Results of Operations
Set forth below are our results of operations for the year ended December 31, 2017 compared with the year ended December 31, 2016 and the year ended December 31, 2016 compared with the year ended December 31, 2015.
For the Years Ended December 31, | 2017 vs 2016 Change | 2016 vs 2015 Change | |||||||||||||||||||||||
2017 | 2016 | 2015 | Amount | % | Amount | % | |||||||||||||||||||
Revenue: | |||||||||||||||||||||||||
Subscriber revenue | $ | 4,472,522 | $ | 4,196,852 | $ | 3,824,793 | $ | 275,670 | 7 | % | $ | 372,059 | 10 | % | |||||||||||
Advertising revenue | 160,347 | 138,231 | 122,292 | 22,116 | 16 | % | 15,939 | 13 | % | ||||||||||||||||
Equipment revenue | 131,586 | 118,947 | 110,923 | 12,639 | 11 | % | 8,024 | 7 | % | ||||||||||||||||
Other revenue | 660,674 | 563,190 | 512,050 | 97,484 | 17 | % | 51,140 | 10 | % | ||||||||||||||||
Total revenue | 5,425,129 | 5,017,220 | 4,570,058 | 407,909 | 8 | % | 447,162 | 10 | % | ||||||||||||||||
Operating expenses: | |||||||||||||||||||||||||
Cost of services: | |||||||||||||||||||||||||
Revenue share and royalties | 1,210,323 | 1,108,515 | 1,034,832 | 101,808 | 9 | % | 73,683 | 7 | % | ||||||||||||||||
Programming and content | 388,033 | 353,779 | 293,091 | 34,254 | 10 | % | 60,688 | 21 | % | ||||||||||||||||
Customer service and billing | 385,431 | 387,131 | 377,908 | (1,700 | ) | — | % | 9,223 | 2 | % | |||||||||||||||
Satellite and transmission | 82,747 | 103,020 | 94,609 | (20,273 | ) | (20 | )% | 8,411 | 9 | % | |||||||||||||||
Cost of equipment | 35,448 | 40,882 | 42,724 | (5,434 | ) | (13 | )% | (1,842 | ) | (4 | )% | ||||||||||||||
Subscriber acquisition costs | 499,492 | 512,809 | 532,599 | (13,317 | ) | (3 | )% | (19,790 | ) | (4 | )% | ||||||||||||||
Sales and marketing | 437,739 | 386,724 | 354,189 | 51,015 | 13 | % | 32,535 | 9 | % | ||||||||||||||||
Engineering, design and development | 112,427 | 82,146 | 64,403 | 30,281 | 37 | % | 17,743 | 28 | % | ||||||||||||||||
General and administrative | 334,023 | 341,106 | 324,801 | (7,083 | ) | (2 | )% | 16,305 | 5 | % | |||||||||||||||
Depreciation and amortization | 298,602 | 268,979 | 272,214 | 29,623 | 11 | % | (3,235 | ) | (1 | )% | |||||||||||||||
Total operating expenses | 3,784,265 | 3,585,091 | 3,391,370 | 199,174 | 6 | % | 193,721 | 6 | % | ||||||||||||||||
Income from operations | 1,640,864 | 1,432,129 | 1,178,688 | 208,735 | 15 | % | 253,441 | 22 | % | ||||||||||||||||
Other income (expense): | |||||||||||||||||||||||||
Interest expense | (345,820 | ) | (331,225 | ) | (299,103 | ) | (14,595 | ) | (4 | )% | (32,122 | ) | (11 | )% | |||||||||||
Loss on extinguishment of debt | (43,679 | ) | (24,229 | ) | — | (19,450 | ) | (80 | )% | (24,229 | ) | — | % | ||||||||||||
Other income | 12,844 | 14,985 | 12,379 | (2,141 | ) | (14 | )% | 2,606 | 21 | % | |||||||||||||||
Total other expense | (376,655 | ) | (340,469 | ) | (286,724 | ) | (36,186 | ) | (11 | )% | (53,745 | ) | (19 | )% | |||||||||||
Income before income taxes | 1,264,209 | 1,091,660 | 891,964 | 172,549 | 16 | % | 199,696 | 22 | % | ||||||||||||||||
Income tax expense | (616,301 | ) | (345,727 | ) | (382,240 | ) | (270,574 | ) | (78 | )% | 36,513 | 10 | % | ||||||||||||
Net income | $ | 647,908 | $ | 745,933 | $ | 509,724 | $ | (98,025 | ) | (13 | )% | $ | 236,209 | 46 | % | ||||||||||
Total Revenue
Subscriber Revenue includes subscription, activation and other fees.
28
• | 2017 vs. 2016: For the years ended December 31, 2017 and 2016, subscriber revenue was $4,472,522 and $4,196,852, respectively, an increase of 7%, or $275,670. The increase was primarily attributable to a 4% increase in the daily weighted average number of subscribers as well as a 3% increase in average monthly revenue per subscriber resulting from certain rate increases. |
• | 2016 vs. 2015: For the years ended December 31, 2016 and 2015, subscriber revenue was $4,196,852 and $3,824,793, respectively, an increase of 10%, or $372,059. The increase was primarily attributable to an 8% increase in the daily weighted average number of subscribers as well as a 3% increase in average monthly revenue per subscriber resulting from certain rate increases. |
We expect subscriber revenues to increase based on the growth of our subscriber base, increases in certain of our subscription rates and the sale of additional services to subscribers.
Advertising Revenue includes the sale of advertising on certain non-music channels.
• | 2017 vs. 2016: For the years ended December 31, 2017 and 2016, advertising revenue was $160,347 and $138,231, respectively, an increase of 16%, or $22,116. The increase was primarily due to a greater number of advertising spots sold and transmitted as well as increases in rates charged per spot. |
• | 2016 vs. 2015: For the years ended December 31, 2016 and 2015, advertising revenue was $138,231 and $122,292, respectively, an increase of 13%, or $15,939. The increase was primarily due to a greater number of advertising spots sold and transmitted as well as increases in rates charged per spot. |
We expect our advertising revenue to continue to grow as more advertisers are attracted to our national platform and growing subscriber base and as we launch additional non-music channels.
Equipment Revenue includes revenue and royalties from the sale of satellite radios, components and accessories.
• | 2017 vs. 2016: For the years ended December 31, 2017 and 2016, equipment revenue was $131,586 and $118,947, respectively, an increase of 11%, or $12,639. The increase was driven by royalty revenue on certain satellite radio components starting in the second quarter of 2016 due to our transition to a new generation of chipsets and revenue from the sales of connected vehicle devices since the acquisition of Automatic, partially offset by lower revenue generated through satellite radio sales to distributors and consumers and lower OEM production. |
• | 2016 vs. 2015: For the years ended December 31, 2016 and 2015, equipment revenue was $118,947 and $110,923, respectively, an increase of 7%, or $8,024. The increase was driven by an increase in OEM production and an increase in royalty revenue on certain satellite radio components starting in the second quarter of 2016 due to our transition to a new generation of chipsets, partially offset by lower revenue generated through satellite radio sales to distributors and consumers. |
We expect equipment revenue to increase due to the increase in royalty revenues associated with our transition to a new generation of chipsets.
Other Revenue includes amounts earned from subscribers for the U.S. Music Royalty Fee, revenue from our connected vehicle business, our Canadian affiliate and ancillary revenues.
• | 2017 vs. 2016: For the years ended December 31, 2017 and 2016, other revenue was $660,674 and $563,190, respectively, an increase of 17%, or $97,484. The increase was primarily driven by higher revenue from Sirius XM Canada due to the new Services Agreement and Advisory Services Agreement entered into in the second quarter of 2017, additional revenues from the U.S. Music Royalty Fee due to an increase in the number of subscribers and subscribers paying at a higher rate and higher revenue generated from our connected vehicle services. |
• | 2016 vs. 2015: For the years ended December 31, 2016 and 2015, other revenue was $563,190 and $512,050, respectively, an increase of 10%, or $51,140. The increase was primarily driven by additional revenues from the U.S. Music Royalty Fee due to an increase in the number of subscribers and subscribers paying at a higher rate. These increases were offset by lower non-recurring engineering fees associated with our connected vehicle services, lower activation revenues from Sirius XM Canada and a change in accounting for a programming contract in the third quarter of 2015. |
Other revenue is expected to grow due to increases in U.S. Music Royalty fees as a result of rate and subscriber growth, and additional revenues from Sirius XM Canada due to the new Services Agreement and Advisory Services Agreement.
29
Operating Expenses
Revenue Share and Royalties include distribution and content provider revenue share, royalties for transmitting content and web streaming, and advertising revenue share.
• | 2017 vs. 2016: For the years ended December 31, 2017 and 2016, revenue share and royalties were $1,210,323 and $1,108,515, respectively, an increase of 9%, or $101,808, and increased as a percentage of total revenue. The increase was due to overall greater revenues subject to music royalties and revenue share to automakers and a 5% increase in the statutory royalty rate applicable to our use of post-1972 recordings, which increased from 10.5% in 2016 to 11% in 2017. We recorded $45,100 and $45,900 of expense related to music royalty legal settlements and related reserves, in 2017 and 2016, respectively. |
• | 2016 vs. 2015: For the years ended December 31, 2016 and 2015, revenue share and royalties were $1,108,515 and $1,034,832, respectively, an increase of 7%, or $73,683, but decreased as a percentage of total revenue. The increase was due to overall greater revenues subject to music royalties and revenue share to automakers, a 5% increase in the statutory royalty rate applicable to our use of post-1972 recordings, and $45,900 related to music royalty legal settlements and related reserves recorded in the fourth quarter of 2016. The increase was mitigated by $128,256 in expense recorded during the twelve months ended December 31, 2015 for a portion of the settlement of the Capitol Records LLC et al. v. Sirius XM Radio Inc. lawsuit related to our use of pre-1972 sound recordings. We recorded $39,808 in expense related to this settlement through the twelve months ended December 31, 2016. |
We expect our revenue share and royalty costs to increase as our revenues grow and as a result of the increase in the royalty rate payable for sound recordings contained in the recent decision of the Copyright Royalty Board (the “CRB”). On December 14, 2017, the CRB issued its determination regarding the post-1972 royalty rate payable by us under the statutory license covering the performance of sound recordings over our satellite radio service, and the making of ephemeral (server) copies in support of such performances, for the five-year period starting January 1, 2018 and ending on December 31, 2022. Under the terms of the CRB’s decision, we are required to pay a royalty of 15.5% of gross revenues, subject to exclusions and adjustments, for the five year period. The rate for 2017 was 11.0%.
Programming and Content includes costs to acquire, create, promote and produce content. We have entered into various agreements with third parties for music and non-music programming that require us to pay license fees and other amounts.
• | 2017 vs. 2016: For the years ended December 31, 2017 and 2016, programming and content expenses were $388,033 and $353,779, respectively, an increase of 10%, or $34,254, and increased as a percentage of total revenue. The increase was primarily due to the addition of video content rights, payment for which started during the third quarter of 2016, as well as talent and personnel-related costs. |
• | 2016 vs. 2015: For the years ended December 31, 2016 and 2015, programming and content expenses were $353,779 and $293,091, respectively, an increase of 21%, or $60,688, and increased as a percentage of total revenue. The increase was primarily due to renewed programming licenses as well as talent and personnel-related costs. |
We expect our programming and content expenses to increase as we expand our programming, through renewal or replacement of expiring agreements.
Customer Service and Billing includes costs associated with the operation and management of internal and third party customer service centers, and our subscriber management systems as well as billing and collection costs, transaction fees and bad debt expense.
• | 2017 vs. 2016: For the years ended December 31, 2017 and 2016, customer service and billing expenses were $385,431 and $387,131, respectively, a decrease of less than 1%, or $1,700, and decreased as a percentage of total revenue. The decrease was primarily due to a decline in call center agent rates and contact rates, partially offset by increased transaction fees based on a higher subscriber base. |
• | 2016 vs. 2015: For the years ended December 31, 2016 and 2015, customer service and billing expenses were $387,131 and $377,908, respectively, an increase of 2%, or $9,223, but decreased as a percentage of total revenue. The increase was primarily due to costs associated with a higher subscriber base driving increased bad debt expenses, transaction fees, and call center costs, partially offset by lower personnel-related costs and the classification of wireless transmission costs related to our connected vehicle services to Satellite and transmission expense in 2016. |
30
We expect our customer service and billing expenses to increase as our subscriber base grows.
Satellite and Transmission consists of costs associated with the operation and maintenance of our terrestrial repeater networks; satellites; satellite telemetry, tracking and control systems; satellite uplink facilities; studios; and delivery of our Internet streaming service.
• | 2017 vs. 2016: For the years ended December 31, 2017 and 2016, satellite and transmission expenses were $82,747 and $103,020, respectively, a decrease of 20%, or $20,273, and decreased as a percentage of total revenue. The decrease was driven by lower wireless costs associated with our connected vehicle services, and a reduction in terrestrial repeater costs as a result of the elimination of duplicative repeater sites; partially offset by increased Internet streaming costs. Satellite and transmission costs in 2016 included a loss on disposal of certain obsolete satellite parts of $12,912 in the second quarter of 2016. |
• | 2016 vs. 2015: For the years ended December 31, 2016 and 2015, satellite and transmission expenses were $103,020 and $94,609, respectively, an increase of 9%, or $8,411, but decreased as a percentage of total revenue. We recorded a loss on disposal of certain obsolete satellite parts of $12,912 in the second quarter of 2016 and a loss on disposal of certain obsolete terrestrial repeaters and related parts of $7,384 in the fourth quarter of 2015. Excluding the losses on disposal of these assets, the increase was driven by the inclusion of wireless transmission costs related to our connected vehicle services that were previously recorded to Customer service and billing expense in 2015, partially offset by lower web streaming costs from in-sourcing certain activities. |
We expect satellite and transmission expenses to grow as costs associated with our investment in Internet streaming services increase.
Cost of Equipment includes costs from the sale of satellite radios, components and accessories and provisions for inventory allowance attributable to products purchased for resale in our direct to consumer distribution channels.
• | 2017 vs. 2016: For the years ended December 31, 2017 and 2016, cost of equipment was $35,448 and $40,882, respectively, a decrease of 13%, or $5,434, and decreased as a percentage of equipment revenue. The decrease was primarily due to lower sales to distributors and consumers, partially offset by the incremental costs associated with the sale of connected vehicle devices since the acquisition of Automatic. |
• | 2016 vs. 2015: For the years ended December 31, 2016 and 2015, cost of equipment was $40,882 and $42,724, respectively, a decrease of 4%, or $1,842, and decreased as a percentage of equipment revenue. The decrease was primarily due to lower aftermarket and direct to consumer sales, partially offset by higher inventory reserves. |
We expect cost of equipment to fluctuate with changes in sales and inventory valuations.
Subscriber Acquisition Costs include hardware subsidies paid to radio manufacturers, distributors and automakers; subsidies paid for chipsets and certain other components used in manufacturing radios; device royalties for certain radios and chipsets; product warranty obligations; and freight. The majority of subscriber acquisition costs are incurred and expensed in advance of, or concurrent with, acquiring a subscriber. Subscriber acquisition costs do not include advertising costs, marketing, loyalty payments to distributors and dealers of satellite radios or revenue share payments to automakers and retailers of satellite radios.
• | 2017 vs. 2016: For the years ended December 31, 2017 and 2016, subscriber acquisition costs were $499,492 and $512,809, respectively, a decrease of 3%, or $13,317, and decreased as a percentage of total revenue. The decrease was driven by reductions to OEM hardware subsidy rates, lower subsidized costs related to the transition of chipsets, and a decrease in installations. |
• | 2016 vs. 2015: For the years ended December 31, 2016 and 2015, subscriber acquisition costs were $512,809 and $532,599, respectively, a decrease of 4%, or $19,790, and decreased as a percentage of total revenue. The decrease was driven by lower subsidized costs related to the transition of chipsets and reductions to OEM hardware subsidy rates, partially offset by higher radio installations. |
We expect subscriber acquisition costs to fluctuate with OEM installations and aftermarket volume; however, the subsidized chipsets cost is expected to decline as we transition to a new generation of chipsets. We intend to continue to offer subsidies and other incentives to acquire subscribers.
31
Sales and Marketing includes costs for marketing, advertising, media and production, including promotional events and sponsorships; cooperative marketing; and personnel. Marketing costs include expenses related to direct mail, outbound telemarketing and email communications.
• | 2017 vs. 2016: For the years ended December 31, 2017 and 2016, sales and marketing expenses were $437,739 and $386,724, respectively, an increase of 13%, or $51,015, and increased as a percentage of total revenue. The increase was primarily due to additional subscriber communications, retention programs and acquisition campaigns as well as higher personnel-related costs; partially offset by the timing of certain OEM marketing campaigns. |
• | 2016 vs. 2015: For the years ended December 31, 2016 and 2015, sales and marketing expenses were $386,724 and $354,189, respectively, an increase of 9%, or $32,535, but decreased as a percentage of total revenue. The increase was primarily due to additional subscriber communications, retention programs and acquisition campaigns as well as higher personnel-related costs. |
We anticipate that sales and marketing expenses will increase as we expand programs to retain our existing subscribers, win back former subscribers, and attract new subscribers.
Engineering, Design and Development consists primarily of compensation and related costs to develop chipsets and new products and services, including streaming and connected vehicle services, research and development for broadcast information systems and costs associated with the incorporation of our radios into new vehicles manufactured by automakers.
• | 2017 vs. 2016: For the years ended December 31, 2017 and 2016, engineering, design and development expenses were $112,427 and $82,146, respectively, an increase of 37%, or $30,281, and increased as a percentage of total revenue. The increase was driven by development of our connected vehicle services and additional costs associated with the development of our audio and video streaming products. |
• | 2016 vs. 2015: For the years ended December 31, 2016 and 2015, engineering, design and development expenses were $82,146 and $64,403, respectively, an increase of 28%, or $17,743, and increased as a percentage of total revenue. The increase was primarily driven by the inclusion of personnel-related costs from our connected vehicle services that were previously recorded in Sales and marketing and General and administrative expense in 2015, partially offset by lower research and development costs. |
We expect engineering, design and development expenses to increase in future periods as we continue to develop our infrastructure, products and services.
General and Administrative primarily consists of compensation and related costs for personnel and facilities, and include costs related to our finance, legal, human resources and information technologies departments.
• | 2017 vs. 2016: For the years ended December 31, 2017 and 2016, general and administrative expenses were $334,023 and $341,106, respectively, a decrease of 2%, or $7,083, and decreased as a percentage of total revenue. The decrease was primarily driven by lower legal costs, litigation reserves and consulting costs. The decrease was partially offset by higher personnel-related costs. |
• | 2016 vs. 2015: For the years ended December 31, 2016 and 2015, general and administrative expenses were $341,106 and $324,801, respectively, an increase of 5%, or $16,305, but decreased as a percentage of total revenue. The increase was primarily driven by consulting and legal costs. |
We expect our general and administrative expenses to increase to support the growth of our business.
Depreciation and Amortization represents the recognition in earnings of the acquisition cost of assets used in operations, including our satellite constellations, property, equipment and intangible assets, over their estimated service lives.
• | 2017 vs. 2016: For the years ended December 31, 2017 and 2016, depreciation and amortization expense was $298,602 and $268,979, respectively, an increase of 11%, or $29,623, and increased as a percentage of total revenue. Depreciation increased as a result of the acceleration of amortization related to a shorter useful life of certain software as well as additional assets placed in-service. |
• | 2016 vs. 2015: For the years ended December 31, 2016 and 2015, depreciation and amortization expense was $268,979 and $272,214, respectively, a decrease of 1%, or $3,235, and decreased as a percentage of total revenue. Depreciation decreased as certain satellites reached the end of their estimated service lives offset by additional assets placed in-service. |
32
Other Income (Expense)
Interest Expense, Net of Amounts Capitalized, includes interest on outstanding debt.
• | 2017 vs. 2016: For the years ended December 31, 2017 and 2016, interest expense was $345,820 and $331,225, respectively, an increase of 4%, or $14,595. The increase was primarily due to higher average debt during the year ended December 31, 2017 compared to the year ended December 31, 2016. |
• | 2016 vs. 2015: For the years ended December 31, 2016 and 2015, interest expense was $331,225 and $299,103, respectively, an increase of 11%, or $32,122. The increase was primarily due to higher average debt during the year ended December 31, 2016 compared to the year ended December 31, 2015. |
Loss on Extinguishment of Debt includes losses incurred as a result of the retirement of certain debt.
• | 2017 vs. 2016: For the years ended December 31, 2017 and 2016, loss on extinguishment of debt, net, was $43,679 and $24,229, respectively. During the year ended December 31, 2017, we recorded losses on extinguishment of debt due to the redemption of our 4.25% Senior Notes due 2020, 5.75% Senior Notes due 2021, and 5.25% Senior Secured Notes due 2022. During the year ended December 31, 2016, a loss was recorded on the redemption of our then outstanding 5.875% Senior Notes due 2020. |
• | 2016 vs. 2015: For the years ended December 31, 2016 and 2015, loss on extinguishment of debt, net, was $24,229 and $0, respectively. During the year ended December 31, 2016, a loss was recorded on the redemption of our then outstanding 5.875% Senior Notes due 2020. There was no loss on extinguishment of debt during the year ended December 31, 2015. |
Other Income primarily includes realized and unrealized gains and losses, interest income, and our share of the income or loss of Sirius XM Canada.
• | 2017 vs. 2016: For the years ended December 31, 2017 and 2016, other income was $12,844 and $14,985, respectively. Other income for the year ended December 31, 2017, included interest earned on our loan to Sirius XM Canada, and our share of Sirius XM Canada's net income, partially offset by transaction costs associated with our investment in Pandora. Other income for the year ended December 31, 2016 was primarily driven by our share of Sirius XM Canada’s net income and dividends received from Sirius XM Canada in excess of our investment. |
• | 2016 vs. 2015: For the years ended December 31, 2016 and 2015, other income was $14,985 and $12,379, respectively. Other income for the year ended December 31, 2016 was primarily driven by our share of Sirius XM Canada’s net income and dividends received from Sirius XM Canada in excess of our investment. Other income for the year ended December 31, 2015 was driven by dividends received from Sirius XM Canada in excess of our investment. |
Income Taxes
Income Tax Expense includes the change in our deferred tax assets, foreign withholding taxes and current federal and state tax expenses.
• | 2017 vs. 2016: For the years ended December 31, 2017 and 2016, income tax expense was $616,301 and $345,727, respectively, and our effective tax rate was 48.7% and 31.7%, respectively. On December 22, 2017, the U.S. government enacted comprehensive tax legislation commonly referred to as the Tax Cut and Jobs Act (the “Tax Act”). The Tax Act makes broad and complex changes to the U.S. tax code that affects 2017, including, but not limited to, accelerated depreciation that will allow for full expensing of qualified property. The Tax Act also establishes new tax laws that will affect 2018 and after, including a reduction in the U.S. federal corporate income tax rate from 35% to 21%. As a result of the reduction of the federal corporate income tax rate, we have revalued our net deferred tax asset, excluding after tax credits, as of December 31, 2017. Based on this revaluation, we have recorded a net tax expense of $184,599 to reduce our net deferred tax asset balance, which was recorded as additional income tax expense for the year ended December 31, 2017. Our effective tax rate increased by 14.6% to 48.7% primarily as a result of the revaluation of our net deferred tax asset. We have recorded provisional adjustments but we have not completed our accounting for income tax effects for certain elements of the Tax Act, principally due to the accelerated depreciation that will allow for full expensing of qualified property. For the years ended December 31, 2017 and 2016, we recorded a $21,700 and a $66,326 tax credit, respectively, under the Protecting Americans from Tax Hikes Act of 2015 related to research and development activities, which reduced our effective tax rate by 1.7% and 6.1%, respectively. |
33
• | 2016 vs. 2015: For the years ended December 31, 2016 and 2015, income tax expense was $345,727 and $382,240, respectively. Our annual effective tax rate for the year ended December 31, 2016 was 31.7%. In the fourth quarter of 2016, we recognized a $66,326 tax credit under the Protecting Americans from Tax Hikes Act of 2015 related to research and development activities, which reduced our effective tax rate by 6.1%. Our annual effective tax rate for the year ended December 31, 2015 was 42.9%, which was impacted by tax law changes in the District of Columbia and New York City. The tax law change in the District of Columbia will reduce our future taxes and use less of certain net operating losses in the future. The District of Columbia tax law change resulted in a $44,392 increase in our valuation allowance during the year ended December 31, 2015. The tax law change in New York City will increase certain net operating losses to be utilized in the future. The New York City tax law change resulted in a $14,831 increase in our deferred tax asset during the year ended December 31, 2015. |
As a result of the Tax Act and our tax planning strategies, we estimate our effective tax rate beginning in taxable year 2018 will be approximately 24.5%.
Recent Accounting Pronouncements
• | In March 2016, the Financial Accounting Standards Board (“FASB”) issued Accounting Standards Update (“ASU”) 2016-09, Compensation-Stock Compensation (Topic 718): Improvements to Employee Share-Based Payment Accounting. |
• | In January 2017, the FASB issued ASU 2017-04, Intangibles - Goodwill and Other (Topic 350). |
• | In May 2014, the FASB issued ASU 2014-09, Revenue from Contracts with Customers (Topic 606). The implementation will not have a significant impact to our Net income, or our key financial performance metrics, adjusted EBITDA and free cash flow. We expect the implementation will impact certain of our operating performance metrics, specifically a reduction in ARPU by approximately 23 cents and SAC, per installation, by approximately 31 cents. |
• | In February 2016, the FASB issued ASU 2016-02, Leases (Topic 842). |
For additional information regarding “Recent Accounting Pronouncements,” refer to Note 3 to our consolidated financial statements in Item 8 of this Annual Report on Form 10-K.
Key Financial and Operating Performance Metrics
In this section, we present certain financial performance measures some of which are not calculated and presented in accordance with generally accepted accounting principles in the United States (“Non-GAAP”), which include free cash flow and adjusted EBITDA. We also present certain operating performance measures, which include average monthly revenue per subscriber, or ARPU; customer service and billing expenses, per average subscriber; and subscriber acquisition cost, or SAC, per installation. Our adjusted EBITDA excludes the impact of share-based payment expense and certain purchase price accounting adjustments related to the merger of Sirius and XM (the “Merger”). Additionally, when applicable, our adjusted EBITDA metric excludes the effect of significant items that do not relate to the on-going performance of our business. We use these Non-GAAP financial and operating performance measures to manage our business, to set operational goals and as a basis for determining performance-based compensation for our employees. See accompanying glossary on pages 41 through 43 for more details and for the reconciliation to the most directly comparable GAAP measure (where applicable).
We believe these Non-GAAP financial and operating performance measures provide useful information to investors regarding our financial condition and results of operations. We believe investors find these Non-GAAP financial and operating performance measures useful in evaluating our core trends because they provide a direct view of our underlying contractual costs. We believe investors use our adjusted EBITDA to estimate our current enterprise value and to make investment decisions. We believe free cash flow provides useful supplemental information to investors regarding our cash available for future subscriber acquisition and capital expenditures, to repurchase or retire debt, to acquire other companies and to evaluate our ability to return capital to stockholders. By providing these Non-GAAP financial and operating performance measures, together with the reconciliations to the most directly comparable GAAP measure (where applicable), we believe we are enhancing investors' understanding of our business and our results of operations.
Our Non-GAAP financial measures should be viewed in addition to, and not as an alternative for or superior to, our reported results prepared in accordance with GAAP. In addition, our Non-GAAP financial measures may not be comparable to similarly-titled measures by other companies. Please refer to the glossary (pages 41 through 43) for a further discussion of
34
such Non-GAAP financial and operating performance measures and reconciliations to the most directly comparable GAAP measure (where applicable). Subscribers and subscription related revenues and expenses associated with our connected vehicle services and Sirius XM Canada are not included in our subscriber count or subscriber-based operating metrics.
Set forth below are our subscriber balances as of December 31, 2017 compared to December 31, 2016 and as of December 31, 2016 compared to December 31, 2015:
As of December 31, | 2017 vs 2016 Change | 2016 vs 2015 Change | ||||||||||||||||||
2017 | 2016 | 2015 | Amount | % | Amount | % | ||||||||||||||
Self-pay subscribers | 27,513 | 25,951 | 24,288 | 1,562 | 6 | % | 1,663 | 7 | % | |||||||||||
Paid promotional subscribers | 5,223 | 5,395 | 5,306 | (172 | ) | (3 | )% | 89 | 2 | % | ||||||||||
Ending subscribers | 32,736 | 31,346 | 29,594 | 1,390 | 4 | % | 1,752 | 6 | % | |||||||||||
The following table contains our Non-GAAP financial and operating performance measures which are based on our adjusted results of operations for the years ended December 31, 2017, 2016 and 2015:
For the Years Ended December 31, | 2017 vs 2016 Change | 2016 vs 2015 Change | |||||||||||||||||||||||
2017 | 2016 | 2015 | Amount | % | Amount | % | |||||||||||||||||||
Self-pay subscribers | 1,562 | 1,663 | 1,765 | (101 | ) | (6 | )% | (102 | ) | (6 | )% | ||||||||||||||
Paid promotional subscribers | (172 | ) | 89 | 517 | (261 | ) | (293 | )% | (428 | ) | (83 | )% | |||||||||||||
Net additions (a) | 1,390 | 1,752 | 2,283 | (362 | ) | (21 | )% | (531 | ) | (23 | )% | ||||||||||||||
Daily weighted average number of subscribers | 31,866 | 30,494 | 28,337 | 1,372 | 4 | % | 2,157 | 8 | % | ||||||||||||||||
Average self-pay monthly churn | 1.8 | % | 1.9 | % | 1.8 | % | (0.1 | )% | (5 | )% | 0.1 | % | 6 | % | |||||||||||
New vehicle consumer conversion rate | 40 | % | 39 | % | 40 | % | 1 | % | 3 | % | (1 | )% | (3 | )% | |||||||||||
ARPU | $ | 13.25 | $ | 12.91 | $ | 12.53 | $ | 0.34 | 3 | % | $ | 0.38 | 3 | % | |||||||||||
SAC, per installation | $ | 29.53 | $ | 30.61 | $ | 33.07 | $ | (1.08 | ) | (4 | )% | $ | (2.46 | ) | (7 | )% | |||||||||
Customer service and billing expenses, per average subscriber | $ | 0.94 | $ | 1.00 | $ | 1.01 | $ | (0.06 | ) | (6 | )% | $ | (0.01 | ) | (1 | )% | |||||||||
Adjusted EBITDA | $ | 2,115,886 | $ | 1,875,775 | $ | 1,657,617 | $ | 240,111 | 13 | % | $ | 218,158 | 13 | % | |||||||||||
Free cash flow | $ | 1,559,772 | $ | 1,509,113 | $ | 1,315,193 | $ | 50,659 | 3 | % | $ | 193,920 | 15 | % | |||||||||||
Diluted weighted average common shares outstanding (GAAP) | 4,723,535 | 4,964,728 | 5,435,166 | (241,193 | ) | (5 | )% | (470,438 | ) | (9 | )% | ||||||||||||||
(a) | Amounts may not sum as a result of rounding. |
Subscribers. At December 31, 2017, we had approximately 32.7 million subscribers, an increase of approximately 1.4 million subscribers, or 4%, from the approximately 31.3 million subscribers as of December 31, 2016. The increase in total subscribers was primarily due to growth in our self-pay subscriber base, which increased by approximately 1.6 million. The increase in self-pay subscribers was primarily driven by original and subsequent owner trial conversions and subscriber win back programs, partially offset by deactivations.
• | 2017 vs. 2016: For the years ended December 31, 2017 and 2016, net additions were 1.4 million and 1.8 million, respectively, a decrease of 21%, or 0.4 million. The decline in paid promotional net additions was due to paid promotional subscription ends outpacing paid promotional subscription starts as starts from automakers offering paid promotional subscriptions remained relatively flat. Self-pay net additions declined due to higher vehicle turnover of our subscriber base mitigated by growth in gross additions. |
• | 2016 vs. 2015: For the years ended December 31, 2016 and 2015, net additions were 1.8 million and 2.3 million, respectively, a decrease of 23%, or 0.5 million. The decline in paid promotional net additions was due to paid promotional subscription ends out-pacing paid promotional subscription starts as a result of lower shipments from automakers offering paid promotional subscriptions. Self-pay net additions declined due to higher vehicle turnover of our subscriber base partially mitigated by growth in gross additions. |
35
Average Self-pay Monthly Churn is derived by dividing the monthly average of self-pay deactivations for the period by the average number of self-pay subscribers for the period. (See accompanying glossary on pages 41 through 43 for more details.)
• | 2017 vs. 2016: For the years ended December 31, 2017 and 2016, our average self-pay monthly churn rate was 1.8% and 1.9%, respectively. The decrease was due to improvements in non-pay and voluntary churn. |
• | 2016 vs. 2015: For the years ended December 31, 2016 and 2015, our average self-pay monthly churn rate was 1.9% and 1.8%, respectively. The increase was due to an increase in vehicle-related, non-pay, and to a lesser extent voluntary churn. |
New Vehicle Consumer Conversion Rate is the percentage of owners and lessees of new vehicles that receive our service and convert to become self-paying subscribers after an initial promotional period. The metric excludes rental and fleet vehicles. (See accompanying glossary on pages 41 through 43 for more details).
• | 2017 vs. 2016: For the years ended December 31, 2017 and 2016, our new vehicle consumer conversion rate was 40% and 39%, respectively. The increase was driven by improvements in the conversion of paid promotional subscribers who were also existing self-pay subscribers. |
• | 2016 vs. 2015: For the years ended December 31, 2016 and 2015, our new vehicle consumer conversion rate was 39% and 40%, respectively. The decrease in conversion was primarily due to certain manual dialing inefficiencies introduced by our call center vendors as a precautionary response to the Federal Communications Commission’s July 2015 order relating to the Telephone Consumer Protection Act of 1991, increased vehicle penetration rate, and lower conversion of first-time buyers and lessees of satellite radio enabled cars. |
ARPU is derived from total earned subscriber revenue (excluding revenue derived from our connected vehicle services), net advertising revenue and other subscription-related revenue, divided by the number of months in the period, divided by the daily weighted average number of subscribers for the period. (See the accompanying glossary on pages 41 through 43 for more details.)
• | 2017 vs. 2016: For the years ended December 31, 2017 and 2016, ARPU was $13.25 and $12.91, respectively. The increase was driven primarily by increases in certain of our subscription rates in 2016, partially offset by growth in subscription discounts offered through customer acquisition and retention programs. |
• | 2016 vs. 2015: For the years ended December 31, 2016 and 2015, ARPU was $12.91 and $12.53, respectively. The increase was driven primarily by increases in certain of our subscription rates, partially offset by growth in subscription discounts offered through customer acquisition and retention programs. |
SAC, Per Installation, is derived from subscriber acquisition costs and margins from the sale of radios, components and accessories, divided by the number of satellite radio installations in new vehicles and shipments of aftermarket radios for the period. (See the accompanying glossary on pages 41 through 43 for more details.)
• | 2017 vs. 2016: For the years ended December 31, 2017 and 2016, SAC, per installation, was $29.53 and $30.61, respectively. The decrease was driven by reductions to OEM hardware subsidy rates as well as lower subsidized costs related to the transition of chipsets. |
• | 2016 vs. 2015: For the years ended December 31, 2016 and 2015, SAC, per installation, was $30.61 and $33.07, respectively. The decrease was driven by lower subsidized costs related to the transition of chipsets as well as lower OEM hardware subsidy rates. |
Customer Service and Billing Expenses, Per Average Subscriber, is derived from total customer service and billing expenses, excluding connected vehicle customer service and billing expenses and share-based payment expense, divided by the number of months in the period, divided by the daily weighted average number of subscribers for the period. (See the accompanying glossary on pages 41 through 43 for more details.)
• | 2017 vs. 2016: For the years ended December 31, 2017 and 2016, customer service and billing expenses, per average subscriber, were $0.94 and $1.00, respectively. The decrease was primarily related to lower call center costs due to lower contact rates and lower agent rates, partially offset by higher transaction fees. |
• | 2016 vs. 2015: For the years ended December 31, 2016 and 2015, customer service and billing expenses, per average subscriber, were $1.00 and $1.01, respectively. The decrease was primarily related to efficiencies achieved from call center process enhancements, partially offset by increased bad debt expense. |
36
Adjusted EBITDA. EBITDA is defined as net income before interest expense, income tax expense and depreciation and amortization. Adjusted EBITDA excludes the impact of other income, loss on extinguishment of debt, other non-cash charges, such as certain purchase price accounting adjustments, share-based payment expense, loss on disposal of assets, and legal settlements and reserves related to the historical use of sound recordings. (See the accompanying glossary on pages 41 through 43 for a reconciliation to GAAP and for more details.)
• | 2017 vs. 2016: For the years ended December 31, 2017 and 2016, adjusted EBITDA was $2,115,886 and $1,875,775, respectively, an increase of 13%, or $240,111. The increase was due to: a growth in revenues resulting from an increase in our subscriber base; an increase in certain of our subscription prices; an increase in Other revenue from higher revenue from Sirius XM Canada under the new Services Agreement and Advisory Services Agreement; additional amounts produced by the U.S. Music Royalty Fee; and lower general and administrative costs and subscriber acquisition costs. These favorable variances were partially offset by higher revenue share and royalty costs due to growth in our revenues and royalty rates, programming and content, sales and marketing and engineering, design and development costs. |
• | 2016 vs. 2015: For the years ended December 31, 2016 and 2015, adjusted EBITDA was $1,875,775 and $1,657,617, respectively, an increase of 13%, or $218,158. The increase was due to growth in revenues primarily as a result of the increase in our subscriber base and certain of our subscription rates and lower subscriber acquisition costs, partially offset by higher revenue share and royalties costs due to growth in our revenues and royalty rates, programming and content, sales and marketing, and general and administrative costs. |
Free Cash Flow includes cash provided by operations, net of additions to property and equipment, restricted and other investment activity, the return of capital from an investment in an unconsolidated entity and excludes the $210,000 pre-1972 sound recordings legal settlement payment made in 2015. (See the accompanying glossary on pages 41 through 43 for a reconciliation to GAAP and for more details.)
• | 2017 vs. 2016: For the years ended December 31, 2017 and 2016, free cash flow was $1,559,772 and $1,509,113, respectively, an increase of $50,659, or 3%. The increase was driven by higher net cash provided by operating activities resulting from improved operating performance, partially offset by an increase in additions to property and equipment resulting from new satellite construction. |
• | 2016 vs. 2015: For the years ended December 31, 2016 and 2015, free cash flow was $1,509,113 and $1,315,193, respectively, an increase of $193,920, or 15%. The increase was primarily driven by higher net cash provided by operating activities resulting from improved operating performance; partially offset by an increase in additions to property and equipment resulting primarily from new satellite construction. The $210,000 pre-1972 sound recordings legal settlement payment made in 2015 was excluded from free cash flow. |
Liquidity and Capital Resources
Cash Flows for the year ended December 31, 2017 compared with the year ended December 31, 2016 and the year ended December 31, 2016 compared with the year ended December 31, 2015.
The following table presents a summary of our cash flow activity for the periods set forth below:
For the Years Ended December 31, | |||||||||||||||||||
2017 | 2016 | 2015 | 2017 vs 2016 | 2016 vs 2015 | |||||||||||||||
Net cash provided by operating activities | $ | 1,855,589 | $ | 1,719,237 | $ | 1,244,051 | $ | 136,352 | $ | 475,186 | |||||||||
Net cash used in investing activities | (1,146,812 | ) | (210,124 | ) | (138,858 | ) | (936,688 | ) | (71,266 | ) | |||||||||
Net cash used in financing activities | (853,694 | ) | (1,407,012 | ) | (1,141,079 | ) | 553,318 | (265,933 | ) | ||||||||||
Net (decrease) increase in cash and cash equivalents | (144,917 | ) | 102,101 | (35,886 | ) | (247,018 | ) | 137,987 | |||||||||||
Cash and cash equivalents at beginning of period | 213,939 | 111,838 | 147,724 | 102,101 | (35,886 | ) | |||||||||||||
Cash and cash equivalents at end of period | $ | 69,022 | $ | 213,939 | $ | 111,838 | $ | (144,917 | ) | $ | 102,101 | ||||||||
Cash Flows Provided by Operating Activities
Cash flows provided by operating activities increased by $136,352 to $1,855,589 for the year ended December 31, 2017 from $1,719,237 for the year ended December 31, 2016. Cash flows provided by operating activities increased by $475,186 to $1,719,237 for the year ended December 31, 2016 from $1,244,051 for the year ended December 31, 2015.
Our largest source of cash provided by operating activities is generated by subscription and subscription-related revenues. We also generate cash from the sale of advertising on certain non-music channels and the sale of satellite radios,
37
components and accessories. Our primary uses of cash from operating activities include revenue share and royalty payments to distributors, programming and content providers, and payments to radio manufacturers, distributors and automakers. In addition, uses of cash from operating activities include payments to vendors to service, maintain and acquire subscribers, general corporate expenditures, and compensation and related costs.
Cash Flows Used in Investing Activities
Cash flows used in investing activities in the year ended December 31, 2017 were primarily due to our investments in Pandora and Sirius XM Canada of $612,465, a loan to Sirius XM Canada of $130,794, the acquisition of Automatic for $107,736 (net of cash and restricted cash acquired), and additional spending of $99,980 to construct replacement satellites, improve our terrestrial repeater network, and for capitalized software. In 2016, our cash flows used in investing activities were primarily due to additional spending of $43,300 to construct replacement satellites, improve our terrestrial repeater network and for capitalized software. In 2015, our cash flows used in investing activities also included an increase to our letters of credit issued for the benefit of lessors of certain of our office space.
Cash Flows Used in Financing Activities
Cash flows used in financing activities consists of the issuance and repayment of long-term debt, the purchase of common stock under our share repurchase program, the payment of cash dividends and taxes paid in lieu of shares issued for stock-based compensation. Proceeds from long-term debt have been used to fund our operations, construct and launch new satellites, invest in other infrastructure improvements and purchase shares of our common stock.
Cash flows used in financing activities in 2017 were primarily due to the redemption of $1,500,000 aggregate principal amount of then-outstanding notes, the purchase and retirement for $1,409,035 of shares of our common stock under our repurchase program, the payment of cash dividends of $190,242, and net repayments of $90,000 under the Credit Facility, partially offset by the issuance of $1,000,000 aggregate principal amount of 3.875% Senior Notes due 2022 and $1,500,000 aggregate principal amount of 5.00% Senior Notes due 2027. Cash flows used in financing activities in the year ended 2016 were primarily due to the purchase and retirement of shares of our common stock under our repurchase program for $1,673,518, the redemption of $650,000 of our then-outstanding 5.875% Senior Notes due 2020 and the payment of a cash dividend of $48,079, partially offset by the issuance of $1,000,000 aggregate principal amount of 5.375% Senior Notes due 2026 and $50,000 in net borrowings under the Credit Facility. Cash flows used in financing activities in 2015 were primarily due to the purchase and retirement of shares of our common stock under our repurchase program for $2,018,254 and $40,000 in net repayments of borrowings under the Credit Facility, partially offset by the issuance of $1,000,000 aggregate principal amount of 5.375% Senior Notes due 2025.
Future Liquidity and Capital Resource Requirements
Based upon our current business plans, we expect to fund operating expenses, capital expenditures, including the construction of replacement satellites, working capital requirements, legal settlements, interest payments, taxes and scheduled maturities of our debt with existing cash, cash flow from operations and borrowings under our Credit Facility. As of December 31, 2017, $1,450,000 was available for future borrowing under our Credit Facility. We believe that we have sufficient cash and cash equivalents as well as debt capacity to cover our estimated short-term and long-term funding needs, as well as fund stock repurchases, future dividend payments and strategic opportunities.
Our ability to meet our debt and other obligations depends on our future operating performance and on economic, financial, competitive and other factors. We continually review our operations for opportunities to adjust the timing of expenditures to ensure that sufficient resources are maintained.
We regularly evaluate our business plans and strategy. These evaluations often result in changes to our business plans and strategy, some of which may be material and significantly change our cash requirements. These changes in our business plans or strategy may include: the acquisition of unique or compelling programming; the development and introduction of new features or services; significant new or enhanced distribution arrangements; investments in infrastructure, such as satellites, equipment or radio spectrum; and acquisitions and investments, including acquisitions and investments that are not directly related to our satellite radio business.
38
Capital Return Program
As of December 31, 2017, our board of directors had authorized for repurchase an aggregate of $10,000,000 of our common stock. As of December 31, 2017, our cumulative repurchases since December 2012 under our stock repurchase program totaled 2,474,135 shares for $9,377,120, and $622,880 remained available under our stock repurchase program.
On January 23, 2018, our board of directors approved an additional $2,000,000 for repurchase of our common stock. The new approval increases the amount of common stock that we have been authorized to repurchase to an aggregate of $12,000,000. Shares of common stock may be purchased from time to time on the open market and in privately negotiated transactions, including in accelerated stock repurchase transactions and transactions with Liberty Media and its affiliates. We intend to fund the additional repurchases through a combination of cash on hand, cash generated by operations and future borrowings.
On January 23, 2018, our board of directors declared a quarterly dividend on our common stock in the amount of $0.011 per share of common stock payable on February 28, 2018 to stockholders of record as of the close of business on February 7, 2018. Our board of directors expects to declare regular quarterly dividends, in an aggregate annual amount of $0.044 per share of common stock.
Debt Covenants
The indentures governing Sirius XM's senior notes and the agreement governing the Credit Facility include restrictive covenants. As of December 31, 2017, we were in compliance with such covenants. For a discussion of our “Debt Covenants,” refer to Note 12 to our consolidated financial statements in Item 8 of this Annual Report on Form 10-K.
Off-Balance Sheet Arrangements
We do not have any significant off-balance sheet arrangements other than those disclosed in Note 15 to our consolidated financial statements in Item 8 of this Annual Report on Form 10-K that are reasonably likely to have a material effect on our financial condition, results of operations, liquidity, capital expenditures or capital resources.
Contractual Cash Commitments
For a discussion of our “Contractual Cash Commitments,” refer to Note 15 to our consolidated financial statements in Item 8 of this Annual Report on Form 10-K.
Related Party Transactions
For a discussion of “Related Party Transactions,” refer to Note 11 to our consolidated financial statements in Item 8 of this Annual Report on Form 10-K.
Critical Accounting Policies and Estimates
Our consolidated financial statements are prepared in accordance with GAAP, which requires management to make estimates and assumptions that affect the reported amounts of assets and liabilities at the date of the financial statements and the reported amounts of revenues and expenses during the periods. Accounting estimates require the use of significant management assumptions and judgments as to future events, and the effect of those events cannot be predicted with certainty. The accounting estimates will change as new events occur, more experience is acquired and more information is obtained. We evaluate and update our assumptions and estimates on an ongoing basis and use outside experts to assist in that evaluation when we deem necessary. We have identified all significant accounting policies in Note 3 to our consolidated financial statements in Item 8 of this Annual Report on Form 10-K.
Intangible Assets. Our intangible assets include goodwill, other indefinite-lived assets (our FCC licenses and trademarks) and definite-lived assets. Our annual impairment assessment of our goodwill and our indefinite-lived assets is performed as of the fourth quarter of each year. We also review our intangible assets for impairment whenever events or changes in circumstances indicate that the carrying amount of an asset is not recoverable. If an impairment exists, the impairment is measured as the amount by which the carrying amount of an intangible asset exceeds its implied fair value.
•Goodwill: We adopted ASU 2017-04, Intangibles - Goodwill and Other (Topic 350), during the fourth quarter of 2017. ASC 350 states that an entity should perform its annual or interim goodwill impairment test by comparing the fair value of a reporting unit with its carrying amount and recognize an impairment charge for the amount by which the carrying
39
amount exceeds the reporting unit’s fair value. Under the updated guidance, the requirements for any reporting unit with a zero or negative carrying amount to perform a qualitative assessment is eliminated.
•Indefinite-lived Assets: ASC 350-30-35, Intangibles - General Intangibles Other than Goodwill, provides for an option to first perform a qualitative assessment to determine whether it is more likely than not that an asset is impaired. If the qualitative assessment supports that it is more likely than not that the fair value of the asset exceeds its carrying value, a company is not required to perform a quantitative impairment test. If the qualitative assessment does not support the fair value of the asset exceeds its carrying value, then a quantitative assessment is performed.
•Definite-lived: We carry our definite-lived assets at cost less accumulated amortization.
Useful Life of Broadcast/Transmission System. Our satellite system includes the costs of our satellite construction, launch vehicles, launch insurance, capitalized interest, spare satellites, terrestrial repeater network and satellite uplink facilities. We monitor our satellites for impairment whenever events or changes in circumstances indicate that the carrying amount of the asset is not recoverable.
We operate two in-orbit Sirius satellites, FM-5 and FM-6, which launched in 2009 and 2013, respectively, and estimate they will operate effectively through the end of their depreciable lives in 2024 and 2028, respectively.
We operate three in-orbit XM satellites, XM-3, XM-4 and XM-5. We estimate that our XM-3 and XM-4 satellites launched in 2005 and 2006, respectively, will reach the end of their depreciable lives in 2020 and 2021, respectively. Our XM-5 satellite was launched in 2010, is used as an in-orbit spare for the Sirius and XM systems and is expected to reach the end of its depreciable life in 2025.
Our satellites have been designed to last fifteen-years. Our in-orbit satellites may experience component failures which could adversely affect their useful lives. We monitor the operating condition of our in-orbit satellites and if events or circumstances indicate that the depreciable lives of our in-orbit satellites have changed, we will modify the depreciable life accordingly. If we were to revise our estimates, our depreciation expense would change.
Income Taxes. Deferred income taxes are recognized for the tax consequences related to temporary differences between the carrying amount of assets and liabilities for financial reporting purposes and the amounts used for tax purposes, based on enacted tax laws and statutory tax rates applicable to the periods in which the differences are expected to affect taxable income.
We assess the recoverability of deferred tax assets at each reporting date and, where applicable, a valuation allowance is recognized when, based on the weight of all available evidence, it is considered more likely than not that all, or some portion, of the deferred tax assets will not be realized. Our assessment includes an analysis of whether deferred tax assets will be realized in the ordinary course of operations based on the available positive and negative evidence, including the scheduling of deferred tax liabilities and forecasted income from operations. The underlying assumptions we use in forecasting future taxable income require significant judgment. In the event that actual income from operations differs from forecasted amounts, or if we change our estimates of forecasted income from operations, we could record additional charges or reduce allowances in order to adjust the carrying value of deferred tax assets to their realizable amount. Such adjustments could be material to our consolidated financial statements.
As of December 31, 2017, we had a valuation allowance of $52,883 relating to deferred tax assets that are not more likely than not to be realized due to certain state net operating loss limitations and acquired net operating losses that we were not likely to be utilized.
ASC 740, Income Taxes, requires a company to first determine whether it is more likely than not that a tax position will be sustained based on its technical merits as of the reporting date, assuming that taxing authorities will examine the position and have full knowledge of all relevant information. A tax position that meets this more likely than not threshold is then measured and recognized at the largest amount of benefit that is greater than fifty percent likely to be realized upon effective settlement with a taxing authority. If the tax position is not more likely than not to be sustained, the gross amount of the unrecognized tax position will not be recorded in the financial statements but will be shown in tabular format within the uncertain income tax positions. Changes in recognition or measurement are reflected in the period in which the change in judgment occurs due to the following conditions: (1) the tax position is “more likely than not” to be sustained, (2) the tax position, amount, and/or timing is ultimately settled through negotiation or litigation, or (3) the statute of limitations for the tax position has expired. A number of years may elapse before an uncertain tax position is effectively settled or until there is a lapse in the applicable statute of limitations. We record interest and penalties related to uncertain tax positions in Income tax expense in our consolidated statements of comprehensive income. As of December 31, 2017, the gross liability for income taxes associated with uncertain tax positions was $334,254.
40
Glossary
Adjusted EBITDA - EBITDA is defined as net income before interest expense, income tax expense and depreciation and amortization. We adjust EBITDA to exclude the impact of other income as well as certain other charges discussed below. Adjusted EBITDA is a Non-GAAP financial measure that excludes (if applicable): (i) certain adjustments as a result of the purchase price accounting for the Merger, (ii) share-based payment expense and (iii) other significant operating expense (income) that do not relate to the on-going performance of our business. We believe adjusted EBITDA is a useful measure of the underlying trend of our operating performance, which provides useful information about our business apart from the costs associated with our capital structure and purchase price accounting. We believe investors find this Non-GAAP financial measure useful when analyzing our past operating performance with our current performance and comparing our operating performance to the performance of other communications, entertainment and media companies. We believe investors use adjusted EBITDA to estimate our current enterprise value and to make investment decisions. As a result of large capital investments in our satellite radio system, our results of operations reflect significant charges for depreciation expense. We believe the exclusion of share-based payment expense is useful as it is not directly related to the operational conditions of our business. We also believe the exclusion of the legal settlements and reserves related to the historical use of sound recordings, loss on extinguishment of debt and loss on disposal of assets, to the extent they occur during the period, is useful as they are significant expenses not incurred as part of our normal operations for the period.
Adjusted EBITDA has certain limitations in that it does not take into account the impact to our statements of comprehensive income of certain expenses, including share-based payment expense and certain purchase price accounting for the Merger. We endeavor to compensate for the limitations of the Non-GAAP measure presented by also providing the comparable GAAP measure with equal or greater prominence and descriptions of the reconciling items, including quantifying such items, to derive the Non-GAAP measure. Investors that wish to compare and evaluate our operating results after giving effect for these costs, should refer to net income as disclosed in our consolidated statements of comprehensive income. Since adjusted EBITDA is a Non-GAAP financial performance measure, our calculation of adjusted EBITDA may be susceptible to varying calculations; may not be comparable to other similarly titled measures of other companies; and should not be considered in isolation, as a substitute for, or superior to measures of financial performance prepared in accordance with GAAP. The reconciliation of net income to the adjusted EBITDA is calculated as follows:
For the Years Ended December 31, | |||||||||||
2017 | 2016 | 2015 | |||||||||
Net income: | $ | 647,908 | $ | 745,933 | $ | 509,724 | |||||
Add back items excluded from Adjusted EBITDA: | |||||||||||
Purchase price accounting adjustments: | |||||||||||
Revenues | 7,251 | 7,251 | 7,251 | ||||||||
Operating expenses | — | — | (1,394 | ) | |||||||
Sound recording legal settlements and reserves | 45,100 | 45,900 | 109,164 | ||||||||
Loss on disposal of assets | — | 12,912 | 7,384 | ||||||||
Share-based payment expense | 124,069 | 108,604 | 84,310 | ||||||||
Depreciation and amortization | 298,602 | 268,979 | 272,214 | ||||||||
Interest expense | 345,820 | 331,225 | 299,103 | ||||||||
Loss on extinguishment of debt | 43,679 | 24,229 | — | ||||||||
Other income | (12,844 | ) | (14,985 | ) | (12,379 | ) | |||||
Income tax expense | 616,301 | 345,727 | 382,240 | ||||||||
Adjusted EBITDA | $ | 2,115,886 | $ | 1,875,775 | $ | 1,657,617 | |||||
41
ARPU - is derived from total earned subscriber revenue, advertising revenue and other subscription-related revenue, excluding revenue associated with our connected vehicle services, divided by the number of months in the period, divided by the daily weighted average number of subscribers for the period. Other subscription-related revenue includes the U.S. Music Royalty Fee. ARPU is calculated as follows:
For the Years Ended December 31, | |||||||||||
2017 | 2016 | 2015 | |||||||||
Subscriber revenue, excluding connected vehicle services | $ | 4,388,676 | $ | 4,108,547 | $ | 3,726,340 | |||||
Add: advertising revenue | 160,347 | 138,231 | 122,292 | ||||||||
Add: other subscription-related revenue | 518,457 | 478,063 | 410,644 | ||||||||
$ | 5,067,480 | $ | 4,724,841 | $ | 4,259,276 | ||||||
Daily weighted average number of subscribers | 31,866 | 30,494 | 28,337 | ||||||||
ARPU | $ | 13.25 | $ | 12.91 | $ | 12.53 | |||||
Average self-pay monthly churn - is defined as the monthly average of self-pay deactivations for the period divided by the average number of self-pay subscribers for the period.
Customer service and billing expenses, per average subscriber - is derived from total customer service and billing expenses, excluding connected vehicle customer service and billing expenses and share-based payment expense, divided by the number of months in the period, divided by the daily weighted average number of subscribers for the period. We believe the exclusion of share-based payment expense in our calculation of customer service and billing expenses, per average subscriber, is useful as share-based payment expense is not directly related to the operational conditions that give rise to variations in the components of our customer service and billing expenses. Customer service and billing expenses, per average subscriber, is calculated as follows:
For the Years Ended December 31, | |||||||||||
2017 | 2016 | 2015 | |||||||||
Customer service and billing expenses, excluding connected vehicle services | $ | 365,005 | $ | 367,978 | $ | 346,789 | |||||
Less: share-based payment expense | (4,229 | ) | (3,735 | ) | (2,982 | ) | |||||
$ | 360,776 | $ | 364,243 | $ | 343,807 | ||||||
Daily weighted average number of subscribers | 31,866 | 30,494 | 28,337 | ||||||||
Customer service and billing expenses, per average subscriber | $ | 0.94 | $ | 1.00 | $ | 1.01 | |||||
42
Free cash flow - is derived from cash flow provided by operating activities, net of additions to property and equipment and restricted and other investment activity. Free cash flow is a metric that our management and board of directors use to evaluate the cash generated by our operations, net of capital expenditures and other investment activity. In a capital intensive business, with significant investments in satellites, we look at our operating cash flow, net of these investing cash outflows, to determine cash available for future subscriber acquisition and capital expenditures, to repurchase or retire debt, to acquire other companies and to evaluate our ability to return capital to stockholders. In 2015, we excluded from free cash flow certain items that do not relate to the on-going performance of our business, such as cash outflows for acquisitions, strategic investments and loans to related parties. We believe free cash flow is an indicator of the long-term financial stability of our business. Free cash flow, which is reconciled to “Net cash provided by operating activities,” is a Non-GAAP financial measure. This measure can be calculated by deducting amounts under the captions “Additions to property and equipment” and deducting or adding Restricted and other investment activity from “Net cash provided by operating activities” from the consolidated statements of cash flows which, in 2015, were adjusted for significant legal settlements. Free cash flow should be used in conjunction with other GAAP financial performance measures and may not be comparable to free cash flow measures presented by other companies. Free cash flow should be viewed as a supplemental measure rather than an alternative measure of cash flows from operating activities, as determined in accordance with GAAP. Free cash flow is limited and does not represent remaining cash flows available for discretionary expenditures due to the fact that the measure does not deduct the payments required for debt maturities. We believe free cash flow provides useful supplemental information to investors regarding our current cash flow, along with other GAAP measures (such as cash flows from operating and investing activities), to determine our financial condition, and to compare our operating performance to other communications, entertainment and media companies. Free cash flow is calculated as follows:
For the Years Ended December 31, | |||||||||||
2017 | 2016 | 2015 | |||||||||
Cash Flow information | |||||||||||
Net cash provided by operating activities | $ | 1,855,589 | $ | 1,719,237 | $ | 1,244,051 | |||||
Net cash used in investing activities | $ | (1,146,812 | ) | $ | (210,124 | ) | $ | (138,858 | ) | ||
Net cash used in financing activities | $ | (853,694 | ) | $ | (1,407,012 | ) | $ | (1,141,079 | ) | ||
Free Cash Flow | |||||||||||
Net cash provided by operating activities | $ | 1,855,589 | $ | 1,719,237 | $ | 1,244,051 | |||||
Additions to property and equipment | (287,970 | ) | (205,829 | ) | (134,892 | ) | |||||
Purchases of restricted and other investments | (7,847 | ) | (4,295 | ) | (3,966 | ) | |||||
Pre-1972 sound recordings legal settlement | — | — | 210,000 | ||||||||
Free cash flow | $ | 1,559,772 | $ | 1,509,113 | $ | 1,315,193 | |||||
New vehicle consumer conversion rate - is defined as the percentage of owners and lessees of new vehicles that receive our satellite radio service and convert to become self-paying subscribers after the initial promotion period. At the time satellite radio enabled vehicles are sold or leased, the owners or lessees generally receive trial subscriptions ranging from three to twelve months. We measure conversion rate three months after the period in which the promotional period ends. The metric excludes rental and fleet vehicles.
Subscriber acquisition cost, per installation - or SAC, per installation, is derived from subscriber acquisition costs and margins from the sale of radios and accessories (excluding connected vehicle services), divided by the number of satellite radio installations in new vehicles and shipments of aftermarket radios for the period. SAC, per installation, is calculated as follows:
For the Years Ended December 31, | |||||||||||
2017 | 2016 | 2015 | |||||||||
Subscriber acquisition costs, excluding connected vehicle services | $ | 499,492 | $ | 512,809 | $ | 532,599 | |||||
Less: margin from sales of radios and accessories, excluding connected vehicle services | (96,110 | ) | (78,065 | ) | (68,199 | ) | |||||
$ | 403,382 | $ | 434,744 | $ | 464,400 | ||||||
Installations | 13,662 | 14,203 | 14,041 | ||||||||
SAC, per installation | $ | 29.53 | $ | 30.61 | $ | 33.07 | |||||
43
ITEM 7A. | QUANTITATIVE AND QUALITATIVE DISCLOSURE ABOUT MARKET RISK |
As of December 31, 2017, we did not hold or issue any free-standing derivatives. We hold investments in money market funds and certificates of deposit. These securities are consistent with the objectives contained within our investment policy. The basic objectives of our investment policy are the preservation of capital, maintaining sufficient liquidity to meet operating requirements and maximizing yield.
As of December 31, 2017, we also held the following investments:
• | Pandora Media, Inc. ("Pandora") Series A Preferred Stock, which we have elected to account for under the fair value option. As of December 31, 2017, the fair value of this investment was $480.5 million which was based on a Black-Scholes option pricing model and an income approach - discounted cash flow analysis. Had the market price of Pandora's common stock been 10% lower as of December 31, 2017, the value of this investment would have been approximately $11.6 million lower. |
• | In connection with the recapitalization of Sirius XM Canada Holdings Inc. ("Sirius XM Canada") on May 25, 2017, we loaned Sirius XM Canada $130.8 million. The loan is denominated in Canadian dollars and is considered a long-term investment with any unrealized gains or losses reported within Accumulated other comprehensive (loss) income. The loan has a term of fifteen years, bears interest at a rate of 7.62% per annum and includes customary covenants and events of default, including an event of default relating to Sirius XM Canada’s failure to maintain specified leverage ratios. The carrying value of the loan as of December 31, 2017 was $140.1 million and approximated its fair value. The loan is denominated in Canadian dollars and it is subject to changes in foreign currency. Had the Canadian to U.S. dollar exchange rate been 10% lower as of December 31, 2017, the value of this loan would have been approximately $14.0 million lower. |
Our debt includes fixed rate instruments and the fair market value of our debt is sensitive to changes in interest rates. Sirius XM's borrowings under the Credit Facility carry a variable interest rate based on LIBOR plus an applicable rate based on its debt to operating cash flow ratio. We currently do not use interest rate derivative instruments to manage our exposure to interest rate fluctuations.
ITEM 8. | FINANCIAL STATEMENTS AND SUPPLEMENTARY DATA |
See the Index to Consolidated Financial Statements and financial statements and financial statement schedule contained in Item 15 herein, which are incorporated herein by reference.
ITEM 9. | CHANGES IN AND DISAGREEMENTS WITH ACCOUNTANTS ON ACCOUNTING AND FINANCIAL DISCLOSURE |
None.
ITEM 9A. | CONTROLS AND PROCEDURES |
Controls and Procedures
We maintain disclosure controls and procedures that are designed to ensure that information required to be disclosed in our reports under the Exchange Act is recorded, processed, summarized and reported within the time periods specified in the Securities and Exchange Commission's rules and forms, and that such information is accumulated and communicated to our management, including our principal executive officer and principal financial officer, as appropriate, to allow timely decisions regarding required disclosures. Any controls and procedures, no matter how well designed and operated, can provide only reasonable assurance of achieving the desired control objectives. An evaluation was performed under the supervision and with the participation of our management, including James E. Meyer, our Chief Executive Officer, and David J. Frear, our Senior Executive Vice President and Chief Financial Officer, of the effectiveness of the design and operation of our disclosure controls and procedures (as that term is defined in Rule 13a-15(e) and 15d-15(e) under the Exchange Act) as of December 31, 2017. Based on that evaluation, our management, including our Chief Executive Officer and our Chief Financial Officer, concluded that our disclosure controls and procedures were effective as of December 31, 2017 at the reasonable assurance level. There has been no change in our internal control over financial reporting (as that term is defined in Rule 13a-15(f) and 15d-15(f) under the Exchange Act) during the year ended December 31, 2017 that has materially affected, or is reasonably likely to materially affect, our internal control over financial reporting.
44
Management's Report on Internal Control over Financial Reporting
Our management is responsible for establishing and maintaining adequate internal control over financial reporting as defined in Rule 13a-15(f) and 15d-15(f) under the Exchange Act. We have performed an evaluation under the supervision and with the participation of our management, including our Chief Executive Officer and our Chief Financial Officer, of the effectiveness of our internal control over financial reporting. Our management used the updated Internal Control-Integrated Framework (2013) issued by the Committee of Sponsoring Organizations of the Treadway Commission to perform this evaluation. Based on that evaluation, our management, including our Chief Executive Officer and Chief Financial Officer, concluded that our internal control over financial reporting was effective as of December 31, 2017.
KPMG LLP, an independent registered public accounting firm, which has audited and reported on the consolidated financial statements contained in this Annual Report on Form 10-K, has issued its report on the effectiveness of our internal control over financial reporting which follows this report.
Audit Report of the Independent Registered Public Accounting Firm
The effectiveness of our internal control over financial reporting as of December 31, 2017 has been audited by KPMG LLP, an independent registered public accounting firm, as stated in their audit report appearing on page F-3 of this Annual Report on Form 10-K.
ITEM 9B. | OTHER INFORMATION |
None.
PART III
ITEM 10. | DIRECTORS, EXECUTIVE OFFICERS AND CORPORATE GOVERNANCE |
Information about our executive officers is contained in the discussion entitled “Executive Officers of the Registrant” in Part I of this Annual Report on Form 10-K.
The additional information required by this Item 10 is incorporated in this report by reference to the applicable information in our definitive proxy statement for the 2018 annual meeting of stockholders set forth under the captions Stock Ownership, Governance of the Company, Item 1. Election of Directors and Item 2. Ratification of Independent Registered Public Accountants, which we expect to file with the Securities and Exchange Commission prior to April 30, 2018.
Code of Ethics
We have adopted a code of ethics that applies to all employees, including executive officers, and to directors. The Code of Ethics is available on the Corporate Governance page of our website at www.siriusxm.com. If we ever were to amend or waive any provision of our Code of Ethics that applies to our principal executive officer, principal financial officer, principal accounting officer or any person performing similar functions, we intend to satisfy our disclosure obligations with respect to any such waiver or amendment by posting such information on our internet website set forth above rather than filing a Form 8-K.
ITEM 11. | EXECUTIVE COMPENSATION |
The information required by this Item 11 is incorporated in this report by reference to the applicable information in our definitive proxy statement for the 2018 annual meeting of stockholders set forth under the captions Item 1. Election of Directors and, Executive Compensation, which we expect to file with the Securities and Exchange Commission prior to April 30, 2018.
ITEM 12. | SECURITY OWNERSHIP OF CERTAIN BENEFICIAL OWNERS AND MANAGEMENT AND RELATED STOCKHOLDER MATTERS |
Certain information required by this Item 12 is set forth under the heading “Equity Compensation Plan Information” in Part II, Item 5, of this report.
45
The additional information required by this Item 12 is incorporated in this report by reference to the applicable information in our definitive proxy statement for the 2018 annual meeting of stockholders set forth under the caption Stock Ownership, which we expect to file with the Securities and Exchange Commission prior to April 30, 2018.
ITEM 13. | CERTAIN RELATIONSHIPS AND RELATED TRANSACTIONS AND DIRECTOR INDEPENDENCE |
The information required by this Item 13 is incorporated in this report by reference to the applicable information in our definitive proxy statement for the 2018 annual meeting of stockholders set forth under the captions Governance of the Company and Item 1. Election of Directors, which we expect to file with the Securities and Exchange Commission prior to April 30, 2018.
ITEM 14. | PRINCIPAL ACCOUNTANT FEES AND SERVICES |
The information required by this Item 14 is incorporated in this report by reference to the applicable information in our definitive proxy statement for the 2018 annual meeting of stockholders set forth under the caption Item 2. Ratification of Independent Registered Public Accountants - Principal Accountant Fees and Services, which we expect to file with the Securities and Exchange Commission prior to April 30, 2018.
46
PART IV
ITEM 15. | EXHIBITS AND FINANCIAL STATEMENT SCHEDULES |
Documents filed as part of this report:
(1) Financial Statements. See Index to Consolidated Financial Statements appearing on page F-1.
(2) Financial Statement Schedules. See Index to Consolidated Financial Statements appearing on page F-1.
(3) Exhibits. See Exhibit Index, which is incorporated herein by reference.
ITEM 16. | FORM 10-K SUMMARY |
None.
47
EXHIBIT INDEX
Exhibit | Description | ||
2.1 | |||
2.2 | |||
3.1 | |||
3.2 | |||
4.1 | |||
4.2 | |||
4.3 | |||
4.4 | |||
4.5 | |||
4.6 | |||
4.7 | |||
4.8 | |||
4.9 | |||
4.10 | |||
10.1 | |||
10.2 | |||
10.3 | |||
48
Exhibit | Description | ||
**10.4 | |||
*10.5 | |||
*10.6 | |||
*10.7 | |||
*10.8 | |||
*10.9 | |||
*10.10 | |||
*10.11 | |||
*10.12 | |||
*10.13 | |||
*10.14 | |||
*10.15 | |||
*10.16 | |||
*10.17 | |||
*10.18 | |||
*10.19 | |||
*10.20 | |||
*10.21 | |||
49
Exhibit | Description | ||
*10.22 | |||
*10.23 | |||
*10.24 | |||
*10.25 | |||
*10.26 | |||
*10.27 | |||
*10.28 | |||
*10.29 | |||
*10.30 | |||
*10.31 | |||
*10.32 | |||
*10.33 | |||
*10.34 | |||
21.1 | |||
23.1 | |||
31.1 | |||
31.2 | |||
32.1 | |||
32.2 | |||
50
Exhibit | Description | ||
99.1 | |||
99.2 | |||
101.1 | The following financial information from our Annual Report on Form 10-K for the year ended December 31, 2017 formatted in eXtensible Business Reporting Language (XBRL): (i) Consolidated Statements of Comprehensive Income for the years ended December 31, 2017, 2016 and 2015; (ii) Consolidated Balance Sheets as of December 31, 2017 and 2016; (iii) Consolidated Statements of Stockholders’ (Deficit) Equity for the years ended December 31, 2017, 2016 and 2015; (iv) Consolidated Statements of Cash Flows for the years ended December 31, 2017, 2016 and 2015; and (v) Combined Notes to Consolidated Financial Statements. | ||
_________________
* | This document has been identified as a management contract or compensatory plan or arrangement. |
** | Pursuant to the Commission’s Orders Granting Confidential Treatment under Rule 406 of the Securities Act of 1933 or Rule 24(b)-2 under the Securities Exchange Act of 1934, certain confidential portions of this Exhibit were omitted by means of redacting a portion of the text. |
The agreements and other documents filed as exhibits to this report are not intended to provide factual information or other disclosure other than with respect to the terms of the agreements or other documents themselves, and you should not rely on them for that purpose. In particular, any representations and warranties made by us in these agreements or other documents were made solely within the specific context of the relevant agreement or document and may not describe the actual state of affairs as of the date they were made or at any other time.
51
SIGNATURES
Pursuant to the requirements of Section 13 or 15(d) of the Securities Exchange Act of 1934, the registrant has duly caused this report to be signed on its behalf by the undersigned, thereunto duly authorized on this 31st day of January 2018.
SIRIUS XM HOLDINGS INC. | ||
By: | /s/ DAVID J. FREAR | |
David J. Frear | ||
Senior Executive Vice President and | ||
Chief Financial Officer | ||
(Principal Financial Officer and Authorized Officer) | ||
52
Pursuant to the requirements of the Securities Exchange Act of 1934, this report has been signed below by the following persons on behalf of the registrant and in the capacities and on the dates indicated.
Signature | Title | Date | |
/s/ GREGORY B. MAFFEI | Chairman of the Board of Directors and Director | January 31, 2018 | |
(Gregory B. Maffei) | |||
/s/ JAMES E. MEYER | Chief Executive Officer and Director (Principal Executive Officer) | January 31, 2018 | |
(James E. Meyer) | |||
/s/ DAVID J. FREAR | Senior Executive Vice President and Chief Financial Officer (Principal Financial Officer) | January 31, 2018 | |
(David J. Frear) | |||
/s/ THOMAS D. BARRY | Senior Vice President and Controller (Principal Accounting Officer) | January 31, 2018 | |
(Thomas D. Barry) | |||
/s/ JOAN L. AMBLE | Director | January 31, 2018 | |
(Joan L. Amble) | |||
/s/ GEORGE W. BODENHEIMER | Director | January 31, 2018 | |
(George W. Bodenheimer) | |||
/s/ MARK D. CARLETON | Director | January 31, 2018 | |
(Mark D. Carleton) | |||
/s/ EDDY W. HARTENSTEIN | Director | January 31, 2018 | |
(Eddy W. Hartenstein) | |||
/s/ JAMES P. HOLDEN | Director | January 31, 2018 | |
(James P. Holden) | |||
/s/ EVAN D. MALONE | Director | January 31, 2018 | |
(Evan D. Malone) | |||
/s/ JAMES F. MOONEY | Director | January 31, 2018 | |
(James F. Mooney) | |||
/s/ MICHAEL RAPINO | Director | January 31, 2018 | |
(Michael Rapino) | |||
/s/ CARL E. VOGEL | Director | January 31, 2018 | |
(Carl E. Vogel) | |||
/s/ VANESSA A. WITTMAN | Director | January 31, 2018 | |
(Vanessa A. Wittman) | |||
/s/ DAVID M. ZASLAV | Director | January 31, 2018 | |
(David M. Zaslav) | |||
53
SIRIUS XM HOLDINGS INC. AND SUBSIDIARIES
INDEX TO CONSOLIDATED FINANCIAL STATEMENTS
F-1
Report of Independent Registered Public Accounting Firm
The Board of Directors and Stockholders
Sirius XM Holdings Inc. and subsidiaries:
Opinion on the Consolidated Financial Statements
We have audited the accompanying consolidated balance sheets of Sirius XM Holdings Inc. and subsidiaries (the “Company”) as of December 31, 2017 and 2016, the related consolidated statements of comprehensive income, stockholders’ (deficit) equity, and cash flows for each of the years in the three‑year period ended December 31, 2017, and the related notes and financial statement schedule listed in Item 15(2) (collectively, the “consolidated financial statements”). In our opinion, the consolidated financial statements present fairly, in all material respects, the financial position of the Company as of December 31, 2017 and 2016, and the results of its operations and its cash flows for each of the years in the three‑year period ended December 31, 2017, in conformity with U.S. generally accepted accounting principles.
We also have audited, in accordance with the standards of the Public Company Accounting Oversight Board (United States) (“PCAOB”), the Company’s internal control over financial reporting as of December 31, 2017, based on criteria established in Internal Control - Integrated Framework (2013) issued by the Committee of Sponsoring Organizations of the Treadway Commission, and our report dated January 31, 2018 expressed an unqualified opinion on the effectiveness of the Company’s internal control over financial reporting.
Change in Accounting Principle
As discussed in Note 3 to the consolidated financial statements, the Company changed its method of accounting for share-based payments in 2016 due to the adoption of ASU 2016-09, Compensation-Stock Compensation (Topic 718): Improvements to Employee Share-Based Payment Accounting.
Basis for Opinion
These consolidated financial statements are the responsibility of the Company’s management. Our responsibility is to express an opinion on these consolidated financial statements based on our audits. We are a public accounting firm registered with the PCAOB and are required to be independent with respect to the Company in accordance with the U.S. federal securities laws and the applicable rules and regulations of the Securities and Exchange Commission and the PCAOB.
We conducted our audits in accordance with the standards of the PCAOB. Those standards require that we plan and perform the audit to obtain reasonable assurance about whether the consolidated financial statements are free of material misstatement, whether due to error or fraud. Our audits included performing procedures to assess the risks of material misstatement of the consolidated financial statements, whether due to error or fraud, and performing procedures that respond to those risks. Such procedures included examining, on a test basis, evidence regarding the amounts and disclosures in the consolidated financial statements. Our audits also included evaluating the accounting principles used and significant estimates made by management, as well as evaluating the overall presentation of the consolidated financial statements. We believe that our audits provide a reasonable basis for our opinion.
/s/ KPMG LLP
We have served as the Company’s auditor since 2008.
New York, New York
January 31, 2018
F-2
Report of Independent Registered Public Accounting Firm
The Board of Directors and Stockholders
Sirius XM Holdings Inc. and subsidiaries:
Opinion on Internal Control Over Financial Reporting
We have audited Sirius XM Holdings Inc. and subsidiaries’ (the “Company”) internal control over financial reporting as of December 31, 2017, based on criteria established in Internal Control - Integrated Framework (2013) issued by the Committee of Sponsoring Organizations of the Treadway Commission. In our opinion, the Company maintained, in all material respects, effective internal control over financial reporting as of December 31, 2017, based on criteria established in Internal Control - Integrated Framework (2013) issued by the Committee of Sponsoring Organizations of the Treadway Commission.
We also have audited, in accordance with the standards of the Public Company Accounting Oversight Board (United States) (“PCAOB”), the consolidated balance sheets of the Company as of December 31, 2017 and 2016, and the related consolidated statements of comprehensive income, stockholders’ (deficit) equity, and cash flows for each of the years in the three-year period ended December 31, 2017, and the related notes and financial statement schedule listed in Item 15(2) (collectively, the “consolidated financial statements”), and our report dated January 31, 2018 expressed an unqualified opinion on those consolidated financial statements.
Basis for Opinion
The Company’s management is responsible for maintaining effective internal control over financial reporting and for its assessment of the effectiveness of internal control over financial reporting, included in the accompanying Management’s Report on Internal Control over Financial Reporting. Our responsibility is to express an opinion on the Company’s internal control over financial reporting based on our audit. We are a public accounting firm registered with the PCAOB and are required to be independent with respect to the Company in accordance with the U.S. federal securities laws and the applicable rules and regulations of the Securities and Exchange Commission and the PCAOB.
We conducted our audit in accordance with the standards of the PCAOB. Those standards require that we plan and perform the audit to obtain reasonable assurance about whether effective internal control over financial reporting was maintained in all material respects. Our audit of internal control over financial reporting included obtaining an understanding of internal control over financial reporting, assessing the risk that a material weakness exists, and testing and evaluating the design and operating effectiveness of internal control based on the assessed risk. Our audit also included performing such other procedures as we considered necessary in the circumstances. We believe that our audit provides a reasonable basis for our opinion.
Definition and Limitations of Internal Control Over Financial Reporting
A company’s internal control over financial reporting is a process designed to provide reasonable assurance regarding the reliability of financial reporting and the preparation of financial statements for external purposes in accordance with generally accepted accounting principles. A company’s internal control over financial reporting includes those policies and procedures that (1) pertain to the maintenance of records that, in reasonable detail, accurately and fairly reflect the transactions and dispositions of the assets of the company; (2) provide reasonable assurance that transactions are recorded as necessary to permit preparation of financial statements in accordance with generally accepted accounting principles, and that receipts and expenditures of the company are being made only in accordance with authorizations of management and directors of the company; and (3) provide reasonable assurance regarding prevention or timely detection of unauthorized acquisition, use, or disposition of the company’s assets that could have a material effect on the financial statements.
Because of its inherent limitations, internal control over financial reporting may not prevent or detect misstatements. Also, projections of any evaluation of effectiveness to future periods are subject to the risk that controls may become inadequate because of changes in conditions, or that the degree of compliance with the policies or procedures may deteriorate.
/s/ KPMG LLP
New York, New York
January 31, 2018
F-3
SIRIUS XM HOLDINGS INC. AND SUBSIDIARIES
CONSOLIDATED STATEMENTS OF COMPREHENSIVE INCOME
For the Years Ended December 31, | |||||||||||
(in thousands, except per share data) | 2017 | 2016 | 2015 | ||||||||
Revenue: | |||||||||||
Subscriber revenue | $ | 4,472,522 | $ | 4,196,852 | $ | 3,824,793 | |||||
Advertising revenue | 160,347 | 138,231 | 122,292 | ||||||||
Equipment revenue | 131,586 | 118,947 | 110,923 | ||||||||
Other revenue | 660,674 | 563,190 | 512,050 | ||||||||
Total revenue | 5,425,129 | 5,017,220 | 4,570,058 | ||||||||
Operating expenses: | |||||||||||
Cost of services: | |||||||||||
Revenue share and royalties | 1,210,323 | 1,108,515 | 1,034,832 | ||||||||
Programming and content | 388,033 | 353,779 | 293,091 | ||||||||
Customer service and billing | 385,431 | 387,131 | 377,908 | ||||||||
Satellite and transmission | 82,747 | 103,020 | 94,609 | ||||||||
Cost of equipment | 35,448 | 40,882 | 42,724 | ||||||||
Subscriber acquisition costs | 499,492 | 512,809 | 532,599 | ||||||||
Sales and marketing | 437,739 | 386,724 | 354,189 | ||||||||
Engineering, design and development | 112,427 | 82,146 | 64,403 | ||||||||
General and administrative | 334,023 | 341,106 | 324,801 | ||||||||
Depreciation and amortization | 298,602 | 268,979 | 272,214 | ||||||||
Total operating expenses | 3,784,265 | 3,585,091 | 3,391,370 | ||||||||
Income from operations | 1,640,864 | 1,432,129 | 1,178,688 | ||||||||
Other income (expense): | |||||||||||
Interest expense | (345,820 | ) | (331,225 | ) | (299,103 | ) | |||||
Loss on extinguishment of debt | (43,679 | ) | (24,229 | ) | — | ||||||
Other income | 12,844 | 14,985 | 12,379 | ||||||||
Total other expense | (376,655 | ) | (340,469 | ) | (286,724 | ) | |||||
Income before income taxes | 1,264,209 | 1,091,660 | 891,964 | ||||||||
Income tax expense | (616,301 | ) | (345,727 | ) | (382,240 | ) | |||||
Net income | $ | 647,908 | $ | 745,933 | $ | 509,724 | |||||
Foreign currency translation adjustment, net of tax | 18,546 | 363 | (100 | ) | |||||||
Total comprehensive income | $ | 666,454 | $ | 746,296 | $ | 509,624 | |||||
Net income per common share: | |||||||||||
Basic | $ | 0.14 | $ | 0.15 | $ | 0.09 | |||||
Diluted | $ | 0.14 | $ | 0.15 | $ | 0.09 | |||||
Weighted average common shares outstanding: | |||||||||||
Basic | 4,637,553 | 4,917,050 | 5,375,707 | ||||||||
Diluted | 4,723,535 | 4,964,728 | 5,435,166 | ||||||||
Dividends declared per common share | $ | 0.041 | $ | 0.010 | $ | — | |||||
See accompanying notes to the consolidated financial statements.
F-4
SIRIUS XM HOLDINGS INC. AND SUBSIDIARIES
CONSOLIDATED BALANCE SHEETS
As of December 31, | |||||||
(in thousands, except per share data) | 2017 | 2016 | |||||
ASSETS | |||||||
Current assets: | |||||||
Cash and cash equivalents | $ | 69,022 | $ | 213,939 | |||
Receivables, net | 241,727 | 223,029 | |||||
Inventory, net | 20,199 | 20,363 | |||||
Related party current assets | 10,284 | 6,170 | |||||
Prepaid expenses and other current assets | 129,669 | 179,148 | |||||
Total current assets | 470,901 | 642,649 | |||||
Property and equipment, net | 1,462,766 | 1,398,693 | |||||
Intangible assets, net | 2,522,846 | 2,544,801 | |||||
Goodwill | 2,286,582 | 2,205,107 | |||||
Related party long-term assets | 962,080 | 8,918 | |||||
Deferred tax assets | 505,528 | 1,084,330 | |||||
Other long-term assets | 118,671 | 119,097 | |||||
Total assets | $ | 8,329,374 | $ | 8,003,595 | |||
LIABILITIES AND STOCKHOLDERS' (DEFICIT) EQUITY | |||||||
Current liabilities: | |||||||
Accounts payable and accrued expenses | $ | 794,341 | $ | 713,034 | |||
Accrued interest | 137,428 | 114,633 | |||||
Current portion of deferred revenue | 1,881,825 | 1,832,609 | |||||
Current maturities of long-term debt | 5,105 | 5,485 | |||||
Related party current liabilities | 2,839 | 2,840 | |||||
Total current liabilities | 2,821,538 | 2,668,601 | |||||
Deferred revenue | 174,579 | 176,319 | |||||
Long-term debt | 6,741,243 | 5,842,764 | |||||
Related party long-term liabilities | 7,364 | 7,955 | |||||
Deferred tax liabilities | 8,169 | 6,418 | |||||
Other long-term liabilities | 100,355 | 93,553 | |||||
Total liabilities | 9,853,248 | 8,795,610 | |||||
Commitments and contingencies (Note 15) | |||||||
Stockholders’ (deficit) equity: | |||||||
Common stock, par value $0.001; 9,000,000 shares authorized; 4,530,928 and 4,746,047 shares issued; 4,527,742 and 4,740,947 outstanding at December 31, 2017 and December 31, 2016, respectively | 4,530 | 4,745 | |||||
Accumulated other comprehensive income (loss), net of tax | 18,407 | (139 | ) | ||||
Additional paid-in capital | 1,713,816 | 3,117,666 | |||||
Treasury stock, at cost; 3,186 and 5,100 shares of common stock at December 31, 2017 and December 31, 2016, respectively | (17,154 | ) | (22,906 | ) | |||
Accumulated deficit | (3,243,473 | ) | (3,891,381 | ) | |||
Total stockholders’ (deficit) equity | (1,523,874 | ) | (792,015 | ) | |||
Total liabilities and stockholders’ (deficit) equity | $ | 8,329,374 | $ | 8,003,595 | |||
See accompanying notes to the consolidated financial statements.
F-5
SIRIUS XM HOLDINGS INC. AND SUBSIDIARIES
CONSOLIDATED STATEMENT OF STOCKHOLDERS’ (DEFICIT) EQUITY
Common Stock | Accumulated Other Comprehensive (Loss) Income | Additional Paid-in Capital | Treasury Stock | Accumulated Deficit | Total Stockholders’ (Deficit) Equity | |||||||||||||||||||||||||
(in thousands) | Shares | Amount | Shares | Amount | ||||||||||||||||||||||||||
Balance at January 1, 2015 | 5,653,529 | $ | 5,653 | $ | (402 | ) | $ | 6,771,554 | 7,410 | $ | (26,034 | ) | $ | (5,440,934 | ) | $ | 1,309,837 | |||||||||||||
Comprehensive income (loss), net of tax | — | — | (100 | ) | — | — | — | 509,724 | 509,624 | |||||||||||||||||||||
Share-based payment expense | — | — | — | 84,310 | — | — | — | 84,310 | ||||||||||||||||||||||
Exercise of options and vesting of restricted stock units | 19,740 | 20 | — | 240 | — | — | — | 260 | ||||||||||||||||||||||
Minimum withholding taxes on net share settlement of stock-based compensation | — | — | — | (54,575 | ) | — | — | — | (54,575 | ) | ||||||||||||||||||||
Issuance of common stock upon exercise of warrants | 6,010 | 6 | — | (6 | ) | — | — | — | — | |||||||||||||||||||||
Common stock repurchased | — | — | — | — | 524,222 | (2,015,947 | ) | — | (2,015,947 | ) | ||||||||||||||||||||
Common stock retired | (525,828 | ) | (526 | ) | — | (2,017,728 | ) | (525,828 | ) | 2,018,254 | — | — | ||||||||||||||||||
Balance at December 31, 2015 | 5,153,451 | $ | 5,153 | $ | (502 | ) | $ | 4,783,795 | 5,804 | $ | (23,727 | ) | $ | (4,931,210 | ) | $ | (166,491 | ) | ||||||||||||
Cumulative effect of change in accounting principle | — | — | — | — | — | — | 293,896 | 293,896 | ||||||||||||||||||||||
Comprehensive income, net of tax | — | — | 363 | — | — | — | 745,933 | 746,296 | ||||||||||||||||||||||
Share-based payment expense | — | — | — | 97,539 | — | — | — | 97,539 | ||||||||||||||||||||||
Exercise of options and vesting of restricted stock units | 13,411 | 13 | — | 335 | — | — | — | 348 | ||||||||||||||||||||||
Minimum withholding taxes on net share settlement of stock-based compensation | — | — | — | (42,827 | ) | — | — | — | (42,827 | ) | ||||||||||||||||||||
Cash dividends paid on common shares | — | — | — | (48,079 | ) | — | — | — | (48,079 | ) | ||||||||||||||||||||
Common stock repurchased | — | — | — | — | 420,111 | (1,672,697 | ) | — | (1,672,697 | ) | ||||||||||||||||||||
Common stock retired | (420,815 | ) | (421 | ) | — | (1,673,097 | ) | (420,815 | ) | 1,673,518 | — | — | ||||||||||||||||||
Balance at December 31, 2016 | 4,746,047 | $ | 4,745 | $ | (139 | ) | $ | 3,117,666 | 5,100 | $ | (22,906 | ) | $ | (3,891,381 | ) | $ | (792,015 | ) | ||||||||||||
Comprehensive income, net of tax | — | — | 18,546 | — | — | — | 647,908 | 666,454 | ||||||||||||||||||||||
Issuance of common stock as part of recapitalization of Sirius XM Canada | 35,000 | 35 | — | 178,815 | — | — | — | 178,850 | ||||||||||||||||||||||
Share-based payment expense | — | — | — | 108,871 | — | — | — | 108,871 | ||||||||||||||||||||||
Exercise of options and vesting of restricted stock units | 22,322 | 22 | — | 752 | — | — | — | 774 | ||||||||||||||||||||||
Minimum withholding taxes on net share settlement of stock-based compensation | — | — | — | (93,283 | ) | — | — | — | (93,283 | ) | ||||||||||||||||||||
Cash dividends paid on common stock | — | — | — | (190,242 | ) | — | — | — | (190,242 | ) | ||||||||||||||||||||
Common stock repurchased | — | — | — | — | 270,527 | (1,403,283 | ) | — | (1,403,283 | ) | ||||||||||||||||||||
Common stock retired | (272,441 | ) | (272 | ) | — | (1,408,763 | ) | (272,441 | ) | 1,409,035 | — | — | ||||||||||||||||||
Balance at December 31, 2017 | 4,530,928 | $ | 4,530 | $ | 18,407 | $ | 1,713,816 | 3,186 | $ | (17,154 | ) | $ | (3,243,473 | ) | $ | (1,523,874 | ) | |||||||||||||
See accompanying notes to the consolidated financial statements.
F-6
SIRIUS XM HOLDINGS INC. AND SUBSIDIARIES
CONSOLIDATED STATEMENTS OF CASH FLOWS
For the Years Ended December 31, | |||||||||||
(in thousands) | 2017 | 2016 | 2015 | ||||||||
Cash flows from operating activities: | |||||||||||
Net income | $ | 647,908 | $ | 745,933 | $ | 509,724 | |||||
Adjustments to reconcile net income to net cash provided by operating activities: | |||||||||||
Depreciation and amortization | 298,602 | 268,979 | 272,214 | ||||||||
Non-cash interest expense, net of amortization of premium | 9,050 | 8,608 | 7,872 | ||||||||
Provision for doubtful accounts | 55,715 | 55,941 | 47,237 | ||||||||
Amortization of deferred income related to equity method investment | (2,776 | ) | (2,772 | ) | (2,776 | ) | |||||
Loss on extinguishment of debt | 43,679 | 24,229 | — | ||||||||
Gain on unconsolidated entity investments, net | (4,561 | ) | (12,529 | ) | — | ||||||
Dividend received from unconsolidated entity investment | 3,606 | 7,160 | 14,788 | ||||||||
Loss on disposal of assets | — | 12,912 | 7,384 | ||||||||
Share-based payment expense | 124,069 | 108,604 | 84,310 | ||||||||
Deferred income taxes | 583,520 | 323,562 | 365,499 | ||||||||
Other non-cash purchase price adjustments | — | — | (1,394 | ) | |||||||
Changes in operating assets and liabilities: | |||||||||||
Receivables | (73,777 | ) | (44,188 | ) | (61,440 | ) | |||||
Inventory | 1,874 | 1,932 | (2,898 | ) | |||||||
Related party, net | (2,210 | ) | (3,485 | ) | (14,953 | ) | |||||
Prepaid expenses and other current assets | 50,194 | 7,156 | (67,204 | ) | |||||||
Other long-term assets | 7,333 | 38,835 | (130,741 | ) | |||||||
Accounts payable and accrued expenses | 41,367 | 78,920 | 52,696 | ||||||||
Accrued interest | 22,795 | 22,978 | 11,215 | ||||||||
Deferred revenue | 41,894 | 79,404 | 145,242 | ||||||||
Other long-term liabilities | 7,307 | (2,942 | ) | 7,276 | |||||||
Net cash provided by operating activities | 1,855,589 | 1,719,237 | 1,244,051 | ||||||||
Cash flows from investing activities: | |||||||||||
Additions to property and equipment | (287,970 | ) | (205,829 | ) | (134,892 | ) | |||||
Purchases of restricted and other investments | (7,847 | ) | (4,295 | ) | (3,966 | ) | |||||
Acquisition of business, net of cash acquired | (107,736 | ) | — | — | |||||||
Investments in related parties | (612,465 | ) | — | — | |||||||
Loan to related party | (130,794 | ) | — | — | |||||||
Net cash used in investing activities | (1,146,812 | ) | (210,124 | ) | (138,858 | ) | |||||
Cash flows from financing activities: | |||||||||||
Proceeds from exercise of stock options | 774 | 348 | 260 | ||||||||
Taxes paid in lieu of shares issued for stock-based compensation | (92,619 | ) | (42,824 | ) | (54,539 | ) | |||||
Net (repayments) borrowings related to revolving credit facility | (90,000 | ) | 50,000 | (40,000 | ) | ||||||
Proceeds from long-term borrowings, net of costs | 2,473,071 | 987,143 | 983,571 | ||||||||
Principal payments of long-term borrowings | (1,512,578 | ) | (660,985 | ) | (12,117 | ) | |||||
Payment of premiums on redemption of debt | (33,065 | ) | (19,097 | ) | — | ||||||
Common stock repurchased and retired | (1,409,035 | ) | (1,673,518 | ) | (2,018,254 | ) | |||||
Dividends paid | (190,242 | ) | (48,079 | ) | — | ||||||
Net cash used in financing activities | (853,694 | ) | (1,407,012 | ) | (1,141,079 | ) | |||||
Net (decrease) increase in cash and cash equivalents | (144,917 | ) | 102,101 | (35,886 | ) | ||||||
Cash and cash equivalents at beginning of period | 213,939 | 111,838 | 147,724 | ||||||||
Cash and cash equivalents at end of period | $ | 69,022 | $ | 213,939 | $ | 111,838 | |||||
See accompanying notes to the consolidated financial statements.
F-7
SIRIUS XM HOLDINGS INC. AND SUBSIDIARIES
CONSOLIDATED STATEMENTS OF CASH FLOWS - Continued
For the Years Ended December 31, | |||||||||||
(in thousands) | 2017 | 2016 | 2015 | ||||||||
Supplemental Disclosure of Cash and Non-Cash Flow Information | |||||||||||
Cash paid during the period for: | |||||||||||
Interest, net of amounts capitalized | $ | 310,492 | $ | 292,556 | $ | 269,925 | |||||
Income taxes paid | $ | 28,045 | $ | 20,639 | $ | 12,384 | |||||
Non-cash investing and financing activities: | |||||||||||
Capital lease obligations incurred to acquire assets | $ | 2,577 | $ | 6,647 | $ | 7,487 | |||||
Treasury stock not yet settled | $ | 17,154 | $ | 22,906 | $ | 23,727 | |||||
Issuance of common stock as part of recapitalization of Sirius XM Canada | $ | 178,850 | $ | — | $ | — | |||||
Other comprehensive income (loss), net of tax for related party | $ | 18,546 | $ | 363 | $ | (100 | ) | ||||
See accompanying notes to the consolidated financial statements.
F-8
SIRIUS XM HOLDINGS INC. AND SUBSIDIARIES
NOTES TO CONSOLIDATED FINANCIAL STATEMENTS
(Dollars and shares in thousands, except per share amounts)
(1) | Business & Basis of Presentation |
This Annual Report on Form 10-K presents information for Sirius XM Holdings Inc. (“Holdings”). The terms “Holdings,” “we,” “us,” “our,” and “our company” as used herein and unless otherwise stated or indicated by context, refer to Sirius XM Holdings Inc. and its subsidiaries, and “Sirius XM” refers to our wholly-owned subsidiary Sirius XM Radio Inc. Holdings has no operations independent of its wholly-owned subsidiary, Sirius XM.
Business
We transmit music, sports, entertainment, comedy, talk, news, traffic and weather channels, as well as infotainment services, in the United States on a subscription fee basis through our two proprietary satellite radio systems. Subscribers can also receive music and other channels, plus features such as SiriusXM On Demand, over our Internet radio service, including through applications for mobile devices, home devices and other consumer electronic equipment. We also provide connected vehicle services. Our connected vehicle services are designed to enhance the safety, security and driving experience for vehicle operators while providing marketing and operational benefits to automakers and their dealers.
We have agreements with every major automaker (“OEMs”) to offer satellite radio in their vehicles, through which we acquire the majority of our subscribers. We also acquire subscribers through marketing to owners and lessees of previously owned vehicles that include factory-installed satellite radios that are not currently subscribing to our services. Our satellite radios are primarily distributed through automakers, retailers, and our website. Satellite radio services are also offered to customers of certain rental car companies.
Our primary source of revenue is subscription fees, with most of our customers subscribing to annual, semi-annual, quarterly or monthly plans. We offer discounts for prepaid, longer-term subscription plans, as well as a multiple subscription discount. We also derive revenue from activation and other fees, the sale of advertising on select non-music channels, the direct sale of satellite radios and accessories, and other ancillary services, such as our weather, traffic and data services.
In certain cases, a subscription to our radio services is included in the sale or lease price of new or previously owned vehicles. The length of these subscriptions varies but is typically three to twelve months. We receive payments for these subscriptions from certain automakers. We also reimburse various automakers for certain costs associated with satellite radios installed in new vehicles and pay revenue share to various automakers.
During the year ended December 31, 2017, we entered into several strategic transactions:
• | On April 18, 2017, Sirius XM acquired Automatic Labs Inc. (“Automatic”). Refer to Note 2 for information on this transaction. |
• | On May 25, 2017, Sirius XM completed a recapitalization of Sirius XM Canada Holdings Inc. (“Sirius XM Canada”). Refer to Note 11 for information on this transaction. |
• | On September 22, 2017, Sirius XM completed a $480,000 investment in Pandora Media, Inc. (“Pandora”). Refer to Note 11 for information on this transaction. |
As of December 31, 2017, Liberty Media Corporation (“Liberty Media”) beneficially owned, directly and indirectly, approximately 70% of the outstanding shares of our common stock. As a result, we are a “controlled company” for the purposes of the NASDAQ corporate governance requirements.
Basis of Presentation
The accompanying consolidated financial statements of Holdings and its subsidiaries have been prepared in accordance with U.S. generally accepted accounting principles (“GAAP”). All significant intercompany transactions have been eliminated in consolidation. Certain numbers in our prior period consolidated financial statements and footnotes have been reclassified or consolidated to conform to our current period presentation.
F-9
SIRIUS XM HOLDINGS INC. AND SUBSIDIARIES
NOTES TO CONSOLIDATED FINANCIAL STATEMENTS - Continued
(Dollars and shares in thousands, except per share amounts)
Public companies are required to disclose certain information about their reportable operating segments. Operating segments are defined as significant components of an enterprise for which separate financial information is available and is evaluated on a regular basis by the chief operating decision makers in deciding how to allocate resources to an individual segment and in assessing performance of the segment. We have determined that we have one reportable segment as our chief operating decision maker, our Chief Executive Officer, assesses performance and allocates resources based on the consolidated results of operations of our business.
We have evaluated events subsequent to the balance sheet date and prior to the filing of this Annual Report on Form 10-K for the year ended December 31, 2017 and have determined that no events have occurred that would require adjustment to our consolidated financial statements. For a discussion of subsequent events that do not require adjustment to our consolidated financial statements refer to Note 17.
Use of Estimates
The preparation of financial statements in conformity with GAAP requires management to make estimates and assumptions that affect the amounts reported in the financial statements and footnotes. Estimates, by their nature, are based on judgment and available information. Actual results could differ materially from those estimates. Significant estimates inherent in the preparation of the accompanying consolidated financial statements include asset impairment, depreciable lives of our satellites, share-based payment expense, and income taxes.
(2) | Acquisition |
On April 18, 2017, Sirius XM acquired Automatic, a connected vehicle device and mobile application company, for an aggregate purchase price of $107,736, net of cash and restricted cash acquired of $819. Automatic has created and operates a data-driven platform that enables vehicle owners to be safer and drive smarter. The company's proprietary Automatic Pro and Automatic Lite connected car adapters provide, among other things, vehicle diagnostic alerts, emergency crash assistance, fuel monitoring, access to parking information and live vehicle location tracking.
The condensed table below summarizes the fair value of the assets acquired and liabilities assumed:
Acquired Assets: | |||
Intangible assets subject to amortization | $ | 14,700 | |
Goodwill | 81,475 | ||
Deferred income tax asset, net | 14,760 | ||
Other assets | 4,019 | ||
Trademark | 800 | ||
Total Assets | $ | 115,754 | |
Assumed Liabilities: | |||
Deferred revenue | (5,582 | ) | |
Other liabilities | (1,617 | ) | |
Total Liabilities | $ | (7,199 | ) |
Total Consideration | $ | 108,555 | |
The transaction was accounted for using the acquisition method of accounting. The fair value assessed for the majority of the assets acquired and liabilities assumed equaled their carrying value. The excess purchase price over identifiable net assets of $81,475 has been recorded to Goodwill in our consolidated balance sheets as of December 31, 2017. A total of $14,700 has been allocated to identifiable intangible assets subject to amortization and relates to the assessed fair value of software and technology and a total of $800 has been allocated to the Automatic trademark.
F-10
SIRIUS XM HOLDINGS INC. AND SUBSIDIARIES
NOTES TO CONSOLIDATED FINANCIAL STATEMENTS - Continued
(Dollars and shares in thousands, except per share amounts)
We recognized acquisition related costs of $922 that were expensed in General and administrative expenses in our consolidated statements of comprehensive income during the year ended December 31, 2017. Pro forma financial information related to this acquisition has not been provided as it is not material to our consolidated results of operations.
(3) | Summary of Significant Accounting Policies |
In addition to the significant accounting policies discussed in this Note 3, the following table includes our significant accounting policies that are described in other notes to our consolidated financial statements, including the number and page of the note:
Cash and Cash Equivalents
Our cash and cash equivalents consist of cash on hand, money market funds, certificates of deposit, in-transit credit card receipts and highly liquid investments purchased with an original maturity of three months or less.
Revenue Recognition
We derive revenue primarily from subscribers, advertising and sales of radios and accessories.
Revenue from subscribers consists primarily of subscription fees and other ancillary subscription based revenues. Revenue is recognized as it is realized or realizable and earned. We recognize subscription fees as our services are provided. Consumers purchasing or leasing a vehicle with a factory-installed satellite radio typically receive between a three and twelve month subscription to our service. In certain cases, the subscription fee for these consumers are prepaid by the applicable automaker. Prepaid subscription fees received from certain automakers are recorded as deferred revenue and amortized to revenue ratably over the service period which commences upon retail sale and activation. There is no revenue recognized for unpaid trial subscriptions.
We recognize revenue from the sale of advertising as the advertising is transmitted. Agency fees are calculated based on a stated percentage applied to gross billing revenue for our advertising inventory and are reported as a reduction of advertising revenue. We pay certain third parties a percentage of advertising revenue. Advertising revenue is recorded gross of such revenue share payments as we are the primary obligor in the transaction. Advertising revenue share payments are recorded to Revenue share and royalties during the period in which the advertising is transmitted.
Equipment revenue and royalties from the sale of satellite radios, components and accessories are recognized upon shipment, net of discounts and rebates. Shipping and handling costs billed to customers are recorded as revenue. Shipping and handling costs associated with shipping goods to customers are reported as a component of Cost of equipment.
Other revenue primarily includes U.S. Music Royalty Fees which are recorded as other revenue and the cost component as Revenue share and royalties expense. Fees received from subscribers for the U.S. Music Royalty Fee are recorded as deferred revenue and amortized to revenue ratably over the service period.
We report revenues net of any tax assessed by a governmental authority that is both imposed on, and concurrent with, a specific revenue-producing transaction between a seller and a customer in our consolidated statements of comprehensive income.
F-11
SIRIUS XM HOLDINGS INC. AND SUBSIDIARIES
NOTES TO CONSOLIDATED FINANCIAL STATEMENTS - Continued
(Dollars and shares in thousands, except per share amounts)
Accounting Standards Codification (“ASC”) 605, Revenue Recognition, provides guidance on how and when to recognize revenues for arrangements that may involve the delivery or performance of multiple products, services and/or rights to use assets, such as in our bundled subscription plans. Revenue arrangements with multiple deliverables are required to be divided into separate units of accounting if the deliverables in the arrangement meet certain criteria. Consideration must be allocated at the inception of the arrangement to all deliverables based on their relative selling price, which has been determined using vendor specific objective evidence of the selling price to self-pay customers.
Revenue Share
We share a portion of our subscription revenues earned from self-pay subscribers and paid promotional subscribers with certain automakers. The terms of the revenue share agreements vary with each automaker, but are typically based upon the earned audio revenue as reported or gross billed audio revenue. Revenue share is recorded as an expense in our consolidated statements of comprehensive income and not as a reduction to revenue.
Programming Costs
Programming costs which are for a specified number of events are amortized on an event-by-event basis; programming costs which are for a specified season or include programming through a dedicated channel are amortized over the season or period on a straight-line basis. We allocate a portion of certain programming costs which are related to sponsorship and marketing activities to Sales and marketing expense on a straight-line basis over the term of the agreement.
Advertising Costs
Media is expensed when aired and advertising production costs are expensed as incurred. Advertising production costs include expenses related to marketing and retention activities, including expenses related to direct mail, outbound telemarketing and email communications. We also incur advertising production costs related to cooperative marketing and promotional events and sponsorships. During the years ended December 31, 2017, 2016 and 2015, we recorded advertising costs of $262,701, $226,969 and $206,351, respectively. These costs are reflected in Sales and marketing expense in our consolidated statements of comprehensive income.
Subscriber Acquisition Costs
Subscriber acquisition costs consist of costs incurred to acquire new subscribers which include hardware subsidies paid to radio manufacturers, distributors and automakers, including subsidies paid to automakers who include a satellite radio and a prepaid subscription to our service in the sale or lease price of a new vehicle; subsidies paid for chipsets and certain other components used in manufacturing radios; device royalties for certain radios and chipsets; commissions paid to retailers and automakers as incentives to purchase, install and activate radios; product warranty obligations; freight; and provisions for inventory allowance attributable to inventory consumed in our OEM and retail distribution channels. Subscriber acquisition costs do not include advertising costs, loyalty payments to distributors and dealers of radios and revenue share payments to automakers and retailers of radios.
Subsidies paid to radio manufacturers and automakers are expensed upon installation, shipment, receipt of product or activation and are included in Subscriber acquisition costs because we are responsible for providing the service to the customers. Commissions paid to retailers and automakers are expensed upon either the sale or activation of radios. Chipsets that are shipped to radio manufacturers and held on consignment are recorded as inventory and expensed as Subscriber acquisition costs when placed into production by radio manufacturers. Costs for chipsets not held on consignment are expensed as Subscriber acquisition costs when the automaker confirms receipt.
Research & Development Costs
Research and development costs are expensed as incurred and primarily include the cost of new product development, chipset design, software development and engineering. During the years ended December 31, 2017, 2016 and 2015, we recorded research and development costs of $96,917, $69,025 and $54,933, respectively. These costs are reported as a component of Engineering, design and development expense in our consolidated statements of comprehensive income.
F-12
SIRIUS XM HOLDINGS INC. AND SUBSIDIARIES
NOTES TO CONSOLIDATED FINANCIAL STATEMENTS - Continued
(Dollars and shares in thousands, except per share amounts)
Accumulated Other Comprehensive Income (Loss)
Accumulated other comprehensive income of $18,407 was primarily comprised of the cumulative foreign currency translation adjustments related to Sirius XM Canada (refer to Note 11 for additional information). During the year ended December 31, 2017, we recorded a foreign currency translation adjustment gain of $18,546, which is recorded net of tax of $11,286. During the years ended December 31, 2016 and 2015, we recorded a foreign currency translation adjustment gain of $363 and loss of $100, respectively, net of tax.
Recent Accounting Pronouncements
We elected to early adopt Financial Accounting Standards Board (“FASB”) Accounting Standards Update (“ASU”) 2016-09, Compensation-Stock Compensation (Topic 718): Improvements to Employee Share-Based Payment Accounting, in the third quarter of 2016, which required that any adjustments be reflected as of January 1, 2016, the beginning of the annual period that includes the interim period of adoption. The areas for simplification in this ASU involve several aspects of the accounting for share-based payment transactions, including the income tax consequences, classification of awards as either equity or liabilities, forfeiture calculations, and classification on the statement of cash flows. The primary impact of adoption of ASU 2016-09 was the recognition of excess tax benefits in our provision for income taxes.
Additionally, we recognized net operating losses related to excess share-based compensation tax return deductions that were previously tracked off balance sheet but not recorded in our financial statements. As of January 1, 2016, $293,896, net of a $1,946 reserve for an uncertain tax position, was recorded as an increase to our Deferred tax assets and decrease to our Accumulated deficit in our consolidated balance sheets as a result of the cumulative effect of this change in accounting principle.
Additional amendments to this ASU related to income taxes and minimum statutory withholding tax requirements had no impact to Accumulated deficit, where the cumulative effect of these changes are required to be recorded. Further, there was no impact to our classification of awards as either equity or liabilities. We also elected to true-up forfeitures in the period of adoption and now recognize forfeitures as they occur. This ASU also required excess tax benefits to be separated from other income tax cash flows and classified as an operating activity, however, prior to adoption, there was no impact to the consolidated statement of cash flows as we have not had any excess tax benefits (windfalls) recorded for book purposes. The presentation requirements for cash flows related to employee taxes paid for withheld shares had no impact to any of the periods presented in our consolidated statement of cash flows as such cash flows have historically been presented as a financing activity.
In January 2017, the FASB issued ASU 2017-04, Intangibles - Goodwill and Other (Topic 350). This ASU eliminates Step 2 from the goodwill impairment test. Under the new guidance, entities should perform its annual or interim goodwill impairment test by comparing the fair value of a reporting unit with its carrying amount and recognize an impairment charge for the amount by which the carrying amount exceeds the reporting unit’s fair value. Additionally, this ASU eliminates the requirements for any reporting unit with a zero or negative carrying amount to perform a qualitative assessment and, if it fails that qualitative test, to perform Step 2 of the goodwill impairment test. The amendments in this ASU are effective for fiscal years beginning after December 15, 2019, including interim periods within those fiscal years, and is applied on a prospective basis. Early adoption is permitted for interim or annual goodwill impairment tests performed on testing dates after January 1, 2017. We elected to early adopt ASU 2017-04 in the fourth quarter of 2017, which did not have an impact on our consolidated financial statements. Refer to Note 8 for information on this adoption.
In May 2014, the FASB issued ASU 2014-09, Revenue from Contracts with Customers (Topic 606). This ASU is a comprehensive new revenue recognition model that requires a company to recognize revenue to depict the transfer of goods or services to a customer at an amount that reflects the consideration it expects to receive in exchange for those goods or services. This ASU also requires additional disclosure about the nature, amount, timing and uncertainty of revenue and cash flows arising from customer contracts, including significant judgments and changes in judgments and assets recognized from costs incurred to obtain or fulfill a contract. In August 2015, the FASB issued ASU 2015-14 which amended the effective date of this ASU to fiscal years beginning after December 15, 2017, and early adoption was permitted only for fiscal years beginning after December 15, 2016. In 2016, the FASB issued additional guidance which clarified principal versus agent considerations, identification of performance obligations and the implementation guidance for licensing. In addition, the FASB issued guidance regarding practical expedients related to disclosures of remaining performance obligations, as well as other amendments to the
F-13
SIRIUS XM HOLDINGS INC. AND SUBSIDIARIES
NOTES TO CONSOLIDATED FINANCIAL STATEMENTS - Continued
(Dollars and shares in thousands, except per share amounts)
guidance on transition, collectibility, non-cash consideration and the presentation of sales and other similar taxes. The two permitted transition methods under the new standard are the full retrospective method, in which case the standard would be applied to each prior reporting period presented, or the modified retrospective method, in which case the cumulative effect of applying the standard would be recognized at the date of initial application. We will adopt this ASU under the modified retrospective method.
We have completed our evaluation of the impact this ASU will have on our revenue streams. Based on our assessment of the impact of adopting this ASU on January 1, 2018, the most significant impact of the ASU relates to the reclassification of approximately $90,000 of Subscriber revenue to offset Revenue share and royalties and certain subsidy payments made to automakers associated with a paid promotional subscription and the impact of the timing of recognition of activation revenues.
The adoption will not have a significant impact to our Net income. Within our consolidated balance sheets, upon adoption, the amount of revenue share associated with a paid promotional subscription to an automaker will be classified as a liability separate from deferred revenue. We expect the adjustment to our opening balance of Accumulated deficit to be approximately $19,000, net of tax, upon adoption.
We have implemented the necessary changes to our business processes, systems and controls to support recognition and disclosure of this ASU upon adoption on January 1, 2018.
In February 2016, the FASB issued ASU 2016-02, Leases (Topic 842). This ASU requires a company to recognize lease assets and liabilities arising from operating leases in the statement of financial position. This ASU does not significantly change the previous lease guidance for how a lessee should recognize the recognition, measurement, and presentation of expenses and cash flows arising from a lease. Additionally, the criteria for classifying a finance lease versus an operating lease are substantially the same as the previous guidance. The amendments in this ASU are effective for fiscal years beginning after December 15, 2018, including interim periods within those fiscal years, and early adoption is permitted. This ASU must be adopted using a modified retrospective approach. We plan to adopt this ASU on January 1, 2019. We are in the process of evaluating the impact of adoption of this ASU on our consolidated financial statements. We currently believe that the most significant changes will be related to the recognition of right-of-use assets and lease liability on our consolidated balance sheets for operating leases.
(4) | Fair Value Measurements |
The fair value of a financial instrument is the amount at which the instrument could be exchanged in an orderly transaction between market participants. As of December 31, 2017 and 2016, the carrying amounts of cash and cash equivalents, receivables, and accounts payable approximated fair value due to the short-term nature of these instruments. ASC 820, Fair Value Measurements and Disclosures, establishes a fair value hierarchy for input into valuation techniques as follows:
i. | Level 1 input: unadjusted quoted prices in active markets for identical instrument; |
ii. | Level 2 input: observable market data for the same or similar instrument but not Level 1, including quoted prices for identical or similar assets or liabilities in markets that are not active or other inputs that are observable or can be corroborated by observable market data for substantially the full term of the assets or liabilities; and |
iii. | Level 3 input: unobservable inputs developed using management's assumptions about the inputs used for pricing the asset or liability. |
F-14
SIRIUS XM HOLDINGS INC. AND SUBSIDIARIES
NOTES TO CONSOLIDATED FINANCIAL STATEMENTS - Continued
(Dollars and shares in thousands, except per share amounts)
Investments are periodically reviewed for impairment and an impairment is recorded whenever declines in fair value below carrying value are determined to be other than temporary. In making this determination, we consider, among other factors, the severity and duration of the decline as well as the likelihood of a recovery within a reasonable timeframe.
Our assets and liabilities measured at fair value were as follows:
December 31, 2017 | December 31, 2016 | ||||||||||||||||||||||||||||
Level 1 | Level 2 | Level 3 | Total Fair Value | Level 1 | Level 2 | Level 3 | Total Fair Value | ||||||||||||||||||||||
Assets: | |||||||||||||||||||||||||||||
Pandora - investment (a) | $ | — | 480,472 | — | $ | 480,472 | $ | — | — | — | $ | — | |||||||||||||||||
Sirius XM Canada - investment (b) | $ | — | — | — | $ | — | $ | 178,696 | — | — | $ | 178,696 | |||||||||||||||||
Liabilities: | |||||||||||||||||||||||||||||
Debt (c) | — | $ | 6,987,473 | — | $ | 6,987,473 | — | $ | 6,008,205 | — | $ | 6,008,205 | |||||||||||||||||
(a) | During the year ended December 31, 2017, Sirius XM completed a $480,000 investment in Pandora. We have elected the fair value option to account for this investment. Refer to Note 11 for information on this transaction. |
(b) | During the year ended December 31, 2017, Sirius XM completed a recapitalization of Sirius XM Canada. Following this recapitalization, Sirius XM Canada ceased to be a publicly traded company. Refer to Note 11 for information on this transaction. The amount as of December 31, 2016 approximated fair value. The carrying value of our investment in Sirius XM Canada was $341,214 and $8,615 as of December 31, 2017 and 2016, respectively. Additionally, as part of this transaction we loaned Sirius XM Canada $130,794. The carrying value of the loan as of December 31, 2017 was $140,073 and approximated its fair value. |
(c) | The fair value for non-publicly traded instruments is based upon estimates from a market maker and brokerage firm. Refer to Note 12 for information related to the carrying value of our debt as of December 31, 2017 and 2016. |
(5) | Earnings per Share |
Basic net income per common share is calculated by dividing the income available to common stockholders by the weighted average common shares outstanding during each reporting period. Diluted net income per common share adjusts the weighted average number of common shares outstanding for the potential dilution that could occur if common stock equivalents (stock options and restricted stock units) were exercised or converted into common stock, calculated using the treasury stock method. We had no participating securities during the years ended December 31, 2017, 2016 and 2015.
Common stock equivalents of 40,541 for the year ended December 31, 2017 and 208,202 and 151,112 for the years ended December 31, 2016 and 2015, respectively, were excluded from the calculation of diluted net income per common share as the effect would have been anti-dilutive.
For the Years Ended December 31, | |||||||||||
2017 (1) | 2016 | 2015 | |||||||||
Numerator: | |||||||||||
Net income available to common stockholders for basic and diluted net income per common share | $ | 647,908 | $ | 745,933 | $ | 509,724 | |||||
Denominator: | |||||||||||
Weighted average common shares outstanding for basic net income per common share | 4,637,553 | 4,917,050 | 5,375,707 | ||||||||
Weighted average impact of dilutive equity instruments | 85,982 | 47,678 | 59,459 | ||||||||
Weighted average shares for diluted net income per common share | 4,723,535 | 4,964,728 | 5,435,166 | ||||||||
Net income per common share: | |||||||||||
Basic | $ | 0.14 | $ | 0.15 | $ | 0.09 | |||||
Diluted | $ | 0.14 | $ | 0.15 | $ | 0.09 | |||||
(1) | Our net income per basic and diluted share includes the impact of $184,599 in income tax expense, or a decrease of approximately $0.04 per share, recorded in the fourth quarter of 2017 due to the reduction in our net deferred tax asset balance as a result of the Tax Cut and Jobs Act signed into law on December 22, 2017. Refer to Note 16 for additional information. |
F-15
SIRIUS XM HOLDINGS INC. AND SUBSIDIARIES
NOTES TO CONSOLIDATED FINANCIAL STATEMENTS - Continued
(Dollars and shares in thousands, except per share amounts)
(6) | Receivables, net |
Receivables, net, includes customer accounts receivable, receivables from distributors and other receivables.
Customer accounts receivable, net, includes receivables from our subscribers and other customers, including advertising, and is stated at amounts due, net of an allowance for doubtful accounts. Our allowance for doubtful accounts is based upon our assessment of various factors. We consider historical experience, the age of the receivable balances, current economic conditions and other factors that may affect the counterparty’s ability to pay. Bad debt expense is included in Customer service and billing expense in our consolidated statements of comprehensive income.
Receivables from distributors primarily include billed and unbilled amounts due from OEMs for services included in the sale or lease price of vehicles, as well as billed amounts due from wholesale distributors of our satellite radios. Other receivables primarily include amounts due from manufacturers of our radios, modules and chipsets where we are entitled to subsidies and royalties based on the number of units produced. We have not established an allowance for doubtful accounts for our receivables from distributors or other receivables as we have historically not experienced any significant collection issues with OEMs or other third parties.
Receivables, net, consists of the following:
December 31, 2017 | December 31, 2016 | ||||||
Gross customer accounts receivable | $ | 100,342 | $ | 105,737 | |||
Allowance for doubtful accounts | (9,500 | ) | (8,658 | ) | |||
Customer accounts receivable, net | $ | 90,842 | $ | 97,079 | |||
Receivables from distributors | 121,410 | 98,498 | |||||
Other receivables | 29,475 | 27,452 | |||||
Total receivables, net | $ | 241,727 | $ | 223,029 | |||
(7) | Inventory, net |
Inventory consists of finished goods, refurbished goods, chipsets and other raw material components used in manufacturing radios and connected vehicle devices. Inventory is stated at the lower of cost or market. We record an estimated allowance for inventory that is considered slow moving or obsolete or whose carrying value is in excess of net realizable value. The provision related to products purchased for resale in our direct to consumer distribution channel and components held for resale by us is reported as a component of Cost of equipment in our consolidated statements of comprehensive income. The provision related to inventory consumed in our OEM channel is reported as a component of Subscriber acquisition costs in our consolidated statements of comprehensive income.
Inventory, net, consists of the following:
December 31, 2017 | December 31, 2016 | ||||||
Raw materials | $ | 6,489 | $ | 10,219 | |||
Finished goods | 21,225 | 19,581 | |||||
Allowance for obsolescence | (7,515 | ) | (9,437 | ) | |||
Total inventory, net | $ | 20,199 | $ | 20,363 | |||
(8) | Goodwill |
Goodwill represents the excess of the purchase price over the estimated fair value of the net tangible and identifiable intangible assets acquired in business combinations. Our annual impairment assessment of our single reporting unit is performed as of the fourth quarter of each year, and an assessment is performed at other times if an event occurs or circumstances change that would more likely than not reduce the fair value of a reporting unit below its carrying amount. We adopted ASU 2017-04, Intangibles - Goodwill and Other (Topic 350), during the fourth quarter of 2017. ASC 350 states that an entity should perform its annual or interim goodwill impairment test by comparing the fair value of a reporting unit with its carrying amount and recognize an impairment charge for the amount by which the carrying amount exceeds the reporting unit’s
F-16
SIRIUS XM HOLDINGS INC. AND SUBSIDIARIES
NOTES TO CONSOLIDATED FINANCIAL STATEMENTS - Continued
(Dollars and shares in thousands, except per share amounts)
fair value. Under the updated guidance, the requirements for any reporting unit with a zero or negative carrying amount to perform a qualitative assessment is eliminated. The carrying amount and goodwill recorded for our one reporting unit was $(1,523,874) and $2,286,582, respectively, as of December 31, 2017. We were not aware of any adverse qualitative factors that would indicate any impairment to our goodwill as of the date of our annual assessment for 2017 and as of December 31, 2017.
No impairment losses were recorded for goodwill during the years ended December 31, 2017, 2016 and 2015. As of December 31, 2017, the cumulative balance of goodwill impairments recorded since the July 2008 merger (the “Merger”) between our wholly owned subsidiary, Vernon Merger Corporation, and XM Satellite Radio Holdings Inc. (“XM”), was $4,766,190, which was recognized during the year ended December 31, 2008.
As a result of the acquisition of Automatic, we recorded additional goodwill of $81,475 during the year ended December 31, 2017.
(9) | Intangible Assets |
Our intangible assets include the following:
December 31, 2017 | December 31, 2016 | ||||||||||||||||||||||||
Weighted Average Useful Lives | Gross Carrying Value | Accumulated Amortization | Net Carrying Value | Gross Carrying Value | Accumulated Amortization | Net Carrying Value | |||||||||||||||||||
Indefinite life intangible assets: | |||||||||||||||||||||||||
FCC licenses | Indefinite | $ | 2,083,654 | $ | — | $ | 2,083,654 | $ | 2,083,654 | $ | — | $ | 2,083,654 | ||||||||||||
Trademarks | Indefinite | 250,800 | — | 250,800 | 250,000 | — | 250,000 | ||||||||||||||||||
Definite life intangible assets: | |||||||||||||||||||||||||
Subscriber relationships | 9 years | 380,000 | (380,000 | ) | — | 380,000 | (364,893 | ) | 15,107 | ||||||||||||||||
OEM relationships | 15 years | 220,000 | (61,111 | ) | 158,889 | 220,000 | (46,444 | ) | 173,556 | ||||||||||||||||
Licensing agreements | 12 years | 45,289 | (34,350 | ) | 10,939 | 45,289 | (30,664 | ) | 14,625 | ||||||||||||||||
Software and technology | 7 years | 43,915 | (25,351 | ) | 18,564 | 29,215 | (21,356 | ) | 7,859 | ||||||||||||||||
Total intangible assets | $ | 3,023,658 | $ | (500,812 | ) | $ | 2,522,846 | $ | 3,008,158 | $ | (463,357 | ) | $ | 2,544,801 | |||||||||||
Indefinite Life Intangible Assets
We have identified our FCC licenses and the XM trademark as indefinite life intangible assets after considering the expected use of the assets, the regulatory and economic environment within which they are used and the effects of obsolescence on their use. As part of the Automatic acquisition in April 2017, we have also identified $800 related to its trademark.
We hold FCC licenses to operate our satellite digital audio radio service and provide ancillary services. The following table outlines the years in which each of our satellite licenses expires:
FCC satellite licenses | Expiration year | |
SIRIUS FM-5 | 2025 | |
SIRIUS FM-6 | 2022 | |
XM-3 | 2021 | |
XM-4 | 2022 | |
XM-5 | 2018 | |
Prior to expiration, we are required to apply for a renewal of our FCC licenses. The renewal and extension of our licenses is reasonably certain at minimal cost, which is expensed as incurred. Each of the FCC licenses authorizes us to use the radio spectrum, which is a renewable, reusable resource that does not deplete or exhaust over time.
ASC 350-30-35, Intangibles - Goodwill and Other, provides for an option to first perform a qualitative assessment to determine whether it is more likely than not that an asset is impaired. If the qualitative assessment supports that it is more likely
F-17
SIRIUS XM HOLDINGS INC. AND SUBSIDIARIES
NOTES TO CONSOLIDATED FINANCIAL STATEMENTS - Continued
(Dollars and shares in thousands, except per share amounts)
than not that the fair value of the asset exceeds its carrying value, a quantitative impairment test is not required. If the qualitative assessment does not support the fair value of the asset, then a quantitative assessment is performed. Our annual impairment assessment of our identifiable indefinite lived intangible assets is performed as of the fourth quarter of each year. An assessment is performed at other times if an event occurs or circumstances change that would more likely than not reduce the fair value of the asset below its carrying value. If the carrying value of the intangible assets exceeds its fair value, an impairment loss is recognized in an amount equal to that excess.
We completed qualitative assessments of our FCC licenses and XM trademark during the fourth quarter of 2017, 2016 and 2015. As of the date of our annual assessment for 2017, 2016 and 2015, our qualitative impairment assessment of the fair value of our indefinite intangible assets indicated that such assets substantially exceeded their carrying value and therefore was not at risk of impairment. No impairments were recorded for intangible assets with indefinite lives during the years ended December 31, 2017, 2016 and 2015.
Definite Life Intangible Assets
Definite-lived intangible assets are amortized over their respective estimated useful lives to their estimated residual values, in a pattern that reflects when the economic benefits will be consumed, and are reviewed for impairment under the provisions of ASC 360-10-35, Property, Plant and Equipment/Overall/Subsequent Measurement. We review intangible assets subject to amortization for impairment whenever events or circumstances indicate that the carrying amount of an asset may not be recoverable. If the sum of the expected cash flows, undiscounted and without interest, is less than the carrying amount of the asset, an impairment loss is recognized in an amount by which the carrying amount of the asset exceeds its fair value. No impairments were recorded for intangible assets with definite lives during the years ended December 31, 2017, 2016 and 2015.
As part of the Automatic acquisition in April 2017, $14,700 was allocated to identifiable intangible assets subject to amortization and relates to the assessed fair value of software and technology. Amortization expense for all definite life intangible assets was $37,455, $48,545 and $51,700 for the years ended December 31, 2017, 2016 and 2015, respectively. Expected amortization expense for the each of the fiscal years 2018 through 2022 and for periods thereafter is as follows:
Years ending December 31, | Amount | |||
2018 | $ | 23,138 | ||
2019 | 22,701 | |||
2020 | 22,121 | |||
2021 | 16,678 | |||
2022 | 15,542 | |||
Thereafter | 88,212 | |||
Total definite life intangible assets, net | $ | 188,392 | ||
(10) | Property and Equipment |
Property and equipment, including satellites, are stated at cost, less accumulated depreciation. Equipment under capital leases is stated at the present value of minimum lease payments. Depreciation is calculated using the straight-line method over the following estimated useful life of the asset:
Satellite system | 15 years |
Terrestrial repeater network | 5 - 15 years |
Broadcast studio equipment | 3 - 15 years |
Capitalized software and hardware | 2 - 7 years |
Satellite telemetry, tracking and control facilities | 3 - 15 years |
Furniture, fixtures, equipment and other | 2 - 7 years |
Building | 20 or 30 years |
Leasehold improvements | Lesser of useful life or remaining lease term |
F-18
SIRIUS XM HOLDINGS INC. AND SUBSIDIARIES
NOTES TO CONSOLIDATED FINANCIAL STATEMENTS - Continued
(Dollars and shares in thousands, except per share amounts)
We review long-lived assets, such as property and equipment, for impairment whenever events or changes in circumstances indicate the carrying amount may not be recoverable. Recoverability of assets to be held and used is measured by a comparison of the carrying amount of an asset to the estimated undiscounted future cash flows expected to be generated by the asset. If the carrying amount of an asset exceeds the estimated future cash flows, an impairment charge is recognized in an amount by which the carrying amount exceeds the fair value of the asset. We did not record any impairments during the years ended December 31, 2017, 2016 and 2015.
Property and equipment, net, consists of the following:
December 31, 2017 | December 31, 2016 | ||||||
Satellite system | $ | 1,586,794 | $ | 1,586,794 | |||
Terrestrial repeater network | 123,254 | 127,854 | |||||
Leasehold improvements | 57,635 | 53,898 | |||||
Broadcast studio equipment | 96,582 | 84,697 | |||||
Capitalized software and hardware | 639,516 | 558,101 | |||||
Satellite telemetry, tracking and control facilities | 69,147 | 77,290 | |||||
Furniture, fixtures, equipment and other | 96,965 | 90,214 | |||||
Land | 38,411 | 38,411 | |||||
Building | 61,824 | 61,597 | |||||
Construction in progress | 301,153 | 144,954 | |||||
Total property and equipment | 3,071,281 | 2,823,810 | |||||
Accumulated depreciation and amortization | (1,608,515 | ) | (1,425,117 | ) | |||
Property and equipment, net | $ | 1,462,766 | $ | 1,398,693 | |||
Construction in progress consists of the following:
December 31, 2017 | December 31, 2016 | ||||||
Satellite system | $ | 183,243 | $ | 43,977 | |||
Terrestrial repeater network | 2,515 | 1,139 | |||||
Capitalized software and hardware | 94,456 | 82,204 | |||||
Other | 20,939 | 17,634 | |||||
Construction in progress | $ | 301,153 | $ | 144,954 | |||
Depreciation and amortization expense on property and equipment was $261,147, $220,434 and $220,514 for the years ended December 31, 2017, 2016 and 2015, respectively. We retired property and equipment of $78,559, $843,129 and $43,833 during the years ended December 31, 2017, 2016 and 2015, respectively, which included approximately $801,206 related to satellites during 2016. We recognized a loss on disposal of assets of $12,912 and $7,384, which was recorded in Satellite and transmission expense in our consolidated statements of comprehensive income, during the years ended December 31, 2016 and 2015, respectively, which related to the disposal of certain obsolete spare parts for a future satellite and obsolete terrestrial repeaters and related parts, respectively. We did not recognize any loss on disposal of assets during the year ended December 31, 2017.
We capitalize a portion of the interest on funds borrowed to finance the construction and launch of our satellites and launch vehicles. Capitalized interest is recorded as part of the asset’s cost and depreciated over the satellite’s useful life. Capitalized interest costs were $4,948 and $419 for the years ended December 31, 2017 and 2016, respectively, which related to the construction of our SXM-7 and SXM-8 satellites. We did not capitalize any interest costs for the year ended December 31, 2015.
F-19
SIRIUS XM HOLDINGS INC. AND SUBSIDIARIES
NOTES TO CONSOLIDATED FINANCIAL STATEMENTS - Continued
(Dollars and shares in thousands, except per share amounts)
Satellites
As of December 31, 2017, we owned a fleet of five satellites. The chart below provides certain information on our satellites as of December 31, 2017:
Satellite Description | Year Delivered | Estimated End of Depreciable Life | ||
SIRIUS FM-5 | 2009 | 2024 | ||
SIRIUS FM-6 | 2013 | 2028 | ||
XM-3 | 2005 | 2020 | ||
XM-4 | 2006 | 2021 | ||
XM-5 | 2010 | 2025 | ||
(11) | Related Party Transactions |
In the normal course of business, we enter into transactions with related parties.
Liberty Media
As of December 31, 2017, Liberty Media beneficially owned, directly and indirectly, approximately 70% of the outstanding shares of our common stock. Liberty Media has two executives and one of its directors on our board of directors. Gregory B. Maffei, the President and Chief Executive Officer of Liberty Media, is the Chairman of our board of directors.
Sirius XM Canada
On May 25, 2017, Sirius XM completed a recapitalization of Sirius XM Canada (the “Transaction”), which is now a privately held corporation.
Following the Transaction, Sirius XM holds a 70% equity interest and 33% voting interest in Sirius XM Canada, with the remainder of the voting power and equity interests held by two of Sirius XM Canada’s previous shareholders. The total consideration from Sirius XM to Sirius XM Canada, excluding transaction costs, during the year ended December 31, 2017 was $308,526, which included $129,676 in cash and we issued 35,000 shares of our common stock with an aggregate value of $178,850 to the holders of the shares of Sirius XM Canada acquired in the Transaction. Sirius XM received common stock, non-voting common stock and preferred stock of Sirius XM Canada. We own 590,950 shares of preferred stock of Sirius XM Canada, which has a liquidation preference of one Canadian dollar per share.
In connection with the Transaction, Sirius XM also made a contribution in the form of a loan to Sirius XM Canada in the aggregate amount of $130,794. The loan is denominated in Canadian dollars and is considered a long-term investment with any unrealized gains or losses reported within Accumulated other comprehensive (loss) income. The loan has a term of fifteen years, bears interest at a rate of 7.62% per annum and includes customary covenants and events of default, including an event of default relating to Sirius XM Canada’s failure to maintain specified leverage ratios. The terms of the loan require Sirius XM Canada to prepay a portion of the outstanding principal amount of the loan within sixty days of the end of each fiscal year in an amount equal to any cash on hand in excess of C$10,000 at the last day of the financial year if all target dividends have been paid in full.
In connection with the Transaction, Sirius XM also entered into a Services Agreement and an Advisory Services Agreement with Sirius XM Canada. Each agreement has a thirty year term. Pursuant to the Services Agreement, Sirius XM Canada will pay Sirius XM 25% of its gross revenues on a monthly basis through December 31, 2021 and 30% of its gross revenues on a monthly basis thereafter. Pursuant to the Advisory Services Agreement, Sirius XM Canada will pay Sirius XM 5% of its gross revenues on a monthly basis. These agreements superseded and replaced the former agreements between Sirius XM Canada and its predecessors and Sirius XM.
Sirius XM Canada is accounted for as an equity method investment, and its results are not consolidated in our consolidated financial statements. Sirius XM Canada does not meet the requirements for consolidation as we do not have the ability to direct the most significant activities that impact Sirius XM Canada's economic performance.
F-20
SIRIUS XM HOLDINGS INC. AND SUBSIDIARIES
NOTES TO CONSOLIDATED FINANCIAL STATEMENTS - Continued
(Dollars and shares in thousands, except per share amounts)
The difference between our investment and our share of the fair value of the underlying net assets of Sirius XM Canada is first allocated to either finite-lived intangibles or indefinite-lived intangibles and the balance is attributed to goodwill. We follow ASC 350, Intangibles - Goodwill and Other, which requires that equity method finite-lived intangibles be amortized over their estimated useful life while indefinite-lived intangibles and goodwill are not amortized. The amortization of equity method finite-lived intangible assets is recorded in Other income in our consolidated statements of comprehensive income. We periodically evaluate our equity method investments to determine if there has been an other-than temporary decline in fair value below carrying value. Equity method finite-lived intangibles, indefinite-lived intangibles and goodwill are included in the carrying amount of the investment.
We had the following related party balances associated with Sirius XM Canada:
December 31, 2017 | December 31, 2016 | ||||||
Related party current assets | $ | 10,284 | $ | 6,170 | |||
Related party long-term assets | $ | 481,608 | $ | 8,918 | |||
Related party current liabilities | $ | 2,839 | $ | 2,840 | |||
Related party long-term liabilities | $ | 7,364 | $ | 7,955 | |||
Under the former agreement with Sirius XM Canada, as of December 31, 2016, our related party current assets balance primarily consisted of activation fees and streaming and chipset costs for which we were reimbursed. As of December 31, 2017, our related party current asset balance included amounts due under the Services Agreement and Advisory Services Agreement and certain amounts related to transactions outside the scope of the new services arrangements. Our related party long-term assets balance as of December 31, 2017 and December 31, 2016 included the carrying value of our investment balance in Sirius XM Canada of $341,214 and $8,615, respectively, and, as of December 31, 2017, also included $140,073 for the current value of the outstanding loan to Sirius XM Canada. Our related party liabilities as of each of December 31, 2017 and December 31, 2016 included $2,776 for the current portion of deferred revenue and $5,088 and $7,867, respectively, for the long-term portion of deferred revenue recorded as of the Merger date related to agreements with legacy XM Canada, now Sirius XM Canada. These costs are being amortized on a straight line basis through 2020.
We recorded the following revenue and other income associated with Sirius XM Canada in our consolidated statements of comprehensive income:
For the Years Ended December 31, | |||||||||||
2017 | 2016 | 2015 | |||||||||
Revenue (a)(b) | $ | 87,111 | $ | 45,962 | $ | 56,397 | |||||
Other income | |||||||||||
Share of net earnings (b) | $ | 4,561 | $ | 12,529 | $ | — | |||||
Dividends (c) | $ | — | $ | 3,575 | $ | 12,645 | |||||
Interest income (d) | $ | 6,243 | $ | — | $ | — | |||||
(a) | Prior to the Transaction, under our former agreements with Sirius XM Canada, we received a percentage-based fee of 10% and 15% for certain types of subscription revenue earned by Sirius XM Canada for the use of the Sirius and XM platforms, respectively, and additional fees for premium services and fees for activation fees and reimbursements for other charges. We record revenue from Sirius XM Canada as Other revenue in our consolidated statements of comprehensive income. |
(b) | Prior to the Transaction, we recognized our proportionate share of revenue and earnings or losses attributable to Sirius XM Canada on a one month lag. As a result of the Transaction, there is no longer a one-month lag and Sirius XM Canada changed its fiscal year-end to December 31 to align with that of Sirius XM. For the year ended December 31, 2017 this amount included $1,501 of amortization related to equity method intangible assets. |
(c) | Sirius XM Canada paid gross dividends to us of $3,796, $7,548 and $15,645 during the years ended December 31, 2017, 2016 and 2015, respectively. These dividends were first recorded as a reduction to our investment balance in Sirius XM Canada to the extent a balance existed and then as Other income for the remaining portion. |
(d) | This interest income relates to the loan to Sirius XM Canada and is recorded as Other income in our consolidated statements of comprehensive income. |
F-21
SIRIUS XM HOLDINGS INC. AND SUBSIDIARIES
NOTES TO CONSOLIDATED FINANCIAL STATEMENTS - Continued
(Dollars and shares in thousands, except per share amounts)
Pandora
On September 22, 2017, Sirius XM completed a $480,000 investment in Pandora. Pursuant to an Investment Agreement with Pandora, Sirius XM purchased 480 shares of Pandora’s Series A Convertible Preferred Stock, par value $0.0001 per share (the “Series A Preferred Stock”), for an aggregate purchase price of $480,000. The Series A Preferred Stock, including accrued but unpaid dividends, represents a stake of approximately 19% of Pandora's currently outstanding common stock, and approximately a 16% interest on an as-converted basis. Pandora operates an internet-based music discovery platform, offering a personalized experience for listeners.
The Series A Preferred Stock is convertible at the option of the holders at any time into shares of common stock of Pandora (“Pandora Common Stock”) at an initial conversion price of $10.50 per share of Pandora Common Stock and an initial conversion rate of 95.2381 shares of Pandora Common Stock per share of Series A Preferred Stock, subject to certain customary anti-dilution adjustments. Holders of the Series A Preferred Stock are entitled to a cumulative dividend at the rate of 6.0% per annum, payable quarterly in arrears, if and when declared. Pandora has the option to pay dividends in cash when authorized by their Board and declared by Pandora or accumulate dividends in lieu of paying cash. Any conversion of Series A Preferred Stock may be settled by Pandora, at its option, in shares of Pandora Common Stock, cash or any combination thereof. However, unless and until Pandora’s stockholders have approved the issuance of greater than 19.99% of the outstanding Pandora Common Stock, the Series A Preferred Stock may not be converted into more than 19.99% of Pandora’s outstanding Pandora Common Stock as of June 9, 2017. The liquidation preference of the Series A Preferred Stock, including accrued dividends of $10,849, was $490,849 as of December 31, 2017.
The investment includes a mandatory redemption feature on any date from and after September 22, 2022 whereby Sirius XM, at its option, may require Pandora to purchase the Series A Preferred Stock at a price equal to 100% of the liquidation preference plus accrued but unpaid dividends for, at the election of Pandora, cash, shares of Pandora Common Stock or a combination thereof, and as such the investment qualifies as a debt security under ASC 320, Investments-Debt and Equity Securities. As the investment includes a conversion option, we have elected to account for this investment under the fair value option to reduce the accounting asymmetry that would otherwise arise when recognizing the changes in the fair value of available-for-sale investments. Under the fair value option, any gains (losses) associated with the change in fair value will be recognized in Other income within our consolidated statements of comprehensive income. A $472 unrealized gain was recognized during the year ended December 31, 2017 as Other income in our consolidated statements of comprehensive income associated with this investment. The fair value of our investment, including accrued dividends, as of December 31, 2017 was $480,472 and is recorded as a related party long-term asset within our consolidated balance sheets. This investment does not meet the requirements for the equity method of accounting as it does not qualify as in-substance common stock.
We have appointed James E. Meyer, our Chief Executive Officer, David J. Frear, our Senior Executive Vice President and Chief Financial Officer, and Gregory B. Maffei, the Chairman of our Board of Directors, to Pandora's Board of Directors pursuant to our designation rights under the Investment Agreement. Mr. Maffei also serves as the Chairman of Pandora's Board of Directors.
Upon certain change of control events involving Pandora, Pandora is required to repurchase all of the Series A Preferred Stock at a price equal to the greater of (1) an amount in cash equal to 100% of the liquidation preference thereof plus all accrued but unpaid dividends through June 9, 2022 (assuming such shares of Series A Preferred Stock remain outstanding through such date) and (2) the consideration the holders would have received if they had converted their shares of Series A Preferred Stock into Pandora Common Stock immediately prior to the change of control event (disregarding the 19.99% cap).
Beginning on September 22, 2020, if the volume weighted average price per share of Pandora Common Stock exceeds $18.375, as may be adjusted, for at least 20 trading days in any period of 30 consecutive trading days, Pandora may redeem all of the outstanding Series A Preferred Stock at a price equal to 100% of the liquidation preference thereof plus all accrued but unpaid dividends for, at the election of Pandora, cash, shares of Pandora Common Stock or a combination thereof, provided that, unless stockholder approval has been received, Pandora may not settle the redemption for shares of Pandora Common Stock to the extent the 19.99% cap would be exceeded.
F-22
SIRIUS XM HOLDINGS INC. AND SUBSIDIARIES
NOTES TO CONSOLIDATED FINANCIAL STATEMENTS - Continued
(Dollars and shares in thousands, except per share amounts)
(12) | Debt |
Our debt as of December 31, 2017 and 2016 consisted of the following:
Carrying value(a) at | ||||||||||||||||||||
Issuer / Borrower | Issued | Debt | Maturity Date | Interest Payable | Principal Amount at December 31, 2017 | December 31, 2017 | December 31, 2016 | |||||||||||||
Sirius XM (b)(e) | May 2013 | 4.25% Senior Notes (the "4.25% Notes") | May 15, 2020 | semi-annually on May 15 and November 15 | $ | — | $ | — | $ | 497,069 | ||||||||||
Sirius XM (b)(f) | August 2013 | 5.75% Senior Notes (the "5.75% Notes") | August 1, 2021 | semi-annually on February 1 and August 1 | — | — | 596,386 | |||||||||||||
Sirius XM (b)(g) | July 2017 | 3.875% Senior Notes (the "3.875% Notes") | August 1, 2022 | semi-annually on February 1 and August 1 | 1,000,000 | 992,011 | — | |||||||||||||
Sirius XM (b) | May 2013 | 4.625% Senior Notes (the "4.625% Notes") | May 15, 2023 | semi-annually on May 15 and November 15 | 500,000 | 496,646 | 496,111 | |||||||||||||
Sirius XM (b) | May 2014 | 6.00% Senior Notes (the "6.00% Notes") | July 15, 2024 | semi-annually on January 15 and July 15 | 1,500,000 | 1,488,002 | 1,486,556 | |||||||||||||
Sirius XM (b) | March 2015 | 5.375% Senior Notes (the "5.375% Notes due 2025") | April 15, 2025 | semi-annually on April 15 and October 15 | 1,000,000 | 991,285 | 990,340 | |||||||||||||
Sirius XM (b) | May 2016 | 5.375% Senior Notes (the "5.375% Notes due 2026") | July 15, 2026 | semi-annually on January 15 and July 15 | 1,000,000 | 990,138 | 989,259 | |||||||||||||
Sirius XM (b)(g) | July 2017 | 5.00% Senior Notes (the "5.00% Notes") | August 1, 2027 | semi-annually on February 1 and August 1 | 1,500,000 | 1,486,162 | — | |||||||||||||
Sirius XM (b)(c)(h) | August 2012 | 5.25% Senior Secured Notes (the "5.25% Notes") | August 15, 2022 | semi-annually on February 15 and August 15 | — | — | 396,232 | |||||||||||||
Sirius XM (d) | December 2012 | Senior Secured Revolving Credit Facility (the "Credit Facility") | June 16, 2020 | variable fee paid quarterly | 1,750,000 | 300,000 | 390,000 | |||||||||||||
Sirius XM | Various | Capital leases | Various | n/a | n/a | 10,597 | 13,559 | |||||||||||||
Total Debt | 6,754,841 | 5,855,512 | ||||||||||||||||||
Less: total current maturities | 5,105 | 5,485 | ||||||||||||||||||
Less: total deferred financing costs for Notes | 8,493 | 7,263 | ||||||||||||||||||
Total long-term debt | $ | 6,741,243 | $ | 5,842,764 | ||||||||||||||||
(a) | The carrying value of the obligations is net of any remaining unamortized original issue discount. |
(b) | Substantially all of our domestic wholly-owned subsidiaries have guaranteed these notes. |
(c) | The liens that secured the 5.25% Notes were equal and ratable to the liens granted to secure the Credit Facility. |
(d) | Sirius XM's obligations under the Credit Facility are guaranteed by certain of its material domestic subsidiaries and are secured by a lien on substantially all of Sirius XM's assets and the assets of its material domestic subsidiaries. Interest on borrowings is payable on a monthly basis and accrues at a rate based on LIBOR plus an applicable rate. Sirius XM is also required to pay a variable fee on the average daily unused portion of the Credit Facility which is payable on a quarterly basis. The variable rate for the unused portion of the Credit Facility was 0.25% per annum as of December 31, 2017. Sirius XM's outstanding borrowings under the Credit Facility are classified as Long-term debt within our consolidated balance sheets due to the long-term maturity of this debt. |
(e) | On July 27, 2017, Sirius XM redeemed $500,000 in outstanding principal amount of the 4.25% Notes for an aggregate purchase price, including premium and interest, of $509,565. We recognized $8,393 to Loss on extinguishment of debt, consisting primarily of unamortized discount, deferred financing fees and repayment premium, as a result of this redemption. |
(f) | On August 4, 2017, Sirius XM redeemed $600,000 in outstanding principal amount of the 5.75% Notes for an aggregate purchase price, including premium and interest, of $617,538. We recognized $20,964 to Loss on extinguishment of debt, consisting primarily of unamortized discount, deferred financing fees and repayment premium, as a result of this redemption. |
(g) | In July 2017, Sirius XM issued $1,000,000 aggregate principal amount of the 3.875% Notes and $1,500,000 aggregate principal amount of the 5.00% Notes with a net original issuance discount and deferred financing costs in the aggregate of $10,291 and $16,638, respectively. |
F-23
SIRIUS XM HOLDINGS INC. AND SUBSIDIARIES
NOTES TO CONSOLIDATED FINANCIAL STATEMENTS - Continued
(Dollars and shares in thousands, except per share amounts)
(h) | On September 1, 2017, Sirius XM redeemed $400,000 in outstanding principal amount of the 5.25% Notes for an aggregate purchase price, including premium and interest, of $411,433. We recognized $14,322 to Loss on extinguishment of debt, consisting primarily of unamortized discount, deferred financing fees and repayment premium, as a result of this redemption. All security interests and other liens securing the 5.25% Notes were released. |
Covenants and Restrictions
Under the Credit Facility, Sirius XM, our wholly-owned subsidiary, must comply with a debt maintenance covenant that it cannot exceed a total leverage ratio, calculated as consolidated total debt to consolidated operating cash flow, of 5.0 to 1.0. The Credit Facility generally requires compliance with certain covenants that restrict Sirius XM's ability to, among other things, (i) incur additional indebtedness, (ii) incur liens, (iii) pay dividends or make certain other restricted payments, investments or acquisitions, (iv) enter into certain transactions with affiliates, (v) merge or consolidate with another person, (vi) sell, assign, lease or otherwise dispose of all or substantially all of Sirius XM's assets, and (vii) make voluntary prepayments of certain debt, in each case subject to exceptions.
The indentures governing Sirius XM's notes restrict Sirius XM's non-guarantor subsidiaries' ability to create, assume, incur or guarantee additional indebtedness without such non-guarantor subsidiary guaranteeing each such series of notes on a pari passu basis. The indentures governing the notes also contain covenants that, among other things, limit Sirius XM's ability and the ability of its subsidiaries to create certain liens; enter into sale/leaseback transactions; and merge or consolidate.
Under Sirius XM's debt agreements, the following generally constitute an event of default: (i) a default in the payment of interest; (ii) a default in the payment of principal; (iii) failure to comply with covenants; (iv) failure to pay other indebtedness after final maturity or acceleration of other indebtedness exceeding a specified amount; (v) certain events of bankruptcy; (vi) a judgment for payment of money exceeding a specified aggregate amount; and (vii) voidance of subsidiary guarantees, subject to grace periods where applicable. If an event of default occurs and is continuing, our debt could become immediately due and payable.
At December 31, 2017 and 2016, we were in compliance with our debt covenants.
(13) | Stockholders’ Equity |
Common Stock, par value $0.001 per share
We are authorized to issue up to 9,000,000 shares of common stock. There were 4,530,928 and 4,746,047 shares of common stock issued and 4,527,742 and 4,740,947 shares outstanding on December 31, 2017 and 2016, respectively. As part of the recapitalization of Sirius XM Canada, we issued 35,000 shares of our common stock to the holders of the shares of Sirius XM Canada.
As of December 31, 2017, there were 311,780 shares of common stock reserved for issuance in connection with outstanding stock based awards and common stock to be granted to members of our board of directors, employees and third parties.
Quarterly Dividends
During the year ended December 31, 2017, our board of directors declared the following dividends:
Declaration Date | Dividend Per Share | Record Date | Total Amount | Payment Date | ||||||||
January 24, 2017 | $ | 0.010 | February 7, 2017 | $ | 47,137 | February 28, 2017 | ||||||
April 25, 2017 | $ | 0.010 | May 10, 2017 | $ | 46,501 | May 31, 2017 | ||||||
July 11, 2017 | $ | 0.010 | August 10, 2017 | $ | 46,216 | August 31, 2017 | ||||||
October 3, 2017 | $ | 0.011 | November 9, 2017 | $ | 50,388 | November 30, 2017 | ||||||
F-24
SIRIUS XM HOLDINGS INC. AND SUBSIDIARIES
NOTES TO CONSOLIDATED FINANCIAL STATEMENTS - Continued
(Dollars and shares in thousands, except per share amounts)
Stock Repurchase Program
As of December 31, 2017, our board of directors had approved for repurchase an aggregate of $10,000,000 of our common stock. Our board of directors did not establish an end date for this stock repurchase program. Shares of common stock may be purchased from time to time on the open market, pursuant to pre-set trading plans meeting the requirements of Rule 10b5-1 under the Exchange Act, in privately negotiated transactions, including transactions with Liberty Media and its affiliates, or otherwise. As of December 31, 2017, our cumulative repurchases since December 2012 under our stock repurchase program totaled 2,474,135 shares for $9,377,120, and $622,880 remained available under our stock repurchase program.
The following table summarizes our total share repurchase activity for the years ended:
December 31, 2017 | December 31, 2016 | December 31, 2015 | |||||||||||||||||||
Share Repurchase Type | Shares | Amount | Shares | Amount | Shares | Amount | |||||||||||||||
Open Market (a) | 270,527 | $ | 1,403,283 | 420,111 | $ | 1,672,697 | 524,222 | $ | 2,015,947 | ||||||||||||
(a) | As of December 31, 2017, $17,154 of common stock repurchases had not settled, nor been retired, and were recorded as Treasury stock within our consolidated balance sheets and consolidated statements of stockholders’ (deficit) equity. For a discussion of subsequent events refer to Note 17. |
Preferred Stock, par value $0.001 per share
We are authorized to issue up to 50,000 shares of undesignated preferred stock with a liquidation preference of $0.001 per share. There were no shares of preferred stock issued or outstanding as of December 31, 2017 and 2016.
(14) | Benefit Plans |
We recognized share-based payment expense of $124,069, $108,604 and $84,310 for the years ended December 31, 2017, 2016 and 2015, respectively.
We account for equity instruments granted to employees in accordance with ASC 718, Compensation - Stock Compensation. ASC 718 requires all share-based compensation payments to be recognized in the financial statements based on fair value. Upon adoption of ASU 2016-09 as of January 1, 2016 we recorded actual forfeitures and no longer estimate forfeitures. For the year ended December 31, 2015, we estimated forfeitures at the time of the grant. We use the Black-Scholes-Merton option-pricing model to value stock option awards and have elected to treat awards with graded vesting as a single award. Share-based compensation expense is recognized ratably over the requisite service period, which is generally the vesting period. We measure restricted stock awards and units using the fair market value of the restricted shares of common stock on the day the award is granted. Stock-based awards granted to employees, non-employees and members of our board of directors include stock options, stock awards and restricted stock units. We apply variable accounting to our non-employee stock-based awards, whereby we remeasure the value of such awards at each balance sheet date.
Fair value as determined using the Black-Scholes-Merton model varies based on assumptions used for the expected life, expected stock price volatility, expected dividend yield and risk-free interest rates. For the years ended December 31, 2017, 2016 and 2015, we estimated the fair value of awards granted using the hybrid approach for volatility, which weights observable historical volatility and implied volatility of qualifying actively traded options on our common stock. The expected life assumption represents the weighted-average period stock-based awards are expected to remain outstanding. These expected life assumptions are established through a review of historical exercise behavior of stock-based award grants with similar vesting periods. Where historical patterns do not exist, contractual terms are used. Dividend yield is based on the current expected annual dividend per share and our stock price. The risk-free interest rate represents the daily treasury yield curve rate at the grant date based on the closing market bid yields on actively traded U.S. treasury securities in the over-the-counter market for the expected term. Our assumptions may change in future periods.
2015 Long-Term Stock Incentive Plan
In May 2015, our stockholders approved the Sirius XM Holdings Inc. 2015 Long-Term Stock Incentive Plan (the “2015 Plan”). Employees, consultants and members of our board of directors are eligible to receive awards under the 2015 Plan. The 2015 Plan provides for the grant of stock options, restricted stock awards, restricted stock units and other stock-based awards that the compensation committee of our board of directors deem appropriate. Stock-based awards granted under the 2015 Plan
F-25
SIRIUS XM HOLDINGS INC. AND SUBSIDIARIES
NOTES TO CONSOLIDATED FINANCIAL STATEMENTS - Continued
(Dollars and shares in thousands, except per share amounts)
are generally subject to a graded vesting requirement, which is generally three to four years from the grant date. Stock options generally expire ten years from the date of grant. Restricted stock units include performance-based restricted stock units (“PRSUs”), the vesting of which are subject to the achievement of performance goals and the employee's continued employment and generally cliff vest on the three-year anniversary of the grant date. Each restricted stock unit entitles the holder to receive one share of common stock upon vesting. As of December 31, 2017, 171,388 shares of common stock were available for future grants under the 2015 Plan.
Other Plans
We maintain three other share-based benefit plans — the Sirius XM Radio Inc. 2009 Long-Term Stock Incentive Plan, the XM 2007 Stock Incentive Plan and the Amended and Restated Sirius Satellite Radio 2003 Long-Term Stock Incentive Plan. Excluding dividend equivalent units granted as a result of a declared dividend, no further awards may be made under these plans.
The following table summarizes the weighted-average assumptions used to compute the fair value of options granted to employees and members of our board of directors:
For the Years Ended December 31, | |||||
2017 | 2016 | 2015 | |||
Risk-free interest rate | 1.8% | 1.1% | 1.4% | ||
Expected life of options — years | 4.59 | 4.25 | 4.17 | ||
Expected stock price volatility | 24% | 22% | 26% | ||
Expected dividend yield | 0.7% | 0.0% | 0.0% | ||
The following table summarizes the weighted-average assumptions used to compute the fair value of options granted in 2015 to third parties, other than non-employee members of our board of directors:
For the Year Ended December 31, | |
2015 | |
Risk-free interest rate | 2.0% |
Expected life of options — years | 7.00 |
Expected stock price volatility | 37% |
Expected dividend yield | 0.0% |
There were no options granted to third parties during the years ended December 31, 2017 and 2016.
Since we did not historically pay dividends on our common stock prior to the fourth quarter of 2016, the expected dividend yield used in the Black-Scholes-Merton option-pricing model was less than one percent for the year ended December 31, 2016 and zero for the year ended December 31, 2015.
F-26
SIRIUS XM HOLDINGS INC. AND SUBSIDIARIES
NOTES TO CONSOLIDATED FINANCIAL STATEMENTS - Continued
(Dollars and shares in thousands, except per share amounts)
The following table summarizes stock option activity under our share-based plans for the years ended December 31, 2017, 2016 and 2015:
Options | Weighted- Average Exercise Price Per Share | Weighted- Average Remaining Contractual Term (Years) | Aggregate Intrinsic Value | |||||||||
Outstanding at the beginning of January 1, 2015 | 267,854 | $ | 2.72 | |||||||||
Granted | 145,366 | $ | 3.95 | |||||||||
Exercised | (57,667 | ) | $ | 1.88 | ||||||||
Forfeited, cancelled or expired | (17,072 | ) | $ | 4.60 | ||||||||
Outstanding as of December 31, 2015 | 338,481 | $ | 3.29 | |||||||||
Granted | 55,222 | $ | 4.14 | |||||||||
Exercised | (50,728 | ) | $ | 2.66 | ||||||||
Forfeited, cancelled or expired | (10,327 | ) | $ | 4.30 | ||||||||
Outstanding as of December 31, 2016 | 332,648 | $ | 3.50 | |||||||||
Granted | 27,339 | $ | 5.49 | |||||||||
Exercised | (73,296 | ) | $ | 3.21 | ||||||||
Forfeited, cancelled or expired | (6,234 | ) | $ | 4.07 | ||||||||
Outstanding as of December 31, 2017 | 280,457 | $ | 3.76 | 6.65 | $ | 453,955 | ||||||
Exercisable as of December 31, 2017 | 131,025 | $ | 3.23 | 5.47 | $ | 279,101 | ||||||
The weighted average grant date fair value per share of options granted during the years ended December 31, 2017, 2016 and 2015 was $1.17, $0.81 and $1.11, respectively. The total intrinsic value of stock options exercised during the years ended December 31, 2017, 2016 and 2015 was $166,517, $81,204, and $117,944, respectively. During the years ended December 31, 2017, 2016 and 2015 the number of net settled shares which were issued as a result of stock option exercises were 16,957, 10,918 and 17,652, respectively.
We recognized share-based payment expense associated with stock options of $78,491, $80,266 and $70,084 for the years ended December 31, 2017, 2016 and 2015, respectively.
The following table summarizes the restricted stock unit, including PRSU, activity under our share-based plans for the years ended December 31, 2017, 2016 and 2015:
Shares | Grant Date Fair Value Per Share | |||||
Nonvested at the beginning of January 1, 2015 | 11,575 | $ | 3.47 | |||
Granted | 8,961 | $ | 3.92 | |||
Vested | (3,464 | ) | $ | 3.44 | ||
Forfeited | (984 | ) | $ | 3.52 | ||
Nonvested as of December 31, 2015 | 16,088 | $ | 3.73 | |||
Granted | 18,523 | $ | 4.21 | |||
Vested | (4,212 | ) | $ | 3.68 | ||
Forfeited | (506 | ) | $ | 3.75 | ||
Nonvested as of December 31, 2016 | 29,893 | $ | 4.03 | |||
Granted | 11,721 | $ | 5.35 | |||
Vested | (8,842 | ) | $ | 3.92 | ||
Forfeited | (1,449 | ) | $ | 4.42 | ||
Nonvested as of December 31, 2017 | 31,323 | $ | 4.54 | |||
F-27
SIRIUS XM HOLDINGS INC. AND SUBSIDIARIES
NOTES TO CONSOLIDATED FINANCIAL STATEMENTS - Continued
(Dollars and shares in thousands, except per share amounts)
The total intrinsic value of restricted stock units and stock awards vesting during the years ended December 31, 2017, 2016 and 2015, was $48,473, $17,807 and $13,720, respectively. During the years ended December 31, 2017, 2016 and 2015 the number of net settled shares which were issued as a result of restricted stock units vesting and the number of share issued from stock awards granted totaled 5,365, 2,493 and 2,088, respectively. During the years ended December 31, 2017 and 2016, we granted 938 and 3,036 PRSUs to certain employees, respectively. We believe it is probable that the performance target applicable to these PRSUs will be achieved.
In connection with the cash dividends paid during the years ended December 31, 2017 and 2016, we granted 247 and 70 restricted stock units, respectively, including PRSUs, in accordance with the terms of existing award agreements. These grants did not result in any additional incremental share-based payment expense being recognized during the years ended December 31, 2017 and 2016.
We recognized share-based payment expense associated with restricted stock units, including PRSUs, and stock awards of $45,578, $28,338 and $14,226 for the years ended December 31, 2017, 2016 and 2015, respectively.
Total unrecognized compensation costs related to unvested share-based payment awards for stock options and restricted stock units granted to employees, members of our board of directors and third parties at December 31, 2017 and 2016 were $241,521 and $266,045, respectively. The total unrecognized compensation costs at December 31, 2017 are expected to be recognized over a weighted-average period of 2.5 years.
401(k) Savings Plan
Sirius XM sponsors the Sirius XM Radio Inc. 401(k) Savings Plan (the “Sirius XM Plan”) for eligible employees. The Sirius XM Plan allows eligible employees to voluntarily contribute from 1% to 50% of their pre-tax eligible earnings, subject to certain defined limits. We match 50% of an employee’s voluntary contributions per pay period on the first 6% of an employee’s pre-tax salary up to a maximum of 3% of eligible compensation. We may also make additional discretionary matching, true-up matching and non-elective contributions to the Sirius XM Plan. Employer matching contributions under the Sirius XM Plan vest at a rate of 33.33% for each year of employment and are fully vested after three years of employment for all current and future contributions. Our cash employer matching contributions are not used to purchase shares of our common stock on the open market, unless the employee elects our common stock as their investment option for this contribution. We recognized $7,582, $7,104 and $8,144 in expense during the years ended December 31, 2017, 2016 and 2015, respectively, in connection with the Sirius XM Plan.
Sirius XM Holdings Inc. Deferred Compensation Plan
In 2015, we adopted the Sirius XM Holdings Inc. Deferred Compensation Plan (the “DCP”). The DCP allows members of our board of directors and certain eligible employees to defer all or a portion of their base salary, cash incentive compensation and/or board of directors’ cash compensation, as applicable. Pursuant to the terms of the DCP, we may elect to make additional contributions beyond amounts deferred by participants, but we are under no obligation to do so. We have established a grantor (or “rabbi”) trust to facilitate the payment of our obligations under the DCP.
Contributions to the DCP, net of withdrawals, for the years ended December 31, 2017 and 2016 were $7,628 and $4,295, respectively. There were no contributions to the DCP for the year ended December 31, 2015. As of December 31, 2017 and 2016, the fair value of the investments held in the trust were $14,641 and $4,854, respectively, which are included in Other long-term assets in our consolidated balance sheets and are classified as trading securities. Trading gains and losses associated with these investments are recorded in Other income within our consolidated statements of comprehensive income. The associated liability is recorded within Other long-term liabilities in our consolidated balance sheets, and any increase or decrease in the liability is recorded in General and administration expense within our consolidated statements of comprehensive income. For the years ended December 31, 2017 and 2016, we recorded an immaterial amount of unrealized gains on investments held in the trust.
F-28
SIRIUS XM HOLDINGS INC. AND SUBSIDIARIES
NOTES TO CONSOLIDATED FINANCIAL STATEMENTS - Continued
(Dollars and shares in thousands, except per share amounts)
(15) | Commitments and Contingencies |
The following table summarizes our expected contractual cash commitments as of December 31, 2017:
2018 | 2019 | 2020 | 2021 | 2022 | Thereafter | Total | |||||||||||||||||||||
Debt obligations | $ | 5,105 | $ | 3,808 | $ | 301,077 | $ | 607 | $ | 1,000,000 | $ | 5,500,000 | $ | 6,810,597 | |||||||||||||
Cash interest payments | 356,525 | 348,148 | 341,781 | 334,381 | 334,375 | 915,938 | 2,631,148 | ||||||||||||||||||||
Satellite and transmission | 134,736 | 87,751 | 43,881 | 4,296 | 2,387 | 4,280 | 277,331 | ||||||||||||||||||||
Programming and content | 331,353 | 305,956 | 258,873 | 175,421 | 51,600 | 162,438 | 1,285,641 | ||||||||||||||||||||
Marketing and distribution | 20,573 | 13,645 | 8,620 | 7,801 | 1,608 | 188 | 52,435 | ||||||||||||||||||||
Satellite incentive payments | 13,690 | 10,652 | 10,197 | 8,574 | 8,558 | 61,767 | 113,438 | ||||||||||||||||||||
Operating lease obligations | 39,983 | 40,161 | 37,902 | 32,068 | 27,504 | 126,638 | 304,256 | ||||||||||||||||||||
Other | 49,237 | 18,401 | 3,265 | 941 | 51 | 20 | 71,915 | ||||||||||||||||||||
Total (1) | $ | 951,202 | $ | 828,522 | $ | 1,005,596 | $ | 564,089 | $ | 1,426,083 | $ | 6,771,269 | $ | 11,546,761 | |||||||||||||
(1) | The table does not include our reserve for uncertain tax positions, which at December 31, 2017 totaled $12,190, as the specific timing of any cash payments cannot be projected with reasonable certainty. |
Debt obligations. Debt obligations include principal payments on outstanding debt and capital lease obligations.
Cash interest payments. Cash interest payments include interest due on outstanding debt and capital lease payments through maturity.
Satellite and transmission. We have entered into agreements to design, build, launch and insure two satellites, SXM-7 and SXM-8, with several third parties. We also have entered into agreements with third parties to operate and maintain satellite telemetry, tracking and control facilities and certain components of our terrestrial repeater networks.
Programming and content. We have entered into various programming agreements. Under the terms of these agreements, our obligations include fixed payments, advertising commitments and revenue sharing arrangements. Our future revenue sharing costs are dependent upon many factors and are difficult to estimate; therefore, they are not included in our minimum contractual cash commitments.
Marketing and distribution. We have entered into various marketing, sponsorship and distribution agreements to promote our brand and are obligated to make payments to sponsors, retailers, automakers and radio manufacturers under these agreements. Certain programming and content agreements also require us to purchase advertising on properties owned or controlled by the licensors. We also reimburse automakers for certain costs associated with the incorporation of satellite radios into new vehicles they manufacture.
Satellite incentive payments. Boeing Satellite Systems International, Inc., the manufacturer of certain of our in-orbit satellites, may be entitled to future in-orbit performance payments with respect to XM-3 and XM-4 meeting their fifteen-year design life, which we expect to occur. Boeing may also be entitled to up to $10,000 of additional incentive payments if our XM-4 satellite continues to operate above baseline specifications during the five years beyond the satellite’s fifteen-year design life.
Space Systems/Loral, the manufacturer of certain of our in-orbit satellites, may be entitled to future in-orbit performance payments with respect to XM-5, SIRIUS FM-5 and SIRIUS FM-6 meeting their fifteen-year design life, which we expect to occur.
Operating lease obligations. We have entered into both cancelable and non-cancelable operating leases for office space, equipment and terrestrial repeaters. These leases provide for minimum lease payments, additional operating expense charges, leasehold improvements and rent escalations that have initial terms ranging from one to fifteen years, and certain leases have options to renew. The effect of the rent holidays and rent concessions are recognized on a straight-line basis over the lease term, including reasonably assured renewal periods. Total rent recognized in connection with leases for the years ended December 31, 2017, 2016 and 2015 was $43,375, $46,968 and $47,679, respectively.
F-29
SIRIUS XM HOLDINGS INC. AND SUBSIDIARIES
NOTES TO CONSOLIDATED FINANCIAL STATEMENTS - Continued
(Dollars and shares in thousands, except per share amounts)
Other. We have entered into various agreements with third parties for general operating purposes. In addition to the minimum contractual cash commitments described above, we have entered into agreements with other variable cost arrangements. These future costs are dependent upon many factors and are difficult to anticipate; however, these costs may be substantial. We may enter into additional programming, distribution, marketing and other agreements that contain similar variable cost provisions. The cost of our common stock acquired in our capital return program but not paid for as of December 31, 2017 was also included in this category.
In addition to the expected contractual cash commitments above, we also have a surety bond of approximately $45,000 primarily used as security against non-performance in the normal course of business. We do not have any other significant off-balance sheet financing arrangements that are reasonably likely to have a material effect on our financial condition, results of operations, liquidity, capital expenditures or capital resources.
Legal Proceedings
In the ordinary course of business, we are a defendant or party to various claims and lawsuits, including the following discussed below.
We record a liability when we believe that it is both probable that a liability will be incurred, and the amount of loss can be reasonably estimated. We evaluate developments in legal matters that could affect the amount of liability that has been previously accrued and make adjustments as appropriate. Significant judgment is required to determine both probability and the estimated amount of a loss or potential loss. We may be unable to reasonably estimate the reasonably possible loss or range of loss for a particular legal contingency for various reasons, including, among others, because: (i) the damages sought are indeterminate; (ii) the proceedings are in the relative early stages; (iii) there is uncertainty as to the outcome of pending proceedings (including motions and appeals); (iv) there is uncertainty as to the likelihood of settlement and the outcome of any negotiations with respect thereto; (v) there remain significant factual issues to be determined or resolved; (vi) the relevant law is unsettled; or (vii) the proceedings involve novel or untested legal theories. In such instances, there may be considerable uncertainty regarding the ultimate resolution of such matters, including a possible eventual loss, if any.
SoundExchange Royalty Claims. In August 2013, SoundExchange, Inc. filed a complaint in the United States District Court for the District of Columbia (“SoundExchange I”) alleging that we underpaid royalties for statutory licenses in violation of the regulations established by the Copyright Royalty Board for the 2007-2012 period. SoundExchange principally alleges that we improperly reduced our gross revenues subject to royalties by deducting revenue attributable to pre-1972 recordings and Premier package revenue that was not “separately charged” as required by the regulations. We believe that we properly applied the gross revenue exclusions contained in the regulations established by the Copyright Royalty Board. SoundExchange is seeking compensatory damages of not less than $50,000 and up to $100,000 or more, payment of late fees and interest, and attorneys’ fees and costs.
In August 2014, the United States District Court for the District of Columbia, in response to our motion to dismiss the complaint, stayed the case on the grounds that it properly should be pursued in the first instance before the Copyright Royalty Board rather than the District Court. In its opinion, the District Court concluded that the gross revenue exclusions in the regulations established by the Copyright Royalty Board for the 2007-2012 period were ambiguous and did not, on their face, make clear whether our royalty calculation approaches were permissible under the regulations. In December 2014, SoundExchange filed a petition with the Copyright Royalty Board requesting an order interpreting the applicable regulations.
On September 11, 2017, the Copyright Royalty Board issued a ruling concluding that we correctly interpreted the revenue exclusions applicable to pre-1972 recordings. Given the limitations on its jurisdiction, the Copyright Royalty Board deferred to further proceedings in the District Court the question of whether we properly applied those pre-1972 revenue exclusions when calculating our royalty payments. The Judges also concluded that we improperly claimed a revenue exclusion based on our Premier package upcharge, because, in the Judges’ view, the portion of the package that contained programming that did not include sound recordings was not offered for a “separate charge.” We have filed a notice of appeal of this ruling to the United States Court of Appeals for the District of Columbia Circuit. We expect that the ruling by the Copyright Royalty Board in this matter will be transmitted back to the District Court for further proceedings, such as adjudication of claims relating to damages and defenses, although those proceedings may be delayed pending the appeal of the Judges’ interpretive decision. We believe we have substantial defenses to SoundExchange claims that can be asserted in the District Court, and will continue to defend this action vigorously.
F-30
SIRIUS XM HOLDINGS INC. AND SUBSIDIARIES
NOTES TO CONSOLIDATED FINANCIAL STATEMENTS - Continued
(Dollars and shares in thousands, except per share amounts)
This matter is captioned SoundExchange, Inc. v. Sirius XM Radio, Inc., No.13-cv-1290-RJL (D.D.C.); the Copyright Royalty Board referral was adjudicated under the caption Determination of Rates and Terms for Preexisting Subscription Services and Satellite Digital Audio Radio Services, United States Copyright Royalty Board, No. 2006-1 CRB DSTRA. Information concerning SoundExchange I is publicly available in filings under the docket numbers.
On December 12, 2017, SoundExchange filed second action against us under the Copyright Act in the United States District Court for the District of Columbia (“SoundExchange II”). This action includes claims that SoundExchange has also attempted to add to the SoundExchange I litigation through a proposed amended complaint. SoundExchange alleges that we have systematically underpaid it for our statutory license by impermissible understating our gross revenues, as defined in the applicable regulations and, in certain cases, understating the performances of recordings on our internet radio service. Specifically, the complaint in SoundExchange II alleges that: from at least 2013 through the present, we improperly excluded from gross revenues a portion of our revenues received from our Premier and All Access packages attributable to premium channels; at least between 2010 and 2012, we improperly excluded late fees received from subscribers from the calculation of gross revenues; at least between 2010 and 2012, we improperly excluded certain credits, adjustments and bad debt for which the underlying revenues had never been included in the first instance; at least between 2010 and 2012, we improperly deducted from gross revenues certain transaction fees and other expenses - for instance, credit card processing fees, collection fees and sales and use taxes - that are purportedly not permitted by the Copyright Royalty Board regulations; at least between 2010 and 2012, we improperly deducted amounts attributable to performances of recordings claimed to be directly licensed on both our satellite radio and internet radio services, even though they were not; at least between 2010 and 2012, we improperly excluded from royalty calculations performances of recordings less than thirty seconds long under the provisions of the Copyright Royalty Board regulations and the Webcaster Settlement Agreement; from 2010 through 2012, we excluded from royalty calculations performances of songs on our internet radio services that we claimed we were unable to identify; we owe associated late fees for the previously identified underpayments under the applicable Copyright Royalty Board regulations; and we have underpaid SoundExchange by an amount exceeding 10% of the royalty payment and we are therefore obligated to pay the reasonable costs of an audit. We believe that we properly applied in all material respects the regulations established by the Copyright Royalty Board. SoundExchange is seeking compensatory damages in an amount to be determined at trial from the alleged underpayments, unspecified late fees and penalties pursuant to the Copyright Royalty Board’s regulations and the Webcaster Settlement Agreement and costs, including reasonable attorney fees and expenses.
This matter is titled SoundExchange, Inc. v. Sirius XM Radio, Inc., No.17-cv-02666-RJL (D.D.C.). Information concerning SoundExchange II is publicly available in filings under the docket number.
As of December 31, 2017, we concluded a loss, in excess of our recorded liabilities, was considered remote in connection with SoundExchange I or SoundExchange II. The assumptions underlying our conclusions may change from time to time and the actual loss may vary from the amounts recorded.
Telephone Consumer Protection Act Suits. On March 13, 2017, Thomas Buchanan, individually and on behalf of all others similarly situated, filed a class action complaint against us in the United States District Court for the Northern District of Texas, Dallas Division. The plaintiff in this action alleges that we violated the Telephone Consumer Protection Act of 1991 (the “TCPA”) by, among other things, making telephone solicitations to persons on the National Do-Not-Call registry, a database established to allow consumers to exclude themselves from telemarketing calls unless they consent to receive the calls in a signed, written agreement, and making calls to consumers in violation of our internal Do-Not-Call registry. The plaintiff is seeking various forms of relief, including statutory damages of five hundred dollars for each violation of the TCPA or, in the alternative, treble damages of up to fifteen hundred dollars for each knowing and willful violation of the TCPA and a permanent injunction prohibiting us from making, or having made, any calls to land lines that are listed on the National Do-Not-Call registry or our internal Do-Not-Call registry. We believe we have substantial defenses to the claims asserted in this action, and we intend to defend this action vigorously.
Other Matters. In the ordinary course of business, we are a defendant in various other lawsuits and arbitration proceedings, including derivative actions; actions filed by subscribers, both on behalf of themselves and on a class action basis; former employees; parties to contracts or leases; and owners of patents, trademarks, copyrights or other intellectual property. None of these other matters, in our opinion, is likely to have a material adverse effect on our business, financial condition or results of operations.
F-31
SIRIUS XM HOLDINGS INC. AND SUBSIDIARIES
NOTES TO CONSOLIDATED FINANCIAL STATEMENTS - Continued
(Dollars and shares in thousands, except per share amounts)
(16) | Income Taxes |
There is no current U.S. federal income tax provision, as all federal taxable income was offset by utilizing U.S. federal net operating loss carryforwards. The current state income tax provision is primarily related to taxable income in certain States that have suspended or limited the ability to use net operating loss carryforwards or where net operating losses have been fully utilized. The current foreign income tax provision is primarily related to foreign withholding taxes on dividends paid to us by Sirius XM Canada. Income tax expense is the sum of current income tax plus the change in deferred tax assets and liabilities.
We file a consolidated federal income tax return for all of our wholly-owned subsidiaries, including Sirius XM. Income tax expense consisted of the following:
For the Years Ended December 31, | |||||||||||
2017 | 2016 | 2015 | |||||||||
Current taxes: | |||||||||||
Federal | $ | — | $ | — | $ | — | |||||
State | (32,579 | ) | (21,782 | ) | (15,916 | ) | |||||
Foreign | (202 | ) | (383 | ) | (825 | ) | |||||
Total current taxes | (32,781 | ) | (22,165 | ) | (16,741 | ) | |||||
Deferred taxes: | |||||||||||
Federal | (564,171 | ) | (304,179 | ) | (318,933 | ) | |||||
State | (19,349 | ) | (19,383 | ) | (46,566 | ) | |||||
Total deferred taxes | (583,520 | ) | (323,562 | ) | (365,499 | ) | |||||
Total income tax expense | $ | (616,301 | ) | $ | (345,727 | ) | $ | (382,240 | ) | ||
The following table presents a reconciliation of the U.S. federal statutory tax rate and our effective tax rate:
For the Years Ended December 31, | ||||||||
2017 | 2016 | 2015 | ||||||
Federal tax expense, at statutory rate | 35.0 | % | 35.0 | % | 35.0 | % | ||
State income tax expense, net of federal benefit | 2.8 | % | 2.8 | % | 2.9 | % | ||
Change in valuation allowance | (0.1 | )% | — | % | 4.9 | % | ||
Tax credit | (1.7 | )% | (6.1 | )% | — | % | ||
Stock-based compensation | (2.9 | )% | (0.6 | )% | — | % | ||
Federal tax reform - deferred rate change | 14.6 | % | — | % | — | % | ||
Other, net | 1.0 | % | 0.6 | % | 0.1 | % | ||
Effective tax rate | 48.7 | % | 31.7 | % | 42.9 | % | ||
On December 22, 2017, the U.S. government enacted comprehensive tax legislation commonly referred to as the Tax Cut and Jobs Act (the “Tax Act”). The Tax Act makes broad and complex changes to the U.S. tax code that affects 2017, including, but not limited to, accelerated depreciation that will allow for full expensing of qualified property. The Tax Act also establishes new tax laws that will affect 2018 and after, including a reduction in the U.S. federal corporate income tax rate from 35% to 21%.
On December 22, 2017, the SEC staff issued Staff Accounting Bulletin No. 118 (“SAB 118”), which provides guidance on accounting for the tax effects of the Tax Act. SAB 118 provides a measurement period that should not extend beyond one year from the Tax Act enactment date for companies to complete the accounting under ASC 740, Income Taxes. In accordance with SAB 118, a company must reflect the income tax effects of those aspects of the Tax Act for which the accounting under ASC 740 is complete. To the extent that a company’s accounting for certain income tax effects of the Tax Act is incomplete but it is able to determine a reasonable estimate, it must record and provisional estimate in the financial statements.
F-32
SIRIUS XM HOLDINGS INC. AND SUBSIDIARIES
NOTES TO CONSOLIDATED FINANCIAL STATEMENTS - Continued
(Dollars and shares in thousands, except per share amounts)
As a result of the reduction of the federal corporate income tax rate, we have revalued our net deferred tax asset, excluding after tax credits, as of December 31, 2017. Based on this revaluation, we have recorded a net tax expense of $184,599 to reduce our net deferred tax asset balance, which was recorded as additional income tax expense for the year ended December 31, 2017. Our effective tax rate increased by 14.6% to 48.7% primarily as a result of the revaluation of our net deferred tax asset. We have recorded provisional adjustments but we have not completed our accounting for income tax effects for certain elements of the Tax Act, principally due to the accelerated depreciation that will allow for full expensing of qualified property.
For the year ended December 31, 2017 and 2016, we recorded a tax credit under the Protecting Americans from Tax Hikes Act of 2015 related to research and development activities. For the year ended December 31, 2015, we recorded additional tax expense to increase our valuation allowance due to a tax law change in the District of Columbia which will reduce our future tax and will limit our ability to use certain net operating losses in the future.
Deferred income taxes are recognized for the tax consequences related to temporary differences between the carrying amount of assets and liabilities for financial reporting purposes and the amounts used for tax purposes at each year-end, based on enacted tax laws and statutory tax rates applicable to the periods in which the differences are expected to affect taxable income. The ultimate realization of deferred tax assets is dependent upon the generation of future taxable income during the periods in which those temporary differences can be carried forward under tax law. Our evaluation of the realizability of deferred tax assets considers both positive and negative evidence, including historical financial performance, scheduled reversal of deferred tax assets and liabilities, projected taxable income and tax planning strategies. The weight given to the potential effects of positive and negative evidence is based on the extent to which it can be objectively verified. A valuation allowance is recognized when, based on the weight of all available evidence, it is considered more likely than not that all, or some portion, of the deferred tax assets will not be realized.
The tax effects of temporary differences that give rise to significant portions of the deferred tax assets and deferred tax liabilities, shown before jurisdictional netting, are presented below:
For the Years Ended December 31, | |||||||
2017 | 2016 | ||||||
Deferred tax assets: | |||||||
Net operating loss carryforwards and tax credits | $ | 686,277 | $ | 1,376,012 | |||
Deferred revenue | 500,461 | 760,774 | |||||
Accrued bonus | 24,150 | 35,225 | |||||
Expensed costs capitalized for tax | 13,914 | 19,610 | |||||
Investments | 29,881 | 44,129 | |||||
Stock based compensation | 50,065 | 74,544 | |||||
Other | 20,819 | 31,133 | |||||
Total deferred tax assets | 1,325,567 | 2,341,427 | |||||
Deferred tax liabilities: | |||||||
Depreciation of property and equipment | (156,003 | ) | (259,491 | ) | |||
FCC license | (506,578 | ) | (783,822 | ) | |||
Other intangible assets | (105,471 | ) | (172,520 | ) | |||
Other | (7,273 | ) | — | ||||
Total deferred tax liabilities | (775,325 | ) | (1,215,833 | ) | |||
Net deferred tax assets before valuation allowance | 550,242 | 1,125,594 | |||||
Valuation allowance | (52,883 | ) | (47,682 | ) | |||
Total net deferred tax asset | $ | 497,359 | $ | 1,077,912 | |||
Net operating loss carryforwards decreased as a result of the utilization of net operating losses related to current year taxable income and due to the Tax Act. For the years ended December 31, 2017 and 2016, we recorded a $21,700 and a $66,326 tax credit, respectively, under the Protecting Americans from Tax Hikes Act of 2015 related to research and
F-33
SIRIUS XM HOLDINGS INC. AND SUBSIDIARIES
NOTES TO CONSOLIDATED FINANCIAL STATEMENTS - Continued
(Dollars and shares in thousands, except per share amounts)
development activities. For the year ended December 31, 2016, we recognized $293,896 of additional net operating losses related to excess share-based compensation deductions due to our adoption of ASU 2016-09, Compensation-Stock Compensation (Topic 718). Our net deferred tax assets were primarily related to gross federal net operating loss carryforwards of approximately $1,977,407.
As of December 31, 2017 and 2016, we had a valuation allowance related to deferred tax assets of $52,883 and $47,682, respectively, which were not likely to be realized due to certain state net operating loss limitations. During the year ended December 31, 2017, our valuation allowance increased primarily due to the impact of the Tax Act as the federal rate decreases from 35% to 21% affected the value of the state valuation allowances. The net operating loss carryforwards upon which the valuation allowance is assessed are projected to expire on various dates through 2035.
ASC 740, Income Taxes, requires a company to first determine whether it is more likely than not that a tax position will be sustained based on its technical merits as of the reporting date, assuming that taxing authorities will examine the position and have full knowledge of all relevant information. A tax position that meets this more likely than not threshold is then measured and recognized at the largest amount of benefit that is greater than fifty percent likely to be realized upon effective settlement with a taxing authority. If the tax position is not more likely than not to be sustained, the gross amount of the unrecognized tax position will not be recorded in the financial statements but will be shown in tabular format within the uncertain income tax positions. Changes in recognition or measurement are reflected in the period in which the change in judgment occurs due to the following conditions: (1) the tax position is “more likely than not” to be sustained, (2) the tax position, amount, and/or timing is ultimately settled through negotiation or litigation, or (3) the statute of limitations for the tax position has expired. A number of years may elapse before an uncertain tax position is effectively settled or until there is a lapse in the applicable statute of limitations. We record interest and penalties related to uncertain tax positions in Income tax expense in our consolidated statements of comprehensive income.
As of December 31, 2017 and 2016, the gross liability for income taxes associated with uncertain tax positions was $334,254 and $303,583, respectively. If recognized, $256,525 of unrecognized tax benefits would affect our effective tax rate. Uncertain tax positions are recognized in Other long-term liabilities which, as of December 31, 2017 and 2016, were $12,190 and $4,780, respectively. No penalties have been accrued.
We have state income tax audits pending. We do not expect the ultimate outcome of these audits to have a material adverse effect on our financial position or results of operations. We also do not currently anticipate that our existing reserves related to uncertain tax positions as of December 31, 2017 will significantly increase or decrease during the twelve month period ending December 31, 2018. Various events could cause our current expectations to change. Should our position with respect to the majority of these uncertain tax positions be upheld, the effect would be recorded in our consolidated statements of comprehensive income as part of the income tax provision. We recorded interest expense of $708 and $100 for the years ended December 31, 2017 and 2016, respectively, related to unrecognized tax benefits.
Changes in our uncertain income tax positions, from January 1 through December 31 are presented below:
2017 | 2016 | ||||||
Balance, beginning of year | $ | 303,583 | $ | 253,277 | |||
Increases in tax positions for prior years | 14,530 | — | |||||
Increases in tax positions for current years | 16,141 | 51,738 | |||||
Decreases in tax positions for prior years | — | (1,432 | ) | ||||
Balance, end of year | $ | 334,254 | $ | 303,583 | |||
(17) | Subsequent Events |
For the period from January 1, 2018 to January 29, 2018, we repurchased 36,840 shares of our common stock on the open market for an aggregate purchase price of $202,006, including fees and commissions.
On January 23, 2018, our board of directors approved an additional $2,000,000 for repurchase of our common stock. The new approval increases the amount of common stock that we have been authorized to repurchase to an aggregate of $12,000,000. Shares of common stock may be purchased from time to time on the open market and in privately negotiated
F-34
SIRIUS XM HOLDINGS INC. AND SUBSIDIARIES
NOTES TO CONSOLIDATED FINANCIAL STATEMENTS - Continued
(Dollars and shares in thousands, except per share amounts)
transactions, including in accelerated stock repurchase transactions and transactions with Liberty Media and its affiliates. We intend to fund the additional repurchases through a combination of cash on hand, cash generated by operations and future borrowings.
On January 23, 2018, our board of directors declared a quarterly dividend on our common stock in the amount of $0.011 per share of common stock payable on February 28, 2018 to stockholders of record as of the close of business on February 7, 2018.
(18) | Quarterly Financial Data--Unaudited |
Our quarterly results of operations are summarized below:
For the Three Months Ended | |||||||||||||||
March 31 | June 30 | September 30 | December 31 | ||||||||||||
2017 | |||||||||||||||
Total revenue | $ | 1,294,066 | $ | 1,347,569 | $ | 1,379,596 | $ | 1,403,898 | |||||||
Cost of services | $ | (497,107 | ) | $ | (513,446 | ) | $ | (519,024 | ) | $ | (572,405 | ) | |||
Income from operations | $ | 393,840 | $ | 416,353 | $ | 433,965 | $ | 396,706 | |||||||
Net income (loss) | $ | 207,073 | $ | 202,109 | $ | 275,722 | $ | (36,996 | ) | ||||||
Net income (loss) per common share--basic (1) | $ | 0.04 | $ | 0.04 | $ | 0.06 | $ | (0.01 | ) | ||||||
Net income (loss) per common share--diluted (1) | $ | 0.04 | $ | 0.04 | $ | 0.06 | $ | (0.01 | ) | ||||||
2016 | |||||||||||||||
Total revenue | $ | 1,201,010 | $ | 1,235,566 | $ | 1,277,646 | $ | 1,302,998 | |||||||
Cost of services | $ | (467,028 | ) | $ | (486,317 | ) | $ | (488,659 | ) | $ | (551,323 | ) | |||
Income from operations | $ | 348,234 | $ | 362,156 | $ | 392,179 | $ | 329,560 | |||||||
Net income (2) | $ | 172,440 | $ | 174,965 | $ | 193,901 | $ | 204,627 | |||||||
Net income per common share--basic (2) | $ | 0.03 | $ | 0.04 | $ | 0.04 | $ | 0.04 | |||||||
Net income per common share--diluted (2) | $ | 0.03 | $ | 0.04 | $ | 0.04 | $ | 0.04 | |||||||
(1) | The sum of quarterly net income per share applicable to common stockholders does not necessarily agree to the net income per share for the year due to rounding. |
(2) | These amounts reflect the adoption of ASU 2016-09, Compensation-Stock Compensation (Topic 718): Improvements to Employee Share-Based Payment Accounting. |
F-35
SIRIUS XM HOLDINGS INC. AND SUBSIDIARIES
Schedule II - Schedule of Valuation and Qualifying Accounts
(in thousands) | |||||||||||||
Description | Balance January 1, | Charged to Expenses (Benefit) | Write-offs/ Payments/ Other | Balance December 31, | |||||||||
2015 | |||||||||||||
Allowance for doubtful accounts | $ | 7,815 | 47,187 | (48,884 | ) | $ | 6,118 | ||||||
Deferred tax assets—valuation allowance | $ | 4,995 | 44,100 | — | $ | 49,095 | |||||||
2016 | |||||||||||||
Allowance for doubtful accounts | $ | 6,118 | 55,941 | (53,401 | ) | $ | 8,658 | ||||||
Deferred tax assets—valuation allowance | $ | 49,095 | (1,019 | ) | (394 | ) | $ | 47,682 | |||||
2017 | |||||||||||||
Allowance for doubtful accounts | $ | 8,658 | 55,715 | (54,873 | ) | $ | 9,500 | ||||||
Deferred tax assets—valuation allowance | $ | 47,682 | 4,395 | 806 | $ | 52,883 | |||||||
F-36