Our Initial Public Offering and Listing
We were established as a subsidiary of Sinopec on June 29, 1993. In preparation for our initial public offering of ordinary shares, all assets and liabilities of the Complex were transferred either to us or to Sinopec Shanghai Jinshan Industrial Company (“JI”), a separate subsidiary of Sinopec. The Complex’s
non-core
businesses and assets, such as housing, stores, schools, transportation and medical services, were transferred to JI. The Complex’s core business and assets were transferred to us. The Complex then ceased to exist as a legal entity. In 1998, Sinopec was restructured into a limited liability company under the name of China Petrochemical Corporation (“Sinopec Group”). On February 25, 2000, Sinopec Group transferred its interest in us to its subsidiary, Sinopec Corp. In 1997, JI was restructured and its subsidiaries were either transferred to Sinopec or Shanghai Jinshan District.
Our H Shares commenced listing on the HKSE on July 26, 1993. Our ADSs, each representing 100 H Shares, are listed on the NYSE. Our A Shares are listed on the Shanghai Stock Exchange. We were the first Chinese joint stock limited company to have securities concurrently traded in Hong Kong, the United States and China. On November 8, 1993, our A Shares were included in the Shanghai Stock Exchange Stock Index.
Pursuant to regulations issued by the CSRC, we were required to obtain shareholder approval for and implement certain share reform. As a result of such share reform, all
non-publicly
tradable A Shares of the Company would be converted into publicly tradable A Shares and may be sold publicly on the Shanghai Stock Exchange subject to any applicable
lock-up
period.
In connection with the share reform, the Distribution Proposal regarding 2013 Interim Distribution of Cash Dividend and the Conversion of Capital Fund and Surplus Reserve into Shares of the Company (“Proposal”) was approved at the Company’s 2013 First Extraordinary General Meeting, 2013 First A Shareholders Class Meeting and 2013 First H Shareholders Class Meeting held on October 22, 2013. According to the Proposal, based on the Company’s total share capital of 7,200,000,000 shares as of June 30, 2013, RMB2,421 million of the capital surplus of the Company from its share premium account was used to fund the issue of 3.36 new bonus shares with respect to every 10 issued and outstanding shares, the surplus reserve was used to fund the issue of 1.64 new bonus shares with respect to every 10 issued and outstanding shares, and an interim cash dividend of RMB0.50 (tax included) for every 10 issued and outstanding shares was distributed to all shareholders.
In addition, Sinopec Corp. undertakes under the Proposal that it shall not, within 12 months from the date on which Sinopec Corp. becomes entitled to trade, deal in or transfer its
non-publicly
tradable shares of the Company in the market (meaning the first trading day after the implementation of the Proposal), trade such shares in the market. Also, after the expiration of the aforesaid
12-month
term, the amount of existing
non-publicly
tradable shares to be disposed of by Sinopec Corp. through trading on the stock exchange shall not represent more than 5% of the total number of our shares held by Sinopec Corp. within the next 12 months, and not more than 10% within the next 24 months.
Immediately upon completion of the conversion of capital surplus and surplus reserve into new shares of the Company, the total number of A Shares of the Company reached, as of December 4, 2013, 7,305,000,000, and the total amount of H Shares of the Company reached 3,495,000,000. Therefore, the Company’s total share capital consists of 10,800,000,000 shares. Sinopec Corp., being the controlling shareholder of the Company, holds 5,460,000,000 A Shares, representing 50.56% of the total share capital of the Company.
The share certificates of new H Shares issued in connection with the share reform were dispatched and the cash dividend was paid to the holders of H Shares on December 4, 2013. The dealings in the new H Shares commenced on December 5, 2013.
The Company exercised its Share Option Incentive Scheme for the first time in August 2017, and the second time in January 2018, and the total number of shares of the Company increased by 14,176, 600 shares and 9,636,900 shares, respectively, upon exercise. Immediately upon completion of the exercise of Share Option Incentive Scheme on February 14, 2018, the total number of A Shares of the Company reached, as of December 4, 2013, 7,328,813,500, and the total amount of H Shares of the Company reached 3,495,000,000.
Description of Principal Capital Expenditures and Divestitures
For a description of capital expansion projects related to our facilities, see
Item 4. Information on the Company – D. Property, Plant and
Equipment – Capital Expansion Program
.
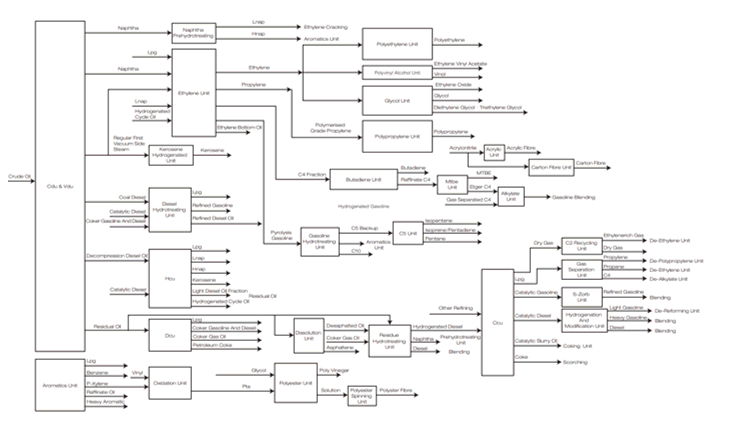
We are one of the major petrochemical companies in China based on 2021 net sales and ethylene production. Our highly integrated petrochemical complex processes crude oil into a broad range of products in four major product areas: