UNITED STATES
SECURITIES AND EXCHANGE COMMISSION
Washington D.C. 20549
Form 10-K
ANNUAL REPORT
(Mark One)
For the fiscal year ended December 31, 2019
OR
For the transition period from to
Commission File Number: 1-12162
(Exact name of registrant as specified in its charter)
State or other jurisdiction of Incorporation or organization | (I.R.S. Employer Identification No.) | |
(Address of principal executive offices) (Zip Code)
Registrant’s telephone number, including area code: (248 ) 754-9200
Securities registered pursuant to Section 12(b) of the Act:
Title of each class | Trading Symbol(s) | Name of each exchange on which registered | ||
Securities registered Pursuant to Section 12(g) of the Act: None
_________________________
Indicate by check mark if the registrant is a well-known seasoned issuer, as defined in Rule 405 of the Securities Act.
Indicate by check mark if the registrant is not required to file reports pursuant to Section 13 or Section 15(d) of the Act.
Yes ☐ No ☑
Indicate by check mark whether the registrant (1) has filed all reports required to be filed by Section 13 or 15(d) of the Securities Exchange Act of 1934 during the preceding 12 months (or for such shorter period that the registrant was required to file such reports), and (2) has been subject to such filing requirements for the past 90 days.
Indicate by check mark whether the registrant has submitted electronically every Interactive Data File required to be submitted pursuant to Rule 405 of Regulation S-TT (§ 232.405 of this chapter) during the preceding 12 months (or for such shorter period that the registrant was required to submit such files).
Indicate by check mark if disclosure of delinquent filers pursuant to Item 405 of Regulation S-K (§ 229.405 of this chapter) is not contained herein, and will not be contained, to the best of registrant’s knowledge, in definitive proxy or information statements incorporated by reference in Part III of this Form 10-K or any amendment to this Form 10-K
Yes ☐ No ☑
Indicate by check mark whether the registrant is a large accelerated filer, an accelerated filer, a non-accelerated filer, smaller reporting company, or an emerging growth company. See the definitions of “large accelerated filer,” “accelerated filer,” “smaller reporting company,” and “emerging growth company” in Rule 12b-2 of the Exchange Act.
☑ | Accelerated filer | ☐ | Non-accelerated filer | ☐ | Smaller reporting company | ||
Emerging growth company | ☐ | ||||||
If an emerging growth company, indicate by check mark if the registrant has elected not to use the extended transition period for complying with any new or revised financial accounting standards provided pursuant to Section 13(a) of the Exchange Act. ☐
Indicate by check mark whether the registrant is a shell company (as defined in Rule 12b-2 of the Exchange Act).
Yes ☐ No ☑
The aggregate market value of the voting common stock of the registrant held by stockholders (not including voting common stock held by directors and executive officers of the registrant) on June 28, 2019 (the last business day of the most recently completed second fiscal quarter) was approximately $8.6 billion.
As of February 7, 2020, the registrant had 206,409,586 shares of voting common stock outstanding.
DOCUMENTS INCORPORATED BY REFERENCE
Portions of the following documents are incorporated herein by reference into the Part of the Form 10-K indicated.
Document | Part of Form 10-K into which incorporated |
Portions of the BorgWarner Inc. Proxy Statement for the 2019 Annual Meeting of Stockholders | Part III |
BORGWARNER INC.
FORM 10-K
YEAR ENDED DECEMBER 31, 2019
INDEX
Page No. | ||
2
CAUTIONARY STATEMENTS FOR FORWARD-LOOKING INFORMATION
Statements contained in this Annual Report on Form 10-K ("Form 10-K") (including Management's Discussion and Analysis of Financial Condition and Results of Operations) may contain forward-looking statements as contemplated by the 1995 Private Securities Litigation Reform Act (the “Act”) that are based on management's current outlook, expectations, estimates and projections. Words such as "anticipates," "believes," "continues," "could," "designed," "effect," "estimates," "evaluates," "expects," "forecasts," "goal," "initiative," "intends," "outlook," "plans," "potential," "project," "pursue," "seek," "should," "target," "when," "would," and variations of such words and similar expressions are intended to identify such forward-looking statements. Further, all statements, other than statements of historical fact contained or incorporated by reference in this Form 10-K, that we expect or anticipate will or may occur in the future regarding our financial position, business strategy and measures to implement that strategy, including changes to operations, competitive strengths, goals, expansion and growth of our business and operations, plans, references to future success and other such matters, are forward-looking statements. Accounting estimates, such as those described under the heading "Critical Accounting Policies" in Item 7 of this Annual Report on Form 10-K, are inherently forward-looking. All forward looking statements are based on assumptions and analyses made by us in light of our experience and our perception of historical trends, current conditions and expected future developments, as well as other factors we believe are appropriate in the circumstances. Forward-looking statements are not guarantees of performance and the Company's actual results may differ materially from those expressed, projected or implied in or by the forward-looking statements.
You should not place undue reliance on these forward-looking statements, which speak only as of the date of this Annual Report. Forward-looking statements are subject to risks and uncertainties, many of which are difficult to predict and generally beyond our control, that could cause actual results to differ materially from those expressed, projected or implied in or by the forward-looking statements. These risks and uncertainties, among others, include: our dependence on automotive and truck production, both of which are highly cyclical; our reliance on major OEM customers; commodities availability and pricing; supply disruptions; fluctuations in interest rates and foreign currency exchange rates; availability of credit; our dependence on key management; our dependence on information systems; the uncertainty of the global economic environment; the outcome of existing or any future legal proceedings, including litigation with respect to various claims; future changes in laws and regulations, including, by way of example, tariffs, in the countries in which we operate; and the other risks noted under Item 1A, “Risk Factors,” and in other reports that we file with the Securities and Exchange Commission. We do not undertake any obligation to update or announce publicly any updates to or revisions to any of the forward-looking statements in this Form 10-K to reflect any change in our expectations or any change in events, conditions, circumstances, or assumptions underlying the statements.
This section and the discussions contained in Item 1A, "Risk Factors," and in Item 7, subheading "Critical Accounting Policies" in this report, are intended to provide meaningful cautionary statements for purposes of the safe harbor provisions of the Act. This should not be construed as a complete list of all of the economic, competitive, governmental, technological and other factors that could adversely affect our expected consolidated financial position, results of operations or liquidity. Additional risks and uncertainties, including without limitation those not currently known to us or that we currently believe are immaterial, also may impair our business, operations, liquidity, financial condition and prospects.
Use of Non-GAAP Financial Measures
In addition to results presented in accordance with accounting principles generally accepted in the United States of America (“GAAP”), this report includes non-GAAP financial measures. The Company believes these non-GAAP financial measures provide additional information that is useful to investors in
3
understanding the underlying performance and trends of the Company. Readers should be aware that non-GAAP financial measures have inherent limitations and should be cautious with respect to the use of such measures. To compensate for these limitations, we use non-GAAP measures as comparative tools, together with GAAP measures, to assist in the evaluation of our operating performance or financial condition. We calculate these measures using the appropriate GAAP components in their entirety and compute them in a manner intended to facilitate consistent period-to-period comparisons. The Company's method of calculating these non-GAAP measures may differ from methods used by other companies. These non-GAAP measures should not be considered in isolation or as a substitute for those financial measures prepared in accordance with GAAP. Where non-GAAP financial measures are used, the most directly comparable GAAP financial measure, as well as the reconciliation to the most directly comparable GAAP financial measure, can be found in this report.
4
PART I
ITEM 1. BUSINESS
BorgWarner Inc. (together with it Consolidated Subsidiaries, the “Company” or "BorgWarner") is a Delaware corporation incorporated in 1987. We are a global product leader in clean and efficient technology solutions for combustion, hybrid and electric vehicles. Our products help improve vehicle performance, propulsion efficiency, stability and air quality. We manufacture and sell these products worldwide, primarily to original equipment manufacturers (“OEMs”) of light vehicles (passenger cars, sport-utility vehicles ("SUVs"), vans and light trucks). The Company's products are also sold to OEMs of commercial vehicles (medium-duty trucks, heavy-duty trucks and buses) and off-highway vehicles (agricultural and construction machinery and marine applications). We also manufacture and sell our products to certain Tier One vehicle systems suppliers and into the aftermarket for light, commercial and off-highway vehicles. The Company operates manufacturing facilities serving customers in Europe, the Americas and Asia and is an original equipment supplier to every major automotive OEM in the world.
Proposed Acquisition of Delphi Technologies PLC
On January 28, 2020, the Company entered into a definitive agreement to acquire Delphi Technologies PLC (“Delphi Technologies”) in an all-stock transaction valued at approximately $3.3 billion, based on the closing price of BorgWarner stock on January 27, 2020. Refer to Note 23, “Subsequent Event,” to the Consolidated Financial Statements in Item 8 of this report for more information. The Company believes this acquisition will increase our power electronics products, capabilities and scale, creating a leader in electrified propulsion systems that is well positioned to take advantage of future propulsion migration, enhance our combustion, commercial vehicle and aftermarket businesses and maintain flexibility across combustion, hybrid and electric propulsion, consistent with our evolution towards the propulsion market of the future.
Financial Information About Reporting Segments
Refer to Note 21, “Reporting Segments and Related Information,” to the Consolidated Financial Statements in Item 8 of this report for financial information about the Company's reporting segments.
Narrative Description of Reporting Segments
The Company reports its results under two reporting segments: Engine and Drivetrain. Net sales by reporting segment for the years ended December 31, 2019, 2018 and 2017 are as follows:
Year Ended December 31, | |||||||||||
(in millions) | 2019 | 2018 | 2017 | ||||||||
Engine | $ | 6,214 | $ | 6,447 | $ | 6,062 | |||||
Drivetrain | 4,015 | 4,140 | 3,790 | ||||||||
Inter-segment eliminations | (61 | ) | (57 | ) | (53 | ) | |||||
Net sales | $ | 10,168 | $ | 10,530 | $ | 9,799 | |||||
The sales information presented above does not include the sales by the Company's unconsolidated joint ventures (see sub-heading “Joint Ventures”). Such unconsolidated sales totaled approximately $827 million, $947 million, and $844 million for the years ended December 31, 2019, 2018 and 2017, respectively.
5
Engine
The Engine Segment develops and manufactures products to improve fuel economy, reduce emissions and enhance performance. Increasingly stringent regulations of, and consumer demand for, better fuel economy and emissions performance are driving demand for the Engine Segment's products in combustion, hybrid and electric propulsion systems. The Engine Segment's technologies include: turbochargers, eBoosters, timing systems, emissions systems, thermal systems, gasoline ignition technology, cabin heaters, battery heaters and battery charging.
Turbochargers provide several benefits including increased power for a given engine size, improved fuel economy and reduced emissions. The Engine Segment has benefited from the growth in turbocharger demand around the world for both combustion and hybrid propulsion systems. The Engine Segment provides turbochargers for light, commercial and off-highway applications for combustion and hybrid vehicles in Europe, the Americas and Asia. The Engine Segment also designs and manufactures turbocharger actuators using integrated electronics to precisely control turbocharger speed and pressure ratio.
Sales of turbochargers for light vehicles represented approximately 28%, 27% and 28% of total net sales for the years ended December 31, 2019, 2018 and 2017, respectively. The Engine Segment currently supplies turbochargers to many OEMs including BMW, Daimler, Fiat Chrysler Automobiles ("FCA"), Ford, General Motors, Hyundai, Jaguar Land Rover, Renault, Volkswagen and Volvo. The Engine Segment also supplies turbochargers to several commercial vehicle and off-highway OEMs including Caterpillar, Daimler, Deutz, John Deere, MAN, Navistar International and Weichai.
The Engine Segment's timing systems enable precise control of air and exhaust flow through the engine, improving fuel economy and emissions. The Engine Segment's timing systems products include timing chain, variable cam timing (“VCT”), crankshaft and camshaft sprockets, tensioners, guides and snubbers, HY-VO® front-wheel drive (“FWD”) transmission chain, four-wheel drive (“4WD”) chain for light vehicles and hybrid power transmission chain. The Engine Segment is a leading manufacturer of timing systems for OEMs around the world.
The Engine Segment's engine timing technology includes VCT with mid-position lock, which allows a greater range of camshaft positioning thereby enabling better control over airflow and the opportunity to improve fuel economy, reduce emissions and improve engine performance compared with conventional VCT systems.
The Engine Segment's emissions systems products improve emissions performance and fuel economy. Products include electric air pumps and exhaust gas recirculation ("EGR") modules, EGR coolers, EGR valves, glow plugs and instant starting systems for combustion, both gasoline and diesel propulsion systems, and hybrid vehicles.
The Engine Segment's thermal systems products are designed to optimize temperatures in propulsion systems and vehicle cabins. Products include viscous fan drives that sense and respond to multiple cooling requirements, polymer fans, coolant pumps, cabin heaters, battery heaters and battery charging.
In 2017, the Company started exploring strategic options for its non-core emission product lines in the Engine segment and launched an active program to locate a buyer and initiated other actions required to complete the plan to sell and exit the non-core pipes and thermostat product lines. In December 2018, the Company reached an agreement to sell its thermostat product lines, and the sale was closed on April 1, 2019. Additionally, during the year, the Company entered into agreements to transition its pipes product lines to multiple buyers. During the year, the assets and liabilities were
6
removed from the Consolidated Balance Sheet. Refer to Note 20, “Assets and Liabilities Held for Sale,” to the Consolidated Financial Statements in Item 8 of this report for more information.
Drivetrain
The Drivetrain Segment develops and manufactures products to improve fuel economy, reduce emissions and enhance performance in combustion, hybrid and electric vehicles. The Drivetrain Segment’s technologies include: rotating electrical components, power electronics, clutching systems, control modules and all-wheel drive systems. The core design features of its rotating electrical components portfolio meet the demands of increasing vehicle electrification, improved fuel efficiency, reduced weight, and lowered electrical and mechanical noise. The Drivetrain Segment's mechanical products include friction, controls products for automatic transmissions and torque management products for All-Wheel Drive ("AWD") vehicles, and its rotating electrical components include starter motors, alternators and electric motors for hybrid and electric vehicles.
Friction and mechanical products for automatic transmissions include dual clutch modules, friction clutch modules, friction and separator plates, transmission bands, torque converter clutches, one-way clutches and torsional vibration dampers. Controls products for automatic transmissions feature electro-hydraulic solenoids for standard and high pressure hydraulic systems, transmission solenoid modules and dual clutch control modules. The Company's 50%-owned joint venture in Japan, NSK-Warner KK ("NSK-Warner"), is a leading producer of friction plates and one-way clutches in Japan and China.
The Drivetrain Segment has led the globalization of today's dual clutch transmission ("DCT") technology for over 15 years. BorgWarner's award-winning DualTronic® technology enables a conventional, manual gearbox to function as a fully automatic transmission by eliminating the interruption in power flow that occurs when shifting a single clutch manual transmission. The result is a smooth shifting automatic transmission with the fuel efficiency and driving experience of a manual gearbox.
The Drivetrain Segment's torque management products include rear-wheel drive (“RWD”)-AWD transfer case systems, FWD-AWD coupling systems and cross-axle coupling systems. The Drivetrain Segment's focus is on developing electronically-controlled torque management devices and systems that will benefit fuel economy and vehicle dynamics.
Transfer cases are installed on RWD-based light trucks, SUVs, cross-over utility vehicles, and passenger cars. A transfer case attaches to the transmission and distributes torque to the front and rear axles improving vehicle traction and stability in dynamic driving conditions. There are many variants of the Drivetrain Segment's transfer case technology in the market today, including Torque On-Demand (TOD®), chain-driven, gear-driven, Pre-Emptive, Part-Time, 1-speed and 2-speed transfer cases. The Drivetrain Segment's transfer cases are featured on Ford and Ram light-duty and heavy-duty trucks.
The Drivetrain Segment is involved in the AWD market for FWD-based vehicles with couplings that use electronically-controlled clutches to distribute power to the rear wheels as traction is required. The Drivetrain Segment's latest coupling innovation, the Centrifugal Electro-Hydraulic (“CEH”) Actuator, used to engage the clutches in the coupling, produces outstanding vehicle stability and traction while promoting better fuel economy with reduced weight. The CEH Actuator is found in the AWD couplings featured in several current FWD-AWD vehicles.
In 2015, the Company acquired Remy International, Inc. (“Remy”), a global market leader in the design, manufacture, remanufacture and distribution of rotating electrical components for light and commercial vehicles, OEMs and the aftermarket. Remy's principal products include starter motors, alternators and electric motors. The Company’s starter motors and alternators are used in gasoline, diesel, natural gas and alternative fuel engines for light vehicle, commercial vehicle, and off-highway applications. The product technology continues to evolve to meet the demands of increasing vehicle
7
electrical loads, improved fuel efficiency, reduced weight and lowered electrical and mechanical noise. The Company’s electric motors are used in both light and commercial vehicles including off-highway applications. These include both pure electric applications as well as hybrid applications, where the electric motors are combined with traditional gasoline or diesel propulsion systems.
The Company sells new starters, alternators and hybrid electric motors to OEMs globally for factory installation on new vehicles, and remanufactured and new starters and alternators to heavy duty aftermarket customers outside of Europe and to OEMs for original equipment service. As a leading remanufacturer, BorgWarner obtains used starters and alternators, commonly referred to as cores, then disassembles, cleans, combines them with new subcomponents and reassembles them into saleable, finished products, which are tested to meet OEM requirements.
In 2017, the Company acquired Sevcon, Inc. ("Sevcon"), a global provider of electrification technologies, serving customers in the U.S., U.K., France, Germany, Italy, China and the Asia Pacific region. Principal products include motor controllers, battery chargers, and uninterrupted power source systems for electric and hybrid vehicles, industrial, medical and telecom applications. These products complement BorgWarner’s power electronics capabilities utilized to provide electrified propulsion solutions.
Joint Ventures
As of December 31, 2019, the Company had eight joint ventures in which it had a less-than-100% ownership interest. Results from the six joint ventures in which the Company is the majority owner are consolidated as part of the Company's results. Results from the two joint ventures in which the Company's effective ownership interest is 50% or less, were reported by the Company using the equity method of accounting. In 2019, the Company and Romeo Systems, Inc. formed a new joint venture, BorgWarner Romeo Power LLC (the "Romeo JV"), in which the Company owns a 60% interest. The Romeo JV focuses on producing battery module and pack technology.
8
Management of the unconsolidated joint ventures is shared with the Company's respective joint venture partners. Certain information concerning the Company's joint ventures is set forth below:
Joint venture | Products | Year organized | Percentage owned by the Company | Location of operation | Joint venture partner | Fiscal 2019 net sales (in millions) (a) | |||||||||
Unconsolidated: | |||||||||||||||
NSK-Warner | Transmission components | 1964 | 50 | % | Japan/China | NSK Ltd. | $ | 610 | |||||||
Turbo Energy Private Limited (b) | Turbochargers | 1987 | 32.6 | % | India | Sundaram Finance Limited; Brakes India Limited | $ | 217 | |||||||
Consolidated: | |||||||||||||||
BorgWarner Transmission Systems Korea Ltd. (c) | Transmission components | 1987 | 60 | % | Korea | NSK-Warner | $ | 238 | |||||||
Borg-Warner Shenglong (Ningbo) Co. Ltd. | Fans and fan drives | 1999 | 70 | % | China | Ningbo Shenglong Automotive Powertrain Systems Co., Ltd. | $ | 79 | |||||||
BorgWarner TorqTransfer Systems Beijing Co. Ltd. | Transfer cases | 2000 | 80 | % | China | Beijing Hainachuan Automotive Parts Holding Co., Ltd. | $ | 243 | |||||||
SeohanWarner Turbo Systems Ltd. | Turbochargers | 2003 | 71 | % | Korea | Korea Flange Company | $ | 199 | |||||||
BorgWarner United Transmission Systems Co. Ltd. | Transmission components | 2009 | 66 | % | China | China Automobile Development United Investment Co., Ltd. | $ | 361 | |||||||
BorgWarner Romeo Power LLC | Battery module and pack technology | 2019 | 60 | % | US | Romeo Systems, Inc. | $ | — | |||||||
________________
(a) | All sales figures are for the year ended December 31, 2019, except NSK-Warner and Turbo Energy Private Limited. NSK-Warner’s sales are reported for the 12 months ended November 30, 2019. Turbo Energy Private Limited’s sales are reported for the 12 months ended September 30, 2019. |
(b) | The Company made purchases from Turbo Energy Private Limited totaling $45 million, $42 million and $32 million for the years ended December 31, 2019, 2018 and 2017, respectively. The Company made purchases from NSK-Warner totaling $6 million, $10 million and $12 million for the years ended December 31, 2019, 2018 and 2017, respectively. |
(c) | BorgWarner Inc. owns 50% of NSK-Warner, which has a 40% interest in BorgWarner Transmission Systems Korea Ltd. This gives the Company an additional indirect effective ownership percentage of 20%, resulting in a total effective ownership interest of 80%. |
Financial Information About Geographic Areas
Refer to Note 21, “Reporting Segments and Related Information,” to the Consolidated Financial Statements in Item 8 of this report for financial information about geographic areas.
Product Lines and Customers
During the year ended December 31, 2019, approximately 83% of the Company's net sales were for light-vehicle applications; approximately 9% were for commercial vehicle applications; approximately 4% were for off-highway vehicle applications; and approximately 4% were to distributors of aftermarket replacement parts.
The Company’s worldwide net sales to the following customers (including their subsidiaries) were approximately as follows:
Year Ended December 31, | ||||||||
Customer | 2019 | 2018 | 2017 | |||||
Ford | 15 | % | 14 | % | 15 | % | ||
Volkswagen | 11 | % | 12 | % | 13 | % | ||
No other single customer accounted for more than 10% of our consolidated net sales in any of the years presented.
9
The Company's automotive products are generally sold directly to OEMs, substantially pursuant to negotiated annual contracts, long-term supply agreements or terms and conditions as may be modified by the parties. Deliveries are subject to periodic authorizations based upon OEM production schedules. The Company typically ships its products directly from its plants to the OEMs.
Sales and Marketing
Each of the Company's businesses within its two reporting segments has its own sales function. Account executives for each of our businesses are assigned to serve specific customers for one or more businesses' products. Our account executives spend the majority of their time in direct contact with customers' purchasing and engineering employees and are responsible for servicing existing business and for identifying and obtaining new business. Because of their close relationship with customers, account executives are able to identify and meet customers' needs based upon their knowledge of our products' design and manufacturing capabilities. Upon securing a new order, account executives participate in product launch team activities and serve as a key interface with customers. In addition, sales and marketing employees of our Engine and Drivetrain reporting segments often work together to explore cross-development opportunities where appropriate.
Seasonality
Our operations are directly related to the automotive industry. Consequently, our Engine and Drivetrain segments may experience seasonal fluctuations to the extent automotive vehicle production slows, such as in the summer months when many customer plants typically close for model year changeovers or vacations. Historically, model changeovers or vacations have generally resulted in lower sales volume in the Company's third quarter.
Research and Development
The Company conducts advanced Engine and Drivetrain research. This advanced engineering function seeks to leverage know-how and expertise across product lines to create new Engine and Drivetrain systems and modules that can be commercialized. This function oversees the Company's investments in certain venture capital funds that provide seed money for start-up businesses developing new technologies pertinent to the automotive industry and the Company's propulsion strategies.
In addition, each of the Company's businesses within its two reporting segments has its own research and development (“R&D”) organization, including engineers and technicians, engaged in R&D activities at facilities worldwide. The Company also operates testing facilities such as prototype, measurement and calibration, life cycle testing and dynamometer laboratories.
By working closely with OEMs and anticipating their future product needs, the Company's R&D personnel conceive, design, develop and manufacture new proprietary automotive components and systems. R&D personnel also work to improve current products and production processes. The Company believes its commitment to R&D will allow it to continue to obtain new orders from its OEM customers.
The Company's net R&D expenditures are included in selling, general and administrative expenses of the Consolidated Statements of Operations. Customer reimbursements are netted against gross R&D expenditures as they are considered a recovery of cost. Customer reimbursements for prototypes are recorded net of prototype costs based on customer contracts, typically either when the prototype is shipped or when it is accepted by the customer. Customer reimbursements for engineering services are recorded when performance obligations are satisfied in accordance with the contract. Financial risks and rewards transfer upon shipment, acceptance of a prototype component by the customer or upon completion of the performance obligation as stated in the respective customer agreement.
10
Year Ended December 31, | |||||||||||
(in millions) | 2019 | 2018 | 2017 | ||||||||
Gross R&D expenditures | $ | 498 | $ | 512 | $ | 473 | |||||
Customer reimbursements | (85 | ) | (72 | ) | (65 | ) | |||||
Net R&D expenditures | $ | 413 | $ | 440 | $ | 408 | |||||
Net R&D expenditures as a percentage of net sales were 4.1%, 4.2% and 4.2% for the years ended December 31, 2019, 2018 and 2017, respectively. None of the Company's R&D related contracts exceeded 5% of net R&D expenditures in any of the years presented.
Intellectual Property
The Company has approximately 6,430 active domestic and foreign patents and patent applications pending or under preparation and receives royalties from licensing patent rights to others. While it considers its patents on the whole to be important, the Company does not consider any single patent, any group of related patents or any single license essential to its operations in the aggregate or to the operations of any of the Company's business groups individually. The expiration of the patents individually and in the aggregate is not expected to have a material effect on the Company's financial position or future operating results. The Company owns numerous trademarks, some of which are valuable, but none of which are essential to its business in the aggregate.
The Company owns the “BorgWarner” trade name and numerous BORGWARNER trademarks, including without limitation "BORGWARNER" and "BORGWARNER and Bug Design", which are material to the Company's business.
11
Competition
The Company's reporting segments compete worldwide with a number of other manufacturers and distributors that produce and sell similar products. Many of these competitors are larger and have greater resources than the Company. Technological innovation, application engineering development, quality, price, delivery and program launch support are the primary methods of competition.
The Company’s major non-OEM competitors by product type follow:
Product Type: Engine | Names of Competitors | |||
Turbochargers: | Cummins Turbo Technology | IHI | ||
Garrett Motion, Inc. | Mitsubishi Heavy Industries (MHI) | |||
BMTS Technology | Vitesco Technologies | |||
Emissions systems: | Mahle | T.RAD | ||
Denso | Pierburg | |||
Bosch | NGK | |||
Eldor | Eberspaecher | |||
Timing systems: | Denso | Schaeffler Group | ||
Iwis | Tsubaki Group | |||
Delphi Technologies | ||||
Thermal systems: | Horton | Usui | ||
Mahle | Xuelong | |||
Product Type: Drivetrain | Names of Competitors | |||
Torque management systems: | GKN Driveline | JTEKT | ||
Magna Powertrain | ||||
Rotating electrical components: | Denso | Valeo | ||
SEG Automotive | Vitesco Technologies | |||
Mitsubishi Electric | Bosch | |||
Transmission systems: | Bosch | FCC | ||
Dynax | Schaeffler Group | |||
Valeo | Denso | |||
In addition, a number of the Company's major OEM customers manufacture, for their own use and for others, products that compete with the Company's products. Other current OEM customers could elect to manufacture products to meet their own requirements or to compete with the Company. There is no assurance that the Company's business will not be adversely affected by increased competition in the markets in which it operates.
For many of its products, the Company's competitors include suppliers in parts of the world that enjoy economic advantages such as lower labor costs, lower health care costs, lower tax rates and, in some cases, export subsidies and/or raw materials subsidies. Also, see Item 1A, "Risk Factors."
12
Workforce
As of December 31, 2019, the Company had a salaried and hourly workforce of approximately 29,000 (as compared with approximately 30,000 at December 31, 2018), of which approximately 6,800 were in the U.S. Approximately 13% of the Company's U.S. workforce is unionized. The workforces at certain international facilities are also unionized. The Company believes the present relations with our workforce to be satisfactory.
We have one domestic collective bargaining agreement which is for one facility in New York, which expires in September 2020.
Raw Materials
The Company uses a variety of raw materials in the production of its products including aluminum, copper, nickel, plastic resins, steel and certain alloy elements. Manufacturing operations for each of the Company's operating segments are dependent upon natural gas, fuel oil and electricity.
The Company uses a variety of tactics to limit the impact of supply shortages and inflationary pressures. The Company's global procurement organization works to accelerate cost reductions, purchases from lower cost regions, optimize the supply base, mitigate risk and collaborate on its buying activities. In addition, the Company uses long-term contracts, cost sharing arrangements, design changes, customer buy programs and limited financial instruments to help control costs. The Company intends to use similar measures in 2020 and beyond. Refer to Note 11, “Financial Instruments,” to the Consolidated Financial Statements in Item 8 of this report for information related to the Company's hedging activities.
For 2020, the Company believes that its supplies of raw materials are adequate and available from multiple sources to support its manufacturing requirements.
Available Information
Through its Internet website (www.borgwarner.com), the Company makes available, free of charge, its Annual Report on Form 10-K, Quarterly Reports on Form 10-Q, Current Reports on Form 8-K, all amendments to those reports, and other filings with the Securities and Exchange Commission as soon as reasonably practicable after they are filed or furnished. The Company also makes the following documents available on its Internet website: the Audit Committee Charter; the Compensation Committee Charter; the Corporate Governance Committee Charter; the Company's Corporate Governance Guidelines; the Company's Code of Ethical Conduct; and the Company's Code of Ethics for CEO and Senior Financial Officers. You may also obtain a copy of any of the foregoing documents, free of charge, if you submit a written request to Investor Relations, 3850 Hamlin Road, Auburn Hills, Michigan 48326. The public may read and copy materials filed by the Company with the SEC at the SEC’s Public Reference Room at 100 F Street, NE, Washington, DC, 20549. The public may obtain information on the operation of the Public Reference Room by calling the SEC at 1-800-SEC-0330. The SEC maintains an Internet site that contains reports, proxy and information statements, and other information regarding issuers that file electronically with the SEC at http://www.sec.gov.
13
Information About Executive Officers of the Company
Set forth below are the names, ages, positions and certain other information concerning the executive officers of the Company as of February 13, 2020.
Name | Age | Position with the Company | ||
Frederic B. Lissalde | 52 | President and Chief Executive Officer | ||
Kevin A. Nowlan | 48 | Executive Vice President, Chief Financial Officer | ||
Tonit M. Calaway | 51 | Executive Vice President, Chief Legal Officer and Secretary | ||
Felecia Pryor | 45 | Executive Vice President, Chief Human Resources Officer | ||
Craig D. Aaron | 42 | Vice President and Treasurer | ||
Stefan Demmerle | 55 | Vice President | ||
Brady D. Ericson | 48 | Vice President | ||
Joseph F. Fadool | 53 | Vice President | ||
Thomas J. McGill | 53 | Vice President and Controller | ||
Volker Weng | 49 | Vice President | ||
Hakan Yilmaz | 41 | Vice President, Chief Technology Officer | ||
Mr. Lissalde has been President and Chief Executive Officer of the Company since August 2018. He was Executive Vice President and Chief Operating Officer of the Company from January 2018 to July 2018. From May 2013 to December 2017, he was Vice President of the Company and President and General Manager of BorgWarner Turbo Systems LLC, a subsidiary.
Mr. Nowlan has been Executive Vice President and Chief Financial Officer since April 2019. He was Senior Vice President, President, Trailer, Components and Chief Financial Officer of Meritor, Inc., a commercial truck and industrial supplier, from March 2018 to March 2019. He was Senior Vice President and Chief Financial Officer of Meritor, Inc. from May 2013 to March 2018.
Ms. Calaway has been Executive Vice President and Chief Legal Officer and Secretary since August 2018. She was Chief Human Resources Officer of the Company from August 2016 to August 2018. She was Vice President of Human Resources of Harley-Davidson Inc., a motorcycle manufacturer, and President of The Harley-Davidson Foundation from February 2010 to July 2016. Since October 2019, Ms. Calaway has served as a member of the Board of Directors of Astronics Corporation, an aerospace and defense company.
Ms. Pryor has been Executive Vice President and Chief Human Resources Officer since April 2019. She was Vice President of Human Resources of BorgWarner Ithaca LLC (d/b/a BorgWarner Morse Systems), a subsidiary, from October 2018 to March 2019. She was Global Human Resources Director - Global Personnel, Organization & Planning for Ford Motor Company, an automotive manufacturer, from January 2018 to October 2018. She was Vice President of Human Resources for Ford Motor Company - ASEAN Markets from August 2016 to January 2018. She was HR Director for Ford’s Research & Engineer Center located in Nanjing, China from August 2014 to August 2016.
Mr. Aaron has been Vice President and Treasurer since March 2019. He was Vice President of Finance of BorgWarner Ithaca LLC (d/b/a BorgWarner Morse Systems), a subsidiary, from December 2016 to February 2019. He was Director, Financial Reporting from August 2012 to November 2016.
Dr. Demmerle has been Vice President of the Company and President and General Manager of BorgWarner PDS (USA) Inc. (formerly known as BorgWarner TorqTransfer Systems Inc.), a subsidiary, since September 2012 and President and General Manager of BorgWarner PDS (Indiana) Inc. (formerly known as Remy International, Inc.), a subsidiary, since December 2015.
14
Mr. Ericson has been Vice President of the Company and President and General Manager of BorgWarner Ithaca LLC (d/b/a BorgWarner Morse Systems), a subsidiary, since June 2019. He was the Executive Vice President and Chief Strategy Officer of the Company from January 2017 until June 2019. He was Vice President of the Company and President and General Manager of BorgWarner Emissions Systems LLC, a subsidiary, from March 2014 until December 2016, during which time BorgWarner BERU Systems GmbH was combined with BorgWarner Emissions Systems Inc.
Mr. Fadool has been Vice President of the Company and President and General Manager of BorgWarner Emissions Systems LLC, BorgWarner Thermal Systems Inc. and Turbo Systems LLC, subsidiaries of the Company, since October 2019. He was Vice President of the Company and President and General Manager of Turbo Systems LLC, a subsidiary, from May 2019 to October 2019. He was Vice President of the Company and President and General Manager of BorgWarner Emissions Systems LLC and BorgWarner Thermal Systems Inc., both subsidiaries, from January 2017 to May 2019. He was Vice President of the Company and President and General Manager of BorgWarner Ithaca LLC (d/b/a BorgWarner Morse Systems), a subsidiary, from July 2015 until December 2016. From May 2012 to July 2015, he was the Vice President of the Company and President and General Manager of BorgWarner Morse TEC Inc., a subsidiary.
Mr. McGill has been Vice President and Controller since April 2019. He was Vice President and Interim Chief Financial Officer from January 2019 to April 2019. Additionally, he was the Treasurer of the Company from May 2012 to March 2019.
Dr. Weng has been Vice President of the Company and President and General Manager of BorgWarner Transmission Systems LLC since October 2019. He was President and General Manager for BorgWarner Emissions Systems LLC and BorgWarner Thermal Systems Inc., both subsidiaries, from May 2019 to September 2019. He was Vice President and General Manager, Europe for BorgWarner Emissions Systems LLC and BorgWarner Thermal Systems Inc., both subsidiaries, from April 2017 to April 2019. He was Vice President and General Manager, Asia for Turbo Systems Systems LLC, a subsidiary, from July 2015 to April 2017. He was General Manager, China for Turbo Systems LLC, a subsidiary, from January 2013 to July 2015.
Mr. Yilmaz has been Vice President and Chief Technology Officer since January 2018. He was Vice President, Global Head of Powertrain Systems and Advanced Engineering for Robert Bosch, a global supplier of technology and services, from May 2016 to December 2017. He was Vice President, Business Strategy and Strategic Marketing for Robert Bosch from January 2015 to April 2016. He was Vice President of Global Program Management and Engineering, for Robert Bosch from January 2013 to December 2014.
Item 1A. Risk Factors
The following risk factors and other information included in this Annual Report on Form 10-K should be considered. The risks and uncertainties described below are not the only ones we face. Additional risks and uncertainties not presently known to us or that we currently deem immaterial also may impact our business operations. If any of the following risks occur, our business including its financial performance, financial condition, operating results and cash flows could be adversely affected.
15
Risks related to our industry
Conditions in the automotive industry may adversely affect our business.
Our financial performance depends on conditions in the global automotive industry. Automotive and truck production and sales are cyclical and sensitive to general economic conditions and other factors including interest rates, consumer credit, and consumer spending and preferences. Economic declines that result in significant reduction in automotive or truck production would have an adverse effect on our sales to OEMs.
We face strong competition.
We compete worldwide with a number of other manufacturers and distributors that produce and sell products similar to ours. Price, quality, delivery, technological innovation, engineering development and program launch support are the primary elements of competition. Our competitors include vertically integrated units of our major OEM customers, as well as a large number of independent domestic and international suppliers. A number of our competitors are larger than we are, and some competitors have greater financial and other resources than we do. Although OEMs have indicated that they will continue to rely on outside suppliers, a number of our major OEM customers manufacture products for their own uses that directly compete with our products. These OEMs could elect to manufacture such products for their own uses in place of the products we currently supply. Our traditional OEM customers, faced with intense international competition, have continued to expand their worldwide sourcing of components. As a result, we have experienced competition from suppliers in other parts of the world that enjoy economic advantages, such as lower labor costs, lower health care costs, lower tax rates and, in some cases, export or raw materials subsidies. Increased competition could adversely affect our business. In addition, any of our competitors may foresee the course of market development more accurately than we do, develop products that are superior to our products, produce similar products at a cost that is lower than our cost, or adapt more quickly than we do to new technologies or evolving customer requirements. As a result, our products may not be able to compete successfully with our competitors' products, and we may not be able to meet the growing demands of customers. These trends may adversely affect our sales as well as the profit margins on our products.
If we do not respond appropriately, the evolution of the automotive industry could adversely affect our business.
The automotive industry is increasingly focused on the development of hybrid and electric vehicles and of advanced driver assistance technologies, with the goal of developing and introducing a commercially-viable, fully-automated driving experience. There has also been an increase in consumer preferences for mobility on demand services, such as car and ride sharing, as opposed to automobile ownership, which may result in a long-term reduction in the number of vehicles per capita. In addition, some industry participants are exploring transportation through alternatives to automobiles. These evolving areas have also attracted increased competition from entrants outside the traditional automotive industry. If we do not continue to innovate and develop, or acquire new and compelling products that capitalize upon new technologies in response to OEM and consumer preferences, this could have an adverse impact on our results of operations.
16
The increased adoption of gasoline and hybrid propulsion systems in Western Europe may materially reduce the demand for our current products.
The industry mix shift away from diesel propulsion systems in Western Europe has resulted and is expected to result in lower demand for current diesel components. This shift is expected to drive further increased demand for gasoline and hybrid propulsion systems. Although we have developed and are currently in production with products for gasoline and hybrid propulsion systems and industry penetration rates for these products are expected to increase over the next several years, due to the high current penetration rates of our key technologies on diesel propulsion systems, this industry mix shift could adversely impact our near-term results of operations, financial condition, and cash flows.
Risks related to our business
We are under substantial pressure from OEMs to reduce the prices of our products.
There is substantial and continuing pressure on OEMs to reduce costs, including costs of products we supply. OEM customers expect annual price reductions in our business. To maintain our profit margins, we seek price reductions from our suppliers, improved production processes to increase manufacturing efficiency, and streamlined product designs to reduce costs, and we attempt to develop new products, the benefits of which support stable or increased prices. Our ability to pass through increased raw material costs to our OEM customers is limited, with cost recovery often less than 100% and often on a delayed basis. Inability to reduce costs in an amount equal to annual price reductions, increases in raw material costs, and increases in employee wages and benefits could have an adverse effect on our business.
We continue to face volatile costs of commodities used in the production of our products.
The Company uses a variety of commodities (including aluminum, copper, nickel, plastic resins, steel, other raw materials and energy) and materials purchased in various forms such as castings, powder metal, forgings, stampings and bar stock. Increasing commodity costs will have an impact on our results. We have sought to alleviate the impact of increasing costs by including a material pass-through provision in our customer contracts wherever possible and by selectively hedging certain commodity exposures. Customers frequently challenge these contractual provisions and rarely pay the full cost of any increases in the cost of materials. The discontinuation or lessening of our ability to pass through or hedge increasing commodity costs could adversely affect our business.
From time to time, commodity prices may also fall rapidly. If this happens, suppliers may withdraw capacity from the market until prices improve which may cause periodic supply interruptions. The same may be true of our transportation carriers and energy providers. If these supply interruptions occur, it could adversely affect our business.
Changes in U.S. administrative policy, including changes to existing trade agreements and any resulting changes in international trade relations, may have an adverse effect on us.
The United States has implemented tariffs on imported steel and aluminum. The United States has also implemented tariffs on items imported by us from China or other countries and may implement tariffs on additional products and export controls on additional items. The impact of these tariffs has increased the cost of raw materials and components we purchase and additional tariffs would likely result in additional increases. The imposition of tariffs by the United States has resulted in retaliatory tariffs from a number of countries, including China, which increase the cost of products we sell. A continuing trade war could have a negative impact on the global market and a more significant adverse effect on our business. The potential imposition of additional tariffs on Chinese imports and imports of automobiles, including
17
cars, SUVs, vans and light trucks, and automotive parts could increase our costs and could result in lowering our gross margin on products sold.
We use important intellectual property in our business. If we are unable to protect our intellectual property or if a third party makes assertions against us or our customers relating to intellectual property rights, our business could be adversely affected.
We own important intellectual property, including patents, trademarks, copyrights, and trade secrets, and are involved in numerous licensing arrangements. Our intellectual property plays an important role in maintaining our competitive position in a number of the markets that we serve. Our competitors may develop technologies that are similar or superior to our proprietary technologies or design around the patents we own or license. Further, as we expand our operations in jurisdictions where the enforcement of intellectual property rights is less robust, the risk of others duplicating our proprietary technologies increases, despite efforts we undertake to protect them. Our inability to protect or enforce our intellectual property rights or claims that we are infringing intellectual property rights of others could adversely affect our business and our competitive position.
We are subject to business continuity risks associated with increasing centralization of our information technology (IT) systems.
To improve efficiency and reduce costs, we have regionally centralized the information systems that support our business processes such as invoicing, payroll, and general management operations. If the centralized systems are disrupted or disabled, key business processes could be interrupted, which could adversely affect our business.
A failure of or disruption in our information technology infrastructure, including a disruption related to cybersecurity, could adversely impact our business and operations.
We rely on the capacity, reliability and security of our IT systems and infrastructure. IT systems are vulnerable to disruptions, including those resulting from natural disasters, cyber attacks or failures in third-party-provided services. Disruptions and attacks on our IT systems pose a risk to the security of our systems and our ability to protect our networks and the confidentiality, availability and integrity of information and data and that of third parties, including our employees. Some cyber attacks depend on human error or manipulation, including phishing attacks or schemes that use social engineering to gain access to systems or carry out disbursement of funds or other frauds, which raise the risks from such events and the costs associated with protecting against such attacks. Although we have implemented security policies, processes, and layers of defense designed to help identify and protect against intentional and unintentional misappropriation or corruption of our systems and information, and disruptions of our operations, we have been, and likely will continue to be, subjected to such attacks or disruptions. Future attacks or disruptions could potentially lead to the inappropriate disclosure of confidential information, including our intellectual property, improper use of our systems and networks, access to and manipulation and destruction of Company or third party data, production downtimes, lost revenues, inappropriate disbursement of funds and both internal and external supply shortages. In addition, we may be required to incur significant costs to protect against damage caused by such attacks or disruptions in the future. These consequences could cause significant damage to our reputation, affect our relationships with our customers and suppliers, lead to claims against the Company and ultimately adversely affect our business.
18
Our business success depends on attracting and retaining qualified personnel.
Our ability to sustain and grow our business requires us to hire, retain and develop a highly skilled and diverse management team and workforce worldwide. In particular, any unplanned turnover or inability to attract and retain key employees and employees with technical and software capabilities in numbers sufficient for our needs could adversely affect our business.
Our profitability and results of operations may be adversely affected by program launch difficulties.
The launch of new business is a complex process, the success of which depends on a wide range of factors, including the production readiness of our manufacturing facilities and manufacturing processes and those of our suppliers, as well as factors related to tooling, equipment, employees, initial product quality and other factors. Our failure to successfully launch new business, or our inability to accurately estimate the cost to design, develop and launch new business, could have an adverse effect on our profitability and results of operations.
To the extent we are not able to successfully launch new business, vehicle production at our customers could be significantly delayed or shut down. Such situations could result in significant financial penalties to us or a diversion of personnel and financial resources to improving launches rather than investment in continuous process improvement or other growth initiatives, and could result in our customers shifting work away from us to a competitor, all of which could result in loss of revenue, or loss of market share and could have an adverse effect on our profitability and cash flows.
Part of our workforce is unionized which could subject us to work stoppages.
As of December 31, 2019, approximately 13% of our U.S. workforce was unionized. We have a domestic collective bargaining agreement for one facility in New York, which expires in September 2020. The workforce at certain of our international facilities is also unionized. A prolonged dispute with our employees could have an adverse effect on our business.
Work stoppages, production shutdowns and similar events could significantly disrupt our business.
Because the automotive industry relies heavily on just-in-time delivery of components during the assembly and manufacture of vehicles, a work stoppage or production shutdown at one or more of our manufacturing and assembly facilities could have adverse effects on our business. Similarly, if one or more of our customers were to experience a work stoppage or production shutdown, that customer would likely halt or limit purchases of our products, which could result in the shutdown of the related manufacturing facilities. A significant disruption in the supply of a key component due to a work stoppage or production shutdown at one of our suppliers or any other supplier could have the same consequences and, accordingly, have an adverse effect on our financial results.
Changes in interest rates and asset returns could increase our pension funding obligations and reduce our profitability.
We have unfunded obligations under certain of our defined benefit pension and other postretirement benefit plans. The valuation of our future payment obligations under the plans and the related plan assets is subject to significant adverse changes if the credit and capital markets cause interest rates and projected rates of return to decline. Such declines could also require us to make significant additional contributions to our pension plans in the future. Additionally, a material deterioration in the funded status of the plans could significantly increase our pension expenses and reduce profitability in the future.
19
We also sponsor post-employment medical benefit plans in the U.S. that are unfunded. If medical costs continue to increase or actuarial assumptions are modified, this could have an adverse effect on our business.
We are subject to extensive environmental regulations.
Our operations are subject to laws governing, among other things, emissions to air, discharges to waters, and the generation, handling, storage, transportation, treatment and disposal of waste and other materials. The operation of automotive parts manufacturing plants entails risks in these areas, and we cannot assure that we will not incur material costs or liabilities as a result. Through various acquisitions over the years, we have acquired a number of manufacturing facilities, and we cannot assure that we will not incur material costs and liabilities relating to activities that predate our ownership. In addition, potentially significant expenditures could be required to comply with evolving interpretations of existing environmental, health and safety laws and regulations or any new such laws and regulations (including concerns about global climate change and its impact) that may be adopted in the future. Costs associated with failure to comply with such laws and regulations could have an adverse effect on our business.
We have liabilities related to environmental, product warranties, litigation and other claims.
We and certain of our current and former direct and indirect corporate predecessors, subsidiaries and divisions have been identified by the United States Environmental Protection Agency and certain state environmental agencies and private parties as potentially responsible parties at various hazardous waste disposal sites under the Comprehensive Environmental Response, Compensation and Liability Act and equivalent state laws, and, as such, may be liable for the cost of clean-up and other remedial activities at such sites. While responsibility for clean-up and other remedial activities at such sites is typically shared among potentially responsible parties based on an allocation formula, we could have greater liability under applicable statutes. Refer to Note 15, "Contingencies," to the Consolidated Financial Statements in item 8 of this report for further discussion.
We provide product warranties to our customers for some of our products. Under these product warranties, we may be required to bear costs and expenses for the repair or replacement of these products. As suppliers become more integrally involved in the vehicle design process and assume more of the vehicle assembly functions, auto manufacturers are increasingly looking to their suppliers for contribution when faced with recalls and product warranty claims. A recall claim brought against us, or a product warranty claim brought against us, could adversely impact our results of operations. In addition, a recall claim could require us to review our entire product portfolio to assess whether similar issues are present in other product lines, which could result in significant disruption to our business and could have an adverse impact on our results of operations. We cannot assure that costs and expenses associated with these product warranties will not be material or that those costs will not exceed any amounts accrued for such product warranties in our financial statements.
We are currently, and may in the future become, subject to legal proceedings and commercial or contractual disputes. These claims typically arise in the normal course of business and may include, but not be limited to, commercial or contractual disputes with our customers and suppliers, intellectual property matters, personal injury, product liability, environmental and employment claims. There is a possibility that such claims may have an adverse impact on our business that is greater than we anticipate. While the Company maintains insurance for certain risks, the amount of insurance may not be adequate to cover all insured claims and liabilities. The incurring of significant liabilities for which there is no, or insufficient, insurance coverage could adversely affect our business.
20
Compliance with and changes in laws could be costly and could affect operating results.
We have operations in multiple countries that can be impacted by expected and unexpected changes in the legal and business environments in which we operate. Compliance-related issues in certain countries associated with laws such as the Foreign Corrupt Practices Act and other anti-corruption laws could adversely affect our business. We have internal policies and procedures relating to compliance with such laws; however, there is a risk that such policies and procedures will not always protect us from the improper acts of employees, agents, business partners, joint venture partners, or representatives, particularly in the case of recently-acquired operations that may not have significant training in applicable compliance policies and procedures. Violations of these laws, which are complex, may result in criminal penalties, sanctions and/or fines that could have an adverse effect on our business, financial condition, and results of operations and reputation.
Changes that could impact the legal environment include new legislation, new regulations, new policies, investigations and legal proceedings, and new interpretations of existing legal rules and regulations, in particular, changes in import and export control laws or exchange control laws, additional restrictions on doing business in countries subject to sanctions, and changes in laws in countries where we operate or intend to operate.
Changes in tax laws or tax rates taken by taxing authorities and tax audits could adversely affect our business.
Changes in tax laws or tax rates, the resolution of tax assessments or audits by various tax authorities, and the inability to fully utilize our tax loss carryforwards and tax credits could adversely affect our operating results. In addition, we may periodically restructure our legal entity organization.
If taxing authorities were to disagree with our tax positions in connection with any such restructurings, our effective tax rate could be materially affected. Our tax filings for various periods are subject to audit by the tax authorities in most jurisdictions where we conduct business. We have received tax assessments from various taxing authorities and are currently at varying stages of appeals and/or litigation regarding these matters. These audits may result in assessment of additional taxes that are resolved with the authorities or through the courts. We believe these assessments may occasionally be based on erroneous and even arbitrary interpretations of local tax law. Resolution of any tax matters involves uncertainties, and there are no assurances that the outcomes will be favorable.
Our growth strategy may prove unsuccessful.
We have a stated goal of increasing sales and operating income at a rate greater than growth, if any, in global vehicle production by increasing content per vehicle with innovative new components and through select acquisitions.
We may not meet our goal due to many factors, including any of the risks identified in the paragraph that follows, failure to develop new products that our customers will purchase, technology changes that could render our products obsolete, and a reversal of the trend of supplying systems (which allows us to increase content per vehicle) instead of components, among other things.
We expect to continue to pursue business ventures, acquisitions, and strategic alliances that leverage our technology capabilities, enhance our customer base, geographic representation, and scale to complement our current businesses, and we regularly evaluate potential growth opportunities, some of which could be material. While we believe that such transactions are an integral part of our long-term strategy, there are risks and uncertainties related to these activities. Assessing a potential growth opportunity involves extensive due diligence. However, the amount of information we can obtain about a potential growth opportunity can be limited, and we can give no assurance that past or future business
21
ventures, acquisitions, and strategic alliances will positively affect our financial performance or will perform as planned. We may not be able to successfully assimilate or integrate companies that we have acquired or acquire in the future, including their personnel, financial systems, distribution, operations and general operating procedures. The integration of companies that we have acquired or will acquire in the future may be more difficult, time consuming or costly than expected. Revenues following the acquisition of a company may be lower than expected, customer loss and business disruption (including, without limitation, difficulties in maintaining relationships with employees, customers, or suppliers) may be greater than expected, and we may not be able to retain key employees at the acquired company. We may also encounter challenges in achieving appropriate internal control over financial reporting in connection with the integration of an acquired company. If we fail to assimilate or integrate acquired companies successfully, our business, reputation and operating results could be adversely affected. Likewise, our failure to integrate and manage acquired companies or realize certain synergies successfully may lead to future impairment of any associated goodwill and intangible asset balances. Failure to execute our growth strategy could adversely affect our business.
Our proposed acquisition of Delphi Technologies is subject to conditions, as well as other uncertainties, and there can be no assurances as to whether or when it may be completed. Failure to complete the proposed transaction could adversely affect our business.
The completion of our proposed acquisition of Delphi Technologies is subject to a number of conditions, including, among other things, the approval by Delphi Technologies stockholders and the receipt of certain regulatory approvals, which make the completion and timing of the completion of the proposed transaction uncertain. If the proposed transaction is not completed, our business may be adversely affected and, without realizing any of the benefits of having completed the proposed transaction, we will be subject to a number of risks, including the following:
•a potential decline to the market price of our common stock;
• | an inability to find another acquisition, with comparable electronic components, systems and technical capabilities; |
• | a loss of time and resources that our management redirected to matters relating to the proposed transaction that could otherwise have been devoted to pursuing other beneficial opportunities; and |
• | potential negative reactions from the financial markets or from our customers, suppliers, or employees. |
In addition, we could be subject to litigation related to any failure to complete the proposed transaction. The materialization of any of these risks could adversely impact our ongoing businesses. Similarly, delays in the completion of the proposed transaction could, among other things, result in additional transaction costs, loss of revenue or personnel, or other negative effects associated with uncertainty about completion of the proposed transaction.
We are subject to risks related to our international operations.
We have manufacturing and technical facilities in many regions including Europe, Asia, and the Americas. For 2019, approximately 77% of our consolidated net sales were outside the U.S. Consequently, our results could be affected by changes in trade, monetary and fiscal policies, trade restrictions or prohibitions, import or other charges or taxes, fluctuations in foreign currency exchange rates, limitations on the repatriation of funds, changing economic conditions, unreliable intellectual property protection and legal systems, insufficient infrastructures, social unrest, political instability and disputes, international terrorism and other factors that may be discrete to a particular country or geography. Compliance with multiple and potentially conflicting laws and regulations of various countries is challenging, burdensome and expensive.
22
The financial statements of foreign subsidiaries are translated to U.S. dollars using the period-end exchange rate for assets and liabilities and an average exchange rate for each period for revenues, expenses and capital expenditures. The local currency is typically the functional currency for the Company's foreign subsidiaries. Significant foreign currency fluctuations and the associated translation of those foreign currencies could adversely affect our business. Additionally, significant changes in currency exchange rates, particularly the Euro, Korean Won and Chinese Renminbi, could cause fluctuations in the reported results of our businesses’ operations that could negatively affect our results of operations.
Because we are a U.S. holding company, one significant source of our funds is distributions from our non-U.S. subsidiaries. Certain countries in which we operate have adopted or could institute currency exchange controls that limit or prohibit our local subsidiaries' ability to convert local currency into U.S. dollars or to make payments outside the country. This could subject us to the risks of local currency devaluation and business disruption.
Our business in China is subject to aggressive competition and is sensitive to economic, political, and market conditions.
Maintaining a strong position in the Chinese market is a key component of our global growth strategy. The automotive supply market in China is highly competitive, with competition from many of the largest global manufacturers and numerous smaller domestic manufacturers. As the Chinese market evolves, we anticipate that market participants will act aggressively to increase or maintain their market share. Increased competition may result in price reductions, reduced margins and our inability to gain or hold market share. In addition, our business in China is sensitive to economic, political, social and market conditions that drive sales volumes in China. In fact, recently, economic growth has slowed in China. If we are unable to maintain our position in the Chinese market or if vehicle sales in China decrease, our business and financial results could be adversely affected.
A downgrade in the ratings of our debt could restrict our ability to access the debt capital markets.
Changes in the ratings that rating agencies assign to our debt may ultimately impact our access to the debt capital markets and the costs we incur to borrow funds. If ratings for our debt fall below investment grade, our access to the debt capital markets could become restricted and our cost of borrowing or the interest rate for any subsequently issued debt would likely increase.
Our revolving credit agreement includes an increase in interest rates if the ratings for our debt are downgraded. The interest costs on our revolving credit agreement are based on a rating grid agreed to in our credit agreement. Further, an increase in the level of our indebtedness and related interest costs may increase our vulnerability to adverse general economic and industry conditions and may affect our ability to obtain additional financing.
We could incur additional restructuring charges as we continue to execute actions in an effort to improve future profitability and competitiveness and to optimize our product portfolio and may not achieve the anticipated savings and benefits from these actions.
We have initiated and may continue to initiate restructuring actions designed to improve the competitiveness of our business and sustain our margin profile, optimize our product portfolio or create an optimal legal entity structure. We may not realize anticipated savings or benefits from past or future actions in full or in part or within the time periods we expect. We are also subject to the risks of labor unrest, negative publicity and business disruption in connection with our actions. Failure to realize anticipated savings or benefits from our actions could have an adverse effect on our business.
23
Risks related to our customers
We rely on sales to major customers.
We rely on sales to OEMs around the world of varying credit quality and manufacturing demands. Supply to several of these customers requires significant investment by the Company. We base our growth projections, in part, on commitments made by our customers. These commitments generally renew yearly during a program life cycle. Among other things, the level of production orders we receive is dependent on the ability of our OEM customers to design and sell products that consumers desire to purchase. If actual production orders from our customers do not approximate such commitments due to a variety of factors including non-renewal of purchase orders, a customer's financial hardship or other unforeseen reasons, it could adversely affect our business.
Some of our sales are concentrated. Our worldwide sales in 2019 to Ford and Volkswagen constituted approximately 15% and 11% of our 2019 consolidated net sales, respectively.
We are sensitive to the effects of our major customers’ labor relations.
All three of our primary North American customers, Ford, Fiat Chrysler Automobiles, and General Motors, have major union contracts with the United Automobile, Aerospace and Agricultural Implement Workers of America. Because of domestic OEMs' dependence on a single union, we are affected by labor difficulties and work stoppages at OEMs' facilities. Similarly, a majority of our global customers' operations outside of North America are also represented by various unions. Any extended work stoppage at one or more of our customers could have an adverse effect on our business.
Risks related to our suppliers
We could be adversely affected by supply shortages of components from our suppliers.
In an effort to manage and reduce the cost of purchased goods and services, we have been rationalizing our supply base. As a result, we are dependent on fewer sources of supply for certain components used in the manufacture of our products. We select suppliers based on total value (including total landed price, quality, delivery, and technology), taking into consideration their production capacities and financial condition. We expect that they will deliver to our stated written expectations.
However, there can be no assurance that capacity limitations, industry shortages, labor or social unrest, weather emergencies, commercial disputes, government actions, riots, wars, sabotage, cyber attacks, non-conforming parts, acts of terrorism, “Acts of God," or other problems that our suppliers experience will not result in occasional shortages or delays in their supply of components to us. If we were to experience a significant or prolonged shortage of critical components from any of our suppliers and could not procure the components from other sources, we would be unable to meet the production schedules for some of our key products and could miss customer delivery expectations. In addition, with fewer sources of supply for certain components, each supplier may perceive that it has greater leverage and, therefore, some ability to seek higher prices from us at a time that we face substantial pressure from OEMs to reduce the prices of our products. This could adversely affect our customer relations and business.
24
Suppliers’ economic distress could result in the disruption of our operations and could adversely affect our business.
Rapidly changing industry conditions such as volatile production volumes; our need to seek price reductions from our suppliers as a result of the substantial pressure we face from OEMs to reduce the prices of our products; credit tightness; changes in foreign currencies; raw material, commodity, tariffs, transportation, and energy price escalation; drastic changes in consumer preferences; and other factors could adversely affect our supply chain, and sometimes with little advance notice. These conditions could also result in increased commercial disputes and supply interruption risks. In certain instances, it would be difficult and expensive for us to change suppliers that are critical to our business. On occasion, we must provide financial support to distressed suppliers or take other measures to protect our supply lines. We cannot predict with certainty the potential adverse effects these costs might have on our business.
We are subject to possible insolvency of financial counterparties.
We engage in numerous financial transactions and contracts including insurance policies, letters of credit, credit line agreements, financial derivatives, and investment management agreements involving various counterparties. We are subject to the risk that one or more of these counterparties may become insolvent and therefore be unable to meet its obligations under such contracts.
Other risks
A variety of other factors could adversely affect our business.
Any of the following could materially and adversely affect our business: the loss of or changes in supply contracts or sourcing strategies of our major customers or suppliers; start-up expenses associated with new vehicle programs or delays or cancellation of such programs; low levels of utilization of our manufacturing facilities, which can be dependent on a single product line or customer; inability to recover engineering and tooling costs; market and financial consequences of recalls that may be required on products we supplied; delays or difficulties in new product development; the possible introduction of similar or superior technologies by others; global excess capacity and vehicle platform proliferation; and the impact of fire, flood, or other natural disasters including pandemics and quarantines.
Item 1B. | Unresolved Staff Comments |
The Company has received no written comments regarding its periodic or current reports from the staff of the Securities and Exchange Commission that were issued 180 days or more preceding the end of its 2019 fiscal year that remain unresolved.
25
Item 2. | Properties |
As of December 31, 2019, the Company had 67 manufacturing, assembly, and technical locations worldwide. The Company's worldwide headquarters are located in a leased facility in Auburn Hills, Michigan. In general, the Company believes its facilities to be suitable and adequate to meet its current and reasonably anticipated needs.
The following is additional information concerning principal manufacturing, assembly, and technical facilities operated by the Company, its subsidiaries, and affiliates.
ENGINE(a)
Americas | Europe | Asia | ||
Asheville, North Carolina | Arcore, Italy | Aoyama, Japan | ||
Auburn Hills, Michigan (d) | Bradford, England (UK) | Chennai, India (b) | ||
Cadillac, Michigan | Kirchheimbolanden, Germany | Chungju-City, South Korea | ||
Dixon, Illinois | Ludwigsburg, Germany | Taicang, China (b) | ||
El Salto Jalisco, Mexico | Lugo, Italy (b) | Kakkalur, India | ||
Fletcher, North Carolina | Markdorf, Germany | Manesar, India | ||
Itatiba, Brazil | Muggendorf, Germany | Nabari City, Japan | ||
Ithaca, New York | Oberboihingen, Germany | Ningbo, China (b) (e) | ||
Marshall, Michigan | Oroszlany, Hungary (d) | Pune, India | ||
Ramos, Mexico | Rzeszow, Poland (d) | Pyongtaek, South Korea (b) (c) | ||
Tralee, Ireland | Rayong, Thailand (d) | |||
Viana de Castelo, Portugal | ||||
Vigo, Spain | ||||
DRIVETRAIN(a)
Americas | Europe | Asia | ||
Anderson, Indiana (b) | Arnstadt, Germany | Beijing, China (b) | ||
Bellwood, Illinois | Gateshead, England (UK) | Dae-Gu, South Korea (b) | ||
Brusque, Brazil (b) | Heidelberg, Germany | Dalian, China (b) | ||
Frankfort, Illinois | Ketsch, Germany | Eumsung, South Korea | ||
Irapuato, Mexico | Landskrona, Sweden (b) | Fukuroi City, Japan | ||
Laredo, Texas (b) | Tulle, France | Changnyeong, South Korea | ||
Livonia, Michigan | Wrexham, Wales (UK) | Ochang, South Korea (b) | ||
Melrose Park, Illinois (b) | Shanghai, China (b) | |||
Noblesville, Indiana (b) | Tianjin, China (b) | |||
San Luis Potosi, Mexico (b) | Wuhan, China (b) | |||
Seneca, South Carolina | ||||
Water Valley, Mississippi | ||||
Waterloo, Ontario, Canada | ||||
________________
(a) | The table excludes joint ventures owned less than 50% and administrative offices. |
(b) | Indicates leased land rights or a leased facility. |
(c) | City has 2 locations: a wholly owned subsidiary and a joint venture. |
(d) | Location serves both segments. |
(e) | City has 3 locations: 2 wholly owned subsidiaries and a joint venture |
26
Item 3. | Legal Proceedings |
The Company is subject to a number of claims and judicial and administrative proceedings (some of which involve substantial amounts) arising out of the Company’s business or relating to matters for which the Company may have a contractual indemnity obligation. See Note 15, "Contingencies," to the Consolidated Financial Statements in Item 8 of this report for a discussion of environmental, product liability and other litigation, which is incorporated herein by reference.
On July 31, 2018, the Division of Enforcement of the SEC informed the Company that it is conducting an investigation related to the Company's accounting for asbestos-related claims not yet asserted. The Company is fully cooperating with the SEC in connection with its investigation.
Item 4. | Mine Safety Disclosures |
Not applicable.
PART II
Item 5. | Market for Registrant's Common Equity, Related Stockholder Matters and Issuer Purchases of Equity Securities |
The Company's common stock is listed for trading on the New York Stock Exchange under the symbol BWA. As of February 7, 2020, there were 1,549 holders of record of Common Stock.
While the Company currently expects that quarterly cash dividends will continue to be paid in the future at levels comparable to recent historical levels, the dividend policy is subject to review and change at the discretion of the Board of Directors.
27
The line graph below compares the cumulative total shareholder return on our Common Stock with the cumulative total return of companies on the Standard & Poor's (S&P's) 500 Stock Index, and companies within Standard Industrial Code (“SIC”) 3714 - Motor Vehicle Parts.
COMPARISON OF 5 YEAR CUMULATIVE TOTAL RETURN*
Among BorgWarner Inc., the S&P 500 Index, and SIC 374 Motor Vehicle Parts
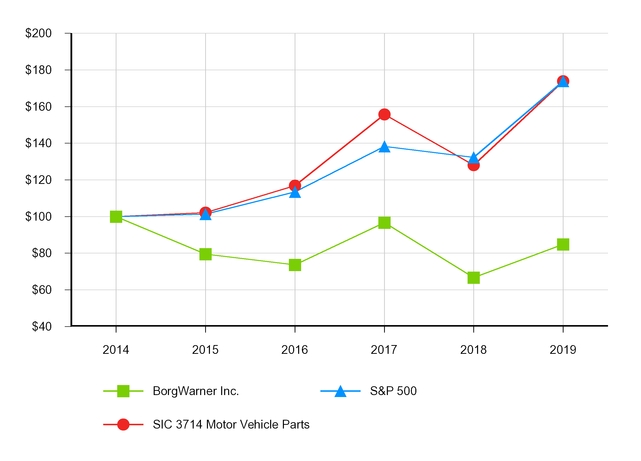
___________
*$100 invested on 12/31/2014 in stock or index, including reinvestment of dividends. Fiscal year ending December 31.
Copyright© 2020 S&P, a division of S&P Global. All rights reserved.
BWA and S&P 500 data are from Capital IQ; SIC Code Index data is from Research Data Group
December 31, | ||||||||||||||||||
2014 | 2015 | 2016 | 2017 | 2018 | 2019 | |||||||||||||
BorgWarner Inc.(1) | $ | 100.00 | $ | 79.48 | $ | 73.65 | $ | 96.64 | $ | 66.71 | $ | 84.83 | ||||||
S&P 500(2) | 100.00 | 101.38 | 113.51 | 138.29 | 132.23 | 173.86 | ||||||||||||
SIC Code Index(3) | 100.00 | 102.17 | 116.88 | 155.78 | 128.11 | 173.86 | ||||||||||||
________________
(1)BorgWarner Inc.
(2)S&P 500 — Standard & Poor’s 500 Total Return Index
(3)Standard Industrial Code (“SIC”) 3714-Motor Vehicle Parts
28
Purchase of Equity Securities
On November 13, 2019, the Company's Board of Directors increased the cumulative authorization for the purchase of the Company's common stock up to 89.6 million shares in the aggregate. As of December 31, 2019, the Company had repurchased 75.4 million shares in the aggregate under the common stock repurchase program. All shares purchased under this authorization have been and will continue to be repurchased in the open market at prevailing prices and at times and in amounts to be determined by management as market conditions and the Company's capital position warrant. The Company may use Rule 10b5-1 and 10b-18 plans to facilitate share repurchases. Repurchased shares will be deemed common stock held in treasury and may subsequently be reissued.
Employee transactions include restricted stock withheld to offset statutory minimum tax withholding that occurs upon vesting of restricted stock. The BorgWarner Inc. 2014 Stock Incentive Plan, as amended and the BorgWarner Inc. 2018 Stock Incentive Plan provide that the withholding obligations be settled by the Company retaining stock that is part of the award. Withheld shares will be deemed common stock held in treasury and may subsequently be reissued for general corporate purposes.
The following table provides information about the Company's purchases of its equity securities that are registered pursuant to Section 12 of the Securities Exchange Act of 1934, as amended (the "Exchange Act") during the quarter ended December 31, 2019:
Issuer Purchases of Equity Securities | |||||||||||||
Period | Total number of shares purchased | Average price per share | Total number of shares purchased as part of publicly announced plans or programs | Maximum number of shares that may yet be purchased under the plans or programs | |||||||||
Month Ended October 31, 2019 | |||||||||||||
Common Stock Repurchase Program | — | $ | — | — | 4,241,311 | ||||||||
Employee transactions | 4,858 | $ | 40.31 | — | |||||||||
Month Ended November 30, 2019 | |||||||||||||
Common Stock Repurchase Program | — | $ | — | — | 14,241,311 | ||||||||
Employee transactions | 623 | $ | 37.59 | — | |||||||||
Month Ended December 31, 2019 | |||||||||||||
Common Stock Repurchase Program | — | $ | — | — | 14,241,311 | ||||||||
Employee transactions | — | $ | — | — | |||||||||
Equity Compensation Plan Information
As of December 31, 2019, the number of shares of options, restricted common stock, warrants and rights outstanding under our equity compensation plans, the weighted average exercise price of outstanding options, restricted common stock, warrants and rights and the number of securities remaining available for issuance were as follows:
Number of securities to be issued upon exercise of outstanding options, restricted common stock, warrants and rights | Weighted average exercise price of outstanding options, restricted common stock, warrants and rights | Number of securities remaining available for future issuance under equity compensation plans (excluding securities reflected in column (a)) | |||||||
Plan category | (a) | (b) | (c) | ||||||
Equity compensation plans approved by security holders | 1,663,812 | $ | 44.26 | 5,984,977 | |||||
Equity compensation plans not approved by security holders | — | $ | — | — | |||||
Total | 1,663,812 | 44.26 | 5,984,977 | ||||||
29
Item 6. | Selected Financial Data |
Year Ended December 31, | ||||||||||||||||||||
(in millions) | 2019 | 2018 | 2017 | 2016 | 2015 | |||||||||||||||
Operating results | ||||||||||||||||||||
Net sales | $ | 10,168 | $ | 10,530 | $ | 9,799 | $ | 9,071 | $ | 8,023 | ||||||||||
Operating income (a) | $ | 1,303 | $ | 1,190 | $ | 1,072 | $ | 973 | $ | 888 | ||||||||||
Net earnings attributable to BorgWarner Inc.(a) | $ | 746 | $ | 931 | $ | 440 | $ | 595 | $ | 577 | ||||||||||
Earnings per share — basic | $ | 3.63 | $ | 4.47 | $ | 2.09 | $ | 2.78 | $ | 2.57 | ||||||||||
Earnings per share — diluted | $ | 3.61 | $ | 4.44 | $ | 2.08 | $ | 2.76 | $ | 2.56 | ||||||||||
Net R&D expenditures | $ | 413 | $ | 440 | $ | 408 | $ | 343 | $ | 307 | ||||||||||
Capital expenditures, including tooling outlays | $ | 481 | $ | 546 | $ | 560 | $ | 501 | $ | 577 | ||||||||||
Depreciation and amortization | $ | 439 | $ | 431 | $ | 408 | $ | 391 | $ | 320 | ||||||||||
Number of employees | 29,000 | 30,000 | 29,000 | 27,000 | 30,000 | |||||||||||||||
Financial position | ||||||||||||||||||||
Cash and cash equivalents | $ | 832 | $ | 739 | $ | 545 | $ | 444 | $ | 578 | ||||||||||
Total assets | $ | 9,702 | $ | 10,095 | $ | 9,788 | $ | 8,835 | $ | 9,211 | ||||||||||
Total debt | $ | 1,960 | $ | 2,114 | $ | 2,188 | $ | 2,220 | $ | 2,550 | ||||||||||
Common share information | ||||||||||||||||||||
Cash dividend declared and paid per share | $ | 0.68 | $ | 0.68 | $ | 0.59 | $ | 0.53 | $ | 0.52 | ||||||||||
Weighted average shares outstanding | ||||||||||||||||||||
Basic | 205.7 | 208.2 | 210.4 | 214.4 | 224.4 | |||||||||||||||
Diluted | 206.8 | 209.5 | 211.5 | 215.3 | 225.6 | |||||||||||||||
________________
(a) | Refer to Item 7, "Management's Discussion and Analysis of Financial Condition and Results of Operations," for discussion of non-comparable items impacting the years ended December 31, 2019 and 2018. |
30
Item 7. | Management’s Discussion and Analysis of Financial Condition and Results of Operations |
INTRODUCTION
BorgWarner Inc. and Consolidated Subsidiaries (the “Company”) is a global product leader in clean and efficient technology solutions for combustion, hybrid and electric vehicles. Our products help improve vehicle performance, propulsion efficiency, stability and air quality. These products are manufactured and sold worldwide, primarily to original equipment manufacturers (“OEMs”) of light vehicles (passenger cars, sport-utility vehicles ("SUVs"), vans and light trucks). The Company's products are also sold to other OEMs of commercial vehicles (medium-duty trucks, heavy-duty trucks and buses) and off-highway vehicles (agricultural and construction machinery and marine applications). We also manufacture and sell our products to certain Tier One vehicle systems suppliers and into the aftermarket for light, commercial and off-highway vehicles. The Company operates manufacturing facilities serving customers in Europe, the Americas and Asia and is an original equipment supplier to every major automotive OEM in the world.
The Company's products fall into two reporting segments: Engine and Drivetrain. The Engine segment's products include turbochargers, timing systems, emissions systems and thermal systems. The Drivetrain segment's products include transmission systems, torque transfer systems and rotating electrical components.
Proposed Acquisition of Delphi Technologies PLC
On January 28, 2020, the Company entered into a definitive agreement to acquire Delphi Technologies PLC (“Delphi Technologies”) in an all-stock transaction valued at approximately $3.3 billion, based on the closing price of BorgWarner stock on January 27, 2020. Refer to Note 23, “Subsequent Event,” to the Consolidated Financial Statements in Item 8 of this report for more information. The Company expects to pay fees, costs and expenses associated with the transaction with available cash. The following discussion and analysis of financial condition and results of operations does not address matters associated with the anticipated acquisition.
31
RESULTS OF OPERATIONS
A detailed comparison of the Company’s 2017 operating results to its 2018 operating results can be found in the Management’s Discussion and Analysis of Financial Condition and Results of Operations section in the Company’s 2018 Annual Report on Form 10-K filed February 19, 2019.
A summary of our operating results for the years ended December 31, 2019 and 2018 is as follows:
Year Ended December 31, | |||||||
(in millions, except per share data) | 2019 | 2018 | |||||
Net sales | $ | 10,168 | $ | 10,530 | |||
Cost of sales | 8,067 | 8,300 | |||||
Gross profit | 2,101 | 2,230 | |||||
Selling, general and administrative expenses | 873 | 946 | |||||
Other (income) expense, net | (75 | ) | 94 | ||||
Operating income | 1,303 | 1,190 | |||||
Equity in affiliates’ earnings, net of tax | (32 | ) | (49 | ) | |||
Interest income | (12 | ) | (6 | ) | |||
Interest expense | 55 | 59 | |||||
Other postretirement expense (income) | 27 | (10 | ) | ||||
Earnings before income taxes and noncontrolling interest | 1,265 | 1,196 | |||||
Provision for income taxes | 468 | 211 | |||||
Net earnings | 797 | 985 | |||||
Net earnings attributable to the noncontrolling interest, net of tax | 51 | 54 | |||||
Net earnings attributable to BorgWarner Inc. | $ | 746 | $ | 931 | |||
Earnings per share — diluted | $ | 3.61 | $ | 4.44 | |||
32
Non-comparable items impacting the Company's earnings per diluted share and net earnings
The Company's earnings per diluted share were $3.61 and $4.44 for the years ended December 31, 2019 and 2018, respectively. The non-comparable items presented below are calculated after tax using the corresponding effective tax rate and the weighted average number of diluted shares for each of the years then ended. The Company believes the following table is useful in highlighting non-comparable items that impacted its earnings per diluted share:
Year Ended December 31, | |||||||
Non-comparable items: | 2019 | 2018 | |||||
Restructuring expense | $ | (0.26 | ) | $ | (0.24 | ) | |
Pension settlement loss | (0.10 | ) | — | ||||
Unfavorable arbitration loss | (0.07 | ) | — | ||||
Merger, acquisition and divestiture expense | (0.05 | ) | (0.03 | ) | |||
Asset impairment and loss on divestiture | (0.03 | ) | (0.09 | ) | |||
Officer stock awards modification | (0.01 | ) | (0.04 | ) | |||
Gain on derecognition of subsidiary | 0.02 | — | |||||
Asbestos-related adjustments | — | (0.08 | ) | ||||
Gain on sale of building | — | 0.07 | |||||
Gain on commercial settlement | — | 0.01 | |||||
Tax reform adjustments | — | 0.06 | |||||
Tax adjustments | (0.02 | ) | 0.30 | ||||
Total impact of non-comparable items per share — diluted: | $ | (0.52 | ) | $ | (0.04 | ) | |
A summary of non-comparable items impacting the Company’s net earnings for the years ended December 31, 2019 and 2018 is as follows:
Year ended December 31, 2019:
• | The Company recorded restructuring expense of $72 million primarily related to actions to reduce structural costs. Refer to Note 16, "Restructuring," to the Consolidated Financial Statements in Item 8 of this report for more information. Over the course of the next few years, the Company plans to take additional actions to reduce existing structural costs. These actions are expected to result in primarily cash restructuring costs in the $275 million to $300 million range through the end of 2023. The resulting annual cost savings are expected to be in the range of approximately $90 million to $100 million by 2023. The Company plans to utilize these savings to sustain the Company’s strong operating margin profile and long-term cost competitiveness. |
• | During the year ended December 31, 2019, the Company settled approximately $50 million of its U.S. pension projected benefit obligation by liquidating approximately $50 million in plan assets through a lump-sum pension de-risking disbursement made to an insurance company. Pursuant to this agreement, the insurance company unconditionally and irrevocably guarantees all future payments to certain participants that were receiving payments from the U.S. pension plan. The insurance company assumes all investment risk associated with the assets that were delivered as part of this transaction. Additionally, during 2019, the Company discharged certain U.S. pension plan obligations by making lump-sum payments of $15 million to former employees of the Company. As a result, the Company settled $65 million of projected pension obligation by liquidating an equivalent amount of pension plan assets and recorded a non-cash settlement loss of $27 million related to the accelerated recognition of unamortized losses. |
• | During the year ended December 31, 2019, the Company recorded $14 million of expenses related to the receipt of a final unfavorable arbitration decision associated with the resolution of a matter related to a previous acquisition. |
33
• | During the year ended December 31, 2019, the Company recorded $11 million of expenses, primarily professional fees, related to the Company's strategic acquisition and divestiture activities, including the transfer of Morse TEC, the anticipated acquisition of Delphi Technologies, and the 20% equity interest in Romeo Systems, Inc. and the divestiture activities for the non-core pipes and thermostat product lines. |
• | During the year ended December 31, 2019, the Company recorded an additional loss on sale of $7 million to account for the cash proceeds and finalization of the purchase price adjustments related to the sale of the non-core pipes and thermostat product lines. Refer to Note 20, "Assets and Liabilities Held for Sale," to the Consolidated Financial Statements in Item 8 of this report for more information. |
• | During the year ended December 31, 2019, the Company recorded a pre-tax gain on the derecognition of BorgWarner Morse TEC LLC ("Morse TEC") of $177 million and removed the asbestos obligations and related insurance assets from the Consolidated Balance Sheet. In addition, the Company recorded tax expense as a result of the reversal of the previously recorded deferred tax assets related to the asbestos liabilities of $173 million, resulting in an after-tax gain of $4 million. Refer to Note 19, "Recent Transactions," to the Consolidated Financial Statements in Item 8 of this report for more information. |
• | The Company's provision for income taxes for the year ended December 31, 2019, includes reductions to tax expense of $19 million related to restructuring and merger, acquisition and divestiture expense and $6 million related to pension settlement loss. This rate also includes increases to tax expense of $22 million due to the U.S. Department of the Treasury’s issuance of the final regulations in the first quarter of 2019 related to the calculation of the one-time transition tax partially offset by reductions to tax expense of $11 million for a global realignment plan and $8 million related to other one-time adjustments. |
Year ended December 31, 2018:
• | The Company recorded restructuring expense of $67 million related to Engine and Drivetrain segment actions designed to improve future profitability and competitiveness, primarily related to employee termination benefits, professional fees, and manufacturing footprint rationalization activities. |
• | During the year ended December 31, 2018, the Company recorded an asset impairment expense of $26 million to adjust the net book value of the pipes and thermostat product lines to fair value less costs to sell. Additionally, the Company recorded $6 million of merger, acquisition and divestiture expense primarily related to professional fees associated with divestiture activities for the non-core pipes and thermostat product lines. Refer to Note 20, "Assets and Liabilities Held for Sale," to the Consolidated Financial Statements in Item 8 of this report for more information. |
• | The Company recorded net restricted stock and performance share unit compensation expense of $8 million in the year ended December 31, 2018 as the Company modified the vesting provisions of restricted stock and performance share unit grants made to retiring executive officers to allow certain of the outstanding awards, that otherwise would have been forfeited, to vest upon retirement. Refer to Note 13, "Stock-Based Compensation," to the Consolidated Financial Statements in Item 8 of this report for more information. |
• | During the year ended December 31, 2018, the Company recorded asbestos-related adjustments resulting in an increase to Other Expense of $23 million. This increase was the result of actuarial valuation changes of $23 million associated with the Company's estimate of liabilities for asbestos-related claims asserted but not yet resolved and potential claims not yet asserted. Refer to Note 15, "Contingencies," to the Consolidated Financial Statements in Item 8 of this report for more information. |
• | During the fourth quarter of 2018, the Company recorded a gain of $19 million related to the sale of a building at a manufacturing facility located in Europe. |
34
• | During the year ended December 31, 2018, the Company recorded a gain of approximately $4 million related to the settlement of a commercial contract for an entity acquired in the 2015 Remy acquisition. |
• | The Company's provision for income taxes for the year ended December 31, 2018 includes reductions of income tax expense of $15 million related to restructuring expense, $6 million related to the asbestos-related adjustments, and $8 million related to asset impairment expense, offset by increases to tax expense of $1 million and $6 million related to a gain on commercial settlement and a gain on the sale of a building, respectively, discussed in Note 4, "Other Expense, Net," to the Consolidated Financial Statements. The provision for income taxes also includes reductions of income tax expense of $13 million related to final adjustments made to measurement period provisional estimates associated with the Tax Cuts and Jobs Act (the "Tax Act"), $22 million related to a decrease in our deferred tax liability due to a tax benefit for certain foreign tax credits now available due to actions the Company took during the year, $9 million related to valuation allowance releases, $3 million related to tax reserve adjustments, and $30 million related to changes in accounting methods and tax filing positions for prior years primarily related to the Tax Act. Refer to Note 5, "Income Taxes," to the Consolidated Financial Statements in Item 8 of this report for more information. |
Net Sales
Net sales for the year ended December 31, 2019 totaled $10,168 million, a 3.4% decrease from the year ended December 31, 2018. Excluding the impact of weaker foreign currencies and the net impact of acquisitions and divestitures, net sales increased 0.7%.
The following table details our results of operations as a percentage of net sales:
Year Ended December 31, | |||||
(percentage of net sales) | 2019 | 2018 | |||
Net sales | 100.0 | % | 100.0 | % | |
Cost of sales | 79.3 | 78.8 | |||
Gross profit | 20.7 | 21.2 | |||
Selling, general and administrative expenses | 8.6 | 9.0 | |||
Other (income) expense, net | (0.7 | ) | 0.9 | ||
Operating income | 12.8 | 11.3 | |||
Equity in affiliates’ earnings, net of tax | (0.3 | ) | (0.5 | ) | |
Interest income | (0.1 | ) | (0.1 | ) | |
Interest expense | 0.5 | 0.6 | |||
Other postretirement expense (income) | 0.3 | (0.1 | ) | ||
Earnings before income taxes and noncontrolling interest | 12.4 | 11.4 | |||
Provision for income taxes | 4.6 | 2.0 | |||
Net earnings | 7.8 | 9.4 | |||
Net earnings attributable to the noncontrolling interest, net of tax | 0.5 | 0.5 | |||
Net earnings attributable to BorgWarner Inc. | 7.3 | % | 8.9 | % | |
Cost of sales as a percentage of net sales was 79.3% and 78.8% in the years ended December 31, 2019 and 2018, respectively. The Company's material cost of sales was approximately 55% of net sales in the years ended December 31, 2019 and 2018. Gross profit as a percentage of net sales was 20.7% and 21.2% in the years ended December 31, 2019 and 2018, respectively. The reduction of gross margin in 2019 compared to 2018 was primarily due to the impact of lower revenue, the increased cost from tariffs and supplier cost reductions not keeping pace with normal customer price deflation.
35
Selling, general and administrative expenses (“SG&A”) was $873 million and $946 million, or 8.6% and 9.0% of net sales for the years ended December 31, 2019 and 2018, respectively. The decrease in SG&A expenses was primarily due to stock-based compensation expense and cost control measures.
Research and development ("R&D") costs, net of customer reimbursements, were $413 million, or 4.1% of net sales, in the year ended December 31, 2019, compared to $440 million, or 4.2% of net sales, in the year ended December 31, 2018. The decrease of R&D costs, net of customer reimbursements, in the year ended December 31, 2019 compared with the year ended December 31, 2018 was primarily due to cost control measures and an increase in customer reimbursements. We will continue to invest in a number of cross-business R&D programs, as well as a number of other key programs, all of which are necessary for short- and long-term growth. Our current long-term expectation for R&D spending remains in the range of 4% to 4.5% of net sales.
Other (income) expense, net was $(75) million and $94 million for the years ended December 31, 2019 and 2018, respectively. This line item is primarily comprised of non-income tax items discussed within the subtitle "Non-comparable items impacting the Company's earnings per diluted share and net earnings" above.
Equity in affiliates' earnings, net of tax was $32 million and $49 million in the years ended December 31, 2019 and 2018, respectively. This line item is driven by the results of our 50%-owned Japanese joint venture, NSK-Warner KK, and our 32.6%-owned Indian joint venture, Turbo Energy Private Limited (“TEL”). The decrease in equity in affiliates' earnings in the year ended December 31, 2019 was due to lower industry volumes and cost pressures in a reduced market.
Interest expense and finance charges were $55 million and $59 million in the years ended December 31, 2019 and 2018, respectively. The decrease in interest expense for the year ended December 31, 2019 compared with the year ended December 31, 2018 was primarily due to lower debt levels.
Provision for income taxes the provision for income taxes resulted in an effective tax rate of 37% for the year ended December 31, 2019, compared with the rate of 17.7% for the year ended December 31, 2018. As of December 31, 2018, the Company has completed its accounting for the tax effects of the Tax Act. For further details, see Note 5, "Income Tax," to the Consolidated Financial Statements in Item 8.
The effective tax rate of 37% for the year ended December 31, 2019 includes an increase in income tax expense of $173 million related to the derecognition of the Morse TEC asbestos-related deferred tax assets and $22 million due to the U.S. Department of the Treasury’s issuance of the final regulations in the first quarter of 2019 related to the calculation of the one-time transition tax. This rate also includes reductions of income tax expense of $19 million related to restructuring expense, $11 million for a global realignment plan, $8 million related to other one-time adjustments and $6 million related to pension settlement loss. Excluding the impact of these non-comparable items, the Company's annual effective tax rate associated with ongoing operations is 26% for the year ended December 31, 2019.
The effective tax rate of 17.7% for the year ended December 31, 2018 includes reductions of income tax expense of $15 million related to restructuring expense, $6 million related to the asbestos-related adjustments, and $8 million related to asset impairment expense, offset by increases to tax expense of $1 million and $6 million related to a gain on commercial settlement and a gain on the sale of a building, respectively, discussed in Note 4, "Other (Income) Expense, Net," to the Consolidated Financial Statements. The provision for income taxes also includes reductions of income tax expense of $13 million related to final adjustments made to measurement period provisional estimates associated with the Tax Act, $22 million related to a decrease in our deferred tax liability due to a tax benefit for certain
36
foreign tax credits now available due to actions the Company took during the year, $9 million related to valuation allowance releases, $3 million related to tax reserve adjustments, and $30 million related to changes in accounting methods and tax filing positions for prior years primarily related to the Tax Act. Excluding the impact of these non-comparable items, the Company's annual effective tax rate associated with ongoing operations for 2018 was 23.8%.
Net earnings attributable to the noncontrolling interest, net of tax of $51 million for the year ended December 31, 2019 decreased by $3 million compared to the year ended December 31, 2018. The decrease was due to lower industry volumes resulting in lower sales and earnings by the Company’s joint ventures.
Results By Reporting Segment
The Company's business is comprised of two reporting segments: Engine and Drivetrain. These segments are strategic business groups, which are managed separately as each represents a specific grouping of related automotive components and systems.
The Company allocates resources to each segment based upon the projected after-tax return on invested capital ("ROIC") of its business initiatives. ROIC is comprised of Adjusted EBIT after deducting notional taxes compared to the projected average capital investment required. Adjusted EBIT is comprised of earnings before interest, income taxes and noncontrolling interest (“EBIT") adjusted for restructuring, goodwill impairment charges, affiliates' earnings and other items not reflective of ongoing operating income or loss.
Adjusted EBIT is the measure of segment income or loss used by the Company. The Company believes Adjusted EBIT is most reflective of the operational profitability or loss of our reporting segments.
The following tables show segment information and Adjusted EBIT for the Company's reporting segments.
Net Sales by Reporting Segment
Year Ended December 31, | |||||||
(in millions) | 2019 | 2018 | |||||
Engine | $ | 6,214 | $ | 6,447 | |||
Drivetrain | 4,015 | 4,140 | |||||
Inter-segment eliminations | (61 | ) | (57 | ) | |||
Net sales | $ | 10,168 | $ | 10,530 | |||
37
Adjusted Earnings Before Interest, Income Taxes and Noncontrolling Interest ("Adjusted EBIT")
Year Ended December 31, | |||||||
(in millions) | 2019 | 2018 | |||||
Engine | $ | 995 | $ | 1,040 | |||
Drivetrain | 443 | 475 | |||||
Adjusted EBIT | 1,438 | 1,515 | |||||
Gain on derecognition of subsidiary | (177 | ) | — | ||||
Restructuring expense | 72 | 67 | |||||
Unfavorable arbitration loss | 14 | — | |||||
Merger, acquisition and divestiture expense | 11 | 6 | |||||
Asset impairment and loss on divestiture | 7 | 25 | |||||
Officer stock awards modification | 2 | 8 | |||||
Asbestos-related adjustments | — | 23 | |||||
Gain on sale of building | — | (19 | ) | ||||
Lease termination settlement | — | — | |||||
Other income | — | (4 | ) | ||||
Corporate, including stock-based compensation | 206 | 219 | |||||
Equity in affiliates' earnings, net of tax | (32 | ) | (49 | ) | |||
Interest income | (12 | ) | (6 | ) | |||
Interest expense | 55 | 59 | |||||
Other postretirement expense (income) | 27 | (10 | ) | ||||
Earnings before income taxes and noncontrolling interest | 1,265 | 1,196 | |||||
Provision for income taxes | 468 | 211 | |||||
Net earnings | 797 | 985 | |||||
Net earnings attributable to the noncontrolling interest, net of tax | 51 | 54 | |||||
Net earnings attributable to BorgWarner Inc. | $ | 746 | $ | 931 | |||
The Engine segment's net sales for the year ended December 31, 2019 decreased $233 million, or 3.6%, and segment Adjusted EBIT decreased $45 million, or 4.3%, from the year ended December 31, 2018. Excluding the impact of weakening foreign currencies, primarily the Euro, Chinese Renminbi, and Korean Won, and the net impact of acquisitions and divestitures, net sales increased 1.3% from the year ended December 31, 2018. The increase in sales was due to higher sales of light vehicle turbochargers and engine timing systems, which was partially offset by weaker commercial vehicle markets around the world. The segment Adjusted EBIT margin was 16.0% for the year ended December 31, 2019, compared to 16.1% in the year ended December 31, 2018.
The Drivetrain segment's net sales for the year ended December 31, 2019 decreased $125 million, or 3.0%, and segment Adjusted EBIT decreased $32 million, or 6.7%, from the year ended December 31, 2018. Excluding the impact of weakening foreign currencies, primarily the Euro, Chinese Renminbi, and Korean Won, net sales were flat from the year ended December 31, 2018. The segment Adjusted EBIT margin was 11.0% in the year ended December 31, 2019, compared to 11.5% in the year ended December 31, 2018. The Adjusted EBIT margin decrease was primarily due to startup costs for launches.
Corporate represents headquarters' expenses not directly attributable to the individual segments. This net expense was $206 million and $219 million for the years ended December 31, 2019 and 2018, respectively. The decrease in Corporate expenses in 2019 compared to 2018 is primarily due to lower costs associated with stock-based compensation and cost control initiatives.
38
Outlook
Our overall outlook for 2020 is cautious. Net new business-related sales growth, due to increased penetration of BorgWarner products around the world, is expected to be partially offset by declining global industry production expected in 2020. The Company expects flat to modestly declining revenue in 2020, excluding the impact of foreign currencies and the net impact of acquisitions and divestitures.
The Company maintains a positive long-term outlook for its global business and is committed to new product development and strategic capital investments to enhance its product leadership strategy. The several trends that are driving the Company's long-term growth are expected to continue, including the increased turbocharger adoption in North America and Asia, the increased adoption of automated transmissions in Asia-Pacific, and increased global penetration of all-wheel drive. The Company's long-term growth is also expected to benefit from the adoption of product offerings for hybrid and electric vehicles.
LIQUIDITY AND CAPITAL RESOURCES
The Company maintains various liquidity sources including cash and cash equivalents and the unused portion of our multi-currency revolving credit agreement. At December 31, 2019, the Company had $832 million of cash and cash equivalents, of which $562 million of cash and cash equivalents was held by our subsidiaries outside of the United States. Cash and cash equivalents held by these subsidiaries is used to fund foreign operational activities and future investments, including acquisitions.
The vast majority of cash and cash equivalents held outside the United States is available for repatriation. The Tax Act reduced the U.S. federal corporate tax rate from 35 percent to 21 percent and required companies to pay a one-time transition tax on earnings of certain foreign subsidiaries that were previously tax deferred. As of January 1, 2018, funds repatriated from foreign subsidiaries are generally no longer taxable for U.S. federal tax purposes. In light of the treatment of foreign earnings under the Tax Act, the Company recorded a liability for the U.S. federal and applicable state income tax liabilities calculated under the provisions of the deemed repatriation of foreign earnings. A deferred tax liability has been recorded for substantially all estimated legally distributable foreign earnings. The Company uses its U.S. liquidity primarily for various corporate purposes, including but not limited to debt service, share repurchases, dividend distributions, acquisitions and divestitures and other corporate expenses.
The Company has a $1.2 billion multi-currency revolving credit facility, which includes a feature that allows the Company's facility to be increased to $1.5 billion with bank approval. The facility provides for borrowings through June 29, 2022. The Company has one key financial covenant as part of the credit agreement which is a debt to EBITDA ("Earnings Before Interest, Taxes, Depreciation and Amortization") ratio. The Company was in compliance with the financial covenant at December 31, 2019 and expects to remain compliant in future periods. At December 31, 2019 and December 31, 2018, the Company had no outstanding borrowings under this facility.
The Company's commercial paper program allows the Company to issue short-term, unsecured commercial paper notes up to a maximum aggregate principal amount outstanding of $1.2 billion. Under this program, the Company may issue notes from time to time and use the proceeds for general corporate purposes. The Company had no outstanding borrowings under this program as of December 31, 2019 and December 31, 2018.
The total current combined borrowing capacity under the multi-currency revolving credit facility and commercial paper program cannot exceed $1.2 billion.
In addition to the credit facility, the Company's universal shelf registration provides the ability to issue various debt and equity instruments subject to market conditions.
39
On February 6, 2019, April 25, 2019, July 25, 2019 and November 13, 2019, the Company’s Board of Directors declared quarterly cash dividends of $0.17 per share of common stock. These dividends were paid on March 15, 2019, June 17, 2019, September 16, 2019 and December 16, 2019.
From a credit quality perspective, the Company had a credit rating of BBB+ from both Standard & Poor's and Fitch Ratings and Baa1 from Moody's as of December 31, 2019 with a stable outlook from all rating agencies. On January 28, 2020, the Company entered into a definitive agreement to acquire Delphi Technologies. Due to uncertainties surrounding this anticipated transaction, Moody's adjusted their outlook to negative and Standard & Poor's placed the Company on CreditWatch with negative implications. The Company’s current outlook from Fitch Ratings remained stable. None of the Company's debt agreements require accelerated repayment in the event of a downgrade in credit ratings.
Capitalization
Total equity increased by $499 million in the year ended December 31, 2019 as follows:
(in millions) | |||
Balance, January 1, 2019 | $ | 4,345 | |
Net earnings | 797 | ||
Purchase of treasury stock | (100 | ) | |
Stock-based compensation | 27 | ||
Other comprehensive loss | (55 | ) | |
Noncontrolling interest contributions | 4 | ||
Dividends declared to BorgWarner stockholders | (140 | ) | |
Dividends declared to noncontrolling stockholders | (34 | ) | |
Balance, December 31, 2019 | $ | 4,844 | |
Operating Activities
Net cash provided by operating activities was $1,008 million and $1,126 million in the years ended December 31, 2019 and 2018, respectively. The decrease for the year ended December 31, 2019 compared with the year ended December 31, 2018 primarily reflected the cash outflow related to the derecognition of a subsidiary, partially offset by changes in working capital.
Investing Activities
Net cash used in investing activities was $489 million and $514 million in the years ended December 31, 2019 and 2018, respectively. The decrease in the year ended December 31, 2019 compared with the year ended December 31, 2018 was primarily due to lower capital expenditures, including tooling outlays in 2019. Year-over-year capital spending decrease of $65 million during the year ended December 31, 2019 was primarily due to timing of the investment activity in the Engine segment.
Financing Activities
Net cash used in financing activities was $420 million and $383 million in the years ended December 31, 2019 and 2018, respectively. The increase in the year ended December 31, 2019 compared with the year ended December 31, 2018 was primarily driven by higher debt repayments, partially offset by lower share repurchases.
40
The Company's significant contractual obligations at December 31, 2019 are as follows:
(in millions) | Total | 2020 | 2021-2022 | 2023-2024 | After 2024 | ||||||||||||||
Other postretirement employee benefits, excluding pensions (a) | $ | 68 | $ | 10 | $ | 18 | $ | 15 | $ | 25 | |||||||||
Defined benefit pension plans (b) | 55 | 4 | 11 | 10 | 30 | ||||||||||||||
Notes payable and long-term debt | 1,973 | 286 | 565 | 1 | 1,121 | ||||||||||||||
Projected interest payments | 757 | 66 | 113 | 95 | 483 | ||||||||||||||
Non-cancelable operating leases | 97 | 20 | 28 | 16 | 33 | ||||||||||||||
Capital spending obligations | 102 | 102 | — | — | — | ||||||||||||||
Total | $ | 3,052 | $ | 488 | $ | 735 | $ | 137 | $ | 1,692 | |||||||||
________________
(a) | Other postretirement employee benefits, excluding pensions, include anticipated future payments to cover retiree medical and life insurance benefits. Amount contained in “After 2024” column includes estimated payments through 2029. Refer to Note 12, "Retirement Benefit Plans," to the Consolidated Financial Statements in Item 8 of this report for disclosures related to the Company’s other postretirement employee benefits. |
(b) | Since the timing and amount of payments for funded defined benefit pension plans are usually not certain for future years such potential payments are not shown in this table. Amount contained in “After 2024” column is for unfunded plans and includes estimated payments through 2029. Refer to Note 12, "Retirement Benefit Plans," to the Consolidated Financial Statements in Item 8 of this report for disclosures related to the Company’s pension benefits. |
We believe that the combination of cash from operations, cash balances, available credit facilities, and the universal shelf registration capacity will be sufficient to satisfy our cash needs for our current level of operations and our planned operations for the foreseeable future. We will continue to balance our needs for internal growth, external growth, debt reduction and cash conservation.
Pension and Other Postretirement Employee Benefits
The Company's policy is to fund its defined benefit pension plans in accordance with applicable government regulations and to make additional contributions when appropriate. At December 31, 2019, all legal funding requirements had been met. The Company contributed $26 million, $26 million and $18 million to its defined benefit pension plans in the years ended December 31, 2019, 2018 and 2017, respectively. The Company expects to contribute a total of $10 million to $20 million into its defined benefit pension plans during 2020. Of the $10 million to $20 million in projected 2020 contributions, $4 million are contractually obligated, while any remaining payments would be discretionary.
The funded status of all pension plans was a net unfunded position of $212 million and $211 million at December 31, 2019 and 2018, respectively. Of these amounts, $107 million and $95 million at December 31, 2019 and 2018, respectively, were related to plans in Germany, where there is not a tax deduction allowed under the applicable regulations to fund the plans; hence the common practice is to make contributions as benefit payments become due.
Other postretirement employee benefits primarily consist of postretirement health care benefits for certain employees and retirees of the Company's U.S. operations. The Company funds these benefits as retiree claims are incurred. Other postretirement employee benefits had an unfunded status of $81 million and $87 million at December 31, 2019 and 2018, respectively.
The Company believes it will be able to fund the requirements of these plans through cash generated from operations or other available sources of financing for the foreseeable future.
Refer to Note 12, "Retirement Benefit Plans," to the Consolidated Financial Statements in Item 8 of this report for more information regarding costs and assumptions for employee retirement benefits.
41
OTHER MATTERS
Contingencies
In the normal course of business, the Company is party to various commercial and legal claims, actions and complaints, including matters involving warranty claims, intellectual property claims, general liability and various other risks. It is not possible to predict with certainty whether or not the Company will ultimately be successful in any of these commercial and legal matters or, if not, what the impact might be. The Company's environmental and product liability contingencies are discussed separately below. The Company's management does not expect that an adverse outcome in any of these commercial and legal claims, actions and complaints will have a material adverse effect on the Company's results of operations, financial position or cash flows, although it could be material to the results of operations in a particular quarter.
Environmental
The Company and certain of its current and former direct and indirect corporate predecessors, subsidiaries and divisions have been identified by the United States Environmental Protection Agency and certain state environmental agencies and private parties as potentially responsible parties (“PRPs”) at various hazardous waste disposal sites under the Comprehensive Environmental Response, Compensation and Liability Act (“Superfund”) and equivalent state laws and, as such, may presently be liable for the cost of clean-up and other remedial activities at 14 such sites. Responsibility for clean-up and other remedial activities at a Superfund site is typically shared among PRPs based on an allocation formula.
The Company believes that none of these matters, individually or in the aggregate, will have a material adverse effect on its results of operations, financial position or cash flows. Generally, this is because either the estimates of the maximum potential liability at a site are not material or the liability will be shared with other PRPs, although no assurance can be given with respect to the ultimate outcome of any such matter.
Refer to Note 15, "Contingencies," to the Consolidated Financial Statements in Item 8 of this report for further details and information respecting the Company’s environmental liability.
CRITICAL ACCOUNTING POLICIES
The consolidated financial statements are prepared in conformity with accounting principles generally accepted in the United States (“GAAP”). In preparing these financial statements, management has made its best estimates and judgments of certain amounts included in the financial statements, giving due consideration to materiality. Critical accounting policies are those that are most important to the portrayal of the Company's financial condition and results of operations. Some of these policies require management's most difficult, subjective or complex judgments in the preparation of the financial statements and accompanying notes. Management makes estimates and assumptions about the effect of matters that are inherently uncertain, relating to the reporting of assets, liabilities, revenues, expenses and the disclosure of contingent assets and liabilities. Our most critical accounting policies are discussed below.
Revenue recognition The Company recognizes revenue when performance obligations under the terms of a contract are satisfied, which generally occurs with the transfer of control of our products. Although the Company may enter into long-term supply arrangements with its major customers, the prices and volumes are not fixed over the life of the arrangements, and a contract does not exist for purposes of applying Accounting Standards Codification ("ASC") Topic 606 until volumes are contractually known. For most of our products, transfer of control occurs upon shipment or delivery;
42
however, a limited number of our customer arrangements for our highly customized products with no alternative use provide us with the right to payment during the production process. As a result, for these limited arrangements, revenue is recognized as goods are produced and control transfers to the customer. Revenue is measured at the amount of consideration we expect to receive in exchange for transferring the good.
The Company continually seeks business development opportunities and at times provides customer incentives for new program awards. Customer incentive payments are capitalized when the payments are incremental and incurred only if the new business is obtained and these amounts are expected to be recovered from the customer over the term of the new business arrangement. The Company recognizes a reduction to revenue as products that the upfront payments are related to are transferred to the customer, based on the total amount of products expected to be sold over the term of the arrangement (generally 3 to 7 years). The Company evaluates the amounts capitalized each period end for recoverability and expenses any amounts that are no longer expected to be recovered over the term of the business arrangement.
Impairment of long-lived assets, including definite-lived intangible assets The Company reviews the carrying value of its long-lived assets, whether held for use or disposal, including other amortizing intangible assets, when events and circumstances warrant such a review under ASC Topic 360. In assessing long-lived assets for an impairment loss, assets are grouped with other assets and liabilities at the lowest level for which identifiable cash flows are largely independent of the cash flows of other assets and liabilities. In assessing long-lived assets for impairment, management generally considers individual facilities the lowest level for which identifiable cash flows are largely independent. A recoverability review is performed using the undiscounted cash flows if there is a triggering event. If the undiscounted cash flow test for recoverability identifies a possible impairment, management will perform a fair value analysis. Management determines fair value under ASC Topic 820 using the appropriate valuation technique of market, income or cost approach. If the carrying value of a long-lived asset is considered impaired, an impairment charge is recorded for the amount by which the carrying value of the long-lived asset exceeds its fair value.
Management believes that the estimates of future cash flows and fair value assumptions are reasonable; however, changes in assumptions underlying these estimates could affect the valuations. Significant judgments and estimates used by management when evaluating long-lived assets for impairment include: (i) an assessment as to whether an adverse event or circumstance has triggered the need for an impairment review; (ii) undiscounted future cash flows generated by the asset; and (iii) fair valuation of the asset. Events and conditions that could result in impairment in the value of our long-lived assets include changes in the industries in which we operate, particularly the impact of a downturn in the global economy, as well as competition and advances in technology, adverse changes in the regulatory environment, or other factors leading to reduction in expected long-term sales or profitability.
Assets and liabilities held for sale The Company classifies assets and liabilities (disposal groups) to be sold as held for sale in the period in which all of the following criteria are met: management, having the authority to approve the action, commits to a plan to sell the disposal group; the disposal group is available for immediate sale in its present condition subject only to terms that are usual and customary for sales of such disposal groups; an active program to locate a buyer and other actions required to complete the plan to sell the disposal group have been initiated; the sale of the disposal group is probable, and transfer of the disposal group is expected to qualify for recognition as a completed sale within one year, except if events or circumstances beyond the Company's control extend the period of time required to sell the disposal group beyond one year; the disposal group is being actively marketed for sale at a price that is reasonable in relation to its current fair value; and actions required to complete the plan indicate that it is unlikely that significant changes to the plan will be made or that the plan will be withdrawn.
43
The Company initially measures a disposal group that is classified as held for sale at the lower of its carrying value or fair value less any costs to sell. Any loss resulting from this measurement is recognized in the period in which the held for sale criteria are met. Conversely, gains are not recognized on the sale of a disposal group until the date of sale. The Company assesses the fair value of a disposal group, less any costs to sell, each reporting period it remains classified as held for sale and reports any subsequent changes as an adjustment to the carrying value of the disposal group, as long as the new carrying value does not exceed the carrying value of the disposal group at the time it was initially classified as held for sale. Additionally, depreciation is not recorded during the period in which the long-lived assets, included in the disposal group, are classified as held for sale.
Upon determining that a disposal group meets the criteria to be classified as held for sale, the Company reports the assets and liabilities of the disposal group, if material, in the line items assets held for sale and liabilities held for sale in the Consolidated Balance Sheet.
Refer to Note 20, "Assets and Liabilities Held for Sale," to the Consolidated Financial Statements in Item 8 of this report for more information.
Goodwill and other indefinite-lived intangible assets During the fourth quarter of each year, the Company qualitatively assesses its goodwill assigned to each of its reporting units. This qualitative assessment evaluates various events and circumstances, such as macro economic conditions, industry and market conditions, cost factors, relevant events and financial trends, that may impact a reporting unit's fair value. Using this qualitative assessment, the Company determines whether it is more-likely-than-not the reporting unit's fair value exceeds its carrying value. If it is determined that it is not more-likely-than-not the reporting unit's fair value exceeds the carrying value, or upon consideration of other factors, including recent acquisition, restructuring or divestiture activity or to refresh the fair values, the Company performs a quantitative, "step one," goodwill impairment analysis. In addition, the Company may test goodwill in between annual test dates if an event occurs or circumstances change that could more-likely-than-not reduce the fair value of a reporting unit below its carrying value.
Similar to goodwill, the Company can elect to perform the impairment test for indefinite-lived intangibles other than goodwill (primarily trade names) using a qualitative analysis, considering similar factors as outlined in the goodwill discussion in order to determine if it is more-likely-than-not that the fair value of the trade names is less than the respective carrying values. If the Company elects to perform or is required to perform a quantitative analysis, the test consists of a comparison of the fair value of the indefinite-lived intangible asset to the carrying value of the asset as of the impairment testing date. The Company estimates the fair value of indefinite-lived intangibles using the relief-from-royalty method, which it believes is an appropriate and widely used valuation technique for such assets. The fair value derived from the relief-from-royalty method is measured as the discounted cash flow savings realized from owning such trade names and not being required to pay a royalty for their use.
During the fourth quarter of 2019, the Company performed an analysis on each reporting unit. Based on the factors above, the Company elected to perform quantitative, "step one," goodwill impairment analyses, on three reporting units. This requires the Company to make significant assumptions and estimates about the extent and timing of future cash flows, discount rates and growth rates. The basis of this goodwill impairment analysis is the Company's annual budget and long-range plan (“LRP”). The annual budget and LRP includes a five-year projection of future cash flows based on actual new products and customer commitments and assumes the last year of the LRP data is a fair indication of the future performance. Because the LRP is estimated over a significant future period of time, those estimates and assumptions are subject to a high degree of uncertainty. Further, the market valuation models and other financial ratios used by the Company require certain assumptions and estimates regarding the applicability of those models to the Company's facts and circumstances.
44
The Company believes the assumptions and estimates used to determine the estimated fair value are reasonable. Different assumptions could materially affect the estimated fair value. The primary assumptions affecting the Company's December 31, 2019 goodwill quantitative, "step one," impairment review are as follows:
• | Discount rate: the Company used a 10.7% weighted average cost of capital (“WACC”) as the discount rate for future cash flows. The WACC is intended to represent a rate of return that would be expected by a market participant. |
• | Operating income margin: the Company used historical and expected operating income margins, which may vary based on the projections of the reporting unit being evaluated. |
• | Revenue growth rate: the Company used a global automotive market industry growth rate forecast adjusted to estimate its own market participation for product lines. |
In addition to the above primary assumptions, the Company notes the following risks to volume and operating income assumptions that could have an impact on the discounted cash flow models:
• | The automotive industry is cyclical, and the Company's results of operations would be adversely affected by industry downturns. |
• | The Company is dependent on market segments that use our key products and would be affected by decreasing demand in those segments. |
• | The Company is subject to risks related to international operations. |
Based on the assumptions outlined above, the impairment testing conducted in the fourth quarter of 2019 indicated the Company's goodwill assigned to the reporting units that were quantitatively assessed were not impaired and contained fair values substantially higher than the reporting units' carrying values. Additionally, for the reporting units quantitatively assessed, sensitivity analyses were completed indicating that a one percentage point increase in the discount rate, a one percentage point decrease in the operating margin, or a one percentage point decrease in the revenue growth rate assumptions would not result in the carrying value exceeding the fair value.
Refer to Note 7, "Goodwill and Other Intangibles," to the Consolidated Financial Statements in Item 8 of this report for more information regarding goodwill.
Product warranties The Company provides warranties on some, but not all, of its products. The warranty terms are typically from one to three years. Provisions for estimated expenses related to product warranty are made at the time products are sold. These estimates are established using historical information about the nature, frequency and average cost of warranty claim settlements as well as product manufacturing and industry developments and recoveries from third parties. Management actively studies trends of warranty claims and takes action to improve product quality and minimize warranty claims. Management believes that the warranty accrual is appropriate; however, actual claims incurred could differ from the original estimates, requiring adjustments to the accrual:
Year Ended December 31, | |||||||
(in millions) | 2019 | 2018 | |||||
Net sales | $ | 10,168 | $ | 10,530 | |||
Warranty provision | $ | 72 | $ | 68 | |||
Warranty provision as a percentage of net sales | 0.7 | % | 0.6 | % | |||
45
The following table illustrates the sensitivity of a 25 basis point change (as a percentage of net sales) in the assumed warranty trend on the Company's accrued warranty liability:
December 31, | |||||||
(in millions) | 2019 | 2018 | |||||
25 basis point decrease (income)/expense | $ | (25 | ) | $ | (26 | ) | |
25 basis point increase (income)/expense | $ | 25 | $ | 26 | |||
At December 31, 2019, the total accrued warranty liability was $116 million. The accrual is represented as $63 million in current liabilities and $53 million in non-current liabilities on our Consolidated Balance Sheet.
Refer to Note 8, "Product Warranty," to the Consolidated Financial Statements in Item 8 of this report for more information regarding product warranties.
Asbestos Like many other industrial companies that have historically operated in the United States, the Company, or parties that the Company is obligated to indemnify, has been named as one of many defendants in asbestos-related personal injury actions. Morse TEC, a former wholly-owned subsidiary of the Company, was the obligor for the Company's recorded asbestos-related liabilities and the policyholder of the related insurance assets. On October 30, 2019, the Company transferred 100% of its equity interests to Enstar Holdings (US) LLC. In the fourth quarter of 2019, the Company derecognized Morse TEC and removed asbestos obligations, related insurance assets and associated deferred tax assets from the Consolidated Balance Sheet.
With the assistance of a third-party actuary, the Company estimated the liability and corresponding insurance recovery for pending and future claims not yet asserted to extend through December 31, 2064 with a runoff through 2074 and defense costs. This estimate was based on the Company's historical claim experience and estimates of the number and resolution cost of potential future claims that may be filed based on anticipated levels of unique plaintiff asbestos-related claims in the U.S. tort system against all defendants. As with any estimates, actual experience may differ. This estimate was not discounted to present value. The Company believed that December 31, 2074 was a reasonable assumption as to the last date on which it was likely to have resolved all asbestos-related claims, based on the nature and useful life of the Company’s products and the likelihood of incidence of asbestos-related disease in the U.S. population generally. The Company assessed the sufficiency of its estimated liability for pending and future claims not yet asserted and defense costs by evaluating actual experience regarding claims filed, settled and dismissed, and amounts paid in claim resolution costs. In addition to claims experience, the Company considered additional quantitative and qualitative factors such as changes in legislation, the legal environment, and the Company's defense strategy. The Company continued to have additional excess insurance coverage available for potential future asbestos-related claims. In connection with the Company’s review of its asbestos-related claims, the Company also reviewed the amount of its potential insurance coverage for such claims, taking into account the remaining limits of such coverage, the number and amount of claims on the Company's insurance from co-insured parties, ongoing litigation against the Company’s insurance carriers, potential remaining recoveries from insolvent insurance carriers, the impact of previous insurance settlements, and coverage available from solvent insurance carriers not party to the coverage litigation.
Refer to Note 15, "Contingencies," to the Consolidated Financial Statements in Item 8 of this report for more information regarding management's judgments applied in the recognition and measurement of asbestos-related assets and liabilities.
Pension and other postretirement defined benefits The Company provides postretirement defined benefits to a number of its current and former employees. Costs associated with postretirement defined
46
benefits include pension and postretirement health care expenses for employees, retirees and surviving spouses and dependents.
The Company's defined benefit pension and other postretirement plans are accounted for in accordance with ASC Topic 715. The determination of the Company's obligation and expense for its pension and other postretirement employee benefits, such as retiree health care, is dependent on certain assumptions used by actuaries in calculating such amounts. Certain assumptions, including the expected long-term rate of return on plan assets, discount rate, rates of increase in compensation and health care costs trends are described in Note 12, "Retirement Benefit Plans," to the Consolidated Financial Statements in Item 8 of this report. The effects of any modification to those assumptions are either recognized immediately or amortized over future periods in accordance with GAAP.
In accordance with GAAP, actual results that differ from assumptions used are accumulated and generally amortized over future periods. The primary assumptions affecting the Company's accounting for employee benefits under ASC Topics 712 and 715 as of December 31, 2019 are as follows:
• | Expected long-term rate of return on plan assets: The expected long-term rate of return is used in the calculation of net periodic benefit cost. The required use of the expected long-term rate of return on plan assets may result in recognized returns that are greater or less than the actual returns on those plan assets in any given year. Over time, however, the expected long-term rate of return on plan assets is designed to approximate actual earned long-term returns. The expected long-term rate of return for pension assets has been determined based on various inputs, including historical returns for the different asset classes held by the Company's trusts and its asset allocation, as well as inputs from internal and external sources regarding expected capital market return, inflation and other variables. The Company also considers the impact of active management of the plans' invested assets. In determining its pension expense for the year ended December 31, 2019, the Company used long-term rates of return on plan assets ranging from 1.75% to 5.9% outside of the U.S. and 6.0% in the U.S. |
Actual returns on U.S. pension assets were 18.0% and -4.1% for the years ended December 31, 2019 and 2018, respectively, compared to the expected rate of return assumption of 6.0% for the same years ended.
Actual returns on U.K. pension assets were 9.5% and -3.1% for the years ended December 31, 2019 and 2018, respectively, compared to the expected rate of return assumption of 5% for the year ended December 31, 2019 and 6% for the year ended in 2018.
Actual returns on German pension assets were 21.0% and -4.2% for the years ended December 31, 2019 and 2018, respectively, compared to the expected rate of return assumption of 5.9% for the same years ended.
• | Discount rate: The discount rate is used to calculate pension and other postretirement employee benefit (“OPEB”) obligations. In determining the discount rate, the Company utilizes a full-yield approach in the estimation of service and interest components by applying the specific spot rates along the yield curve used in the determination of the benefit obligation to the relevant projected cash flows. The Company used discount rates ranging from 0.74% to 9.0% to determine its pension and other benefit obligations as of December 31, 2019, including weighted average discount rates of 3.17% in the U.S., 1.61% outside of the U.S., and 2.95% for U.S. other postretirement health care plans. The U.S. discount rate reflects the fact that our U.S. pension plan has been closed for new participants since 1989 (1999 for our U.S. health care plan). |
• | Health care cost trend: For postretirement employee health care plan accounting, the Company reviews external data and Company-specific historical trends for health care cost to determine the |
47
health care cost trend rate assumptions. In determining the projected benefit obligation for postretirement employee health care plans as of December 31, 2019, the Company used health care cost trend rates of 6.25%, declining to an ultimate trend rate of 5% by the year 2025.
While the Company believes that these assumptions are appropriate, significant differences in actual experience or significant changes in these assumptions may materially affect the Company's pension and OPEB and its future expense.
The following table illustrates the sensitivity to a change in certain assumptions for Company sponsored U.S. and non-U.S. pension plans on its 2020 pre-tax pension expense:
(in millions) | Impact on U.S. 2020 pre-tax pension (expense)/income | Impact on Non-U.S. 2020 pre-tax pension (expense)/income | ||||||
One percentage point decrease in discount rate | $ | — | * | $ | (7 | ) | ||
One percentage point increase in discount rate | $ | — | * | $ | 7 | |||
One percentage point decrease in expected return on assets | $ | (2 | ) | $ | (5 | ) | ||
One percentage point increase in expected return on assets | $ | 2 | $ | 5 | ||||
________________
* A one percentage point increase or decrease in the discount rate would have a negligible impact on the Company’s U.S. 2020 pre-tax pension expense.
The sensitivity to a change in the discount rate assumption related to the Company's total 2020 U.S. OPEB expense is expected to be negligible, as any increase in interest expense will be offset by net actuarial gains.
The following table illustrates the sensitivity to a one-percentage point change in the assumed health care cost trend related to the Company's OPEB obligation and service and interest cost:
One Percentage Point | |||||||
(in millions) | Increase | Decrease | |||||
Effect on other postretirement employee benefit obligation | $ | 5 | $ | (5 | ) | ||
Effect on total service and interest cost components | $ | — | $ | — | |||
Refer to Note 12, "Retirement Benefit Plans," to the Consolidated Financial Statements in Item 8 of this report for more information regarding the Company’s retirement benefit plans.
Restructuring Restructuring costs may occur when the Company takes action to exit or significantly curtail a part of its operations or implements a reorganization that affects the nature and focus of operations. A restructuring charge can consist of severance costs associated with reductions to the workforce, costs to terminate an operating lease or contract, professional fees and other costs incurred related to the implementation of restructuring activities.
The Company generally records costs associated with voluntary separations at the time of employee acceptance. Costs for involuntary separation programs are recorded when management has approved the plan for separation, the employees are identified and aware of the benefits they are entitled to and it is unlikely that the plan will change significantly. When a plan of separation requires approval by or consultation with the relevant labor organization or government, the costs are recorded upon agreement. Costs associated with benefits that are contingent on the employee continuing to provide service are accrued over the required service period.
Income taxes The Company accounts for income taxes in accordance with ASC Topic 740. Deferred tax assets and liabilities are recognized for the future tax consequences attributable to differences between financial statement carrying amounts of existing assets and liabilities and their respective tax
48
bases and operating loss and tax credit carryforwards. Deferred tax assets and liabilities are measured using enacted tax rates expected to apply to taxable income in the years in which those temporary differences are expected to be recovered or settled.
Accounting for income taxes is complex, in part because the Company conducts business globally and therefore files income tax returns in numerous tax jurisdictions. Management judgment is required in determining the Company’s worldwide provision for income taxes and recording the related assets and liabilities, including accruals for unrecognized tax benefits. In calculating the provision for income taxes on an interim basis, the Company uses an estimate of the annual effective tax rate based upon the facts and circumstances known at each interim period. In determining the need for a valuation allowance, the historical and projected financial performance of the operation recording the net deferred tax asset is considered along with any other pertinent information. Since future financial results may differ from previous estimates, periodic adjustments to the Company’s valuation allowance may be necessary.
The Company is subject to income taxes in the U.S. at the federal and state level and numerous non-U.S. jurisdictions. The determination of accruals for unrecognized tax benefits includes the application of complex tax laws in a multitude of jurisdictions across the Company's global operations. Management judgment is required in determining the accruals for unrecognized tax benefits. In the ordinary course of the Company's business, there are many transactions and calculations where the ultimate tax determination is less than certain. Accruals for unrecognized tax benefits are established when, despite the belief that tax positions are supportable, there remain certain positions that do not meet the minimum probability threshold, which is a tax position that is more-likely-than-not to be sustained upon examination by the applicable taxing authority. The Company has certain U.S. state income tax returns and certain non-U.S. income tax returns which are currently under various stages of audit by applicable tax authorities. At December 31, 2019, the Company has a liability for tax positions the Company estimates are not more-likely-than-not to be sustained based on the technical merits, which is included in other current and non-current liabilities. Nonetheless, the amounts ultimately paid, if any, upon resolution of the issues raised by the taxing authorities may differ materially from the amounts accrued for each year.
The Tax Act that was signed into law in December 2017 constitutes a major change to the U.S. tax system. The impact of the Tax Act on the Company is based on management’s current interpretations of the Tax Act, recently issued regulations and related analysis. The Company's tax liability may be materially different based on regulatory developments. In future periods, our effective tax rate could be subject to additional uncertainty as a result of regulatory developments related to the Tax Act.
Refer to Note 5, "Income Taxes," to the Consolidated Financial Statements in Item 8 of this report for more information regarding income taxes.
New Accounting Pronouncements
Refer to Note 1, "Summary of Significant Accounting Policies," to the Consolidated Financial Statements in Item 8 of this report for more information regarding new applicable accounting pronouncements.
49
QUANTITATIVE AND QUALITATIVE DISCLOSURES ABOUT MARKET RISK
The Company's primary market risks include fluctuations in interest rates and foreign currency exchange rates. We are also affected by changes in the prices of commodities used or consumed in our manufacturing operations. Some of our commodity purchase price risk is covered by supply agreements with customers and suppliers. Other commodity purchase price risk is addressed by hedging strategies, which include forward contracts. The Company enters into derivative instruments only with high credit quality counterparties and diversifies its positions across such counterparties in order to reduce its exposure to credit losses. We do not engage in any derivative instruments for purposes other than hedging specific operating risks.
We have established policies and procedures to manage sensitivity to interest rate, foreign currency exchange rate and commodity purchase price risk, which include monitoring the level of exposure to each market risk. For quantitative disclosures about market risk, refer to Note 11, "Financial Instruments," to the Consolidated Financial Statements in Item 8 of this report for information with respect to interest rate risk and foreign currency exchange rate risk and commodity purchase price risk.
Interest Rate Risk
Interest rate risk is the risk that we will incur economic losses due to adverse changes in interest rates. The Company manages its interest rate risk by balancing its exposure to fixed and variable rates while attempting to optimize its interest costs. The Company selectively uses interest rate swaps to reduce market value risk associated with changes in interest rates (fair value hedges). At December 31, 2019, all of the Company's debt had fixed interest rates.
Foreign Currency Exchange Rate Risk
Foreign currency exchange rate risk is the risk that we will incur economic losses due to adverse changes in foreign currency exchange rates. Currently, our most significant currency exposures relate to the Chinese Renminbi, the Euro, the Hungarian Forint, the Japanese Yen, the Mexican Peso, the Swedish Krona and the South Korean Won. We mitigate our foreign currency exchange rate risk by establishing local production facilities and related supply chain participants in the markets we serve, by invoicing customers in the same currency as the source of the products and by funding some of our investments in foreign markets through local currency loans. Such non-U.S. Dollar debt was $41 million and $47 million as of December 31, 2019 and 2018, respectively. We also monitor our foreign currency exposure in each country and implement strategies to respond to changing economic and political environments. The depreciation of the British Pound following the United Kingdom's 2016 vote to leave the European Union has not and is not expected to have a significant impact on the Company since net sales from the United Kingdom represent less than 2% of the Company's net sales in 2019. In addition, the Company periodically enters into forward currency contracts to reduce exposure to exchange rate risk related to transactions denominated in currencies other than the functional currency. As of December 31, 2018, the Company recorded a deferred gain of $2 million and a deferred loss of $2 million related to foreign currency derivatives. As of December 31, 2019, deferred gains and losses related to foreign currency derivatives were immaterial.
The foreign currency translation adjustment loss of $55 million and foreign currency translation adjustment loss of $148 million for the year ended December 31, 2019 and 2018, respectively, contained within our Consolidated Statements of Comprehensive Income represent the foreign currency translational impacts of converting our non-U.S. dollar subsidiaries' financial statements to the Company’s reporting currency (U.S. Dollar) and the related gains and losses arising from our net investment hedges. The 2019 foreign currency translation adjustment loss was primarily due to the impact of a strengthening U.S. dollar against the Euro, Chinese Renminbi and Swedish Krona, which which increased approximately 2%, 1% and 6% and increased other comprehensive loss by
50
approximately $18 million, $17 million and $15 million, respectively. The 2018 foreign currency translation adjustment loss was primarily due to the impact of a strengthening U.S. dollar against the Euro and Chinese Renminbi, which increased approximately 4% and 5% and increased other comprehensive loss by approximately $58 million and $48 million, respectively. In addition, the Company periodically enters into foreign currency contracts, cross-currency swaps, and foreign currency denominated debt designated as net investment hedges to reduce exposure to translational exchange rate risk. As of December 31, 2019 and 2018, the Company recorded a deferred gain of $4 million and a deferred loss of $14 million, respectively, for net investment hedges.
Commodity Price Risk
Commodity price risk is the possibility that we will incur economic losses due to adverse changes in the cost of raw materials used in the production of our products. Commodity forward and option contracts are executed to offset our exposure to potential change in prices mainly for various non-ferrous metals and natural gas consumption used in the manufacturing of vehicle components. As of December 31, 2019 and 2018, the Company had outstanding commodity swap contracts with total notional values of $1 million and $2 million, respectively. The related fair value of these swaps were immaterial.
Disclosure Regarding Forward-Looking Statements
The matters discussed in this Item 7 include forward looking statements. See "Forward Looking Statements" at the beginning of this Annual Report on Form 10-K.
Item 7A. | Quantitative and Qualitative Disclosures About Market Risk |
For quantitative and qualitative information regarding market risk, please refer to the discussion in Item 7 of this report under the caption "Quantitative and Qualitative Disclosures about Market Risk."
For information regarding interest rate risk, foreign currency exchange risk and commodity price risk, refer to Note 11, "Financial Instruments," to the Consolidated Financial Statements in Item 8 of this report. For information regarding the levels of indebtedness subject to interest rate fluctuation, refer to Note 9, "Notes Payable and Long-Term Debt," to the Consolidated Financial Statements in Item 8 of this report. For information regarding the level of business outside the United States, which is subject to foreign currency exchange rate market risk, refer to Note 21, "Reporting Segments and Related Information," to the Consolidated Financial Statements in Item 8 of this report.
51
Item 8. | Financial Statements and Supplementary Data |
Index to Financial Statements and Supplementary Data | Page No. | |
52
Report of Independent Registered Public Accounting Firm
To the Board of Directors and Stockholders of BorgWarner Inc.
Opinions on the Financial Statements and Internal Control over Financial Reporting
We have audited the accompanying consolidated balance sheets of BorgWarner Inc. and its subsidiaries (the “Company”) as of December 31, 2019 and 2018, and the related consolidated statements of operations, of comprehensive income, of equity and of cash flows for each of the three years in the period ended December 31, 2019, including the related notes (collectively referred to as the “consolidated financial statements”). We also have audited the Company's internal control over financial reporting as of December 31, 2019, based on criteria established in Internal Control - Integrated Framework (2013) issued by the Committee of Sponsoring Organizations of the Treadway Commission (COSO).
In our opinion, the consolidated financial statements referred to above present fairly, in all material respects, the financial position of the Company as of December 31, 2019 and 2018, and the results of its operations and its cash flows for each of the three years in the period ended December 31, 2019 in conformity with accounting principles generally accepted in the United States of America. Also in our opinion, the Company maintained, in all material respects, effective internal control over financial reporting as of December 31, 2019, based on criteria established in Internal Control - Integrated Framework (2013) issued by the COSO.
Basis for Opinions
The Company's management is responsible for these consolidated financial statements, for maintaining effective internal control over financial reporting, and for its assessment of the effectiveness of internal control over financial reporting, included in Management’s Report on Internal Control Over Financial Reporting appearing under Item 9A. Our responsibility is to express opinions on the Company’s consolidated financial statements and on the Company's internal control over financial reporting based on our audits. We are a public accounting firm registered with the Public Company Accounting Oversight Board (United States) (PCAOB) and are required to be independent with respect to the Company in accordance with the U.S. federal securities laws and the applicable rules and regulations of the Securities and Exchange Commission and the PCAOB.
We conducted our audits in accordance with the standards of the PCAOB. Those standards require that we plan and perform the audits to obtain reasonable assurance about whether the consolidated financial statements are free of material misstatement, whether due to error or fraud, and whether effective internal control over financial reporting was maintained in all material respects.
Our audits of the consolidated financial statements included performing procedures to assess the risks of material misstatement of the consolidated financial statements, whether due to error or fraud, and performing procedures that respond to those risks. Such procedures included examining, on a test basis, evidence regarding the amounts and disclosures in the consolidated financial statements. Our audits also included evaluating the accounting principles used and significant estimates made by management, as well as evaluating the overall presentation of the consolidated financial statements. Our audit of internal control over financial reporting included obtaining an understanding of internal control over financial reporting, assessing the risk that a material weakness exists, and testing and evaluating the design and operating effectiveness of internal control based on the assessed risk. Our audits also included performing such other procedures as we considered necessary in the circumstances. We believe that our audits provide a reasonable basis for our opinions.
Definition and Limitations of Internal Control over Financial Reporting
A company’s internal control over financial reporting is a process designed to provide reasonable assurance regarding the reliability of financial reporting and the preparation of financial statements for external purposes in accordance with generally accepted accounting principles. A company’s internal control over financial reporting includes those policies and procedures that (i) pertain to the maintenance of records that, in reasonable detail, accurately and fairly reflect the transactions and dispositions of the assets of the company; (ii) provide reasonable assurance that transactions are recorded as necessary to permit preparation of financial statements in accordance with generally accepted accounting principles, and that receipts and expenditures of the company are being made only in accordance with authorizations of management and directors of the company; and (iii) provide reasonable
53
assurance regarding prevention or timely detection of unauthorized acquisition, use, or disposition of the company’s assets that could have a material effect on the financial statements.
Because of its inherent limitations, internal control over financial reporting may not prevent or detect misstatements. Also, projections of any evaluation of effectiveness to future periods are subject to the risk that controls may become inadequate because of changes in conditions, or that the degree of compliance with the policies or procedures may deteriorate.
Critical Audit Matters
The critical audit matter communicated below is a matter arising from the current period audit of the consolidated financial statements that was communicated or required to be communicated to the audit committee and that (i) relates to accounts or disclosures that are material to the consolidated financial statements and (ii) involved our especially challenging, subjective, or complex judgments. The communication of critical audit matters does not alter in any way our opinion on the consolidated financial statements, taken as a whole, and we are not, by communicating the critical audit matter below, providing a separate opinion on the critical audit matter or on the accounts or disclosures to which it relates.
Income Taxes - Worldwide Provision for Income Taxes
As described in Notes 1 and 5 to the consolidated financial statements, the Company has recorded income taxes from continuing operations of $468 million for the year ended December 31, 2019. Management judgment is required in determining the Company’s worldwide provision for income taxes and recording the related assets and liabilities, including accruals for unrecognized tax benefits. As disclosed by management, accounting for income taxes is complex, in part because the Company conducts business globally and therefore files income tax returns in numerous tax jurisdictions. The Company is subject to income taxes in the U.S. at the federal and state level and numerous non-U.S. jurisdictions. In the ordinary course of the Company’s business, there are many transactions and calculations where the ultimate tax determination is less than certain. Accruals for unrecognized tax benefits are established when, despite the belief that tax positions are supportable, there remain certain positions that do not meet the minimum probability threshold, which is a tax position that is more-likely-than-not to be sustained upon examination by the applicable taxing authority. The determination of accruals for unrecognized tax benefits includes the application of complex tax laws in a multitude of jurisdictions across the Company’s global operations.
The principal considerations for our determination that performing procedures relating to management’s worldwide provision for income taxes is a critical audit matter are there was significant judgment by management when developing the worldwide provision for income taxes, including the accruals for unrecognized tax benefits. This in turn led to a high degree of auditor judgment, subjectivity and effort in performing our audit procedures relating to management’s worldwide provision for income taxes. Also, the audit effort involved the use of professionals with specialized skill and knowledge to assist in performing these procedures and evaluating the audit evidence obtained.
Addressing the matter involved performing procedures and evaluating audit evidence in connection with forming our overall opinion on the consolidated financial statements. These procedures included testing the effectiveness of controls relating to management’s worldwide provision for income taxes and accruals for unrecognized tax benefits. These procedures also included, among others, testing the accuracy of the worldwide provision for income taxes, including the rate reconciliation and permanent and temporary differences, evaluating the completeness of management’s identification of uncertain tax positions, and evaluating the reasonableness of management’s more-likely-than-not determination in consideration of the tax laws in relevant jurisdictions. Professionals with specialized skill and knowledge were used to assist in testing the accuracy of the worldwide provision for income taxes and evaluating the completeness of management’s identification of accruals for unrecognized tax benefits.
/s/ PricewaterhouseCoopers LLP
Detroit, Michigan
February 13, 2020
We have served as the Company’s auditor since 2008.
54
BORGWARNER INC. AND CONSOLIDATED SUBSIDIARIES
CONSOLIDATED BALANCE SHEETS
December 31, | |||||||
(in millions, except share and per share amounts) | 2019 | 2018 | |||||
ASSETS | |||||||
Cash and cash equivalents | $ | $ | |||||
Receivables, net | |||||||
Inventories, net | |||||||
Prepayments and other current assets | |||||||
Assets held for sale | |||||||
Total current assets | |||||||
Property, plant and equipment, net | |||||||
Investments and other long-term receivables | |||||||
Goodwill | |||||||
Other intangible assets, net | |||||||
Other non-current assets | |||||||
Total assets | $ | $ | |||||
LIABILITIES AND EQUITY | |||||||
Notes payable and other short-term debt | $ | $ | |||||
Accounts payable and accrued expenses | |||||||
Income taxes payable | |||||||
Liabilities held for sale | |||||||
Total current liabilities | |||||||
Long-term debt | |||||||
Other non-current liabilities: | |||||||
Asbestos-related liabilities | |||||||
Retirement-related liabilities | |||||||
Other | |||||||
Total other non-current liabilities | |||||||
Commitments and contingencies | |||||||
Capital stock: | |||||||
Preferred stock, $0.01 par value; authorized shares: 5,000,000; none issued and outstanding | — | — | |||||
Common stock, $0.01 par value; authorized shares: 390,000,000; issued shares: (2019 - 246,387,057; 2018 - 246,387,057); outstanding shares: (2019 - 206,407,543; 2018 - 208,214,934) | |||||||
Non-voting common stock, $0.01 par value; authorized shares: 25,000,000; none issued and outstanding | — | — | |||||
Capital in excess of par value | |||||||
Retained earnings | |||||||
Accumulated other comprehensive loss | ( | ) | ( | ) | |||
Common stock held in treasury, at cost: (2019 - 39,979,514 shares; 2018 - 38,172,123 shares) | ( | ) | ( | ) | |||
Total BorgWarner Inc. stockholders’ equity | |||||||
Noncontrolling interest | |||||||
Total equity | |||||||
Total liabilities and equity | $ | $ | |||||
See Accompanying Notes to Consolidated Financial Statements.
55
BORGWARNER INC. AND CONSOLIDATED SUBSIDIARIES
CONSOLIDATED STATEMENTS OF OPERATIONS
Year Ended December 31, | |||||||||||
(in millions) | 2019 | 2018 | 2017 | ||||||||
Net sales | $ | $ | $ | ||||||||
Cost of sales | |||||||||||
Gross profit | |||||||||||
Selling, general and administrative expenses | |||||||||||
Other (income) expense, net | ( | ) | |||||||||
Operating income | |||||||||||
Equity in affiliates’ earnings, net of tax | ( | ) | ( | ) | ( | ) | |||||
Interest income | ( | ) | ( | ) | ( | ) | |||||
Interest expense | |||||||||||
Other postretirement expense (income) | ( | ) | ( | ) | |||||||
Earnings before income taxes and noncontrolling interest | |||||||||||
Provision for income taxes | |||||||||||
Net earnings | |||||||||||
Net earnings attributable to the noncontrolling interest, net of tax | |||||||||||
Net earnings attributable to BorgWarner Inc. | $ | $ | $ | ||||||||
Earnings per share — basic | $ | $ | $ | ||||||||
Earnings per share — diluted | $ | $ | $ | ||||||||
Weighted average shares outstanding: | |||||||||||
Basic | |||||||||||
Diluted | |||||||||||
See Accompanying Notes to Consolidated Financial Statements.
56
BORGWARNER INC. AND CONSOLIDATED SUBSIDIARIES
CONSOLIDATED STATEMENTS OF COMPREHENSIVE INCOME
Year Ended December 31, | |||||||||||
(in millions) | 2019 | 2018 | 2017 | ||||||||
Net earnings attributable to BorgWarner Inc. | $ | $ | $ | ||||||||
Other comprehensive (loss) income | |||||||||||
Foreign currency translation adjustments | ( | ) | ( | ) | |||||||
Hedge instruments* | ( | ) | |||||||||
Defined benefit postretirement plans* | ( | ) | |||||||||
Other* | ( | ) | ( | ) | |||||||
Total other comprehensive (loss) income attributable to BorgWarner Inc. | ( | ) | ( | ) | |||||||
Comprehensive income attributable to BorgWarner Inc.* | |||||||||||
Net earnings attributable to noncontrolling interest, net of tax* | |||||||||||
Other comprehensive (loss) income attributable to the noncontrolling interest* | ( | ) | ( | ) | |||||||
Comprehensive income | $ | $ | $ | ||||||||
____________________________________
* | Net of income taxes. |
See Accompanying Notes to Consolidated Financial Statements.
57
BORGWARNER INC. AND CONSOLIDATED SUBSIDIARIES
CONSOLIDATED STATEMENTS OF CASH FLOWS
Year Ended December 31, | |||||||||||
(in millions) | 2019 | 2018 | 2017 | ||||||||
OPERATING | |||||||||||
Net earnings | $ | $ | $ | ||||||||
Adjustments to reconcile net earnings to net cash flows from operations: | |||||||||||
Non-cash charges (credits) to operations: | |||||||||||
Depreciation and amortization | |||||||||||
Deferred income tax provision (benefit) | ( | ) | |||||||||
Stock-based compensation expense | |||||||||||
Restructuring expense, net of cash paid | |||||||||||
Pension settlement loss | |||||||||||
Tax reform adjustments to provision for income taxes | ( | ) | |||||||||
Asset impairment and loss on divestiture | |||||||||||
Gain on derecognition of subsidiary | ( | ) | |||||||||
Equity in affiliates’ earnings, net of dividends received, and other | — | ( | ) | ( | ) | ||||||
Net earnings adjusted for non-cash charges to operations | |||||||||||
Derecognition of a subsidiary | ( | ) | |||||||||
Changes in assets and liabilities: | |||||||||||
Receivables | ( | ) | ( | ) | |||||||
Inventories | ( | ) | ( | ) | ( | ) | |||||
Prepayments and other current assets | ( | ) | ( | ) | |||||||
Accounts payable and accrued expenses | ( | ) | ( | ) | |||||||
Prepaid taxes and income taxes payable | ( | ) | ( | ) | ( | ) | |||||
Other assets and liabilities | ( | ) | ( | ) | ( | ) | |||||
Net cash provided by operating activities | |||||||||||
INVESTING | |||||||||||
Capital expenditures, including tooling outlays | ( | ) | ( | ) | ( | ) | |||||
Payments for investments in equity securities | ( | ) | ( | ) | ( | ) | |||||
Payments for businesses acquired, including restricted cash, net of cash acquired | ( | ) | ( | ) | |||||||
Proceeds from sale of businesses, net of cash divested | |||||||||||
Proceeds from (payments for) settlement of net investment hedges | ( | ) | |||||||||
Proceeds from asset disposals and other | |||||||||||
Net cash used in investing activities | ( | ) | ( | ) | ( | ) | |||||
FINANCING | |||||||||||
Net decrease in notes payable | ( | ) | ( | ) | |||||||
Additions to debt, net of debt issuance costs | |||||||||||
Repayments of long term debt, including current portion | ( | ) | ( | ) | ( | ) | |||||
Payments for debt issuance cost | ( | ) | |||||||||
Payments for purchase of treasury stock | ( | ) | ( | ) | ( | ) | |||||
Payments for stock-based compensation items | ( | ) | ( | ) | ( | ) | |||||
Capital contribution from noncontrolling interest | |||||||||||
Dividends paid to BorgWarner stockholders | ( | ) | ( | ) | ( | ) | |||||
Dividends paid to noncontrolling stockholders | ( | ) | ( | ) | ( | ) | |||||
Net cash used in financing activities | ( | ) | ( | ) | ( | ) | |||||
Effect of exchange rate changes on cash | ( | ) | ( | ) | |||||||
Net increase in cash and cash equivalents | |||||||||||
Cash and cash equivalents at beginning of year | |||||||||||
Cash and cash equivalents at end of year | $ | $ | $ | ||||||||
SUPPLEMENTAL CASH FLOW INFORMATION | |||||||||||
Cash paid during the year for: | |||||||||||
Interest | $ | $ | $ | ||||||||
Income taxes, net of refunds | $ | $ | $ | ||||||||
Non-cash investing transactions | |||||||||||
Liabilities assumed from business acquired | $ | $ | $ | ||||||||
See Accompanying Notes to Consolidated Financial Statements.
58
BORGWARNER INC. AND CONSOLIDATED SUBSIDIARIES
CONSOLIDATED STATEMENTS OF EQUITY
Number of shares | BorgWarner Inc. stockholder's equity | ||||||||||||||||||||||||||||
(in millions, except share data) | Issued common stock | Common stock held in treasury | Issued common stock | Capital in excess of par value | Treasury stock | Retained earnings | Accumulated other comprehensive income (loss) | Noncontrolling interests | |||||||||||||||||||||
Balance, January 1, 2017 | ( | ) | $ | $ | $ | ( | ) | $ | $ | ( | ) | $ | |||||||||||||||||
Dividends declared ($0.59 per share) * | — | — | — | — | — | ( | ) | — | ( | ) | |||||||||||||||||||
Stock incentive plans | — | — | ( | ) | — | — | — | ||||||||||||||||||||||
Net issuance for executive stock plan | — | — | — | — | — | ||||||||||||||||||||||||
Net issuance of restricted stock | — | — | — | — | — | ||||||||||||||||||||||||
Purchase of treasury stock | — | ( | ) | — | — | ( | ) | — | — | — | |||||||||||||||||||
Business divestiture | — | — | — | — | — | — | — | ||||||||||||||||||||||
Net earnings | — | — | — | — | — | — | |||||||||||||||||||||||
Other comprehensive loss | — | — | — | — | — | — | |||||||||||||||||||||||
Balance, December 31, 2017 | ( | ) | $ | $ | $ | ( | ) | $ | $ | ( | ) | $ | |||||||||||||||||
Adoption of accounting standards | — | — | — | — | — | ( | ) | — | |||||||||||||||||||||
Dividends declared ($0.68 per share) * | — | — | — | — | — | ( | ) | — | ( | ) | |||||||||||||||||||
Net issuance for executive stock plan | — | — | — | — | — | ||||||||||||||||||||||||
Net issuance of restricted stock | — | — | — | — | — | ||||||||||||||||||||||||
Purchase of treasury stock | — | ( | ) | — | — | ( | ) | — | — | — | |||||||||||||||||||
Business divestiture | — | — | — | — | — | — | — | ||||||||||||||||||||||
Net earnings | — | — | — | — | — | — | |||||||||||||||||||||||
Other comprehensive income | — | — | — | — | — | — | ( | ) | ( | ) | |||||||||||||||||||
Balance, December 31, 2018 | ( | ) | $ | $ | $ | ( | ) | $ | $ | ( | ) | $ | |||||||||||||||||
Dividends declared ($0.68 per share) * | — | — | — | — | — | ( | ) | — | ( | ) | |||||||||||||||||||
Noncontrolling interest contributions | — | — | — | — | — | — | — | ||||||||||||||||||||||
Net issuance for executive stock plan | — | — | — | — | — | ||||||||||||||||||||||||
Net issuance of restricted stock | — | — | ( | ) | — | — | — | ||||||||||||||||||||||
Purchase of treasury stock | — | ( | ) | — | — | ( | ) | — | — | — | |||||||||||||||||||
Net earnings | — | — | — | — | — | — | |||||||||||||||||||||||
Other comprehensive loss | — | — | — | — | — | — | ( | ) | ( | ) | |||||||||||||||||||
Balance, December 31, 2019 | ( | ) | $ | $ | $ | ( | ) | $ | $ | ( | ) | $ | |||||||||||||||||
____________________________________
* | The dividends declared relate to BorgWarner common stock. |
See Accompanying Notes to Consolidated Financial Statements.
59
NOTES TO CONSOLIDATED FINANCIAL STATEMENTS
INTRODUCTION
BorgWarner Inc. (together with it Consolidated Subsidiaries, the “Company”) is a Delaware corporation incorporated in 1987. We are a global product leader in clean and efficient technology solutions for combustion, hybrid and electric vehicles. Our products help improve vehicle performance, propulsion efficiency, stability and air quality. We manufacture and sell these products worldwide, primarily to original equipment manufacturers (“OEMs”) of light vehicles (passenger cars, sport-utility vehicles ("SUVs"), vans and light trucks). The Company's products are also sold to OEMs of commercial vehicles (medium-duty trucks, heavy-duty trucks and buses) and off-highway vehicles (agricultural and construction machinery and marine applications). We also manufacture and sell our products to certain Tier One vehicle systems suppliers and into the aftermarket for light, commercial and off-highway vehicles. The Company operates manufacturing facilities serving customers in Europe, the Americas and Asia and is an original equipment supplier to every major automotive OEM in the world. The Company's products fall into two reporting segments: Engine and Drivetrain.
NOTE 1 | SUMMARY OF SIGNIFICANT ACCOUNTING POLICIES |
The following paragraphs briefly describe the Company's significant accounting policies.
Basis of presentation Certain prior period amounts have been reclassified to conform to current period presentation.
Use of estimates The preparation of financial statements in conformity with accounting principles generally accepted in the United States of America (“GAAP”) requires management to make estimates and assumptions. These estimates and assumptions affect the reported amounts of assets and liabilities and disclosure of contingent assets and liabilities as of the date of the financial statements and the accompanying notes, as well as the amounts of revenues and expenses reported during the periods covered by these financial statements and accompanying notes. Actual results could differ from those estimates.
Revenue recognition The Company recognizes revenue when performance obligations under the terms of a contract are satisfied, which generally occurs with the transfer of control of our products. Although the Company may enter into long-term supply arrangements with its major customers, the prices and volumes are not fixed over the life of the arrangements, and a contract does not exist for purposes of applying Accounting Standards Codification ("ASC") Topic 606 until volumes are contractually known. For most of our products, transfer of control occurs upon shipment or delivery, however, a limited number of our customer arrangements for our highly customized products with no alternative use provide us with the right to payment during the production process. As a result, for these limited arrangements, revenue is recognized as goods are produced and control transfers to the customer. Revenue is measured at the amount of consideration we expect to receive in exchange for transferring the good.
60
NOTES TO CONSOLIDATED FINANCIAL STATEMENTS — (Continued)
The Company continually seeks business development opportunities and at times provides customer incentives for new program awards. Customer incentive payments are capitalized when the payments are incremental and incurred only if the new business is obtained and these amounts are expected to be recovered from the customer over the term of the new business arrangement. The Company recognizes a reduction to revenue as products that the upfront payments are related to are transferred to the customer, based on the total amount of products expected to be sold over the term of the arrangement (generally 3 to 7 years). The Company evaluates the amounts capitalized each period end for recoverability and expenses any amounts that are no longer expected to be recovered over the term of the business arrangement.
Cost of sales The Company includes materials, direct labor and manufacturing overhead within cost of sales. Manufacturing overhead is comprised of indirect materials, indirect labor, factory operating costs and other such costs associated with manufacturing products for sale.
Cash and cash equivalents Cash and cash equivalents are valued at fair market value. It is the Company's policy to classify all highly liquid investments with original maturities of three months or less as cash and cash equivalents. Cash and cash equivalents are maintained with several financial institutions. Deposits held with banks may exceed the amount of insurance provided on such deposits. Generally, these deposits may be redeemed upon demand and are maintained with financial institutions of reputable credit and therefore bear minimal risk.
Receivables, net Accounts receivable are stated at cost less an allowance for bad debts. An allowance for doubtful accounts is recorded when it is probable amounts will not be collected based on specific identification of customer circumstances or age of the receivable.
Refer to Note 6, "Balance Sheet Information," to the Consolidated Financial Statements for more information.
Inventories, net Cost of certain U.S. inventories is determined using the last-in, first-out (“LIFO”) method at the lower of cost or market, while other U.S. and foreign operations use the first-in, first-out (“FIFO”) or average-cost methods at the lower of cost or net realizable value. Inventory held by U.S. operations using the LIFO method was $193 million and $138 million at December 31, 2019 and 2018, respectively. Such inventories, if valued at current cost instead of LIFO, would have been greater by $15 million and $17 million at December 31, 2019 and 2018, respectively.
Refer to Note 6, "Balance Sheet Information," to the Consolidated Financial Statements for more information.
Pre-production costs related to long-term supply arrangements Engineering, research and development and other design and development costs for products sold on long-term supply arrangements are expensed as incurred unless the Company has a contractual guarantee for reimbursement from the customer. Costs for molds, dies and other tools used to make products sold on long-term supply arrangements for which the Company has title to the assets are capitalized in property, plant and equipment and amortized to cost of sales over the shorter of the term of the arrangement or over the estimated useful lives of the assets, typically three to five years. Costs for molds, dies and other tools used to make products sold on long-term supply arrangements for which the Company has a contractual guarantee for lump sum reimbursement from the customer are capitalized in prepayments and other current assets.
Property, plant and equipment, net Property, plant and equipment is valued at cost less accumulated depreciation. Expenditures for maintenance, repairs and renewals of relatively minor items are generally charged to expense as incurred. Renewals of significant items are capitalized. Depreciation is generally computed on a straight-line basis over the estimated useful lives of the assets. Useful lives
61
NOTES TO CONSOLIDATED FINANCIAL STATEMENTS — (Continued)
for buildings range from 15 to 40 years and useful lives for machinery and equipment range from three to 12 years. For income tax purposes, accelerated methods of depreciation are generally used.
Refer to Note 6, "Balance Sheet Information," to the Consolidated Financial Statements for more information.
Impairment of long-lived assets, including definite-lived intangible assets The Company reviews the carrying value of its long-lived assets, whether held for use or disposal, including other amortizing intangible assets, when events and circumstances warrant such a review under ASC Topic 360. In assessing long-lived assets for an impairment loss, assets are grouped with other assets and liabilities at the lowest level for which identifiable cash flows are largely independent of the cash flows of other assets and liabilities. In assessing long-lived assets for impairment, management generally considers individual facilities the lowest level for which identifiable cash flows are largely independent. A recoverability review is performed using the undiscounted cash flows if there is a triggering event. If the undiscounted cash flow test for recoverability identifies a possible impairment, management will perform a fair value analysis. Management determines fair value under ASC Topic 820 using the appropriate valuation technique of market, income or cost approach. If the carrying value of a long-lived asset is considered impaired, an impairment charge is recorded for the amount by which the carrying value of the long-lived asset exceeds its fair value.
Management believes that the estimates of future cash flows and fair value assumptions are reasonable; however, changes in assumptions underlying these estimates could affect the valuations. Significant judgments and estimates used by management when evaluating long-lived assets for impairment include: (i) an assessment as to whether an adverse event or circumstance has triggered the need for an impairment review; (ii) undiscounted future cash flows generated by the asset; and (iii) fair valuation of the asset.
Assets and liabilities held for sale The Company classifies assets and liabilities (disposal groups) to be sold as held for sale in the period in which all of the following criteria are met: management, having the authority to approve the action, commits to a plan to sell the disposal group; the disposal group is available for immediate sale in its present condition subject only to terms that are usual and customary for sales of such disposal groups; an active program to locate a buyer and other actions required to complete the plan to sell the disposal group have been initiated; the sale of the disposal group is probable, and transfer of the disposal group is expected to qualify for recognition as a completed sale within one year, except if events or circumstances beyond the Company's control extend the period of time required to sell the disposal group beyond one year; the disposal group is being actively marketed for sale at a price that is reasonable in relation to its current fair value; and actions required to complete the plan indicate that it is unlikely that significant changes to the plan will be made or that the plan will be withdrawn.
The Company initially measures a disposal group that is classified as held for sale at the lower of its carrying value or fair value less any costs to sell. Any loss resulting from this measurement is recognized in the period in which the held for sale criteria are met. Conversely, gains are not recognized on the sale of a disposal group until the date of sale. The Company assesses the fair value of a disposal group, less any costs to sell, each reporting period it remains classified as held for sale and reports any subsequent changes as an adjustment to the carrying value of the disposal group, as long as the new carrying value does not exceed the carrying value of the disposal group at the time it was initially classified as held for sale.
Upon determining that a disposal group meets the criteria to be classified as held for sale, the Company reports the assets and liabilities of the disposal group, if material, in the line items assets held for sale and liabilities held for sale in the Consolidated Balance Sheets. Additionally, depreciation is not
62
NOTES TO CONSOLIDATED FINANCIAL STATEMENTS — (Continued)
recorded during the period in which the long-lived assets, included in the disposal group, are classified as held for sale.
Goodwill and other indefinite-lived intangible assets During the fourth quarter of each year, the Company qualitatively assesses its goodwill assigned to each of its reporting units. This qualitative assessment evaluates various events and circumstances, such as macro economic conditions, industry and market conditions, cost factors, relevant events and financial trends, that may impact a reporting unit's fair value. Using this qualitative assessment, the Company determines whether it is more-likely-than-not the reporting unit's fair value exceeds its carrying value. If it is determined that it is not more-likely-than-not the reporting unit's fair value exceeds the carrying value, or upon consideration of other factors, including recent acquisition, restructuring or divestiture activity or to refresh the fair values, the Company performs a quantitative, "step one," goodwill impairment analysis. In addition, the Company may test goodwill in between annual test dates if an event occurs or circumstances change that could more-likely-than-not reduce the fair value of a reporting unit below its carrying value.
Similar to goodwill, the Company can elect to perform the impairment test for indefinite-lived intangibles other than goodwill (primarily trade names) using a qualitative analysis, considering similar factors as outlined in the goodwill discussion in order to determine if it is more-likely-than-not that the fair value of the trade names is less than the respective carrying values. If the Company elects to perform or is required to perform a quantitative analysis, the test consists of a comparison of the fair value of the indefinite-lived intangible asset to the carrying value of the asset as of the impairment testing date. The Company estimates the fair value of indefinite-lived intangibles using the relief-from-royalty method, which it believes is an appropriate and widely used valuation technique for such assets. The fair value derived from the relief-from-royalty method is measured as the discounted cash flow savings realized from owning such trade names and not being required to pay a royalty for their use.
Refer to Note 7, "Goodwill and Other Intangibles," to the Consolidated Financial Statements for more information.
Product warranties The Company provides warranties on some, but not all, of its products. The warranty terms are typically from one to three years. Provisions for estimated expenses related to product warranty are made at the time products are sold. These estimates are established using historical information about the nature, frequency and average cost of warranty claim settlements as well as product manufacturing and industry developments and recoveries from third parties. Management actively studies trends of warranty claims and takes action to improve product quality and minimize warranty claims. Management believes that the warranty accrual is appropriate; however, actual claims incurred could differ from the original estimates, requiring adjustments to the accrual. The product warranty accrual is allocated to current and non-current liabilities in the Consolidated Balance Sheets.
Refer to Note 8, "Product Warranty," to the Consolidated Financial Statements for more information.
Other loss accruals and valuation allowances The Company has numerous other loss exposures, such as customer claims, workers' compensation claims, litigation and recoverability of assets. Establishing loss accruals or valuation allowances for these matters requires the use of estimates and judgment in regard to the risk exposure and ultimate realization. The Company estimates losses under the programs using consistent and appropriate methods; however, changes to its assumptions could materially affect the recorded accrued liabilities for loss or asset valuation allowances.
Asbestos Like many other industrial companies that have historically operated in the United States, the Company, or parties that the Company is obligated to indemnify, has been named as one of many defendants in asbestos-related personal injury actions. BorgWarner Morse TEC LLC ("Morse TEC"), a former wholly-owned subsidiary of the Company, was the obligor for the Company's recorded asbestos-related liabilities and the policyholder of the related insurance assets. On October 30, 2019, the
63
NOTES TO CONSOLIDATED FINANCIAL STATEMENTS — (Continued)
Company transferred 100 % of its equity interests to Enstar Holdings (US) LLC (“Enstar”). In the fourth quarter of 2019, the Company derecognized Morse TEC and removed asbestos obligations, related insurance assets and associated deferred tax assets from the Consolidated Balance Sheet.
With the assistance of a third-party actuary, the Company estimated the liability and corresponding insurance recovery for pending and future claims not yet asserted to extend through December 31, 2064 with a runoff through 2074 and defense costs. This estimate was based on the Company's historical claim experience and estimates of the number and resolution cost of potential future claims that may be filed based on anticipated levels of unique plaintiff asbestos-related claims in the U.S. tort system against all defendants. As with any estimates, actual experience may differ. This estimate was not discounted to present value. The Company believed that December 31, 2074 was a reasonable assumption as to the last date on which it was likely to have resolved all asbestos-related claims, based on the nature and useful life of the Company’s products and the likelihood of incidence of asbestos-related disease in the U.S. population generally. The Company assessed the sufficiency of its estimated liability for pending and future claims not yet asserted and defense costs by evaluating actual experience regarding claims filed, settled and dismissed, and amounts paid in claim resolution costs. In addition to claims experience, the Company considered additional quantitative and qualitative factors such as changes in legislation, the legal environment, and the Company's defense strategy. The Company continued to have additional excess insurance coverage available for potential future asbestos-related claims. In connection with the Company’s review of its asbestos-related claims, the Company also reviewed the amount of its potential insurance coverage for such claims, taking into account the remaining limits of such coverage, the number and amount of claims on the Company's insurance from co-insured parties, ongoing litigation against the Company’s insurance carriers, potential remaining recoveries from insolvent insurance carriers, the impact of previous insurance settlements, and coverage available from solvent insurance carriers not party to the coverage litigation.
Refer to Note 15, "Contingencies," to the Consolidated Financial Statements for more information.
Environmental contingencies The Company accounts for environmental costs in accordance with ASC Topic 450. Costs related to environmental assessments and remediation efforts at operating facilities are accrued when it is probable that a liability has been incurred and the amount of that liability can be reasonably estimated. Estimated costs are recorded at undiscounted amounts, based on experience and assessments and are regularly evaluated. The liabilities are recorded in accounts payable and accrued expenses and other non-current liabilities in the Company's Consolidated Balance Sheets.
Refer to Note 15, "Contingencies," to the Consolidated Financial Statements for more information.
Derivative financial instruments The Company recognizes that certain normal business transactions generate risk. Examples of risks include exposure to exchange rate risk related to transactions denominated in currencies other than the functional currency, changes in commodity costs and interest rates. It is the objective of the Company to assess the impact of these transaction risks and offer protection from selected risks through various methods, including financial derivatives. Virtually all derivative instruments held by the Company are designated as hedges, have high correlation with the underlying exposure and are highly effective in offsetting underlying price movements. Accordingly, gains and losses from changes in qualifying hedge fair values are matched with the underlying transactions. Hedge instruments are generally reported gross, with no right to offset, on the Consolidated Balance Sheets at their fair value based on quoted market prices for contracts with similar maturities. The Company does not engage in any derivative transactions for purposes other than hedging specific risks.
64
NOTES TO CONSOLIDATED FINANCIAL STATEMENTS — (Continued)
Foreign currency The financial statements of foreign subsidiaries are translated to U.S. dollars using the period-end exchange rate for assets and liabilities and an average exchange rate for each period for revenues, expenses and capital expenditures. The local currency is the functional currency for substantially all of the Company's foreign subsidiaries. Translation adjustments for foreign subsidiaries are recorded as a component of accumulated other comprehensive income (loss) in equity. The Company recognizes transaction gains and losses arising from fluctuations in currency exchange rates on transactions denominated in currencies other than the functional currency in earnings as incurred.
Refer to Note 14, "Accumulated Other Comprehensive Loss," to the Consolidated Financial Statements for more information.
Pensions and other postretirement employee defined benefits The Company's defined benefit pension and other postretirement employee benefit plans are accounted for in accordance with ASC Topic 715. Disability, early retirement and other postretirement employee benefits are accounted for in accordance with ASC Topic 712.
Pensions and other postretirement employee benefit costs and related liabilities and assets are dependent upon assumptions used in calculating such amounts. These assumptions include discount rates, expected returns on plan assets, health care cost trends, compensation and other factors. In accordance with GAAP, actual results that differ from the assumptions used are accumulated and amortized over future periods, and accordingly, generally affect recognized expense in future periods.
Refer to Note 12, "Retirement Benefit Plans," to the Consolidated Financial Statements for more information.
Restructuring Restructuring costs may occur when the Company takes action to exit or significantly curtail a part of its operations or implements a reorganization that affects the nature and focus of operations. A restructuring charge can consist of severance costs associated with reductions to the workforce, costs to terminate an operating lease or contract, professional fees and other costs incurred related to the implementation of restructuring activities.
The Company generally records costs associated with voluntary separations at the time of employee acceptance. Costs for involuntary separation programs are recorded when management has approved the plan for separation, the employees are identified and aware of the benefits they are entitled to and it is unlikely that the plan will change significantly. When a plan of separation requires approval by or consultation with the relevant labor organization or government, the costs are recorded upon agreement. Costs associated with benefits that are contingent on the employee continuing to provide service are accrued over the required service period.
Refer to Note 16, "Restructuring," to the Consolidated Financial Statements for more information.
Income taxes In accordance with ASC Topic 740, the Company's income tax expense is calculated based on expected income and statutory tax rates in the various jurisdictions in which the Company operates and requires the use of management's estimates and judgments. Accounting for income taxes is complex, in part because the Company conducts business globally and therefore files income tax returns in numerous tax jurisdictions. Management judgment is required in determining the Company’s worldwide provision for income taxes and recording the related assets and liabilities, including accruals for unrecognized tax benefits.
65
NOTES TO CONSOLIDATED FINANCIAL STATEMENTS — (Continued)
The determination of accruals for unrecognized tax benefits includes the application of complex tax laws in a multitude of jurisdictions across the Company's global operations. Management judgment is required in determining the gross unrecognized tax benefits related liabilities. In the ordinary course of the Company's business, there are many transactions and calculations where the ultimate tax determination is less than certain. Accruals for unrecognized tax benefits are established when, despite the belief that tax positions are supportable, there remain certain positions that do not meet the minimum probability threshold, which is a tax position that is more-likely-than-not to be sustained upon examination by the applicable taxing authority.
Refer to Note 5, "Income Taxes," to the Consolidated Financial Statements for more information.
New Accounting Pronouncements
Recently Adopted Accounting Standards
In February 2016, the Financial Accounting Standards Board ("FASB") issued Accounting Standards Update ("ASU") No. 2016-02, "Leases (Topic 842)." Under this guidance, a lease is a contract, or part of a contract, that conveys the right to control the use of an identified asset for a period of time in exchange for consideration. Lessees are required to recognize a right-of-use asset and a lease liability for leases with a term of more than 12 months, including operating leases defined under previous GAAP. This guidance was effective for interim and annual reporting periods beginning after December 15, 2018.
The Company adopted ASC Topic 842 as of January 1, 2019, using the optional transition method provided in ASU No. 2018-11, "Leases (Topic 842): Targeted Improvements." Under this method, the Company recorded an adjustment as of the effective date and did not include any retrospective adjustments to comparative periods to reflect the adoption of ASC Topic 842. In addition, the Company elected the package of practical expedients permitted under the transition guidance within ASC Topic 842, which among other things, does not require the Company to reassess whether existing contracts contain leases, classification of leases identified, nor classification and treatment of initial direct costs capitalized under ASC Topic 840. The Company also elected the practical expedients to combine the lease and non-lease components. The Company did not elect the practical expedient to apply hindsight as part of the leases evaluation. Additionally, the Company elected the practical expedient under ASU No. 2018-01, "Leases (Topic 842): Land Easement Practical Expedient for Transition to Topic 842", which allows an entity to not reassess whether any existing land easements are or contain leases.
The Company's lease agreements primarily consist of real estate property, such as manufacturing facilities, warehouses, and office buildings, in addition to personal property, such as vehicles, manufacturing and information technology equipment. The Company determines whether a contract is or contains a lease at contract inception. The majority of the Company's lease arrangements are comprised of fixed payments and a limited number of these arrangements include a variable payment component based on certain index fluctuations.
Adoption of ASC Topic 842 resulted in the recording of lease right-of-use assets ("lease assets") and lease liabilities of approximately $104 million and $103 million, respectively, as of January 1, 2019. The adoption did not impact consolidated net earnings and had no impact on cash flows. Refer to Note 17, "Leases and Commitments," to the Consolidated Financial Statements for more information.
Accounting Standards Not Yet Adopted
In December 2019, the FASB issued ASU No. 2019-12, “Income Taxes (Topic 740) - Simplifying the Accounting for Income Taxes.” The amendments in the standard remove certain exceptions to the general principles in Topic 740 and improve consistent application of and simplify GAAP for other areas of Topic 740 by clarifying and amending existing guidance. This guidance is effective for interim and
66
NOTES TO CONSOLIDATED FINANCIAL STATEMENTS — (Continued)
annual reporting periods beginning after December 15, 2020. The Company is currently evaluating the impact of this guidance on its consolidated financial statements.
In August 2018, the FASB issued ASU No. 2018-15, "Intangibles - Goodwill and Other - Internal-Use Software (Subtopic 350-40)." It requires implementation costs incurred by customers in cloud computing arrangements to be deferred and recognized over the term of the arrangement, if those costs would be capitalized by the customer in a software licensing arrangement under the internal-use software guidance (Subtopic 350-40). This guidance is effective for interim and annual periods beginning after December 15, 2019 and early adoption is permitted. The Company does not expect this guidance to have a material impact on its consolidated financial statements.
In August 2018, the FASB issued ASU No. 2018-14, "Compensation - Retirement Benefits - Defined Benefit Plans - General (Subtopic 715-20)." The new standard (i) requires the removal of disclosures that are no longer considered cost beneficial; (ii) clarifies specific requirements of certain disclosures; (iii) adds new disclosure requirements, including the weighted average interest crediting rates for cash balance plans and other plans with promised interest crediting rates, and reasons for significant gains and losses related to changes in the benefit obligation. This guidance is effective for annual periods beginning after December 15, 2020 and early adoption is permitted. The Company does not expect this guidance to have a material impact on its consolidated financial statements and will include enhanced disclosures in the consolidated financial statements upon adoption.
In August 2018, the FASB issued ASU No. 2018-13, "Fair Value Measurement (Topic 820)." It removes disclosure requirements on fair value measurements including the amount of and reasons for transfers between Level 1 and Level 2 of the fair value hierarchy, the policy for timing of transfers between levels, and the valuation processes for Level 3 fair value measurements. It also amends and clarifies certain disclosures and adds new disclosure requirements including the changes in unrealized gains and losses for the period included in other comprehensive income for recurring Level 3 fair value measurements, and the range and weighted average of significant unobservable inputs used to develop Level 3 fair value measurements. This guidance is effective for interim and annual periods beginning after December 15, 2019. An entity is permitted to early adopt any removed or modified disclosures and delay adoption of the additional disclosures until the effective date. The Company does not expect this guidance to have a material impact on its consolidated financial statements.
In June 2016, the FASB issued ASU No. 2016-13, "Financial Instruments - Credit Losses (Topic 326)." It replaces the current incurred loss impairment method with a new method that reflects expected credit losses. Under this new model an entity would recognize an impairment allowance equal to its current estimate of credit losses on financial assets measured at amortized cost. This guidance is effective for fiscal years beginning after December 15, 2019, with early adoption permitted. The Company does not expect this guidance to have a material impact on its consolidated financial statements.
67
NOTES TO CONSOLIDATED FINANCIAL STATEMENTS — (Continued)
NOTE 2 REVENUE FROM CONTRACTS WITH CUSTOMERS
The Company manufactures and sells products, primarily to OEMs of light vehicles, and to a lesser extent, to other OEMs of commercial vehicles and off-highway vehicles, to certain Tier One vehicle systems suppliers and into the aftermarket. Although the Company may enter into long-term supply arrangements with its major customers, the prices and volumes are not fixed over the life of the arrangements, and a contract does not exist for purposes of applying ASC Topic 606, "Revenue from Contracts with Customers", until volumes are contractually known. Revenue is recognized when performance obligations under the terms of a contract are satisfied, which generally occurs with the transfer of control of our products. For most of our products, transfer of control occurs upon shipment or delivery; however, a limited number of our customer arrangements for our highly customized products with no alternative use provide us with the right to payment during the production process. As a result, for these limited arrangements, revenue is recognized as goods are produced and control transfers to the customer using the input cost-to-cost method. The Company recorded a contract asset of $10 million and $11 million at December 31, 2019 and December 31, 2018, respectively, for these arrangements. These amounts are reflected in Prepayments and other current assets in the Company's Consolidated Balance Sheets.
Revenue is measured at the amount of consideration we expect to receive in exchange for transferring the goods. The Company has a limited number of arrangements with customers where the price paid by the customer is dependent on the volume of product purchased over the term of the arrangement. In other limited arrangements, the Company will provide a rebate to customers based on the volume of products purchased during the course of the arrangement. The Company estimates the volumes to be sold over the term of the arrangement and recognizes revenue based on the estimated amount of consideration to be received from these arrangements. As a result of these arrangements, the Company recognized a liability of $2 million and $6 million at December 31, 2019 and December 31, 2018. These amounts are reflected in Accounts payable and accrued expenses in the Company's Consolidated Balance Sheets.
The Company’s payment terms with customers are customary and vary by customer and geography but typically range from 30 to 90 days . We have evaluated the terms of our arrangements and determined that they do not contain significant financing components. The Company provides warranties on some of its products. Provisions for estimated expenses related to product warranty are made at the time products are sold. Refer to Note 8, "Product Warranty," to the Consolidated Financial Statements for more information. Shipping and handling fees billed to customers are included in sales, while costs of shipping and handling are included in cost of sales. The Company has elected to apply the accounting policy election available under ASC Topic 606 and accounts for shipping and handling activities as a fulfillment cost.
In limited instances, certain customers have provided payments in advance of receiving related products, typically at the onset of an arrangement prior to the beginning of production. These contract liabilities are reflected in Accounts payable and accrued expenses and Other non-current liabilities in the Company's Consolidated Balance Sheets and were $10 million and $12 million at December 31, 2019 and $13 million and $17 million at December 31, 2018, respectively. These amounts are reflected as revenue over the term of the arrangement (typically 3 to 7 years) as the underlying products are shipped.
The Company continually seeks business development opportunities and at times provides customer incentives for new program awards. The Company evaluates the underlying economics of each amount of consideration payable to a customer to determine the proper accounting by understanding the reasons for the payment, the rights and obligations resulting from the payment, the nature of the promise in the contract, and other relevant facts and circumstances. When the Company determines that the payments are incremental and incurred only if the new business is obtained and expects to recover these amounts from the customer over the term of the new business arrangement, the Company capitalizes these amounts. The Company recognizes a reduction to revenue as products that the upfront payments are
68
NOTES TO CONSOLIDATED FINANCIAL STATEMENTS — (Continued)
related to are transferred to the customer, based on the total amount of products expected to be sold over the term of the arrangement (generally 3 to 7 years). The Company evaluates the amounts capitalized each period end for recoverability and expenses any amounts that are no longer expected to be recovered over the term of the business arrangement. The Company had $37 million and $29 million recorded in Prepayments and other current assets, and $180 million and $187 million recorded in Other non-current assets in the Consolidated Balance Sheets at December 31, 2019 and December 31, 2018.
The following table represents a disaggregation of revenue from contracts with customers by segment and region:
Year Ended December 31, 2019 | ||||||||||||
(In millions) | Engine | Drivetrain | Total | |||||||||
North America | $ | $ | $ | |||||||||
Europe | ||||||||||||
Asia | ||||||||||||
Other | ||||||||||||
Total | $ | $ | $ | |||||||||
Year Ended December 31, 2018 | ||||||||||||
(In millions) | Engine | Drivetrain | Total | |||||||||
North America | $ | $ | $ | |||||||||
Europe | ||||||||||||
Asia | ||||||||||||
Other | ||||||||||||
Total | $ | $ | $ | |||||||||
Year Ended December 31, 2017 | ||||||||||||
(In millions) | Engine | Drivetrain | Total | |||||||||
North America | $ | $ | $ | |||||||||
Europe | ||||||||||||
Asia | ||||||||||||
Other | ||||||||||||
Total | $ | $ | $ | |||||||||
NOTE 3 RESEARCH AND DEVELOPMENT COSTS
The Company's net Research & Development ("R&D") expenditures are included in selling, general and administrative expenses of the Consolidated Statements of Operations. Customer reimbursements are netted against gross R&D expenditures as they are considered a recovery of cost. Customer reimbursements for prototypes are recorded net of prototype costs based on customer contracts, typically either when the prototype is shipped or when it is accepted by the customer. Customer reimbursements for engineering services are recorded when performance obligations are satisfied in accordance with the contract. Financial risks and rewards transfer upon shipment, acceptance of a prototype component by the customer or upon completion of the performance obligation as stated in the respective customer agreement.
The following table presents the Company’s gross and net expenditures on R&D activities:
69
NOTES TO CONSOLIDATED FINANCIAL STATEMENTS — (Continued)
Year Ended December 31, | |||||||||||
(in millions) | 2019 | 2018 | 2017 | ||||||||
Gross R&D expenditures | $ | $ | $ | ||||||||
Customer reimbursements | ( | ) | ( | ) | ( | ) | |||||
Net R&D expenditures | $ | $ | $ | ||||||||
Net R&D expenditures as a percentage of net sales were 4.1 %, 4.2 % and 4.2 % for the years ended December 31, 2019, 2018 and 2017, respectively. The Company has contracts with several customers at the Company's various R&D locations. None of the Company's R&D-related customer reimbursements under these contracts exceeded 5 % of net R&D expenditures in any of the periods presented.
NOTE 4 OTHER (INCOME) EXPENSE, NET
Items included in Other (income) expense, net consist of:
Year Ended December 31, | |||||||||||
(in millions) | 2019 | 2018 | 2017 | ||||||||
Gain on derecognition of subsidiary | $ | ( | ) | $ | $ | ||||||
Restructuring expense | |||||||||||
Unfavorable arbitration loss | |||||||||||
Merger, acquisition and divestiture expense | |||||||||||
Asset impairment and loss on divestiture | |||||||||||
Asbestos-related adjustments | |||||||||||
Gain on sale of building | ( | ) | |||||||||
Gain on commercial settlement | ( | ) | |||||||||
Lease termination settlement | |||||||||||
Other income | ( | ) | ( | ) | — | ||||||
Other (income) expense, net | $ | ( | ) | $ | $ | ||||||
On October 30, 2019, the Company entered into a definitive agreement with Enstar, a subsidiary of Enstar Group Limited, pursuant to which Enstar acquired 100 % of the equity interests of Morse TEC, a consolidated wholly-owned subsidiary of the Company that holds asbestos and certain other liabilities. In connection with the closing, the Company recorded a pre-tax gain of $177 million. Refer to Note 19 “Recent Transactions,” to the Consolidated Financial Statements for more information.
During the year ended December 31, 2019 the Company recorded $72 million of restructuring expense, primarily related to actions to reduce structural costs. During the years ended December 31, 2018 and 2017, the Company recorded restructuring expense of $67 million and $58 million, respectively, primarily related to Drivetrain and Engine segment actions designed to improve future profitability and competitiveness. Refer to Note 16, "Restructuring," to the Consolidated Financial Statements for more information.
During the year ended December 31, 2019, the Company recorded $14 million of expense related to the receipt of a final unfavorable arbitration decision associated with the resolution of a matter related to a previous acquisition.
During the years ended December 31, 2019, 2018 and 2017, the Company recorded $11 million, $6 million and $10 million of merger, acquisition and divestiture expenses. The merger, acquisition and divestiture expense in the year ended December 31, 2019 was primarily professional fees, related to the Company's review of strategic acquisition and divestiture targets, including the transfer of Morse TEC, the anticipated acquisition of Delphi Technologies PLC, and the 20 % equity interest in Romeo Systems, Inc. and the divestiture activities for the non-core pipes and thermostat product lines. The merger, acquisition and divestiture expense in the year ended December 31, 2018 primarily related to
70
NOTES TO CONSOLIDATED FINANCIAL STATEMENTS — (Continued)
professional fees associated with divestiture activities for the non-core pipes and thermostat product lines. Refer to Note 20, "Assets and Liabilities Held For Sale," to the Consolidated Financial Statements for more information. The merger and acquisition expense in the year ended December 31, 2017 primarily related to the acquisition of Sevcon. Refer to Note 19, "Recent Transactions," to the Consolidated Financial Statements for more information.
In the third quarter of 2017, the Company started exploring strategic options for non-core emission product lines. In the fourth quarter of 2017, the Company launched an active program to locate a buyer for these non-core pipes and thermostat product lines and initiated all other actions required to complete the plan to sell these non-core product lines. The Company determined that the assets and liabilities of the pipes and thermostat product lines met the held for sale criteria as of December 31, 2017. As a result, the Company recorded an asset impairment expense of $71 million in the fourth quarter of 2017 to adjust the net book value of this business to its fair value less cost to sell. In December 2018, the Company reached an agreement to sell its thermostat product lines for approximately $28 million. As a result, the Company recorded an additional asset impairment expense of $25 million in the year ended December 31, 2018 to adjust the net book value of this business to fair value less costs to sell. All closing conditions were satisfied, and the sale was closed on April 1, 2019. Based on the agreement reached in the fourth quarter of 2019 regarding the finalization of the purchase price adjustments related to the sale of the thermostat product lines, the Company determined that $7 million of additional loss on sale was required during the year ended December 31, 2019.
During the year ended December 31, 2018, the Company recorded asbestos-related adjustments resulting in an increase to Other (income) expense, net, of $23 million. This increase was the result of actuarial valuation changes of $23 million associated with the Company's estimate of liabilities for asbestos-related claims asserted but not yet resolved and potential claims not yet asserted. Refer to Note 15, "Contingencies," to the Consolidated Financial Statements for more information.
During the fourth quarter of 2018, the Company recorded a gain of $19 million related to the sale of a building at a manufacturing facility located in Europe.
During the year ended December 31, 2018, the Company recorded a gain of approximately $4 million related to the settlement of a commercial contract for an entity acquired in the 2015 Remy acquisition.
During the first quarter of 2017, the Company recorded a loss of $5 million related to the termination of a long-term property lease for a manufacturing facility located in Europe.
71
NOTES TO CONSOLIDATED FINANCIAL STATEMENTS — (Continued)
NOTE 5 | INCOME TAXES |
Earnings before income taxes and the provision for income taxes are presented in the following table.
Year Ended December 31, | |||||||||||
(in millions) | 2019 | 2018 | 2017 | ||||||||
Earnings before income taxes: | |||||||||||
U.S. | $ | $ | $ | ||||||||
Non-U.S. | |||||||||||
Total | $ | $ | $ | ||||||||
Provision for income taxes: | |||||||||||
Current: | |||||||||||
Federal | $ | $ | $ | ||||||||
State | |||||||||||
Foreign | |||||||||||
Total current | |||||||||||
Deferred: | |||||||||||
Federal | ( | ) | |||||||||
State | ( | ) | |||||||||
Foreign | ( | ) | ( | ) | |||||||
Total deferred | ( | ) | |||||||||
Total provision for income taxes | $ | $ | $ | ||||||||
The provision for income taxes resulted in an effective tax rate of 37 %, 17.7 % and 54.7 % for the years ended December 31, 2019, 2018 and 2017, respectively. An analysis of the differences between the effective tax rate and the U.S. statutory rate for the years ended December 31, 2019, 2018 and 2017 is presented below.
On December 22, 2017, the Tax Cuts and Jobs Act (the "Tax Act"), was enacted into law, which significantly changed existing U.S. tax law and included many provisions applicable to the Company, such as reducing the U.S. federal statutory tax rate, imposing a one-time transition tax on deemed repatriation of deferred foreign income, and adopting a territorial tax system. The Tax Act reduced the U.S. federal statutory tax rate from 35 % to 21 % effective January 1, 2018. The Tax Act also includes a provision to tax Global Intangible Low-Taxed Income (“GILTI”) of foreign subsidiaries, a special tax deduction for Foreign-Derived Intangible Income (“FDII”), and a Base Erosion Anti-Abuse (“BEAT”) tax measure that may tax certain payments between a U.S. corporation and its subsidiaries. These additional provisions of the Tax Act were effective beginning January 1, 2018.
In accordance with guidance provided by Staff Accounting Bulletin No 118 (SAB 118), as of December 31, 2017, the Company had not completed its accounting for the tax effects of the Tax Act and had recorded provisional estimates for significant items including the following: (i) the effects on existing deferred balances, including executive compensation, (ii) the one-time transition tax, and (iii) its indefinite reinvestment assertion. In light of the treatment of foreign earnings under the Tax Act, the Company reconsidered its indefinite reinvestment position and concluded it would no longer assert indefinite reinvestment with respect to the Company's foreign unremitted earnings as of December 31, 2017. The Company recognized income tax expense of $274 million for the year ended December 31, 2017 for the significant items it could reasonably estimate associated with the Tax Act. This amount was comprised of (i) a revaluation of U.S. deferred tax assets and liabilities at December 31, 2017, resulting in a tax charge of $75 million, including $11 million for executive compensation (ii) a one-time transition tax resulting in a tax charge of $105 million and (iii) a tax charge of $94 million for additional provisional deferred tax liabilities with respect to the expected future remittance of foreign earnings.
72
NOTES TO CONSOLIDATED FINANCIAL STATEMENTS — (Continued)
For the year ended December 31, 2018, the Company completed its accounting for the tax effects of the Tax Act. The final SAB 118 adjustments resulted in: (i) an increase in the Company's existing deferred tax asset balances of $13 million, including $9 million for executive compensation (ii) a tax charge of $8 million for the one-time transition tax, and (iii) a decrease in the deferred tax liability associated with its indefinite reinvestment assertion of $7 million. The total impact to tax expense from these adjustments was a net tax benefit of $13 million. Compared to the year ended December 31, 2017, this additional tax benefit from the final adjustments was a result of further analysis performed by the Company and the issuance of additional regulatory guidance.
In 2018, the Company made an accounting policy election to treat the future tax impacts of the GILTI provisions of the Tax Act as a period cost to the extent applicable.
As discussed above, in light of the treatment of foreign earnings under the Tax Act, the Company reconsidered its indefinite reinvestment position with respect to its foreign unremitted earnings in 2017, and the Company is no longer asserting indefinite reinvestment with respect to its foreign unremitted earnings. The Company recorded a deferred tax liability of $56 million with respect to its foreign unremitted earnings at December 31, 2019. With respect to certain book versus tax basis differences not represented by undistributed earnings of approximately $400 million as of December 31, 2019, the Company continues to assert indefinite reinvestment of these basis differences. These basis differences would become taxable upon the sale or liquidation of the foreign subsidiaries. The Company's best estimate of the unrecognized deferred tax liability on these basis differences is approximately $20 million as of December 31, 2019.
The following table provides a reconciliation of tax expense based on the U.S. statutory tax rate to final tax expense.
Year Ended December 31, | |||||||||||
(in millions) | 2019 | 2018 | 2017 | ||||||||
Income taxes at U.S. statutory rate of 21% for 2019 and 2018 (35% for 2017) | $ | $ | $ | ||||||||
Increases (decreases) resulting from: | |||||||||||
Impact of transactions | ( | ) | |||||||||
Reserve adjustments, settlements and claims | |||||||||||
Foreign rate differentials | ( | ) | |||||||||
Net tax on remittance of foreign earnings | ( | ) | |||||||||
U.S. tax on non-U.S. earnings | |||||||||||
Other foreign taxes | |||||||||||
State taxes, net of federal benefit | |||||||||||
Non-deductible transaction costs | |||||||||||
Impact of foreign derived intangible income | ( | ) | ( | ) | |||||||
Valuation allowance adjustments | ( | ) | ( | ) | |||||||
Affiliates' earnings | ( | ) | ( | ) | ( | ) | |||||
Changes in accounting methods and filing positions | ( | ) | ( | ) | ( | ) | |||||
Tax credits | ( | ) | ( | ) | ( | ) | |||||
Tax holidays | ( | ) | ( | ) | ( | ) | |||||
Revaluation of U.S. deferred taxes | ( | ) | |||||||||
Other | ( | ) | |||||||||
Provision for income taxes, as reported | $ | $ | $ | ||||||||
The change in the effective tax rate for 2019, as compared to 2018, was primarily due to the derecognition of Morse TEC and items related to the Tax Act. The derecognition of Morse TEC resulted in
73
NOTES TO CONSOLIDATED FINANCIAL STATEMENTS — (Continued)
an increase in income tax expense of $173 million for the reversal of the asbestos-related deferred tax assets. This amount is offset in the rate reconciliation above by a benefit of $37 million representing the impact of the nontaxable pre-tax gain of $177 million.The items related to the Tax Act include an increase in tax expense of $22 million due to the U.S. Department of the Treasury’s issuance of the final regulations in the first quarter of 2019 related to the calculation of the one-time transition tax. Additionally, the Company recorded a tax expense of $22 million on net remittance of foreign earnings in 2019 compared to a tax benefit recorded in 2018. The tax benefit in 2018 is related to the refinement in the Company’s change in the indefinite reinvestment assertion.
The Company's provision for income taxes for the year ended December 31, 2019 includes an increase in income tax expense for the items mentioned above. In addition, the provision for income taxes also includes reductions of income tax expense of $19 million related to restructuring and merger, acquisition and divestiture expense, $11 million for a global realignment plan, $8 million related to other one-time adjustments and $6 million related to pension settlement loss.
The change in the effective tax rate for 2018, as compared to 2017, was primarily due to items related to the Tax Act. The Tax Act includes a reduction in the US income tax rate from 35 % to 21 %, as of January 1, 2018. Tax expense includes a provision for GILTI of $29 million, net of foreign tax credits and a tax benefit for FDII of $15 million that was not applicable in 2017. The one-time transition tax that resulted in a tax charge of $105 million in 2017 was not applicable in 2018. There was also a tax charge of $75 million related to a revaluation of U.S. deferred tax assets and liabilities, including $11 million for executive compensation in 2017 and the initial tax charge of $94 million related to the Company’s change in indefinite reinvestment assertion with respect to the expected future remittance of undistributed foreign earnings in 2017.
The Company's provision for income taxes for the year ended December 31, 2018 includes reductions of income tax expense of $15 million related to restructuring expense, $6 million related to the asbestos-related adjustments, and $8 million related to asset impairment expense, offset by increases to tax expense of $1 million and $6 million related to a gain on commercial settlement and a gain on the sale of a building, respectively, discussed in Note 4, "Other (Income) Expense, Net," to the Consolidated Financial Statements. The provision for income taxes also includes reductions of income tax expense of $13 million related to final adjustments made to measurement period provisional estimates associated with the Tax Act, $22 million related to a decrease in the Company's deferred tax liability due to a tax benefit for certain foreign tax credits now available due to actions the Company took during the year, $9 million related to valuation allowance releases, $3 million related to tax reserve adjustments, and $30 million related to changes in accounting methods and tax filing positions for prior years primarily related to the Tax Act.
The Company's provision for income taxes for the year ended December 31, 2017 includes reductions of income tax expense of $10 million, $1 million, $18 million and $4 million related to the restructuring expense, merger and acquisition expense, asset impairment expense and other one-time adjustments, respectively, discussed in Note 4, "Other (Income) Expense, Net," to the Consolidated Financial Statements.
74
NOTES TO CONSOLIDATED FINANCIAL STATEMENTS — (Continued)
A roll forward of the Company's total gross unrecognized tax benefits for the years ended December 31, 2019 and 2018, respectively, is presented below:
(in millions) | 2019 | 2018 | 2017 | ||||||||
Balance, January 1 | $ | $ | $ | ||||||||
Additions based on tax positions related to current year | |||||||||||
Additions/(reductions) for tax positions of prior years | ( | ) | |||||||||
Reductions for closure of tax audits and settlements | ( | ) | ( | ) | |||||||
Reductions for lapse in statute of limitations | ( | ) | ( | ) | |||||||
Translation adjustment | ( | ) | ( | ) | |||||||
Balance, December 31 | $ | $ | $ | ||||||||
The Company recognizes interest and penalties related to unrecognized tax benefits in income tax expense. The amounts recognized in income tax expense for 2019 and 2018 are $15 million and $10 million, respectively. The Company has an accrual of approximately $46 million and $32 million for the payment of interest and penalties at December 31, 2019 and 2018, respectively. As of December 31, 2019, approximately $144 million represents the amount that, if recognized, would affect the Company's effective income tax rate in future periods. This amount includes a decrease in U.S. federal income taxes that would occur upon recognition of the state tax benefits and U.S. foreign tax credits included therein. The Company estimates that approximately $5 million will be released in the next 12 months for the closure of an audit and the lapse in statute of limitations subsequent to the reporting period from certain taxing jurisdictions.
The Company and/or one of its subsidiaries files income tax returns in the U.S. federal, various state jurisdictions and various foreign jurisdictions. In certain tax jurisdictions, the Company may have more than one taxpayer. The Company is no longer subject to income tax examinations by tax authorities in its major tax jurisdictions as follows:
Tax jurisdiction | Years no longer subject to audit | Tax jurisdiction | Years no longer subject to audit | |||
U.S. Federal | Japan | |||||
China | Mexico | |||||
France | Poland | |||||
Germany | South Korea | |||||
Hungary | ||||||
In the U.S., certain tax attributes created in years prior to 2015 were subsequently utilized. Even though the U.S. federal statute of limitations has expired for years prior to 2015, the years in which these tax attributes were created could still be subject to examination, limited to only the examination of the creation of the tax attribute.
75
NOTES TO CONSOLIDATED FINANCIAL STATEMENTS — (Continued)
The components of deferred tax assets and liabilities as of December 31, 2019 and 2018 consist of the following:
December 31, | |||||||
(in millions) | 2019 | 2018 | |||||
Deferred tax assets: | |||||||
Research and development capitalization | $ | $ | |||||
Net operating loss and capital loss carryforwards | |||||||
Other comprehensive loss | |||||||
Unrecognized tax benefits | |||||||
Employee compensation | |||||||
Pension and other postretirement benefits | |||||||
State tax credits | |||||||
Warranty | |||||||
Foreign tax credits | |||||||
Asbestos-related | |||||||
Other | |||||||
Total deferred tax assets | $ | $ | |||||
Valuation allowance | ( | ) | ( | ) | |||
Net deferred tax asset | $ | $ | |||||
Deferred tax liabilities: | |||||||
Goodwill and intangible assets | ( | ) | ( | ) | |||
Fixed assets | ( | ) | ( | ) | |||
Unremitted foreign earnings | ( | ) | ( | ) | |||
Other | ( | ) | ( | ) | |||
Total deferred tax liabilities | $ | ( | ) | $ | ( | ) | |
Net deferred taxes | $ | ( | ) | $ | |||
76
NOTES TO CONSOLIDATED FINANCIAL STATEMENTS — (Continued)
NOTE 6 | BALANCE SHEET INFORMATION |
Detailed balance sheet data is as follows:
December 31, | |||||||
(in millions) | 2019 | 2018 | |||||
Receivables, net: | |||||||
Customers | $ | $ | |||||
Indirect taxes | |||||||
Other | |||||||
Gross receivables | |||||||
Bad debt allowance (a) | ( | ) | ( | ) | |||
Total receivables, net | $ | $ | |||||
Inventories, net: | |||||||
Raw material and supplies | $ | $ | |||||
Work in progress | |||||||
Finished goods | |||||||
FIFO inventories | |||||||
LIFO reserve | ( | ) | ( | ) | |||
Total inventories, net | $ | $ | |||||
Prepayments and other current assets: | |||||||
Prepaid taxes | $ | $ | |||||
Prepaid tooling | |||||||
Other | |||||||
Total prepayments and other current assets | $ | $ | |||||
Property, plant and equipment, net: | |||||||
Land and land use rights | $ | $ | |||||
Buildings | |||||||
Machinery and equipment | |||||||
Capital leases | |||||||
Construction in progress | |||||||
Property, plant and equipment, gross | |||||||
Accumulated depreciation | ( | ) | ( | ) | |||
Property, plant and equipment, net, excluding tooling | |||||||
Tooling, net of amortization | |||||||
Property, plant and equipment, net | $ | $ | |||||
Investments and other long-term receivables: | |||||||
Investment in equity affiliates | $ | $ | |||||
Cost method investments | |||||||
Other long-term asbestos-related insurance receivables* | |||||||
Other long-term receivables* | |||||||
Total investments and other long-term receivables | $ | $ | |||||
Other non-current assets: | |||||||
Operating leases | $ | $ | |||||
Deferred income taxes* | |||||||
Deferred asbestos-related insurance asset* | |||||||
Other | |||||||
Total other non-current assets | $ | $ | |||||
77
NOTES TO CONSOLIDATED FINANCIAL STATEMENTS — (Continued)
December 31, | |||||||
(in millions) | 2019 | 2018 | |||||
Accounts payable and accrued expenses: | |||||||
Trade payables | $ | $ | |||||
Payroll and employee related | |||||||
Customer related | |||||||
Product warranties | |||||||
Indirect taxes | |||||||
Severance | |||||||
Operating leases | |||||||
Interest | |||||||
Insurance | |||||||
Retirement related | |||||||
Dividends payable to noncontrolling shareholders | |||||||
Asbestos-related* | |||||||
Other | |||||||
Total accounts payable and accrued expenses | $ | $ | |||||
Other non-current liabilities: | |||||||
Deferred income taxes | $ | $ | |||||
Operating leases | — | ||||||
Product warranties | |||||||
Deferred revenue | |||||||
Other | |||||||
Total other non-current liabilities | $ | $ | |||||
________________
* | Relates to the derecognition of Morse TEC, refer to Note 19, “Recent Transactions” to the Consolidated Financial Statements for more information. |
(a) Bad debt allowance: | 2019 | 2018 | 2017 | ||||||||
Beginning balance, January 1 | $ | ( | ) | $ | ( | ) | $ | ( | ) | ||
Provision | ( | ) | ( | ) | ( | ) | |||||
Write-offs | |||||||||||
Ending balance, December 31 | $ | ( | ) | $ | ( | ) | $ | ( | ) | ||
As of December 31, 2019 and December 31, 2018, accounts payable of $102 million and $104 million, respectively, were related to property, plant and equipment purchases.
Interest costs capitalized for the years ended December 31, 2019, 2018 and 2017 were $16 million, $22 million and $20 million, respectively.
NOTE 7 | GOODWILL AND OTHER INTANGIBLES |
During the fourth quarter of each year, the Company qualitatively assesses its goodwill assigned to each of its reporting units. This qualitative assessment evaluates various events and circumstances, such as macro economic conditions, industry and market conditions, cost factors, relevant events and financial trends, that may impact a reporting unit's fair value. Using this qualitative assessment, the Company determines whether it is more-likely-than-not the reporting unit's fair value exceeds its carrying value. If it is determined that it is not more-likely-than-not the reporting unit's fair value exceeds the carrying value, or upon consideration of other factors, including recent acquisition, restructuring or divestiture activity or to refresh the fair values, the Company performs a quantitative, "step one," goodwill impairment analysis. In addition, the Company may test goodwill in between annual test dates if an event
78
NOTES TO CONSOLIDATED FINANCIAL STATEMENTS — (Continued)
occurs or circumstances change that could more-likely-than-not reduce the fair value of a reporting unit below its carrying value.
During the fourth quarter of 2019, the Company performed an analysis on each reporting unit. Based on the factors above, the Company elected to perform quantitative, "step one," goodwill impairment analyses, on three reporting units. This requires the Company to make significant assumptions and estimates about the extent and timing of future cash flows, discount rates and growth rates. The basis of this goodwill impairment analysis is the Company's annual budget and long-range plan (“LRP”). The annual budget and LRP includes a five-year projection of future cash flows based on actual new products and customer commitments and assumes the last year of the LRP data is a fair indication of the future performance. Because the LRP is estimated over a significant future period of time, those estimates and assumptions are subject to a high degree of uncertainty. Further, the market valuation models and other financial ratios used by the Company require certain assumptions and estimates regarding the applicability of those models to the Company's facts and circumstances.
The Company believes the assumptions and estimates used to determine the estimated fair value are reasonable. Different assumptions could materially affect the estimated fair value. The primary assumptions affecting the Company's December 31, 2019 goodwill quantitative, "step one," impairment review are as follows:
• | Discount rate: the Company used a |
• | Operating income margin: the Company used historical and expected operating income margins, which may vary based on the projections of the reporting unit being evaluated. |
• | Revenue growth rate: the Company used a global automotive market industry growth rate forecast adjusted to estimate its own market participation for product lines. |
In addition to the above primary assumptions, the Company notes the following risks to volume and operating income assumptions that could have an impact on the discounted cash flow models:
• | The automotive industry is cyclical, and the Company's results of operations would be adversely affected by industry downturns. |
• | The Company is dependent on market segments that use our key products and would be affected by decreasing demand in those segments. |
• | The Company is subject to risks related to international operations. |
Based on the assumptions outlined above, the impairment testing conducted in the fourth quarter of 2019 indicated the Company's goodwill assigned to the reporting units that were quantitatively assessed were not impaired and contained fair values substantially higher than the reporting units' carrying values. Additionally, for the reporting units quantitatively assessed, sensitivity analyses were completed indicating that a one percentage point increase in the discount rate, a one percentage point decrease in the operating margin, or a one percentage point decrease in the revenue growth rate assumptions would not result in the carrying value exceeding the fair value.
79
NOTES TO CONSOLIDATED FINANCIAL STATEMENTS — (Continued)
The changes in the carrying amount of goodwill for the years ended December 31, 2019 and 2018 are as follows:
2019 | 2018 | ||||||||||||||
(in millions) | Engine | Drivetrain | Engine | Drivetrain | |||||||||||
Gross goodwill balance, January 1 | $ | $ | $ | $ | |||||||||||
Accumulated impairment losses, January 1 | ( | ) | — | ( | ) | — | |||||||||
Net goodwill balance, January 1 | $ | $ | $ | $ | |||||||||||
Goodwill during the year: | |||||||||||||||
Acquisitions* | |||||||||||||||
Translation adjustment and other | ( | ) | ( | ) | ( | ) | ( | ) | |||||||
Ending balance, December 31 | $ | $ | $ | $ | |||||||||||
________________
* | Acquisitions relate to the Company's 2019 purchase of Rinehart Motion Systems LLC and AM Racing LLC and the 2017 purchase of Sevcon. |
The Company’s other intangible assets, primarily from acquisitions, consist of the following:
December 31, 2019 | December 31, 2018 | ||||||||||||||||||||||
(in millions) | Gross carrying amount | Accumulated amortization | Net carrying amount | Gross carrying amount | Accumulated amortization | Net carrying amount | |||||||||||||||||
Amortized intangible assets: | |||||||||||||||||||||||
Patented and unpatented technology | $ | $ | $ | $ | $ | $ | |||||||||||||||||
Customer relationships | |||||||||||||||||||||||
Miscellaneous | |||||||||||||||||||||||
Total amortized intangible assets | |||||||||||||||||||||||
Unamortized trade names | — | — | |||||||||||||||||||||
Total other intangible assets | $ | $ | $ | $ | $ | $ | |||||||||||||||||
Amortization of other intangible assets was $39 million, $40 million and $40 million for the years ended December 31, 2019, 2018 and 2017, respectively. The estimated useful lives of the Company's amortized intangible assets range from 3 to 20 years. The Company utilizes the straight line method of amortization recognized over the estimated useful lives of the assets. The estimated future annual amortization expense, primarily for acquired intangible assets, is as follows: $39 million in 2020, $38 million in 2021, $37 million in 2022, $31 million in 2023, and $31 million in 2024.
A roll forward of the gross carrying amounts of the Company's other intangible assets is presented below:
(in millions) | 2019 | 2018 | |||||
Beginning balance, January 1 | $ | $ | |||||
Acquisitions* | |||||||
Translation adjustment | ( | ) | ( | ) | |||
Ending balance, December 31 | $ | $ | |||||
________________
* | Acquisitions relate to the Company's 2019 purchase of Rinehart Motion Systems LLC and AM Racing LLC and the 2017 purchase of Sevcon. |
80
NOTES TO CONSOLIDATED FINANCIAL STATEMENTS — (Continued)
A roll forward of the accumulated amortization associated with the Company's other intangible assets is presented below:
(in millions) | 2019 | 2018 | |||||
Beginning balance, January 1 | $ | $ | |||||
Amortization | |||||||
Translation adjustment | ( | ) | ( | ) | |||
Ending balance, December 31 | $ | $ | |||||
NOTE 8 | PRODUCT WARRANTY |
The changes in the carrying amount of the Company’s total product warranty liability for the years ended December 31, 2019 and 2018 were as follows:
(in millions) | 2019 | 2018 | |||||
Beginning balance, January 1 | $ | $ | |||||
Provisions for current period sales | |||||||
Adjustments of prior estimates | |||||||
Payments | ( | ) | ( | ) | |||
Translation adjustment | ( | ) | ( | ) | |||
Ending balance, December 31 | $ | $ | |||||
The product warranty liability is classified in the Consolidated Balance Sheets as follows:
December 31, | |||||||
(in millions) | 2019 | 2018 | |||||
Accounts payable and accrued expenses | $ | $ | |||||
Other non-current liabilities | |||||||
Total product warranty liability | $ | $ | |||||
81
NOTES TO CONSOLIDATED FINANCIAL STATEMENTS — (Continued)
NOTE 9 | NOTES PAYABLE AND LONG-TERM DEBT |
As of December 31, 2019 and 2018, the Company had short-term and long-term debt outstanding as follows:
December 31, | |||||||
(in millions) | 2019 | 2018 | |||||
Short-term debt | |||||||
Short-term borrowings | $ | $ | |||||
Long-term debt | |||||||
8.00% Senior notes due 10/01/19 ($134 million par value) | — | ||||||
4.625% Senior notes due 09/15/20 ($250 million par value) | |||||||
1.80% Senior notes due 11/7/22 (€500 million par value) | |||||||
3.375% Senior notes due 03/15/25 ($500 million par value) | |||||||
7.125% Senior notes due 02/15/29 ($121 million par value) | |||||||
4.375% Senior notes due 03/15/45 ($500 million par value) | |||||||
Term loan facilities and other | |||||||
Total long-term debt | $ | $ | |||||
Less: current portion | |||||||
Long-term debt, net of current portion | $ | $ | |||||
In July 2016, the Company terminated interest rate swaps which had the effect of converting $384 million of fixed rate notes to variable rates. The gain on the termination was recorded as an increase to the notes and is being amortized as a reduction to interest expense over the remaining terms of the notes. The unamortized gain related to these swap terminations was $1 million and $2 million as of December 31, 2019 and December 31, 2018, respectively, on the 4.625 % notes.
The Company may utilize uncommitted lines of credit for short-term working capital requirements. As of December 31, 2019 and 2018, the Company had $34 million and $33 million, respectively, in borrowings under these facilities, which are reported in Notes payable and short-term debt on the Consolidated Balance Sheets.
The weighted average interest rate on short-term borrowings outstanding as of December 31, 2019 and 2018 was 2.5 % and 4.3 %, respectively. The weighted average interest rate on all borrowings outstanding, including the effects of outstanding swaps, as of December 31, 2019 and 2018 was 2.8 % and 3.4 %, respectively.
Annual principal payments required as of December 31, 2019 are as follows:
(in millions) | |||
2020 | $ | ||
2021 | |||
2022 | |||
2023 | |||
2024 | |||
After 2024 | |||
Total payments | $ | ||
Less: unamortized discounts | |||
Total | $ | ||
82
NOTES TO CONSOLIDATED FINANCIAL STATEMENTS — (Continued)
The Company's long-term debt includes various covenants, none of which are expected to restrict future operations.
The Company has a $1.2 billion multi-currency revolving credit facility, which includes a feature that allows the Company's facility to be increased to $1.5 billion with bank approval. The facility provides for borrowings through June 29, 2022. The Company has one key financial covenant as part of the credit agreement which is a debt to EBITDA ("Earnings Before Interest, Taxes, Depreciation and Amortization") ratio. The Company was in compliance with the financial covenant at December 31, 2019. At December 31, 2019 and December 31, 2018, the Company had no outstanding borrowings under this facility.
The Company's commercial paper program allows the Company to issue short-term, unsecured commercial paper notes up to a maximum aggregate principal amount outstanding of $1.2 billion. Under this program, the Company may issue notes from time to time and use the proceeds for general corporate purposes. The Company had no outstanding borrowings under this program as of December 31, 2019 and December 31, 2018.
The total current combined borrowing capacity under the multi-currency revolving credit facility and commercial paper program cannot exceed $1.2 billion.
As of December 31, 2019 and 2018, the estimated fair values of the Company's senior unsecured notes totaled $2,025 million and $2,058 million, respectively. The estimated fair values were $106 million higher than carrying value at December 31, 2019 and $8 million less than their carrying value at December 31, 2018. Fair market values of the senior unsecured notes are developed using observable values for similar debt instruments, which are considered Level 2 inputs as defined by ASC Topic 820. The carrying values of the Company's multi-currency revolving credit facility and commercial paper program approximate fair value. The fair value estimates do not necessarily reflect the values the Company could realize in the current markets.
The Company had outstanding letters of credit of $28 million and $43 million at December 31, 2019 and 2018, respectively. The letters of credit typically act as guarantees of payment to certain third parties in accordance with specified terms and conditions.
NOTE 10 FAIR VALUE MEASUREMENTS
ASC Topic 820 emphasizes that fair value is a market-based measurement, not an entity-specific measurement. Therefore, a fair value measurement should be determined based on assumptions that market participants would use in pricing an asset or liability. As a basis for considering market participant assumptions in fair value measurements, ASC Topic 820 establishes a fair value hierarchy, which prioritizes the inputs used in measuring fair values as follows:
Level 1: | Observable inputs such as quoted prices for identical assets or liabilities in active markets; |
Level 2: | Inputs, other than quoted prices in active markets, that are observable either directly or indirectly; and |
Level 3: | Unobservable inputs in which there is little or no market data, which require the reporting entity to develop its own assumptions. |
Assets and liabilities measured at fair value are based on one or more of the following three valuation techniques noted in ASC Topic 820:
A. | Market approach: Prices and other relevant information generated by market transactions involving identical or comparable assets, liabilities or a group of assets or liabilities, such as a business. |
83
NOTES TO CONSOLIDATED FINANCIAL STATEMENTS — (Continued)
B. | Cost approach: Amount that would be required to replace the service capacity of an asset (replacement cost). |
C. | Income approach: Techniques to convert future amounts to a single present amount based upon market expectations (including present value techniques, option-pricing and excess earnings models). |
The following tables classify assets and liabilities measured at fair value on a recurring basis as of December 31, 2019 and 2018:
Basis of fair value measurements | |||||||||||||||||
Balance at December 31, 2019 | Quoted prices in active markets for identical items (Level 1) | Significant other observable inputs (Level 2) | Significant unobservable inputs (Level 3) | Valuation technique | |||||||||||||
(in millions) | |||||||||||||||||
Assets: | |||||||||||||||||
Net investment hedge contracts | $ | $ | $ | $ | A | ||||||||||||
Liabilities: | |||||||||||||||||
Foreign currency contracts | $ | $ | — | $ | $ | — | A | ||||||||||
Net investment hedge contracts | $ | $ | $ | $ | A | ||||||||||||
Basis of fair value measurements | |||||||||||||||||
(in millions) | Balance at December 31, 2018 | Quoted prices in active markets for identical items (Level 1) | Significant other observable inputs (Level 2) | Significant unobservable inputs (Level 3) | Valuation technique | ||||||||||||
Assets: | |||||||||||||||||
Foreign currency contracts | $ | $ | — | $ | $ | — | A | ||||||||||
Other long-term receivables (insurance settlement agreement note receivable) | $ | $ | — | $ | $ | — | C | ||||||||||
Net investment hedge contracts | $ | $ | $ | $ | A | ||||||||||||
Liabilities: | |||||||||||||||||
Foreign currency contracts | $ | $ | — | $ | $ | — | A | ||||||||||
The following tables classify the Company's defined benefit plan assets measured at fair value on a recurring basis as of December 31, 2019 and 2018:
Basis of fair value measurements | |||||||||||||||||||||
(in millions) | Balance at December 31, 2019 | Quoted prices in active markets for identical items (Level 1) | Significant other observable inputs (Level 2) | Significant unobservable inputs (Level 3) (a) | Valuation technique | Assets measured at NAV (b) | |||||||||||||||
U.S. Plans: | |||||||||||||||||||||
Fixed income securities | $ | $ | — | $ | — | $ | — | — | |||||||||||||
Equity securities | — | — | A | ||||||||||||||||||
Real estate and other | — | — | A | ||||||||||||||||||
$ | $ | $ | — | $ | — | $ | |||||||||||||||
Non-U.S. Plans: | |||||||||||||||||||||
Fixed income securities | $ | $ | — | $ | $ | — | — | ||||||||||||||
Equity securities | — | — | A | ||||||||||||||||||
Insurance contract and other | — | — | C | ||||||||||||||||||
$ | $ | $ | — | $ | $ | ||||||||||||||||
84
NOTES TO CONSOLIDATED FINANCIAL STATEMENTS — (Continued)
Basis of fair value measurements | |||||||||||||||||||||
(in millions) | Balance at December 31, 2018 | Quoted prices in active markets for identical items (Level 1) | Significant other observable inputs (Level 2) | Significant unobservable inputs (Level 3) | Valuation technique | Assets measured at NAV (b) | |||||||||||||||
U.S. Plans: | |||||||||||||||||||||
Fixed income securities | $ | $ | $ | — | $ | — | A | ||||||||||||||
Equity securities | — | — | A | ||||||||||||||||||
Real estate and other | — | — | A | ||||||||||||||||||
$ | $ | $ | — | $ | — | $ | |||||||||||||||
Non-U.S. Plans: | |||||||||||||||||||||
Fixed income securities | $ | $ | — | $ | $ | — | — | ||||||||||||||
Equity securities | — | — | A | ||||||||||||||||||
Other | — | — | — | — | |||||||||||||||||
$ | $ | $ | — | $ | — | $ | |||||||||||||||
________________
(a) | In 2019, the BW Plan, a defined benefit plan in the United Kingdom, purchased an insurance contract that guarantees payment of specified pension liabilities. The Company measures the fair value of the insurance asset by projecting expected future cash flows from the contract and discounting them to present value based on current market rates, including an assessment for non-performance risk of the insurance company. The assumptions used to project expected future cash flows are based on actuarial estimates and are unobservable; therefore, the contract is categorized within Level 3 of the hierarchy. |
(b) | Certain assets that are measured at fair value using the NAV per share (or its equivalent) practical expedient have not been classified in the fair value hierarchy. These amounts represent investments in commingled and managed funds which have underlying assets in fixed income securities, equity securities, and other assets. |
The reconciliation of Level 3 defined benefit plans assets was as follows:
Fair Value Measurements | ||||
(in millions) | Using Significant Unobservable Inputs (Level 3) | |||
Balance at December 31, 2018 | $ | |||
Purchase of insurance contract | ||||
Unrealized gains on assets still held at the reporting date | ||||
Translation adjustment | ||||
Balance at December 31, 2019 | $ | |||
Refer to Note 12, "Retirement Benefit Plans," to the Consolidated Financial Statements for more detail surrounding the defined plan’s asset investment policies and strategies, target allocation percentages and expected return on plan asset assumptions.
NOTE 11 | FINANCIAL INSTRUMENTS |
The Company’s financial instruments include cash and cash equivalents, marketable securities and accounts receivable. Due to the short-term nature of these instruments, their book value approximates their fair value. The Company’s financial instruments may include long-term debt, interest rate and cross-currency swaps, commodity derivative contracts and foreign currency derivative contracts. All derivative contracts are placed with counterparties that have an S&P, or equivalent, investment grade credit rating at the time of the contracts’ placement. At December 31, 2019 and 2018, the Company had no derivative contracts that contained credit-risk-related contingent features.
The Company uses certain commodity derivative contracts to protect against commodity price changes related to forecasted raw material and component purchases. The Company primarily utilizes
85
NOTES TO CONSOLIDATED FINANCIAL STATEMENTS — (Continued)
forward and option contracts, which are designated as cash flow hedges. At December 31, 2019 and December 31, 2018, the following commodity derivative contracts were outstanding.
Commodity derivative contracts | ||||||||||
Volume hedged | Volume hedged | |||||||||
Commodity | December 31, 2019 | December 31, 2018 | Units of measure | Duration | ||||||
Copper | Metric Tons | Dec - 20 | ||||||||
The Company manages its interest rate risk by balancing its exposure to fixed and variable rates while attempting to optimize its interest costs. The Company selectively uses interest rate swaps to reduce market value risk associated with changes in interest rates (fair value hedges). At December 31, 2019 and December 31, 2018, the Company had no outstanding interest rate swaps.
The Company uses foreign currency forward and option contracts to protect against exchange rate movements for forecasted cash flows, including capital expenditures, purchases, operating expenses or sales transactions designated in currencies other than the functional currency of the operating unit. In addition, the Company uses foreign currency forward contracts to hedge exposure associated with our net investment in certain foreign operations (net investment hedges). The Company has also designated its Euro-denominated debt as a net investment hedge of the Company's investment in a European subsidiary. Foreign currency derivative contracts require the Company, at a future date, to either buy or sell foreign currency in exchange for the operating units’ local currency. At December 31, 2019 and December 31, 2018, the following foreign currency derivative contracts were outstanding:
Foreign currency derivatives (in millions) | ||||||||||
Functional currency | Traded currency | Notional in traded currency December 31, 2019 | Notional in traded currency December 31, 2018 | Ending duration | ||||||
Brazilian real | Euro | Mar - 20 | ||||||||
Brazilian real | US dollar | — | Jun - 19 | |||||||
British pound | Euro | — | Mar - 20 | |||||||
British pound | US dollar | — | Mar - 20 | |||||||
Chinese renminbi | US dollar | — | Aug - 20 | |||||||
Euro | British pound | — | Oct - 19 | |||||||
Euro | Japanese yen | — | Dec - 20 | |||||||
Euro | Swedish krona | — | Jun - 19 | |||||||
Euro | US dollar | Dec - 20 | ||||||||
Japanese yen | Chinese renminbi | — | Dec - 19 | |||||||
Japanese yen | Korean won | — | Dec - 19 | |||||||
Japanese yen | US dollar | — | Dec - 19 | |||||||
Korean won | Euro | Dec - 20 | ||||||||
Korean won | Japanese yen | Dec - 20 | ||||||||
Korean won | US dollar | Dec - 20 | ||||||||
Swedish krona | Euro | Jan - 20 | ||||||||
US dollar | Euro | Dec - 20 | ||||||||
US dollar | Mexican peso | — | Dec - 19 | |||||||
The Company selectively uses cross-currency swaps to hedge the foreign currency exposure associated with our net investment in certain foreign operations (net investment hedges). In December 2019, the Company terminated its $250 million cross-currency swap contract originally maturing in September 2020, and executed a $500 million cross-currency swap contract to mature in March 2025, resulting in cash proceeds of $23 million and a deferred gain of $21 million that is expected to remain in accumulated other comprehensive loss. At December 31, 2019 and December 31, 2018, the following cross-currency swap contracts were outstanding:
86
NOTES TO CONSOLIDATED FINANCIAL STATEMENTS — (Continued)
Cross-currency swaps | |||||||||
(in millions) | December 31, 2019 | December 31, 2018 | Ending duration | ||||||
US dollar to Euro: | |||||||||
Fixed receiving notional | $ | $ | Mar - 25 | ||||||
Fixed paying notional | € | € | Mar - 25 | ||||||
US dollar to Japanese yen: | |||||||||
Fixed receiving notional | $ | $ | Feb - 23 | ||||||
Fixed paying notional | ¥ | ¥ | Feb - 23 | ||||||
At December 31, 2019 and 2018, the following amounts were recorded in the Consolidated Balance Sheets as being payable to or receivable from counterparties under ASC Topic 815:
(in millions) | Assets | Liabilities | ||||||||||||||||||
Derivatives designated as hedging instruments Under Topic 815: | Location | December 31, 2019 | December 31, 2018 | Location | December 31, 2019 | December 31, 2018 | ||||||||||||||
Foreign currency | Prepayments and other current assets | $ | $ | Accounts payable and accrued expenses | $ | $ | ||||||||||||||
Net investment hedges | Other non-current assets | $ | $ | Other non-current liabilities | $ | $ | ||||||||||||||
Derivatives not designated as hedging instruments | ||||||||||||||||||||
Foreign currency | Prepayments and other current assets | $ | $ | Accounts payable and accrued expenses | $ | $ | ||||||||||||||
Effectiveness for cash flow hedges is assessed at the inception of the hedging relationship and quarterly, thereafter. Gains and losses arising from these contracts that are included in the assessment of effectiveness are deferred into accumulated other comprehensive income (loss) ("AOCI") and reclassified into income as the underlying operating transactions are recognized. These realized gains or losses offset the hedged transaction and are recorded on the same line in the statement of operations. The initial value of any component excluded from the assessment of effectiveness will be recognized in income using a systematic and rational method over the life of the hedging instrument. Any difference between the change in fair value of the excluded component and amounts recognized in income under that systematic and rational method will be recognized in AOCI.
Effectiveness for net investment hedges is assessed at the inception of the hedging relationship and quarterly, thereafter. Gains and losses arising from these contracts that are included in the assessment of effectiveness are deferred into foreign currency translation adjustments and only released when the subsidiary being hedged is sold or substantially liquidated. The initial value of any component excluded from the assessment of effectiveness will be recognized in income using a systematic and rational method over the life of the hedging instrument. Any difference between the change in fair value of the excluded component and amounts recognized in income under that systematic and rational method will be recognized in AOCI.
87
NOTES TO CONSOLIDATED FINANCIAL STATEMENTS — (Continued)
The table below shows deferred gains (losses) reported in AOCI as well as the amount expected to be reclassified to income in one year or less. The amount expected to be reclassified to income in one year or less assumes no change in the current relationship of the hedged item at December 31, 2019 market rates.
(in millions) | Deferred gain (loss) in AOCI at | Gain (loss) expected to be reclassified to income in one year or less | ||||||||||
Contract Type | December 31, 2019 | December 31, 2018 | ||||||||||
Net investment hedges: | ||||||||||||
Foreign currency | — | |||||||||||
Cross-currency swaps | — | |||||||||||
Foreign currency denominated debt | ( | ) | ( | ) | — | |||||||
Total | $ | $ | ( | ) | $ | |||||||
88
NOTES TO CONSOLIDATED FINANCIAL STATEMENTS — (Continued)
Derivative instruments designated as hedging instruments as defined by ASC Topic 815 held during the period resulted in the following gains and losses recorded in income:
Year Ended December 31, 2019 | ||||||||||||||||
(in millions) | Net sales | Cost of sales | Selling, general and administrative expenses | Other comprehensive income | ||||||||||||
Total amounts of earnings and other comprehensive income line items in which the effects of cash flow hedges are recorded | $ | $ | $ | $ | ( | ) | ||||||||||
Gain (loss) on cash flow hedging relationships: | ||||||||||||||||
Foreign currency | ||||||||||||||||
Gain (loss) recognized in other comprehensive income | $ | ( | ) | |||||||||||||
Gain (loss) reclassified from AOCI to income | $ | ( | ) | $ | $ | $ | — | |||||||||
Year Ended December 31, 2018 | ||||||||||||||||
(in millions) | Net sales | Cost of sales | Selling, general and administrative expenses | Other comprehensive income | ||||||||||||
Total amounts of earnings and other comprehensive income line items in which the effects of cash flow hedges are recorded | $ | $ | $ | $ | ( | ) | ||||||||||
Gain (loss) on cash flow hedging relationships: | ||||||||||||||||
Foreign currency | ||||||||||||||||
Gain (loss) recognized in other comprehensive income | $ | ( | ) | |||||||||||||
Gain (loss) reclassified from AOCI to income | $ | ( | ) | $ | ( | ) | $ | $ | — | |||||||
Year Ended December 31, 2017 | ||||||||||||||||
(in millions) | Net sales | Cost of sales | Selling, general and administrative expenses | Other comprehensive income | ||||||||||||
Total amounts of earnings and other comprehensive income line items in which the effects of cash flow hedges are recorded | $ | $ | $ | $ | ||||||||||||
Gain (loss) on cash flow hedging relationships: | ||||||||||||||||
Foreign currency | ||||||||||||||||
Gain (loss) recognized in other comprehensive income | $ | ( | ) | |||||||||||||
Gain (loss) reclassified from AOCI to income | $ | $ | $ | $ | — | |||||||||||
Commodity | ||||||||||||||||
Gain (loss) recognized in other comprehensive income | $ | — | $ | — | $ | — | $ | |||||||||
Gain (loss) reclassified from AOCI to income | $ | $ | $ | $ | — | |||||||||||
There were no gains and (losses) recorded in income related to components excluded from the assessment of effectiveness for derivative instruments designated as cash flow hedges.
Gains and (losses) on derivative instruments designated as net investment hedges were recognized in other comprehensive income during the periods presented below.
(in millions) | Year Ended December 31, | |||||||||||
Net investment hedges | 2019 | 2018 | 2017 | |||||||||
Foreign currency | $ | $ | $ | ( | ) | |||||||
Cross-currency swaps | $ | $ | $ | |||||||||
Foreign currency denominated debt | $ | $ | $ | ( | ) | |||||||
89
NOTES TO CONSOLIDATED FINANCIAL STATEMENTS — (Continued)
Derivatives designated as net investment hedge instruments as defined by ASC Topic 815 held during the period resulted in the following gains and (losses) recorded in Interest expense and finance charges on components excluded from the assessment of effectiveness:
(in millions) | Year Ended December 31, | |||||||||||
Net investment hedges | 2019 | 2018 | 2017 | |||||||||
Foreign currency | $ | $ | $ | |||||||||
Cross-currency swaps | $ | $ | $ | |||||||||
There were no gains and (losses) recorded in income related to components excluded from the assessment of effectiveness for foreign currency denominated debt designated as net investment hedges. There were no gains and losses reclassified from AOCI for net investment hedges during the periods presented.
Derivatives not designated as hedging instruments are used to hedge remeasurement exposures of monetary assets and liabilities denominated in currencies other than the operating units' functional currency. These derivatives resulted in the following gains and (losses) recorded to income:
(in millions) | Year Ended December 31, | |||||||||||||
Contract Type | Location | 2019 | 2018 | 2017 | ||||||||||
Foreign Currency | Selling, general and administrative expenses | $ | ( | ) | $ | $ | ( | ) | ||||||
NOTE 12 | RETIREMENT BENEFIT PLANS |
The Company sponsors various defined contribution savings plans, primarily in the U.S., that allow employees to contribute a portion of their pre-tax and/or after-tax income in accordance with plan specified guidelines. Under specified conditions, the Company will make contributions to the plans and/or match a percentage of the employee contributions up to certain limits. Total expense related to the defined contribution plans was $37 million, $35 million and $34 million in the years ended December 31, 2019, 2018 and 2017, respectively.
The Company has a number of defined benefit pension plans and other postretirement employee benefit plans covering eligible salaried and hourly employees and their dependents. The defined pension benefits provided are primarily based on (i) years of service and (ii) average compensation or a monthly retirement benefit amount. The Company provides defined benefit pension plans in France, Germany, Ireland, Italy, Japan, Mexico, South Korea, Sweden, U.K. and the U.S. The other postretirement employee benefit plans, which provide medical benefits, are unfunded plans. Our U.S. and U.K. defined benefit plans are frozen and no additional service cost is being accrued. All pension and other postretirement employee benefit plans in the U.S. have been closed to new employees. The measurement date for all plans is December 31.
During the year ended December 31, 2019, the Company settled approximately $50 million of its U.S. pension projected benefit obligation by liquidating approximately $50 million in plan assets through a lump-sum disbursement made to an insurance company. Pursuant to this agreement, the insurance company unconditionally and irrevocably guarantees all future payments to certain participants that were receiving payments from the U.S. pension plan. The insurance company assumes all investment risk associated with the assets that were delivered as part of this transaction. Additionally, during the year ended December 31, 2019, the Company discharged certain U.S. pension plan obligations by making lump-sum payments of $15 million to former employees of the Company. As a result, the Company settled $65 million of projected benefit obligation by liquidating pension plan assets and recorded a non-cash settlement loss of $27 million related to the accelerated recognition of unamortized losses.
90
NOTES TO CONSOLIDATED FINANCIAL STATEMENTS — (Continued)
The following table summarizes the expenses for the Company's defined contribution and defined benefit pension plans and the other postretirement defined employee benefit plans:
Year Ended December 31, | |||||||||||
(in millions) | 2019 | 2018 | 2017 | ||||||||
Defined contribution expense | $ | $ | $ | ||||||||
Defined benefit pension expense | |||||||||||
Other postretirement employee benefit expense | — | — | |||||||||
Total | $ | $ | $ | ||||||||
The following provides a roll forward of the plans’ benefit obligations, plan assets, funded status and recognition in the Consolidated Balance Sheets:
Pension benefits | Other postretirement | ||||||||||||||||||||||
Year Ended December 31, | employee benefits | ||||||||||||||||||||||
2019 | 2018 | Year Ended December 31, | |||||||||||||||||||||
(in millions) | US | Non-US | US | Non-US | 2019 | 2018 | |||||||||||||||||
Change in projected benefit obligation: | |||||||||||||||||||||||
Projected benefit obligation, January 1 | $ | $ | $ | $ | $ | $ | |||||||||||||||||
Service cost | — | — | — | — | |||||||||||||||||||
Interest cost | |||||||||||||||||||||||
Plan amendments | — | — | — | ||||||||||||||||||||
Settlement and curtailment | ( | ) | ( | ) | — | ( | ) | — | — | ||||||||||||||
Actuarial (gain) loss | ( | ) | ( | ) | |||||||||||||||||||
Currency translation | — | ( | ) | — | ( | ) | — | — | |||||||||||||||
Benefits paid | ( | ) | ( | ) | ( | ) | ( | ) | ( | ) | ( | ) | |||||||||||
Projected benefit obligation, December 31 | $ | $ | $ | $ | $ | $ | |||||||||||||||||
Change in plan assets: | |||||||||||||||||||||||
Fair value of plan assets, January 1 | $ | $ | $ | $ | |||||||||||||||||||
Actual return on plan assets | ( | ) | ( | ) | |||||||||||||||||||
Employer contribution | |||||||||||||||||||||||
Settlements | ( | ) | ( | ) | — | ( | ) | ||||||||||||||||
Currency translation | — | — | ( | ) | |||||||||||||||||||
Benefits paid | ( | ) | ( | ) | ( | ) | ( | ) | |||||||||||||||
Fair value of plan assets, December 31 | $ | $ | $ | $ | |||||||||||||||||||
Funded status | $ | ( | ) | $ | ( | ) | $ | ( | ) | $ | ( | ) | $ | ( | ) | $ | ( | ) | |||||
Amounts in the Consolidated Balance Sheets consist of: | |||||||||||||||||||||||
Non-current assets | $ | $ | $ | $ | $ | $ | |||||||||||||||||
Current liabilities | ( | ) | ( | ) | — | ( | ) | ( | ) | ( | ) | ||||||||||||
Non-current liabilities | ( | ) | ( | ) | ( | ) | ( | ) | ( | ) | ( | ) | |||||||||||
Net amount | $ | ( | ) | $ | ( | ) | $ | ( | ) | $ | ( | ) | $ | ( | ) | $ | ( | ) | |||||
Amounts in accumulated other comprehensive loss consist of: | |||||||||||||||||||||||
Net actuarial loss | $ | $ | $ | $ | $ | $ | |||||||||||||||||
Net prior service (credit) cost | ( | ) | ( | ) | ( | ) | ( | ) | |||||||||||||||
Net amount | $ | $ | $ | $ | $ | $ | |||||||||||||||||
Total accumulated benefit obligation for all plans | $ | $ | $ | $ | |||||||||||||||||||
91
NOTES TO CONSOLIDATED FINANCIAL STATEMENTS — (Continued)
The funded status of pension plans with accumulated benefit obligations in excess of plan assets at December 31 is as follows:
December 31, | |||||||
(in millions) | 2019 | 2018 | |||||
Accumulated benefit obligation | $ | ( | ) | $ | ( | ) | |
Plan assets | |||||||
Deficiency | $ | ( | ) | $ | ( | ) | |
Pension deficiency by country: | |||||||
United States | $ | ( | ) | $ | ( | ) | |
Germany | ( | ) | ( | ) | |||
Other | ( | ) | ( | ) | |||
Total pension deficiency | $ | ( | ) | $ | ( | ) | |
The weighted average asset allocations of the Company’s funded pension plans and target allocations by asset category are as follows:
December 31, | Target Allocation | ||||||
2019 | 2018 | ||||||
U.S. Plans: | |||||||
Real estate and other | % | % | 0% - 15% | ||||
Fixed income securities | % | % | 45% - 65% | ||||
Equity securities | % | % | 25% - 45% | ||||
% | % | ||||||
Non-U.S. Plans: | |||||||
Insurance contract, real estate and other | % | % | 0% - 36% | ||||
Fixed income securities | % | % | 29% - 62% | ||||
Equity securities | % | % | 30% - 43% | ||||
% | % | ||||||
The Company's investment strategy is to maintain actual asset weightings within a preset range of target allocations. The Company believes these ranges represent an appropriate risk profile for the planned benefit payments of the plans based on the timing of the estimated benefit payments. In each asset category, separate portfolios are maintained for additional diversification. Investment managers are retained in each asset category to manage each portfolio against its benchmark. Each investment manager has appropriate investment guidelines. In addition, the entire portfolio is evaluated against a relevant peer group. The defined benefit pension plans did not hold any Company securities as investments as of December 31, 2019 and 2018. A portion of pension assets is invested in common and commingled trusts.
The Company expects to contribute a total of $10 million to $20 million into its defined benefit pension plans during 2020. Of the $10 million to $20 million in projected 2020 contributions, $4 million are contractually obligated, while any remaining payments would be discretionary.
Refer to Note 10, "Fair Value Measurements," to the Consolidated Financial Statements for more detail surrounding the fair value of each major category of plan assets, as well as the inputs and valuation techniques used to develop the fair value measurements of the plans' assets at December 31, 2019 and 2018.
92
NOTES TO CONSOLIDATED FINANCIAL STATEMENTS — (Continued)
See the table below for a breakout of net periodic benefit cost between U.S. and non-U.S. pension plans:
Pension benefits | Other postretirement employee benefits | ||||||||||||||||||||||||||||||||||
Year Ended December 31, | |||||||||||||||||||||||||||||||||||
2019 | 2018 | 2017 | Year Ended December 31, | ||||||||||||||||||||||||||||||||
(in millions) | US | Non-US | US | Non-US | US | Non-US | 2019 | 2018 | 2017 | ||||||||||||||||||||||||||
Service cost | $ | — | $ | $ | — | $ | $ | — | $ | $ | — | $ | — | $ | — | ||||||||||||||||||||
Interest cost | |||||||||||||||||||||||||||||||||||
Expected return on plan assets | ( | ) | ( | ) | ( | ) | ( | ) | ( | ) | ( | ) | — | — | — | ||||||||||||||||||||
Settlements, curtailments and other | — | — | — | — | — | ||||||||||||||||||||||||||||||
Amortization of unrecognized prior service (credit) cost | ( | ) | ( | ) | ( | ) | — | ( | ) | ( | ) | ( | ) | ||||||||||||||||||||||
Amortization of unrecognized loss | |||||||||||||||||||||||||||||||||||
Net periodic cost (income) | $ | $ | $ | ( | ) | $ | $ | ( | ) | $ | $ | — | $ | — | $ | ||||||||||||||||||||
The components of net periodic benefit cost other than the service cost component are included in Other postretirement income in the Consolidated Statements of Operations.
The estimated net loss for the defined benefit pension plans that will be amortized from accumulated other comprehensive loss into net periodic benefit cost over the next fiscal year is $14 million. The estimated net loss and prior service credit for the other postretirement employee benefit plans that will be amortized from accumulated other comprehensive loss into net periodic benefit cost over the next fiscal year are $1 million and $3 million, respectively.
The Company's weighted-average assumptions used to determine the benefit obligations for its defined benefit pension and other postretirement employee benefit plans as of December 31, 2019 and 2018 were as follows:
December 31, | |||
(percent) | 2019 | 2018 | |
U.S. pension plans: | |||
Discount rate | |||
Rate of compensation increase | N/A | N/A | |
U.S. other postretirement employee benefit plans: | |||
Discount rate | |||
Rate of compensation increase | N/A | N/A | |
Non-U.S. pension plans: | |||
Discount rate | |||
Rate of compensation increase | |||
93
NOTES TO CONSOLIDATED FINANCIAL STATEMENTS — (Continued)
The Company's weighted-average assumptions used to determine the net periodic benefit cost/(income) for its defined benefit pension and other postretirement employee benefit plans for the years ended December 31, 2019 and 2018 were as follows:
Year Ended December 31, | |||
(percent) | 2019 | 2018 | |
U.S. pension plans: | |||
Discount rate - service cost | |||
Effective interest rate on benefit obligation | |||
Expected long-term rate of return on assets | |||
Average rate of increase in compensation | N/A | N/A | |
U.S. other postretirement plans: | |||
Discount rate - service cost | |||
Effective interest rate on benefit obligation | |||
Expected long-term rate of return on assets | N/A | N/A | |
Average rate of increase in compensation | N/A | N/A | |
Non-U.S. pension plans: | |||
Discount rate - service cost | |||
Effective interest rate on benefit obligation | |||
Expected long-term rate of return on assets | |||
Average rate of increase in compensation | |||
The Company's approach to establishing the discount rate is based upon the market yields of high-quality corporate bonds, with appropriate consideration of each plan's defined benefit payment terms and duration of the liabilities. In determining the discount rate, the Company utilizes a full-yield approach in the estimation of service and interest components by applying the specific spot rates along the yield curve used in the determination of the benefit obligation to the relevant projected cash flows.
The Company determines its expected return on plan asset assumptions by evaluating estimates of future market returns and the plans' asset allocation. The Company also considers the impact of active management of the plans' invested assets.
The estimated future benefit payments for the pension and other postretirement employee benefits are as follows:
Pension benefits | Other postretirement employee benefits | |||||||||||
(in millions) | ||||||||||||
Year | U.S. | Non-U.S. | ||||||||||
2020 | $ | $ | $ | |||||||||
2021 | ||||||||||||
2022 | ||||||||||||
2023 | ||||||||||||
2024 | ||||||||||||
2025-2029 | ||||||||||||
The weighted-average rate of increase in the per capita cost of covered health care benefits is projected to be 6.25 % in 2019 for pre-65 and post-65 participants, decreasing to 5 % by the year 2025. A one-percentage point change in the assumed health care cost trend would have the following effects:
94
NOTES TO CONSOLIDATED FINANCIAL STATEMENTS — (Continued)
One Percentage Point | |||||||
(in millions) | Increase | Decrease | |||||
Effect on other postretirement employee benefit obligation | $ | $ | ( | ) | |||
Effect on total service and interest cost components | $ | — | $ | — | |||
NOTE 13 | STOCK-BASED COMPENSATION |
The Company has granted restricted common stock and restricted stock units (collectively, "restricted stock") and performance share units as long-term incentive awards to employees and non-employee directors under the BorgWarner Inc. 2014 Stock Incentive Plan, as amended ("2014 Plan") and the BorgWarner Inc. 2018 Stock Incentive Plan ("2018 Plan"). The Company's Board of Directors adopted the 2018 Plan as a replacement to the 2014 Plan in February 2018, and the Company's stockholders approved the 2018 Plan at the annual meeting of stockholders on April 25, 2018. After stockholders approved the 2018 Plan, the Company could no longer make grants under the 2014 Plan. The shares that were available for issuance under the 2014 Plan were cancelled upon approval of the 2018 Plan. The 2018 Plan authorizes the issuance of a total of 7 million shares, of which approximately 6 million shares were available for future issuance as of December 31, 2019.
Stock Options A summary of the plans’ shares under option at December 31, 2019, 2018 and 2017 is as follows:
Shares (thousands) | Weighted average exercise price | Weighted average remaining contractual life (in years) | Aggregate intrinsic value (in millions) | |||||||||
Outstanding at January 1, 2017 | $ | $ | ||||||||||
Exercised | ( | ) | $ | $ | ||||||||
Outstanding at December 31, 2017 | — | $ | — | $ | — | |||||||
Exercised | — | $ | — | $ | — | |||||||
Outstanding at December 31, 2018 | — | $ | $ | — | ||||||||
Exercised | — | $ | — | $ | — | |||||||
Outstanding at December 31, 2019 | $ | $ | — | |||||||||
Options exercisable at December 31, 2019 | $ | — | $ | |||||||||
Proceeds from stock option exercises for the years ended December 31, 2019, 2018 and 2017 were as follows:
Year Ended December 31, | |||||||||||
(in millions) | 2019 | 2018 | 2017 | ||||||||
Proceeds from stock options exercised — gross | $ | $ | $ | ||||||||
Tax benefit | — | ||||||||||
Proceeds from stock options exercised, net of tax | $ | $ | — | $ | |||||||
Restricted Stock The value of restricted stock is determined by the market value of the Company’s common stock at the date of grant. In 2019, restricted stock in the amount of 1,058,180 shares and 23,880 shares was granted to employees and non-employee directors, respectively. The value of the awards is recognized as compensation expense ratably over the restriction periods. As of December 31, 2019, there was $37 million of unrecognized compensation expense that will be recognized over a weighted average period of approximately 1.8 years.
95
NOTES TO CONSOLIDATED FINANCIAL STATEMENTS — (Continued)
Restricted stock compensation expense recorded in the Consolidated Statements of Operations is as follows:
Year Ended December 31, | |||||||||||
(in millions, except per share data) | 2019 | 2018 | 2017 | ||||||||
Restricted stock compensation expense | $ | $ | $ | ||||||||
Restricted stock compensation expense, net of tax | $ | $ | $ | ||||||||
A summary of the status of the Company’s nonvested restricted stock for employees and non-employee directors at December 31, 2019, 2018 and 2017 is as follows:
Shares subject to restriction (thousands) | Weighted average grant date fair value | |||||
Nonvested at January 1, 2017 | $ | |||||
Granted | $ | |||||
Vested | ( | ) | $ | |||
Forfeited | ( | ) | $ | |||
Nonvested at December 31, 2017 | $ | |||||
Granted | $ | |||||
Vested | ( | ) | $ | |||
Forfeited | ( | ) | $ | |||
Nonvested at December 31, 2018 | $ | |||||
Granted | $ | |||||
Vested | ( | ) | $ | |||
Forfeited | ( | ) | $ | |||
Nonvested at December 31, 2019 | $ | |||||
Total Shareholder Return Performance Share Units The 2014 and 2018 Plans provide for awarding of performance shares to members of senior management at the end of successive three-year periods based on the Company's performance in terms of total shareholder return relative to a peer group of automotive companies. Based on the Company’s relative ranking within the performance peer group, it is possible for none of the awards to vest or for a range up to 200 % of the target shares to vest.
The Company recognizes compensation expense relating to its performance share plans ratably over the performance period regardless of whether the market conditions are expected to be achieved. Compensation expense associated with the performance share plans is calculated using a lattice model (Monte Carlo simulation). The amounts expensed under the plan and the common stock issuances for the three-year measurement periods ended December 31, 2019, 2018 and 2017 were as follows:
Year Ended December 31, | |||||||||||
(in millions, except share data) | 2019 | 2018 | 2017 | ||||||||
Expense | $ | $ | $ | ||||||||
Number of shares | |||||||||||
96
NOTES TO CONSOLIDATED FINANCIAL STATEMENTS — (Continued)
A summary of the status of the Company's nonvested total shareholder return performance share units at December 31, 2019, 2018 and 2017 is as follows:
Number of shares (thousands) | Weighted average grant date fair value | |||||
Nonvested at January 1, 2017 | $ | |||||
Granted | $ | |||||
Forfeited | ( | ) | $ | |||
Nonvested at December 31, 2017 | $ | |||||
Granted | $ | |||||
Forfeited | ( | ) | $ | |||
Nonvested at December 31, 2018 | $ | |||||
Granted | $ | |||||
Vested | ( | ) | $ | |||
Forfeited | ( | ) | $ | |||
Nonvested at December 31, 2019 | $ | |||||
As of December 31, 2019, there was $7 million of unrecognized compensation expense that will be recognized over a weighted average period of approximately 1.7 years.
Relative Revenue Growth Performance Share Units The 2014 and 2018 Plans provide for awarding of performance shares to reward members of senior management based on the Company's performance in terms of revenue growth relative to the vehicle market over three-year performance periods. The value of this performance share award is determined by the market value of the Company’s common stock at the date of grant. The Company recognizes compensation expense relating to its performance share plans over the performance period based on the number of shares expected to vest at the end of each reporting period. The actual performance of the Company is evaluated quarterly, and the expense is adjusted according to the new projections. The amounts expensed under the plan and common stock issuance for the years ended December 31, 2019, 2018 and 2017 were as follows:
Year Ended December 31, | |||||||||||
(in millions, except share data) | 2019 | 2018 | 2017 | ||||||||
Expense | $ | $ | $ | ||||||||
Number of shares | |||||||||||
97
NOTES TO CONSOLIDATED FINANCIAL STATEMENTS — (Continued)
A summary of the status of the Company’s nonvested relative revenue growth performance shares at December 31, 2019, 2018 and 2017 is as follows:
Number of shares (thousands) | Weighted average grant date fair value | |||||
Nonvested at January 1, 2017 | $ | |||||
Granted | $ | |||||
Vested | ( | ) | $ | |||
Forfeited | ( | ) | $ | |||
Nonvested at December 31, 2017 | $ | |||||
Granted | $ | |||||
Vested | ( | ) | $ | |||
Forfeited | ( | ) | $ | |||
Nonvested at December 31, 2018 | $ | |||||
Granted | $ | |||||
Vested | ( | ) | $ | |||
Forfeited | ( | ) | $ | |||
Nonvested at December 31, 2019 | $ | |||||
Based on the Company’s relative revenue growth in excess of the industry vehicle production, it is possible for none of the awards to vest or for a range up to 200 % of the target shares to vest. As of December 31, 2019, there was $8 million of unrecognized compensation expense that will be recognized over a weighted average period of approximately 1.7 years. The unrecognized amount of compensation expense is based on projected performance as of December 31, 2019.
In 2018, the Company modified the vesting provisions of restricted stock and performance share unit grants made to retiring executive officers to allow certain of the outstanding awards, that otherwise would have been forfeited, to vest upon retirement. This resulted in net restricted stock and performance share unit compensation expense of $2 million and $8 million for the years ended December 31, 2019 and 2018, respectively.
98
NOTES TO CONSOLIDATED FINANCIAL STATEMENTS — (Continued)
NOTE 14 ACCUMULATED OTHER COMPREHENSIVE LOSS
The following table summarizes the activity within accumulated other comprehensive loss during the years ended December 31, 2019, 2018 and 2017:
(in millions) | Foreign currency translation adjustments | Hedge instruments | Defined benefit postretirement plans | Other | Total | |||||||||||||||
Beginning Balance, January 1, 2017 | $ | ( | ) | $ | $ | ( | ) | $ | $ | ( | ) | |||||||||
Comprehensive (loss) income before reclassifications | ( | ) | ( | ) | ||||||||||||||||
Income taxes associated with comprehensive (loss) income before reclassifications | — | ( | ) | — | — | |||||||||||||||
Reclassification from accumulated other comprehensive (loss) income | — | ( | ) | — | ||||||||||||||||
Income taxes reclassified into net earnings | — | ( | ) | — | ( | ) | ||||||||||||||
Ending Balance December 31, 2017 | $ | ( | ) | $ | ( | ) | $ | ( | ) | $ | $ | ( | ) | |||||||
Adoption of accounting standard | — | — | ( | ) | — | ( | ) | |||||||||||||
Comprehensive (loss) income before reclassifications | ( | ) | ( | ) | ( | ) | ( | ) | ( | ) | ||||||||||
Income taxes associated with comprehensive (loss) income before reclassifications | — | — | ||||||||||||||||||
Reclassification from accumulated other comprehensive (loss) income | — | — | ||||||||||||||||||
Income taxes reclassified into net earnings | — | ( | ) | ( | ) | — | ( | ) | ||||||||||||
Ending Balance December 31, 2018 | $ | ( | ) | $ | — | $ | ( | ) | $ | $ | ( | ) | ||||||||
Comprehensive (loss) income before reclassifications | ( | ) | ( | ) | ( | ) | ( | ) | ( | ) | ||||||||||
Income taxes associated with comprehensive (loss) income before reclassifications | ( | ) | — | — | — | |||||||||||||||
Reclassification from accumulated other comprehensive (loss) income | — | — | ||||||||||||||||||
Income taxes reclassified into net earnings | — | — | ( | ) | — | ( | ) | |||||||||||||
Ending Balance December 31, 2019 | $ | ( | ) | $ | — | $ | ( | ) | $ | — | $ | ( | ) | |||||||
NOTE 15 | CONTINGENCIES |
The Company's environmental and product liability contingencies are discussed separately below. In the normal course of business, the Company is also party to various other commercial and legal claims, actions and complaints, including matters involving warranty claims, intellectual property claims, general liability and various other risks. It is not possible to predict with certainty whether or not the Company will ultimately be successful in any of these other commercial and legal matters or, if not, what the impact might be. The Company's management does not expect that an adverse outcome in any of these other commercial and legal claims, actions and complaints will have a material adverse effect on the Company's results of operations, financial position or cash flows, although it could be material to the results of operations in a particular quarter.
Environmental
The Company and certain of its current and former direct and indirect corporate predecessors, subsidiaries and divisions have been identified by the United States Environmental Protection Agency and certain state environmental agencies and private parties as potentially responsible parties (“PRPs”) at various hazardous waste disposal sites under the Comprehensive Environmental Response, Compensation and Liability Act (“Superfund”) and equivalent state laws. The PRPs may currently be liable for the cost of clean-up and other remedial activities at 14 and 28 such sites as of December 31, 2019 and 2018, respectively. Responsibility for clean-up and other remedial activities at a Superfund site is typically shared among PRPs based on an allocation formula.
99
NOTES TO CONSOLIDATED FINANCIAL STATEMENTS — (Continued)
The Company believes that none of these matters, individually or in the aggregate, will have a material adverse effect on its results of operations, financial position or cash flows. Generally, this is because either the estimates of the maximum potential liability at a site are not material or the liability will be shared with other PRPs, although no assurance can be given with respect to the ultimate outcome of any such matter.
The Company has an accrual for environmental liabilities of $3 million and $9 million as of December 31, 2019 and December 31, 2018, respectively. This accrual is based on information available to the Company (which in most cases includes: an estimate of allocation of liability among PRPs; the probability that other PRPs, many of whom are large, solvent public companies, will fully pay the cost apportioned to them; currently available information from PRPs and/or federal or state environmental agencies concerning the scope of contamination and estimated remediation and consulting costs; and remediation alternatives). The decrease in both the number of sites and accrual was primarily the result of divestitures completed during 2019 including Morse TEC and non-core pipes and thermostat product lines. Refer to Note 19, "Recent Transactions," to the Consolidated Financial Statements for more information.
Asbestos-related Liability
Like many other industrial companies that have historically operated in the United States, the Company, or parties that the Company is obligated to indemnify, has been named as one of many defendants in asbestos-related personal injury actions. Morse TEC, a former wholly-owned subsidiary of the Company, was the obligor for the Company's recorded asbestos-related liabilities and the policyholder of the related insurance assets. On October 30, 2019, the Company transferred 100 % of its equity interests to Enstar. As a result of the transaction, the Company removed Morse TEC's asbestos-related liabilities, related insurance assets and associated deferred tax assets from the Consolidated Balance Sheet. Refer to Note 19 "Recent Transactions," to the Consolidated Financial Statements for more information.
The Company’s asbestos-related claims activity during the years ended December 31, 2019 and 2018 is as follows:
2019 | 2018 | ||||
Beginning claims January 1 | |||||
New claims received | |||||
Dismissed claims | ( | ) | ( | ) | |
Settled claims | ( | ) | ( | ) | |
Derecognized claims | ( | ) | |||
Ending claims December 31 | |||||
During the years ended December 31, 2019 and 2018, the Company paid $38 million and $46 million, respectively, in asbestos-related claim resolution costs and associated defense costs. Asbestos-related claim resolution costs and associated defense costs are reflected in the Company's operating cash flows.
Prior to the derecognition of Morse TEC, the Company reviewed its own experience in handling asbestos-related claims and trends affecting asbestos-related claims in the U.S. tort system generally for the purposes of assessing the value of pending asbestos-related claims and the number and value of those that may be asserted in the future, as well as potential recoveries from the Company’s insurance carriers with respect to such claims and defense costs.
100
NOTES TO CONSOLIDATED FINANCIAL STATEMENTS — (Continued)
As part of its review and assessment of asbestos-related claims, the Company utilized a third-party actuary to further assist in the analysis of potential future asbestos-related claim resolution costs and associated defense costs. The actuary’s work utilized data and analysis resulting from the Company’s claim review process, including input from national coordinating counsel and local counsel, and included the development of an estimate of the potential value of asbestos-related claims asserted but not yet resolved as well as the number and potential value of asbestos-related claims not yet asserted. In developing the estimate of liability for potential future claims, the actuary projected a potential number of future claims based on the Company’s historical claim filings and patterns and compared that to anticipated levels of unique plaintiff asbestos-related claims asserted in the U.S. tort system against all defendants. The actuary also utilized assumptions based on the Company’s historical proportion of claims resolved without payment, historical claim resolution costs for those claims that result in a payment, and historical defense costs. The liabilities were estimated by multiplying the pending and projected future claim filings by projected payments rates and average claim resolution amounts and then adding an estimate for defense costs.
The Company determined based on the factors described above, including the analysis and input of the actuary, its best estimate of the aggregate liability both for asbestos-related claims asserted but not yet resolved and potential asbestos-related claims not yet asserted, including estimated defense costs. This liability reflected the actuarial central estimate, which was intended to represent an expected value of the most probable outcome. As of December 31, 2019 and 2018, the Company estimates that its aggregate liability for such claims, including defense costs, is as follows:
(in millions) | 2019 | 2018 | |||||
Beginning asbestos liability as of January 1 | $ | $ | |||||
Actuarial revaluation | |||||||
Claim resolution costs and defense related costs | ( | ) | ( | ) | |||
Derecognized liability | ( | ) | |||||
Ending asbestos liability as of December 31 | $ | $ | |||||
The Company's estimate of asbestos-related claim resolution costs and associated defense costs was not discounted to present value and included an estimate of liability for potential future claims not yet asserted through December 31, 2064 with a runoff through 2074. The Company believed that December 31, 2074 was a reasonable assumption as to the last date on which it was likely to have resolved all asbestos-related claims, based on the nature and useful life of the Company’s products and the likelihood of incidence of asbestos-related disease in the U.S. population generally.
During the year ended December 31, 2018, the Company recorded an increase to its asbestos-related liabilities of $23 million as a result of actuarial valuation changes. This increase was the result of higher future defense costs resulting from recent trends in the ratio of defense costs to claim resolution costs. During the year ended December 31, 2017, the Company, with the assistance of counsel and its third party actuary, reviewed the Company's claims experience against external data sources and concluded no actuarial valuation adjustment to the liability in 2017 was necessary.
The Company’s estimate of the claim resolution costs and associated defense costs for asbestos-related claims asserted but not yet resolved and potential claims not yet asserted was its reasonable best estimate of such costs. Such estimate was subject to numerous uncertainties. The balances recorded for asbestos-related claims were based on the best available information and assumptions that the Company believed to be reasonable, but those assumptions may change over time. The Company concluded that it was reasonably possible that it may incur additional losses through 2074 for asbestos-related claims, in addition to amounts recorded, of up to approximately $100 million as of December 31, 2018.
101
NOTES TO CONSOLIDATED FINANCIAL STATEMENTS — (Continued)
The Company had certain insurance coverage applicable to asbestos-related claims. The rights to this insurance were transferred with Morse TEC upon the sale of its membership interests. Prior to the derecognition, the coverage was the subject of litigation that remained pending at the time of the derecognition.
As of December 31, 2018, the Company estimated that it had $386 million in aggregate insurance coverage available with respect to asbestos-related claims, and their associated defense costs. The Company had recorded this insurance coverage as a long-term receivable for asbestos-related claim resolution costs and associated defense costs that have been incurred, less cash and notes received, and remaining limits as a deferred insurance asset with respect to liabilities recorded for potential future costs for asbestos-related claims. The Company had determined the amount of that estimate by taking into account the remaining limits of the insurance coverage, the number and amounts of potential claims from co-insured parties, potential remaining recoveries from insolvent insurance carriers, the impact of previous insurance settlements, and coverage available from solvent insurance carriers not party to the coverage litigation. The Company’s estimated remaining insurance coverage relating to asbestos-related claims and their associated defense costs was the subject of disputes with its insurance carriers. The Company believed that its insurance receivable was probable of collection when recorded notwithstanding those disputes based on, among other things, the arguments made by the insurance carriers in litigation proceedings and evaluation of those arguments by the Company and its counsel, the case law applicable to the issues in dispute, the rulings to date by the court, the absence of any credible evidence alleged by the insurance carriers that they were not liable to indemnify the Company, and the fact that the Company had recovered a substantial portion of its insurance coverage, $271 million through December 31, 2018, from its insurance carriers under similar policies. However, the resolution of the insurance coverage disputes, and the number and amounts of claims on our insurance from co-insured parties, could have increased or decreased the amount of such insurance coverage available to the Company as compared to the Company’s estimate.
The amounts recorded in the Consolidated Balance Sheets respecting asbestos-related claims are as follows:
December 31, | |||||||
(in millions) | 2019 | 2018 | |||||
Assets: | |||||||
Other long-term asbestos-related insurance receivables | $ | $ | |||||
Deferred asbestos-related insurance asset | |||||||
Total insurance assets | $ | $ | |||||
Liabilities: | |||||||
Accounts payable and accrued expenses | $ | $ | |||||
Other non-current liabilities | |||||||
Total accrued liabilities | $ | $ | |||||
NOTE 16 RESTRUCTURING
The Company has initiated several actions to reduce existing structural costs. The Company recorded $5 million in the Engine segment and $6 million in the Drivetrain segment in the year ended December 31, 2019 related to these actions. Additionally, the Company initiated a voluntary termination
102
NOTES TO CONSOLIDATED FINANCIAL STATEMENTS — (Continued)
program in the Engine segment where approximately 350 employees accepted termination packages and recorded restructuring expense of $37 million in the year ended December 31, 2019.
In 2017, the Company initiated actions within its Engine segment designed to improve future profitability and competitiveness and started exploring strategic options for the non-core product lines. As a continuation of these actions, the Company recorded restructuring expense of $18 million and $54 million in the years ended December 31, 2019 and 2018, respectively, primarily related to professional fees, employee termination benefits and relocation costs. The largest portion of this was a voluntary termination program in the European emissions business where approximately 140 employees accepted the termination packages. As a result, the Company recorded approximately $28 million of employee severance expense during the year ended December 31, 2018. In addition, the Company recorded $6 million in employee termination benefits in other locations in the Engine segment in the year ended December 31, 2018. The Company recorded restructuring expense of $48 million within its emissions business in the year ended December 31, 2017, primarily related to professional fees and negotiated commercial costs associated with business divestiture and manufacturing footprint rationalization activities.
The Company also recorded restructuring expense of $6 million in the year ended December
31, 2019, related to Corporate restructuring activities.
Additionally, the Company recorded restructuring expense of $10 million in the year ended December 31, 2018 in the Drivetrain segment primarily related to manufacturing footprint rationalization activities.
On September 27, 2017, the Company acquired 100 % of the equity interests of Sevcon Inc ("Sevcon"). In connection with this transaction, the Company recorded restructuring expense of $7 million during the year ended December 31, 2017, primarily related to contractually required severance associated with Sevcon executive officers and other employee termination benefits.
Estimates of restructuring expense are based on information available at the time such charges are recorded. Due to the inherent uncertainty involved in estimating restructuring expenses, actual amounts paid for such activities may differ from amounts initially recorded. Accordingly, the Company may record revisions of previous estimates by adjusting previously established accruals.
The Company is evaluating numerous options across its operations and plans to take additional restructuring actions to reduce existing structural costs over the next few years. These actions are expected to result in significant restructuring expense.
The following table displays a rollforward of the severance accruals recorded within the Company's Consolidated Balance Sheets and the related cash flow activity for the years ended December 31, 2019 and 2018:
Severance Accruals | ||||||||||||
(in millions) | Drivetrain | Engine | Total | |||||||||
Balance at January 1, 2018 | $ | $ | $ | |||||||||
Provision | ||||||||||||
Cash payments | ( | ) | ( | ) | ( | ) | ||||||
Balance at December 31, 2018 | ||||||||||||
Provision | ||||||||||||
Cash payments | ( | ) | ( | ) | ( | ) | ||||||
Balance at December 31, 2019 | $ | $ | $ | |||||||||
103
NOTES TO CONSOLIDATED FINANCIAL STATEMENTS — (Continued)
NOTE 17 | LEASES AND COMMITMENTS |
The Company's lease agreements primarily consist of real estate property, such as manufacturing facilities, warehouses, and office buildings, in addition to personal property, such as vehicles, manufacturing and information technology equipment. A significant portion of leases are classified as operating leases, and as of December 31, 2019, finance leases were immaterial.
Generally, the Company’s operating leases have renewal options that extend lease terms an additional 1 to 5 years, and some include options to terminate the agreement or purchase the leased asset. The amortizable life of these assets is the lesser of its useful life or the lease term, including renewal periods reasonably assured of being exercised at lease inception. The Company’s lease arrangements with renewal periods reasonably assured of being exercised at lease inception are immaterial.
For the year ended December 31, 2019, leased assets obtained in exchange for lease obligations were $4 million.
All leases with an initial term of 12 months or less without an option to extend or purchase the underlying asset that the Company is reasonably certain to exercise ("short-term leases") are not recorded on the Consolidated Balance Sheet, and lease expense is recognized on a straight-line basis over the lease term.
The following table presents the operating lease assets and lease liabilities:
(in millions) | December 31, 2019 | ||||
Assets | Location | ||||
Operating leases | Other non-current assets | $ | |||
Total operating leases | $ | ||||
Liabilities | |||||
Operating leases | Accounts payable and accrued expenses | $ | |||
Operating leases | Other non-current liabilities | ||||
Total operating lease liabilities | $ | ||||
The following table presents the maturity of lease liabilities as of December 31, 2019:
(in millions) | Operating leases | |||
2020 | $ | |||
2021 | ||||
2022 | ||||
2023 | ||||
2024 | ||||
After 2024 | ||||
Total (undiscounted) lease payments | $ | |||
Less: Imputed interest | ||||
Present value of lease liabilities | $ | |||
In the year ended December 31, 2019, the Company recorded operating lease costs of $24 million and short-term lease costs of $18 million, primarily in Cost of sales in the Consolidated Statement of
104
NOTES TO CONSOLIDATED FINANCIAL STATEMENTS — (Continued)
Operations. Under the previous lease accounting standard, total rent expense was $42 million and $40 million in the years ended December 31, 2018 and 2017, respectively. The operating cash flows for operating leases were $24 million for the year ended December 31, 2019.
ASC Topic 842 requires that the rate implicit in the lease be used if readily determinable. Generally, implicit rates are not readily determinable in the Company's agreements and the incremental borrowing rate is used for each lease arrangement. The incremental borrowing rates are determined using rates specific to the term of the lease, economic environments where lease activity is concentrated, value of lease portfolio, and assuming full collateralization of the loans. The following table presents the terms and discount rates:
Operating leases | As of December 31, 2019 | |
Weighted-average remaining lease term (years) | ||
Weighted-average discount rate | % | |
NOTE 18 | EARNINGS PER SHARE |
The Company presents both basic and diluted earnings per share of common stock (“EPS”) amounts. Basic EPS is calculated by dividing net earnings attributable to BorgWarner Inc. by the weighted average shares of common stock outstanding during the reporting period. Diluted EPS is calculated by dividing net earnings attributable to BorgWarner Inc. by the weighted average shares of common stock and common equivalent stock outstanding during the reporting period.
The dilutive impact of stock-based compensation is calculated using the treasury stock method. The treasury stock method assumes that the Company uses the assumed proceeds from the exercise of awards to repurchase common stock at the average market price during the period. The assumed proceeds under the treasury stock method include the purchase price that the grantee will pay in the future, and compensation cost for future service that the Company has not yet recognized. Options are only dilutive when the average market price of the underlying common stock exceeds the exercise price of the options. The dilutive effects of performance-based stock awards described in Note 13, "Stock-Based Compensation," to the Consolidated Financial Statements are included in the computation of diluted earnings per share at the level the related performance criteria are met through the respective balance sheet date.
105
NOTES TO CONSOLIDATED FINANCIAL STATEMENTS — (Continued)
The following table reconciles the numerators and denominators used to calculate basic and diluted earnings per share of common stock:
Year Ended December 31, | |||||||||||
(in millions except share and per share amounts) | 2019 | 2018 | 2017 | ||||||||
Basic earnings per share: | |||||||||||
Net earnings attributable to BorgWarner Inc. | $ | $ | $ | ||||||||
Weighted average shares of common stock outstanding | |||||||||||
Basic earnings per share of common stock | $ | $ | $ | ||||||||
Diluted earnings per share: | |||||||||||
Net earnings attributable to BorgWarner Inc. | $ | $ | $ | ||||||||
Weighted average shares of common stock outstanding | |||||||||||
Effect of stock-based compensation | |||||||||||
Weighted average shares of common stock outstanding including dilutive shares | |||||||||||
Diluted earnings per share of common stock | $ | $ | $ | ||||||||
Antidilutive stock-based awards excluded from the calculation of diluted earnings per share | — | ||||||||||
NOTE 19 | RECENT TRANSACTIONS |
BorgWarner Morse TEC LLC
On October 30, 2019, the Company entered into a Membership Interest Purchase Agreement (the "Purchase Agreement") with Enstar. Pursuant to the Purchase Agreement, the Company transferred 100 % of the equity interests of Morse TEC to Enstar. In connection with this transfer, the Company contributed approximately $172 million in cash to Morse TEC. As Morse TEC was the obligor for the Company's asbestos-related liabilities and policyholder of the related insurance assets, the rights and obligations related to these items transferred upon the sale, and pursuant to the Purchase Agreement, Morse TEC indemnifies the Company and its affiliates for asbestos-related liabilities as more specifically described in the Purchase Agreement. This indemnification obligation with respect to Asbestos-Related Liabilities (as such terms are defined in the Purchase Agreement) are not subject to any cap or time limitation. Following the completion of this transfer, the Company has no obligation with respect to previously recorded asbestos-related liabilities. In accordance with ASC Topic 810 this subsidiary was derecognized as the Company ceased to control the entity, and the Company removed the associated assets and liabilities from the Consolidated Balance Sheet, resulting in a pre-tax gain of $177 million. In addition, the Company recorded tax expense as a result of the reversal of the previously recorded deferred tax assets related to the asbestos liabilities of $173 million, resulting in an after-tax gain of $4 million.
106
NOTES TO CONSOLIDATED FINANCIAL STATEMENTS — (Continued)
The following is a summary of the impacts to the Consolidated Balance Sheet:
(in millions) | ||||
Cash and cash equivalents | $ | ( | ) | |
Receivables, net | ( | ) | ||
Investments and other long-term receivables | ( | ) | ||
Other non-current assets | ( | ) | ||
Accounts payable and accrued expenses | ||||
Asbestos-related and environmental liabilities | ||||
Gain on derecognition of subsidiary, net | $ | |||
Romeo Systems, Inc.
In May 2019, the Company invested $50 million in exchange for a 20 % equity interest in Romeo Systems, Inc. ("Romeo"), a technology-leading battery module and pack supplier. The Company accounts for this investment in Series A-1 Preferred Stock of Romeo under the measurement alternative in ASC Topic 321, "Investments - Equity Securities" for equity investments without a readily determinable fair value. Such investments are measured at cost, less any impairment, plus or minus changes resulting from observable price changes in orderly transactions for an identical or similar investment of the same issuer. In September 2019, the Company and Romeo contributed total equity of $10 million and formed a new joint venture, BorgWarner Romeo Power LLC (the "Romeo JV"), in which the Company owns
technology. The Company is the primary beneficiary of the Romeo JV and consolidates the Romeo JV in
its consolidated financial statements.
Rinehart Motion Systems LLC and AM Racing LLC
On January 2, 2019, the Company acquired Rinehart Motion Systems LLC and AM Racing LLC, two
established companies in the specialty electric and hybrid propulsion market, for approximately $15 million, of which $10 million was paid in the first quarter of 2019, and the remaining $5 million will be paid upon satisfaction of certain conditions.
The Company created Cascadia Motion LLC ("Cascadia Motion") to combine assets and operations of these two acquired companies. Based in Oregon, Cascadia Motion specializes in design, development and production of hybrid and electric propulsion solutions for prototype and low-volume production applications. It allows the Company to offer design, development and production of full electric and hybrid propulsion systems for niche and low-volume manufacturing applications.
In connection with the acquisition, the Company recognized intangible assets of $5 million, goodwill of $7 million within the Drivetrain reporting segment, and other assets and liabilities of $2 million to reflect the preliminary fair value of the assets acquired and liabilities assumed. The intangible assets will be amortized over a period of 2 to 15 years. Various valuation techniques were used to determine the fair value of the intangible assets, with the primary techniques being forms of the income approach, which use significant unobservable inputs, or Level 3 inputs, as defined by the fair value hierarchy. Under these valuation approaches, the Company is required to make estimates and assumptions about sales, operating margins, growth rates, royalty rates and discount rates based on budgets, business plans, economic projections, anticipated future cash flows and marketplace data. Due to the nature of the transaction, goodwill is not deductible for tax purposes.
107
NOTES TO CONSOLIDATED FINANCIAL STATEMENTS — (Continued)
Sevcon, Inc.
On September 27, 2017 , the Company acquired 100 % of the equity interests in Sevcon for cash of $186 million. This amount includes $27 million paid to settle outstanding debt and $5 million paid for Sevcon stock-based awards attributable to pre-combination services.
Sevcon is a global provider of electrification technologies, serving customers in the U.S., U.K., France, Germany, Italy, China and the Asia-Pacific region. Sevcon products complement BorgWarner’s power electronics capabilities utilized to provide electrified propulsion solutions. Sevcon's operating results and assets are reported within the Company's Drivetrain reporting segment.
The following table summarizes the aggregated fair value of the assets acquired and liabilities assumed on September 27, 2017, the date of acquisition:
(in millions) | ||||
Receivables, net | $ | |||
Inventories, net | ||||
Other current assets | ||||
Property, plant and equipment, net | ||||
Goodwill | ||||
Other intangible assets | ||||
Deferred tax liabilities | ( | ) | ||
Income taxes payable | ( | ) | ||
Other assets and liabilities | ( | ) | ||
Accounts payable and accrued expenses | ( | ) | ||
Total consideration, net of cash acquired | ||||
Less: Assumed retirement-related liabilities | ||||
Cash paid, net of cash acquired | $ | |||
In connection with the acquisition, the Company capitalized $18 million for customer relationships, $49 million for developed technology and $4 million for the Sevcon trade name. These intangible assets, excluding the indefinite-lived trade name, will be amortized over a period of 7 to 20 years. Various valuation techniques were used to determine the fair value of the intangible assets, with the primary techniques being forms of the income approach, specifically, the relief-from-royalty and excess earnings valuation methods, which use significant unobservable inputs, or Level 3 inputs, as defined by the fair value hierarchy. Under these valuation approaches, the Company is required to make estimates and assumptions about sales, operating margins, growth rates, royalty rates and discount rates based on budgets, business plans, economic projections, anticipated future cash flows and marketplace data. Due to the nature of the transaction, goodwill is not deductible for tax purposes.
In the third quarter of 2018, the Company finalized all purchase accounting adjustments related to the acquisition and recorded fair value adjustments based on new information obtained during the measurement period primarily related to intangible assets. These adjustments have resulted in a decrease in goodwill of $6 million from the Company's initial estimate.
Due to its insignificant size relative to the Company, supplemental pro forma financial information of the combined entity for the current and prior reporting period is not provided.
108
NOTES TO CONSOLIDATED FINANCIAL STATEMENTS — (Continued)
NOTE 20 | ASSETS AND LIABILITIES HELD FOR SALE |
In 2017, the Company started exploring strategic options for non-core emission product lines. In the fourth quarter of 2017, the Company launched an active program to locate a buyer for these non-core pipes and thermostat product lines and initiated all other actions required to complete the plan to sell these non-core product lines. The Company determined that the assets and liabilities of the pipes and thermostat product lines met the held for sale criteria as of December 31, 2017. As a result, the Company recorded an asset impairment expense of $71 million in the fourth quarter of 2017 to adjust the net book value of this business to its fair value less cost to sell. In December 2018, the Company reached an agreement to sell its thermostat product lines for approximately $28 million. As a result, the Company recorded an additional asset impairment expense of $25 million in the year ended December 31, 2018 to adjust the net book value of this business to fair value less costs to sell. All closing conditions were satisfied, and the sale was closed on April 1, 2019. Based on the agreement reached in the fourth quarter of 2019 regarding the finalization of the purchase price adjustments related to the sale of the thermostat product lines, the Company determined that $7 million of additional loss on sale was required during the year ended December 31, 2019. During the year ended December 31, 2019, the assets and liabilities were removed from the Consolidated Balance Sheet. The business did not meet the criteria to be classified as a discontinued operation.
The assets and liabilities classified as held for sale at December 31, 2018 were as follows:
December 31, | |||
(in millions) | 2018 | ||
Receivables, net | $ | ||
Inventories, net | |||
Prepayments and other current assets | |||
Property, plant and equipment, net | |||
Goodwill | |||
Other intangible assets, net | |||
Other assets | |||
Impairment of carrying value | ( | ) | |
Total assets held for sale | $ | ||
Accounts payable and accrued expenses | $ | ||
Other liabilities | |||
Total liabilities held for sale | $ | ||
NOTE 21 | REPORTING SEGMENTS AND RELATED INFORMATION |
The Company's business is comprised of two reporting segments: Engine and Drivetrain. These segments are strategic business groups, which are managed separately as each represents a specific grouping of related automotive components and systems.
The Company allocates resources to each segment based upon the projected after-tax return on invested capital ("ROIC") of its business initiatives. ROIC is comprised of Adjusted EBIT after deducting notional taxes compared to the projected average capital investment required. Adjusted EBIT is comprised of earnings before interest, income taxes and noncontrolling interest (“EBIT") adjusted for restructuring, goodwill impairment charges, affiliates' earnings and other items not reflective of on-going operating income or loss.
109
NOTES TO CONSOLIDATED FINANCIAL STATEMENTS — (Continued)
Adjusted EBIT is the measure of segment income or loss used by the Company. The Company believes Adjusted EBIT is most reflective of the operational profitability or loss of our reporting segments. The following tables show segment information and Adjusted EBIT for the Company's reporting segments:
2019 Segment information | |||||||||||||||||||||||
Net sales | Year-end assets | Depreciation/ amortization | Long-lived asset expenditures (a) | ||||||||||||||||||||
(in millions) | Customers | Inter-segment | Net | ||||||||||||||||||||
Engine | $ | $ | $ | $ | $ | $ | |||||||||||||||||
Drivetrain | |||||||||||||||||||||||
Inter-segment eliminations | — | ( | ) | ( | ) | — | — | — | |||||||||||||||
Total | — | ||||||||||||||||||||||
Corporate (b) | — | — | — | ||||||||||||||||||||
Consolidated | $ | $ | — | $ | $ | $ | $ | ||||||||||||||||
2018 Segment information | |||||||||||||||||||||||
Net sales | Year-end assets | Depreciation/ amortization | Long-lived asset expenditures (a) | ||||||||||||||||||||
(in millions) | Customers | Inter-segment | Net | ||||||||||||||||||||
Engine | $ | $ | $ | $ | $ | $ | |||||||||||||||||
Drivetrain | |||||||||||||||||||||||
Inter-segment eliminations | — | ( | ) | ( | ) | — | — | — | |||||||||||||||
Total | — | ||||||||||||||||||||||
Corporate (b) | — | — | — | ||||||||||||||||||||
Consolidated | $ | $ | — | $ | $ | $ | $ | ||||||||||||||||
2017 Segment information | |||||||||||||||||||||||
Net sales | Year-end assets | Depreciation/ amortization | Long-lived asset expenditures (a) | ||||||||||||||||||||
(in millions) | Customers | Inter-segment | Net | ||||||||||||||||||||
Engine | $ | $ | $ | $ | $ | $ | |||||||||||||||||
Drivetrain | |||||||||||||||||||||||
Inter-segment eliminations | — | ( | ) | ( | ) | — | — | — | |||||||||||||||
Total | — | ||||||||||||||||||||||
Corporate (b) | — | — | — | ||||||||||||||||||||
Consolidated | $ | $ | — | $ | $ | $ | $ | ||||||||||||||||
_______________
(a) Long-lived asset expenditures include capital expenditures and tooling outlays.
(b) Corporate assets include investments and other long-term receivables and deferred income taxes.
110
NOTES TO CONSOLIDATED FINANCIAL STATEMENTS — (Continued)
Adjusted earnings before interest, income taxes and noncontrolling interest ("Adjusted EBIT")
Year Ended December 31, | |||||||||||
(in millions) | 2019 | 2018 | 2017 | ||||||||
Engine | $ | $ | $ | ||||||||
Drivetrain | |||||||||||
Adjusted EBIT | |||||||||||
Gain on derecognition of subsidiary | ( | ) | |||||||||
Restructuring expense | |||||||||||
Unfavorable arbitration loss | |||||||||||
Merger, acquisition and divestiture expense | |||||||||||
Asset impairment and loss on divestiture | |||||||||||
Officer stock awards modification | |||||||||||
Asbestos-related adjustments | |||||||||||
Gain on sale of building | ( | ) | |||||||||
Lease termination settlement | |||||||||||
Other (income) expense | ( | ) | |||||||||
Corporate, including stock-based compensation | |||||||||||
Equity in affiliates' earnings, net of tax | ( | ) | ( | ) | ( | ) | |||||
Interest income | ( | ) | ( | ) | ( | ) | |||||
Interest expense | |||||||||||
Other postretirement expense (income) | ( | ) | ( | ) | |||||||
Earnings before income taxes and noncontrolling interest | |||||||||||
Provision for income taxes | |||||||||||
Net earnings | |||||||||||
Net earnings attributable to the noncontrolling interest, net of tax | |||||||||||
Net earnings attributable to BorgWarner Inc. | $ | $ | $ | ||||||||
111
NOTES TO CONSOLIDATED FINANCIAL STATEMENTS — (Continued)
Geographic Information
During the year ended December 31, 2019, approximately 77 % of the Company's consolidated net sales were outside the United States ("U.S."), attributing sales to the location of production rather than the location of the customer. Outside the U.S., only Germany, China, South Korea, Mexico, Poland and Hungary exceeded 5 % of consolidated net sales during the year ended December 31, 2019. Also, the Company's equity investments are excluded from the definition of long-lived assets, as are goodwill and certain other non-current assets.
Net sales | Long-lived assets | ||||||||||||||||||||||
(in millions) | 2019 | 2018 | 2017 | 2019 | 2018 | 2017 | |||||||||||||||||
United States | $ | $ | $ | $ | $ | $ | |||||||||||||||||
Europe: | |||||||||||||||||||||||
Germany | |||||||||||||||||||||||
Poland | |||||||||||||||||||||||
Hungary | |||||||||||||||||||||||
Other Europe | |||||||||||||||||||||||
Total Europe | |||||||||||||||||||||||
China | |||||||||||||||||||||||
Mexico | |||||||||||||||||||||||
South Korea | |||||||||||||||||||||||
Other foreign | |||||||||||||||||||||||
Total | $ | $ | $ | $ | $ | $ | |||||||||||||||||
Consolidated net sales to Ford (including its subsidiaries) were approximately 15 %, 14 %, and 15 % for the years ended December 31, 2019, 2018 and 2017, respectively, and to Volkswagen (including its subsidiaries) were approximately 11 %, 12 % and 13 % for the years ended December 31, 2019, 2018 and 2017, respectively. Both of the Company's reporting segments had significant sales to Ford and Volkswagen in 2019, 2018 and 2017. Such sales consisted of a variety of products to a variety of customer locations and regions. No other single customer accounted for more than 10 % of consolidated net sales in any of the years presented.
Sales by Product Line
Sales of turbochargers for light vehicles represented approximately 28 %, 27 % and 28 % of total net sales for the years ended December 31, 2019, 2018 and 2017, respectively. The Company currently supplies light vehicle turbochargers to many OEMs including BMW, Daimler, Fiat Chrysler Automobiles, Ford, General Motors, Great Wall, Hyundai, Renault, Volkswagen and Volvo. No other single product line accounted for more than 10 % of consolidated net sales in any of the years presented.
112
NOTES TO CONSOLIDATED FINANCIAL STATEMENTS — (Continued)
NOTE 22 INTERIM FINANCIAL INFORMATION (Unaudited)
The following table presents summary quarterly financial data:
(in millions, except per share amounts) | 2019 | 2018 | |||||||||||||||||||||||||||||||||||||
Quarter ended | Mar-31 | Jun-30 | Sep-30 | Dec-31 | Year | Mar-31 | Jun-30 | Sep-30 | Dec-31 | Year | |||||||||||||||||||||||||||||
Net sales | $ | $ | $ | $ | $ | $ | $ | $ | $ | $ | |||||||||||||||||||||||||||||
Cost of sales | |||||||||||||||||||||||||||||||||||||||
Gross profit | |||||||||||||||||||||||||||||||||||||||
Selling, general and administrative expenses | |||||||||||||||||||||||||||||||||||||||
Other expense (income), net | ( | ) | ( | ) | |||||||||||||||||||||||||||||||||||
Operating income | |||||||||||||||||||||||||||||||||||||||
Equity in affiliates’ earnings, net of tax | ( | ) | ( | ) | ( | ) | ( | ) | ( | ) | ( | ) | ( | ) | ( | ) | ( | ) | ( | ) | |||||||||||||||||||
Interest income | ( | ) | ( | ) | ( | ) | ( | ) | ( | ) | ( | ) | ( | ) | ( | ) | ( | ) | ( | ) | |||||||||||||||||||
Interest expense | |||||||||||||||||||||||||||||||||||||||
Other postretirement expense (income) | ( | ) | ( | ) | ( | ) | ( | ) | ( | ) | ( | ) | |||||||||||||||||||||||||||
Earnings before income taxes and noncontrolling interest | |||||||||||||||||||||||||||||||||||||||
Provision for income taxes | |||||||||||||||||||||||||||||||||||||||
Net earnings | |||||||||||||||||||||||||||||||||||||||
Net earnings attributable to the noncontrolling interest, net of tax | |||||||||||||||||||||||||||||||||||||||
Net earnings attributable to BorgWarner Inc. (a) | $ | $ | $ | $ | $ | $ | $ | $ | $ | $ | |||||||||||||||||||||||||||||
Earnings per share — basic | $ | $ | $ | $ | $ | $ | $ | $ | $ | $ | |||||||||||||||||||||||||||||
Earnings per share — diluted | $ | $ | $ | $ | $ | $ | $ | $ | $ | $ | |||||||||||||||||||||||||||||
_______________
(a) The Company's results were impacted by the following:
• | Quarter ended December 31, 2019: The Company recorded a pre-tax gain on the derecognition of Morse TEC of $ |
• | Quarter ended September 30, 2019: The Company recorded restructuring expense of $ |
• | Quarter ended June 30, 2019: The Company recorded restructuring expense of $ |
113
NOTES TO CONSOLIDATED FINANCIAL STATEMENTS — (Continued)
• | Quarter ended March 31, 2019: The Company recorded restructuring expense of $ |
• | Quarter ended December 31, 2018: The Company recorded an asset impairment expense of $ |
• | Quarter ended September 30, 2018: The Company recorded restructuring expense of $ |
• | Quarter ended June 30, 2018: The Company recorded restructuring expense of $ |
• | Quarter ended March 31, 2018: The Company recorded restructuring expense of $ |
Note 23. Subsequent Event
On January 28, 2020, the Company entered into a definitive agreement to acquire Delphi Technologies PLC (“Delphi Technologies”) in an all-stock transaction valued at approximately $3.3 billion, based on the closing price of BorgWarner stock on January 27, 2020. The transaction, which is expected to close in the second half of 2020, is subject to approval by Delphi Technologies' stockholders, the satisfaction of customary closing conditions and receipt of regulatory approvals.
Under the terms of the agreement, Delphi Technologies stockholders would receive a fixed exchange ratio of 0.4534 shares of BorgWarner common stock for each share of Delphi Technologies stock. Upon closing of the transaction, current BorgWarner stockholders are expected to own approximately 84 % of the combined company, while current Delphi Technologies stockholders are expected to own approximately 16 %.
114
Item 9. Changes in and Disagreements With Accountants on Accounting and Financial Disclosure
Not applicable.
Item 9A. | Controls and Procedures |
Disclosure Controls and Procedures
A control system, no matter how well conceived and operated, can provide only reasonable, not absolute, assurance that the objectives of the control system are met. Further, the design of a control system must reflect the fact that there are resource constraints and the benefits of controls must be considered relative to costs. Because of the inherent limitations in all control systems, no evaluation of controls can provide absolute assurance that all control issues and instances of fraud, if any, within the Company have been detected. Because of the inherent limitations in a cost-effective control system, misstatements due to error or fraud may occur and not be detected. However, our disclosure controls and procedures are designed to provide reasonable assurance of achieving their objectives.
The Company has adopted and maintains disclosure controls and procedures that are designed to provide reasonable assurance that information required to be disclosed in the reports filed or submitted under the Exchange Act, such as this Form 10-K, is collected, recorded, processed, summarized and reported within the time periods specified in the rules and forms of the Securities and Exchange Commission. The Company's disclosure controls and procedures are also designed to ensure that such information is accumulated and communicated to management to allow timely decisions regarding required disclosure. As required under Exchange Act Rule 13a-15, the Company's management, including the Chief Executive Officer and Chief Financial Officer, has conducted an evaluation of the effectiveness of disclosure controls and procedures as of the end of the period covered by this report. Based on that evaluation, the Chief Executive Officer and Chief Financial Officer concluded that the disclosure controls and procedures are effective.
Management's Report on Internal Control Over Financial Reporting
The Company's management is responsible for establishing and maintaining adequate internal control over financial reporting, as defined in Exchange Act Rule 13a-15(f). Management conducted an assessment of the Company's internal control over financial reporting based on the framework and criteria established by the Committee of Sponsoring Organizations of the Treadway Commission in Internal Control - Integrated Framework (2013). Based on the assessment, management concluded that, as of December 31, 2019, the Company's internal control over financial reporting is effective based on those criteria.
PricewaterhouseCoopers LLP, an independent registered public accounting firm, has audited the Company's consolidated financial statements and the effectiveness of internal control over financial reporting as of December 31, 2019 as stated in its report included herein.
Changes in Internal Control over Financial Reporting
There have been no changes in internal control over the financial reporting that occurred during the most recent fiscal quarter that have materially affected, or are reasonably likely to materially affect our internal control over financial reporting.
Item 9B. | Other Information |
Not applicable.
115
PART III
Item 10. | Directors, Executive Officers and Corporate Governance |
Information with respect to directors, executive officers and corporate governance that appears in the Company's proxy statement for its 2020 Annual Meeting of Stockholders under the captions “Election of Directors,” “Information on Nominees for Directors,” “Board Committees,” “Section 16(a) Beneficial Ownership Reporting Compliance,” “Code of Ethics,” and “Compensation Committee Report” is incorporated herein by this reference and made a part of this report.
Code of Ethics
The Company has long maintained a Code of Ethical Conduct, updated from time to time, which is applicable to all directors, officers, and employees of the Company. In addition, the Company has adopted a Code of Ethics for CEO and Senior Financial Officers, which applies to the Company’s CEO, CFO, Treasurer, and Controller. Each of these codes is posted on the Company’s website at www.borgwarner.com. We intend to disclose any amendments to, or waivers from, a provision of our Code of Ethical Conduct or Code of Ethics for CEO and Senior Financial Officers on our website within four business days following the date of any amendment or waiver.
Delinquent Section 16(a) Reports
Section 16(a) of the Securities Exchange Act of 1934 requires the Company’s executive officers, directors, and persons who beneficially own more than 10% of a registered class of the Company’s equity securities, to file with the SEC initial reports of ownership and reports of changes in ownership of the Company’s common stock. Such officers, directors and persons are required by SEC regulation to furnish the Company with copies of all Section 16(a) forms that they file with the SEC.
One Form 4 was filed eight business days late on behalf of each of Directors Lissalde, Michas, Carlson, Cuneo, Hanley, Mascarenas, McKernan, McWhinney, and Sato due to miscommunication of stock grant information. Otherwise, based on information provided to the Company by each director and executive officer, the Company believes all beneficial ownership reports required to be filed in 2019 were timely.
Item 11. | Executive Compensation |
Information with respect to director and executive compensation that will appear in the Company's proxy statement for its 2020 Annual Meeting of Stockholders under the captions “Director Compensation,” “Compensation Committee Interlocks and Insider Participation,” “Compensation Discussion and Analysis,” “Restricted Stock,” “Long-Term Equity Incentives,” and “Change of Control Agreements” is incorporated herein by this reference and made a part of this report.
Item 12. | Security Ownership of Certain Beneficial Owners and Management and Related Stockholder Matters |
Information with respect to security ownership and certain beneficial owners and management and related stockholders matters that will appear in the Company's proxy statement for its 2020 Annual Meeting of Stockholders under the caption “Security Ownership of Certain Beneficial Owners and Management” is incorporated herein by this reference and made a part of this report.
For information regarding the Company's equity compensation plans, see Item 5 “Market for the Registrant's Common Equity, Related Stockholder Matters and Issuer Purchases of Equity Securities” in this Annual Report on Form 10-K.
Item 13. | Certain Relationships and Related Transactions and Director Independence |
116
Information with respect to certain relationships and related transactions and director independence that will appear in the Company's proxy statement for its 2020 Annual Meeting of Stockholders under the caption “Certain Relationships and Related Transactions, and Director Independence” is incorporated herein by this reference and made a part of this report.
Item 14. | Principal Accountant Fees and Services |
Information with respect to principal accountant fees and services that will appear in the Company's proxy statement for its 2020 Annual Meeting of Stockholders under the caption “Fees Paid to PwC” is incorporated herein by this reference and made a part of this report.
PART IV
Item 15. | Exhibits and Financial Statement Schedules |
The information required by this Section (a)(3) of Item 15 is set forth on the Exhibit Index that precedes the Signatures page of this Form 10-K. The information required by this Section (a)(1) of Item 15 is set forth above in Item 8, Financial Statements and Supplementary Data. All financial statement schedules have been omitted, since the required information is not applicable or is not present in amounts sufficient to require submission of the schedule, or because the information required is included in the consolidated financial statements and notes thereto included in this Form 10-K.
Item 16. | Form 10-K Summary |
Not applicable.
117
EXHIBIT INDEX
Exhibit Number | Description | |||
2.1 | ||||
3.1 | ||||
3.2 | ||||
4.1 | ||||
4.2 | ||||
4.3 | ||||
4.4 | ||||
4.5 | ||||
4.6 | ||||
10.1 | ||||
†10.2 | ||||
†10.3 | ||||
A - 1
Exhibit Number | Description | |||
†10.4 | ||||
†10.5 | ||||
†10.6 | ||||
†10.7 | ||||
†10.8 | ||||
†10.9 | ||||
†10.10 | ||||
†10.11 | ||||
†10.12 | ||||
†10.13 | ||||
†10.14 | ||||
†10.15 | ||||
†10.16 | ||||
†10.17 | ||||
A - 2
Exhibit Number | Description | |||
†10.18 | ||||
†10.19 | ||||
†10.20 | ||||
†10.21 | ||||
†10.22 | ||||
†10.23 | ||||
†10.24 | ||||
†10.25 | ||||
†10.26 | ||||
†10.27 | ||||
†10.28 | ||||
†10.29 | ||||
†10.30 | ||||
A - 3
Exhibit Number | Description | |||
†10.31 | ||||
†10.32 | ||||
†10.33 | ||||
†10.34 | ||||
†10.35 | ||||
†10.36 | ||||
†10.37 | ||||
10.38 | ||||
10.39 | ||||
10.40 | ||||
10.41 | ||||
21.1 | ||||
23.1 | ||||
31.1 | ||||
A - 4
Exhibit Number | Description | |||
31.2 | ||||
32.1 | ||||
101.INS | XBRL Instance Document.* | |||
101.SCH | XBRL Taxonomy Extension Schema Document.* | |||
101.CAL | XBRL Taxonomy Extension Calculation Linkbase Document.* | |||
101.LAB | XBRL Taxonomy Extension Label Linkbase Document.* | |||
101.PRE | XBRL Taxonomy Extension Presentation Linkbase Document.* | |||
101.DEF | XBRL Taxonomy Extension Definition Linkbase Document.* | |||
104.1 | Cover Page Interactive Data File (formatted as Inline XBRL and contained in Exhibit 101).* | |||
*Filed herewith. | ||||
† Indicates a management contract or compensatory plan or arrangement. | ||||
A - 5
SIGNATURES
Pursuant to the requirements of Section 13 or 15(d) of the Securities Exchange Act of 1934, the registrant has duly caused this report to be signed on its behalf by the undersigned, thereunto duly authorized.
BORGWARNER INC. | |
By: | /s/ Frederic B. Lissalde |
Frederic B. Lissalde | |
President and Chief Executive Officer | |
Date: February 13, 2020
Pursuant to the requirements of the Securities Exchange Act of 1934, this report has been signed below by the following person on behalf of the registrant and in the capacities indicated on the 13th day of February, 2020.
Signature | Title | |||
/s/ Frederic B. Lissalde | President and Chief Executive Officer | |||
Frederic B. Lissalde | (Principal Executive Officer) and Director | |||
/s/ Kevin A. Nowlan | Executive Vice President and Chief Financial Officer | |||
Kevin A. Nowlan | (Principal Financial Officer) | |||
/s/ Thomas J. McGill | Vice President and Controller | |||
Thomas J. McGill | (Principal Accounting Officer) | |||
/s/ Jan Carlson | ||||
Jan Carlson | Director | |||
/s/ Dennis C. Cuneo | ||||
Dennis C. Cuneo | Director | |||
/s/ Michael S. Hanley | ||||
Michael S. Hanley | Director | |||
/s/ John R. McKernan, Jr. | ||||
John R. McKernan, Jr. | Director | |||
/s/ Deborah D. McWhinney | ||||
Deborah D. McWhinney | Director | |||
/s/ Paul A. Mascarenas | ||||
Paul A. Mascarenas | Director | |||
/s/ Alexis P. Michas | ||||
Alexis P. Michas | Director and Non-Executive Chairman | |||
/s/ Vicki L. Sato | ||||
Vicki L. Sato | Director | |||