United States Securities and Exchange Commission
Washington, D.C. 20549
FORM N-CSR
Certified Shareholder
Report of Registered Management Investment Companies
Investment Company Act file number 811-07736
Janus
Aspen Series
(Exact name of registrant as specified in charter)
151 Detroit Street, Denver,
Colorado 80206
(Address of principal executive offices) (Zip code)
Abigail J. Murray, 151
Detroit Street, Denver, Colorado 80206
(Name and address of agent for service)
Registrant's telephone number, including area code: 303-333-3863
Date of fiscal year end: 12/31
Date of reporting period:
12/31/20
Item 1 - Reports to Shareholders
ANNUAL REPORT December 31, 2020 | |||||
Janus Henderson VIT Balanced Portfolio | |||||
Janus Aspen Series | |||||
HIGHLIGHTS · Portfolio management perspective · Investment strategy behind your portfolio · Portfolio
performance, characteristics | |||||
|

Table of Contents
Janus Henderson VIT Balanced Portfolio
Janus Henderson VIT Balanced Portfolio (unaudited)


PERFORMANCE OVERVIEW
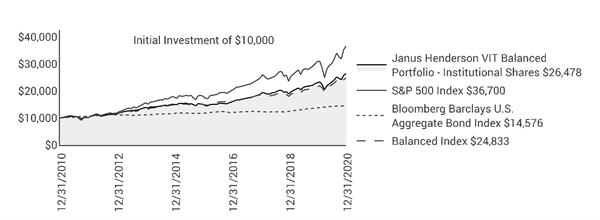
Janus Henderson VIT Balanced Portfolio’s Institutional Shares and Service Shares returned 14.31% and 14.03%, respectively, for the 12-month period ended December 31, 2020, compared with 14.20% for the Balanced Index, an internally calculated benchmark that combines the total returns from the S&P 500® Index (55%) and the Bloomberg Barclays U.S. Aggregate Bond Index (45%). The S&P 500 Index returned 18.40% and the Bloomberg Barclays U.S. Aggregate Bond Index returned 7.51%.
INVESTMENT ENVIRONMENT
Market participants faced a benign backdrop at the start of the period, with a relatively strong U.S. economy, low interest rate environment and progress in U.S.-China trade relations. However, in March, the exogenous shock of the COVID-19 coronavirus ushered in a period of severe economic uncertainty. Swift and aggressive central bank and government stimulus measures were put in place to combat economic shutdowns. The stimulus, coupled with faster-than-expected progress in COVID-19 vaccine developments, contributed to an improving economic outlook and helped equity markets recover at a brisk pace. U.S. stocks finished the year with strong gains, but within the S&P 500 Index, performance across sectors varied significantly. Information technology, consumer discretionary and communication services stocks led the index higher. Energy stocks ended the year with sharp losses as they struggled to recover after the price of crude oil futures went negative intra-period. Real estate and financials also generated negative returns.
The bond market ultimately fared well despite a dramatic intra-period sell-off in credit sectors during the COVID-19 correction. Both investment-grade and high-yield bonds finished the period with positive returns, with investment-grade corporates outperforming high yield. Securitized credit generated strong risk-adjusted returns. Rates fell across the yield curve as the Federal Reserve (Fed) cut policy rates to zero and executed large-scale purchases of U.S. Treasuries. The yield on the 10-year Treasury note ended December at 0.92%, down from 1.92% one year ago.
PERFORMANCE DISCUSSION
The Portfolio’s ability to dynamically adjust its allocation with changing market conditions proved beneficial over the period; we reduced equity and credit exposures as risks increased early in the year and then pivoted to a more optimistic stance as stimulus measures were announced and the economic outlook began to improve. The equity allocation dipped as low as 48% in March but ended the period at approximately 63%.
The equity sleeve performed in line with the S&P 500 Index. Sector positioning contributed to relative results. This included a material underweight to energy – the worst-performing benchmark sector – and an overweight to the strong-performing information technology sector.
The pandemic has accelerated the digital transformation of the global economy, and companies at the forefront of that shift saw outsized benefits during the year. Our position in semiconductor company Lam Research was the largest individual contributor to relative performance. Microsoft and Adobe were also strong performers as many companies pivoted to work-from-home environments and demand for their respective products remained robust.
Holdings in the consumer discretionary, industrials and materials sectors weighed on results. Early in the period, we closed positions in our largest equity detractors for the year: Boeing, LyondellBasell and Norwegian Cruise Line, all of which regained some ground as the period progressed.
Aircraft manufacturing company Boeing was the largest equity detractor. The company’s 737 MAX aircraft remained grounded and we became concerned with the level of debt the company had accumulated. Our belief
Janus Aspen Series | 1 |
Janus Henderson VIT Balanced Portfolio (unaudited)
that the global travel and leisure industries will experience long-term reverberations stemming from the COVID-19 crisis also influenced our decision and prompted us to close our position in Norwegian. In terms of chemical producer LyondellBasell, we grew concerned with the company’s ties to oil prices via ethylene – a primary product line – and exited the position.
The fixed income sleeve outperformed the Bloomberg Barclays U.S. Aggregate Bond Index. As the spread of COVID-19 gathered momentum, but before the bulk of the markets’ collapse, we had sought to preserve capital and increase liquidity by lowering our credit allocations and increasing interest rate duration. Coming out of the COVID-19 correction, we began adding back to our credit exposure by purchasing bonds of higher-quality companies that we thought would be better positioned in the event of an extended downturn. As the Fed’s level of commitment to supporting credit markets solidified and the health care industry began aggressive efforts to combat the virus, we became increasingly comfortable adding additional risk, but remained focused on issuers that we felt could navigate sustained economic uncertainty.
Later in the period, continued support from the Fed and the potential for additional fiscal stimulus, coupled with the likelihood that vaccine developments would advance the pace of reopening the U.S. economy in 2021, led us to rotate some of our investment-grade bond exposure to the higher-rated segments of the high-yield corporate market, which had underperformed investment grade earlier in the period. We also established an allocation to Treasury Inflation-Protected Securities (TIPS); while not concerned with an outsized jump in inflation, we do believe the risk of inflation is now skewed to the upside. Many of these positioning shifts were funded by moving further underweight in agency mortgage-backed securities (MBS), which in our view had lower return opportunities relative to other credit markets.
At period end, the fixed income sleeve remained materially overweight corporate and securitized credit including approximately 15% in high-yield corporate bonds, while maintaining an underweight to both Treasuries and MBS. Both our asset allocation decisions and security selection were positive contributors to relative outperformance during the year. No asset class materially detracted from relative performance, although the sleeve’s positioning in certain cyclical sectors such as independent energy weighed on results.
OUTLOOK
We are pleased to see that the effectiveness of the COVID-19 vaccine has generally exceeded expectations, and we are optimistic that 2021 will bode well for risk assets, particularly equities, as evidenced by our overweight to the asset class. The economic recovery is in its early stages, and we expect economic growth, corporate earnings growth and employment data to continue to improve in 2021. Consumer and corporate balance sheets generally remain healthy, and although widespread vaccine distribution will take time to achieve, we expect pent-up demand to drive strong spending from consumers, and likely companies, during the latter half of 2021.
The Fed’s commitment to an ultra-accommodative policy paints a positive backdrop for equities. Further, with the U.S. elections mostly behind us, company management teams are gaining clarity in terms of the political and regulatory landscape and are beginning to resume share repurchase programs, which should offer another level of price support to stocks. We are also optimistic that constructive geopolitical trade negotiations could provide companies with the confidence to increase capital spending. In the equity sleeve, we remain focused on high-quality growth companies with strong balance sheets and attractive opportunities for future capital deployment. The sleeve remains positioned with considerable exposure to secular trends that continue to gain momentum, including cloud services, Software as a Service and health care innovation.
In the fixed income sleeve, we maintain a positive outlook for credit markets. With government bond yields near historic lows across the developed world, we expect areas that still offer yield to remain in demand. But it is important to acknowledge the relatively less attractive valuations across U.S. Treasuries at year-end and that much of the recovery is already priced into the highest-quality corporate bonds. In our view, it is the more credit sensitive parts of the market, including the lowest tier of investment grade as well as high yield, that still provide opportunities for active managers to identify attractive risk-adjusted securities. We expect front-end Treasury yields to remain anchored in 2021 as a result of the Fed’s commitment to ensuring a sustained economic recovery through accommodative monetary policy. But we remain mindful that the risk is more skewed to higher interest rates across the intermediate and long end of the yield curve, driven by the economic recovery and higher inflation expectations.
2 | DECEMBER 31, 2020 |
Janus Henderson VIT Balanced Portfolio (unaudited)
As always, we will dynamically adjust each sleeve of the Portfolio, as well as the Portfolio’s overall asset allocation, based on market conditions and the investment opportunities our equity and fixed income teams identify through their bottom-up, fundamental research.
Thank you for your investment in Janus Henderson VIT Balanced Portfolio.
Janus Aspen Series | 3 |
Janus Henderson VIT Balanced Portfolio (unaudited)
Portfolio At A Glance
December 31, 2020
|
|
|
|
|
|
|
|
|
|
|
|
|
|
|
|
|
|
|
|
|
|
|
|
|
|
|
|
|
|
| 5 Top Contributors - Equity Sleeve Holdings | 5 Top Detractors - Equity Sleeve Holdings | |||||||
|
| Average
|
| Relative
|
|
| Average |
| Relative
|
| Lam Research Corp | 1.91% |
| 0.76% |
| Boeing Co | 0.61% |
| -1.06% |
| Adobe Inc | 3.09% |
| 0.63% |
| LyondellBasell Industries NV | 0.39% |
| -0.94% |
| Microsoft Corp | 7.83% |
| 0.54% |
| Norwegian Cruise Line Holdings Ltd | 0.14% |
| -0.76% |
| NVIDIA Corp | 1.50% |
| 0.41% |
| US Bancorp | 0.70% |
| -0.71% |
| Deere & Co | 1.15% |
| 0.34% |
| Amazon.com Inc | 3.75% |
| -0.62% |
| 5 Top Contributors - Equity Sleeve Sectors* |
|
|
|
|
|
|
|
| Relative |
| Equity Sleeve | S&P 500 Index |
|
|
| Contribution |
| Average Weight | Average Weight |
| Energy |
| 1.31% |
| 0.39% | 2.80% |
| Information Technology |
| 0.87% |
| 30.96% | 26.47% |
| Financials |
| 0.52% |
| 10.01% | 10.68% |
| Utilities |
| 0.49% |
| 0.27% | 3.18% |
| Health Care |
| 0.31% |
| 15.23% | 14.41% |
|
|
|
|
|
|
|
|
|
|
|
|
|
|
| 5 Top Detractors - Equity Sleeve Sectors* |
|
|
|
|
|
|
|
| Relative |
| Equity Sleeve | S&P 500 Index |
|
|
| Contribution |
| Average Weight | Average Weight |
| Consumer Discretionary |
| -1.28% |
| 15.23% | 10.78% |
| Industrials |
| -1.13% |
| 7.25% | 8.35% |
| Materials |
| -1.01% |
| 0.81% | 2.56% |
| Other** |
| -0.77% |
| 1.65% | 0.00% |
| Consumer Staples |
| -0.15% |
| 8.03% | 7.13% |
| Relative contribution reflects
how the portolio's holdings impacted return relative to the benchmark. Cash and securities not held in
the portfolio are not shown. For equity portfolios, relative contribution compares the performance of
a security in the portfolio to the benchmark's total return, factoring in the difference in weight of
that security in the benchmark. Returns are calculated using daily returns and previous day ending weights
rolled up by ticker, excluding fixed income securities, gross of advisory fees, may exclude certain derivatives
and will differ from actual performance. | |||||
* | Based on sector classification according to the Global Industry Classification Standard (“GICS”) codes, which are the exclusive property and a service mark of MSCI Inc. and Standard & Poor’s. | |||||
** | Not a GICS classified sector. | |||||
4 | DECEMBER 31, 2020 |
Janus Henderson VIT Balanced Portfolio (unaudited)
Portfolio At A Glance
December 31, 2020
5 Largest Equity Holdings - (% of Net Assets) | |
Microsoft Corp | |
Software | 4.8% |
Apple Inc | |
Technology Hardware, Storage & Peripherals | 3.6% |
Amazon.com Inc | |
Internet & Direct Marketing Retail | 3.1% |
Alphabet Inc - Class C | |
Interactive Media & Services | 2.6% |
Mastercard Inc | |
Information Technology Services | 2.5% |
16.6% | |
Asset Allocation - (% of Net Assets) | |||||
Common Stocks | 62.5% | ||||
Corporate Bonds | 19.6% | ||||
Asset-Backed/Commercial Mortgage-Backed Securities | 5.3% | ||||
Mortgage-Backed Securities | 5.3% | ||||
United States Treasury Notes/Bonds | 4.8% | ||||
Investment Companies | 2.7% | ||||
Inflation-Indexed Bonds | 1.1% | ||||
Preferred Stocks | 0.3% | ||||
Bank Loans and Mezzanine Loans | 0.1% | ||||
Other | (1.7)% | ||||
100.0% | |||||
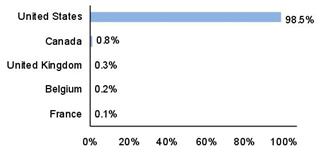
Top Country Allocations - Long Positions - (% of Investment Securities) | |
As of December 31, 2020
| As of December 31, 2019
|

Janus Aspen Series | 5 |
Janus Henderson VIT Balanced Portfolio (unaudited)
Performance
See important disclosures on the next page. |
|
|
|
|
|
|
|
|
| |
|
|
|
|
|
|
|
|
|
|
Average Annual Total Return - for the periods ended December 31, 2020 |
|
| Expense Ratios | ||||||
|
| One
| Five | Ten
| Since |
|
| Total
Annual Fund | |
Institutional Shares |
| 14.31% | 11.81% | 10.23% | 10.18% |
|
| 0.62% | |
Service Shares |
| 14.03% | 11.53% | 9.95% | 10.00% |
|
| 0.87% | |
S&P 500 Index |
| 18.40% | 15.22% | 13.88% | 10.12% |
|
|
| |
Bloomberg Barclays U.S. Aggregate Bond Index |
| 7.51% | 4.44% | 3.84% | 5.23% |
|
|
| |
Balanced Index |
| 14.20% | 10.57% | 9.52% | 8.18% |
|
|
| |
Morningstar Quartile - Institutional Shares |
| 2nd | 1st | 1st | 1st |
|
|
| |
Morningstar Ranking - based on total returns for Allocation - 50% to 70% Equity Funds |
| 218/689 | 40/647 | 27/525 | 10/211 |
|
|
| |
Returns quoted are past performance and do not guarantee future results; current performance may be lower or higher. Investment returns and principal value will vary; there may be a gain or loss when shares are sold. For the most recent month-end performance call 800.668.0434 or visit janushenderson.com/VITperformance.
Performance may be affected by risks that include those associated with foreign and emerging markets, fixed income securities, high-yield and high-risk securities, undervalued, overlooked and smaller capitalization companies, real estate related securities including Real Estate Investment Trusts (REITs), non-diversification, portfolio turnover, derivatives, short sales, initial public offerings (IPOs) and potential conflicts of interest. Each product has different risks. Please see the prospectus for more information about risks, holdings and other details.
Returns do not reflect the deduction of fees, charges or expenses of any insurance product or qualified plan. If applied, returns would have been lower.
Returns include reinvestment of all dividends and distributions and do not reflect the deduction of taxes that a shareholder would pay on Portfolio distributions or redemptions of Portfolio shares. The returns do not include adjustments in accordance with generally accepted accounting principles required at the period end for financial reporting purposes.
Performance for Service Shares prior to December 31, 1999 reflects the performance of Institutional Shares, adjusted to reflect the expenses of Service Shares.
Ranking is for the share class shown only; other classes may have different performance characteristics.
© 2020 Morningstar, Inc. All Rights Reserved.
There is no assurance that the investment process will consistently lead to successful investing.
See Notes to Schedule of Investments and Other Information for index definitions.
Index performance does not reflect the expenses of managing a portfolio as an index is unmanaged and not available for direct investment.
6 | DECEMBER 31, 2020 |
Janus Henderson VIT Balanced Portfolio (unaudited)
Performance
See “Useful Information About Your Portfolio Report.”
Effective February 1, 2020, Jeremiah Buckley, Michael Keough, Marc Pinto and Greg Wilensky are Co-Portfolio Managers of the Portfolio.
Portfolio Manager Marc Pinto has announced his retirement effective April 2, 2021.
*The Portfolio’s inception date – September 13, 1993
‡ As stated in the prospectus. See Financial Highlights for actual expense ratios during the reporting period.
Janus Aspen Series | 7 |
Janus Henderson VIT Balanced Portfolio (unaudited)
Expense Examples
As a shareholder of the Portfolio, you incur two types of costs: (1) transaction costs and (2) ongoing costs, including management fees; 12b-1 distribution and shareholder servicing fees (applicable to Service Shares only); transfer agent fees and expenses payable pursuant to the Transfer Agency Agreement; and other Portfolio expenses. This example is intended to help you understand your ongoing costs (in dollars) of investing in the Portfolio and to compare these costs with the ongoing costs of investing in other mutual funds. To do so, compare this 5% hypothetical example with the 5% hypothetical examples that appear in the shareholder reports of the other funds. The example is based upon an investment of $1,000 invested at the beginning of the period and held for the six-months indicated, unless noted otherwise in the table and footnotes below.
Actual Expenses
The information in the table under the heading “Actual” provides information about actual account values and actual expenses. You may use the information in these columns, together with the amount you invested, to estimate the expenses that you paid over the period. Simply divide your account value by $1,000 (for example, an $8,600 account value divided by $1,000 = 8.6), then multiply the result by the number in the appropriate column for your share class under the heading entitled “Expenses Paid During Period” to estimate the expenses you paid on your account during the period.
Hypothetical Example for Comparison Purposes
The information in the table under the heading “Hypothetical (5% return before expenses)” provides information about hypothetical account values and hypothetical expenses based upon the Portfolio’s actual expense ratio and an assumed rate of return of 5% per year before expenses, which is not the Portfolio’s actual return. The hypothetical account values and expenses may not be used to estimate the actual ending account balance or expenses you paid for the period. You may use this information to compare the ongoing costs of investing in the Portfolio and other funds. To do so, compare this 5% hypothetical example with the 5% hypothetical examples that appear in the shareholder reports of the other funds. Additionally, for an analysis of the fees associated with an investment in either share class or other similar funds, please visit www.finra.org/fundanalyzer.
Please note that the expenses shown in the table are meant to highlight your ongoing costs only and do not reflect any transaction costs, such as any charges at the separate account level or contract level. These fees are fully described in the Portfolio’s prospectuses. Therefore, the hypothetical examples are useful in comparing ongoing costs only, and will not help you determine the relative total costs of owning different funds. In addition, if these transaction costs were included, your costs would have been higher.
|
|
|
|
|
|
|
|
| ||
|
|
| Actual |
| Hypothetical
|
| ||||
| Beginning | Ending | Expenses |
| Beginning | Ending | Expenses | Net Annualized | ||
Institutional Shares | $1,000.00 | $1,144.80 | $3.40 |
| $1,000.00 | $1,021.97 | $3.20 | 0.63% | ||
Service Shares | $1,000.00 | $1,143.40 | $4.74 |
| $1,000.00 | $1,020.71 | $4.47 | 0.88% | ||
† | Expenses Paid During Period are equal to the Net Annualized Expense Ratio multiplied by the average account value over the period, multiplied by 184/366 (to reflect the one-half year period). Expenses in the examples include the effect of applicable fee waivers and/or expense reimbursements, if any. Had such waivers and/or reimbursements not been in effect, your expenses would have been higher. Please refer to the Notes to Financial Statements or the Portfolio’s prospectuses for more information regarding waivers and/or reimbursements. | |||||||||
8 | DECEMBER 31, 2020 |
Janus Henderson VIT Balanced Portfolio
Schedule of Investments
December 31, 2020
Shares
or | Value | ||||||
Asset-Backed/Commercial Mortgage-Backed Securities– 5.3% | |||||||
208 Park Avenue Mortgage Trust 2017-280P, | |||||||
ICE LIBOR USD 1 Month + 0.8800%, 1.0386%, 9/15/34 (144A)‡ | $3,072,117 | $3,073,155 | |||||
Angel Oak Mortgage Trust I LLC 2018-2, | |||||||
ICE LIBOR USD 12 Month + 0.7600%, 3.6740%, 7/27/48 (144A)‡ | 428,415 | 432,707 | |||||
Angel Oak Mortgage Trust I LLC 2019-5, 2.5930%, 10/25/49 (144A)‡ | 2,155,836 | 2,183,131 | |||||
Angel Oak Mortgage Trust I LLC 2019-6, | |||||||
ICE LIBOR USD 12 Month + 0.9500%, 2.6200%, 11/25/59 (144A)‡ | 1,989,320 | 2,014,402 | |||||
Angel Oak Mortgage Trust I LLC 2020-3, | |||||||
ICE LIBOR USD 12 Month + 1.0000%, 2.4100%, 4/25/65 (144A)‡ | 3,139,183 | 3,169,418 | |||||
Applebee's Funding LLC / IHOP Funding LLC, 4.1940%, 6/7/49 (144A) | 3,746,610 | 3,666,797 | |||||
Arbys Funding LLC 2020-1A, 3.2370%, 7/30/50 (144A) | 8,217,405 | 8,363,523 | |||||
Arroyo Mortgage Trust 2018-1, | |||||||
ICE LIBOR USD 12 Month + 0.8500%, 3.7630%, 4/25/48 (144A)‡ | 635,568 | 642,117 | |||||
Bank 2018-BN12 A4, 4.2550%, 5/15/61‡ | 1,122,676 | 1,334,016 | |||||
Bank 2019-BN17, 3.7140%, 4/15/52 | 2,498,288 | 2,911,301 | |||||
Bank 2019-BN18, 3.5840%, 5/15/62 | 4,251,505 | 4,926,190 | |||||
Bank 2019-BN20, 3.0110%, 9/15/62 | 2,044,338 | 2,283,612 | |||||
Bank 2019-BN23, 2.9200%, 12/15/52 | 3,677,640 | 4,088,135 | |||||
Bank 2019-BNK24, 2.9600%, 11/15/62 | 864,000 | 964,250 | |||||
Barclays Comercial Mortgage Securities LLC 2015-SRCH, | |||||||
4.1970%, 8/10/35 (144A) | 2,528,000 | 2,886,887 | |||||
Barclays Comercial Mortgage Securities LLC 2017-DELC, | |||||||
ICE LIBOR USD 1 Month + 0.8500%, 1.0086%, 8/15/36 (144A)‡ | 2,087,000 | 2,063,642 | |||||
Benchmark Mortgage Trust 2020-B16, 2.7320%, 2/15/53 | 2,207,000 | 2,423,701 | |||||
BVRT Financing Trust, 7/10/32‡ | 2,815,000 | 2,815,000 | |||||
BX Commercial Mortgage Trust 2018-IND, | |||||||
ICE LIBOR USD 1 Month + 0.7500%, 0.9090%, 11/15/35 (144A)‡ | 2,252,683 | 2,251,861 | |||||
BX Commercial Mortgage Trust 2019-XL, | |||||||
ICE LIBOR USD 1 Month + 0.9200%, 1.0790%, 10/15/36 (144A)‡ | 4,248,108 | 4,256,277 | |||||
BX Commercial Mortgage Trust 2019-XL, | |||||||
ICE LIBOR USD 1 Month + 1.0800%, 1.2390%, 10/15/36 (144A)‡ | 689,190 | 689,132 | |||||
BX Commercial Mortgage Trust 2020-FOX A, | |||||||
ICE LIBOR USD 1 Month + 1.0000%, 1.1590%, 11/15/32 (144A)‡ | 7,131,000 | 7,142,048 | |||||
BX Commercial Mortgage Trust 2020-FOX B, | |||||||
ICE LIBOR USD 1 Month + 1.3500%, 1.5090%, 11/15/32 (144A)‡ | 1,260,000 | 1,263,076 | |||||
BX Commercial Mortgage Trust 2020-FOX C, | |||||||
ICE LIBOR USD 1 Month + 1.5500%, 1.7090%, 11/15/32 (144A)‡ | 1,149,000 | 1,151,856 | |||||
BX Trust 2019-OC11, 3.2020%, 12/9/41 (144A) | 4,457,000 | 4,891,466 | |||||
BX Trust 2019-OC11, 3.6050%, 12/9/41 (144A) | 2,229,000 | 2,453,650 | |||||
BX Trust 2019-OC11, 3.8560%, 12/9/41 (144A) | 2,229,000 | 2,370,463 | |||||
BX Trust 2019-OC11, 4.0755%, 12/9/41 (144A)‡ | 3,343,000 | 3,487,888 | |||||
BX Trust 2019-OC11, 4.0755%, 12/9/41 (144A)‡ | 851,000 | 849,275 | |||||
BXP Trust 2017-GM, 3.3790%, 6/13/39 (144A) | 1,140,000 | 1,271,422 | |||||
CarMax Auto Owner Trust 2017-3, 2.7200%, 5/15/23 | 2,701,000 | 2,741,069 | |||||
Chase Home Lending Mortgage Trust 2019-ATR2, | |||||||
ICE LIBOR USD 1 Month + 0.9000%, 1.0480%, 7/25/49 (144A)‡ | 379,691 | 379,673 | |||||
Cold Storage Trust 2020-ICE5 A, | |||||||
ICE LIBOR USD 1 Month + 0.9000%, 1.0586%, 11/15/37 (144A)‡ | 6,737,000 | 6,737,726 | |||||
Cold Storage Trust 2020-ICE5 B, | |||||||
ICE LIBOR USD 1 Month + 1.3000%, 1.4586%, 11/15/37 (144A)‡ | 2,995,000 | 2,996,486 | |||||
Cold Storage Trust 2020-ICE5 C, | |||||||
ICE LIBOR USD 1 Month + 1.6500%, 1.8086%, 11/15/37 (144A)‡ | 3,007,000 | 3,008,443 | |||||
COLT Funding LLC 2020-2, | |||||||
ICE LIBOR USD 12 Month + 1.5000%, 1.8530%, 3/25/65 (144A)‡ | 1,819,491 | 1,840,945 | |||||
COLT Funding LLC 2020-3, | |||||||
ICE LIBOR USD 12 Month + 1.2000%, 1.5060%, 4/27/65 (144A)‡ | 1,836,674 | 1,839,867 | |||||
Connecticut Avenue Securities Trust 2014-C04, | |||||||
ICE LIBOR USD 1 Month + 4.9000%, 5.0480%, 11/25/24‡ | 417,197 | 428,185 | |||||
Connecticut Avenue Securities Trust 2016-C03, | |||||||
ICE LIBOR USD 1 Month + 5.9000%, 6.0480%, 10/25/28‡ | 647,907 | 678,666 | |||||
See Notes to Schedule of Investments and Other Information and Notes to Financial Statements. | |
Janus Aspen Series | 9 |
Janus Henderson VIT Balanced Portfolio
Schedule of Investments
December 31, 2020
Shares
or | Value | ||||||
Asset-Backed/Commercial Mortgage-Backed Securities– (continued) | |||||||
Connecticut Avenue Securities Trust 2016-C04, | |||||||
ICE LIBOR USD 1 Month + 4.2500%, 4.3980%, 1/25/29‡ | $1,601,141 | $1,656,807 | |||||
Connecticut Avenue Securities Trust 2016-C06 1M2, | |||||||
ICE LIBOR USD 1 Month + 4.2500%, 4.3980%, 4/25/29‡ | 1,998,312 | 2,048,071 | |||||
Connecticut Avenue Securities Trust 2017-C01, | |||||||
ICE LIBOR USD 1 Month + 3.5500%, 3.6980%, 7/25/29‡ | 2,172,863 | 2,237,535 | |||||
Connecticut Avenue Securities Trust 2018-C05, | |||||||
ICE LIBOR USD 1 Month + 2.3500%, 2.4980%, 1/25/31‡ | 2,695,097 | 2,692,482 | |||||
Connecticut Avenue Securities Trust 2018-R07, | |||||||
ICE LIBOR USD 1 Month + 2.4000%, 2.5480%, 4/25/31 (144A)‡ | 3,283,144 | 3,279,738 | |||||
Connecticut Avenue Securities Trust 2019-R02, | |||||||
ICE LIBOR USD 1 Month + 2.3000%, 2.4480%, 8/25/31 (144A)‡ | 4,295,377 | 4,284,637 | |||||
Connecticut Avenue Securities Trust 2019-R03, | |||||||
ICE LIBOR USD 1 Month + 2.1500%, 2.2980%, 9/25/31 (144A)‡ | 3,042,068 | 3,032,622 | |||||
Connecticut Avenue Securities Trust 2019-R04, | |||||||
ICE LIBOR USD 1 Month + 2.1000%, 2.2480%, 6/25/39 (144A)‡ | 3,815,278 | 3,803,447 | |||||
Connecticut Avenue Securities Trust 2019-R05, | |||||||
ICE LIBOR USD 1 Month + 2.0000%, 2.1480%, 7/25/39 (144A)‡ | 3,349,205 | 3,337,984 | |||||
Connecticut Avenue Securities Trust 2019-R06, | |||||||
ICE LIBOR USD 1 Month + 2.1000%, 2.2480%, 9/25/39 (144A)‡ | 3,711,652 | 3,704,270 | |||||
Connecticut Avenue Securities Trust 2019-R07, | |||||||
ICE LIBOR USD 1 Month + 2.1000%, 2.2480%, 10/25/39 (144A)‡ | 4,647,402 | 4,631,628 | |||||
Connecticut Avenue Securities Trust 2020-R01, | |||||||
ICE LIBOR USD 1 Month + 0.8000%, 0.9480%, 1/25/40 (144A)‡ | 697,973 | 698,188 | |||||
Connecticut Avenue Securities Trust 2020-R01 1M2, | |||||||
ICE LIBOR USD 1 Month + 2.0500%, 2.1980%, 1/25/40 (144A)‡ | 3,578,359 | 3,556,115 | |||||
Connecticut Avenue Securities Trust 2020-R02, | |||||||
ICE LIBOR USD 1 Month + 2.0000%, 2.1480%, 1/25/40 (144A)‡ | 5,273,843 | 5,236,778 | |||||
Cosmopolitan Hotel Trust 2017, | |||||||
ICE LIBOR USD 1 Month + 0.9300%, 1.0886%, 11/15/36 (144A)‡ | 2,618,339 | 2,588,922 | |||||
Credit Acceptance Auto Loan Trust 2018-2, 3.9400%, 7/15/27 (144A) | 1,172,000 | 1,198,357 | |||||
Credit Suisse Commercial Mortgage Trust 2019-ICE4, | |||||||
ICE LIBOR USD 1 Month + 0.9800%, 1.1390%, 5/15/36 (144A)‡ | 7,812,000 | 7,815,009 | |||||
Credit Suisse Commercial Mortgage Trust 2019-ICE4 C, | |||||||
ICE LIBOR USD 1 Month + 1.4300%, 1.5890%, 5/15/36 (144A)‡ | 1,486,000 | 1,484,150 | |||||
Credit Suisse Commercial Mortgage Trust 2020-UNFI, 4.1682%, 12/6/22‡ | 2,312,000 | 2,327,230 | |||||
DB Master Finance LLC 2019-1A A23, 4.3520%, 5/20/49 (144A) | 1,295,600 | 1,408,884 | |||||
DB Master Finance LLC 2019-1A A2I, 3.7870%, 5/20/49 (144A) | 1,620,488 | 1,677,204 | |||||
DB Master Finance LLC 2019-1A A2II, 4.0210%, 5/20/49 (144A) | 1,020,088 | 1,079,661 | |||||
Domino's Pizza Master Issuer LLC, 3.0820%, 7/25/47 (144A) | 716,830 | 725,545 | |||||
Domino's Pizza Master Issuer LLC, 4.1180%, 7/25/47 (144A) | 913,740 | 978,498 | |||||
Domino's Pizza Master Issuer LLC, 4.1160%, 7/25/48 (144A) | 3,357,713 | 3,557,573 | |||||
Domino's Pizza Master Issuer LLC, 4.3280%, 7/25/48 (144A) | 2,020,493 | 2,194,236 | |||||
Domino's Pizza Master Issuer LLC, 3.6680%, 10/25/49 (144A) | 6,453,810 | 6,834,119 | |||||
Drive Auto Receivables Trust 2017-1, 5.1700%, 9/16/24 | 2,997,000 | 3,095,025 | |||||
Drive Auto Receivables Trust 2017-2, 5.2700%, 11/15/24 | 2,613,000 | 2,717,373 | |||||
Drive Auto Receivables Trust 2017-3, 3.5300%, 12/15/23 (144A) | 458,645 | 465,470 | |||||
Drive Auto Receivables Trust 2017-A, 4.1600%, 5/15/24 (144A) | 795,087 | 804,666 | |||||
Drive Auto Receivables Trust 2018-4, 3.6600%, 11/15/24 | 528,531 | 532,918 | |||||
Fannie Mae Connecticut Avenue Securities, | |||||||
ICE LIBOR USD 1 Month + 5.0000%, 5.1480%, 7/25/25‡ | 2,379,267 | 2,405,111 | |||||
Fannie Mae Connecticut Avenue Securities, | |||||||
ICE LIBOR USD 1 Month + 5.7000%, 5.8480%, 4/25/28‡ | 1,354,787 | 1,415,568 | |||||
Fannie Mae Connecticut Avenue Securities, | |||||||
ICE LIBOR USD 1 Month + 2.0000%, 2.1480%, 3/25/31‡ | 3,628,195 | 3,591,324 | |||||
Fannie Mae REMICS, 3.0000%, 5/25/48 | 4,093,032 | 4,394,681 | |||||
Fannie Mae REMICS, 3.0000%, 11/25/49 | 6,230,042 | 6,648,163 | |||||
Freddie Mac Structured Agency Credit Risk Debt Notes 2016-DNA1 M3, | |||||||
ICE LIBOR USD 1 Month + 5.5500%, 5.7001%, 7/25/28‡ | 1,849,773 | 1,926,647 | |||||
Freddie Mac Structured Agency Credit Risk Debt Notes 2019-DNA4 M2, | |||||||
See Notes to Schedule of Investments and Other Information and Notes to Financial Statements. | |
10 | DECEMBER 31, 2020 |
Janus Henderson VIT Balanced Portfolio
Schedule of Investments
December 31, 2020
Shares
or | Value | ||||||
Asset-Backed/Commercial Mortgage-Backed Securities– (continued) | |||||||
ICE LIBOR USD 1 Month + 1.9500%, 2.0980%, 10/25/49 (144A)‡ | $1,179,566 | $1,173,719 | |||||
Freddie Mac Structured Agency Credit Risk Debt Notes 2020-DNA1 M2, | |||||||
ICE LIBOR USD 1 Month + 1.7000%, 1.8480%, 1/25/50 (144A)‡ | 3,914,000 | 3,884,715 | |||||
Freddie Mac Structured Agency Credit Risk Debt Notes 2020-DNA3 M2, | |||||||
ICE LIBOR USD 1 Month + 3.0000%, 3.1480%, 6/25/50 (144A)‡ | 2,150,300 | 2,166,873 | |||||
Freddie Mac Structured Agency Credit Risk Debt Notes 2020-DNA6 M2, | |||||||
US 30 Day Average SOFR + 2.0000%, 2.0773%, 12/25/50 (144A)‡ | 4,640,000 | 4,632,578 | |||||
Freddie Mac Structured Agency Credit Risk Debt Notes 2020-HQA4 M2, | |||||||
ICE LIBOR USD 1 Month + 3.1500%, 3.2980%, 9/25/50 (144A)‡ | 2,441,000 | 2,463,420 | |||||
Freddie Mac Structured Agency Credit Risk Debt Notes 2020-HQA5 M2, | |||||||
US 30 Day Average SOFR + 2.6000%, 2.6817%, 11/25/50 (144A)‡ | 7,495,000 | 7,518,529 | |||||
Great Wolf Trust, | |||||||
ICE LIBOR USD 1 Month + 1.0340%, 1.1930%, 12/15/36 (144A)‡ | 1,067,000 | 1,044,428 | |||||
Great Wolf Trust, | |||||||
ICE LIBOR USD 1 Month + 1.3340%, 1.4930%, 12/15/36 (144A)‡ | 1,195,000 | 1,123,334 | |||||
Great Wolf Trust, | |||||||
ICE LIBOR USD 1 Month + 1.6330%, 1.7920%, 12/15/36 (144A)‡ | 1,332,000 | 1,240,459 | |||||
GS Mortgage Securities Trust 2018-GS10, 4.1550%, 7/10/51‡ | 1,603,823 | 1,913,127 | |||||
GS Mortgage Securities Trust 2018-GS9, 3.9920%, 3/10/51‡ | 2,669,380 | 3,125,404 | |||||
GS Mortgage Securities Trust 2020-GC45, 2.9106%, 2/13/53 | 2,189,000 | 2,434,569 | |||||
GS Mortgage Securities Trust 2020-GC47, 2.3772%, 5/12/53 | 3,112,000 | 3,326,210 | |||||
Jack in the Box Funding LLC 2019-1A A23, 4.9700%, 8/25/49 (144A) | 3,528,338 | 3,792,962 | |||||
Jack in the Box Funding LLC 2019-1A A2I, 3.9820%, 8/25/49 (144A) | 3,528,338 | 3,608,339 | |||||
Jack in the Box Funding LLC 2019-1A A2II, 4.4760%, 8/25/49 (144A) | 4,962,500 | 5,197,449 | |||||
JP Morgan Mortgage Trust 2019-LTV2, | |||||||
ICE LIBOR USD 1 Month + 0.9000%, 1.0480%, 12/25/49 (144A)‡ | 918,674 | 919,629 | |||||
Morgan Stanley Capital I Trust 2016-UB11, 2.7820%, 8/15/49 | 2,782,000 | 3,013,580 | |||||
Morgan Stanley Capital I Trust 2019-H6, 3.4170%, 6/15/52 | 1,423,916 | 1,627,021 | |||||
Morgan Stanley Capital I Trust 2015-UBS8, 3.8090%, 12/15/48 | 2,221,000 | 2,491,190 | |||||
Morgan Stanley Capital I Trust 2018-H3, 4.1770%, 7/15/51 | 2,249,599 | 2,672,293 | |||||
Morgan Stanley Capital I Trust 2018-H4, 4.3100%, 12/15/51 | 3,365,443 | 4,027,211 | |||||
New Residential Mortgage Loan Trust 2018-2, | |||||||
ICE LIBOR USD 6 Month + 0.6800%, 4.5000%, 2/25/58 (144A)‡ | 845,635 | 908,038 | |||||
NRZ Excess Spread Collateralized Notes 2020-PLS1 A, | |||||||
3.8440%, 12/25/25 (144A) | 2,138,000 | 2,137,995 | |||||
Oak Street Investment Grade Net Lease Fund 2020-1A A1, | |||||||
1.8500%, 11/20/50 (144A) | 3,755,534 | 3,754,508 | |||||
Oak Street Investment Grade Net Lease Fund 2020-1A A5, | |||||||
3.3900%, 11/20/50 (144A) | 5,424,000 | 5,416,026 | |||||
OneMain Direct Auto Receivables Trust 2018-1, 3.8500%, 10/14/25 (144A) | 570,000 | 592,011 | |||||
OneMain Direct Auto Receivables Trust 2018-1, 4.4000%, 1/14/28 (144A) | 566,000 | 590,158 | |||||
Planet Fitness Master Issuer LLC 2018-1A, 4.2620%, 9/5/48 (144A) | 2,666,620 | 2,664,837 | |||||
Planet Fitness Master Issuer LLC 2019-1A, 3.8580%, 12/5/49 (144A) | 3,372,930 | 3,281,388 | |||||
Preston Ridge Partners Mortgage Trust 2019-3A, 3.3510%, 7/25/24 (144A)Ç | 1,821,161 | 1,827,402 | |||||
Preston Ridge Partners Mortgage Trust 2019-4A, 3.3510%, 11/25/24 (144A)Ç | 2,388,007 | 2,391,115 | |||||
Preston Ridge Partners Mortgage Trust 2020-1A, 2.9810%, 2/25/25 (144A)Ç | 974,486 | 976,249 | |||||
Preston Ridge Partners Mortgage Trust 2020-2, 3.6710%, 8/25/25 (144A)Ç | 1,984,602 | 1,991,894 | |||||
Preston Ridge Partners Mortgage Trust 2020-3, 2.8570%, 9/25/25 (144A)Ç | 5,861,564 | 5,892,277 | |||||
Preston Ridge Partners Mortgage Trust 2020-4 A1, 2.9510%, 10/25/25 (144A)Ç | 3,651,607 | 3,652,595 | |||||
Preston Ridge Partners Mortgage Trust 2020-5 A1, 3.1040%, 11/25/25 (144A)Ç | 1,921,355 | 1,924,548 | |||||
Santander Drive Auto Receivables Trust 2016-3, 4.2900%, 2/15/24 | 3,056,000 | 3,075,638 | |||||
Santander Drive Auto Receivables Trust 2020-1 A2A, 2.0700%, 1/17/23 | 1,032,455 | 1,037,025 | |||||
Sequoia Mortgage Trust 2013-5, 2.5000%, 5/25/43 (144A)‡ | 1,488,208 | 1,542,307 | |||||
Sequoia Mortgage Trust 2020-2, 3.5000%, 3/25/50 (144A)‡ | 777,094 | 798,394 | |||||
Spruce Hill Mortgage Loan Trust 2020-SH1 A1, | |||||||
ICE LIBOR USD 12 Month + 0.9500%, 2.5210%, 1/28/50 (144A)‡ | 622,136 | 680,678 | |||||
Spruce Hill Mortgage Loan Trust 2020-SH1 A2, | |||||||
ICE LIBOR USD 12 Month + 1.0500%, 2.6240%, 1/28/50 (144A)‡ | 1,542,737 | 1,680,396 | |||||
Spruce Hill Mortgage Loan Trust 2020-SH2, 3.4070%, 6/25/55 (144A)‡ | 5,588,544 | 6,171,385 | |||||
Starwood Mortgage Residential Trust 2020-2, 2.7180%, 4/25/60 (144A)‡ | 1,628,059 | 1,650,255 | |||||
See Notes to Schedule of Investments and Other Information and Notes to Financial Statements. | |
Janus Aspen Series | 11 |
Janus Henderson VIT Balanced Portfolio
Schedule of Investments
December 31, 2020
Shares
or | Value | ||||||
Asset-Backed/Commercial Mortgage-Backed Securities– (continued) | |||||||
Taco Bell Funding LLC, 4.3180%, 11/25/48 (144A) | $2,958,620 | $3,005,409 | |||||
Taco Bell Funding LLC, 4.9400%, 11/25/48 (144A) | 2,178,540 | 2,390,863 | |||||
Towd Point Asset Funding LLC 2019-HE1 A1, | |||||||
ICE LIBOR USD 1 Month + 0.9000%, 1.0480%, 4/25/48 (144A)‡ | 1,145,611 | 1,141,462 | |||||
United Auto Credit Securitization Trust 2019-1 C, 3.1600%, 8/12/24 (144A) | 1,517,082 | 1,524,824 | |||||
Vantage Data Centers LLC 2020-1A A2, 1.6450%, 9/15/45 (144A) | 7,100,000 | 7,107,087 | |||||
Vantage Data Centers LLC 2020-2A A2, 1.9920%, 9/15/45 (144A) | 3,097,000 | 3,101,417 | |||||
VCAT Asset Securitization LLC 2020-NPL1, 3.6710%, 8/25/50 (144A)Ç | 2,089,787 | 2,089,764 | |||||
Wendy's Funding LLC, 3.5730%, 3/15/48 (144A) | 1,133,930 | 1,172,441 | |||||
Wendy's Funding LLC, 3.8840%, 3/15/48 (144A) | 323,980 | 341,735 | |||||
Wendy's Funding LLC, 3.7830%, 6/15/49 (144A) | 2,066,065 | 2,164,379 | |||||
WFRBS Commercial Mortgage Trust 2014-C25, 3.6310%, 11/15/47 | 2,351,000 | 2,600,996 | |||||
Wingstop Funding LLC 2020-1A A2, 2.8410%, 12/5/50 (144A) | 3,624,000 | 3,686,334 | |||||
Total Asset-Backed/Commercial Mortgage-Backed Securities (cost $349,024,329) | 357,398,963 | ||||||
Bank Loans and Mezzanine Loans– 0.1% | |||||||
Consumer Non-Cyclical – 0.1% | |||||||
Elanco Animal Health Inc, ICE LIBOR USD 1 Month + 1.7500%, 1.9048%, 8/1/27‡((cost $9,240,038) | 9,240,038 | 9,173,060 | |||||
Corporate Bonds– 19.6% | |||||||
Banking – 4.1% | |||||||
Banco Santander SA, 2.7490%, 12/3/30 | 4,800,000 | 4,953,914 | |||||
Bank of America Corp, ICE LIBOR USD 3 Month + 1.5120%, 3.7050%, 4/24/28‡ | 9,368,000 | 10,661,044 | |||||
Bank of America Corp, ICE LIBOR USD 3 Month + 1.0700%, 3.9700%, 3/5/29‡ | 3,294,000 | 3,837,466 | |||||
Bank of America Corp, SOFR + 2.1500%, 2.5920%, 4/29/31‡ | 14,103,000 | 15,112,649 | |||||
Bank of America Corp, ICE LIBOR USD 3 Month + 3.1350%, 5.2000%‡,µ | 2,002,000 | 2,087,085 | |||||
Bank of America Corp, ICE LIBOR USD 3 Month + 3.7050%, 6.2500%‡,µ | 5,841,000 | 6,480,955 | |||||
Bank of America Corp, ICE LIBOR USD 3 Month + 3.8980%, 6.1000%‡,µ | 2,051,000 | 2,323,886 | |||||
Bank of America Corp, ICE LIBOR USD 3 Month + 2.6640%, 4.3000%, 1/24/70‡ | 4,443,000 | 4,581,000 | |||||
Bank of New York Mellon Corp, | |||||||
US Treasury Yield Curve Rate 5 Year + 4.3580%, 4.7000%‡,µ | 8,577,000 | 9,458,716 | |||||
BNP Paribas SA, ICE LIBOR USD 3 Month + 2.2350%, 4.7050%, 1/10/25 (144A)‡ | 3,042,000 | 3,380,506 | |||||
BNP Paribas SA, ICE LIBOR USD 3 Month + 1.1110%, 2.8190%, 11/19/25 (144A)‡ | 2,067,000 | 2,208,326 | |||||
BNP Paribas SA, SOFR + 1.5070%, 3.0520%, 1/13/31 (144A)‡ | 5,635,000 | 6,145,824 | |||||
BNP Paribas SA, | |||||||
US Treasury Yield Curve Rate 5 Year + 2.0500%, 2.5880%, 8/12/35 (144A)‡ | 8,887,000 | 9,080,289 | |||||
Citigroup Inc, ICE LIBOR USD 3 Month + 1.5630%, 3.8870%, 1/10/28‡ | 9,899,000 | 11,370,113 | |||||
Citigroup Inc, SOFR + 3.9140%, 4.4120%, 3/31/31‡ | 6,795,000 | 8,233,932 | |||||
Citigroup Inc, ICE LIBOR USD 3 Month + 4.0680%, 5.9500%‡,µ | 3,565,000 | 3,741,821 | |||||
Citigroup Inc, 5.9000%µ | 452,000 | 474,826 | |||||
Citigroup Inc, ICE LIBOR USD 3 Month + 3.4660%, 5.3500%‡,µ | 2,436,000 | 2,536,485 | |||||
Citigroup Inc, ICE LIBOR USD 3 Month + 3.4230%, 6.3000%‡,µ | 555,000 | 601,620 | |||||
Citigroup Inc, ICE LIBOR USD 3 Month + 3.9050%, 5.9500%‡,µ | 2,339,000 | 2,555,357 | |||||
Citigroup Inc, SOFR + 3.8130%, 5.0000%‡,µ | 3,727,000 | 3,873,751 | |||||
Citigroup Inc, SOFR + 3.2340%, 4.7000%‡,µ | 2,444,000 | 2,511,430 | |||||
Citizens Financial Group Inc, 2.6380%, 9/30/32 | 3,680,000 | 3,890,552 | |||||
Credit Agricole SA/London, SOFR + 1.6760%, 1.9070%, 6/16/26 (144A)‡ | 1,778,000 | 1,843,774 | |||||
Credit Suisse Group AG, | |||||||
US Treasury Yield Curve Rate 5 Year + 3.5540%, 4.5000% (144A)‡,µ | 8,369,000 | 8,410,008 | |||||
First Republic Bank/CA, 4.6250%, 2/13/47 | 1,653,000 | 2,178,381 | |||||
Goldman Sachs Group Inc, 3.5000%, 4/1/25 | 10,761,000 | 11,966,456 | |||||
Goldman Sachs Group Inc, ICE LIBOR USD 3 Month + 3.9220%, 4.1279%‡,µ | 9,690,000 | 9,670,426 | |||||
Goldman Sachs Group Inc, ICE LIBOR USD 3 Month + 2.8740%, 5.0000%‡,µ | 739,000 | 746,390 | |||||
Goldman Sachs Group Inc, | |||||||
US Treasury Yield Curve Rate 5 Year + 3.2240%, 4.9500%‡,µ | 1,666,000 | 1,762,495 | |||||
HSBC Holdings PLC, SOFR + 1.5380%, 1.6450%, 4/18/26‡ | 3,742,000 | 3,826,411 | |||||
HSBC Holdings PLC, SOFR + 1.2900%, 1.5890%, 5/24/27‡ | 13,189,000 | 13,408,789 | |||||
HSBC Holdings PLC, SOFR + 1.9470%, 2.3570%, 8/18/31‡ | 2,865,000 | 2,957,335 | |||||
JPMorgan Chase & Co, SOFR + 1.8500%, 2.0830%, 4/22/26‡ | 16,792,000 | 17,730,952 | |||||
See Notes to Schedule of Investments and Other Information and Notes to Financial Statements. | |
12 | DECEMBER 31, 2020 |
Janus Henderson VIT Balanced Portfolio
Schedule of Investments
December 31, 2020
Shares
or | Value | ||||||
Corporate Bonds– (continued) | |||||||
Banking– (continued) | |||||||
JPMorgan Chase & Co, ICE LIBOR USD 3 Month + 1.2450%, 3.9600%, 1/29/27‡ | $8,352,000 | $9,595,025 | |||||
JPMorgan Chase & Co, SOFR + 2.5150%, 2.9560%, 5/13/31‡ | 13,078,000 | 14,336,569 | |||||
JPMorgan Chase & Co, ICE LIBOR USD 3 Month + 2.5800%, 4.6250%‡,µ | 833,000 | 822,466 | |||||
JPMorgan Chase & Co, SOFR + 3.3800%, 5.0000%, 7/31/69‡ | 2,000,000 | 2,104,061 | |||||
JPMorgan Chase & Co, SOFR + 3.1250%, 4.6000%, 1/23/70‡ | 2,111,000 | 2,179,607 | |||||
JPMorgan Chase & Co, SOFR + 2.7450%, 4.0000%, 2/24/70‡ | 1,999,000 | 2,031,484 | |||||
Morgan Stanley, SOFR + 1.9900%, 2.1880%, 4/28/26‡ | 6,824,000 | 7,206,361 | |||||
Morgan Stanley, 4.3500%, 9/8/26 | 3,985,000 | 4,699,068 | |||||
Morgan Stanley, 3.9500%, 4/23/27 | 6,273,000 | 7,252,417 | |||||
Morgan Stanley, SOFR + 1.0340%, 1.7940%, 2/13/32‡ | 5,529,000 | 5,559,829 | |||||
Natwest Group PLC, | |||||||
US Treasury Yield Curve Rate 5 Year + 2.3500%, 3.0320%, 11/28/35‡ | 5,500,000 | 5,688,155 | |||||
UBS Group AG, | |||||||
US Treasury Yield Curve Rate 1 Year + 1.0800%, 1.3640%, 1/30/27 (144A)‡ | 7,020,000 | 7,096,924 | |||||
Westpac Banking Corp, | |||||||
US Treasury Yield Curve Rate 5 Year + 1.7500%, 2.6680%, 11/15/35‡ | 5,490,000 | 5,655,578 | |||||
Westpac Banking Corp, 2.9630%, 11/16/40 | 1,624,000 | 1,726,809 | |||||
270,557,317 | |||||||
Basic Industry – 0.5% | |||||||
Allegheny Technologies Inc, 5.8750%, 12/1/27 | 4,100,000 | 4,330,625 | |||||
Axalta Coating Systems Ltd, 3.3750%, 2/15/29 (144A) | 7,654,000 | 7,654,000 | |||||
Constellium NV, 5.7500%, 5/15/24 (144A) | 4,159,000 | 4,243,927 | |||||
Element Solutions Inc, 3.8750%, 9/1/28 (144A) | 5,787,000 | 5,953,376 | |||||
Georgia-Pacific LLC, 3.1630%, 11/15/21 (144A) | 3,657,000 | 3,725,489 | |||||
Nutrition & Biosciences Inc, 1.8320%, 10/15/27 (144A) | 4,072,000 | 4,195,051 | |||||
Nutrition & Biosciences Inc, 3.2680%, 11/15/40 (144A) | 1,492,000 | 1,601,039 | |||||
Nutrition & Biosciences Inc, 3.4680%, 12/1/50 (144A) | 2,280,000 | 2,472,164 | |||||
Reliance Steel & Aluminum Co, 4.5000%, 4/15/23 | 2,242,000 | 2,418,805 | |||||
36,594,476 | |||||||
Brokerage – 0.6% | |||||||
Charles Schwab Corp, | |||||||
US Treasury Yield Curve Rate 5 Year + 4.9710%, 5.3750%‡,µ | 15,360,000 | 17,107,200 | |||||
Charles Schwab Corp, | |||||||
US Treasury Yield Curve Rate 10 Year + 3.0790%, 4.0000%‡,µ | 7,093,000 | 7,465,382 | |||||
Intercontinental Exchange Inc, 2.1000%, 6/15/30 | 4,138,000 | 4,307,779 | |||||
Intercontinental Exchange Inc, 1.8500%, 9/15/32 | 2,181,000 | 2,197,377 | |||||
Raymond James Financial Inc, 5.6250%, 4/1/24 | 1,553,000 | 1,792,039 | |||||
Raymond James Financial Inc, 4.6500%, 4/1/30 | 1,983,000 | 2,431,224 | |||||
Raymond James Financial Inc, 4.9500%, 7/15/46 | 2,715,000 | 3,714,913 | |||||
39,015,914 | |||||||
Capital Goods – 1.3% | |||||||
Avery Dennison Co, 2.6500%, 4/30/30 | 5,093,000 | 5,459,711 | |||||
BAE Systems PLC, 3.4000%, 4/15/30 (144A) | 2,256,000 | 2,554,429 | |||||
BAE Systems PLC, 1.9000%, 2/15/31 (144A) | 3,168,000 | 3,200,791 | |||||
Boeing Co, 4.5080%, 5/1/23 | 6,065,000 | 6,554,872 | |||||
Boeing Co, 4.8750%, 5/1/25 | 1,957,000 | 2,230,382 | |||||
Boeing Co, 2.7500%, 2/1/26 | 1,978,000 | 2,079,497 | |||||
Boeing Co, 2.2500%, 6/15/26 | 504,000 | 516,746 | |||||
Boeing Co, 3.2500%, 2/1/28 | 2,110,000 | 2,260,395 | |||||
Boeing Co, 3.6000%, 5/1/34 | 5,168,000 | 5,452,306 | |||||
Boeing Co, 5.7050%, 5/1/40 | 4,356,000 | 5,632,798 | |||||
Boeing Co, 5.9300%, 5/1/60 | 1,200,000 | 1,699,248 | |||||
General Dynamics Corp, 3.5000%, 4/1/27 | 2,033,000 | 2,337,854 | |||||
General Electric Co, 6.7500%, 3/15/32 | 2,125,000 | 2,977,640 | |||||
Huntington Ingalls Industries Inc, 3.8440%, 5/1/25 (144A) | 3,563,000 | 3,958,374 | |||||
Huntington Ingalls Industries Inc, 4.2000%, 5/1/30 (144A) | 6,409,000 | 7,587,192 | |||||
Northrop Grumman Corp, 4.4000%, 5/1/30 | 3,546,000 | 4,399,212 | |||||
United Rentals North America Inc, 3.8750%, 2/15/31 | 1,581,000 | 1,658,548 | |||||
Vulcan Materials Co, 3.5000%, 6/1/30 | 2,835,000 | 3,254,593 | |||||
See Notes to Schedule of Investments and Other Information and Notes to Financial Statements. | |
Janus Aspen Series | 13 |
Janus Henderson VIT Balanced Portfolio
Schedule of Investments
December 31, 2020
Shares
or | Value | ||||||
Corporate Bonds– (continued) | |||||||
Capital Goods– (continued) | |||||||
Wabtec Corp, 4.4000%, 3/15/24 | $3,516,000 | $3,847,278 | |||||
Wabtec Corp, 3.4500%, 11/15/26 | 975,000 | 1,070,062 | |||||
Wabtec Corp, 4.9500%, 9/15/28 | 11,064,000 | 13,121,035 | |||||
Westinghouse Air Brake Technologies Corp, 3.2000%, 6/15/25 | 4,854,000 | 5,235,751 | |||||
87,088,714 | |||||||
Communications – 2.1% | |||||||
AT&T Inc, 1.6500%, 2/1/28 | 3,063,000 | 3,123,744 | |||||
AT&T Inc, 3.5000%, 9/15/53 (144A) | 1,680,000 | 1,673,596 | |||||
AT&T Inc, 3.5500%, 9/15/55 (144A) | 2,407,000 | 2,394,201 | |||||
AT&T Inc, 3.8000%, 12/1/57 (144A) | 3,657,000 | 3,798,169 | |||||
AT&T Inc, 3.6500%, 9/15/59 (144A) | 604,000 | 605,766 | |||||
CCO Holdings LLC / CCO Holdings Capital Corp, 4.2500%, 2/1/31 (144A) | 6,601,000 | 6,956,530 | |||||
CCO Holdings LLC / CCO Holdings Capital Corp, 4.5000%, 5/1/32 (144A) | 9,894,000 | 10,564,022 | |||||
CenturyLink Inc, 6.4500%, 6/15/21 | 2,658,000 | 2,711,718 | |||||
CenturyLink Inc, 5.8000%, 3/15/22 | 1,479,000 | 1,541,857 | |||||
Charter Communications Operating LLC / Charter Communications Operating Capital, | |||||||
2.8000%, 4/1/31 | 4,500,000 | 4,753,668 | |||||
Charter Communications Operating LLC / Charter Communications Operating Capital, | |||||||
6.4840%, 10/23/45 | 936,000 | 1,326,298 | |||||
Charter Communications Operating LLC / Charter Communications Operating Capital, | |||||||
5.3750%, 5/1/47 | 1,778,000 | 2,215,850 | |||||
Charter Communications Operating LLC / Charter Communications Operating Capital, | |||||||
4.8000%, 3/1/50 | 4,793,000 | 5,718,931 | |||||
Charter Communications Operating LLC / Charter Communications Operating Capital, | |||||||
3.7000%, 4/1/51 | 2,337,000 | 2,422,575 | |||||
Comcast Corp, 3.7500%, 4/1/40 | 1,775,000 | 2,132,743 | |||||
Crown Castle International Corp, 3.6500%, 9/1/27 | 1,958,000 | 2,209,705 | |||||
Crown Castle International Corp, 4.3000%, 2/15/29 | 3,161,000 | 3,752,471 | |||||
Crown Castle International Corp, 3.1000%, 11/15/29 | 4,247,000 | 4,677,399 | |||||
CSC Holdings LLC, 4.1250%, 12/1/30 (144A) | 5,750,000 | 6,012,200 | |||||
CSC Holdings LLC, 4.6250%, 12/1/30 (144A) | 6,461,000 | 6,743,669 | |||||
CSC Holdings LLC, 3.3750%, 2/15/31 (144A) | 4,001,000 | 3,925,981 | |||||
Fox Corp, 4.0300%, 1/25/24 | 2,592,000 | 2,854,294 | |||||
GCI LLC, 4.7500%, 10/15/28 (144A) | 9,592,000 | 10,230,348 | |||||
Level 3 Financing Inc, 3.8750%, 11/15/29 (144A) | 8,158,000 | 9,059,622 | |||||
Sirius XM Radio Inc, 4.1250%, 7/1/30 (144A) | 6,938,000 | 7,384,634 | |||||
T-Mobile USA Inc, 3.5000%, 4/15/25 (144A) | 3,170,000 | 3,502,787 | |||||
T-Mobile USA Inc, 3.7500%, 4/15/27 (144A) | 12,066,000 | 13,740,761 | |||||
T-Mobile USA Inc, 2.0500%, 2/15/28 (144A) | 1,148,000 | 1,194,104 | |||||
T-Mobile USA Inc, 3.8750%, 4/15/30 (144A) | 4,058,000 | 4,699,205 | |||||
T-Mobile USA Inc, 2.5500%, 2/15/31 (144A) | 1,557,000 | 1,634,959 | |||||
T-Mobile USA Inc, 3.0000%, 2/15/41 (144A) | 3,014,000 | 3,124,674 | |||||
T-Mobile USA Inc, 3.3000%, 2/15/51 (144A) | 2,616,000 | 2,691,419 | |||||
Verizon Communications Inc, 3.0000%, 3/22/27 | 2,200,000 | 2,436,068 | |||||
Verizon Communications Inc, 4.8620%, 8/21/46 | 1,321,000 | 1,782,425 | |||||
143,596,393 | |||||||
Consumer Cyclical – 2.2% | |||||||
1011778 BC ULC / New Red Finance Inc, 4.0000%, 10/15/30 (144A) | 10,521,000 | 10,669,977 | |||||
AutoZone Inc, 3.7500%, 4/18/29 | 2,021,000 | 2,329,584 | |||||
AutoZone Inc, 1.6500%, 1/15/31 | 2,416,000 | 2,399,078 | |||||
Booking Holdings Inc, 4.1000%, 4/13/25 | 11,477,000 | 13,013,508 | |||||
Booking Holdings Inc, 4.5000%, 4/13/27 | 5,945,000 | 7,086,436 | |||||
Booking Holdings Inc, 4.6250%, 4/13/30 | 4,148,000 | 5,151,612 | |||||
Choice Hotels International Inc, 3.7000%, 12/1/29 | 4,189,000 | 4,568,775 | |||||
See Notes to Schedule of Investments and Other Information and Notes to Financial Statements. | |
14 | DECEMBER 31, 2020 |
Janus Henderson VIT Balanced Portfolio
Schedule of Investments
December 31, 2020
Shares
or | Value | ||||||
Corporate Bonds– (continued) | |||||||
Consumer Cyclical– (continued) | |||||||
Choice Hotels International Inc, 3.7000%, 1/15/31 | $1,267,000 | $1,403,228 | |||||
Dollar General Corp, 3.5000%, 4/3/30 | 3,266,000 | 3,747,327 | |||||
Dollar General Corp, 4.1250%, 4/3/50 | 3,153,000 | 3,983,281 | |||||
Experian Finance PLC, 2.7500%, 3/8/30 (144A) | 10,283,000 | 11,158,943 | |||||
Ford Motor Credit Co LLC, 3.3750%, 11/13/25 | 7,879,000 | 8,068,569 | |||||
Ford Motor Credit Co LLC, 4.0000%, 11/13/30 | 7,319,000 | 7,699,076 | |||||
General Motors Co, 4.2000%, 10/1/27 | 1,542,000 | 1,746,637 | |||||
General Motors Co, 5.0000%, 10/1/28 | 4,428,000 | 5,266,942 | |||||
General Motors Co, 5.4000%, 4/1/48 | 1,505,000 | 1,892,433 | |||||
General Motors Financial Co Inc, 4.3500%, 4/9/25 | 2,570,000 | 2,868,595 | |||||
General Motors Financial Co Inc, 4.3000%, 7/13/25 | 790,000 | 886,220 | |||||
General Motors Financial Co Inc, 4.3500%, 1/17/27 | 2,216,000 | 2,521,799 | |||||
GLP Capital LP / GLP Financing II Inc, 3.3500%, 9/1/24 | 693,000 | 727,491 | |||||
GLP Capital LP / GLP Financing II Inc, 5.2500%, 6/1/25 | 1,284,000 | 1,444,603 | |||||
GLP Capital LP / GLP Financing II Inc, 5.3750%, 4/15/26 | 2,597,000 | 2,980,499 | |||||
GLP Capital LP / GLP Financing II Inc, 5.3000%, 1/15/29 | 344,000 | 400,285 | |||||
GLP Capital LP / GLP Financing II Inc, 4.0000%, 1/15/30 | 4,670,000 | 5,072,834 | |||||
GLP Capital LP / GLP Financing II Inc, 4.0000%, 1/15/31 | 1,839,000 | 2,006,754 | |||||
IHS Markit Ltd, 5.0000%, 11/1/22 (144A) | 1,475,000 | 1,577,109 | |||||
IHS Markit Ltd, 4.7500%, 2/15/25 (144A) | 2,588,000 | 2,969,989 | |||||
Lowe's Cos Inc, 4.5000%, 4/15/30 | 5,499,000 | 6,841,496 | |||||
Lowe's Cos Inc, 5.0000%, 4/15/40 | 2,810,000 | 3,816,420 | |||||
Marriott International Inc, 5.7500%, 5/1/25 | 6,416,000 | 7,503,418 | |||||
MDC Holdings Inc, 5.5000%, 1/15/24 | 2,249,000 | 2,462,655 | |||||
MGM Resorts International, 7.7500%, 3/15/22 | 544,000 | 579,360 | |||||
Nordstrom Inc, 4.3750%, 4/1/30 | 5,449,000 | 5,364,101 | |||||
O'Reilly Automotive Inc, 3.6000%, 9/1/27 | 90,000 | 102,433 | |||||
O'Reilly Automotive Inc, 4.3500%, 6/1/28 | 696,000 | 827,540 | |||||
O'Reilly Automotive Inc, 3.9000%, 6/1/29 | 4,040,000 | 4,748,702 | |||||
Ross Stores Inc, 1.8750%, 4/15/31 | 1,942,000 | 1,948,528 | |||||
Service Corp International/US, 3.3750%, 8/15/30 | 2,052,000 | 2,134,511 | |||||
149,970,748 | |||||||
Consumer Non-Cyclical – 2.5% | |||||||
Anheuser-Busch Cos LLC / Anheuser-Busch InBev Worldwide Inc, | |||||||
4.9000%, 2/1/46 | 4,540,000 | 5,908,562 | |||||
Anheuser-Busch InBev Worldwide Inc, 4.3500%, 6/1/40 | 3,603,000 | 4,414,893 | |||||
Aramark Services Inc, 6.3750%, 5/1/25 (144A) | 9,706,000 | 10,373,287 | |||||
Avantor Funding Inc, 4.6250%, 7/15/28 (144A) | 3,985,000 | 4,214,137 | |||||
Baxter International Inc, 3.9500%, 4/1/30 (144A) | 4,133,000 | 4,936,856 | |||||
Boston Scientific Corp, 4.0000%, 3/1/29 | 1,009,000 | 1,188,571 | |||||
Cigna Corp, 3.4000%, 9/17/21 | 600,000 | 612,894 | |||||
Cigna Corp, 2.4000%, 3/15/30 | 1,946,000 | 2,073,752 | |||||
Cigna Corp, 3.2000%, 3/15/40 | 885,000 | 969,135 | |||||
Cigna Corp, 3.4000%, 3/15/50 | 1,335,000 | 1,499,443 | |||||
Coca-Cola Femsa SAB de CV, 2.7500%, 1/22/30 | 2,607,000 | 2,810,661 | |||||
CVS Health Corp, 4.3000%, 3/25/28 | 1,757,000 | 2,091,345 | |||||
CVS Health Corp, 4.1250%, 4/1/40 | 2,449,000 | 2,919,950 | |||||
CVS Health Corp, 2.7000%, 8/21/40 | 1,926,000 | 1,945,621 | |||||
CVS Health Corp, 5.0500%, 3/25/48 | 2,563,000 | 3,468,186 | |||||
CVS Health Corp, 4.2500%, 4/1/50 | 1,209,000 | 1,509,681 | |||||
DaVita Inc, 4.6250%, 6/1/30 (144A) | 4,493,000 | 4,762,580 | |||||
DaVita Inc, 3.7500%, 2/15/31 (144A) | 6,903,000 | 7,009,030 | |||||
Diageo Capital PLC, 1.3750%, 9/29/25 | 3,173,000 | 3,264,079 | |||||
Diageo Capital PLC, 2.0000%, 4/29/30 | 2,989,000 | 3,115,238 | |||||
Diageo Capital PLC, 2.1250%, 4/29/32 | 2,398,000 | 2,531,498 | |||||
Elanco Animal Health Inc, 5.2720%, 8/28/23 | 5,460,000 | 5,965,050 | |||||
Fomento Economico Mexicano SAB de CV, 3.5000%, 1/16/50 | 3,146,000 | 3,493,324 | |||||
Hasbro Inc, 3.5500%, 11/19/26 | 8,044,000 | 8,975,697 | |||||
Hasbro Inc, 3.9000%, 11/19/29 | 8,515,000 | 9,634,986 | |||||
See Notes to Schedule of Investments and Other Information and Notes to Financial Statements. | |
Janus Aspen Series | 15 |
Janus Henderson VIT Balanced Portfolio
Schedule of Investments
December 31, 2020
Shares
or | Value | ||||||
Corporate Bonds– (continued) | |||||||
Consumer Non-Cyclical– (continued) | |||||||
Hasbro Inc, 5.1000%, 5/15/44 | $1,320,000 | $1,507,866 | |||||
HCA Inc, 4.7500%, 5/1/23 | 3,958,000 | 4,316,227 | |||||
HCA Inc, 5.3750%, 2/1/25 | 2,189,000 | 2,461,596 | |||||
HCA Inc, 5.8750%, 2/15/26 | 1,152,000 | 1,324,800 | |||||
HCA Inc, 5.3750%, 9/1/26 | 883,000 | 1,014,920 | |||||
HCA Inc, 5.6250%, 9/1/28 | 2,351,000 | 2,777,119 | |||||
HCA Inc, 5.8750%, 2/1/29 | 1,902,000 | 2,291,910 | |||||
HCA Inc, 3.5000%, 9/1/30 | 6,704,000 | 7,119,790 | |||||
JBS USA LUX SA / JBS USA Finance Inc, 6.7500%, 2/15/28 (144A) | 2,573,000 | 2,890,765 | |||||
JBS USA LUX SA / JBS USA Food Co / JBS USA Finance Inc, | |||||||
6.5000%, 4/15/29 (144A) | 4,122,000 | 4,798,420 | |||||
JBS USA LUX SA / JBS USA Food Co / JBS USA Finance Inc, | |||||||
5.5000%, 1/15/30 (144A) | 5,277,000 | 6,062,007 | |||||
Mondelez International Inc, 2.7500%, 4/13/30 | 720,000 | 790,403 | |||||
Royalty Pharma PLC, 1.7500%, 9/2/27 (144A) | 2,033,000 | 2,090,996 | |||||
Royalty Pharma PLC, 2.2000%, 9/2/30 (144A) | 393,000 | 403,352 | |||||
Royalty Pharma PLC, 3.3000%, 9/2/40 (144A) | 3,932,000 | 4,128,593 | |||||
Royalty Pharma PLC, 3.5500%, 9/2/50 (144A) | 3,923,000 | 4,179,635 | |||||
Sysco Corp, 2.5000%, 7/15/21 | 629,000 | 635,253 | |||||
Sysco Corp, 5.9500%, 4/1/30 | 6,804,000 | 8,936,425 | |||||
Sysco Corp, 6.6000%, 4/1/40 | 3,303,000 | 4,825,739 | |||||
Sysco Corp, 6.6000%, 4/1/50 | 1,572,000 | 2,417,410 | |||||
Upjohn Inc, 1.6500%, 6/22/25 (144A) | 884,000 | 913,518 | |||||
165,575,200 | |||||||
Electric – 0.8% | |||||||
AEP Transmission Co LLC, 3.6500%, 4/1/50 | 2,835,000 | 3,430,835 | |||||
Ameren Corp, 3.5000%, 1/15/31 | 11,657,000 | 13,398,035 | |||||
Black Hills Corp, 2.5000%, 6/15/30 | 1,743,000 | 1,829,626 | |||||
Dominion Energy Inc, 3.3750%, 4/1/30 | 5,928,000 | 6,749,028 | |||||
East Ohio Gas Co/The, 2.0000%, 6/15/30 (144A) | 648,000 | 671,199 | |||||
NextEra Energy Capital Holdings Inc, 2.7500%, 5/1/25 | 2,601,000 | 2,813,291 | |||||
NRG Energy Inc, 7.2500%, 5/15/26 | 4,447,000 | 4,691,585 | |||||
NRG Energy Inc, 6.6250%, 1/15/27 | 4,756,000 | 5,022,526 | |||||
NRG Energy Inc, 3.3750%, 2/15/29 (144A) | 4,783,000 | 4,896,835 | |||||
NRG Energy Inc, 3.6250%, 2/15/31 (144A) | 5,400,000 | 5,555,520 | |||||
PPL WEM Ltd / Western Power Distribution Ltd, 5.3750%, 5/1/21 (144A) | 2,553,000 | 2,562,197 | |||||
51,620,677 | |||||||
Energy – 0.8% | |||||||
Cheniere Corpus Christi Holdings LLC, 3.7000%, 11/15/29 | 4,749,000 | 5,284,334 | |||||
Cheniere Energy Inc, 4.6250%, 10/15/28 (144A) | 10,717,000 | 11,252,850 | |||||
Continental Resources Inc, 5.7500%, 1/15/31 (144A) | 5,520,000 | 6,127,090 | |||||
Energy Transfer Operating LP, 5.8750%, 1/15/24 | 1,589,000 | 1,785,669 | |||||
Energy Transfer Operating LP, 5.5000%, 6/1/27 | 1,185,000 | 1,395,980 | |||||
Energy Transfer Operating LP, 4.9500%, 6/15/28 | 184,000 | 211,994 | |||||
Hess Midstream Operations LP, 5.1250%, 6/15/28 (144A) | 6,466,000 | 6,758,974 | |||||
Kinder Morgan Inc/DE, 4.3000%, 3/1/28 | 1,871,000 | 2,193,355 | |||||
NGPL PipeCo LLC, 4.3750%, 8/15/22 (144A) | 3,174,000 | 3,306,727 | |||||
ONEOK Inc, 5.8500%, 1/15/26 | 1,593,000 | 1,907,653 | |||||
ONEOK Inc, 6.3500%, 1/15/31 | 3,407,000 | 4,365,957 | |||||
ONEOK Inc, 7.1500%, 1/15/51 | 890,000 | 1,229,697 | |||||
TransCanada PipeLines Ltd, 4.1000%, 4/15/30 | 7,412,000 | 8,752,622 | |||||
54,572,902 | |||||||
Finance Companies – 0.2% | |||||||
Quicken Loans LLC, 3.6250%, 3/1/29 (144A) | 4,435,000 | 4,523,700 | |||||
Quicken Loans LLC, 3.8750%, 3/1/31 (144A) | 6,482,000 | 6,725,075 | |||||
USAA Capital Corp, 2.1250%, 5/1/30 (144A) | 284,000 | 298,459 | |||||
11,547,234 | |||||||
Financial Institutions – 0% | |||||||
Jones Lang LaSalle Inc, 4.4000%, 11/15/22 | 2,938,000 | 3,111,893 | |||||
See Notes to Schedule of Investments and Other Information and Notes to Financial Statements. | |
16 | DECEMBER 31, 2020 |
Janus Henderson VIT Balanced Portfolio
Schedule of Investments
December 31, 2020
Shares
or | Value | ||||||
Corporate Bonds– (continued) | |||||||
Industrial Conglomerates – 0.1% | |||||||
General Electric Co, ICE LIBOR USD 3 Month + 3.3300%, 5.0000%‡,µ | $5,540,000 | $5,137,020 | |||||
Information Technology Services – 0.1% | |||||||
Booz Allen Hamilton Inc, 3.8750%, 9/1/28 (144A) | 5,412,000 | 5,574,360 | |||||
Insurance – 0.8% | |||||||
Brown & Brown Inc, 4.5000%, 3/15/29 | 2,493,000 | 2,949,716 | |||||
Brown & Brown Inc, 2.3750%, 3/15/31 | 955,000 | 998,927 | |||||
Centene Corp, 5.3750%, 6/1/26 (144A) | 6,910,000 | 7,288,046 | |||||
Centene Corp, 4.2500%, 12/15/27 | 5,363,000 | 5,684,780 | |||||
Centene Corp, 4.6250%, 12/15/29 | 8,060,000 | 8,948,293 | |||||
Centene Corp, 3.3750%, 2/15/30 | 3,535,000 | 3,719,138 | |||||
Molina Healthcare Inc, 4.3750%, 6/15/28 (144A) | 13,333,000 | 14,032,982 | |||||
Prudential Financial Inc, | |||||||
US Treasury Yield Curve Rate 5 Year + 3.0350%, 3.7000%, 10/1/50‡ | 7,720,000 | 8,166,062 | |||||
51,787,944 | |||||||
Real Estate Investment Trusts (REITs) – 0.5% | |||||||
Agree LP, 2.9000%, 10/1/30 | 2,058,000 | 2,184,986 | |||||
Alexandria Real Estate Equities Inc, 4.9000%, 12/15/30 | 4,758,000 | 6,051,692 | |||||
MPT Operating Partnership LP/MPT Finance Corp, 5.0000%, 10/15/27 | 1,631,000 | 1,734,976 | |||||
MPT Operating Partnership LP/MPT Finance Corp, 4.6250%, 8/1/29 | 1,481,000 | 1,592,075 | |||||
MPT Operating Partnership LP/MPT Finance Corp, 3.5000%, 3/15/31 | 16,610,000 | 17,149,825 | |||||
WP Carey Inc, 2.4000%, 2/1/31 | 4,073,000 | 4,227,547 | |||||
32,941,101 | |||||||
Technology – 3.0% | |||||||
Analog Devices Inc, 2.9500%, 4/1/25 | 2,815,000 | 3,071,833 | |||||
Broadcom Inc, 4.7000%, 4/15/25 | 7,427,000 | 8,509,518 | |||||
Broadcom Inc, 3.1500%, 11/15/25 | 6,292,000 | 6,865,296 | |||||
Broadcom Inc, 4.1500%, 11/15/30 | 5,187,000 | 5,995,985 | |||||
Broadcom Inc, 4.3000%, 11/15/32 | 4,150,000 | 4,916,712 | |||||
Broadridge Financial Solutions Inc, 2.9000%, 12/1/29 | 5,355,000 | 5,862,753 | |||||
CoStar Group Inc, 2.8000%, 7/15/30 (144A) | 6,989,000 | 7,257,880 | |||||
Dell International LLC / EMC Corp, 5.8750%, 6/15/21 (144A) | 5,481,000 | 5,490,866 | |||||
Equifax Inc, 2.6000%, 12/1/24 | 6,943,000 | 7,435,028 | |||||
Equifax Inc, 2.6000%, 12/15/25 | 4,708,000 | 5,080,643 | |||||
Equifax Inc, 3.1000%, 5/15/30 | 4,291,000 | 4,770,539 | |||||
Equinix Inc, 2.9000%, 11/18/26 | 1,688,000 | 1,845,640 | |||||
Equinix Inc, 1.8000%, 7/15/27 | 5,872,000 | 6,042,068 | |||||
Equinix Inc, 3.2000%, 11/18/29 | 3,797,000 | 4,183,010 | |||||
Equinix Inc, 2.1500%, 7/15/30 | 2,665,000 | 2,709,193 | |||||
Gartner Inc, 3.7500%, 10/1/30 (144A) | 1,038,000 | 1,089,900 | |||||
Global Payments Inc, 3.2000%, 8/15/29 | 1,143,000 | 1,268,662 | |||||
Global Payments Inc, 2.9000%, 5/15/30 | 4,310,000 | 4,686,332 | |||||
Keysight Technologies Inc, 3.0000%, 10/30/29 | 4,569,000 | 5,041,990 | |||||
Leidos Inc, 2.9500%, 5/15/23 (144A) | 808,000 | 850,102 | |||||
Leidos Inc, 3.6250%, 5/15/25 (144A) | 3,135,000 | 3,505,212 | |||||
Leidos Inc, 4.3750%, 5/15/30 (144A) | 4,468,000 | 5,350,207 | |||||
Leidos Inc, 2.3000%, 2/15/31 (144A) | 3,675,000 | 3,741,881 | |||||
Marvell Technology Group Ltd, 4.2000%, 6/22/23 | 1,361,000 | 1,472,728 | |||||
Marvell Technology Group Ltd, 4.8750%, 6/22/28 | 6,730,000 | 7,946,361 | |||||
Microchip Technology Inc, 2.6700%, 9/1/23 (144A) | 6,452,000 | 6,747,453 | |||||
Microchip Technology Inc, 4.2500%, 9/1/25 (144A) | 5,055,000 | 5,347,490 | |||||
MSCI Inc, 4.0000%, 11/15/29 (144A) | 422,000 | 449,430 | |||||
MSCI Inc, 3.6250%, 9/1/30 (144A) | 3,328,000 | 3,477,760 | |||||
MSCI Inc, 3.8750%, 2/15/31 (144A) | 6,019,000 | 6,365,092 | |||||
PayPal Holdings Inc, 1.6500%, 6/1/25 | 2,243,000 | 2,342,972 | |||||
PayPal Holdings Inc, 2.6500%, 10/1/26 | 6,511,000 | 7,155,095 | |||||
PayPal Holdings Inc, 2.3000%, 6/1/30 | 2,592,000 | 2,774,039 | |||||
Qorvo Inc, 3.3750%, 4/1/31 (144A) | 5,951,000 | 6,144,407 | |||||
Sensata Technologies Inc, 3.7500%, 2/15/31 (144A) | 6,563,000 | 6,803,075 | |||||
Total System Services Inc, 4.8000%, 4/1/26 | 3,189,000 | 3,794,351 | |||||
See Notes to Schedule of Investments and Other Information and Notes to Financial Statements. | |
Janus Aspen Series | 17 |
Janus Henderson VIT Balanced Portfolio
Schedule of Investments
December 31, 2020
Shares
or | Value | ||||||
Corporate Bonds– (continued) | |||||||
Technology– (continued) | |||||||
Trimble Inc, 4.7500%, 12/1/24 | $5,510,000 | $6,296,718 | |||||
Trimble Inc, 4.9000%, 6/15/28 | 9,681,000 | 11,579,379 | |||||
Verisk Analytics Inc, 5.5000%, 6/15/45 | 1,616,000 | 2,286,527 | |||||
Verisk Analytics Inc, 3.6250%, 5/15/50 | 2,972,000 | 3,457,548 | |||||
VMware Inc, 4.5000%, 5/15/25 | 5,017,000 | 5,740,743 | |||||
VMware Inc, 4.6500%, 5/15/27 | 5,629,000 | 6,584,309 | |||||
202,336,727 | |||||||
Total Corporate Bonds (cost $1,205,869,544) | 1,311,028,620 | ||||||
Inflation-Indexed Bonds– 1.1% | |||||||
United States Treasury Inflation Indexed Bonds, 0.1250%, 10/15/25ÇÇ((cost $74,293,563) | 69,518,084 | 75,574,743 | |||||
Mortgage-Backed Securities– 5.3% | |||||||
Fannie Mae: | |||||||
1.5000%, TBA, 15 Year Maturity | 1,180,441 | 1,214,615 | |||||
2.0000%, TBA, 15 Year Maturity | 10,750,785 | 11,244,891 | |||||
2.5000%, TBA, 15 Year Maturity | 8,099,200 | 8,443,416 | |||||
2.0000%, TBA, 30 Year Maturity | 44,105,761 | 45,840,441 | |||||
2.5000%, TBA, 30 Year Maturity | 29,964,385 | 31,594,448 | |||||
98,337,811 | |||||||
Fannie Mae Pool: | |||||||
3.0000%, 10/1/34 | 676,067 | 721,170 | |||||
2.5000%, 11/1/34 | 425,207 | 452,207 | |||||
3.0000%, 11/1/34 | 240,412 | 259,498 | |||||
3.0000%, 12/1/34 | 247,187 | 265,221 | |||||
6.0000%, 2/1/37 | 89,689 | 106,385 | |||||
4.5000%, 11/1/42 | 512,620 | 572,992 | |||||
3.0000%, 1/1/43 | 283,075 | 302,012 | |||||
3.0000%, 2/1/43 | 82,276 | 88,249 | |||||
3.0000%, 5/1/43 | 2,906,780 | 3,070,376 | |||||
3.0000%, 5/1/43 | 615,719 | 662,028 | |||||
3.5000%, 4/1/44 | 1,066,764 | 1,181,373 | |||||
5.0000%, 7/1/44 | 67,789 | 76,837 | |||||
4.5000%, 10/1/44 | 1,241,497 | 1,402,446 | |||||
4.5000%, 3/1/45 | 1,896,341 | 2,142,182 | |||||
4.5000%, 6/1/45 | 1,124,488 | 1,254,035 | |||||
3.5000%, 12/1/45 | 939,251 | 1,007,751 | |||||
3.5000%, 12/1/45 | 741,323 | 815,043 | |||||
3.0000%, 1/1/46 | 109,234 | 115,382 | |||||
4.5000%, 2/1/46 | 2,450,765 | 2,739,395 | |||||
3.5000%, 7/1/46 | 1,337,956 | 1,460,907 | |||||
3.0000%, 9/1/46 | 7,142,288 | 7,619,669 | |||||
3.0000%, 2/1/47 | 23,223,212 | 24,775,420 | |||||
3.0000%, 3/1/47 | 2,392,080 | 2,566,082 | |||||
3.5000%, 3/1/47 | 805,212 | 863,937 | |||||
3.5000%, 7/1/47 | 669,876 | 718,731 | |||||
3.5000%, 8/1/47 | 592,234 | 629,434 | |||||
3.5000%, 8/1/47 | 395,545 | 438,250 | |||||
3.5000%, 12/1/47 | 2,031,536 | 2,172,592 | |||||
3.5000%, 12/1/47 | 205,424 | 227,602 | |||||
3.5000%, 12/1/47 | 112,186 | 124,297 | |||||
3.5000%, 1/1/48 | 1,464,721 | 1,566,421 | |||||
3.5000%, 1/1/48 | 1,408,132 | 1,505,515 | |||||
4.0000%, 1/1/48 | 5,535,400 | 5,984,805 | |||||
4.0000%, 1/1/48 | 4,956,324 | 5,360,693 | |||||
3.0000%, 2/1/48 | 1,102,173 | 1,190,252 | |||||
3.5000%, 3/1/48 | 944,805 | 1,009,945 | |||||
3.5000%, 3/1/48 | 180,482 | 200,204 | |||||
4.0000%, 3/1/48 | 1,804,999 | 1,950,037 | |||||
See Notes to Schedule of Investments and Other Information and Notes to Financial Statements. | |
18 | DECEMBER 31, 2020 |
Janus Henderson VIT Balanced Portfolio
Schedule of Investments
December 31, 2020
Shares
or | Value | ||||||
Mortgage-Backed Securities– (continued) | |||||||
Fannie Mae Pool– (continued) | |||||||
4.5000%, 3/1/48 | $77,321 | $84,079 | |||||
3.5000%, 4/1/48 | 1,842,699 | 2,030,552 | |||||
3.0000%, 5/1/48 | 545,012 | 581,609 | |||||
5.0000%, 5/1/48 | 1,485,787 | 1,645,628 | |||||
3.5000%, 7/1/48 | 19,723,620 | 20,939,455 | |||||
4.5000%, 8/1/48 | 46,001 | 49,824 | |||||
3.0000%, 11/1/48 | 2,813,639 | 2,974,244 | |||||
3.5000%, 11/1/48 | 3,090,216 | 3,405,246 | |||||
4.0000%, 2/1/49 | 906,518 | 966,853 | |||||
3.0000%, 8/1/49 | 1,433,608 | 1,541,000 | |||||
3.0000%, 9/1/49 | 284,883 | 302,586 | |||||
2.5000%, 1/1/50 | 656,116 | 696,059 | |||||
2.5000%, 10/1/50 | 1,182,159 | 1,249,314 | |||||
3.5000%, 8/1/56 | 4,357,019 | 4,822,157 | |||||
3.0000%, 2/1/57 | 4,103,835 | 4,450,988 | |||||
3.0000%, 6/1/57 | 77,715 | 84,252 | |||||
123,423,221 | |||||||
Freddie Mac Gold Pool: | |||||||
3.5000%, 1/1/47 | 531,395 | 576,733 | |||||
Freddie Mac Pool: | |||||||
3.0000%, 5/1/31 | 5,634,306 | 5,986,879 | |||||
3.0000%, 9/1/32 | 1,244,592 | 1,331,364 | |||||
3.0000%, 10/1/32 | 629,052 | 663,249 | |||||
3.0000%, 1/1/33 | 719,616 | 769,787 | |||||
2.5000%, 12/1/33 | 6,126,761 | 6,419,594 | |||||
3.0000%, 10/1/34 | 1,260,434 | 1,351,956 | |||||
3.0000%, 10/1/34 | 514,565 | 548,821 | |||||
2.5000%, 11/1/34 | 1,751,115 | 1,862,640 | |||||
2.5000%, 11/1/34 | 356,977 | 379,712 | |||||
6.0000%, 4/1/40 | 1,453,943 | 1,727,594 | |||||
3.5000%, 7/1/42 | 251,686 | 273,161 | |||||
3.5000%, 8/1/42 | 326,646 | 354,517 | |||||
3.5000%, 8/1/42 | 272,317 | 295,553 | |||||
3.5000%, 2/1/43 | 877,986 | 956,163 | |||||
3.0000%, 3/1/43 | 2,640,608 | 2,818,486 | |||||
3.0000%, 6/1/43 | 239,567 | 251,500 | |||||
3.5000%, 2/1/44 | 895,812 | 975,576 | |||||
4.5000%, 5/1/44 | 441,050 | 491,917 | |||||
3.5000%, 12/1/44 | 5,472,804 | 5,938,162 | |||||
3.0000%, 1/1/45 | 1,530,310 | 1,629,837 | |||||
3.0000%, 1/1/46 | 195,569 | 213,727 | |||||
3.5000%, 7/1/46 | 6,448,955 | 7,091,721 | |||||
3.5000%, 7/1/46 | 1,209,326 | 1,296,947 | |||||
3.0000%, 8/1/46 | 417,053 | 440,813 | |||||
3.0000%, 10/1/46 | 2,760,171 | 2,940,296 | |||||
4.0000%, 3/1/47 | 547,265 | 597,622 | |||||
3.0000%, 4/1/47 | 520,744 | 550,413 | |||||
3.5000%, 4/1/47 | 213,738 | 233,584 | |||||
3.5000%, 9/1/47 | 2,132,616 | 2,259,872 | |||||
3.5000%, 11/1/47 | 1,744,156 | 1,872,594 | |||||
3.5000%, 12/1/47 | 3,095,893 | 3,377,360 | |||||
3.5000%, 12/1/47 | 1,360,162 | 1,454,809 | |||||
3.5000%, 2/1/48 | 1,470,453 | 1,571,504 | |||||
3.5000%, 2/1/48 | 1,169,883 | 1,250,609 | |||||
4.0000%, 3/1/48 | 1,504,749 | 1,625,627 | |||||
4.5000%, 3/1/48 | 61,833 | 66,972 | |||||
4.0000%, 4/1/48 | 2,242,350 | 2,391,552 | |||||
4.0000%, 4/1/48 | 1,393,808 | 1,505,226 | |||||
4.0000%, 5/1/48 | 2,538,478 | 2,707,385 | |||||
See Notes to Schedule of Investments and Other Information and Notes to Financial Statements. | |
Janus Aspen Series | 19 |
Janus Henderson VIT Balanced Portfolio
Schedule of Investments
December 31, 2020
Shares
or | Value | ||||||
Mortgage-Backed Securities– (continued) | |||||||
Freddie Mac Pool– (continued) | |||||||
4.5000%, 7/1/48 | $557,137 | $605,828 | |||||
5.0000%, 9/1/48 | 175,210 | 194,591 | |||||
4.5000%, 12/1/48 | 1,112,507 | 1,225,853 | |||||
3.0000%, 8/1/49 | 1,195,836 | 1,273,554 | |||||
3.0000%, 8/1/49 | 399,538 | 429,488 | |||||
3.0000%, 12/1/49 | 840,899 | 879,853 | |||||
3.0000%, 12/1/49 | 728,640 | 762,393 | |||||
2.5000%, 1/1/50 | 276,932 | 293,832 | |||||
3.0000%, 3/1/50 | 861,638 | 908,391 | |||||
3.5000%, 3/1/50 | 470,428 | 508,396 | |||||
75,557,280 | |||||||
Ginnie Mae: | |||||||
2.0000%, TBA, 30 Year Maturity | 4,078,122 | 4,263,065 | |||||
2.5000%, TBA, 30 Year Maturity | 20,540,500 | 21,745,611 | |||||
26,008,676 | |||||||
Ginnie Mae I Pool: | |||||||
4.0000%, 1/15/45 | 5,064,829 | 5,585,479 | |||||
4.5000%, 8/15/46 | 5,174,992 | 5,869,872 | |||||
4.0000%, 7/15/47 | 1,581,374 | 1,714,154 | |||||
4.0000%, 8/15/47 | 344,292 | 373,200 | |||||
4.0000%, 11/15/47 | 613,901 | 665,448 | |||||
4.0000%, 12/15/47 | 721,170 | 781,723 | |||||
14,989,876 | |||||||
Ginnie Mae II Pool: | |||||||
4.0000%, 8/20/47 | 608,232 | 659,878 | |||||
4.0000%, 8/20/47 | 156,538 | 172,066 | |||||
4.0000%, 8/20/47 | 90,372 | 98,046 | |||||
4.5000%, 2/20/48 | 836,734 | 912,057 | |||||
4.0000%, 5/20/48 | 427,489 | 459,922 | |||||
4.5000%, 5/20/48 | 2,631,520 | 2,834,038 | |||||
4.5000%, 5/20/48 | 353,580 | 380,790 | |||||
4.0000%, 6/20/48 | 4,279,206 | 4,599,852 | |||||
5.0000%, 8/20/48 | 3,238,708 | 3,525,806 | |||||
13,642,455 | |||||||
Total Mortgage-Backed Securities (cost $342,309,920) | 352,536,052 | ||||||
United States Treasury Notes/Bonds– 4.8% | |||||||
1.1250%, 2/28/22 | 75,540,600 | 76,431,743 | |||||
0.2500%, 6/30/25 | 4,683,300 | 4,670,494 | |||||
0.3750%, 11/30/25 | 25,950,000 | 25,980,410 | |||||
0.8750%, 11/15/30 | 36,856,700 | 36,712,728 | |||||
1.1250%, 5/15/40 | 3,805,000 | 3,606,427 | |||||
1.3750%, 11/15/40 | 7,847,000 | 7,745,234 | |||||
2.7500%, 8/15/42 | 33,107,500 | 40,976,997 | |||||
1.2500%, 5/15/50 | 85,083,400 | 77,013,771 | |||||
1.3750%, 8/15/50 | 48,052,700 | 44,899,242 | |||||
Total United States Treasury Notes/Bonds (cost $317,239,883) | 318,037,046 | ||||||
Common Stocks– 62.5% | |||||||
Aerospace & Defense – 1.0% | |||||||
General Dynamics Corp | 300,996 | 44,794,225 | |||||
L3Harris Technologies Inc | 99,203 | 18,751,351 | |||||
63,545,576 | |||||||
Air Freight & Logistics – 0.7% | |||||||
United Parcel Service Inc | 276,854 | 46,622,214 | |||||
Airlines – 0% | |||||||
Southwest Airlines Co | 71,012 | 3,309,869 | |||||
Banks – 0.9% | |||||||
Bank of America Corp | 1,922,415 | 58,268,399 | |||||
See Notes to Schedule of Investments and Other Information and Notes to Financial Statements. | |
20 | DECEMBER 31, 2020 |
Janus Henderson VIT Balanced Portfolio
Schedule of Investments
December 31, 2020
Shares
or | Value | ||||||
Common Stocks– (continued) | |||||||
Beverages – 0.8% | |||||||
Monster Beverage Corp* | 557,991 | $51,603,008 | |||||
Biotechnology – 0.8% | |||||||
AbbVie Inc | 528,477 | 56,626,311 | |||||
Capital Markets – 2.7% | |||||||
Blackstone Group Inc | 738,276 | 47,847,668 | |||||
CME Group Inc | 260,286 | 47,385,066 | |||||
Morgan Stanley | 1,043,225 | 71,492,209 | |||||
S&P Global Inc | 51,709 | 16,998,300 | |||||
183,723,243 | |||||||
Chemicals – 0.5% | |||||||
Sherwin-Williams Co | 41,443 | 30,456,875 | |||||
Communications Equipment – 0.4% | |||||||
Motorola Solutions Inc | 145,978 | 24,825,019 | |||||
Consumer Finance – 0.7% | |||||||
American Express Co | 380,282 | 45,979,897 | |||||
Electronic Equipment, Instruments & Components – 0.4% | |||||||
Corning Inc | 766,642 | 27,599,112 | |||||
Entertainment – 1.4% | |||||||
Activision Blizzard Inc | 322,317 | 29,927,133 | |||||
Walt Disney Co* | 344,012 | 62,328,094 | |||||
92,255,227 | |||||||
Equity Real Estate Investment Trusts (REITs) – 0.3% | |||||||
Crown Castle International Corp | 125,427 | 19,966,724 | |||||
Food & Staples Retailing – 1.6% | |||||||
Costco Wholesale Corp | 219,857 | 82,837,720 | |||||
Sysco Corp | 284,258 | 21,108,999 | |||||
103,946,719 | |||||||
Food Products – 0.5% | |||||||
Hershey Co | 202,824 | 30,896,180 | |||||
Health Care Equipment & Supplies – 2.4% | |||||||
Abbott Laboratories | 601,438 | 65,851,447 | |||||
Edwards Lifesciences Corp* | 77,036 | 7,027,994 | |||||
Intuitive Surgical Inc* | 25,137 | 20,564,580 | |||||
Medtronic PLC | 397,388 | 46,550,030 | |||||
Stryker Corp | 93,569 | 22,928,148 | |||||
162,922,199 | |||||||
Health Care Providers & Services – 2.1% | |||||||
UnitedHealth Group Inc | 397,148 | 139,271,861 | |||||
Hotels, Restaurants & Leisure – 2.6% | |||||||
Hilton Worldwide Holdings Inc | 344,131 | 38,288,015 | |||||
McDonald's Corp | 438,854 | 94,169,291 | |||||
Starbucks Corp | 396,874 | 42,457,580 | |||||
174,914,886 | |||||||
Household Products – 1.1% | |||||||
Clorox Co | 69,958 | 14,125,919 | |||||
Procter & Gamble Co | 409,753 | 57,013,032 | |||||
71,138,951 | |||||||
Industrial Conglomerates – 1.2% | |||||||
Honeywell International Inc | 377,585 | 80,312,329 | |||||
Information Technology Services – 4.3% | |||||||
Accenture PLC | 379,108 | 99,026,801 | |||||
Fidelity National Information Services Inc | 123,665 | 17,493,651 | |||||
Mastercard Inc | 472,352 | 168,601,323 | |||||
285,121,775 | |||||||
Insurance – 1.6% | |||||||
Marsh & McLennan Cos Inc | 160,848 | 18,819,216 | |||||
Progressive Corp | 886,204 | 87,627,851 | |||||
106,447,067 | |||||||
See Notes to Schedule of Investments and Other Information and Notes to Financial Statements. | |
Janus Aspen Series | 21 |
Janus Henderson VIT Balanced Portfolio
Schedule of Investments
December 31, 2020
Shares
or | Value | ||||||
Common Stocks– (continued) | |||||||
Interactive Media & Services – 2.6% | |||||||
Alphabet Inc - Class C* | 99,024 | $173,478,165 | |||||
Internet & Direct Marketing Retail – 3.6% | |||||||
Amazon.com Inc* | 64,096 | 208,756,185 | |||||
Booking Holdings Inc* | 15,665 | 34,890,185 | |||||
243,646,370 | |||||||
Leisure Products – 0.5% | |||||||
Hasbro Inc | 376,269 | 35,196,202 | |||||
Life Sciences Tools & Services – 1.3% | |||||||
Illumina Inc* | 64,632 | 23,913,840 | |||||
Thermo Fisher Scientific Inc | 132,841 | 61,874,681 | |||||
85,788,521 | |||||||
Machinery – 0.9% | |||||||
Deere & Co | 224,512 | 60,404,954 | |||||
Media – 1.4% | |||||||
Comcast Corp | 1,819,783 | 95,356,629 | |||||
Multiline Retail – 0.9% | |||||||
Dollar General Corp | 287,560 | 60,473,868 | |||||
Personal Products – 0.3% | |||||||
Estee Lauder Cos Inc | 64,313 | 17,119,477 | |||||
Pharmaceuticals – 3.4% | |||||||
Bristol-Myers Squibb Co | 987,784 | 61,272,241 | |||||
Eli Lilly & Co | 455,807 | 76,958,454 | |||||
Merck & Co Inc | 1,118,336 | 91,479,885 | |||||
229,710,580 | |||||||
Real Estate Management & Development – 0.4% | |||||||
CBRE Group Inc* | 471,033 | 29,543,190 | |||||
Road & Rail – 0.6% | |||||||
CSX Corp | 471,335 | 42,773,651 | |||||
Semiconductor & Semiconductor Equipment – 4.3% | |||||||
Advanced Micro Devices Inc* | 102,806 | 9,428,338 | |||||
Lam Research Corp | 205,666 | 97,129,882 | |||||
NVIDIA Corp | 145,134 | 75,788,975 | |||||
QUALCOMM Inc | 260,438 | 39,675,125 | |||||
Texas Instruments Inc | 377,343 | 61,933,307 | |||||
283,955,627 | |||||||
Software – 7.6% | |||||||
Adobe Inc* | 267,940 | 134,002,153 | |||||
Microsoft Corp | 1,441,907 | 320,809,780 | |||||
salesforce.com Inc* | 227,828 | 50,698,565 | |||||
505,510,498 | |||||||
Specialty Retail – 1.7% | |||||||
Home Depot Inc | 432,078 | 114,768,558 | |||||
Technology Hardware, Storage & Peripherals – 3.6% | |||||||
Apple Inc | 1,821,794 | 241,733,846 | |||||
Textiles, Apparel & Luxury Goods – 1.0% | |||||||
NIKE Inc | 487,865 | 69,018,262 | |||||
Wireless Telecommunication Services – 0.4% | |||||||
T-Mobile US Inc* | 183,902 | 24,799,185 | |||||
Total Common Stocks (cost $2,435,790,811) | 4,173,031,024 | ||||||
Preferred Stocks– 0.3% | |||||||
Banks – 0.3% | |||||||
First Republic Bank/CA, 4.1250%µ | 286,925 | 7,586,297 | |||||
Truist Financial Corp, 4.7500%µ | 328,875 | 9,099,971 | |||||
Total Preferred Stocks (cost $15,395,000) | 16,686,268 | ||||||
See Notes to Schedule of Investments and Other Information and Notes to Financial Statements. | |
22 | DECEMBER 31, 2020 |
Janus Henderson VIT Balanced Portfolio
Schedule of Investments
December 31, 2020
Shares
or | Value | ||||||
Investment Companies– 2.7% | |||||||
Money Markets – 2.7% | |||||||
Janus Henderson Cash Liquidity Fund LLC, 0.1108%ºº,£((cost $182,253,696) | 182,240,738 | $182,258,962 | |||||
Total Investments (total cost $4,931,416,784) – 101.7% | 6,795,724,738 | ||||||
Liabilities, net of Cash, Receivables and Other Assets – (1.7)% | (114,393,238) | ||||||
Net Assets – 100% | $6,681,331,500 | ||||||
Summary of Investments by Country - (Long Positions) (unaudited) | |||||
% of | |||||
Investment | |||||
Country | Value | Securities | |||
United States | $6,654,904,882 | 97.9 | % | ||
United Kingdom | 54,267,865 | 0.8 | |||
France | 22,658,719 | 0.3 | |||
Canada | 19,422,599 | 0.3 | |||
Switzerland | 15,506,932 | 0.2 | |||
Belgium | 10,323,455 | 0.2 | |||
Australia | 7,382,387 | 0.1 | |||
Mexico | 6,303,985 | 0.1 | |||
Spain | 4,953,914 | 0.1 | |||
Total | $6,795,724,738 | 100.0 | % |
Schedules of Affiliated Investments – (% of Net Assets)
Dividend Income | Realized Gain/(Loss) | Change in Unrealized Appreciation/ Depreciation | Value at 12/31/20 | |||||||
Investment Companies - 2.7% | ||||||||||
Money Markets - 2.7% | ||||||||||
Janus Henderson Cash Liquidity Fund LLC, 0.1108%ºº | $ | 716,444 | $ | (3,358) | $ | 5,668 | $ | 182,258,962 | ||
Value at 12/31/19 | Purchases | Sales Proceeds | Value at 12/31/20 | |||||||
Investment Companies - 2.7% | ||||||||||
Money Markets - 2.7% | ||||||||||
Janus Henderson Cash Liquidity Fund LLC, 0.1108%ºº | 105,128,872 | 1,889,317,681 | (1,812,189,901) | 182,258,962 | ||||||
See Notes to Schedule of Investments and Other Information and Notes to Financial Statements. | |
Janus Aspen Series | 23 |
Janus Henderson VIT Balanced Portfolio
Notes to Schedule of Investments and Other Information
Balanced Index | Balanced Index is an internally-calculated, hypothetical combination of total returns from the S&P 500® Index (55%) and the Bloomberg Barclays U.S. Aggregate Bond Index (45%). |
Bloomberg Barclays U.S. Aggregate Bond Index | Bloomberg Barclays U.S. Aggregate Bond Index is a broad-based measure of the investment grade, US dollar-denominated, fixed-rate taxable bond market. |
S&P 500® Index | S&P 500® Index reflects U.S. large-cap equity performance and represents broad U.S. equity market performance. |
ICE | Intercontinental Exchange |
LIBOR | London Interbank Offered Rate |
LLC | Limited Liability Company |
LP | Limited Partnership |
PLC | Public Limited Company |
SOFR | Secured Overnight Financing Rate |
TBA | (To Be Announced) Securities are purchased/sold on a forward commitment basis with an approximate principal amount and no defined maturity date. The actual principal and maturity date will be determined upon settlement when specific mortgage pools are assigned. |
144A | Securities sold under Rule 144A of the Securities Act of 1933, as amended, are subject to legal and/or contractual restrictions on resale and may not be publicly sold without registration under the 1933 Act. Unless otherwise noted, these securities have been determined to be liquid under guidelines established by the Board of Trustees. The total value of 144A securities as of the year ended December 31, 2020 is $673,353,732, which represents 10.1% of net assets. |
* | Non-income producing security. |
‡ | Variable or floating rate security. Rate shown is the current rate as of December 31, 2020. Certain variable rate securities are not based on a published reference rate and spread; they are determined by the issuer or agent and current market conditions. Reference rate is as of reset date and may vary by security, which may not indicate a reference rate and/or spread in their description. |
ÇÇ | Security is a U.S. Treasury Inflation-Protected Security (TIPS). |
ºº | Rate shown is the 7-day yield as of December 31, 2020. |
µ | Perpetual security. Perpetual securities have no stated maturity date, but they may be called/redeemed by the issuer. The date indicated, if any, represents the next call date. |
Ç | Step bond. The coupon rate will increase or decrease periodically based upon a predetermined schedule. The rate shown reflects the current rate. |
£ | The Portfolio may invest in certain securities that are considered affiliated companies. As defined by the Investment Company Act of 1940, as amended, an affiliated company is one in which the Portfolio owns 5% or more of the outstanding voting securities, or a company which is under common ownership or control. |
24 | DECEMBER 31, 2020 |
Janus Henderson VIT Balanced Portfolio
Notes to Schedule of Investments and Other Information
The following is a summary of the inputs that were used to value the Portfolio’s investments in securities and other financial instruments as of December 31, 2020. See Notes to Financial Statements for more information. | ||||||||||||
Valuation Inputs Summary | ||||||||||||
Level 2 - | Level 3 - | |||||||||||
Level 1 - | Other Significant | Significant | ||||||||||
Quoted Prices | Observable Inputs | Unobservable Inputs | ||||||||||
Assets | ||||||||||||
Investments In Securities: | ||||||||||||
Asset-Backed/Commercial Mortgage-Backed Securities | $ | - | $ | 357,398,963 | $ | - | ||||||
Bank Loans and Mezzanine Loans | - | 9,173,060 | - | |||||||||
Corporate Bonds | - | 1,311,028,620 | - | |||||||||
Inflation-Indexed Bonds | - | 75,574,743 | - | |||||||||
Mortgage-Backed Securities | - | 352,536,052 | - | |||||||||
United States Treasury Notes/Bonds | - | 318,037,046 | - | |||||||||
Common Stocks | 4,173,031,024 | - | - | |||||||||
Preferred Stocks | - | 16,686,268 | - | |||||||||
Investment Companies | - | 182,258,962 | - | |||||||||
Total Assets | $ | 4,173,031,024 | $ | 2,622,693,714 | $ | - | ||||||
Janus Aspen Series | 25 |
Janus Henderson VIT Balanced Portfolio
Statement of Assets and Liabilities
December 31, 2020
|
|
|
|
|
|
|
Assets: |
|
|
|
| ||
| Unaffiliated investments, at value(1) |
| $ | 6,613,465,776 |
| |
| Affiliated investments, at value(2) |
|
| 182,258,962 |
| |
| Cash |
|
| 742 |
| |
| Non-interested Trustees' deferred compensation |
|
| 153,670 |
| |
| Receivables: |
|
|
|
| |
|
| Interest |
|
| 13,488,088 |
|
|
| Portfolio shares sold |
|
| 4,732,515 |
|
|
| Dividends |
|
| 2,680,373 |
|
|
| Investments sold |
|
| 89,105 |
|
|
| Dividends from affiliates |
|
| 18,586 |
|
| Other assets |
|
| 39,435 |
| |
Total Assets |
|
| 6,816,927,252 |
| ||
Liabilities: |
|
|
|
| ||
| Payables: |
|
| — |
| |
|
| Investments purchased |
|
| 129,298,600 |
|
|
| Advisory fees |
|
| 3,346,044 |
|
|
| 12b-1 Distribution and shareholder servicing fees |
|
| 1,414,585 |
|
|
| Portfolio shares repurchased |
|
| 559,508 |
|
|
| Transfer agent fees and expenses |
|
| 322,675 |
|
|
| Non-interested Trustees' deferred compensation fees |
|
| 153,670 |
|
|
| Professional fees |
|
| 54,439 |
|
|
| Affiliated portfolio administration fees payable |
|
| 15,209 |
|
|
| Non-interested Trustees' fees and expenses |
|
| 8,249 |
|
|
| Custodian fees |
|
| 6,486 |
|
|
| Accrued expenses and other payables |
|
| 416,287 |
|
Total Liabilities |
|
| 135,595,752 |
| ||
Net Assets |
| $ | 6,681,331,500 |
| ||
Net Assets Consist of: |
|
|
|
| ||
| Capital (par value and paid-in surplus) |
| $ | 4,769,239,748 |
| |
| Total distributable earnings (loss) |
|
| 1,912,091,752 |
| |
Total Net Assets |
| $ | 6,681,331,500 |
| ||
Net Assets - Institutional Shares |
| $ | 464,280,285 |
| ||
| Shares Outstanding, $0.001 Par Value (unlimited shares authorized) |
|
| 10,652,454 |
| |
Net Asset Value Per Share |
| $ | 43.58 |
| ||
Net Assets - Service Shares |
| $ | 6,217,051,215 |
| ||
| Shares Outstanding, $0.001 Par Value (unlimited shares authorized) |
|
| 134,835,939 |
| |
Net Asset Value Per Share |
| $ | 46.11 |
| ||
(1) Includes cost of $4,749,163,088. (2) Includes cost of $182,253,696. |
See Notes to Financial Statements. | |
26 | DECEMBER 31, 2020 |
Janus Henderson VIT Balanced Portfolio
Statement of Operations
For the year ended December 31, 2020
|
|
|
|
|
|
Investment Income: |
|
|
| ||
| Interest | $ | 63,965,433 |
| |
| Dividends |
| 57,235,560 |
| |
| Dividends from affiliates |
| 716,444 |
| |
| Other income |
| 362,133 |
| |
| Foreign tax withheld |
| (76,198) |
| |
Total Investment Income |
| 122,203,372 |
| ||
Expenses: |
|
|
| ||
| Advisory fees |
| 31,406,892 |
| |
| 12b-1 Distribution and shareholder servicing fees: |
|
|
| |
|
| Service Shares |
| 13,183,407 |
|
| Transfer agent administrative fees and expenses: |
|
|
| |
|
| Institutional Shares |
| 216,736 |
|
|
| Service Shares |
| 2,638,436 |
|
| Other transfer agent fees and expenses: |
|
|
| |
|
| Institutional Shares |
| 20,591 |
|
|
| Service Shares |
| 110,092 |
|
| Affiliated portfolio administration fees |
| 142,759 |
| |
| Non-interested Trustees’ fees and expenses |
| 109,477 |
| |
| Professional fees |
| 82,514 |
| |
| Custodian fees |
| 49,838 |
| |
| Shareholder reports expense |
| 34,134 |
| |
| Registration fees |
| 23,486 |
| |
| Other expenses |
| 343,327 |
| |
Total Expenses |
| 48,361,689 |
| ||
Net Investment Income/(Loss) |
| 73,841,683 |
| ||
Net Realized Gain/(Loss) on Investments: |
|
|
| ||
| Investments and foreign currency transactions |
| 57,041,086 |
| |
| Investments in affiliates |
| (3,358) |
| |
Total Net Realized Gain/(Loss) on Investments |
| 57,037,728 |
| ||
Change in Unrealized Net Appreciation/Depreciation: |
|
|
| ||
| Investments and non-interested Trustees’ deferred compensation |
| 675,804,153 |
| |
| Investments in affiliates |
| 5,668 |
| |
Total Change in Unrealized Net Appreciation/Depreciation |
| 675,809,821 |
| ||
Net Increase/(Decrease) in Net Assets Resulting from Operations | $ | 806,689,232 |
| ||
|
|
|
|
|
|
See Notes to Financial Statements. | |
Janus Aspen Series | 27 |
Janus Henderson VIT Balanced Portfolio
Statements of Changes in Net Assets
|
|
|
|
|
|
|
|
|
|
|
| Year ended |
| Year ended |
| ||
Operations: |
|
|
|
|
|
| ||
| Net investment income/(loss) | $ | 73,841,683 |
| $ | 80,027,111 |
| |
| Net realized gain/(loss) on investments |
| 57,037,728 |
|
| 87,916,180 |
| |
| Change in unrealized net appreciation/depreciation |
| 675,809,821 |
|
| 729,551,886 |
| |
Net Increase/(Decrease) in Net Assets Resulting from Operations |
| 806,689,232 |
|
| 897,495,177 |
| ||
Dividends and Distributions to Shareholders: |
|
|
|
|
|
| ||
|
| Institutional Shares |
| (14,605,878) |
|
| (19,713,876) |
|
|
| Service Shares |
| (160,131,796) |
|
| (174,336,200) |
|
Net Decrease from Dividends and Distributions to Shareholders |
| (174,737,674) |
|
| (194,050,076) |
| ||
Capital Share Transactions: |
|
|
|
|
|
| ||
|
| Institutional Shares |
| (25,132,978) |
|
| (23,374,008) |
|
|
| Service Shares |
| 782,520,443 |
|
| 763,429,463 |
|
Net Increase/(Decrease) from Capital Share Transactions |
| 757,387,465 |
|
| 740,055,455 |
| ||
Net Increase/(Decrease) in Net Assets |
| 1,389,339,023 |
|
| 1,443,500,556 |
| ||
Net Assets: |
|
|
|
|
|
| ||
| Beginning of period |
| 5,291,992,477 |
|
| 3,848,491,921 |
| |
| End of period | $ | 6,681,331,500 |
| $ | 5,291,992,477 |
| |
|
|
|
|
|
|
|
|
|
See Notes to Financial Statements. | |
28 | DECEMBER 31, 2020 |
Janus Henderson VIT Balanced Portfolio
Financial Highlights
Institutional Shares |
|
|
|
|
|
|
|
|
|
|
|
|
|
|
| |||
For a share outstanding during the year ended December 31 |
| 2020 |
|
| 2019 |
|
| 2018 |
|
| 2017 |
|
| 2016 |
| |||
| Net Asset Value, Beginning of Period |
| $39.48 |
|
| $33.75 |
|
| $35.27 |
|
| $30.32 |
|
| $30.08 |
| ||
| Income/(Loss) from Investment Operations: |
|
|
|
|
|
|
|
|
|
|
|
|
|
|
| ||
|
| Net investment income/(loss)(1) |
| 0.61 |
|
| 0.74 |
|
| 0.66 |
|
| 0.64 |
|
| 0.58 |
| |
|
| Net realized and unrealized gain/(loss) |
| 4.86 |
|
| 6.74 |
|
| (0.42) |
|
| 4.92 |
|
| 0.77 |
| |
| Total from Investment Operations |
| 5.47 |
|
| 7.48 |
|
| 0.24 |
|
| 5.56 |
|
| 1.35 |
| ||
| Less Dividends and Distributions: |
|
|
|
|
|
|
|
|
|
|
|
|
|
|
| ||
|
| Dividends (from net investment income) |
| (0.73) |
|
| (0.72) |
|
| (0.77) |
|
| (0.54) |
|
| (0.67) |
| |
|
| Distributions (from capital gains) |
| (0.64) |
|
| (1.03) |
|
| (0.99) |
|
| (0.07) |
|
| (0.44) |
| |
| Total Dividends and Distributions |
| (1.37) |
|
| (1.75) |
|
| (1.76) |
|
| (0.61) |
|
| (1.11) |
| ||
| Net Asset Value, End of Period |
| $43.58 |
|
| $39.48 |
|
| $33.75 |
|
| $35.27 |
|
| $30.32 |
| ||
| Total Return* |
| 14.31% |
|
| 22.59% |
|
| 0.68% |
|
| 18.43% |
|
| 4.60% |
| ||
| Net Assets, End of Period (in thousands) |
| $464,280 |
|
| $446,026 |
|
| $402,796 |
|
| $429,403 |
|
| $403,833 |
| ||
| Average Net Assets for the Period (in thousands) |
| $430,893 |
|
| $426,775 |
|
| $429,843 |
|
| $417,575 |
|
| $413,338 |
| ||
| Ratios to Average Net Assets**: |
|
|
|
|
|
|
|
|
|
|
|
|
|
|
| ||
|
| Ratio of Gross Expenses |
| 0.62% |
|
| 0.62% |
|
| 0.63% |
|
| 0.63% |
|
| 0.62% |
| |
|
| Ratio of Net Expenses (After Waivers and Expense Offsets) |
| 0.62% |
|
| 0.62% |
|
| 0.63% |
|
| 0.63% |
|
| 0.62% |
| |
|
| Ratio of Net Investment Income/(Loss) |
| 1.54% |
|
| 1.99% |
|
| 1.85% |
|
| 1.94% |
|
| 1.94% |
| |
| Portfolio Turnover Rate |
| 80%(2) |
|
| 79%(2) |
|
| 97%(2) |
|
| 67%(2) |
|
| 80% |
| ||
Service Shares |
|
|
|
|
|
|
|
|
|
|
|
|
|
|
| |||
For a share outstanding during the year ended December 31 |
| 2020 |
|
| 2019 |
|
| 2018 |
|
| 2017 |
|
| 2016 |
| |||
| Net Asset Value, Beginning of Period |
| $41.70 |
|
| $35.59 |
|
| $37.09 |
|
| $31.89 |
|
| $31.61 |
| ||
| Income/(Loss) from Investment Operations: |
|
|
|
|
|
|
|
|
|
|
|
|
|
|
| ||
|
| Net investment income/(loss)(1) |
| 0.54 |
|
| 0.68 |
|
| 0.60 |
|
| 0.58 |
|
| 0.53 |
| |
|
| Net realized and unrealized gain/(loss) |
| 5.15 |
|
| 7.11 |
|
| (0.44) |
|
| 5.17 |
|
| 0.80 |
| |
| Total from Investment Operations |
| 5.69 |
|
| 7.79 |
|
| 0.16 |
|
| 5.75 |
|
| 1.33 |
| ||
| Less Dividends and Distributions: |
|
|
|
|
|
|
|
|
|
|
|
|
|
|
| ||
|
| Dividends (from net investment income) |
| (0.64) |
|
| (0.65) |
|
| (0.67) |
|
| (0.48) |
|
| (0.61) |
| |
|
| Distributions (from capital gains) |
| (0.64) |
|
| (1.03) |
|
| (0.99) |
|
| (0.07) |
|
| (0.44) |
| |
| Total Dividends and Distributions |
| (1.28) |
|
| (1.68) |
|
| (1.66) |
|
| (0.55) |
|
| (1.05) |
| ||
| Net Asset Value, End of Period |
| $46.11 |
|
| $41.70 |
|
| $35.59 |
|
| $37.09 |
|
| $31.89 |
| ||
| Total Return* |
| 14.05% |
|
| 22.27% |
|
| 0.43% |
|
| 18.13% |
|
| 4.32% |
| ||
| Net Assets, End of Period (in thousands) |
| $6,217,051 |
|
| $4,845,966 |
|
| $3,445,696 |
|
| $2,887,613 |
|
| $2,227,878 |
| ||
| Average Net Assets for the Period (in thousands) |
| $5,239,258 |
|
| $4,109,486 |
|
| $3,235,435 |
|
| $2,523,514 |
|
| $1,938,234 |
| ||
| Ratios to Average Net Assets**: |
|
|
|
|
|
|
|
|
|
|
|
|
|
|
| ||
|
| Ratio of Gross Expenses |
| 0.87% |
|
| 0.87% |
|
| 0.88% |
|
| 0.88% |
|
| 0.87% |
| |
|
| Ratio of Net Expenses (After Waivers and Expense Offsets) |
| 0.87% |
|
| 0.87% |
|
| 0.88% |
|
| 0.88% |
|
| 0.87% |
| |
|
| Ratio of Net Investment Income/(Loss) |
| 1.28% |
|
| 1.74% |
|
| 1.62% |
|
| 1.69% |
|
| 1.71% |
| |
| Portfolio Turnover Rate |
| 80%(2) |
|
| 79%(2) |
|
| 97%(2) |
|
| 67%(2) |
|
| 80% |
| ||
* Total return includes adjustments in accordance with generally accepted accounting principles required at the year or period end and are not annualized for periods of less than one full year. Total return does not include fees, charges, or expenses imposed by the variable annuity and life insurance contracts for which Janus Aspen Series serves as an underlying investment vehicle. ** Annualized for periods of less than one full year. (1) Per share amounts are calculated based on average shares outstanding during the year or period. (2) Portfolio Turnover Rate excludes TBA (to be announced) purchase and sales commitments. |
See Notes to Financial Statements. | |
Janus Aspen Series | 29 |
Janus Henderson VIT Balanced Portfolio
Notes to Financial Statements
1. Organization and Significant Accounting Policies
Janus Henderson VIT Balanced Portfolio (the “Portfolio”) is a series of Janus Aspen Series (the “Trust”), which is organized as a Delaware statutory trust and is registered under the Investment Company Act of 1940, as amended (the “1940 Act”), as an open-end management investment company, and therefore has applied the specialized accounting and reporting guidance in Financial Accounting Standards Board (“FASB”) Accounting Standards Codification (“ASC”) Topic 946. The Trust offers 11 portfolios, each of which offers multiple share classes, with differing investment objectives and policies. The Portfolio seeks long-term capital growth, consistent with preservation of capital and balanced by current income. The Portfolio is classified as diversified, as defined in the 1940 Act.
The Portfolio currently offers two classes of shares: Institutional Shares and Service Shares. Each class represents an interest in the same portfolio of investments. Institutional Shares are offered only in connection with investment in and payments under variable insurance contracts as well as certain qualified retirement plans. Service Shares are offered only in connection with investment in and payments under variable insurance contracts as well as certain qualified retirement plans that require a fee from Portfolio assets to procure distribution and administrative services to contract owners and plan participants.
Shareholders, including other portfolios, participating insurance companies, as well as accounts, may from time to time own (beneficially or of record) a significant percentage of the Portfolio’s Shares and can be considered to “control” the Portfolio when that ownership exceeds 25% of the Portfolio’s assets (and which may differ from control as determined in accordance with United States of America generally accepted accounting priciples ("US GAAP")).
The following accounting policies have been followed by the Portfolio and are in conformity with US GAAP.
Investment Valuation
Securities held by the Portfolio are valued in accordance with policies and procedures established by and under the supervision of the Trustees (the “Valuation Procedures”). Equity securities traded on a domestic securities exchange are generally valued at the closing prices on the primary market or exchange on which they trade. If such price is lacking for the trading period immediately preceding the time of determination, such securities are valued at their current bid price. Equity securities that are traded on a foreign exchange are generally valued at the closing prices on such markets. In the event that there is no current trading volume on a particular security in such foreign exchange, the bid price from the primary exchange is generally used to value the security. Securities that are traded on the over-the-counter (“OTC”) markets are generally valued at their closing or latest bid prices as available. Foreign securities and currencies are converted to U.S. dollars using the applicable exchange rate in effect at the close of the New York Stock Exchange (“NYSE”). The Portfolio will determine the market value of individual securities held by it by using prices provided by one or more approved professional pricing services or, as needed, by obtaining market quotations from independent broker-dealers. Most debt securities are valued in accordance with the evaluated bid price supplied by the pricing service that is intended to reflect market value. The evaluated bid price supplied by the pricing service is an evaluation that may consider factors such as security prices, yields, maturities and ratings. Certain short-term securities maturing within 60 days or less may be evaluated and valued on an amortized cost basis provided that the amortized cost determined approximates market value. Securities for which market quotations or evaluated prices are not readily available or deemed unreliable are valued at fair value determined in good faith under the Valuation Procedures. Circumstances in which fair value pricing may be utilized include, but are not limited to: (i) a significant event that may affect the securities of a single issuer, such as a merger, bankruptcy, or significant issuer-specific development; (ii) an event that may affect an entire market, such as a natural disaster or significant governmental action; (iii) a nonsignificant event such as a market closing early or not opening, or a security trading halt; and (iv) pricing of a nonvalued security and a restricted or nonpublic security. Special valuation considerations may apply with respect to “odd-lot” fixed-income transactions which, due to their small size, may receive evaluated prices by pricing services which reflect a large block trade and not what actually could be obtained for the odd-lot position. The Portfolio uses systematic fair valuation models provided by independent third parties to value international equity securities in order to adjust for stale pricing, which may occur between the close of certain foreign exchanges and the close of the NYSE.
Valuation Inputs Summary
FASB ASC 820, Fair Value Measurements and Disclosures (“ASC 820”), defines fair value, establishes a framework for measuring fair value, and expands disclosure requirements regarding fair value measurements. This standard emphasizes that fair value is a market-based measurement that should be determined based on the assumptions that
30 | DECEMBER 31, 2020 |
Janus Henderson VIT Balanced Portfolio
Notes to Financial Statements
market participants would use in pricing an asset or liability and establishes a hierarchy that prioritizes inputs to valuation techniques used to measure fair value. These inputs are summarized into three broad levels:
Level 1 – Unadjusted quoted prices in active markets the Portfolio has the ability to access for identical assets or liabilities.
Level 2 – Observable inputs other than unadjusted quoted prices included in Level 1 that are observable for the asset or liability either directly or indirectly. These inputs may include quoted prices for the identical instrument on an inactive market, prices for similar instruments, interest rates, prepayment speeds, credit risk, yield curves, default rates and similar data.
Assets or liabilities categorized as Level 2 in the hierarchy generally include: debt securities fair valued in accordance with the evaluated bid or ask prices supplied by a pricing service; securities traded on OTC markets and listed securities for which no sales are reported that are fair valued at the latest bid price (or yield equivalent thereof) obtained from one or more dealers transacting in a market for such securities or by a pricing service approved by the Portfolio’s Trustees; certain short-term debt securities with maturities of 60 days or less that are fair valued at amortized cost; and equity securities of foreign issuers whose fair value is determined by using systematic fair valuation models provided by independent third parties in order to adjust for stale pricing which may occur between the close of certain foreign exchanges and the close of the NYSE. Other securities that may be categorized as Level 2 in the hierarchy include, but are not limited to, preferred stocks, bank loans, swaps, investments in unregistered investment companies, options, and forward contracts.
Level 3 – Unobservable inputs for the asset or liability to the extent that relevant observable inputs are not available, representing the Portfolio’s own assumptions about the assumptions that a market participant would use in valuing the asset or liability, and that would be based on the best information available.
There have been no significant changes in valuation techniques used in valuing any such positions held by the Portfolio since the beginning of the fiscal year.
The inputs or methodology used for fair valuing securities are not necessarily an indication of the risk associated with investing in those securities. The summary of inputs used as of December 31, 2020 to fair value the Portfolio’s investments in securities and other financial instruments is included in the “Valuation Inputs Summary” in the Notes to Schedule of Investments and Other Information.
Investment Transactions and Investment Income
Investment transactions are accounted for as of the date purchased or sold (trade date). Dividend income is recorded on the ex-dividend date. Certain dividends from foreign securities will be recorded as soon as the Portfolio is informed of the dividend, if such information is obtained subsequent to the ex-dividend date. Dividends from foreign securities may be subject to withholding taxes in foreign jurisdictions. Interest income is recorded daily on the accrual basis and includes amortization of premiums and accretion of discounts. The Portfolio classifies gains and losses on prepayments received as an adjustment to interest income. Debt securities may be placed in non-accrual status and related interest income may be reduced by stopping current accruals and writing off interest receivables when collection of all or a portion of interest has become doubtful. Gains and losses are determined on the identified cost basis, which is the same basis used for federal income tax purposes. Income, as well as gains and losses, both realized and unrealized, are allocated daily to each class of shares based upon the ratio of net assets represented by each class as a percentage of total net assets.
Expenses
The Portfolio bears expenses incurred specifically on its behalf. Each class of shares bears a portion of general expenses, which are allocated daily to each class of shares based upon the ratio of net assets represented by each class as a percentage of total net assets. Expenses directly attributable to a specific class of shares are charged against the operations of such class.
Estimates
The preparation of financial statements in conformity with US GAAP requires management to make estimates and assumptions that affect the reported amount of assets and liabilities and disclosure of contingent assets and liabilities at the date of the financial statements, and the reported amounts of income and expenses during the reporting period. Actual results could differ from those estimates.
Janus Aspen Series | 31 |
Janus Henderson VIT Balanced Portfolio
Notes to Financial Statements
Indemnifications
In the normal course of business, the Portfolio may enter into contracts that contain provisions for indemnification of other parties against certain potential liabilities. The Portfolio’s maximum exposure under these arrangements is unknown, and would involve future claims that may be made against the Portfolio that have not yet occurred. Currently, the risk of material loss from such claims is considered remote.
Foreign Currency Translations
The Portfolio does not isolate that portion of the results of operations resulting from the effect of changes in foreign exchange rates on investments from the fluctuations arising from changes in market prices of securities held at the date of the financial statements. Net unrealized appreciation or depreciation of investments and foreign currency translations arise from changes in the value of assets and liabilities, including investments in securities held at the date of the financial statements, resulting from changes in the exchange rates and changes in market prices of securities held.
Currency gains and losses are also calculated on payables and receivables that are denominated in foreign currencies. The payables and receivables are generally related to foreign security transactions and income translations.
Foreign currency-denominated assets and forward currency contracts may involve more risks than domestic transactions, including currency risk, counterparty risk, political and economic risk, regulatory risk and equity risk. Risks may arise from unanticipated movements in the value of foreign currencies relative to the U.S. dollar.
Dividends and Distributions
The Portfolio may make semiannual distributions of substantially all of its investment income and an annual distribution of its net realized capital gains (if any).
The Portfolio may make certain investments in real estate investment trusts (“REITs”) which pay dividends to their shareholders based upon funds available from operations. It is quite common for these dividends to exceed the REITs’ taxable earnings and profits, resulting in the excess portion of such dividends being designated as a return of capital. If the Portfolio distributes such amounts, such distributions could constitute a return of capital to shareholders for federal income tax purposes.
Federal Income Taxes
The Portfolio intends to continue to qualify as a regulated investment company and distribute all of its taxable income in accordance with the requirements of Subchapter M of the Internal Revenue Code. Management has analyzed the Portfolio’s tax positions taken for all open federal income tax years, generally a three-year period, and has concluded that no provision for federal income tax is required in the Portfolio’s financial statements. The Portfolio is not aware of any tax positions for which it is reasonably possible that the total amounts of unrecognized tax benefits will significantly change in the next twelve months.
2. Other Investments and Strategies
Additional Investment Risk
The Portfolio may be invested in lower-rated debt securities that have a higher risk of default or loss of value since these securities may be sensitive to economic changes, political changes, or adverse developments specific to the issuer.
In the aftermath of the 2007-2008 financial crisis, the financial sector experienced reduced liquidity in credit and other fixed-income markets, and an unusually high degree of volatility, both domestically and internationally. In response to the crisis, the United States and certain foreign governments, along with the U.S. Federal Reserve and certain foreign central banks, took a number of unprecedented steps designed to support the financial markets. For example, the enactment of the Dodd-Frank Act in 2010 provided for widespread regulation of financial institutions, consumer financial products and services, broker-dealers, over-the-counter derivatives, investment advisers, credit rating agencies, and mortgage lending, which expanded federal oversight in the financial sector, including the investment management industry. More recently, in response to the COVID-19 pandemic, the U.S. government and the Federal Reserve, as well as certain foreign governments and central banks, have taken extraordinary actions to support local and global economies and the financial markets, including reducing interest rates to record-low levels. Extremely low or negative interest rates may become more prevalent or may not work as intended. As there is little precedent for this situation, the impact on various markets that interest rate or other significant policy changes may have is unknown. The withdrawal of this support, a failure of measures put in place in response to such economic uncertainty, or investor perception that
32 | DECEMBER 31, 2020 |
Janus Henderson VIT Balanced Portfolio
Notes to Financial Statements
such efforts were not sufficient could each negatively affect financial markets generally, and the value and liquidity of specific securities. In addition, policy and legislative changes in the United States and in other countries continue to impact many aspects of financial regulation.
Widespread disease, including pandemics and epidemics, and natural or environmental disasters, such as earthquakes, fires, floods, hurricanes, tsunamis and weather-related phenomena generally, have been and can be highly disruptive to economies and markets, adversely impacting individual companies, sectors, industries, markets, currencies, interest and inflation rates, credit ratings, investor sentiment, and other factors affecting the value of a Fund’s investments. Economies and financial markets throughout the world have become increasingly interconnected, which increases the likelihood that events or conditions in one region or country will adversely affect markets or issuers in other regions or countries, including the United States. These disruptions could prevent a Fund from executing advantageous investment decisions in a timely manner and negatively impact a Fund’s ability to achieve its investment objective(s). Any such event(s) could have a significant adverse impact on the value of a Fund. In addition, these disruptions could also impair the information technology and other operational systems upon which the Fund’s service providers, including Janus Capital Management LLC ("Janus Capital") or the subadviser (as applicable), rely, and could otherwise disrupt the ability of employees of the Fund’s service providers to perform essential tasks on behalf of the Fund. Adverse weather conditions may also have a particularly significant negative effect on issuers in the agricultural sector and on insurance and reinsurance companies that insure or reinsure against the impact of natural disasters.
A number of countries in the European Union (the “EU”) have experienced, and may continue to experience, severe economic and financial difficulties. In particular, many EU nations are susceptible to economic risks associated with high levels of debt. Many non-governmental issuers, and even certain governments, have defaulted on, or been forced to restructure, their debts. Many other issuers have faced difficulties obtaining credit or refinancing existing obligations. Financial institutions have in many cases required government or central bank support, have needed to raise capital, and/or have been impaired in their ability to extend credit. As a result, financial markets in the EU have experienced extreme volatility and declines in asset values and liquidity. These difficulties may continue, worsen, or spread further within the EU. Responses to these financial problems by European governments, central banks, and others, including austerity measures and reforms, may not work, may result in social unrest, and may limit future growth and economic recovery or have other unintended consequences. The risk of investing in securities in the European markets may also be heightened due to the referendum in which the United Kingdom voted to exit the EU, commonly known as “Brexit,” which immediately led to significant market volatility around the world, as well as political, economic and legal uncertainty. The United Kingdom formally left the EU on January 31, 2020 and entered into an eleven-month transition period, which expired on December 31, 2020. The negative impact on not only the United Kingdom and European economies could be significant, potentially resulting in increased volatility and illiquidity and lower economic growth for companies that rely significantly on the United Kingdom and/or Europe for their business activities and revenues. Any further exits from the EU, or an increase in the belief that such exits are likely or possible, would likely cause additional market disruption globally and introduce new legal and regulatory uncertainties.
Inflation-Linked Securities
The Portfolio may invest in inflation-indexed bonds, including municipal inflation-indexed bonds and corporate inflation-indexed bonds, or in derivatives that are linked to these securities. Inflation-linked bonds are fixed-income securities that have a principal value that is periodically adjusted according to the rate of inflation. If an index measuring inflation falls, the principal value of inflation-indexed bonds will typically be adjusted downward, and consequently the interest payable on these securities (calculated with respect to a smaller principal amount) will be reduced. Because of their inflation adjustment feature, inflation-linked bonds typically have lower yields than conventional fixed-rate bonds. In addition, inflation-linked bonds also normally decline in price when real interest rates rise. In the event of deflation, when prices decline over time, the principal and income of inflation-linked bonds would likely decline, resulting in losses to the Portfolio.
In the case of Treasury Inflation-Protected Securities, also known as TIPS, repayment of original bond principal upon maturity (as adjusted for inflation) is guaranteed by the U.S. Treasury. For inflation-linked bonds that do not provide a similar guarantee, the adjusted principal value of the inflation-linked bond repaid at maturity may be less than the original principal. Other non-U.S. sovereign governments also issue inflation-linked securities (sometimes referred to as “linkers”) that are tied to their own local consumer price indices. In certain of these non-U.S. jurisdictions, the repayment of the original bond principal upon the maturity of an inflation-linked bond is not guaranteed, allowing for the amount of the bond repaid at maturity to be less than par. Inflation-linked bonds may also be issued by, or related to, sovereign
Janus Aspen Series | 33 |
Janus Henderson VIT Balanced Portfolio
Notes to Financial Statements
governments of other developed countries, emerging market countries, or companies or other entities not affiliated with governments.
Loans
The Portfolio may invest in various commercial loans, including bank loans, bridge loans, debtor-in-possession (“DIP”) loans, mezzanine loans, and other fixed and floating rate loans. These loans may be acquired through loan participations and assignments or on a when-issued basis. Commercial loans will comprise no more than 20% of the Portfolio’s total assets. Below are descriptions of the types of loans held by the Portfolio as of December 31, 2020.
· Bank Loans - Bank loans are obligations of companies or other entities entered into in connection with recapitalizations, acquisitions, and refinancings. The Portfolio’s investments in bank loans are generally acquired as a participation interest in, or assignment of, loans originated by a lender or other financial institution. These investments may include institutionally-traded floating and fixed-rate debt securities.
· Floating Rate Loans – Floating rate loans are debt securities that have floating interest rates, that adjust periodically, and are tied to a benchmark lending rate, such as London Interbank Offered Rate (“LIBOR”). In other cases, the lending rate could be tied to the prime rate offered by one or more major U.S. banks or the rate paid on large certificates of deposit traded in the secondary markets. If the benchmark lending rate changes, the rate payable to lenders under the loan will change at the next scheduled adjustment date specified in the loan agreement. Floating rate loans are typically issued to companies (‘‘borrowers’’) in connection with recapitalizations, acquisitions, and refinancings. Floating rate loan investments are generally below investment grade. Senior floating rate loans are secured by specific collateral of a borrower and are senior in the borrower’s capital structure. The senior position in the borrower’s capital structure generally gives holders of senior loans a claim on certain of the borrower’s assets that is senior to subordinated debt and preferred and common stock in the case of a borrower’s default. Floating rate loan investments may involve foreign borrowers, and investments may be denominated in foreign currencies. Floating rate loans often involve borrowers whose financial condition is troubled or uncertain and companies that are highly leveraged. The Portfolio may invest in obligations of borrowers who are in bankruptcy proceedings. While the Portfolio generally expects to invest in fully funded term loans, certain of the loans in which the Portfolio may invest include revolving loans, bridge loans, and delayed draw term loans.
Purchasers of floating rate loans may pay and/or receive certain fees. The Portfolio may receive fees such as covenant waiver fees or prepayment penalty fees. The Portfolio may pay fees such as facility fees. Such fees may affect the Portfolio’s return.
· Mezzanine Loans - Mezzanine loans are secured by the stock of the company that owns the assets. Mezzanine loans are a hybrid of debt and equity financing that is typically used to fund the expansion of existing companies. A mezzanine loan is composed of debt capital that gives the lender the right to convert to an ownership or equity interest in the company if the loan is not paid back in time and in full. Mezzanine loans typically are the most subordinated debt obligation in an issuer’s capital structure.
Mortgage- and Asset-Backed Securities
Mortgage- and asset-backed securities represent interests in “pools” of commercial or residential mortgages or other assets, including consumer and commercial loans or receivables. The Portfolio may purchase fixed or variable rate commercial or residential mortgage-backed securities issued by the Government National Mortgage Association (“Ginnie Mae”), the Federal National Mortgage Association (“Fannie Mae”), the Federal Home Loan Mortgage Corporation (“Freddie Mac”), or other governmental or government-related entities. Ginnie Mae’s guarantees are backed as to the timely payment of principal and interest by the full faith and credit of the U.S. Government. Fannie Mae and Freddie Mac securities are not backed by the full faith and credit of the U.S. Government. In September 2008, the Federal Housing Finance Agency (“FHFA”), an agency of the U.S. Government, placed Fannie Mae and Freddie Mac under conservatorship. Since that time, Fannie Mae and Freddie Mac have received capital support through U.S. Treasury preferred stock purchases and Treasury and Federal Reserve purchases of their mortgage-backed securities. The FHFA and the U.S. Treasury have imposed strict limits on the size of these entities’ mortgage portfolios. The FHFA has the power to cancel any contract entered into by Fannie Mae and Freddie Mac prior to FHFA’s appointment as conservator or receiver, including the guarantee obligations of Fannie Mae and Freddie Mac.
The Portfolio may also purchase other mortgage- and asset-backed securities through single- and multi-seller conduits, collateralized debt obligations, structured investment vehicles, and other similar securities. Asset-backed securities may
34 | DECEMBER 31, 2020 |
Janus Henderson VIT Balanced Portfolio
Notes to Financial Statements
be backed by various consumer obligations, including automobile loans, equipment leases, credit card receivables, or other collateral. In the event the underlying loans are not paid, the securities’ issuer could be forced to sell the assets and recognize losses on such assets, which could impact your return. Unlike traditional debt instruments, payments on these securities include both interest and a partial payment of principal. Mortgage- and asset-backed securities are subject to both extension risk, where borrowers pay off their debt obligations more slowly in times of rising interest rates, and prepayment risk, where borrowers pay off their debt obligations sooner than expected in times of declining interest rates. These risks may reduce the Portfolio’s returns. In addition, investments in mortgage- and asset-backed securities, including those comprised of subprime mortgages, may be subject to a higher degree of credit risk, valuation risk, extension risk (if interest rates rise), and liquidity risk than various other types of fixed-income securities. Additionally, although mortgage-backed securities are generally supported by some form of government or private guarantee and/or insurance, there is no assurance that guarantors or insurers will meet their obligations.
Real Estate Investing
The Portfolio may invest in equity and debt securities of real estate-related companies. Such companies may include those in the real estate industry or real estate-related industries. These securities may include common stocks, corporate bonds, preferred stocks, and other equity securities, including, but not limited to, mortgage-backed securities, real estate-backed securities, securities of REITs and similar REIT-like entities. A REIT is a trust that invests in real estate-related projects, such as properties, mortgage loans, and construction loans. REITs are generally categorized as equity, mortgage, or hybrid REITs. A REIT may be listed on an exchange or traded OTC.
Sovereign Debt
The Portfolio may invest in U.S. and non-U.S. government debt securities (“sovereign debt”). Some investments in sovereign debt, such as U.S. sovereign debt, are considered low risk. However, investments in sovereign debt, especially the debt of less developed countries, can involve a high degree of risk, including the risk that the governmental entity that controls the repayment of sovereign debt may not be willing or able to repay the principal and/or to pay the interest on its sovereign debt in a timely manner. A sovereign debtor’s willingness or ability to satisfy its debt obligation may be affected by various factors including, but not limited to, its cash flow situation, the extent of its foreign currency reserves, the availability of foreign exchange when a payment is due, the relative size of its debt position in relation to its economy as a whole, the sovereign debtor’s policy toward international lenders, and local political constraints to which the governmental entity may be subject. Sovereign debtors may also be dependent on expected disbursements from foreign governments, multilateral agencies, and other entities. The failure of a sovereign debtor to implement economic reforms, achieve specified levels of economic performance, or repay principal or interest when due may result in the cancellation of third party commitments to lend funds to the sovereign debtor, which may further impair such debtor’s ability or willingness to timely service its debts. The Portfolio may be requested to participate in the rescheduling of such sovereign debt and to extend further loans to governmental entities, which may adversely affect the Portfolio’s holdings. In the event of default, there may be limited or no legal remedies for collecting sovereign debt and there may be no bankruptcy proceedings through which the Portfolio may collect all or part of the sovereign debt that a governmental entity has not repaid. In addition, to the extent the Portfolio invests in non-U.S. sovereign debt, it may be subject to currency risk.
TBA Commitments
The Portfolio may enter into “to be announced” or “TBA” commitments. TBAs are forward agreements for the purchase or sale of securities, including mortgage-backed securities, for a fixed price, with payment and delivery on an agreed upon future settlement date. The specific securities to be delivered are not identified at the trade date. However, delivered securities must meet specified terms, including issuer, rate, and mortgage terms. Although the particular TBA securities must meet industry-accepted “good delivery” standards, there can be no assurance that a security purchased on forward commitment basis will ultimately be issued or delivered by the counterparty. During the settlement period, the Portfolio will still bear the risk of any decline in the value of the security to be delivered. Because TBA commitments do not require the purchase and sale of identical securities, the characteristics of the security delivered to the Portfolio may be less favorable than the security delivered to the dealer. If the counterparty to a transaction fails to deliver the security, the Portfolio could suffer a loss.
When-Issued, Delayed Delivery and Forward Commitment Transactions
The Portfolio may purchase or sell securities on a when-issued, delayed delivery, or forward commitment basis. When purchasing a security on a when-issued, delayed delivery, or forward commitment basis, the Portfolio assumes the rights and risks of ownership of the security, including the risk of price and yield fluctuations, and takes such fluctuations into
Janus Aspen Series | 35 |
Janus Henderson VIT Balanced Portfolio
Notes to Financial Statements
account when determining its net asset value. Typically, no income accrues on securities the Portfolio has committed to purchase prior to the time delivery of the securities is made. Because the Portfolio is not required to pay for the security until the delivery date, these risks are in addition to the risks associated with the Portfolio’s other investments. If the other party to a transaction fails to deliver the securities, the Portfolio could miss a favorable price or yield opportunity. If the Portfolio remains substantially fully invested at a time when when-issued, delayed delivery, or forward commitment purchases are outstanding, the purchases may result in a form of leverage.
When the Portfolio has sold a security on a when-issued, delayed delivery, or forward commitment basis, the Portfolio does not participate in future gains or losses with respect to the security. If the other party to a transaction fails to pay for the securities, the Portfolio could suffer a loss. Additionally, when selling a security on a when-issued, delayed delivery, or forward commitment basis without owning the security, the Portfolio will incur a loss if the security’s price appreciates in value such that the security’s price is above the agreed upon price on the settlement date. The Portfolio may dispose of or renegotiate a transaction after it is entered into, and may purchase or sell when-issued, delayed delivery or forward commitment securities before the settlement date, which may result in a gain or loss.
3. Investment Advisory Agreements and Other Transactions with Affiliates
The Portfolio pays Janus Capital Management LLC (“Janus Capital”) an investment advisory fee which is calculated daily and paid monthly. The Portfolio’s contractual investment advisory fee rate (expressed as an annual rate) is 0.55% of its average daily net assets.
Janus Services LLC (“Janus Services”), a wholly-owned subsidiary of Janus Capital, is the Portfolio’s transfer agent. Janus Services receives an administrative services fee at an annual rate of 0.05% of the average daily net assets of the Portfolio for arranging for the provision by participating insurance companies and qualified plan service providers of administrative services, including recordkeeping, subaccounting, order processing, or other shareholder services provided on behalf of contract holders or plan participants investing in the Portfolio. Other shareholder services may include the provision of order confirmations, periodic account statements, forwarding prospectuses, shareholder reports, and other materials to existing investors, and answering inquiries regarding accounts. Janus Services expects to use this entire fee to compensate insurance companies and qualified plan service providers for providing these services to their customers who invest in the Portfolio. Any unused portion will be reimbursed to the applicable share class at least annually.
In addition, Janus Services provides or arranges for the provision of certain other internal administrative, recordkeeping, and shareholder relations services for the Portfolio. Janus Services is not compensated for these internal services related to the shares, except for out-of-pocket costs. These amounts are disclosed as “Other transfer agent fees and expenses” on the Statement of Operations.
Under a distribution and shareholder servicing plan (the “Plan”) adopted in accordance with Rule 12b-1 under the 1940 Act, the Service Shares may pay the Trust’s distributor, Janus Distributors LLC (“Janus Distributors”), a wholly-owned subsidiary of Janus Capital, a fee for the sale and distribution and/or shareholder servicing of the Service Shares at an annual rate of up to 0.25% of the average daily net assets of the Service Shares. Under the terms of the Plan, the Trust is authorized to make payments to Janus Distributors for remittance to insurance companies and qualified plan service providers as compensation for distribution and/or shareholder services performed by such entities. These amounts are disclosed as “12b-1 Distribution and shareholder servicing fees” on the Statement of Operations. Payments under the Plan are not tied exclusively to actual 12b-1 distribution and servicing fees, and the payments may exceed 12b-1 distribution and servicing fees actually incurred. If any of the Portfolio’s actual 12b-1 distribution and servicing fees incurred during a calendar year are less than the payments made during a calendar year, the Portfolio will be refunded the difference. Refunds, if any, are included in “12b-1 Distribution and shareholder servicing fees” in the Statement of Operations.
Janus Capital serves as administrator to the Portfolio pursuant to an administration agreement between Janus Capital and the Trust. Under the administration agreement, Janus Capital is obligated to provide or arrange for the provision of certain administration, compliance, and accounting services to the Portfolio, including providing office space for the Portfolio, and is reimbursed by the Portfolio for certain of its costs in providing these services (to the extent Janus Capital seeks reimbursement and such costs are not otherwise waived). In addition, employees of Janus Capital and/or its affiliates may serve as officers of the Trust. The Portfolio pays for some or all of the salaries, fees, and expenses of Janus Capital employees and Portfolio officers, with respect to certain specified administration functions they perform on behalf of the Portfolio. The Portfolio pays these costs based on out-of-pocket expenses incurred by Janus Capital,
36 | DECEMBER 31, 2020 |
Janus Henderson VIT Balanced Portfolio
Notes to Financial Statements
and these costs are separate and apart from advisory fees and other expenses paid in connection with the investment advisory services Janus Capital (or any subadvisor, as applicable) provides to the Portfolio. These amounts are disclosed as “Affiliated portfolio administration fees” on the Statement of Operations. In addition, some expenses related to compensation payable to the Portfolio’s Chief Compliance Officer and certain compliance staff, all of whom are employees of Janus Capital and/or its affiliates, are shared with the Portfolio. Total compensation of $34,973 was paid to the Chief Compliance Officer and certain compliance staff by the Trust during the year ended December 31, 2020. The Portfolio's portion is reported as part of “Other expenses” on the Statement of Operations.
The Board of Trustees has adopted a deferred compensation plan (the “Deferred Plan”) for independent Trustees to elect to defer receipt of all or a portion of the annual compensation they are entitled to receive from the Portfolio. All deferred fees are credited to an account established in the name of the Trustees. The amounts credited to the account then increase or decrease, as the case may be, in accordance with the performance of one or more of the Janus Henderson funds that are selected by the Trustees. The account balance continues to fluctuate in accordance with the performance of the selected fund or funds until final payment of all amounts are credited to the account. The fluctuation of the account balance is recorded by the Portfolio as unrealized appreciation/(depreciation) and is included as of December 31, 2020 on the Statement of Assets and Liabilities in the asset, “Non-interested Trustees’ deferred compensation,” and liability, “Non-interested Trustees’ deferred compensation fees.” Additionally, the recorded unrealized appreciation/(depreciation) is included in “Total distributable earnings (loss)” on the Statement of Assets and Liabilities. Deferred compensation expenses for the year ended December 31, 2020 are included in “Non-interested Trustees’ fees and expenses” on the Statement of Operations. Trustees are allowed to change their designation of mutual funds from time to time. Amounts will be deferred until distributed in accordance with the Deferred Plan. Deferred fees of $471,450 were paid by the Trust to the Trustees under the Deferred Plan during the year ended December 31, 2020.
Pursuant to the provisions of the 1940 Act and related rules, the Portfolio may participate in an affiliated or non-affiliated cash sweep program. In the cash sweep program, uninvested cash balances of the Portfolio may be used to purchase shares of affiliated or non-affiliated money market funds or cash management pooled investment vehicles that operate as money market funds. The Portfolio is eligible to participate in the cash sweep program (the “Investing Funds”). As adviser, Janus Capital has an inherent conflict of interest because of its fiduciary duties to the affiliated money market funds or cash management pooled investment vehicles and the Investing Funds. Janus Henderson Cash Liquidity Fund LLC (the “Sweep Vehicle”) is an affiliated unregistered cash management pooled investment vehicle that invests primarily in highly-rated short-term fixed-income securities. The Sweep Vehicle operates pursuant to the provisions of the 1940 Act that govern the operation of money market funds and prices its shares at NAV reflecting market-based values of its portfolio securities (i.e., a “floating” NAV) rounded to the fourth decimal place (e.g., $1.0000). The Sweep Vehicle is permitted to impose a liquidity fee (of up to 2%) on redemptions from the Sweep Vehicle or a redemption gate that temporarily suspends redemptions from the Sweep Vehicle for up to 10 business days during a 90 day period. There are no restrictions on the Portfolio's ability to withdraw investments from the Sweep Vehicle at will, and there are no unfunded capital commitments due from the Portfolio to the Sweep Vehicle. The Sweep Vehicle does not charge any management fee, sales charge or service fee.
Any purchases and sales, realized gains/losses and recorded dividends from affiliated investments during the year ended December 31, 2020 can be found in the “Schedules of Affiliated Investments” located in the Schedule of Investments.
The Portfolio is permitted to purchase or sell securities (“cross-trade”) between itself and other funds or accounts managed by Janus Capital in accordance with Rule 17a-7 under the Investment Company Act of 1940 (“Rule 17a-7”), when the transaction is consistent with the investment objectives and policies of the Portfolio and in accordance with the Internal Cross Trade Procedures adopted by the Trust’s Board of Trustees. These procedures have been designed to ensure that any cross-trade of securities by the Portfolio from or to another fund or account that is or could be considered an affiliate of the Portfolio under certain limited circumstances by virtue of having a common investment adviser, common Officer, or common Trustee complies with Rule 17a-7. Under these procedures, each cross-trade is effected at the current market price to save costs where allowed. During the year ended December 31, 2020, the Portfolio engaged in cross trades amounting to $25,893,453 in purchases and $19,858,633 in sales, resulting in a net realized gain of $749,155. The net realized gain is included within the “Net Realized Gain/(Loss) on Investments” section of the Portfolio’s Statement of Operations.
Janus Aspen Series | 37 |
Janus Henderson VIT Balanced Portfolio
Notes to Financial Statements
4. Federal Income Tax
The tax components of capital shown in the table below represent: (1) distribution requirements the Portfolio must satisfy under the income tax regulations; (2) losses or deductions the Portfolio may be able to offset against income and gains realized in future years; and (3) unrealized appreciation or depreciation of investments for federal income tax purposes.
Other book to tax differences primarily consist of deferred compensation. The Portfolio has elected to treat gains and losses on forward foreign currency contracts as capital gains and losses, if applicable. Other foreign currency gains and losses on debt instruments are treated as ordinary income for federal income tax purposes pursuant to Section 988 of the Internal Revenue Code.
|
|
| Loss Deferrals | Other Book | Net Tax |
| |
Undistributed
| Undistributed | Accumulated | Late-Year
| Post-October | to Tax | Appreciation/ |
|
$ 25,337,095 | $ 40,603,763 | $ - | $ - | $ - | $ (149,551) | $1,846,300,445 |
|
The aggregate cost of investments and the composition of unrealized appreciation and depreciation of investment securities for federal income tax purposes as of December 31, 2020 are noted below. The primary differences between book and tax appreciation or depreciation of investments are wash sale loss deferrals and investments in partnerships.
Federal Tax Cost | Unrealized | Unrealized | Net
Tax Appreciation/ |
$ 4,949,424,293 | $1,857,856,131 | $(11,555,686) | $ 1,846,300,445 |
Income and capital gains distributions are determined in accordance with income tax regulations that may differ from US GAAP. These differences are due to differing treatments for items such as net short-term gains, deferral of wash sale losses, foreign currency transactions, and capital loss carryovers. Certain permanent differences such as tax returns of capital and net investment losses noted below have been reclassified to capital.
For the year ended December 31, 2020 |
| |||
Distributions |
|
| ||
From Ordinary Income | From Long-Term Capital Gains | Tax Return of Capital | Net Investment Loss |
|
$ 122,041,226 | $ 52,696,448 | $ - | $ - |
|
For the year ended December 31, 2019 |
| |||
Distributions |
|
| ||
From Ordinary Income | From Long-Term Capital Gains | Tax Return of Capital | Net Investment Loss |
|
$ 77,976,625 | $ 116,073,451 | $ - | $ - |
|
Permanent book to tax basis differences may result in reclassifications between the components of net assets. These differences have no impact on the results of operations or net assets. The following reclassifications have been made to the Portfolio:
|
|
|
Increase/(Decrease) to Capital | Increase/(Decrease) to Undistributed
| Increase/(Decrease) to Undistributed
|
$ 1 | $ 5,948,073 | $ (5,948,074) |
38 | DECEMBER 31, 2020 |
Janus Henderson VIT Balanced Portfolio
Notes to Financial Statements
5. Capital Share Transactions
|
|
|
|
|
|
|
|
| Year ended December 31, 2020 |
| Year ended December 31, 2019 | ||
|
| Shares | Amount |
| Shares | Amount |
Institutional Shares: |
|
|
|
|
| |
Shares sold | 833,472 | $ 32,931,124 |
| 761,195 | $ 28,340,063 | |
Reinvested dividends and distributions | 377,963 | 14,605,878 |
| 536,983 | 19,713,876 | |
Shares repurchased | (1,857,858) | (72,669,980) |
| (1,933,358) | (71,427,947) | |
Net Increase/(Decrease) | (646,423) | $ (25,132,978) |
| (635,180) | $ (23,374,008) | |
Service Shares: |
|
|
|
|
| |
Shares sold | 21,712,567 | $911,634,210 |
| 20,594,452 | $809,496,215 | |
Reinvested dividends and distributions | 3,917,443 | 160,131,796 |
| 4,493,890 | 174,336,200 | |
Shares repurchased | (7,010,260) | (289,245,563) |
| (5,686,724) | (220,402,952) | |
Net Increase/(Decrease) | 18,619,750 | $782,520,443 |
| 19,401,618 | $763,429,463 | |
6. Purchases and Sales of Investment Securities
For the year ended December 31, 2020, the aggregate cost of purchases and proceeds from sales of investment securities (excluding any short-term securities, short-term options contracts, TBAs, and in-kind transactions, as applicable) was as follows:
Purchases of | Proceeds from Sales | Purchases
of Long- | Proceeds
from Sales |
$3,356,216,005 | $2,779,083,353 | $ 1,625,922,679 | $ 1,629,232,260 |
7. Subsequent Event
Management has evaluated whether any events or transactions occurred subsequent to December 31, 2020 and through the date of issuance of the Portfolio’s financial statements and determined that there were no material events or transactions that would require recognition or disclosure in the Portfolio’s financial statements.
Janus Aspen Series | 39 |
Janus Henderson VIT Balanced Portfolio
Report of Independent Registered Public Accounting Firm
To the Board of Trustees of Janus Aspen Series and Shareholders of Janus Henderson VIT Balanced Portfolio
Opinion on the Financial Statements
We have audited the accompanying statement of assets and liabilities, including the schedule of investments, of Janus Henderson VIT Balanced Portfolio (one of the portfolios constituting Janus Aspen Series, referred to hereafter as the "Portfolio") as of December 31, 2020, the related statement of operations for the year ended December 31, 2020, the statements of changes in net assets for each of the two years in the period ended December 31, 2020, including the related notes, and the financial highlights for each of the five years in the period ended December 31, 2020 (collectively referred to as the “financial statements”). In our opinion, the financial statements present fairly, in all material respects, the financial position of the Portfolio as of December 31, 2020, the results of its operations for the year then ended, the changes in its net assets for each of the two years in the period ended December 31, 2020 and the financial highlights for each of the five years in the period ended December 31, 2020 in conformity with accounting principles generally accepted in the United States of America.
Basis for Opinion
These financial statements are the responsibility of the Portfolio’s management. Our responsibility is to express an opinion on the Portfolio’s financial statements based on our audits. We are a public accounting firm registered with the Public Company Accounting Oversight Board (United States) (PCAOB) and are required to be independent with respect to the Portfolio in accordance with the U.S. federal securities laws and the applicable rules and regulations of the Securities and Exchange Commission and the PCAOB.
We conducted our audits of these financial statements in accordance with the standards of the PCAOB. Those standards require that we plan and perform the audit to obtain reasonable assurance about whether the financial statements are free of material misstatement, whether due to error or fraud.
Our audits included performing procedures to assess the risks of material misstatement of the financial statements, whether due to error or fraud, and performing procedures that respond to those risks. Such procedures included examining, on a test basis, evidence regarding the amounts and disclosures in the financial statements. Our audits also included evaluating the accounting principles used and significant estimates made by management, as well as evaluating the overall presentation of the financial statements. Our procedures included confirmation of securities owned as of December 31, 2020 by correspondence with the custodian, transfer agent, and brokers; when replies were not received from brokers, we performed other auditing procedures. We believe that our audits provide a reasonable basis for our opinion.

Denver, Colorado
February
16, 2021
We have served as the auditor of one or more investment companies in Janus Henderson Funds since 1990.
40 | DECEMBER 31, 2020 |
Janus Henderson VIT Balanced Portfolio
Additional Information (unaudited)
Proxy Voting Policies and Voting Record
A description of the policies and procedures that the Portfolio uses to determine how to vote proxies relating to its portfolio securities is available without charge: (i) upon request, by calling 1-800-525-1093; (ii) on the Portfolio’s website at janushenderson.com/proxyvoting; and (iii) on the SEC’s website at http://www.sec.gov. Additionally, information regarding the Portfolio’s proxy voting record for the most recent twelve-month period ended June 30 is also available, free of charge, through janushenderson.com/proxyvoting and from the SEC’s website at http://www.sec.gov.
Full Holdings
The Portfolio files its complete portfolio holdings (schedule of investments) with the SEC as an exhibit to Form N-PORT within 60 days of the end of the first and third fiscal quarters, and in the annual report and semiannual report to shareholders. The Portfolio’s Form N-PORT filings and annual and semiannual reports: (i) are available on the SEC’s website at http://www.sec.gov; (ii) may be reviewed and copied at the SEC’s Public Reference Room in Washington, D.C. (information on the Public Reference Room may be obtained by calling 1-800-SEC-0330); and (iii) are available without charge, upon request, by calling a Janus Henderson representative at 1-877-335-2687 (toll free). Portfolio holdings consisting of at least the names of the holdings are generally available on a monthly basis with a 30-day lag under Full Holdings for the Portfolio at janushenderson.com/vit.
APPROVAL OF ADVISORY AGREEMENTS DURING THE PERIOD
The Trustees of Janus Aspen Series, each of whom serves as an “independent” Trustee (the “Trustees”), oversee the management of each Portfolio of Janus Aspen Series (each, a “VIT Portfolio,” and collectively, the “VIT Portfolios”), as well as each Fund of Janus Investment Fund (together with the VIT Portfolios, the “Janus Henderson Funds,” and each, a “Janus Henderson Fund”). As required by law, the Trustees determine annually whether to continue the investment advisory agreement for each Janus Henderson Fund and the subadvisory agreements for the Janus Henderson Funds that utilize subadvisers.
In connection with their most recent consideration of those agreements for each Janus Henderson Fund, the Trustees received, and reviewed information provided by Janus Capital and the respective subadvisers in response to requests of the Trustees and their independent legal counsel. They also received and reviewed information and analysis provided by, and in response to requests of, their independent fee consultant. Throughout their consideration of the agreements, the Trustees were advised by their independent legal counsel. The Trustees met with management to consider the agreements, and also met separately in executive session with their independent legal counsel and their independent fee consultant.
At a meeting held on December 9, 2020, based on the Trustees’ evaluation of the information provided by Janus Capital, the subadvisers, and the independent fee consultant, as well as other information, the Trustees determined that the overall arrangements between each Janus Henderson Fund and Janus Capital and each subadviser, as applicable, were fair and reasonable in light of the nature, extent and quality of the services provided by Janus Capital, its affiliates and the subadvisers, the fees charged for those services, and other matters that the Trustees considered relevant in the exercise of their business judgment. At that meeting, the Trustees unanimously approved the continuation of the investment advisory agreement for each Janus Henderson Fund, and the subadvisory agreement for each subadvised Janus Henderson Fund, for the period from February 1, 2021 through February 1, 2022, subject to earlier termination as provided for in each agreement.
In considering the continuation of those agreements, the Trustees reviewed and analyzed various factors that they determined were relevant, including the factors described below, none of which by itself was considered dispositive. However, the material factors and conclusions that formed the basis for the Trustees’ determination to approve the continuation of the agreements are discussed separately below. Also included is a summary of the independent fee consultant’s conclusions and opinions that arose during, and were included as part of, the Trustees’ consideration of the agreements. “Management fees,” as used herein, reflect actual annual advisory fees and, for the purpose of peer comparisons any administration fees (excluding out of pocket costs), net of any waivers, paid by a fund as a percentage of average net assets.
Nature, Extent and Quality of Services
The Trustees reviewed the nature, extent and quality of the services provided by Janus Capital and the subadvisers to the Janus Henderson Funds, taking into account the investment objective, strategies and policies of each Janus Henderson Fund, and the knowledge the Trustees gained from their regular meetings with management on at least a
Janus Aspen Series | 41 |
Janus Henderson VIT Balanced Portfolio
Additional Information (unaudited)
quarterly basis and their ongoing review of information related to the Janus Henderson Funds. In addition, the Trustees reviewed the resources and key personnel of Janus Capital and each subadviser, particularly noting those employees who provide investment and risk management services to the Janus Henderson Funds. The Trustees also considered other services provided to the Janus Henderson Funds by Janus Capital or the subadvisers, such as managing the execution of portfolio transactions and the selection of broker-dealers for those transactions. The Trustees considered Janus Capital’s role as administrator to the Janus Henderson Funds, noting that Janus Capital generally does not receive a fee for its services but is reimbursed for its out-of-pocket costs. The Trustees considered the role of Janus Capital in monitoring adherence to the Janus Henderson Funds’ investment restrictions, providing support services for the Trustees and Trustee committees, and overseeing communications with shareholders and the activities of other service providers, including monitoring compliance with various policies and procedures of the Janus Henderson Funds and with applicable securities laws and regulations.
In this regard, the independent fee consultant noted that Janus Capital provides a number of different services for the Janus Henderson Funds and fund shareholders, ranging from investment management services to various other servicing functions, and that, in its view, Janus Capital is a capable provider of those services. The independent fee consultant also provided its belief that Janus Capital has developed a number of institutional competitive advantages that should enable it to provide superior investment and service performance over the long term.
The Trustees concluded that the nature, extent and quality of the services provided by Janus Capital or the subadviser to each Janus Henderson Fund were appropriate and consistent with the terms of the respective advisory and subadvisory agreements, and that, taking into account steps taken to address those Janus Henderson Funds whose performance lagged that of their peers for certain periods, the Janus Henderson Funds were likely to benefit from the continued provision of those services. They also concluded that Janus Capital and each subadviser had sufficient personnel, with the appropriate education and experience, to serve the Janus Henderson Funds effectively and had demonstrated its ability to attract well-qualified personnel.
Performance of the Funds
The Trustees considered the performance results of each Janus Henderson Fund over various time periods. They noted that they considered Janus Henderson Fund performance data throughout the year, including periodic meetings with each Janus Henderson Fund’s portfolio manager(s), and also reviewed information comparing each Janus Henderson Fund’s performance with the performance of comparable funds and peer groups identified by Broadridge Financial Solutions, Inc. (“Broadridge”), an independent data provider, and with the Janus Henderson Fund’s benchmark index. In this regard, the independent fee consultant found that the overall Janus Henderson Funds’ performance has been reasonable: for the 36 months ended September 30, 2020, approximately 75% of the Janus Henderson Funds were in the top two quartiles of performance versus Broadridge peers, and for the 12 months ended September 30, 2020, approximately 62% of the Janus Henderson Funds were in the top two quartiles of performance versus Broadridge peers.
The Trustees considered the performance of each Janus Henderson Fund, noting that performance may vary by share class, and noted the following with respect to the VIT Portfolios:
· For Janus Henderson Balanced Portfolio, the Trustees noted that the Fund’s performance was in the first Broadridge quartile for the 36 months ended May 31, 2020 and the first Broadridge quartile for the 12 months ended May 31, 2020.
· For Janus Henderson Enterprise Portfolio, the Trustees noted that the Fund’s performance was in the bottom Broadridge quartile for the 36 months ended May 31, 2020 and the bottom Broadridge quartile for the 12 months ended May 31, 2020. The Trustees noted the reasons for the Fund’s underperformance and the steps Janus Capital had taken or was taking to improve performance.
· For Janus Henderson Flexible Bond Portfolio, the Trustees noted that the Fund’s performance was in the third Broadridge quartile for the 36 months ended May 31, 2020 and the first Broadridge quartile for the 12 months ended May 31, 2020. The Trustees noted the reasons for the Fund’s underperformance and the steps Janus Capital had taken or was taking to improve performance, and that the performance trend was improving.
42 | DECEMBER 31, 2020 |
Janus Henderson VIT Balanced Portfolio
Additional Information (unaudited)
· For Janus Henderson Forty Portfolio, the Trustees noted that the Fund’s performance was in the second Broadridge quartile for the 36 months ended May 31, 2020 and the second Broadridge quartile for the 12 months ended May 31, 2020.
· For Janus Henderson Global Research Portfolio, the Trustees noted that the Fund’s performance was in the third Broadridge quartile for the 36 months ended May 31, 2020 and the bottom Broadridge quartile for the 12 months ended May 31, 2020. The Trustees noted the reasons for the Fund’s underperformance, while also noting that the Fund has a performance fee structure that results in lower management fees during periods of underperformance, and the steps Janus Capital had taken or was taking to improve performance.
· For Janus Henderson Global Technology and Innovation Portfolio, the Trustees noted that the Fund’s performance was in the first Broadridge quartile for the 36 months ended May 31, 2020 and the second Broadridge quartile for the 12 months ended May 31, 2020.
· For Janus Henderson Mid Cap Value Portfolio, the Trustees noted that the Fund’s performance was in the third Broadridge quartile for the 36 months ended May 31, 2020 and the third Broadridge quartile for the 12 months ended May 31, 2020. The Trustees noted the reasons for the Fund’s underperformance, while also noting that the Fund has a performance fee structure that results in lower management fees during periods of underperformance, and the steps Janus Capital and Perkins had taken or were taking to improve performance.
· For Janus Henderson Overseas Portfolio, the Trustees noted that the Fund’s performance was in the bottom Broadridge quartile for the 36 months ended May 31, 2020 and the third Broadridge quartile for the 12 months ended May 31, 2020. The Trustees noted the reasons for the Fund’s underperformance, while also noting that the Fund has a performance fee structure that results in lower management fees during periods of underperformance and the steps Janus Capital had taken or was taking to improve performance.
· For Janus Henderson Research Portfolio, the Trustees noted that the Fund’s performance was in the third Broadridge quartile for the 36 months ended May 31, 2020 and the third Broadridge quartile for the 12 months ended May 31, 2020. The Trustees noted the reasons for the Fund’s underperformance, while also noting that the Fund has a performance fee structure that results in lower management fees during periods of underperformance, and the steps Janus Capital had taken or was taking to improve performance.
· For Janus Henderson U.S. Low Volatility Portfolio, the Trustees noted that the Fund’s performance was in the second Broadridge quartile for the 36 months ended May 31, 2020 and the third Broadridge quartile for the 12 months ended May 31, 2020.
In consideration of each Janus Henderson Fund’s performance, the Trustees concluded that, taking into account the factors relevant to performance, as well as other considerations, including steps taken to improve performance, the Janus Henderson Fund’s performance warranted continuation of such Janus Henderson Fund’s investment advisory and subadvisory agreement(s).
Costs of Services Provided
The Trustees examined information regarding the fees and expenses of each Janus Henderson Fund in comparison to similar information for other comparable funds as provided by Broadridge, an independent data provider. They also reviewed an analysis of that information provided by their independent fee consultant and noted that the rate of management fees (investment advisory fees and any administration fees but excluding out-of-pocket costs) for many of the Janus Henderson Funds, after applicable waivers, was below the average management fee rate of the respective peer group of funds selected by an independent data provider. The Trustees also examined information regarding the subadvisory fees charged for subadvisory services, as applicable, noting that all such fees were paid by Janus Capital out of its management fees collected from such Janus Henderson Fund.
The independent fee consultant provided its belief that the management fees charged by Janus Capital to each of the Janus Henderson Funds under the current investment advisory and administration agreements are reasonable in relation to the services provided by Janus Capital. The independent fee consultant found: (1) the total expenses and management fees of the Janus Henderson Funds to be reasonable relative to other comparable mutual funds; (2) the total expenses, on average, were 10% under the average total expenses of the respective Broadridge Expense Group peers; and (3) and the management fees for the Janus Henderson Funds, on average, were 9% under the average management fees for the respective Broadridge Expense Group. The Trustees also considered the total expenses for
Janus Aspen Series | 43 |
Janus Henderson VIT Balanced Portfolio
Additional Information (unaudited)
each share class of each Janus Henderson Fund compared to the average total expenses for its Broadridge Expense Group and to average total expenses for its Broadridge Expense Universe.
For certain Janus Henderson Funds, the independent fee consultant also performed a systematic “focus list” analysis of expenses which assessed fund fees in the context of fund performance being delivered. Based on this analysis, the independent fee consultant found that the combination of service quality/performance and expenses on these individual Janus Henderson Funds was reasonable in light of performance trends, performance histories, and existence of performance fees, breakpoints, and/or expense waivers on such Janus Henderson Funds.
The Trustees considered the methodology used by Janus Capital and each subadviser in determining compensation payable to portfolio managers, the competitive environment for investment management talent, and the competitive market for mutual funds in different distribution channels.
The Trustees also reviewed management fees charged by Janus Capital and each subadviser to comparable separate account clients and to comparable non-affiliated funds subadvised by Janus Capital or by a subadviser (for which Janus Capital or the subadviser provides only or primarily portfolio management services). Although in most instances subadvisory and separate account fee rates for various investment strategies were lower than management fee rates for Janus Henderson Funds having a similar strategy, the Trustees considered that Janus Capital noted that, under the terms of the management agreements with the Janus Henderson Funds, Janus Capital performs significant additional services for the Janus Henderson Funds that it does not provide to those other clients, including administration services, oversight of the Janus Henderson Funds’ other service providers, trustee support, regulatory compliance and numerous other services, and that, in serving the Janus Henderson Funds, Janus Capital assumes many legal risks and other costs that it does not assume in servicing its other clients. Moreover, they noted that the independent fee consultant found that: (1) the management fees Janus Capital charges to the Janus Henderson Funds are reasonable in relation to the management fees Janus Capital charges to funds subadvised by Janus Capital and to the fees Janus Capital charges to its institutional separate account clients; (2) these subadvised and institutional separate accounts have different service and infrastructure needs and operate in markets very distinct relative to retail funds; and (3) Janus Henderson mutual fund investors enjoy reasonable fees relative to the fees charged to Janus Henderson subadvised fund and separate account investors; (4) 9 of 10 Janus Henderson Funds have lower management fees than similar funds subadvised by Janus Capital; and (5) 5 of 8 Janus Henderson Funds have lower management fees than similar separate accounts managed by Janus Capital.
The Trustees considered the fees for each Janus Henderson Fund for its fiscal year ended in 2019, including the VIT Portfolios, and noted the following with regard to each VIT Portfolio’s total expenses, net of applicable fee waivers (the VIT Portfolio’s “total expenses”):
· For Janus Henderson Balanced Portfolio, the Trustees noted that, although the Fund’s total expenses exceeded the peer group average for one share class, overall the Fund’s total expenses were reasonable.
· For Janus Henderson Enterprise Portfolio, the Trustees noted that, although the Fund’s total expenses exceeded the peer group average for one share class, overall the Fund’s total expenses were reasonable.
· For Janus Henderson Flexible Bond Portfolio, the Trustees noted that, although the Fund’s total expenses exceeded the peer group for one share class, overall the Fund’s total expenses were reasonable. The Trustees also noted that Janus Capital has contractually agreed to limit the Fund’s expenses, although this limit did not apply because the Fund’s total expenses were already below the applicable fee limit.
· For Janus Henderson Forty Portfolio, the Trustees noted that, although the Fund’s total expenses exceeded the peer group average for one share class, overall the Fund’s total expenses were reasonable.
· For Janus Henderson Global Research Portfolio, the Trustees noted that, although the Fund’s total expenses exceeded the peer group average for one share class, overall the Fund’s total expenses were reasonable.
· For Janus Henderson Global Technology and Innovation Portfolio, the Trustees noted that the Fund’s total expenses were below the peer group for both share classes.
· For Janus Henderson Mid Cap Value Portfolio, the Trustees noted that, although the Fund’s total expenses exceeded the peer group for one share class, overall the Fund’s total expenses were reasonable. The Trustees also noted that Janus Capital has contractually agreed to limit the Fund’s expenses, although this limit did not apply because the Fund’s total expenses were already below the applicable fee limit.
44 | DECEMBER 31, 2020 |
Janus Henderson VIT Balanced Portfolio
Additional Information (unaudited)
· For Janus Henderson Overseas Portfolio, the Trustees noted that the Fund’s total expenses were below the peer group for both share classes.
· For Janus Henderson Research Portfolio, the Trustees noted that the Fund’s total expenses were below the peer group average for both share classes.
· For Janus Henderson U.S. Low Volatility Portfolio, the Trustees noted that the Fund’s total expenses were below the peer group for its sole share class.
The Trustees reviewed information on the overall profitability to Janus Capital and its affiliates of their relationship with the Janus Henderson Funds, and considered profitability data of other publicly traded mutual fund advisers. The Trustees recognized that profitability comparisons among fund managers are difficult because of the variation in the type of comparative information that is publicly available, and the profitability of any fund manager is affected by numerous factors, including the organizational structure of the particular fund manager, differences in complex size, difference in product mix, difference in types of business (mutual fund, institutional and other), differences in the types of funds and other accounts it manages, possible other lines of business, the methodology for allocating expenses, and the fund manager’s capital structure and cost of capital.
Additionally, the Trustees considered the estimated profitability to Janus Capital from the investment management services it provided to each Janus Henderson Fund. In their review, the Trustees considered whether Janus Capital and each subadviser receive adequate incentives and resources to manage the Janus Henderson Funds effectively. In reviewing profitability, the Trustees noted that the estimated profitability for an individual Janus Henderson Fund is necessarily a product of the allocation methodology utilized by Janus Capital to allocate its expenses as part of the estimated profitability calculation. In this regard, the Trustees noted that the independent fee consultant found that (1) the expense allocation methodology and rationales utilized by Janus Capital were reasonable and (2) no clear correlation exists between expense allocations and operating margins. The Trustees also considered that the estimated profitability for an individual Janus Henderson Fund was influenced by a number of factors, including not only the allocation methodology selected, but also the presence of fee waivers and expense caps, and whether the Janus Henderson Fund’s investment management agreement contained breakpoints or a performance fee component. The Trustees determined, after taking into account these factors, among others, that Janus Capital’s estimated profitability with respect to each Janus Henderson Fund was not unreasonable in relation to the services provided, and that the variation in the range of such estimated profitability among the Janus Henderson Funds was not a material factor in the Board’s approval of the reasonableness of any Janus Henderson Fund’s investment management fees.
The Trustees concluded that the management fees payable by each Janus Henderson Fund to Janus Capital and its affiliates, as well as the fees paid by Janus Capital to the subadvisers of subadvised Janus Henderson Funds, were reasonable in relation to the nature, extent, and quality of the services provided, taking into account the fees charged by other advisers for managing comparable mutual funds with similar strategies, the fees Janus Capital and the subadvisers charge to other clients, and, as applicable, the impact of fund performance on management fees payable by the Janus Henderson Funds. The Trustees also concluded that each Janus Henderson Fund’s total expenses were reasonable, taking into account the size of the Janus Henderson Fund, the quality of services provided by Janus Capital and any subadviser, the investment performance of the Janus Henderson Fund, and any expense limitations agreed to or provided by Janus Capital.
Economies of Scale
The Trustees considered information about the potential for Janus Capital to realize economies of scale as the assets of the Janus Henderson Funds increase. They noted that their independent fee consultant published a report to the Trustees in November 2019 which provided its research and analysis into economies of scale. They also noted that, although many Janus Henderson Funds pay advisory fees at a fixed base rate as a percentage of net assets, without any breakpoints or performance fees, their independent fee consultant concluded that 73% of these Janus Henderson Funds’ have contractual management fees (gross of waivers) below their Broadridge Expense Group averages. They also noted the following: (1) that for those Janus Henderson Funds whose expenses are being reduced by the contractual expense limitations of Janus Capital, Janus Capital is subsidizing certain of these Janus Henderson Funds because they have not reached adequate scale; (2) as the assets of some of the Janus Henderson Funds have declined in the past few years, certain of those Janus Henderson Funds have benefited from having advisory fee rates that have remained constant rather than increasing as assets declined; (3) performance fee structures have been implemented for various Janus Henderson Funds that have caused the effective rate of advisory fees payable by such
Janus Aspen Series | 45 |
Janus Henderson VIT Balanced Portfolio
Additional Information (unaudited)
Janus Henderson Fund to vary depending on the investment performance of the Janus Henderson Fund relative to its benchmark index over the measurement period; and (4) a few Janus Henderson Funds have fee schedules with breakpoints and reduced fee rates above certain asset levels. The Trustees also noted that the Janus Henderson Funds share directly in economies of scale through the significant investments made by Janus Capital and its affiliates related to services provided to the Funds and the lower charges of third-party service providers that are based in part on the combined scale of all of the Janus Henderson Funds.
The Trustees also considered the independent fee consultant’s conclusion that, given the limitations of various analytical approaches to economies of scale and their conflicting results, it is difficult to analytically confirm or deny the existence of economies of scale in the Janus Henderson complex. In this regard, the independent consultant concluded that (1) to the extent there were economies of scale at Janus Capital, Janus Capital’s general strategy of setting fixed management fees below peers appeared to share any such economies with investors even on smaller Janus Henderson Funds which have not yet achieved those economies and (2) by setting lower fixed fees from the start on these Janus Henderson Funds, Janus Capital appeared to be investing to increase the likelihood that these Janus Henderson Funds will grow to a level to achieve any economies of scale that may exist. Further, the independent fee consultant provided its belief that Janus Henderson Fund investors are well-served by the fee levels and performance fee structures in place on the Janus Henderson Funds in light of any economies of scale that may be present at Janus Capital.
Based on all of the information reviewed, including the recent and past research and analysis conducted by the Trustees’ independent fee consultant, the Trustees concluded that the current fee structure of each Janus Henderson Fund was reasonable and that the current rates of fees do reflect a sharing between Janus Capital and the Janus Henderson Fund of any economies of scale that may be present at the current asset level of the Janus Henderson Fund.
Other Benefits to Janus Capital
The Trustees also considered benefits that accrue to Janus Capital and its affiliates and subadvisers to the Janus Henderson Funds from their relationships with the Janus Henderson Funds. They recognized that two affiliates of Janus Capital separately serve the Janus Henderson Funds as transfer agent and distributor, respectively, and the transfer agent receives compensation directly from the non-money market funds for services provided, and that such compensation contributes to the overall profitability of Janus Capital and its affiliates that results from their relationship with the Janus Henderson Funds. The Trustees also considered Janus Capital’s past and proposed use of commissions paid by the Janus Henderson Funds on portfolio brokerage transactions to obtain proprietary and third-party research products and services benefiting the Janus Henderson Fund and/or other clients of Janus Capital and Janus Capital, and/or a subadviser to a Janus Henderson Fund. The Trustees concluded that Janus Capital’s and the subadvisers’ use of these types of client commission arrangements to obtain proprietary and third-party research products and services was consistent with regulatory requirements and guidelines and was likely to benefit each Janus Henderson Fund. The Trustees also concluded that, other than the services provided by Janus Capital and its affiliates and subadvisers pursuant to the agreements and the fees to be paid by each Janus Henderson Fund therefor, the Janus Henderson Funds and Janus Capital and the subadvisers may potentially benefit from their relationship with each other in other ways. They concluded that Janus Capital and its affiliates share directly in economies of scale through the lower charges of third-party service providers that are based in part on the combined scale of the Janus Henderson Funds and other clients serviced by Janus Capital and its affiliates. They also concluded that Janus Capital and/or the subadvisers benefit from the receipt of research products and services acquired through commissions paid on portfolio transactions of the Janus Henderson Funds and that the Janus Henderson Funds benefit from Janus Capital’s and/or the subadvisers’ receipt of those products and services as well as research products and services acquired through commissions paid by other clients of Janus Capital and/or other clients of the subadvisers. They further concluded that the success of any Janus Henderson Fund could attract other business to Janus Capital, the subadvisers or other Janus Henderson funds, and that the success of Janus Capital and the subadvisers could enhance Janus Capital’s and the subadvisers’ ability to serve the Janus Henderson Funds.
46 | DECEMBER 31, 2020 |
Janus Henderson VIT Balanced Portfolio
Useful Information About Your Portfolio Report (unaudited)
The Management Commentary in this report includes valuable insight as well as statistical information to help you understand how your Portfolio’s performance and characteristics stack up against those of comparable indices.
If the Portfolio invests in foreign securities, this report may include information about country exposure. Country exposure is based primarily on the country of risk. A company may be allocated to a country based on other factors such as location of the company’s principal office, the location of the principal trading market for the company’s securities, or the country where a majority of the company’s revenues are derived.
Please keep in mind that the opinions expressed in the Management Commentary are just that: opinions. They are a reflection based on best judgment at the time this report was compiled, which was December 31, 2020. As the investing environment changes, so could opinions. These views are unique and are not necessarily shared by fellow employees or by Janus Henderson in general.
Performance Overviews
Performance overview graphs compare the performance of a hypothetical $10,000 investment in the Portfolio with one or more widely used market indices. When comparing the performance of the Portfolio with an index, keep in mind that market indices are not available for investment and do not reflect deduction of expenses.
Average annual total returns are quoted for a Portfolio with more than one year of performance history. Average annual total return is calculated by taking the growth or decline in value of an investment over a period of time, including reinvestment of dividends and distributions, then calculating the annual compounded percentage rate that would have produced the same result had the rate of growth been constant throughout the period. Average annual total return does not reflect the deduction of taxes that a shareholder would pay on Portfolio distributions or redemptions of Portfolio shares.
Cumulative total returns are quoted for a Portfolio with less than one year of performance history. Cumulative total return is the growth or decline in value of an investment over time, independent of the period of time involved. Cumulative total return does not reflect the deduction of taxes that a shareholder would pay on Portfolio distributions or redemptions of Portfolio shares.
Pursuant to federal securities rules, expense ratios shown in the performance chart reflect subsidized (if applicable) and unsubsidized ratios. The total annual fund operating expenses ratio is gross of any fee waivers, reflecting the Portfolio’s unsubsidized expense ratio. The net annual fund operating expenses ratio (if applicable) includes contractual waivers of Janus Capital and reflects the Portfolio’s subsidized expense ratio. Ratios may be higher or lower than those shown in the “Financial Highlights” in this report.
Schedule of Investments
Following the performance overview section is the Portfolio’s Schedule of Investments. This schedule reports the types of securities held in the Portfolio on the last day of the reporting period. Securities are usually listed by type (common stock, corporate bonds, U.S. Government obligations, etc.) and by industry classification (banking, communications, insurance, etc.). Holdings are subject to change without notice.
The value of each security is quoted as of the last day of the reporting period. The value of securities denominated in foreign currencies is converted into U.S. dollars.
If the Portfolio invests in foreign securities, it will also provide a summary of investments by country. This summary reports the Portfolio exposure to different countries by providing the percentage of securities invested in each country. The country of each security represents the country of risk. The Portfolio’s Schedule of Investments relies upon the industry group and country classifications published by Barclays and/or MSCI Inc.
Tables listing details of individual forward currency contracts, futures, written options, swaptions, and swaps follow the Portfolio’s Schedule of Investments (if applicable).
Statement of Assets and Liabilities
This statement is often referred to as the “balance sheet.” It lists the assets and liabilities of the Portfolio on the last day of the reporting period.
Janus Aspen Series | 47 |
Janus Henderson VIT Balanced Portfolio
Useful Information About Your Portfolio Report (unaudited)
The Portfolio’s assets are calculated by adding the value of the securities owned, the receivable for securities sold but not yet settled, the receivable for dividends declared but not yet received on securities owned, and the receivable for Portfolio shares sold to investors but not yet settled. The Portfolio’s liabilities include payables for securities purchased but not yet settled, Portfolio shares redeemed but not yet paid, and expenses owed but not yet paid. Additionally, there may be other assets and liabilities such as unrealized gain or loss on forward currency contracts.
The section entitled “Net Assets Consist of” breaks down the components of the Portfolio’s net assets. Because the Portfolio must distribute substantially all earnings, you will notice that a significant portion of net assets is shareholder capital.
The last section of this statement reports the net asset value (“NAV”) per share on the last day of the reporting period. The NAV is calculated by dividing the Portfolio’s net assets for each share class (assets minus liabilities) by the number of shares outstanding.
Statement of Operations
This statement details the Portfolio’s income, expenses, realized gains and losses on securities and currency transactions, and changes in unrealized appreciation or depreciation of Portfolio holdings.
The first section in this statement, entitled “Investment Income,” reports the dividends earned from securities and interest earned from interest-bearing securities in the Portfolio.
The next section reports the expenses incurred by the Portfolio, including the advisory fee paid to the investment adviser, transfer agent fees and expenses, and printing and postage for mailing statements, financial reports and prospectuses. Expense offsets and expense reimbursements, if any, are also shown.
The last section lists the amounts of realized gains or losses from investment and foreign currency transactions, and changes in unrealized appreciation or depreciation of investments and foreign currency-denominated assets and liabilities. The Portfolio will realize a gain (or loss) when it sells its position in a particular security. A change in unrealized gain (or loss) refers to the change in net appreciation or depreciation of the Portfolio during the reporting period. “Net Realized and Unrealized Gain/(Loss) on Investments” is affected both by changes in the market value of Portfolio holdings and by gains (or losses) realized during the reporting period.
Statements of Changes in Net Assets
These statements report the increase or decrease in the Portfolio’s net assets during the reporting period. Changes in the Portfolio’s net assets are attributable to investment operations, dividends and distributions to investors, and capital share transactions. This is important to investors because it shows exactly what caused the Portfolio’s net asset size to change during the period.
The first section summarizes the information from the Statement of Operations regarding changes in net assets due to the Portfolio’s investment operations. The Portfolio’s net assets may also change as a result of dividend and capital gains distributions to investors. If investors receive their dividends and/or distributions in cash, money is taken out of the Portfolio to pay the dividend and/or distribution. If investors reinvest their dividends and/or distributions, the Portfolio’s net assets will not be affected. If you compare the Portfolio’s “Net Decrease from Dividends and Distributions” to “Reinvested Dividends and Distributions,” you will notice that dividends and distributions have little effect on the Portfolio’s net assets. This is because the majority of the Portfolio’s investors reinvest their dividends and/or distributions.
The reinvestment of dividends and distributions is included under “Capital Share Transactions.” “Capital Shares” refers to the money investors contribute to the Portfolio through purchases or withdrawals via redemptions. The Portfolio’s net assets will increase and decrease in value as investors purchase and redeem shares from the Portfolio.
Financial Highlights
This schedule provides a per-share breakdown of the components that affect the Portfolio’s NAV for current and past reporting periods as well as total return, asset size, ratios, and portfolio turnover rate.
The first line in the table reflects the NAV per share at the beginning of the reporting period. The next line reports the net investment income/(loss) per share. Following is the per share total of net gains/(losses), realized and unrealized. Per share dividends and distributions to investors are then subtracted to arrive at the NAV per share at the end of the period. The next line reflects the total return for the period. The total return may include adjustments in accordance with
48 | DECEMBER 31, 2020 |
Janus Henderson VIT Balanced Portfolio
Useful Information About Your Portfolio Report (unaudited)
generally accepted accounting principles required at the period end for financial reporting purposes. As a result, the total return may differ from the total return reflected for individual shareholder transactions. Also included are ratios of expenses and net investment income to average net assets.
The Portfolio’s expenses may be reduced through expense offsets and expense reimbursements. The ratios shown reflect expenses before and after any such offsets and reimbursements.
The ratio of net investment income/(loss) summarizes the income earned less expenses, divided by the average net assets of the Portfolio during the reporting period. Do not confuse this ratio with the Portfolio’s yield. The net investment income ratio is not a true measure of the Portfolio’s yield because it does not take into account the dividends distributed to the Portfolio’s investors.
The next figure is the portfolio turnover rate, which measures the buying and selling activity in the Portfolio. Portfolio turnover is affected by market conditions, changes in the asset size of the Portfolio, fluctuating volume of shareholder purchase and redemption orders, the nature of the Portfolio’s investments, and the investment style and/or outlook of the portfolio manager(s) and/or investment personnel. A 100% rate implies that an amount equal to the value of the entire portfolio was replaced once during the fiscal year; a 50% rate means that an amount equal to the value of half the portfolio is traded in a year; and a 200% rate means that an amount equal to the value of the entire portfolio is traded every six months.
Janus Aspen Series | 49 |
Janus Henderson VIT Balanced Portfolio
Designation Requirements (unaudited)
For federal income tax purposes, the Portfolio designated the following for the year ended December 31, 2020:
| |
Capital Gain Distributions | $52,696,448 |
Dividends Received Deduction Percentage | 56% |
50 | DECEMBER 31, 2020 |
Janus Henderson VIT Balanced Portfolio
Trustees and Officers (unaudited)
The following are the Trustees and officers of the Trust, together with a brief description of their principal occupations during the last five years (principal occupations for certain Trustees may include periods over five years). The Portfolio’s Statement of Additional Information includes additional information about the Trustees and officers and is available, without charge, by calling 1-877-335-2687.
Each Trustee has served in that capacity since he or she was originally elected or appointed. The Trustees do not serve a specified term of office. Each Trustee will hold office until the termination of the Trust or his or her earlier death, resignation, retirement, incapacity, or removal. Under the Portfolio’s Governance Procedures and Guidelines, the policy is for Trustees to retire no later than the end of the calendar year in which the Trustee turns 75. The Trustees review the Portfolio’s Governance Procedures and Guidelines from time to time and may make changes they deem appropriate. The Portfolio’s Nominating and Governance Committee will consider nominees for the position of Trustee recommended by shareholders. Shareholders may submit the name of a candidate for consideration by the Committee by submitting their recommendations to the Trust’s Secretary. Each Trustee is currently a Trustee of one other registered investment company advised by Janus Capital: Janus Investment Fund. Collectively, these two registered investment companies consist of 56 series or funds referred to herein as the Fund Complex.
The Trust’s officers are elected annually by the Trustees for a one-year term. Certain officers also serve as officers of Janus Investment Fund. Certain officers of the Portfolio may also be officers and/or directors of Janus Capital. Except as otherwise disclosed, Portfolio officers receive no compensation from the Portfolio, except for the Portfolio’s Chief Compliance Officer, as authorized by the Trustees.
Janus Aspen Series | 51 |
Janus Henderson VIT Balanced Portfolio
Trustees and Officers (unaudited)
TRUSTEES | |||||
Name, Address, and Age | Positions Held with the Trust | Length of Time Served | Principal Occupations During the Past Five Years | Number of Portfolios/Funds in Fund Complex Overseen by Trustee | Other Directorships Held by Trustee During the Past Five Years |
Independent Trustees | |||||
William F. McCalpin 151 Detroit Street Denver, CO 80206 DOB: 1957 | Chairman Trustee | 1/08-Present 6/02-Present | Independent Consultant (since 2019) and Chief Operating Officer, muun chi LLC (organic food business) (since 2020). Formerly, Managing Partner, Impact Investments, Athena Capital Advisors LLC (independent registered investment advisor) (2016-2019), Managing Director, Holos Consulting LLC (provides consulting services to foundations and other nonprofit organizations) (2009-2016), Chief Executive Officer, Imprint Capital Advisors (impact investment firm) (2013-2015), and Executive Vice President and Chief Operating Officer of The Rockefeller Brothers Fund (a private family foundation) (1998-2006). | 56 | Director of Mutual Fund Directors Forum (a non-profit organization serving independent directors of U.S. mutual funds) (since 2016), Chairman of the Board and Trustee of The Investment Fund for Foundations Investment Program (TIP) (consisting of 2 funds) (since 2008), and Director of the F.B. Heron Foundation (a private grantmaking foundation) (since 2006). |
52 | DECEMBER 31, 2020 |
Janus Henderson VIT Balanced Portfolio
Trustees and Officers (unaudited)
TRUSTEES | |||||
Name, Address, and Age | Positions Held with the Trust | Length of Time Served | Principal Occupations During the Past Five Years | Number of Portfolios/Funds in Fund Complex Overseen by Trustee | Other Directorships Held by Trustee During the Past Five Years |
Independent Trustees | |||||
Alan A. Brown 151 Detroit Street Denver, CO 80206 DOB: 1962 | Trustee | 1/13-Present | Principal, Curam Holdings LLC (since 2018). Formerly, Executive Vice President, Institutional Markets, of Black Creek Group (private equity real estate investment management firm) (2012-2018), Executive Vice President and Co-Head, Global Private Client Group (2007-2010), Executive Vice President, Mutual Funds (2005-2007), and Chief Marketing Officer (2001-2005) of Nuveen Investments, Inc. (asset management). | 56 | Advisory Board Member of AEW Core Property Trust (open-end property fund) (since 2020), and Director of WTTW (PBS affiliate) (since 2003). Formerly, Director of MotiveQuest LLC (strategic social market research company) (2003-2016), Director of Nuveen Global Investors LLC (2007-2011), Director of Communities in Schools (2004-2010), and Director of Mutual Fund Education Alliance (until 2010). |
Janus Aspen Series | 53 |
Janus Henderson VIT Balanced Portfolio
Trustees and Officers (unaudited)
TRUSTEES | |||||
Name, Address, and Age | Positions Held with the Trust | Length of Time Served | Principal Occupations During the Past Five Years | Number of Portfolios/Funds in Fund Complex Overseen by Trustee | Other Directorships Held by Trustee During the Past Five Years |
Independent Trustees | |||||
William D. Cvengros 151 Detroit Street Denver, CO 80206 DOB: 1948 | Trustee | 1/11-Present | Chief Executive Officer of SJC Capital, LLC (a personal investment company and consulting firm) (since 2002). Formerly, Chief Executive Officer and President of PIMCO Advisors Holdings L.P. (a publicly traded investment management firm) (1994-2000), and Chief Investment Officer (1987-1994) and Vice Chairman and Director (1990-1994) of Pacific Life Insurance Company (a mutual life insurance and annuity company) (1987-1994). | 56 | Advisory Board Member, RevOZ Fund LP and related funds (real estate investments for opportunity zones) (since 2020), and Advisory Board Member, Innovate Partners Emerging Growth and Equity Fund I (early stage venture capital fund) (since 2014). Formerly, Managing Trustee of National Retirement Partners Liquidating Trust (2013-2016), Chairman, National Retirement Partners, Inc. (formerly a network of advisors to 401(k) plans) (2005-2013), Director of Prospect Acquisition Corp. (a special purpose acquisition corporation) (2007-2009), Director of RemedyTemp, Inc. (temporary help services company) (1996-2006), and Trustee of PIMCO Funds Multi-Manager Series (1990-2000) and Pacific Life Variable Life & Annuity Trusts (1987-1994). |
54 | DECEMBER 31, 2020 |
Janus Henderson VIT Balanced Portfolio
Trustees and Officers (unaudited)
TRUSTEES | |||||
Name, Address, and Age | Positions Held with the Trust | Length of Time Served | Principal Occupations During the Past Five Years | Number of Portfolios/Funds in Fund Complex Overseen by Trustee | Other Directorships Held by Trustee During the Past Five Years |
Independent Trustees | |||||
Raudline Etienne 151 Detroit Street Denver, CO 80206 DOB: 1965 | Trustee | 6/16-Present | Founder, Daraja Capital (advisory and investment firm) (since 2016), and Senior Advisor, Albright Stonebridge Group LLC (global strategy firm) (since 2016). Formerly, Senior Vice President (2011-2015), Albright Stonebridge Group LLC, and Deputy Comptroller and Chief Investment Officer, New York State Common Retirement Fund (public pension fund) (2008-2011). | 56 | Board Member, Van Alen Institute (nonprofit architectural and design organization) (since 2019) and Director of Brightwood Capital Advisors, LLC (since 2014). |
William M. Fitzgerald, Sr. 151 Detroit Street Denver, CO 80206 DOB: 1964 | Trustee | 9/19-Present | Founder, Fitzgerald Asset Management LLC (since 2012). Formerly, Founder and Chief Investment Officer, Global Infrastructure Asset Management LLC (2008-2017), Chief Investment Officer of Nuveen Asset Management (2000-2007), and Managing Director, Nuveen Investment LLC (1988-2007). | 56 | Board of Directors, Municipal Securities Rulemaking Board (since 2017). Formerly, Board of Directors of Syncora Holdings Ltd, Syncora Guarantee Inc., and Syncora Capital Assurance Inc. (2009-2016), and Trustee, Destra Investment Trust (2010-2014). |
Janus Aspen Series | 55 |
Janus Henderson VIT Balanced Portfolio
Trustees and Officers (unaudited)
TRUSTEES | |||||
Name, Address, and Age | Positions Held with the Trust | Length of Time Served | Principal Occupations During the Past Five Years | Number of Portfolios/Funds in Fund Complex Overseen by Trustee | Other Directorships Held by Trustee During the Past Five Years |
Independent Trustees | |||||
Gary A. Poliner 151 Detroit Street Denver, CO 80206 DOB: 1953 | Trustee | 6/16-Present | Retired. Formerly, President (2010-2013) of Northwestern Mutual Life Insurance Company. | 56 | Director of MGIC Investment Corporation (private mortgage insurance) (since 2013) and West Bend Mutual Insurance Company (property/casualty insurance) (since 2013). Formerly, Trustee of Northwestern Mutual Life Insurance Company (2010-2013) and Director of Frank Russell Company (global asset management firm) (2008-2013). |
Diane L. Wallace 151 Detroit Street Denver, CO 80206 DOB: 1958 | Trustee | 6/17-Present | Retired. Formerly, Chief Operating Officer, Senior Vice President-Operations, and Chief Financial Officer for Driehaus Capital Management, LLC (1988-2006) and Treasurer for Driehaus Mutual Funds (1996-2002). | 56 | Director of Family Service of Lake County (since 2019). Formerly, Independent Trustee, Henderson Global Funds (13 portfolios) (2015-2017), Independent Trustee, State Farm Associates' Funds Trust, State Farm Mutual Fund Trust, and State Farm Variable Product Trust (28 portfolios) (2013-2017). |
56 | DECEMBER 31, 2020 |
Janus Henderson VIT Balanced Portfolio
Trustees and Officers (unaudited)
TRUSTEES | |||||
Name, Address, and Age | Positions Held with the Trust | Length of Time Served | Principal Occupations During the Past Five Years | Number of Portfolios/Funds in Fund Complex Overseen by Trustee | Other Directorships Held by Trustee During the Past Five Years |
Independent Trustees | |||||
Linda S. Wolf 151 Detroit Street Denver, CO 80206 DOB: 1947 | Trustee | 11/05-Present | Retired. Formerly, Chairman and Chief Executive Officer of Leo Burnett (Worldwide) (advertising agency) (2001-2005). | 56 | Director of Chicago Community Trust (Regional Community Foundation), Lurie Children’s Hospital (Chicago, IL), Shirley Ryan Ability Lab and Wrapports, LLC (digital communications company). Formerly, Director of Chicago Council on Global Affairs (until 2019), InnerWorkings (until 2019) and Director of Walmart (until 2017). |
Janus Aspen Series | 57 |
Janus Henderson VIT Balanced Portfolio
Trustees and Officers (unaudited)
OFFICERS | |||
Name, Address, and Age | Positions Held with the Trust | Term of Office* and Length of Time Served | Principal Occupations During the Past Five Years |
Jeremiah Buckley | Executive Vice President and Co-Portfolio Manager Janus Henderson Balanced Portfolio | 12/15-Present | Portfolio Manager for other Janus Henderson accounts. |
Marc
Pinto | Executive Vice President and Co-Portfolio Manager Janus Henderson Balanced Portfolio | 5/05-Present | Portfolio Manager for other Janus Henderson accounts. |
Michael
Keough | Executive Vice President and Co-Portfolio Manager Janus Henderson Balanced Portfolio | 12/19 - Present | Portfolio Manager for other Janus Henderson accounts. |
Greg Wilensky | Executive Vice President and Co-Portfolio Manager Janus Henderson Balanced Portfolio | 2/20-Present | Head of U.S. Fixed Income of Janus Henderson Investors and Portfolio Manager for other Janus Henderson accounts. Formerly, Director and Lead Portfolio Manager of the U.S. Multi-Sector Fixed Income team at AllianceBernstein (2007-2019). |
* Officers are elected at least annually by the Trustees for a one-year term and may also be elected from time to time by the Trustees for an interim period. | |||
58 | DECEMBER 31, 2020 |
Janus Henderson VIT Balanced Portfolio
Trustees and Officers (unaudited)
OFFICERS | |||
Name, Address, and Age | Positions Held with the Trust | Term of Office* and Length of Time Served | Principal Occupations During the Past Five Years |
Bruce L. Koepfgen | President and Chief Executive Officer | 7/14-Present | Executive Vice President and Head of North America at Janus Henderson Investors (since 2017), President and Head of North America at Janus Capital Management LLC (since 2013 and 2017, respectively), President at Janus Capital Group Inc. (since 2013), President and Director at Janus International Holding LLC (since 2019 and 2011, respectively), President at Janus Holdings LLC (since 2019), President and Director at Janus Management Holdings Corporation (since 2017 and 2012, respectively), Executive Vice President and Head of North America at Janus Distributors LLC (since 2011 and 2019, respectively), Vice President and Director at Intech Investment Management LLC (since 2012), and Executive Vice President at Perkins Investment Management LLC (since 2011). Formerly, Executive Vice President at Janus Capital Group Inc., Janus International Holding LLC, and Janus Management Holdings Corporation (2011-2019), Director at Perkins Investment Management LLC (2011-2019), and Chief Financial Officer at Janus Capital Group Inc. (2011-2013). |
* Officers are elected at least annually by the Trustees for a one-year term and may also be elected from time to time by the Trustees for an interim period. | |||
Janus Aspen Series | 59 |
Janus Henderson VIT Balanced Portfolio
Trustees and Officers (unaudited)
OFFICERS | |||||
Name, Address, and Age | Positions Held with the Trust | Term of Office* and Length of Time Served | Principal Occupations During the Past Five Years | ||
Kristin
Mariani | Vice President, Chief Compliance Officer, and Anti-Money Laundering Officer | 7/20-Present | Head of Compliance, North America for Janus Henderson Investors (since September 2020), and Chief Compliance Officer for Janus Capital Management LLC (since September 2017). Formerly, Global Head of Investment Management Compliance for Janus Henderson Investors (February 2019 – August 2020), Vice President, Head of Global Distribution Compliance and Chief Compliance Officer of Janus Henderson Distributors (May 2017-September 2017), Vice President, Compliance at Janus Capital Group Inc., Janus Capital Management LLC, and Janus Distributors LLC (2009-2017). | ||
Jesper
Nergaard | Chief Financial Officer | 3/05-Present | Head of U.S. Fund Administration, Janus Henderson Investors and Janus Services LLC. | ||
Abigail J. Murray | Vice President, Chief Legal Officer, and Secretary | 12/20-Present | Managing Counsel (2020-present). Formerly, Senior Counsel for Invesco Ltd. (2017-2020), and Vice President and Senior Counsel, ALPS Fund Services, Inc. and Assistant General Counsel, ALPS Advisors, Inc. (2015-2017). | ||
* Officers are elected at least annually by the Trustees for a one-year term and may also be elected from time to time by the Trustees for an interim period. | |||||
60 | DECEMBER 31, 2020 |
Janus Henderson VIT Balanced Portfolio
Notes
NotesPage1
Janus Aspen Series | 61 |
| ||||||||
This report is submitted for the general information of shareholders of the Portfolio. It is not an offer or solicitation for the Portfolio and is not authorized for distribution to prospective investors unless preceded or accompanied by an effective prospectus. | ||||||||
Janus Henderson, Janus, Henderson, Perkins, and Intech are trademarks of Janus Henderson Group plc or one of its subsidiaries. © Janus Henderson Group plc Janus Henderson Distributors | ||||||||
109-02-81113 03-21 | ||||||||

ANNUAL REPORT December 31, 2020 | ||
Janus Henderson VIT Enterprise Portfolio | ||
Janus Aspen Series | ||
HIGHLIGHTS · Portfolio management perspective · Investment strategy behind your portfolio · Portfolio
performance, characteristics |
|

Table of Contents
Janus Henderson VIT Enterprise Portfolio
Janus Henderson VIT Enterprise Portfolio (unaudited)(closed to certain new investors)


PERFORMANCE OVERVIEW
During the 12 months ended December 31, 2020, Janus Henderson VIT Enterprise Portfolio’s Institutional Shares and Service Shares returned 19.47% and 19.18%, respectively. The Portfolio’s benchmark, the Russell Midcap® Growth Index, returned 35.59%. Stock selection in the information technology sector detracted from the Portfolio’s relative performance. An underweight and stock selection in the consumer discretionary sector contributed positively to relative results.
INVESTMENT ENVIRONMENT
Mid-cap stocks ended the year with strong positive performance despite heightened volatility. Stocks declined sharply in the first quarter after the COVID 19 pandemic halted travel and disrupted supply chains. Efforts to contain the pandemic also led to a sharp economic contraction. The Federal Reserve responded aggressively to this crisis by cutting policy rates to zero, and Congress passed a $2 trillion economic stimulus package. Stocks regained ground in the second quarter and extended this rally into the third and fourth quarters, aided by signs of resilient economic and corporate earnings growth. The emergency approval of several COVID-19 vaccines also boosted market performance in the fourth quarter, as it raised hopes for a return to normalcy in 2021. Against this backdrop, communication services was the strongest-performing sector of the Russell Midcap® Growth Index, aided by the expansion in the digital economy. Energy was the weakest-performing sector, as the decline in miles driven reduced demand and pushed oil prices lower.
PERFORMANCE DISCUSSION
In our view, one of the most stunning developments of 2020 was the extreme outperformance of the most expensive stocks in our index. An unusual combination of factors contributed to this imbalance, including low interest rates, pandemic-driven disruptions to companies exposed to the physical economy and winner-take-all dynamics that allowed companies to quickly scale and dominate markets. Heightened uncertainty around COVID-19 also made investors willing to pay high stock prices for any companies they viewed as either insulated or benefiting from the pandemic. This confluence of factors pushed valuations higher even when companies did not substantially raise their revenue or earnings outlooks. Instead, these valuation increases were driven by multiple expansion, a dynamic we viewed as worrisome and unsustainable. We remain concerned that many of these companies will fail to produce the future growth rates needed to justify current stock valuations. While we believe our cautious approach to these expensive, more speculative growth stocks was warranted, it dampened our relative performance for the year.
Among our individual holdings, Boston Scientific was a prominent detractor. The medical device manufacturer lost a key growth driver after it was forced to pull its Lotus Edge transcatheter aortic valve replacement (TAVR) system from the market because of performance issues. Despite this setback, the company has other avenues for future revenue growth.
Cimpress, another detractor, produces marketing collateral for small businesses and the business-to-consumer segment. The stock declined in the first quarter after the company reported disappointing revenue growth. It also faced headwinds due to weaker economic growth during the rest of the year. Despite near-term uncertainty we continue to see potential in Cimpress’ unique business model, which allows it to use high-volume printers to produce small-volume orders at competitive costs.
On a positive note, a number of holdings benefited from pandemic-related trends such as the growth in e-commerce. Wayfair, a top positive contributor, sells furniture and housing accessories through its website. Its business benefited from consumers’ willingness to spend money online to make the pandemic-driven lockdown period more enjoyable. Sales trends were strong, helped by Wayfair’s expanded product breadth and customer
Janus Aspen Series | 1 |
Janus Henderson VIT Enterprise Portfolio (unaudited)(closed to certain new investors)
reach. The company also saw customers return for second or third purchases, which we view to be a strong indicator of customer loyalty and future earnings potential.
NICE Systems was another notable contributor. It offers technology solutions for call centers and data security, functions that were critical as more business interactions and commerce moved online during the pandemic. The company’s services include sophisticated analytical applications that help boost customer engagement, and it benefits from recurring revenue streams and high customer retention rates.
DERIVATIVES
Please see the Derivative Instruments section in the “Notes to Financial Statements” for a discussion of derivatives used by the Janus Henderson VIT Enterprise Portfolio.
OUTLOOK
As we look ahead to 2021, we believe the rollout of vaccines and the normalization of the economy could lead to renewed appreciation for the moderately priced, sustainable growth companies we own. At the same time, we recognize that recent market imbalances may persist in the short term, especially as it may take time for people to return to pre-pandemic behavior even after a vaccine is widely available. We also remain concerned about pockets of the market where we believe recent valuation gains have been driven more by speculation than by fundamentals. While a few of these stocks may warrant such prices, we believe it is incredibly optimistic to expect most to deliver the sustained rapid earnings growth needed to justify such valuations, especially considering historic growth rates. For this reason, we have remained disciplined in our approach to valuation, even as we have continued to focus on companies we believe can deliver sustained growth over a three- to five-year period. These include companies with durable competitive advantages and large addressable markets with higher barriers to entry, which will enable companies to raise prices if higher inflation accompanies an economic rebound. We also believe the recent period has led to new innovations, especially in the digital economy. We remain on the lookout for opportunities to capitalize on these changes by investing in reasonably valued companies we believe are positioned for strong relative growth over longer time horizons.
Thank you for your investment in Janus VIT Enterprise Portfolio.
2 | DECEMBER 31, 2020 |
Janus Henderson VIT Enterprise Portfolio (unaudited)(closed to certain new investors)
Portfolio At A Glance
December 31, 2020
|
|
|
|
|
|
|
|
|
|
|
|
|
|
|
|
|
|
|
|
|
|
|
|
|
|
|
|
|
|
| 5 Top Contributors - Holdings | 5 Top Detractors - Holdings | |||||||
|
| Average
|
| Relative
|
|
| Average |
| Relative
|
| Wayfair Inc | 0.93% |
| 1.17% |
| Boston Scientific Corp | 1.88% |
| -1.24% |
| Nice Ltd (ADR) | 2.70% |
| 1.01% |
| Magellan Midstream Partners LP | 1.47% |
| -1.14% |
| Catalent Inc | 1.50% |
| 0.53% |
| Cimpress PLC | 0.88% |
| -0.81% |
| Lam Research Corp | 1.64% |
| 0.39% |
| Aon PLC | 2.22% |
| -0.77% |
| Ritchie Bros Auctioneers Inc | 1.28% |
| 0.32% |
| Norwegian Cruise Line Holdings Ltd | 0.14% |
| -0.73% |
| 5 Top Contributors - Sectors* |
|
|
|
|
|
|
|
| Relative |
| Portfolio | Russell Midcap Growth Index |
|
|
| Contribution |
| Average Weight | Average Weight |
| Consumer Discretionary |
| 1.02% |
| 7.31% | 12.39% |
| Consumer Staples |
| 0.72% |
| 0.00% | 3.71% |
| Materials |
| 0.29% |
| 1.10% | 2.40% |
| Industrials |
| -0.33% |
| 15.89% | 14.05% |
| Utilities |
| -0.44% |
| 0.65% | 0.05% |
|
|
|
|
|
|
|
|
|
|
|
|
|
|
| 5 Top Detractors - Sectors* |
|
|
|
|
|
|
|
| Relative |
| Portfolio | Russell Midcap Growth Index |
|
|
| Contribution |
| Average Weight | Average Weight |
| Information Technology |
| -6.32% |
| 35.39% | 36.05% |
| Health Care |
| -4.47% |
| 18.55% | 19.44% |
| Financials |
| -2.45% |
| 11.10% | 3.96% |
| Communication Services |
| -1.35% |
| 0.49% | 5.17% |
| Other** |
| -1.12% |
| 4.88% | 0.00% |
| Relative contribution reflects
how the portolio's holdings impacted return relative to the benchmark. Cash and securities not held in
the portfolio are not shown. For equity portfolios, relative contribution compares the performance of
a security in the portfolio to the benchmark's total return, factoring in the difference in weight of
that security in the benchmark. Returns are calculated using daily returns and previous day ending weights
rolled up by ticker, excluding fixed income securities, gross of advisory fees, may exclude certain derivatives
and will differ from actual performance. | |||||
* | Based on sector classification according to the Global Industry Classification Standard (“GICS”) codes, which are the exclusive property and a service mark of MSCI Inc. and Standard & Poor’s. | |||||
** | Not a GICS classified sector. | |||||
Janus Aspen Series | 3 |
Janus Henderson VIT Enterprise Portfolio (unaudited)(closed to certain new investors)
Portfolio At A Glance
December 31, 2020
5 Largest Equity Holdings - (% of Net Assets) | |
Nice Ltd (ADR) | |
Software | 3.0% |
SS&C Technologies Holdings Inc | |
Software | 2.6% |
Microchip Technology Inc | |
Semiconductor & Semiconductor Equipment | 2.4% |
KLA Corp | |
Semiconductor & Semiconductor Equipment | 2.4% |
TE Connectivity Ltd | |
Electronic Equipment, Instruments & Components | 2.2% |
12.6% | |
Asset Allocation - (% of Net Assets) | |||||
Common Stocks | 96.2% | ||||
Investment Companies | 4.0% | ||||
Investments Purchased with Cash Collateral from Securities Lending | 0.2% | ||||
Other | (0.4)% | ||||
100.0% | |||||
Top Country Allocations - Long Positions - (% of Investment Securities) | |
As of December 31, 2020
| As of December 31, 2019
|
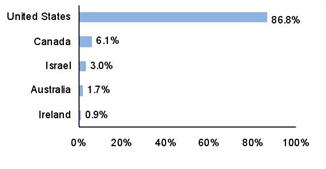

4 | DECEMBER 31, 2020 |
Janus Henderson VIT Enterprise Portfolio (unaudited)(closed to certain new investors)
Performance
See important disclosures on the next page. |

|
|
|
|
|
|
|
|
| |
|
|
|
|
|
|
|
|
|
|
Average Annual Total Return - for the periods ended December 31, 2020 |
|
| Expense Ratios | ||||||
|
| One
| Five | Ten
| Since |
|
| Total
Annual Fund | |
Institutional Shares(1) |
| 19.47% | 18.21% | 15.25% | 11.73% |
|
| 0.72% | |
Service Shares(1) |
| 19.18% | 17.92% | 14.97% | 11.45% |
|
| 0.97% | |
Russell Midcap Growth Index |
| 35.59% | 18.66% | 15.04% | 10.97% |
|
|
| |
Morningstar Quartile - Institutional Shares |
| 4th | 2nd | 1st | 2nd |
|
|
| |
Morningstar Ranking - based on total returns for Mid-Cap Growth Funds |
| 554/609 | 251/563 | 134/512 | 53/151 |
|
|
| |
Returns quoted are past performance and do not guarantee future results; current performance may be lower or higher. Investment returns and principal value will vary; there may be a gain or loss when shares are sold. For the most recent month-end performance call 800.668.0434 or visit janushenderson.com/VITperformance.
Performance may be affected by risks that include those associated with foreign and emerging markets, fixed income securities, high-yield and high-risk securities, undervalued, overlooked and smaller capitalization companies, real estate related securities including Real Estate Investment Trusts (REITs), non-diversification, portfolio turnover, derivatives, short sales, initial public offerings (IPOs) and potential conflicts of interest. Each product has different risks. Please see the prospectus for more information about risks, holdings and other details.
Returns do not reflect the deduction of fees, charges or expenses of any insurance product or qualified plan. If applied, returns would have been lower.
Returns include reinvestment of all dividends and distributions and do not reflect the deduction of taxes that a shareholder would pay on Portfolio distributions or redemptions of Portfolio shares. The returns do not include adjustments in accordance with generally accepted accounting principles required at the period end for financial reporting purposes.
Performance for Service Shares prior to December 31, 1999 reflects the performance of Institutional Shares, adjusted to reflect the expenses of Service Shares.
Ranking is for the share class shown only; other classes may have different performance characteristics.
© 2020 Morningstar, Inc. All Rights Reserved.
There is no assurance that the investment process will consistently lead to successful investing.
See Notes to Schedule of Investments and Other Information for index definitions.
Index performance does not reflect the expenses of managing a portfolio as an index is unmanaged and not available for direct investment.
See “Useful Information About Your Portfolio Report.”
*The Portfolio’s inception date – September 13, 1993
Janus Aspen Series | 5 |
Janus Henderson VIT Enterprise Portfolio (unaudited)(closed to certain new investors)
Performance
‡ As stated in the prospectus. See Financial Highlights for actual expense ratios during the reporting period.
(1) Closed to certain new investors.
6 | DECEMBER 31, 2020 |
Janus Henderson VIT Enterprise Portfolio (unaudited)(closed to certain new investors)
Expense Examples
As a shareholder of the Portfolio, you incur two types of costs: (1) transaction costs and (2) ongoing costs, including management fees; 12b-1 distribution and shareholder servicing fees (applicable to Service Shares only); transfer agent fees and expenses payable pursuant to the Transfer Agency Agreement; and other Portfolio expenses. This example is intended to help you understand your ongoing costs (in dollars) of investing in the Portfolio and to compare these costs with the ongoing costs of investing in other mutual funds. To do so, compare this 5% hypothetical example with the 5% hypothetical examples that appear in the shareholder reports of the other funds. The example is based upon an investment of $1,000 invested at the beginning of the period and held for the six-months indicated, unless noted otherwise in the table and footnotes below.
Actual Expenses
The information in the table under the heading “Actual” provides information about actual account values and actual expenses. You may use the information in these columns, together with the amount you invested, to estimate the expenses that you paid over the period. Simply divide your account value by $1,000 (for example, an $8,600 account value divided by $1,000 = 8.6), then multiply the result by the number in the appropriate column for your share class under the heading entitled “Expenses Paid During Period” to estimate the expenses you paid on your account during the period.
Hypothetical Example for Comparison Purposes
The information in the table under the heading “Hypothetical (5% return before expenses)” provides information about hypothetical account values and hypothetical expenses based upon the Portfolio’s actual expense ratio and an assumed rate of return of 5% per year before expenses, which is not the Portfolio’s actual return. The hypothetical account values and expenses may not be used to estimate the actual ending account balance or expenses you paid for the period. You may use this information to compare the ongoing costs of investing in the Portfolio and other funds. To do so, compare this 5% hypothetical example with the 5% hypothetical examples that appear in the shareholder reports of the other funds. Additionally, for an analysis of the fees associated with an investment in either share class or other similar funds, please visit www.finra.org/fundanalyzer.
Please note that the expenses shown in the table are meant to highlight your ongoing costs only and do not reflect any transaction costs, such as any charges at the separate account level or contract level. These fees are fully described in the Portfolio’s prospectuses. Therefore, the hypothetical examples are useful in comparing ongoing costs only, and will not help you determine the relative total costs of owning different funds. In addition, if these transaction costs were included, your costs would have been higher.
|
|
|
|
|
|
|
|
| ||
|
|
| Actual |
| Hypothetical
|
| ||||
| Beginning | Ending | Expenses |
| Beginning | Ending | Expenses | Net Annualized | ||
Institutional Shares | $1,000.00 | $1,283.50 | $4.19 |
| $1,000.00 | $1,021.47 | $3.71 | 0.73% | ||
Service Shares | $1,000.00 | $1,281.80 | $5.68 |
| $1,000.00 | $1,020.16 | $5.03 | 0.99% | ||
† | Expenses Paid During Period are equal to the Net Annualized Expense Ratio multiplied by the average account value over the period, multiplied by 184/366 (to reflect the one-half year period). Expenses in the examples include the effect of applicable fee waivers and/or expense reimbursements, if any. Had such waivers and/or reimbursements not been in effect, your expenses would have been higher. Please refer to the Notes to Financial Statements or the Portfolio’s prospectuses for more information regarding waivers and/or reimbursements. | |||||||||
Janus Aspen Series | 7 |
Janus Henderson VIT Enterprise Portfolio
Schedule of Investments
December 31, 2020
Shares
or | Value | ||||||
Common Stocks– 96.2% | |||||||
Aerospace & Defense – 2.6% | |||||||
L3Harris Technologies Inc | 107,060 | $20,236,481 | |||||
Teledyne Technologies Inc* | 59,094 | 23,163,666 | |||||
43,400,147 | |||||||
Airlines – 0.9% | |||||||
Ryanair Holdings PLC (ADR)* | 138,279 | 15,207,924 | |||||
Auto Components – 0.6% | |||||||
Visteon Corp* | 81,724 | 10,257,996 | |||||
Banks – 0.9% | |||||||
SVB Financial Group* | 37,671 | 14,609,944 | |||||
Biotechnology – 2.9% | |||||||
Abcam PLC (ADR)*,# | 208,800 | 4,499,640 | |||||
Ascendis Pharma A/S (ADR)* | 41,022 | 6,841,649 | |||||
BioMarin Pharmaceutical Inc* | 125,834 | 11,034,383 | |||||
Neurocrine Biosciences Inc* | 112,924 | 10,823,765 | |||||
RPI International Holdings LP (144A) | 125,340 | 5,959,765 | |||||
Sarepta Therapeutics Inc* | 54,669 | 9,320,518 | |||||
48,479,720 | |||||||
Capital Markets – 3.8% | |||||||
Cboe Global Markets Inc | 107,235 | 9,985,723 | |||||
Charles Schwab Corp | 230,206 | 12,210,126 | |||||
LPL Financial Holdings Inc | 305,969 | 31,888,089 | |||||
MSCI Inc | 24,359 | 10,877,024 | |||||
64,960,962 | |||||||
Commercial Services & Supplies – 3.2% | |||||||
Cimpress PLC* | 150,495 | 13,204,431 | |||||
Edenred | 256,051 | 14,526,292 | |||||
Ritchie Bros Auctioneers Inc | 384,093 | 26,713,668 | |||||
54,444,391 | |||||||
Containers & Packaging – 1.2% | |||||||
Sealed Air Corp | 458,588 | 20,998,745 | |||||
Diversified Consumer Services – 1.7% | |||||||
frontdoor Inc* | 187,787 | 9,428,785 | |||||
Terminix Global Holdings Inc* | 382,086 | 19,490,207 | |||||
28,918,992 | |||||||
Electric Utilities – 1.2% | |||||||
Alliant Energy Corp | 401,550 | 20,691,872 | |||||
Electrical Equipment – 1.8% | |||||||
Sensata Technologies Holding PLC* | 585,167 | 30,861,708 | |||||
Electronic Equipment, Instruments & Components – 5.8% | |||||||
Dolby Laboratories Inc | 194,718 | 18,912,959 | |||||
Flex Ltd* | 1,277,236 | 22,964,703 | |||||
National Instruments Corp | 431,702 | 18,968,986 | |||||
TE Connectivity Ltd | 304,091 | 36,816,297 | |||||
97,662,945 | |||||||
Entertainment – 0.5% | |||||||
Liberty Media Corp-Liberty Formula One* | 191,260 | 8,147,676 | |||||
Equity Real Estate Investment Trusts (REITs) – 2.3% | |||||||
Crown Castle International Corp | 75,290 | 11,985,415 | |||||
Lamar Advertising Co | 320,195 | 26,646,628 | |||||
38,632,043 | |||||||
Health Care Equipment & Supplies – 8.2% | |||||||
Boston Scientific Corp* | 745,673 | 26,806,944 | |||||
Cooper Cos Inc | 90,400 | 32,844,128 | |||||
Dentsply Sirona Inc | 275,686 | 14,434,919 | |||||
ICU Medical Inc* | 77,960 | 16,721,640 | |||||
STERIS PLC | 100,961 | 19,136,148 | |||||
Teleflex Inc | 39,818 | 16,387,894 | |||||
See Notes to Schedule of Investments and Other Information and Notes to Financial Statements. | |
8 | DECEMBER 31, 2020 |
Janus Henderson VIT Enterprise Portfolio
Schedule of Investments
December 31, 2020
Shares
or | Value | ||||||
Common Stocks– (continued) | |||||||
Health Care Equipment & Supplies– (continued) | |||||||
Varian Medical Systems Inc* | 73,230 | $12,815,982 | |||||
139,147,655 | |||||||
Hotels, Restaurants & Leisure – 0.9% | |||||||
Airbnb Inc - Class A* | 13,123 | 1,926,456 | |||||
Aramark | 339,119 | 13,049,299 | |||||
14,975,755 | |||||||
Information Technology Services – 11.3% | |||||||
Amdocs Ltd | 375,345 | 26,623,221 | |||||
Broadridge Financial Solutions Inc | 233,900 | 35,833,480 | |||||
Euronet Worldwide Inc* | 55,992 | 8,114,361 | |||||
Fidelity National Information Services Inc | 191,529 | 27,093,692 | |||||
Global Payments Inc | 150,847 | 32,495,461 | |||||
GoDaddy Inc* | 388,720 | 32,244,324 | |||||
WEX Inc* | 140,766 | 28,650,104 | |||||
191,054,643 | |||||||
Insurance – 5.6% | |||||||
Aon PLC | 166,481 | 35,172,441 | |||||
Intact Financial Corp | 256,711 | 30,401,102 | |||||
Willis Towers Watson PLC | 16,509 | 3,478,116 | |||||
WR Berkley Corp | 374,425 | 24,869,309 | |||||
93,920,968 | |||||||
Internet & Direct Marketing Retail – 0.8% | |||||||
DoorDash Inc - Class A*,# | 10,853 | 1,549,266 | |||||
Wayfair Inc* | 50,412 | 11,383,534 | |||||
12,932,800 | |||||||
Life Sciences Tools & Services – 3.9% | |||||||
Illumina Inc* | 29,834 | 11,038,580 | |||||
PerkinElmer Inc | 137,887 | 19,786,785 | |||||
PRA Health Sciences Inc* | 129,967 | 16,303,061 | |||||
Waters Corp* | 75,921 | 18,784,374 | |||||
65,912,800 | |||||||
Machinery – 3.4% | |||||||
Ingersoll Rand Inc* | 410,238 | 18,690,443 | |||||
Middleby Corp* | 75,242 | 9,700,199 | |||||
Rexnord Corp | 373,230 | 14,738,853 | |||||
Wabtec Corp | 187,429 | 13,719,803 | |||||
56,849,298 | |||||||
Oil, Gas & Consumable Fuels – 1.3% | |||||||
Magellan Midstream Partners LP | 514,995 | 21,856,388 | |||||
Pharmaceuticals – 3.7% | |||||||
Bristol-Myers Squibb Co | 147,468 | 9,147,440 | |||||
Catalent Inc* | 286,462 | 29,812,100 | |||||
Elanco Animal Health Inc* | 435,020 | 13,342,063 | |||||
Royalty Pharma PLC - Class A | 207,383 | 10,379,519 | |||||
62,681,122 | |||||||
Professional Services – 2.5% | |||||||
CoStar Group Inc* | 17,582 | 16,250,691 | |||||
IHS Markit Ltd | 102,332 | 9,192,484 | |||||
Verisk Analytics Inc | 77,574 | 16,103,587 | |||||
41,546,762 | |||||||
Road & Rail – 0.9% | |||||||
JB Hunt Transport Services Inc | 116,212 | 15,880,370 | |||||
Semiconductor & Semiconductor Equipment – 9.1% | |||||||
KLA Corp | 155,536 | 40,269,826 | |||||
Lam Research Corp | 69,356 | 32,754,758 | |||||
Microchip Technology Inc | 292,921 | 40,455,319 | |||||
NXP Semiconductors NV | 64,577 | 10,268,389 | |||||
ON Semiconductor Corp* | 715,497 | 23,418,217 | |||||
See Notes to Schedule of Investments and Other Information and Notes to Financial Statements. | |
Janus Aspen Series | 9 |
Janus Henderson VIT Enterprise Portfolio
Schedule of Investments
December 31, 2020
Shares
or | Value | ||||||
Common Stocks– (continued) | |||||||
Semiconductor & Semiconductor Equipment– (continued) | |||||||
Xilinx Inc | 41,045 | $5,818,950 | |||||
152,985,459 | |||||||
Software – 11.5% | |||||||
Atlassian Corp PLC* | 120,773 | 28,245,182 | |||||
Bill.com Holdings Inc* | 23,008 | 3,140,592 | |||||
Ceridian HCM Holding Inc* | 256,849 | 27,369,829 | |||||
Constellation Software Inc/Canada | 24,642 | 32,003,814 | |||||
Dynatrace Inc* | 209,197 | 9,051,954 | |||||
Nice Ltd (ADR)* | 178,687 | 50,664,912 | |||||
SS&C Technologies Holdings Inc | 606,857 | 44,148,847 | |||||
Topicus.com Inc*,¢ | 45,829 | 0 | |||||
194,625,130 | |||||||
Specialty Retail – 2.0% | |||||||
Burlington Stores Inc* | 42,794 | 11,192,771 | |||||
CarMax Inc* | 236,022 | 22,294,638 | |||||
33,487,409 | |||||||
Textiles, Apparel & Luxury Goods – 0.8% | |||||||
Gildan Activewear Inc | 512,198 | 14,346,666 | |||||
Trading Companies & Distributors – 0.9% | |||||||
Ferguson PLC | 126,525 | 15,384,537 | |||||
Total Common Stocks (cost $842,923,489) | 1,624,862,827 | ||||||
Investment Companies– 4.0% | |||||||
Money Markets – 4.0% | |||||||
Janus Henderson Cash Liquidity Fund LLC, 0.1108%ºº,£((cost $67,875,445) | 67,872,097 | 67,878,884 | |||||
Investments Purchased with Cash Collateral from Securities Lending– 0.2% | |||||||
Investment Companies – 0.2% | |||||||
Janus Henderson Cash Collateral Fund LLC, 0.0264%ºº,£ | 2,859,857 | 2,859,857 | |||||
Time Deposits – 0% | |||||||
Canadian Imperial Bank of Commerce, 0.0800%, 1/4/21 | $714,964 | 714,964 | |||||
Total Investments Purchased with Cash Collateral from Securities Lending (cost $3,574,821) | 3,574,821 | ||||||
Total Investments (total cost $914,373,755) – 100.4% | 1,696,316,532 | ||||||
Liabilities, net of Cash, Receivables and Other Assets – (0.4)% | (5,953,949) | ||||||
Net Assets – 100% | $1,690,362,583 | ||||||
Summary of Investments by Country - (Long Positions) (unaudited) | |||||
% of | |||||
Investment | |||||
Country | Value | Securities | |||
United States | $1,472,865,683 | 86.8 | % | ||
Canada | 103,465,250 | 6.1 | |||
Israel | 50,664,912 | 3.0 | |||
Australia | 28,245,182 | 1.7 | |||
Ireland | 15,207,924 | 0.9 | |||
France | 14,526,292 | 0.8 | |||
Denmark | 6,841,649 | 0.4 | |||
United Kingdom | 4,499,640 | 0.3 | |||
Total | $1,696,316,532 | 100.0 | % |
See Notes to Schedule of Investments and Other Information and Notes to Financial Statements. | |
10 | DECEMBER 31, 2020 |
Janus Henderson VIT Enterprise Portfolio
Schedule of Investments
December 31, 2020
Schedules of Affiliated Investments – (% of Net Assets)
Dividend Income | Realized Gain/(Loss) | Change in Unrealized Appreciation/ Depreciation | Value at 12/31/20 | |||||||
Investment Companies - 4.0% | ||||||||||
Money Markets - 4.0% | ||||||||||
Janus Henderson Cash Liquidity Fund LLC, 0.1108%ºº | $ | 440,050 | $ | 7,164 | $ | 5,001 | $ | 67,878,884 | ||
Investments Purchased with Cash Collateral from Securities Lending - 0.2% | ||||||||||
Investment Companies - 0.2% | ||||||||||
Janus Henderson Cash Collateral Fund LLC, 0.0264%ºº | 14,822∆ | - | - | 2,859,857 | ||||||
Total Affiliated Investments - 4.2% | $ | 454,872 | $ | 7,164 | $ | 5,001 | $ | 70,738,741 | ||
Value at 12/31/19 | Purchases | Sales Proceeds | Value at 12/31/20 | |||||||
Investment Companies - 4.0% | ||||||||||
Money Markets - 4.0% | ||||||||||
Janus Henderson Cash Liquidity Fund LLC, 0.1108%ºº | 106,440,118 | 211,430,988 | (250,004,387) | 67,878,884 | ||||||
Investments Purchased with Cash Collateral from Securities Lending - 0.2% | ||||||||||
Investment Companies - 0.2% | ||||||||||
Janus Henderson Cash Collateral Fund LLC, 0.0264%ºº | 3,921,920 | 175,239,006 | (176,301,069) | 2,859,857 | ||||||
Schedule of Forward Foreign Currency Exchange Contracts, Open |
Counterparty/ Foreign Currency | Settlement Date | Foreign Currency Amount (Sold)/ Purchased | USD Currency Amount (Sold)/ Purchased | Market Value and Unrealized Appreciation/ (Depreciation) | ||||
Barclays Capital, Inc.: | ||||||||
Canadian Dollar | 3/4/21 | (8,943,000) | $ | 7,036,912 | $ | 8,069 | ||
Euro | 3/4/21 | (793,000) | 973,115 | 3,103 | ||||
Euro | 3/4/21 | (2,698,000) | 3,279,041 | (21,200) | ||||
(10,028) | ||||||||
Citibank, National Association: | ||||||||
Canadian Dollar | 3/4/21 | (6,127,000) | 4,819,943 | 4,365 | ||||
Canadian Dollar | 3/4/21 | (616,000) | 479,260 | (4,891) | ||||
Euro | 3/4/21 | 790,000 | (962,865) | 3,477 | ||||
Euro | 3/4/21 | 360,000 | (441,321) | (962) | ||||
Euro | 3/4/21 | (10,309,000) | 12,539,310 | (70,841) | ||||
See Notes to Schedule of Investments and Other Information and Notes to Financial Statements. | |
Janus Aspen Series | 11 |
Janus Henderson VIT Enterprise Portfolio
Schedule of Investments
December 31, 2020
Counterparty/ Foreign Currency | Settlement Date | Foreign Currency Amount (Sold)/ Purchased | USD Currency Amount (Sold)/ Purchased | Market Value and Unrealized Appreciation/ (Depreciation) | ||||
(68,852) | ||||||||
Credit Suisse International: | ||||||||
Canadian Dollar | 3/4/21 | (12,427,000) | $ | 9,773,619 | 6,491 | |||
HSBC Securities (USA), Inc.: | ||||||||
Canadian Dollar | 3/4/21 | 590,000 | (458,979) | 4,737 | ||||
Canadian Dollar | 3/4/21 | (9,402,000) | 7,389,680 | 81 | ||||
Euro | 3/4/21 | (5,887,800) | 7,164,216 | (37,845) | ||||
(33,027) | ||||||||
JPMorgan Chase Bank, National Association: | ||||||||
Euro | 3/4/21 | (12,664,000) | 15,398,854 | (91,974) | ||||
Total | $ | (197,390) | ||||||
The following table, grouped by derivative type, provides information about the fair value and location of derivatives within the Statement of Assets and Liabilities as of December 31, 2020.
Fair Value of Derivative Instruments (not accounted for as hedging instruments) as of December 31, 2020 | |||||
|
|
|
|
|
|
|
|
|
|
| Currency
|
Asset Derivatives: |
|
|
| ||
Forward foreign currency exchange contracts |
|
| $ 30,323 | ||
Liability Derivatives: |
|
|
| ||
Forward foreign currency exchange contracts |
|
| $227,713 | ||
The following tables provide information about the effect of derivatives and hedging activities on the Portfolio’s Statement of Operations for the year ended December 31, 2020.
The effect of Derivative Instruments (not accounted for as hedging instruments) on the Statement of Operations for the year ended December 31, 2020 | ||||
|
|
|
|
|
Amount of Realized Gain/(Loss) Recognized on Derivatives | ||||
Derivative |
| Currency | ||
Forward foreign currency exchange contracts |
| $(2,777,660) | ||
|
|
| ||
|
|
| ||
Amount of Change in Unrealized Appreciation/Depreciation Recognized on Derivatives | ||||
Derivative |
| Currency
| ||
Forward foreign currency exchange contracts |
| $ 331,453 | ||
Please see the "Net Realized Gain/(Loss) on Investments" and "Change in Unrealized Net Appreciation/Depreciation" sections of the Portfolio’s Statement of Operations.
See Notes to Schedule of Investments and Other Information and Notes to Financial Statements. | |
12 | DECEMBER 31, 2020 |
Janus Henderson VIT Enterprise Portfolio
Schedule of Investments
December 31, 2020
Average Ending Monthly Market Value of Derivative Instruments During the Year Ended December 31, 2020 | |
|
|
| Market Value(a) |
Forward foreign currency exchange contracts, purchased | $ 143,878 |
Forward foreign currency exchange contracts, sold | 49,279,682 |
(a) Forward foreign currency exchange contracts are reported as the average ending monthly currency amount purchased or sold. | |
See Notes to Schedule of Investments and Other Information and Notes to Financial Statements. | |
Janus Aspen Series | 13 |
Janus Henderson VIT Enterprise Portfolio
Notes to Schedule of Investments and Other Information
Russell Midcap® Growth Index | Russell Midcap® Growth Index reflects the performance of U.S. mid-cap equities with higher price-to-book ratios and higher forecasted growth values. |
ADR | American Depositary Receipt |
LLC | Limited Liability Company |
LP | Limited Partnership |
PLC | Public Limited Company |
144A | Securities sold under Rule 144A of the Securities Act of 1933, as amended, are subject to legal and/or contractual restrictions on resale and may not be publicly sold without registration under the 1933 Act. Unless otherwise noted, these securities have been determined to be liquid under guidelines established by the Board of Trustees. The total value of 144A securities as of the year ended December 31, 2020 is $5,959,765, which represents 0.4% of net assets. |
* | Non-income producing security. |
ºº | Rate shown is the 7-day yield as of December 31, 2020. |
# | Loaned security; a portion of the security is on loan at December 31, 2020. |
¢ | Security is valued using significant unobservable inputs. |
£ | The Portfolio may invest in certain securities that are considered affiliated companies. As defined by the Investment Company Act of 1940, as amended, an affiliated company is one in which the Portfolio owns 5% or more of the outstanding voting securities, or a company which is under common ownership or control. |
∆ | Net of income paid to the securities lending agent and rebates paid to the borrowing counterparties. |
14 | DECEMBER 31, 2020 |
Janus Henderson VIT Enterprise Portfolio
Notes to Schedule of Investments and Other Information
The following is a summary of the inputs that were used to value the Portfolio’s investments in securities and other financial instruments as of December 31, 2020. See Notes to Financial Statements for more information. | |||||||||||||
Valuation Inputs Summary | |||||||||||||
Level 2 - | Level 3 - | ||||||||||||
Level 1 - | Other Significant | Significant | |||||||||||
Quoted Prices | Observable Inputs | Unobservable Inputs | |||||||||||
Assets | |||||||||||||
Investments In Securities: | |||||||||||||
Common Stocks | |||||||||||||
Biotechnology | $ | 42,519,955 | $ | 5,959,765 | $ | - | |||||||
Commercial Services & Supplies | 39,918,099 | 14,526,292 | - | ||||||||||
Software | 194,625,130 | - | 0 | ||||||||||
Trading Companies & Distributors | - | 15,384,537 | - | ||||||||||
All Other | 1,311,929,049 | - | - | ||||||||||
Investment Companies | - | 67,878,884 | - | ||||||||||
Investments Purchased with Cash Collateral from Securities Lending | - | 3,574,821 | - | ||||||||||
Total Investments in Securities | $ | 1,588,992,233 | $ | 107,324,299 | $ | 0 | |||||||
Other Financial Instruments(a): | |||||||||||||
Forward Foreign Currency Exchange Contracts | - | 30,323 | - | ||||||||||
Total Assets | $ | 1,588,992,233 | $ | 107,354,622 | $ | 0 | |||||||
Liabilities | |||||||||||||
Other Financial Instruments(a): | |||||||||||||
Forward Foreign Currency Exchange Contracts | $ | - | $ | 227,713 | $ | - | |||||||
(a) | Other financial instruments include forward foreign currency exchange, futures, written options, written swaptions, and swap contracts. Forward foreign currency exchange contracts are reported at their unrealized appreciation/(depreciation) at measurement date, which represents the change in the contract's value from trade date. Futures, certain written options on futures, and centrally cleared swap contracts are reported at their variation margin at measurement date, which represents the amount due to/from the Portfolio at that date. Written options, written swaptions, and other swap contracts are reported at their market value at measurement date. | ||||||||||||
Janus Aspen Series | 15 |
Janus Henderson VIT Enterprise Portfolio
Statement of Assets and Liabilities
December 31, 2020
|
|
|
|
|
|
|
Assets: |
|
|
|
| ||
| Unaffiliated investments, at value(1)(2) |
| $ | 1,625,577,791 |
| |
| Affiliated investments, at value(3) |
|
| 70,738,741 |
| |
| Forward foreign currency exchange contracts |
|
| 30,323 |
| |
| Non-interested Trustees' deferred compensation |
|
| 38,973 |
| |
| Receivables: |
|
|
|
| |
|
| Investments sold |
|
| 1,829,128 |
|
|
| Portfolio shares sold |
|
| 653,170 |
|
|
| Dividends |
|
| 497,730 |
|
|
| Dividends from affiliates |
|
| 5,751 |
|
| Other assets |
|
| 14,648 |
| |
Total Assets |
|
| 1,699,386,255 |
| ||
Liabilities: |
|
|
|
| ||
| Collateral for securities loaned (Note 3) |
|
| 3,574,821 |
| |
| Forward foreign currency exchange contracts |
|
| 227,713 |
| |
| Closed foreign currency contracts |
|
| 253,409 |
| |
| Payables: |
|
| — |
| |
|
| Portfolio shares repurchased |
|
| 3,520,120 |
|
|
| Advisory fees |
|
| 990,090 |
|
|
| 12b-1 Distribution and shareholder servicing fees |
|
| 210,142 |
|
|
| Transfer agent fees and expenses |
|
| 83,839 |
|
|
| Professional fees |
|
| 39,339 |
|
|
| Non-interested Trustees' deferred compensation fees |
|
| 38,973 |
|
|
| Affiliated portfolio administration fees payable |
|
| 3,868 |
|
|
| Custodian fees |
|
| 3,339 |
|
|
| Non-interested Trustees' fees and expenses |
|
| 1,943 |
|
|
| Accrued expenses and other payables |
|
| 76,076 |
|
Total Liabilities |
|
| 9,023,672 |
| ||
Net Assets |
| $ | 1,690,362,583 |
| ||
Net Assets Consist of: |
|
|
|
| ||
| Capital (par value and paid-in surplus) |
| $ | 751,939,275 |
| |
| Total distributable earnings (loss) |
|
| 938,423,308 |
| |
Total Net Assets |
| $ | 1,690,362,583 |
| ||
Net Assets - Institutional Shares |
| $ | 768,141,223 |
| ||
| Shares Outstanding, $0.001 Par Value (unlimited shares authorized) |
|
| 8,153,332 |
| |
Net Asset Value Per Share |
| $ | 94.21 |
| ||
Net Assets - Service Shares |
| $ | 922,221,360 |
| ||
| Shares Outstanding, $0.001 Par Value (unlimited shares authorized) |
|
| 10,544,256 |
| |
Net Asset Value Per Share |
| $ | 87.46 |
| ||
(1) Includes cost of $843,638,453. (2) Includes $3,493,848 of securities on loan. See Note 3 in Notes to Financial Statements. (3) Includes cost of $70,735,302. |
See Notes to Financial Statements. | |
16 | DECEMBER 31, 2020 |
Janus Henderson VIT Enterprise Portfolio
Statement of Operations
For the year ended December 31, 2020
|
|
|
|
|
|
Investment Income: |
|
|
| ||
| Dividends | $ | 14,088,850 |
| |
| Dividends from affiliates |
| 440,050 |
| |
| Affiliated securities lending income, net |
| 14,822 |
| |
| Unaffiliated securities lending income, net |
| 1,364 |
| |
| Other income |
| 13 |
| |
| Foreign tax withheld |
| (197,438) |
| |
Total Investment Income |
| 14,347,661 |
| ||
Expenses: |
|
|
| ||
| Advisory fees |
| 9,490,207 |
| |
| 12b-1 Distribution and shareholder servicing fees: |
|
|
| |
|
| Service Shares |
| 1,948,140 |
|
| Transfer agent administrative fees and expenses: |
|
|
| |
|
| Institutional Shares |
| 351,794 |
|
|
| Service Shares |
| 389,628 |
|
| Other transfer agent fees and expenses: |
|
|
| |
|
| Institutional Shares |
| 35,343 |
|
|
| Service Shares |
| 18,426 |
|
| Shareholder reports expense |
| 72,831 |
| |
| Professional fees |
| 51,347 |
| |
| Affiliated portfolio administration fees |
| 37,071 |
| |
| Non-interested Trustees’ fees and expenses |
| 27,599 |
| |
| Custodian fees |
| 27,096 |
| |
| Registration fees |
| 25,060 |
| |
| Other expenses |
| 121,710 |
| |
Total Expenses |
| 12,596,252 |
| ||
Net Investment Income/(Loss) |
| 1,751,409 |
| ||
Net Realized Gain/(Loss) on Investments: |
|
|
| ||
| Investments and foreign currency transactions |
| 155,301,235 |
| |
| Investments in affiliates |
| 7,164 |
| |
| Forward foreign currency exchange contracts |
| (2,777,660) |
| |
Total Net Realized Gain/(Loss) on Investments |
| 152,530,739 |
| ||
Change in Unrealized Net Appreciation/Depreciation: |
|
|
| ||
| Investments, foreign currency translations and non-interested Trustees’ deferred compensation |
| 116,436,711 |
| |
| Investments in affiliates |
| 5,001 |
| |
| Forward foreign currency exchange contracts |
| 331,453 |
| |
Total Change in Unrealized Net Appreciation/Depreciation |
| 116,773,165 |
| ||
Net Increase/(Decrease) in Net Assets Resulting from Operations | $ | 271,055,313 |
| ||
|
|
|
|
|
|
See Notes to Financial Statements. | |
Janus Aspen Series | 17 |
Janus Henderson VIT Enterprise Portfolio
Statements of Changes in Net Assets
|
|
|
|
|
|
|
|
|
|
|
| Year ended |
| Year ended |
| ||
Operations: |
|
|
|
|
|
| ||
| Net investment income/(loss) | $ | 1,751,409 |
| $ | 3,462,396 |
| |
| Net realized gain/(loss) on investments |
| 152,530,739 |
|
| 111,811,975 |
| |
| Change in unrealized net appreciation/depreciation |
| 116,773,165 |
|
| 298,949,675 |
| |
Net Increase/(Decrease) in Net Assets Resulting from Operations |
| 271,055,313 |
|
| 414,224,046 |
| ||
Dividends and Distributions to Shareholders: |
|
|
|
|
|
| ||
|
| Institutional Shares |
| (51,851,530) |
|
| (41,927,038) |
|
|
| Service Shares |
| (59,611,141) |
|
| (45,398,321) |
|
Net Decrease from Dividends and Distributions to Shareholders |
| (111,462,671) |
|
| (87,325,359) |
| ||
Capital Share Transactions: |
|
|
|
|
|
| ||
|
| Institutional Shares |
| (91,362,702) |
|
| 50,633,453 |
|
|
| Service Shares |
| 9,681,015 |
|
| 68,470,182 |
|
Net Increase/(Decrease) from Capital Share Transactions |
| (81,681,687) |
|
| 119,103,635 |
| ||
Net Increase/(Decrease) in Net Assets |
| 77,910,955 |
|
| 446,002,322 |
| ||
Net Assets: |
|
|
|
|
|
| ||
| Beginning of period |
| 1,612,451,628 |
|
| 1,166,449,306 |
| |
| End of period | $ | 1,690,362,583 |
| $ | 1,612,451,628 |
| |
|
|
|
|
|
|
|
|
|
See Notes to Financial Statements. | |
18 | DECEMBER 31, 2020 |
Janus Henderson VIT Enterprise Portfolio
Financial Highlights
Institutional Shares |
|
|
|
|
|
|
|
|
|
|
|
|
|
|
| |||
For a share outstanding during the year ended December 31 |
| 2020 |
|
| 2019 |
|
| 2018 |
|
| 2017 |
|
| 2016 |
| |||
| Net Asset Value, Beginning of Period |
| $85.46 |
|
| $67.02 |
|
| $70.65 |
|
| $59.27 |
|
| $57.33 |
| ||
| Income/(Loss) from Investment Operations: |
|
|
|
|
|
|
|
|
|
|
|
|
|
|
| ||
|
| Net investment income/(loss)(1) |
| 0.20 |
|
| 0.29 |
|
| 0.21 |
|
| 0.11 |
|
| 0.28 |
| |
|
| Net realized and unrealized gain/(loss) |
| 14.53 |
|
| 23.06 |
|
| (0.16) |
|
| 15.67 |
|
| 6.50 |
| |
| Total from Investment Operations |
| 14.73 |
|
| 23.35 |
|
| 0.05 |
|
| 15.78 |
|
| 6.78 |
| ||
| Less Dividends and Distributions: |
|
|
|
|
|
|
|
|
|
|
|
|
|
|
| ||
|
| Dividends (from net investment income) |
| (0.06) |
|
| (0.16) |
|
| (0.18) |
|
| (0.17) |
|
| (0.09) |
| |
|
| Distributions (from capital gains) |
| (5.92) |
|
| (4.75) |
|
| (3.50) |
|
| (4.23) |
|
| (4.75) |
| |
| Total Dividends and Distributions |
| (5.98) |
|
| (4.91) |
|
| (3.68) |
|
| (4.40) |
|
| (4.84) |
| ||
| Net Asset Value, End of Period |
| $94.21 |
|
| $85.46 |
|
| $67.02 |
|
| $70.65 |
|
| $59.27 |
| ||
| Total Return* |
| 19.47% |
|
| 35.48% |
|
| (0.41)% |
|
| 27.42% |
|
| 12.36% |
| ||
| Net Assets, End of Period (in thousands) |
| $768,141 |
|
| $791,044 |
|
| $577,477 |
|
| $618,750 |
|
| $459,250 |
| ||
| Average Net Assets for the Period (in thousands) |
| $699,442 |
|
| $707,052 |
|
| $641,390 |
|
| $556,940 |
|
| $435,190 |
| ||
| Ratios to Average Net Assets**: |
|
|
|
|
|
|
|
|
|
|
|
|
|
|
| ||
|
| Ratio of Gross Expenses |
| 0.72% |
|
| 0.72% |
|
| 0.72% |
|
| 0.73% |
|
| 0.72% |
| |
|
| Ratio of Net Expenses (After Waivers and Expense Offsets) |
| 0.72% |
|
| 0.72% |
|
| 0.72% |
|
| 0.73% |
|
| 0.72% |
| |
|
| Ratio of Net Investment Income/(Loss) |
| 0.25% |
|
| 0.37% |
|
| 0.29% |
|
| 0.17% |
|
| 0.48% |
| |
| Portfolio Turnover Rate |
| 16% |
|
| 14% |
|
| 14% |
|
| 14% |
|
| 20% |
| ||
Service Shares |
|
|
|
|
|
|
|
|
|
|
|
|
|
|
| |||
For a share outstanding during the year ended December 31 |
| 2020 |
|
| 2019 |
|
| 2018 |
|
| 2017 |
|
| 2016 |
| |||
| Net Asset Value, Beginning of Period |
| $79.93 |
|
| $63.00 |
|
| $66.67 |
|
| $56.22 |
|
| $54.67 |
| ||
| Income/(Loss) from Investment Operations: |
|
|
|
|
|
|
|
|
|
|
|
|
|
|
| ||
|
| Net investment income/(loss)(1) |
| —(2) |
|
| 0.09 |
|
| 0.03 |
|
| (0.05) |
|
| 0.12 |
| |
|
| Net realized and unrealized gain/(loss) |
| 13.45 |
|
| 21.63 |
|
| (0.12) |
|
| 14.82 |
|
| 6.19 |
| |
| Total from Investment Operations |
| 13.45 |
|
| 21.72 |
|
| (0.09) |
|
| 14.77 |
|
| 6.31 |
| ||
| Less Dividends and Distributions: |
|
|
|
|
|
|
|
|
|
|
|
|
|
|
| ||
|
| Dividends (from net investment income) |
| — |
|
| (0.04) |
|
| (0.08) |
|
| (0.09) |
|
| (0.01) |
| |
|
| Distributions (from capital gains) |
| (5.92) |
|
| (4.75) |
|
| (3.50) |
|
| (4.23) |
|
| (4.75) |
| |
| Total Dividends and Distributions |
| (5.92) |
|
| (4.79) |
|
| (3.58) |
|
| (4.32) |
|
| (4.76) |
| ||
| Net Asset Value, End of Period |
| $87.46 |
|
| $79.93 |
|
| $63.00 |
|
| $66.67 |
|
| $56.22 |
| ||
| Total Return* |
| 19.18% |
|
| 35.14% |
|
| (0.65)% |
|
| 27.09% |
|
| 12.10% |
| ||
| Net Assets, End of Period (in thousands) |
| $922,221 |
|
| $821,408 |
|
| $588,973 |
|
| $555,550 |
|
| $419,251 |
| ||
| Average Net Assets for the Period (in thousands) |
| $773,949 |
|
| $734,274 |
|
| $612,433 |
|
| $489,237 |
|
| $373,400 |
| ||
| Ratios to Average Net Assets**: |
|
|
|
|
|
|
|
|
|
|
|
|
|
|
| ||
|
| Ratio of Gross Expenses |
| 0.97% |
|
| 0.97% |
|
| 0.97% |
|
| 0.98% |
|
| 0.97% |
| |
|
| Ratio of Net Expenses (After Waivers and Expense Offsets) |
| 0.97% |
|
| 0.97% |
|
| 0.97% |
|
| 0.98% |
|
| 0.97% |
| |
|
| Ratio of Net Investment Income/(Loss) |
| 0.00%(3) |
|
| 0.12% |
|
| 0.04% |
|
| (0.08)% |
|
| 0.22% |
| |
| Portfolio Turnover Rate |
| 16% |
|
| 14% |
|
| 14% |
|
| 14% |
|
| 20% |
| ||
* Total return includes adjustments in accordance with generally accepted accounting principles required at the year or period end and are not annualized for periods of less than one full year. Total return does not include fees, charges, or expenses imposed by the variable annuity and life insurance contracts for which Janus Aspen Series serves as an underlying investment vehicle. ** Annualized for periods of less than one full year. (1) Per share amounts are calculated based on average shares outstanding during the year or period. (2) Less than $0.005 on a per share basis. (3) Less than 0.005%. |
See Notes to Financial Statements. | |
Janus Aspen Series | 19 |
Janus Henderson VIT Enterprise Portfolio
Notes to Financial Statements
1. Organization and Significant Accounting Policies
Janus Henderson VIT Enterprise Portfolio (the “Portfolio”) is a series of Janus Aspen Series (the “Trust”), which is organized as a Delaware statutory trust and is registered under the Investment Company Act of 1940, as amended (the “1940 Act”), as an open-end management investment company, and therefore has applied the specialized accounting and reporting guidance in Financial Accounting Standards Board (“FASB”) Accounting Standards Codification (“ASC”) Topic 946. The Trust offers 11 portfolios, each of which offers multiple share classes, with differing investment objectives and policies. The Portfolio seeks long-term growth of capital. The Portfolio is classified as diversified, as defined in the 1940 Act.
The Portfolio currently offers two classes of shares: Institutional Shares and Service Shares. Each class represents an interest in the same portfolio of investments. Institutional Shares are offered only in connection with investment in and payments under variable insurance contracts as well as certain qualified retirement plans. Service Shares are offered only in connection with investment in and payments under variable insurance contracts as well as certain qualified retirement plans that require a fee from Portfolio assets to procure distribution and administrative services to contract owners and plan participants.
Shareholders, including other portfolios, participating insurance companies, as well as accounts, may from time to time own (beneficially or of record) a significant percentage of the Portfolio’s Shares and can be considered to “control” the Portfolio when that ownership exceeds 25% of the Portfolio’s assets (and which may differ from control as determined in accordance with United States of America generally accepted accounting priciples ("US GAAP")).
The following accounting policies have been followed by the Portfolio and are in conformity with US GAAP.
Investment Valuation
Securities held by the Portfolio are valued in accordance with policies and procedures established by and under the supervision of the Trustees (the “Valuation Procedures”). Equity securities traded on a domestic securities exchange are generally valued at the closing prices on the primary market or exchange on which they trade. If such price is lacking for the trading period immediately preceding the time of determination, such securities are valued at their current bid price. Equity securities that are traded on a foreign exchange are generally valued at the closing prices on such markets. In the event that there is no current trading volume on a particular security in such foreign exchange, the bid price from the primary exchange is generally used to value the security. Securities that are traded on the over-the-counter (“OTC”) markets are generally valued at their closing or latest bid prices as available. Foreign securities and currencies are converted to U.S. dollars using the applicable exchange rate in effect at the close of the New York Stock Exchange (“NYSE”). The Portfolio will determine the market value of individual securities held by it by using prices provided by one or more approved professional pricing services or, as needed, by obtaining market quotations from independent broker-dealers. Most debt securities are valued in accordance with the evaluated bid price supplied by the pricing service that is intended to reflect market value. The evaluated bid price supplied by the pricing service is an evaluation that may consider factors such as security prices, yields, maturities and ratings. Certain short-term securities maturing within 60 days or less may be evaluated and valued on an amortized cost basis provided that the amortized cost determined approximates market value. Securities for which market quotations or evaluated prices are not readily available or deemed unreliable are valued at fair value determined in good faith under the Valuation Procedures. Circumstances in which fair value pricing may be utilized include, but are not limited to: (i) a significant event that may affect the securities of a single issuer, such as a merger, bankruptcy, or significant issuer-specific development; (ii) an event that may affect an entire market, such as a natural disaster or significant governmental action; (iii) a nonsignificant event such as a market closing early or not opening, or a security trading halt; and (iv) pricing of a nonvalued security and a restricted or nonpublic security. Special valuation considerations may apply with respect to “odd-lot” fixed-income transactions which, due to their small size, may receive evaluated prices by pricing services which reflect a large block trade and not what actually could be obtained for the odd-lot position. The Portfolio uses systematic fair valuation models provided by independent third parties to value international equity securities in order to adjust for stale pricing, which may occur between the close of certain foreign exchanges and the close of the NYSE.
Valuation Inputs Summary
FASB ASC 820, Fair Value Measurements and Disclosures (“ASC 820”), defines fair value, establishes a framework for measuring fair value, and expands disclosure requirements regarding fair value measurements. This standard emphasizes that fair value is a market-based measurement that should be determined based on the assumptions that
20 | DECEMBER 31, 2020 |
Janus Henderson VIT Enterprise Portfolio
Notes to Financial Statements
market participants would use in pricing an asset or liability and establishes a hierarchy that prioritizes inputs to valuation techniques used to measure fair value. These inputs are summarized into three broad levels:
Level 1 – Unadjusted quoted prices in active markets the Portfolio has the ability to access for identical assets or liabilities.
Level 2 – Observable inputs other than unadjusted quoted prices included in Level 1 that are observable for the asset or liability either directly or indirectly. These inputs may include quoted prices for the identical instrument on an inactive market, prices for similar instruments, interest rates, prepayment speeds, credit risk, yield curves, default rates and similar data.
Assets or liabilities categorized as Level 2 in the hierarchy generally include: debt securities fair valued in accordance with the evaluated bid or ask prices supplied by a pricing service; securities traded on OTC markets and listed securities for which no sales are reported that are fair valued at the latest bid price (or yield equivalent thereof) obtained from one or more dealers transacting in a market for such securities or by a pricing service approved by the Portfolio’s Trustees; certain short-term debt securities with maturities of 60 days or less that are fair valued at amortized cost; and equity securities of foreign issuers whose fair value is determined by using systematic fair valuation models provided by independent third parties in order to adjust for stale pricing which may occur between the close of certain foreign exchanges and the close of the NYSE. Other securities that may be categorized as Level 2 in the hierarchy include, but are not limited to, preferred stocks, bank loans, swaps, investments in unregistered investment companies, options, and forward contracts.
Level 3 – Unobservable inputs for the asset or liability to the extent that relevant observable inputs are not available, representing the Portfolio’s own assumptions about the assumptions that a market participant would use in valuing the asset or liability, and that would be based on the best information available.
There have been no significant changes in valuation techniques used in valuing any such positions held by the Portfolio since the beginning of the fiscal year.
The inputs or methodology used for fair valuing securities are not necessarily an indication of the risk associated with investing in those securities. The summary of inputs used as of December 31, 2020 to fair value the Portfolio’s investments in securities and other financial instruments is included in the “Valuation Inputs Summary” in the Notes to Schedule of Investments and Other Information.
Investment Transactions and Investment Income
Investment transactions are accounted for as of the date purchased or sold (trade date). Dividend income is recorded on the ex-dividend date. Certain dividends from foreign securities will be recorded as soon as the Portfolio is informed of the dividend, if such information is obtained subsequent to the ex-dividend date. Dividends from foreign securities may be subject to withholding taxes in foreign jurisdictions. Interest income is recorded daily on the accrual basis and includes amortization of premiums and accretion of discounts. The Portfolio classifies gains and losses on prepayments received as an adjustment to interest income. Debt securities may be placed in non-accrual status and related interest income may be reduced by stopping current accruals and writing off interest receivables when collection of all or a portion of interest has become doubtful. Gains and losses are determined on the identified cost basis, which is the same basis used for federal income tax purposes. Income, as well as gains and losses, both realized and unrealized, are allocated daily to each class of shares based upon the ratio of net assets represented by each class as a percentage of total net assets.
Expenses
The Portfolio bears expenses incurred specifically on its behalf. Each class of shares bears a portion of general expenses, which are allocated daily to each class of shares based upon the ratio of net assets represented by each class as a percentage of total net assets. Expenses directly attributable to a specific class of shares are charged against the operations of such class.
Estimates
The preparation of financial statements in conformity with US GAAP requires management to make estimates and assumptions that affect the reported amount of assets and liabilities and disclosure of contingent assets and liabilities at the date of the financial statements, and the reported amounts of income and expenses during the reporting period. Actual results could differ from those estimates.
Janus Aspen Series | 21 |
Janus Henderson VIT Enterprise Portfolio
Notes to Financial Statements
Indemnifications
In the normal course of business, the Portfolio may enter into contracts that contain provisions for indemnification of other parties against certain potential liabilities. The Portfolio’s maximum exposure under these arrangements is unknown, and would involve future claims that may be made against the Portfolio that have not yet occurred. Currently, the risk of material loss from such claims is considered remote.
Foreign Currency Translations
The Portfolio does not isolate that portion of the results of operations resulting from the effect of changes in foreign exchange rates on investments from the fluctuations arising from changes in market prices of securities held at the date of the financial statements. Net unrealized appreciation or depreciation of investments and foreign currency translations arise from changes in the value of assets and liabilities, including investments in securities held at the date of the financial statements, resulting from changes in the exchange rates and changes in market prices of securities held.
Currency gains and losses are also calculated on payables and receivables that are denominated in foreign currencies. The payables and receivables are generally related to foreign security transactions and income translations.
Foreign currency-denominated assets and forward currency contracts may involve more risks than domestic transactions, including currency risk, counterparty risk, political and economic risk, regulatory risk and equity risk. Risks may arise from unanticipated movements in the value of foreign currencies relative to the U.S. dollar.
Dividends and Distributions
The Portfolio may make semiannual distributions of substantially all of its investment income and an annual distribution of its net realized capital gains (if any).
The Portfolio may make certain investments in real estate investment trusts (“REITs”) which pay dividends to their shareholders based upon funds available from operations. It is quite common for these dividends to exceed the REITs’ taxable earnings and profits, resulting in the excess portion of such dividends being designated as a return of capital. If the Portfolio distributes such amounts, such distributions could constitute a return of capital to shareholders for federal income tax purposes.
Federal Income Taxes
The Portfolio intends to continue to qualify as a regulated investment company and distribute all of its taxable income in accordance with the requirements of Subchapter M of the Internal Revenue Code. Management has analyzed the Portfolio’s tax positions taken for all open federal income tax years, generally a three-year period, and has concluded that no provision for federal income tax is required in the Portfolio’s financial statements. The Portfolio is not aware of any tax positions for which it is reasonably possible that the total amounts of unrecognized tax benefits will significantly change in the next twelve months.
2. Derivative Instruments
The Portfolio may invest in various types of derivatives, which may at times result in significant derivative exposure. A derivative is a financial instrument whose performance is derived from the performance of another asset. The Portfolio may invest in derivative instruments including, but not limited to: futures contracts, put options, call options, options on futures contracts, options on foreign currencies, options on recovery locks, options on security and commodity indices, swaps, forward contracts, structured investments, and other equity-linked derivatives. Each derivative instrument that was held by the Portfolio during the year ended December 31, 2020 is discussed in further detail below. A summary of derivative activity by the Portfolio is reflected in the tables at the end of the Schedule of Investments.
The Portfolio may use derivative instruments for hedging purposes (to offset risks associated with an investment, currency exposure, or market conditions), to adjust currency exposure relative to a benchmark index, or for speculative purposes (to earn income and seek to enhance returns). When the Portfolio invests in a derivative for speculative purposes, the Portfolio will be fully exposed to the risks of loss of that derivative, which may sometimes be greater than the derivative’s cost. The Portfolio may not use any derivative to gain exposure to an asset or class of assets that it would be prohibited by its investment restrictions from purchasing directly. The Portfolio’s ability to use derivative instruments may also be limited by tax considerations.
Investments in derivatives in general are subject to market risks that may cause their prices to fluctuate over time. Investments in derivatives may not directly correlate with the price movements of the underlying instrument. As a result,
22 | DECEMBER 31, 2020 |
Janus Henderson VIT Enterprise Portfolio
Notes to Financial Statements
the use of derivatives may expose the Portfolio to additional risks that it would not be subject to if it invested directly in the securities underlying those derivatives. The use of derivatives may result in larger losses or smaller gains than otherwise would be the case. Derivatives can be volatile and may involve significant risks.
In pursuit of its investment objective, the Portfolio may seek to use derivatives to increase or decrease exposure to the following market risk factors:
· Commodity Risk – the risk related to the change in value of commodities or commodity-linked investments due to changes in the overall market movements, volatility of the underlying benchmark, changes in interest rates, or other factors affecting a particular industry or commodity such as drought, floods, weather, livestock disease, embargoes, tariffs, and international economic, political, and regulatory developments.
· Counterparty Risk – the risk that the counterparty (the party on the other side of the transaction) on a derivative transaction will be unable to honor its financial obligation to the Portfolio.
· Credit Risk – the risk an issuer will be unable to make principal and interest payments when due, or will default on its obligations.
· Currency Risk – the risk that changes in the exchange rate between currencies will adversely affect the value (in U.S. dollar terms) of an investment.
· Equity Risk – the risk related to the change in value of equity securities as they relate to increases or decreases in the general market.
· Index Risk – if the derivative is linked to the performance of an index, it will be subject to the risks associated with changes in that index. If the index changes, the Portfolio could receive lower interest payments or experience a reduction in the value of the derivative to below what the Portfolio paid. Certain indexed securities, including inverse securities (which move in an opposite direction to the index), may create leverage, to the extent that they increase or decrease in value at a rate that is a multiple of the changes in the applicable index.
· Interest Rate Risk – the risk that the value of fixed-income securities will generally decline as prevailing interest rates rise, which may cause the Portfolio’s NAV to likewise decrease.
· Leverage Risk – the risk associated with certain types of leveraged investments or trading strategies pursuant to which relatively small market movements may result in large changes in the value of an investment. The Portfolio creates leverage by investing in instruments, including derivatives, where the investment loss can exceed the original amount invested. Certain investments or trading strategies, such as short sales, that involve leverage can result in losses that greatly exceed the amount originally invested.
· Liquidity Risk – the risk that certain securities may be difficult or impossible to sell at the time that the seller would like or at the price that the seller believes the security is currently worth.
Derivatives may generally be traded OTC or on an exchange. Derivatives traded OTC are agreements that are individually negotiated between parties and can be tailored to meet a purchaser’s needs. OTC derivatives are not guaranteed by a clearing agency and may be subject to increased credit risk.
In an effort to mitigate credit risk associated with derivatives traded OTC, the Portfolio may enter into collateral agreements with certain counterparties whereby, subject to certain minimum exposure requirements, the Portfolio may require the counterparty to post collateral if the Portfolio has a net aggregate unrealized gain on all OTC derivative contracts with a particular counterparty. Additionally, the Portfolio may deposit cash and/or treasuries as collateral with the counterparty and/or custodian daily (based on the daily valuation of the financial asset) if the Portfolio has a net aggregate unrealized loss on OTC derivative contracts with a particular counterparty. All liquid securities and restricted cash are considered to cover in an amount at all times equal to or greater than the Portfolio’s commitment with respect to certain exchange-traded derivatives, centrally cleared derivatives, forward foreign currency exchange contracts, short sales, and/or securities with extended settlement dates. There is no guarantee that counterparty exposure is reduced and these arrangements are dependent on Janus Capital Management LLC's ("Janus Capital") ability to establish and maintain appropriate systems and trading.
Janus Aspen Series | 23 |
Janus Henderson VIT Enterprise Portfolio
Notes to Financial Statements
Forward Foreign Currency Exchange Contracts
A forward foreign currency exchange contract (“forward currency contract”) is an obligation to buy or sell a specified currency at a future date at a negotiated rate (which may be U.S. dollars or a foreign currency). The Portfolio may enter into forward currency contracts for hedging purposes, including, but not limited to, reducing exposure to changes in foreign currency exchange rates on foreign portfolio holdings and locking in the U.S. dollar cost of firm purchase and sale commitments for securities denominated in or exposed to foreign currencies. The Portfolio may also invest in forward currency contracts for non-hedging purposes such as seeking to enhance returns. The Portfolio is subject to currency risk and counterparty risk in the normal course of pursuing its investment objective through its investments in forward currency contracts.
Forward currency contracts are valued by converting the foreign value to U.S. dollars by using the current spot U.S. dollar exchange rate and/or forward rate for that currency. Exchange and forward rates as of the close of the NYSE shall be used to value the forward currency contracts. The unrealized appreciation/(depreciation) for forward currency contracts is reported in the Statement of Assets and Liabilities as a receivable or payable and in the Statement of Operations for the change in unrealized net appreciation/depreciation (if applicable). The gain or loss arising from the difference between the U.S. dollar cost of the original contract and the value of the foreign currency in U.S. dollars upon closing a forward currency contract is reported on the Statement of Operations (if applicable).
During the year, the Portfolio entered into forward currency contracts with the obligation to sell foreign currencies in the future at an agreed upon rate in order to decrease exposure to currency risk associated with foreign currency denominated securities held by the Portfolio.
3. Other Investments and Strategies
Additional Investment Risk
In the aftermath of the 2007-2008 financial crisis, the financial sector experienced reduced liquidity in credit and other fixed-income markets, and an unusually high degree of volatility, both domestically and internationally. In response to the crisis, the United States and certain foreign governments, along with the U.S. Federal Reserve and certain foreign central banks, took a number of unprecedented steps designed to support the financial markets. For example, the enactment of the Dodd-Frank Act in 2010 provided for widespread regulation of financial institutions, consumer financial products and services, broker-dealers, over-the-counter derivatives, investment advisers, credit rating agencies, and mortgage lending, which expanded federal oversight in the financial sector, including the investment management industry. More recently, in response to the COVID-19 pandemic, the U.S. government and the Federal Reserve, as well as certain foreign governments and central banks, have taken extraordinary actions to support local and global economies and the financial markets, including reducing interest rates to record-low levels. Extremely low or negative interest rates may become more prevalent or may not work as intended. As there is little precedent for this situation, the impact on various markets that interest rate or other significant policy changes may have is unknown. The withdrawal of this support, a failure of measures put in place in response to such economic uncertainty, or investor perception that such efforts were not sufficient could each negatively affect financial markets generally, and the value and liquidity of specific securities. In addition, policy and legislative changes in the United States and in other countries continue to impact many aspects of financial regulation.
Widespread disease, including pandemics and epidemics, and natural or environmental disasters, such as earthquakes, fires, floods, hurricanes, tsunamis and weather-related phenomena generally, have been and can be highly disruptive to economies and markets, adversely impacting individual companies, sectors, industries, markets, currencies, interest and inflation rates, credit ratings, investor sentiment, and other factors affecting the value of a Fund’s investments. Economies and financial markets throughout the world have become increasingly interconnected, which increases the likelihood that events or conditions in one region or country will adversely affect markets or issuers in other regions or countries, including the United States. These disruptions could prevent a Fund from executing advantageous investment decisions in a timely manner and negatively impact a Fund’s ability to achieve its investment objective(s). Any such event(s) could have a significant adverse impact on the value of a Fund. In addition, these disruptions could also impair the information technology and other operational systems upon which the Fund’s service providers, including Janus Capital or the subadviser (as applicable), rely, and could otherwise disrupt the ability of employees of the Fund’s service providers to perform essential tasks on behalf of the Fund. Adverse weather conditions may also have a particularly significant negative effect on issuers in the agricultural sector and on insurance and reinsurance companies that insure or reinsure against the impact of natural disasters.
24 | DECEMBER 31, 2020 |
Janus Henderson VIT Enterprise Portfolio
Notes to Financial Statements
A number of countries in the European Union (the “EU”) have experienced, and may continue to experience, severe economic and financial difficulties. In particular, many EU nations are susceptible to economic risks associated with high levels of debt. Many non-governmental issuers, and even certain governments, have defaulted on, or been forced to restructure, their debts. Many other issuers have faced difficulties obtaining credit or refinancing existing obligations. Financial institutions have in many cases required government or central bank support, have needed to raise capital, and/or have been impaired in their ability to extend credit. As a result, financial markets in the EU have experienced extreme volatility and declines in asset values and liquidity. These difficulties may continue, worsen, or spread further within the EU. Responses to these financial problems by European governments, central banks, and others, including austerity measures and reforms, may not work, may result in social unrest, and may limit future growth and economic recovery or have other unintended consequences. The risk of investing in securities in the European markets may also be heightened due to the referendum in which the United Kingdom voted to exit the EU, commonly known as “Brexit,” which immediately led to significant market volatility around the world, as well as political, economic and legal uncertainty. The United Kingdom formally left the EU on January 31, 2020 and entered into an eleven-month transition period, which expired on December 31, 2020. The negative impact on not only the United Kingdom and European economies could be significant, potentially resulting in increased volatility and illiquidity and lower economic growth for companies that rely significantly on the United Kingdom and/or Europe for their business activities and revenues. Any further exits from the EU, or an increase in the belief that such exits are likely or possible, would likely cause additional market disruption globally and introduce new legal and regulatory uncertainties.
Counterparties
Portfolio transactions involving a counterparty are subject to the risk that the counterparty or a third party will not fulfill its obligation to the Portfolio (“counterparty risk”). Counterparty risk may arise because of the counterparty’s financial condition (i.e., financial difficulties, bankruptcy, or insolvency), market activities and developments, or other reasons, whether foreseen or not. A counterparty’s inability to fulfill its obligation may result in significant financial loss to the Portfolio. The Portfolio may be unable to recover its investment from the counterparty or may obtain a limited recovery, and/or recovery may be delayed. The extent of the Portfolio’s exposure to counterparty risk with respect to financial assets and liabilities approximates its carrying value. See the "Offsetting Assets and Liabilities" section of this Note for further details.
The Portfolio may be exposed to counterparty risk through participation in various programs, including, but not limited to, lending its securities to third parties, cash sweep arrangements whereby the Portfolio’s cash balance is invested in one or more types of cash management vehicles, as well as investments in, but not limited to, repurchase agreements, debt securities, and derivatives, including various types of swaps, futures and options. The Portfolio intends to enter into financial transactions with counterparties that Janus Capital believes to be creditworthy at the time of the transaction. There is always the risk that Janus Capital’s analysis of a counterparty’s creditworthiness is incorrect or may change due to market conditions. To the extent that the Portfolio focuses its transactions with a limited number of counterparties, it will have greater exposure to the risks associated with one or more counterparties.
Offsetting Assets and Liabilities
The Portfolio presents gross and net information about transactions that are either offset in the financial statements or subject to an enforceable master netting arrangement or similar agreement with a designated counterparty, regardless of whether the transactions are actually offset in the Statement of Assets and Liabilities.
In order to better define its contractual rights and to secure rights that will help the Portfolio mitigate its counterparty risk, the Portfolio has entered into an International Swaps and Derivatives Association, Inc. Master Agreement (“ISDA Master Agreement”) or similar agreement with its derivative contract counterparties. An ISDA Master Agreement is a bilateral agreement between the Portfolio and a counterparty that governs OTC derivatives and forward foreign currency exchange contracts and typically contains, among other things, collateral posting terms and netting provisions in the event of a default and/or termination event. Under an ISDA Master Agreement, in the event of a default and/or termination event, the Portfolio may offset with each counterparty certain derivative financial instruments’ payables and/or receivables with collateral held and/or posted and create one single net payment.
The following tables present gross amounts of recognized assets and/or liabilities and the net amounts after deducting collateral that has been pledged by counterparties or has been pledged to counterparties (if applicable). For corresponding information grouped by type of instrument, see the “Fair Value of Derivative Instruments (not accounted for as hedging instruments) as of December 31, 2020” table located in the Portfolio’s Schedule of Investments.
Janus Aspen Series | 25 |
Janus Henderson VIT Enterprise Portfolio
Notes to Financial Statements
Offsetting of Financial Assets and Derivative Assets | |||||||||
Gross Amounts | |||||||||
of Recognized | Offsetting Asset | Collateral | |||||||
Counterparty | Assets | or Liability(a) | Pledged(b) | Net Amount | |||||
Barclays Capital, Inc. | $ | 11,172 | $ | (11,172) | $ | — | $ | — | |
Citibank, National Association | 7,842 | (7,842) | — | — | |||||
Credit Suisse International | 6,491 | — | — | 6,491 | |||||
HSBC Securities (USA), Inc. | 4,818 | (4,818) | — | — | |||||
JPMorgan Chase Bank, National Association | 3,493,848 | — | (3,493,848) | — | |||||
Total | $ | 3,524,171 | $ | (23,832) | $ | (3,493,848) | $ | 6,491 | |
Offsetting of Financial Liabilities and Derivative Liabilities | |||||||||
Gross Amounts | |||||||||
of Recognized | Offsetting Asset | Collateral | |||||||
Counterparty | Liabilities | or Liability(a) | Pledged(b) | Net Amount | |||||
Barclays Capital, Inc. | $ | 21,200 | $ | (11,172) | $ | — | $ | 10,028 | |
Citibank, National Association | 76,694 | (7,842) | — | 68,852 | |||||
HSBC Securities (USA), Inc. | 37,845 | (4,818) | — | 33,027 | |||||
JPMorgan Chase Bank, National Association | 91,974 | — | — | 91,974 | |||||
Total | $ | 227,713 | $ | (23,832) | $ | — | $ | 203,881 | |
(a) | Represents the amount of assets or liabilities that could be offset with the same counterparty under master netting or similar agreements that management elects not to offset on the Statement of Assets and Liabilities. | ||||||||
(b) | Collateral pledged is limited to the net outstanding amount due to/from an individual counterparty. The actual collateral amounts pledged may exceed these amounts and may fluctuate in value. | ||||||||
JPMorgan Chase Bank, National Association acts as securities lending agent and a limited purpose custodian or subcustodian to receive and disburse cash balances and cash collateral, hold short-term investments, hold collateral, and perform other custodial functions in accordance with the Non-Custodial Securities Lending Agreement. For financial reporting purposes, the Portfolio does not offset financial instruments' payables and receivables and related collateral on the Statement of Assets and Liabilities. Securities on loan will be continuously secured by collateral which may consist of cash, U.S. Government securities, domestic and foreign short-term debt instruments, letters of credit, time deposits, repurchase agreements, money market mutual funds or other money market accounts, or such other collateral as permitted by the Securities and Exchange Commission (the “SEC”). See “Securities Lending” in the “Notes to Financial Statements” for additional information.
The Portfolio generally does not exchange collateral on its forward foreign currency contracts with its counterparties; however, all liquid securities and restricted cash are considered to cover in an amount at all times equal to or greater than the Portfolio’s commitment with respect to these contracts. Certain securities may be segregated at the Portfolio’s custodian. These segregated securities are denoted on the accompanying Schedule of Investments and are evaluated daily to ensure their cover and/or market value equals or exceeds the Portfolio’s corresponding forward foreign currency exchange contract's obligation value.
The Portfolio may require the counterparty to pledge securities as collateral daily (based on the daily valuation of the financial asset) if the Portfolio has a net aggregate unrealized gain on OTC derivative contracts with a particular
26 | DECEMBER 31, 2020 |
Janus Henderson VIT Enterprise Portfolio
Notes to Financial Statements
counterparty. The Portfolio may deposit cash as collateral with the counterparty and/or custodian daily (based on the daily valuation of the financial asset) if the Portfolio has a net aggregate unrealized loss on OTC derivative contracts with a particular counterparty. The collateral amounts are subject to minimum exposure requirements and initial margin requirements. Collateral amounts are monitored and subsequently adjusted up or down as valuations fluctuate by at least the minimum exposure requirement. Collateral may reduce the risk of loss.
Real Estate Investing
The Portfolio may invest in equity and debt securities of real estate-related companies. Such companies may include those in the real estate industry or real estate-related industries. These securities may include common stocks, corporate bonds, preferred stocks, and other equity securities, including, but not limited to, mortgage-backed securities, real estate-backed securities, securities of REITs and similar REIT-like entities. A REIT is a trust that invests in real estate-related projects, such as properties, mortgage loans, and construction loans. REITs are generally categorized as equity, mortgage, or hybrid REITs. A REIT may be listed on an exchange or traded OTC.
Securities Lending
Under procedures adopted by the Trustees, the Portfolio may seek to earn additional income by lending securities to certain qualified broker-dealers and institutions. JPMorgan Chase Bank, National Association acts as securities lending agent and a limited purpose custodian or subcustodian to receive and disburse cash balances and cash collateral, hold short-term investments, hold collateral, and perform other custodial functions in accordance with the Non-Custodial Securities Lending Agreement. The Portfolio may lend portfolio securities in an amount equal to up to 1/3 of its total assets as determined at the time of the loan origination. There is the risk of delay in recovering a loaned security or the risk of loss in collateral rights if the borrower fails financially. In addition, Janus Capital makes efforts to balance the benefits and risks from granting such loans. All loans will be continuously secured by collateral which may consist of cash, U.S. Government securities, domestic and foreign short-term debt instruments, letters of credit, time deposits, repurchase agreements, money market mutual funds or other money market accounts, or such other collateral as permitted by the SEC. If the Portfolio is unable to recover a security on loan, the Portfolio may use the collateral to purchase replacement securities in the market. There is a risk that the value of the collateral could decrease below the cost of the replacement security by the time the replacement investment is made, resulting in a loss to the Portfolio. In certain circumstances individual loan transactions could yield negative returns.
Upon receipt of cash collateral, Janus Capital may invest it in affiliated or non-affiliated cash management vehicles, whether registered or unregistered entities, as permitted by the 1940 Act and rules promulgated thereunder. Janus Capital currently intends to primarily invest the cash collateral in a cash management vehicle for which Janus Capital serves as investment adviser, Janus Henderson Cash Collateral Fund LLC, or in time deposits. An investment in Janus Henderson Cash Collateral Fund LLC is generally subject to the same risks that shareholders experience when investing in similarly structured vehicles, such as the potential for significant fluctuations in assets as a result of the purchase and redemption activity of the securities lending program, a decline in the value of the collateral, and possible liquidity issues. Such risks may delay the return of the cash collateral and cause the Portfolio to violate its agreement to return the cash collateral to a borrower in a timely manner. As adviser to the Portfolio and Janus Henderson Cash Collateral Fund LLC, Janus Capital has an inherent conflict of interest as a result of its fiduciary duties to both the Portfolio and Janus Henderson Cash Collateral Fund LLC. Additionally, Janus Capital receives an investment advisory fee of 0.05% for managing Janus Henderson Cash Collateral Fund LLC, but it may not receive a fee for managing certain other affiliated cash management vehicles in which the Portfolio may invest, and therefore may have an incentive to allocate preferred investment opportunities to investment vehicles for which it is receiving a fee.
The value of the collateral must be at least 102% of the market value of the loaned securities that are denominated in U.S. dollars and 105% of the market value of the loaned securities that are not denominated in U.S. dollars. Loaned securities and related collateral are marked-to-market each business day based upon the market value of the loaned securities at the close of business, employing the most recent available pricing information. Collateral levels are then adjusted based on this mark-to-market evaluation.
The cash collateral invested by Janus Capital is disclosed in the Schedule of Investments (if applicable).
Income earned from the investment of the cash collateral, net of rebates paid to, or fees paid by, borrowers and less the fees paid to the lending agent are included as “Affiliated securities lending income, net” on the Statement of Operations. As of December 31, 2020, securities lending transactions accounted for as secured borrowings with an overnight and
Janus Aspen Series | 27 |
Janus Henderson VIT Enterprise Portfolio
Notes to Financial Statements
continuous contractual maturity are $3,493,848. Gross amounts of recognized liabilities for securities lending (collateral received) as of December 31, 2020 is $3,574,821, resulting in the net amount due to the counterparty of $80,973.
4. Investment Advisory Agreements and Other Transactions with Affiliates
The Portfolio pays Janus Capital an investment advisory fee which is calculated daily and paid monthly. The Portfolio’s contractual investment advisory fee rate (expressed as an annual rate) is 0.64% of its average daily net assets.
Janus Services LLC (“Janus Services”), a wholly-owned subsidiary of Janus Capital, is the Portfolio’s transfer agent. Janus Services receives an administrative services fee at an annual rate of 0.05% of the average daily net assets of the Portfolio for arranging for the provision by participating insurance companies and qualified plan service providers of administrative services, including recordkeeping, subaccounting, order processing, or other shareholder services provided on behalf of contract holders or plan participants investing in the Portfolio. Other shareholder services may include the provision of order confirmations, periodic account statements, forwarding prospectuses, shareholder reports, and other materials to existing investors, and answering inquiries regarding accounts. Janus Services expects to use this entire fee to compensate insurance companies and qualified plan service providers for providing these services to their customers who invest in the Portfolio. Any unused portion will be reimbursed to the applicable share class at least annually.
In addition, Janus Services provides or arranges for the provision of certain other internal administrative, recordkeeping, and shareholder relations services for the Portfolio. Janus Services is not compensated for these internal services related to the shares, except for out-of-pocket costs. These amounts are disclosed as “Other transfer agent fees and expenses” on the Statement of Operations.
Under a distribution and shareholder servicing plan (the “Plan”) adopted in accordance with Rule 12b-1 under the 1940 Act, the Service Shares may pay the Trust’s distributor, Janus Distributors LLC (“Janus Distributors”), a wholly-owned subsidiary of Janus Capital, a fee for the sale and distribution and/or shareholder servicing of the Service Shares at an annual rate of up to 0.25% of the average daily net assets of the Service Shares. Under the terms of the Plan, the Trust is authorized to make payments to Janus Distributors for remittance to insurance companies and qualified plan service providers as compensation for distribution and/or shareholder services performed by such entities. These amounts are disclosed as “12b-1 Distribution and shareholder servicing fees” on the Statement of Operations. Payments under the Plan are not tied exclusively to actual 12b-1 distribution and servicing fees, and the payments may exceed 12b-1 distribution and servicing fees actually incurred. If any of the Portfolio’s actual 12b-1 distribution and servicing fees incurred during a calendar year are less than the payments made during a calendar year, the Portfolio will be refunded the difference. Refunds, if any, are included in “12b-1 Distribution and shareholder servicing fees” in the Statement of Operations.
Janus Capital serves as administrator to the Portfolio pursuant to an administration agreement between Janus Capital and the Trust. Under the administration agreement, Janus Capital is obligated to provide or arrange for the provision of certain administration, compliance, and accounting services to the Portfolio, including providing office space for the Portfolio, and is reimbursed by the Portfolio for certain of its costs in providing these services (to the extent Janus Capital seeks reimbursement and such costs are not otherwise waived). In addition, employees of Janus Capital and/or its affiliates may serve as officers of the Trust. The Portfolio pays for some or all of the salaries, fees, and expenses of Janus Capital employees and Portfolio officers, with respect to certain specified administration functions they perform on behalf of the Portfolio. The Portfolio pays these costs based on out-of-pocket expenses incurred by Janus Capital, and these costs are separate and apart from advisory fees and other expenses paid in connection with the investment advisory services Janus Capital (or any subadvisor, as applicable) provides to the Portfolio. These amounts are disclosed as “Affiliated portfolio administration fees” on the Statement of Operations. In addition, some expenses related to compensation payable to the Portfolio’s Chief Compliance Officer and certain compliance staff, all of whom are employees of Janus Capital and/or its affiliates, are shared with the Portfolio. Total compensation of $34,973 was paid to the Chief Compliance Officer and certain compliance staff by the Trust during the year ended December 31, 2020. The Portfolio's portion is reported as part of “Other expenses” on the Statement of Operations.
The Board of Trustees has adopted a deferred compensation plan (the “Deferred Plan”) for independent Trustees to elect to defer receipt of all or a portion of the annual compensation they are entitled to receive from the Portfolio. All deferred fees are credited to an account established in the name of the Trustees. The amounts credited to the account then increase or decrease, as the case may be, in accordance with the performance of one or more of the Janus Henderson funds that are selected by the Trustees. The account balance continues to fluctuate in accordance with the
28 | DECEMBER 31, 2020 |
Janus Henderson VIT Enterprise Portfolio
Notes to Financial Statements
performance of the selected fund or funds until final payment of all amounts are credited to the account. The fluctuation of the account balance is recorded by the Portfolio as unrealized appreciation/(depreciation) and is included as of December 31, 2020 on the Statement of Assets and Liabilities in the asset, “Non-interested Trustees’ deferred compensation,” and liability, “Non-interested Trustees’ deferred compensation fees.” Additionally, the recorded unrealized appreciation/(depreciation) is included in “Total distributable earnings (loss)” on the Statement of Assets and Liabilities. Deferred compensation expenses for the year ended December 31, 2020 are included in “Non-interested Trustees’ fees and expenses” on the Statement of Operations. Trustees are allowed to change their designation of mutual funds from time to time. Amounts will be deferred until distributed in accordance with the Deferred Plan. Deferred fees of $471,450 were paid by the Trust to the Trustees under the Deferred Plan during the year ended December 31, 2020.
Pursuant to the provisions of the 1940 Act and related rules, the Portfolio may participate in an affiliated or non-affiliated cash sweep program. In the cash sweep program, uninvested cash balances of the Portfolio may be used to purchase shares of affiliated or non-affiliated money market funds or cash management pooled investment vehicles that operate as money market funds. The Portfolio is eligible to participate in the cash sweep program (the “Investing Funds”). As adviser, Janus Capital has an inherent conflict of interest because of its fiduciary duties to the affiliated money market funds or cash management pooled investment vehicles and the Investing Funds. Janus Henderson Cash Liquidity Fund LLC (the “Sweep Vehicle”) is an affiliated unregistered cash management pooled investment vehicle that invests primarily in highly-rated short-term fixed-income securities. The Sweep Vehicle operates pursuant to the provisions of the 1940 Act that govern the operation of money market funds and prices its shares at NAV reflecting market-based values of its portfolio securities (i.e., a “floating” NAV) rounded to the fourth decimal place (e.g., $1.0000). The Sweep Vehicle is permitted to impose a liquidity fee (of up to 2%) on redemptions from the Sweep Vehicle or a redemption gate that temporarily suspends redemptions from the Sweep Vehicle for up to 10 business days during a 90 day period. There are no restrictions on the Portfolio's ability to withdraw investments from the Sweep Vehicle at will, and there are no unfunded capital commitments due from the Portfolio to the Sweep Vehicle. The Sweep Vehicle does not charge any management fee, sales charge or service fee.
Any purchases and sales, realized gains/losses and recorded dividends from affiliated investments during the year ended December 31, 2020 can be found in the “Schedules of Affiliated Investments” located in the Schedule of Investments.
The Portfolio is permitted to purchase or sell securities (“cross-trade”) between itself and other funds or accounts managed by Janus Capital in accordance with Rule 17a-7 under the Investment Company Act of 1940 (“Rule 17a-7”), when the transaction is consistent with the investment objectives and policies of the Portfolio and in accordance with the Internal Cross Trade Procedures adopted by the Trust’s Board of Trustees. These procedures have been designed to ensure that any cross-trade of securities by the Portfolio from or to another fund or account that is or could be considered an affiliate of the Portfolio under certain limited circumstances by virtue of having a common investment adviser, common Officer, or common Trustee complies with Rule 17a-7. Under these procedures, each cross-trade is effected at the current market price to save costs where allowed. During the year ended December 31, 2020, the Portfolio engaged in cross trades amounting to $37,688 in purchases and $1,255,713 in sales, resulting in a net realized gain of $207,533. The net realized gain is included within the “Net Realized Gain/(Loss) on Investments” section of the Portfolio’s Statement of Operations.
Janus Aspen Series | 29 |
Janus Henderson VIT Enterprise Portfolio
Notes to Financial Statements
5. Federal Income Tax
The tax components of capital shown in the table below represent: (1) distribution requirements the Portfolio must satisfy under the income tax regulations; (2) losses or deductions the Portfolio may be able to offset against income and gains realized in future years; and (3) unrealized appreciation or depreciation of investments for federal income tax purposes.
Other book to tax differences primarily consist of deferred compensation, derivatives, and foreign currency contract adjustments. The Portfolio has elected to treat gains and losses on forward foreign currency contracts as capital gains and losses, if applicable. Other foreign currency gains and losses on debt instruments are treated as ordinary income for federal income tax purposes pursuant to Section 988 of the Internal Revenue Code.
|
|
| Loss Deferrals | Other Book | Net Tax |
| |
Undistributed | Undistributed
| Accumulated | Late-Year | Post-October
| to Tax | Appreciation/
|
|
$ 4,092,543 | $ 152,888,587 | $ - | $ - | $ - | $ (36,892) | $781,479,070 |
|
The aggregate cost of investments and the composition of unrealized appreciation and depreciation of investment securities for federal income tax purposes as of December 31, 2020 are noted below. The primary differences between book and tax appreciation or depreciation of investments are wash sale loss deferrals, investments in partnerships, and investments in passive foreign investment companies.
Federal Tax Cost | Unrealized | Unrealized | Net
Tax Appreciation/ |
$ 914,837,462 | $785,904,845 | $ (4,425,775) | $ 781,479,070 |
30 | DECEMBER 31, 2020 |
Janus Henderson VIT Enterprise Portfolio
Notes to Financial Statements
Information on the tax components of derivatives as of December 31, 2020 is as follows:
Federal Tax Cost | Unrealized | Unrealized | Net
Tax Appreciation/ |
$ (197,390) | $ - | $ - | $ - |
Tax cost of investments and unrealized appreciation/(depreciation) may also include timing differences that do not constitute adjustments to tax basis.
Income and capital gains distributions are determined in accordance with income tax regulations that may differ from US GAAP. These differences are due to differing treatments for items such as net short-term gains, deferral of wash sale losses, foreign currency transactions, passive foreign investment companies, and capital loss carryovers. Certain permanent differences such as tax returns of capital and net investment losses noted below have been reclassified to capital.
For the year ended December 31, 2020 |
| |||
Distributions |
|
| ||
From Ordinary Income | From Long-Term Capital Gains | Tax Return of Capital | Net Investment Loss |
|
$ 1,166,288 | $ 110,296,383 | $ - | $ - |
|
For the year ended December 31, 2019 |
| |||
Distributions |
|
| ||
From Ordinary Income | From Long-Term Capital Gains | Tax Return of Capital | Net Investment Loss |
|
$ 1,802,648 | $ 85,522,711 | $ - | $ - |
|
Permanent book to tax basis differences may result in reclassifications between the components of net assets. These differences have no impact on the results of operations or net assets. The following reclassifications have been made to the Portfolio:
|
|
|
Increase/(Decrease) to Capital | Increase/(Decrease) to Undistributed
| Increase/(Decrease) to Undistributed
|
$ - | $ (2,050,599) | $ 2,050,599 |
6. Capital Share Transactions
|
|
|
|
|
|
|
|
| Year ended December 31, 2020 |
| Year ended December 31, 2019 | ||
|
| Shares | Amount |
| Shares | Amount |
Institutional Shares: |
|
|
|
|
| |
Shares sold | 962,490 | $ 74,261,046 |
| 1,542,514 | $123,201,744 | |
Reinvested dividends and distributions | 726,925 | 51,851,530 |
| 533,515 | 41,927,038 | |
Shares repurchased | (2,792,786) | (217,475,278) |
| (1,435,966) | (114,495,329) | |
Net Increase/(Decrease) | (1,103,371) | $ (91,362,702) |
| 640,063 | $ 50,633,453 | |
Service Shares: |
|
|
|
|
| |
Shares sold | 2,291,089 | $163,267,970 |
| 2,323,035 | $172,829,765 | |
Reinvested dividends and distributions | 898,977 | 59,611,141 |
| 617,488 | 45,398,321 | |
Shares repurchased | (2,922,142) | (213,198,096) |
| (2,013,680) | (149,757,904) | |
Net Increase/(Decrease) | 267,924 | $ 9,681,015 |
| 926,843 | $ 68,470,182 | |
Janus Aspen Series | 31 |
Janus Henderson VIT Enterprise Portfolio
Notes to Financial Statements
7. Purchases and Sales of Investment Securities
For the year ended December 31, 2020, the aggregate cost of purchases and proceeds from sales of investment securities (excluding any short-term securities, short-term options contracts, TBAs, and in-kind transactions, as applicable) was as follows:
Purchases of | Proceeds
from Sales | Purchases of Long- | Proceeds from Sales |
$218,372,268 | $ 373,801,530 | $ - | $ - |
8. Subsequent Event
Management has evaluated whether any events or transactions occurred subsequent to December 31, 2020 and through the date of issuance of the Portfolio’s financial statements and determined that there were no material events or transactions that would require recognition or disclosure in the Portfolio’s financial statements.
32 | DECEMBER 31, 2020 |
Janus Henderson VIT Enterprise Portfolio
Report of Independent Registered Public Accounting Firm
To the Board of Trustees of Janus Aspen Series and Shareholders of Janus Henderson VIT Enterprise Portfolio
Opinion on the Financial Statements
We have audited the accompanying statement of assets and liabilities, including the schedule of investments, of Janus Henderson VIT Enterprise Portfolio (one of the portfolios constituting Janus Aspen Series, referred to hereafter as the "Portfolio") as of December 31, 2020, the related statement of operations for the year ended December 31, 2020, the statements of changes in net assets for each of the two years in the period ended December 31, 2020, including the related notes, and the financial highlights for each of the five years in the period ended December 31, 2020 (collectively referred to as the “financial statements”). In our opinion, the financial statements present fairly, in all material respects, the financial position of the Portfolio as of December 31, 2020, the results of its operations for the year then ended, the changes in its net assets for each of the two years in the period ended December 31, 2020 and the financial highlights for each of the five years in the period ended December 31, 2020 in conformity with accounting principles generally accepted in the United States of America.
Basis for Opinion
These financial statements are the responsibility of the Portfolio’s management. Our responsibility is to express an opinion on the Portfolio’s financial statements based on our audits. We are a public accounting firm registered with the Public Company Accounting Oversight Board (United States) (PCAOB) and are required to be independent with respect to the Portfolio in accordance with the U.S. federal securities laws and the applicable rules and regulations of the Securities and Exchange Commission and the PCAOB.
We conducted our audits of these financial statements in accordance with the standards of the PCAOB. Those standards require that we plan and perform the audit to obtain reasonable assurance about whether the financial statements are free of material misstatement, whether due to error or fraud.
Our audits included performing procedures to assess the risks of material misstatement of the financial statements, whether due to error or fraud, and performing procedures that respond to those risks. Such procedures included examining, on a test basis, evidence regarding the amounts and disclosures in the financial statements. Our audits also included evaluating the accounting principles used and significant estimates made by management, as well as evaluating the overall presentation of the financial statements. Our procedures included confirmation of securities owned as of December 31, 2020 by correspondence with the custodian, transfer agent and brokers; when replies were not received from brokers, we performed other auditing procedures. We believe that our audits provide a reasonable basis for our opinion.

Denver, Colorado
February
16, 2021
We have served as the auditor of one or more investment companies in Janus Henderson Funds since 1990.
Janus Aspen Series | 33 |
Janus Henderson VIT Enterprise Portfolio
Additional Information (unaudited)
Proxy Voting Policies and Voting Record
A description of the policies and procedures that the Portfolio uses to determine how to vote proxies relating to its portfolio securities is available without charge: (i) upon request, by calling 1-800-525-1093; (ii) on the Portfolio’s website at janushenderson.com/proxyvoting; and (iii) on the SEC’s website at http://www.sec.gov. Additionally, information regarding the Portfolio’s proxy voting record for the most recent twelve-month period ended June 30 is also available, free of charge, through janushenderson.com/proxyvoting and from the SEC’s website at http://www.sec.gov.
Full Holdings
The Portfolio files its complete portfolio holdings (schedule of investments) with the SEC as an exhibit to Form N-PORT within 60 days of the end of the first and third fiscal quarters, and in the annual report and semiannual report to shareholders. The Portfolio’s Form N-PORT filings and annual and semiannual reports: (i) are available on the SEC’s website at http://www.sec.gov; (ii) may be reviewed and copied at the SEC’s Public Reference Room in Washington, D.C. (information on the Public Reference Room may be obtained by calling 1-800-SEC-0330); and (iii) are available without charge, upon request, by calling a Janus Henderson representative at 1-877-335-2687 (toll free). Portfolio holdings consisting of at least the names of the holdings are generally available on a monthly basis with a 30-day lag under Full Holdings for the Portfolio at janushenderson.com/vit.
APPROVAL OF ADVISORY AGREEMENTS DURING THE PERIOD
The Trustees of Janus Aspen Series, each of whom serves as an “independent” Trustee (the “Trustees”), oversee the management of each Portfolio of Janus Aspen Series (each, a “VIT Portfolio,” and collectively, the “VIT Portfolios”), as well as each Fund of Janus Investment Fund (together with the VIT Portfolios, the “Janus Henderson Funds,” and each, a “Janus Henderson Fund”). As required by law, the Trustees determine annually whether to continue the investment advisory agreement for each Janus Henderson Fund and the subadvisory agreements for the Janus Henderson Funds that utilize subadvisers.
In connection with their most recent consideration of those agreements for each Janus Henderson Fund, the Trustees received, and reviewed information provided by Janus Capital and the respective subadvisers in response to requests of the Trustees and their independent legal counsel. They also received and reviewed information and analysis provided by, and in response to requests of, their independent fee consultant. Throughout their consideration of the agreements, the Trustees were advised by their independent legal counsel. The Trustees met with management to consider the agreements, and also met separately in executive session with their independent legal counsel and their independent fee consultant.
At a meeting held on December 9, 2020, based on the Trustees’ evaluation of the information provided by Janus Capital, the subadvisers, and the independent fee consultant, as well as other information, the Trustees determined that the overall arrangements between each Janus Henderson Fund and Janus Capital and each subadviser, as applicable, were fair and reasonable in light of the nature, extent and quality of the services provided by Janus Capital, its affiliates and the subadvisers, the fees charged for those services, and other matters that the Trustees considered relevant in the exercise of their business judgment. At that meeting, the Trustees unanimously approved the continuation of the investment advisory agreement for each Janus Henderson Fund, and the subadvisory agreement for each subadvised Janus Henderson Fund, for the period from February 1, 2021 through February 1, 2022, subject to earlier termination as provided for in each agreement.
In considering the continuation of those agreements, the Trustees reviewed and analyzed various factors that they determined were relevant, including the factors described below, none of which by itself was considered dispositive. However, the material factors and conclusions that formed the basis for the Trustees’ determination to approve the continuation of the agreements are discussed separately below. Also included is a summary of the independent fee consultant’s conclusions and opinions that arose during, and were included as part of, the Trustees’ consideration of the agreements. “Management fees,” as used herein, reflect actual annual advisory fees and, for the purpose of peer comparisons any administration fees (excluding out of pocket costs), net of any waivers, paid by a fund as a percentage of average net assets.
Nature, Extent and Quality of Services
The Trustees reviewed the nature, extent and quality of the services provided by Janus Capital and the subadvisers to the Janus Henderson Funds, taking into account the investment objective, strategies and policies of each Janus Henderson Fund, and the knowledge the Trustees gained from their regular meetings with management on at least a
34 | DECEMBER 31, 2020 |
Janus Henderson VIT Enterprise Portfolio
Additional Information (unaudited)
quarterly basis and their ongoing review of information related to the Janus Henderson Funds. In addition, the Trustees reviewed the resources and key personnel of Janus Capital and each subadviser, particularly noting those employees who provide investment and risk management services to the Janus Henderson Funds. The Trustees also considered other services provided to the Janus Henderson Funds by Janus Capital or the subadvisers, such as managing the execution of portfolio transactions and the selection of broker-dealers for those transactions. The Trustees considered Janus Capital’s role as administrator to the Janus Henderson Funds, noting that Janus Capital generally does not receive a fee for its services but is reimbursed for its out-of-pocket costs. The Trustees considered the role of Janus Capital in monitoring adherence to the Janus Henderson Funds’ investment restrictions, providing support services for the Trustees and Trustee committees, and overseeing communications with shareholders and the activities of other service providers, including monitoring compliance with various policies and procedures of the Janus Henderson Funds and with applicable securities laws and regulations.
In this regard, the independent fee consultant noted that Janus Capital provides a number of different services for the Janus Henderson Funds and fund shareholders, ranging from investment management services to various other servicing functions, and that, in its view, Janus Capital is a capable provider of those services. The independent fee consultant also provided its belief that Janus Capital has developed a number of institutional competitive advantages that should enable it to provide superior investment and service performance over the long term.
The Trustees concluded that the nature, extent and quality of the services provided by Janus Capital or the subadviser to each Janus Henderson Fund were appropriate and consistent with the terms of the respective advisory and subadvisory agreements, and that, taking into account steps taken to address those Janus Henderson Funds whose performance lagged that of their peers for certain periods, the Janus Henderson Funds were likely to benefit from the continued provision of those services. They also concluded that Janus Capital and each subadviser had sufficient personnel, with the appropriate education and experience, to serve the Janus Henderson Funds effectively and had demonstrated its ability to attract well-qualified personnel.
Performance of the Funds
The Trustees considered the performance results of each Janus Henderson Fund over various time periods. They noted that they considered Janus Henderson Fund performance data throughout the year, including periodic meetings with each Janus Henderson Fund’s portfolio manager(s), and also reviewed information comparing each Janus Henderson Fund’s performance with the performance of comparable funds and peer groups identified by Broadridge Financial Solutions, Inc. (“Broadridge”), an independent data provider, and with the Janus Henderson Fund’s benchmark index. In this regard, the independent fee consultant found that the overall Janus Henderson Funds’ performance has been reasonable: for the 36 months ended September 30, 2020, approximately 75% of the Janus Henderson Funds were in the top two quartiles of performance versus Broadridge peers, and for the 12 months ended September 30, 2020, approximately 62% of the Janus Henderson Funds were in the top two quartiles of performance versus Broadridge peers.
The Trustees considered the performance of each Janus Henderson Fund, noting that performance may vary by share class, and noted the following with respect to the VIT Portfolios:
· For Janus Henderson Balanced Portfolio, the Trustees noted that the Fund’s performance was in the first Broadridge quartile for the 36 months ended May 31, 2020 and the first Broadridge quartile for the 12 months ended May 31, 2020.
· For Janus Henderson Enterprise Portfolio, the Trustees noted that the Fund’s performance was in the bottom Broadridge quartile for the 36 months ended May 31, 2020 and the bottom Broadridge quartile for the 12 months ended May 31, 2020. The Trustees noted the reasons for the Fund’s underperformance and the steps Janus Capital had taken or was taking to improve performance.
· For Janus Henderson Flexible Bond Portfolio, the Trustees noted that the Fund’s performance was in the third Broadridge quartile for the 36 months ended May 31, 2020 and the first Broadridge quartile for the 12 months ended May 31, 2020. The Trustees noted the reasons for the Fund’s underperformance and the steps Janus Capital had taken or was taking to improve performance, and that the performance trend was improving.
Janus Aspen Series | 35 |
Janus Henderson VIT Enterprise Portfolio
Additional Information (unaudited)
· For Janus Henderson Forty Portfolio, the Trustees noted that the Fund’s performance was in the second Broadridge quartile for the 36 months ended May 31, 2020 and the second Broadridge quartile for the 12 months ended May 31, 2020.
· For Janus Henderson Global Research Portfolio, the Trustees noted that the Fund’s performance was in the third Broadridge quartile for the 36 months ended May 31, 2020 and the bottom Broadridge quartile for the 12 months ended May 31, 2020. The Trustees noted the reasons for the Fund’s underperformance, while also noting that the Fund has a performance fee structure that results in lower management fees during periods of underperformance, and the steps Janus Capital had taken or was taking to improve performance.
· For Janus Henderson Global Technology and Innovation Portfolio, the Trustees noted that the Fund’s performance was in the first Broadridge quartile for the 36 months ended May 31, 2020 and the second Broadridge quartile for the 12 months ended May 31, 2020.
· For Janus Henderson Mid Cap Value Portfolio, the Trustees noted that the Fund’s performance was in the third Broadridge quartile for the 36 months ended May 31, 2020 and the third Broadridge quartile for the 12 months ended May 31, 2020. The Trustees noted the reasons for the Fund’s underperformance, while also noting that the Fund has a performance fee structure that results in lower management fees during periods of underperformance, and the steps Janus Capital and Perkins had taken or were taking to improve performance.
· For Janus Henderson Overseas Portfolio, the Trustees noted that the Fund’s performance was in the bottom Broadridge quartile for the 36 months ended May 31, 2020 and the third Broadridge quartile for the 12 months ended May 31, 2020. The Trustees noted the reasons for the Fund’s underperformance, while also noting that the Fund has a performance fee structure that results in lower management fees during periods of underperformance and the steps Janus Capital had taken or was taking to improve performance.
· For Janus Henderson Research Portfolio, the Trustees noted that the Fund’s performance was in the third Broadridge quartile for the 36 months ended May 31, 2020 and the third Broadridge quartile for the 12 months ended May 31, 2020. The Trustees noted the reasons for the Fund’s underperformance, while also noting that the Fund has a performance fee structure that results in lower management fees during periods of underperformance, and the steps Janus Capital had taken or was taking to improve performance.
· For Janus Henderson U.S. Low Volatility Portfolio, the Trustees noted that the Fund’s performance was in the second Broadridge quartile for the 36 months ended May 31, 2020 and the third Broadridge quartile for the 12 months ended May 31, 2020.
In consideration of each Janus Henderson Fund’s performance, the Trustees concluded that, taking into account the factors relevant to performance, as well as other considerations, including steps taken to improve performance, the Janus Henderson Fund’s performance warranted continuation of such Janus Henderson Fund’s investment advisory and subadvisory agreement(s).
Costs of Services Provided
The Trustees examined information regarding the fees and expenses of each Janus Henderson Fund in comparison to similar information for other comparable funds as provided by Broadridge, an independent data provider. They also reviewed an analysis of that information provided by their independent fee consultant and noted that the rate of management fees (investment advisory fees and any administration fees but excluding out-of-pocket costs) for many of the Janus Henderson Funds, after applicable waivers, was below the average management fee rate of the respective peer group of funds selected by an independent data provider. The Trustees also examined information regarding the subadvisory fees charged for subadvisory services, as applicable, noting that all such fees were paid by Janus Capital out of its management fees collected from such Janus Henderson Fund.
The independent fee consultant provided its belief that the management fees charged by Janus Capital to each of the Janus Henderson Funds under the current investment advisory and administration agreements are reasonable in relation to the services provided by Janus Capital. The independent fee consultant found: (1) the total expenses and management fees of the Janus Henderson Funds to be reasonable relative to other comparable mutual funds; (2) the total expenses, on average, were 10% under the average total expenses of the respective Broadridge Expense Group peers; and (3) and the management fees for the Janus Henderson Funds, on average, were 9% under the average management fees for the respective Broadridge Expense Group. The Trustees also considered the total expenses for
36 | DECEMBER 31, 2020 |
Janus Henderson VIT Enterprise Portfolio
Additional Information (unaudited)
each share class of each Janus Henderson Fund compared to the average total expenses for its Broadridge Expense Group and to average total expenses for its Broadridge Expense Universe.
For certain Janus Henderson Funds, the independent fee consultant also performed a systematic “focus list” analysis of expenses which assessed fund fees in the context of fund performance being delivered. Based on this analysis, the independent fee consultant found that the combination of service quality/performance and expenses on these individual Janus Henderson Funds was reasonable in light of performance trends, performance histories, and existence of performance fees, breakpoints, and/or expense waivers on such Janus Henderson Funds.
The Trustees considered the methodology used by Janus Capital and each subadviser in determining compensation payable to portfolio managers, the competitive environment for investment management talent, and the competitive market for mutual funds in different distribution channels.
The Trustees also reviewed management fees charged by Janus Capital and each subadviser to comparable separate account clients and to comparable non-affiliated funds subadvised by Janus Capital or by a subadviser (for which Janus Capital or the subadviser provides only or primarily portfolio management services). Although in most instances subadvisory and separate account fee rates for various investment strategies were lower than management fee rates for Janus Henderson Funds having a similar strategy, the Trustees considered that Janus Capital noted that, under the terms of the management agreements with the Janus Henderson Funds, Janus Capital performs significant additional services for the Janus Henderson Funds that it does not provide to those other clients, including administration services, oversight of the Janus Henderson Funds’ other service providers, trustee support, regulatory compliance and numerous other services, and that, in serving the Janus Henderson Funds, Janus Capital assumes many legal risks and other costs that it does not assume in servicing its other clients. Moreover, they noted that the independent fee consultant found that: (1) the management fees Janus Capital charges to the Janus Henderson Funds are reasonable in relation to the management fees Janus Capital charges to funds subadvised by Janus Capital and to the fees Janus Capital charges to its institutional separate account clients; (2) these subadvised and institutional separate accounts have different service and infrastructure needs and operate in markets very distinct relative to retail funds; and (3) Janus Henderson mutual fund investors enjoy reasonable fees relative to the fees charged to Janus Henderson subadvised fund and separate account investors; (4) 9 of 10 Janus Henderson Funds have lower management fees than similar funds subadvised by Janus Capital; and (5) 5 of 8 Janus Henderson Funds have lower management fees than similar separate accounts managed by Janus Capital.
The Trustees considered the fees for each Janus Henderson Fund for its fiscal year ended in 2019, including the VIT Portfolios, and noted the following with regard to each VIT Portfolio’s total expenses, net of applicable fee waivers (the VIT Portfolio’s “total expenses”):
· For Janus Henderson Balanced Portfolio, the Trustees noted that, although the Fund’s total expenses exceeded the peer group average for one share class, overall the Fund’s total expenses were reasonable.
· For Janus Henderson Enterprise Portfolio, the Trustees noted that, although the Fund’s total expenses exceeded the peer group average for one share class, overall the Fund’s total expenses were reasonable.
· For Janus Henderson Flexible Bond Portfolio, the Trustees noted that, although the Fund’s total expenses exceeded the peer group for one share class, overall the Fund’s total expenses were reasonable. The Trustees also noted that Janus Capital has contractually agreed to limit the Fund’s expenses, although this limit did not apply because the Fund’s total expenses were already below the applicable fee limit.
· For Janus Henderson Forty Portfolio, the Trustees noted that, although the Fund’s total expenses exceeded the peer group average for one share class, overall the Fund’s total expenses were reasonable.
· For Janus Henderson Global Research Portfolio, the Trustees noted that, although the Fund’s total expenses exceeded the peer group average for one share class, overall the Fund’s total expenses were reasonable.
· For Janus Henderson Global Technology and Innovation Portfolio, the Trustees noted that the Fund’s total expenses were below the peer group for both share classes.
· For Janus Henderson Mid Cap Value Portfolio, the Trustees noted that, although the Fund’s total expenses exceeded the peer group for one share class, overall the Fund’s total expenses were reasonable. The Trustees also noted that Janus Capital has contractually agreed to limit the Fund’s expenses, although this limit did not apply because the Fund’s total expenses were already below the applicable fee limit.
Janus Aspen Series | 37 |
Janus Henderson VIT Enterprise Portfolio
Additional Information (unaudited)
· For Janus Henderson Overseas Portfolio, the Trustees noted that the Fund’s total expenses were below the peer group for both share classes.
· For Janus Henderson Research Portfolio, the Trustees noted that the Fund’s total expenses were below the peer group average for both share classes.
· For Janus Henderson U.S. Low Volatility Portfolio, the Trustees noted that the Fund’s total expenses were below the peer group for its sole share class.
The Trustees reviewed information on the overall profitability to Janus Capital and its affiliates of their relationship with the Janus Henderson Funds, and considered profitability data of other publicly traded mutual fund advisers. The Trustees recognized that profitability comparisons among fund managers are difficult because of the variation in the type of comparative information that is publicly available, and the profitability of any fund manager is affected by numerous factors, including the organizational structure of the particular fund manager, differences in complex size, difference in product mix, difference in types of business (mutual fund, institutional and other), differences in the types of funds and other accounts it manages, possible other lines of business, the methodology for allocating expenses, and the fund manager’s capital structure and cost of capital.
Additionally, the Trustees considered the estimated profitability to Janus Capital from the investment management services it provided to each Janus Henderson Fund. In their review, the Trustees considered whether Janus Capital and each subadviser receive adequate incentives and resources to manage the Janus Henderson Funds effectively. In reviewing profitability, the Trustees noted that the estimated profitability for an individual Janus Henderson Fund is necessarily a product of the allocation methodology utilized by Janus Capital to allocate its expenses as part of the estimated profitability calculation. In this regard, the Trustees noted that the independent fee consultant found that (1) the expense allocation methodology and rationales utilized by Janus Capital were reasonable and (2) no clear correlation exists between expense allocations and operating margins. The Trustees also considered that the estimated profitability for an individual Janus Henderson Fund was influenced by a number of factors, including not only the allocation methodology selected, but also the presence of fee waivers and expense caps, and whether the Janus Henderson Fund’s investment management agreement contained breakpoints or a performance fee component. The Trustees determined, after taking into account these factors, among others, that Janus Capital’s estimated profitability with respect to each Janus Henderson Fund was not unreasonable in relation to the services provided, and that the variation in the range of such estimated profitability among the Janus Henderson Funds was not a material factor in the Board’s approval of the reasonableness of any Janus Henderson Fund’s investment management fees.
The Trustees concluded that the management fees payable by each Janus Henderson Fund to Janus Capital and its affiliates, as well as the fees paid by Janus Capital to the subadvisers of subadvised Janus Henderson Funds, were reasonable in relation to the nature, extent, and quality of the services provided, taking into account the fees charged by other advisers for managing comparable mutual funds with similar strategies, the fees Janus Capital and the subadvisers charge to other clients, and, as applicable, the impact of fund performance on management fees payable by the Janus Henderson Funds. The Trustees also concluded that each Janus Henderson Fund’s total expenses were reasonable, taking into account the size of the Janus Henderson Fund, the quality of services provided by Janus Capital and any subadviser, the investment performance of the Janus Henderson Fund, and any expense limitations agreed to or provided by Janus Capital.
Economies of Scale
The Trustees considered information about the potential for Janus Capital to realize economies of scale as the assets of the Janus Henderson Funds increase. They noted that their independent fee consultant published a report to the Trustees in November 2019 which provided its research and analysis into economies of scale. They also noted that, although many Janus Henderson Funds pay advisory fees at a fixed base rate as a percentage of net assets, without any breakpoints or performance fees, their independent fee consultant concluded that 73% of these Janus Henderson Funds’ have contractual management fees (gross of waivers) below their Broadridge Expense Group averages. They also noted the following: (1) that for those Janus Henderson Funds whose expenses are being reduced by the contractual expense limitations of Janus Capital, Janus Capital is subsidizing certain of these Janus Henderson Funds because they have not reached adequate scale; (2) as the assets of some of the Janus Henderson Funds have declined in the past few years, certain of those Janus Henderson Funds have benefited from having advisory fee rates that have remained constant rather than increasing as assets declined; (3) performance fee structures have been implemented for various Janus Henderson Funds that have caused the effective rate of advisory fees payable by such
38 | DECEMBER 31, 2020 |
Janus Henderson VIT Enterprise Portfolio
Additional Information (unaudited)
Janus Henderson Fund to vary depending on the investment performance of the Janus Henderson Fund relative to its benchmark index over the measurement period; and (4) a few Janus Henderson Funds have fee schedules with breakpoints and reduced fee rates above certain asset levels. The Trustees also noted that the Janus Henderson Funds share directly in economies of scale through the significant investments made by Janus Capital and its affiliates related to services provided to the Funds and the lower charges of third-party service providers that are based in part on the combined scale of all of the Janus Henderson Funds.
The Trustees also considered the independent fee consultant’s conclusion that, given the limitations of various analytical approaches to economies of scale and their conflicting results, it is difficult to analytically confirm or deny the existence of economies of scale in the Janus Henderson complex. In this regard, the independent consultant concluded that (1) to the extent there were economies of scale at Janus Capital, Janus Capital’s general strategy of setting fixed management fees below peers appeared to share any such economies with investors even on smaller Janus Henderson Funds which have not yet achieved those economies and (2) by setting lower fixed fees from the start on these Janus Henderson Funds, Janus Capital appeared to be investing to increase the likelihood that these Janus Henderson Funds will grow to a level to achieve any economies of scale that may exist. Further, the independent fee consultant provided its belief that Janus Henderson Fund investors are well-served by the fee levels and performance fee structures in place on the Janus Henderson Funds in light of any economies of scale that may be present at Janus Capital.
Based on all of the information reviewed, including the recent and past research and analysis conducted by the Trustees’ independent fee consultant, the Trustees concluded that the current fee structure of each Janus Henderson Fund was reasonable and that the current rates of fees do reflect a sharing between Janus Capital and the Janus Henderson Fund of any economies of scale that may be present at the current asset level of the Janus Henderson Fund.
Other Benefits to Janus Capital
The Trustees also considered benefits that accrue to Janus Capital and its affiliates and subadvisers to the Janus Henderson Funds from their relationships with the Janus Henderson Funds. They recognized that two affiliates of Janus Capital separately serve the Janus Henderson Funds as transfer agent and distributor, respectively, and the transfer agent receives compensation directly from the non-money market funds for services provided, and that such compensation contributes to the overall profitability of Janus Capital and its affiliates that results from their relationship with the Janus Henderson Funds. The Trustees also considered Janus Capital’s past and proposed use of commissions paid by the Janus Henderson Funds on portfolio brokerage transactions to obtain proprietary and third-party research products and services benefiting the Janus Henderson Fund and/or other clients of Janus Capital and Janus Capital, and/or a subadviser to a Janus Henderson Fund. The Trustees concluded that Janus Capital’s and the subadvisers’ use of these types of client commission arrangements to obtain proprietary and third-party research products and services was consistent with regulatory requirements and guidelines and was likely to benefit each Janus Henderson Fund. The Trustees also concluded that, other than the services provided by Janus Capital and its affiliates and subadvisers pursuant to the agreements and the fees to be paid by each Janus Henderson Fund therefor, the Janus Henderson Funds and Janus Capital and the subadvisers may potentially benefit from their relationship with each other in other ways. They concluded that Janus Capital and its affiliates share directly in economies of scale through the lower charges of third-party service providers that are based in part on the combined scale of the Janus Henderson Funds and other clients serviced by Janus Capital and its affiliates. They also concluded that Janus Capital and/or the subadvisers benefit from the receipt of research products and services acquired through commissions paid on portfolio transactions of the Janus Henderson Funds and that the Janus Henderson Funds benefit from Janus Capital’s and/or the subadvisers’ receipt of those products and services as well as research products and services acquired through commissions paid by other clients of Janus Capital and/or other clients of the subadvisers. They further concluded that the success of any Janus Henderson Fund could attract other business to Janus Capital, the subadvisers or other Janus Henderson funds, and that the success of Janus Capital and the subadvisers could enhance Janus Capital’s and the subadvisers’ ability to serve the Janus Henderson Funds.
Janus Aspen Series | 39 |
Janus Henderson VIT Enterprise Portfolio
Useful Information About Your Portfolio Report (unaudited)
The Management Commentary in this report includes valuable insight as well as statistical information to help you understand how your Portfolio’s performance and characteristics stack up against those of comparable indices.
If the Portfolio invests in foreign securities, this report may include information about country exposure. Country exposure is based primarily on the country of risk. A company may be allocated to a country based on other factors such as location of the company’s principal office, the location of the principal trading market for the company’s securities, or the country where a majority of the company’s revenues are derived.
Please keep in mind that the opinions expressed in the Management Commentary are just that: opinions. They are a reflection based on best judgment at the time this report was compiled, which was December 31, 2020. As the investing environment changes, so could opinions. These views are unique and are not necessarily shared by fellow employees or by Janus Henderson in general.
Performance Overviews
Performance overview graphs compare the performance of a hypothetical $10,000 investment in the Portfolio with one or more widely used market indices. When comparing the performance of the Portfolio with an index, keep in mind that market indices are not available for investment and do not reflect deduction of expenses.
Average annual total returns are quoted for a Portfolio with more than one year of performance history. Average annual total return is calculated by taking the growth or decline in value of an investment over a period of time, including reinvestment of dividends and distributions, then calculating the annual compounded percentage rate that would have produced the same result had the rate of growth been constant throughout the period. Average annual total return does not reflect the deduction of taxes that a shareholder would pay on Portfolio distributions or redemptions of Portfolio shares.
Cumulative total returns are quoted for a Portfolio with less than one year of performance history. Cumulative total return is the growth or decline in value of an investment over time, independent of the period of time involved. Cumulative total return does not reflect the deduction of taxes that a shareholder would pay on Portfolio distributions or redemptions of Portfolio shares.
Pursuant to federal securities rules, expense ratios shown in the performance chart reflect subsidized (if applicable) and unsubsidized ratios. The total annual fund operating expenses ratio is gross of any fee waivers, reflecting the Portfolio’s unsubsidized expense ratio. The net annual fund operating expenses ratio (if applicable) includes contractual waivers of Janus Capital and reflects the Portfolio’s subsidized expense ratio. Ratios may be higher or lower than those shown in the “Financial Highlights” in this report.
Schedule of Investments
Following the performance overview section is the Portfolio’s Schedule of Investments. This schedule reports the types of securities held in the Portfolio on the last day of the reporting period. Securities are usually listed by type (common stock, corporate bonds, U.S. Government obligations, etc.) and by industry classification (banking, communications, insurance, etc.). Holdings are subject to change without notice.
The value of each security is quoted as of the last day of the reporting period. The value of securities denominated in foreign currencies is converted into U.S. dollars.
If the Portfolio invests in foreign securities, it will also provide a summary of investments by country. This summary reports the Portfolio exposure to different countries by providing the percentage of securities invested in each country. The country of each security represents the country of risk. The Portfolio’s Schedule of Investments relies upon the industry group and country classifications published by Barclays and/or MSCI Inc.
Tables listing details of individual forward currency contracts, futures, written options, swaptions, and swaps follow the Portfolio’s Schedule of Investments (if applicable).
Statement of Assets and Liabilities
This statement is often referred to as the “balance sheet.” It lists the assets and liabilities of the Portfolio on the last day of the reporting period.
40 | DECEMBER 31, 2020 |
Janus Henderson VIT Enterprise Portfolio
Useful Information About Your Portfolio Report (unaudited)
The Portfolio’s assets are calculated by adding the value of the securities owned, the receivable for securities sold but not yet settled, the receivable for dividends declared but not yet received on securities owned, and the receivable for Portfolio shares sold to investors but not yet settled. The Portfolio’s liabilities include payables for securities purchased but not yet settled, Portfolio shares redeemed but not yet paid, and expenses owed but not yet paid. Additionally, there may be other assets and liabilities such as unrealized gain or loss on forward currency contracts.
The section entitled “Net Assets Consist of” breaks down the components of the Portfolio’s net assets. Because the Portfolio must distribute substantially all earnings, you will notice that a significant portion of net assets is shareholder capital.
The last section of this statement reports the net asset value (“NAV”) per share on the last day of the reporting period. The NAV is calculated by dividing the Portfolio’s net assets for each share class (assets minus liabilities) by the number of shares outstanding.
Statement of Operations
This statement details the Portfolio’s income, expenses, realized gains and losses on securities and currency transactions, and changes in unrealized appreciation or depreciation of Portfolio holdings.
The first section in this statement, entitled “Investment Income,” reports the dividends earned from securities and interest earned from interest-bearing securities in the Portfolio.
The next section reports the expenses incurred by the Portfolio, including the advisory fee paid to the investment adviser, transfer agent fees and expenses, and printing and postage for mailing statements, financial reports and prospectuses. Expense offsets and expense reimbursements, if any, are also shown.
The last section lists the amounts of realized gains or losses from investment and foreign currency transactions, and changes in unrealized appreciation or depreciation of investments and foreign currency-denominated assets and liabilities. The Portfolio will realize a gain (or loss) when it sells its position in a particular security. A change in unrealized gain (or loss) refers to the change in net appreciation or depreciation of the Portfolio during the reporting period. “Net Realized and Unrealized Gain/(Loss) on Investments” is affected both by changes in the market value of Portfolio holdings and by gains (or losses) realized during the reporting period.
Statements of Changes in Net Assets
These statements report the increase or decrease in the Portfolio’s net assets during the reporting period. Changes in the Portfolio’s net assets are attributable to investment operations, dividends and distributions to investors, and capital share transactions. This is important to investors because it shows exactly what caused the Portfolio’s net asset size to change during the period.
The first section summarizes the information from the Statement of Operations regarding changes in net assets due to the Portfolio’s investment operations. The Portfolio’s net assets may also change as a result of dividend and capital gains distributions to investors. If investors receive their dividends and/or distributions in cash, money is taken out of the Portfolio to pay the dividend and/or distribution. If investors reinvest their dividends and/or distributions, the Portfolio’s net assets will not be affected. If you compare the Portfolio’s “Net Decrease from Dividends and Distributions” to “Reinvested Dividends and Distributions,” you will notice that dividends and distributions have little effect on the Portfolio’s net assets. This is because the majority of the Portfolio’s investors reinvest their dividends and/or distributions.
The reinvestment of dividends and distributions is included under “Capital Share Transactions.” “Capital Shares” refers to the money investors contribute to the Portfolio through purchases or withdrawals via redemptions. The Portfolio’s net assets will increase and decrease in value as investors purchase and redeem shares from the Portfolio.
Financial Highlights
This schedule provides a per-share breakdown of the components that affect the Portfolio’s NAV for current and past reporting periods as well as total return, asset size, ratios, and portfolio turnover rate.
The first line in the table reflects the NAV per share at the beginning of the reporting period. The next line reports the net investment income/(loss) per share. Following is the per share total of net gains/(losses), realized and unrealized. Per share dividends and distributions to investors are then subtracted to arrive at the NAV per share at the end of the period. The next line reflects the total return for the period. The total return may include adjustments in accordance with
Janus Aspen Series | 41 |
Janus Henderson VIT Enterprise Portfolio
Useful Information About Your Portfolio Report (unaudited)
generally accepted accounting principles required at the period end for financial reporting purposes. As a result, the total return may differ from the total return reflected for individual shareholder transactions. Also included are ratios of expenses and net investment income to average net assets.
The Portfolio’s expenses may be reduced through expense offsets and expense reimbursements. The ratios shown reflect expenses before and after any such offsets and reimbursements.
The ratio of net investment income/(loss) summarizes the income earned less expenses, divided by the average net assets of the Portfolio during the reporting period. Do not confuse this ratio with the Portfolio’s yield. The net investment income ratio is not a true measure of the Portfolio’s yield because it does not take into account the dividends distributed to the Portfolio’s investors.
The next figure is the portfolio turnover rate, which measures the buying and selling activity in the Portfolio. Portfolio turnover is affected by market conditions, changes in the asset size of the Portfolio, fluctuating volume of shareholder purchase and redemption orders, the nature of the Portfolio’s investments, and the investment style and/or outlook of the portfolio manager(s) and/or investment personnel. A 100% rate implies that an amount equal to the value of the entire portfolio was replaced once during the fiscal year; a 50% rate means that an amount equal to the value of half the portfolio is traded in a year; and a 200% rate means that an amount equal to the value of the entire portfolio is traded every six months.
42 | DECEMBER 31, 2020 |
Janus Henderson VIT Enterprise Portfolio
Designation Requirements (unaudited)
For federal income tax purposes, the Portfolio designated the following for the year ended December 31, 2020:
| |
Capital Gain Distributions | $110,296,383 |
Dividends Received Deduction Percentage | 46% |
Janus Aspen Series | 43 |
Janus Henderson VIT Enterprise Portfolio
Trustees and Officers (unaudited)
The following are the Trustees and officers of the Trust, together with a brief description of their principal occupations during the last five years (principal occupations for certain Trustees may include periods over five years). The Portfolio’s Statement of Additional Information includes additional information about the Trustees and officers and is available, without charge, by calling 1-877-335-2687.
Each Trustee has served in that capacity since he or she was originally elected or appointed. The Trustees do not serve a specified term of office. Each Trustee will hold office until the termination of the Trust or his or her earlier death, resignation, retirement, incapacity, or removal. Under the Portfolio’s Governance Procedures and Guidelines, the policy is for Trustees to retire no later than the end of the calendar year in which the Trustee turns 75. The Trustees review the Portfolio’s Governance Procedures and Guidelines from time to time and may make changes they deem appropriate. The Portfolio’s Nominating and Governance Committee will consider nominees for the position of Trustee recommended by shareholders. Shareholders may submit the name of a candidate for consideration by the Committee by submitting their recommendations to the Trust’s Secretary. Each Trustee is currently a Trustee of one other registered investment company advised by Janus Capital: Janus Investment Fund. Collectively, these two registered investment companies consist of 56 series or funds referred to herein as the Fund Complex.
The Trust’s officers are elected annually by the Trustees for a one-year term. Certain officers also serve as officers of Janus Investment Fund. Certain officers of the Portfolio may also be officers and/or directors of Janus Capital. Except as otherwise disclosed, Portfolio officers receive no compensation from the Portfolio, except for the Portfolio’s Chief Compliance Officer, as authorized by the Trustees.
44 | DECEMBER 31, 2020 |
Janus Henderson VIT Enterprise Portfolio
Trustees and Officers (unaudited)
TRUSTEES | |||||
Name, Address, and Age | Positions Held with the Trust | Length of Time Served | Principal Occupations During the Past Five Years | Number of Portfolios/Funds in Fund Complex Overseen by Trustee | Other Directorships Held by Trustee During the Past Five Years |
Independent Trustees | |||||
William F. McCalpin 151 Detroit Street Denver, CO 80206 DOB: 1957 | Chairman Trustee | 1/08-Present 6/02-Present | Independent Consultant (since 2019) and Chief Operating Officer, muun chi LLC (organic food business) (since 2020). Formerly, Managing Partner, Impact Investments, Athena Capital Advisors LLC (independent registered investment advisor) (2016-2019), Managing Director, Holos Consulting LLC (provides consulting services to foundations and other nonprofit organizations) (2009-2016), Chief Executive Officer, Imprint Capital Advisors (impact investment firm) (2013-2015), and Executive Vice President and Chief Operating Officer of The Rockefeller Brothers Fund (a private family foundation) (1998-2006). | 56 | Director of Mutual Fund Directors Forum (a non-profit organization serving independent directors of U.S. mutual funds) (since 2016), Chairman of the Board and Trustee of The Investment Fund for Foundations Investment Program (TIP) (consisting of 2 funds) (since 2008), and Director of the F.B. Heron Foundation (a private grantmaking foundation) (since 2006). |
Janus Aspen Series | 45 |
Janus Henderson VIT Enterprise Portfolio
Trustees and Officers (unaudited)
TRUSTEES | |||||
Name, Address, and Age | Positions Held with the Trust | Length of Time Served | Principal Occupations During the Past Five Years | Number of Portfolios/Funds in Fund Complex Overseen by Trustee | Other Directorships Held by Trustee During the Past Five Years |
Independent Trustees | |||||
Alan A. Brown 151 Detroit Street Denver, CO 80206 DOB: 1962 | Trustee | 1/13-Present | Principal, Curam Holdings LLC (since 2018). Formerly, Executive Vice President, Institutional Markets, of Black Creek Group (private equity real estate investment management firm) (2012-2018), Executive Vice President and Co-Head, Global Private Client Group (2007-2010), Executive Vice President, Mutual Funds (2005-2007), and Chief Marketing Officer (2001-2005) of Nuveen Investments, Inc. (asset management). | 56 | Advisory Board Member of AEW Core Property Trust (open-end property fund) (since 2020), and Director of WTTW (PBS affiliate) (since 2003). Formerly, Director of MotiveQuest LLC (strategic social market research company) (2003-2016), Director of Nuveen Global Investors LLC (2007-2011), Director of Communities in Schools (2004-2010), and Director of Mutual Fund Education Alliance (until 2010). |
46 | DECEMBER 31, 2020 |
Janus Henderson VIT Enterprise Portfolio
Trustees and Officers (unaudited)
TRUSTEES | |||||
Name, Address, and Age | Positions Held with the Trust | Length of Time Served | Principal Occupations During the Past Five Years | Number of Portfolios/Funds in Fund Complex Overseen by Trustee | Other Directorships Held by Trustee During the Past Five Years |
Independent Trustees | |||||
William D. Cvengros 151 Detroit Street Denver, CO 80206 DOB: 1948 | Trustee | 1/11-Present | Chief Executive Officer of SJC Capital, LLC (a personal investment company and consulting firm) (since 2002). Formerly, Chief Executive Officer and President of PIMCO Advisors Holdings L.P. (a publicly traded investment management firm) (1994-2000), and Chief Investment Officer (1987-1994) and Vice Chairman and Director (1990-1994) of Pacific Life Insurance Company (a mutual life insurance and annuity company) (1987-1994). | 56 | Advisory Board Member, RevOZ Fund LP and related funds (real estate investments for opportunity zones) (since 2020), and Advisory Board Member, Innovate Partners Emerging Growth and Equity Fund I (early stage venture capital fund) (since 2014). Formerly, Managing Trustee of National Retirement Partners Liquidating Trust (2013-2016), Chairman, National Retirement Partners, Inc. (formerly a network of advisors to 401(k) plans) (2005-2013), Director of Prospect Acquisition Corp. (a special purpose acquisition corporation) (2007-2009), Director of RemedyTemp, Inc. (temporary help services company) (1996-2006), and Trustee of PIMCO Funds Multi-Manager Series (1990-2000) and Pacific Life Variable Life & Annuity Trusts (1987-1994). |
Janus Aspen Series | 47 |
Janus Henderson VIT Enterprise Portfolio
Trustees and Officers (unaudited)
TRUSTEES | |||||
Name, Address, and Age | Positions Held with the Trust | Length of Time Served | Principal Occupations During the Past Five Years | Number of Portfolios/Funds in Fund Complex Overseen by Trustee | Other Directorships Held by Trustee During the Past Five Years |
Independent Trustees | |||||
Raudline Etienne 151 Detroit Street Denver, CO 80206 DOB: 1965 | Trustee | 6/16-Present | Founder, Daraja Capital (advisory and investment firm) (since 2016), and Senior Advisor, Albright Stonebridge Group LLC (global strategy firm) (since 2016). Formerly, Senior Vice President (2011-2015), Albright Stonebridge Group LLC, and Deputy Comptroller and Chief Investment Officer, New York State Common Retirement Fund (public pension fund) (2008-2011). | 56 | Board Member, Van Alen Institute (nonprofit architectural and design organization) (since 2019) and Director of Brightwood Capital Advisors, LLC (since 2014). |
William M. Fitzgerald, Sr. 151 Detroit Street Denver, CO 80206 DOB: 1964 | Trustee | 9/19-Present | Founder, Fitzgerald Asset Management LLC (since 2012). Formerly, Founder and Chief Investment Officer, Global Infrastructure Asset Management LLC (2008-2017), Chief Investment Officer of Nuveen Asset Management (2000-2007), and Managing Director, Nuveen Investment LLC (1988-2007). | 56 | Board of Directors, Municipal Securities Rulemaking Board (since 2017). Formerly, Board of Directors of Syncora Holdings Ltd, Syncora Guarantee Inc., and Syncora Capital Assurance Inc. (2009-2016), and Trustee, Destra Investment Trust (2010-2014). |
48 | DECEMBER 31, 2020 |
Janus Henderson VIT Enterprise Portfolio
Trustees and Officers (unaudited)
TRUSTEES | |||||
Name, Address, and Age | Positions Held with the Trust | Length of Time Served | Principal Occupations During the Past Five Years | Number of Portfolios/Funds in Fund Complex Overseen by Trustee | Other Directorships Held by Trustee During the Past Five Years |
Independent Trustees | |||||
Gary A. Poliner 151 Detroit Street Denver, CO 80206 DOB: 1953 | Trustee | 6/16-Present | Retired. Formerly, President (2010-2013) of Northwestern Mutual Life Insurance Company. | 56 | Director of MGIC Investment Corporation (private mortgage insurance) (since 2013) and West Bend Mutual Insurance Company (property/casualty insurance) (since 2013). Formerly, Trustee of Northwestern Mutual Life Insurance Company (2010-2013) and Director of Frank Russell Company (global asset management firm) (2008-2013). |
Diane L. Wallace 151 Detroit Street Denver, CO 80206 DOB: 1958 | Trustee | 6/17-Present | Retired. Formerly, Chief Operating Officer, Senior Vice President-Operations, and Chief Financial Officer for Driehaus Capital Management, LLC (1988-2006) and Treasurer for Driehaus Mutual Funds (1996-2002). | 56 | Director of Family Service of Lake County (since 2019). Formerly, Independent Trustee, Henderson Global Funds (13 portfolios) (2015-2017), Independent Trustee, State Farm Associates' Funds Trust, State Farm Mutual Fund Trust, and State Farm Variable Product Trust (28 portfolios) (2013-2017). |
Janus Aspen Series | 49 |
Janus Henderson VIT Enterprise Portfolio
Trustees and Officers (unaudited)
TRUSTEES | |||||
Name, Address, and Age | Positions Held with the Trust | Length of Time Served | Principal Occupations During the Past Five Years | Number of Portfolios/Funds in Fund Complex Overseen by Trustee | Other Directorships Held by Trustee During the Past Five Years |
Independent Trustees | |||||
Linda S. Wolf 151 Detroit Street Denver, CO 80206 DOB: 1947 | Trustee | 11/05-Present | Retired. Formerly, Chairman and Chief Executive Officer of Leo Burnett (Worldwide) (advertising agency) (2001-2005). | 56 | Director of Chicago Community Trust (Regional Community Foundation), Lurie Children’s Hospital (Chicago, IL), Shirley Ryan Ability Lab and Wrapports, LLC (digital communications company). Formerly, Director of Chicago Council on Global Affairs (until 2019), InnerWorkings (until 2019) and Director of Walmart (until 2017). |
50 | DECEMBER 31, 2020 |
Janus Henderson VIT Enterprise Portfolio
Trustees and Officers (unaudited)
OFFICERS | |||
Name, Address, and Age | Positions Held with the Trust | Term of Office* and Length of Time Served | Principal Occupations During the Past Five Years |
Brian Demain | Executive Vice President and Co-Portfolio Manager Janus Henderson Enterprise Portfolio | 11/07-Present | Portfolio Manager for other Janus Henderson accounts. |
Cody Wheaton | Executive Vice President and Co-Portfolio Manager | 7/16-Present | Portfolio
Manager for other Janus |
Bruce L. Koepfgen | President and Chief Executive Officer | 7/14-Present | Executive Vice President and Head of North America at Janus Henderson Investors (since 2017), President and Head of North America at Janus Capital Management LLC (since 2013 and 2017, respectively), President at Janus Capital Group Inc. (since 2013), President and Director at Janus International Holding LLC (since 2019 and 2011, respectively), President at Janus Holdings LLC (since 2019), President and Director at Janus Management Holdings Corporation (since 2017 and 2012, respectively), Executive Vice President and Head of North America at Janus Distributors LLC (since 2011 and 2019, respectively), Vice President and Director at Intech Investment Management LLC (since 2012), and Executive Vice President at Perkins Investment Management LLC (since 2011). Formerly, Executive Vice President at Janus Capital Group Inc., Janus International Holding LLC, and Janus Management Holdings Corporation (2011-2019), Director at Perkins Investment Management LLC (2011-2019), and Chief Financial Officer at Janus Capital Group Inc. (2011-2013). |
* Officers are elected at least annually by the Trustees for a one-year term and may also be elected from time to time by the Trustees for an interim period. | |||
Janus Aspen Series | 51 |
Janus Henderson VIT Enterprise Portfolio
Trustees and Officers (unaudited)
OFFICERS | |||
Name, Address, and Age | Positions Held with the Trust | Term of Office* and Length of Time Served | Principal Occupations During the Past Five Years |
Kristin Mariani | Vice President, Chief Compliance Officer, and Anti-Money Laundering Officer | 7/20-Present | Head of Compliance, North America for Janus Henderson Investors (since September 2020), and Chief Compliance Officer for Janus Capital Management LLC (since September 2017). Formerly, Global Head of Investment Management Compliance for Janus Henderson Investors (February 2019 – August 2020), Vice President, Head of Global Distribution Compliance and Chief Compliance Officer of Janus Henderson Distributors (May 2017-September 2017), Vice President, Compliance at Janus Capital Group Inc., Janus Capital Management LLC, and Janus Distributors LLC (2009-2017). |
Jesper Nergaard | Chief
Financial Officer | 3/05-Present | Head of U.S. Fund Administration, Janus Henderson Investors and Janus Services LLC. |
Abigail
J. Murray | Vice President, Chief Legal Officer, and Secretary | 12/20-Present | Managing Counsel (2020-present). Formerly, Senior Counsel for Invesco Ltd. (2017-2020), and Vice President and Senior Counsel, ALPS Fund Services, Inc. and Assistant General Counsel, ALPS Advisors, Inc. (2015-2017). |
* Officers are elected at least annually by the Trustees for a one-year term and may also be elected from time to time by the Trustees for an interim period. | |||
52 | DECEMBER 31, 2020 |
Janus Henderson VIT Enterprise Portfolio
Notes
NotesPage1
Janus Aspen Series | 53 |
| ||||||||
This report is submitted for the general information of shareholders of the Portfolio. It is not an offer or solicitation for the Portfolio and is not authorized for distribution to prospective investors unless preceded or accompanied by an effective prospectus. | ||||||||
Janus Henderson, Janus, Henderson, Perkins, and Intech are trademarks of Janus Henderson Group plc or one of its subsidiaries. © Janus Henderson Group plc Janus Henderson Distributors | ||||||||
109-02-81116 03-21 | ||||||||

ANNUAL REPORT December 31, 2020 | |||||
Janus Henderson VIT Flexible Bond Portfolio | |||||
Janus Aspen Series | |||||
HIGHLIGHTS · Portfolio management perspective · Investment strategy behind your portfolio · Portfolio
performance, characteristics | |||||
|

Table of Contents
Janus Henderson VIT Flexible Bond Portfolio
Janus Henderson VIT Flexible Bond Portfolio (unaudited)


PERFORMANCE OVERVIEW
During the 12-month period ended December 31, 2020, Janus Henderson VIT Flexible Bond Portfolio’s Institutional Shares and Service Shares returned 10.48% and 10.25%, respectively, compared with 7.51% for the Portfolio’s benchmark, the Bloomberg Barclays U.S. Aggregate Bond Index.
INVESTMENT ENVIRONMENT
The bond market ultimately fared well despite a dramatic intra-period sell-off in credit sectors amid the COVID-19 correction. Aggressive stimulus by the Federal Reserve (Fed), including a commitment to open-ended quantitative easing, led to a rapid improvement in fixed income market liquidity and a successful primary market for companies needing to access capital. Both investment-grade and high-yield bonds finished the period with positive returns, with investment-grade corporates outperforming high yield. Securitized credit generated strong risk-adjusted returns. Rates fell across the yield curve as the Fed cut policy rates to zero and executed large-scale purchases of U.S. Treasuries. The yield on the 10-year Treasury note ended December at 0.92%, down from 1.92% one year ago.
PERFORMANCE DISCUSSION
We were reducing risk at the start of the period, cautious on credit valuations after strong performance in 2019. As the spread of COVID-19 gathered momentum, but before the bulk of the markets’ collapse, we sought to preserve capital and increase liquidity by further lowering our credit allocations and increasing interest rate duration. Coming out of the COVID-19 correction, we began purchasing bonds of higher-quality companies that, in our view, were positioned to withstand an extended downturn. With the Fed’s commitment to supporting credit markets and the health care industry’s aggressive efforts to combat the virus, we became increasingly comfortable adding risk, but remained focused on issuers we felt could navigate sustained economic uncertainty.
Later in the period, continued Fed support, the likelihood of additional fiscal stimulus, and vaccine developments that could advance the pace of reopening the U.S. economy in 2021, led us to rotate some of our investment-grade exposure to the higher-rated segments of the high-yield corporate market, which had underperformed investment grade earlier in the period. We also established an allocation to Treasury Inflation-Protected Securities (TIPS); while not concerned with an outsized jump in inflation, we believe the risk of inflation is now skewed to the upside. Many of these positioning shifts were funded by moving further underweight in agency mortgage-backed securities (MBS), which in our view had lower return opportunities.
The Portfolio closed 2020 materially overweight corporate and securitized credit, with approximately 15% in high-yield corporate bonds, while maintaining an underweight to both Treasuries and MBS. However, late in the calendar year, as spreads in corporate bond markets narrowed, we trimmed some of our strongest-performing positions to capture gains. The ability to dynamically adjust the Portfolio as market conditions and the economic outlook evolved drove relative outperformance, and both asset allocation and security selection contributed positively to results. No asset class materially detracted, although the Portfolio’s positioning in certain cyclical sectors such as metals and mining and midstream energy weighed modestly on relative returns.
DERIVATIVES USAGE
Please see the Derivative Instruments section in the “Notes to Financial Statements” for a discussion of derivatives used by the Fund.
Janus Aspen Series | 1 |
Janus Henderson VIT Flexible Bond Portfolio (unaudited)
OUTLOOK
We remain positive on the outlook for credit markets, believing it is appropriate to look past the continued near-term headwinds from elevated COVID-19 cases. Both the economic recovery and the credit repair cycle are in early innings, and this phase of the cycle has historically been positive for returns across spread product sectors. In 2021, we expect a robust recovery in economic activity to result in strong corporate earnings growth and a healthy consumer, aided by a recovery in employment and continued government support.
With government bond yields near historic lows across the developed world, we expect areas that still offer yield to remain in demand, benefiting credit markets across the various asset classes and the ratings spectrum. But it is important to take note of where the markets ended the year. The sharp drop in government bond yields in the first quarter of 2020 followed by a very strong recovery in credit spreads has resulted in less attractive valuations across U.S. Treasuries and much of the recovery already priced into the highest-quality corporate bonds. In our view, it is the more credit sensitive parts of the market, including the lowest tier of investment grade as well as high yield, that still provide opportunities for active managers to identify attractive risk-adjusted securities.
We expect front-end Treasury yields to remain anchored in 2021 as a result of the Fed’s commitment to ensuring a sustained economic recovery through accommodative monetary policy. But we remain mindful that the risk is more skewed to higher interest rates across the intermediate and long end of the yield curve, driven by the economic recovery and higher inflation expectations. We anticipate navigating the interest rate environment will be a key driver of the strategy’s performance in the year ahead.
2020 was unique and difficult in many ways. However, the volatility offered significant opportunities to demonstrate the value of active management, and the benefits possible for managers with both the flexibility to take significant positions relative to the benchmark and the conviction to take advantage of it. We anticipate index returns will be more modest in 2021, bond market volatility more subdued, and thus believe the opportunity to add incremental returns through active sector and security selection will be paramount.
Thank you for your investment in Janus Henderson VIT Flexible Bond Portfolio.
2 | DECEMBER 31, 2020 |
Janus Henderson VIT Flexible Bond Portfolio (unaudited)
Portfolio At A Glance
December 31, 2020
Fund Profile |
|
|
30-day Current Yield* | Without
| With
|
Institutional Shares | 1.11% | 1.13% |
Service Shares | 0.88% | 0.90% |
Weighted Average Maturity | 8.34 Years | |
Average Effective Duration** | 6.40 Years | |
* Yield will fluctuate. |
|
|
** A theoretical measure of price volatility. |
| |
Ratings† Summary - (% of Total Investments) |
|
AAA | 1.5% |
AA | 29.6% |
A | 7.0% |
BBB | 37.0% |
BB | 11.7% |
B | 2.9% |
Not Rated | 8.8% |
Other | 1.5% |
† Credit ratings provided by Standard & Poor's (S&P), an independent credit rating agency. Credit ratings range from AAA (highest) to D (lowest) based on S&P's measures. Further information on S&P's rating methodology may be found at www.standardandpoors.com. Other rating agencies may rate the same securities differently. Ratings are relative and subjective and are not absolute standards of quality. Credit quality does not remove market risk and is subject to change. "Not Rated" securities are not rated by S&P, but may be rated by other rating agencies and do not necessarily indicate low quality. "Other" includes cash equivalents, equity securities, and certain derivative instruments. | |
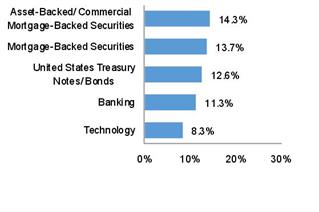
Asset Allocation - (% of Net Assets) | |||||
Corporate Bonds | 53.9% | ||||
Asset-Backed/Commercial Mortgage-Backed Securities | 14.3% | ||||
Mortgage-Backed Securities | 13.7% | ||||
United States Treasury Notes/Bonds | 12.6% | ||||
Investment Companies | 5.3% | ||||
Inflation-Indexed Bonds | 3.0% | ||||
Preferred Stocks | 0.7% | ||||
Bank Loans and Mezzanine Loans | 0.4% | ||||
Investments Purchased with Cash Collateral from Securities Lending | 0.0% | ||||
Other | (3.9)% | ||||
100.0% | |||||
Janus Aspen Series | 3 |
Janus Henderson VIT Flexible Bond Portfolio (unaudited)
Performance
See important disclosures on the next page. |
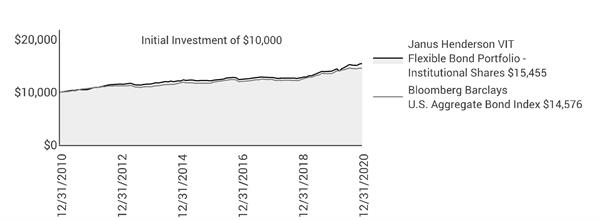
|
|
|
|
|
|
|
|
|
| |
|
|
|
|
|
|
|
|
|
| |
Average Annual Total Return - for the periods ended December 31, 2020 |
|
| Expense Ratios | |||||||
|
| One
| Five | Ten
| Since |
|
| Total
Annual Fund | Net Annual Fund
| |
Institutional Shares |
| 10.48% | 4.94% | 4.45% | 6.32% |
|
| 0.60% | 0.57% | |
Service Shares |
| 10.25% | 4.67% | 4.19% | 6.09% |
|
| 0.85% | 0.82% | |
Bloomberg Barclays U.S. Aggregate Bond Index |
| 7.51% | 4.44% | 3.84% | 5.23% |
|
|
|
| |
Morningstar Quartile - Institutional Shares |
| 1st | 2nd | 2nd | 1st |
|
|
|
| |
Morningstar Ranking - based on total returns for Intermediate Core - Plus Bond Funds |
| 88/613 | 255/537 | 181/481 | 7/185 |
|
|
|
| |
Returns quoted are past performance and do not guarantee future results; current performance may be lower or higher. Investment returns and principal value will vary; there may be a gain or loss when shares are sold. For the most recent month-end performance call 800.668.0434 or visit janushenderson.com/VITperformance.
Net expense ratios reflect the expense waiver, if any, contractually agreed to for at least a one-year period commencing on April 29, 2020.
Performance may be affected by risks that include those associated with foreign and emerging markets, fixed income securities, high-yield and high-risk securities, undervalued, overlooked and smaller capitalization companies, real estate related securities including Real Estate Investment Trusts (REITs), non-diversification, portfolio turnover, derivatives, short sales, initial public offerings (IPOs) and potential conflicts of interest. Each product has different risks. Please see the prospectus for more information about risks, holdings and other details.
Returns do not reflect the deduction of fees, charges or expenses of any insurance product or qualified plan. If applied, returns would have been lower.
Returns include reinvestment of all dividends and distributions and do not reflect the deduction of taxes that a shareholder would pay on Portfolio distributions or redemptions of Portfolio shares. The returns do not include adjustments in accordance with generally accepted accounting principles required at the period end for financial reporting purposes.
Performance for Service Shares prior to December 31, 1999 reflects the performance of Institutional Shares, adjusted to reflect the expenses of Service Shares.
Ranking is for the share class shown only; other classes may have different performance characteristics. When an expense waiver is in effect, it may have a material effect on the total return, and therefore the ranking for the period.
© 2020 Morningstar, Inc. All Rights Reserved.
There is no assurance that the investment process will consistently lead to successful investing.
See Notes to Schedule of Investments and Other Information for indexfor index definitions.
4 | DECEMBER 31, 2020 |
Janus Henderson VIT Flexible Bond Portfolio (unaudited)
Performance
Index performance does not reflect the expenses of managing a portfolio as an index is unmanaged and not available for direct investment.
See “Useful Information About Your Portfolio Report.”
Effective February 1, 2020, Michael Keough and Greg Wilensky are Co-Portfolio Managers of the Portfolio.
*The Portfolio’s inception date – September 13, 1993
‡ As stated in the prospectus. See Financial Highlights for actual expense ratios during the reporting period.
Janus Aspen Series | 5 |
Janus Henderson VIT Flexible Bond Portfolio (unaudited)
Expense Examples
As a shareholder of the Portfolio, you incur two types of costs: (1) transaction costs and (2) ongoing costs, including management fees; 12b-1 distribution and shareholder servicing fees (applicable to Service Shares only); transfer agent fees and expenses payable pursuant to the Transfer Agency Agreement; and other Portfolio expenses. This example is intended to help you understand your ongoing costs (in dollars) of investing in the Portfolio and to compare these costs with the ongoing costs of investing in other mutual funds. To do so, compare this 5% hypothetical example with the 5% hypothetical examples that appear in the shareholder reports of the other funds. The example is based upon an investment of $1,000 invested at the beginning of the period and held for the six-months indicated, unless noted otherwise in the table and footnotes below.
Actual Expenses
The information in the table under the heading “Actual” provides information about actual account values and actual expenses. You may use the information in these columns, together with the amount you invested, to estimate the expenses that you paid over the period. Simply divide your account value by $1,000 (for example, an $8,600 account value divided by $1,000 = 8.6), then multiply the result by the number in the appropriate column for your share class under the heading entitled “Expenses Paid During Period” to estimate the expenses you paid on your account during the period.
Hypothetical Example for Comparison Purposes
The information in the table under the heading “Hypothetical (5% return before expenses)” provides information about hypothetical account values and hypothetical expenses based upon the Portfolio’s actual expense ratio and an assumed rate of return of 5% per year before expenses, which is not the Portfolio’s actual return. The hypothetical account values and expenses may not be used to estimate the actual ending account balance or expenses you paid for the period. You may use this information to compare the ongoing costs of investing in the Portfolio and other funds. To do so, compare this 5% hypothetical example with the 5% hypothetical examples that appear in the shareholder reports of the other funds. Additionally, for an analysis of the fees associated with an investment in either share class or other similar funds, please visit www.finra.org/fundanalyzer.
Please note that the expenses shown in the table are meant to highlight your ongoing costs only and do not reflect any transaction costs, such as any charges at the separate account level or contract level. These fees are fully described in the Portfolio’s prospectuses. Therefore, the hypothetical examples are useful in comparing ongoing costs only, and will not help you determine the relative total costs of owning different funds. In addition, if these transaction costs were included, your costs would have been higher.
|
|
|
|
|
|
|
|
| ||
|
|
| Actual |
| Hypothetical
|
| ||||
| Beginning | Ending | Expenses |
| Beginning | Ending | Expenses | Net Annualized | ||
Institutional Shares | $1,000.00 | $1,035.20 | $2.97 |
| $1,000.00 | $1,022.22 | $2.95 | 0.58% | ||
Service Shares | $1,000.00 | $1,034.00 | $4.29 |
| $1,000.00 | $1,020.91 | $4.27 | 0.84% | ||
† | Expenses Paid During Period are equal to the Net Annualized Expense Ratio multiplied by the average account value over the period, multiplied by 184/366 (to reflect the one-half year period). Expenses in the examples include the effect of applicable fee waivers and/or expense reimbursements, if any. Had such waivers and/or reimbursements not been in effect, your expenses would have been higher. Please refer to the Notes to Financial Statements or the Portfolio’s prospectuses for more information regarding waivers and/or reimbursements. | |||||||||
6 | DECEMBER 31, 2020 |
Janus Henderson VIT Flexible Bond Portfolio
Schedule of Investments
December 31, 2020
Shares
or | Value | ||||||
Asset-Backed/Commercial Mortgage-Backed Securities– 14.3% | |||||||
208 Park Avenue Mortgage Trust 2017-280P, | |||||||
ICE LIBOR USD 1 Month + 0.8800%, 1.0386%, 9/15/34 (144A)‡ | $629,029 | $629,242 | |||||
Angel Oak Mortgage Trust I LLC 2018-2, | |||||||
ICE LIBOR USD 12 Month + 0.7600%, 3.6740%, 7/27/48 (144A)‡ | 131,341 | 132,657 | |||||
Angel Oak Mortgage Trust I LLC 2019-5, 2.5930%, 10/25/49 (144A)‡ | 446,649 | 452,304 | |||||
Angel Oak Mortgage Trust I LLC 2019-6, | |||||||
ICE LIBOR USD 12 Month + 0.9500%, 2.6200%, 11/25/59 (144A)‡ | 412,254 | 417,452 | |||||
Angel Oak Mortgage Trust I LLC 2020-3, | |||||||
ICE LIBOR USD 12 Month + 1.0000%, 2.4100%, 4/25/65 (144A)‡ | 656,237 | 662,558 | |||||
Angel Oak Mortgage Trust I LLC2020-2, | |||||||
ICE LIBOR USD 12 Month + 2.2000%, 2.5310%, 1/26/65 (144A)‡ | 693,328 | 710,668 | |||||
Applebee's Funding LLC / IHOP Funding LLC, 4.1940%, 6/7/49 (144A) | 1,226,925 | 1,200,788 | |||||
Arbys Funding LLC 2020-1A, 3.2370%, 7/30/50 (144A) | 1,800,488 | 1,832,503 | |||||
Arroyo Mortgage Trust 2018-1, | |||||||
ICE LIBOR USD 12 Month + 0.8500%, 3.7630%, 4/25/48 (144A)‡ | 295,980 | 299,030 | |||||
Bank 2018-BN12 A4, 4.2550%, 5/15/61‡ | 260,123 | 309,090 | |||||
Bank 2019-BN17, 3.7140%, 4/15/52 | 569,676 | 663,854 | |||||
Bank 2019-BN18, 3.5840%, 5/15/62 | 978,130 | 1,133,353 | |||||
Bank 2019-BN20, 3.0110%, 9/15/62 | 466,163 | 520,724 | |||||
Bank 2019-BN23, 2.9200%, 12/15/52 | 838,600 | 932,204 | |||||
Bank 2019-BNK24, 2.9600%, 11/15/62 | 236,800 | 264,276 | |||||
Barclays Comercial Mortgage Securities LLC 2015-SRCH, | |||||||
4.1970%, 8/10/35 (144A) | 1,447,000 | 1,652,423 | |||||
Barclays Comercial Mortgage Securities LLC 2017-DELC, | |||||||
ICE LIBOR USD 1 Month + 0.8500%, 1.0086%, 8/15/36 (144A)‡ | 443,000 | 438,042 | |||||
Benchmark Mortgage Trust 2020-B16, 2.7320%, 2/15/53 | 565,000 | 620,476 | |||||
BVRT Financing Trust, 7/10/32‡ | 543,000 | 543,000 | |||||
BX Commercial Mortgage Trust 2018-IND, | |||||||
ICE LIBOR USD 1 Month + 0.7500%, 0.9090%, 11/15/35 (144A)‡ | 908,804 | 908,473 | |||||
BX Commercial Mortgage Trust 2019-XL, | |||||||
ICE LIBOR USD 1 Month + 0.9200%, 1.0790%, 10/15/36 (144A)‡ | 1,312,879 | 1,315,404 | |||||
BX Commercial Mortgage Trust 2019-XL, | |||||||
ICE LIBOR USD 1 Month + 1.0800%, 1.2390%, 10/15/36 (144A)‡ | 218,338 | 218,320 | |||||
BX Commercial Mortgage Trust 2020-FOX A, | |||||||
ICE LIBOR USD 1 Month + 1.0000%, 1.1590%, 11/15/32 (144A)‡ | 1,788,000 | 1,790,770 | |||||
BX Commercial Mortgage Trust 2020-FOX B, | |||||||
ICE LIBOR USD 1 Month + 1.3500%, 1.5090%, 11/15/32 (144A)‡ | 320,000 | 320,781 | |||||
BX Commercial Mortgage Trust 2020-FOX C, | |||||||
ICE LIBOR USD 1 Month + 1.5500%, 1.7090%, 11/15/32 (144A)‡ | 320,000 | 320,796 | |||||
BX Trust 2019-OC11, 3.2020%, 12/9/41 (144A) | 1,227,000 | 1,346,607 | |||||
BX Trust 2019-OC11, 3.6050%, 12/9/41 (144A) | 614,000 | 675,882 | |||||
BX Trust 2019-OC11, 3.8560%, 12/9/41 (144A) | 614,000 | 652,967 | |||||
BX Trust 2019-OC11, 4.0755%, 12/9/41 (144A)‡ | 920,000 | 959,873 | |||||
BX Trust 2019-OC11, 4.0755%, 12/9/41 (144A)‡ | 234,000 | 233,526 | |||||
BXP Trust 2017-GM, 3.3790%, 6/13/39 (144A) | 696,000 | 776,237 | |||||
Chase Home Lending Mortgage Trust 2019-ATR2, | |||||||
ICE LIBOR USD 1 Month + 0.9000%, 1.0480%, 7/25/49 (144A)‡ | 120,791 | 120,785 | |||||
Cold Storage Trust 2020-ICE5 A, | |||||||
ICE LIBOR USD 1 Month + 0.9000%, 1.0586%, 11/15/37 (144A)‡ | 1,771,000 | 1,771,191 | |||||
Cold Storage Trust 2020-ICE5 B, | |||||||
ICE LIBOR USD 1 Month + 1.3000%, 1.4586%, 11/15/37 (144A)‡ | 788,000 | 788,391 | |||||
Cold Storage Trust 2020-ICE5 C, | |||||||
ICE LIBOR USD 1 Month + 1.6500%, 1.8086%, 11/15/37 (144A)‡ | 791,000 | 791,380 | |||||
COLT Funding LLC 2020-2, | |||||||
ICE LIBOR USD 12 Month + 1.5000%, 1.8530%, 3/25/65 (144A)‡ | 371,631 | 376,013 | |||||
COLT Funding LLC 2020-3, | |||||||
ICE LIBOR USD 12 Month + 1.2000%, 1.5060%, 4/27/65 (144A)‡ | 378,238 | 378,895 | |||||
Connecticut Avenue Securities Trust 2014-C04, | |||||||
ICE LIBOR USD 1 Month + 4.9000%, 5.0480%, 11/25/24‡ | 87,276 | 89,574 | |||||
See Notes to Schedule of Investments and Other Information and Notes to Financial Statements. | |
Janus Aspen Series | 7 |
Janus Henderson VIT Flexible Bond Portfolio
Schedule of Investments
December 31, 2020
Shares
or | Value | ||||||
Asset-Backed/Commercial Mortgage-Backed Securities– (continued) | |||||||
Connecticut Avenue Securities Trust 2016-C03, | |||||||
ICE LIBOR USD 1 Month + 5.9000%, 6.0480%, 10/25/28‡ | $143,387 | $150,194 | |||||
Connecticut Avenue Securities Trust 2016-C04, | |||||||
ICE LIBOR USD 1 Month + 4.2500%, 4.3980%, 1/25/29‡ | 354,345 | 366,664 | |||||
Connecticut Avenue Securities Trust 2016-C06 1M2, | |||||||
ICE LIBOR USD 1 Month + 4.2500%, 4.3980%, 4/25/29‡ | 402,521 | 412,544 | |||||
Connecticut Avenue Securities Trust 2017-C01, | |||||||
ICE LIBOR USD 1 Month + 3.5500%, 3.6980%, 7/25/29‡ | 627,218 | 645,886 | |||||
Connecticut Avenue Securities Trust 2018-C05, | |||||||
ICE LIBOR USD 1 Month + 2.3500%, 2.4980%, 1/25/31‡ | 666,502 | 665,855 | |||||
Connecticut Avenue Securities Trust 2018-R07, | |||||||
ICE LIBOR USD 1 Month + 2.4000%, 2.5480%, 4/25/31 (144A)‡ | 313,500 | 313,175 | |||||
Connecticut Avenue Securities Trust 2019-R02, | |||||||
ICE LIBOR USD 1 Month + 2.3000%, 2.4480%, 8/25/31 (144A)‡ | 360,165 | 359,264 | |||||
Connecticut Avenue Securities Trust 2019-R03, | |||||||
ICE LIBOR USD 1 Month + 2.1500%, 2.2980%, 9/25/31 (144A)‡ | 936,890 | 933,981 | |||||
Connecticut Avenue Securities Trust 2019-R04, | |||||||
ICE LIBOR USD 1 Month + 2.1000%, 2.2480%, 6/25/39 (144A)‡ | 926,894 | 924,020 | |||||
Connecticut Avenue Securities Trust 2019-R05, | |||||||
ICE LIBOR USD 1 Month + 2.0000%, 2.1480%, 7/25/39 (144A)‡ | 926,456 | 923,352 | |||||
Connecticut Avenue Securities Trust 2019-R06, | |||||||
ICE LIBOR USD 1 Month + 2.1000%, 2.2480%, 9/25/39 (144A)‡ | 699,199 | 697,809 | |||||
Connecticut Avenue Securities Trust 2019-R07, | |||||||
ICE LIBOR USD 1 Month + 2.1000%, 2.2480%, 10/25/39 (144A)‡ | 1,212,790 | 1,208,673 | |||||
Connecticut Avenue Securities Trust 2020-R01, | |||||||
ICE LIBOR USD 1 Month + 0.8000%, 0.9480%, 1/25/40 (144A)‡ | 141,481 | 141,524 | |||||
Connecticut Avenue Securities Trust 2020-R01 1M2, | |||||||
ICE LIBOR USD 1 Month + 2.0500%, 2.1980%, 1/25/40 (144A)‡ | 720,557 | 716,078 | |||||
Connecticut Avenue Securities Trust 2020-R02, | |||||||
ICE LIBOR USD 1 Month + 2.0000%, 2.1480%, 1/25/40 (144A)‡ | 1,522,717 | 1,512,015 | |||||
Cosmopolitan Hotel Trust 2017, | |||||||
ICE LIBOR USD 1 Month + 0.9300%, 1.0886%, 11/15/36 (144A)‡ | 552,036 | 545,834 | |||||
Credit Acceptance Auto Loan Trust 2018-2, 3.9400%, 7/15/27 (144A) | 563,000 | 575,661 | |||||
Credit Suisse Commercial Mortgage Trust 2019-ICE4, | |||||||
ICE LIBOR USD 1 Month + 0.9800%, 1.1390%, 5/15/36 (144A)‡ | 1,570,000 | 1,570,605 | |||||
Credit Suisse Commercial Mortgage Trust 2019-ICE4 C, | |||||||
ICE LIBOR USD 1 Month + 1.4300%, 1.5890%, 5/15/36 (144A)‡ | 831,000 | 829,965 | |||||
Credit Suisse Commercial Mortgage Trust 2020-UNFI, 4.1682%, 12/6/22‡ | 453,000 | 455,984 | |||||
DB Master Finance LLC 2019-1A A23, 4.3520%, 5/20/49 (144A) | 459,188 | 499,338 | |||||
DB Master Finance LLC 2019-1A A2I, 3.7870%, 5/20/49 (144A) | 573,738 | 593,818 | |||||
DB Master Finance LLC 2019-1A A2II, 4.0210%, 5/20/49 (144A) | 232,063 | 245,615 | |||||
Domino's Pizza Master Issuer LLC, 3.0820%, 7/25/47 (144A) | 229,890 | 232,685 | |||||
Domino's Pizza Master Issuer LLC, 4.1180%, 7/25/47 (144A) | 360,840 | 386,413 | |||||
Domino's Pizza Master Issuer LLC, 4.1160%, 7/25/48 (144A) | 1,068,408 | 1,132,002 | |||||
Domino's Pizza Master Issuer LLC, 4.3280%, 7/25/48 (144A) | 555,220 | 602,964 | |||||
Domino's Pizza Master Issuer LLC, 3.6680%, 10/25/49 (144A) | 1,985,940 | 2,102,967 | |||||
Drive Auto Receivables Trust 2017-1, 5.1700%, 9/16/24 | 1,590,000 | 1,642,005 | |||||
Drive Auto Receivables Trust 2017-2, 5.2700%, 11/15/24 | 1,400,000 | 1,455,921 | |||||
Drive Auto Receivables Trust 2017-3, 3.5300%, 12/15/23 (144A) | 105,138 | 106,703 | |||||
Drive Auto Receivables Trust 2017-A, 4.1600%, 5/15/24 (144A) | 277,026 | 280,364 | |||||
Exeter Automobile Receivables Trust 2018-1A C, 3.0300%, 1/17/23 (144A) | 186,823 | 187,350 | |||||
Fannie Mae Connecticut Avenue Securities, | |||||||
ICE LIBOR USD 1 Month + 5.0000%, 5.1480%, 7/25/25‡ | 533,224 | 539,016 | |||||
Fannie Mae Connecticut Avenue Securities, | |||||||
ICE LIBOR USD 1 Month + 5.7000%, 5.8480%, 4/25/28‡ | 312,130 | 326,134 | |||||
Fannie Mae Connecticut Avenue Securities, | |||||||
ICE LIBOR USD 1 Month + 2.0000%, 2.1480%, 3/25/31‡ | 1,004,306 | 994,100 | |||||
Fannie Mae REMICS, 3.0000%, 5/25/48 | 1,612,923 | 1,731,793 | |||||
Fannie Mae REMICS, 3.0000%, 11/25/49 | 1,962,394 | 2,094,098 | |||||
See Notes to Schedule of Investments and Other Information and Notes to Financial Statements. | |
8 | DECEMBER 31, 2020 |
Janus Henderson VIT Flexible Bond Portfolio
Schedule of Investments
December 31, 2020
Shares
or | Value | ||||||
Asset-Backed/Commercial Mortgage-Backed Securities– (continued) | |||||||
Freddie Mac Structured Agency Credit Risk Debt Notes 2016-DNA1 M3, | |||||||
ICE LIBOR USD 1 Month + 5.5500%, 5.7001%, 7/25/28‡ | $383,624 | $399,567 | |||||
Freddie Mac Structured Agency Credit Risk Debt Notes 2019-DNA4 M2, | |||||||
ICE LIBOR USD 1 Month + 1.9500%, 2.0980%, 10/25/49 (144A)‡ | 231,899 | 230,749 | |||||
Freddie Mac Structured Agency Credit Risk Debt Notes 2020-DNA1 M2, | |||||||
ICE LIBOR USD 1 Month + 1.7000%, 1.8480%, 1/25/50 (144A)‡ | 1,014,000 | 1,006,413 | |||||
Freddie Mac Structured Agency Credit Risk Debt Notes 2020-DNA3 M2, | |||||||
ICE LIBOR USD 1 Month + 3.0000%, 3.1480%, 6/25/50 (144A)‡ | 448,516 | 451,973 | |||||
Freddie Mac Structured Agency Credit Risk Debt Notes 2020-DNA6 M2, | |||||||
US 30 Day Average SOFR + 2.0000%, 2.0773%, 12/25/50 (144A)‡ | 910,000 | 908,544 | |||||
Freddie Mac Structured Agency Credit Risk Debt Notes 2020-HQA4 M2, | |||||||
ICE LIBOR USD 1 Month + 3.1500%, 3.2980%, 9/25/50 (144A)‡ | 500,000 | 504,592 | |||||
Freddie Mac Structured Agency Credit Risk Debt Notes 2020-HQA5 M2, | |||||||
US 30 Day Average SOFR + 2.6000%, 2.6817%, 11/25/50 (144A)‡ | 1,481,000 | 1,485,649 | |||||
Great Wolf Trust, | |||||||
ICE LIBOR USD 1 Month + 1.0340%, 1.1930%, 12/15/36 (144A)‡ | 293,000 | 286,802 | |||||
Great Wolf Trust, | |||||||
ICE LIBOR USD 1 Month + 1.3340%, 1.4930%, 12/15/36 (144A)‡ | 328,000 | 308,329 | |||||
Great Wolf Trust, | |||||||
ICE LIBOR USD 1 Month + 1.6330%, 1.7920%, 12/15/36 (144A)‡ | 365,000 | 339,916 | |||||
GS Mortgage Securities Trust 2018-GS10, 4.1550%, 7/10/51‡ | 371,605 | 443,271 | |||||
GS Mortgage Securities Trust 2018-GS9, 3.9920%, 3/10/51‡ | 618,450 | 724,103 | |||||
GS Mortgage Securities Trust 2020-GC45, 2.9106%, 2/13/53 | 580,000 | 645,066 | |||||
GS Mortgage Securities Trust 2020-GC47, 2.3772%, 5/12/53 | 663,000 | 708,637 | |||||
Jack in the Box Funding LLC 2019-1A A23, 4.9700%, 8/25/49 (144A) | 1,182,068 | 1,270,722 | |||||
Jack in the Box Funding LLC 2019-1A A2I, 3.9820%, 8/25/49 (144A) | 1,182,068 | 1,208,870 | |||||
Jack in the Box Funding LLC 2019-1A A2II, 4.4760%, 8/25/49 (144A) | 1,182,068 | 1,238,032 | |||||
JP Morgan Mortgage Trust 2019-LTV2, | |||||||
ICE LIBOR USD 1 Month + 0.9000%, 1.0480%, 12/25/49 (144A)‡ | 294,623 | 294,930 | |||||
Morgan Stanley Capital I Trust 2016-UB11, 2.7820%, 8/15/49 | 594,000 | 643,446 | |||||
Morgan Stanley Capital I Trust 2019-H6, 3.4170%, 6/15/52 | 324,754 | 371,076 | |||||
Morgan Stanley Capital I Trust 2015-UBS8, 3.8090%, 12/15/48 | 447,000 | 501,379 | |||||
Morgan Stanley Capital I Trust 2018-H3, 4.1770%, 7/15/51 | 590,372 | 701,301 | |||||
Morgan Stanley Capital I Trust 2018-H4, 4.3100%, 12/15/51 | 883,008 | 1,056,639 | |||||
New Residential Mortgage Loan Trust 2018-2, | |||||||
ICE LIBOR USD 6 Month + 0.6800%, 4.5000%, 2/25/58 (144A)‡ | 408,449 | 438,590 | |||||
NRZ Excess Spread Collateralized Notes 2020-PLS1 A, | |||||||
3.8440%, 12/25/25 (144A) | 419,000 | 418,999 | |||||
Oak Street Investment Grade Net Lease Fund 2020-1A A1, | |||||||
1.8500%, 11/20/50 (144A) | 770,878 | 770,667 | |||||
Oak Street Investment Grade Net Lease Fund 2020-1A A5, | |||||||
3.3900%, 11/20/50 (144A) | 1,082,000 | 1,080,409 | |||||
OneMain Direct Auto Receivables Trust 2018-1, 3.8500%, 10/14/25 (144A) | 254,000 | 263,809 | |||||
OneMain Direct Auto Receivables Trust 2018-1, 4.4000%, 1/14/28 (144A) | 252,000 | 262,756 | |||||
Planet Fitness Master Issuer LLC 2018-1A, 4.2620%, 9/5/48 (144A) | 554,243 | 553,872 | |||||
Planet Fitness Master Issuer LLC 2019-1A, 3.8580%, 12/5/49 (144A) | 949,410 | 923,643 | |||||
Preston Ridge Partners Mortgage Trust 2019-3A, 3.3510%, 7/25/24 (144A)Ç | 367,233 | 368,491 | |||||
Preston Ridge Partners Mortgage Trust 2019-4A, 3.3510%, 11/25/24 (144A)Ç | 611,859 | 612,655 | |||||
Preston Ridge Partners Mortgage Trust 2020-1A, 2.9810%, 2/25/25 (144A)Ç | 246,769 | 247,216 | |||||
Preston Ridge Partners Mortgage Trust 2020-2, 3.6710%, 8/25/25 (144A)Ç | 404,113 | 405,598 | |||||
Preston Ridge Partners Mortgage Trust 2020-3, 2.8570%, 9/25/25 (144A)Ç | 1,192,006 | 1,198,252 | |||||
Preston Ridge Partners Mortgage Trust 2020-4 A1, 2.9510%, 10/25/25 (144A)Ç | 725,602 | 725,798 | |||||
Preston Ridge Partners Mortgage Trust 2020-5 A1, 3.1040%, 11/25/25 (144A)Ç | 392,493 | 393,145 | |||||
Santander Drive Auto Receivables Trust 2016-3, 4.2900%, 2/15/24 | 1,868,000 | 1,880,004 | |||||
Sequoia Mortgage Trust 2013-5, 2.5000%, 5/25/43 (144A)‡ | 228,707 | 237,021 | |||||
Spruce Hill Mortgage Loan Trust 2020-SH1 A1, | |||||||
ICE LIBOR USD 12 Month + 0.9500%, 2.5210%, 1/28/50 (144A)‡ | 155,534 | 170,169 | |||||
Spruce Hill Mortgage Loan Trust 2020-SH1 A2, | |||||||
ICE LIBOR USD 12 Month + 1.0500%, 2.6240%, 1/28/50 (144A)‡ | 308,548 | 336,079 | |||||
Spruce Hill Mortgage Loan Trust 2020-SH2, 3.4070%, 6/25/55 (144A)‡ | 1,116,948 | 1,236,981 | |||||
See Notes to Schedule of Investments and Other Information and Notes to Financial Statements. | |
Janus Aspen Series | 9 |
Janus Henderson VIT Flexible Bond Portfolio
Schedule of Investments
December 31, 2020
Shares
or | Value | ||||||
Asset-Backed/Commercial Mortgage-Backed Securities– (continued) | |||||||
Starwood Mortgage Residential Trust 2020-2, 2.7180%, 4/25/60 (144A)‡ | $335,888 | $340,467 | |||||
Taco Bell Funding LLC, 4.3180%, 11/25/48 (144A) | 597,800 | 607,254 | |||||
Taco Bell Funding LLC, 4.9400%, 11/25/48 (144A) | 508,620 | 558,191 | |||||
Towd Point Asset Funding LLC 2019-HE1 A1, | |||||||
ICE LIBOR USD 1 Month + 0.9000%, 1.0480%, 4/25/48 (144A)‡ | 534,546 | 532,610 | |||||
Vantage Data Centers LLC 2020-1A A2, 1.6450%, 9/15/45 (144A) | 1,453,000 | 1,454,450 | |||||
Vantage Data Centers LLC 2020-2A A2, 1.9920%, 9/15/45 (144A) | 634,000 | 634,904 | |||||
VCAT Asset Securitization LLC 2020-NPL1, 3.6710%, 8/25/50 (144A)Ç | 423,606 | 423,601 | |||||
Wendy's Funding LLC, 3.5730%, 3/15/48 (144A) | 385,090 | 398,169 | |||||
Wendy's Funding LLC, 3.8840%, 3/15/48 (144A) | 104,760 | 110,501 | |||||
Wendy's Funding LLC, 3.7830%, 6/15/49 (144A) | 558,735 | 585,323 | |||||
WFRBS Commercial Mortgage Trust 2014-C25, 3.6310%, 11/15/47 | 501,000 | 554,274 | |||||
Wingstop Funding LLC 2020-1A A2, 2.8410%, 12/5/50 (144A) | 915,000 | 930,738 | |||||
Total Asset-Backed/Commercial Mortgage-Backed Securities (cost $89,419,470) | 91,737,520 | ||||||
Bank Loans and Mezzanine Loans– 0.4% | |||||||
Consumer Non-Cyclical – 0.4% | |||||||
Elanco Animal Health Inc, ICE LIBOR USD 1 Month + 1.7500%, 1.9048%, 8/1/27‡((cost $2,491,545) | 2,491,545 | 2,473,484 | |||||
Corporate Bonds– 53.9% | |||||||
Banking – 11.3% | |||||||
Banco Santander SA, 2.7490%, 12/3/30 | 1,800,000 | 1,857,718 | |||||
Bank of America Corp, ICE LIBOR USD 3 Month + 1.0600%, 3.5590%, 4/23/27‡ | 2,694,000 | 3,041,103 | |||||
Bank of America Corp, ICE LIBOR USD 3 Month + 1.5120%, 3.7050%, 4/24/28‡ | 2,482,000 | 2,824,585 | |||||
Bank of America Corp, SOFR + 2.1500%, 2.5920%, 4/29/31‡ | 1,748,000 | 1,873,141 | |||||
Bank of America Corp, ICE LIBOR USD 3 Month + 3.1350%, 5.2000%‡,µ | 522,000 | 544,185 | |||||
Bank of America Corp, ICE LIBOR USD 3 Month + 3.7050%, 6.2500%‡,µ | 1,230,000 | 1,364,762 | |||||
Bank of America Corp, ICE LIBOR USD 3 Month + 3.8980%, 6.1000%‡,µ | 538,000 | 609,581 | |||||
Bank of America Corp, ICE LIBOR USD 3 Month + 2.6640%, 4.3000%, 1/24/70‡ | 1,160,000 | 1,196,030 | |||||
Bank of New York Mellon Corp, | |||||||
US Treasury Yield Curve Rate 5 Year + 4.3580%, 4.7000%‡,µ | 2,095,000 | 2,310,366 | |||||
BNP Paribas SA, ICE LIBOR USD 3 Month + 2.2350%, 4.7050%, 1/10/25 (144A)‡ | 835,000 | 927,917 | |||||
BNP Paribas SA, ICE LIBOR USD 3 Month + 1.1110%, 2.8190%, 11/19/25 (144A)‡ | 567,000 | 605,767 | |||||
BNP Paribas SA, SOFR + 1.5070%, 3.0520%, 1/13/31 (144A)‡ | 1,564,000 | 1,705,780 | |||||
BNP Paribas SA, | |||||||
US Treasury Yield Curve Rate 5 Year + 2.0500%, 2.5880%, 8/12/35 (144A)‡ | 2,312,000 | 2,362,285 | |||||
Citigroup Inc, ICE LIBOR USD 3 Month + 1.5630%, 3.8870%, 1/10/28‡ | 1,461,000 | 1,678,123 | |||||
Citigroup Inc, SOFR + 1.4220%, 2.9760%, 11/5/30‡ | 535,000 | 588,896 | |||||
Citigroup Inc, ICE LIBOR USD 3 Month + 4.0680%, 5.9500%‡,µ | 1,238,000 | 1,299,404 | |||||
Citigroup Inc, 5.9000%µ | 118,000 | 123,959 | |||||
Citigroup Inc, ICE LIBOR USD 3 Month + 3.4660%, 5.3500%‡,µ | 636,000 | 662,235 | |||||
Citigroup Inc, ICE LIBOR USD 3 Month + 3.4230%, 6.3000%‡,µ | 145,000 | 157,180 | |||||
Citigroup Inc, ICE LIBOR USD 3 Month + 3.9050%, 5.9500%‡,µ | 614,000 | 670,795 | |||||
Citigroup Inc, SOFR + 3.8130%, 5.0000%‡,µ | 661,000 | 687,027 | |||||
Citigroup Inc, SOFR + 3.2340%, 4.7000%‡,µ | 638,000 | 655,602 | |||||
Citizens Financial Group Inc, 2.6380%, 9/30/32 | 2,475,000 | 2,616,608 | |||||
Credit Agricole SA, 4.3750%, 3/17/25 (144A) | 771,000 | 865,344 | |||||
Credit Agricole SA, 3.2500%, 1/14/30 (144A) | 1,673,000 | 1,834,678 | |||||
Credit Agricole SA/London, SOFR + 1.6760%, 1.9070%, 6/16/26 (144A)‡ | 261,000 | 270,655 | |||||
Credit Suisse Group AG, | |||||||
US Treasury Yield Curve Rate 5 Year + 3.5540%, 4.5000% (144A)‡,µ | 2,174,000 | 2,184,653 | |||||
Goldman Sachs Group Inc, 3.5000%, 4/1/25 | 1,682,000 | 1,870,419 | |||||
Goldman Sachs Group Inc, ICE LIBOR USD 3 Month + 3.9220%, 4.1279%‡,µ | 1,846,000 | 1,842,271 | |||||
Goldman Sachs Group Inc, ICE LIBOR USD 3 Month + 2.8740%, 5.0000%‡,#,µ | 193,000 | 194,930 | |||||
Goldman Sachs Group Inc, | |||||||
US Treasury Yield Curve Rate 5 Year + 3.2240%, 4.9500%‡,µ | 435,000 | 460,195 | |||||
HSBC Holdings PLC, SOFR + 1.5380%, 1.6450%, 4/18/26‡ | 1,415,000 | 1,446,919 | |||||
HSBC Holdings PLC, SOFR + 1.2900%, 1.5890%, 5/24/27‡ | 3,499,000 | 3,557,309 | |||||
HSBC Holdings PLC, SOFR + 1.9470%, 2.3570%, 8/18/31‡ | 731,000 | 754,559 | |||||
See Notes to Schedule of Investments and Other Information and Notes to Financial Statements. | |
10 | DECEMBER 31, 2020 |
Janus Henderson VIT Flexible Bond Portfolio
Schedule of Investments
December 31, 2020
Shares
or | Value | ||||||
Corporate Bonds– (continued) | |||||||
Banking– (continued) | |||||||
JPMorgan Chase & Co, SOFR + 1.8500%, 2.0830%, 4/22/26‡ | $1,682,000 | $1,776,052 | |||||
JPMorgan Chase & Co, ICE LIBOR USD 3 Month + 1.2450%, 3.9600%, 1/29/27‡ | 2,982,000 | 3,425,810 | |||||
JPMorgan Chase & Co, SOFR + 2.5150%, 2.9560%, 5/13/31‡ | 3,058,000 | 3,352,288 | |||||
JPMorgan Chase & Co, ICE LIBOR USD 3 Month + 2.5800%, 4.6250%‡,µ | 218,000 | 215,243 | |||||
JPMorgan Chase & Co, SOFR + 3.3800%, 5.0000%, 7/31/69‡ | 522,000 | 549,160 | |||||
JPMorgan Chase & Co, SOFR + 3.1250%, 4.6000%, 1/23/70‡ | 551,000 | 568,908 | |||||
JPMorgan Chase & Co, SOFR + 2.7450%, 4.0000%, 2/24/70‡ | 522,000 | 530,483 | |||||
Morgan Stanley, SOFR + 1.9900%, 2.1880%, 4/28/26‡ | 1,777,000 | 1,876,568 | |||||
Morgan Stanley, 3.9500%, 4/23/27 | 1,799,000 | 2,079,882 | |||||
Morgan Stanley, SOFR + 1.0340%, 1.7940%, 2/13/32‡ | 1,442,000 | 1,450,040 | |||||
Natwest Group PLC, | |||||||
US Treasury Yield Curve Rate 5 Year + 2.3500%, 3.0320%, 11/28/35‡ | 1,418,000 | 1,466,510 | |||||
Societe Generale SA, 2.6250%, 1/22/25 (144A) | 2,037,000 | 2,156,965 | |||||
SVB Financial Group, 3.1250%, 6/5/30 | 3,076,000 | 3,461,529 | |||||
UBS Group AG, | |||||||
US Treasury Yield Curve Rate 1 Year + 1.0800%, 1.3640%, 1/30/27 (144A)‡ | 1,849,000 | 1,869,261 | |||||
Westpac Banking Corp, | |||||||
US Treasury Yield Curve Rate 5 Year + 1.7500%, 2.6680%, 11/15/35‡ | 1,432,000 | 1,475,189 | |||||
Westpac Banking Corp, 2.9630%, 11/16/40 | 425,000 | 451,905 | |||||
72,350,774 | |||||||
Basic Industry – 1.5% | |||||||
Axalta Coating Systems Ltd, 3.3750%, 2/15/29 (144A) | 1,996,000 | 1,996,000 | |||||
Constellium NV, 5.7500%, 5/15/24 (144A) | 847,000 | 864,296 | |||||
Element Solutions Inc, 3.8750%, 9/1/28 (144A) | 1,501,000 | 1,544,154 | |||||
Georgia-Pacific LLC, 3.1630%, 11/15/21 (144A) | 900,000 | 916,855 | |||||
Nutrition & Biosciences Inc, 1.8320%, 10/15/27 (144A) | 1,040,000 | 1,071,428 | |||||
Nutrition & Biosciences Inc, 3.2680%, 11/15/40 (144A) | 381,000 | 408,844 | |||||
Nutrition & Biosciences Inc, 3.4680%, 12/1/50 (144A) | 591,000 | 640,811 | |||||
Reliance Steel & Aluminum Co, 4.5000%, 4/15/23 | 1,847,000 | 1,992,655 | |||||
9,435,043 | |||||||
Brokerage – 1.4% | |||||||
Charles Schwab Corp, | |||||||
US Treasury Yield Curve Rate 5 Year + 4.9710%, 5.3750%‡,µ | 2,750,000 | 3,062,812 | |||||
Charles Schwab Corp, | |||||||
US Treasury Yield Curve Rate 10 Year + 3.0790%, 4.0000%‡,µ | 1,844,000 | 1,940,810 | |||||
Intercontinental Exchange Inc, 2.1000%, 6/15/30 | 1,053,000 | 1,096,204 | |||||
Intercontinental Exchange Inc, 1.8500%, 9/15/32 | 562,000 | 566,220 | |||||
Raymond James Financial Inc, 5.6250%, 4/1/24 | 516,000 | 595,423 | |||||
Raymond James Financial Inc, 4.6500%, 4/1/30 | 185,000 | 226,816 | |||||
Raymond James Financial Inc, 4.9500%, 7/15/46 | 1,132,000 | 1,548,907 | |||||
9,037,192 | |||||||
Capital Goods – 3.6% | |||||||
Avery Dennison Co, 2.6500%, 4/30/30 | 1,690,000 | 1,811,685 | |||||
BAE Systems PLC, 3.4000%, 4/15/30 (144A) | 501,000 | 567,273 | |||||
BAE Systems PLC, 1.9000%, 2/15/31 (144A) | 817,000 | 825,456 | |||||
Bemis Co Inc, 2.6300%, 6/19/30 | 1,599,000 | 1,730,679 | |||||
Boeing Co, 4.5080%, 5/1/23 | 1,379,000 | 1,490,382 | |||||
Boeing Co, 4.8750%, 5/1/25 | 1,023,000 | 1,165,907 | |||||
Boeing Co, 2.7500%, 2/1/26 | 519,000 | 545,631 | |||||
Boeing Co, 2.2500%, 6/15/26 | 291,000 | 298,359 | |||||
Boeing Co, 3.2500%, 2/1/28 | 554,000 | 593,488 | |||||
Boeing Co, 3.6000%, 5/1/34 | 1,447,000 | 1,526,603 | |||||
Boeing Co, 5.7050%, 5/1/40 | 480,000 | 620,694 | |||||
Boeing Co, 5.9300%, 5/1/60 | 288,000 | 407,819 | |||||
General Electric Co, 6.7500%, 3/15/32 | 905,000 | 1,268,124 | |||||
Huntington Ingalls Industries Inc, 3.8440%, 5/1/25 (144A) | 575,000 | 638,806 | |||||
Huntington Ingalls Industries Inc, 4.2000%, 5/1/30 (144A) | 1,276,000 | 1,510,572 | |||||
Northrop Grumman Corp, 4.4000%, 5/1/30 | 634,000 | 786,548 | |||||
United Rentals North America Inc, 3.8750%, 2/15/31 | 413,000 | 433,258 | |||||
See Notes to Schedule of Investments and Other Information and Notes to Financial Statements. | |
Janus Aspen Series | 11 |
Janus Henderson VIT Flexible Bond Portfolio
Schedule of Investments
December 31, 2020
Shares
or | Value | ||||||
Corporate Bonds– (continued) | |||||||
Capital Goods– (continued) | |||||||
Vulcan Materials Co, 3.5000%, 6/1/30 | $608,000 | $697,987 | |||||
Wabtec Corp, 4.4000%, 3/15/24 | 558,000 | 610,575 | |||||
Wabtec Corp, 3.4500%, 11/15/26 | 861,000 | 944,947 | |||||
Wabtec Corp, 4.9500%, 9/15/28 | 2,621,000 | 3,108,300 | |||||
Westinghouse Air Brake Technologies Corp, 3.2000%, 6/15/25 | 1,183,000 | 1,276,039 | |||||
22,859,132 | |||||||
Communications – 5.7% | |||||||
AT&T Inc, 1.6500%, 2/1/28 | 801,000 | 816,885 | |||||
AT&T Inc, 3.5000%, 9/15/53 (144A) | 436,000 | 434,338 | |||||
AT&T Inc, 3.5500%, 9/15/55 (144A) | 625,000 | 621,677 | |||||
CCO Holdings LLC / CCO Holdings Capital Corp, 4.2500%, 2/1/31 (144A) | 1,644,000 | 1,732,546 | |||||
CCO Holdings LLC / CCO Holdings Capital Corp, 4.5000%, 5/1/32 (144A) | 2,596,000 | 2,771,801 | |||||
CenturyLink Inc, 6.4500%, 6/15/21 | 928,000 | 946,755 | |||||
CenturyLink Inc, 5.8000%, 3/15/22 | 516,000 | 537,930 | |||||
Charter Communications Operating LLC / Charter Communications Operating Capital, | |||||||
6.4840%, 10/23/45 | 302,000 | 427,929 | |||||
Charter Communications Operating LLC / Charter Communications Operating Capital, | |||||||
5.3750%, 5/1/47 | 242,000 | 301,595 | |||||
Charter Communications Operating LLC / Charter Communications Operating Capital, | |||||||
4.8000%, 3/1/50 | 1,369,000 | 1,633,469 | |||||
Charter Communications Operating LLC / Charter Communications Operating Capital, | |||||||
3.7000%, 4/1/51 | 613,000 | 635,446 | |||||
Comcast Corp, 3.7500%, 4/1/40 | 184,000 | 221,084 | |||||
Crown Castle International Corp, 3.6500%, 9/1/27 | 653,000 | 736,944 | |||||
Crown Castle International Corp, 4.3000%, 2/15/29 | 807,000 | 958,002 | |||||
Crown Castle International Corp, 3.1000%, 11/15/29 | 1,372,000 | 1,511,041 | |||||
CSC Holdings LLC, 4.1250%, 12/1/30 (144A) | 1,320,000 | 1,380,192 | |||||
CSC Holdings LLC, 4.6250%, 12/1/30 (144A) | 1,356,000 | 1,415,325 | |||||
CSC Holdings LLC, 3.3750%, 2/15/31 (144A) | 1,043,000 | 1,023,444 | |||||
GCI LLC, 4.7500%, 10/15/28 (144A) | 2,474,000 | 2,638,645 | |||||
Level 3 Financing Inc, 3.8750%, 11/15/29 (144A) | 2,361,000 | 2,621,938 | |||||
Netflix Inc, 3.6250%, 6/15/25 (144A) | 3,058,000 | 3,274,323 | |||||
Sirius XM Radio Inc, 4.1250%, 7/1/30 (144A) | 1,837,000 | 1,955,257 | |||||
T-Mobile USA Inc, 1.5000%, 2/15/26 (144A) | 300,000 | 307,161 | |||||
T-Mobile USA Inc, 3.7500%, 4/15/27 (144A) | 2,129,000 | 2,424,505 | |||||
T-Mobile USA Inc, 2.0500%, 2/15/28 (144A) | 604,000 | 628,257 | |||||
T-Mobile USA Inc, 3.8750%, 4/15/30 (144A) | 356,000 | 412,252 | |||||
T-Mobile USA Inc, 2.5500%, 2/15/31 (144A) | 1,284,000 | 1,348,290 | |||||
T-Mobile USA Inc, 3.0000%, 2/15/41 (144A) | 776,000 | 804,495 | |||||
T-Mobile USA Inc, 3.3000%, 2/15/51 (144A) | 673,000 | 692,403 | |||||
Verizon Communications Inc, 3.0000%, 3/22/27 | 471,000 | 521,540 | |||||
Verizon Communications Inc, 4.8620%, 8/21/46 | 479,000 | 646,315 | |||||
36,381,784 | |||||||
Consumer Cyclical – 6.3% | |||||||
1011778 BC ULC / New Red Finance Inc, 4.0000%, 10/15/30 (144A) | 2,758,000 | 2,797,053 | |||||
AutoZone Inc, 3.7500%, 4/18/29 | 523,000 | 602,856 | |||||
AutoZone Inc, 1.6500%, 1/15/31 | 625,000 | 620,622 | |||||
Best Buy Co Inc, 1.9500%, 10/1/30 | 1,680,000 | 1,687,093 | |||||
Booking Holdings Inc, 4.1000%, 4/13/25 | 2,604,000 | 2,952,616 | |||||
Booking Holdings Inc, 4.5000%, 4/13/27 | 794,000 | 946,447 | |||||
Booking Holdings Inc, 4.6250%, 4/13/30 | 554,000 | 688,041 | |||||
Choice Hotels International Inc, 3.7000%, 12/1/29 | 1,179,000 | 1,285,888 | |||||
Choice Hotels International Inc, 3.7000%, 1/15/31 | 315,000 | 348,869 | |||||
Experian Finance PLC, 2.7500%, 3/8/30 (144A) | 2,862,000 | 3,105,795 | |||||
Ford Motor Credit Co LLC, 3.3750%, 11/13/25 | 2,130,000 | 2,181,248 | |||||
See Notes to Schedule of Investments and Other Information and Notes to Financial Statements. | |
12 | DECEMBER 31, 2020 |
Janus Henderson VIT Flexible Bond Portfolio
Schedule of Investments
December 31, 2020
Shares
or | Value | ||||||
Corporate Bonds– (continued) | |||||||
Consumer Cyclical– (continued) | |||||||
Ford Motor Credit Co LLC, 4.0000%, 11/13/30 | $1,904,000 | $2,002,875 | |||||
General Motors Co, 4.2000%, 10/1/27 | 438,000 | 496,127 | |||||
General Motors Co, 5.0000%, 10/1/28 | 1,113,000 | 1,323,872 | |||||
General Motors Co, 5.4000%, 4/1/48 | 464,000 | 583,448 | |||||
General Motors Financial Co Inc, 4.3500%, 4/9/25 | 319,000 | 356,063 | |||||
General Motors Financial Co Inc, 4.3000%, 7/13/25 | 276,000 | 309,616 | |||||
General Motors Financial Co Inc, 4.3500%, 1/17/27 | 748,000 | 851,221 | |||||
GLP Capital LP / GLP Financing II Inc, 3.3500%, 9/1/24 | 228,000 | 239,348 | |||||
GLP Capital LP / GLP Financing II Inc, 5.2500%, 6/1/25 | 440,000 | 495,035 | |||||
GLP Capital LP / GLP Financing II Inc, 5.3750%, 4/15/26 | 1,083,000 | 1,242,927 | |||||
GLP Capital LP / GLP Financing II Inc, 5.3000%, 1/15/29 | 90,000 | 104,726 | |||||
GLP Capital LP / GLP Financing II Inc, 4.0000%, 1/15/30 | 1,539,000 | 1,671,754 | |||||
GLP Capital LP / GLP Financing II Inc, 4.0000%, 1/15/31 | 331,000 | 361,194 | |||||
IHS Markit Ltd, 5.0000%, 11/1/22 (144A) | 1,034,000 | 1,105,580 | |||||
IHS Markit Ltd, 4.7500%, 2/15/25 (144A) | 1,793,000 | 2,057,647 | |||||
IHS Markit Ltd, 4.0000%, 3/1/26 (144A) | 559,000 | 640,390 | |||||
Lowe's Cos Inc, 4.5000%, 4/15/30 | 673,000 | 837,303 | |||||
Lowe's Cos Inc, 5.0000%, 4/15/40 | 477,000 | 647,841 | |||||
Marriott International Inc, 5.7500%, 5/1/25 | 1,360,000 | 1,590,500 | |||||
MDC Holdings Inc, 5.5000%, 1/15/24 | 1,101,000 | 1,205,595 | |||||
MGM Resorts International, 7.7500%, 3/15/22 | 281,000 | 299,265 | |||||
Nordstrom Inc, 4.3750%, 4/1/30 | 1,408,000 | 1,386,062 | |||||
O'Reilly Automotive Inc, 3.6000%, 9/1/27 | 31,000 | 35,282 | |||||
O'Reilly Automotive Inc, 4.3500%, 6/1/28 | 237,000 | 281,792 | |||||
O'Reilly Automotive Inc, 3.9000%, 6/1/29 | 1,645,000 | 1,933,568 | |||||
Ross Stores Inc, 1.8750%, 4/15/31 | 510,000 | 511,714 | |||||
Service Corp International/US, 3.3750%, 8/15/30 | 550,000 | 572,115 | |||||
40,359,388 | |||||||
Consumer Non-Cyclical – 4.9% | |||||||
Anheuser-Busch Cos LLC / Anheuser-Busch InBev Worldwide Inc, | |||||||
4.9000%, 2/1/46 | 1,440,000 | 1,874,081 | |||||
Anheuser-Busch InBev Worldwide Inc, 4.3500%, 6/1/40 | 735,000 | 900,624 | |||||
Aramark Services Inc, 6.3750%, 5/1/25 (144A) | 2,227,000 | 2,380,106 | |||||
Avantor Funding Inc, 4.6250%, 7/15/28 (144A) | 992,000 | 1,049,040 | |||||
Baxter International Inc, 3.9500%, 4/1/30 (144A) | 507,000 | 605,610 | |||||
Boston Scientific Corp, 4.0000%, 3/1/29 | 633,000 | 745,655 | |||||
Cigna Corp, 2.4000%, 3/15/30 | 538,000 | 573,319 | |||||
Cigna Corp, 3.2000%, 3/15/40 | 245,000 | 268,292 | |||||
Cigna Corp, 3.4000%, 3/15/50 | 369,000 | 414,453 | |||||
Coca-Cola Femsa SAB de CV, 2.7500%, 1/22/30 | 691,000 | 744,981 | |||||
CVS Health Corp, 4.3000%, 3/25/28 | 660,000 | 785,594 | |||||
CVS Health Corp, 4.1250%, 4/1/40 | 342,000 | 407,768 | |||||
CVS Health Corp, 2.7000%, 8/21/40 | 494,000 | 499,033 | |||||
CVS Health Corp, 4.2500%, 4/1/50 | 169,000 | 211,031 | |||||
DaVita Inc, 4.6250%, 6/1/30 (144A) | 1,081,000 | 1,145,860 | |||||
DaVita Inc, 3.7500%, 2/15/31 (144A) | 1,438,000 | 1,460,088 | |||||
Elanco Animal Health Inc, 5.2720%, 8/28/23 | 1,085,000 | 1,185,362 | |||||
Fomento Economico Mexicano SAB de CV, 3.5000%, 1/16/50 | 1,012,000 | 1,123,727 | |||||
Hasbro Inc, 3.5500%, 11/19/26 | 890,000 | 993,084 | |||||
Hasbro Inc, 3.9000%, 11/19/29 | 2,398,000 | 2,713,411 | |||||
Hasbro Inc, 5.1000%, 5/15/44 | 1,161,000 | 1,326,237 | |||||
HCA Inc, 5.3750%, 2/1/25 | 573,000 | 644,356 | |||||
JBS USA LUX SA / JBS USA Finance Inc, 6.7500%, 2/15/28 (144A) | 657,000 | 738,139 | |||||
JBS USA LUX SA / JBS USA Food Co / JBS USA Finance Inc, | |||||||
6.5000%, 4/15/29 (144A) | 1,063,000 | 1,237,438 | |||||
JBS USA LUX SA / JBS USA Food Co / JBS USA Finance Inc, | |||||||
5.5000%, 1/15/30 (144A) | 1,361,000 | 1,563,462 | |||||
Royalty Pharma PLC, 1.7500%, 9/2/27 (144A) | 524,000 | 538,948 | |||||
Royalty Pharma PLC, 2.2000%, 9/2/30 (144A) | 101,000 | 103,660 | |||||
See Notes to Schedule of Investments and Other Information and Notes to Financial Statements. | |
Janus Aspen Series | 13 |
Janus Henderson VIT Flexible Bond Portfolio
Schedule of Investments
December 31, 2020
Shares
or | Value | ||||||
Corporate Bonds– (continued) | |||||||
Consumer Non-Cyclical– (continued) | |||||||
Royalty Pharma PLC, 3.3000%, 9/2/40 (144A) | $1,014,000 | $1,064,698 | |||||
Royalty Pharma PLC, 3.5500%, 9/2/50 (144A) | 1,011,000 | 1,077,138 | |||||
Sysco Corp, 5.9500%, 4/1/30 | 1,141,000 | 1,498,598 | |||||
Sysco Corp, 6.6000%, 4/1/40 | 428,000 | 625,315 | |||||
Sysco Corp, 6.6000%, 4/1/50 | 408,000 | 627,419 | |||||
Upjohn Inc, 1.6500%, 6/22/25 (144A) | 223,000 | 230,446 | |||||
31,356,973 | |||||||
Electric – 2.9% | |||||||
AEP Transmission Co LLC, 3.6500%, 4/1/50 | 376,000 | 455,024 | |||||
Ameren Corp, 3.5000%, 1/15/31 | 2,031,000 | 2,334,341 | |||||
Black Hills Corp, 2.5000%, 6/15/30 | 2,508,305 | 2,632,966 | |||||
CMS Energy Corp, | |||||||
US Treasury Yield Curve Rate 5 Year + 4.1160%, 4.7500%, 6/1/50‡ | 1,249,000 | 1,406,331 | |||||
Dominion Energy Inc, 3.3750%, 4/1/30 | 898,000 | 1,022,373 | |||||
East Ohio Gas Co/The, 2.0000%, 6/15/30 (144A) | 148,000 | 153,299 | |||||
IPALCO Enterprises Inc, 4.2500%, 5/1/30 (144A) | 2,653,000 | 3,061,157 | |||||
NextEra Energy Capital Holdings Inc, 2.7500%, 5/1/25 | 596,000 | 644,645 | |||||
NRG Energy Inc, 7.2500%, 5/15/26 | 2,024,000 | 2,135,320 | |||||
NRG Energy Inc, 6.6250%, 1/15/27 | 758,000 | 800,478 | |||||
NRG Energy Inc, 3.3750%, 2/15/29 (144A) | 1,246,000 | 1,275,655 | |||||
NRG Energy Inc, 3.6250%, 2/15/31 (144A) | 1,408,000 | 1,448,550 | |||||
PPL WEM Ltd / Western Power Distribution Ltd, 5.3750%, 5/1/21 (144A) | 1,336,000 | 1,340,813 | |||||
18,710,952 | |||||||
Energy – 2.6% | |||||||
Cheniere Corpus Christi Holdings LLC, 3.7000%, 11/15/29 | 1,348,000 | 1,499,954 | |||||
Cheniere Energy Inc, 4.6250%, 10/15/28 (144A) | 2,763,000 | 2,901,150 | |||||
Continental Resources Inc, 5.7500%, 1/15/31 (144A) | 1,432,000 | 1,589,491 | |||||
Energy Transfer Operating LP, 5.8750%, 1/15/24 | 763,000 | 857,436 | |||||
Energy Transfer Operating LP, 5.5000%, 6/1/27 | 106,000 | 124,873 | |||||
Energy Transfer Operating LP, 4.9500%, 6/15/28 | 172,000 | 198,169 | |||||
Hess Midstream Operations LP, 5.1250%, 6/15/28 (144A) | 1,974,000 | 2,063,442 | |||||
Kinder Morgan Inc/DE, 4.3000%, 3/1/28 | 378,000 | 443,126 | |||||
NGPL PipeCo LLC, 4.3750%, 8/15/22 (144A) | 2,001,000 | 2,084,676 | |||||
ONEOK Inc, 5.8500%, 1/15/26 | 344,000 | 411,948 | |||||
ONEOK Inc, 6.3500%, 1/15/31 | 736,000 | 943,160 | |||||
ONEOK Inc, 7.1500%, 1/15/51 | 192,000 | 265,283 | |||||
TransCanada PipeLines Ltd, 4.1000%, 4/15/30 | 813,000 | 960,049 | |||||
Transcontinental Gas Pipe Line Co LLC, 3.2500%, 5/15/30 | 1,352,000 | 1,514,228 | |||||
Transcontinental Gas Pipe Line Co LLC, 3.9500%, 5/15/50 | 665,000 | 750,859 | |||||
16,607,844 | |||||||
Finance Companies – 0.5% | |||||||
Quicken Loans LLC, 3.6250%, 3/1/29 (144A) | 1,146,000 | 1,168,920 | |||||
Quicken Loans LLC, 3.8750%, 3/1/31 (144A) | 1,675,000 | 1,737,812 | |||||
USAA Capital Corp, 2.1250%, 5/1/30 (144A) | 150,000 | 157,637 | |||||
3,064,369 | |||||||
Financial Institutions – 0.2% | |||||||
Jones Lang LaSalle Inc, 4.4000%, 11/15/22 | 1,319,000 | 1,397,068 | |||||
Industrial Conglomerates – 0.2% | |||||||
General Electric Co, ICE LIBOR USD 3 Month + 3.3300%, 5.0000%‡,µ | 1,723,000 | 1,597,669 | |||||
Information Technology Services – 0.2% | |||||||
Booz Allen Hamilton Inc, 3.8750%, 9/1/28 (144A) | 1,412,000 | 1,454,360 | |||||
Insurance – 2.1% | |||||||
Brown & Brown Inc, 4.5000%, 3/15/29 | 837,000 | 990,338 | |||||
Brown & Brown Inc, 2.3750%, 3/15/31 | 142,000 | 148,531 | |||||
Centene Corp, 4.2500%, 12/15/27 | 1,501,000 | 1,591,060 | |||||
Centene Corp, 4.6250%, 12/15/29 | 2,256,000 | 2,504,634 | |||||
Centene Corp, 3.3750%, 2/15/30 | 910,000 | 957,402 | |||||
Centene Corp, 3.0000%, 10/15/30 | 1,718,000 | 1,820,908 | |||||
Molina Healthcare Inc, 4.3750%, 6/15/28 (144A) | 3,025,000 | 3,183,812 | |||||
See Notes to Schedule of Investments and Other Information and Notes to Financial Statements. | |
14 | DECEMBER 31, 2020 |
Janus Henderson VIT Flexible Bond Portfolio
Schedule of Investments
December 31, 2020
Shares
or | Value | ||||||
Corporate Bonds– (continued) | |||||||
Insurance– (continued) | |||||||
Prudential Financial Inc, | |||||||
US Treasury Yield Curve Rate 5 Year + 3.0350%, 3.7000%, 10/1/50‡ | $1,989,000 | $2,103,924 | |||||
13,300,609 | |||||||
Real Estate Investment Trusts (REITs) – 2.2% | |||||||
Agree LP, 2.9000%, 10/1/30 | 1,823,000 | 1,935,485 | |||||
Alexandria Real Estate Equities Inc, 4.9000%, 12/15/30 | 576,000 | 732,613 | |||||
Lexington Realty Trust, 2.7000%, 9/15/30 | 2,631,000 | 2,737,299 | |||||
MPT Operating Partnership LP/MPT Finance Corp, 5.0000%, 10/15/27 | 409,000 | 435,074 | |||||
MPT Operating Partnership LP/MPT Finance Corp, 4.6250%, 8/1/29 | 386,000 | 414,950 | |||||
MPT Operating Partnership LP/MPT Finance Corp, 3.5000%, 3/15/31 | 3,992,000 | 4,121,740 | |||||
Realty Income Corp, 3.2500%, 1/15/31 | 1,099,000 | 1,245,149 | |||||
Rexford Industrial Realty Inc, 2.1250%, 12/1/30 | 1,405,000 | 1,406,031 | |||||
WP Carey Inc, 2.4000%, 2/1/31 | 1,066,000 | 1,106,449 | |||||
14,134,790 | |||||||
Technology – 8.3% | |||||||
Broadcom Inc, 4.7000%, 4/15/25 | 804,000 | 921,187 | |||||
Broadcom Inc, 3.1500%, 11/15/25 | 1,396,000 | 1,523,197 | |||||
Broadcom Inc, 4.1500%, 11/15/30 | 1,419,000 | 1,640,313 | |||||
Broadcom Inc, 4.3000%, 11/15/32 | 921,000 | 1,091,155 | |||||
Broadridge Financial Solutions Inc, 2.9000%, 12/1/29 | 1,405,000 | 1,538,220 | |||||
Cadence Design Systems Inc, 4.3750%, 10/15/24 | 2,887,000 | 3,242,212 | |||||
CoStar Group Inc, 2.8000%, 7/15/30 (144A) | 1,475,000 | 1,531,746 | |||||
Equifax Inc, 2.6000%, 12/1/24 | 1,954,000 | 2,092,474 | |||||
Equifax Inc, 2.6000%, 12/15/25 | 1,325,000 | 1,429,875 | |||||
Equifax Inc, 3.1000%, 5/15/30 | 949,000 | 1,055,055 | |||||
Equinix Inc, 2.9000%, 11/18/26 | 528,000 | 577,309 | |||||
Equinix Inc, 1.8000%, 7/15/27 | 1,400,000 | 1,440,548 | |||||
Equinix Inc, 3.2000%, 11/18/29 | 1,471,000 | 1,620,545 | |||||
Gartner Inc, 3.7500%, 10/1/30 (144A) | 268,000 | 281,400 | |||||
Global Payments Inc, 3.2000%, 8/15/29 | 389,000 | 431,767 | |||||
Global Payments Inc, 2.9000%, 5/15/30 | 1,244,000 | 1,352,621 | |||||
Keysight Technologies Inc, 3.0000%, 10/30/29 | 1,424,000 | 1,571,415 | |||||
Leidos Inc, 2.9500%, 5/15/23 (144A) | 173,000 | 182,015 | |||||
Leidos Inc, 3.6250%, 5/15/25 (144A) | 672,000 | 751,356 | |||||
Leidos Inc, 4.3750%, 5/15/30 (144A) | 1,212,000 | 1,451,309 | |||||
Leidos Inc, 2.3000%, 2/15/31 (144A) | 960,000 | 977,471 | |||||
Marvell Technology Group Ltd, 4.2000%, 6/22/23 | 619,000 | 669,815 | |||||
Marvell Technology Group Ltd, 4.8750%, 6/22/28 | 1,755,000 | 2,072,194 | |||||
Microchip Technology Inc, 2.6700%, 9/1/23 (144A) | 1,729,000 | 1,808,175 | |||||
Microchip Technology Inc, 4.2500%, 9/1/25 (144A) | 1,119,000 | 1,183,747 | |||||
MSCI Inc, 3.8750%, 2/15/31 (144A) | 2,034,000 | 2,150,955 | |||||
PayPal Holdings Inc, 2.6500%, 10/1/26 | 1,453,000 | 1,596,737 | |||||
PayPal Holdings Inc, 2.3000%, 6/1/30 | 574,000 | 614,313 | |||||
Qorvo Inc, 3.3750%, 4/1/31 (144A) | 1,535,000 | 1,584,887 | |||||
Sensata Technologies Inc, 3.7500%, 2/15/31 (144A) | 1,418,000 | 1,469,870 | |||||
Total System Services Inc, 4.8000%, 4/1/26 | 2,691,000 | 3,201,818 | |||||
Trimble Inc, 4.7500%, 12/1/24 | 2,757,000 | 3,150,644 | |||||
Trimble Inc, 4.9000%, 6/15/28 | 2,747,000 | 3,285,668 | |||||
Verisk Analytics Inc, 5.5000%, 6/15/45 | 969,000 | 1,371,067 | |||||
Verisk Analytics Inc, 3.6250%, 5/15/50 | 106,000 | 123,318 | |||||
VMware Inc, 4.5000%, 5/15/25 | 730,000 | 835,308 | |||||
VMware Inc, 4.6500%, 5/15/27 | 819,000 | 957,994 | |||||
52,779,700 | |||||||
Total Corporate Bonds (cost $318,966,610) | 344,827,647 | ||||||
Inflation-Indexed Bonds– 3.0% | |||||||
United States Treasury Inflation Indexed Bonds, 0.1250%, 10/15/25ÇÇ((cost $18,878,779) | 17,636,161 | 19,203,436 | |||||
See Notes to Schedule of Investments and Other Information and Notes to Financial Statements. | |
Janus Aspen Series | 15 |
Janus Henderson VIT Flexible Bond Portfolio
Schedule of Investments
December 31, 2020
Shares
or | Value | ||||||
Mortgage-Backed Securities– 13.7% | |||||||
Fannie Mae: | |||||||
2.0000%, TBA, 15 Year Maturity | $2,562,198 | $2,679,957 | |||||
2.5000%, TBA, 15 Year Maturity | 1,232,300 | 1,284,673 | |||||
2.0000%, TBA, 30 Year Maturity | 11,378,251 | 11,825,758 | |||||
2.5000%, TBA, 30 Year Maturity | 8,904,325 | 9,388,720 | |||||
25,179,108 | |||||||
Fannie Mae Pool: | |||||||
3.0000%, 10/1/34 | 208,107 | 221,990 | |||||
2.5000%, 11/1/34 | 268,791 | 285,860 | |||||
3.0000%, 11/1/34 | 41,228 | 44,502 | |||||
3.0000%, 12/1/34 | 42,553 | 45,658 | |||||
6.0000%, 2/1/37 | 102,192 | 121,217 | |||||
4.5000%, 11/1/42 | 76,440 | 85,443 | |||||
3.0000%, 1/1/43 | 30,836 | 32,899 | |||||
3.0000%, 2/1/43 | 39,305 | 42,157 | |||||
3.0000%, 5/1/43 | 443,506 | 468,467 | |||||
3.0000%, 5/1/43 | 214,028 | 230,126 | |||||
3.5000%, 4/1/44 | 556,636 | 616,439 | |||||
5.0000%, 7/1/44 | 655,565 | 743,067 | |||||
4.5000%, 10/1/44 | 172,385 | 194,734 | |||||
4.5000%, 3/1/45 | 263,268 | 297,398 | |||||
4.5000%, 6/1/45 | 151,870 | 169,367 | |||||
3.5000%, 12/1/45 | 480,805 | 528,617 | |||||
3.5000%, 12/1/45 | 246,311 | 264,274 | |||||
4.5000%, 2/1/46 | 284,109 | 317,568 | |||||
3.5000%, 7/1/46 | 925,772 | 1,010,845 | |||||
3.0000%, 9/1/46 | 732,908 | 781,895 | |||||
3.0000%, 2/1/47 | 9,623,863 | 10,267,109 | |||||
3.5000%, 3/1/47 | 211,402 | 226,819 | |||||
3.5000%, 7/1/47 | 175,763 | 188,581 | |||||
3.5000%, 8/1/47 | 349,313 | 371,254 | |||||
3.5000%, 12/1/47 | 706,317 | 755,359 | |||||
3.5000%, 1/1/48 | 507,024 | 542,228 | |||||
3.5000%, 1/1/48 | 228,060 | 243,833 | |||||
4.0000%, 1/1/48 | 1,611,971 | 1,743,486 | |||||
3.0000%, 2/1/48 | 141,936 | 153,279 | |||||
3.5000%, 3/1/48 | 322,017 | 344,219 | |||||
4.0000%, 3/1/48 | 608,576 | 657,477 | |||||
3.0000%, 5/1/48 | 70,114 | 74,822 | |||||
5.0000%, 5/1/48 | 175,468 | 194,345 | |||||
3.5000%, 7/1/48 | 5,170,845 | 5,489,594 | |||||
3.0000%, 11/1/48 | 1,634,503 | 1,727,802 | |||||
3.0000%, 8/1/49 | 272,205 | 292,596 | |||||
3.0000%, 9/1/49 | 70,078 | 74,433 | |||||
2.5000%, 1/1/50 | 162,269 | 172,148 | |||||
2.5000%, 10/1/50 | 371,564 | 392,671 | |||||
3.5000%, 8/1/56 | 2,395,540 | 2,651,278 | |||||
3.0000%, 2/1/57 | 1,564,069 | 1,696,377 | |||||
3.0000%, 6/1/57 | 7,776 | 8,430 | |||||
34,770,663 | |||||||
Freddie Mac Gold Pool: | |||||||
3.5000%, 1/1/47 | 139,448 | 151,346 | |||||
Freddie Mac Pool: | |||||||
3.0000%, 5/1/31 | 1,563,343 | 1,661,171 | |||||
3.0000%, 9/1/32 | 320,026 | 342,338 | |||||
3.0000%, 10/1/32 | 100,685 | 106,158 | |||||
3.0000%, 1/1/33 | 181,488 | 194,141 | |||||
2.5000%, 12/1/33 | 1,950,739 | 2,043,976 | |||||
3.0000%, 10/1/34 | 379,615 | 407,179 | |||||
3.0000%, 10/1/34 | 158,389 | 168,934 | |||||
See Notes to Schedule of Investments and Other Information and Notes to Financial Statements. | |
16 | DECEMBER 31, 2020 |
Janus Henderson VIT Flexible Bond Portfolio
Schedule of Investments
December 31, 2020
Shares
or | Value | ||||||
Mortgage-Backed Securities– (continued) | |||||||
Freddie Mac Pool– (continued) | |||||||
2.5000%, 11/1/34 | $225,239 | $239,584 | |||||
2.5000%, 11/1/34 | 206,693 | 219,857 | |||||
6.0000%, 4/1/40 | 160,458 | 190,658 | |||||
3.5000%, 7/1/42 | 10,120 | 10,984 | |||||
3.5000%, 8/1/42 | 13,134 | 14,255 | |||||
3.5000%, 8/1/42 | 10,950 | 11,884 | |||||
3.5000%, 2/1/43 | 424,884 | 462,716 | |||||
3.0000%, 3/1/43 | 340,054 | 362,961 | |||||
3.0000%, 6/1/43 | 38,345 | 40,254 | |||||
3.5000%, 2/1/44 | 593,000 | 645,802 | |||||
4.5000%, 5/1/44 | 136,956 | 152,751 | |||||
3.0000%, 1/1/45 | 633,008 | 674,177 | |||||
4.0000%, 2/1/46 | 455,679 | 503,074 | |||||
3.5000%, 7/1/46 | 1,803,719 | 1,983,495 | |||||
3.5000%, 7/1/46 | 413,037 | 442,964 | |||||
3.0000%, 8/1/46 | 242,275 | 256,078 | |||||
4.0000%, 3/1/47 | 122,884 | 134,191 | |||||
3.0000%, 4/1/47 | 302,512 | 319,747 | |||||
3.5000%, 11/1/47 | 605,586 | 650,181 | |||||
3.5000%, 12/1/47 | 464,079 | 496,372 | |||||
3.5000%, 2/1/48 | 238,524 | 254,916 | |||||
3.5000%, 2/1/48 | 190,132 | 203,252 | |||||
4.0000%, 4/1/48 | 506,789 | 547,301 | |||||
4.5000%, 7/1/48 | 162,115 | 176,283 | |||||
5.0000%, 9/1/48 | 65,600 | 72,856 | |||||
3.0000%, 8/1/49 | 75,869 | 81,556 | |||||
3.0000%, 12/1/49 | 270,165 | 282,679 | |||||
3.0000%, 12/1/49 | 207,865 | 217,493 | |||||
2.5000%, 1/1/50 | 68,490 | 72,670 | |||||
3.0000%, 3/1/50 | 84,713 | 89,309 | |||||
14,734,197 | |||||||
Ginnie Mae: | |||||||
2.5000%, TBA, 30 Year Maturity | 2,582,319 | 2,733,824 | |||||
Ginnie Mae I Pool: | |||||||
4.0000%, 1/15/45 | 1,842,154 | 2,031,522 | |||||
4.5000%, 8/15/46 | 2,173,045 | 2,464,835 | |||||
4.0000%, 8/15/47 | 206,094 | 223,399 | |||||
4.0000%, 11/15/47 | 286,977 | 311,073 | |||||
4.0000%, 12/15/47 | 353,989 | 383,712 | |||||
5,414,541 | |||||||
Ginnie Mae II Pool: | |||||||
4.0000%, 8/20/47 | 218,631 | 237,195 | |||||
4.0000%, 8/20/47 | 57,922 | 62,840 | |||||
4.0000%, 8/20/47 | 36,149 | 39,735 | |||||
4.5000%, 2/20/48 | 474,472 | 517,184 | |||||
4.0000%, 5/20/48 | 605,034 | 650,937 | |||||
4.5000%, 5/20/48 | 923,409 | 994,473 | |||||
4.5000%, 5/20/48 | 161,294 | 173,707 | |||||
4.0000%, 6/20/48 | 889,860 | 956,538 | |||||
5.0000%, 8/20/48 | 855,495 | 931,331 | |||||
4,563,940 | |||||||
Total Mortgage-Backed Securities (cost $85,056,652) | 87,547,619 | ||||||
United States Treasury Notes/Bonds– 12.6% | |||||||
2.1250%, 5/31/21 | 5,746,000 | 5,792,686 | |||||
1.1250%, 2/28/22 | 15,945,000 | 16,133,101 | |||||
0.3750%, 11/30/25 | 5,646,000 | 5,652,616 | |||||
0.8750%, 11/15/30 | 5,665,000 | 5,642,871 | |||||
1.1250%, 5/15/40 | 2,189,000 | 2,074,762 | |||||
See Notes to Schedule of Investments and Other Information and Notes to Financial Statements. | |
Janus Aspen Series | 17 |
Janus Henderson VIT Flexible Bond Portfolio
Schedule of Investments
December 31, 2020
Shares
or | Value | ||||||
United States Treasury Notes/Bonds– (continued) | |||||||
1.3750%, 11/15/40 | $1,937,000 | $1,911,880 | |||||
2.7500%, 8/15/42 | 10,011,400 | 12,391,063 | |||||
1.2500%, 5/15/50 | 20,648,600 | 18,690,209 | |||||
1.3750%, 8/15/50 | 12,989,900 | 12,137,438 | |||||
Total United States Treasury Notes/Bonds (cost $79,924,178) | 80,426,626 | ||||||
Preferred Stocks– 0.7% | |||||||
Banks – 0.7% | |||||||
First Republic Bank/CA, 4.1250%µ | 73,250 | 1,936,730 | |||||
Truist Financial Corp, 4.7500%µ | 85,750 | 2,372,702 | |||||
Total Preferred Stocks (cost $3,975,000) | 4,309,432 | ||||||
Investment Companies– 5.3% | |||||||
Money Markets – 5.3% | |||||||
Janus Henderson Cash Liquidity Fund LLC, 0.1108%ºº,£((cost $33,621,553) | 33,619,502 | 33,622,864 | |||||
Investments Purchased with Cash Collateral from Securities Lending– 0% | |||||||
Investment Companies – 0% | |||||||
Janus Henderson Cash Collateral Fund LLC, 0.0264%ºº,£ | 113,710 | 113,710 | |||||
Time Deposits – 0% | |||||||
Canadian Imperial Bank of Commerce, 0.0800%, 1/4/21 | $28,428 | 28,428 | |||||
Total Investments Purchased with Cash Collateral from Securities Lending (cost $142,138) | 142,138 | ||||||
Total Investments (total cost $632,475,925) – 103.9% | 664,290,766 | ||||||
Liabilities, net of Cash, Receivables and Other Assets – (3.9)% | (25,134,602) | ||||||
Net Assets – 100% | $639,156,164 | ||||||
Summary of Investments by Country - (Long Positions) (unaudited) | |||||
% of | |||||
Investment | |||||
Country | Value | Securities | |||
United States | $624,257,500 | 94.0 | % | ||
United Kingdom | 13,064,634 | 2.0 | |||
France | 10,729,391 | 1.6 | |||
Switzerland | 4,053,914 | 0.6 | |||
Canada | 3,757,102 | 0.5 | |||
Belgium | 2,774,705 | 0.4 | |||
Australia | 1,927,094 | 0.3 | |||
Mexico | 1,868,708 | 0.3 | |||
Spain | 1,857,718 | 0.3 | |||
Total | $664,290,766 | 100.0 | % |
See Notes to Schedule of Investments and Other Information and Notes to Financial Statements. | |
18 | DECEMBER 31, 2020 |
Janus Henderson VIT Flexible Bond Portfolio
Schedule of Investments
December 31, 2020
Schedules of Affiliated Investments – (% of Net Assets)
Dividend Income | Realized Gain/(Loss) | Change in Unrealized Appreciation/ Depreciation | Value at 12/31/20 | |||||||
Investment Companies - 5.3% | ||||||||||
Money Markets - 5.3% | ||||||||||
Janus Henderson Cash Liquidity Fund LLC, 0.1108%ºº | $ | 134,041 | $ | (1,986) | $ | 1,677 | $ | 33,622,864 | ||
Investments Purchased with Cash Collateral from Securities Lending - 0.0% | ||||||||||
Investment Companies - 0.0% | ||||||||||
Janus Henderson Cash Collateral Fund LLC, 0.0264%ºº | 7,943∆ | - | - | 113,710 | ||||||
Total Affiliated Investments - 5.3% | $ | 141,984 | $ | (1,986) | $ | 1,677 | $ | 33,736,574 | ||
Value at 12/31/19 | Purchases | Sales Proceeds | Value at 12/31/20 | |||||||
Investment Companies - 5.3% | ||||||||||
Money Markets - 5.3% | ||||||||||
Janus Henderson Cash Liquidity Fund LLC, 0.1108%ºº | 24,916,418 | 345,459,888 | (336,753,133) | 33,622,864 | ||||||
Investments Purchased with Cash Collateral from Securities Lending - 0.0% | ||||||||||
Investment Companies - 0.0% | ||||||||||
Janus Henderson Cash Collateral Fund LLC, 0.0264% ºº | - | 22,306,716 | (22,193,006) | 113,710 | ||||||
Schedule of Futures
Description | Number of Contracts | Expiration Date | Value and Notional Amount | Unrealized Appreciation/ (Depreciation) | Variation Margin Asset/(Liability) | ||||||||
Futures Purchased: | |||||||||||||
10 Year US Treasury Note | 1 | 3/31/21 | $ | 156,359 | $ | (172) | $ | 219 | |||||
5 Year US Treasury Note | 7 | 4/5/21 | 883,148 | 1,969 | 328 | ||||||||
Total - Futures Purchased | 1,797 | 547 | |||||||||||
Futures Sold: | |||||||||||||
2 Year US Treasury Note | 1 | 4/5/21 | (220,977) | (211) | (23) | ||||||||
Total | $ | 1,586 | $ | 524 | |||||||||
See Notes to Schedule of Investments and Other Information and Notes to Financial Statements. | |
Janus Aspen Series | 19 |
Janus Henderson VIT Flexible Bond Portfolio
Schedule of Investments
December 31, 2020
The following table, grouped by derivative type, provides information about the fair value and location of derivatives within the Statement of Assets and Liabilities as of December 31, 2020.
Fair Value of Derivative Instruments (not accounted for as hedging instruments) as of December 31, 2020 | |||||
|
|
|
|
|
|
|
|
|
|
| Interest
Rate |
Asset Derivatives: |
|
|
| ||
Variation margin receivable |
|
| $ 547 | ||
Liability Derivatives: |
|
|
| ||
Variation margin payable |
|
| $ 23 | ||
The following tables provide information about the effect of derivatives and hedging activities on the Portfolio’s Statement of Operations for the year ended December 31, 2020.
The effect of Derivative Instruments (not accounted for as hedging instruments) on the Statement of Operations for the year ended December 31, 2020 | ||||
|
|
|
|
|
Amount of Realized Gain/(Loss) Recognized on Derivatives | ||||
Derivative |
| Interest Rate | ||
Futures contracts |
| $ (3,532) | ||
|
|
| ||
|
|
| ||
Amount of Change in Unrealized Appreciation/Depreciation Recognized on Derivatives | ||||
Derivative |
| Interest Rate
| ||
Futures contracts |
| $ 1,586 | ||
Please see the "Net Realized Gain/(Loss) on Investments" and "Change in Unrealized Net Appreciation/Depreciation" sections of the Portfolio’s Statement of Operations.
Average Ending Monthly Market Value of Derivative Instruments During the Year Ended December 31, 2020 | |
|
|
| Market Value |
Futures contracts, purchased | $ 803,788 |
Futures contracts, sold | 84,968 |
See Notes to Schedule of Investments and Other Information and Notes to Financial Statements. | |
20 | DECEMBER 31, 2020 |
Janus Henderson VIT Flexible Bond Portfolio
Notes to Schedule of Investments and Other Information
Bloomberg Barclays U.S. Aggregate Bond Index | Bloomberg Barclays U.S. Aggregate Bond Index is a broad-based measure of the investment grade, US dollar-denominated, fixed-rate taxable bond market. |
ICE | Intercontinental Exchange |
LIBOR | London Interbank Offered Rate |
LLC | Limited Liability Company |
LP | Limited Partnership |
PLC | Public Limited Company |
SOFR | Secured Overnight Financing Rate |
TBA | (To Be Announced) Securities are purchased/sold on a forward commitment basis with an approximate principal amount and no defined maturity date. The actual principal and maturity date will be determined upon settlement when specific mortgage pools are assigned. |
144A | Securities sold under Rule 144A of the Securities Act of 1933, as amended, are subject to legal and/or contractual restrictions on resale and may not be publicly sold without registration under the 1933 Act. Unless otherwise noted, these securities have been determined to be liquid under guidelines established by the Board of Trustees. The total value of 144A securities as of the year ended December 31, 2020 is $178,701,464, which represents 28.0% of net assets. |
‡ | Variable or floating rate security. Rate shown is the current rate as of December 31, 2020. Certain variable rate securities are not based on a published reference rate and spread; they are determined by the issuer or agent and current market conditions. Reference rate is as of reset date and may vary by security, which may not indicate a reference rate and/or spread in their description. |
ÇÇ | Security is a U.S. Treasury Inflation-Protected Security (TIPS). |
ºº | Rate shown is the 7-day yield as of December 31, 2020. |
# | Loaned security; a portion of the security is on loan at December 31, 2020. |
µ | Perpetual security. Perpetual securities have no stated maturity date, but they may be called/redeemed by the issuer. The date indicated, if any, represents the next call date. |
Ç | Step bond. The coupon rate will increase or decrease periodically based upon a predetermined schedule. The rate shown reflects the current rate. |
£ | The Portfolio may invest in certain securities that are considered affiliated companies. As defined by the Investment Company Act of 1940, as amended, an affiliated company is one in which the Portfolio owns 5% or more of the outstanding voting securities, or a company which is under common ownership or control. |
∆ | Net of income paid to the securities lending agent and rebates paid to the borrowing counterparties. |
Janus Aspen Series | 21 |
Janus Henderson VIT Flexible Bond Portfolio
Notes to Schedule of Investments and Other Information
The following is a summary of the inputs that were used to value the Portfolio’s investments in securities and other financial instruments as of December 31, 2020. See Notes to Financial Statements for more information. | |||||||||||||
Valuation Inputs Summary | |||||||||||||
Level 2 - | Level 3 - | ||||||||||||
Level 1 - | Other Significant | Significant | |||||||||||
Quoted Prices | Observable Inputs | Unobservable Inputs | |||||||||||
Assets | |||||||||||||
Investments In Securities: | |||||||||||||
Asset-Backed/Commercial Mortgage-Backed Securities | $ | - | $ | 91,737,520 | $ | - | |||||||
Bank Loans and Mezzanine Loans | - | 2,473,484 | - | ||||||||||
Corporate Bonds | - | 344,827,647 | - | ||||||||||
Inflation-Indexed Bonds | - | 19,203,436 | - | ||||||||||
Mortgage-Backed Securities | - | 87,547,619 | - | ||||||||||
United States Treasury Notes/Bonds | - | 80,426,626 | - | ||||||||||
Preferred Stocks | - | 4,309,432 | - | ||||||||||
Investment Companies | - | 33,622,864 | - | ||||||||||
Investments Purchased with Cash Collateral from Securities Lending | - | 142,138 | - | ||||||||||
Total Investments in Securities | $ | - | $ | 664,290,766 | $ | - | |||||||
Other Financial Instruments(a): | |||||||||||||
Variation Margin Receivable | 547 | - | - | ||||||||||
Total Assets | $ | 547 | $ | 664,290,766 | $ | - | |||||||
Liabilities | |||||||||||||
Other Financial Instruments(a): | |||||||||||||
Variation Margin Payable | $ | 23 | $ | - | $ | - | |||||||
(a) | Other financial instruments include forward foreign currency exchange, futures, written options, written swaptions, and swap contracts. Forward foreign currency exchange contracts are reported at their unrealized appreciation/(depreciation) at measurement date, which represents the change in the contract's value from trade date. Futures, certain written options on futures, and centrally cleared swap contracts are reported at their variation margin at measurement date, which represents the amount due to/from the Portfolio at that date. Written options, written swaptions, and other swap contracts are reported at their market value at measurement date. | ||||||||||||
22 | DECEMBER 31, 2020 |
Janus Henderson VIT Flexible Bond Portfolio
Statement of Assets and Liabilities
December 31, 2020
|
|
|
|
|
|
|
Assets: |
|
|
|
| ||
| Unaffiliated investments, at value(1)(2) |
| $ | 630,554,192 |
| |
| Affiliated investments, at value(3) |
|
| 33,736,574 |
| |
| Cash |
|
| 4,713 |
| |
| Deposits with brokers for futures |
|
| 20,000 |
| |
| Variation margin receivable |
|
| 547 |
| |
| Non-interested Trustees' deferred compensation |
|
| 14,713 |
| |
| Receivables: |
|
|
|
| |
|
| Interest |
|
| 3,506,715 |
|
|
| Portfolio shares sold |
|
| 593,313 |
|
|
| Investments sold |
|
| 12,991 |
|
|
| Dividends from affiliates |
|
| 3,036 |
|
| Other assets |
|
| 5,594 |
| |
Total Assets |
|
| 668,452,388 |
| ||
Liabilities: |
|
|
|
| ||
| Collateral for securities loaned (Note 3) |
|
| 142,138 |
| |
| Variation margin payable |
|
| 23 |
| |
| Payables: |
|
| — |
| |
|
| Investments purchased |
|
| 27,737,769 |
|
|
| Portfolio shares repurchased |
|
| 810,725 |
|
|
| Advisory fees |
|
| 283,115 |
|
|
| 12b-1 Distribution and shareholder servicing fees |
|
| 113,554 |
|
|
| Professional fees |
|
| 46,328 |
|
|
| Transfer agent fees and expenses |
|
| 31,903 |
|
|
| Non-interested Trustees' deferred compensation fees |
|
| 14,713 |
|
|
| Custodian fees |
|
| 2,759 |
|
|
| Affiliated portfolio administration fees payable |
|
| 1,481 |
|
|
| Non-interested Trustees' fees and expenses |
|
| 903 |
|
|
| Accrued expenses and other payables |
|
| 110,813 |
|
Total Liabilities |
|
| 29,296,224 |
| ||
Net Assets |
| $ | 639,156,164 |
| ||
Net Assets Consist of: |
|
|
|
| ||
| Capital (par value and paid-in surplus) |
| $ | 590,394,428 |
| |
| Total distributable earnings (loss) |
|
| 48,761,736 |
| |
Total Net Assets |
| $ | 639,156,164 |
| ||
Net Assets - Institutional Shares |
| $ | 145,791,817 |
| ||
| Shares Outstanding, $0.001 Par Value (unlimited shares authorized) |
|
| 11,431,657 |
| |
Net Asset Value Per Share |
| $ | 12.75 |
| ||
Net Assets - Service Shares |
| $ | 493,364,347 |
| ||
| Shares Outstanding, $0.001 Par Value (unlimited shares authorized) |
|
| 35,273,763 |
| |
Net Asset Value Per Share |
| $ | 13.99 |
| ||
(1) Includes cost of $598,740,662. (2) Includes $138,370 of securities on loan. See Note 3 in Notes to Financial Statements. (3) Includes cost of $33,735,263. |
See Notes to Financial Statements. | |
Janus Aspen Series | 23 |
Janus Henderson VIT Flexible Bond Portfolio
Statement of Operations
For the year ended December 31, 2020
|
|
|
|
|
|
Investment Income: |
|
|
| ||
| Interest | $ | 16,550,546 |
| |
| Dividends from affiliates |
| 134,041 |
| |
| Dividends |
| 66,596 |
| |
| Affiliated securities lending income, net |
| 7,943 |
| |
| Unaffiliated securities lending income, net |
| 834 |
| |
| Other income |
| 80,137 |
| |
Total Investment Income |
| 16,840,097 |
| ||
Expenses: |
|
|
| ||
| Advisory fees |
| 2,962,508 |
| |
| 12b-1 Distribution and shareholder servicing fees: |
|
|
| |
|
| Service Shares |
| 1,084,942 |
|
| Transfer agent administrative fees and expenses: |
|
|
| |
|
| Institutional Shares |
| 78,663 |
|
|
| Service Shares |
| 216,988 |
|
| Other transfer agent fees and expenses: |
|
|
| |
|
| Institutional Shares |
| 8,661 |
|
|
| Service Shares |
| 11,457 |
|
| Professional fees |
| 55,589 |
| |
| Shareholder reports expense |
| 33,047 |
| |
| Registration fees |
| 20,697 |
| |
| Affiliated portfolio administration fees |
| 14,782 |
| |
| Custodian fees |
| 13,341 |
| |
| Non-interested Trustees’ fees and expenses |
| 11,175 |
| |
| Other expenses |
| 85,804 |
| |
Total Expenses |
| 4,597,654 |
| ||
Less: Excess Expense Reimbursement and Waivers |
| (68,741) |
| ||
Net Expenses |
| 4,528,913 |
| ||
Net Investment Income/(Loss) |
| 12,311,184 |
| ||
Net Realized Gain/(Loss) on Investments: |
|
|
| ||
| Investments |
| 30,179,290 |
| |
| Investments in affiliates |
| (1,986) |
| |
| Futures contracts |
| (3,532) |
| |
Total Net Realized Gain/(Loss) on Investments |
| 30,173,772 |
| ||
Change in Unrealized Net Appreciation/Depreciation: |
|
|
| ||
| Investments and non-interested Trustees’ deferred compensation |
| 14,060,248 |
| |
| Investments in affiliates |
| 1,677 |
| |
| Futures contracts |
| 1,586 |
| |
Total Change in Unrealized Net Appreciation/Depreciation |
| 14,063,511 |
| ||
Net Increase/(Decrease) in Net Assets Resulting from Operations | $ | 56,548,467 |
| ||
|
|
|
|
|
|
See Notes to Financial Statements. | |
24 | DECEMBER 31, 2020 |
Janus Henderson VIT Flexible Bond Portfolio
Statements of Changes in Net Assets
|
|
|
|
|
|
|
|
|
|
|
| Year ended |
| Year ended |
| ||
Operations: |
|
|
|
|
|
| ||
| Net investment income/(loss) | $ | 12,311,184 |
| $ | 16,145,287 |
| |
| Net realized gain/(loss) on investments |
| 30,173,772 |
|
| 16,000,005 |
| |
| Change in unrealized net appreciation/depreciation |
| 14,063,511 |
|
| 21,514,428 |
| |
Net Increase/(Decrease) in Net Assets Resulting from Operations |
| 56,548,467 |
|
| 53,659,720 |
| ||
Dividends and Distributions to Shareholders: |
|
|
|
|
|
| ||
|
| Institutional Shares |
| (4,451,177) |
|
| (6,558,390) |
|
|
| Service Shares |
| (10,580,741) |
|
| (10,929,187) |
|
Net Decrease from Dividends and Distributions to Shareholders |
| (15,031,918) |
|
| (17,487,577) |
| ||
Capital Share Transactions: |
|
|
|
|
|
| ||
|
| Institutional Shares |
| (27,989,330) |
|
| (90,843,813) |
|
|
| Service Shares |
| 66,237,602 |
|
| (11,187,982) |
|
Net Increase/(Decrease) from Capital Share Transactions |
| 38,248,272 |
|
| (102,031,795) |
| ||
Net Increase/(Decrease) in Net Assets |
| 79,764,821 |
|
| (65,859,652) |
| ||
Net Assets: |
|
|
|
|
|
| ||
| Beginning of period |
| 559,391,343 |
|
| 625,250,995 |
| |
| End of period | $ | 639,156,164 |
| $ | 559,391,343 |
| |
|
|
|
|
|
|
|
|
|
See Notes to Financial Statements. | |
Janus Aspen Series | 25 |
Janus Henderson VIT Flexible Bond Portfolio
Financial Highlights
Institutional Shares |
|
|
|
|
|
|
|
|
|
|
|
|
|
|
| |||
For a share outstanding during the year ended December 31 |
| 2020 |
|
| 2019 |
|
| 2018 |
|
| 2017 |
|
| 2016 |
| |||
| Net Asset Value, Beginning of Period |
| $11.88 |
|
| $11.21 |
|
| $11.69 |
|
| $11.62 |
|
| $11.67 |
| ||
| Income/(Loss) from Investment Operations: |
|
|
|
|
|
|
|
|
|
|
|
|
|
|
| ||
|
| Net investment income/(loss)(1) |
| 0.28 |
|
| 0.34 |
|
| 0.33 |
|
| 0.30 |
|
| 0.28 |
| |
|
| Net realized and unrealized gain/(loss) |
| 0.96 |
|
| 0.72 |
|
| (0.45) |
|
| 0.12 |
|
| 0.01 |
| |
| Total from Investment Operations |
| 1.24 |
|
| 1.06 |
|
| (0.12) |
|
| 0.42 |
|
| 0.29 |
| ||
| Less Dividends and Distributions: |
|
|
|
|
|
|
|
|
|
|
|
|
|
|
| ||
|
| Dividends (from net investment income) |
| (0.37) |
|
| (0.39) |
|
| (0.36) |
|
| (0.35) |
|
| (0.34) |
| |
|
| Distributions (from capital gains) |
| — |
|
| — |
|
| — |
|
| — |
|
| — |
| |
| Total Dividends and Distributions |
| (0.37) |
|
| (0.39) |
|
| (0.36) |
|
| (0.35) |
|
| (0.34) |
| ||
| Net Asset Value, End of Period |
| $12.75 |
|
| $11.88 |
|
| $11.21 |
|
| $11.69 |
|
| $11.62 |
| ||
| Total Return* |
| 10.48% |
|
| 9.57% |
|
| (1.00)% |
|
| 3.62% |
|
| 2.46% |
| ||
| Net Assets, End of Period (in thousands) |
| $145,792 |
|
| $162,620 |
|
| $240,427 |
|
| $292,251 |
|
| $335,208 |
| ||
| Average Net Assets for the Period (in thousands) |
| $156,575 |
|
| $208,624 |
|
| $266,429 |
|
| $319,492 |
|
| $350,120 |
| ||
| Ratios to Average Net Assets**: |
|
|
|
|
|
|
|
|
|
|
|
|
|
|
| ||
|
| Ratio of Gross Expenses |
| 0.60% |
|
| 0.60% |
|
| 0.61% |
|
| 0.60% |
|
| 0.58% |
| |
|
| Ratio of Net Expenses (After Waivers and Expense Offsets) |
| 0.59% |
|
| 0.60% |
|
| 0.61% |
|
| 0.60% |
|
| 0.58% |
| |
|
| Ratio of Net Investment Income/(Loss) |
| 2.28% |
|
| 2.89% |
|
| 2.88% |
|
| 2.51% |
|
| 2.31% |
| |
| Portfolio Turnover Rate |
| 139%(2) |
|
| 177%(2) |
|
| 238%(2) |
|
| 130%(2) |
|
| 112% |
| ||
Service Shares |
|
|
|
|
|
|
|
|
|
|
|
|
|
|
| |||
For a share outstanding during the year ended December 31 |
| 2020 |
|
| 2019 |
|
| 2018 |
|
| 2017 |
|
| 2016 |
| |||
| Net Asset Value, Beginning of Period |
| $12.99 |
|
| $12.23 |
|
| $12.73 |
|
| $12.63 |
|
| $12.66 |
| ||
| Income/(Loss) from Investment Operations: |
|
|
|
|
|
|
|
|
|
|
|
|
|
|
| ||
|
| Net investment income/(loss)(1) |
| 0.28 |
|
| 0.34 |
|
| 0.33 |
|
| 0.29 |
|
| 0.27 |
| |
|
| Net realized and unrealized gain/(loss) |
| 1.05 |
|
| 0.79 |
|
| (0.50) |
|
| 0.13 |
|
| 0.01 |
| |
| Total from Investment Operations |
| 1.33 |
|
| 1.13 |
|
| (0.17) |
|
| 0.42 |
|
| 0.28 |
| ||
| Less Dividends and Distributions: |
|
|
|
|
|
|
|
|
|
|
|
|
|
|
| ||
|
| Dividends (from net investment income) |
| (0.33) |
|
| (0.37) |
|
| (0.33) |
|
| (0.32) |
|
| (0.31) |
| |
|
| Distributions (from capital gains) |
| — |
|
| — |
|
| — |
|
| — |
|
| — |
| |
| Total Dividends and Distributions |
| (0.33) |
|
| (0.37) |
|
| (0.33) |
|
| (0.32) |
|
| (0.31) |
| ||
| Net Asset Value, End of Period |
| $13.99 |
|
| $12.99 |
|
| $12.23 |
|
| $12.73 |
|
| $12.63 |
| ||
| Total Return* |
| 10.33% |
|
| 9.28% |
|
| (1.29)% |
|
| 3.35% |
|
| 2.22% |
| ||
| Net Assets, End of Period (in thousands) |
| $493,364 |
|
| $396,771 |
|
| $384,824 |
|
| $403,243 |
|
| $401,186 |
| ||
| Average Net Assets for the Period (in thousands) |
| $431,012 |
|
| $384,358 |
|
| $389,260 |
|
| $402,544 |
|
| $383,710 |
| ||
| Ratios to Average Net Assets**: |
|
|
|
|
|
|
|
|
|
|
|
|
|
|
| ||
|
| Ratio of Gross Expenses |
| 0.85% |
|
| 0.85% |
|
| 0.86% |
|
| 0.85% |
|
| 0.83% |
| |
|
| Ratio of Net Expenses (After Waivers and Expense Offsets) |
| 0.84% |
|
| 0.85% |
|
| 0.86% |
|
| 0.85% |
|
| 0.83% |
| |
|
| Ratio of Net Investment Income/(Loss) |
| 2.03% |
|
| 2.63% |
|
| 2.64% |
|
| 2.27% |
|
| 2.06% |
| |
| Portfolio Turnover Rate |
| 139%(2) |
|
| 177%(2) |
|
| 238%(2) |
|
| 130%(2) |
|
| 112% |
| ||
* Total return includes adjustments in accordance with generally accepted accounting principles required at the year or period end and are not annualized for periods of less than one full year. Total return does not include fees, charges, or expenses imposed by the variable annuity and life insurance contracts for which Janus Aspen Series serves as an underlying investment vehicle. ** Annualized for periods of less than one full year. (1) Per share amounts are calculated based on average shares outstanding during the year or period. (2) Portfolio Turnover Rate excludes TBA (to be announced) purchase and sales commitments. |
See Notes to Financial Statements. | |
26 | DECEMBER 31, 2020 |
Janus Henderson VIT Flexible Bond Portfolio
Notes to Financial Statements
1. Organization and Significant Accounting Policies
Janus Henderson VIT Flexible Bond Portfolio (the “Portfolio”) is a series of Janus Aspen Series (the “Trust”), which is organized as a Delaware statutory trust and is registered under the Investment Company Act of 1940, as amended (the “1940 Act”), as an open-end management investment company, and therefore has applied the specialized accounting and reporting guidance in Financial Accounting Standards Board (“FASB”) Accounting Standards Codification (“ASC”) Topic 946. The Trust offers 11 portfolios, each of which offers multiple share classes, with differing investment objectives and policies. The Portfolio seeks to obtain maximum total return, consistent with preservation of capital. The Portfolio is classified as diversified, as defined in the 1940 Act.
The Portfolio currently offers two classes of shares: Institutional Shares and Service Shares. Each class represents an interest in the same portfolio of investments. Institutional Shares are offered only in connection with investment in and payments under variable insurance contracts as well as certain qualified retirement plans. Service Shares are offered only in connection with investment in and payments under variable insurance contracts as well as certain qualified retirement plans that require a fee from Portfolio assets to procure distribution and administrative services to contract owners and plan participants.
Shareholders, including other portfolios, participating insurance companies, as well as accounts, may from time to time own (beneficially or of record) a significant percentage of the Portfolio’s Shares and can be considered to “control” the Portfolio when that ownership exceeds 25% of the Portfolio’s assets (and which may differ from control as determined in accordance with United States of America generally accepted accounting priciples ("US GAAP")).
The following accounting policies have been followed by the Portfolio and are in conformity with US GAAP.
Investment Valuation
Securities held by the Portfolio are valued in accordance with policies and procedures established by and under the supervision of the Trustees (the “Valuation Procedures”). Equity securities traded on a domestic securities exchange are generally valued at the closing prices on the primary market or exchange on which they trade. If such price is lacking for the trading period immediately preceding the time of determination, such securities are valued at their current bid price. Equity securities that are traded on a foreign exchange are generally valued at the closing prices on such markets. In the event that there is no current trading volume on a particular security in such foreign exchange, the bid price from the primary exchange is generally used to value the security. Securities that are traded on the over-the-counter (“OTC”) markets are generally valued at their closing or latest bid prices as available. Foreign securities and currencies are converted to U.S. dollars using the applicable exchange rate in effect at the close of the New York Stock Exchange (“NYSE”). The Portfolio will determine the market value of individual securities held by it by using prices provided by one or more approved professional pricing services or, as needed, by obtaining market quotations from independent broker-dealers. Most debt securities are valued in accordance with the evaluated bid price supplied by the pricing service that is intended to reflect market value. The evaluated bid price supplied by the pricing service is an evaluation that may consider factors such as security prices, yields, maturities and ratings. Certain short-term securities maturing within 60 days or less may be evaluated and valued on an amortized cost basis provided that the amortized cost determined approximates market value. Securities for which market quotations or evaluated prices are not readily available or deemed unreliable are valued at fair value determined in good faith under the Valuation Procedures. Circumstances in which fair value pricing may be utilized include, but are not limited to: (i) a significant event that may affect the securities of a single issuer, such as a merger, bankruptcy, or significant issuer-specific development; (ii) an event that may affect an entire market, such as a natural disaster or significant governmental action; (iii) a nonsignificant event such as a market closing early or not opening, or a security trading halt; and (iv) pricing of a nonvalued security and a restricted or nonpublic security. Special valuation considerations may apply with respect to “odd-lot” fixed-income transactions which, due to their small size, may receive evaluated prices by pricing services which reflect a large block trade and not what actually could be obtained for the odd-lot position. The Portfolio uses systematic fair valuation models provided by independent third parties to value international equity securities in order to adjust for stale pricing, which may occur between the close of certain foreign exchanges and the close of the NYSE.
Valuation Inputs Summary
FASB ASC 820, Fair Value Measurements and Disclosures (“ASC 820”), defines fair value, establishes a framework for measuring fair value, and expands disclosure requirements regarding fair value measurements. This standard emphasizes that fair value is a market-based measurement that should be determined based on the assumptions that
Janus Aspen Series | 27 |
Janus Henderson VIT Flexible Bond Portfolio
Notes to Financial Statements
market participants would use in pricing an asset or liability and establishes a hierarchy that prioritizes inputs to valuation techniques used to measure fair value. These inputs are summarized into three broad levels:
Level 1 – Unadjusted quoted prices in active markets the Portfolio has the ability to access for identical assets or liabilities.
Level 2 – Observable inputs other than unadjusted quoted prices included in Level 1 that are observable for the asset or liability either directly or indirectly. These inputs may include quoted prices for the identical instrument on an inactive market, prices for similar instruments, interest rates, prepayment speeds, credit risk, yield curves, default rates and similar data.
Assets or liabilities categorized as Level 2 in the hierarchy generally include: debt securities fair valued in accordance with the evaluated bid or ask prices supplied by a pricing service; securities traded on OTC markets and listed securities for which no sales are reported that are fair valued at the latest bid price (or yield equivalent thereof) obtained from one or more dealers transacting in a market for such securities or by a pricing service approved by the Portfolio’s Trustees; certain short-term debt securities with maturities of 60 days or less that are fair valued at amortized cost; and equity securities of foreign issuers whose fair value is determined by using systematic fair valuation models provided by independent third parties in order to adjust for stale pricing which may occur between the close of certain foreign exchanges and the close of the NYSE. Other securities that may be categorized as Level 2 in the hierarchy include, but are not limited to, preferred stocks, bank loans, swaps, investments in unregistered investment companies, options, and forward contracts.
Level 3 – Unobservable inputs for the asset or liability to the extent that relevant observable inputs are not available, representing the Portfolio’s own assumptions about the assumptions that a market participant would use in valuing the asset or liability, and that would be based on the best information available.
There have been no significant changes in valuation techniques used in valuing any such positions held by the Portfolio since the beginning of the fiscal year.
The inputs or methodology used for fair valuing securities are not necessarily an indication of the risk associated with investing in those securities. The summary of inputs used as of December 31, 2020 to fair value the Portfolio’s investments in securities and other financial instruments is included in the “Valuation Inputs Summary” in the Notes to Schedule of Investments and Other Information.
Investment Transactions and Investment Income
Investment transactions are accounted for as of the date purchased or sold (trade date). Dividend income is recorded on the ex-dividend date. Certain dividends from foreign securities will be recorded as soon as the Portfolio is informed of the dividend, if such information is obtained subsequent to the ex-dividend date. Dividends from foreign securities may be subject to withholding taxes in foreign jurisdictions. Interest income is recorded daily on the accrual basis and includes amortization of premiums and accretion of discounts. The Portfolio classifies gains and losses on prepayments received as an adjustment to interest income. Debt securities may be placed in non-accrual status and related interest income may be reduced by stopping current accruals and writing off interest receivables when collection of all or a portion of interest has become doubtful. Gains and losses are determined on the identified cost basis, which is the same basis used for federal income tax purposes. Income, as well as gains and losses, both realized and unrealized, are allocated daily to each class of shares based upon the ratio of net assets represented by each class as a percentage of total net assets.
Expenses
The Portfolio bears expenses incurred specifically on its behalf. Each class of shares bears a portion of general expenses, which are allocated daily to each class of shares based upon the ratio of net assets represented by each class as a percentage of total net assets. Expenses directly attributable to a specific class of shares are charged against the operations of such class.
Estimates
The preparation of financial statements in conformity with US GAAP requires management to make estimates and assumptions that affect the reported amount of assets and liabilities and disclosure of contingent assets and liabilities at the date of the financial statements, and the reported amounts of income and expenses during the reporting period. Actual results could differ from those estimates.
28 | DECEMBER 31, 2020 |
Janus Henderson VIT Flexible Bond Portfolio
Notes to Financial Statements
Indemnifications
In the normal course of business, the Portfolio may enter into contracts that contain provisions for indemnification of other parties against certain potential liabilities. The Portfolio’s maximum exposure under these arrangements is unknown, and would involve future claims that may be made against the Portfolio that have not yet occurred. Currently, the risk of material loss from such claims is considered remote.
Dividends and Distributions
The Portfolio may make semiannual distributions of substantially all of its investment income and an annual distribution of its net realized capital gains (if any).
The Portfolio may make certain investments in real estate investment trusts (“REITs”) which pay dividends to their shareholders based upon funds available from operations. It is quite common for these dividends to exceed the REITs’ taxable earnings and profits, resulting in the excess portion of such dividends being designated as a return of capital. If the Portfolio distributes such amounts, such distributions could constitute a return of capital to shareholders for federal income tax purposes.
Federal Income Taxes
The Portfolio intends to continue to qualify as a regulated investment company and distribute all of its taxable income in accordance with the requirements of Subchapter M of the Internal Revenue Code. Management has analyzed the Portfolio’s tax positions taken for all open federal income tax years, generally a three-year period, and has concluded that no provision for federal income tax is required in the Portfolio’s financial statements. The Portfolio is not aware of any tax positions for which it is reasonably possible that the total amounts of unrecognized tax benefits will significantly change in the next twelve months.
2. Derivative Instruments
The Portfolio may invest in various types of derivatives, which may at times result in significant derivative exposure. A derivative is a financial instrument whose performance is derived from the performance of another asset. The Portfolio may invest in derivative instruments including, but not limited to: futures contracts, put options, call options, options on futures contracts, options on foreign currencies, options on recovery locks, options on security and commodity indices, swaps, forward contracts, structured investments, and other equity-linked derivatives. Each derivative instrument that was held by the Portfolio during the year ended December 31, 2020 is discussed in further detail below. A summary of derivative activity by the Portfolio is reflected in the tables at the end of the Schedule of Investments.
The Portfolio may use derivative instruments for hedging purposes (to offset risks associated with an investment, currency exposure, or market conditions), to adjust currency exposure relative to a benchmark index, or for speculative purposes (to earn income and seek to enhance returns). When the Portfolio invests in a derivative for speculative purposes, the Portfolio will be fully exposed to the risks of loss of that derivative, which may sometimes be greater than the derivative’s cost. The Portfolio may not use any derivative to gain exposure to an asset or class of assets that it would be prohibited by its investment restrictions from purchasing directly. The Portfolio’s ability to use derivative instruments may also be limited by tax considerations.
Investments in derivatives in general are subject to market risks that may cause their prices to fluctuate over time. Investments in derivatives may not directly correlate with the price movements of the underlying instrument. As a result, the use of derivatives may expose the Portfolio to additional risks that it would not be subject to if it invested directly in the securities underlying those derivatives. The use of derivatives may result in larger losses or smaller gains than otherwise would be the case. Derivatives can be volatile and may involve significant risks.
In pursuit of its investment objective, the Portfolio may seek to use derivatives to increase or decrease exposure to the following market risk factors:
· Commodity Risk – the risk related to the change in value of commodities or commodity-linked investments due to changes in the overall market movements, volatility of the underlying benchmark, changes in interest rates, or other factors affecting a particular industry or commodity such as drought, floods, weather, livestock disease, embargoes, tariffs, and international economic, political, and regulatory developments.
· Counterparty Risk – the risk that the counterparty (the party on the other side of the transaction) on a derivative transaction will be unable to honor its financial obligation to the Portfolio.
Janus Aspen Series | 29 |
Janus Henderson VIT Flexible Bond Portfolio
Notes to Financial Statements
· Credit Risk – the risk an issuer will be unable to make principal and interest payments when due, or will default on its obligations.
· Currency Risk – the risk that changes in the exchange rate between currencies will adversely affect the value (in U.S. dollar terms) of an investment.
· Equity Risk – the risk related to the change in value of equity securities as they relate to increases or decreases in the general market.
· Index Risk – if the derivative is linked to the performance of an index, it will be subject to the risks associated with changes in that index. If the index changes, the Portfolio could receive lower interest payments or experience a reduction in the value of the derivative to below what the Portfolio paid. Certain indexed securities, including inverse securities (which move in an opposite direction to the index), may create leverage, to the extent that they increase or decrease in value at a rate that is a multiple of the changes in the applicable index.
· Interest Rate Risk – the risk that the value of fixed-income securities will generally decline as prevailing interest rates rise, which may cause the Portfolio’s NAV to likewise decrease.
· Leverage Risk – the risk associated with certain types of leveraged investments or trading strategies pursuant to which relatively small market movements may result in large changes in the value of an investment. The Portfolio creates leverage by investing in instruments, including derivatives, where the investment loss can exceed the original amount invested. Certain investments or trading strategies, such as short sales, that involve leverage can result in losses that greatly exceed the amount originally invested.
· Liquidity Risk – the risk that certain securities may be difficult or impossible to sell at the time that the seller would like or at the price that the seller believes the security is currently worth.
Derivatives may generally be traded OTC or on an exchange. Derivatives traded OTC are agreements that are individually negotiated between parties and can be tailored to meet a purchaser’s needs. OTC derivatives are not guaranteed by a clearing agency and may be subject to increased credit risk.
In an effort to mitigate credit risk associated with derivatives traded OTC, the Portfolio may enter into collateral agreements with certain counterparties whereby, subject to certain minimum exposure requirements, the Portfolio may require the counterparty to post collateral if the Portfolio has a net aggregate unrealized gain on all OTC derivative contracts with a particular counterparty. Additionally, the Portfolio may deposit cash and/or treasuries as collateral with the counterparty and/or custodian daily (based on the daily valuation of the financial asset) if the Portfolio has a net aggregate unrealized loss on OTC derivative contracts with a particular counterparty. All liquid securities and restricted cash are considered to cover in an amount at all times equal to or greater than the Portfolio’s commitment with respect to certain exchange-traded derivatives, centrally cleared derivatives, forward foreign currency exchange contracts, short sales, and/or securities with extended settlement dates. There is no guarantee that counterparty exposure is reduced and these arrangements are dependent on Janus Capital Management LLC's ("Janus Capital") ability to establish and maintain appropriate systems and trading.
Futures Contracts
A futures contract is an exchange-traded agreement to take or make delivery of an underlying asset at a specific time in the future for a specific predetermined negotiated price. The Portfolio may enter into futures contracts to gain exposure to the stock market or other markets pending investment of cash balances or to meet liquidity needs. The Portfolio is subject to interest rate risk, equity risk, and currency risk in the normal course of pursuing its investment objective through its investments in futures contracts. The Portfolio may also use such derivative instruments to hedge or protect from adverse movements in securities prices, currency rates or interest rates. The use of futures contracts may involve risks such as the possibility of illiquid markets or imperfect correlation between the values of the contracts and the underlying securities, or that the counterparty will fail to perform its obligations.
Futures contracts on commodities are valued at the settlement price on valuation date on the commodities exchange as reported by an approved vendor. Mini contracts, as defined in the description of the contract, shall be valued using the Actual Settlement Price or “ASET” price type as reported by an approved vendor. In the event that foreign futures trade when the foreign equity markets are closed, the last foreign futures trade price shall be used.
Futures contracts are marked-to-market daily, and the daily variation margin is recorded as a receivable or payable on the Statement of Assets and Liabilities (if applicable). The change in unrealized net appreciation/depreciation is
30 | DECEMBER 31, 2020 |
Janus Henderson VIT Flexible Bond Portfolio
Notes to Financial Statements
reported on the Statement of Operations (if applicable). When a contract is closed, a realized gain or loss is reported on the Statement of Operations (if applicable), equal to the difference between the opening and closing value of the contract.
Securities held by the Portfolio that are designated as collateral for market value on futures contracts are noted on the Schedule of Investments (if applicable). Such collateral is in the possession of the Portfolio’s futures commission merchant.
With futures, there is minimal counterparty credit risk to the Portfolio since futures are exchange-traded and the exchange’s clearinghouse, as counterparty to all exchange-traded futures, guarantees the futures against default.
During the year, the Portfolio purchased interest rate futures to increase exposure to interest rate risk.
During the year, the Portfolio sold interest rate futures to decrease exposure to interest rate risk.
3. Other Investments and Strategies
Additional Investment Risk
The Portfolio may be invested in lower-rated debt securities that have a higher risk of default or loss of value since these securities may be sensitive to economic changes, political changes, or adverse developments specific to the issuer.
In the aftermath of the 2007-2008 financial crisis, the financial sector experienced reduced liquidity in credit and other fixed-income markets, and an unusually high degree of volatility, both domestically and internationally. In response to the crisis, the United States and certain foreign governments, along with the U.S. Federal Reserve and certain foreign central banks, took a number of unprecedented steps designed to support the financial markets. For example, the enactment of the Dodd-Frank Act in 2010 provided for widespread regulation of financial institutions, consumer financial products and services, broker-dealers, over-the-counter derivatives, investment advisers, credit rating agencies, and mortgage lending, which expanded federal oversight in the financial sector, including the investment management industry. More recently, in response to the COVID-19 pandemic, the U.S. government and the Federal Reserve, as well as certain foreign governments and central banks, have taken extraordinary actions to support local and global economies and the financial markets, including reducing interest rates to record-low levels. Extremely low or negative interest rates may become more prevalent or may not work as intended. As there is little precedent for this situation, the impact on various markets that interest rate or other significant policy changes may have is unknown. The withdrawal of this support, a failure of measures put in place in response to such economic uncertainty, or investor perception that such efforts were not sufficient could each negatively affect financial markets generally, and the value and liquidity of specific securities. In addition, policy and legislative changes in the United States and in other countries continue to impact many aspects of financial regulation.
Widespread disease, including pandemics and epidemics, and natural or environmental disasters, such as earthquakes, fires, floods, hurricanes, tsunamis and weather-related phenomena generally, have been and can be highly disruptive to economies and markets, adversely impacting individual companies, sectors, industries, markets, currencies, interest and inflation rates, credit ratings, investor sentiment, and other factors affecting the value of a Fund’s investments. Economies and financial markets throughout the world have become increasingly interconnected, which increases the likelihood that events or conditions in one region or country will adversely affect markets or issuers in other regions or countries, including the United States. These disruptions could prevent a Fund from executing advantageous investment decisions in a timely manner and negatively impact a Fund’s ability to achieve its investment objective(s). Any such event(s) could have a significant adverse impact on the value of a Fund. In addition, these disruptions could also impair the information technology and other operational systems upon which the Fund’s service providers, including Janus Capital or the subadviser (as applicable), rely, and could otherwise disrupt the ability of employees of the Fund’s service providers to perform essential tasks on behalf of the Fund. Adverse weather conditions may also have a particularly significant negative effect on issuers in the agricultural sector and on insurance and reinsurance companies that insure or reinsure against the impact of natural disasters.
A number of countries in the European Union (the “EU”) have experienced, and may continue to experience, severe economic and financial difficulties. In particular, many EU nations are susceptible to economic risks associated with high levels of debt. Many non-governmental issuers, and even certain governments, have defaulted on, or been forced to restructure, their debts. Many other issuers have faced difficulties obtaining credit or refinancing existing obligations. Financial institutions have in many cases required government or central bank support, have needed to raise capital,
Janus Aspen Series | 31 |
Janus Henderson VIT Flexible Bond Portfolio
Notes to Financial Statements
and/or have been impaired in their ability to extend credit. As a result, financial markets in the EU have experienced extreme volatility and declines in asset values and liquidity. These difficulties may continue, worsen, or spread further within the EU. Responses to these financial problems by European governments, central banks, and others, including austerity measures and reforms, may not work, may result in social unrest, and may limit future growth and economic recovery or have other unintended consequences. The risk of investing in securities in the European markets may also be heightened due to the referendum in which the United Kingdom voted to exit the EU, commonly known as “Brexit,” which immediately led to significant market volatility around the world, as well as political, economic and legal uncertainty. The United Kingdom formally left the EU on January 31, 2020 and entered into an eleven-month transition period, which expired on December 31, 2020. The negative impact on not only the United Kingdom and European economies could be significant, potentially resulting in increased volatility and illiquidity and lower economic growth for companies that rely significantly on the United Kingdom and/or Europe for their business activities and revenues. Any further exits from the EU, or an increase in the belief that such exits are likely or possible, would likely cause additional market disruption globally and introduce new legal and regulatory uncertainties.
LIBOR Replacement Risk
The Fund may invest in certain debt securities, derivatives or other financial instruments that utilize the London Interbank Offered Rate (LIBOR) as a reference rate for various rate calculations. On July 27, 2017, the U.K. Financial Conduct Authority announced that it intends to stop compelling or inducing banks to submit LIBOR rates after 2021. However, it remains unclear if LIBOR will continue to exist in its current, or a modified, form. Actions by regulators have resulted in the establishment of alternative reference rates to LIBOR in most major currencies. The U.S. Federal Reserve, based on the recommendations of the New York Federal Reserve’s Alternative Reference Rate Committee (comprised of major derivative market participants and their regulators), has begun publishing a Secured Overnight Financing Rate (SOFR), that is intended to replace U.S. dollar LIBOR. Proposals for alternative reference rates for other currencies have also been announced or have already begun publication. However, global consensus on alternative rates is lacking. The elimination of LIBOR or changes to other reference rates or any other changes or reforms to the determination or supervision of reference rates could adversely impact (i) volatility and liquidity in markets that are tied to LIBOR, (ii) the market for, or value of, specific securities or payments linked to those reference rates, (iii) availability or terms of borrowing or refinancing, or (iv) the effectiveness of hedging strategies. For these and other reasons, the elimination of LIBOR or changes to other interest rates may adversely affect the Fund’s performance and/or net asset value. Since the usefulness of LIBOR as a benchmark could deteriorate during the transition period, these effects could occur prior to the end of 2021. Markets are slowly developing in response to these new rates. Uncertainty regarding the process for amending existing contracts or instruments to transition away from LIBOR remains a concern for the Fund. The effect of any changes to, or discontinuation of, LIBOR on the Fund will vary depending, among other things, on (1) existing fallback or termination provisions in individual contracts and (2) whether, how, and when industry participants develop and adopt new reference rates and fallbacks for both legacy and new products and instruments. Accordingly, it is difficult to predict the full impact of the transition away from LIBOR on the Fund until new reference rates and fallbacks for both legacy and new products, instruments and contracts are commercially accepted.
Counterparties
Portfolio transactions involving a counterparty are subject to the risk that the counterparty or a third party will not fulfill its obligation to the Portfolio (“counterparty risk”). Counterparty risk may arise because of the counterparty’s financial condition (i.e., financial difficulties, bankruptcy, or insolvency), market activities and developments, or other reasons, whether foreseen or not. A counterparty’s inability to fulfill its obligation may result in significant financial loss to the Portfolio. The Portfolio may be unable to recover its investment from the counterparty or may obtain a limited recovery, and/or recovery may be delayed. The extent of the Portfolio’s exposure to counterparty risk with respect to financial assets and liabilities approximates its carrying value.
The Portfolio may be exposed to counterparty risk through participation in various programs, including, but not limited to, lending its securities to third parties, cash sweep arrangements whereby the Portfolio’s cash balance is invested in one or more types of cash management vehicles, as well as investments in, but not limited to, repurchase agreements, debt securities, and derivatives, including various types of swaps, futures and options. The Portfolio intends to enter into financial transactions with counterparties that Janus Capital believes to be creditworthy at the time of the transaction. There is always the risk that Janus Capital’s analysis of a counterparty’s creditworthiness is incorrect or may change due to market conditions. To the extent that the Portfolio focuses its transactions with a limited number of counterparties, it will have greater exposure to the risks associated with one or more counterparties.
32 | DECEMBER 31, 2020 |
Janus Henderson VIT Flexible Bond Portfolio
Notes to Financial Statements
Inflation-Linked Securities
The Portfolio may invest in inflation-indexed bonds, including municipal inflation-indexed bonds and corporate inflation-indexed bonds, or in derivatives that are linked to these securities. Inflation-linked bonds are fixed-income securities that have a principal value that is periodically adjusted according to the rate of inflation. If an index measuring inflation falls, the principal value of inflation-indexed bonds will typically be adjusted downward, and consequently the interest payable on these securities (calculated with respect to a smaller principal amount) will be reduced. Because of their inflation adjustment feature, inflation-linked bonds typically have lower yields than conventional fixed-rate bonds. In addition, inflation-linked bonds also normally decline in price when real interest rates rise. In the event of deflation, when prices decline over time, the principal and income of inflation-linked bonds would likely decline, resulting in losses to the Portfolio.
In the case of Treasury Inflation-Protected Securities, also known as TIPS, repayment of original bond principal upon maturity (as adjusted for inflation) is guaranteed by the U.S. Treasury. For inflation-linked bonds that do not provide a similar guarantee, the adjusted principal value of the inflation-linked bond repaid at maturity may be less than the original principal. Other non-U.S. sovereign governments also issue inflation-linked securities (sometimes referred to as “linkers”) that are tied to their own local consumer price indices. In certain of these non-U.S. jurisdictions, the repayment of the original bond principal upon the maturity of an inflation-linked bond is not guaranteed, allowing for the amount of the bond repaid at maturity to be less than par. Inflation-linked bonds may also be issued by, or related to, sovereign governments of other developed countries, emerging market countries, or companies or other entities not affiliated with governments.
Loans
The Portfolio may invest in various commercial loans, including bank loans, bridge loans, debtor-in-possession (“DIP”) loans, mezzanine loans, and other fixed and floating rate loans. These loans may be acquired through loan participations and assignments or on a when-issued basis. Commercial loans will comprise no more than 20% of the Portfolio’s total assets. Below are descriptions of the types of loans held by the Portfolio as of December 31, 2020.
· Bank Loans - Bank loans are obligations of companies or other entities entered into in connection with recapitalizations, acquisitions, and refinancings. The Portfolio’s investments in bank loans are generally acquired as a participation interest in, or assignment of, loans originated by a lender or other financial institution. These investments may include institutionally-traded floating and fixed-rate debt securities.
· Floating Rate Loans – Floating rate loans are debt securities that have floating interest rates, that adjust periodically, and are tied to a benchmark lending rate, such as London Interbank Offered Rate (“LIBOR”). In other cases, the lending rate could be tied to the prime rate offered by one or more major U.S. banks or the rate paid on large certificates of deposit traded in the secondary markets. If the benchmark lending rate changes, the rate payable to lenders under the loan will change at the next scheduled adjustment date specified in the loan agreement. Floating rate loans are typically issued to companies (‘‘borrowers’’) in connection with recapitalizations, acquisitions, and refinancings. Floating rate loan investments are generally below investment grade. Senior floating rate loans are secured by specific collateral of a borrower and are senior in the borrower’s capital structure. The senior position in the borrower’s capital structure generally gives holders of senior loans a claim on certain of the borrower’s assets that is senior to subordinated debt and preferred and common stock in the case of a borrower’s default. Floating rate loan investments may involve foreign borrowers, and investments may be denominated in foreign currencies. Floating rate loans often involve borrowers whose financial condition is troubled or uncertain and companies that are highly leveraged. The Portfolio may invest in obligations of borrowers who are in bankruptcy proceedings. While the Portfolio generally expects to invest in fully funded term loans, certain of the loans in which the Portfolio may invest include revolving loans, bridge loans, and delayed draw term loans.
Purchasers of floating rate loans may pay and/or receive certain fees. The Portfolio may receive fees such as covenant waiver fees or prepayment penalty fees. The Portfolio may pay fees such as facility fees. Such fees may affect the Portfolio’s return.
· Mezzanine Loans - Mezzanine loans are secured by the stock of the company that owns the assets. Mezzanine loans are a hybrid of debt and equity financing that is typically used to fund the expansion of existing companies. A mezzanine loan is composed of debt capital that gives the lender the right to convert to
Janus Aspen Series | 33 |
Janus Henderson VIT Flexible Bond Portfolio
Notes to Financial Statements
an ownership or equity interest in the company if the loan is not paid back in time and in full. Mezzanine loans typically are the most subordinated debt obligation in an issuer’s capital structure.
Mortgage- and Asset-Backed Securities
Mortgage- and asset-backed securities represent interests in “pools” of commercial or residential mortgages or other assets, including consumer and commercial loans or receivables. The Portfolio may purchase fixed or variable rate commercial or residential mortgage-backed securities issued by the Government National Mortgage Association (“Ginnie Mae”), the Federal National Mortgage Association (“Fannie Mae”), the Federal Home Loan Mortgage Corporation (“Freddie Mac”), or other governmental or government-related entities. Ginnie Mae’s guarantees are backed as to the timely payment of principal and interest by the full faith and credit of the U.S. Government. Fannie Mae and Freddie Mac securities are not backed by the full faith and credit of the U.S. Government. In September 2008, the Federal Housing Finance Agency (“FHFA”), an agency of the U.S. Government, placed Fannie Mae and Freddie Mac under conservatorship. Since that time, Fannie Mae and Freddie Mac have received capital support through U.S. Treasury preferred stock purchases and Treasury and Federal Reserve purchases of their mortgage-backed securities. The FHFA and the U.S. Treasury have imposed strict limits on the size of these entities’ mortgage portfolios. The FHFA has the power to cancel any contract entered into by Fannie Mae and Freddie Mac prior to FHFA’s appointment as conservator or receiver, including the guarantee obligations of Fannie Mae and Freddie Mac.
The Portfolio may also purchase other mortgage- and asset-backed securities through single- and multi-seller conduits, collateralized debt obligations, structured investment vehicles, and other similar securities. Asset-backed securities may be backed by various consumer obligations, including automobile loans, equipment leases, credit card receivables, or other collateral. In the event the underlying loans are not paid, the securities’ issuer could be forced to sell the assets and recognize losses on such assets, which could impact your return. Unlike traditional debt instruments, payments on these securities include both interest and a partial payment of principal. Mortgage- and asset-backed securities are subject to both extension risk, where borrowers pay off their debt obligations more slowly in times of rising interest rates, and prepayment risk, where borrowers pay off their debt obligations sooner than expected in times of declining interest rates. These risks may reduce the Portfolio’s returns. In addition, investments in mortgage- and asset-backed securities, including those comprised of subprime mortgages, may be subject to a higher degree of credit risk, valuation risk, extension risk (if interest rates rise), and liquidity risk than various other types of fixed-income securities. Additionally, although mortgage-backed securities are generally supported by some form of government or private guarantee and/or insurance, there is no assurance that guarantors or insurers will meet their obligations.
Offsetting Assets and Liabilities
The Portfolio presents gross and net information about transactions that are either offset in the financial statements or subject to an enforceable master netting arrangement or similar agreement with a designated counterparty, regardless of whether the transactions are actually offset in the Statement of Assets and Liabilities.
In order to better define its contractual rights and to secure rights that will help the Portfolio mitigate its counterparty risk, the Portfolio has entered into an International Swaps and Derivatives Association, Inc. Master Agreement (“ISDA Master Agreement”) or similar agreement with its derivative contract counterparties. An ISDA Master Agreement is a bilateral agreement between the Portfolio and a counterparty that governs OTC derivatives and forward foreign currency exchange contracts and typically contains, among other things, collateral posting terms and netting provisions in the event of a default and/or termination event. Under an ISDA Master Agreement, in the event of a default and/or termination event, the Portfolio may offset with each counterparty certain derivative financial instruments’ payables and/or receivables with collateral held and/or posted and create one single net payment.
The following table presents gross amounts of recognized assets and/or liabilities and the net amounts after deducting collateral that has been pledged by counterparties or has been pledged to counterparties (if applicable). For corresponding information grouped by type of instrument, see the “Fair Value of Derivative Instruments (not accounted for as hedging instruments) as of December 31, 2020” table located in the Portfolio’s Schedule of Investments.
34 | DECEMBER 31, 2020 |
Janus Henderson VIT Flexible Bond Portfolio
Notes to Financial Statements
Offsetting of Financial Assets and Derivative Assets | |||||||||
Gross Amounts | |||||||||
of Recognized | Offsetting Asset | Collateral | |||||||
Counterparty | Assets | or Liability(a) | Pledged(b) | Net Amount | |||||
JPMorgan Chase Bank, National Association | $ | 138,370 | $ | — | $ | (138,370) | $ | — | |
(a) | Represents the amount of assets or liabilities that could be offset with the same counterparty under master netting or similar agreements that management elects not to offset on the Statement of Assets and Liabilities. | ||||||||
(b) | Collateral pledged is limited to the net outstanding amount due to/from an individual counterparty. The actual collateral amounts pledged may exceed these amounts and may fluctuate in value. | ||||||||
JPMorgan Chase Bank, National Association acts as securities lending agent and a limited purpose custodian or subcustodian to receive and disburse cash balances and cash collateral, hold short-term investments, hold collateral, and perform other custodial functions in accordance with the Non-Custodial Securities Lending Agreement. For financial reporting purposes, the Portfolio does not offset financial instruments' payables and receivables and related collateral on the Statement of Assets and Liabilities. Securities on loan will be continuously secured by collateral which may consist of cash, U.S. Government securities, domestic and foreign short-term debt instruments, letters of credit, time deposits, repurchase agreements, money market mutual funds or other money market accounts, or such other collateral as permitted by the Securities and Exchange Commission (the “SEC”). See “Securities Lending” in the “Notes to Financial Statements” for additional information.
Real Estate Investing
The Portfolio may invest in equity and debt securities of real estate-related companies. Such companies may include those in the real estate industry or real estate-related industries. These securities may include common stocks, corporate bonds, preferred stocks, and other equity securities, including, but not limited to, mortgage-backed securities, real estate-backed securities, securities of REITs and similar REIT-like entities. A REIT is a trust that invests in real estate-related projects, such as properties, mortgage loans, and construction loans. REITs are generally categorized as equity, mortgage, or hybrid REITs. A REIT may be listed on an exchange or traded OTC.
Securities Lending
Under procedures adopted by the Trustees, the Portfolio may seek to earn additional income by lending securities to certain qualified broker-dealers and institutions. JPMorgan Chase Bank, National Association acts as securities lending agent and a limited purpose custodian or subcustodian to receive and disburse cash balances and cash collateral, hold short-term investments, hold collateral, and perform other custodial functions in accordance with the Non-Custodial Securities Lending Agreement. The Portfolio may lend portfolio securities in an amount equal to up to 1/3 of its total assets as determined at the time of the loan origination. There is the risk of delay in recovering a loaned security or the risk of loss in collateral rights if the borrower fails financially. In addition, Janus Capital makes efforts to balance the benefits and risks from granting such loans. All loans will be continuously secured by collateral which may consist of cash, U.S. Government securities, domestic and foreign short-term debt instruments, letters of credit, time deposits, repurchase agreements, money market mutual funds or other money market accounts, or such other collateral as permitted by the SEC. If the Portfolio is unable to recover a security on loan, the Portfolio may use the collateral to purchase replacement securities in the market. There is a risk that the value of the collateral could decrease below the cost of the replacement security by the time the replacement investment is made, resulting in a loss to the Portfolio. In certain circumstances individual loan transactions could yield negative returns.
Upon receipt of cash collateral, Janus Capital may invest it in affiliated or non-affiliated cash management vehicles, whether registered or unregistered entities, as permitted by the 1940 Act and rules promulgated thereunder. Janus Capital currently intends to primarily invest the cash collateral in a cash management vehicle for which Janus Capital serves as investment adviser, Janus Henderson Cash Collateral Fund LLC, or in time deposits. An investment in Janus Henderson Cash Collateral Fund LLC is generally subject to the same risks that shareholders experience when investing in similarly structured vehicles, such as the potential for significant fluctuations in assets as a result of the purchase and redemption activity of the securities lending program, a decline in the value of the collateral, and possible
Janus Aspen Series | 35 |
Janus Henderson VIT Flexible Bond Portfolio
Notes to Financial Statements
liquidity issues. Such risks may delay the return of the cash collateral and cause the Portfolio to violate its agreement to return the cash collateral to a borrower in a timely manner. As adviser to the Portfolio and Janus Henderson Cash Collateral Fund LLC, Janus Capital has an inherent conflict of interest as a result of its fiduciary duties to both the Portfolio and Janus Henderson Cash Collateral Fund LLC. Additionally, Janus Capital receives an investment advisory fee of 0.05% for managing Janus Henderson Cash Collateral Fund LLC, but it may not receive a fee for managing certain other affiliated cash management vehicles in which the Portfolio may invest, and therefore may have an incentive to allocate preferred investment opportunities to investment vehicles for which it is receiving a fee.
The value of the collateral must be at least 102% of the market value of the loaned securities that are denominated in U.S. dollars and 105% of the market value of the loaned securities that are not denominated in U.S. dollars. Loaned securities and related collateral are marked-to-market each business day based upon the market value of the loaned securities at the close of business, employing the most recent available pricing information. Collateral levels are then adjusted based on this mark-to-market evaluation.
The cash collateral invested by Janus Capital is disclosed in the Schedule of Investments (if applicable).
Income earned from the investment of the cash collateral, net of rebates paid to, or fees paid by, borrowers and less the fees paid to the lending agent are included as “Affiliated securities lending income, net” on the Statement of Operations. As of December 31, 2020, securities lending transactions accounted for as secured borrowings with an overnight and continuous contractual maturity are $138,370. Gross amounts of recognized liabilities for securities lending (collateral received) as of December 31, 2020 is $142,138, resulting in the net amount due to the counterparty of $3,768.
Sovereign Debt
The Portfolio may invest in U.S. and non-U.S. government debt securities (“sovereign debt”). Some investments in sovereign debt, such as U.S. sovereign debt, are considered low risk. However, investments in sovereign debt, especially the debt of less developed countries, can involve a high degree of risk, including the risk that the governmental entity that controls the repayment of sovereign debt may not be willing or able to repay the principal and/or to pay the interest on its sovereign debt in a timely manner. A sovereign debtor’s willingness or ability to satisfy its debt obligation may be affected by various factors including, but not limited to, its cash flow situation, the extent of its foreign currency reserves, the availability of foreign exchange when a payment is due, the relative size of its debt position in relation to its economy as a whole, the sovereign debtor’s policy toward international lenders, and local political constraints to which the governmental entity may be subject. Sovereign debtors may also be dependent on expected disbursements from foreign governments, multilateral agencies, and other entities. The failure of a sovereign debtor to implement economic reforms, achieve specified levels of economic performance, or repay principal or interest when due may result in the cancellation of third party commitments to lend funds to the sovereign debtor, which may further impair such debtor’s ability or willingness to timely service its debts. The Portfolio may be requested to participate in the rescheduling of such sovereign debt and to extend further loans to governmental entities, which may adversely affect the Portfolio’s holdings. In the event of default, there may be limited or no legal remedies for collecting sovereign debt and there may be no bankruptcy proceedings through which the Portfolio may collect all or part of the sovereign debt that a governmental entity has not repaid. In addition, to the extent the Portfolio invests in non-U.S. sovereign debt, it may be subject to currency risk.
TBA Commitments
The Portfolio may enter into “to be announced” or “TBA” commitments. TBAs are forward agreements for the purchase or sale of securities, including mortgage-backed securities, for a fixed price, with payment and delivery on an agreed upon future settlement date. The specific securities to be delivered are not identified at the trade date. However, delivered securities must meet specified terms, including issuer, rate, and mortgage terms. Although the particular TBA securities must meet industry-accepted “good delivery” standards, there can be no assurance that a security purchased on forward commitment basis will ultimately be issued or delivered by the counterparty. During the settlement period, the Portfolio will still bear the risk of any decline in the value of the security to be delivered. Because TBA commitments do not require the purchase and sale of identical securities, the characteristics of the security delivered to the Portfolio may be less favorable than the security delivered to the dealer. If the counterparty to a transaction fails to deliver the security, the Portfolio could suffer a loss.
When-Issued, Delayed Delivery and Forward Commitment Transactions
The Portfolio may purchase or sell securities on a when-issued, delayed delivery, or forward commitment basis. When purchasing a security on a when-issued, delayed delivery, or forward commitment basis, the Portfolio assumes the rights
36 | DECEMBER 31, 2020 |
Janus Henderson VIT Flexible Bond Portfolio
Notes to Financial Statements
and risks of ownership of the security, including the risk of price and yield fluctuations, and takes such fluctuations into account when determining its net asset value. Typically, no income accrues on securities the Portfolio has committed to purchase prior to the time delivery of the securities is made. Because the Portfolio is not required to pay for the security until the delivery date, these risks are in addition to the risks associated with the Portfolio’s other investments. If the other party to a transaction fails to deliver the securities, the Portfolio could miss a favorable price or yield opportunity. If the Portfolio remains substantially fully invested at a time when when-issued, delayed delivery, or forward commitment purchases are outstanding, the purchases may result in a form of leverage.
When the Portfolio has sold a security on a when-issued, delayed delivery, or forward commitment basis, the Portfolio does not participate in future gains or losses with respect to the security. If the other party to a transaction fails to pay for the securities, the Portfolio could suffer a loss. Additionally, when selling a security on a when-issued, delayed delivery, or forward commitment basis without owning the security, the Portfolio will incur a loss if the security’s price appreciates in value such that the security’s price is above the agreed upon price on the settlement date. The Portfolio may dispose of or renegotiate a transaction after it is entered into, and may purchase or sell when-issued, delayed delivery or forward commitment securities before the settlement date, which may result in a gain or loss.
4. Investment Advisory Agreements and Other Transactions with Affiliates
The Portfolio pays Janus Capital an investment advisory fee which is calculated daily and paid monthly. The following table reflects the Portfolio’s contractual investment advisory fee rate (expressed as an annual rate).
Average Daily Net Assets of the Portfolio | Contractual Investment Advisory Fee (%) |
First $300 Million | 0.55 |
Over $300 Million | 0.45 |
The Fund’s actual investment advisory fee rate for the reporting period was 0.50% of average annual net assets before any applicable waivers.
Janus Capital has contractually agreed to waive the advisory fee payable by the Portfolio or reimburse expenses in an amount equal to the amount, if any, that the Portfolio’s total annual fund operating expenses, including the investment advisory fee, but excluding the 12b-1 distribution and shareholder servicing fees (applicable to Service Shares), transfer agent fees and expenses payable pursuant to the Transfer Agency Agreement, brokerage commissions, interest, dividends, taxes, acquired fund fees and expenses, and extraordinary expenses, exceed the annual rate of 0.52% of the Portfolio’s average daily net assets. Janus Capital has agreed to continue the waivers for at least a one-year period commencing April 29, 2020. The previous expense limit (until at least May 1, 2020) was 0.57%. If applicable, amounts waived and/or reimbursed to the Portfolio by Janus Capital are disclosed as “Excess Expense Reimbursement and Waivers” on the Statement of Operations.
Janus Services LLC (“Janus Services”), a wholly-owned subsidiary of Janus Capital, is the Portfolio’s transfer agent. Janus Services receives an administrative services fee at an annual rate of 0.05% of the average daily net assets of the Portfolio for arranging for the provision by participating insurance companies and qualified plan service providers of administrative services, including recordkeeping, subaccounting, order processing, or other shareholder services provided on behalf of contract holders or plan participants investing in the Portfolio. Other shareholder services may include the provision of order confirmations, periodic account statements, forwarding prospectuses, shareholder reports, and other materials to existing investors, and answering inquiries regarding accounts. Janus Services expects to use this entire fee to compensate insurance companies and qualified plan service providers for providing these services to their customers who invest in the Portfolio. Any unused portion will be reimbursed to the applicable share class at least annually.
In addition, Janus Services provides or arranges for the provision of certain other internal administrative, recordkeeping, and shareholder relations services for the Portfolio. Janus Services is not compensated for these internal services related to the shares, except for out-of-pocket costs. These amounts are disclosed as “Other transfer agent fees and expenses” on the Statement of Operations.
Under a distribution and shareholder servicing plan (the “Plan”) adopted in accordance with Rule 12b-1 under the 1940 Act, the Service Shares may pay the Trust’s distributor, Janus Distributors LLC (“Janus Distributors”), a wholly-owned subsidiary of Janus Capital, a fee for the sale and distribution and/or shareholder servicing of the Service Shares at an
Janus Aspen Series | 37 |
Janus Henderson VIT Flexible Bond Portfolio
Notes to Financial Statements
annual rate of up to 0.25% of the average daily net assets of the Service Shares. Under the terms of the Plan, the Trust is authorized to make payments to Janus Distributors for remittance to insurance companies and qualified plan service providers as compensation for distribution and/or shareholder services performed by such entities. These amounts are disclosed as “12b-1 Distribution and shareholder servicing fees” on the Statement of Operations. Payments under the Plan are not tied exclusively to actual 12b-1 distribution and servicing fees, and the payments may exceed 12b-1 distribution and servicing fees actually incurred. If any of the Portfolio’s actual 12b-1 distribution and servicing fees incurred during a calendar year are less than the payments made during a calendar year, the Portfolio will be refunded the difference. Refunds, if any, are included in “12b-1 Distribution and shareholder servicing fees” in the Statement of Operations.
Janus Capital serves as administrator to the Portfolio pursuant to an administration agreement between Janus Capital and the Trust. Under the administration agreement, Janus Capital is obligated to provide or arrange for the provision of certain administration, compliance, and accounting services to the Portfolio, including providing office space for the Portfolio, and is reimbursed by the Portfolio for certain of its costs in providing these services (to the extent Janus Capital seeks reimbursement and such costs are not otherwise waived). In addition, employees of Janus Capital and/or its affiliates may serve as officers of the Trust. The Portfolio pays for some or all of the salaries, fees, and expenses of Janus Capital employees and Portfolio officers, with respect to certain specified administration functions they perform on behalf of the Portfolio. The Portfolio pays these costs based on out-of-pocket expenses incurred by Janus Capital, and these costs are separate and apart from advisory fees and other expenses paid in connection with the investment advisory services Janus Capital (or any subadvisor, as applicable) provides to the Portfolio. These amounts are disclosed as “Affiliated portfolio administration fees” on the Statement of Operations. In addition, some expenses related to compensation payable to the Portfolio’s Chief Compliance Officer and certain compliance staff, all of whom are employees of Janus Capital and/or its affiliates, are shared with the Portfolio. Total compensation of $34,973 was paid to the Chief Compliance Officer and certain compliance staff by the Trust during the year ended December 31, 2020. The Portfolio's portion is reported as part of “Other expenses” on the Statement of Operations.
The Board of Trustees has adopted a deferred compensation plan (the “Deferred Plan”) for independent Trustees to elect to defer receipt of all or a portion of the annual compensation they are entitled to receive from the Portfolio. All deferred fees are credited to an account established in the name of the Trustees. The amounts credited to the account then increase or decrease, as the case may be, in accordance with the performance of one or more of the Janus Henderson funds that are selected by the Trustees. The account balance continues to fluctuate in accordance with the performance of the selected fund or funds until final payment of all amounts are credited to the account. The fluctuation of the account balance is recorded by the Portfolio as unrealized appreciation/(depreciation) and is included as of December 31, 2020 on the Statement of Assets and Liabilities in the asset, “Non-interested Trustees’ deferred compensation,” and liability, “Non-interested Trustees’ deferred compensation fees.” Additionally, the recorded unrealized appreciation/(depreciation) is included in “Total distributable earnings (loss)” on the Statement of Assets and Liabilities. Deferred compensation expenses for the year ended December 31, 2020 are included in “Non-interested Trustees’ fees and expenses” on the Statement of Operations. Trustees are allowed to change their designation of mutual funds from time to time. Amounts will be deferred until distributed in accordance with the Deferred Plan. Deferred fees of $471,450 were paid by the Trust to the Trustees under the Deferred Plan during the year ended December 31, 2020.
Pursuant to the provisions of the 1940 Act and related rules, the Portfolio may participate in an affiliated or non-affiliated cash sweep program. In the cash sweep program, uninvested cash balances of the Portfolio may be used to purchase shares of affiliated or non-affiliated money market funds or cash management pooled investment vehicles that operate as money market funds. The Portfolio is eligible to participate in the cash sweep program (the “Investing Funds”). As adviser, Janus Capital has an inherent conflict of interest because of its fiduciary duties to the affiliated money market funds or cash management pooled investment vehicles and the Investing Funds. Janus Henderson Cash Liquidity Fund LLC (the “Sweep Vehicle”) is an affiliated unregistered cash management pooled investment vehicle that invests primarily in highly-rated short-term fixed-income securities. The Sweep Vehicle operates pursuant to the provisions of the 1940 Act that govern the operation of money market funds and prices its shares at NAV reflecting market-based values of its portfolio securities (i.e., a “floating” NAV) rounded to the fourth decimal place (e.g., $1.0000). The Sweep Vehicle is permitted to impose a liquidity fee (of up to 2%) on redemptions from the Sweep Vehicle or a redemption gate that temporarily suspends redemptions from the Sweep Vehicle for up to 10 business days during a 90 day period. There are no restrictions on the Portfolio's ability to withdraw investments from the Sweep Vehicle at will,
38 | DECEMBER 31, 2020 |
Janus Henderson VIT Flexible Bond Portfolio
Notes to Financial Statements
and there are no unfunded capital commitments due from the Portfolio to the Sweep Vehicle. The Sweep Vehicle does not charge any management fee, sales charge or service fee.
Any purchases and sales, realized gains/losses and recorded dividends from affiliated investments during the year ended December 31, 2020 can be found in the “Schedules of Affiliated Investments” located in the Schedule of Investments.
The Portfolio is permitted to purchase or sell securities (“cross-trade”) between itself and other funds or accounts managed by Janus Capital in accordance with Rule 17a-7 under the Investment Company Act of 1940 (“Rule 17a-7”), when the transaction is consistent with the investment objectives and policies of the Portfolio and in accordance with the Internal Cross Trade Procedures adopted by the Trust’s Board of Trustees. These procedures have been designed to ensure that any cross-trade of securities by the Portfolio from or to another fund or account that is or could be considered an affiliate of the Portfolio under certain limited circumstances by virtue of having a common investment adviser, common Officer, or common Trustee complies with Rule 17a-7. Under these procedures, each cross-trade is effected at the current market price to save costs where allowed. During the year ended December 31, 2020, the Portfolio engaged in cross trades amounting to $3,136,715 in purchases and $8,143,228 in sales, resulting in a net realized gain of $475,464. The net realized gain is included within the “Net Realized Gain/(Loss) on Investments” section of the Portfolio’s Statement of Operations.
5. Federal Income Tax
The tax components of capital shown in the table below represent: (1) distribution requirements the Portfolio must satisfy under the income tax regulations; (2) losses or deductions the Portfolio may be able to offset against income and gains realized in future years; and (3) unrealized appreciation or depreciation of investments for federal income tax purposes.
Other book to tax differences primarily consist of deferred compensation. The Portfolio has elected to treat gains and losses on forward foreign currency contracts as capital gains and losses, if applicable. Other foreign currency gains and losses on debt instruments are treated as ordinary income for federal income tax purposes pursuant to Section 988 of the Internal Revenue Code.
|
|
| Loss Deferrals | Other Book | Net Tax |
| |
Undistributed | Undistributed
| Accumulated | Late-Year | Post-October
| to Tax | Appreciation/
|
|
$ 5,685,517 | $ 11,880,635 | $ - | $ - | $ - | $ (14,710) | $ 31,210,294 |
|
During the year ended December 31, 2020, capital loss carryovers of $11,564,717 were utilized by the Portfolio. There are no unused capital loss carryovers.
The aggregate cost of investments and the composition of unrealized appreciation and depreciation of investment securities for federal income tax purposes as of December 31, 2020 are noted below. The primary differences between book and tax appreciation or depreciation of investments are wash sale loss deferrals and investments in partnerships.
Federal Tax Cost | Unrealized | Unrealized
| Net Tax Appreciation/ |
$ 633,080,472 | $32,573,369 | $ (1,363,075) | $ 31,210,294 |
Janus Aspen Series | 39 |
Janus Henderson VIT Flexible Bond Portfolio
Notes to Financial Statements
Information on the tax components of derivatives as of December 31, 2020 is as follows:
Federal Tax Cost | Unrealized | Unrealized | Net
Tax Appreciation/ |
$ 1,586 | $ - | $ - | $ - |
Tax cost of investments and unrealized appreciation/(depreciation) may also include timing differences that do not constitute adjustments to tax basis.
Income and capital gains distributions are determined in accordance with income tax regulations that may differ from US GAAP. These differences are due to differing treatments for items such as net short-term gains, deferral of wash sale losses, and capital loss carryovers. Certain permanent differences such as tax returns of capital and net investment losses noted below have been reclassified to capital.
For the year ended December 31, 2020 |
| |||
Distributions |
|
| ||
From Ordinary Income | From Long-Term Capital Gains | Tax Return of Capital | Net Investment Loss |
|
$ 15,031,918 | $ - | $ - | $ - |
|
For the year ended December 31, 2019 |
| |||
Distributions |
|
| ||
From Ordinary Income | From Long-Term Capital Gains | Tax Return of Capital | Net Investment Loss |
|
$ 17,487,577 | $ - | $ - | $ - |
|
Permanent book to tax basis differences may result in reclassifications between the components of net assets. These differences have no impact on the results of operations or net assets. The following reclassifications have been made to the Portfolio:
|
|
|
Increase/(Decrease) to Capital | Increase/(Decrease) to Undistributed
| Increase/(Decrease) to Undistributed
|
$ 5 | $ 1,353,405 | $ (1,353,410) |
6. Capital Share Transactions
|
|
|
|
|
|
|
|
| Year ended December 31, 2020 |
| Year ended December 31, 2019 | ||
|
| Shares | Amount |
| Shares | Amount |
Institutional Shares: |
|
|
|
|
| |
Shares sold | 2,510,696 | $ 31,141,098 |
| 1,563,012 | $ 18,348,907 | |
Reinvested dividends and distributions | 356,034 | 4,451,177 |
| 562,738 | 6,558,390 | |
Shares repurchased | (5,127,790) | (63,581,605) |
| (9,884,146) | (115,751,110) | |
Net Increase/(Decrease) | (2,261,060) | $ (27,989,330) |
| (7,758,396) | $(90,843,813) | |
Service Shares: |
|
|
|
|
| |
Shares sold | 11,715,760 | $159,704,605 |
| 5,747,545 | $ 73,366,642 | |
Reinvested dividends and distributions | 771,012 | 10,580,741 |
| 856,061 | 10,929,187 | |
Shares repurchased | (7,748,985) | (104,047,744) |
| (7,526,222) | (95,483,811) | |
Net Increase/(Decrease) | 4,737,787 | $ 66,237,602 |
| (922,616) | $(11,187,982) | |
40 | DECEMBER 31, 2020 |
Janus Henderson VIT Flexible Bond Portfolio
Notes to Financial Statements
7. Purchases and Sales of Investment Securities
For the year ended December 31, 2020, the aggregate cost of purchases and proceeds from sales of investment securities (excluding any short-term securities, short-term options contracts, TBAs, and in-kind transactions, as applicable) was as follows:
Purchases of | Proceeds
from Sales | Purchases of Long- | Proceeds from Sales |
$485,913,607 | $ 473,430,598 | $ 317,599,457 | $ 305,090,944 |
8. Recent Accounting Pronouncements
The FASB issued Accounting Standards Update 2020-04 Reference Rate Reform: Facilitation of the Effects of Reference Rate Reform on Financial Reporting (“ASU 2020-04”) in March 2020. The new guidance in the ASU provide optional temporary financial reporting relief from the effect of certain types of contract modifications due to the planned discontinuation of the LIBOR or other interbank-offered based reference rates as of the end of 2021. For new and existing contracts, Funds may elect to apply the guidance as of March 12, 2020 through December 31, 2022. Management is currently evaluating the impact, if any, of the ASU’s adoption to the Fund’s financial statements.
9. Subsequent Event
Management has evaluated whether any events or transactions occurred subsequent to December 31, 2020 and through the date of issuance of the Portfolio’s financial statements and determined that there were no material events or transactions that would require recognition or disclosure in the Portfolio’s financial statements.
Janus Aspen Series | 41 |
Janus Henderson VIT Flexible Bond Portfolio
Report of Independent Registered Public Accounting Firm
To the Board of Trustees of Janus Aspen Series and Shareholders of Janus Henderson VIT Flexible Bond Portfolio
Opinion on the Financial Statements
We have audited the accompanying statement of assets and liabilities, including the schedule of investments, of Janus Henderson VIT Flexible Bond Portfolio (one of the portfolios constituting Janus Aspen Series, referred to hereafter as the "Portfolio") as of December 31, 2020, the related statement of operations for the year ended December 31, 2020, the statements of changes in net assets for each of the two years in the period ended December 31, 2020, including the related notes, and the financial highlights for each of the five years in the period ended December 31, 2020 (collectively referred to as the “financial statements”). In our opinion, the financial statements present fairly, in all material respects, the financial position of the Portfolio as of December 31, 2020, the results of its operations for the year then ended, the changes in its net assets for each of the two years in the period ended December 31, 2020 and the financial highlights for each of the five years in the period ended December 31, 2020 in conformity with accounting principles generally accepted in the United States of America.
Basis for Opinion
These financial statements are the responsibility of the Portfolio’s management. Our responsibility is to express an opinion on the Portfolio’s financial statements based on our audits. We are a public accounting firm registered with the Public Company Accounting Oversight Board (United States) (PCAOB) and are required to be independent with respect to the Portfolio in accordance with the U.S. federal securities laws and the applicable rules and regulations of the Securities and Exchange Commission and the PCAOB.
We conducted our audits of these financial statements in accordance with the standards of the PCAOB. Those standards require that we plan and perform the audit to obtain reasonable assurance about whether the financial statements are free of material misstatement, whether due to error or fraud.
Our audits included performing procedures to assess the risks of material misstatement of the financial statements, whether due to error or fraud, and performing procedures that respond to those risks. Such procedures included examining, on a test basis, evidence regarding the amounts and disclosures in the financial statements. Our audits also included evaluating the accounting principles used and significant estimates made by management, as well as evaluating the overall presentation of the financial statements. Our procedures included confirmation of securities owned as of December 31, 2020 by correspondence with the custodian, transfer agent, and brokers; when replies were not received from brokers, we performed other auditing procedures. We believe that our audits provide a reasonable basis for our opinion.

Denver, Colorado
February
16, 2021
We have served as the auditor of one or more investment companies in Janus Henderson Funds since 1990.
42 | DECEMBER 31, 2020 |
Janus Henderson VIT Flexible Bond Portfolio
Additional Information (unaudited)
Proxy Voting Policies and Voting Record
A description of the policies and procedures that the Portfolio uses to determine how to vote proxies relating to its portfolio securities is available without charge: (i) upon request, by calling 1-800-525-1093; (ii) on the Portfolio’s website at janushenderson.com/proxyvoting; and (iii) on the SEC’s website at http://www.sec.gov. Additionally, information regarding the Portfolio’s proxy voting record for the most recent twelve-month period ended June 30 is also available, free of charge, through janushenderson.com/proxyvoting and from the SEC’s website at http://www.sec.gov.
Full Holdings
The Portfolio files its complete portfolio holdings (schedule of investments) with the SEC as an exhibit to Form N-PORT within 60 days of the end of the first and third fiscal quarters, and in the annual report and semiannual report to shareholders. The Portfolio’s Form N-PORT filings and annual and semiannual reports: (i) are available on the SEC’s website at http://www.sec.gov; (ii) may be reviewed and copied at the SEC’s Public Reference Room in Washington, D.C. (information on the Public Reference Room may be obtained by calling 1-800-SEC-0330); and (iii) are available without charge, upon request, by calling a Janus Henderson representative at 1-877-335-2687 (toll free). Portfolio holdings consisting of at least the names of the holdings are generally available on a monthly basis with a 30-day lag under Full Holdings for the Portfolio at janushenderson.com/vit.
APPROVAL OF ADVISORY AGREEMENTS DURING THE PERIOD
The Trustees of Janus Aspen Series, each of whom serves as an “independent” Trustee (the “Trustees”), oversee the management of each Portfolio of Janus Aspen Series (each, a “VIT Portfolio,” and collectively, the “VIT Portfolios”), as well as each Fund of Janus Investment Fund (together with the VIT Portfolios, the “Janus Henderson Funds,” and each, a “Janus Henderson Fund”). As required by law, the Trustees determine annually whether to continue the investment advisory agreement for each Janus Henderson Fund and the subadvisory agreements for the Janus Henderson Funds that utilize subadvisers.
In connection with their most recent consideration of those agreements for each Janus Henderson Fund, the Trustees received, and reviewed information provided by Janus Capital and the respective subadvisers in response to requests of the Trustees and their independent legal counsel. They also received and reviewed information and analysis provided by, and in response to requests of, their independent fee consultant. Throughout their consideration of the agreements, the Trustees were advised by their independent legal counsel. The Trustees met with management to consider the agreements, and also met separately in executive session with their independent legal counsel and their independent fee consultant.
At a meeting held on December 9, 2020, based on the Trustees’ evaluation of the information provided by Janus Capital, the subadvisers, and the independent fee consultant, as well as other information, the Trustees determined that the overall arrangements between each Janus Henderson Fund and Janus Capital and each subadviser, as applicable, were fair and reasonable in light of the nature, extent and quality of the services provided by Janus Capital, its affiliates and the subadvisers, the fees charged for those services, and other matters that the Trustees considered relevant in the exercise of their business judgment. At that meeting, the Trustees unanimously approved the continuation of the investment advisory agreement for each Janus Henderson Fund, and the subadvisory agreement for each subadvised Janus Henderson Fund, for the period from February 1, 2021 through February 1, 2022, subject to earlier termination as provided for in each agreement.
In considering the continuation of those agreements, the Trustees reviewed and analyzed various factors that they determined were relevant, including the factors described below, none of which by itself was considered dispositive. However, the material factors and conclusions that formed the basis for the Trustees’ determination to approve the continuation of the agreements are discussed separately below. Also included is a summary of the independent fee consultant’s conclusions and opinions that arose during, and were included as part of, the Trustees’ consideration of the agreements. “Management fees,” as used herein, reflect actual annual advisory fees and, for the purpose of peer comparisons any administration fees (excluding out of pocket costs), net of any waivers, paid by a fund as a percentage of average net assets.
Nature, Extent and Quality of Services
The Trustees reviewed the nature, extent and quality of the services provided by Janus Capital and the subadvisers to the Janus Henderson Funds, taking into account the investment objective, strategies and policies of each Janus Henderson Fund, and the knowledge the Trustees gained from their regular meetings with management on at least a
Janus Aspen Series | 43 |
Janus Henderson VIT Flexible Bond Portfolio
Additional Information (unaudited)
quarterly basis and their ongoing review of information related to the Janus Henderson Funds. In addition, the Trustees reviewed the resources and key personnel of Janus Capital and each subadviser, particularly noting those employees who provide investment and risk management services to the Janus Henderson Funds. The Trustees also considered other services provided to the Janus Henderson Funds by Janus Capital or the subadvisers, such as managing the execution of portfolio transactions and the selection of broker-dealers for those transactions. The Trustees considered Janus Capital’s role as administrator to the Janus Henderson Funds, noting that Janus Capital generally does not receive a fee for its services but is reimbursed for its out-of-pocket costs. The Trustees considered the role of Janus Capital in monitoring adherence to the Janus Henderson Funds’ investment restrictions, providing support services for the Trustees and Trustee committees, and overseeing communications with shareholders and the activities of other service providers, including monitoring compliance with various policies and procedures of the Janus Henderson Funds and with applicable securities laws and regulations.
In this regard, the independent fee consultant noted that Janus Capital provides a number of different services for the Janus Henderson Funds and fund shareholders, ranging from investment management services to various other servicing functions, and that, in its view, Janus Capital is a capable provider of those services. The independent fee consultant also provided its belief that Janus Capital has developed a number of institutional competitive advantages that should enable it to provide superior investment and service performance over the long term.
The Trustees concluded that the nature, extent and quality of the services provided by Janus Capital or the subadviser to each Janus Henderson Fund were appropriate and consistent with the terms of the respective advisory and subadvisory agreements, and that, taking into account steps taken to address those Janus Henderson Funds whose performance lagged that of their peers for certain periods, the Janus Henderson Funds were likely to benefit from the continued provision of those services. They also concluded that Janus Capital and each subadviser had sufficient personnel, with the appropriate education and experience, to serve the Janus Henderson Funds effectively and had demonstrated its ability to attract well-qualified personnel.
Performance of the Funds
The Trustees considered the performance results of each Janus Henderson Fund over various time periods. They noted that they considered Janus Henderson Fund performance data throughout the year, including periodic meetings with each Janus Henderson Fund’s portfolio manager(s), and also reviewed information comparing each Janus Henderson Fund’s performance with the performance of comparable funds and peer groups identified by Broadridge Financial Solutions, Inc. (“Broadridge”), an independent data provider, and with the Janus Henderson Fund’s benchmark index. In this regard, the independent fee consultant found that the overall Janus Henderson Funds’ performance has been reasonable: for the 36 months ended September 30, 2020, approximately 75% of the Janus Henderson Funds were in the top two quartiles of performance versus Broadridge peers, and for the 12 months ended September 30, 2020, approximately 62% of the Janus Henderson Funds were in the top two quartiles of performance versus Broadridge peers.
The Trustees considered the performance of each Janus Henderson Fund, noting that performance may vary by share class, and noted the following with respect to the VIT Portfolios:
· For Janus Henderson Balanced Portfolio, the Trustees noted that the Fund’s performance was in the first Broadridge quartile for the 36 months ended May 31, 2020 and the first Broadridge quartile for the 12 months ended May 31, 2020.
· For Janus Henderson Enterprise Portfolio, the Trustees noted that the Fund’s performance was in the bottom Broadridge quartile for the 36 months ended May 31, 2020 and the bottom Broadridge quartile for the 12 months ended May 31, 2020. The Trustees noted the reasons for the Fund’s underperformance and the steps Janus Capital had taken or was taking to improve performance.
· For Janus Henderson Flexible Bond Portfolio, the Trustees noted that the Fund’s performance was in the third Broadridge quartile for the 36 months ended May 31, 2020 and the first Broadridge quartile for the 12 months ended May 31, 2020. The Trustees noted the reasons for the Fund’s underperformance and the steps Janus Capital had taken or was taking to improve performance, and that the performance trend was improving.
44 | DECEMBER 31, 2020 |
Janus Henderson VIT Flexible Bond Portfolio
Additional Information (unaudited)
· For Janus Henderson Forty Portfolio, the Trustees noted that the Fund’s performance was in the second Broadridge quartile for the 36 months ended May 31, 2020 and the second Broadridge quartile for the 12 months ended May 31, 2020.
· For Janus Henderson Global Research Portfolio, the Trustees noted that the Fund’s performance was in the third Broadridge quartile for the 36 months ended May 31, 2020 and the bottom Broadridge quartile for the 12 months ended May 31, 2020. The Trustees noted the reasons for the Fund’s underperformance, while also noting that the Fund has a performance fee structure that results in lower management fees during periods of underperformance, and the steps Janus Capital had taken or was taking to improve performance.
· For Janus Henderson Global Technology and Innovation Portfolio, the Trustees noted that the Fund’s performance was in the first Broadridge quartile for the 36 months ended May 31, 2020 and the second Broadridge quartile for the 12 months ended May 31, 2020.
· For Janus Henderson Mid Cap Value Portfolio, the Trustees noted that the Fund’s performance was in the third Broadridge quartile for the 36 months ended May 31, 2020 and the third Broadridge quartile for the 12 months ended May 31, 2020. The Trustees noted the reasons for the Fund’s underperformance, while also noting that the Fund has a performance fee structure that results in lower management fees during periods of underperformance, and the steps Janus Capital and Perkins had taken or were taking to improve performance.
· For Janus Henderson Overseas Portfolio, the Trustees noted that the Fund’s performance was in the bottom Broadridge quartile for the 36 months ended May 31, 2020 and the third Broadridge quartile for the 12 months ended May 31, 2020. The Trustees noted the reasons for the Fund’s underperformance, while also noting that the Fund has a performance fee structure that results in lower management fees during periods of underperformance and the steps Janus Capital had taken or was taking to improve performance.
· For Janus Henderson Research Portfolio, the Trustees noted that the Fund’s performance was in the third Broadridge quartile for the 36 months ended May 31, 2020 and the third Broadridge quartile for the 12 months ended May 31, 2020. The Trustees noted the reasons for the Fund’s underperformance, while also noting that the Fund has a performance fee structure that results in lower management fees during periods of underperformance, and the steps Janus Capital had taken or was taking to improve performance.
· For Janus Henderson U.S. Low Volatility Portfolio, the Trustees noted that the Fund’s performance was in the second Broadridge quartile for the 36 months ended May 31, 2020 and the third Broadridge quartile for the 12 months ended May 31, 2020.
In consideration of each Janus Henderson Fund’s performance, the Trustees concluded that, taking into account the factors relevant to performance, as well as other considerations, including steps taken to improve performance, the Janus Henderson Fund’s performance warranted continuation of such Janus Henderson Fund’s investment advisory and subadvisory agreement(s).
Costs of Services Provided
The Trustees examined information regarding the fees and expenses of each Janus Henderson Fund in comparison to similar information for other comparable funds as provided by Broadridge, an independent data provider. They also reviewed an analysis of that information provided by their independent fee consultant and noted that the rate of management fees (investment advisory fees and any administration fees but excluding out-of-pocket costs) for many of the Janus Henderson Funds, after applicable waivers, was below the average management fee rate of the respective peer group of funds selected by an independent data provider. The Trustees also examined information regarding the subadvisory fees charged for subadvisory services, as applicable, noting that all such fees were paid by Janus Capital out of its management fees collected from such Janus Henderson Fund.
The independent fee consultant provided its belief that the management fees charged by Janus Capital to each of the Janus Henderson Funds under the current investment advisory and administration agreements are reasonable in relation to the services provided by Janus Capital. The independent fee consultant found: (1) the total expenses and management fees of the Janus Henderson Funds to be reasonable relative to other comparable mutual funds; (2) the total expenses, on average, were 10% under the average total expenses of the respective Broadridge Expense Group peers; and (3) and the management fees for the Janus Henderson Funds, on average, were 9% under the average management fees for the respective Broadridge Expense Group. The Trustees also considered the total expenses for
Janus Aspen Series | 45 |
Janus Henderson VIT Flexible Bond Portfolio
Additional Information (unaudited)
each share class of each Janus Henderson Fund compared to the average total expenses for its Broadridge Expense Group and to average total expenses for its Broadridge Expense Universe.
For certain Janus Henderson Funds, the independent fee consultant also performed a systematic “focus list” analysis of expenses which assessed fund fees in the context of fund performance being delivered. Based on this analysis, the independent fee consultant found that the combination of service quality/performance and expenses on these individual Janus Henderson Funds was reasonable in light of performance trends, performance histories, and existence of performance fees, breakpoints, and/or expense waivers on such Janus Henderson Funds.
The Trustees considered the methodology used by Janus Capital and each subadviser in determining compensation payable to portfolio managers, the competitive environment for investment management talent, and the competitive market for mutual funds in different distribution channels.
The Trustees also reviewed management fees charged by Janus Capital and each subadviser to comparable separate account clients and to comparable non-affiliated funds subadvised by Janus Capital or by a subadviser (for which Janus Capital or the subadviser provides only or primarily portfolio management services). Although in most instances subadvisory and separate account fee rates for various investment strategies were lower than management fee rates for Janus Henderson Funds having a similar strategy, the Trustees considered that Janus Capital noted that, under the terms of the management agreements with the Janus Henderson Funds, Janus Capital performs significant additional services for the Janus Henderson Funds that it does not provide to those other clients, including administration services, oversight of the Janus Henderson Funds’ other service providers, trustee support, regulatory compliance and numerous other services, and that, in serving the Janus Henderson Funds, Janus Capital assumes many legal risks and other costs that it does not assume in servicing its other clients. Moreover, they noted that the independent fee consultant found that: (1) the management fees Janus Capital charges to the Janus Henderson Funds are reasonable in relation to the management fees Janus Capital charges to funds subadvised by Janus Capital and to the fees Janus Capital charges to its institutional separate account clients; (2) these subadvised and institutional separate accounts have different service and infrastructure needs and operate in markets very distinct relative to retail funds; and (3) Janus Henderson mutual fund investors enjoy reasonable fees relative to the fees charged to Janus Henderson subadvised fund and separate account investors; (4) 9 of 10 Janus Henderson Funds have lower management fees than similar funds subadvised by Janus Capital; and (5) 5 of 8 Janus Henderson Funds have lower management fees than similar separate accounts managed by Janus Capital.
The Trustees considered the fees for each Janus Henderson Fund for its fiscal year ended in 2019, including the VIT Portfolios, and noted the following with regard to each VIT Portfolio’s total expenses, net of applicable fee waivers (the VIT Portfolio’s “total expenses”):
· For Janus Henderson Balanced Portfolio, the Trustees noted that, although the Fund’s total expenses exceeded the peer group average for one share class, overall the Fund’s total expenses were reasonable.
· For Janus Henderson Enterprise Portfolio, the Trustees noted that, although the Fund’s total expenses exceeded the peer group average for one share class, overall the Fund’s total expenses were reasonable.
· For Janus Henderson Flexible Bond Portfolio, the Trustees noted that, although the Fund’s total expenses exceeded the peer group for one share class, overall the Fund’s total expenses were reasonable. The Trustees also noted that Janus Capital has contractually agreed to limit the Fund’s expenses, although this limit did not apply because the Fund’s total expenses were already below the applicable fee limit.
· For Janus Henderson Forty Portfolio, the Trustees noted that, although the Fund’s total expenses exceeded the peer group average for one share class, overall the Fund’s total expenses were reasonable.
· For Janus Henderson Global Research Portfolio, the Trustees noted that, although the Fund’s total expenses exceeded the peer group average for one share class, overall the Fund’s total expenses were reasonable.
· For Janus Henderson Global Technology and Innovation Portfolio, the Trustees noted that the Fund’s total expenses were below the peer group for both share classes.
· For Janus Henderson Mid Cap Value Portfolio, the Trustees noted that, although the Fund’s total expenses exceeded the peer group for one share class, overall the Fund’s total expenses were reasonable. The Trustees also noted that Janus Capital has contractually agreed to limit the Fund’s expenses, although this limit did not apply because the Fund’s total expenses were already below the applicable fee limit.
46 | DECEMBER 31, 2020 |
Janus Henderson VIT Flexible Bond Portfolio
Additional Information (unaudited)
· For Janus Henderson Overseas Portfolio, the Trustees noted that the Fund’s total expenses were below the peer group for both share classes.
· For Janus Henderson Research Portfolio, the Trustees noted that the Fund’s total expenses were below the peer group average for both share classes.
· For Janus Henderson U.S. Low Volatility Portfolio, the Trustees noted that the Fund’s total expenses were below the peer group for its sole share class.
The Trustees reviewed information on the overall profitability to Janus Capital and its affiliates of their relationship with the Janus Henderson Funds, and considered profitability data of other publicly traded mutual fund advisers. The Trustees recognized that profitability comparisons among fund managers are difficult because of the variation in the type of comparative information that is publicly available, and the profitability of any fund manager is affected by numerous factors, including the organizational structure of the particular fund manager, differences in complex size, difference in product mix, difference in types of business (mutual fund, institutional and other), differences in the types of funds and other accounts it manages, possible other lines of business, the methodology for allocating expenses, and the fund manager’s capital structure and cost of capital.
Additionally, the Trustees considered the estimated profitability to Janus Capital from the investment management services it provided to each Janus Henderson Fund. In their review, the Trustees considered whether Janus Capital and each subadviser receive adequate incentives and resources to manage the Janus Henderson Funds effectively. In reviewing profitability, the Trustees noted that the estimated profitability for an individual Janus Henderson Fund is necessarily a product of the allocation methodology utilized by Janus Capital to allocate its expenses as part of the estimated profitability calculation. In this regard, the Trustees noted that the independent fee consultant found that (1) the expense allocation methodology and rationales utilized by Janus Capital were reasonable and (2) no clear correlation exists between expense allocations and operating margins. The Trustees also considered that the estimated profitability for an individual Janus Henderson Fund was influenced by a number of factors, including not only the allocation methodology selected, but also the presence of fee waivers and expense caps, and whether the Janus Henderson Fund’s investment management agreement contained breakpoints or a performance fee component. The Trustees determined, after taking into account these factors, among others, that Janus Capital’s estimated profitability with respect to each Janus Henderson Fund was not unreasonable in relation to the services provided, and that the variation in the range of such estimated profitability among the Janus Henderson Funds was not a material factor in the Board’s approval of the reasonableness of any Janus Henderson Fund’s investment management fees.
The Trustees concluded that the management fees payable by each Janus Henderson Fund to Janus Capital and its affiliates, as well as the fees paid by Janus Capital to the subadvisers of subadvised Janus Henderson Funds, were reasonable in relation to the nature, extent, and quality of the services provided, taking into account the fees charged by other advisers for managing comparable mutual funds with similar strategies, the fees Janus Capital and the subadvisers charge to other clients, and, as applicable, the impact of fund performance on management fees payable by the Janus Henderson Funds. The Trustees also concluded that each Janus Henderson Fund’s total expenses were reasonable, taking into account the size of the Janus Henderson Fund, the quality of services provided by Janus Capital and any subadviser, the investment performance of the Janus Henderson Fund, and any expense limitations agreed to or provided by Janus Capital.
Economies of Scale
The Trustees considered information about the potential for Janus Capital to realize economies of scale as the assets of the Janus Henderson Funds increase. They noted that their independent fee consultant published a report to the Trustees in November 2019 which provided its research and analysis into economies of scale. They also noted that, although many Janus Henderson Funds pay advisory fees at a fixed base rate as a percentage of net assets, without any breakpoints or performance fees, their independent fee consultant concluded that 73% of these Janus Henderson Funds’ have contractual management fees (gross of waivers) below their Broadridge Expense Group averages. They also noted the following: (1) that for those Janus Henderson Funds whose expenses are being reduced by the contractual expense limitations of Janus Capital, Janus Capital is subsidizing certain of these Janus Henderson Funds because they have not reached adequate scale; (2) as the assets of some of the Janus Henderson Funds have declined in the past few years, certain of those Janus Henderson Funds have benefited from having advisory fee rates that have remained constant rather than increasing as assets declined; (3) performance fee structures have been implemented for various Janus Henderson Funds that have caused the effective rate of advisory fees payable by such
Janus Aspen Series | 47 |
Janus Henderson VIT Flexible Bond Portfolio
Additional Information (unaudited)
Janus Henderson Fund to vary depending on the investment performance of the Janus Henderson Fund relative to its benchmark index over the measurement period; and (4) a few Janus Henderson Funds have fee schedules with breakpoints and reduced fee rates above certain asset levels. The Trustees also noted that the Janus Henderson Funds share directly in economies of scale through the significant investments made by Janus Capital and its affiliates related to services provided to the Funds and the lower charges of third-party service providers that are based in part on the combined scale of all of the Janus Henderson Funds.
The Trustees also considered the independent fee consultant’s conclusion that, given the limitations of various analytical approaches to economies of scale and their conflicting results, it is difficult to analytically confirm or deny the existence of economies of scale in the Janus Henderson complex. In this regard, the independent consultant concluded that (1) to the extent there were economies of scale at Janus Capital, Janus Capital’s general strategy of setting fixed management fees below peers appeared to share any such economies with investors even on smaller Janus Henderson Funds which have not yet achieved those economies and (2) by setting lower fixed fees from the start on these Janus Henderson Funds, Janus Capital appeared to be investing to increase the likelihood that these Janus Henderson Funds will grow to a level to achieve any economies of scale that may exist. Further, the independent fee consultant provided its belief that Janus Henderson Fund investors are well-served by the fee levels and performance fee structures in place on the Janus Henderson Funds in light of any economies of scale that may be present at Janus Capital.
Based on all of the information reviewed, including the recent and past research and analysis conducted by the Trustees’ independent fee consultant, the Trustees concluded that the current fee structure of each Janus Henderson Fund was reasonable and that the current rates of fees do reflect a sharing between Janus Capital and the Janus Henderson Fund of any economies of scale that may be present at the current asset level of the Janus Henderson Fund.
Other Benefits to Janus Capital
The Trustees also considered benefits that accrue to Janus Capital and its affiliates and subadvisers to the Janus Henderson Funds from their relationships with the Janus Henderson Funds. They recognized that two affiliates of Janus Capital separately serve the Janus Henderson Funds as transfer agent and distributor, respectively, and the transfer agent receives compensation directly from the non-money market funds for services provided, and that such compensation contributes to the overall profitability of Janus Capital and its affiliates that results from their relationship with the Janus Henderson Funds. The Trustees also considered Janus Capital’s past and proposed use of commissions paid by the Janus Henderson Funds on portfolio brokerage transactions to obtain proprietary and third-party research products and services benefiting the Janus Henderson Fund and/or other clients of Janus Capital and Janus Capital, and/or a subadviser to a Janus Henderson Fund. The Trustees concluded that Janus Capital’s and the subadvisers’ use of these types of client commission arrangements to obtain proprietary and third-party research products and services was consistent with regulatory requirements and guidelines and was likely to benefit each Janus Henderson Fund. The Trustees also concluded that, other than the services provided by Janus Capital and its affiliates and subadvisers pursuant to the agreements and the fees to be paid by each Janus Henderson Fund therefor, the Janus Henderson Funds and Janus Capital and the subadvisers may potentially benefit from their relationship with each other in other ways. They concluded that Janus Capital and its affiliates share directly in economies of scale through the lower charges of third-party service providers that are based in part on the combined scale of the Janus Henderson Funds and other clients serviced by Janus Capital and its affiliates. They also concluded that Janus Capital and/or the subadvisers benefit from the receipt of research products and services acquired through commissions paid on portfolio transactions of the Janus Henderson Funds and that the Janus Henderson Funds benefit from Janus Capital’s and/or the subadvisers’ receipt of those products and services as well as research products and services acquired through commissions paid by other clients of Janus Capital and/or other clients of the subadvisers. They further concluded that the success of any Janus Henderson Fund could attract other business to Janus Capital, the subadvisers or other Janus Henderson funds, and that the success of Janus Capital and the subadvisers could enhance Janus Capital’s and the subadvisers’ ability to serve the Janus Henderson Funds.
48 | DECEMBER 31, 2020 |
Janus Henderson VIT Flexible Bond Portfolio
Useful Information About Your Portfolio Report (unaudited)
The Management Commentary in this report includes valuable insight as well as statistical information to help you understand how your Portfolio’s performance and characteristics stack up against those of comparable indices.
If the Portfolio invests in foreign securities, this report may include information about country exposure. Country exposure is based primarily on the country of risk. A company may be allocated to a country based on other factors such as location of the company’s principal office, the location of the principal trading market for the company’s securities, or the country where a majority of the company’s revenues are derived.
Please keep in mind that the opinions expressed in the Management Commentary are just that: opinions. They are a reflection based on best judgment at the time this report was compiled, which was December 31, 2020. As the investing environment changes, so could opinions. These views are unique and are not necessarily shared by fellow employees or by Janus Henderson in general.
Performance Overviews
Performance overview graphs compare the performance of a hypothetical $10,000 investment in the Portfolio with one or more widely used market indices. When comparing the performance of the Portfolio with an index, keep in mind that market indices are not available for investment and do not reflect deduction of expenses.
Average annual total returns are quoted for a Portfolio with more than one year of performance history. Average annual total return is calculated by taking the growth or decline in value of an investment over a period of time, including reinvestment of dividends and distributions, then calculating the annual compounded percentage rate that would have produced the same result had the rate of growth been constant throughout the period. Average annual total return does not reflect the deduction of taxes that a shareholder would pay on Portfolio distributions or redemptions of Portfolio shares.
Cumulative total returns are quoted for a Portfolio with less than one year of performance history. Cumulative total return is the growth or decline in value of an investment over time, independent of the period of time involved. Cumulative total return does not reflect the deduction of taxes that a shareholder would pay on Portfolio distributions or redemptions of Portfolio shares.
Pursuant to federal securities rules, expense ratios shown in the performance chart reflect subsidized (if applicable) and unsubsidized ratios. The total annual fund operating expenses ratio is gross of any fee waivers, reflecting the Portfolio’s unsubsidized expense ratio. The net annual fund operating expenses ratio (if applicable) includes contractual waivers of Janus Capital and reflects the Portfolio’s subsidized expense ratio. Ratios may be higher or lower than those shown in the “Financial Highlights” in this report.
Schedule of Investments
Following the performance overview section is the Portfolio’s Schedule of Investments. This schedule reports the types of securities held in the Portfolio on the last day of the reporting period. Securities are usually listed by type (common stock, corporate bonds, U.S. Government obligations, etc.) and by industry classification (banking, communications, insurance, etc.). Holdings are subject to change without notice.
The value of each security is quoted as of the last day of the reporting period. The value of securities denominated in foreign currencies is converted into U.S. dollars.
If the Portfolio invests in foreign securities, it will also provide a summary of investments by country. This summary reports the Portfolio exposure to different countries by providing the percentage of securities invested in each country. The country of each security represents the country of risk. The Portfolio’s Schedule of Investments relies upon the industry group and country classifications published by Barclays and/or MSCI Inc.
Tables listing details of individual forward currency contracts, futures, written options, swaptions, and swaps follow the Portfolio’s Schedule of Investments (if applicable).
Statement of Assets and Liabilities
This statement is often referred to as the “balance sheet.” It lists the assets and liabilities of the Portfolio on the last day of the reporting period.
Janus Aspen Series | 49 |
Janus Henderson VIT Flexible Bond Portfolio
Useful Information About Your Portfolio Report (unaudited)
The Portfolio’s assets are calculated by adding the value of the securities owned, the receivable for securities sold but not yet settled, the receivable for dividends declared but not yet received on securities owned, and the receivable for Portfolio shares sold to investors but not yet settled. The Portfolio’s liabilities include payables for securities purchased but not yet settled, Portfolio shares redeemed but not yet paid, and expenses owed but not yet paid. Additionally, there may be other assets and liabilities such as unrealized gain or loss on forward currency contracts.
The section entitled “Net Assets Consist of” breaks down the components of the Portfolio’s net assets. Because the Portfolio must distribute substantially all earnings, you will notice that a significant portion of net assets is shareholder capital.
The last section of this statement reports the net asset value (“NAV”) per share on the last day of the reporting period. The NAV is calculated by dividing the Portfolio’s net assets for each share class (assets minus liabilities) by the number of shares outstanding.
Statement of Operations
This statement details the Portfolio’s income, expenses, realized gains and losses on securities and currency transactions, and changes in unrealized appreciation or depreciation of Portfolio holdings.
The first section in this statement, entitled “Investment Income,” reports the dividends earned from securities and interest earned from interest-bearing securities in the Portfolio.
The next section reports the expenses incurred by the Portfolio, including the advisory fee paid to the investment adviser, transfer agent fees and expenses, and printing and postage for mailing statements, financial reports and prospectuses. Expense offsets and expense reimbursements, if any, are also shown.
The last section lists the amounts of realized gains or losses from investment and foreign currency transactions, and changes in unrealized appreciation or depreciation of investments and foreign currency-denominated assets and liabilities. The Portfolio will realize a gain (or loss) when it sells its position in a particular security. A change in unrealized gain (or loss) refers to the change in net appreciation or depreciation of the Portfolio during the reporting period. “Net Realized and Unrealized Gain/(Loss) on Investments” is affected both by changes in the market value of Portfolio holdings and by gains (or losses) realized during the reporting period.
Statements of Changes in Net Assets
These statements report the increase or decrease in the Portfolio’s net assets during the reporting period. Changes in the Portfolio’s net assets are attributable to investment operations, dividends and distributions to investors, and capital share transactions. This is important to investors because it shows exactly what caused the Portfolio’s net asset size to change during the period.
The first section summarizes the information from the Statement of Operations regarding changes in net assets due to the Portfolio’s investment operations. The Portfolio’s net assets may also change as a result of dividend and capital gains distributions to investors. If investors receive their dividends and/or distributions in cash, money is taken out of the Portfolio to pay the dividend and/or distribution. If investors reinvest their dividends and/or distributions, the Portfolio’s net assets will not be affected. If you compare the Portfolio’s “Net Decrease from Dividends and Distributions” to “Reinvested Dividends and Distributions,” you will notice that dividends and distributions have little effect on the Portfolio’s net assets. This is because the majority of the Portfolio’s investors reinvest their dividends and/or distributions.
The reinvestment of dividends and distributions is included under “Capital Share Transactions.” “Capital Shares” refers to the money investors contribute to the Portfolio through purchases or withdrawals via redemptions. The Portfolio’s net assets will increase and decrease in value as investors purchase and redeem shares from the Portfolio.
Financial Highlights
This schedule provides a per-share breakdown of the components that affect the Portfolio’s NAV for current and past reporting periods as well as total return, asset size, ratios, and portfolio turnover rate.
The first line in the table reflects the NAV per share at the beginning of the reporting period. The next line reports the net investment income/(loss) per share. Following is the per share total of net gains/(losses), realized and unrealized. Per share dividends and distributions to investors are then subtracted to arrive at the NAV per share at the end of the period. The next line reflects the total return for the period. The total return may include adjustments in accordance with
50 | DECEMBER 31, 2020 |
Janus Henderson VIT Flexible Bond Portfolio
Useful Information About Your Portfolio Report (unaudited)
generally accepted accounting principles required at the period end for financial reporting purposes. As a result, the total return may differ from the total return reflected for individual shareholder transactions. Also included are ratios of expenses and net investment income to average net assets.
The Portfolio’s expenses may be reduced through expense offsets and expense reimbursements. The ratios shown reflect expenses before and after any such offsets and reimbursements.
The ratio of net investment income/(loss) summarizes the income earned less expenses, divided by the average net assets of the Portfolio during the reporting period. Do not confuse this ratio with the Portfolio’s yield. The net investment income ratio is not a true measure of the Portfolio’s yield because it does not take into account the dividends distributed to the Portfolio’s investors.
The next figure is the portfolio turnover rate, which measures the buying and selling activity in the Portfolio. Portfolio turnover is affected by market conditions, changes in the asset size of the Portfolio, fluctuating volume of shareholder purchase and redemption orders, the nature of the Portfolio’s investments, and the investment style and/or outlook of the portfolio manager(s) and/or investment personnel. A 100% rate implies that an amount equal to the value of the entire portfolio was replaced once during the fiscal year; a 50% rate means that an amount equal to the value of half the portfolio is traded in a year; and a 200% rate means that an amount equal to the value of the entire portfolio is traded every six months.
Janus Aspen Series | 51 |
Janus Henderson VIT Flexible Bond Portfolio
Trustees and Officers (unaudited)
The following are the Trustees and officers of the Trust, together with a brief description of their principal occupations during the last five years (principal occupations for certain Trustees may include periods over five years). The Portfolio’s Statement of Additional Information includes additional information about the Trustees and officers and is available, without charge, by calling 1-877-335-2687.
Each Trustee has served in that capacity since he or she was originally elected or appointed. The Trustees do not serve a specified term of office. Each Trustee will hold office until the termination of the Trust or his or her earlier death, resignation, retirement, incapacity, or removal. Under the Portfolio’s Governance Procedures and Guidelines, the policy is for Trustees to retire no later than the end of the calendar year in which the Trustee turns 75. The Trustees review the Portfolio’s Governance Procedures and Guidelines from time to time and may make changes they deem appropriate. The Portfolio’s Nominating and Governance Committee will consider nominees for the position of Trustee recommended by shareholders. Shareholders may submit the name of a candidate for consideration by the Committee by submitting their recommendations to the Trust’s Secretary. Each Trustee is currently a Trustee of one other registered investment company advised by Janus Capital: Janus Investment Fund. Collectively, these two registered investment companies consist of 56 series or funds referred to herein as the Fund Complex.
The Trust’s officers are elected annually by the Trustees for a one-year term. Certain officers also serve as officers of Janus Investment Fund. Certain officers of the Portfolio may also be officers and/or directors of Janus Capital. Except as otherwise disclosed, Portfolio officers receive no compensation from the Portfolio, except for the Portfolio’s Chief Compliance Officer, as authorized by the Trustees.
52 | DECEMBER 31, 2020 |
Janus Henderson VIT Flexible Bond Portfolio
Trustees and Officers (unaudited)
TRUSTEES | |||||
Name, Address, and Age | Positions Held with the Trust | Length of Time Served | Principal Occupations During the Past Five Years | Number of Portfolios/Funds in Fund Complex Overseen by Trustee | Other Directorships Held by Trustee During the Past Five Years |
Independent Trustees | |||||
William F. McCalpin 151 Detroit Street Denver, CO 80206 DOB: 1957 | Chairman Trustee | 1/08-Present 6/02-Present | Independent Consultant (since 2019) and Chief Operating Officer, muun chi LLC (organic food business) (since 2020). Formerly, Managing Partner, Impact Investments, Athena Capital Advisors LLC (independent registered investment advisor) (2016-2019), Managing Director, Holos Consulting LLC (provides consulting services to foundations and other nonprofit organizations) (2009-2016), Chief Executive Officer, Imprint Capital Advisors (impact investment firm) (2013-2015), and Executive Vice President and Chief Operating Officer of The Rockefeller Brothers Fund (a private family foundation) (1998-2006). | 56 | Director of Mutual Fund Directors Forum (a non-profit organization serving independent directors of U.S. mutual funds) (since 2016), Chairman of the Board and Trustee of The Investment Fund for Foundations Investment Program (TIP) (consisting of 2 funds) (since 2008), and Director of the F.B. Heron Foundation (a private grantmaking foundation) (since 2006). |
Janus Aspen Series | 53 |
Janus Henderson VIT Flexible Bond Portfolio
Trustees and Officers (unaudited)
TRUSTEES | |||||
Name, Address, and Age | Positions Held with the Trust | Length of Time Served | Principal Occupations During the Past Five Years | Number of Portfolios/Funds in Fund Complex Overseen by Trustee | Other Directorships Held by Trustee During the Past Five Years |
Independent Trustees | |||||
Alan A. Brown 151 Detroit Street Denver, CO 80206 DOB: 1962 | Trustee | 1/13-Present | Principal, Curam Holdings LLC (since 2018). Formerly, Executive Vice President, Institutional Markets, of Black Creek Group (private equity real estate investment management firm) (2012-2018), Executive Vice President and Co-Head, Global Private Client Group (2007-2010), Executive Vice President, Mutual Funds (2005-2007), and Chief Marketing Officer (2001-2005) of Nuveen Investments, Inc. (asset management). | 56 | Advisory Board Member of AEW Core Property Trust (open-end property fund) (since 2020), and Director of WTTW (PBS affiliate) (since 2003). Formerly, Director of MotiveQuest LLC (strategic social market research company) (2003-2016), Director of Nuveen Global Investors LLC (2007-2011), Director of Communities in Schools (2004-2010), and Director of Mutual Fund Education Alliance (until 2010). |
54 | DECEMBER 31, 2020 |
Janus Henderson VIT Flexible Bond Portfolio
Trustees and Officers (unaudited)
TRUSTEES | |||||
Name, Address, and Age | Positions Held with the Trust | Length of Time Served | Principal Occupations During the Past Five Years | Number of Portfolios/Funds in Fund Complex Overseen by Trustee | Other Directorships Held by Trustee During the Past Five Years |
Independent Trustees | |||||
William D. Cvengros 151 Detroit Street Denver, CO 80206 DOB: 1948 | Trustee | 1/11-Present | Chief Executive Officer of SJC Capital, LLC (a personal investment company and consulting firm) (since 2002). Formerly, Chief Executive Officer and President of PIMCO Advisors Holdings L.P. (a publicly traded investment management firm) (1994-2000), and Chief Investment Officer (1987-1994) and Vice Chairman and Director (1990-1994) of Pacific Life Insurance Company (a mutual life insurance and annuity company) (1987-1994). | 56 | Advisory Board Member, RevOZ Fund LP and related funds (real estate investments for opportunity zones) (since 2020), and Advisory Board Member, Innovate Partners Emerging Growth and Equity Fund I (early stage venture capital fund) (since 2014). Formerly, Managing Trustee of National Retirement Partners Liquidating Trust (2013-2016), Chairman, National Retirement Partners, Inc. (formerly a network of advisors to 401(k) plans) (2005-2013), Director of Prospect Acquisition Corp. (a special purpose acquisition corporation) (2007-2009), Director of RemedyTemp, Inc. (temporary help services company) (1996-2006), and Trustee of PIMCO Funds Multi-Manager Series (1990-2000) and Pacific Life Variable Life & Annuity Trusts (1987-1994). |
Janus Aspen Series | 55 |
Janus Henderson VIT Flexible Bond Portfolio
Trustees and Officers (unaudited)
TRUSTEES | |||||
Name, Address, and Age | Positions Held with the Trust | Length of Time Served | Principal Occupations During the Past Five Years | Number of Portfolios/Funds in Fund Complex Overseen by Trustee | Other Directorships Held by Trustee During the Past Five Years |
Independent Trustees | |||||
Raudline Etienne 151 Detroit Street Denver, CO 80206 DOB: 1965 | Trustee | 6/16-Present | Founder, Daraja Capital (advisory and investment firm) (since 2016), and Senior Advisor, Albright Stonebridge Group LLC (global strategy firm) (since 2016). Formerly, Senior Vice President (2011-2015), Albright Stonebridge Group LLC, and Deputy Comptroller and Chief Investment Officer, New York State Common Retirement Fund (public pension fund) (2008-2011). | 56 | Board Member, Van Alen Institute (nonprofit architectural and design organization) (since 2019) and Director of Brightwood Capital Advisors, LLC (since 2014). |
William M. Fitzgerald, Sr. 151 Detroit Street Denver, CO 80206 DOB: 1964 | Trustee | 9/19-Present | Founder, Fitzgerald Asset Management LLC (since 2012). Formerly, Founder and Chief Investment Officer, Global Infrastructure Asset Management LLC (2008-2017), Chief Investment Officer of Nuveen Asset Management (2000-2007), and Managing Director, Nuveen Investment LLC (1988-2007). | 56 | Board of Directors, Municipal Securities Rulemaking Board (since 2017). Formerly, Board of Directors of Syncora Holdings Ltd, Syncora Guarantee Inc., and Syncora Capital Assurance Inc. (2009-2016), and Trustee, Destra Investment Trust (2010-2014). |
56 | DECEMBER 31, 2020 |
Janus Henderson VIT Flexible Bond Portfolio
Trustees and Officers (unaudited)
TRUSTEES | |||||
Name, Address, and Age | Positions Held with the Trust | Length of Time Served | Principal Occupations During the Past Five Years | Number of Portfolios/Funds in Fund Complex Overseen by Trustee | Other Directorships Held by Trustee During the Past Five Years |
Independent Trustees | |||||
Gary A. Poliner 151 Detroit Street Denver, CO 80206 DOB: 1953 | Trustee | 6/16-Present | Retired. Formerly, President (2010-2013) of Northwestern Mutual Life Insurance Company. | 56 | Director of MGIC Investment Corporation (private mortgage insurance) (since 2013) and West Bend Mutual Insurance Company (property/casualty insurance) (since 2013). Formerly, Trustee of Northwestern Mutual Life Insurance Company (2010-2013) and Director of Frank Russell Company (global asset management firm) (2008-2013). |
Diane L. Wallace 151 Detroit Street Denver, CO 80206 DOB: 1958 | Trustee | 6/17-Present | Retired. Formerly, Chief Operating Officer, Senior Vice President-Operations, and Chief Financial Officer for Driehaus Capital Management, LLC (1988-2006) and Treasurer for Driehaus Mutual Funds (1996-2002). | 56 | Director of Family Service of Lake County (since 2019). Formerly, Independent Trustee, Henderson Global Funds (13 portfolios) (2015-2017), Independent Trustee, State Farm Associates' Funds Trust, State Farm Mutual Fund Trust, and State Farm Variable Product Trust (28 portfolios) (2013-2017). |
Janus Aspen Series | 57 |
Janus Henderson VIT Flexible Bond Portfolio
Trustees and Officers (unaudited)
TRUSTEES | |||||
Name, Address, and Age | Positions Held with the Trust | Length of Time Served | Principal Occupations During the Past Five Years | Number of Portfolios/Funds in Fund Complex Overseen by Trustee | Other Directorships Held by Trustee During the Past Five Years |
Independent Trustees | |||||
Linda S. Wolf 151 Detroit Street Denver, CO 80206 DOB: 1947 | Trustee | 11/05-Present | Retired. Formerly, Chairman and Chief Executive Officer of Leo Burnett (Worldwide) (advertising agency) (2001-2005). | 56 | Director of Chicago Community Trust (Regional Community Foundation), Lurie Children’s Hospital (Chicago, IL), Shirley Ryan Ability Lab and Wrapports, LLC (digital communications company). Formerly, Director of Chicago Council on Global Affairs (until 2019), InnerWorkings (until 2019) and Director of Walmart (until 2017). |
58 | DECEMBER 31, 2020 |
Janus Henderson VIT Flexible Bond Portfolio
Trustees and Officers (unaudited)
OFFICERS | |||
Name, Address, and Age | Positions Held with the Trust | Term of Office* and Length of Time Served | Principal Occupations During the Past Five Years |
Michael Keough | Executive Vice President and Co-Portfolio Manager Janus Henderson Flexible Bond Portfolio | 12/15 - Present | Portfolio Manager for other Janus Henderson accounts. |
Greg
Wilensky | Executive Vice President and Co-Portfolio Manager Janus Henderson Flexible Bond Portfolio | 2/20 - Present | Head of U.S. Fixed Income of Janus Henderson Investors and Portfolio Manager for other Janus Henderson accounts. Formerly, Director and Lead Portfolio Manager of the U.S. Multi-Sector Fixed Income team at AllianceBernstein (2007-2019). |
* Officers are elected at least annually by the Trustees for a one-year term and may also be elected from time to time by the Trustees for an interim period. | |||
Janus Aspen Series | 59 |
Janus Henderson VIT Flexible Bond Portfolio
Trustees and Officers (unaudited)
OFFICERS | |||
Name, Address, and Age | Positions Held with the Trust | Term of Office* and Length of Time Served | Principal Occupations During the Past Five Years |
Bruce L. Koepfgen | President and Chief Executive Officer | 7/14-Present | Executive Vice President and Head of North America at Janus Henderson Investors (since 2017), President and Head of North America at Janus Capital Management LLC (since 2013 and 2017, respectively), President at Janus Capital Group Inc. (since 2013), President and Director at Janus International Holding LLC (since 2019 and 2011, respectively), President at Janus Holdings LLC (since 2019), President and Director at Janus Management Holdings Corporation (since 2017 and 2012, respectively), Executive Vice President and Head of North America at Janus Distributors LLC (since 2011 and 2019, respectively), Vice President and Director at Intech Investment Management LLC (since 2012), and Executive Vice President at Perkins Investment Management LLC (since 2011). Formerly, Executive Vice President at Janus Capital Group Inc., Janus International Holding LLC, and Janus Management Holdings Corporation (2011-2019), Director at Perkins Investment Management LLC (2011-2019), and Chief Financial Officer at Janus Capital Group Inc. (2011-2013). |
* Officers are elected at least annually by the Trustees for a one-year term and may also be elected from time to time by the Trustees for an interim period. | |||
60 | DECEMBER 31, 2020 |
Janus Henderson VIT Flexible Bond Portfolio
Trustees and Officers (unaudited)
OFFICERS | |||
Name, Address, and Age | Positions Held with the Trust | Term of Office* and Length of Time Served | Principal Occupations During the Past Five Years |
Kristin Mariani | Vice President, Chief Compliance Officer, and Anti-Money Laundering Officer | 7/20-Present | Head of Compliance, North America for Janus Henderson Investors (since September 2020), and Chief Compliance Officer for Janus Capital Management LLC (since September 2017). Formerly, Global Head of Investment Management Compliance for Janus Henderson Investors (February 2019 – August 2020), Vice President, Head of Global Distribution Compliance and Chief Compliance Officer of Janus Henderson Distributors (May 2017-September 2017), Vice President, Compliance at Janus Capital Group Inc., Janus Capital Management LLC, and Janus Distributors LLC (2009-2017). |
Jesper Nergaard | Chief
Financial Officer | 3/05-Present | Head of U.S. Fund Administration, Janus Henderson Investors and Janus Services LLC. |
Abigail
J. Murray | Vice President, Chief Legal Officer, and Secretary | 12/20-Present | Managing Counsel (2020-present). Formerly, Senior Counsel for Invesco Ltd. (2017-2020), and Vice President and Senior Counsel, ALPS Fund Services, Inc. and Assistant General Counsel, ALPS Advisors, Inc. (2015-2017). |
* Officers are elected at least annually by the Trustees for a one-year term and may also be elected from time to time by the Trustees for an interim period. | |||
Janus Aspen Series | 61 |
| ||||||||
This report is submitted for the general information of shareholders of the Portfolio. It is not an offer or solicitation for the Portfolio and is not authorized for distribution to prospective investors unless preceded or accompanied by an effective prospectus. | ||||||||
Janus Henderson, Janus, Henderson, Perkins, and Intech are trademarks of Janus Henderson Group plc or one of its subsidiaries. © Janus Henderson Group plc Janus Henderson Distributors | ||||||||
109-02-81114 03-21 | ||||||||

ANNUAL REPORT December 31, 2020 | ||
Janus Henderson VIT Forty Portfolio | ||
Janus Aspen Series | ||
HIGHLIGHTS · Portfolio management perspective · Investment strategy behind your portfolio · Portfolio
performance, characteristics |
|

Table of Contents
Janus Henderson VIT Forty Portfolio
Janus Henderson VIT Forty Portfolio (unaudited)


PERFORMANCE OVERVIEW
For the 12-month period ended December 31, 2020, Janus Henderson VIT Forty Portfolio’s Institutional Shares and Service Shares returned 39.40% and 39.03%, respectively, versus a return of 38.49% for the Portfolio’s primary benchmark, the Russell 1000® Growth Index. The Portfolio’s secondary benchmark, the S&P 500® Index, returned 18.40% for the period.
INVESTMENT ENVIRONMENT
The Russell 1000 Growth Index posted a strong gain for the year after a sharp downturn in the first quarter, reaching record levels on the heels of highly effective coronavirus vaccine trials, subsequent regulatory approvals and the rollout of initial vaccinations. The beginning of inoculations fueled optimism for a return to normalcy and a full reopening of the economy as the population gets closer to herd immunity. Significant sources of uncertainty waned later in the period as the results of the U.S. presidential election were finalized and markets welcomed the passing of a second round of fiscal stimulus by Congress. However, sustained coronavirus cases and ongoing social restrictions weighed on sentiment throughout the year.
PERFORMANCE DISCUSSION
The Portfolio outperformed both its primary benchmark, the Russell 1000 Growth Index, and its secondary benchmark, the S&P 500 Index, during the year ended December 31, 2020. Stock selection in the Portfolio was the main contributor to performance relative to the primary benchmark during the period. As part of our investment strategy, we seek companies that have built clear, sustainable, competitive moats around their businesses, which gives them the potential to grow market share within their respective industries over time. Important competitive advantages could include a strong brand, network effects from a product or service that would be hard for a competitor to replicate, a lower cost structure than competitors in the industry, a distribution advantage or patent protection over valuable intellectual property. We think emphasizing these sustainable competitive advantages can be a meaningful driver of outperformance over longer time horizons because the market often underestimates the duration of growth for these companies and the long-term potential return to shareholders.
Social media operator Snap, Inc. was among the top relative contributors during the period. The company reported results that beat estimates, driven by faster average revenue per user growth in North America and Europe and new user growth in the rest of the world. As Snap has introduced new features and the company has matured, we have begun to see its business model evolve into a core digital advertising platform with the potential for significant growth.
Align Technology, a medical device company that designs, manufactures and markets dentistry products, was also among the top contributors. During the period, the company reported results that surpassed estimates, and its strong balance sheet has enabled it to invest significantly. As COVID-19 accelerated the digitization of dental procedures, Align had the ability and the willingness to implement market development initiatives and disproportionately benefit while competitors were struggling. We continue to believe that Align is competitively positioned to capitalize on the long-term trend away from traditional bracket braces to clear aligners.
Avalara was another top contributor for the period. The Software as a Service company is a provider of tax calculation solutions for medium-size e-commerce businesses. Companies that sell goods online are now required to collect the appropriate sales tax for each state they sell into, even if they do not have a physical presence in that state. This requirement, combined with the complexity of the U.S. tax code, makes Avalara’s software an essential service for many online businesses. The
Janus Aspen Series | 1 |
Janus Henderson VIT Forty Portfolio (unaudited)
stock was up after reporting strong earnings and a growing customer base through a challenging economic environment.
Boston Scientific, a cardiovascular-focused medical device company, was among the top detractors from benchmark-relative performance. During the period, the company’s shares suffered as it voluntarily recalled its Lotus Edge transcatheter aortic valve replacement (TAVR) product. We remain constructive on the stock despite this setback. The TAVR market is currently a small portion of the company’s revenue and profitability and, in our view, the company is attractively valued as one of the fastest-growing companies within the medical technology industry.
Another top detractor for the period was defense contractor L3Harris Technologies. Defense stocks in general held up better during the initial COVID-related market sell-off but have struggled more recently. Huge levels of fiscal stimulus will likely lead to strained government budgets for the foreseeable future. As a result, fears that defense spending will be negatively impacted have weighed on the stock.
American Tower REIT, which owns and operates wireless and broadcast communications towers, was another detractor. Investors priced in slightly lower cell tower growth after the company renegotiated its contracts with the combined T-Mobile/Sprint. The stock also lagged later in the period as investors sought companies with strong secular growth or cyclical recovery prospects. Long term, we believe that the company can benefit from increasing wireless data consumption and the transition to 5G networks as well as growth outside the U.S.
OUTLOOK
We expect strong economic growth to reemerge in 2021 in the wake of headwinds from the pandemic in 2020 and the U.S.-China trade war in 2019. Market leadership in 2020 was dominated by stocks that benefited as a direct result of the COVID environment, driven partially by retail investor participation spurred by zero-cost trading and an increase in hours spent at home for individual investors. While leadership has thus far been narrow – limited mostly to the digital economy – we foresee a broadening recovery as vaccines are widely implemented and consumers are able to reengage with the physical economy.
Healthy consumer balance sheets, bolstered by a robust housing market and swift market recovery, can kindle pent-up demand in hard-hit industries like travel, entertainment and dining. Moving forward from the current trough, we see a long period of growth for select companies in industries like leisure travel. For instance, we see opportunity in some companies with variable cost structures that have been able to cut expenses to adjust to a drop in demand. While they have lost cash flow in the near term, they have not permanently impaired capital by diluting shareholders with additional equity. These companies have been willing to invest in their business during the downturn, and we believe they can continue to grow as the global economy recovers.
In our view, equities remain attractive as unparalleled levels of fiscal and monetary stimulus and a historically low interest rate environment have continued to support company valuations. As the economy normalizes, we see the potential for companies with more cyclical characteristics to rebound; however, we believe innovation will continue to be the primary driver of durable growth moving forward. Thus, we believe that it will be essential to remain focused on identifying the most innovative companies in the world.
Thank you for your investment in Janus Henderson VIT Forty Portfolio.
2 | DECEMBER 31, 2020 |
Janus Henderson VIT Forty Portfolio (unaudited)
Portfolio At A Glance
December 31, 2020
|
|
|
|
|
|
|
|
|
|
|
|
|
|
|
|
|
|
|
|
|
|
|
|
|
|
|
|
|
|
| 5 Top Contributors - Holdings | 5 Top Detractors - Holdings | |||||||
|
| Average
|
| Relative
|
|
| Average |
| Relative
|
| Snap Inc | 1.22% |
| 2.03% |
| Tesla Inc | 0.10% |
| -2.89% |
| Align Technology Inc | 0.59% |
| 0.95% |
| Boston Scientific Corp | 3.06% |
| -2.12% |
| Avalara Inc | 0.93% |
| 0.79% |
| Apple Inc | 5.31% |
| -1.57% |
| Netflix Inc | 2.61% |
| 0.64% |
| L3Harris Technologies Inc | 2.73% |
| -1.14% |
| Amazon.com Inc | 8.10% |
| 0.56% |
| American Tower Corp | 2.69% |
| -0.80% |
| 5 Top Contributors - Sectors* |
|
|
|
|
|
|
|
| Relative |
| Portfolio | Russell 1000 Growth Index |
|
|
| Contribution |
| Average Weight | Average Weight |
| Communication Services |
| 2.04% |
| 15.45% | 11.50% |
| Consumer Staples |
| 0.70% |
| 1.78% | 4.61% |
| Industrials |
| 0.51% |
| 5.70% | 6.39% |
| Health Care |
| 0.23% |
| 13.20% | 14.28% |
| Energy |
| 0.15% |
| 0.00% | 0.13% |
|
|
|
|
|
|
|
|
|
|
|
|
|
|
| 5 Top Detractors - Sectors* |
|
|
|
|
|
|
|
| Relative |
| Portfolio | Russell 1000 Growth Index |
|
|
| Contribution |
| Average Weight | Average Weight |
| Information Technology |
| -0.72% |
| 37.69% | 42.12% |
| Materials |
| -0.58% |
| 2.71% | 1.04% |
| Financials |
| -0.31% |
| 3.08% | 2.46% |
| Real Estate |
| -0.30% |
| 2.69% | 2.10% |
| Other** |
| -0.28% |
| 1.91% | 0.00% |
| Relative contribution reflects
how the portolio's holdings impacted return relative to the benchmark. Cash and securities not held in
the portfolio are not shown. For equity portfolios, relative contribution compares the performance of
a security in the portfolio to the benchmark's total return, factoring in the difference in weight of
that security in the benchmark. Returns are calculated using daily returns and previous day ending weights
rolled up by ticker, excluding fixed income securities, gross of advisory fees, may exclude certain derivatives
and will differ from actual performance. | |||||
* | Based on sector classification according to the Global Industry Classification Standard (“GICS”) codes, which are the exclusive property and a service mark of MSCI Inc. and Standard & Poor’s. | |||||
** | Not a GICS classified sector. | |||||
Janus Aspen Series | 3 |
Janus Henderson VIT Forty Portfolio (unaudited)
Portfolio At A Glance
December 31, 2020
5 Largest Equity Holdings - (% of Net Assets) | |
Amazon.com Inc | |
Internet & Direct Marketing Retail | 8.5% |
Microsoft Corp | |
Software | 7.5% |
Mastercard Inc | |
Information Technology Services | 6.2% |
Apple Inc | |
Technology Hardware, Storage & Peripherals | 5.3% |
Facebook Inc | |
Interactive Media & Services | 4.4% |
31.9% | |
Asset Allocation - (% of Net Assets) | |||||
Common Stocks | 97.6% | ||||
Investment Companies | 2.1% | ||||
Other | 0.3% | ||||
100.0% | |||||
Top Country Allocations - Long Positions - (% of Investment Securities) | |
As of December 31, 2020
| As of December 31, 2019
|
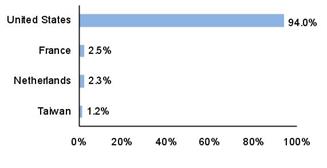
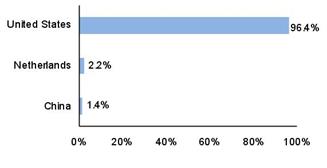
4 | DECEMBER 31, 2020 |
Janus Henderson VIT Forty Portfolio (unaudited)
Performance
See important disclosures on the next page. |
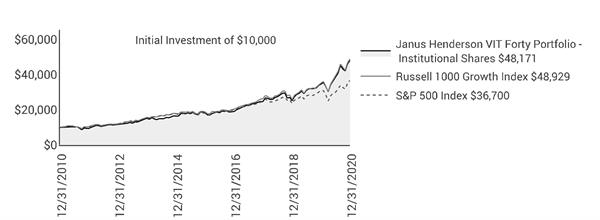
|
|
|
|
|
|
|
|
| |
|
|
|
|
|
|
|
|
|
|
Average Annual Total Return - for the periods ended December 31, 2020 |
|
| Expense Ratios | ||||||
|
| One
| Five | Ten
| Since |
|
| Total
Annual Fund | |
Institutional Shares |
| 39.40% | 21.03% | 17.02% | 13.06% |
|
| 0.77% | |
Service Shares |
| 39.03% | 20.73% | 16.73% | 12.75% |
|
| 1.02% | |
Russell 1000 Growth Index |
| 38.49% | 21.00% | 17.21% | 9.50% |
|
|
| |
S&P 500 Index |
| 18.40% | 15.22% | 13.88% | 8.79% |
|
|
| |
Morningstar Quartile - Institutional Shares |
| 2nd | 1st | 1st | 1st |
|
|
| |
Morningstar Ranking - based on total returns for Large Growth Funds |
| 418/1,319 | 216/1,211 | 213/1,058 | 12/550 |
|
|
| |
Returns quoted are past performance and do not guarantee future results; current performance may be lower or higher. Investment returns and principal value will vary; there may be a gain or loss when shares are sold. For the most recent month-end performance call 800.668.0434 or visit janushenderson.com/VITperformance.
This Portfolio has a performance-based management fee that may adjust up or down based on the Portfolio’s performance.
Performance may be affected by risks that include those associated with foreign and emerging markets, fixed income securities, high-yield and high-risk securities, undervalued, overlooked and smaller capitalization companies, real estate related securities including Real Estate Investment Trusts (REITs), non-diversification, portfolio turnover, derivatives, short sales, initial public offerings (IPOs) and potential conflicts of interest. Each product has different risks. Please see the prospectus for more information about risks, holdings and other details.
High absolute short-term performance is not typical and may not be achieved in the future. Such results should not be the sole basis for evaluating material facts in making an investment decision.
Returns do not reflect the deduction of fees, charges or expenses of any insurance product or qualified plan. If applied, returns would have been lower.
Returns include reinvestment of all dividends and distributions and do not reflect the deduction of taxes that a shareholder would pay on Portfolio distributions or redemptions of Portfolio shares. The returns do not include adjustments in accordance with generally accepted accounting principles required at the period end for financial reporting purposes.
Performance for Service Shares prior to December 31, 1999 reflects the performance of Institutional Shares, adjusted to reflect the expenses of Service Shares.
Ranking is for the share class shown only; other classes may have different performance characteristics.
© 2020 Morningstar, Inc. All Rights Reserved.
There is no assurance that the investment process will consistently lead to successful investing.
Janus Aspen Series | 5 |
Janus Henderson VIT Forty Portfolio (unaudited)
Performance
See Notes to Schedule of Investments and Other Information for index definitions.
Index performance does not reflect the expenses of managing a portfolio as an index is unmanaged and not available for direct investment.
See “Useful Information About Your Portfolio Report.”
*The Portfolio’s inception date – May 1 ,1997
‡ As stated in the prospectus. See Financial Highlights for actual expense ratios during the reporting period.
6 | DECEMBER 31, 2020 |
Janus Henderson VIT Forty Portfolio (unaudited)
Expense Examples
As a shareholder of the Portfolio, you incur two types of costs: (1) transaction costs and (2) ongoing costs, including management fees; 12b-1 distribution and shareholder servicing fees (applicable to Service Shares only); transfer agent fees and expenses payable pursuant to the Transfer Agency Agreement; and other Portfolio expenses. This example is intended to help you understand your ongoing costs (in dollars) of investing in the Portfolio and to compare these costs with the ongoing costs of investing in other mutual funds. To do so, compare this 5% hypothetical example with the 5% hypothetical examples that appear in the shareholder reports of the other funds. The example is based upon an investment of $1,000 invested at the beginning of the period and held for the six-months indicated, unless noted otherwise in the table and footnotes below.
Actual Expenses
The information in the table under the heading “Actual” provides information about actual account values and actual expenses. You may use the information in these columns, together with the amount you invested, to estimate the expenses that you paid over the period. Simply divide your account value by $1,000 (for example, an $8,600 account value divided by $1,000 = 8.6), then multiply the result by the number in the appropriate column for your share class under the heading entitled “Expenses Paid During Period” to estimate the expenses you paid on your account during the period.
Hypothetical Example for Comparison Purposes
The information in the table under the heading “Hypothetical (5% return before expenses)” provides information about hypothetical account values and hypothetical expenses based upon the Portfolio’s actual expense ratio and an assumed rate of return of 5% per year before expenses, which is not the Portfolio’s actual return. The hypothetical account values and expenses may not be used to estimate the actual ending account balance or expenses you paid for the period. You may use this information to compare the ongoing costs of investing in the Portfolio and other funds. To do so, compare this 5% hypothetical example with the 5% hypothetical examples that appear in the shareholder reports of the other funds. Additionally, for an analysis of the fees associated with an investment in either share class or other similar funds, please visit www.finra.org/fundanalyzer.
Please note that the expenses shown in the table are meant to highlight your ongoing costs only and do not reflect any transaction costs, such as any charges at the separate account level or contract level. These fees are fully described in the Portfolio’s prospectuses. Therefore, the hypothetical examples are useful in comparing ongoing costs only, and will not help you determine the relative total costs of owning different funds. In addition, if these transaction costs were included, your costs would have been higher.
|
|
|
|
|
|
|
|
| ||
|
|
| Actual |
| Hypothetical
|
| ||||
| Beginning | Ending | Expenses |
| Beginning | Ending | Expenses | Net Annualized | ||
Institutional Shares | $1,000.00 | $1,257.70 | $4.26 |
| $1,000.00 | $1,021.37 | $3.81 | 0.75% | ||
Service Shares | $1,000.00 | $1,256.20 | $5.67 |
| $1,000.00 | $1,020.11 | $5.08 | 1.00% | ||
† | Expenses Paid During Period are equal to the Net Annualized Expense Ratio multiplied by the average account value over the period, multiplied by 184/366 (to reflect the one-half year period). Expenses in the examples include the effect of applicable fee waivers and/or expense reimbursements, if any. Had such waivers and/or reimbursements not been in effect, your expenses would have been higher. Please refer to the Notes to Financial Statements or the Portfolio’s prospectuses for more information regarding waivers and/or reimbursements. | |||||||||
Janus Aspen Series | 7 |
Janus Henderson VIT Forty Portfolio
Schedule of Investments
December 31, 2020
| Value | ||||||
Common Stocks– 97.6% | |||||||
Aerospace & Defense – 2.8% | |||||||
L3Harris Technologies Inc | 163,089 | $30,827,083 | |||||
Biotechnology – 1.4% | |||||||
Vertex Pharmaceuticals Inc* | 64,670 | 15,284,108 | |||||
Capital Markets – 2.6% | |||||||
Blackstone Group Inc | 445,093 | 28,846,477 | |||||
Chemicals – 1.9% | |||||||
Sherwin-Williams Co | 28,141 | 20,681,102 | |||||
Diversified Financial Services – 0.3% | |||||||
Altimeter Growth Corp* | 284,205 | 3,694,665 | |||||
Entertainment – 3.6% | |||||||
Netflix Inc* | 46,933 | 25,378,081 | |||||
Walt Disney Co* | 76,012 | 13,771,854 | |||||
39,149,935 | |||||||
Equity Real Estate Investment Trusts (REITs) – 2.0% | |||||||
American Tower Corp | 97,278 | 21,835,020 | |||||
Health Care Equipment & Supplies – 8.1% | |||||||
Align Technology Inc* | 47,079 | 25,158,076 | |||||
Boston Scientific Corp* | 696,903 | 25,053,663 | |||||
Danaher Corp | 123,360 | 27,403,190 | |||||
Edwards Lifesciences Corp* | 125,970 | 11,492,243 | |||||
89,107,172 | |||||||
Hotels, Restaurants & Leisure – 0.6% | |||||||
Caesars Entertainment Inc* | 85,425 | 6,344,515 | |||||
Household Products – 2.2% | |||||||
Procter & Gamble Co | 176,038 | 24,493,927 | |||||
Information Technology Services – 9.1% | |||||||
Mastercard Inc | 191,073 | 68,201,597 | |||||
PayPal Holdings Inc* | 84,660 | 19,827,372 | |||||
Twilio Inc* | 34,852 | 11,797,402 | |||||
99,826,371 | |||||||
Interactive Media & Services – 11.3% | |||||||
Alphabet Inc - Class C* | 16,836 | 29,494,652 | |||||
Facebook Inc* | 176,648 | 48,253,168 | |||||
Match Group Inc* | 87,336 | 13,204,330 | |||||
Snap Inc* | 652,308 | 32,661,062 | |||||
123,613,212 | |||||||
Internet & Direct Marketing Retail – 11.9% | |||||||
Amazon.com Inc* | 28,685 | 93,425,037 | |||||
Booking Holdings Inc* | 15,296 | 34,068,322 | |||||
DoorDash Inc - Class A* | 17,147 | 2,447,734 | |||||
129,941,093 | |||||||
Life Sciences Tools & Services – 1.5% | |||||||
Illumina Inc* | 45,529 | 16,845,730 | |||||
Pharmaceuticals – 1.7% | |||||||
Elanco Animal Health Inc* | 587,960 | 18,032,733 | |||||
Professional Services – 2.0% | |||||||
CoStar Group Inc* | 23,541 | 21,758,475 | |||||
Semiconductor & Semiconductor Equipment – 8.3% | |||||||
ASML Holding NV | 50,830 | 24,790,808 | |||||
NVIDIA Corp | 43,296 | 22,609,171 | |||||
Taiwan Semiconductor Manufacturing Co Ltd (ADR) | 123,850 | 13,504,604 | |||||
Texas Instruments Inc | 184,213 | 30,234,880 | |||||
91,139,463 | |||||||
Software – 13.9% | |||||||
Adobe Inc* | 61,304 | 30,659,356 | |||||
Avalara Inc* | 26,897 | 4,435,046 | |||||
Microsoft Corp | 369,831 | 82,257,811 | |||||
salesforce.com Inc* | 158,009 | 35,161,743 | |||||
152,513,956 | |||||||
See Notes to Schedule of Investments and Other Information and Notes to Financial Statements. | |
8 | DECEMBER 31, 2020 |
Janus Henderson VIT Forty Portfolio
Schedule of Investments
December 31, 2020
| Value | ||||||
Common Stocks– (continued) | |||||||
Technology Hardware, Storage & Peripherals – 5.3% | |||||||
Apple Inc | 437,981 | $58,115,699 | |||||
Textiles, Apparel & Luxury Goods – 4.4% | |||||||
LVMH Moet Hennessy Louis Vuitton SE | 44,543 | 27,828,264 | |||||
NIKE Inc | 147,294 | 20,837,682 | |||||
48,665,946 | |||||||
Wireless Telecommunication Services – 2.7% | |||||||
T-Mobile US Inc* | 219,823 | 29,643,132 | |||||
Total Common Stocks (cost $536,693,675) | 1,070,359,814 | ||||||
Investment Companies– 2.1% | |||||||
Money Markets – 2.1% | |||||||
Janus Henderson Cash Liquidity Fund LLC, 0.1108%ºº,£((cost $22,532,880) | 22,530,627 | 22,532,880 | |||||
Total Investments (total cost $559,226,555) – 99.7% | 1,092,892,694 | ||||||
Cash, Receivables and Other Assets, net of Liabilities – 0.3% | 3,716,393 | ||||||
Net Assets – 100% | $1,096,609,087 | ||||||
Summary of Investments by Country - (Long Positions) (unaudited) | |||||
% of | |||||
Investment | |||||
Country | Value | Securities | |||
United States | $1,026,769,018 | 94.0 | % | ||
France | 27,828,264 | 2.5 | |||
Netherlands | 24,790,808 | 2.3 | |||
Taiwan | 13,504,604 | 1.2 | |||
Total | $1,092,892,694 | 100.0 | % |
See Notes to Schedule of Investments and Other Information and Notes to Financial Statements. | |
Janus Aspen Series | 9 |
Janus Henderson VIT Forty Portfolio
Schedule of Investments
December 31, 2020
Schedules of Affiliated Investments – (% of Net Assets)
Dividend Income | Realized Gain/(Loss) | Change in Unrealized Appreciation/ Depreciation | Value at 12/31/20 | |||||||
Investment Companies - 2.1% | ||||||||||
Money Markets - 2.1% | ||||||||||
Janus Henderson Cash Liquidity Fund LLC, 0.1108%ºº | $ | 104,495 | $ | 5,437 | $ | 223 | $ | 22,532,880 | ||
Investments Purchased with Cash Collateral from Securities Lending - N/A | ||||||||||
Investment Companies - N/A | ||||||||||
Janus Henderson Cash Collateral Fund LLC, 0.0264%ºº | 283,080∆ | - | - | - | ||||||
Total Affiliated Investments - 2.1% | $ | 387,575 | $ | 5,437 | $ | 223 | $ | 22,532,880 | ||
Value at 12/31/19 | Purchases | Sales Proceeds | Value at 12/31/20 | |||||||
Investment Companies - 2.1% | ||||||||||
Money Markets - 2.1% | ||||||||||
Janus Henderson Cash Liquidity Fund LLC, 0.1108%ºº | 17,377,343 | 270,952,708 | (265,802,831) | 22,532,880 | ||||||
Investments Purchased with Cash Collateral from Securities Lending - N/A | ||||||||||
Investment Companies - N/A | ||||||||||
Janus Henderson Cash Collateral Fund LLC, 0.0264%ºº | - | 31,371,081 | (31,371,081) | - | ||||||
See Notes to Schedule of Investments and Other Information and Notes to Financial Statements. | |
10 | DECEMBER 31, 2020 |
Janus Henderson VIT Forty Portfolio
Notes to Schedule of Investments and Other Information
Russell 1000® Growth Index | Russell 1000® Growth Index reflects the performance of U.S. large-cap equities with higher price-to-book ratios and higher forecasted growth values. |
S&P 500® Index | S&P 500® Index reflects U.S. large-cap equity performance and represents broad U.S. equity market performance. |
ADR | American Depositary Receipt |
LLC | Limited Liability Company |
* | Non-income producing security. |
ºº | Rate shown is the 7-day yield as of December 31, 2020. |
£ | The Portfolio may invest in certain securities that are considered affiliated companies. As defined by the Investment Company Act of 1940, as amended, an affiliated company is one in which the Portfolio owns 5% or more of the outstanding voting securities, or a company which is under common ownership or control. |
∆ | Net of income paid to the securities lending agent and rebates paid to the borrowing counterparties. |
The following is a summary of the inputs that were used to value the Portfolio’s investments in securities and other financial instruments as of December 31, 2020. See Notes to Financial Statements for more information. | ||||||||||||
Valuation Inputs Summary | ||||||||||||
Level 2 - | Level 3 - | |||||||||||
Level 1 - | Other Significant | Significant | ||||||||||
Quoted Prices | Observable Inputs | Unobservable Inputs | ||||||||||
Assets | ||||||||||||
Investments In Securities: | ||||||||||||
Common Stocks | ||||||||||||
Textiles, Apparel & Luxury Goods | $ | 20,837,682 | $ | 27,828,264 | $ | - | ||||||
All Other | 1,021,693,868 | - | - | |||||||||
Investment Companies | - | 22,532,880 | - | |||||||||
Total Assets | $ | 1,042,531,550 | $ | 50,361,144 | $ | - | ||||||
Janus Aspen Series | 11 |
Janus Henderson VIT Forty Portfolio
Statement of Assets and Liabilities
December 31, 2020
|
|
|
|
|
|
|
Assets: |
|
|
|
| ||
| Unaffiliated investments, at value(1) |
| $ | 1,070,359,814 |
| |
| Affiliated investments, at value(2) |
|
| 22,532,880 |
| |
| Non-interested Trustees' deferred compensation |
|
| 25,279 |
| |
| Receivables: |
|
|
|
| |
|
| Investments sold |
|
| 8,494,752 |
|
|
| Portfolio shares sold |
|
| 426,404 |
|
|
| Dividends |
|
| 183,179 |
|
|
| Foreign tax reclaims |
|
| 7,160 |
|
|
| Dividends from affiliates |
|
| 2,041 |
|
| Other assets |
|
| 9,463 |
| |
Total Assets |
|
| 1,102,040,972 |
| ||
Liabilities: |
|
|
|
| ||
| Payables: |
|
| — |
| |
|
| Investments purchased |
|
| 2,233,048 |
|
|
| Portfolio shares repurchased |
|
| 2,121,255 |
|
|
| Advisory fees |
|
| 708,874 |
|
|
| 12b-1 Distribution and shareholder servicing fees |
|
| 144,639 |
|
|
| Transfer agent fees and expenses |
|
| 54,246 |
|
|
| Professional fees |
|
| 36,783 |
|
|
| Non-interested Trustees' deferred compensation fees |
|
| 25,279 |
|
|
| Affiliated portfolio administration fees payable |
|
| 2,499 |
|
|
| Non-interested Trustees' fees and expenses |
|
| 1,442 |
|
|
| Custodian fees |
|
| 1,228 |
|
|
| Accrued expenses and other payables |
|
| 102,592 |
|
Total Liabilities |
|
| 5,431,885 |
| ||
Net Assets |
| $ | 1,096,609,087 |
| ||
Net Assets Consist of: |
|
|
|
| ||
| Capital (par value and paid-in surplus) |
| $ | 421,985,829 |
| |
| Total distributable earnings (loss) |
|
| 674,623,258 |
| |
Total Net Assets |
| $ | 1,096,609,087 |
| ||
Net Assets - Institutional Shares |
| $ | 462,216,274 |
| ||
| Shares Outstanding, $0.001 Par Value (unlimited shares authorized) |
|
| 8,109,308 |
| |
Net Asset Value Per Share |
| $ | 57.00 |
| ||
Net Assets - Service Shares |
| $ | 634,392,813 |
| ||
| Shares Outstanding, $0.001 Par Value (unlimited shares authorized) |
|
| 11,978,720 |
| |
Net Asset Value Per Share |
| $ | 52.96 |
| ||
(1) Includes cost of $536,693,675. (2) Includes cost of $22,532,880. |
See Notes to Financial Statements. | |
12 | DECEMBER 31, 2020 |
Janus Henderson VIT Forty Portfolio
Statement of Operations
For the year ended December 31, 2020
|
|
|
|
|
|
Investment Income: |
|
|
| ||
| Dividends | $ | 6,626,305 |
| |
| Affiliated securities lending income, net |
| 283,080 |
| |
| Dividends from affiliates |
| 104,495 |
| |
| Unaffiliated securities lending income, net |
| 3,166 |
| |
| Other income |
| 113 |
| |
| Foreign tax withheld |
| (80,047) |
| |
Total Investment Income |
| 6,937,112 |
| ||
Expenses: |
|
|
| ||
| Advisory fees |
| 6,377,205 |
| |
| 12b-1 Distribution and shareholder servicing fees: |
|
|
| |
|
| Service Shares |
| 1,381,019 |
|
| Transfer agent administrative fees and expenses: |
|
|
| |
|
| Institutional Shares |
| 196,107 |
|
|
| Service Shares |
| 276,204 |
|
| Other transfer agent fees and expenses: |
|
|
| |
|
| Institutional Shares |
| 18,719 |
|
|
| Service Shares |
| 11,879 |
|
| Professional fees |
| 44,872 |
| |
| Shareholder reports expense |
| 41,138 |
| |
| Registration fees |
| 25,729 |
| |
| Affiliated portfolio administration fees |
| 23,615 |
| |
| Non-interested Trustees’ fees and expenses |
| 18,071 |
| |
| Custodian fees |
| 9,440 |
| |
| Other expenses |
| 90,493 |
| |
Total Expenses |
| 8,514,491 |
| ||
Net Investment Income/(Loss) |
| (1,577,379) |
| ||
Net Realized Gain/(Loss) on Investments: |
|
|
| ||
| Investments and foreign currency transactions |
| 142,550,247 |
| |
| Investments in affiliates |
| 5,437 |
| |
Total Net Realized Gain/(Loss) on Investments |
| 142,555,684 |
| ||
Change in Unrealized Net Appreciation/Depreciation: |
|
|
| ||
| Investments, foreign currency translations and non-interested Trustees’ deferred compensation |
| 177,594,218 |
| |
| Investments in affiliates |
| 223 |
| |
Total Change in Unrealized Net Appreciation/Depreciation |
| 177,594,441 |
| ||
Net Increase/(Decrease) in Net Assets Resulting from Operations | $ | 318,572,746 |
| ||
|
|
|
|
|
|
See Notes to Financial Statements. | |
Janus Aspen Series | 13 |
Janus Henderson VIT Forty Portfolio
Statements of Changes in Net Assets
|
|
|
|
|
|
|
|
|
|
|
| Year ended |
| Year ended |
| ||
Operations: |
|
|
|
|
|
| ||
| Net investment income/(loss) | $ | (1,577,379) |
| $ | 678,107 |
| |
| Net realized gain/(loss) on investments |
| 142,555,684 |
|
| 71,678,445 |
| |
| Change in unrealized net appreciation/depreciation |
| 177,594,441 |
|
| 183,133,171 |
| |
Net Increase/(Decrease) in Net Assets Resulting from Operations |
| 318,572,746 |
|
| 255,489,723 |
| ||
Dividends and Distributions to Shareholders: |
|
|
|
|
|
| ||
|
| Institutional Shares |
| (28,629,140) |
|
| (27,749,524) |
|
|
| Service Shares |
| (43,209,494) |
|
| (42,198,627) |
|
Net Decrease from Dividends and Distributions to Shareholders |
| (71,838,634) |
|
| (69,948,151) |
| ||
Capital Share Transactions: |
|
|
|
|
|
| ||
|
| Institutional Shares |
| (4,352,608) |
|
| (6,219,350) |
|
|
| Service Shares |
| (32,885,634) |
|
| (11,662,110) |
|
Net Increase/(Decrease) from Capital Share Transactions |
| (37,238,242) |
|
| (17,881,460) |
| ||
Net Increase/(Decrease) in Net Assets |
| 209,495,870 |
|
| 167,660,112 |
| ||
Net Assets: |
|
|
|
|
|
| ||
| Beginning of period |
| 887,113,217 |
|
| 719,453,105 |
| |
| End of period | $ | 1,096,609,087 |
| $ | 887,113,217 |
| |
|
|
|
|
|
|
|
|
|
See Notes to Financial Statements. | |
14 | DECEMBER 31, 2020 |
Janus Henderson VIT Forty Portfolio
Financial Highlights
Institutional Shares |
|
|
|
|
|
|
|
|
|
|
|
|
|
|
| |||
For a share outstanding during the year ended December 31 |
| 2020 |
|
| 2019 |
|
| 2018 |
|
| 2017 |
|
| 2016 |
| |||
| Net Asset Value, Beginning of Period |
| $44.38 |
|
| $35.20 |
|
| $39.76 |
|
| $32.19 |
|
| $36.37 |
| ||
| Income/(Loss) from Investment Operations: |
|
|
|
|
|
|
|
|
|
|
|
|
|
|
| ||
|
| Net investment income/(loss)(1) |
| (0.01) |
|
| 0.09 |
|
| 0.07 |
|
| 0.02 |
|
| 0.05 |
| |
|
| Net realized and unrealized gain/(loss) |
| 16.29 |
|
| 12.55 |
|
| 1.31 |
|
| 9.58 |
|
| 0.58 |
| |
| Total from Investment Operations |
| 16.28 |
|
| 12.64 |
|
| 1.38 |
|
| 9.60 |
|
| 0.63 |
| ||
| Less Dividends and Distributions: |
|
|
|
|
|
|
|
|
|
|
|
|
|
|
| ||
|
| Dividends (from net investment income) |
| (0.14) |
|
| (0.06) |
|
| — |
|
| — |
|
| — |
| |
|
| Distributions (from capital gains) |
| (3.52) |
|
| (3.40) |
|
| (5.94) |
|
| (2.03) |
|
| (4.81) |
| |
| Total Dividends and Distributions |
| (3.66) |
|
| (3.46) |
|
| (5.94) |
|
| (2.03) |
|
| (4.81) |
| ||
| Net Asset Value, End of Period |
| $57.00 |
|
| $44.38 |
|
| $35.20 |
|
| $39.76 |
|
| $32.19 |
| ||
| Total Return* |
| 39.40% |
|
| 37.16% |
|
| 1.98% |
|
| 30.31% |
|
| 2.20% |
| ||
| Net Assets, End of Period (in thousands) |
| $462,216 |
|
| $362,001 |
|
| $292,132 |
|
| $309,258 |
|
| $257,009 |
| ||
| Average Net Assets for the Period (in thousands) |
| $389,419 |
|
| $337,416 |
|
| $327,962 |
|
| $297,125 |
|
| $273,374 |
| ||
| Ratios to Average Net Assets**: |
|
|
|
|
|
|
|
|
|
|
|
|
|
|
| ||
|
| Ratio of Gross Expenses |
| 0.76% |
|
| 0.77% |
|
| 0.71% |
|
| 0.82% |
|
| 0.72% |
| |
|
| Ratio of Net Expenses (After Waivers and Expense Offsets) |
| 0.76% |
|
| 0.77% |
|
| 0.71% |
|
| 0.82% |
|
| 0.72% |
| |
|
| Ratio of Net Investment Income/(Loss) |
| (0.02)% |
|
| 0.23% |
|
| 0.17% |
|
| 0.05% |
|
| 0.15% |
| |
| Portfolio Turnover Rate |
| 41% |
|
| 35% |
|
| 41% |
|
| 39% |
|
| 53% |
| ||
Service Shares |
|
|
|
|
|
|
|
|
|
|
|
|
|
|
| |||
For a share outstanding during the year ended December 31 |
| 2020 |
|
| 2019 |
|
| 2018 |
|
| 2017 |
|
| 2016 |
| |||
| Net Asset Value, Beginning of Period |
| $41.53 |
|
| $33.15 |
|
| $37.84 |
|
| $30.79 |
|
| $35.08 |
| ||
| Income/(Loss) from Investment Operations: |
|
|
|
|
|
|
|
|
|
|
|
|
|
|
| ||
|
| Net investment income/(loss)(1) |
| (0.12) |
|
| (0.01) |
|
| (0.03) |
|
| (0.07) |
|
| (0.03) |
| |
|
| Net realized and unrealized gain/(loss) |
| 15.15 |
|
| 11.80 |
|
| 1.28 |
|
| 9.15 |
|
| 0.55 |
| |
| Total from Investment Operations |
| 15.03 |
|
| 11.79 |
|
| 1.25 |
|
| 9.08 |
|
| 0.52 |
| ||
| Less Dividends and Distributions: |
|
|
|
|
|
|
|
|
|
|
|
|
|
|
| ||
|
| Dividends (from net investment income) |
| (0.08) |
|
| (0.01) |
|
| — |
|
| — |
|
| — |
| |
|
| Distributions (from capital gains) |
| (3.52) |
|
| (3.40) |
|
| (5.94) |
|
| (2.03) |
|
| (4.81) |
| |
| Total Dividends and Distributions |
| (3.60) |
|
| (3.41) |
|
| (5.94) |
|
| (2.03) |
|
| (4.81) |
| ||
| Net Asset Value, End of Period |
| $52.96 |
|
| $41.53 |
|
| $33.15 |
|
| $37.84 |
|
| $30.79 |
| ||
| Total Return* |
| 39.03% |
|
| 36.85% |
|
| 1.72% |
|
| 29.99% |
|
| 1.94% |
| ||
| Net Assets, End of Period (in thousands) |
| $634,393 |
|
| $525,112 |
|
| $427,321 |
|
| $466,969 |
|
| $430,510 |
| ||
| Average Net Assets for the Period (in thousands) |
| $548,645 |
|
| $495,465 |
|
| $487,559 |
|
| $457,168 |
|
| $464,943 |
| ||
| Ratios to Average Net Assets**: |
|
|
|
|
|
|
|
|
|
|
|
|
|
|
| ||
|
| Ratio of Gross Expenses |
| 1.01% |
|
| 1.02% |
|
| 0.96% |
|
| 1.06% |
|
| 0.97% |
| |
|
| Ratio of Net Expenses (After Waivers and Expense Offsets) |
| 1.01% |
|
| 1.02% |
|
| 0.96% |
|
| 1.06% |
|
| 0.97% |
| |
|
| Ratio of Net Investment Income/(Loss) |
| (0.27)% |
|
| (0.02)% |
|
| (0.08)% |
|
| (0.19)% |
|
| (0.09)% |
| |
| Portfolio Turnover Rate |
| 41% |
|
| 35% |
|
| 41% |
|
| 39% |
|
| 53% |
| ||
* Total return includes adjustments in accordance with generally accepted accounting principles required at the year or period end and are not annualized for periods of less than one full year. Total return does not include fees, charges, or expenses imposed by the variable annuity and life insurance contracts for which Janus Aspen Series serves as an underlying investment vehicle. ** Annualized for periods of less than one full year. (1) Per share amounts are calculated based on average shares outstanding during the year or period. |
See Notes to Financial Statements. | |
Janus Aspen Series | 15 |
Janus Henderson VIT Forty Portfolio
Notes to Financial Statements
1. Organization and Significant Accounting Policies
Janus Henderson VIT Forty Portfolio (the “Portfolio”) is a series of Janus Aspen Series (the “Trust”), which is organized as a Delaware statutory trust and is registered under the Investment Company Act of 1940, as amended (the “1940 Act”), as an open-end management investment company, and therefore has applied the specialized accounting and reporting guidance in Financial Accounting Standards Board (“FASB”) Accounting Standards Codification (“ASC”) Topic 946. The Trust offers 11 portfolios, each of which offers multiple share classes, with differing investment objectives and policies. The Portfolio seeks long-term growth of capital. The Portfolio is classified as nondiversified, as defined in the 1940 Act.
The Portfolio currently offers two classes of shares: Institutional Shares and Service Shares. Each class represents an interest in the same portfolio of investments. Institutional Shares are offered only in connection with investment in and payments under variable insurance contracts as well as certain qualified retirement plans. Service Shares are offered only in connection with investment in and payments under variable insurance contracts as well as certain qualified retirement plans that require a fee from Portfolio assets to procure distribution and administrative services to contract owners and plan participants.
Shareholders, including other portfolios, participating insurance companies, as well as accounts, may from time to time own (beneficially or of record) a significant percentage of the Portfolio’s Shares and can be considered to “control” the Portfolio when that ownership exceeds 25% of the Portfolio’s assets (and which may differ from control as determined in accordance with United States of America generally accepted accounting priciples ("US GAAP")).
The following accounting policies have been followed by the Portfolio and are in conformity with US GAAP.
Investment Valuation
Securities held by the Portfolio are valued in accordance with policies and procedures established by and under the supervision of the Trustees (the “Valuation Procedures”). Equity securities traded on a domestic securities exchange are generally valued at the closing prices on the primary market or exchange on which they trade. If such price is lacking for the trading period immediately preceding the time of determination, such securities are valued at their current bid price. Equity securities that are traded on a foreign exchange are generally valued at the closing prices on such markets. In the event that there is no current trading volume on a particular security in such foreign exchange, the bid price from the primary exchange is generally used to value the security. Securities that are traded on the over-the-counter (“OTC”) markets are generally valued at their closing or latest bid prices as available. Foreign securities and currencies are converted to U.S. dollars using the applicable exchange rate in effect at the close of the New York Stock Exchange (“NYSE”). The Portfolio will determine the market value of individual securities held by it by using prices provided by one or more approved professional pricing services or, as needed, by obtaining market quotations from independent broker-dealers. Most debt securities are valued in accordance with the evaluated bid price supplied by the pricing service that is intended to reflect market value. The evaluated bid price supplied by the pricing service is an evaluation that may consider factors such as security prices, yields, maturities and ratings. Certain short-term securities maturing within 60 days or less may be evaluated and valued on an amortized cost basis provided that the amortized cost determined approximates market value. Securities for which market quotations or evaluated prices are not readily available or deemed unreliable are valued at fair value determined in good faith under the Valuation Procedures. Circumstances in which fair value pricing may be utilized include, but are not limited to: (i) a significant event that may affect the securities of a single issuer, such as a merger, bankruptcy, or significant issuer-specific development; (ii) an event that may affect an entire market, such as a natural disaster or significant governmental action; (iii) a nonsignificant event such as a market closing early or not opening, or a security trading halt; and (iv) pricing of a nonvalued security and a restricted or nonpublic security. Special valuation considerations may apply with respect to “odd-lot” fixed-income transactions which, due to their small size, may receive evaluated prices by pricing services which reflect a large block trade and not what actually could be obtained for the odd-lot position. The Portfolio uses systematic fair valuation models provided by independent third parties to value international equity securities in order to adjust for stale pricing, which may occur between the close of certain foreign exchanges and the close of the NYSE.
Valuation Inputs Summary
FASB ASC 820, Fair Value Measurements and Disclosures (“ASC 820”), defines fair value, establishes a framework for measuring fair value, and expands disclosure requirements regarding fair value measurements. This standard emphasizes that fair value is a market-based measurement that should be determined based on the assumptions that
16 | DECEMBER 31, 2020 |
Janus Henderson VIT Forty Portfolio
Notes to Financial Statements
market participants would use in pricing an asset or liability and establishes a hierarchy that prioritizes inputs to valuation techniques used to measure fair value. These inputs are summarized into three broad levels:
Level 1 – Unadjusted quoted prices in active markets the Portfolio has the ability to access for identical assets or liabilities.
Level 2 – Observable inputs other than unadjusted quoted prices included in Level 1 that are observable for the asset or liability either directly or indirectly. These inputs may include quoted prices for the identical instrument on an inactive market, prices for similar instruments, interest rates, prepayment speeds, credit risk, yield curves, default rates and similar data.
Assets or liabilities categorized as Level 2 in the hierarchy generally include: debt securities fair valued in accordance with the evaluated bid or ask prices supplied by a pricing service; securities traded on OTC markets and listed securities for which no sales are reported that are fair valued at the latest bid price (or yield equivalent thereof) obtained from one or more dealers transacting in a market for such securities or by a pricing service approved by the Portfolio’s Trustees; certain short-term debt securities with maturities of 60 days or less that are fair valued at amortized cost; and equity securities of foreign issuers whose fair value is determined by using systematic fair valuation models provided by independent third parties in order to adjust for stale pricing which may occur between the close of certain foreign exchanges and the close of the NYSE. Other securities that may be categorized as Level 2 in the hierarchy include, but are not limited to, preferred stocks, bank loans, swaps, investments in unregistered investment companies, options, and forward contracts.
Level 3 – Unobservable inputs for the asset or liability to the extent that relevant observable inputs are not available, representing the Portfolio’s own assumptions about the assumptions that a market participant would use in valuing the asset or liability, and that would be based on the best information available.
There have been no significant changes in valuation techniques used in valuing any such positions held by the Portfolio since the beginning of the fiscal year.
The inputs or methodology used for fair valuing securities are not necessarily an indication of the risk associated with investing in those securities. The summary of inputs used as of December 31, 2020 to fair value the Portfolio’s investments in securities and other financial instruments is included in the “Valuation Inputs Summary” in the Notes to Schedule of Investments and Other Information.
Investment Transactions and Investment Income
Investment transactions are accounted for as of the date purchased or sold (trade date). Dividend income is recorded on the ex-dividend date. Certain dividends from foreign securities will be recorded as soon as the Portfolio is informed of the dividend, if such information is obtained subsequent to the ex-dividend date. Dividends from foreign securities may be subject to withholding taxes in foreign jurisdictions. Interest income is recorded daily on the accrual basis and includes amortization of premiums and accretion of discounts. The Portfolio classifies gains and losses on prepayments received as an adjustment to interest income. Debt securities may be placed in non-accrual status and related interest income may be reduced by stopping current accruals and writing off interest receivables when collection of all or a portion of interest has become doubtful. Gains and losses are determined on the identified cost basis, which is the same basis used for federal income tax purposes.
Expenses
The Portfolio bears expenses incurred specifically on its behalf. Each class of shares bears a portion of general expenses, which are allocated daily to each class of shares based upon the ratio of net assets represented by each class as a percentage of total net assets. Expenses directly attributable to a specific class of shares are charged against the operations of such class.
Estimates
The preparation of financial statements in conformity with US GAAP requires management to make estimates and assumptions that affect the reported amount of assets and liabilities and disclosure of contingent assets and liabilities at the date of the financial statements, and the reported amounts of income and expenses during the reporting period. Actual results could differ from those estimates.
Janus Aspen Series | 17 |
Janus Henderson VIT Forty Portfolio
Notes to Financial Statements
Indemnifications
In the normal course of business, the Portfolio may enter into contracts that contain provisions for indemnification of other parties against certain potential liabilities. The Portfolio’s maximum exposure under these arrangements is unknown, and would involve future claims that may be made against the Portfolio that have not yet occurred. Currently, the risk of material loss from such claims is considered remote.
Foreign Currency Translations
The Portfolio does not isolate that portion of the results of operations resulting from the effect of changes in foreign exchange rates on investments from the fluctuations arising from changes in market prices of securities held at the date of the financial statements. Net unrealized appreciation or depreciation of investments and foreign currency translations arise from changes in the value of assets and liabilities, including investments in securities held at the date of the financial statements, resulting from changes in the exchange rates and changes in market prices of securities held.
Currency gains and losses are also calculated on payables and receivables that are denominated in foreign currencies. The payables and receivables are generally related to foreign security transactions and income translations.
Foreign currency-denominated assets and forward currency contracts may involve more risks than domestic transactions, including currency risk, counterparty risk, political and economic risk, regulatory risk and equity risk. Risks may arise from unanticipated movements in the value of foreign currencies relative to the U.S. dollar.
Dividends and Distributions
The Portfolio may make semiannual distributions of substantially all of its investment income and an annual distribution of its net realized capital gains (if any).
The Portfolio may make certain investments in real estate investment trusts (“REITs”) which pay dividends to their shareholders based upon funds available from operations. It is quite common for these dividends to exceed the REITs’ taxable earnings and profits, resulting in the excess portion of such dividends being designated as a return of capital. If the Portfolio distributes such amounts, such distributions could constitute a return of capital to shareholders for federal income tax purposes.
Federal Income Taxes
The Portfolio intends to continue to qualify as a regulated investment company and distribute all of its taxable income in accordance with the requirements of Subchapter M of the Internal Revenue Code. Management has analyzed the Portfolio’s tax positions taken for all open federal income tax years, generally a three-year period, and has concluded that no provision for federal income tax is required in the Portfolio’s financial statements. The Portfolio is not aware of any tax positions for which it is reasonably possible that the total amounts of unrecognized tax benefits will significantly change in the next twelve months.
2. Other Investments and Strategies
Additional Investment Risk
In the aftermath of the 2007-2008 financial crisis, the financial sector experienced reduced liquidity in credit and other fixed-income markets, and an unusually high degree of volatility, both domestically and internationally. In response to the crisis, the United States and certain foreign governments, along with the U.S. Federal Reserve and certain foreign central banks, took a number of unprecedented steps designed to support the financial markets. For example, the enactment of the Dodd-Frank Act in 2010 provided for widespread regulation of financial institutions, consumer financial products and services, broker-dealers, over-the-counter derivatives, investment advisers, credit rating agencies, and mortgage lending, which expanded federal oversight in the financial sector, including the investment management industry. More recently, in response to the COVID-19 pandemic, the U.S. government and the Federal Reserve, as well as certain foreign governments and central banks, have taken extraordinary actions to support local and global economies and the financial markets, including reducing interest rates to record-low levels. Extremely low or negative interest rates may become more prevalent or may not work as intended. As there is little precedent for this situation, the impact on various markets that interest rate or other significant policy changes may have is unknown. The withdrawal of this support, a failure of measures put in place in response to such economic uncertainty, or investor perception that such efforts were not sufficient could each negatively affect financial markets generally, and the value and liquidity of specific securities. In addition, policy and legislative changes in the United States and in other countries continue to impact many aspects of financial regulation.
18 | DECEMBER 31, 2020 |
Janus Henderson VIT Forty Portfolio
Notes to Financial Statements
Widespread disease, including pandemics and epidemics, and natural or environmental disasters, such as earthquakes, fires, floods, hurricanes, tsunamis and weather-related phenomena generally, have been and can be highly disruptive to economies and markets, adversely impacting individual companies, sectors, industries, markets, currencies, interest and inflation rates, credit ratings, investor sentiment, and other factors affecting the value of a Fund’s investments. Economies and financial markets throughout the world have become increasingly interconnected, which increases the likelihood that events or conditions in one region or country will adversely affect markets or issuers in other regions or countries, including the United States. These disruptions could prevent a Fund from executing advantageous investment decisions in a timely manner and negatively impact a Fund’s ability to achieve its investment objective(s). Any such event(s) could have a significant adverse impact on the value of a Fund. In addition, these disruptions could also impair the information technology and other operational systems upon which the Fund’s service providers, including Janus Capital Management LLC ("Janus Capital") or the subadviser (as applicable), rely, and could otherwise disrupt the ability of employees of the Fund’s service providers to perform essential tasks on behalf of the Fund. Adverse weather conditions may also have a particularly significant negative effect on issuers in the agricultural sector and on insurance and reinsurance companies that insure or reinsure against the impact of natural disasters.
A number of countries in the European Union (the “EU”) have experienced, and may continue to experience, severe economic and financial difficulties. In particular, many EU nations are susceptible to economic risks associated with high levels of debt. Many non-governmental issuers, and even certain governments, have defaulted on, or been forced to restructure, their debts. Many other issuers have faced difficulties obtaining credit or refinancing existing obligations. Financial institutions have in many cases required government or central bank support, have needed to raise capital, and/or have been impaired in their ability to extend credit. As a result, financial markets in the EU have experienced extreme volatility and declines in asset values and liquidity. These difficulties may continue, worsen, or spread further within the EU. Responses to these financial problems by European governments, central banks, and others, including austerity measures and reforms, may not work, may result in social unrest, and may limit future growth and economic recovery or have other unintended consequences. The risk of investing in securities in the European markets may also be heightened due to the referendum in which the United Kingdom voted to exit the EU, commonly known as “Brexit,” which immediately led to significant market volatility around the world, as well as political, economic and legal uncertainty. The United Kingdom formally left the EU on January 31, 2020 and entered into an eleven-month transition period, which expired on December 31, 2020. The negative impact on not only the United Kingdom and European economies could be significant, potentially resulting in increased volatility and illiquidity and lower economic growth for companies that rely significantly on the United Kingdom and/or Europe for their business activities and revenues. Any further exits from the EU, or an increase in the belief that such exits are likely or possible, would likely cause additional market disruption globally and introduce new legal and regulatory uncertainties.
Counterparties
Portfolio transactions involving a counterparty are subject to the risk that the counterparty or a third party will not fulfill its obligation to the Portfolio (“counterparty risk”). Counterparty risk may arise because of the counterparty’s financial condition (i.e., financial difficulties, bankruptcy, or insolvency), market activities and developments, or other reasons, whether foreseen or not. A counterparty’s inability to fulfill its obligation may result in significant financial loss to the Portfolio. The Portfolio may be unable to recover its investment from the counterparty or may obtain a limited recovery, and/or recovery may be delayed. The extent of the Portfolio’s exposure to counterparty risk with respect to financial assets and liabilities approximates its carrying value.
The Portfolio may be exposed to counterparty risk through participation in various programs, including, but not limited to, lending its securities to third parties, cash sweep arrangements whereby the Portfolio’s cash balance is invested in one or more types of cash management vehicles, as well as investments in, but not limited to, repurchase agreements, debt securities, and derivatives, including various types of swaps, futures and options. The Portfolio intends to enter into financial transactions with counterparties that Janus Capital believes to be creditworthy at the time of the transaction. There is always the risk that Janus Capital’s analysis of a counterparty’s creditworthiness is incorrect or may change due to market conditions. To the extent that the Portfolio focuses its transactions with a limited number of counterparties, it will have greater exposure to the risks associated with one or more counterparties.
Real Estate Investing
The Portfolio may invest in equity and debt securities of real estate-related companies. Such companies may include those in the real estate industry or real estate-related industries. These securities may include common stocks, corporate bonds, preferred stocks, and other equity securities, including, but not limited to, mortgage-backed securities,
Janus Aspen Series | 19 |
Janus Henderson VIT Forty Portfolio
Notes to Financial Statements
real estate-backed securities, securities of REITs and similar REIT-like entities. A REIT is a trust that invests in real estate-related projects, such as properties, mortgage loans, and construction loans. REITs are generally categorized as equity, mortgage, or hybrid REITs. A REIT may be listed on an exchange or traded OTC.
Securities Lending
Under procedures adopted by the Trustees, the Portfolio may seek to earn additional income by lending securities to certain qualified broker-dealers and institutions. JPMorgan Chase Bank, National Association acts as securities lending agent and a limited purpose custodian or subcustodian to receive and disburse cash balances and cash collateral, hold short-term investments, hold collateral, and perform other custodial functions in accordance with the Non-Custodial Securities Lending Agreement. The Portfolio may lend portfolio securities in an amount equal to up to 1/3 of its total assets as determined at the time of the loan origination. There is the risk of delay in recovering a loaned security or the risk of loss in collateral rights if the borrower fails financially. In addition, Janus Capital makes efforts to balance the benefits and risks from granting such loans. All loans will be continuously secured by collateral which may consist of cash, U.S. Government securities, domestic and foreign short-term debt instruments, letters of credit, time deposits, repurchase agreements, money market mutual funds or other money market accounts, or such other collateral as permitted by the Securities and Exchange Commission (the "SEC"). If the Portfolio is unable to recover a security on loan, the Portfolio may use the collateral to purchase replacement securities in the market. There is a risk that the value of the collateral could decrease below the cost of the replacement security by the time the replacement investment is made, resulting in a loss to the Portfolio. In certain circumstances individual loan transactions could yield negative returns.
Upon receipt of cash collateral, Janus Capital may invest it in affiliated or non-affiliated cash management vehicles, whether registered or unregistered entities, as permitted by the 1940 Act and rules promulgated thereunder. Janus Capital currently intends to primarily invest the cash collateral in a cash management vehicle for which Janus Capital serves as investment adviser, Janus Henderson Cash Collateral Fund LLC, or in time deposits. An investment in Janus Henderson Cash Collateral Fund LLC is generally subject to the same risks that shareholders experience when investing in similarly structured vehicles, such as the potential for significant fluctuations in assets as a result of the purchase and redemption activity of the securities lending program, a decline in the value of the collateral, and possible liquidity issues. Such risks may delay the return of the cash collateral and cause the Portfolio to violate its agreement to return the cash collateral to a borrower in a timely manner. As adviser to the Portfolio and Janus Henderson Cash Collateral Fund LLC, Janus Capital has an inherent conflict of interest as a result of its fiduciary duties to both the Portfolio and Janus Henderson Cash Collateral Fund LLC. Additionally, Janus Capital receives an investment advisory fee of 0.05% for managing Janus Henderson Cash Collateral Fund LLC, but it may not receive a fee for managing certain other affiliated cash management vehicles in which the Portfolio may invest, and therefore may have an incentive to allocate preferred investment opportunities to investment vehicles for which it is receiving a fee.
The value of the collateral must be at least 102% of the market value of the loaned securities that are denominated in U.S. dollars and 105% of the market value of the loaned securities that are not denominated in U.S. dollars. Loaned securities and related collateral are marked-to-market each business day based upon the market value of the loaned securities at the close of business, employing the most recent available pricing information. Collateral levels are then adjusted based on this mark-to-market evaluation.
The cash collateral invested by Janus Capital is disclosed in the Schedule of Investments (if applicable).
Income earned from the investment of the cash collateral, net of rebates paid to, or fees paid by, borrowers and less the fees paid to the lending agent are included as “Affiliated securities lending income, net” on the Statement of Operations.
There were no securities on loan as of December 31, 2020.
3. Investment Advisory Agreements and Other Transactions with Affiliates
The Portfolio pays Janus Capital Management LLC (“Janus Capital”) an investment advisory fee which is calculated daily and paid monthly. The Portfolio’s "base" fee rate prior to any performance adjustment (expressed as an annual rate) is 0.64%.
The investment advisory fee rate is determined by calculating a base fee and applying a performance adjustment. The base fee rate is the same as the contractual investment advisory fee rate. The performance adjustment either increases or decreases the base fee depending on how well the Portfolio has performed relative to its benchmark index. The Portfolio's benchmark index used in the calculation is the Russell 1000® Growth Index.
20 | DECEMBER 31, 2020 |
Janus Henderson VIT Forty Portfolio
Notes to Financial Statements
The calculation of the performance adjustment applies as follows:
Investment Advisory Fee = Base Fee Rate +/- Performance Adjustment
The investment advisory fee rate paid to Janus Capital by the Portfolio consists of two components: (1) a base fee calculated by applying the contractual fixed rate of the advisory fee to the Portfolio’s average daily net assets during the previous month (“Base Fee Rate”), plus or minus (2) a performance-fee adjustment (“Performance Adjustment”) calculated by applying a variable rate of up to 0.15% (positive or negative) to the Portfolio’s average daily net assets based on the Portfolio’s relative performance compared to the cumulative investment record of its benchmark index over a 36-month performance measurement period or shorter time period, as applicable. The investment performance of a Portfolio’s Service Shares, for the performance measurement period is used to calculate the Performance Adjustment. No Performance Adjustment is applied unless the difference between the Portfolio’s investment performance and the cumulative investment record of the Portfolio’s benchmark index is 0.50% or greater (positive or negative) during the applicable performance measurement period.
The Portfolio’s prospectuses and statement(s) of additional information contain additional information about performance-based fees. The amount shown as advisory fees on the Statement of Operations reflects the Base Fee Rate plus/minus any Performance Adjustment. For the year ended December 31, 2020, the performance adjusted investment advisory fee rate before any waivers and/or reimbursements of expenses is 0.68%.
Janus Services LLC (“Janus Services”), a wholly-owned subsidiary of Janus Capital, is the Portfolio’s transfer agent. Janus Services receives an administrative services fee at an annual rate of 0.05% of the average daily net assets of the Portfolio for arranging for the provision by participating insurance companies and qualified plan service providers of administrative services, including recordkeeping, subaccounting, order processing, or other shareholder services provided on behalf of contract holders or plan participants investing in the Portfolio. Other shareholder services may include the provision of order confirmations, periodic account statements, forwarding prospectuses, shareholder reports, and other materials to existing investors, and answering inquiries regarding accounts. Janus Services expects to use this entire fee to compensate insurance companies and qualified plan service providers for providing these services to their customers who invest in the Portfolio. Any unused portion will be reimbursed to the applicable share class at least annually.
In addition, Janus Services provides or arranges for the provision of certain other internal administrative, recordkeeping, and shareholder relations services for the Portfolio. Janus Services is not compensated for these internal services related to the shares, except for out-of-pocket costs. These amounts are disclosed as “Other transfer agent fees and expenses” on the Statement of Operations.
Under a distribution and shareholder servicing plan (the “Plan”) adopted in accordance with Rule 12b-1 under the 1940 Act, the Service Shares may pay the Trust’s distributor, Janus Distributors LLC (“Janus Distributors”), a wholly-owned subsidiary of Janus Capital, a fee for the sale and distribution and/or shareholder servicing of the Service Shares at an annual rate of up to 0.25% of the average daily net assets of the Service Shares. Under the terms of the Plan, the Trust is authorized to make payments to Janus Distributors for remittance to insurance companies and qualified plan service providers as compensation for distribution and/or shareholder services performed by such entities. These amounts are disclosed as “12b-1 Distribution and shareholder servicing fees” on the Statement of Operations. Payments under the Plan are not tied exclusively to actual 12b-1 distribution and servicing fees, and the payments may exceed 12b-1 distribution and servicing fees actually incurred. If any of the Portfolio’s actual 12b-1 distribution and servicing fees incurred during a calendar year are less than the payments made during a calendar year, the Portfolio will be refunded the difference. Refunds, if any, are included in “12b-1 Distribution and shareholder servicing fees” in the Statement of Operations.
Janus Capital serves as administrator to the Portfolio pursuant to an administration agreement between Janus Capital and the Trust. Under the administration agreement, Janus Capital is obligated to provide or arrange for the provision of certain administration, compliance, and accounting services to the Portfolio, including providing office space for the Portfolio, and is reimbursed by the Portfolio for certain of its costs in providing these services (to the extent Janus Capital seeks reimbursement and such costs are not otherwise waived). In addition, employees of Janus Capital and/or its affiliates may serve as officers of the Trust. The Portfolio pays for some or all of the salaries, fees, and expenses of Janus Capital employees and Portfolio officers, with respect to certain specified administration functions they perform on behalf of the Portfolio. The Portfolio pays these costs based on out-of-pocket expenses incurred by Janus Capital, and these costs are separate and apart from advisory fees and other expenses paid in connection with the investment
Janus Aspen Series | 21 |
Janus Henderson VIT Forty Portfolio
Notes to Financial Statements
advisory services Janus Capital (or any subadvisor, as applicable) provides to the Portfolio. These amounts are disclosed as “Affiliated portfolio administration fees” on the Statement of Operations. In addition, some expenses related to compensation payable to the Portfolio’s Chief Compliance Officer and certain compliance staff, all of whom are employees of Janus Capital and/or its affiliates, are shared with the Portfolio. Total compensation of $34,973 was paid to the Chief Compliance Officer and certain compliance staff by the Trust during the year ended December 31, 2020. The Portfolio's portion is reported as part of “Other expenses” on the Statement of Operations.
The Board of Trustees has adopted a deferred compensation plan (the “Deferred Plan”) for independent Trustees to elect to defer receipt of all or a portion of the annual compensation they are entitled to receive from the Portfolio. All deferred fees are credited to an account established in the name of the Trustees. The amounts credited to the account then increase or decrease, as the case may be, in accordance with the performance of one or more of the Janus Henderson funds that are selected by the Trustees. The account balance continues to fluctuate in accordance with the performance of the selected fund or funds until final payment of all amounts are credited to the account. The fluctuation of the account balance is recorded by the Portfolio as unrealized appreciation/(depreciation) and is included as of December 31, 2020 on the Statement of Assets and Liabilities in the asset, “Non-interested Trustees’ deferred compensation,” and liability, “Non-interested Trustees’ deferred compensation fees.” Additionally, the recorded unrealized appreciation/(depreciation) is included in “Total distributable earnings (loss)” on the Statement of Assets and Liabilities. Deferred compensation expenses for the year ended December 31, 2020 are included in “Non-interested Trustees’ fees and expenses” on the Statement of Operations. Trustees are allowed to change their designation of mutual funds from time to time. Amounts will be deferred until distributed in accordance with the Deferred Plan. Deferred fees of $471,450 were paid by the Trust to the Trustees under the Deferred Plan during the year ended December 31, 2020.
Pursuant to the provisions of the 1940 Act and related rules, the Portfolio may participate in an affiliated or non-affiliated cash sweep program. In the cash sweep program, uninvested cash balances of the Portfolio may be used to purchase shares of affiliated or non-affiliated money market funds or cash management pooled investment vehicles that operate as money market funds. The Portfolio is eligible to participate in the cash sweep program (the “Investing Funds”). As adviser, Janus Capital has an inherent conflict of interest because of its fiduciary duties to the affiliated money market funds or cash management pooled investment vehicles and the Investing Funds. Janus Henderson Cash Liquidity Fund LLC (the “Sweep Vehicle”) is an affiliated unregistered cash management pooled investment vehicle that invests primarily in highly-rated short-term fixed-income securities. The Sweep Vehicle operates pursuant to the provisions of the 1940 Act that govern the operation of money market funds and prices its shares at NAV reflecting market-based values of its portfolio securities (i.e., a “floating” NAV) rounded to the fourth decimal place (e.g., $1.0000). The Sweep Vehicle is permitted to impose a liquidity fee (of up to 2%) on redemptions from the Sweep Vehicle or a redemption gate that temporarily suspends redemptions from the Sweep Vehicle for up to 10 business days during a 90 day period. There are no restrictions on the Portfolio's ability to withdraw investments from the Sweep Vehicle at will, and there are no unfunded capital commitments due from the Portfolio to the Sweep Vehicle. The Sweep Vehicle does not charge any management fee, sales charge or service fee.
Any purchases and sales, realized gains/losses and recorded dividends from affiliated investments during the year ended December 31, 2020 can be found in the “Schedules of Affiliated Investments” located in the Schedule of Investments.
The Portfolio is permitted to purchase or sell securities (“cross-trade”) between itself and other funds or accounts managed by Janus Capital in accordance with Rule 17a-7 under the Investment Company Act of 1940 (“Rule 17a-7”), when the transaction is consistent with the investment objectives and policies of the Portfolio and in accordance with the Internal Cross Trade Procedures adopted by the Trust’s Board of Trustees. These procedures have been designed to ensure that any cross-trade of securities by the Portfolio from or to another fund or account that is or could be considered an affiliate of the Portfolio under certain limited circumstances by virtue of having a common investment adviser, common Officer, or common Trustee complies with Rule 17a-7. Under these procedures, each cross-trade is effected at the current market price to save costs where allowed. During the year ended December 31, 2020, the Portfolio engaged in cross trades amounting to $44,137 in purchases and $1,075,151 in sales, resulting in a net realized loss of $565,414. The net realized loss is included within the “Net Realized Gain/(Loss) on Investments” section of the Portfolio’s Statement of Operations.
22 | DECEMBER 31, 2020 |
Janus Henderson VIT Forty Portfolio
Notes to Financial Statements
4. Federal Income Tax
The tax components of capital shown in the table below represent: (1) distribution requirements the Portfolio must satisfy under the income tax regulations; (2) losses or deductions the Portfolio may be able to offset against income and gains realized in future years; and (3) unrealized appreciation or depreciation of investments for federal income tax purposes.
Other book to tax differences primarily consist of deferred compensation. The Portfolio has elected to treat gains and losses on forward foreign currency contracts as capital gains and losses, if applicable. Other foreign currency gains and losses on debt instruments are treated as ordinary income for federal income tax purposes pursuant to Section 988 of the Internal Revenue Code.
|
|
| Loss Deferrals | Other Book | Net Tax |
| |
Undistributed | Undistributed
| Accumulated | Late-Year | Post-October
| to Tax | Appreciation/
|
|
$ 6,110,328 | $ 138,007,250 | $ - | $ - | $ - | $ (22,551) | $530,528,231 |
|
The aggregate cost of investments and the composition of unrealized appreciation and depreciation of investment securities for federal income tax purposes as of December 31, 2020 are noted below. The primary differences between book and tax appreciation or depreciation of investments are wash sale loss deferrals, investments in partnerships, and investments in passive foreign investment companies.
Federal Tax Cost | Unrealized | Unrealized | Net
Tax Appreciation/ |
$ 562,364,463 | $530,623,143 | $ (94,912) | $ 530,528,231 |
Income and capital gains distributions are determined in accordance with income tax regulations that may differ from US GAAP. These differences are due to differing treatments for items such as net short-term gains, deferral of wash sale losses, foreign currency transactions, passive foreign investment companies, and capital loss carryovers. Certain permanent differences such as tax returns of capital and net investment losses noted below have been reclassified to capital.
For the year ended December 31, 2020 |
| |||
Distributions |
|
| ||
From Ordinary Income | From Long-Term Capital Gains | Tax Return of Capital | Net Investment Loss |
|
$ 6,253,584 | $ 65,585,050 | $ - | $ - |
|
For the year ended December 31, 2019 |
| |||
Distributions |
|
| ||
From Ordinary Income | From Long-Term Capital Gains | Tax Return of Capital | Net Investment Loss |
|
$ 618,837 | $ 69,329,314 | $ - | $ - |
|
Janus Aspen Series | 23 |
Janus Henderson VIT Forty Portfolio
Notes to Financial Statements
Permanent book to tax basis differences may result in reclassifications between the components of net assets. These differences have no impact on the results of operations or net assets. The following reclassifications have been made to the Portfolio:
|
|
|
Increase/(Decrease) to Capital | Increase/(Decrease)
to Undistributed | Increase/(Decrease)
to Undistributed |
$ (2) | $ 913,636 | $ (913,634) |
5. Capital Share Transactions
|
|
|
|
|
|
|
|
| Year ended December 31, 2020 |
| Year ended December 31, 2019 | ||
|
| Shares | Amount |
| Shares | Amount |
Institutional Shares: |
|
|
|
|
| |
Shares sold | 1,037,980 | $ 48,778,741 |
| 1,174,768 | $ 48,016,950 | |
Reinvested dividends and distributions | 667,502 | 28,629,140 |
| 703,924 | 27,749,524 | |
Shares repurchased | (1,752,621) | (81,760,489) |
| (2,021,587) | (81,985,824) | |
Net Increase/(Decrease) | (47,139) | $ (4,352,608) |
| (142,895) | $ (6,219,350) | |
Service Shares: |
|
|
|
|
| |
Shares sold | 1,055,239 | $ 47,177,425 |
| 919,315 | $ 34,835,599 | |
Reinvested dividends and distributions | 1,082,945 | 43,209,494 |
| 1,143,734 | 42,198,627 | |
Shares repurchased | (2,804,441) | (123,272,553) |
| (2,307,562) | (88,696,336) | |
Net Increase/(Decrease) | (666,257) | $(32,885,634) |
| (244,513) | $(11,662,110) | |
6. Purchases and Sales of Investment Securities
For the year ended December 31, 2020, the aggregate cost of purchases and proceeds from sales of investment securities (excluding any short-term securities, short-term options contracts, TBAs, and in-kind transactions, as applicable) was as follows:
Purchases of | Proceeds from Sales | Purchases
of Long- | Proceeds
from Sales |
$379,038,219 | $ 499,636,029 | $ - | $ - |
7. Subsequent Event
Management has evaluated whether any events or transactions occurred subsequent to December 31, 2020 and through the date of issuance of the Portfolio’s financial statements and determined that there were no material events or transactions that would require recognition or disclosure in the Portfolio’s financial statements.
24 | DECEMBER 31, 2020 |
Janus Henderson VIT Forty Portfolio
Report of Independent Registered Public Accounting Firm
To the Board of Trustees of Janus Aspen Series and Shareholders of Janus Henderson VIT Forty Portfolio
Opinion on the Financial Statements
We have audited the accompanying statement of assets and liabilities, including the schedule of investments, of Janus Henderson VIT Forty Portfolio (one of the portfolios constituting Janus Aspen Series, referred to hereafter as the "Portfolio") as of December 31, 2020, the related statement of operations for the year ended December 31, 2020, the statements of changes in net assets for each of the two years in the period ended December 31, 2020, including the related notes, and the financial highlights for each of the five years in the period ended December 31, 2020 (collectively referred to as the “financial statements”). In our opinion, the financial statements present fairly, in all material respects, the financial position of the Portfolio as of December 31, 2020, the results of its operations for the year then ended, the changes in its net assets for each of the two years in the period ended December 31, 2020 and the financial highlights for each of the five years in the period ended December 31, 2020 in conformity with accounting principles generally accepted in the United States of America.
Basis for Opinion
These financial statements are the responsibility of the Portfolio’s management. Our responsibility is to express an opinion on the Portfolio’s financial statements based on our audits. We are a public accounting firm registered with the Public Company Accounting Oversight Board (United States) (PCAOB) and are required to be independent with respect to the Portfolio in accordance with the U.S. federal securities laws and the applicable rules and regulations of the Securities and Exchange Commission and the PCAOB.
We conducted our audits of these financial statements in accordance with the standards of the PCAOB. Those standards require that we plan and perform the audit to obtain reasonable assurance about whether the financial statements are free of material misstatement, whether due to error or fraud.
Our audits included performing procedures to assess the risks of material misstatement of the financial statements, whether due to error or fraud, and performing procedures that respond to those risks. Such procedures included examining, on a test basis, evidence regarding the amounts and disclosures in the financial statements. Our audits also included evaluating the accounting principles used and significant estimates made by management, as well as evaluating the overall presentation of the financial statements. Our procedures included confirmation of securities owned as of December 31, 2020 by correspondence with the custodian, transfer agent, and brokers; when replies were not received from brokers, we performed other auditing procedures. We believe that our audits provide a reasonable basis for our opinion.

Denver, Colorado
February
16, 2021
We have served as the auditor of one or more investment companies in Janus Henderson Funds since 1990.
Janus Aspen Series | 25 |
Janus Henderson VIT Forty Portfolio
Additional Information (unaudited)
Proxy Voting Policies and Voting Record
A description of the policies and procedures that the Portfolio uses to determine how to vote proxies relating to its portfolio securities is available without charge: (i) upon request, by calling 1-800-525-1093; (ii) on the Portfolio’s website at janushenderson.com/proxyvoting; and (iii) on the SEC’s website at http://www.sec.gov. Additionally, information regarding the Portfolio’s proxy voting record for the most recent twelve-month period ended June 30 is also available, free of charge, through janushenderson.com/proxyvoting and from the SEC’s website at http://www.sec.gov.
Full Holdings
The Portfolio files its complete portfolio holdings (schedule of investments) with the SEC as an exhibit to Form N-PORT within 60 days of the end of the first and third fiscal quarters, and in the annual report and semiannual report to shareholders. The Portfolio’s Form N-PORT filings and annual and semiannual reports: (i) are available on the SEC’s website at http://www.sec.gov; (ii) may be reviewed and copied at the SEC’s Public Reference Room in Washington, D.C. (information on the Public Reference Room may be obtained by calling 1-800-SEC-0330); and (iii) are available without charge, upon request, by calling a Janus Henderson representative at 1-877-335-2687 (toll free). Portfolio holdings consisting of at least the names of the holdings are generally available on a monthly basis with a 30-day lag under Full Holdings for the Portfolio at janushenderson.com/vit.
APPROVAL OF ADVISORY AGREEMENTS DURING THE PERIOD
The Trustees of Janus Aspen Series, each of whom serves as an “independent” Trustee (the “Trustees”), oversee the management of each Portfolio of Janus Aspen Series (each, a “VIT Portfolio,” and collectively, the “VIT Portfolios”), as well as each Fund of Janus Investment Fund (together with the VIT Portfolios, the “Janus Henderson Funds,” and each, a “Janus Henderson Fund”). As required by law, the Trustees determine annually whether to continue the investment advisory agreement for each Janus Henderson Fund and the subadvisory agreements for the Janus Henderson Funds that utilize subadvisers.
In connection with their most recent consideration of those agreements for each Janus Henderson Fund, the Trustees received, and reviewed information provided by Janus Capital and the respective subadvisers in response to requests of the Trustees and their independent legal counsel. They also received and reviewed information and analysis provided by, and in response to requests of, their independent fee consultant. Throughout their consideration of the agreements, the Trustees were advised by their independent legal counsel. The Trustees met with management to consider the agreements, and also met separately in executive session with their independent legal counsel and their independent fee consultant.
At a meeting held on December 9, 2020, based on the Trustees’ evaluation of the information provided by Janus Capital, the subadvisers, and the independent fee consultant, as well as other information, the Trustees determined that the overall arrangements between each Janus Henderson Fund and Janus Capital and each subadviser, as applicable, were fair and reasonable in light of the nature, extent and quality of the services provided by Janus Capital, its affiliates and the subadvisers, the fees charged for those services, and other matters that the Trustees considered relevant in the exercise of their business judgment. At that meeting, the Trustees unanimously approved the continuation of the investment advisory agreement for each Janus Henderson Fund, and the subadvisory agreement for each subadvised Janus Henderson Fund, for the period from February 1, 2021 through February 1, 2022, subject to earlier termination as provided for in each agreement.
In considering the continuation of those agreements, the Trustees reviewed and analyzed various factors that they determined were relevant, including the factors described below, none of which by itself was considered dispositive. However, the material factors and conclusions that formed the basis for the Trustees’ determination to approve the continuation of the agreements are discussed separately below. Also included is a summary of the independent fee consultant’s conclusions and opinions that arose during, and were included as part of, the Trustees’ consideration of the agreements. “Management fees,” as used herein, reflect actual annual advisory fees and, for the purpose of peer comparisons any administration fees (excluding out of pocket costs), net of any waivers, paid by a fund as a percentage of average net assets.
Nature, Extent and Quality of Services
The Trustees reviewed the nature, extent and quality of the services provided by Janus Capital and the subadvisers to the Janus Henderson Funds, taking into account the investment objective, strategies and policies of each Janus Henderson Fund, and the knowledge the Trustees gained from their regular meetings with management on at least a
26 | DECEMBER 31, 2020 |
Janus Henderson VIT Forty Portfolio
Additional Information (unaudited)
quarterly basis and their ongoing review of information related to the Janus Henderson Funds. In addition, the Trustees reviewed the resources and key personnel of Janus Capital and each subadviser, particularly noting those employees who provide investment and risk management services to the Janus Henderson Funds. The Trustees also considered other services provided to the Janus Henderson Funds by Janus Capital or the subadvisers, such as managing the execution of portfolio transactions and the selection of broker-dealers for those transactions. The Trustees considered Janus Capital’s role as administrator to the Janus Henderson Funds, noting that Janus Capital generally does not receive a fee for its services but is reimbursed for its out-of-pocket costs. The Trustees considered the role of Janus Capital in monitoring adherence to the Janus Henderson Funds’ investment restrictions, providing support services for the Trustees and Trustee committees, and overseeing communications with shareholders and the activities of other service providers, including monitoring compliance with various policies and procedures of the Janus Henderson Funds and with applicable securities laws and regulations.
In this regard, the independent fee consultant noted that Janus Capital provides a number of different services for the Janus Henderson Funds and fund shareholders, ranging from investment management services to various other servicing functions, and that, in its view, Janus Capital is a capable provider of those services. The independent fee consultant also provided its belief that Janus Capital has developed a number of institutional competitive advantages that should enable it to provide superior investment and service performance over the long term.
The Trustees concluded that the nature, extent and quality of the services provided by Janus Capital or the subadviser to each Janus Henderson Fund were appropriate and consistent with the terms of the respective advisory and subadvisory agreements, and that, taking into account steps taken to address those Janus Henderson Funds whose performance lagged that of their peers for certain periods, the Janus Henderson Funds were likely to benefit from the continued provision of those services. They also concluded that Janus Capital and each subadviser had sufficient personnel, with the appropriate education and experience, to serve the Janus Henderson Funds effectively and had demonstrated its ability to attract well-qualified personnel.
Performance of the Funds
The Trustees considered the performance results of each Janus Henderson Fund over various time periods. They noted that they considered Janus Henderson Fund performance data throughout the year, including periodic meetings with each Janus Henderson Fund’s portfolio manager(s), and also reviewed information comparing each Janus Henderson Fund’s performance with the performance of comparable funds and peer groups identified by Broadridge Financial Solutions, Inc. (“Broadridge”), an independent data provider, and with the Janus Henderson Fund’s benchmark index. In this regard, the independent fee consultant found that the overall Janus Henderson Funds’ performance has been reasonable: for the 36 months ended September 30, 2020, approximately 75% of the Janus Henderson Funds were in the top two quartiles of performance versus Broadridge peers, and for the 12 months ended September 30, 2020, approximately 62% of the Janus Henderson Funds were in the top two quartiles of performance versus Broadridge peers.
The Trustees considered the performance of each Janus Henderson Fund, noting that performance may vary by share class, and noted the following with respect to the VIT Portfolios:
· For Janus Henderson Balanced Portfolio, the Trustees noted that the Fund’s performance was in the first Broadridge quartile for the 36 months ended May 31, 2020 and the first Broadridge quartile for the 12 months ended May 31, 2020.
· For Janus Henderson Enterprise Portfolio, the Trustees noted that the Fund’s performance was in the bottom Broadridge quartile for the 36 months ended May 31, 2020 and the bottom Broadridge quartile for the 12 months ended May 31, 2020. The Trustees noted the reasons for the Fund’s underperformance and the steps Janus Capital had taken or was taking to improve performance.
· For Janus Henderson Flexible Bond Portfolio, the Trustees noted that the Fund’s performance was in the third Broadridge quartile for the 36 months ended May 31, 2020 and the first Broadridge quartile for the 12 months ended May 31, 2020. The Trustees noted the reasons for the Fund’s underperformance and the steps Janus Capital had taken or was taking to improve performance, and that the performance trend was improving.
Janus Aspen Series | 27 |
Janus Henderson VIT Forty Portfolio
Additional Information (unaudited)
· For Janus Henderson Forty Portfolio, the Trustees noted that the Fund’s performance was in the second Broadridge quartile for the 36 months ended May 31, 2020 and the second Broadridge quartile for the 12 months ended May 31, 2020.
· For Janus Henderson Global Research Portfolio, the Trustees noted that the Fund’s performance was in the third Broadridge quartile for the 36 months ended May 31, 2020 and the bottom Broadridge quartile for the 12 months ended May 31, 2020. The Trustees noted the reasons for the Fund’s underperformance, while also noting that the Fund has a performance fee structure that results in lower management fees during periods of underperformance, and the steps Janus Capital had taken or was taking to improve performance.
· For Janus Henderson Global Technology and Innovation Portfolio, the Trustees noted that the Fund’s performance was in the first Broadridge quartile for the 36 months ended May 31, 2020 and the second Broadridge quartile for the 12 months ended May 31, 2020.
· For Janus Henderson Mid Cap Value Portfolio, the Trustees noted that the Fund’s performance was in the third Broadridge quartile for the 36 months ended May 31, 2020 and the third Broadridge quartile for the 12 months ended May 31, 2020. The Trustees noted the reasons for the Fund’s underperformance, while also noting that the Fund has a performance fee structure that results in lower management fees during periods of underperformance, and the steps Janus Capital and Perkins had taken or were taking to improve performance.
· For Janus Henderson Overseas Portfolio, the Trustees noted that the Fund’s performance was in the bottom Broadridge quartile for the 36 months ended May 31, 2020 and the third Broadridge quartile for the 12 months ended May 31, 2020. The Trustees noted the reasons for the Fund’s underperformance, while also noting that the Fund has a performance fee structure that results in lower management fees during periods of underperformance and the steps Janus Capital had taken or was taking to improve performance.
· For Janus Henderson Research Portfolio, the Trustees noted that the Fund’s performance was in the third Broadridge quartile for the 36 months ended May 31, 2020 and the third Broadridge quartile for the 12 months ended May 31, 2020. The Trustees noted the reasons for the Fund’s underperformance, while also noting that the Fund has a performance fee structure that results in lower management fees during periods of underperformance, and the steps Janus Capital had taken or was taking to improve performance.
· For Janus Henderson U.S. Low Volatility Portfolio, the Trustees noted that the Fund’s performance was in the second Broadridge quartile for the 36 months ended May 31, 2020 and the third Broadridge quartile for the 12 months ended May 31, 2020.
In consideration of each Janus Henderson Fund’s performance, the Trustees concluded that, taking into account the factors relevant to performance, as well as other considerations, including steps taken to improve performance, the Janus Henderson Fund’s performance warranted continuation of such Janus Henderson Fund’s investment advisory and subadvisory agreement(s).
Costs of Services Provided
The Trustees examined information regarding the fees and expenses of each Janus Henderson Fund in comparison to similar information for other comparable funds as provided by Broadridge, an independent data provider. They also reviewed an analysis of that information provided by their independent fee consultant and noted that the rate of management fees (investment advisory fees and any administration fees but excluding out-of-pocket costs) for many of the Janus Henderson Funds, after applicable waivers, was below the average management fee rate of the respective peer group of funds selected by an independent data provider. The Trustees also examined information regarding the subadvisory fees charged for subadvisory services, as applicable, noting that all such fees were paid by Janus Capital out of its management fees collected from such Janus Henderson Fund.
The independent fee consultant provided its belief that the management fees charged by Janus Capital to each of the Janus Henderson Funds under the current investment advisory and administration agreements are reasonable in relation to the services provided by Janus Capital. The independent fee consultant found: (1) the total expenses and management fees of the Janus Henderson Funds to be reasonable relative to other comparable mutual funds; (2) the total expenses, on average, were 10% under the average total expenses of the respective Broadridge Expense Group peers; and (3) and the management fees for the Janus Henderson Funds, on average, were 9% under the average management fees for the respective Broadridge Expense Group. The Trustees also considered the total expenses for
28 | DECEMBER 31, 2020 |
Janus Henderson VIT Forty Portfolio
Additional Information (unaudited)
each share class of each Janus Henderson Fund compared to the average total expenses for its Broadridge Expense Group and to average total expenses for its Broadridge Expense Universe.
For certain Janus Henderson Funds, the independent fee consultant also performed a systematic “focus list” analysis of expenses which assessed fund fees in the context of fund performance being delivered. Based on this analysis, the independent fee consultant found that the combination of service quality/performance and expenses on these individual Janus Henderson Funds was reasonable in light of performance trends, performance histories, and existence of performance fees, breakpoints, and/or expense waivers on such Janus Henderson Funds.
The Trustees considered the methodology used by Janus Capital and each subadviser in determining compensation payable to portfolio managers, the competitive environment for investment management talent, and the competitive market for mutual funds in different distribution channels.
The Trustees also reviewed management fees charged by Janus Capital and each subadviser to comparable separate account clients and to comparable non-affiliated funds subadvised by Janus Capital or by a subadviser (for which Janus Capital or the subadviser provides only or primarily portfolio management services). Although in most instances subadvisory and separate account fee rates for various investment strategies were lower than management fee rates for Janus Henderson Funds having a similar strategy, the Trustees considered that Janus Capital noted that, under the terms of the management agreements with the Janus Henderson Funds, Janus Capital performs significant additional services for the Janus Henderson Funds that it does not provide to those other clients, including administration services, oversight of the Janus Henderson Funds’ other service providers, trustee support, regulatory compliance and numerous other services, and that, in serving the Janus Henderson Funds, Janus Capital assumes many legal risks and other costs that it does not assume in servicing its other clients. Moreover, they noted that the independent fee consultant found that: (1) the management fees Janus Capital charges to the Janus Henderson Funds are reasonable in relation to the management fees Janus Capital charges to funds subadvised by Janus Capital and to the fees Janus Capital charges to its institutional separate account clients; (2) these subadvised and institutional separate accounts have different service and infrastructure needs and operate in markets very distinct relative to retail funds; and (3) Janus Henderson mutual fund investors enjoy reasonable fees relative to the fees charged to Janus Henderson subadvised fund and separate account investors; (4) 9 of 10 Janus Henderson Funds have lower management fees than similar funds subadvised by Janus Capital; and (5) 5 of 8 Janus Henderson Funds have lower management fees than similar separate accounts managed by Janus Capital.
The Trustees considered the fees for each Janus Henderson Fund for its fiscal year ended in 2019, including the VIT Portfolios, and noted the following with regard to each VIT Portfolio’s total expenses, net of applicable fee waivers (the VIT Portfolio’s “total expenses”):
· For Janus Henderson Balanced Portfolio, the Trustees noted that, although the Fund’s total expenses exceeded the peer group average for one share class, overall the Fund’s total expenses were reasonable.
· For Janus Henderson Enterprise Portfolio, the Trustees noted that, although the Fund’s total expenses exceeded the peer group average for one share class, overall the Fund’s total expenses were reasonable.
· For Janus Henderson Flexible Bond Portfolio, the Trustees noted that, although the Fund’s total expenses exceeded the peer group for one share class, overall the Fund’s total expenses were reasonable. The Trustees also noted that Janus Capital has contractually agreed to limit the Fund’s expenses, although this limit did not apply because the Fund’s total expenses were already below the applicable fee limit.
· For Janus Henderson Forty Portfolio, the Trustees noted that, although the Fund’s total expenses exceeded the peer group average for one share class, overall the Fund’s total expenses were reasonable.
· For Janus Henderson Global Research Portfolio, the Trustees noted that, although the Fund’s total expenses exceeded the peer group average for one share class, overall the Fund’s total expenses were reasonable.
· For Janus Henderson Global Technology and Innovation Portfolio, the Trustees noted that the Fund’s total expenses were below the peer group for both share classes.
· For Janus Henderson Mid Cap Value Portfolio, the Trustees noted that, although the Fund’s total expenses exceeded the peer group for one share class, overall the Fund’s total expenses were reasonable. The Trustees also noted that Janus Capital has contractually agreed to limit the Fund’s expenses, although this limit did not apply because the Fund’s total expenses were already below the applicable fee limit.
Janus Aspen Series | 29 |
Janus Henderson VIT Forty Portfolio
Additional Information (unaudited)
· For Janus Henderson Overseas Portfolio, the Trustees noted that the Fund’s total expenses were below the peer group for both share classes.
· For Janus Henderson Research Portfolio, the Trustees noted that the Fund’s total expenses were below the peer group average for both share classes.
· For Janus Henderson U.S. Low Volatility Portfolio, the Trustees noted that the Fund’s total expenses were below the peer group for its sole share class.
The Trustees reviewed information on the overall profitability to Janus Capital and its affiliates of their relationship with the Janus Henderson Funds, and considered profitability data of other publicly traded mutual fund advisers. The Trustees recognized that profitability comparisons among fund managers are difficult because of the variation in the type of comparative information that is publicly available, and the profitability of any fund manager is affected by numerous factors, including the organizational structure of the particular fund manager, differences in complex size, difference in product mix, difference in types of business (mutual fund, institutional and other), differences in the types of funds and other accounts it manages, possible other lines of business, the methodology for allocating expenses, and the fund manager’s capital structure and cost of capital.
Additionally, the Trustees considered the estimated profitability to Janus Capital from the investment management services it provided to each Janus Henderson Fund. In their review, the Trustees considered whether Janus Capital and each subadviser receive adequate incentives and resources to manage the Janus Henderson Funds effectively. In reviewing profitability, the Trustees noted that the estimated profitability for an individual Janus Henderson Fund is necessarily a product of the allocation methodology utilized by Janus Capital to allocate its expenses as part of the estimated profitability calculation. In this regard, the Trustees noted that the independent fee consultant found that (1) the expense allocation methodology and rationales utilized by Janus Capital were reasonable and (2) no clear correlation exists between expense allocations and operating margins. The Trustees also considered that the estimated profitability for an individual Janus Henderson Fund was influenced by a number of factors, including not only the allocation methodology selected, but also the presence of fee waivers and expense caps, and whether the Janus Henderson Fund’s investment management agreement contained breakpoints or a performance fee component. The Trustees determined, after taking into account these factors, among others, that Janus Capital’s estimated profitability with respect to each Janus Henderson Fund was not unreasonable in relation to the services provided, and that the variation in the range of such estimated profitability among the Janus Henderson Funds was not a material factor in the Board’s approval of the reasonableness of any Janus Henderson Fund’s investment management fees.
The Trustees concluded that the management fees payable by each Janus Henderson Fund to Janus Capital and its affiliates, as well as the fees paid by Janus Capital to the subadvisers of subadvised Janus Henderson Funds, were reasonable in relation to the nature, extent, and quality of the services provided, taking into account the fees charged by other advisers for managing comparable mutual funds with similar strategies, the fees Janus Capital and the subadvisers charge to other clients, and, as applicable, the impact of fund performance on management fees payable by the Janus Henderson Funds. The Trustees also concluded that each Janus Henderson Fund’s total expenses were reasonable, taking into account the size of the Janus Henderson Fund, the quality of services provided by Janus Capital and any subadviser, the investment performance of the Janus Henderson Fund, and any expense limitations agreed to or provided by Janus Capital.
Economies of Scale
The Trustees considered information about the potential for Janus Capital to realize economies of scale as the assets of the Janus Henderson Funds increase. They noted that their independent fee consultant published a report to the Trustees in November 2019 which provided its research and analysis into economies of scale. They also noted that, although many Janus Henderson Funds pay advisory fees at a fixed base rate as a percentage of net assets, without any breakpoints or performance fees, their independent fee consultant concluded that 73% of these Janus Henderson Funds’ have contractual management fees (gross of waivers) below their Broadridge Expense Group averages. They also noted the following: (1) that for those Janus Henderson Funds whose expenses are being reduced by the contractual expense limitations of Janus Capital, Janus Capital is subsidizing certain of these Janus Henderson Funds because they have not reached adequate scale; (2) as the assets of some of the Janus Henderson Funds have declined in the past few years, certain of those Janus Henderson Funds have benefited from having advisory fee rates that have remained constant rather than increasing as assets declined; (3) performance fee structures have been implemented for various Janus Henderson Funds that have caused the effective rate of advisory fees payable by such
30 | DECEMBER 31, 2020 |
Janus Henderson VIT Forty Portfolio
Additional Information (unaudited)
Janus Henderson Fund to vary depending on the investment performance of the Janus Henderson Fund relative to its benchmark index over the measurement period; and (4) a few Janus Henderson Funds have fee schedules with breakpoints and reduced fee rates above certain asset levels. The Trustees also noted that the Janus Henderson Funds share directly in economies of scale through the significant investments made by Janus Capital and its affiliates related to services provided to the Funds and the lower charges of third-party service providers that are based in part on the combined scale of all of the Janus Henderson Funds.
The Trustees also considered the independent fee consultant’s conclusion that, given the limitations of various analytical approaches to economies of scale and their conflicting results, it is difficult to analytically confirm or deny the existence of economies of scale in the Janus Henderson complex. In this regard, the independent consultant concluded that (1) to the extent there were economies of scale at Janus Capital, Janus Capital’s general strategy of setting fixed management fees below peers appeared to share any such economies with investors even on smaller Janus Henderson Funds which have not yet achieved those economies and (2) by setting lower fixed fees from the start on these Janus Henderson Funds, Janus Capital appeared to be investing to increase the likelihood that these Janus Henderson Funds will grow to a level to achieve any economies of scale that may exist. Further, the independent fee consultant provided its belief that Janus Henderson Fund investors are well-served by the fee levels and performance fee structures in place on the Janus Henderson Funds in light of any economies of scale that may be present at Janus Capital.
Based on all of the information reviewed, including the recent and past research and analysis conducted by the Trustees’ independent fee consultant, the Trustees concluded that the current fee structure of each Janus Henderson Fund was reasonable and that the current rates of fees do reflect a sharing between Janus Capital and the Janus Henderson Fund of any economies of scale that may be present at the current asset level of the Janus Henderson Fund.
Other Benefits to Janus Capital
The Trustees also considered benefits that accrue to Janus Capital and its affiliates and subadvisers to the Janus Henderson Funds from their relationships with the Janus Henderson Funds. They recognized that two affiliates of Janus Capital separately serve the Janus Henderson Funds as transfer agent and distributor, respectively, and the transfer agent receives compensation directly from the non-money market funds for services provided, and that such compensation contributes to the overall profitability of Janus Capital and its affiliates that results from their relationship with the Janus Henderson Funds. The Trustees also considered Janus Capital’s past and proposed use of commissions paid by the Janus Henderson Funds on portfolio brokerage transactions to obtain proprietary and third-party research products and services benefiting the Janus Henderson Fund and/or other clients of Janus Capital and Janus Capital, and/or a subadviser to a Janus Henderson Fund. The Trustees concluded that Janus Capital’s and the subadvisers’ use of these types of client commission arrangements to obtain proprietary and third-party research products and services was consistent with regulatory requirements and guidelines and was likely to benefit each Janus Henderson Fund. The Trustees also concluded that, other than the services provided by Janus Capital and its affiliates and subadvisers pursuant to the agreements and the fees to be paid by each Janus Henderson Fund therefor, the Janus Henderson Funds and Janus Capital and the subadvisers may potentially benefit from their relationship with each other in other ways. They concluded that Janus Capital and its affiliates share directly in economies of scale through the lower charges of third-party service providers that are based in part on the combined scale of the Janus Henderson Funds and other clients serviced by Janus Capital and its affiliates. They also concluded that Janus Capital and/or the subadvisers benefit from the receipt of research products and services acquired through commissions paid on portfolio transactions of the Janus Henderson Funds and that the Janus Henderson Funds benefit from Janus Capital’s and/or the subadvisers’ receipt of those products and services as well as research products and services acquired through commissions paid by other clients of Janus Capital and/or other clients of the subadvisers. They further concluded that the success of any Janus Henderson Fund could attract other business to Janus Capital, the subadvisers or other Janus Henderson funds, and that the success of Janus Capital and the subadvisers could enhance Janus Capital’s and the subadvisers’ ability to serve the Janus Henderson Funds.
Janus Aspen Series | 31 |
Janus Henderson VIT Forty Portfolio
Useful Information About Your Portfolio Report (unaudited)
The Management Commentary in this report includes valuable insight as well as statistical information to help you understand how your Portfolio’s performance and characteristics stack up against those of comparable indices.
If the Portfolio invests in foreign securities, this report may include information about country exposure. Country exposure is based primarily on the country of risk. A company may be allocated to a country based on other factors such as location of the company’s principal office, the location of the principal trading market for the company’s securities, or the country where a majority of the company’s revenues are derived.
Please keep in mind that the opinions expressed in the Management Commentary are just that: opinions. They are a reflection based on best judgment at the time this report was compiled, which was December 31, 2020. As the investing environment changes, so could opinions. These views are unique and are not necessarily shared by fellow employees or by Janus Henderson in general.
Performance Overviews
Performance overview graphs compare the performance of a hypothetical $10,000 investment in the Portfolio with one or more widely used market indices. When comparing the performance of the Portfolio with an index, keep in mind that market indices are not available for investment and do not reflect deduction of expenses.
Average annual total returns are quoted for a Portfolio with more than one year of performance history. Average annual total return is calculated by taking the growth or decline in value of an investment over a period of time, including reinvestment of dividends and distributions, then calculating the annual compounded percentage rate that would have produced the same result had the rate of growth been constant throughout the period. Average annual total return does not reflect the deduction of taxes that a shareholder would pay on Portfolio distributions or redemptions of Portfolio shares.
Cumulative total returns are quoted for a Portfolio with less than one year of performance history. Cumulative total return is the growth or decline in value of an investment over time, independent of the period of time involved. Cumulative total return does not reflect the deduction of taxes that a shareholder would pay on Portfolio distributions or redemptions of Portfolio shares.
Pursuant to federal securities rules, expense ratios shown in the performance chart reflect subsidized (if applicable) and unsubsidized ratios. The total annual fund operating expenses ratio is gross of any fee waivers, reflecting the Portfolio’s unsubsidized expense ratio. The net annual fund operating expenses ratio (if applicable) includes contractual waivers of Janus Capital and reflects the Portfolio’s subsidized expense ratio. Ratios may be higher or lower than those shown in the “Financial Highlights” in this report.
Schedule of Investments
Following the performance overview section is the Portfolio’s Schedule of Investments. This schedule reports the types of securities held in the Portfolio on the last day of the reporting period. Securities are usually listed by type (common stock, corporate bonds, U.S. Government obligations, etc.) and by industry classification (banking, communications, insurance, etc.). Holdings are subject to change without notice.
The value of each security is quoted as of the last day of the reporting period. The value of securities denominated in foreign currencies is converted into U.S. dollars.
If the Portfolio invests in foreign securities, it will also provide a summary of investments by country. This summary reports the Portfolio exposure to different countries by providing the percentage of securities invested in each country. The country of each security represents the country of risk. The Portfolio’s Schedule of Investments relies upon the industry group and country classifications published by Barclays and/or MSCI Inc.
Tables listing details of individual forward currency contracts, futures, written options, swaptions, and swaps follow the Portfolio’s Schedule of Investments (if applicable).
Statement of Assets and Liabilities
This statement is often referred to as the “balance sheet.” It lists the assets and liabilities of the Portfolio on the last day of the reporting period.
32 | DECEMBER 31, 2020 |
Janus Henderson VIT Forty Portfolio
Useful Information About Your Portfolio Report (unaudited)
The Portfolio’s assets are calculated by adding the value of the securities owned, the receivable for securities sold but not yet settled, the receivable for dividends declared but not yet received on securities owned, and the receivable for Portfolio shares sold to investors but not yet settled. The Portfolio’s liabilities include payables for securities purchased but not yet settled, Portfolio shares redeemed but not yet paid, and expenses owed but not yet paid. Additionally, there may be other assets and liabilities such as unrealized gain or loss on forward currency contracts.
The section entitled “Net Assets Consist of” breaks down the components of the Portfolio’s net assets. Because the Portfolio must distribute substantially all earnings, you will notice that a significant portion of net assets is shareholder capital.
The last section of this statement reports the net asset value (“NAV”) per share on the last day of the reporting period. The NAV is calculated by dividing the Portfolio’s net assets for each share class (assets minus liabilities) by the number of shares outstanding.
Statement of Operations
This statement details the Portfolio’s income, expenses, realized gains and losses on securities and currency transactions, and changes in unrealized appreciation or depreciation of Portfolio holdings.
The first section in this statement, entitled “Investment Income,” reports the dividends earned from securities and interest earned from interest-bearing securities in the Portfolio.
The next section reports the expenses incurred by the Portfolio, including the advisory fee paid to the investment adviser, transfer agent fees and expenses, and printing and postage for mailing statements, financial reports and prospectuses. Expense offsets and expense reimbursements, if any, are also shown.
The last section lists the amounts of realized gains or losses from investment and foreign currency transactions, and changes in unrealized appreciation or depreciation of investments and foreign currency-denominated assets and liabilities. The Portfolio will realize a gain (or loss) when it sells its position in a particular security. A change in unrealized gain (or loss) refers to the change in net appreciation or depreciation of the Portfolio during the reporting period. “Net Realized and Unrealized Gain/(Loss) on Investments” is affected both by changes in the market value of Portfolio holdings and by gains (or losses) realized during the reporting period.
Statements of Changes in Net Assets
These statements report the increase or decrease in the Portfolio’s net assets during the reporting period. Changes in the Portfolio’s net assets are attributable to investment operations, dividends and distributions to investors, and capital share transactions. This is important to investors because it shows exactly what caused the Portfolio’s net asset size to change during the period.
The first section summarizes the information from the Statement of Operations regarding changes in net assets due to the Portfolio’s investment operations. The Portfolio’s net assets may also change as a result of dividend and capital gains distributions to investors. If investors receive their dividends and/or distributions in cash, money is taken out of the Portfolio to pay the dividend and/or distribution. If investors reinvest their dividends and/or distributions, the Portfolio’s net assets will not be affected. If you compare the Portfolio’s “Net Decrease from Dividends and Distributions” to “Reinvested Dividends and Distributions,” you will notice that dividends and distributions have little effect on the Portfolio’s net assets. This is because the majority of the Portfolio’s investors reinvest their dividends and/or distributions.
The reinvestment of dividends and distributions is included under “Capital Share Transactions.” “Capital Shares” refers to the money investors contribute to the Portfolio through purchases or withdrawals via redemptions. The Portfolio’s net assets will increase and decrease in value as investors purchase and redeem shares from the Portfolio.
Financial Highlights
This schedule provides a per-share breakdown of the components that affect the Portfolio’s NAV for current and past reporting periods as well as total return, asset size, ratios, and portfolio turnover rate.
The first line in the table reflects the NAV per share at the beginning of the reporting period. The next line reports the net investment income/(loss) per share. Following is the per share total of net gains/(losses), realized and unrealized. Per share dividends and distributions to investors are then subtracted to arrive at the NAV per share at the end of the period. The next line reflects the total return for the period. The total return may include adjustments in accordance with
Janus Aspen Series | 33 |
Janus Henderson VIT Forty Portfolio
Useful Information About Your Portfolio Report (unaudited)
generally accepted accounting principles required at the period end for financial reporting purposes. As a result, the total return may differ from the total return reflected for individual shareholder transactions. Also included are ratios of expenses and net investment income to average net assets.
The Portfolio’s expenses may be reduced through expense offsets and expense reimbursements. The ratios shown reflect expenses before and after any such offsets and reimbursements.
The ratio of net investment income/(loss) summarizes the income earned less expenses, divided by the average net assets of the Portfolio during the reporting period. Do not confuse this ratio with the Portfolio’s yield. The net investment income ratio is not a true measure of the Portfolio’s yield because it does not take into account the dividends distributed to the Portfolio’s investors.
The next figure is the portfolio turnover rate, which measures the buying and selling activity in the Portfolio. Portfolio turnover is affected by market conditions, changes in the asset size of the Portfolio, fluctuating volume of shareholder purchase and redemption orders, the nature of the Portfolio’s investments, and the investment style and/or outlook of the portfolio manager(s) and/or investment personnel. A 100% rate implies that an amount equal to the value of the entire portfolio was replaced once during the fiscal year; a 50% rate means that an amount equal to the value of half the portfolio is traded in a year; and a 200% rate means that an amount equal to the value of the entire portfolio is traded every six months.
34 | DECEMBER 31, 2020 |
Janus Henderson VIT Forty Portfolio
Designation Requirements (unaudited)
For federal income tax purposes, the Portfolio designated the following for the year ended December 31, 2020:
| |
Capital Gain Distributions | $65,585,050 |
Dividends Received Deduction Percentage | 26% |
Janus Aspen Series | 35 |
Janus Henderson VIT Forty Portfolio
Trustees and Officers (unaudited)
The following are the Trustees and officers of the Trust, together with a brief description of their principal occupations during the last five years (principal occupations for certain Trustees may include periods over five years). The Portfolio’s Statement of Additional Information includes additional information about the Trustees and officers and is available, without charge, by calling 1-877-335-2687.
Each Trustee has served in that capacity since he or she was originally elected or appointed. The Trustees do not serve a specified term of office. Each Trustee will hold office until the termination of the Trust or his or her earlier death, resignation, retirement, incapacity, or removal. Under the Portfolio’s Governance Procedures and Guidelines, the policy is for Trustees to retire no later than the end of the calendar year in which the Trustee turns 75. The Trustees review the Portfolio’s Governance Procedures and Guidelines from time to time and may make changes they deem appropriate. The Portfolio’s Nominating and Governance Committee will consider nominees for the position of Trustee recommended by shareholders. Shareholders may submit the name of a candidate for consideration by the Committee by submitting their recommendations to the Trust’s Secretary. Each Trustee is currently a Trustee of one other registered investment company advised by Janus Capital: Janus Investment Fund. Collectively, these two registered investment companies consist of 56 series or funds referred to herein as the Fund Complex.
The Trust’s officers are elected annually by the Trustees for a one-year term. Certain officers also serve as officers of Janus Investment Fund. Certain officers of the Portfolio may also be officers and/or directors of Janus Capital. Except as otherwise disclosed, Portfolio officers receive no compensation from the Portfolio, except for the Portfolio’s Chief Compliance Officer, as authorized by the Trustees.
36 | DECEMBER 31, 2020 |
Janus Henderson VIT Forty Portfolio
Trustees and Officers (unaudited)
TRUSTEES | |||||
Name, Address, and Age | Positions Held with the Trust | Length of Time Served | Principal Occupations During the Past Five Years | Number of Portfolios/Funds in Fund Complex Overseen by Trustee | Other Directorships Held by Trustee During the Past Five Years |
Independent Trustees | |||||
William F. McCalpin 151 Detroit Street Denver, CO 80206 DOB: 1957 | Chairman Trustee | 1/08-Present 6/02-Present | Independent Consultant (since 2019) and Chief Operating Officer, muun chi LLC (organic food business) (since 2020). Formerly, Managing Partner, Impact Investments, Athena Capital Advisors LLC (independent registered investment advisor) (2016-2019), Managing Director, Holos Consulting LLC (provides consulting services to foundations and other nonprofit organizations) (2009-2016), Chief Executive Officer, Imprint Capital Advisors (impact investment firm) (2013-2015), and Executive Vice President and Chief Operating Officer of The Rockefeller Brothers Fund (a private family foundation) (1998-2006). | 56 | Director of Mutual Fund Directors Forum (a non-profit organization serving independent directors of U.S. mutual funds) (since 2016), Chairman of the Board and Trustee of The Investment Fund for Foundations Investment Program (TIP) (consisting of 2 funds) (since 2008), and Director of the F.B. Heron Foundation (a private grantmaking foundation) (since 2006). |
Janus Aspen Series | 37 |
Janus Henderson VIT Forty Portfolio
Trustees and Officers (unaudited)
TRUSTEES | |||||
Name, Address, and Age | Positions Held with the Trust | Length of Time Served | Principal Occupations During the Past Five Years | Number of Portfolios/Funds in Fund Complex Overseen by Trustee | Other Directorships Held by Trustee During the Past Five Years |
Independent Trustees | |||||
Alan A. Brown 151 Detroit Street Denver, CO 80206 DOB: 1962 | Trustee | 1/13-Present | Principal, Curam Holdings LLC (since 2018). Formerly, Executive Vice President, Institutional Markets, of Black Creek Group (private equity real estate investment management firm) (2012-2018), Executive Vice President and Co-Head, Global Private Client Group (2007-2010), Executive Vice President, Mutual Funds (2005-2007), and Chief Marketing Officer (2001-2005) of Nuveen Investments, Inc. (asset management). | 56 | Advisory Board Member of AEW Core Property Trust (open-end property fund) (since 2020), and Director of WTTW (PBS affiliate) (since 2003). Formerly, Director of MotiveQuest LLC (strategic social market research company) (2003-2016), Director of Nuveen Global Investors LLC (2007-2011), Director of Communities in Schools (2004-2010), and Director of Mutual Fund Education Alliance (until 2010). |
38 | DECEMBER 31, 2020 |
Janus Henderson VIT Forty Portfolio
Trustees and Officers (unaudited)
TRUSTEES | |||||
Name, Address, and Age | Positions Held with the Trust | Length of Time Served | Principal Occupations During the Past Five Years | Number of Portfolios/Funds in Fund Complex Overseen by Trustee | Other Directorships Held by Trustee During the Past Five Years |
Independent Trustees | |||||
William D. Cvengros 151 Detroit Street Denver, CO 80206 DOB: 1948 | Trustee | 1/11-Present | Chief Executive Officer of SJC Capital, LLC (a personal investment company and consulting firm) (since 2002). Formerly, Chief Executive Officer and President of PIMCO Advisors Holdings L.P. (a publicly traded investment management firm) (1994-2000), and Chief Investment Officer (1987-1994) and Vice Chairman and Director (1990-1994) of Pacific Life Insurance Company (a mutual life insurance and annuity company) (1987-1994). | 56 | Advisory Board Member, RevOZ Fund LP and related funds (real estate investments for opportunity zones) (since 2020), and Advisory Board Member, Innovate Partners Emerging Growth and Equity Fund I (early stage venture capital fund) (since 2014). Formerly, Managing Trustee of National Retirement Partners Liquidating Trust (2013-2016), Chairman, National Retirement Partners, Inc. (formerly a network of advisors to 401(k) plans) (2005-2013), Director of Prospect Acquisition Corp. (a special purpose acquisition corporation) (2007-2009), Director of RemedyTemp, Inc. (temporary help services company) (1996-2006), and Trustee of PIMCO Funds Multi-Manager Series (1990-2000) and Pacific Life Variable Life & Annuity Trusts (1987-1994). |
Janus Aspen Series | 39 |
Janus Henderson VIT Forty Portfolio
Trustees and Officers (unaudited)
TRUSTEES | |||||
Name, Address, and Age | Positions Held with the Trust | Length of Time Served | Principal Occupations During the Past Five Years | Number of Portfolios/Funds in Fund Complex Overseen by Trustee | Other Directorships Held by Trustee During the Past Five Years |
Independent Trustees | |||||
Raudline Etienne 151 Detroit Street Denver, CO 80206 DOB: 1965 | Trustee | 6/16-Present | Founder, Daraja Capital (advisory and investment firm) (since 2016), and Senior Advisor, Albright Stonebridge Group LLC (global strategy firm) (since 2016). Formerly, Senior Vice President (2011-2015), Albright Stonebridge Group LLC, and Deputy Comptroller and Chief Investment Officer, New York State Common Retirement Fund (public pension fund) (2008-2011). | 56 | Board Member, Van Alen Institute (nonprofit architectural and design organization) (since 2019) and Director of Brightwood Capital Advisors, LLC (since 2014). |
William M. Fitzgerald, Sr. 151 Detroit Street Denver, CO 80206 DOB: 1964 | Trustee | 9/19-Present | Founder, Fitzgerald Asset Management LLC (since 2012). Formerly, Founder and Chief Investment Officer, Global Infrastructure Asset Management LLC (2008-2017), Chief Investment Officer of Nuveen Asset Management (2000-2007), and Managing Director, Nuveen Investment LLC (1988-2007). | 56 | Board of Directors, Municipal Securities Rulemaking Board (since 2017). Formerly, Board of Directors of Syncora Holdings Ltd, Syncora Guarantee Inc., and Syncora Capital Assurance Inc. (2009-2016), and Trustee, Destra Investment Trust (2010-2014). |
40 | DECEMBER 31, 2020 |
Janus Henderson VIT Forty Portfolio
Trustees and Officers (unaudited)
TRUSTEES | |||||
Name, Address, and Age | Positions Held with the Trust | Length of Time Served | Principal Occupations During the Past Five Years | Number of Portfolios/Funds in Fund Complex Overseen by Trustee | Other Directorships Held by Trustee During the Past Five Years |
Independent Trustees | |||||
Gary A. Poliner 151 Detroit Street Denver, CO 80206 DOB: 1953 | Trustee | 6/16-Present | Retired. Formerly, President (2010-2013) of Northwestern Mutual Life Insurance Company. | 56 | Director of MGIC Investment Corporation (private mortgage insurance) (since 2013) and West Bend Mutual Insurance Company (property/casualty insurance) (since 2013). Formerly, Trustee of Northwestern Mutual Life Insurance Company (2010-2013) and Director of Frank Russell Company (global asset management firm) (2008-2013). |
Diane L. Wallace 151 Detroit Street Denver, CO 80206 DOB: 1958 | Trustee | 6/17-Present | Retired. Formerly, Chief Operating Officer, Senior Vice President-Operations, and Chief Financial Officer for Driehaus Capital Management, LLC (1988-2006) and Treasurer for Driehaus Mutual Funds (1996-2002). | 56 | Director of Family Service of Lake County (since 2019). Formerly, Independent Trustee, Henderson Global Funds (13 portfolios) (2015-2017), Independent Trustee, State Farm Associates' Funds Trust, State Farm Mutual Fund Trust, and State Farm Variable Product Trust (28 portfolios) (2013-2017). |
Janus Aspen Series | 41 |
Janus Henderson VIT Forty Portfolio
Trustees and Officers (unaudited)
TRUSTEES | |||||
Name, Address, and Age | Positions Held with the Trust | Length of Time Served | Principal Occupations During the Past Five Years | Number of Portfolios/Funds in Fund Complex Overseen by Trustee | Other Directorships Held by Trustee During the Past Five Years |
Independent Trustees | |||||
Linda S. Wolf 151 Detroit Street Denver, CO 80206 DOB: 1947 | Trustee | 11/05-Present | Retired. Formerly, Chairman and Chief Executive Officer of Leo Burnett (Worldwide) (advertising agency) (2001-2005). | 56 | Director of Chicago Community Trust (Regional Community Foundation), Lurie Children’s Hospital (Chicago, IL), Shirley Ryan Ability Lab and Wrapports, LLC (digital communications company). Formerly, Director of Chicago Council on Global Affairs (until 2019), InnerWorkings (until 2019) and Director of Walmart (until 2017). |
42 | DECEMBER 31, 2020 |
Janus Henderson VIT Forty Portfolio
Trustees and Officers (unaudited)
OFFICERS | |||
Name, Address, and Age | Positions Held with the Trust | Term of Office* and Length of Time Served | Principal Occupations During the Past Five Years |
A. Douglas Rao 151 Detroit Street Denver, CO 80206 DOB: 1974 | Executive Vice President and Co-Portfolio Manager Janus Henderson Forty Portfolio | 6/13-Present | Portfolio Manager for other Janus Henderson accounts. |
Nick
Schommer | Executive Vice President and
Co-Portfolio Manager | 1/16-Present | Portfolio Manager for other Janus Henderson accounts. |
Bruce
L. Koepfgen | President and Chief Executive Officer | 7/14-Present | Executive Vice President and Head of North America at Janus Henderson Investors (since 2017), President and Head of North America at Janus Capital Management LLC (since 2013 and 2017, respectively), President at Janus Capital Group Inc. (since 2013), President and Director at Janus International Holding LLC (since 2019 and 2011, respectively), President at Janus Holdings LLC (since 2019), President and Director at Janus Management Holdings Corporation (since 2017 and 2012, respectively), Executive Vice President and Head of North America at Janus Distributors LLC (since 2011 and 2019, respectively), Vice President and Director at Intech Investment Management LLC (since 2012), and Executive Vice President at Perkins Investment Management LLC (since 2011). Formerly, Executive Vice President at Janus Capital Group Inc., Janus International Holding LLC, and Janus Management Holdings Corporation (2011-2019), Director at Perkins Investment Management LLC (2011-2019), and Chief Financial Officer at Janus Capital Group Inc. (2011-2013). |
* Officers are elected at least annually by the Trustees for a one-year term and may also be elected from time to time by the Trustees for an interim period. | |||
Janus Aspen Series | 43 |
Janus Henderson VIT Forty Portfolio
Trustees and Officers (unaudited)
OFFICERS | |||
Name, Address, and Age | Positions Held with the Trust | Term of Office* and Length of Time Served | Principal Occupations During the Past Five Years |
Kristin
Mariani | Vice President, Chief Compliance Officer, and Anti-Money Laundering Officer | 7/20-Present | Head of Compliance, North America for Janus Henderson Investors (since September 2020), and Chief Compliance Officer for Janus Capital Management LLC (since September 2017). Formerly, Global Head of Investment Management Compliance for Janus Henderson Investors (February 2019 – August 2020), Vice President, Head of Global Distribution Compliance and Chief Compliance Officer of Janus Henderson Distributors (May 2017-September 2017), Vice President, Compliance at Janus Capital Group Inc., Janus Capital Management LLC, and Janus Distributors LLC (2009-2017). |
Jesper
Nergaard | Chief Financial Officer | 3/05-Present | Head of U.S. Fund Administration, Janus Henderson Investors and Janus Services LLC. |
Abigail J. Murray | Vice President, Chief Legal Officer, and Secretary | 12/20-Present | Managing Counsel (2020-present). Formerly, Senior Counsel for Invesco Ltd. (2017-2020), and Vice President and Senior Counsel, ALPS Fund Services, Inc. and Assistant General Counsel, ALPS Advisors, Inc. (2015-2017). |
* Officers are elected at least annually by the Trustees for a one-year term and may also be elected from time to time by the Trustees for an interim period. | |||
44 | DECEMBER 31, 2020 |
Janus Henderson VIT Forty Portfolio
Notes
NotesPage1
Janus Aspen Series | 45 |
| ||||||||
This report is submitted for the general information of shareholders of the Portfolio. It is not an offer or solicitation for the Portfolio and is not authorized for distribution to prospective investors unless preceded or accompanied by an effective prospectus. | ||||||||
Janus Henderson, Janus, Henderson, Perkins, and Intech are trademarks of Janus Henderson Group plc or one of its subsidiaries. © Janus Henderson Group plc Janus Henderson Distributors | ||||||||
109-02-81115 03-21 | ||||||||

ANNUAL REPORT December 31, 2020 | ||
Janus Henderson VIT Global Research Portfolio | ||
Janus Aspen Series | ||
HIGHLIGHTS · Portfolio management perspective · Investment strategy behind your portfolio · Portfolio
performance, characteristics |
|

Table of Contents
Janus Henderson VIT Global Research Portfolio
Janus Henderson VIT Global Research Portfolio (unaudited)
PERFORMANCE SUMMARY
Janus Henderson Global Research Portfolio’s Institutional Shares and Service Shares returned 20.06% and 19.76%, respectively, over the 12-month period ending December 31, 2020, while its primary benchmark, the MSCI World IndexSM, returned 15.90%. The Portfolio’s secondary benchmark, the MSCI All Country World IndexSM, returned 16.25%.
MARKET ENVIRONMENT
Global equities generated solid gains for the year, recovering from a sharp downturn in March sparked by the worldwide spread of COVID-19 and ensuing fears of a global economic recession. Unprecedented monetary and fiscal stimulus by governments and central banks around the world, along with the development and approval of COVID-19 vaccines, supported the recovery in equities. A favorable earnings backdrop also contributed to the market’s resilience. Although the rebound in the markets was led primarily by large-cap technology and health care stocks, toward the end of the period, market leadership showed signs of expanding to more cyclical and value-oriented businesses in areas of the market that historically have performed well during an economic recovery.
PERFORMANCE DISCUSSION
Our seven global sector teams employ a bottom-up, fundamental approach to identify what we consider the best global opportunities. Our analysts take a long-term view of companies with a focus on value creation and duration of growth, which may lead to high returns on invested capital. The Portfolio directly captures the insights of our teams through their highest-conviction ideas. In building a diversified portfolio, we seek to minimize macroeconomic risks while generating superior performance over longer periods.
Contributing most to relative performance were the Portfolio’s selection of financials and communications stocks. Conversely, weak security selection within the energy and health care sectors limited relative gains.
On an individual stock basis, top relative contributors included technology holdings Taiwan Semiconductor Manufacturing Company (TSMC), ASML Holding and Adobe. Rising demand for 5G technology, high-performance computing applications and the Internet of Things continued to support a positive outlook for the semiconductor industry. Companies such as TSMC, a semiconductor foundry company, and ASML, a manufacturer of chip-making equipment, subsequently benefited. Adobe continued to benefit from robust growth in digital media across creative and document clouds. The software maker saw increased demand for its products due to an acceleration in these trends as more people worked from home during quarantines.
Key contributors to the Portfolio’s performance also included companies affected by changes in consumer behaviors due to the pandemic. For example, an acceleration in online commerce lifted the stock of Amazon.com. Its Amazon Web Services (AWS) cloud computing platform also saw continued strength, driven in part by an increase in the number of people working from home.
On an individual stock basis, notable relative detractors included a strong-performing technology-related stock that does not meet our investment criteria and, consequently, is not held in the Portfolio. However, among stocks that are held in the Portfolio, technology hardware and services company Apple was a top detractor. The Portfolio held a notably smaller position in the stock than the index. Given the large share of the index that Apple commands, this prevented us from benefiting from the stock’s strong gains to the same degree as our benchmark. Shares advanced on enthusiasm surrounding the 5G product cycle.
Janus Aspen Series | 1 |
Janus Henderson VIT Global Research Portfolio (unaudited)
Decreased demand for oil during the pandemic and Saudi Arabia’s decision to bring incremental supply into a weak market caused oil prices to plummet during the period. Our holdings in integrated energy company Suncor Energy and shale oil and gas producer EOG Resources subsequently detracted from the Portfolio’s relative results. We are optimistic about steps Suncor is taking to navigate the current challenging environment, including reducing operating expenses and cutting its shareholder dividend to help preserve balance sheet strength. Furthermore, Suncor runs a significant percentage of oil it produces through its own refineries, providing it with a deep understanding of how to take advantage of dislocations in the value chain. We are less optimistic about EOG Resources and liquidated our position in the stock as a means of reducing our upstream exposure to exploration companies.
Other notable detractors included companies that experienced a significant disruption as a result of the global pandemic. For example, the impact of the pandemic on travel demand weighed on Norwegian Cruise Line Holdings. The cruise ship operator suffered from a significant increase in cancellations and decrease in bookings. Given the severity of the stock’s decline, we sold our position.
OUTLOOK
Our outlook for equities in 2021 is positive, supported by expectations of strong earnings growth and the notion that the global economy may be healing more rapidly than anticipated. While we recognize that businesses and households could again shut their wallets in the event of an extended and uncontrolled increase in COVID-19 infections, many countries have coalesced around the idea that certain economic activity remains essential and many companies have learned to adapt their business models to accommodate changes in client behavior. Still other companies have benefited from helping businesses and households navigate the health crisis, such as those providing remote working and e-commerce solutions and innovative pharmaceutical and biotechnology firms developing COVID-19 therapies and vaccines.
The value these sectors added to the economy in 2020 enabled them to generate some of the year’s highest market returns and, as evidence builds that a V-shaped recovery is emerging, we believe they have the potential to be joined by other sectors. Improving economic conditions are already being reflected in corporate earnings and upwardly revised estimates for the coming quarters. Notably, leading the expected earnings gains for 2021 are industrials, consumer discretionary and materials – three sectors typically dependent upon broad economic growth.
While a broadening recovery in equities, in our view, is grounded in favorable fundamentals, certain risks remain. Among them are the unknown duration of the pandemic and, in the U.S., potential changes in the regulatory environment and a possible inflationary surprise. Although we remain cognizant of these risks, we view fundamentals, forward-looking management teams and low interest rates as strong catalysts capable of helping equity markets overcome adversity and therefore look forward to 2021 with optimism.
Thank you for your investment in Janus Henderson VIT Global Research Portfolio.
2 | DECEMBER 31, 2020 |
Janus Henderson VIT Global Research Portfolio (unaudited)
Portfolio At A Glance
December 31, 2020
|
|
|
|
|
|
|
|
|
|
|
|
|
|
|
|
|
|
|
|
|
|
|
|
|
|
|
|
|
|
| 5 Top Contributors - Holdings | 5 Top Detractors - Holdings | |||||||
|
| Average |
| Relative |
|
| Average |
| Relative |
| Taiwan Semiconductor Manufacturing Co Ltd | 1.51% |
| 0.74% |
| Apple Inc | 1.57% |
| -1.35% |
| ASML Holding NV | 2.00% |
| 0.71% |
| Suncor Energy Inc | 0.60% |
| -0.60% |
| Amazon.com Inc | 3.71% |
| 0.59% |
| Norwegian Cruise Line Holdings Ltd | 0.13% |
| -0.59% |
| Hexagon AB | 1.37% |
| 0.58% |
| Microsoft Corp | 2.60% |
| -0.50% |
| Adobe Inc | 2.20% |
| 0.52% |
| EOG Resources Inc | 0.15% |
| -0.41% |
| 4 Top Contributors - Sectors* |
|
|
|
|
|
|
|
| Relative |
| Portfolio | MSCI World Index |
|
|
| Contribution |
| Average Weight | Average Weight |
| Financials |
| 3.12% |
| 18.53% | 18.36% |
| Communications |
| 2.05% |
| 10.62% | 10.53% |
| Consumer |
| 0.56% |
| 17.16% | 17.28% |
| Industrials |
| 0.54% |
| 16.34% | 16.40% |
|
|
|
|
|
|
|
|
|
|
|
|
|
|
| 4 Top Detractors - Sectors* |
|
|
|
|
|
|
|
| Relative |
| Portfolio | MSCI World Index |
|
|
| Contribution |
| Average Weight | Average Weight |
| Energy |
| -0.71% |
| 6.70% | 6.71% |
| Healthcare |
| -0.52% |
| 13.67% | 13.84% |
| Other** |
| -0.34% |
| 0.41% | 0.09% |
| Technology |
| -0.10% |
| 16.57% | 16.79% |
| Relative contribution reflects
how the portolio's holdings impacted return relative to the benchmark. Cash and securities not held in
the portfolio are not shown. For equity portfolios, relative contribution compares the performance of
a security in the portfolio to the benchmark's total return, factoring in the difference in weight of
that security in the benchmark. Returns are calculated using daily returns and previous day ending weights
rolled up by ticker, excluding fixed income securities, gross of advisory fees, may exclude certain derivatives
and will differ from actual performance. | |||||
* | The sectors listed above reflect those covered by the six analyst teams who comprise the Janus Henderson Research Team. | |||||
** | Not a GICS classified sector. | |||||
Janus Aspen Series | 3 |
Janus Henderson VIT Global Research Portfolio (unaudited)
Portfolio At A Glance
December 31, 2020
5 Largest Equity Holdings - (% of Net Assets) | |
Microsoft Corp | |
Software | 4.2% |
Amazon.com Inc | |
Internet & Direct Marketing Retail | 3.4% |
Apple Inc | |
Technology Hardware, Storage & Peripherals | 3.2% |
Alphabet Inc - Class C | |
Interactive Media & Services | 2.7% |
ASML Holding NV | |
Semiconductor & Semiconductor Equipment | 2.3% |
15.8% | |
Asset Allocation - (% of Net Assets) | |||||
Common Stocks | 99.6% | ||||
Investment Companies | 0.4% | ||||
Investments Purchased with Cash Collateral from Securities Lending | 0.3% | ||||
Other | (0.3)% | ||||
100.0% | |||||
Top Country Allocations - Long Positions - (% of Investment Securities) | |
As of December 31, 2020
| As of December 31, 2019
|


4 | DECEMBER 31, 2020 |
Janus Henderson VIT Global Research Portfolio (unaudited)
Performance
See important disclosures on the next page. |
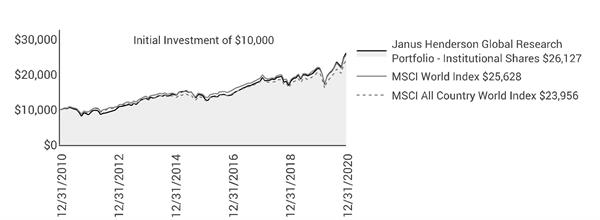
|
|
|
|
|
|
|
|
| |
|
|
|
|
|
|
|
|
|
|
Average Annual Total Return - for the periods ended December 31, 2020 |
|
| Expense Ratios | ||||||
|
| One
| Five | Ten
| Since |
|
| Total
Annual Fund | |
Institutional Shares |
| 20.06% | 13.35% | 10.08% | 8.92% |
|
| 0.79% | |
Service Shares |
| 19.76% | 13.06% | 9.81% | 8.64% |
|
| 1.04% | |
MSCI World Index |
| 15.90% | 12.19% | 9.87% | 7.54% |
|
|
| |
MSCI All Country World Index |
| 16.25% | 12.26% | 9.13% | N/A** |
|
|
| |
Morningstar Quartile - Institutional Shares |
| 2nd | 2nd | 2nd | 2nd |
|
|
| |
Morningstar Ranking - based on total returns for World Large Stock Funds |
| 327/894 | 247/739 | 201/538 | 87/167 |
|
|
| |
Returns quoted are past performance and do not guarantee future results; current performance may be lower or higher. Investment returns and principal value will vary; there may be a gain or loss when shares are sold. For the most recent month-end performance call 800.668.0434 or visit janushenderson.com/VITperformance.
This Portfolio has a performance-based management fee that may adjust up or down based on the Portfolio’s performance.
Performance may be affected by risks that include those associated with foreign and emerging markets, fixed income securities, high-yield and high-risk securities, undervalued, overlooked and smaller capitalization companies, real estate related securities including Real Estate Investment Trusts (REITs), non-diversification, portfolio turnover, derivatives, short sales, initial public offerings (IPOs) and potential conflicts of interest. Each product has different risks. Please see the prospectus for more information about risks, holdings and other details.
Returns do not reflect the deduction of fees, charges or expenses of any insurance product or qualified plan. If applied, returns would have been lower.
Returns include reinvestment of all dividends and distributions and do not reflect the deduction of taxes that a shareholder would pay on Portfolio distributions or redemptions of Portfolio shares. The returns do not include adjustments in accordance with generally accepted accounting principles required at the period end for financial reporting purposes.
Performance for Service Shares prior to December 31, 1999 reflects the performance of Institutional Shares adjusted to reflect the expenses of Service Shares.
Ranking is for the share class shown only; other classes may have different performance characteristics.
© 2020 Morningstar, Inc. All Rights Reserved.
There is no assurance that the investment process will consistently lead to successful investing.
See Notes to Schedule of Investments and Other Information for index definitions.
Index performance does not reflect the expenses of managing a portfolio as an index is unmanaged and not available for direct investment.
Janus Aspen Series | 5 |
Janus Henderson VIT Global Research Portfolio (unaudited)
Performance
See “Useful Information About Your Portfolio Report.”
Effective April 13, 2020, Matthew Peron is the Portfolio Manager of the Portfolio and provides general oversight of the Research Team.
*The Portfolio’s inception date – September 13, 1993
‡ As stated in the prospectus. See Financial Highlights for actual expense ratios during the reporting period.
**Since inception return is not shown for the index because the index’s inception date differs significantly from the Portfolio’s inception date.
6 | DECEMBER 31, 2020 |
Janus Henderson VIT Global Research Portfolio (unaudited)
Expense Examples
As a shareholder of the Portfolio, you incur two types of costs: (1) transaction costs and (2) ongoing costs, including management fees; 12b-1 distribution and shareholder servicing fees (applicable to Service Shares only); transfer agent fees and expenses payable pursuant to the Transfer Agency Agreement; and other Portfolio expenses. This example is intended to help you understand your ongoing costs (in dollars) of investing in the Portfolio and to compare these costs with the ongoing costs of investing in other mutual funds. To do so, compare this 5% hypothetical example with the 5% hypothetical examples that appear in the shareholder reports of the other funds. The example is based upon an investment of $1,000 invested at the beginning of the period and held for the six-months indicated, unless noted otherwise in the table and footnotes below.
Actual Expenses
The information in the table under the heading “Actual” provides information about actual account values and actual expenses. You may use the information in these columns, together with the amount you invested, to estimate the expenses that you paid over the period. Simply divide your account value by $1,000 (for example, an $8,600 account value divided by $1,000 = 8.6), then multiply the result by the number in the appropriate column for your share class under the heading entitled “Expenses Paid During Period” to estimate the expenses you paid on your account during the period.
Hypothetical Example for Comparison Purposes
The information in the table under the heading “Hypothetical (5% return before expenses)” provides information about hypothetical account values and hypothetical expenses based upon the Portfolio’s actual expense ratio and an assumed rate of return of 5% per year before expenses, which is not the Portfolio’s actual return. The hypothetical account values and expenses may not be used to estimate the actual ending account balance or expenses you paid for the period. You may use this information to compare the ongoing costs of investing in the Portfolio and other funds. To do so, compare this 5% hypothetical example with the 5% hypothetical examples that appear in the shareholder reports of the other funds. Additionally, for an analysis of the fees associated with an investment in either share class or other similar funds, please visit www.finra.org/fundanalyzer.
Please note that the expenses shown in the table are meant to highlight your ongoing costs only and do not reflect any transaction costs, such as any charges at the separate account level or contract level. These fees are fully described in the Portfolio’s prospectuses. Therefore, the hypothetical examples are useful in comparing ongoing costs only, and will not help you determine the relative total costs of owning different funds. In addition, if these transaction costs were included, your costs would have been higher.
|
|
|
|
|
|
|
|
| ||
|
|
| Actual |
| Hypothetical
|
| ||||
| Beginning | Ending | Expenses |
| Beginning | Ending | Expenses | Net Annualized | ||
Institutional Shares | $1,000.00 | $1,246.70 | $4.69 |
| $1,000.00 | $1,020.96 | $4.22 | 0.83% | ||
Service Shares | $1,000.00 | $1,245.20 | $6.15 |
| $1,000.00 | $1,019.66 | $5.53 | 1.09% | ||
† | Expenses Paid During Period are equal to the Net Annualized Expense Ratio multiplied by the average account value over the period, multiplied by 184/366 (to reflect the one-half year period). Expenses in the examples include the effect of applicable fee waivers and/or expense reimbursements, if any. Had such waivers and/or reimbursements not been in effect, your expenses would have been higher. Please refer to the Notes to Financial Statements or the Portfolio’s prospectuses for more information regarding waivers and/or reimbursements. | |||||||||
Janus Aspen Series | 7 |
Janus Henderson VIT Global Research Portfolio
Schedule of Investments
December 31, 2020
Shares
or | Value | ||||||
Common Stocks– 99.6% | |||||||
Aerospace & Defense – 3.1% | |||||||
CAE Inc | 262,601 | $7,277,392 | |||||
L3Harris Technologies Inc | 45,055 | 8,516,296 | |||||
Safran SA* | 74,126 | 10,511,234 | |||||
26,304,922 | |||||||
Air Freight & Logistics – 1.0% | |||||||
United Parcel Service Inc | 49,010 | 8,253,284 | |||||
Airlines – 0.8% | |||||||
Ryanair Holdings PLC (ADR)* | 57,869 | 6,364,433 | |||||
Auto Components – 1.0% | |||||||
Aptiv PLC | 61,339 | 7,991,858 | |||||
Automobiles – 0.3% | |||||||
Maruti Suzuki India Ltd | 27,481 | 2,883,750 | |||||
Banks – 3.9% | |||||||
BNP Paribas SA* | 90,207 | 4,757,288 | |||||
Citigroup Inc | 134,440 | 8,289,570 | |||||
HDFC Bank Ltd* | 229,255 | 4,516,164 | |||||
JPMorgan Chase & Co | 116,644 | 14,821,953 | |||||
32,384,975 | |||||||
Beverages – 3.4% | |||||||
Constellation Brands Inc | 73,933 | 16,195,024 | |||||
Pernod Ricard SA | 66,041 | 12,657,660 | |||||
28,852,684 | |||||||
Biotechnology – 3.1% | |||||||
AbbVie Inc | 74,211 | 7,951,709 | |||||
Alexion Pharmaceuticals Inc* | 19,894 | 3,108,239 | |||||
Ascendis Pharma A/S (ADR)* | 16,788 | 2,799,903 | |||||
Global Blood Therapeutics Inc* | 29,556 | 1,280,070 | |||||
Neurocrine Biosciences Inc* | 33,071 | 3,169,855 | |||||
Sarepta Therapeutics Inc* | 19,985 | 3,407,243 | |||||
Vertex Pharmaceuticals Inc* | 16,814 | 3,973,821 | |||||
25,690,840 | |||||||
Building Products – 1.2% | |||||||
Daikin Industries Ltd | 45,800 | 10,201,911 | |||||
Capital Markets – 2.5% | |||||||
Blackstone Group Inc | 118,228 | 7,662,357 | |||||
London Stock Exchange Group PLC | 51,336 | 6,326,984 | |||||
Morgan Stanley | 106,161 | 7,275,213 | |||||
21,264,554 | |||||||
Chemicals – 1.8% | |||||||
Air Products & Chemicals Inc | 28,550 | 7,800,431 | |||||
Sherwin-Williams Co | 10,423 | 7,659,967 | |||||
15,460,398 | |||||||
Consumer Finance – 1.6% | |||||||
Nexi SpA (144A)* | 368,229 | 7,313,926 | |||||
Synchrony Financial | 164,461 | 5,708,441 | |||||
13,022,367 | |||||||
Electronic Equipment, Instruments & Components – 2.6% | |||||||
Hexagon AB | 150,541 | 13,715,122 | |||||
Keyence Corp | 14,500 | 8,161,529 | |||||
21,876,651 | |||||||
Entertainment – 2.4% | |||||||
Liberty Media Corp-Liberty Formula One* | 193,189 | 8,229,851 | |||||
Netflix Inc* | 22,511 | 12,172,373 | |||||
20,402,224 | |||||||
Equity Real Estate Investment Trusts (REITs) – 1.1% | |||||||
American Tower Corp | 13,320 | 2,989,807 | |||||
Crown Castle International Corp | 19,644 | 3,127,128 | |||||
See Notes to Schedule of Investments and Other Information and Notes to Financial Statements. | |
8 | DECEMBER 31, 2020 |
Janus Henderson VIT Global Research Portfolio
Schedule of Investments
December 31, 2020
Shares or | |||||||