UNITED STATES
SECURITIES AND EXCHANGE COMMISSION
Washington, D.C. 20549
FORM
|
|
ANNUAL REPORT PURSUANT TO SECTION 13 OR 15(d) OF THE SECURITIES EXCHANGE ACT OF 1934 |
For the Fiscal Year Ended
OR
|
|
TRANSITION REPORT PURSUANT TO SECTION 13 OR 15(d) OF THE SECURITIES EXCHANGE ACT OF 1934 |
For the transition period from to
Commission File Number:
Commission File Number:
(Exact name of registrant as specified in its charter)
|
|
|
|
|
|
|
(State or other jurisdiction of incorporation or organization) |
(I.R.S. Employer Identification No.) |
|
|
|
|
|
( |
|
(Address of principal executive offices) (Zip Code) |
(Registrant’s telephone number, including area code) |
Securities registered pursuant to Section 12(b) of the Act:
|
Title of each class |
|
Trading Symbol(s) |
|
Name of each exchange on which registered |
Common Shares of Beneficial Interest, |
|
|
|
|
7.57% Notes due August 15, 2026 |
|
N/A |
|
|
Securities registered pursuant to Section 12(g) of the Act:
None (Equity Residential)
Units of Limited Partnership Interest (ERP Operating Limited Partnership)
(Title of each class)
Indicate by check mark if the registrant is a well-known seasoned issuer, as defined in Rule 405 of the Securities Act.
|
Equity Residential |
ERP Operating Limited Partnership |
Indicate by check mark if the registrant is not required to file reports pursuant to Section 13 or Section 15(d) of the Act.
|
Equity Residential Yes ☐ |
ERP Operating Limited Partnership Yes ☐ |
Indicate by check mark whether the registrant (1) has filed all reports required to be filed by Section 13 or 15(d) of the Securities Exchange Act of 1934 during the preceding 12 months (or for such shorter period that the registrant was required to file such reports), and (2) has been subject to such filing requirements for the past 90 days.
|
Equity Residential |
ERP Operating Limited Partnership |
Indicate by check mark whether the registrant has submitted electronically every Interactive Data File required to be submitted pursuant to Rule 405 of Regulation S-T (§ 232.405 of this chapter) during the preceding 12 months (or for such shorter period that the registrant was required to submit such files).
|
Equity Residential |
ERP Operating Limited Partnership |
Indicate by check mark whether the registrant is a large accelerated filer, an accelerated filer, a non-accelerated filer, a smaller reporting company, or an emerging growth company. See the definitions of “large accelerated filer,” “accelerated filer,” “smaller reporting company,” and “emerging growth company” in Rule 12b-2 of the Exchange Act.
|
Equity Residential: |
|
|
|
|
|
|
|
|
|
|
|
|
|
|
|
|
|
☒ |
|
Accelerated filer |
|
☐ |
|
|
|
|
|
|||
|
Non-accelerated filer |
|
☐ |
|
Smaller reporting company |
|
☐ |
|
|
|
|
|
|
|
|
|
Emerging growth company |
|
|
|
|
|
|
|
ERP Operating Limited Partnership: |
|
|
|
|
||
|
|
|
|
|
|
|
|
|
Large accelerated filer |
|
☐ |
|
Accelerated filer |
|
☐ |
|
|
|
|
|
|||
|
|
|
☒ |
|
Smaller reporting company |
|
☐ |
|
|
|
|
|
|
|
|
|
Emerging growth company |
|
|
|
|
|
|
If an emerging growth company, indicate by check mark if the registrant has elected not to use the extended transition period for complying with any new or revised financial accounting standards provided pursuant to Section 13(a) of the Exchange Act.
|
Equity Residential |
|
☐ |
|
ERP Operating Limited Partnership |
|
☐ |
Indicate by check mark whether the registrant has filed a report on and attestation to its management’s assessment of the effectiveness of its internal control over financial reporting under Section 404(b) of the Sarbanes-Oxley Act (15 U.S.C. 7262(b)) by the registered public accounting firm that prepared or issued its audit report.
|
Equity Residential |
|
|
|
ERP Operating Limited Partnership |
|
|
Indicate by check mark whether the registrant is a shell company (as defined in Rule 12b-2 of the Act).
|
Equity Residential Yes |
ERP Operating Limited Partnership Yes |
The aggregate market value of Common Shares held by non-affiliates of the Registrant was approximately $
The number of Common Shares of Beneficial Interest, $0.01 par value, outstanding on February 11, 2022 was
|
Auditor Firm Id: |
|
Auditor Name: |
|
Auditor Location: |
|
DOCUMENTS INCORPORATED BY REFERENCE
2
EXPLANATORY NOTE
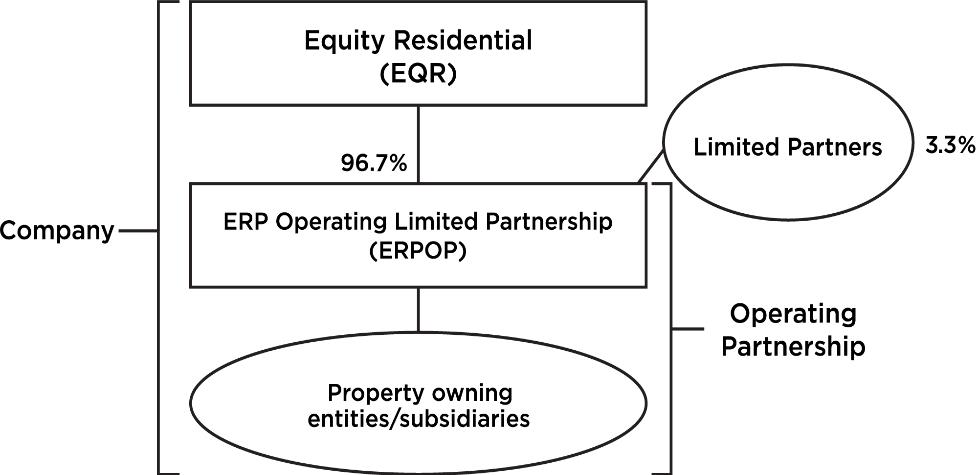
This report combines the annual reports on Form 10-K for the year ended December 31, 2021 of Equity Residential and ERP Operating Limited Partnership. Unless stated otherwise or the context otherwise requires, references to “EQR” mean Equity Residential, a Maryland real estate investment trust (“REIT”), and references to “ERPOP” mean ERP Operating Limited Partnership, an Illinois limited partnership. References to the “Company,” “we,” “us” or “our” mean collectively EQR, ERPOP and those entities/subsidiaries owned or controlled by EQR and/or ERPOP. References to the “Operating Partnership” mean collectively ERPOP and those entities/subsidiaries owned or controlled by ERPOP. The following chart illustrates the Company’s and the Operating Partnership’s corporate structure:
EQR is the general partner of, and as of December 31, 2021 owned an approximate 96.7% ownership interest in, ERPOP. The remaining 3.3% interest is owned by limited partners. As the sole general partner of ERPOP, EQR has exclusive control of ERPOP’s day-to-day management. Management operates the Company and the Operating Partnership as one business. The management of EQR consists of the same members as the management of ERPOP.
The Company is structured as an umbrella partnership REIT (“UPREIT”) and EQR contributes all net proceeds from its various equity offerings to ERPOP. In return for those contributions, EQR receives a number of OP Units (see definition below) in ERPOP equal to the number of Common Shares it has issued in the equity offering. The Company may acquire properties in transactions that include the issuance of OP Units as consideration for the acquired properties. Such transactions may, in certain circumstances, enable the sellers to defer in whole or in part, the recognition of taxable income or gain that might otherwise result from the sales. This is one of the reasons why the Company is structured in the manner shown above. Based on the terms of ERPOP’s partnership agreement, OP Units can be exchanged with Common Shares on a one-for-one basis because the Company maintains a one-for-one relationship between the OP Units of ERPOP issued to EQR and the outstanding Common Shares.
The Company believes that combining the reports on Form 10-K of EQR and ERPOP into this single report provides the following benefits:
|
|
• |
enhances investors’ understanding of the Company and the Operating Partnership by enabling investors to view the business as a whole in the same manner as management views and operates the business; |
|
|
• |
eliminates duplicative disclosure and provides a more streamlined and readable presentation since a substantial portion of the disclosure applies to both the Company and the Operating Partnership; and |
|
|
• |
creates time and cost efficiencies through the preparation of one combined report instead of two separate reports. |
3
The Company believes it is important to understand the few differences between EQR and ERPOP in the context of how EQR and ERPOP operate as a consolidated company. All of the Company’s property ownership, development and related business operations are conducted through the Operating Partnership and EQR has no material assets or liabilities other than its investment in ERPOP. EQR’s primary function is acting as the general partner of ERPOP. EQR also issues equity from time to time, the net proceeds of which it is obligated to contribute to ERPOP. EQR does not have any indebtedness as all debt is incurred by the Operating Partnership. The Operating Partnership holds substantially all of the assets of the Company, including the Company’s ownership interests in its joint ventures. The Operating Partnership conducts the operations of the business and is structured as a partnership with no publicly traded equity. Except for the net proceeds from equity offerings by EQR (which are contributed to the capital of ERPOP in exchange for additional partnership interests in ERPOP (“OP Units”) (on a one-for-one Common Share per OP Unit basis) or additional preference units in ERPOP (on a one-for-one preferred share per preference unit basis)), the Operating Partnership generates all remaining capital required by the Company’s business. These sources include the Operating Partnership’s working capital, net cash provided by operating activities, borrowings under its revolving credit facility and/or commercial paper program, the issuance of secured and unsecured debt and partnership interests, and proceeds received from disposition of certain properties and joint venture interests.
Shareholders’ equity, partners’ capital and noncontrolling interests are the main areas of difference between the consolidated financial statements of the Company and those of the Operating Partnership. The limited partners of the Operating Partnership are accounted for as partners’ capital in the Operating Partnership’s financial statements and as noncontrolling interests in the Company’s financial statements. The noncontrolling interests in the Operating Partnership’s financial statements include the interests of unaffiliated partners in various consolidated partnerships. The noncontrolling interests in the Company’s financial statements include the same noncontrolling interests at the Operating Partnership level and limited partner OP Unit holders of the Operating Partnership. The differences between shareholders’ equity and partners’ capital result from differences in the equity issued at the Company and Operating Partnership levels.
To help investors understand the differences between the Company and the Operating Partnership, this report provides separate consolidated financial statements for the Company and the Operating Partnership; a single set of consolidated notes to such financial statements that includes separate discussions of each entity’s debt, noncontrolling interests and shareholders’ equity or partners’ capital, as applicable; and a combined Management’s Discussion and Analysis of Financial Condition and Results of Operations section that includes discrete information related to each entity.
This report also includes separate Part II, Item 9A, Controls and Procedures, sections and separate Exhibits 31 and 32 certifications for each of the Company and the Operating Partnership in order to establish that the requisite certifications have been made and that the Company and the Operating Partnership are compliant with Rule 13a-15 or Rule 15d-15 of the Securities Exchange Act of 1934, as amended (the “Exchange Act”), and 18 U.S.C. §1350.
In order to highlight the differences between the Company and the Operating Partnership, the separate sections in this report for the Company and the Operating Partnership specifically refer to the Company and the Operating Partnership. In the sections that combine disclosure of the Company and the Operating Partnership, this report refers to actions or holdings as being actions or holdings of the Company. Although the Operating Partnership is generally the entity that directly or indirectly enters into contracts and joint ventures and holds assets and debt, reference to the Company is appropriate because the Company is one business and the Company operates that business through the Operating Partnership.
As general partner with control of ERPOP, EQR consolidates ERPOP for financial reporting purposes, and EQR essentially has no assets or liabilities other than its investment in ERPOP. Therefore, the assets and liabilities of the Company and the Operating Partnership are the same on their respective financial statements. The separate discussions of the Company and the Operating Partnership in this report should be read in conjunction with each other to understand the results of the Company on a consolidated basis and how management operates the Company.
4
EQUITY RESIDENTIAL
ERP OPERATING LIMITED PARTNERSHIP
TABLE OF CONTENTS
|
|
|
|
|
PAGE |
|
PART I. |
|
|
|
|
|
|
|
|
|
|
|
Item 1. |
|
|
6 |
|
|
|
|
|
|
|
|
Item 1A. |
|
|
11 |
|
|
|
|
|
|
|
|
Item 1B. |
|
|
21 |
|
|
|
|
|
|
|
|
Item 2. |
|
|
21 |
|
|
|
|
|
|
|
|
Item 3. |
|
|
24 |
|
|
|
|
|
|
|
|
Item 4. |
|
|
24 |
|
|
|
|
|
|
|
|
PART II. |
|
|
|
|
|
|
|
|
|
|
|
Item 5. |
|
|
25 |
|
|
|
|
|
|
|
|
Item 6. |
|
|
25 |
|
|
|
|
|
|
|
|
Item 7. |
|
Management’s Discussion and Analysis of Financial Condition and Results of Operations |
|
26 |
|
|
|
|
|
|
|
Item 7A. |
|
|
42 |
|
|
|
|
|
|
|
|
Item 8. |
|
|
42 |
|
|
|
|
|
|
|
|
Item 9. |
|
Changes in and Disagreements with Accountants on Accounting and Financial Disclosure |
|
42 |
|
|
|
|
|
|
|
Item 9A. |
|
|
42 |
|
|
|
|
|
|
|
|
Item 9B. |
|
|
44 |
|
|
|
|
|
|
|
|
Item 9C. |
|
Disclosure Regarding Foreign Jurisdictions that Prevent Inspections |
|
44 |
|
|
|
|
|
|
|
PART III. |
|
|
|
|
|
|
|
|
|
|
|
Item 10. |
|
|
45 |
|
|
|
|
|
|
|
|
Item 11. |
|
|
45 |
|
|
|
|
|
|
|
|
Item 12. |
|
Security Ownership of Certain Beneficial Owners and Management and Related Stockholder Matters |
|
45 |
|
|
|
|
|
|
|
Item 13. |
|
Certain Relationships and Related Transactions, and Trustee Independence |
|
45 |
|
|
|
|
|
|
|
Item 14. |
|
|
45 |
|
|
|
|
|
|
|
|
PART IV. |
|
|
|
|
|
|
|
|
|
|
|
Item 15. |
|
|
46 |
|
|
|
|
|
|
|
|
Item 16. |
|
|
46 |
|
|
|
|
|
|
|
|
EX-4.3 |
|
|
|
|
|
|
|
|
|
|
|
EX-21 |
|
|
|
|
|
|
|
|
|
|
|
EX-23.1 |
|
|
|
|
|
|
|
|
|
|
|
EX-23.2 |
|
|
|
|
|
|
|
|
|
|
|
EX-31.1 |
|
|
|
|
|
|
|
|
|
|
|
EX-31.2 |
|
|
|
|
|
|
|
|
|
|
|
EX-31.3 |
|
|
|
|
|
|
|
|
|
|
|
EX 31.4 |
|
|
|
|
|
|
|
|
|
|
|
EX-32.1 |
|
|
|
|
|
|
|
|
|
|
|
EX-32.2 |
|
|
|
|
|
|
|
|
|
|
|
EX-32.3 |
|
|
|
|
|
|
|
|
|
|
|
EX-32.4 |
|
|
|
|
|
|
|
|
|
|
|
EX-101 INSTANCE DOCUMENT |
|
|
||
|
|
|
|
|
|
|
EX-101 SCHEMA DOCUMENT |
|
|
||
|
|
|
|
|
|
|
EX-101 CALCULATION LINKBASE DOCUMENT |
|
|
||
|
|
|
|
|
|
|
EX-101 LABELS LINKBASE DOCUMENT |
|
|
||
|
|
|
|
|
|
|
EX-101 PRESENTATION LINKBASE DOCUMENT |
|
|
||
|
|
|
|
|
|
|
EX-101 DEFINITION LINKBASE DOCUMENT |
|
|
||
5
PART I
Item 1. Business
General
Equity Residential (“EQR”) is committed to creating communities where people thrive. The Company, a member of the S&P 500, is focused on the acquisition, development and management of residential properties located in and around dynamic cities that attract affluent long-term renters. ERP Operating Limited Partnership (“ERPOP”) is focused on conducting the multifamily property business of EQR. EQR is a Maryland real estate investment trust (“REIT”) formed in March 1993 and ERPOP is an Illinois limited partnership formed in May 1993. References to the “Company,” “we,” “us” or “our” mean collectively EQR, ERPOP and those entities/subsidiaries owned or controlled by EQR and/or ERPOP. References to the “Operating Partnership” mean collectively ERPOP and those entities/subsidiaries owned or controlled by ERPOP.
EQR is the general partner of, and as of December 31, 2021 owned an approximate 96.7% ownership interest in, ERPOP. All of the Company’s property ownership, development and related business operations are conducted through the Operating Partnership and EQR has no material assets or liabilities other than its investment in ERPOP. EQR issues equity from time to time, the net proceeds of which it is obligated to contribute to ERPOP, but does not have any indebtedness as all debt is incurred by the Operating Partnership. The Operating Partnership holds substantially all of the assets of the Company, including the Company’s ownership interests in its joint ventures. The Operating Partnership conducts the operations of the business and is structured as a partnership with no publicly traded equity.
The Company’s corporate headquarters is located in Chicago, Illinois and the Company also operates regional property management offices in most of its markets.
Certain capitalized terms used herein are defined in the Notes to Consolidated Financial Statements. See also Note 17 in the Notes to Consolidated Financial Statements for additional discussion regarding the Company’s segment disclosures.
Available Information
You may access our Annual Report on Form 10-K, our Quarterly Reports on Form 10-Q, our Current Reports on Form 8-K, our proxy statements and any amendments to any of those reports/statements we file with or furnish to the Securities and Exchange Commission (“SEC”) free of charge on our website, www.equityapartments.com. These reports/statements are made available on our website as soon as reasonably practicable after we file them with or furnish them to the SEC. The information contained on our website, including any information referred to in this report as being available on our website, is not a part of or incorporated into this report.
Business Objectives and Operating and Investing Strategies
Overview
The Company is one of the largest U.S. publicly-traded owners and operators of high quality rental apartment properties, with an established presence in Boston, New York, Washington, D.C., Southern California (including Los Angeles, Orange County and San Diego), San Francisco and Seattle, and an expanding presence in Denver, Atlanta, Dallas/Ft. Worth and Austin. We believe our markets are knowledge centers of the U.S. economy that draw talented workers and employers that drive economic growth in the United States. We believe the locations of our properties in these markets are attractive to these knowledge workers whom we hope to convert into satisfied long-term residents.
Equity Residential is committed to creating communities where people thrive. We carry this, our corporate purpose, through our relationships with our customers, our employees, our shareholders and the communities in which we operate. It drives our commitments to sustainability, diversity and inclusion, the total wellbeing of our employees and being a responsible corporate citizen in the communities in which we operate, which has been especially relevant as we faced unprecedented challenges like the novel coronavirus (“COVID-19”) pandemic.
We believe we have created an industry‐leading operating platform and balance sheet to run our properties. Our employees are focused on delivering remarkable customer service to our residents so they will stay with us longer, be willing to pay higher rent for a great experience and will tell others about how much they love living in an Equity Residential property. We utilize technology and other innovative methods of engagement with our residents to foster relationships and community, improve the resident experience and operate our business more efficiently. We pair that with disciplined balance sheet management that enhances returns and value creation while maintaining flexibility to take advantage of future opportunities. We believe that our stakeholders value stability, liquidity, predictability and accountability and that is the mission to which we remain unwaveringly committed.
6
Despite the challenges we have faced with the COVID-19 pandemic, we believe that the long-term prospects for our business remain strong. Our well-located communities are in and around dynamic cities that we believe will continue to attract affluent long-term renters. With the pandemic subsiding and cities reopening, we are seeing strong demand from our affluent resident base, demonstrating the long-term attractiveness of our communities.
Investment Strategy
The Company’s long-term strategy is to invest in apartment communities located in strategically targeted markets with the goal of maximizing our risk-adjusted total returns and balancing current cash flow generation with long-term capital appreciation. We seek to meet this goal by investing in markets that are characterized by conditions favorable to multifamily property operations over the long-term. The markets we focus on generally feature one or more of the following characteristics that allow us to drive performance:
|
|
• |
Large and diverse economic drivers. Our markets are some of the largest cities in the United States. They are markets that generally attract a variety of large and diverse industries and businesses. They include a number of submarkets that are attractive for long-term multifamily ownership. |
|
|
• |
Strong high quality job growth. Our markets attract and create high quality jobs that are often focused in growing areas of the knowledge-based economy. These jobs result in the significant presence and growth in renters that work in the highest earning sectors of the economy, are not rent burdened and are attracted to our type of properties. This creates the ability to raise rents more readily in good economic times and reduces risk during downturns. Many of these workers are employed in the fields of Science, Technology, Engineering and Mathematics, or STEM jobs, which experienced significantly lower job loss during the COVID-19 pandemic. |
|
|
• |
Significant apartment demand that meets new apartment supply. We remain focused on owning and operating properties in markets or submarkets where the supply of apartments is balanced with strong demand that supports superior long-term returns. |
|
|
• |
Other favorable performance drivers including high and rapidly rising single-family housing prices that support longer term rentership, a balanced regulatory/political environment relating to housing policy and manageable resiliency/environmental risk. |
We believe our strategy capitalizes on the preference of renters of all ages to live in the locations where we operate which typically are near transportation (both public transit and convenient highway access), entertainment, employment centers/universities and cultural and outdoor amenities. Furthermore, we believe that demand for rental housing will continue to be driven primarily through household formations from the younger segments of our population, including both Millennials and Generation Z, and to a lesser extent the aging Baby Boomer generation.
|
|
• |
Millennials are comprised of those individuals born between 1981 and 1996, total approximately 72 million people and continue to be a significant portion of the renter population. They also tend to remain renters longer due to societal trends favoring delays in marriage and having children as well as lower savings for home down payments. |
|
|
• |
Generation Z is comprised of the approximately 67 million people born between 1997 and 2012. This cohort is just now entering the renter population and is expected to continue to be an important source of demand. |
|
|
• |
Baby Boomers, a demographic of more than 71 million people born between 1946 and 1964, also trend toward apartment rentals. |
The Company continues to allocate capital in order to optimize performance by balancing current cash flow growth with long-term capital appreciation. Most recently, we have done so by adding expansion markets to our portfolio allocation that meet the same characteristics listed above. Expansion into these markets of Denver, Atlanta, Dallas/Ft. Worth and Austin includes investments in both urban and suburban properties and is generally being funded by reducing exposure in selective established markets. Development also plays an important role in our capital allocation. Development activity is focused on our in-house pipeline, our strategic partnership with Toll Brothers, Inc. and joint ventures with other third-party developers in both established and expansion markets.
Operations and Innovation
We attempt to balance occupancy and rental rates to maximize our revenue while exercising tight cost control to generate the highest possible return to our shareholders. Revenue is maximized through our customized pricing system that uses market data on current and projected demand and availability to create both current and forward pricing daily for each apartment unit we manage. We focus on the resident experience and leveraging operating efficiency which we believe drives our success in renewing our residents. This focus has driven strong occupancy and a high percentage of residents renewing that is in line with pre-pandemic levels while achieving strong renewal rate growth.
7
Rapidly evolving technology continues to drive innovation in the rental industry. We have been and continue to be a leader in deploying and investing in property technology to serve our customers better and operate more efficiently. Having been a first mover in such important areas as revenue management and online leasing, we are focused on technology that improves our operating margins and customer experience. We use a standardized purchasing system to control our operating expenses and a business intelligence platform that allows all our team members to quickly identify and address issues and opportunities. Our operations benefitted from having many of these initiatives in place during the pandemic, allowing us to interact with our customers in a safe and responsible manner, including self-guided tours, automated responses to customer inquiries and enhanced service and maintenance management. While we believe areas such as “smart home” technology and others will provide the foundation for current and future improvements to how we do business, we will continue to consider the cost and longevity of technology capital investments and their benefits.
Our Commitment to Environmental, Social and Governance (“ESG”)
At Equity Residential, we believe a focus on ESG is a key way to programmatically address stakeholder concerns as part of our corporate purpose. This needs to be a sustainable endeavor, in which we provide resilient properties that will stand the test of time and remain attractive to our customers and the community without negatively impacting the environment. We have a dedicated in-house team that initiates and applies sustainable practices in all aspects of our business, including investment activities, development, property operations and property management activities. Multifamily housing is one of the most environmentally-friendly uses of real estate, as each property provides homes for hundreds of families in a denser shared environment. We consider building locations based on walkability, accessibility, neighborhoods and parks. We also design our communities to support amenities such as fitness centers and we select locations near shops, restaurants, outdoor amenities such as bike/running paths and health clubs, enabling a low carbon footprint lifestyle for our residents to live, work and play.
Equity Residential’s sustainability program actively manages environmental impacts and climate-related risks and opportunities through optimized, financially responsible capital investments and technologies. We methodically focus on energy, water and emissions to advance the program’s policies, targets and resilience outcomes. Together, we believe our program drives long-term asset value, responsibly manages risks and engages our communities, residents, employees and shareholders as part of our broader ESG strategy and commitment to good corporate citizenship and maximizing investment performance.
To further strengthen our commitments to ESG initiatives, we issued two sustainable fixed-income instruments (each a “green bond”) designed to support projects that contribute to environmental sustainability. In 2018, the Company became the first multifamily REIT ever to issue a green bond, with the net proceeds of approximately $396.7 million from the offering allocated to the development of a property in San Francisco certified as LEED Platinum and the acquisition of two properties certified as LEED Silver. In 2021, the Company issued a second green bond, and the net proceeds of approximately $497.5 million from this offering are intended to be allocated to the development or acquisition of green buildings and/or investments in renewable energy, energy efficiency and sustainable water management. Additionally, during 2021, the Company began funding its $10.0 million investment in a new fund focused on early stage sustainability and climate change mitigation technology relevant to the built environment.
We are also intensely focused on the “Social” and “Governance” aspects of ESG. As detailed below, we have a commitment to our employees’ engagement, diversity and inclusion and wellness that is the foundation of our corporate purpose. We also recognize that a successful company must incorporate the best corporate governance practices in order to better serve its stakeholders.
For additional information regarding our ESG efforts, see our 2021 Environmental, Social and Governance Report at our website, www.equityapartments.com. This report, which includes Sustainability Accounting Standards Board disclosures and incorporates recommendations from the Task Force on Climate-related Financial Disclosures, was reviewed and approved by the Corporate Governance Committee of our Board of Trustees, which monitors the Company’s ongoing ESG efforts. We continue to enhance our ESG disclosure efforts, including auditing the results outlined in the above report. Furthermore, our annual proxy statements contain additional information on our ESG efforts, including detailed information regarding our corporate governance practices. Such annual proxy statements and the information contained therein are not part of or incorporated into this report, except as otherwise provided herein.
Human Capital
At Equity Residential, our team of approximately 2,400 employees is the driving force behind our success. We believe that our richly diverse work environment captures top talent, cultivates the best ideas and creates the widest possible platform for this success in line with our corporate purpose of “Creating communities where people thrive”. Our core principles, affectionately named “Ten Ways to Be a Winner”, guide our behavior as individuals and collectively as a team, helping us in our goal to deliver market-leading performance. As part of our Ten Ways to Be a Winner, we encourage our team members to raise questions, take educated risks, offer new ideas and help us make the right decisions. One way we live the “Ten Ways” is by enriching our culture through our core “Equity Values: Diversity & Inclusion, Social Responsibility, Sustainability and Total Wellbeing”. We have assembled a cross-functional employee-led Equity Values Council to lead our efforts on these values by acting as change agents to drive initiatives,
8
create goals and awareness, and encourage colleagues to participate in community service activities and wellness initiatives. In addition, executive compensation is based, in part, on meeting important Equity Values goals, and our Board of Trustees, primarily through its Compensation Committee, takes an active role in overseeing our efforts in this regard.
Diversity and Inclusion
|
|
• |
Our commitment to diversity and inclusion starts with a highly skilled and diverse Board of Trustees. |
|
|
• |
We are committed to hiring a diverse workforce and also fostering a safe, inclusive and productive workplace for all employees. We believe providing a work environment based on respect, trust and collaboration creates an exceptional employee experience where employees can bring their whole selves to work and thrive in their careers. In recent years, we have created dedicated Diversity and Inclusion staffing to oversee this crucial work. |
|
|
• |
To further prioritize the importance of our diversity and inclusion efforts, our executives’ annual compensation goals include an evaluation of objective metrics measuring our Company’s progress in this regard. |
|
|
• |
We have the benefit of a diverse workforce, of which 62.0% currently identify as ethnically diverse. We also continue to focus on improving our female representation, which is now 36.0% of our workforce. |
|
|
• |
A diversity and inclusion lens is embedded in our talent review process. This includes the development of our Overcoming Bias in Performance Review Toolkit designed to provide practical bias interrupters and tweaks to the performance evaluation process that interrupt and correct unconscious bias. |
|
|
• |
We strategically identify opportunities to increase the diversity of our talent pipeline at all levels, including by actively seeking to source a pool of diverse candidates for mid-management and above positions in the communities where we serve, such as from Project Destined, Fannie Mae’s Future Housing Leaders, Howard University, Roosevelt University, International Rescue Committee and Evanston Scholars. |
|
|
• |
We employ interns from the Development School for Youth and local colleges to provide pathways for students of various backgrounds interested in real estate. |
|
|
• |
The Company was named the Gold Nareit 2021 Diversity, Equity and Inclusion award recipient in recognition of the Company’s demonstration of a strong commitment to the advancement of diversity and inclusion both within the Company and in the REIT and publicly traded real estate industry. |
Pay Equity
|
|
• |
In order to attract and retain the best employees, we are committed to providing a total compensation package which is market-based, performance driven, fair and internally equitable. |
|
|
• |
Our goal is to be competitive both within the general employment market as well as with our competitors in the real estate industry, with our strongest performers being paid more. |
|
|
• |
Base pay is reviewed annually, as is Equity Residential’s compensation framework, by partnering with managers to create and update job descriptions that reflect the duties, skills, experience and education required to perform the role, and then benchmarking our jobs against third-party compensation surveys to determine the market value of the job. |
|
|
• |
During the year-end evaluation process, managers review and calibrate compensation for all employees on their team, in an effort to ensure equity around our pay practices and allow us to retain and reward our top talent. |
Employee Engagement
|
|
• |
Employee engagement and experience are extremely important at Equity Residential. In 2021, we transitioned to a new Employee Experience (EX) Survey, measuring employee engagement and diversity & inclusion, among other components of the employee experience. |
|
|
• |
Our 2021 engagement score of 79% favorability is very strong, especially given the pandemic and uncertainty surrounding it. Our Diversity & Inclusion Index score of 83% demonstrated an increase in employee favorability for the initiatives taking place and a greater sense of belonging. |
|
|
• |
Senior leaders are assessed annually on their leadership results, which for 2021 were measured by a pulse survey score, employee retention and diversity and inclusion efforts. |
Training and Development
|
|
• |
We believe a successful workplace is one where employees constantly learn and grow. Our internal Organization and Talent Development (“OTD”) team is interspersed throughout our markets and works regularly with employees to expand their knowledge and skills. OTD develops and delivers a wide range of training and development opportunities, from tactical to strategic, face-to-face to virtual, social learning to self-directed learning, and more. In 2021, each employee |
9
|
|
completed an average of approximately 15 hours of dedicated learning at a Company expenditure of approximately $1,200 per employee. |
Health, Safety and Wellness
|
|
• |
Equity Residential is committed to providing the tools and resources to help our employees achieve total wellbeing. Whether physical, financial, career, social or community wellbeing, Equity Residential offers benefits to help meet our employee needs. |
|
|
• |
Physical Wellbeing: Equity Residential is focused on providing benefits that help our employees achieve balance and address good health proactively, with coverage for emergencies and ongoing needs that can arise as well. Long before healthcare reform, Equity Residential made a commitment to cover 100% of employee preventive care. This commitment—and our robust and highly popular wellness program—has made proactive personal healthcare more accessible and manageable for employees, while encouraging ongoing healthy behaviors and rewarding employees for taking a proactive approach to their health. During the COVID-19 pandemic, we held 2020 healthcare premiums flat for employees in 2021 in support of a holistic total rewards strategy. |
|
|
• |
Financial Wellbeing: These benefits and resources help our employees manage their money better today, while preparing for financial milestones and retirement in the future. Financial peace of mind is at the core of these offerings, whether it’s our generous 401(k) match, basic and supplemental insurance to ensure our loved ones and possessions are cared for, rent discounts at our properties or additional savings and investment options like our employee share purchase plan. |
|
|
• |
Career Wellbeing: When employees move up in skill and experience, so does Equity Residential. We encourage our employees to Test their Limits, push the boundaries of their comfort zones and seek new challenges through several learning resources and courses, in addition to tuition reimbursement. We actively promote from within, and many senior corporate and property leaders have risen from entry level or junior positions. |
|
|
• |
Social and Community Wellbeing: We offer a number of benefits that foster social and community wellbeing, including paid time off to volunteer in our communities. |
|
|
• |
Throughout the COVID-19 pandemic, we have communicated regularly with employees and also released a comprehensive guide designed as a single place for employees to access information on critical benefits and resources. A key focus included mental wellbeing to help employees better cope with the challenges to our work routines, our home routines and how we interact with our family, friends and community. We also continued to ensure that our employees had access to personal protective equipment and cleaning supplies as needed throughout the pandemic. |
|
|
• |
In October 2021, as an effort to do our part in the prevention and severity of the COVID-19 pandemic, we introduced our COVID-19 Health & Safety Requirement Policy requiring all employees to be fully vaccinated (or receive an approved accommodation) by January 13, 2022. When implementing this new policy, we took great care by supporting each employee in their decision-making process and providing additional resources, including access to medical professionals. Our efforts resulted in a compliance and employee retention rate of 99%. |
|
|
• |
For nearly three years, we have partnered with Employees1st to provide financial relief via a crisis fund for employees struck by personal hardships or unforeseen disasters. The Company contributed additional funds to the Employees1st crisis fund to further support employees who experienced hardship as a result of the ongoing COVID-19 pandemic. We are proud that this program allows yet another avenue for us to tangibly demonstrate our One Team culture by ensuring that employees are safe and secure, especially during extreme or catastrophic circumstances. |
Competition
All of the Company’s properties are located in developed areas with multiple housing choices, including other multifamily properties. The number of competitive housing choices or multifamily properties in a particular area could have a material effect on the Company’s ability to lease apartment units at its properties and on the rents charged. The Company may be competing with other housing providers that have greater resources than the Company and whose managers have more experience than the Company’s managers. In addition, other forms of rental properties and single-family housing provide housing alternatives to potential residents of multifamily properties. See Item 1A, Risk Factors, for additional information with respect to competition.
Regulatory Considerations
See Item 1A, Risk Factors, for information concerning the potential effects of governmental regulations, including environmental regulations, on our operations.
10
Item 1A. Risk Factors
General
This Item 1A includes forward-looking statements. You should refer to our discussion of the qualifications and limitations on forward-looking statements included in Item 7, Management’s Discussion and Analysis of Financial Condition and Results of Operations.
The occurrence of the events discussed in the following risk factors could adversely affect, possibly in a material manner, our business, financial condition or results of operations, which could affect the value of our common shares of beneficial interest or preferred shares of beneficial interest (which we refer to collectively as “Shares”), Preference Units, OP Units, restricted units and our public unsecured debt. In this section, we refer to the Shares, Preference Units, OP Units, restricted units and public unsecured debt together as our “securities” and the investors who own such securities as our “security holders.”
Risks Related to the ongoing COVID-19 Pandemic
The ongoing COVID-19 pandemic and the pace and degree of recovery, as well as the emergence of new variants, could have a material adverse effect on our business, results of operations, cash flows and financial condition.
During the early stages of the COVID-19 pandemic, governments and other authorities around the world, including federal, state and local authorities in the United States, imposed measures intended to control its spread, including restrictions on movement and business operations such as travel bans, border closings, business closures, quarantines, social distancing and shelter-in-place orders. While many of the most stringent restrictions have been removed throughout our markets, the ongoing COVID-19 pandemic has caused, and could continue to cause, severe economic, market and other disruptions worldwide. There can be no assurance that conditions will not deteriorate as a result of the pandemic.
The impact of the COVID-19 pandemic could materially negatively impact our business, results of operations, financial condition and liquidity in a number of ways, including:
|
|
• |
A decrease in our rental revenues or increase in related reserves and write-offs as a potential result of: |
|
|
• |
The deterioration of global economic conditions as a result of the pandemic, which could ultimately decrease occupancy levels and pricing across our portfolio, reduce or defer our residents’ spending, or negatively impact our residents’ and tenants’ ability to pay their rent on time or at all; |
|
|
• |
Reductions in the demand for multifamily properties within our markets due to changes in resident preferences (including changes resulting from increased employer flexibility to work from home), economic disruptions due to delays in business re-openings or required re-closures, and other factors impacting demand; |
|
|
• |
Elevated costs or concessions required to attract or retain new and existing residents/tenants, release units due to resident or tenant nonpayment, default, or bankruptcy, or other incentives that may be less favorable to us than those that are currently in place; |
|
|
• |
Local and national authorities expanding or extending certain measures that impose restrictions on our ability to enforce residents’ or tenants’ contractual rental obligations (such as eviction moratoriums or rental forgiveness) and limit our ability to raise rents or charge certain fees; |
|
|
• |
Failure by local and national authorities to extend, adequately fund or administer government stimulus and relief programs which may be providing or would provide benefits to our residents (or employers of our residents) and tenants; and |
|
|
• |
Restrictions inhibiting our employees’ ability to meet with existing and potential residents, which has disrupted and could in the future further disrupt our ability to lease apartments and could adversely impact our rental rate and occupancy levels. |
|
|
• |
Our properties may also incur additional operating expenses related to the ongoing pandemic, such as higher cleaning or other related costs; |
|
|
• |
The risk that our access to capital at attractive terms may be diminished due to, among other factors: (i) potential disruptions in the long-term debt and commercial paper markets; (ii) the risk that a prolonged economic slowdown or recession could negatively impact our lending counterparties; and (iii) reductions in the Company’s credit ratings as a result of a protracted and more severe deterioration in our operations due to the pandemic; |
11
|
|
• |
The risk of a prolonged outbreak and/or multiple waves of an outbreak of the pandemic: |
|
|
a) |
could cause long-term damage to economic conditions, which in turn could cause material declines in the fair value of our assets, leading to asset impairment charges; and, |
|
|
b) |
could cause an adverse impact on our future financial results, cash flows and financial condition and therefore our ability to pay dividends; |
|
|
• |
A general decline in the real estate market or demand for real estate transactions could hinder our ability to acquire or dispose of properties, or obtain financing to develop properties, including through our joint ventures; |
|
|
• |
The risk of delays in our development and renovation projects due to construction moratoriums, governmental movement restrictions, social distancing requirements, the closure of many permitting and inspection agencies and disruptions in the supply of labor or the supply of construction materials or other products due to problems in the broader supply chain or otherwise; |
|
|
• |
A possible decline in the price of our common shares due to a prolonged economic recession or other impacts described herein; |
|
|
• |
Increased risks of potential cyber attacks due to an increased reliance on remote working and other electronic interactions with our current and prospective residents; and |
|
|
• |
Potential inability to maintain adequate staffing at our properties and corporate/regional offices due to an outbreak at one or more of our properties or corporate/regional offices and/or the continued duration or expansion of the pandemic. |
The extent of the ongoing COVID-19 pandemic’s effect on our operational and financial performance will depend on future developments, including the duration, spread and intensity of COVID-19 and its variants; the distribution, effectiveness and acceptance of vaccines and testing; and the pace and degree of recovery from the pandemic, all of which are uncertain and difficult to predict. To the extent the COVID-19 pandemic adversely affects our business, results of operations, cash flows and financial condition, it may also continue to heighten many of the other risks described below.
Risks Related to our Business Strategy
Investing in real estate is inherently subject to risks that could negatively impact our business.
Investing in real estate is subject to varying degrees and types of risk. While we seek to mitigate these risks through various strategies, including geographic diversification, market research and proactive asset management, among other techniques, these risks cannot be eliminated. Factors that may impact cash flows and real estate values include, but are not limited to:
|
|
• |
Local economic conditions, particularly oversupply or reductions in demand; |
|
|
• |
National, regional and local political and regulatory climates, governmental fiscal health and governmental policies; |
|
|
• |
The inability or unwillingness of residents to pay rent increases; |
|
|
• |
Increases in our operating expenses due to inflationary or other pressures; |
|
|
• |
Cost and availability of labor and materials required to maintain our properties at acceptable standards; |
|
|
• |
Availability of attractive financing opportunities; |
|
|
• |
Changes in social preferences; and |
|
|
• |
Additional risks that are discussed below. |
The geographic concentration of our properties could have an adverse effect on our operations.
While the Company continues to diversify its portfolio with the addition of the expansion markets, the Company’s properties are still predominantly concentrated in our established coastal markets. If one or more of these markets is unfavorably impacted by specific economic conditions, local real estate conditions, increases in social unrest, increases in real estate and other taxes, reduced quality of life, deterioration of local or state government health, rent control or stabilization laws, localized environmental issues or natural/man-made disasters, the impact of such conditions may have a more negative impact on our results of operations than if our properties were more geographically diverse.
Within its markets, the Company is also predominantly concentrated in certain dense urban and suburban submarkets. To the extent that these markets or submarkets within these markets become less desirable to operate in, including changes in multifamily housing supply and demand, our results of operations could be more negatively impacted than if we were more diversified within our markets or invested in a greater number of markets.
12
Competition in multifamily housing may negatively affect operations and demand for the Company’s properties or residents.
Our properties face competition for residents from other existing or new multifamily properties, condominiums, single family homes and other living arrangements, whether owned or rental, that may attract residents from our properties or prospective residents that would otherwise choose to live with us. As a result, we may not be able to renew existing resident leases or enter into new resident leases, or if we are able to renew or enter into new leases, they may be at rates or terms that are less favorable than our current rates or terms, resulting in a material impact on our results of operations.
Additionally, our properties face competition for residents as a result of technology innovation. Therefore, we may not be able to retain residents or attract new residents if we are unable to identify and cost effectively implement new, relevant technologies and keep up with constantly changing resident demand for the latest innovations.
The short-term nature of apartment leases exposes us more quickly to the effects of declining market rents, potentially making our results of operations and cash flows more volatile.
Generally, our residential apartment leases are for twelve months or less. If the terms of the renewal or releasing are less favorable than current terms, then the Company’s results of operations and financial condition could be negatively affected. Given our generally shorter-term lease structure, our rental revenues are impacted by declines in market rents more quickly than if our leases were for longer terms. In addition, operating expenses associated with each property, such as real estate taxes, insurance, utilities, maintenance costs and employee wages and benefits, may not decline as quickly or at the same rate as revenues when circumstances might cause a reduction of those revenues at our properties.
Competition for acquisitions may prevent us from acquiring properties on favorable terms.
We may not be successful in pursuing acquisition and development opportunities. We expect that other real estate investors will compete with us for attractive investment opportunities or may also develop properties in markets where we focus our development and acquisition efforts. We may not be in a position or have the opportunity in the future to make suitable property acquisitions on favorable terms.
Operations from new acquisitions, development projects and renovations may fail to perform as expected.
We intend to actively acquire, develop and renovate multifamily operating properties as part of our business strategy. Newly acquired, developed or renovated properties may not perform as we expect. We may overestimate the revenue (or underestimate the expenses) that these new or repositioned properties may generate. The occupancy rates and rents at these properties may also fail to meet our expectations for these investments. We may also underestimate the costs necessary to operate an acquired or developed property to the standards established for its intended market position. Land parcels acquired for development may lose significant value prior to the start of construction. Development and renovations are subject to even greater uncertainties and risks due to the complexities and lead time to build or complete these projects. We may also underestimate the costs to complete a development property or to complete a renovation.
Construction risks on our development projects could affect our profitability.
We intend to continue to develop multifamily properties through both wholly owned and joint venture arrangements as part of our business strategy. Development often includes long planning and entitlement timelines, subjecting the project to changes in market conditions. It can involve complex and costly activities, including significant environmental remediation or construction work in our markets. We may also experience an increase in costs due to general disruptions that affect the cost of labor and/or materials, such as supply chain disruptions, trade disputes, tariffs, labor unrest, geopolitical conflicts or other factors that create inflationary pressures. We may abandon opportunities that we have already begun to explore for a number of reasons, and as a result, we may fail to recover expenses or option payments already incurred in exploring those opportunities. We may also be unable to obtain, or experience delays in obtaining, necessary zoning, occupancy, or other required governmental or third-party permits and authorizations. These and other risks inherent in development projects, including the joint venture risks noted below. could result in increased costs or the delay or abandonment of opportunities.
13
Because real estate investments are illiquid, we may not be able to sell properties when appropriate.
Real estate investments often cannot be sold quickly due to regulatory constraints, market conditions or otherwise. As a result, we may not be able to reconfigure our portfolio, including the diversification of our portfolio into the expansion markets, as promptly as planned or in response to changing economic or other conditions. We may also be unable to consummate dispositions in a timely manner, on attractive terms, or at all. The capitalization rates/disposition yields at which properties may be sold could also be higher than historic rates, thereby reducing our potential proceeds from sale. In some cases, we may also determine that we will not recover the carrying amount of the property upon disposition. This inability to reallocate our capital promptly could negatively affect our financial condition, including our ability to make distributions to our security holders.
We are subject to risks involved in real estate activity through joint ventures.
We currently, and may continue to in the future, develop and acquire properties in joint ventures with unrelated third parties. Joint ventures create risks including the following:
|
|
• |
The possibility that our partners might refuse or be financially unable to make capital contributions when due or may fail to meet contractual obligations to cover development cost overruns and therefore we may be forced to make contributions to protect our investments; |
|
|
• |
These projects generally use mortgage debt to finance their activities at a higher leverage level than how we finance the Company as a whole; |
|
|
• |
We may be responsible to our partners for indemnifiable losses; |
|
|
• |
Our partners might at any time have business or economic goals that are inconsistent with ours; and |
|
|
• |
Our partners may be in a position to take action or withhold consent contrary to our recommendations, instructions or requests. |
At times we have entered into agreements providing for joint and several liability with our partners. We also have in the past and could choose in the future to guarantee part of or all of certain joint venture debt. We and our respective joint venture partners may each have the right to trigger a buy-sell arrangement that could cause us to sell our interest, or acquire our partner's interest, at a time or price that is unfavorable to us. To the extent we have commitments to, on behalf of or are dependent on any such off-balance sheet commitments, or if those commitments or their properties or leases are subject to material contingencies, our liquidity and financial condition could be adversely affected.
In some instances, our joint venture partners may also have competing interests or objectives that could create conflicts of interest similar to those noted above. These objectives may be contrary to our compliance with the REIT requirements, and our REIT status could be jeopardized if any of our joint ventures do not operate in compliance with those requirements. To the extent our partners do not meet their obligations to us or our joint ventures, or they take actions inconsistent with the interests of the joint venture, it could have a negative effect on our results of operations and financial condition, including distributions to our security holders.
The Company’s real estate assets may be subject to impairment charges.
A decline in the fair value of our assets may require us to recognize an impairment against our assets under accounting principles generally accepted in the United States (“GAAP”) if we were to determine that, with respect to any assets in unrealized loss positions, we do not have the ability and intent to hold such assets for a period of time sufficient to allow for recovery of the depreciated cost of such assets. If such a determination were to be made, we would recognize unrealized losses through earnings and write-down the depreciated cost of such assets to a new cost basis, based on the fair value of such assets on the date they are considered to be impaired. Such impairment charges reflect non-cash losses at the time of recognition; subsequent disposition or sale of such assets could further affect our future losses or gains, as they are based on the difference between the sale price received and adjusted amortized cost of such assets at the time of sale. If we are required to recognize material asset impairment charges in the future, these charges could adversely affect our financial condition and results of operations.
Corporate social responsibility, specifically related to ESG, may impose additional costs and expose us to new risks.
Environmental sustainability, social and governance evaluations remain highly important to some investors and other stakeholders. Certain organizations that provide corporate governance and other corporate risk advisory services to investors have developed scores and ratings to evaluate companies and investment funds based upon ESG metrics. Many investors focus on positive ESG-related business practices and scores when choosing to allocate their capital and may consider a company's score as a reputational or other factor in making an investment decision. Investors' increased focus and activism related to ESG and similar matters may constrain our business operations or increase expenses or capital expenditures. In addition, investors may decide to
14
refrain from investing in us as a result of their assessment of our approach to and consideration of ESG factors. We may face reputational damage in the event our corporate responsibility procedures or standards do not meet the standards set by various constituencies. Although we have generally scored highly in these metrics to date, there can be no assurance that we will continue to score highly in the future. In addition, the criteria by which companies are rated for ESG efforts may change, which could cause us to receive lower scores than in previous years. A low ESG score could result in a negative perception of the Company, exclusion of our securities from consideration by certain investors who may elect to invest with our competition instead and/or cause investors to reallocate their capital away from the Company, all of which could have an adverse impact on the price of our securities.
Risks Related to our Financing Strategy and Capital Structure
Disruptions in the financial markets could hinder our ability to obtain debt and equity financing and impact our acquisitions and dispositions.
Dislocations and disruptions in capital markets could result in increased costs or lack of availability of debt financing (including under our commercial paper program) and equity financing. Such events may affect our ability to refinance existing debt, require us to utilize higher cost alternatives and/or impair our ability to adjust to changing economic and business conditions. Capital market disruptions could negatively impact our ability to make acquisitions or make it more difficult or not possible for us to sell properties or may unfavorably affect the price we receive for properties that we do sell. Such disruptions could cause the price of our securities to decline.
Changes in market conditions and volatility of share prices could decrease the market price of our Common Shares.
The stock markets, including the New York Stock Exchange on which we list our Common Shares, have experienced significant price and volume fluctuations over time. As a result, the market price of our Common Shares could be similarly volatile. Investors in our Common Shares consequently may experience a decrease in the value of their shares, including decreases due to this volatility and not necessarily related to our operating performance or prospects. Additionally, the market price of our Common Shares may decline or fluctuate significantly in response to the sale of substantial amounts of our Common Shares, or the anticipation of the sale of such shares, by large holders of our securities, as well as our inclusion or exclusion from stock indices. The issuance of additional Common Shares by the Company, or the perception that such issuances might occur, could also cause significant volatility and decreases in the value of our shares.
Our financial counterparties may not perform their obligations.
Although we have not experienced any material counterparty non-performance, disruptions in financial and credit markets or other events could impair the ability of our counterparties to perform under their contractual obligations to us. There are multiple financial institutions that are individually committed to provide borrowings under our revolving credit facility. Should any of these institutions fail to perform their obligations when contractually required, our financial condition could be adversely affected.
Rising interest rates can increase costs and impact the value of the Company’s assets.
The Company is exposed to market risk from financial instruments primarily from changes in market interest rates. Such risks derive from the refinancing of debt, exposure to interest rate fluctuations in floating rate debt and from derivative instruments utilized to swap fixed rate debt to floating rates or to hedge rates in anticipation of future debt issuances. Increases in interest rates would increase our interest expense and the costs of refinancing existing debt. Higher interest rates could also result in increased capitalization rates, which may lead to reduced valuations of the Company’s assets.
Insufficient cash flow could affect our ability to service existing debt and create refinancing risk.
We are subject to risks normally associated with debt financing, including the risk that our cash flow will be insufficient to meet required payments. We may not be able to refinance existing debt and if we can, the terms of such refinancing may be less favorable than the terms of existing indebtedness. Our inability to refinance, extend or repay debt with proceeds from other capital market transactions would negatively impact our financial condition. If the debt is secured, the mortgage holder may also foreclose on the property.
A significant downgrade in our credit ratings could adversely affect our performance.
A significant downgrade in our credit ratings, while not affecting our ability to draw proceeds under the Company’s revolving credit facility, would cause the corresponding borrowing costs to increase, impact our ability to borrow secured and unsecured debt, and potentially impair our ability to access the commercial paper market or otherwise limit our access to capital. In addition, a
15
downgrade below investment grade would likely cause us to lose access to the commercial paper markets and would require us to post cash collateral and/or letters of credit in favor of some of our secured lenders to cover our self-insured property and liability insurance deductibles or to obtain lower deductible insurance compliant with the lenders’ requirements at the lower ratings level.
Financial covenants could limit operational flexibility and affect our overall financial position.
The terms of our credit agreements, including our revolving credit facility and the indentures under which a substantial portion of our unsecured debt was issued, require us to comply with a number of financial covenants. These covenants may limit our flexibility to run our business and breaches of these covenants could result in defaults under the instruments governing the applicable indebtedness and trigger a cross default of other debt.
Some of our properties are financed with tax-exempt bonds or otherwise contain restrictive covenants or deed restrictions, including affordability requirements, which limit income from certain properties. The Company monitors compliance with the restrictive covenants and deed restrictions that affect these properties. While we generally believe that the interest rate benefit from financing properties with tax-exempt bonds more than outweighs any loss of income due to restrictive covenants or deed restrictions, this may not always be the case. Some of these requirements are complex, and our failure to comply with them may subject us to material fines or liabilities.
We may change the dividend policy for our securities in the future.
The decision to declare and pay dividends on our securities, as well as the timing, amount and composition of any such future dividends, is at the discretion of the Board of Trustees and will depend on actual and projected financial conditions, the Company’s actual and projected liquidity and operating results, the Company’s projected cash needs for capital expenditures and other investment activities and such other factors as the Company’s Board of Trustees deems relevant. The Board of Trustees may modify our dividend policy from time to time and any change in our dividend policy could negatively impact the market price of our securities.
Issuances or sales of our Common Shares or Units may be dilutive.
Any additional issuance of Common Shares or Units would reduce the percentage of our Common Shares and Units owned by existing investors. In most circumstances, shareholders and unitholders will not be entitled to vote on whether or not we issue additional Common Shares or Units. In addition, depending on the terms and pricing of additional offerings of our Common Shares or Units along with the value of our properties, our shareholders and unitholders could experience dilution in both the book value and fair value of their Common Shares or Units, as well as dilution in our actual and expected earnings per share, funds from operations (“FFO”) per share and Normalized FFO per share.
Regulatory and Tax Risks
The adoption of, or changes in, rent control or rent stabilization regulations and eviction regulations in our markets could have an adverse effect on our operations and property values.
A growing number of state and local governments have enacted and may continue to consider enacting and/or expanding rent control, rent stabilization or other regulations, which limit or could continue to limit our ability to raise rents or charge certain fees, either of which could have a retroactive effect. We continue to see increases in governmental entities considering or being urged by advocacy groups to consider rent forgiveness, rent control or rent stabilization regulations or expand coverage of existing regulations in our markets. These regulations may also make changes to and/or expand eviction and other tenants’ rights regulations that may limit our ability to enforce residents’ or tenants’ contractual rental obligations (such as eviction moratoriums), pursue collections or charge certain fees, which could have an adverse impact on our operations and property values.
Compliance or failure to comply with regulatory requirements could result in substantial costs.
Our properties are subject to various federal, state and local regulatory requirements, such as state and local fire and life safety requirements, building and zoning codes, environmental and other ESG regulations, and federal, state and local accessibility requirements, including and in addition to those imposed by the Americans with Disabilities Act and the Fair Housing Act. Noncompliance could result in fines, subject us to lawsuits and require us to remediate or repair the noncompliance. Existing requirements could change and compliance with future requirements may require significant unanticipated expenditures that could adversely affect our financial condition or results of operations.
Environmental problems are possible and can be costly.
Federal, state and local laws and regulations relating to the protection of the environment may require current or previous owners or operators of real estate to investigate and clean up hazardous or toxic substances at such properties. The owner or operator
16
may have to pay a governmental entity or third parties for property damage and for investigation and clean-up costs incurred by such parties in connection with the contamination. These laws typically impose clean-up responsibility and liability without regard to whether the owner or operator knew of or caused the presence of the contaminants. Even if more than one person may have been responsible for the contamination, each person covered by the environmental laws may be held responsible for all of the clean-up costs incurred. Third parties may also sue the owner or operator of a site for damages and costs resulting from environmental contamination emanating from that site. We cannot be assured that existing environmental assessments of our properties reveal all environmental liabilities, that any prior owner of any of our properties did not create a material environmental condition not known to us, or that a material environmental condition does not otherwise exist as to any of our properties.
Changes in U.S. accounting standards may materially and adversely affect the reporting of our operations.
The Company follows GAAP, which is established by the Financial Accounting Standards Board (“FASB”), an independent body whose standards are recognized by the Securities and Exchange Commission (“SEC”) as authoritative for publicly held companies. The FASB and the SEC create and interpret accounting standards and may issue new accounting pronouncements or change the interpretation and application of these standards that govern the preparation of our financial statements. These changes could have a material impact on our reported consolidated results of operations and financial position.
Any weaknesses identified in our internal control over financial reporting could result in a decrease of our share price.
Section 404 of the Sarbanes-Oxley Act of 2002 requires us to evaluate and report on our internal control over financial reporting. If we identify one or more material weaknesses in our internal control over financial reporting, we could lose investor confidence in the accuracy and completeness of our financial reports, which in turn could have a negative impact on our share price.
Our failure to qualify as a REIT would have serious adverse consequences to our security holders.
We plan to continue to meet the requirements for taxation as a REIT. Many of these requirements, for which there is limited judicial and administrative interpretation, however, are highly technical and complex. Therefore, we cannot guarantee that we have qualified or will qualify as a REIT in the future. The determination that we are a REIT requires an analysis of various factual matters that may not be totally within our control. To qualify as a REIT, our assets must be substantially comprised of real estate assets as defined in the Internal Revenue Code of 1986, as amended (the “Code”), and related guidance and our gross income must generally come from rental and other real estate or passive related sources that are itemized in the REIT tax laws. We are also required to distribute to security holders at least 90% of our REIT taxable income excluding net capital gains.
If we fail to qualify as a REIT, we would be subject to U.S. federal income tax at regular corporate rates and would have to pay significant income taxes unless the Internal Revenue Service (“IRS”) granted us relief under certain statutory provisions. In addition, we would remain disqualified from taxation as a REIT for four years following the year in which we failed to qualify as a REIT. We would therefore have less money available for investments or for distributions to security holders and would no longer be required to make distributions to security holders. This would likely have a significant negative impact on the value of our securities.
In addition, certain of our subsidiary entities have elected to be taxed as REITs. As such, each must separately satisfy all of the requirements to qualify for REIT status. If a subsidiary REIT did not satisfy such requirements, and certain relief provisions did not apply, it would be taxed as a regular corporation and its income would be subject to U.S. federal income taxation. Failure to comply with these complex REIT rules at the subsidiary REIT level can have a material and detrimental impact to EQR’s REIT status.
Gain on disposition of assets held for sale in the ordinary course of business is subject to 100% tax.
Any gain resulting from transfers of properties we hold as inventory or primarily for sale to customers in the ordinary course of business is treated as income from a prohibited transaction subject to a 100% penalty tax unless certain safe harbor exceptions set forth in the Code apply. We do not believe that our transfers or disposals of property are prohibited transactions. However, whether property is held for investment purposes is a question that depends on all the facts and circumstances surrounding the particular transaction. The IRS may contend that certain transfers or dispositions of properties by us or contributions of properties are prohibited transactions. While we believe the IRS would not prevail in any such dispute, if the IRS were to argue successfully that a transfer or disposition of property constituted a prohibited transaction, we would be required to pay a 100% penalty tax on any gain allocable to us from the prohibited transaction. In addition, income from a prohibited transaction might adversely affect our ability to satisfy the income tests for qualification as a REIT.
17
We may be subject to legislative or regulatory tax changes that could negatively impact our financial condition.
At any time, U.S. federal income tax laws governing REITs or impacting real estate or the administrative interpretations of those laws may be enacted or amended. We cannot predict if or when any new U.S. federal income tax law, regulation or administrative interpretation, or any amendment to any existing U.S. federal income tax law, IRS and U.S. Department of Treasury regulations or other administrative guidance, will be adopted or become effective and any such law, regulation or interpretation may take effect retroactively. The Company and our shareholders could be negatively impacted by any such change in, or any new, U.S. federal income tax law, regulations or administrative guidance.
Distribution requirements may limit our flexibility to manage our portfolio.
In order to maintain qualification as a REIT under the Code, a REIT must annually distribute to its shareholders at least 90% of its REIT taxable income, excluding the dividends paid deduction and net capital gains. To the extent the REIT does not distribute all its net capital gain, or distributes at least 90%, but less than 100% of its REIT taxable income, it will be required to pay regular U.S. federal income tax on the undistributed amount at corporate rates. In addition, we will be subject to a 4% nondeductible excise tax on amounts, if any, by which distributions we pay in any calendar year are less than the sum of 85% of our ordinary income, 95% of our net capital gains and 100% of our undistributed income from prior years. We may not have sufficient cash or other liquid assets to meet the 90% distribution requirement. We may be required from time to time, under certain circumstances, to accrue as income for tax purposes interest and rent earned but not yet received. We may incur a reduction in tax depreciation without a reduction in capital expenditures. Difficulties in meeting the 90% distribution requirement might arise due to competing demands for our funds or due to timing differences between tax reporting and cash distributions, because deductions may be disallowed, income may be reported before cash is received, expenses may have to be paid before a deduction is allowed or because the IRS may make a determination that adjusts reported income. In addition, gain from the sale of property may exceed the amount of cash received on a leverage-neutral basis. A substantial increase to our taxable income may reduce the flexibility of the Company to manage its portfolio through dispositions of properties other than through tax deferred transactions, such as Section 1031 exchanges, or cause the Company to borrow funds or liquidate investments on unfavorable terms in order to meet these distribution requirements. If we do not dispose of our properties through tax deferred transactions, we may be required to distribute the gain proceeds to shareholders or pay income tax. If we fail to satisfy the 90% distribution requirement and are unable to cure the deficiency, we would cease to be taxed as a REIT, resulting in substantial tax-related liabilities.
We have a share ownership limit for REIT tax purposes.
To remain qualified as a REIT for U.S. federal income tax purposes, not more than 50% in value of our outstanding Shares may be owned, directly or indirectly, by five or fewer individuals at any time during the last half of any year. To facilitate maintenance of our REIT qualification, our Declaration of Trust, subject to certain exceptions, prohibits ownership by any single shareholder of more than five percent of the lesser of the number or value of any outstanding class of common or preferred shares (the “Ownership Limit”). Absent an exemption or waiver granted by our Board of Trustees, securities acquired or held in violation of the Ownership Limit will be transferred to a trust for the exclusive benefit of a designated charitable beneficiary, and the security holder’s rights to distributions and to vote would terminate. A transfer of Shares may automatically be deemed void if it causes a person to violate the Ownership Limit. The Ownership Limit could delay or prevent a change in control and, therefore, could affect our security holders’ ability to realize a premium over the then-prevailing market price for their Shares. To reduce the ability of the Board to use the Ownership Limit as an anti-takeover device, the Company’s Ownership Limit requires, rather than permits, the Board to grant a waiver of the Ownership Limit if the individual seeking a waiver demonstrates that such ownership would not jeopardize the Company’s status as a REIT.
Tax elections regarding distributions may impact future liquidity of the Company or our shareholders.
Under certain circumstances we have made and/or may consider making in the future, a tax election to treat certain distributions to shareholders made after the close of a taxable year as having been distributed during such closed taxable year. This election, which is provided for in the Code, may allow us to avoid increasing our dividends or paying additional income taxes in the current year. However, this could result in a constraint on our ability to decrease our dividends in future years without creating risk of either violating the REIT distribution requirements or generating additional income tax liability. In addition, the Company may be required to pay interest to the IRS based on such a distribution.
In order to retain liquidity and continue to satisfy the REIT distribution requirements, the Company could issue shares rather than pay a dividend entirely in cash to shareholders. The IRS has published several rulings which have allowed REITs to offer shareholders the choice between shares or cash as a form of payment of a dividend (an “elective stock dividend”). However, REITs are generally required to structure the cash component to be no less than 20% of the total dividend paid. Therefore, it is possible that the total tax burden to shareholders resulting from an elective stock dividend may exceed the amount of cash received by the shareholder.
Inapplicability of Maryland law limiting certain changes in control.
Certain provisions of Maryland law applicable to REITs prohibit “business combinations” (including certain issuances of equity securities) with any person who beneficially owns ten percent or more of the voting power of outstanding securities, or with an
18
affiliate who, at any time within the two-year period prior to the date in question, was the beneficial owner of ten percent or more of the voting power of the Company’s outstanding voting securities (an “Interested Shareholder”), or with an affiliate of an Interested Shareholder. These prohibitions last for five years after the most recent date on which the Interested Shareholder became an Interested Shareholder. After the five-year period, a business combination with an Interested Shareholder must be approved by two super-majority shareholder votes unless, among other conditions, holders of common shares receive a minimum price for their shares and the consideration is received in cash or in the same form as previously paid by the Interested Shareholder for its common shares. As permitted by Maryland law, however, the Board of Trustees of the Company has opted out of these restrictions with respect to any business combination involving Sam Zell and certain of his affiliates and persons acting in concert with them. Consequently, the five-year prohibition and the super-majority vote requirements will not apply to a business combination involving us and/or any of them. Such business combinations may not be in the best interest of our security holders.
General Risk Factors
Risk of Pandemics or Other Health Crisis.
A pandemic, epidemic or other health crisis, similar to the ongoing outbreak of COVID-19, affecting areas where our properties, corporate/regional offices or major service providers are located could have an adverse effect on our business, results of operations, cash flows and financial condition.
The occurrence of cyber incidents, or a deficiency in our cybersecurity, could negatively impact our business by causing a disruption to our operations, a compromise or corruption of our confidential information, and/or damage to our reputation and business relationships, all of which could negatively impact our financial results.
A cyber incident is an intentional attack or an unintentional event that can include gaining unauthorized access to systems to disrupt payment collections and operations, corrupt data or steal confidential information, including information regarding our residents, prospective residents, employees and employees’ dependents.
Despite system redundancy, the implementation of security measures, required employee awareness training and the existence of a disaster recovery plan for our internal information technology systems, our systems and systems maintained by third-party vendors with which we do business are vulnerable to damage from any number of sources. We face risks associated with security breaches, whether through cyber attacks or cyber intrusions over the Internet, malware, computer viruses, attachments to emails, phishing attempts, ransomware or other scams, persons inside our organization or persons/vendors with access to our systems and other significant disruptions of our information technology networks and related systems, including property infrastructure. Our information technology networks and related systems are essential to the operation of our business and our ability to perform day-to-day operations. Even the most well-protected information, networks, systems and facilities remain potentially vulnerable because the techniques used in such attempted security breaches evolve and generally are not recognized until launched against a target, and in some cases are designed not to be detected and, in fact, may not be detected. Accordingly, we may be unable to anticipate these techniques or to implement adequate security barriers or other preventative measures, and thus it is impossible for us to entirely mitigate this risk.
We may periodically collect and store personally identifiable information of our residents and prospective residents in connection with our leasing activities, and we may collect and store personally identifiable information of our employees and their dependents. In addition, we often engage third-party service providers that may have access to such personally identifiable information in connection with providing necessary information technology, security and other business services to us. The systems of these third-party service providers may contain defects in design or other problems that could unexpectedly compromise personally identifiable information. Although we make efforts to maintain the security and integrity of our information technology networks and those of our third-party providers and we have implemented various measures to manage the risk of a security breach or disruption, there can be no assurance that our security efforts and measures will be effective or that attempted security breaches or disruptions would not be successful or damaging.
We address potential breaches or disclosure of this confidential personally identifiable information by implementing a variety of security measures intended to protect the confidentiality and security of this information including (among others): (a) engaging reputable, recognized firms to help us design and maintain our information technology and data security systems; (b) conducting periodic testing and verification of information and data security systems, including performing ethical hacks of our systems to discover where any vulnerabilities may exist; (c) providing periodic employee awareness training around phishing and other scams, malware and other cyber risks; and (d) systematically deleting personally identifiable information that no longer is required. The Company also has a cyber liability insurance policy to provide some coverage for certain risks arising out of data and network breaches and data privacy regulations which provides a policy aggregate limit and a per occurrence deductible. Cyber liability insurance generally covers, among other things, costs associated with the wrongful release, through inadvertent breach or network
19
attack, of personally identifiable information. However, there can be no assurance that these measures will prevent a cyber incident or that our cyber liability insurance coverage will be sufficient to cover our losses in the event of a cyber incident.
A breach or significant and extended disruption in the function of our systems, including our primary website, could damage our reputation and cause us to lose residents and revenues, result in a violation of applicable privacy and other laws, generate third-party claims, result in the unintended and/or unauthorized public disclosure or the misappropriation of proprietary, personally identifiable and confidential information and require us to incur significant expenses to address and remediate or otherwise resolve these kinds of issues. We may not be able to recover these expenses in whole or in any part from our service providers, our insurers or any other responsible parties. As a result, there can be no assurance that our financial results would not be negatively impacted.
We are also subject to laws, rules, and regulations in the United States, such as the California Consumer Privacy Act (“CCPA”), relating to the collection, use, and security of resident, customer, employee and other data. Evolving compliance and operational requirements under the CCPA and the privacy laws of other jurisdictions in which we operate may impose significant costs that are likely to increase over time. Our failure to comply with laws, rules, and regulations related to privacy and data protection could harm our business or reputation or subject us to fines and penalties.
The Audit Committee is primarily responsible for oversight of the risk management process related to cybersecurity and typically meets no less often than annually with Company information technology personnel to discuss recent trends in cyber risks and the Company’s strategy to defend its business systems and information against cyber attacks as well as the Company’s efforts to comply with data privacy laws such as the CCPA.
Our business and operations rely on specialized information technology systems, the failure of or inadequacy of which could impact our business.
Our ability to identify, implement and maintain appropriate information technology systems differentiates and creates competitive advantages for us in the operations of our business. These systems often are developed and hosted by third-party vendors whom we rely upon for ongoing maintenance, upgrades and enhancements. While we maintain a rigorous process around selecting appropriate information technology systems and partnering with vendors, our failure to adequately do so could negatively impact our operations and competitive position.
We depend on our key personnel.
We depend on the efforts of our trustees and executive officers. If one or more of them resign or otherwise cease to be employed by us, our business and results of operations and financial condition could be adversely affected.
Litigation risk could affect our business.
We may become involved in legal proceedings, claims, actions, inquiries and investigations in the ordinary course of business. These legal proceedings may include, but are not limited to, proceedings related to consumer, shareholder, securities, employment, environmental, development, condominium conversion, tort, eviction and commercial legal issues. Litigation can be lengthy and expensive, and it can divert management's attention and resources. Results cannot be predicted with certainty, and an unfavorable outcome in litigation could result in liability material to our financial condition or results of operations.
Insurance policies can be costly and may not cover all losses, which may adversely affect our financial condition or results of operations.
The Company’s property, general liability and workers compensation insurance policies provide coverage with substantial per occurrence deductibles and/or self-insured retentions. These self-insurance retentions can be a material portion of insurance losses in excess of the base deductibles. While the Company has previously purchased incremental insurance coverage in the event of multiple non-catastrophic occurrences within the same policy year, these substantial deductible and self-insured retention amounts do expose the Company to greater potential for uninsured losses and this additional multiple occurrences coverage may not be available at all or on commercially reasonable terms in the future. We believe the policy specifications and insured limits of these policies are adequate and appropriate; however, there are certain types of extraordinary losses which may not be adequately covered under our insurance program. As a result, our financial results could be adversely affected and may vary significantly from period to period.
The Company relies on third-party insurance providers for its property, general liability, workers compensation and other insurance, and should any of them experience liquidity issues or other financial distress, it could negatively impact their ability to pay claims under the Company’s policies.
20
Earthquake risk: Our policies insuring against earthquake losses have substantial deductibles which are applied to the values of the buildings involved in the loss. With the geographic concentration of our properties, a single earthquake affecting a market may have a significant negative effect on our financial condition and results of operations. We cannot assure that an earthquake would not cause damage or losses greater than insured levels. In the event of a loss in excess of insured limits, we could lose our capital invested in the affected property or market, as well as anticipated future revenue.
Terrorism risk: The Company has terrorism insurance coverage which excludes losses from nuclear, biological and chemical attacks. In the event of a terrorist attack impacting one or more of our properties, we could lose the revenues from the property, our capital investment in the property and possibly face liability claims from residents or others suffering injuries or losses.
Catastrophic weather and natural disaster risk: Our properties may be located in areas that could experience catastrophic weather and other natural disasters from time to time, including wildfires, snow or ice storms, hail, windstorms or hurricanes, drought, flooding or other severe disasters. These severe weather and natural disasters could cause substantial damages or losses to our properties which may not be covered or could exceed our insurance coverage. Exposure to this risk could also result in a decrease in demand for properties located in these areas or affected by these conditions.
Climate change risk: To the extent that significant changes in the climate occur in areas where our properties are located, we may experience severe weather, which may result in physical damage to or decrease the demand for properties located in these areas or affected by these conditions. Should the impact of climate change be material in nature, significant property damage or destruction of our properties could result. In addition, climate change could cause a significant increase in insurance premiums and deductibles or a decrease in the availability of coverage, either of which could expose the Company to even greater uninsured losses. Our financial condition or results of operations may be adversely affected. In addition, changes in federal, state and local legislation and regulation based on concerns about climate change could adversely impact the value of our properties or result in increased capital expenditures on our existing properties and our new development properties.
Provisions of our Declaration of Trust and Bylaws could inhibit changes in control.
Certain provisions of our Declaration of Trust and Bylaws may delay or prevent a change in control of the Company or other transactions that could provide the security holders with a premium over the then-prevailing market price of their securities or which might otherwise be in the best interest of our security holders. This includes the Ownership Limit described above. While our existing preferred shares/preference units do not have all of these provisions, any future series of preferred shares/preference units may have certain voting provisions that could delay or prevent a change in control or other transactions that might otherwise be in the interest of our security holders. Our Bylaws require certain information to be provided by any security holder, or persons acting in concert with such security holder, who proposes business or a nominee at an annual meeting of shareholders, including disclosure of information related to hedging activities and investment strategies with respect to our securities. These requirements could delay or prevent a change in control or other transactions that might otherwise be in the interest of our security holders. The Board of Trustees may use its powers to issue preferred shares and to set the terms of such securities to delay or prevent a change in control of the Company even if a change in control were in the interest of the security holders.
Item 1B. Unresolved Staff Comments
None.
Item 2. Properties
As of December 31, 2021, the Company, directly or indirectly through investments in title holding entities, owned all or a portion of 310 properties located in 10 states and the District of Columbia consisting of 80,407 apartment units. See Item 1, Business, for additional information regarding the Company’s properties and the markets/metro areas upon which we are focused. The Company’s properties are summarized by building type in the following table:
|
Type |
|
Properties |
|
|
Apartment Units |
|
|
Average Apartment Units |
|
|||
|
Garden |
|
|
96 |
|
|
|
24,489 |
|
|
|
255 |
|
|
Mid/High-Rise |
|
|
214 |
|
|
|
55,918 |
|
|
|
261 |
|
|
|
|
|
310 |
|
|
|
80,407 |
|
|
|
259 |
|
Garden-style are generally defined as properties with two and/or three story buildings while mid-rise/high-rise are generally defined as properties with greater than three story buildings. These two property types typically provide residents with amenities, such as rooftop decks and swimming pools, fitness centers and community rooms. In addition, many of our urban properties have non-residential components, such as parking garages and/or retail spaces.
21
The Company’s properties are summarized by ownership type in the following table:
|
|
|
Properties |
|
|
Apartment Units |
|
||
|
Wholly Owned Properties |
|
|
|
|
|
|
|
|
|
Partially Owned Properties – Consolidated |
|
|
|
|
|
|
|
|
|
|
|
|
|
|
|
|
|
|
The following table sets forth certain information by market relating to the Company’s properties at December 31, 2021:
|
Portfolio Summary |
|
|||||||||||||||
|
Markets/Metro Areas |
|
Properties |
|
|
Apartment Units |
|
|
% of Stabilized Budgeted NOI (1) |
|
|
Average Rental Rate (2) |
|
||||
|
Established Markets: |
|
|
|
|
|
|
|
|
|
|
|
|
|
|
|
|
|
Los Angeles |
|
|
66 |
|
|
|
15,259 |
|
|
|
18.6 |
% |
|
$ |
2,673 |
|
|
Orange County |
|
|
13 |
|
|
|
4,028 |
|
|
|
5.3 |
% |
|
|
2,427 |
|
|
San Diego |
|
|
11 |
|
|
|
2,706 |
|
|
|
3.7 |
% |
|
|
2,598 |
|
|
Subtotal – Southern California |
|
|
90 |
|
|
|
21,993 |
|
|
|
27.6 |
% |
|
|
2,619 |
|
|
|
|
|
|
|
|
|
|
|
|
|
|
|
|
|
|
|
|
San Francisco |
|
|
44 |
|
|
|
11,830 |
|
|
|
16.0 |
% |
|
|
2,957 |
|
|
Washington D.C. |
|
|
48 |
|
|
|
14,851 |
|
|
|
15.5 |
% |
|
|
2,358 |
|
|
New York |
|
|
36 |
|
|
|
9,343 |
|
|
|
13.7 |
% |
|
|
3,597 |
|
|
Boston |
|
|
27 |
|
|
|
7,170 |
|
|
|
11.4 |
% |
|
|
3,049 |
|
|
Seattle |
|
|
46 |
|
|
|
9,525 |
|
|
|
11.0 |
% |
|
|
2,332 |
|
|
|
|
|
|
|
|
|
|
|
|
|
|
|
|
|
|
|
|
Expansion Markets: |
|
|
|
|
|
|
|
|
|
|
|
|
|
|
|
|
|
Denver |
|
|
8 |
|
|
|
2,498 |
|
|
|
2.6 |
% |
|
|
2,197 |
|
|
Atlanta |
|
|
4 |
|
|
|
1,215 |
|
|
|
1.0 |
% |
|
|
1,935 |
|
|
Dallas/Ft. Worth |
|
|
4 |
|
|
|
1,241 |
|
|
|
0.8 |
% |
|
|
1,868 |
|
|
Austin |
|
|
3 |
|
|
|
741 |
|
|
|
0.4 |
% |
|
|
1,694 |
|
|
|
|
|
|
|
|
|
|
|
|
|
|
|
|
|
|
|
|
Total |
|
|
310 |
|
|
|
80,407 |
|
|
|
100.0 |
% |
|
$ |
2,696 |
|
Note: Projects under development are not included in the Portfolio Summary until construction has been completed.
|
(1) |
% of Stabilized Budgeted NOI - Represents original budgeted 2022 NOI for stabilized properties and projected annual NOI at stabilization (defined as having achieved 90% occupancy for three consecutive months) for properties that are in lease-up. |
|
(2) |
Average Rental Rate - Total residential rental revenues reflected on a straight-line basis in accordance with GAAP divided by the weighted average occupied apartment units for the reporting period presented. |
The following tables provide a rollforward of the apartment units included in Same Store Properties (please refer to the Definitions section in Item 7, Management’s Discussion and Analysis of Financial Condition and Results of Operations) and a reconciliation of apartment units included in Same Store Properties to those included in Total Properties for the year ended December 31, 2021:
|
|
|
Year Ended December 31, 2021 |
|
|||||
|
|
|
Properties |
|
|
Apartment Units |
|
||
|
Same Store Properties at December 31, 2020 |
|
|
285 |
|
|
|
73,585 |
|
|
2019 acquisitions stabilized |
|
|
12 |
|
|
|
3,323 |
|
|
2021 dispositions |
|
|
(14 |
) |
|
|
(3,053 |
) |
|
Lease-up properties stabilized |
|
|
1 |
|
|
|
222 |
|
|
Same Store Properties at December 31, 2021 |
|
|
284 |
|
|
|
74,077 |
|
22
|
|
|
Year Ended December 31, 2021 |
|
|||||
|
|
|
Properties |
|
|
Apartment Units |
|
||
|
Same Store |
|
|
284 |
|
|
|
74,077 |
|
|
Non-Same Store: |
|
|
|
|
|
|
|
|
|
2021 acquisitions |
|
|
17 |
|
|
|
4,747 |
|
|
2020 acquisitions |
|
|
1 |
|
|
|
158 |
|
|
2019 acquisitions not yet stabilized |
|
|
1 |
|
|
|
217 |
|
|
Lease-up properties not yet stabilized (1) |
|
|
6 |
|
|
|
1,207 |
|
|
Other |
|
|
1 |
|
|
|
1 |
|
|
Total Non-Same Store |
|
|
26 |
|
|
|
6,330 |
|
|
Total Properties and Apartment Units |
|
|
310 |
|
|
|
80,407 |
|
Note: Properties are considered “stabilized” when they have achieved 90% occupancy for three consecutive months. Properties are included in same store when they are stabilized for all of the current and comparable periods presented.
|
(1) |
Consists of properties in various stages of lease-up and properties where lease-up has been completed but the properties were not stabilized for the comparable periods presented. Also includes one former third-party master-leased property that was not stabilized. |
As of December 31, 2021, the Company’s same store occupancy was 96.4% and its total portfolio-wide occupancy, which includes completed development properties in various stages of lease-up, was 95.7%. Certain of the Company’s properties are encumbered by mortgages and additional detail can be found on Schedule III – Real Estate and Accumulated Depreciation.
The properties in various stages of development and lease-up at December 31, 2021 are included in the following table:
|
Development and Lease-Up Projects as of December 31, 2021 |
||||||||||||||||||||||||||||||||||||
|
(Amounts in thousands except for project and apartment unit amounts) |
||||||||||||||||||||||||||||||||||||
|
|
|
|
|
|
|
|
|
|
|
|
|
|
|
|
|
|
|
|
|
|
|
|
|
|
|
|
|
|
|
|
|
|
|
|
|
|
|
|
|
|
|
|
|
|
|
|
|
|
|
Total |
|
|
Total |
|
|
|
|
|
|
|
|
|
|
|
|
|
|
|
|
|
|
|
||
|
|
|
|
|
|
|
|
|
No. of |
|
|
Budgeted |
|
|
Book |
|
|
|
|
|
|
|
|
|
|
Estimated/Actual |
|
Percentage |
|||||||||
|
|
|
|
|
Ownership |
|
|
Apartment |
|
|
Capital |
|
|
Value |
|
|
Total |
|
|
Percentage |
|
|
Start |
|
Initial |
|
Completion |
|
Stabilization |
|
Leased / |
||||||
|
Projects |
|
Location |
|
Percentage |
|
|
Units |
|
|
Cost (1) |
|
|
to Date |
|
|
Debt (2) |
|
|
Completed |
|
|
Date |
|
Occupancy |
|
Date |
|
Date |
|
Occupied |
||||||
|
CONSOLIDATED: |
|
|
|
|
|
|
|
|
|
|
|
|
|
|
|
|
|
|
|
|
|
|
|
|
|
|
|
|
|
|
|
|
|
|
|
|
|
Projects Under Development: |
|
|
|
|
|
|
|
|
|
|
|
|
|
|
|
|
|
|
|
|
|
|
|
|
|
|
|
|
|
|
|
|
|
|
|
|
|
9th and W (3) |
|
Washington, DC |
|
92% |
|
|
|
312 |
|
|
$ |
108,027 |
|
|
$ |
24,307 |
|
|
$ |
— |
|
|
16% |
|
|
Q3 2021 |
|
Q2 2023 |
|
Q3 2023 |
|
Q3 2024 |
|
– / – |
||
|
Projects Under Development - Consolidated |
|
|
|
|
|
|
|
|
312 |
|
|
|
108,027 |
|
|
|
24,307 |
|
|
|
— |
|
|
|
|
|
|
|
|
|
|
|
|
|
|
|
|
Projects Completed Not Stabilized: |
|
|
|
|
|
|
|
|
|
|
|
|
|
|
|
|
|
|
|
|
|
|
|
|
|
|
|
|
|
|
|
|
|
|
|
|
|
The Edge (fka 4885 Edgemoor Lane) (3) |
|
Bethesda, MD |
|
100% |
|
|
|
154 |
|
|
|
75,271 |
|
|
|
73,091 |
|
|
|
— |
|
|
100% |
|
|
Q3 2019 |
|
Q3 2021 |
|
Q3 2021 |
|
Q3 2022 |
|
62% / 54% |
||
|
Aero Apartments |
|
Alameda, CA |
|
90% |
|
|
|
200 |
|
|
|
117,794 |
|
|
|
113,361 |
|
|
|
61,662 |
|
|
100% |
|
|
Q3 2019 |
|
Q2 2021 |
|
Q2 2021 |
|
Q2 2022 |
|
71% / 70% |
||
|
Alcott Apartments (fka West End Tower) |
|
Boston, MA |
|
100% |
|
|
|
470 |
|
|
|
409,749 |
|
|
|
398,138 |
|
|
|
— |
|
|
98% |
|
|
Q2 2018 |
|
Q3 2021 |
|
Q4 2021 |
|
Q1 2023 |
|
52% / 43% |
||
|
Projects Completed Not Stabilized - Consolidated |
|
|
|
|
|
|
|
|
824 |
|
|
|
602,814 |
|
|
|
584,590 |
|
|
|
61,662 |
|
|
|
|
|
|
|
|
|
|
|
|
|
|
|
|
UNCONSOLIDATED: (4) |
|
|
|
|
|
|
|
|
|
|
|
|
|
|
|
|
|
|
|
|
|
|
|
|
|
|
|
|
|
|
|
|
|
|
|
|
|
Projects Under Development: |
|
|
|
|
|
|
|
|
|
|
|
|
|
|
|
|
|
|
|
|
|
|
|
|
|
|
|
|
|
|
|
|
|
|
|
|
|
Alloy Sunnyside |
|
Denver, CO |
|
80% |
|
|
|
209 |
|
|
|
66,004 |
|
|
|
15,554 |
|
|
|
— |
|
|
12% |
|
|
Q3 2021 |
|
Q2 2023 |
|
Q4 2023 |
|
Q3 2024 |
|
– / – |
||
|
Alexan Harrison |
|
Harrison, NY |
|
62% |
|
|
|
450 |
|
|
|
198,664 |
|
|
|
52,041 |
|
|
|
— |
|
|
4% |
|
|
Q3 2021 |
|
Q3 2023 |
|
Q2 2024 |
|
Q4 2025 |
|
– / – |
||
|
Solana Beeler Park |
|
Denver, CO |
|
90% |
|
|
|
270 |
|
|
|
79,956 |
|
|
|
12,739 |
|
|
|
— |
|
|
1% |
|
|
Q4 2021 |
|
Q4 2023 |
|
Q2 2024 |
|
Q1 2025 |
|
– / – |
||
|
Projects Under Development - Unconsolidated |
|
|
|
|
|
|
|
|
929 |
|
|
|
344,624 |
|
|
|
80,334 |
|
|
|
— |
|
|
|
|
|
|
|
|
|
|
|
|
|
|
|
|
Total Development Projects - Consolidated |
|
|
|
|
|
|
|
|
1,136 |
|
|
|
710,841 |
|
|
|
608,897 |
|
|
|
61,662 |
|
|
|
|
|
|
|
|
|
|
|
|
|
|
|
|
Total Development Projects - Unconsolidated |
|
|
|
|
|
|
|
|
929 |
|
|
|
344,624 |
|
|
|
80,334 |
|
|
|
— |
|
|
|
|
|
|
|
|
|
|
|
|
|
|
|
|
Total Development Projects |
|
|
|
|
|
|
|
|
2,065 |
|
|
$ |
1,055,465 |
|
|
$ |
689,231 |
|
|
$ |
61,662 |
|
|
|
|
|
|
|
|
|
|
|
|
|
|
|
|
(1) |
Total Budgeted Capital Cost – Estimated remaining cost for projects under development and/or developed plus all capitalized costs incurred to date, including land acquisition costs, construction costs, capitalized real estate taxes and insurance, capitalized interest and loan fees, permits, professional fees, allocated development overhead and other regulatory fees, plus any estimates of costs remaining to be funded for all projects, all in accordance with GAAP. Amounts for partially owned consolidated and unconsolidated properties are presented at 100% of the project. |
|
(2) |
All non-wholly owned projects are being partially funded with project-specific construction loans. None of these loans are recourse to the Company. As of December 31, 2021, no draws have been made on the construction loans for 9th and W, Alloy Sunnyside, Alexan Harrison or Solana Beeler Park. |
|
(3) |
The land under these projects are subject to long-term ground leases. |
|
(4) |
The Company has six unconsolidated development joint ventures as of December 31, 2021. In addition to the three projects disclosed in “Projects Under Development – Unconsolidated” above, the Company has three additional unconsolidated joint venture projects that have not yet started but are expected to do so in 2022 and eventually deliver approximately 1,005 apartment units. |
23
Item 3. Legal Proceedings
As of December 31, 2021, the Company does not believe there is any litigation pending or threatened against it that, individually or in the aggregate, may reasonably be expected to have a material adverse effect on the Company.
Item 4. Mine Safety Disclosures
Not applicable.
24
PART II
Item 5. Market for Registrant’s Common Equity, Related Stockholder Matters and Issuer Purchases of Equity Securities
Common Share/Unit Information (Equity Residential and ERP Operating Limited Partnership)
The Company’s Common Shares trade on the New York Stock Exchange under the trading symbol EQR. There is no established public market for the Operating Partnership’s Units (OP Units and restricted units). At February 11, 2022, the number of record holders of Common Shares was approximately 1,850 and 375,917,242 Common Shares were outstanding. At February 11, 2022, the number of record holders of Units in the Operating Partnership was approximately 475 and 388,789,846 Units were outstanding.
Unregistered Common Shares Issued in the Quarter Ended December 31, 2021 (Equity Residential)
During the quarter ended December 31, 2021, EQR issued 200,245 Common Shares in exchange for 200,245 OP Units held by various limited partners of ERPOP. OP Units are generally exchangeable into Common Shares on a one-for-one basis or, at the option of ERPOP, the cash equivalent thereof, at any time one year after the date of issuance. These shares were either registered under the Securities Act of 1933, as amended (the “Securities Act”), or issued in reliance on an exemption from registration under Section 4(a)(2) of the Securities Act and the rules and regulations promulgated thereunder, as these were transactions by an issuer not involving a public offering. In light of the manner of the sale and information obtained by EQR from the limited partners in connection with these transactions, EQR believes it may rely on these exemptions.
Equity Compensation Plan Information
The following table provides information as of December 31, 2021 with respect to the Company’s Common Shares that may be issued under its existing equity compensation plans.
|
Plan Category |
|
Number of securities to be issued upon exercise of outstanding options, warrants and rights |
|
|
Weighted-average exercise price of outstanding options, warrants and rights |
|
|
Number of securities remaining available for future issuance under equity compensation plans (excluding securities in column (a)) |
|
|||
|
|
|
(a) (1) |
|
|
(b) (1) |
|
|
(c) (2) |
|
|||
|
Equity compensation plans approved by shareholders |
|
|
4,387,833 |
|
|
$ |
60.65 |
|
|
|
12,092,912 |
|
|
Equity compensation plans not approved by shareholders |
|
N/A |
|
|
N/A |
|
|
N/A |
|
|||
|
(1) |
The amounts shown in columns (a) and (b) of the above table do not include 309,876 outstanding Common Shares (all of which are restricted and subject to vesting requirements) that were granted under the Company’s 2011 Share Incentive Plan, as amended (the “2011 Plan”), and 2019 Share Incentive Plan, as amended (the “2019 Plan”), and outstanding Common Shares that have been purchased by employees and trustees under the Company’s ESPP. |
|
(2) |
Includes 9,539,478 Common Shares that may be issued under the 2019 Plan and 2,553,434 Common Shares that may be sold to employees and trustees under the ESPP. |
On June 27, 2019, the shareholders of EQR approved the Company's 2019 Plan and the Company filed a Form S-8 registration statement to register 11,331,958 Common Shares under this plan. As of December 31, 2021, 9,539,478 shares were available for future issuance. In conjunction with the approval of the 2019 Plan, no further awards may be granted under the 2011 Plan. The 2019 Plan expires on June 27, 2029.
Any Common Shares issued pursuant to EQR’s incentive equity compensation and employee share purchase plans will result in ERPOP issuing OP Units to EQR on a one-for-one basis, with ERPOP receiving the net cash proceeds of such issuances.
Item 6. Reserved
25
Item 7. Management’s Discussion and Analysis of Financial Condition and Results of Operations
The following discussion and analysis of the results of operations and financial condition of the Company and the Operating Partnership should be read in connection with the Consolidated Financial Statements and Notes thereto. Due to the Company’s ability to control the Operating Partnership and its subsidiaries, the Operating Partnership and each such subsidiary entity has been consolidated with the Company for financial reporting purposes, except for any unconsolidated properties/entities. Capitalized terms used herein and not defined are as defined elsewhere in this Annual Report on Form 10-K. In addition, please refer to the Definitions section below for various capitalized terms not immediately defined in this Item 7, Management’s Discussion and Analysis of Financial Condition and Results of Operations.
Forward-Looking Statements
Forward-looking statements are intended to be made pursuant to the safe harbor provisions of the Private Securities Litigation Reform Act of 1995. These statements are based on current expectations, estimates, projections and assumptions made by management. While the Company’s management believes the assumptions underlying its forward-looking statements are reasonable, such information is inherently subject to uncertainties and may involve certain risks, which could cause actual results, performance or achievements of the Company to differ materially from anticipated future results, performance or achievements expressed or implied by such forward-looking statements. Many of these uncertainties and risks are difficult to predict and beyond management’s control, such as the current COVID-19 pandemic (see below for further discussion). Forward-looking statements are not guarantees of future performance, results or events. The forward-looking statements contained herein are made as of the date hereof and the Company undertakes no obligation to update or supplement these forward-looking statements.
In addition, these forward-looking statements are subject to risks related to the COVID-19 pandemic and its accompanying variants, many of which are unknown, including the duration, severity and the extent of the adverse health impact on the general population, our residents and employees, the distribution, effectiveness and acceptance of vaccines and testing, the overall reopening progress in the cities in which we operate, the potential long-term changes in customer preferences for living in our communities and the impact of operational changes we have implemented and may implement in response to the pandemic.
Additional factors that might cause such differences are discussed in Part I of this Annual Report on Form 10-K, particularly those under Item 1A, Risk Factors.
Forward-looking statements and related uncertainties are also included in the Notes to Consolidated Financial Statements in this report.
Overview
See Item 1, Business, for discussion regarding the Company’s overview.
Business Objectives and Operating and Investing Strategies
See Item 1, Business, for discussion regarding the Company’s business objectives and operating and investing strategies.
COVID-19 Impact
The Company continues to monitor and respond to the ongoing effects of the COVID-19 pandemic. Its duration, severity and the extent of its adverse health impact on the general population, our residents and employees, along with the distribution, effectiveness and acceptance of vaccines and testing and pace and degree of recovery from the pandemic are among the many unknowns that have had or could continue to have a significant impact on the Company. These, among other items, have impacted the economy, the unemployment rate and our operations and could materially affect our future consolidated results of operations, financial condition, liquidity, investments and overall performance. Despite the impact of COVID-19, we continue to believe that the long-term prospects for our business remain strong. For additional details, see Item 1A, Risk Factors.
26
Results of Operations
2020 and 2021 Transactions
In conjunction with our business objectives and operating and investing strategies, the following table provides a rollforward of the transactions that occurred during the years ended December 31, 2020 and 2021:
Portfolio Rollforward
($ in thousands)
|
|
|
Properties |
|
|
Apartment Units |
|
|
Purchase Price |
|
|
Acquisition Cap Rate |
|
||||
|
12/31/2019 |
|
|
309 |
|
|
|
79,962 |
|
|
|
|
|
|
|
|
|
|
Acquisitions: |
|
|
|
|
|
|
|
|
|
|
|
|
|
|
|
|
|
Consolidated Rental Properties – Not Stabilized (1) |
|
|
1 |
|
|
|
158 |
|
|
$ |
48,860 |
|
|
|
4.7 |
% |
|
|
|
|
|
|
|
|
|
|
|
Sales Price |
|
|
Disposition Yield |
|
||
|
Dispositions: |
|
|
|
|
|
|
|
|
|
|
|
|
|
|
|
|
|
Consolidated Rental Properties |
|
|
(6 |
) |
|
|
(2,231 |
) |
|
$ |
(1,066,861 |
) |
|
|
(4.5 |
)% |
|
12/31/2020 |
|
|
304 |
|
|
|
77,889 |
|
|
|
|
|
|
|
|
|
|
|
|
|
|
|
|
|
|
|
|
Purchase Price |
|
|
Acquisition Cap Rate |
|
||
|
Acquisitions: |
|
|
|
|
|
|
|
|
|
|
|
|
|
|
|
|
|
Consolidated Rental Properties |
|
|
13 |
|
|
|
3,533 |
|
|
$ |
1,249,679 |
|
|
|
3.7 |
% |
|
Consolidated Rental Properties – Not Stabilized (2) |
|
|
4 |
|
|
|
1,214 |
|
|
$ |
459,700 |
|
|
|
4.0 |
% |
|
|
|
|
|
|
|
|
|
|
|
Sales Price |
|
|
Disposition Yield |
|
||
|
Dispositions: |
|
|
|
|
|
|
|
|
|
|
|
|
|
|
|
|
|
Consolidated Rental Properties |
|
|
(14 |
) |
|
|
(3,053 |
) |
|
$ |
(1,716,775 |
) |
|
|
(3.7 |
)% |
|
Completed Developments – Consolidated |
|
|
3 |
|
|
|
824 |
|
|
|
|
|
|
|
|
|
|
12/31/2021 |
|
|
310 |
|
|
|
80,407 |
|
|
|
|
|
|
|
|
|
|
(1) |
The Company acquired one property during the year ended December 31, 2020 in the Seattle market that was in lease-up and is expected to stabilize in its second year of ownership. |
|
(2) |
The Company acquired four properties during the year ended December 31, 2021, one each in the Denver, Atlanta, Seattle and Dallas/Ft. Worth markets, that are in lease-up and are expected to stabilize in their second year of ownership at the combined Acquisition Cap Rate listed above. |
Acquisitions
|
|
• |
The consolidated property acquired in 2020 was located in the Seattle market; |
|
|
• |
The consolidated properties acquired in 2021 are located in the Atlanta (4), Austin (3), Boston, Dallas/Ft. Worth (4), Denver (3), Seattle and Washington D.C. markets. The Atlanta, Austin and Dallas/Ft. Worth acquisitions marked the Company’s re-entry into these markets; |
|
|
• |
Approximately $1.4 billion, or 82.0% of all acquisition activity in 2021, was in expansion markets; and |
|
|
• |
The Company funded the 2021 acquisitions by selling older assets located within established markets that no longer met our long-term investment criteria. |
Dispositions
|
|
• |
The consolidated properties disposed of in 2020 were located in the Phoenix, San Diego, San Francisco (3) and Washington D.C. markets and the sales generated an Unlevered IRR of 10.2%; and |
|
|
• |
The consolidated properties disposed of in 2021 were located in the Los Angeles (6), New York, San Francisco (5), Seattle and Washington D.C. markets and the sales generated an Unlevered IRR of 10.4%. |
Developments
|
|
• |
The Company completed construction on three consolidated apartment properties during 2021, located in the San Francisco, Washington D.C. and Boston markets, consisting of 824 apartment units totaling approximately $602.8 million of development costs; and |
27
|
|
• |
The Company commenced construction on one consolidated and three unconsolidated apartment properties during 2021, located in the Denver (2), New York and Washington D.C. markets, consisting of 1,241 apartment units totaling approximately $452.7 million of expected development costs. |
Investments in Unconsolidated Entities
|
|
• |
The Company entered into six separate unconsolidated joint ventures during 2021 for the purpose of developing vacant land parcels in Texas (3), Colorado (2) and New York. The Company’s total investment in these six joint ventures is approximately $72.2 million as of December 31, 2021. Three of the projects are related to the Company’s joint venture development program with Toll Brothers, Inc. (“Toll”) discussed below; and |
|
|
• |
Pursuant to our strategic partnership with Toll, the Company and Toll entered into three separate joint venture agreements during 2021. The projects have not yet started but are expected to do so in 2022. Toll will act as managing member of each project overseeing approvals, design and construction. See Notes 6 and 16 in the Notes to Consolidated Financial Statements for additional discussion. |
See Note 4 in the Notes to Consolidated Financial Statements for additional discussion regarding the Company’s real estate transactions.
Future Outlook
|
|
• |
The Company’s guidance assumes consolidated rental acquisitions of approximately $2.0 billion and consolidated rental dispositions of approximately $2.0 billion during the year ending December 31, 2022; and |
|
|
• |
We currently anticipate spending approximately $200.0 million on development costs during the year ending December 31, 2022, primarily for consolidated and unconsolidated properties currently under construction (amount only includes our share of development costs). |
The above 2022 guidance assumptions are based on current expectations and are forward-looking.
Comparison of the year ended December 31, 2021 to the year ended December 31, 2020
The following table presents a reconciliation of diluted earnings per share/unit for the year ended December 31, 2021 as compared to the same period in 2020:
|
|
|
Year Ended December 31 |
|
|
|
Diluted earnings per share/unit for full year 2020 |
|
$ |
2.45 |
|
|
Property NOI |
|
|
(0.35 |
) |
|
Interest expense |
|
|
0.14 |
|
|
Debt extinguishment costs |
|
|
0.10 |
|
|
Corporate overhead (1) |
|
|
(0.03 |
) |
|
Net gain/loss on property sales |
|
|
1.38 |
|
|
Non-operating asset gains/losses |
|
|
(0.02 |
) |
|
Impairment – non-operating assets |
|
|
(0.04 |
) |
|
Depreciation expense |
|
|
(0.04 |
) |
|
Other |
|
|
(0.05 |
) |
|
Diluted earnings per share/unit for full year 2021 |
|
$ |
3.54 |
|
|
(1) |
Corporate overhead includes property management and general and administrative expenses. |
The Company’s primary financial measure for evaluating each of its apartment communities is net operating income (“NOI”). NOI represents rental income less direct property operating expenses (including real estate taxes and insurance). The Company believes that NOI is helpful to investors as a supplemental measure of its operating performance because it is a direct measure of the actual operating results of the Company’s apartment properties.
28
The following tables present reconciliations of operating income per the consolidated statements of operations to NOI, along with rental income, operating expenses and NOI per the consolidated statements of operations allocated between same store and non-same store results (amounts in thousands):
|
|
|
Year Ended December 31, |
|
|
2021 vs. 2020 |
|
||||||||||
|
|
|
2021 |
|
|
2020 |
|
|
$ Change |
|
|
% Change |
|
||||
|
Operating income |
|
$ |
1,675,841 |
|
|
$ |
1,317,990 |
|
|
$ |
357,851 |
|
|
|
27.2 |
% |
|
Adjustments: |
|
|
|
|
|
|
|
|
|
|
|
|
|
|
|
|
|
Property management |
|
|
98,155 |
|
|
|
93,825 |
|
|
|
4,330 |
|
|
|
4.6 |
% |
|
General and administrative |
|
|
56,506 |
|
|
|
48,305 |
|
|
|
8,201 |
|
|
|
17.0 |
% |
|
Depreciation |
|
|
838,272 |
|
|
|
820,832 |
|
|
|
17,440 |
|
|
|
2.1 |
% |
|
Net (gain) loss on sales of real estate properties |
|
|
(1,072,183 |
) |
|
|
(531,807 |
) |
|
|
(540,376 |
) |
|
|
101.6 |
% |
|
Impairment |
|
|
16,769 |
|
|
|
— |
|
|
|
16,769 |
|
|
|
— |
|
|
Total NOI |
|
$ |
1,613,360 |
|
|
$ |
1,749,145 |
|
|
$ |
(135,785 |
) |
|
|
(7.8 |
)% |
|
Rental income: |
|
|
|
|
|
|
|
|
|
|
|
|
|
|
|
|
|
Same store |
|
$ |
2,342,257 |
|
|
$ |
2,425,025 |
|
|
$ |
(82,768 |
) |
|
|
(3.4 |
)% |
|
Non-same store/other |
|
|
121,740 |
|
|
|
146,680 |
|
|
|
(24,940 |
) |
|
|
(17.0 |
)% |
|
Total rental income |
|
|
2,463,997 |
|
|
|
2,571,705 |
|
|
|
(107,708 |
) |
|
|
(4.2 |
)% |
|
Operating expenses: |
|
|
|
|
|
|
|
|
|
|
|
|
|
|
|
|
|
Same store |
|
|
803,995 |
|
|
|
780,381 |
|
|
|
23,614 |
|
|
|
3.0 |
% |
|
Non-same store/other |
|
|
46,642 |
|
|
|
42,179 |
|
|
|
4,463 |
|
|
|
10.6 |
% |
|
Total operating expenses |
|
|
850,637 |
|
|
|
822,560 |
|
|
|
28,077 |
|
|
|
3.4 |
% |
|
NOI: |
|
|
|
|
|
|
|
|
|
|
|
|
|
|
|
|
|
Same store |
|
|
1,538,262 |
|
|
|
1,644,644 |
|
|
|
(106,382 |
) |
|
|
(6.5 |
)% |
|
Non-same store/other |
|
|
75,098 |
|
|
|
104,501 |
|
|
|
(29,403 |
) |
|
|
(28.1 |
)% |
|
Total NOI |
|
$ |
1,613,360 |
|
|
$ |
1,749,145 |
|
|
$ |
(135,785 |
) |
|
|
(7.8 |
)% |
Note: See Note 17 in the Notes to Consolidated Financial Statements for detail by reportable segment/market. Non-same store/other NOI results consist primarily of properties acquired in calendar years 2020 and 2021, operations from the Company’s development properties and operations prior to disposition from 2020 and 2021 sold properties.
|
• |
The decrease in same store rental income is due primarily to the negative cumulative impact of leasing activity at lower Average Rental Rates, particularly in late 2020 and early 2021. |
|
• |
The increase in same store operating expenses is due primarily to: |
|
|
• |
Utilities – A $10.2 million increase due to water, sewer and trash charges (approximately 65% of total) increasing as a result of both higher usage and rate, as well as increases in natural gas and electric charges (approximately 35% of total) due to higher commodity prices; |
|
|
• |
Real estate taxes – A $5.2 million increase due to modest rate growth, partially offset by reduced assessed values in certain locations; and |
|
|
• |
Repairs and maintenance – A $5.2 million increase primarily driven by low comparable period expense growth due to the pandemic along with increases in minimum wage on contract services and maintenance repairs in 2021. |
|
• |
The decrease in non-same store/other NOI is due primarily to a negative impact of lost NOI from 2020 and 2021 dispositions of $50.2 million, partially offset by a positive impact of higher NOI from non-stabilized properties acquired between 2019 and 2021 of $21.1 million. |
|
• |
The decrease in consolidated total NOI is primarily a result of the Company’s lower NOI from same store properties, largely due to the economic impact from the COVID-19 pandemic. |
See the Same Store Results section below for additional discussion of those results.
29
Property management expenses include off-site expenses associated with the self-management of the Company’s properties as well as management fees paid to any third-party management companies. These expenses increased approximately $4.3 million or 4.6% during the year ended December 31, 2021 as compared to 2020. This increase is primarily attributable to increases in payroll-related costs, legal and professional fees and information technology-related costs specifically for various operating initiatives such as sales-focused improvements and service enhancements. The expenses in 2020 were lower than normal due to the impact of COVID-19.
General and administrative expenses, which include corporate operating expenses, increased approximately $8.2 million or 17.0% during the year ended December 31, 2021 as compared to 2020, primarily due to increases in payroll-related costs, partially offset by decreases in office rent as a result of the consolidation of space at the Company’s corporate headquarters. The expenses in 2020 were lower than normal due to the impact of COVID-19.
Depreciation expense, which includes depreciation on non-real estate assets, increased approximately $17.4 million or 2.1% during the year ended December 31, 2021 as compared to 2020, primarily as a result of additional depreciation expense on properties acquired in 2020 and 2021 and development properties placed in service during 2021, partially offset by in-place leases for 2019 acquisitions being fully depreciated as of December 31, 2020 and the Company being a net seller during 2020, which resulted in lower depreciation in the current period.
Net gain on sales of real estate properties increased approximately $540.4 million or 101.6% during the year ended December 31, 2021 as compared to 2020, primarily as a result of a higher sales volume with the sale of fourteen consolidated apartment properties in 2021 as compared to the sale of six consolidated apartment properties in the same period in 2020.
Impairment increased approximately $16.8 million during the year ended December 31, 2021 as compared to 2020, due to an impairment charge in 2021 on one land parcel held for development compared to no impairment charges taken during 2020.
Interest and other income increased approximately $19.7 million during the year ended December 31, 2021 as compared to 2020. The increase is primarily due to a gain of $23.4 million on the sale of various investment securities that occurred during 2021 but not during 2020, partially offset by decreases in insurance/litigation settlement proceeds and other non-comparable items that occurred during 2020 but not during 2021.
Other expenses increased approximately $1.8 million or 10.1% during the year ended December 31, 2021 as compared to 2020, primarily due to an increase in various litigation and environmental reserves/settlements and an increase in ground lease finance charges, partially offset by a decrease in advocacy contributions.
Interest expense, including amortization of deferred financing costs, decreased approximately $92.8 million or 24.8% during the year ended December 31, 2021 as compared to 2020. The decrease is primarily due to lower debt extinguishment costs as well as lower overall interest rates and debt balances in 2021 as compared to 2020. The effective interest cost on all indebtedness, excluding debt extinguishment costs/prepayment penalties, for the year ended December 31, 2021 was 3.52% as compared to 3.94% in 2020. The Company capitalized interest of approximately $15.9 million and $10.2 million during the years ended December 31, 2021 and 2020, respectively.
Net gain on sales of land parcels decreased approximately $34.2 million during the year ended December 31, 2021 as compared to 2020, primarily as a result of the sale of two land parcels in 2020 as compared to no sales in 2021.
Net (income) loss attributable to Noncontrolling Interests in partially owned properties increased approximately $3.1 million or 20.9% during the year ended December 31, 2021 as compared to 2020, primarily as a result of higher noncontrolling interest allocations from higher gains on the sale of one partially owned apartment property in 2021 as compared to the sale of one partially owned apartment property in 2020.
For comparison of the year ended December 31, 2020 to the year ended December 31, 2019, refer to Item 7, Management’s Discussion and Analysis of Financial Condition and Results of Operations, included in the Company’s and the Operating Partnership’s Annual Report on Form 10-K for the year ended December 31, 2020.
Same Store Results
Properties that the Company owned and were stabilized for all of both 2021 and 2020 (the “2021 Same Store Properties”), which represented 74,077 apartment units, drove the Company’s results of operations. Properties are considered “stabilized” when they have achieved 90% occupancy for three consecutive months. Properties are included in same store when they are stabilized for all of the current and comparable periods presented.
30
The following table provides comparative total same store results and statistics for the 2021 Same Store Properties:
2021 vs. 2020
Same Store Results/Statistics Including 74,077 Same Store Apartment Units
$ in thousands (except for Average Rental Rate)
|
2021 |
|
|
2020 |
|
||||||||||||||||||||||||||||||||||
|
|
|
Residential |
|
|
% Change |
|
|
Non- Residential |
|
|
% Change |
|
|
Total |
|
|
% Change |
|
|
|
|
Residential |
|
|
Non- Residential |
|
|
Total |
|
|||||||||
|
Revenues |
|
$ |
2,253,068 |
|
|
|
(4.6 |
%) |
|
$ |
89,189 |
|
(1) |
|
40.1 |
% |
|
$ |
2,342,257 |
|
|
|
(3.4 |
%) |
|
Revenues |
|
$ |
2,361,359 |
|
|
$ |
63,666 |
|
|
$ |
2,425,025 |
|
|
Expenses |
|
$ |
779,729 |
|
|
|
2.8 |
% |
|
$ |
24,266 |
|
|
|
9.7 |
% |
|
$ |
803,995 |
|
|
|
3.0 |
% |
|
Expenses |
|
$ |
758,257 |
|
|
$ |
22,124 |
|
|
$ |
780,381 |
|
|
NOI |
|
$ |
1,473,339 |
|
|
|
(8.1 |
%) |
|
$ |
64,923 |
|
|
|
56.3 |
% |
|
$ |
1,538,262 |
|
|
|
(6.5 |
%) |
|
NOI |
|
$ |
1,603,102 |
|
|
$ |
41,542 |
|
|
$ |
1,644,644 |
|
|
|
|
|
|
|
|
|
|
|
|
|
|
|
|
|
|
|
|
|
|
|
|
|
|
|
|
|
|
|
|
|
|
|
|
|
|
|
|
|
|
Average Rental Rate |
|
$ |
2,640 |
|
|
|
(5.6 |
%) |
|
|
|
|
|
|
|
|
|
|
|
|
|
|
|
|
|
Average Rental Rate |
|
$ |
2,797 |
|
|
|
|
|
|
|
|
|
|
Physical Occupancy |
|
|
96.1 |
% |
|
|
1.1 |
% |
|
|
|
|
|
|
|
|
|
|
|
|
|
|
|
|
|
Physical Occupancy |
|
|
95.0 |
% |
|
|
|
|
|
|
|
|
|
Turnover |
|
|
44.4 |
% |
|
|
(8.5 |
%) |
|
|
|
|
|
|
|
|
|
|
|
|
|
|
|
|
|
Turnover |
|
|
52.9 |
% |
|
|
|
|
|
|
|
|
Note: Same store revenues for all leases are reflected on a straight-line basis in accordance with GAAP for the current and comparable periods.
|
(1) |
Changes in same store Non-Residential revenues are primarily driven by the write-off of Non-Residential straight-line lease receivables in 2020 and lower bad debt in 2021. |
The following table provides results and statistics related to our Residential same store operations for the years ended December 31, 2021 and 2020:
2021 vs. 2020
Same Store Residential Results/Statistics by Market
|
|
|
|
|
|
|
|
|
|
|
|
|
|
|
|
|
|
|
|
|
|
|
Increase (Decrease) from Prior Year |
|
|||||||||
|
Markets/Metro Areas |
|
Apartment Units |
|
|
2021 % of Actual NOI |
|
|
2021 Average Rental Rate |
|
|
2021 Weighted Average Physical Occupancy % |
|
|
2021 Turnover |
|
|
Average Rental Rate |
|
|
Physical Occupancy |
|
|
Turnover |
|
||||||||
|
Los Angeles |
|
|
15,259 |
|
|
|
20.5 |
% |
|
$ |
2,501 |
|
|
|
96.6 |
% |
|
|
41.5 |
% |
|
|
(0.7 |
%) |
|
|
1.0 |
% |
|
|
(10.4 |
%) |
|
Orange County |
|
|
4,028 |
|
|
|
5.7 |
% |
|
|
2,318 |
|
|
|
97.7 |
% |
|
|
34.6 |
% |
|
|
2.9 |
% |
|
|
1.0 |
% |
|
|
(10.7 |
%) |
|
San Diego |
|
|
2,706 |
|
|
|
4.1 |
% |
|
|
2,484 |
|
|
|
97.6 |
% |
|
|
43.1 |
% |
|
|
4.6 |
% |
|
|
0.6 |
% |
|
|
(5.9 |
%) |
|
Subtotal – Southern California |
|
|
21,993 |
|
|
|
30.3 |
% |
|
|
2,465 |
|
|
|
96.9 |
% |
|
|
40.4 |
% |
|
|
0.5 |
% |
|
|
0.9 |
% |
|
|
(9.9 |
%) |
|
|
|
|
|
|
|
|
|
|
|
|
|
|
|
|
|
|
|
|
|
|
|
|
|
|
|
|
|
|
|
|
|
|
|
San Francisco |
|
|
11,630 |
|
|
|
18.0 |
% |
|
|
2,900 |
|
|
|
95.1 |
% |
|
|
48.2 |
% |
|
|
(11.3 |
%) |
|
|
0.6 |
% |
|
|
(8.7 |
%) |
|
Washington D.C. |
|
|
14,322 |
|
|
|
17.5 |
% |
|
|
2,332 |
|
|
|
96.5 |
% |
|
|
45.3 |
% |
|
|
(4.3 |
%) |
|
|
0.9 |
% |
|
|
(5.0 |
%) |
|
New York |
|
|
9,343 |
|
|
|
12.1 |
% |
|
|
3,497 |
|
|
|
95.2 |
% |
|
|
37.5 |
% |
|
|
(9.6 |
%) |
|
|
2.4 |
% |
|
|
(13.8 |
%) |
|
Seattle |
|
|
8,819 |
|
|
|
10.6 |
% |
|
|
2,274 |
|
|
|
95.6 |
% |
|
|
50.6 |
% |
|
|
(7.1 |
%) |
|
|
0.2 |
% |
|
|
(4.0 |
%) |
|
Boston |
|
|
6,346 |
|
|
|
9.6 |
% |
|
|
2,883 |
|
|
|
95.7 |
% |
|
|
47.0 |
% |
|
|
(7.0 |
%) |
|
|
1.5 |
% |
|
|
(9.3 |
%) |
|
Denver |
|
|
1,624 |
|
|
|
1.9 |
% |
|
|
2,066 |
|
|
|
96.6 |
% |
|
|
60.2 |
% |
|
|
1.4 |
% |
|
|
1.7 |
% |
|
|
(9.8 |
%) |
|
|
|
|
|
|
|
|
|
|
|
|
|
|
|
|
|
|
|
|
|
|
|
|
|
|
|
|
|
|
|
|
|
|
|
Total |
|
|
74,077 |
|
|
|
100.0 |
% |
|
$ |
2,640 |
|
|
|
96.1 |
% |
|
|
44.4 |
% |
|
|
(5.6 |
%) |
|
|
1.1 |
% |
|
|
(8.5 |
%) |
Note: The above table reflects Residential same store results only. Residential operations account for approximately 96.1% of total revenues for the year ended December 31, 2021.
Despite the significant impact from the pandemic on our business, which is reflected in the results for the year ended December 31, 2021, a strong recovery continues across our portfolio. Robust economic growth coupled with reopening of cities drove our operations to recover rapidly with significant demand for our apartments in all of our markets. This has led to high Physical Occupancy, increased pricing power and a material reduction in Leasing Concessions. Key operating drivers for this performance during 2021 include:
|
|
• |
Pricing – There has been significant improvement in pricing (net of Leasing Concessions) since the end of the fourth quarter of 2020, with pricing reaching or exceeding pre-pandemic levels. Monthly Residential Leasing Concessions granted have also declined significantly from their peak of $6.1 million per month in February 2021 and have now returned to more normalized pre-pandemic levels. |
|
|
• |
Physical Occupancy – Physical Occupancy was 96.6% for the fourth quarter of 2021 and remained strong for the year ended December 31, 2021 at 96.1%. |
31
|
|
• |
Percentage of Residents Renewing and Turnover – Our strategy of focusing on resident renewals continued to deliver strong results. We reported the lowest Turnover in our history for both the fourth quarter of 2021 (9.4%) and the full year of 2021 (44.4%), which we believe reaffirms the demand and desirability for our product. Results have been positive to date as the Percentage of Residents Renewing continues to improve with the fourth quarter of 2021 above 60%, which is higher than 2019 levels. |
Despite strong rent collections throughout the pandemic, the financial impact from a small subset of our residents and Non-Residential tenants not paying has led to higher levels of bad debt than we have historically experienced. We continue to work with our residents and Non-Residential tenants on meeting their financial obligations. During the year ended December 31, 2021, the Company received governmental rental assistance payments paid on behalf of residents of approximately $34.7 million with approximately $16.3 million of that received in the fourth quarter of 2021. Despite receipt of these payments, our reserves and bad debt remained elevated in 2021. Our bad debt allowance policies remain consistent with those in place before the pandemic.
Liquidity and Capital Resources
With approximately $2.2 billion in readily available liquidity, a strong balance sheet, limited near-term maturities, very strong credit metrics and ample access to capital markets, the Company believes it is well positioned to meet its future obligations and opportunities. See further discussion below.
Statements of Cash Flows
The following table sets forth our sources and uses of cash flows for the years ended December 31, 2021, 2020 and 2019 (amounts in thousands):
|
|
|
Year Ended December 31, |
|
|||||||||
|
|
|
2021 |
|
|
2020 |
|
|
2019 |
|
|||
|
Cash flow provided by (used for): |
|
|
|
|
|
|
|
|
|
|
|
|
|
Operating activities |
|
$ |
1,260,184 |
|
|
$ |
1,265,536 |
|
|
$ |
1,456,984 |
|
|
Investing activities |
|
$ |
(434,620 |
) |
|
$ |
663,586 |
|
|
$ |
(771,824 |
) |
|
Financing activities |
|
$ |
(565,056 |
) |
|
$ |
(1,946,393 |
) |
|
$ |
(684,474 |
) |
The following provides information regarding the Company’s cash flows from operating, investing and financing activities for the year ended December 31, 2021.
Operating Activities
Our operating cash flows are primarily impacted by NOI and its components, such as Average Rental Rates, Physical Occupancy levels and operating expenses related to our properties. Cash provided by operating activities for the year ended December 31, 2021 as compared to 2020, declined by approximately $5.4 million as a direct result of the NOI and other changes discussed above in Results of Operations.
Investing Activities
Our investing cash flows are primarily impacted by our transaction activity (acquisitions/dispositions), development spend and capital expenditures. For 2021, key drivers were:
|
|
• |
Acquired seventeen consolidated rental properties for approximately $1.7 billion in cash; |
|
|
• |
Disposed of fourteen consolidated rental properties, receiving net proceeds of approximately $1.7 billion; |
|
|
• |
Invested in six separate unconsolidated development joint ventures for approximately $48.5 million in cash; |
|
|
• |
Invested $206.4 million primarily in development projects; |
|
|
• |
Purchased $168.3 million of various investment securities and other investments; |
|
|
• |
Sold various investment securities, receiving net proceeds of $191.4 million; and |
|
|
• |
Invested $151.0 million in capital expenditures to real estate presented in the table below. |
32
For the year ended December 31, 2021, our actual capital expenditures to real estate included the following (amounts in thousands except for apartment unit and per apartment unit amounts):
Capital Expenditures to Real Estate
For the Year Ended December 31, 2021
|
|
|
Same Store Properties |
|
|
Non-Same Store Properties/Other |
|
|
Total |
|
|
Same Store Avg. Per Apartment Unit |
|
||||
|
Total Apartment Units |
|
|
74,077 |
|
|
|
6,330 |
|
|
|
80,407 |
|
|
|
|
|
|
|
|
|
|
|
|
|
|
|
|
|
|
|
|
|
|
|
|
Building Improvements |
|
$ |
87,456 |
|
|
$ |
1,570 |
|
|
$ |
89,026 |
|
|
$ |
1,181 |
|
|
Renovation Expenditures (1) |
|
|
28,558 |
|
|
|
297 |
|
|
|
28,855 |
|
|
|
385 |
|
|
Replacements |
|
|
31,374 |
|
|
|
1,764 |
|
|
|
33,138 |
|
|
|
424 |
|
|
Total Capital Expenditures to Real Estate |
|
$ |
147,388 |
|
|
$ |
3,631 |
|
|
$ |
151,019 |
|
|
$ |
1,990 |
|
|
(1) |
Renovation Expenditures – Amounts for 1,347 same store apartment units approximated $21,201 per apartment unit renovated. |
Financing Activities
Our financing cash flows primarily relate to our borrowing activity (debt proceeds or repayment), distributions/dividends to shareholders and other Common Share activity. In 2021, key drivers were:
|
|
• |
Obtained $28.5 million in 3.58% fixed rate mortgage debt maturing on March 1, 2031; |
|
|
• |
Obtained $29.9 million in variable rate construction mortgage debt that is non-recourse to the Company maturing on June 25, 2022; |
|
|
• |
Issued $500.0 million of ten-year 1.85% unsecured notes due 2031, receiving net proceeds of approximately $497.5 million before underwriting fees and other expenses. This was the Company’s second ever green bond offering; |
|
|
• |
Repaid $164.3 million of mortgage loans (inclusive of scheduled principal repayments); |
|
|
• |
Issued Common Shares related to share option exercises and ESPP purchases and received net proceeds of $89.7 million, which were contributed to the capital of the Operating Partnership in exchange for additional OP Units (on a one-for-one Common Share per OP Unit basis); and |
|
|
• |
Paid dividends/distributions on Common Shares, Preferred Shares, Units (including OP Units and restricted units) and noncontrolling interests in partially owned properties totaling approximately $940.7 million. |
Short-Term Liquidity and Cash Proceeds
The Company generally expects to meet its short-term liquidity requirements, including capital expenditures related to maintaining its existing properties and scheduled unsecured note and mortgage note repayments, through its working capital, net cash provided by operating activities and borrowings under the Company’s revolving credit facility and commercial paper program. Currently, the Company considers its cash provided by operating activities to be adequate to meet operating requirements and payments of distributions.
The following table presents the Company’s balances for cash and cash equivalents, restricted deposits and the available borrowing capacity on its revolving credit facility as of December 31, 2021 and 2020 (amounts in thousands):
|
|
|
December 31, 2021 |
|
|
December 31, 2020 |
|
||
|
Cash and cash equivalents |
|
$ |
123,832 |
|
|
$ |
42,591 |
|
|
Restricted deposits |
|
$ |
236,404 |
|
|
$ |
57,137 |
|
|
Unsecured revolving credit facility availability |
|
$ |
2,181,372 |
|
|
$ |
1,984,051 |
|
Credit Facility and Commercial Paper Program
The Company has a $2.5 billion unsecured revolving credit facility maturing November 1, 2024. The Company has the ability to increase available borrowings by an additional $750.0 million by adding lenders to the facility, obtaining the agreement of existing lenders to increase their commitments or incurring one or more term loans. The interest rate on advances under the facility will generally be the London Interbank Offered Rate (“LIBOR”) plus a spread (currently 0.775%), or based on bids received from the
33
lending group, and the Company pays an annual facility fee (currently 0.125%). Both the spread and the facility fee are dependent on the Company’s senior unsecured credit rating.
The unsecured revolving credit agreement contains provisions that establish a process for entering into an amendment to replace LIBOR under certain circumstances, such as the anticipated phase-out of LIBOR. See Item 7A for additional information with respect to the LIBOR transition.
The Company may borrow up to a maximum of $1.0 billion under its commercial paper program subject to market conditions. The notes will be sold under customary terms in the United States commercial paper note market and will rank pari passu with all of the Company’s other unsecured senior indebtedness.
The Company limits its utilization of the revolving credit facility in order to maintain liquidity to support its $1.0 billion commercial paper program along with certain other obligations. The following table presents the availability on the Company’s unsecured revolving credit facility as of February 11, 2022 (amounts in thousands):
|
|
|
February 11, 2022 |
|
|
|
Unsecured revolving credit facility commitment |
|
$ |
2,500,000 |
|
|
Commercial paper balance outstanding |
|
|
(300,000 |
) |
|
Unsecured revolving credit facility balance outstanding |
|
|
— |
|
|
Other restricted amounts |
|
|
(3,507 |
) |
|
Unsecured revolving credit facility availability |
|
$ |
2,196,493 |
|
Dividend Policy
The Company determines its dividends/distributions based on actual and projected financial conditions, the Company’s actual and projected liquidity and operating results, the Company’s projected cash needs for capital expenditures and other investment activities and such other factors as the Company’s Board of Trustees deems relevant. The Company declared a dividend/distribution for each quarter in 2021 of $0.6025 per share/unit, consistent with the amount paid in 2020. All future dividends/distributions remain subject to the discretion of the Company’s Board of Trustees.
Total dividends/distributions paid in January 2022 amounted to $233.5 million (excluding distributions on Partially Owned Properties), which consisted of certain distributions declared during the quarter ended December 31, 2021.
Long-Term Financing and Capital Needs
The Company expects to meet its long-term liquidity requirements, such as lump sum unsecured note and mortgage debt maturities, property acquisitions and financing of development activities, through the issuance of secured and unsecured debt and equity securities (including additional OP Units), proceeds received from the disposition of certain properties and joint ventures, along with cash generated from operations after all distributions. The Company has a significant number of unencumbered properties available to secure additional mortgage borrowings should unsecured capital be unavailable or the cost of alternative sources of capital be too high. The value of and cash flow from these unencumbered properties are in excess of the requirements the Company must maintain in order to comply with covenants under its unsecured notes and line of credit. Of the $28.3 billion in investment in real estate on the Company’s balance sheet at December 31, 2021, $24.5 billion or 86.7% was unencumbered. However, there can be no assurances that these sources of capital will be available to the Company in the future on acceptable terms or otherwise.
EQR issues equity and guarantees certain debt of the Operating Partnership from time to time. EQR does not have any indebtedness as all debt is incurred by the Operating Partnership.
34
The Company’s total debt summary schedule as of December 31, 2021 is as follows:
Debt Summary as of December 31, 2021
($ in thousands)
|
|
|
Debt Balances |
|
|
% of Total |
|
||
|
Secured |
|
$ |
2,191,201 |
|
|
|
26.3 |
% |
|
Unsecured |
|
|
6,150,252 |
|
|
|
73.7 |
% |
|
Total |
|
$ |
8,341,453 |
|
|
|
100.0 |
% |
|
Fixed Rate Debt: |
|
|
|
|
|
|
|
|
|
Secured – Conventional |
|
$ |
1,896,472 |
|
|
|
22.8 |
% |
|
Unsecured – Public |
|
|
5,835,222 |
|
|
|
69.9 |
% |
|
Fixed Rate Debt |
|
|
7,731,694 |
|
|
|
92.7 |
% |
|
Floating Rate Debt: |
|
|
|
|
|
|
|
|
|
Secured – Conventional |
|
|
59,890 |
|
|
|
0.7 |
% |
|
Secured – Tax Exempt |
|
|
234,839 |
|
|
|
2.8 |
% |
|
Unsecured – Revolving Credit Facility |
|
|
— |
|
|
|
— |
|
|
Unsecured – Commercial Paper Program |
|
|
315,030 |
|
|
|
3.8 |
% |
|
Floating Rate Debt |
|
|
609,759 |
|
|
|
7.3 |
% |
|
Total |
|
$ |
8,341,453 |
|
|
|
100.0 |
% |
The following table summarizes the Company’s debt maturity schedule as of December 31, 2021:
Debt Maturity Schedule as of December 31, 2021
($ in thousands)
|
Year |
|
Fixed Rate |
|
|
Floating Rate |
|
|
Total |
|
|
% of Total |
|
||||
|
2022 |
|
$ |
264,185 |
|
|
$ |
376,904 |
|
(1) |
$ |
641,089 |
|
|
|
7.6 |
% |
|
2023 |
|
|
1,325,588 |
|
|
|
3,500 |
|
|
|
1,329,088 |
|
|
|
15.8 |
% |
|
2024 |
|
|
— |
|
|
|
6,100 |
|
|
|
6,100 |
|
|
|
0.1 |
% |
|
2025 |
|
|
450,000 |
|
|
|
8,200 |
|
|
|
458,200 |
|
|
|
5.4 |
% |
|
2026 |
|
|
592,025 |
|
|
|
9,000 |
|
|
|
601,025 |
|
|
|
7.1 |
% |
|
2027 |
|
|
400,000 |
|
|
|
9,800 |
|
|
|
409,800 |
|
|
|
4.9 |
% |
|
2028 |
|
|
900,000 |
|
|
|
10,700 |
|
|
|
910,700 |
|
|
|
10.8 |
% |
|
2029 |
|
|
888,120 |
|
|
|
11,500 |
|
|
|
899,620 |
|
|
|
10.7 |
% |
|
2030 |
|
|
1,095,000 |
|
|
|
12,600 |
|
|
|
1,107,600 |
|
|
|
13.2 |
% |
|
2031 |
|
|
528,500 |
|
|
|
39,700 |
|
|
|
568,200 |
|
|
|
6.7 |
% |
|
2032+ |
|
|
1,350,850 |
|
|
|
138,900 |
|
|
|
1,489,750 |
|
|
|
17.7 |
% |
|
Subtotal |
|
|
7,794,268 |
|
|
|
626,904 |
|
|
|
8,421,172 |
|
|
|
100.0 |
% |
|
Deferred Financing Costs and Unamortized (Discount) |
|
|
(62,574 |
) |
|
|
(17,145 |
) |
|
|
(79,719 |
) |
|
N/A |
|
|
|
Total |
|
$ |
7,731,694 |
|
|
$ |
609,759 |
|
|
$ |
8,341,453 |
|
|
|
100.0 |
% |
|
(1) |
Includes $315.1 million in principal outstanding on the Company’s commercial paper program. |
Interest expected to be incurred on the Company’s secured and unsecured debt based on obligations outstanding at December 31, 2021, inclusive of capitalized interest, approximates $225.0 million annually for the next five years, with total remaining obligations of approximately $2.5 billion. For floating rate debt, the current rate in effect for the most recent payment through December 31, 2021 is assumed to be in effect through the respective maturity date of each instrument.
See Note 9 in the Notes to Consolidated Financial Statements for additional discussion of debt at December 31, 2021. See also Notes 8 and 16 in the Notes to Consolidated Financial Statements for additional discussion of contractual obligations and commitments as of December 31, 2021.
35
Capital Structure
The Company’s “Consolidated Debt-to-Total Market Capitalization Ratio” as of December 31, 2021 is presented in the following table. The Company calculates the equity component of its market capitalization as the sum of (i) the total outstanding Common Shares and assumed conversion of all Units at the equivalent market value of the closing price of the Company’s Common Shares on the New York Stock Exchange and (ii) the liquidation value of all perpetual preferred shares outstanding.
Equity Residential
Capital Structure as of December 31, 2021
(Amounts in thousands except for share/unit and per share amounts)
|
Secured Debt |
|
|
|
|
|
|
|
|
|
$ |
2,191,201 |
|
|
|
26.3 |
% |
|
|
|
|
|
Unsecured Debt |
|
|
|
|
|
|
|
|
|
|
6,150,252 |
|
|
|
73.7 |
% |
|
|
|
|
|
Total Debt |
|
|
|
|
|
|
|
|
|
|
8,341,453 |
|
|
|
100.0 |
% |
|
|
19.2 |
% |
|
Common Shares (includes Restricted Shares) |
|
|
375,527,195 |
|
|
|
96.7 |
% |
|
|
|
|
|
|
|
|
|
|
|
|
|
Units (includes OP Units and Restricted Units) |
|
|
12,659,027 |
|
|
|
3.3 |
% |
|
|
|
|
|
|
|
|
|
|
|
|
|
Total Shares and Units |
|
|
388,186,222 |
|
|
|
100.0 |
% |
|
|
|
|
|
|
|
|
|
|
|
|
|
Common Share Price at December 31, 2021 |
|
$ |
90.50 |
|
|
|
|
|
|
|
|
|
|
|
|
|
|
|
|
|
|
|
|
|
|
|
|
|
|
|
|
|
35,130,853 |
|
|
|
99.9 |
% |
|
|
|
|
|
Perpetual Preferred Equity |
|
|
|
|
|
|
|
|
|
|
37,280 |
|
|
|
0.1 |
% |
|
|
|
|
|
Total Equity |
|
|
|
|
|
|
|
|
|
|
35,168,133 |
|
|
|
100.0 |
% |
|
|
80.8 |
% |
|
Total Market Capitalization |
|
|
|
|
|
|
|
|
|
$ |
43,509,586 |
|
|
|
|
|
|
|
100.0 |
% |
The Operating Partnership’s “Consolidated Debt-to-Total Market Capitalization Ratio” as of December 31, 2021 is presented in the following table. The Operating Partnership calculates the equity component of its market capitalization as the sum of (i) the total outstanding Units at the equivalent market value of the closing price of the Company’s Common Shares on the New York Stock Exchange and (ii) the liquidation value of all perpetual preference units outstanding.
ERP Operating Limited Partnership
Capital Structure as of December 31, 2021
(Amounts in thousands except for unit and per unit amounts)
|
Secured Debt |
|
|
|
|
|
|
|
$ |
2,191,201 |
|
|
|
26.3 |
% |
|
|
|
|
|
Unsecured Debt |
|
|
|
|
|
|
|
|
6,150,252 |
|
|
|
73.7 |
% |
|
|
|
|
|
Total Debt |
|
|
|
|
|
|
|
|
8,341,453 |
|
|
|
100.0 |
% |
|
|
19.2 |
% |
|
Total Outstanding Units |
|
|
388,186,222 |
|
|
|
|
|
|
|
|
|
|
|
|
|
|
|
|
Common Share Price at December 31, 2021 |
|
$ |
90.50 |
|
|
|
|
|
|
|
|
|
|
|
|
|
|
|
|
|
|
|
|
|
|
|
|
|
35,130,853 |
|
|
|
99.9 |
% |
|
|
|
|
|
Perpetual Preference Units |
|
|
|
|
|
|
|
|
37,280 |
|
|
|
0.1 |
% |
|
|
|
|
|
Total Equity |
|
|
|
|
|
|
|
|
35,168,133 |
|
|
|
100.0 |
% |
|
|
80.8 |
% |
|
Total Market Capitalization |
|
|
|
|
|
|
|
$ |
43,509,586 |
|
|
|
|
|
|
|
100.0 |
% |
Financial Flexibility
EQR and ERPOP currently have an active universal shelf registration statement for the issuance of equity and debt securities that automatically became effective upon filing with the SEC in June 2019 and expires in June 2022. Per the terms of ERPOP’s partnership agreement, EQR contributes the net proceeds of all equity offerings to the capital of ERPOP in exchange for additional OP Units (on a one-for-one Common Share per OP Unit basis) or preference units (on a one-for-one preferred share per preference unit basis).
The Company has an At-The-Market (“ATM”) share offering program which allows EQR to issue Common Shares from time to time into the existing trading market at current market prices or through negotiated transactions, including under forward sale arrangements. The current program matures in June 2022 and gives EQR the authority to issue up to 13.0 million shares, all of which remain outstanding as of December 31, 2021, pending the settlement of the outstanding forward sale agreements. These forward sale agreements allow the Company, at its election, to settle the agreements by issuing Common Shares in exchange for net proceeds at the then-applicable forward sale price specified by the agreement or, alternatively, to settle the agreements in whole or in part through the delivery or receipt of Common Shares or cash. Issuances of shares under these forward sale agreements are classified as equity transactions. Accordingly, no amounts relating to the forward sale agreements are recorded in the consolidated financial statements
36
until settlement occurs. Prior to any settlements, the only impact to the consolidated financial statements is the inclusion of incremental shares, if any, within the calculation of diluted net income per share using the treasury stock method (see Note 11 in the Notes to Consolidated Financial Statements for additional discussion). The actual forward price per share to be received by the Company upon settlement will be determined on the applicable settlement date based on adjustments made to the initial forward price to reflect the then-current overnight federal funds rate and the amount of dividends paid to holders of the Company’s Common Shares over the term of the forward sale agreement.
As of February 11, 2022, the Company had entered into such forward sale agreements under this program for a total of approximately 1.7 million Common Shares at a weighted average initial forward price per share of $83.25. As of February 11, 2022, no shares under the forward sale agreements had been settled. These forward sale agreements must be settled by March 2023.
The Company may repurchase up to 13.0 million Common Shares under its share repurchase program. No open market repurchases have occurred since 2008, and no repurchases of any kind have occurred since February 2014. As of February 11, 2022, EQR has remaining authorization to repurchase up to 13.0 million of its shares.
We believe our ability to access capital markets is enhanced by ERPOP’s long-term senior debt ratings and short-term commercial paper ratings, as well as EQR’s long-term preferred equity ratings. As of February 11, 2022, the ratings are as follows:
|
|
|
Standard & Poor’s |
|
Moody's |
|
ERPOP's long-term senior debt rating |
|
A- |
|
A3 |
|
ERPOP's short-term commercial paper rating |
|
A-2 |
|
P-2 |
|
EQR's long-term preferred equity rating |
|
BBB |
|
Baa1 |
See Note 18 in the Notes to Consolidated Financial Statements for discussion of the events, if any, which occurred subsequent to December 31, 2021.
Definitions
The definition of certain terms described above or below are as follows:
|
|
• |
Acquisition Cap Rate – NOI that the Company anticipates receiving in the next 12 months (or the year two or three stabilized NOI for properties that are in lease-up at acquisition) less an estimate of property management costs/management fees allocated to the project (generally ranging from 2.0% to 4.0% of revenues depending on the size and income streams of the asset) and less an estimate for in-the-unit replacement capital expenditures (generally ranging from $100-$450 per apartment unit depending on the age and condition of the asset) divided by the gross purchase price of the asset. The weighted average Acquisition Cap Rate for acquired properties is weighted based on the projected NOI streams and the relative purchase price for each respective property. |
|
|
• |
Average Rental Rate – Total Residential rental revenues reflected on a straight-line basis in accordance with GAAP divided by the weighted average occupied apartment units for the reporting period presented. |
|
|
• |
Building Improvements – Includes roof replacement, paving, building mechanical equipment systems, exterior siding and painting, major landscaping, furniture, fixtures and equipment for amenities and common areas, vehicles and office and maintenance equipment. |
|
|
• |
Disposition Yield – NOI that the Company anticipates giving up in the next 12 months less an estimate of property management costs/management fees allocated to the project (generally ranging from 2.0% to 4.0% of revenues depending on the size and income streams of the asset) and less an estimate for in-the-unit replacement capital expenditures (generally ranging from $100-$450 per apartment unit depending on the age and condition of the asset) divided by the gross sales price of the asset. The weighted average Disposition Yield for sold properties is weighted based on the projected NOI streams and the relative sales price for each respective property. |
|
|
• |
Leasing Concessions – Reflects upfront discounts on both new move-in and renewal leases on a straight-line basis. |
|
|
• |
Non-Residential – Consists of revenues and expenses from retail and public parking garage operations. |
|
|
• |
Non-Same Store Properties – For annual comparisons, primarily includes all properties acquired during 2020 and 2021, plus any properties in lease-up and not stabilized as of January 1, 2020. |
|
|
• |
Percentage of Residents Renewing – Leases renewed expressed as a percentage of total renewal offers extended during the reporting period. |
|
|
• |
Physical Occupancy – The weighted average occupied apartment units for the reporting period divided by the average of total apartment units available for rent for the reporting period. |
37
|
|
• |
Renovation Expenditures – Apartment unit renovation costs (primarily kitchens and baths) designed to reposition these units for higher rental levels in their respective markets. |
|
|
• |
Replacements – Includes appliances, mechanical equipment, fixtures and flooring (including hardwood and carpeting). |
|
|
• |
Residential – Consists of multifamily apartment revenues and expenses. |
|
|
• |
Same Store Properties – For annual comparisons, primarily includes all properties acquired or completed that are stabilized prior to January 1, 2020, less properties subsequently sold. Properties are included in Same Store when they are stabilized for all of the current and comparable periods presented. |
|
|
• |
Same Store Residential Revenues – Revenues from our same store properties presented on a GAAP basis which reflects the impact of Leasing Concessions on a straight-line basis. |
|
|
• |
% of Stabilized Budgeted NOI – Represents original budgeted 2022 NOI for stabilized properties and projected annual NOI at stabilization (defined as having achieved 90% occupancy for three consecutive months) for properties that are in lease-up. |
|
|
• |
Total Budgeted Capital Cost – Estimated remaining cost for projects under development and/or developed plus all capitalized costs incurred to date, including land acquisition costs, construction costs, capitalized real estate taxes and insurance, capitalized interest and loan fees, permits, professional fees, allocated development overhead and other regulatory fees, plus any estimates of costs remaining to be funded for all projects, all in accordance with GAAP. Amounts for partially owned consolidated and unconsolidated properties are presented at 100% of the project. |
|
|
• |
Turnover – Total Residential move-outs (including inter-property and intra-property transfers) divided by total Residential apartment units. |
|
|
• |
Unlevered Internal Rate of Return (“IRR”) – The Unlevered IRR on sold properties is the compound annual rate of return calculated by the Company based on the timing and amount of: (i) the gross purchase price of the property plus any direct acquisition costs incurred by the Company; (ii) total revenues earned during the Company’s ownership period; (iii) total direct property operating expenses (including real estate taxes and insurance) incurred during the Company’s ownership period; (iv) capital expenditures incurred during the Company’s ownership period; and (v) the gross sales price of the property net of selling costs. |
38
Critical Accounting Policies and Estimates
The preparation of financial statements in conformity with accounting principles generally accepted in the United States requires management to use judgment in the application of accounting policies, including making estimates and assumptions. If our judgment or interpretation of the facts and circumstances relating to various transactions had been different or different assumptions were made, it is possible that different accounting policies would have been applied, resulting in different financial results or different presentation of our financial statements.
The Company’s significant accounting policies are described in Note 2 in the Notes to Consolidated Financial Statements. These policies were followed in preparing the consolidated financial statements at and for the year ended December 31, 2021.
The Company has identified the significant accounting policies below as critical accounting policies. These critical accounting policies are those that have the most impact on the reporting of our financial condition and those requiring significant judgments and estimates. With respect to these critical accounting policies, management believes that the application of judgments and estimates is consistently applied and produces financial information that fairly presents the results of operations for all periods presented.
Impairment of Long-Lived Assets
The Company evaluates its long-lived assets, including its investment in real estate, for indicators of impairment at least quarterly. The judgments regarding the existence of impairment indicators are based on factors such as operational performance, market conditions, legal, regulatory and environmental concerns, the Company’s intent and ability to hold the related asset, as well as any significant cost overruns on development properties. Future events could occur which would cause the Company to conclude that impairment indicators exist and an impairment loss is warranted. Assessing impairment can be complex and involves a high degree of subjectivity in determining if indicators are present and in estimating the future undiscounted cash flows or the fair value of an asset. In particular, these estimates are sensitive to significant assumptions, including the estimation of future rental revenues, operating expenses, discount and capitalization rates and our intent and ability to hold the related asset, all of which could be affected by our expectations about future market or economic conditions. Assumptions are primarily subject to property-specific characteristics, especially with respect to our intent and ability to hold the related asset. While these property-specific assumptions can have a significant impact on the undiscounted cash flows or estimated fair value of a particular asset, our evaluation of the reported carrying values of long-lived assets during the current year were not particularly sensitive to external or market assumptions.
Acquisition of Investment Properties
The Company allocates the purchase price of properties that meet the definition of an asset acquisition to net tangible and identified intangible assets acquired based on their relative fair values using assumptions primarily based upon property-specific characteristics. In making estimates of relative fair values for purposes of allocating purchase price, the Company utilizes a number of sources, including independent appraisals that may be obtained in connection with the acquisition or financing of the respective property, our own analysis of recently acquired or developed and existing comparable properties in our portfolio and other market data. The Company also considers information obtained about each property as a result of its pre-acquisition due diligence, marketing and leasing activities in estimating the relative fair value of the tangible and intangible assets/liabilities acquired.
39
Funds From Operations and Normalized Funds From Operations
The following is the Company’s and the Operating Partnership’s reconciliation of net income to FFO available to Common Shares and Units / Units and Normalized FFO available to Common Shares and Units / Units for each of the three years ended December 31, 2021:
Funds From Operations and Normalized Funds From Operations
(Amounts in thousands)
|
|
|
Year Ended December 31, |
|
|||||||||
|
|
|
2021 |
|
|
2020 |
|
|
2019 |
|
|||
|
Net income |
|
$ |
1,396,714 |
|
|
$ |
962,501 |
|
|
$ |
1,009,708 |
|
|
Net (income) loss attributable to Noncontrolling Interests – Partially Owned Properties |
|
|
(17,964 |
) |
|
|
(14,855 |
) |
|
|
(3,297 |
) |
|
Preferred/preference distributions |
|
|
(3,090 |
) |
|
|
(3,090 |
) |
|
|
(3,090 |
) |
|
Net income available to Common Shares and Units / Units |
|
|
1,375,660 |
|
|
|
944,556 |
|
|
|
1,003,321 |
|
|
Adjustments: |
|
|
|
|
|
|
|
|
|
|
|
|
|
Depreciation |
|
|
838,272 |
|
|
|
820,832 |
|
|
|
831,083 |
|
|
Depreciation – Non-real estate additions |
|
|
(4,277 |
) |
|
|
(4,564 |
) |
|
|
(5,585 |
) |
|
Depreciation – Partially Owned Properties |
|
|
(3,673 |
) |
|
|
(3,345 |
) |
|
|
(3,599 |
) |
|
Depreciation – Unconsolidated Properties |
|
|
2,487 |
|
|
|
2,454 |
|
|
|
2,997 |
|
|
Net (gain) loss on sales of unconsolidated entities - operating assets |
|
|
(1,304 |
) |
|
|
(1,636 |
) |
|
|
(69,522 |
) |
|
Net (gain) loss on sales of real estate properties |
|
|
(1,072,183 |
) |
|
|
(531,807 |
) |
|
|
(447,637 |
) |
|
Noncontrolling Interests share of gain (loss) on sales of real estate properties |
|
|
15,650 |
|
|
|
11,655 |
|
|
|
— |
|
|
FFO available to Common Shares and Units / Units (1) (3) (4) |
|
|
1,150,632 |
|
|
|
1,238,145 |
|
|
|
1,311,058 |
|
|
Adjustments: |
|
|
|
|
|
|
|
|
|
|
|
|
|
Impairment – non-operating assets |
|
|
16,769 |
|
|
|
— |
|
|
|
— |
|
|
Write-off of pursuit costs |
|
|
6,526 |
|
|
|
6,869 |
|
|
|
5,529 |
|
|
Debt extinguishment and preferred share redemption (gains) losses |
|
|
744 |
|
|
|
39,292 |
|
|
|
23,991 |
|
|
Non-operating asset (gains) losses |
|
|
(22,283 |
) |
|
|
(32,590 |
) |
|
|
(940 |
) |
|
Other miscellaneous items |
|
|
8,976 |
|
|
|
4,652 |
|
|
|
8,430 |
|
|
Normalized FFO available to Common Shares and Units / Units (2) (3) (4) |
|
$ |
1,161,364 |
|
|
$ |
1,256,368 |
|
|
$ |
1,348,068 |
|
|
|
|
|
|
|
|
|
|
|
|
|
|
|
|
FFO (1) (3) |
|
$ |
1,153,722 |
|
|
$ |
1,241,235 |
|
|
$ |
1,314,148 |
|
|
Preferred/preference distributions |
|
|
(3,090 |
) |
|
|
(3,090 |
) |
|
|
(3,090 |
) |
|
FFO available to Common Shares and Units / Units (1) (3) (4) |
|
$ |
1,150,632 |
|
|
$ |
1,238,145 |
|
|
$ |
1,311,058 |
|
|
|
|
|
|
|
|
|
|
|
|
|
|
|
|
Normalized FFO (2) (3) |
|
$ |
1,164,454 |
|
|
$ |
1,259,458 |
|
|
$ |
1,351,158 |
|
|
Preferred/preference distributions |
|
|
(3,090 |
) |
|
|
(3,090 |
) |
|
|
(3,090 |
) |
|
Normalized FFO available to Common Shares and Units / Units (2) (3) (4) |
|
$ |
1,161,364 |
|
|
$ |
1,256,368 |
|
|
$ |
1,348,068 |
|
|
(1) |
The National Association of Real Estate Investment Trusts (“Nareit”) defines funds from operations (“FFO”) (December 2018 White Paper) as net income (computed in accordance with accounting principles generally accepted in the United States (“GAAP”)), excluding gains or losses from sales and impairment write-downs of depreciable real estate and land when connected to the main business of a REIT, impairment write-downs of investments in entities when the impairment is directly attributable to decreases in the value of depreciable real estate held by the entity and depreciation and amortization related to real estate. Adjustments for partially owned consolidated and unconsolidated partnerships and joint ventures are calculated to reflect funds from operations on the same basis. |
|
(2) |
Normalized funds from operations (“Normalized FFO”) begins with FFO and excludes: |
|
|
• |
the impact of any expenses relating to non-operating asset impairment; |
|
|
• |
pursuit cost write-offs; |
|
|
• |
gains and losses from early debt extinguishment and preferred share redemptions; |
|
|
• |
gains and losses from non-operating assets; and |
|
|
• |
other miscellaneous items. |
40
|
(3) |
The Company believes that FFO and FFO available to Common Shares and Units / Units are helpful to investors as supplemental measures of the operating performance of a real estate company, because they are recognized measures of performance by the real estate industry and by excluding gains or losses from sales and impairment write-downs of depreciable real estate and excluding depreciation related to real estate (which can vary among owners of identical assets in similar condition based on historical cost accounting and useful life estimates), FFO and FFO available to Common Shares and Units / Units can help compare the operating performance of a company’s real estate between periods or as compared to different companies. The Company also believes that Normalized FFO and Normalized FFO available to Common Shares and Units / Units are helpful to investors as supplemental measures of the operating performance of a real estate company because they allow investors to compare the Company’s operating performance to its performance in prior reporting periods and to the operating performance of other real estate companies without the effect of items that by their nature are not comparable from period to period and tend to obscure the Company’s actual operating results. FFO, FFO available to Common Shares and Units / Units, Normalized FFO and Normalized FFO available to Common Shares and Units / Units do not represent net income, net income available to Common Shares / Units or net cash flows from operating activities in accordance with GAAP. Therefore, FFO, FFO available to Common Shares and Units / Units, Normalized FFO and Normalized FFO available to Common Shares and Units / Units should not be exclusively considered as alternatives to net income, net income available to Common Shares / Units or net cash flows from operating activities as determined by GAAP or as a measure of liquidity. The Company’s calculation of FFO, FFO available to Common Shares and Units / Units, Normalized FFO and Normalized FFO available to Common Shares and Units / Units may differ from other real estate companies due to, among other items, variations in cost capitalization policies for capital expenditures and, accordingly, may not be comparable to such other real estate companies. |
|
(4) |
FFO available to Common Shares and Units / Units and Normalized FFO available to Common Shares and Units / Units are calculated on a basis consistent with net income available to Common Shares / Units and reflects adjustments to net income for preferred distributions and premiums on redemption of preferred shares/preference units in accordance with GAAP. The equity positions of various individuals and entities that contributed their properties to the Operating Partnership in exchange for OP Units are collectively referred to as the “Noncontrolling Interests – Operating Partnership”. Subject to certain restrictions, the Noncontrolling Interests – Operating Partnership may exchange their OP Units for Common Shares on a one-for-one basis. |
41
Item 7A. Quantitative and Qualitative Disclosures about Market Risk
The Company is exposed to market risk from financial instruments primarily from changes in interest rates. Such risks derive from the refinancing of debt maturities, from exposure to interest rate fluctuations on floating rate debt and from derivative instruments utilized to swap fixed rate debt to floating or to hedge rates in anticipation of future debt issuances. Our operating results are, therefore, affected by changes in short-term interest rates, primarily LIBOR and Securities Industry and Financial Markets Association (“SIFMA”) indices, which directly impact borrowings under our revolving credit facility and interest on secured and unsecured borrowings contractually tied to such rates. Short-term interest rates also indirectly affect the discount on notes issued under our commercial paper program. Additionally, we have exposure to long-term interest rates, particularly U.S. Treasuries as they are utilized to price our long-term borrowings and therefore affect the cost of refinancing existing debt or incurring additional debt.
In the U.S., the Alternative Rates Reference Committee (the “ARRC”), a group of market participants convened in 2014 to help ensure a successful transition away from USD LIBOR, has identified the Secured Overnight Financing Rate (“SOFR”) as its preferred alternative rate. As part of the transition process that is now under way, LIBOR is no longer published for certain tenors and key USD settings are expected to be discontinued by June 2023. LIBOR is the primary basis for determining interest payments on borrowings on the Company’s $2.5 billion revolving credit facility. This facility contains provisions that establish a process for entering into an amendment to replace LIBOR under certain circumstances. We are closely monitoring the evolution of practices in the credit market and we do not expect such transition to have a material impact on the Company’s financial position or cash flows.
The Company monitors and manages interest rates as part of its risk management process, by targeting adequate levels of floating rate exposure and an appropriate debt maturity profile. From time to time, we may utilize derivative instruments to manage interest rate exposure and to comply with the requirements of certain lenders, but not for trading or speculative purposes.
The Company had total variable rate debt of $0.6 billion, representing 7.3% of total debt, and $0.8 billion, representing 10.0% of total debt, as of December 31, 2021 and 2020, respectively. If interest rates had been 100 basis points higher in 2021 and 2020 and average balances coincided with year end balances, our annual interest expense would have been $6.1 million and $8.1 million higher, respectively. Unsecured notes issued under the Company’s commercial paper program are treated as variable rate debt for the purposes of this calculation even though they do not have a stated interest rate, given their short-term nature. The effect of derivatives, if applicable, is also considered when computing the total amount of variable rate debt.
Changes in interest rates also affect the estimated fair market value of our fixed rate debt, computed using a discounted cash flow model. As of December 31, 2021, the Company had total outstanding fixed rate debt of $7.7 billion, or 92.7% of total debt, with an estimated fair market value of $8.4 billion. If interest rates had been 100 basis points lower as of December 31, 2021, the estimated fair market value would have increased by approximately $637.2 million. As of December 31, 2020, the Company had total outstanding fixed rate debt of $7.2 billion, or 90.0% of total debt, with an estimated fair market value of $8.2 billion. If interest rates had been 100 basis points lower as of December 31, 2020, the estimated fair market value would have increased by approximately $686.6 million.
These amounts were determined by considering the impact of hypothetical interest rates on the Company’s financial instruments. These analyses do not consider the effects of the changes in overall economic activity that could exist in such an environment. Further, in the event of changes of such magnitude, management would likely take actions to further mitigate its exposure to these changes. However, due to the uncertainty of the specific actions that would be taken and their possible effects, this analysis assumes no changes in the Company’s financial structure or results.
The Company cannot predict the effect of adverse changes in interest rates on its debt and derivative instruments and, therefore, its exposure to market risk, nor can there be any assurance that long-term debt will be available at advantageous pricing. Consequently, future results may differ materially from the estimated adverse changes discussed above.
Item 8. Financial Statements and Supplementary Data
See Index to Consolidated Financial Statements and Schedule on page F-1 of this Form 10-K.
Item 9. Changes in and Disagreements with Accountants on Accounting and Financial Disclosure
None.
Item 9A. Controls and Procedures
Equity Residential
(a) Evaluation of Disclosure Controls and Procedures:
Effective as of December 31, 2021, the Company carried out an evaluation, under the supervision and with the participation of the Company’s management, including the Chief Executive Officer and Chief Financial Officer, of the effectiveness of the
42
Company’s disclosure controls and procedures pursuant to Exchange Act Rules 13a-15 and 15d-15. Based on that evaluation, the Chief Executive Officer and Chief Financial Officer concluded that the disclosure controls and procedures are effective to ensure that information required to be disclosed by the Company in its Exchange Act filings is recorded, processed, summarized and reported within the time periods specified in the SEC’s rules and forms.
(b) Management’s Report on Internal Control over Financial Reporting:
Equity Residential’s management is responsible for establishing and maintaining adequate internal control over financial reporting, as such term is defined in Rule 13a-15(f) under the Exchange Act. Under the supervision and with the participation of management, including the Company’s Chief Executive Officer and Chief Financial Officer, management conducted an evaluation of the effectiveness of internal control over financial reporting based on the framework in Internal Control – Integrated Framework issued by the Committee of Sponsoring Organizations of the Treadway Commission (2013 framework).
Because of its inherent limitations, internal control over financial reporting may not prevent or detect misstatements. Therefore, even those systems determined to be effective can only provide reasonable assurance with respect to financial statement preparation and presentation.
Based on the Company’s evaluation under the framework in Internal Control – Integrated Framework, management concluded that its internal control over financial reporting was effective as of December 31, 2021. Our internal control over financial reporting has been audited as of December 31, 2021 by Ernst & Young LLP, an independent registered public accounting firm, as stated in their report which is included herein.
(c) Changes in Internal Control over Financial Reporting:
There were no changes to the internal control over financial reporting of the Company identified in connection with the Company’s evaluation referred to above that occurred during the fourth quarter of 2021 that have materially affected, or are reasonably likely to materially affect, the Company’s internal control over financial reporting.
ERP Operating Limited Partnership
(a) Evaluation of Disclosure Controls and Procedures:
Effective as of December 31, 2021, the Operating Partnership carried out an evaluation, under the supervision and with the participation of the Operating Partnership’s management, including the Chief Executive Officer and Chief Financial Officer of EQR, of the effectiveness of the Operating Partnership’s disclosure controls and procedures pursuant to Exchange Act Rules 13a-15 and 15d-15. Based on that evaluation, the Chief Executive Officer and Chief Financial Officer concluded that the disclosure controls and procedures are effective to ensure that information required to be disclosed by the Operating Partnership in its Exchange Act filings is recorded, processed, summarized and reported within the time periods specified in the SEC’s rules and forms.
(b) Management’s Report on Internal Control over Financial Reporting:
ERP Operating Limited Partnership’s management is responsible for establishing and maintaining adequate internal control over financial reporting, as such term is defined in Rule 13a-15(f) under the Exchange Act. Under the supervision and with the participation of management, including the Chief Executive Officer and Chief Financial Officer of EQR, management conducted an evaluation of the effectiveness of internal control over financial reporting based on the framework in Internal Control – Integrated Framework issued by the Committee of Sponsoring Organizations of the Treadway Commission (2013 framework).
Because of its inherent limitations, internal control over financial reporting may not prevent or detect misstatements. Therefore, even those systems determined to be effective can only provide reasonable assurance with respect to financial statement preparation and presentation.
Based on the Operating Partnership’s evaluation under the framework in Internal Control – Integrated Framework, management concluded that its internal control over financial reporting was effective as of December 31, 2021. Our internal control over financial reporting has been audited as of December 31, 2021 by Ernst & Young LLP, an independent registered public accounting firm, as stated in their report which is included herein.
43
(c) Changes in Internal Control over Financial Reporting:
There were no changes to the internal control over financial reporting of the Operating Partnership identified in connection with the Operating Partnership’s evaluation referred to above that occurred during the fourth quarter of 2021 that have materially affected, or are reasonably likely to materially affect, the Operating Partnership’s internal control over financial reporting.
Item 9B. Other Information
None.
Item 9C. Disclosure Regarding Foreign Jurisdictions that Prevent Inspections
Not applicable.
44
PART III
Items 10, 11, 12, 13 and 14.
Trustees, Executive Officers and Corporate Governance; Executive Compensation; Security Ownership of Certain Beneficial Owners and Management and Related Stockholder Matters; Certain Relationships and Related Transactions, and Trustee Independence; and Principal Accountant Fees and Services
The information required by Item 10, Item 11, Item 12, Item 13 and Item 14 is incorporated by reference to, and will be contained in, Equity Residential’s Proxy Statement, which the Company intends to file no later than 120 days after the end of its fiscal year ended December 31, 2021, and thus these items have been omitted in accordance with General Instruction G(3) to Form 10-K. Equity Residential is the general partner and 96.7% owner of ERP Operating Limited Partnership.
45
PART IV
Item 15. Exhibit and Financial Statement Schedules
(a) The following documents are filed as part of this Report:
|
|
(1) |
Financial Statements: See Index to Consolidated Financial Statements and Schedule on page F-1 of this Form 10-K. |
|
|
(2) |
Exhibits: See the Exhibit Index. |
|
|
(3) |
Financial Statement Schedules: See Index to Consolidated Financial Statements and Schedule on page F-1 of this Form 10-K. |
Item 16. Form 10-K Summary
None.
46
EXHIBIT INDEX
The exhibits listed below are filed as part of this report. References to exhibits or other filings under the caption “Location” indicate that the exhibit or other filing has been filed, that the indexed exhibit and the exhibit referred to are the same and that the exhibit referred to is incorporated by reference. The Commission file numbers for our Exchange Act filings referenced below are 1-12252 (Equity Residential) and 0-24920 (ERP Operating Limited Partnership).
|
Exhibit |
|
Description |
|
Location |
|
3.1 |
|
Articles of Restatement of Declaration of Trust of Equity Residential dated December 9, 2004. |
|
Included as Exhibit 3.1 to Equity Residential’s Form 10-K for the year ended December 31, 2004. |
|
|
|
|
|
|
|
3.2 |
|
Eighth Amended and Restated Bylaws of Equity Residential, effective as of October 1, 2015. |
|
Included as Exhibit 3.1 to Equity Residential's Form 8-K dated and filed on October 1, 2015. |
|
|
|
|
|
|
|
3.3 |
|
|
Included as Exhibit 3.1 to Equity Residential's Form 8-K dated and filed on November 20, 2017. |
|
|
|
|
|
|
|
|
3.4 |
|
|
Included as Exhibit 3.1 to Equity Residential's Form 8-K dated May 4, 2020, filed on May 8, 2020. |
|
|
|
|
|
|
|
|
3.5 |
|
|
Included as Exhibit 10.1 to Equity Residential's and ERP Operating Limited Partnership's Form 8-K dated March 18, 2021, filed on March 24, 2021. |
|
|
|
|
|
|
|
|
4.1 |
|
|
Included as Exhibit 4.1 to Equity Residential's and ERP Operating Limited Partnership's Form 10-K for the year ended December 31, 2019. |
|
|
|
|
|
|
|
|
4.2 |
|
|
Included as Exhibit 4.2 to Equity Residential's and ERP Operating Limited Partnership's Form 10-K for the year ended December 31, 2019. |
|
|
|
|
|
|
|
|
4.3 |
|
|
Attached herein. |
|
|
|
|
|
|
|
|
4.4 |
|
Indenture, dated October 1, 1994, between the Operating Partnership and The Bank of New York Mellon Trust Company, N.A., as successor trustee (“Indenture”). |
|
Included as Exhibit 4(a) to ERP Operating Limited Partnership’s Form S-3 filed on October 7, 1994. ** |
|
|
|
|
|
|
|
4.5 |
|
First Supplemental Indenture to Indenture, dated as of September 9, 2004. |
|
Included as Exhibit 4.2 to ERP Operating Limited Partnership’s Form 8-K, filed on September 10, 2004. |
|
|
|
|
|
|
|
4.6 |
|
Second Supplemental Indenture to Indenture, dated as of August 23, 2006. |
|
Included as Exhibit 4.1 to ERP Operating Limited Partnership’s Form 8-K dated August 16, 2006, filed on August 23, 2006. |
|
|
|
|
|
|
|
4.7 |
|
Third Supplemental Indenture to Indenture, dated as of June 4, 2007. |
|
Included as Exhibit 4.1 to ERP Operating Limited Partnership’s Form 8-K dated May 30, 2007, filed on June 1, 2007. |
|
|
|
|
|
|
|
4.8 |
|
Fourth Supplemental Indenture to Indenture, dated as of December 12, 2011. |
|
Included as Exhibit 4.2 to ERP Operating Limited Partnership's Form 8-K dated December 7, 2011, filed on December 9, 2011. |
|
|
|
|
|
|
|
4.9 |
|
Fifth Supplemental Indenture to Indenture, dated as of February 1, 2016. |
|
Included as Exhibit 4.6 to Equity Residential's and ERP Operating Limited Partnership's Form 10-K for the year ended December 31, 2015. |
|
|
|
|
|
|
|
4.10 |
|
|
Included as Exhibit 4.1 to ERP Operating Limited Partnership's Form 8-K dated April 3, 2013, filed on April 8, 2013. |
|
|
|
|
|
|
|
|
4.11 |
|
|
Included as Exhibit 4.1 to ERP Operating Limited Partnership's Form 8-K dated May 11, 2015, filed on May 13, 2015. |
|
|
|
|
|
|
|
|
4.12 |
|
|
Included as Exhibit 1 to ERP Operating Limited Partnership’s Form 8-K, filed on August 13, 1996. |
|
|
|
|
|
|
|
|
4.13 |
|
|
Included as Exhibit 4.1 to ERP Operating Limited Partnership's Form 8-K dated October 4, 2016, filed on October 7, 2016. |
|
|
|
|
|
|
|
|
4.14 |
|
|
Included as Exhibit 4.1 to Equity Residential's and ERP Operating Limited Partnership's Form 8-K dated July 31, 2017, filed on August 2, 2017. |
|
|
|
|
|
|
|
|
4.15 |
|
|
Included as Exhibit 4.1 to Equity Residential's and ERP Operating Limited Partnership's Form 8-K dated February 1, 2018, filed on February 6, 2018. |
|
|
|
|
|
|
|
47
|
4.16 |
|
|
Included as Exhibit 4.1 to Equity Residential's and ERP Operating Limited Partnership's Form 8-K dated November 28, 2018, filed on November 29, 2018. |
|
|
|
|
|
|
|
|
4.17 |
|
|
Included as Exhibit 4.1 to Equity Residential's and ERP Operating Limited Partnership's Form 8-K dated June 17, 2019, filed on June 20, 2019. |
|
|
|
|
|
|
|
|
4.18 |
|
|
Included as Exhibit 4.1 to Equity Residential's and ERP Operating Limited Partnership's Form 8-K dated August 20, 2019, filed on August 22, 2019. |
|
|
|
|
|
|
|
|
4.19 |
|
|
Included as Exhibit 4.1 to Equity Residential's and ERP Operating Limited Partnership's Form 8-K dated August 3, 2021, filed on August 5, 2021. |
|
|
|
|
|
|
|
|
4.20 |
|
|
Included as Exhibit 4.2 to ERP Operating Limited Partnership's Form 8-K dated June 16, 2014, filed on June 18, 2014. |
|
|
|
|
|
|
|
|
4.21 |
|
|
Included as Exhibit 4.2 to ERP Operating Limited Partnership's Form 8-K dated May 11, 2015, filed on May 13, 2015. |
|
|
|
|
|
|
|
|
4.22 |
|
|
Included as Exhibit 4.2 to Equity Residential's and ERP Operating Limited Partnership's Form 8-K dated July 31, 2017, filed on August 2, 2017. |
|
|
|
|
|
|
|
|
10.1 |
* |
Noncompetition Agreement (Zell). |
|
Included as an exhibit to Equity Residential's Form S-11 Registration Statement, File No. 33-63158. ** |
|
|
|
|
|
|
|
10.2 |
|
|
Included as Exhibit 10.1 to Equity Residential's and ERP Operating Limited Partnership's Form 8-K dated November 1, 2019, filed on November 4, 2019. |
|
|
|
|
|
|
|
|
10.3 |
|
|
Included as Exhibit 10.1 to Equity Residential's and ERP Operating Limited Partnership's Form 10-Q for the quarterly period ended September 30, 2021. |
|
|
|
|
|
|
|
|
10.4 |
|
Amended and Restated Limited Partnership Agreement of Lexford Properties, L.P. |
|
Included as Exhibit 10.16 to Equity Residential's Form 10-K for the year ended December 31, 1999. |
|
|
|
|
|
|
|
10.5 |
* |
|
Included as Exhibit 99.1 to Equity Residential's and ERP Operating Limited Partnership's Form 8-K dated June 27, 2019, filed on July 1, 2019. |
|
|
|
|
|
|
|
|
10.6 |
* |
|
Included as Exhibit 99.1 to Equity Residential's and ERP Operating Limited Partnership's Form 8-K dated June 16, 2011, filed on June 22, 2011. |
|
|
|
|
|
|
|
|
10.7 |
* |
|
Included as Exhibit 10.1 to Equity Residential's and ERP Operating Limited Partnership's Form 10-Q for the quarterly period ended June 30, 2012. |
|
|
|
|
|
|
|
|
10.8 |
* |
|
Included as Exhibit 10.1 to Equity Residential's and ERP Operating Limited Partnership's Form 10-Q for the quarterly period ended September 30, 2013. |
|
|
|
|
|
|
|
|
10.9 |
* |
|
Included as Exhibit 10.1 to Equity Residential's and ERP Operating Limited Partnership's Form 10-Q for the quarterly period ended March 31, 2014. |
|
|
|
|
|
|
|
|
10.10 |
* |
|
Included as Exhibit 10.1 to Equity Residential's and ERP Operating Limited Partnership's Form 10-Q for the quarterly period ended September 30, 2014. |
|
|
|
|
|
|
|
|
10.11 |
* |
|
Included as Exhibit 10.1 to Equity Residential's and ERP Operating Limited Partnership's Form 10-Q for the quarterly period ended June 30, 2016. |
|
|
|
|
|
|
|
|
10.12 |
* |
|
Included as Exhibit 10.18 to Equity Residential's and ERP Operating Limited Partnership's Form 10-K for the year ended December 31, 2016. |
|
|
|
|
|
|
|
|
10.13 |
* |
|
Included as Exhibit 10.1 to Equity Residential's and ERP Operating Limited Partnership's Form 10-Q for the quarterly period ended September 30, 2017. |
|
|
|
|
|
|
|
48
|
10.14 |
* |
|
Included as Exhibit 10.1 to Equity Residential's and ERP Operating Limited Partnership's Form 10-Q for the quarterly period ended March 31, 2018. |
|
|
|
|
|
|
|
|
10.15 |
* |
Form of Change in Control/Severance Agreement between the Company and other executive officers. |
|
Included as Exhibit 10.13 to Equity Residential's Form 10-K for the year ended December 31, 2001. |
|
|
|
|
|
|
|
10.16 |
* |
|
Included as Exhibit 10.1 to Equity Residential's Form 10-Q for the quarterly period ended March 31, 2009. |
|
|
|
|
|
|
|
|
10.17 |
* |
Form of Indemnification Agreement between the Company and each trustee and executive officer. |
|
Included as Exhibit 10.18 to Equity Residential's Form 10-K for the year ended December 31, 2003. |
|
|
|
|
|
|
|
10.18 |
* |
|
Included as Exhibit 10.24 to Equity Residential's Form 10-K for the year ended December 31, 2006. |
|
|
|
|
|
|
|
|
10.19 |
* |
Retirement Benefits Agreement between Samuel Zell and the Company dated October 18, 2001. |
|
Included as Exhibit 10.18 to Equity Residential's Form 10-K for the year ended December 31, 2001. |
|
|
|
|
|
|
|
10.20 |
* |
|
Included as Exhibit 10.1 to Equity Residential's and ERP Operating Limited Partnership's Form 10-Q for the quarterly period ended September 30, 2018. |
|
|
|
|
|
|
|
|
10.21 |
* |
|
Included as Exhibit 10.1 to Equity Residential's and ERP Operating Limited Partnership's Form 10-Q for the quarterly period ended March 31, 2020. |
|
|
|
|
|
|
|
|
10.22 |
* |
|
Included as Exhibit 10.2 to Equity Residential's and ERP Operating Limited Partnership's Form 10-Q for the quarterly period ended June 30, 2017. |
|
|
|
|
|
|
|
|
10.23 |
* |
|
Included as Exhibit 10.1 to Equity Residential's and ERP Operating Limited Partnership's Form 10-Q for the quarterly period ended June 30, 2020. |
|
|
|
|
|
|
|
|
10.24 |
* |
|
Included as Exhibit 10.2 to Equity Residential's Form 10-Q for the quarterly period ended March 31, 2008. |
|
|
|
|
|
|
|
|
10.25 |
|
|
Included as Exhibit 1.1 to Equity Residential's and ERP Operating Limited Partnership's Form 8-K dated and filed on June 6, 2019. |
|
|
|
|
|
|
|
|
10.26 |
|
|
Included as Exhibit 1.2 to Equity Residential's and ERP Operating Limited Partnership's Form 8-K dated and filed on June 6, 2019. |
|
|
|
|
|
|
|
|
10.27 |
|
Archstone Residual JV, LLC Limited Liability Company Agreement. |
|
Included as Exhibit 10.3 to Equity Residential's and ERP Operating Limited Partnership's Form 8-K dated February 27, 2013, filed on February 28, 2013. |
|
|
|
|
|
|
|
10.28 |
|
Archstone Parallel Residual JV, LLC Limited Liability Company Agreement. |
|
Included as Exhibit 10.4 to Equity Residential's and ERP Operating Limited Partnership's Form 8-K dated February 27, 2013, filed on February 28, 2013. |
|
|
|
|
|
|
|
10.29 |
|
Archstone Parallel Residual JV 2, LLC Limited Liability Company Agreement. |
|
Included as Exhibit 10.5 to Equity Residential's and ERP Operating Limited Partnership's Form 8-K dated February 27, 2013, filed on February 28, 2013. |
|
|
|
|
|
|
|
10.30 |
|
Legacy Holdings JV, LLC Limited Liability Company Agreement. |
|
Included as Exhibit 10.6 to Equity Residential's and ERP Operating Limited Partnership's Form 8-K dated February 27, 2013, filed on February 28, 2013. |
|
|
|
|
|
|
|
21 |
|
List of Subsidiaries of Equity Residential and ERP Operating Limited Partnership. |
|
Attached herein. |
|
|
|
|
|
|
|
23.1 |
|
|
Attached herein. |
|
|
|
|
|
|
|
|
23.2 |
|
Consent of Ernst & Young LLP - ERP Operating Limited Partnership. |
|
Attached herein. |
|
|
|
|
|
|
|
24 |
|
|
See the signature page to this report. |
|
|
|
|
|
|
|
49
|
31.1 |
|
Equity Residential - Certification of Mark J. Parrell, Chief Executive Officer. |
|
Attached herein. |
|
|
|
|
|
|
|
31.2 |
|
Equity Residential - Certification of Robert A. Garechana, Chief Financial Officer. |
|
Attached herein. |
|
|
|
|
|
|
|
31.3 |
|
|
Attached herein. |
|
|
|
|
|
|
|
|
31.4 |
|
|
Attached herein. |
|
|
|
|
|
|
|
|
32.1 |
|
|
Attached herein. |
|
|
|
|
|
|
|
|
32.2 |
|
|
Attached herein. |
|
|
|
|
|
|
|
|
32.3 |
|
|
Attached herein. |
|
|
|
|
|
|
|
|
32.4 |
|
|
Attached herein. |
|
|
|
|
|
|
|
|
101.INS |
|
Inline XBRL Instance Document – the instance document does not appear in the Interactive Data File because XBRL tags are embedded within the Inline XBRL document. |
|
|
|
|
|
|
|
|
|
101.SCH |
|
Inline XBRL Taxonomy Extension Schema Document. |
|
|
|
|
|
|
|
|
|
101.CAL |
|
Inline XBRL Taxonomy Extension Calculation Linkbase Document. |
|
|
|
|
|
|
|
|
|
101.DEF |
|
Inline XBRL Taxonomy Extension Definition Linkbase Document. |
|
|
|
|
|
|
|
|
|
101.LAB |
|
Inline XBRL Taxonomy Extension Label Linkbase Document. |
|
|
|
|
|
|
|
|
|
101.PRE |
|
Inline XBRL Taxonomy Extension Presentation Linkbase Document. |
|
|
|
|
|
|
|
|
|
104 |
|
Cover Page Interactive Data File (embedded within the Inline XBRL document). |
|
|
*Management contracts and compensatory plans or arrangements filed as exhibits to this report are identified by an asterisk.
**Filed on paper – hyperlink is not required pursuant to Rule 105 of Regulation S-T.
50
SIGNATURES
Pursuant to the requirements of Section 13 or 15(d) of the Securities Exchange Act of 1934, each registrant has duly caused this report to be signed on its behalf by the undersigned thereunto duly authorized.
|
|
|
EQUITY RESIDENTIAL |
||
|
|
|
|
|
|
|
|
|
By: |
|
/s/ Mark J. Parrell |
|
|
|
|
|
Mark J. Parrell President and Chief Executive Officer (Principal Executive Officer) |
|
|
|
|
|
|
|
|
|
Date: |
|
February 17, 2022 |
|
|
|
|
|
|
|
|
|
ERP OPERATING LIMITED PARTNERSHIP BY: EQUITY RESIDENTIAL ITS GENERAL PARTNER |
||
|
|
|
|
|
|
|
|
|
By: |
|
/s/ Mark J. Parrell |
|
|
|
|
|
Mark J. Parrell President and Chief Executive Officer (Principal Executive Officer) |
|
|
|
|
|
|
|
|
|
Date: |
|
February 17, 2022 |
EQUITY RESIDENTIAL
ERP OPERATING LIMITED PARTNERSHIP
POWER OF ATTORNEY
KNOW ALL MEN/WOMEN BY THESE PRESENTS, that each person whose signature appears below, hereby constitutes and appoints Mark J. Parrell, Robert A. Garechana and Ian S. Kaufman, or any of them, his or her attorneys-in-fact and agents, with full power of substitution and resubstitution for him or her in any and all capacities, to do all acts and things which said attorneys and agents, or any of them, deem advisable to enable the company to comply with the Securities Exchange Act of 1934, as amended, and any requirements or regulations of the Securities and Exchange Commission in respect thereof, in connection with the company’s filing of an annual report on Form 10-K for the company’s fiscal year 2021, including specifically, but without limitation of the general authority hereby granted, the power and authority to sign his or her name as a trustee or officer, or both, of the company, as indicated below opposite his or her signature, to the Form 10-K, and any amendment thereto; and each of the undersigned does hereby fully ratify and confirm all that said attorneys and agents, or any of them, or the substitute of any of them, shall do or cause to be done by virtue hereof.
Pursuant to the requirements of the Securities Exchange Act of 1934, this report has been signed below by the following persons on behalf of each registrant and in the capacities set forth below and on the dates indicated:
|
Name |
|
Title |
|
Date |
|
|
|
|
|
|
|
/s/ Mark J. Parrell |
|
President, Chief Executive Officer and Trustee |
|
February 17, 2022 |
|
Mark J. Parrell |
|
(Principal Executive Officer) |
|
|
|
|
|
|
|
|
|
/s/ Robert A. Garechana |
|
Executive Vice President and Chief Financial Officer |
|
February 17, 2022 |
|
Robert A. Garechana |
|
(Principal Financial Officer) |
|
|
|
|
|
|
|
|
|
/s/ Ian S. Kaufman |
|
Senior Vice President and Chief Accounting Officer |
|
February 17, 2022 |
|
Ian S. Kaufman |
|
(Principal Accounting Officer) |
|
|
|
|
|
|
|
|
|
/s/ Angela M. Aman |
|
Trustee |
|
February 17, 2022 |
|
Angela M. Aman |
|
|
|
|
|
|
|
|
|
|
|
/s/ Raymond Bennett |
|
Trustee |
|
February 17, 2022 |
|
Raymond Bennett |
|
|
|
|
|
|
|
|
|
|
|
/s/ Linda Walker Bynoe |
|
Trustee |
|
February 17, 2022 |
|
Linda Walker Bynoe |
|
|
|
|
|
|
|
|
|
|
|
/s/ Connie K. Duckworth |
|
Trustee |
|
February 17, 2022 |
|
Connie K. Duckworth |
|
|
|
|
|
|
|
|
|
|
|
/s/ Mary Kay Haben |
|
Trustee |
|
February 17, 2022 |
|
Mary Kay Haben |
|
|
|
|
|
|
|
|
|
|
|
/s/ T. Zia Huque |
|
Trustee |
|
February 17, 2022 |
|
T. Zia Huque |
|
|
|
|
|
|
|
|
|
|
|
/s/ John E. Neal |
|
Trustee |
|
February 17, 2022 |
|
John E. Neal |
|
|
|
|
|
|
|
|
|
|
|
/s/ David J. Neithercut |
|
Trustee |
|
February 17, 2022 |
|
David J. Neithercut |
|
|
|
|
|
|
|
|
|
|
|
/s/ Mark S. Shapiro |
|
Trustee |
|
February 17, 2022 |
|
Mark S. Shapiro |
|
|
|
|
|
|
|
|
|
|
|
/s/ Stephen E. Sterrett |
|
Trustee |
|
February 17, 2022 |
|
Stephen E. Sterrett |
|
|
|
|
|
|
|
|
|
|
|
/s/ Samuel Zell |
|
Chairman of the Board of Trustees |
|
February 17, 2022 |
|
Samuel Zell |
|
|
|
|
|
|
|
|
|
|
INDEX TO CONSOLIDATED FINANCIAL STATEMENTS AND SCHEDULE
EQUITY RESIDENTIAL
ERP OPERATING LIMITED PARTNERSHIP
|
|
|
PAGE |
|
|
|
|
|
FINANCIAL STATEMENTS FILED AS PART OF THIS REPORT |
|
|
|
|
|
|
|
|
F-2 to F-3 |
|
|
|
|
|
|
|
F-4 to F-5 |
|
|
|
|
|
|
|
F-6 |
|
|
|
|
|
|
|
F-7 |
|
|
|
|
|
|
Financial Statements of Equity Residential: |
|
|
|
|
|
|
|
Consolidated Balance Sheets as of December 31, 2021 and 2020 |
|
F-8 |
|
|
|
|
|
|
F-9 to F-10 |
|
|
|
|
|
|
Consolidated Statements of Cash Flows for the years ended December 31, 2021, 2020 and 2019 |
|
F-11 to F-13 |
|
|
|
|
|
Consolidated Statements of Changes in Equity for the years ended December 31, 2021, 2020 and 2019 |
|
F-14 to F-15 |
|
|
|
|
|
Financial Statements of ERP Operating Limited Partnership: |
|
|
|
|
|
|
|
Consolidated Balance Sheets as of December 31, 2021 and 2020 |
|
F-16 |
|
|
|
|
|
|
F-17 to F-18 |
|
|
|
|
|
|
Consolidated Statements of Cash Flows for the years ended December 31, 2021, 2020 and 2019 |
|
F-19 to F-21 |
|
|
|
|
|
Consolidated Statements of Changes in Capital for the years ended December 31, 2021, 2020 and 2019 |
|
F-22 to F-23 |
|
|
|
|
|
|
F-24 to F-55 |
|
|
|
|
|
|
SCHEDULE FILED AS PART OF THIS REPORT |
|
|
|
|
|
|
|
|
S-1 to S-12 |
All other schedules have been omitted because they are inapplicable, not required or the information is included elsewhere in the consolidated financial statements or notes thereto.
REPORT OF INDEPENDENT REGISTERED PUBLIC ACCOUNTING FIRM
To the Shareholders and the Board of Trustees of Equity Residential
Opinion on the Financial Statements
We have audited the accompanying consolidated balance sheets of Equity Residential (the Company) as of December 31, 2021 and 2020, the related consolidated statements of operations and comprehensive income, changes in equity and cash flows for each of the three years in the period ended December 31, 2021, and the related notes and financial statement schedule listed in the Index at Item 15(a) (collectively referred to as the “consolidated financial statements”). In our opinion, the consolidated financial statements present fairly, in all material respects, the financial position of the Company at December 31, 2021 and 2020, and the results of its operations and its cash flows for each of the three years in the period ended December 31, 2021, in conformity with U.S. generally accepted accounting principles.
We also have audited, in accordance with the standards of the Public Company Accounting Oversight Board (United States) (PCAOB), the Company's internal control over financial reporting as of December 31, 2021, based on criteria established in Internal Control – Integrated Framework issued by the Committee of Sponsoring Organizations of the Treadway Commission (2013 framework) and our report dated February 17, 2022 expressed an unqualified opinion thereon.
Basis for Opinion
These financial statements are the responsibility of the Company's management. Our responsibility is to express an opinion on the Company’s financial statements based on our audits. We are a public accounting firm registered with the PCAOB and are required to be independent with respect to the Company in accordance with the U.S. federal securities laws and the applicable rules and regulations of the Securities and Exchange Commission and the PCAOB.
We conducted our audits in accordance with the standards of the PCAOB. Those standards require that we plan and perform the audit to obtain reasonable assurance about whether the financial statements are free of material misstatement, whether due to error or fraud. Our audits included performing procedures to assess the risks of material misstatement of the financial statements, whether due to error or fraud, and performing procedures that respond to those risks. Such procedures included examining, on a test basis, evidence regarding the amounts and disclosures in the financial statements. Our audits also included evaluating the accounting principles used and significant estimates made by management, as well as evaluating the overall presentation of the financial statements. We believe that our audits provide a reasonable basis for our opinion.
Critical Audit Matters
The critical audit matters communicated below are matters arising from the current period audit of the financial statements that were communicated or required to be communicated to the audit committee and that: (1) relate to accounts or disclosures that are material to the financial statements and (2) involved our especially challenging, subjective or complex judgments. The communication of critical audit matters does not alter in any way our opinion on the consolidated financial statements, taken as a whole, and we are not, by communicating the critical audit matters below, providing separate opinions on the critical audit matters or on the accounts or disclosures to which they relate.
|
|
Impairment of Long-Lived Assets |
|
|
|
||
|
Description of the Matter |
At December 31, 2021, the Company’s net investment in real estate was approximately $19.9 billion. As more fully described in Note 2 to the consolidated financial statements, the Company periodically evaluates its long-lived assets, including its investment in real estate, for impairment. The judgments and assumptions regarding the existence of impairment indicators are based on factors such as operational performance, market conditions, legal and environmental concerns, the Company’s intent and ability to hold the related asset, as well as any significant cost overruns on development properties. If the expected future undiscounted cash flows are less than the carrying amount of the long-lived asset, an impairment loss is recognized for the difference between the estimated fair value and the carrying amount. Auditing the Company's process to evaluate indicators of impairment was complex due to a high degree of subjectivity in the identification of events or changes in circumstances that may indicate impairment was present. Changes in these judgments could have a material impact on the Company’s analysis. |
|
|
|
|
|
F-2
|
How We Addressed the Matter in Our Audit |
We obtained an understanding, evaluated the design and tested the operating effectiveness of controls over the Company’s long-lived asset impairment evaluation, including controls over management’s determination and review of the significant assumptions used in the analyses described above. We performed audit procedures that included, among others, evaluating the judgments used by management to identify whether indicators of impairment were present and testing the significant assumptions and completeness and accuracy of market and operating data used by the Company in its analyses. We reviewed costs incurred on development properties. We compared the significant assumptions used by management to current market data and performed sensitivity analyses of certain significant assumptions, such as market capitalization rates. We also held discussions with management and read the minutes of meetings of the Board of Trustees and related committees to understand whether there were any changes in management’s operating and development plans that would result in the disposal of a property significantly before the end of its useful life. |
|
|
|
|
|
|
|
Acquisitions of Investments in Real Estate |
|
|
|
|
|
|
Description of the Matter |
During the year ended December 31, 2021, the Company acquired 17 consolidated apartment properties for an aggregate purchase price of $1.7 billion. The transactions were accounted for as asset acquisitions and the purchase prices were allocated based on the relative fair values of the tangible and identified intangible assets acquired and liabilities assumed. As more fully described in Note 2 to the consolidated financial statements, the estimates used in determining the relative fair values may be based on appraisals, internal analyses of recently acquired and existing comparable properties in the Company’s portfolio, other market data, and internal marketing and leasing activities. Auditing the Company’s estimate of the fair value of the acquired tangible and identified intangible assets and liabilities is complex and requires a higher degree of auditor judgment due to the judgment used by management in selecting key assumptions based on recent comparable transactions or other internal or market data, which are primarily unobservable inputs. The allocation of purchase price to the components of properties acquired could have an effect on the Company’s net income due to the varying useful lives applicable to each component and the recognition of the related depreciation or amortization expense in the Company’s consolidated statements of operations and comprehensive income. |
|
|
|
|
|
|
How We Addressed the Matter in Our Audit |
We obtained an understanding, evaluated the design and tested the operating effectiveness of controls over the Company’s process for estimating the fair value of acquired assets and liabilities and allocating purchase price to the various components, including controls over management’s determination and review of the significant assumptions used in the analyses described above. We evaluated the use of the key assumptions in the valuation models and recalculated the model’s results. To test the fair values of acquired tangible and intangible assets and liabilities used in the purchase price allocation, we performed procedures to evaluate the valuation methods and significant assumptions used by management. We evaluated the completeness and accuracy of the underlying data supporting the determination of the various inputs. We involved our real estate valuation specialists to assist us in evaluating the Company’s methodology and assumptions, including those related to land and building values, estimated replacement costs, market rental rates and capitalization rates. |
|
|
|
|
/s/ ERNST & YOUNG LLP |
|
|
|
ERNST & YOUNG LLP |
|
We have served as the Company’s auditor since 1996. |
|
|
|
Chicago, Illinois |
|
|
|
February 17, 2022 |
|
|
F-3
REPORT OF INDEPENDENT REGISTERED PUBLIC ACCOUNTING FIRM
To the Partners of ERP Operating Limited Partnership
Opinion on the Financial Statements
We have audited the accompanying consolidated balance sheets of ERP Operating Limited Partnership (the Operating Partnership) as of December 31, 2021 and 2020, the related consolidated statements of operations and comprehensive income, changes in capital and cash flows for each of the three years in the period ended December 31, 2021, and the related notes and financial statement schedule listed in the Index at Item 15(a) (collectively referred to as the “consolidated financial statements”). In our opinion, the consolidated financial statements present fairly, in all material respects, the financial position of the Operating Partnership at December 31, 2021 and 2020, and the results of its operations and its cash flows for each of the three years in the period ended December 31, 2021, in conformity with U.S. generally accepted accounting principles.
We also have audited, in accordance with the standards of the Public Company Accounting Oversight Board (United States) (PCAOB), the Operating Partnership’s internal control over financial reporting as of December 31, 2021, based on criteria established in Internal Control – Integrated Framework issued by the Committee of Sponsoring Organizations of the Treadway Commission (2013 framework) and our report dated February 17, 2022 expressed an unqualified opinion thereon.
Basis for Opinion
These financial statements are the responsibility of the Operating Partnership’s management. Our responsibility is to express an opinion on the Operating Partnership’s financial statements based on our audits. We are a public accounting firm registered with the PCAOB and are required to be independent with respect to the Operating Partnership in accordance with the U.S. federal securities laws and the applicable rules and regulations of the Securities and Exchange Commission and the PCAOB.
We conducted our audits in accordance with the standards of the PCAOB. Those standards require that we plan and perform the audit to obtain reasonable assurance about whether the financial statements are free of material misstatement, whether due to error or fraud. Our audits included performing procedures to assess the risks of material misstatement of the financial statements, whether due to error or fraud, and performing procedures that respond to those risks. Such procedures included examining, on a test basis, evidence regarding the amounts and disclosures in the financial statements. Our audits also included evaluating the accounting principles used and significant estimates made by management, as well as evaluating the overall presentation of the financial statements. We believe that our audits provide a reasonable basis for our opinion.
Critical Audit Matters
The critical audit matters communicated below are matters arising from the current period audit of the financial statements that were communicated or required to be communicated to the audit committee and that: (1) relate to accounts or disclosures that are material to the financial statements and (2) involved our especially challenging, subjective or complex judgments. The communication of critical audit matters does not alter in any way our opinion on the consolidated financial statements, taken as a whole, and we are not, by communicating the critical audit matters below, providing separate opinions on the critical audit matters or on the accounts or disclosures to which they relate.
|
|
Impairment of Long-Lived Assets |
|
|
|
||
|
Description of the Matter |
At December 31, 2021, the Operating Partnership’s net investment in real estate was approximately $19.9 billion. As more fully described in Note 2 to the consolidated financial statements, the Operating Partnership periodically evaluates its long-lived assets, including its investment in real estate, for impairment. The judgments and assumptions regarding the existence of impairment indicators are based on factors such as operational performance, market conditions, legal and environmental concerns, the Operating Partnership’s intent and ability to hold the related asset, as well as any significant cost overruns on development properties. If the expected future undiscounted cash flows are less than the carrying amount of the long-lived asset, an impairment loss is recognized for the difference between the estimated fair value and the carrying amount. Auditing the Operating Partnership's process to evaluate indicators of impairment was complex due to a high degree of subjectivity in the identification of events or changes in circumstances that may indicate impairment was present. Changes in these judgments could have a material impact on the Operating Partnership’s analysis. |
|
|
|
|
|
F-4
|
How We Addressed the Matter in Our Audit |
We obtained an understanding, evaluated the design and tested the operating effectiveness of controls over the Operating Partnership’s long-lived asset impairment evaluation, including controls over management’s determination and review of the significant assumptions used in the analyses described above. We performed audit procedures that included, among others, evaluating the judgments used by management to identify whether indicators of impairment were present and testing the significant assumptions and completeness and accuracy of market and operating data used by the Operating Partnership in its analyses. We reviewed costs incurred on development properties. We compared the significant assumptions used by management to current market data and performed sensitivity analyses of certain significant assumptions, such as market capitalization rates. We also held discussions with management and read the minutes of meetings of the Board of Trustees and related committees to understand whether there were any changes in management’s operating and development plans that would result in the disposal of a property significantly before the end of its useful life. |
|
|
|
|
|
|
|
Acquisitions of Investments in Real Estate |
|
|
|
|
|
|
Description of the Matter |
During the year ended December 31, 2021, the Operating Partnership acquired 17 consolidated apartment properties for an aggregate purchase price of $1.7 billion. The transactions were accounted for as asset acquisitions and the purchase prices were allocated based on the relative fair values of the tangible and identified intangible assets acquired and liabilities assumed. As more fully described in Note 2 to the consolidated financial statements, the estimates used in determining the relative fair values may be based on appraisals, internal analyses of recently acquired and existing comparable properties in the Operating Partnership’s portfolio, other market data, and internal marketing and leasing activities. Auditing the Operating Partnership’s estimate of the fair value of the acquired tangible and identified intangible assets and liabilities is complex and requires a higher degree of auditor judgment due to the judgment used by management in selecting key assumptions based on recent comparable transactions or other internal or market data, which are primarily unobservable inputs. The allocation of purchase price to the components of properties acquired could have an effect on the Operating Partnership’s net income due to the varying useful lives applicable to each component and the recognition of the related depreciation or amortization expense in the Operating Partnership’s consolidated statements of operations and comprehensive income. |
|
|
|
|
|
|
How We Addressed the Matter in Our Audit |
We obtained an understanding, evaluated the design and tested the operating effectiveness of controls over the Operating Partnership’s process for estimating the fair value of acquired assets and liabilities and allocating purchase price to the various components, including controls over management’s determination and review of the significant assumptions used in the analyses described above. We evaluated the use of the key assumptions in the valuation models and recalculated the model’s results. To test the fair values of acquired tangible and intangible assets and liabilities used in the purchase price allocation, we performed procedures to evaluate the valuation methods and significant assumptions used by management. We evaluated the completeness and accuracy of the underlying data supporting the determination of the various inputs. We involved our real estate valuation specialists to assist us in evaluating the Operating Partnership’s methodology and assumptions, including those related to land and building values, estimated replacement costs, market rental rates and capitalization rates. |
|
|
|
|
/s/ ERNST & YOUNG LLP |
|
|
|
ERNST & YOUNG LLP |
|
We have served as the Operating Partnership’s auditor since 1996. |
|
|
|
Chicago, Illinois |
|
|
|
February 17, 2022 |
|
|
F-5
REPORT OF INDEPENDENT REGISTERED PUBLIC ACCOUNTING FIRM
To the Shareholders and the Board of Trustees of Equity Residential
Opinion on Internal Control over Financial Reporting
We have audited Equity Residential’s internal control over financial reporting as of December 31, 2021, based on criteria established in Internal Control – Integrated Framework issued by the Committee of Sponsoring Organizations of the Treadway Commission (2013 framework) (the COSO criteria). In our opinion, Equity Residential (the Company) maintained, in all material respects, effective internal control over financial reporting as of December 31, 2021, based on the COSO criteria.
We also have audited, in accordance with the standards of the Public Company Accounting Oversight Board (United States) (PCAOB), the consolidated balance sheets of the Company as of December 31, 2021 and 2020, the related consolidated statements of operations and comprehensive income, changes in equity and cash flows for each of the three years in the period ended December 31, 2021, and the related notes and financial statement schedule listed in the Index at Item 15(a) and our report dated February 17, 2022 expressed an unqualified opinion thereon.
Basis for Opinion
The Company’s management is responsible for maintaining effective internal control over financial reporting, and for its assessment of the effectiveness of internal control over financial reporting included in the accompanying Management's Report on Internal Control over Financial Reporting. Our responsibility is to express an opinion on the Company’s internal control over financial reporting based on our audit. We are a public accounting firm registered with the PCAOB and are required to be independent with respect to the Company in accordance with the U.S. federal securities laws and the applicable rules and regulations of the Securities and Exchange Commission and the PCAOB.
We conducted our audit in accordance with the standards of the PCAOB. Those standards require that we plan and perform the audit to obtain reasonable assurance about whether effective internal control over financial reporting was maintained in all material respects.
Our audit included obtaining an understanding of internal control over financial reporting, assessing the risk that a material weakness exists, testing and evaluating the design and operating effectiveness of internal control based on the assessed risk, and performing such other procedures as we considered necessary in the circumstances. We believe that our audit provides a reasonable basis for our opinion.
Definition and Limitations of Internal Control over Financial Reporting
A company’s internal control over financial reporting is a process designed to provide reasonable assurance regarding the reliability of financial reporting and the preparation of financial statements for external purposes in accordance with generally accepted accounting principles. A company’s internal control over financial reporting includes those policies and procedures that (1) pertain to the maintenance of records that, in reasonable detail, accurately and fairly reflect the transactions and dispositions of the assets of the company; (2) provide reasonable assurance that transactions are recorded as necessary to permit preparation of financial statements in accordance with generally accepted accounting principles, and that receipts and expenditures of the company are being made only in accordance with authorizations of management and trustees of the company; and (3) provide reasonable assurance regarding prevention or timely detection of unauthorized acquisition, use, or disposition of the company’s assets that could have a material effect on the financial statements.
Because of its inherent limitations, internal control over financial reporting may not prevent or detect misstatements. Also, projections of any evaluation of effectiveness to future periods are subject to the risk that controls may become inadequate because of changes in conditions, or that the degree of compliance with the policies or procedures may deteriorate.
|
|
|
/s/ ERNST & YOUNG LLP |
|
|
|
ERNST & YOUNG LLP |
|
|
|
|
|
Chicago, Illinois |
|
|
|
February 17, 2022 |
|
|
F-6
REPORT OF INDEPENDENT REGISTERED PUBLIC ACCOUNTING FIRM
To the Partners of ERP Operating Limited Partnership
Opinion on Internal Control over Financial Reporting
We have audited ERP Operating Limited Partnership’s internal control over financial reporting as of December 31, 2021, based on criteria established in Internal Control – Integrated Framework issued by the Committee of Sponsoring Organizations of the Treadway Commission (2013 framework) (the COSO criteria). In our opinion, ERP Operating Limited Partnership (the Operating Partnership) maintained, in all material respects, effective internal control over financial reporting as of December 31, 2021, based on the COSO criteria.
We also have audited, in accordance with the standards of the Public Company Accounting Oversight Board (United States) (PCAOB), the consolidated balance sheets of the Operating Partnership as of December 31, 2021 and 2020, the related consolidated statements of operations and comprehensive income, changes in capital and cash flows for each of the three years in the period ended December 31, 2021, and the related notes and financial statement schedule listed in the Index at Item 15(a) and our report dated February 17, 2022 expressed an unqualified opinion thereon.
Basis for Opinion
The Operating Partnership’s management is responsible for maintaining effective internal control over financial reporting, and for its assessment of the effectiveness of internal control over financial reporting included in the accompanying Management's Report on Internal Control over Financial Reporting. Our responsibility is to express an opinion on the Operating Partnership’s internal control over financial reporting based on our audit. We are a public accounting firm registered with the PCAOB and are required to be independent with respect to the Operating Partnership in accordance with the U.S. federal securities laws and the applicable rules and regulations of the Securities and Exchange Commission and the PCAOB.
We conducted our audit in accordance with the standards of the PCAOB. Those standards require that we plan and perform the audit to obtain reasonable assurance about whether effective internal control over financial reporting was maintained in all material respects.
Our audit included obtaining an understanding of internal control over financial reporting, assessing the risk that a material weakness exists, testing and evaluating the design and operating effectiveness of internal control based on the assessed risk, and performing such other procedures as we considered necessary in the circumstances. We believe that our audit provides a reasonable basis for our opinion.
Definition and Limitations of Internal Control over Financial Reporting
A company’s internal control over financial reporting is a process designed to provide reasonable assurance regarding the reliability of financial reporting and the preparation of financial statements for external purposes in accordance with generally accepted accounting principles. A company’s internal control over financial reporting includes those policies and procedures that (1) pertain to the maintenance of records that, in reasonable detail, accurately and fairly reflect the transactions and dispositions of the assets of the company; (2) provide reasonable assurance that transactions are recorded as necessary to permit preparation of financial statements in accordance with generally accepted accounting principles, and that receipts and expenditures of the company are being made only in accordance with authorizations of management and trustees of the company; and (3) provide reasonable assurance regarding prevention or timely detection of unauthorized acquisition, use, or disposition of the company’s assets that could have a material effect on the financial statements.
Because of its inherent limitations, internal control over financial reporting may not prevent or detect misstatements. Also, projections of any evaluation of effectiveness to future periods are subject to the risk that controls may become inadequate because of changes in conditions, or that the degree of compliance with the policies or procedures may deteriorate.
|
|
|
/s/ ERNST & YOUNG LLP |
|
|
|
ERNST & YOUNG LLP |
|
|
|
|
|
Chicago, Illinois |
|
|
|
February 17, 2022 |
|
|
F-7
EQUITY RESIDENTIAL
CONSOLIDATED BALANCE SHEETS
(Amounts in thousands except for share amounts)
|
|
|
December 31, |
|
|
December 31, |
|
||
|
|
|
2021 |
|
|
2020 |
|
||
|
ASSETS |
|
|
|
|
|
|
|
|
|
Land |
|
$ |
|
|
|
$ |
|
|
|
Depreciable property |
|
|
|
|
|
|
|
|
|
Projects under development |
|
|
|
|
|
|
|
|
|
Land held for development |
|
|
|
|
|
|
|
|
|
Investment in real estate |
|
|
|
|
|
|
|
|
|
Accumulated depreciation |
|
|
( |
) |
|
|
( |
) |
|
Investment in real estate, net |
|
|
|
|
|
|
|
|
|
Investments in unconsolidated entities |
|
|
|
|
|
|
|
|
|
Cash and cash equivalents |
|
|
|
|
|
|
|
|
|
Restricted deposits |
|
|
|
|
|
|
|
|
|
Right-of-use assets |
|
|
|
|
|
|
|
|
|
Other assets |
|
|
|
|
|
|
|
|
|
Total assets |
|
$ |
|
|
|
$ |
|
|
|
|
|
|
|
|
|
|
|
|
|
LIABILITIES AND EQUITY |
|
|
|
|
|
|
|
|
|
Liabilities: |
|
|
|
|
|
|
|
|
|
Mortgage notes payable, net |
|
$ |
|
|
|
$ |
|
|
|
Notes, net |
|
|
|
|
|
|
|
|
|
Line of credit and commercial paper |
|
|
|
|
|
|
|
|
|
Accounts payable and accrued expenses |
|
|
|
|
|
|
|
|
|
Accrued interest payable |
|
|
|
|
|
|
|
|
|
Lease liabilities |
|
|
|
|
|
|
|
|
|
Other liabilities |
|
|
|
|
|
|
|
|
|
Security deposits |
|
|
|
|
|
|
|
|
|
Distributions payable |
|
|
|
|
|
|
|
|
|
Total liabilities |
|
|
|
|
|
|
|
|
|
|
|
|
|
|
|
|
|
|
|
Commitments and contingencies |
|
|
|
|
|
|
|
|
|
|
|
|
|
|
|
|
|
|
|
Redeemable Noncontrolling Interests – Operating Partnership |
|
|
|
|
|
|
|
|
|
Equity: |
|
|
|
|
|
|
|
|
|
Shareholders' equity: |
|
|
|
|
|
|
|
|
|
Preferred Shares of beneficial interest, $ authorized; December 31, 2020 |
|
|
|
|
|
|
|
|
|
Common Shares of beneficial interest, $ authorized; |
|
|
|
|
|
|
|
|
|
Paid in capital |
|
|
|
|
|
|
|
|
|
Retained earnings |
|
|
|
|
|
|
|
|
|
Accumulated other comprehensive income (loss) |
|
|
( |
) |
|
|
( |
) |
|
Total shareholders’ equity |
|
|
|
|
|
|
|
|
|
Noncontrolling Interests: |
|
|
|
|
|
|
|
|
|
Operating Partnership |
|
|
|
|
|
|
|
|
|
Partially Owned Properties |
|
|
|
|
|
|
|
|
|
Total Noncontrolling Interests |
|
|
|
|
|
|
|
|
|
Total equity |
|
|
|
|
|
|
|
|
|
Total liabilities and equity |
|
$ |
|
|
|
$ |
|
|
See accompanying notes
F-8
EQUITY RESIDENTIAL
CONSOLIDATED STATEMENTS OF OPERATIONS AND COMPREHENSIVE INCOME
(Amounts in thousands except per share data)
|
|
|
Year Ended December 31, |
|
|||||||||
|
|
|
2021 |
|
|
2020 |
|
|
2019 |
|
|||
|
REVENUES |
|
|
|
|
|
|
|
|
|
|
|
|
|
Rental income |
|
$ |
|
|
|
$ |
|
|
|
$ |
|
|
|
|
|
|
|
|
|
|
|
|
|
|
|
|
|
EXPENSES |
|
|
|
|
|
|
|
|
|
|
|
|
|
Property and maintenance |
|
|
|
|
|
|
|
|
|
|
|
|
|
Real estate taxes and insurance |
|
|
|
|
|
|
|
|
|
|
|
|
|
Property management |
|
|
|
|
|
|
|
|
|
|
|
|
|
General and administrative |
|
|
|
|
|
|
|
|
|
|
|
|
|
Depreciation |
|
|
|
|
|
|
|
|
|
|
|
|
|
Total expenses |
|
|
|
|
|
|
|
|
|
|
|
|
|
|
|
|
|
|
|
|
|
|
|
|
|
|
|
Net gain (loss) on sales of real estate properties |
|
|
|
|
|
|
|
|
|
|
|
|
|
Impairment |
|
|
( |
) |
|
|
— |
|
|
|
— |
|
|
|
|
|
|
|
|
|
|
|
|
|
|
|
|
Operating income |
|
|
|
|
|
|
|
|
|
|
|
|
|
|
|
|
|
|
|
|
|
|
|
|
|
|
|
Interest and other income |
|
|
|
|
|
|
|
|
|
|
|
|
|
Other expenses |
|
|
( |
) |
|
|
( |
) |
|
|
( |
) |
|
Interest: |
|
|
|
|
|
|
|
|
|
|
|
|
|
Expense incurred, net |
|
|
( |
) |
|
|
( |
) |
|
|
( |
) |
|
Amortization of deferred financing costs |
|
|
( |
) |
|
|
( |
) |
|
|
( |
) |
|
Income before income and other taxes, income (loss) from investments in unconsolidated entities and net gain (loss) on sales of land parcels |
|
|
|
|
|
|
|
|
|
|
|
|
|
Income and other tax (expense) benefit |
|
|
( |
) |
|
|
( |
) |
|
|
|
|
|
Income (loss) from investments in unconsolidated entities |
|
|
( |
) |
|
|
( |
) |
|
|
|
|
|
Net gain (loss) on sales of land parcels |
|
|
|
|
|
|
|
|
|
|
|
|
|
Net income |
|
|
|
|
|
|
|
|
|
|
|
|
|
Net (income) loss attributable to Noncontrolling Interests: |
|
|
|
|
|
|
|
|
|
|
|
|
|
Operating Partnership |
|
|
( |
) |
|
|
( |
) |
|
|
( |
) |
|
Partially Owned Properties |
|
|
( |
) |
|
|
( |
) |
|
|
( |
) |
|
Net income attributable to controlling interests |
|
|
|
|
|
|
|
|
|
|
|
|
|
Preferred distributions |
|
|
( |
) |
|
|
( |
) |
|
|
( |
) |
|
Net income available to Common Shares |
|
$ |
|
|
|
$ |
|
|
|
$ |
|
|
|
|
|
|
|
|
|
|
|
|
|
|
|
|
|
Earnings per share – basic: |
|
|
|
|
|
|
|
|
|
|
|
|
|
Net income available to Common Shares |
|
$ |
|
|
|
$ |
|
|
|
$ |
|
|
|
Weighted average Common Shares outstanding |
|
|
|
|
|
|
|
|
|
|
|
|
|
|
|
|
|
|
|
|
|
|
|
|
|
|
|
Earnings per share – diluted: |
|
|
|
|
|
|
|
|
|
|
|
|
|
Net income available to Common Shares |
|
$ |
|
|
|
$ |
|
|
|
$ |
|
|
|
Weighted average Common Shares outstanding |
|
|
|
|
|
|
|
|
|
|
|
|
See accompanying notes
F-9
EQUITY RESIDENTIAL
CONSOLIDATED STATEMENTS OF OPERATIONS AND COMPREHENSIVE INCOME (Continued)
(Amounts in thousands except per share data)
|
|
|
Year Ended December 31, |
|
|||||||||
|
|
|
2021 |
|
|
2020 |
|
|
2019 |
|
|||
|
Comprehensive income: |
|
|
|
|
|
|
|
|
|
|
|
|
|
Net income |
|
$ |
|
|
|
$ |
|
|
|
$ |
|
|
|
Other comprehensive income (loss): |
|
|
|
|
|
|
|
|
|
|
|
|
|
Other comprehensive income (loss) – derivative instruments: |
|
|
|
|
|
|
|
|
|
|
|
|
|
Unrealized holding gains (losses) arising during the year |
|
|
— |
|
|
|
( |
) |
|
|
( |
) |
|
Losses reclassified into earnings from other comprehensive income |
|
|
|
|
|
|
|
|
|
|
|
|
|
Other comprehensive income (loss) |
|
|
|
|
|
|
|
|
|
|
( |
) |
|
Comprehensive income |
|
|
|
|
|
|
|
|
|
|
|
|
|
Comprehensive (income) attributable to Noncontrolling Interests |
|
|
( |
) |
|
|
( |
) |
|
|
( |
) |
|
Comprehensive income attributable to controlling interests |
|
$ |
|
|
|
$ |
|
|
|
$ |
|
|
See accompanying notes
F-10
EQUITY RESIDENTIAL
CONSOLIDATED STATEMENTS OF CASH FLOWS
(Amounts in thousands)
|
|
|
Year Ended December 31, |
|
|||||||||
|
|
|
2021 |
|
|
2020 |
|
|
2019 |
|
|||
|
CASH FLOWS FROM OPERATING ACTIVITIES: |
|
|
|
|
|
|
|
|
|
|
|
|
|
Net income |
|
$ |
|
|
|
$ |
|
|
|
$ |
|
|
|
Adjustments to reconcile net income to net cash provided by operating activities: |
|
|
|
|
|
|
|
|
|
|
|
|
|
Depreciation |
|
|
|
|
|
|
|
|
|
|
|
|
|
Amortization of deferred financing costs |
|
|
|
|
|
|
|
|
|
|
|
|
|
Amortization of above/below market lease intangibles |
|
|
( |
) |
|
|
( |
) |
|
|
( |
) |
|
Amortization of discounts and premiums on debt |
|
|
|
|
|
|
|
|
|
|
|
|
|
Amortization of deferred settlements on derivative instruments |
|
|
|
|
|
|
|
|
|
|
|
|
|
Amortization of right-of-use assets |
|
|
|
|
|
|
|
|
|
|
|
|
|
Impairment |
|
|
|
|
|
|
— |
|
|
|
— |
|
|
Write-off of pursuit costs |
|
|
|
|
|
|
|
|
|
|
|
|
|
(Income) loss from investments in unconsolidated entities |
|
|
|
|
|
|
|
|
|
|
( |
) |
|
Distributions from unconsolidated entities – return on capital |
|
|
|
|
|
|
|
|
|
|
|
|
|
Net (gain) loss on sales of real estate properties |
|
|
( |
) |
|
|
( |
) |
|
|
( |
) |
|
Net (gain) loss on sales of land parcels |
|
|
( |
) |
|
|
( |
) |
|
|
( |
) |
|
Net (gain) loss on debt extinguishment |
|
|
— |
|
|
|
|
|
|
|
|
|
|
Realized/unrealized (gain) loss on derivative instruments |
|
|
— |
|
|
|
|
|
|
|
— |
|
|
Realized (gain) loss on sale of investment securities |
|
|
( |
) |
|
|
— |
|
|
|
— |
|
|
Compensation paid with Company Common Shares |
|
|
|
|
|
|
|
|
|
|
|
|
|
Other operating activities, net |
|
|
— |
|
|
|
|
|
|
|
( |
) |
|
Changes in assets and liabilities: |
|
|
|
|
|
|
|
|
|
|
|
|
|
(Increase) decrease in other assets |
|
|
|
|
|
|
( |
) |
|
|
|
|
|
Increase (decrease) in accounts payable and accrued expenses |
|
|
|
|
|
|
|
|
|
|
|
|
|
Increase (decrease) in accrued interest payable |
|
|
|
|
|
|
( |
) |
|
|
|
|
|
Increase (decrease) in lease liabilities |
|
|
( |
) |
|
|
( |
) |
|
|
( |
) |
|
Increase (decrease) in other liabilities |
|
|
|
|
|
|
( |
) |
|
|
|
|
|
Increase (decrease) in security deposits |
|
|
|
|
|
|
( |
) |
|
|
|
|
|
Net cash provided by operating activities |
|
|
|
|
|
|
|
|
|
|
|
|
|
CASH FLOWS FROM INVESTING ACTIVITIES: |
|
|
|
|
|
|
|
|
|
|
|
|
|
Investment in real estate – acquisitions |
|
|
( |
) |
|
|
( |
) |
|
|
( |
) |
|
Investment in real estate – development/other |
|
|
( |
) |
|
|
( |
) |
|
|
( |
) |
|
Capital expenditures to real estate |
|
|
( |
) |
|
|
( |
) |
|
|
( |
) |
|
Non-real estate capital additions |
|
|
( |
) |
|
|
( |
) |
|
|
( |
) |
|
Interest capitalized for real estate and unconsolidated entities under development |
|
|
( |
) |
|
|
( |
) |
|
|
( |
) |
|
Proceeds from disposition of real estate, net |
|
|
|
|
|
|
|
|
|
|
|
|
|
Investments in unconsolidated entities – acquisitions |
|
|
( |
) |
|
|
— |
|
|
|
— |
|
|
Investments in unconsolidated entities – other |
|
|
( |
) |
|
|
( |
) |
|
|
( |
) |
|
Distributions from unconsolidated entities – return of capital |
|
|
|
|
|
|
|
|
|
|
|
|
|
Purchase of investment securities and other investments |
|
|
( |
) |
|
|
( |
) |
|
|
( |
) |
|
Proceeds from sale of investment securities |
|
|
|
|
|
|
— |
|
|
|
— |
|
|
Net cash provided by (used for) investing activities |
|
|
( |
) |
|
|
|
|
|
|
( |
) |
See accompanying notes
F-11
EQUITY RESIDENTIAL
CONSOLIDATED STATEMENTS OF CASH FLOWS (Continued)
(Amounts in thousands)
|
|
|
Year Ended December 31, |
|
|||||||||
|
|
|
2021 |
|
|
2020 |
|
|
2019 |
|
|||
|
CASH FLOWS FROM FINANCING ACTIVITIES: |
|
|
|
|
|
|
|
|
|
|
|
|
|
Debt financing costs |
|
$ |
( |
) |
|
$ |
( |
) |
|
$ |
( |
) |
|
Mortgage notes payable, net: |
|
|
|
|
|
|
|
|
|
|
|
|
|
Proceeds |
|
|
|
|
|
|
|
|
|
|
|
|
|
Lump sum payoffs |
|
|
( |
) |
|
|
( |
) |
|
|
( |
) |
|
Scheduled principal repayments |
|
|
( |
) |
|
|
( |
) |
|
|
( |
) |
|
Net gain (loss) on debt extinguishment |
|
|
— |
|
|
|
( |
) |
|
|
( |
) |
|
Notes, net: |
|
|
|
|
|
|
|
|
|
|
|
|
|
Proceeds |
|
|
|
|
|
|
— |
|
|
|
|
|
|
Lump sum payoffs |
|
|
— |
|
|
|
( |
) |
|
|
( |
) |
|
Net gain (loss) on debt extinguishment |
|
|
— |
|
|
|
( |
) |
|
|
( |
) |
|
Line of credit and commercial paper: |
|
|
|
|
|
|
|
|
|
|
|
|
|
Line of credit proceeds |
|
|
|
|
|
|
|
|
|
|
|
|
|
Line of credit repayments |
|
|
( |
) |
|
|
( |
) |
|
|
( |
) |
|
Commercial paper proceeds |
|
|
|
|
|
|
|
|
|
|
|
|
|
Commercial paper repayments |
|
|
( |
) |
|
|
( |
) |
|
|
( |
) |
|
Proceeds from (payments on) settlement of derivative instruments |
|
|
— |
|
|
|
( |
) |
|
|
( |
) |
|
Prepaid finance ground lease |
|
|
— |
|
|
|
— |
|
|
|
( |
) |
|
Finance ground lease principal payments |
|
|
( |
) |
|
|
— |
|
|
|
— |
|
|
Proceeds from Employee Share Purchase Plan (ESPP) |
|
|
|
|
|
|
|
|
|
|
|
|
|
Proceeds from exercise of options |
|
|
|
|
|
|
|
|
|
|
|
|
|
Payment of offering costs |
|
|
( |
) |
|
|
— |
|
|
|
( |
) |
|
Other financing activities, net |
|
|
( |
) |
|
|
( |
) |
|
|
( |
) |
|
Contributions – Noncontrolling Interests – Partially Owned Properties |
|
|
|
|
|
|
|
|
|
|
|
|
|
Contributions – Noncontrolling Interests – Operating Partnership |
|
|
— |
|
|
|
|
|
|
|
|
|
|
Distributions: |
|
|
|
|
|
|
|
|
|
|
|
|
|
Common Shares |
|
|
( |
) |
|
|
( |
) |
|
|
( |
) |
|
Preferred Shares |
|
|
( |
) |
|
|
( |
) |
|
|
( |
) |
|
Noncontrolling Interests – Operating Partnership |
|
|
( |
) |
|
|
( |
) |
|
|
( |
) |
|
Noncontrolling Interests – Partially Owned Properties |
|
|
( |
) |
|
|
( |
) |
|
|
( |
) |
|
Net cash provided by (used for) financing activities |
|
|
( |
) |
|
|
( |
) |
|
|
( |
) |
|
Net increase (decrease) in cash and cash equivalents and restricted deposits |
|
|
|
|
|
|
( |
) |
|
|
|
|
|
Cash and cash equivalents and restricted deposits, beginning of year |
|
|
|
|
|
|
|
|
|
|
|
|
|
Cash and cash equivalents and restricted deposits, end of year |
|
$ |
|
|
|
$ |
|
|
|
$ |
|
|
|
|
|
|
|
|
|
|
|
|
|
|
|
|
|
Cash and cash equivalents and restricted deposits, end of year |
|
|
|
|
|
|
|
|
|
|
|
|
|
Cash and cash equivalents |
|
$ |
|
|
|
$ |
|
|
|
$ |
|
|
|
Restricted deposits |
|
|
|
|
|
|
|
|
|
|
|
|
|
Total cash and cash equivalents and restricted deposits, end of year |
|
$ |
|
|
|
$ |
|
|
|
$ |
|
|
See accompanying notes
F-12
EQUITY RESIDENTIAL
CONSOLIDATED STATEMENTS OF CASH FLOWS (Continued)
(Amounts in thousands)
|
|
|
Year Ended December 31, |
|
|||||||||
|
|
|
2021 |
|
|
2020 |
|
|
2019 |
|
|||
|
SUPPLEMENTAL INFORMATION: |
|
|
|
|
|
|
|
|
|
|
|
|
|
Cash paid for interest, net of amounts capitalized |
|
$ |
|
|
|
$ |
|
|
|
$ |
|
|
|
Net cash paid (received) for income and other taxes |
|
$ |
|
|
|
$ |
( |
) |
|
$ |
( |
) |
|
Amortization of deferred financing costs: |
|
|
|
|
|
|
|
|
|
|
|
|
|
Investment in real estate, net |
|
$ |
( |
) |
|
$ |
( |
) |
|
$ |
( |
) |
|
Other assets |
|
$ |
|
|
|
$ |
|
|
|
$ |
|
|
|
Mortgage notes payable, net |
|
$ |
|
|
|
$ |
|
|
|
$ |
|
|
|
Notes, net |
|
$ |
|
|
|
$ |
|
|
|
$ |
|
|
|
Amortization of discounts and premiums on debt: |
|
|
|
|
|
|
|
|
|
|
|
|
|
Mortgage notes payable, net |
|
$ |
|
|
|
$ |
|
|
|
$ |
|
|
|
Notes, net |
|
$ |
|
|
|
$ |
|
|
|
$ |
|
|
|
Amortization of deferred settlements on derivative instruments: |
|
|
|
|
|
|
|
|
|
|
|
|
|
Other liabilities |
|
$ |
( |
) |
|
$ |
( |
) |
|
$ |
( |
) |
|
Accumulated other comprehensive income |
|
$ |
|
|
|
$ |
|
|
|
$ |
|
|
|
Write-off of pursuit costs: |
|
|
|
|
|
|
|
|
|
|
|
|
|
Investment in real estate, net |
|
$ |
|
|
|
$ |
|
|
|
$ |
|
|
|
Other assets |
|
$ |
|
|
|
$ |
|
|
|
$ |
|
|
|
Accounts payable and accrued expenses |
|
$ |
|
|
|
$ |
|
|
|
$ |
|
|
|
(Income) loss from investments in unconsolidated entities: |
|
|
|
|
|
|
|
|
|
|
|
|
|
Investments in unconsolidated entities |
|
$ |
|
|
|
$ |
|
|
|
$ |
( |
) |
|
Other liabilities |
|
$ |
|
|
|
$ |
|
|
|
$ |
|
|
|
Realized/unrealized (gain) loss on derivative instruments: |
|
|
|
|
|
|
|
|
|
|
|
|
|
Other assets |
|
$ |
— |
|
|
$ |
— |
|
|
$ |
|
|
|
Notes, net |
|
$ |
— |
|
|
$ |
— |
|
|
$ |
|
|
|
Other liabilities |
|
$ |
— |
|
|
$ |
|
|
|
$ |
|
|
|
Accumulated other comprehensive income |
|
$ |
— |
|
|
$ |
( |
) |
|
$ |
( |
) |
|
Interest capitalized for real estate and unconsolidated entities under development: |
|
|
|
|
|
|
|
|
|
|
|
|
|
Investment in real estate, net |
|
$ |
( |
) |
|
$ |
( |
) |
|
$ |
( |
) |
|
Investments in unconsolidated entities |
|
$ |
( |
) |
|
$ |
— |
|
|
$ |
— |
|
|
Investments in unconsolidated entities – other: |
|
|
|
|
|
|
|
|
|
|
|
|
|
Investment in real estate, net |
|
$ |
|
|
|
$ |
— |
|
|
$ |
— |
|
|
Investments in unconsolidated entities |
|
$ |
( |
) |
|
$ |
( |
) |
|
$ |
( |
) |
|
Other liabilities |
|
$ |
( |
) |
|
$ |
( |
) |
|
$ |
( |
) |
|
Debt financing costs: |
|
|
|
|
|
|
|
|
|
|
|
|
|
Other assets |
|
$ |
|
|
|
$ |
( |
) |
|
$ |
( |
) |
|
Mortgage notes payable, net |
|
$ |
( |
) |
|
$ |
( |
) |
|
$ |
( |
) |
|
Notes, net |
|
$ |
( |
) |
|
$ |
— |
|
|
$ |
( |
) |
|
Right-of-use assets and lease liabilities initial measurement and reclassifications: |
|
|
|
|
|
|
|
|
|
|
|
|
|
Right-of-use assets |
|
$ |
|
|
|
$ |
— |
|
|
$ |
( |
) |
|
Other assets |
|
$ |
— |
|
|
$ |
— |
|
|
$ |
|
|
|
Lease liabilities |
|
$ |
( |
) |
|
$ |
— |
|
|
$ |
|
|
|
Other liabilities |
|
$ |
— |
|
|
$ |
— |
|
|
$ |
( |
) |
|
Non-cash share distribution from unconsolidated entities: |
|
|
|
|
|
|
|
|
|
|
|
|
|
Investments in unconsolidated entities |
|
$ |
|
|
|
$ |
— |
|
|
$ |
— |
|
|
Other assets |
|
$ |
( |
) |
|
$ |
— |
|
|
$ |
— |
|
See accompanying notes
F-13
EQUITY RESIDENTIAL
CONSOLIDATED STATEMENTS OF CHANGES IN EQUITY
(Amounts in thousands except per share data)
|
|
|
Year Ended December 31, |
|
|||||||||
|
|
|
2021 |
|
|
2020 |
|
|
2019 |
|
|||
|
SHAREHOLDERS’ EQUITY |
|
|
|
|
|
|
|
|
|
|
|
|
|
PREFERRED SHARES |
|
|
|
|
|
|
|
|
|
|
|
|
|
Balance, beginning of year |
|
$ |
|
|
|
$ |
|
|
|
$ |
|
|
|
Balance, end of year |
|
$ |
|
|
|
$ |
|
|
|
$ |
|
|
|
COMMON SHARES, $ |
|
|
|
|
|
|
|
|
|
|
|
|
|
Balance, beginning of year |
|
$ |
|
|
|
$ |
|
|
|
$ |
|
|
|
Conversion of OP Units into Common Shares |
|
|
|
|
|
|
|
|
|
|
|
|
|
Exercise of share options |
|
|
|
|
|
|
|
|
|
|
|
|
|
Employee Share Purchase Plan (ESPP) |
|
|
|
|
|
|
|
|
|
|
|
|
|
Share-based employee compensation expense: |
|
|
|
|
|
|
|
|
|
|
|
|
|
Restricted shares |
|
|
|
|
|
|
|
|
|
|
|
|
|
Balance, end of year |
|
$ |
|
|
|
$ |
|
|
|
$ |
|
|
|
PAID IN CAPITAL |
|
|
|
|
|
|
|
|
|
|
|
|
|
Balance, beginning of year |
|
$ |
|
|
|
$ |
|
|
|
$ |
|
|
|
Common Share Issuance: |
|
|
|
|
|
|
|
|
|
|
|
|
|
Conversion of OP Units into Common Shares |
|
|
|
|
|
|
|
|
|
|
|
|
|
Exercise of share options |
|
|
|
|
|
|
|
|
|
|
|
|
|
Employee Share Purchase Plan (ESPP) |
|
|
|
|
|
|
|
|
|
|
|
|
|
Share-based employee compensation expense: |
|
|
|
|
|
|
|
|
|
|
|
|
|
Restricted shares |
|
|
|
|
|
|
|
|
|
|
|
|
|
Share options |
|
|
|
|
|
|
|
|
|
|
|
|
|
ESPP discount |
|
|
|
|
|
|
|
|
|
|
|
|
|
Offering costs |
|
|
( |
) |
|
|
— |
|
|
|
( |
) |
|
Supplemental Executive Retirement Plan (SERP) |
|
|
( |
) |
|
|
( |
) |
|
|
( |
) |
|
Change in market value of Redeemable Noncontrolling Interests – Operating Partnership |
|
|
( |
) |
|
|
|
|
|
|
( |
) |
|
Adjustment for Noncontrolling Interests ownership in Operating Partnership |
|
|
( |
) |
|
|
|
|
|
|
|
|
|
Balance, end of year |
|
$ |
|
|
|
$ |
|
|
|
$ |
|
|
|
RETAINED EARNINGS |
|
|
|
|
|
|
|
|
|
|
|
|
|
Balance, beginning of year |
|
$ |
|
|
|
$ |
|
|
|
$ |
|
|
|
Net income attributable to controlling interests |
|
|
|
|
|
|
|
|
|
|
|
|
|
Common Share distributions |
|
|
( |
) |
|
|
( |
) |
|
|
( |
) |
|
Preferred Share distributions |
|
|
( |
) |
|
|
( |
) |
|
|
( |
) |
|
Balance, end of year |
|
$ |
|
|
|
$ |
|
|
|
$ |
|
|
|
ACCUMULATED OTHER COMPREHENSIVE INCOME (LOSS) |
|
|
|
|
|
|
|
|
|
|
|
|
|
Balance, beginning of year |
|
$ |
( |
) |
|
$ |
( |
) |
|
$ |
( |
) |
|
Accumulated other comprehensive income (loss) – derivative instruments: |
|
|
|
|
|
|
|
|
|
|
|
|
|
Unrealized holding gains (losses) arising during the year |
|
|
— |
|
|
|
( |
) |
|
|
( |
) |
|
Losses reclassified into earnings from other comprehensive income |
|
|
|
|
|
|
|
|
|
|
|
|
|
Balance, end of year |
|
$ |
( |
) |
|
$ |
( |
) |
|
$ |
( |
) |
|
|
|
|
|
|
|
|
|
|
|
|
|
|
|
DISTRIBUTIONS |
|
|
|
|
|
|
|
|
|
|
|
|
|
Distributions declared per Common Share outstanding |
|
$ |
|
|
|
$ |
|
|
|
$ |
|
|
See accompanying notes
F-14
EQUITY RESIDENTIAL
CONSOLIDATED STATEMENTS OF CHANGES IN EQUITY (Continued)
(Amounts in thousands except per share data)
|
|
|
Year Ended December 31, |
|
|||||||||
|
|
|
2021 |
|
|
2020 |
|
|
2019 |
|
|||
|
NONCONTROLLING INTERESTS |
|
|
|
|
|
|
|
|
|
|
|
|
|
OPERATING PARTNERSHIP |
|
|
|
|
|
|
|
|
|
|
|
|
|
Balance, beginning of year |
|
$ |
|
|
|
$ |
|
|
|
$ |
|
|
|
Issuance of restricted units to Noncontrolling Interests |
|
|
— |
|
|
|
|
|
|
|
|
|
|
Conversion of OP Units held by Noncontrolling Interests into OP Units held by General Partner |
|
|
( |
) |
|
|
( |
) |
|
|
( |
) |
|
Equity compensation associated with Noncontrolling Interests |
|
|
|
|
|
|
|
|
|
|
|
|
|
Net income attributable to Noncontrolling Interests |
|
|
|
|
|
|
|
|
|
|
|
|
|
Distributions to Noncontrolling Interests |
|
|
( |
) |
|
|
( |
) |
|
|
( |
) |
|
Change in carrying value of Redeemable Noncontrolling Interests – Operating Partnership |
|
|
( |
) |
|
|
( |
) |
|
|
( |
) |
|
Adjustment for Noncontrolling Interests ownership in Operating Partnership |
|
|
|
|
|
|
( |
) |
|
|
( |
) |
|
Balance, end of year |
|
$ |
|
|
|
$ |
|
|
|
$ |
|
|
|
PARTIALLY OWNED PROPERTIES |
|
|
|
|
|
|
|
|
|
|
|
|
|
Balance, beginning of year |
|
$ |
|
|
|
$ |
|
|
|
$ |
( |
) |
|
Net income attributable to Noncontrolling Interests |
|
|
|
|
|
|
|
|
|
|
|
|
|
Contributions by Noncontrolling Interests |
|
|
|
|
|
|
|
|
|
|
|
|
|
Distributions to Noncontrolling Interests |
|
|
( |
) |
|
|
( |
) |
|
|
( |
) |
|
Balance, end of year |
|
$ |
|
|
|
$ |
|
|
|
$ |
|
|
See accompanying notes
F-15
ERP OPERATING LIMITED PARTNERSHIP
CONSOLIDATED BALANCE SHEETS
(Amounts in thousands)
|
|
|
December 31, |
|
|
December 31, |
|
||
|
|
|
2021 |
|
|
2020 |
|
||
|
ASSETS |
|
|
|
|
|
|
|
|
|
Land |
|
$ |
|
|
|
$ |
|
|
|
Depreciable property |
|
|
|
|
|
|
|
|
|
Projects under development |
|
|
|
|
|
|
|
|
|
Land held for development |
|
|
|
|
|
|
|
|
|
Investment in real estate |
|
|
|
|
|
|
|
|
|
Accumulated depreciation |
|
|
( |
) |
|
|
( |
) |
|
Investment in real estate, net |
|
|
|
|
|
|
|
|
|
Investments in unconsolidated entities |
|
|
|
|
|
|
|
|
|
Cash and cash equivalents |
|
|
|
|
|
|
|
|
|
Restricted deposits |
|
|
|
|
|
|
|
|
|
Right-of-use assets |
|
|
|
|
|
|
|
|
|
Other assets |
|
|
|
|
|
|
|
|
|
Total assets |
|
$ |
|
|
|
$ |
|
|
|
|
|
|
|
|
|
|
|
|
|
LIABILITIES AND CAPITAL |
|
|
|
|
|
|
|
|
|
Liabilities: |
|
|
|
|
|
|
|
|
|
Mortgage notes payable, net |
|
$ |
|
|
|
$ |
|
|
|
Notes, net |
|
|
|
|
|
|
|
|
|
Line of credit and commercial paper |
|
|
|
|
|
|
|
|
|
Accounts payable and accrued expenses |
|
|
|
|
|
|
|
|
|
Accrued interest payable |
|
|
|
|
|
|
|
|
|
Lease liabilities |
|
|
|
|
|
|
|
|
|
Other liabilities |
|
|
|
|
|
|
|
|
|
Security deposits |
|
|
|
|
|
|
|
|
|
Distributions payable |
|
|
|
|
|
|
|
|
|
Total liabilities |
|
|
|
|
|
|
|
|
|
|
|
|
|
|
|
|
|
|
|
Commitments and contingencies |
|
|
|
|
|
|
|
|
|
|
|
|
|
|
|
|
|
|
|
Redeemable Limited Partners |
|
|
|
|
|
|
|
|
|
Capital: |
|
|
|
|
|
|
|
|
|
Partners’ Capital: |
|
|
|
|
|
|
|
|
|
Preference Units |
|
|
|
|
|
|
|
|
|
General Partner |
|
|
|
|
|
|
|
|
|
Limited Partners |
|
|
|
|
|
|
|
|
|
Accumulated other comprehensive income (loss) |
|
|
( |
) |
|
|
( |
) |
|
Total partners’ capital |
|
|
|
|
|
|
|
|
|
Noncontrolling Interests – Partially Owned Properties |
|
|
|
|
|
|
|
|
|
Total capital |
|
|
|
|
|
|
|
|
|
Total liabilities and capital |
|
$ |
|
|
|
$ |
|
|
See accompanying notes
F-16
ERP OPERATING LIMITED PARTNERSHIP
CONSOLIDATED STATEMENTS OF OPERATIONS AND COMPREHENSIVE INCOME
(Amounts in thousands except per Unit data)
|
|
|
Year Ended December 31, |
|
|||||||||
|
|
|
2021 |
|
|
2020 |
|
|
2019 |
|
|||
|
REVENUES |
|
|
|
|
|
|
|
|
|
|
|
|
|
Rental income |
|
$ |
|
|
|
$ |
|
|
|
$ |
|
|
|
|
|
|
|
|
|
|
|
|
|
|
|
|
|
EXPENSES |
|
|
|
|
|
|
|
|
|
|
|
|
|
Property and maintenance |
|
|
|
|
|
|
|
|
|
|
|
|
|
Real estate taxes and insurance |
|
|
|
|
|
|
|
|
|
|
|
|
|
Property management |
|
|
|
|
|
|
|
|
|
|
|
|
|
General and administrative |
|
|
|
|
|
|
|
|
|
|
|
|
|
Depreciation |
|
|
|
|
|
|
|
|
|
|
|
|
|
Total expenses |
|
|
|
|
|
|
|
|
|
|
|
|
|
|
|
|
|
|
|
|
|
|
|
|
|
|
|
Net gain (loss) on sales of real estate properties |
|
|
|
|
|
|
|
|
|
|
|
|
|
Impairment |
|
|
( |
) |
|
|
— |
|
|
|
— |
|
|
|
|
|
|
|
|
|
|
|
|
|
|
|
|
Operating income |
|
|
|
|
|
|
|
|
|
|
|
|
|
|
|
|
|
|
|
|
|
|
|
|
|
|
|
Interest and other income |
|
|
|
|
|
|
|
|
|
|
|
|
|
Other expenses |
|
|
( |
) |
|
|
( |
) |
|
|
( |
) |
|
Interest: |
|
|
|
|
|
|
|
|
|
|
|
|
|
Expense incurred, net |
|
|
( |
) |
|
|
( |
) |
|
|
( |
) |
|
Amortization of deferred financing costs |
|
|
( |
) |
|
|
( |
) |
|
|
( |
) |
|
Income before income and other taxes, income (loss) from investments in unconsolidated entities and net gain (loss) on sales of land parcels |
|
|
|
|
|
|
|
|
|
|
|
|
|
Income and other tax (expense) benefit |
|
|
( |
) |
|
|
( |
) |
|
|
|
|
|
Income (loss) from investments in unconsolidated entities |
|
|
( |
) |
|
|
( |
) |
|
|
|
|
|
Net gain (loss) on sales of land parcels |
|
|
|
|
|
|
|
|
|
|
|
|
|
Net income |
|
|
|
|
|
|
|
|
|
|
|
|
|
Net (income) loss attributable to Noncontrolling Interests – Partially Owned Properties |
|
|
( |
) |
|
|
( |
) |
|
|
( |
) |
|
Net income attributable to controlling interests |
|
$ |
|
|
|
$ |
|
|
|
$ |
|
|
|
ALLOCATION OF NET INCOME: |
|
|
|
|
|
|
|
|
|
|
|
|
|
Preference Units |
|
$ |
|
|
|
$ |
|
|
|
$ |
|
|
|
|
|
|
|
|
|
|
|
|
|
|
|
|
|
General Partner |
|
$ |
|
|
|
$ |
|
|
|
$ |
|
|
|
Limited Partners |
|
|
|
|
|
|
|
|
|
|
|
|
|
Net income available to Units |
|
$ |
|
|
|
$ |
|
|
|
$ |
|
|
|
|
|
|
|
|
|
|
|
|
|
|
|
|
|
Earnings per Unit – basic: |
|
|
|
|
|
|
|
|
|
|
|
|
|
Net income available to Units |
|
$ |
|
|
|
$ |
|
|
|
$ |
|
|
|
Weighted average Units outstanding |
|
|
|
|
|
|
|
|
|
|
|
|
|
|
|
|
|
|
|
|
|
|
|
|
|
|
|
Earnings per Unit – diluted: |
|
|
|
|
|
|
|
|
|
|
|
|
|
Net income available to Units |
|
$ |
|
|
|
$ |
|
|
|
$ |
|
|
|
Weighted average Units outstanding |
|
|
|
|
|
|
|
|
|
|
|
|
See accompanying notes
F-17
ERP OPERATING LIMITED PARTNERSHIP
CONSOLIDATED STATEMENTS OF OPERATIONS AND COMPREHENSIVE INCOME (Continued)
(Amounts in thousands except per Unit data)
|
|
|
Year Ended December 31, |
|
|||||||||
|
|
|
2021 |
|
|
2020 |
|
|
2019 |
|
|||
|
Comprehensive income: |
|
|
|
|
|
|
|
|
|
|
|
|
|
Net income |
|
$ |
|
|
|
$ |
|
|
|
$ |
|
|
|
Other comprehensive income (loss): |
|
|
|
|
|
|
|
|
|
|
|
|
|
Other comprehensive income (loss) – derivative instruments: |
|
|
|
|
|
|
|
|
|
|
|
|
|
Unrealized holding gains (losses) arising during the year |
|
|
— |
|
|
|
( |
) |
|
|
( |
) |
|
Losses reclassified into earnings from other comprehensive income |
|
|
|
|
|
|
|
|
|
|
|
|
|
Other comprehensive income (loss) |
|
|
|
|
|
|
|
|
|
|
( |
) |
|
Comprehensive income |
|
|
|
|
|
|
|
|
|
|
|
|
|
Comprehensive (income) attributable to Noncontrolling Interests – Partially Owned Properties |
|
|
( |
) |
|
|
( |
) |
|
|
( |
) |
|
Comprehensive income attributable to controlling interests |
|
$ |
|
|
|
$ |
|
|
|
$ |
|
|
See accompanying notes
F-18
ERP OPERATING LIMITED PARTNERSHIP
CONSOLIDATED STATEMENTS OF CASH FLOWS
(Amounts in thousands)
|
|
|
Year Ended December 31, |
|
|||||||||
|
|
|
2021 |
|
|
2020 |
|
|
2019 |
|
|||
|
CASH FLOWS FROM OPERATING ACTIVITIES: |
|
|
|
|
|
|
|
|
|
|
|
|
|
Net income |
|
$ |
|
|
|
$ |
|
|
|
$ |
|
|
|
Adjustments to reconcile net income to net cash provided by operating activities: |
|
|
|
|
|
|
|
|
|
|
|
|
|
Depreciation |
|
|
|
|
|
|
|
|
|
|
|
|
|
Amortization of deferred financing costs |
|
|
|
|
|
|
|
|
|
|
|
|
|
Amortization of above/below market lease intangibles |
|
|
( |
) |
|
|
( |
) |
|
|
( |
) |
|
Amortization of discounts and premiums on debt |
|
|
|
|
|
|
|
|
|
|
|
|
|
Amortization of deferred settlements on derivative instruments |
|
|
|
|
|
|
|
|
|
|
|
|
|
Amortization of right-of-use assets |
|
|
|
|
|
|
|
|
|
|
|
|
|
Impairment |
|
|
|
|
|
|
— |
|
|
|
— |
|
|
Write-off of pursuit costs |
|
|
|
|
|
|
|
|
|
|
|
|
|
(Income) loss from investments in unconsolidated entities |
|
|
|
|
|
|
|
|
|
|
( |
) |
|
Distributions from unconsolidated entities – return on capital |
|
|
|
|
|
|
|
|
|
|
|
|
|
Net (gain) loss on sales of real estate properties |
|
|
( |
) |
|
|
( |
) |
|
|
( |
) |
|
Net (gain) loss on sales of land parcels |
|
|
( |
) |
|
|
( |
) |
|
|
( |
) |
|
Net (gain) loss on debt extinguishment |
|
|
— |
|
|
|
|
|
|
|
|
|
|
Realized/unrealized (gain) loss on derivative instruments |
|
|
— |
|
|
|
|
|
|
|
— |
|
|
Realized (gain) loss on sale of investment securities |
|
|
( |
) |
|
|
— |
|
|
|
— |
|
|
Compensation paid with Company Common Shares |
|
|
|
|
|
|
|
|
|
|
|
|
|
Other operating activities, net |
|
|
— |
|
|
|
|
|
|
|
( |
) |
|
Changes in assets and liabilities: |
|
|
|
|
|
|
|
|
|
|
|
|
|
(Increase) decrease in other assets |
|
|
|
|
|
|
( |
) |
|
|
|
|
|
Increase (decrease) in accounts payable and accrued expenses |
|
|
|
|
|
|
|
|
|
|
|
|
|
Increase (decrease) in accrued interest payable |
|
|
|
|
|
|
( |
) |
|
|
|
|
|
Increase (decrease) in lease liabilities |
|
|
( |
) |
|
|
( |
) |
|
|
( |
) |
|
Increase (decrease) in other liabilities |
|
|
|
|
|
|
( |
) |
|
|
|
|
|
Increase (decrease) in security deposits |
|
|
|
|
|
|
( |
) |
|
|
|
|
|
Net cash provided by operating activities |
|
|
|
|
|
|
|
|
|
|
|
|
|
CASH FLOWS FROM INVESTING ACTIVITIES: |
|
|
|
|
|
|
|
|
|
|
|
|
|
Investment in real estate – acquisitions |
|
|
( |
) |
|
|
( |
) |
|
|
( |
) |
|
Investment in real estate – development/other |
|
|
( |
) |
|
|
( |
) |
|
|
( |
) |
|
Capital expenditures to real estate |
|
|
( |
) |
|
|
( |
) |
|
|
( |
) |
|
Non-real estate capital additions |
|
|
( |
) |
|
|
( |
) |
|
|
( |
) |
|
Interest capitalized for real estate and unconsolidated entities under development |
|
|
( |
) |
|
|
( |
) |
|
|
( |
) |
|
Proceeds from disposition of real estate, net |
|
|
|
|
|
|
|
|
|
|
|
|
|
Investments in unconsolidated entities – acquisitions |
|
|
( |
) |
|
|
— |
|
|
|
— |
|
|
Investments in unconsolidated entities – other |
|
|
( |
) |
|
|
( |
) |
|
|
( |
) |
|
Distributions from unconsolidated entities – return of capital |
|
|
|
|
|
|
|
|
|
|
|
|
|
Purchase of investment securities and other investments |
|
|
( |
) |
|
|
( |
) |
|
|
( |
) |
|
Proceeds from sale of investment securities |
|
|
|
|
|
|
— |
|
|
|
— |
|
|
Net cash provided by (used for) investing activities |
|
|
( |
) |
|
|
|
|
|
|
( |
) |
See accompanying notes
F-19
ERP OPERATING LIMITED PARTNERSHIP
CONSOLIDATED STATEMENTS OF CASH FLOWS (Continued)
(Amounts in thousands)
|
|
|
Year Ended December 31, |
|
|||||||||
|
|
|
2021 |
|
|
2020 |
|
|
2019 |
|
|||
|
CASH FLOWS FROM FINANCING ACTIVITIES: |
|
|
|
|
|
|
|
|
|
|
|
|
|
Debt financing costs |
|
$ |
( |
) |
|
$ |
( |
) |
|
$ |
( |
) |
|
Mortgage notes payable, net: |
|
|
|
|
|
|
|
|
|
|
|
|
|
Proceeds |
|
|
|
|
|
|
|
|
|
|
|
|
|
Lump sum payoffs |
|
|
( |
) |
|
|
( |
) |
|
|
( |
) |
|
Scheduled principal repayments |
|
|
( |
) |
|
|
( |
) |
|
|
( |
) |
|
Net gain (loss) on debt extinguishment |
|
|
— |
|
|
|
( |
) |
|
|
( |
) |
|
Notes, net: |
|
|
|
|
|
|
|
|
|
|
|
|
|
Proceeds |
|
|
|
|
|
|
— |
|
|
|
|
|
|
Lump sum payoffs |
|
|
— |
|
|
|
( |
) |
|
|
( |
) |
|
Net gain (loss) on debt extinguishment |
|
|
— |
|
|
|
( |
) |
|
|
( |
) |
|
Line of credit and commercial paper: |
|
|
|
|
|
|
|
|
|
|
|
|
|
Line of credit proceeds |
|
|
|
|
|
|
|
|
|
|
|
|
|
Line of credit repayments |
|
|
( |
) |
|
|
( |
) |
|
|
( |
) |
|
Commercial paper proceeds |
|
|
|
|
|
|
|
|
|
|
|
|
|
Commercial paper repayments |
|
|
( |
) |
|
|
( |
) |
|
|
( |
) |
|
Proceeds from (payments on) settlement of derivative instruments |
|
|
— |
|
|
|
( |
) |
|
|
( |
) |
|
Prepaid finance ground lease |
|
|
— |
|
|
|
— |
|
|
|
( |
) |
|
Finance ground lease principal payments |
|
|
( |
) |
|
|
— |
|
|
|
— |
|
|
Proceeds from EQR’s Employee Share Purchase Plan (ESPP) |
|
|
|
|
|
|
|
|
|
|
|
|
|
Proceeds from exercise of EQR options |
|
|
|
|
|
|
|
|
|
|
|
|
|
Payment of offering costs |
|
|
( |
) |
|
|
— |
|
|
|
( |
) |
|
Other financing activities, net |
|
|
( |
) |
|
|
( |
) |
|
|
( |
) |
|
Contributions – Noncontrolling Interests – Partially Owned Properties |
|
|
|
|
|
|
|
|
|
|
|
|
|
Contributions – Limited Partners |
|
|
— |
|
|
|
|
|
|
|
|
|
|
Distributions: |
|
|
|
|
|
|
|
|
|
|
|
|
|
OP Units – General Partner |
|
|
( |
) |
|
|
( |
) |
|
|
( |
) |
|
Preference Units |
|
|
( |
) |
|
|
( |
) |
|
|
( |
) |
|
OP Units – Limited Partners |
|
|
( |
) |
|
|
( |
) |
|
|
( |
) |
|
Noncontrolling Interests – Partially Owned Properties |
|
|
( |
) |
|
|
( |
) |
|
|
( |
) |
|
Net cash provided by (used for) financing activities |
|
|
( |
) |
|
|
( |
) |
|
|
( |
) |
|
Net increase (decrease) in cash and cash equivalents and restricted deposits |
|
|
|
|
|
|
( |
) |
|
|
|
|
|
Cash and cash equivalents and restricted deposits, beginning of year |
|
|
|
|
|
|
|
|
|
|
|
|
|
Cash and cash equivalents and restricted deposits, end of year |
|
$ |
|
|
|
$ |
|
|
|
$ |
|
|
|
|
|
|
|
|
|
|
|
|
|
|
|
|
|
Cash and cash equivalents and restricted deposits, end of year |
|
|
|
|
|
|
|
|
|
|
|
|
|
Cash and cash equivalents |
|
$ |
|
|
|
$ |
|
|
|
$ |
|
|
|
Restricted deposits |
|
|
|
|
|
|
|
|
|
|
|
|
|
Total cash and cash equivalents and restricted deposits, end of year |
|
$ |
|
|
|
$ |
|
|
|
$ |
|
|
See accompanying notes
F-20
ERP OPERATING LIMITED PARTNERSHIP
CONSOLIDATED STATEMENTS OF CASH FLOWS (Continued)
(Amounts in thousands)
|
|
|
Year Ended December 31, |
|
|||||||||
|
|
|
2021 |
|
|
2020 |
|
|
2019 |
|
|||
|
SUPPLEMENTAL INFORMATION: |
|
|
|
|
|
|
|
|
|
|
|
|
|
Cash paid for interest, net of amounts capitalized |
|
$ |
|
|
|
$ |
|
|
|
$ |
|
|
|
Net cash paid (received) for income and other taxes |
|
$ |
|
|
|
$ |
( |
) |
|
$ |
( |
) |
|
Amortization of deferred financing costs: |
|
|
|
|
|
|
|
|
|
|
|
|
|
Investment in real estate, net |
|
$ |
( |
) |
|
$ |
( |
) |
|
$ |
( |
) |
|
Other assets |
|
$ |
|
|
|
$ |
|
|
|
$ |
|
|
|
Mortgage notes payable, net |
|
$ |
|
|
|
$ |
|
|
|
$ |
|
|
|
Notes, net |
|
$ |
|
|
|
$ |
|
|
|
$ |
|
|
|
Amortization of discounts and premiums on debt: |
|
|
|
|
|
|
|
|
|
|
|
|
|
Mortgage notes payable, net |
|
$ |
|
|
|
$ |
|
|
|
$ |
|
|
|
Notes, net |
|
$ |
|
|
|
$ |
|
|
|
$ |
|
|
|
Amortization of deferred settlements on derivative instruments: |
|
|
|
|
|
|
|
|
|
|
|
|
|
Other liabilities |
|
$ |
( |
) |
|
$ |
( |
) |
|
$ |
( |
) |
|
Accumulated other comprehensive income |
|
$ |
|
|
|
$ |
|
|
|
$ |
|
|
|
Write-off of pursuit costs: |
|
|
|
|
|
|
|
|
|
|
|
|
|
Investment in real estate, net |
|
$ |
|
|
|
$ |
|
|
|
$ |
|
|
|
Other assets |
|
$ |
|
|
|
$ |
|
|
|
$ |
|
|
|
Accounts payable and accrued expenses |
|
$ |
|
|
|
$ |
|
|
|
$ |
|
|
|
(Income) loss from investments in unconsolidated entities: |
|
|
|
|
|
|
|
|
|
|
|
|
|
Investments in unconsolidated entities |
|
$ |
|
|
|
$ |
|
|
|
$ |
( |
) |
|
Other liabilities |
|
$ |
|
|
|
$ |
|
|
|
$ |
|
|
|
Realized/unrealized (gain) loss on derivative instruments: |
|
|
|
|
|
|
|
|
|
|
|
|
|
Other assets |
|
$ |
— |
|
|
$ |
— |
|
|
$ |
|
|
|
Notes, net |
|
$ |
— |
|
|
$ |
— |
|
|
$ |
|
|
|
Other liabilities |
|
$ |
— |
|
|
$ |
|
|
|
$ |
|
|
|
Accumulated other comprehensive income |
|
$ |
— |
|
|
$ |
( |
) |
|
$ |
( |
) |
|
Interest capitalized for real estate and unconsolidated entities under development: |
|
|
|
|
|
|
|
|
|
|
|
|
|
Investment in real estate, net |
|
$ |
( |
) |
|
$ |
( |
) |
|
$ |
( |
) |
|
Investments in unconsolidated entities |
|
$ |
( |
) |
|
$ |
— |
|
|
$ |
— |
|
|
Investments in unconsolidated entities – other: |
|
|
|
|
|
|
|
|
|
|
|
|
|
Investment in real estate, net |
|
$ |
|
|
|
$ |
— |
|
|
$ |
— |
|
|
Investments in unconsolidated entities |
|
$ |
( |
) |
|
$ |
( |
) |
|
$ |
( |
) |
|
Other liabilities |
|
$ |
( |
) |
|
$ |
( |
) |
|
$ |
( |
) |
|
Debt financing costs: |
|
|
|
|
|
|
|
|
|
|
|
|
|
Other assets |
|
$ |
|
|
|
$ |
( |
) |
|
$ |
( |
) |
|
Mortgage notes payable, net |
|
$ |
( |
) |
|
$ |
( |
) |
|
$ |
( |
) |
|
Notes, net |
|
$ |
( |
) |
|
$ |
— |
|
|
$ |
( |
) |
|
Right-of-use assets and lease liabilities initial measurement and reclassifications: |
|
|
|
|
|
|
|
|
|
|
|
|
|
Right-of-use assets |
|
$ |
|
|
|
$ |
— |
|
|
$ |
( |
) |
|
Other assets |
|
$ |
— |
|
|
$ |
— |
|
|
$ |
|
|
|
Lease liabilities |
|
$ |
( |
) |
|
$ |
— |
|
|
$ |
|
|
|
Other liabilities |
|
$ |
— |
|
|
$ |
— |
|
|
$ |
( |
) |
|
Non-cash share distribution from unconsolidated entities: |
|
|
|
|
|
|
|
|
|
|
|
|
|
Investments in unconsolidated entities |
|
$ |
|
|
|
$ |
— |
|
|
$ |
— |
|
|
Other assets |
|
$ |
( |
) |
|
$ |
— |
|
|
$ |
— |
|
See accompanying notes
F-21
ERP OPERATING LIMITED PARTNERSHIP
CONSOLIDATED STATEMENTS OF CHANGES IN CAPITAL
(Amounts in thousands except per Unit data)
|
|
|
Year Ended December 31, |
|
|||||||||
|
|
|
2021 |
|
|
2020 |
|
|
2019 |
|
|||
|
PARTNERS’ CAPITAL |
|
|
|
|
|
|
|
|
|
|
|
|
|
PREFERENCE UNITS |
|
|
|
|
|
|
|
|
|
|
|
|
|
Balance, beginning of year |
|
$ |
|
|
|
$ |
|
|
|
$ |
|
|
|
Balance, end of year |
|
$ |
|
|
|
$ |
|
|
|
$ |
|
|
|
GENERAL PARTNER |
|
|
|
|
|
|
|
|
|
|
|
|
|
Balance, beginning of year |
|
$ |
|
|
|
$ |
|
|
|
$ |
|
|
|
OP Unit Issuance: |
|
|
|
|
|
|
|
|
|
|
|
|
|
Conversion of OP Units held by Limited Partners into OP Units held by General Partner |
|
|
|
|
|
|
|
|
|
|
|
|
|
Exercise of EQR share options |
|
|
|
|
|
|
|
|
|
|
|
|
|
EQR’s Employee Share Purchase Plan (ESPP) |
|
|
|
|
|
|
|
|
|
|
|
|
|
Share-based employee compensation expense: |
|
|
|
|
|
|
|
|
|
|
|
|
|
EQR restricted shares |
|
|
|
|
|
|
|
|
|
|
|
|
|
EQR share options |
|
|
|
|
|
|
|
|
|
|
|
|
|
EQR ESPP discount |
|
|
|
|
|
|
|
|
|
|
|
|
|
Net income available to Units – General Partner |
|
|
|
|
|
|
|
|
|
|
|
|
|
OP Units – General Partner distributions |
|
|
( |
) |
|
|
( |
) |
|
|
( |
) |
|
Offering costs |
|
|
( |
) |
|
|
— |
|
|
|
( |
) |
|
Supplemental Executive Retirement Plan (SERP) |
|
|
( |
) |
|
|
( |
) |
|
|
( |
) |
|
Change in market value of Redeemable Limited Partners |
|
|
( |
) |
|
|
|
|
|
|
( |
) |
|
Adjustment for Limited Partners ownership in Operating Partnership |
|
|
( |
) |
|
|
|
|
|
|
|
|
|
Balance, end of year |
|
$ |
|
|
|
$ |
|
|
|
$ |
|
|
|
LIMITED PARTNERS |
|
|
|
|
|
|
|
|
|
|
|
|
|
Balance, beginning of year |
|
$ |
|
|
|
$ |
|
|
|
$ |
|
|
|
Issuance of restricted units to Limited Partners |
|
|
— |
|
|
|
|
|
|
|
|
|
|
Conversion of OP Units held by Limited Partners into OP Units held by General Partner |
|
|
( |
) |
|
|
( |
) |
|
|
( |
) |
|
Equity compensation associated with Units – Limited Partners |
|
|
|
|
|
|
|
|
|
|
|
|
|
Net income available to Units – Limited Partners |
|
|
|
|
|
|
|
|
|
|
|
|
|
Units – Limited Partners distributions |
|
|
( |
) |
|
|
( |
) |
|
|
( |
) |
|
Change in carrying value of Redeemable Limited Partners |
|
|
( |
) |
|
|
( |
) |
|
|
( |
) |
|
Adjustment for Limited Partners ownership in Operating Partnership |
|
|
|
|
|
|
( |
) |
|
|
( |
) |
|
Balance, end of year |
|
$ |
|
|
|
$ |
|
|
|
$ |
|
|
|
ACCUMULATED OTHER COMPREHENSIVE INCOME (LOSS) |
|
|
|
|
|
|
|
|
|
|
|
|
|
Balance, beginning of year |
|
$ |
( |
) |
|
$ |
( |
) |
|
$ |
( |
) |
|
Accumulated other comprehensive income (loss) – derivative instruments: |
|
|
|
|
|
|
|
|
|
|
|
|
|
Unrealized holding gains (losses) arising during the year |
|
|
— |
|
|
|
( |
) |
|
|
( |
) |
|
Losses reclassified into earnings from other comprehensive income |
|
|
|
|
|
|
|
|
|
|
|
|
|
Balance, end of year |
|
$ |
( |
) |
|
$ |
( |
) |
|
$ |
( |
) |
|
|
|
|
|
|
|
|
|
|
|
|
|
|
|
DISTRIBUTIONS |
|
|
|
|
|
|
|
|
|
|
|
|
|
Distributions declared per Unit outstanding |
|
$ |
|
|
|
$ |
|
|
|
$ |
|
|
See accompanying notes
F-22
ERP OPERATING LIMITED PARTNERSHIP
CONSOLIDATED STATEMENTS OF CHANGES IN CAPITAL (Continued)
(Amounts in thousands except per Unit data)
|
|
|
Year Ended December 31, |
|
|||||||||
|
|
|
2021 |
|
|
2020 |
|
|
2019 |
|
|||
|
NONCONTROLLING INTERESTS |
|
|
|
|
|
|
|
|
|
|
|
|
|
NONCONTROLLING INTERESTS – PARTIALLY OWNED PROPERTIES |
|
|
|
|
|
|
|
|
|
|
|
|
|
Balance, beginning of year |
|
$ |
|
|
|
$ |
|
|
|
$ |
( |
) |
|
Net income attributable to Noncontrolling Interests |
|
|
|
|
|
|
|
|
|
|
|
|
|
Contributions by Noncontrolling Interests |
|
|
|
|
|
|
|
|
|
|
|
|
|
Distributions to Noncontrolling Interests |
|
|
( |
) |
|
|
( |
) |
|
|
( |
) |
|
Balance, end of year |
|
$ |
|
|
|
$ |
|
|
|
$ |
|
|
See accompanying notes
F-23
EQUITY RESIDENTIAL
ERP OPERATING LIMITED PARTNERSHIP
NOTES TO CONSOLIDATED FINANCIAL STATEMENTS
|
1. |
Business |
Equity Residential (“EQR”) is an S&P 500 company focused on the acquisition, development and management of residential properties located in and around dynamic cities that attract affluent long-term renters, a business that is conducted on its behalf by ERP Operating Limited Partnership (“ERPOP”). EQR is a Maryland real estate investment trust (“REIT”) formed in March 1993 and ERPOP is an Illinois limited partnership formed in May 1993. References to the “Company,” “we,” “us” or “our” mean collectively EQR, ERPOP and those entities/subsidiaries owned or controlled by EQR and/or ERPOP. References to the “Operating Partnership” mean collectively ERPOP and those entities/subsidiaries owned or controlled by ERPOP. Unless otherwise indicated, the notes to consolidated financial statements apply to both the Company and the Operating Partnership.
EQR is the general partner of, and as of December 31, 2021 owned an approximate
As of December 31, 2021, the Company, directly or indirectly through investments in title holding entities, owned all or a portion of
|
|
|
Properties |
|
|
Apartment Units |
|
||
|
Wholly Owned Properties |
|
|
294 |
|
|
|
76,861 |
|
|
Partially Owned Properties – Consolidated |
|
|
16 |
|
|
|
3,546 |
|
|
|
|
|
310 |
|
|
|
80,407 |
|
COVID-19 Pandemic
The Company continues to monitor and respond to the ongoing effects of the novel coronavirus (“COVID-19”) pandemic. Its duration, severity and the extent of its adverse health impact on the general population, our residents and employees, along with the distribution, effectiveness and acceptance of vaccines and testing and pace and degree of recovery from the pandemic are among the many unknowns that have had or could continue to have a significant impact on the Company. These, among other items, have impacted the economy, the unemployment rate and our operations and could materially affect our future consolidated results of operations, financial condition, liquidity, investments and overall performance.
|
2. |
Summary of Significant Accounting Policies |
Basis of Presentation
Due to the Company’s ability as general partner to control either through ownership or by contract the Operating Partnership and its subsidiaries, the Operating Partnership and each such subsidiary has been consolidated with the Company for financial reporting purposes, except for any unconsolidated properties/entities.
Real Estate Assets and Depreciation of Investment in Real Estate
The Company expects that substantially all of its acquisitions will be accounted for as asset acquisitions. In an asset acquisition, the Company is required to capitalize transaction costs and allocate the purchase price on a relative fair value basis (including any identified intangible assets). For the years ended December 31, 2021 and 2020, all acquisitions were considered asset acquisitions.
In making estimates of relative fair values for purposes of allocating purchase price, the Company utilizes a number of sources, including independent appraisals that may be obtained in connection with the acquisition or financing of the respective property, our own analysis of recently acquired or developed and existing comparable properties in our portfolio and other market data. The Company also considers information obtained about each property as a result of its pre-acquisition due diligence, marketing and
F-24
leasing activities in estimating the relative fair value of the tangible and intangible assets/liabilities acquired. The Company allocates the purchase price of acquired real estate to various components as follows:
|
|
• |
Land – Based on actual purchase price adjusted to an allocation of the relative fair value (as necessary) if acquired separately or market research/comparables if acquired with an operating property. |
|
|
• |
Furniture, Fixtures and Equipment – Based on an estimate of the allocation of the relative fair value of the appliances and fixtures inside an apartment unit. The per-apartment unit amount applied depends on the economic age of the apartment units acquired. Depreciation is calculated on the straight-line method over an estimated useful life of |
|
|
• |
Lease Intangibles – The Company considers the value of acquired in-place leases and above/below market leases and the amortization period is the average remaining term of each respective acquired lease. In-place residential leases’ average term at acquisition approximates |
|
|
• |
Other Intangible Assets – The Company considers whether it has acquired other intangible assets, including any customer relationship intangibles and the amortization period is the estimated useful life of the acquired intangible asset. |
|
|
• |
Building – Based on the allocation of the relative fair value determined on an “as-if vacant” basis. Depreciation is calculated on the straight-line method over an estimated useful life of |
|
|
• |
Long-Term Debt – The Company calculates the allocation of the relative fair value by discounting the remaining contractual cash flows on each instrument at the current market rate for those borrowings. |
Replacements inside an apartment unit such as appliances and carpeting are depreciated over an estimated useful life of
Property dispositions are recorded when control transfers to unrelated third parties, contingencies have been removed and sufficient cash consideration has been received by the Company. Upon disposition, the related costs and accumulated depreciation are removed from the respective accounts. Any gain or loss on sale is recognized in accordance with accounting principles generally accepted in the United States.
The Company classifies real estate assets as real estate held for sale when it is probable a property will be disposed of. The Company classifies properties under development and/or expansion and properties in the lease-up phase (including land) as construction-in-progress until construction has been completed and certificates of occupancy permits have been obtained.
Impairment of Long-Lived Assets
At least quarterly, the Company evaluates its long-lived assets, including its investment in real estate, for indicators of impairment. The judgments regarding the existence of impairment indicators are based on factors such as operational performance, market conditions, legal, regulatory and environmental concerns, the Company’s intent and ability to hold the related asset, as well as any significant cost overruns on development properties. Future events could occur which would cause the Company to conclude that impairment indicators exist and an impairment loss is warranted. If an impairment indicator exists, the Company performs the following:
|
|
• |
For long-lived operating assets to be held and used, the Company compares the expected future undiscounted cash flows for the long-lived asset against the carrying amount of that asset. If the sum of the estimated undiscounted cash flows is less than the carrying amount of the asset, the Company would make an estimate of the fair value for the particular asset and would record an impairment loss for the difference between the estimated fair value and the carrying amount of the asset. In determining the future undiscounted cash flows or the estimated fair value of an asset there is judgment in estimating the expected future rental revenues, operating expenses and discount and capitalization rates. |
|
|
• |
For long-lived non-operating assets (projects under development and land held for development), management evaluates major cost overruns, market conditions that could affect lease-up projections, intent and ability to hold the asset, and any other indicators of impairment. If any of the indicators were to suggest impairment was present, a recoverability analysis would be performed and the carrying value of the asset would be adjusted accordingly to fair value. |
|
|
• |
For long-lived assets to be disposed of, an impairment loss is recognized when the estimated fair value of the asset, less the estimated cost to sell, is less than the carrying amount of the asset measured at the time that the Company has determined it will sell the asset. Long-lived assets held for sale and the related liabilities are separately reported, with the |
F-25
|
|
long-lived assets reported at the lower of their carrying amounts or their estimated fair values, less their costs to sell, and are not depreciated after reclassification to real estate held for sale. |
See Note 4 for further discussion of the Company’s impairment charge on a land parcel in 2021.
Impairment of Investments in Unconsolidated Entities
At least quarterly, the Company evaluates its investments in unconsolidated entities, including any multifamily real estate assets held by a joint venture, for indicators of other than temporary impairment, considering whether there has been a change to events or circumstances that would impact recoverability of the Company’s investment as well as any changes with regards to the Company's intent and ability to hold the investment to recover its carrying value.
Cost Capitalization
See the Real Estate Assets and Depreciation of Investment in Real Estate section for a discussion of the Company’s policy with respect to capitalization vs. expensing of fixed asset/repair and maintenance costs. For all development, capital and renovation projects, the Company uses its professional judgment in determining whether such costs meet the criteria for capitalization or must be expensed as incurred. The Company capitalizes interest, real estate taxes and insurance, as well as payroll for those individuals directly responsible for and who spend their time on the execution and supervision of development activities. Additionally, the Company capitalizes payroll for those individuals directly responsible for and who spend their time on the execution and supervision of major capital and/or renovation projects. Capitalization ends when the asset, or a portion of the asset, is substantially completed and ready for its intended use. These costs are reflected on the balance sheets as increases to depreciable property and/or construction-in-progress.
During the years ended December 31, 2021 and 2020, the Company capitalized $
Cash and Cash Equivalents
The Company considers all demand deposits, money market accounts and investments in certificates of deposit with a maturity of three months or less at the date of purchase to be cash equivalents. The Company maintains its cash and cash equivalents at financial institutions. The combined account balances at one or more institutions typically exceed the Federal Deposit Insurance Corporation (“FDIC”) insurance coverage, and, as a result, there is a concentration of credit risk related to amounts on deposit in excess of FDIC insurance coverage. The Company believes that the risk is not significant, as the Company does not anticipate the financial institutions’ non-performance.
Fair Value of Financial Instruments
The valuation of financial instruments requires the Company to make estimates and judgments that affect the fair value of the instruments. The Company, where possible, bases the fair values of its financial instruments on listed market prices and third-party quotes. Where these are not available, the Company bases its estimates on current instruments with similar terms and maturities or on other factors relevant to the financial instruments.
In the normal course of business, the Company is exposed to the effect of interest rate changes. The Company may seek to manage these risks by following established risk management policies and procedures, including the use of derivatives to hedge interest rate risk on debt instruments. The Company may also use derivatives to manage commodity prices in the daily operations of the business.
The Company has a policy of only entering into derivative contracts with major financial institutions based upon their credit ratings and other factors. When viewed in conjunction with the underlying and offsetting exposure that the derivatives are designed to hedge, the Company has not sustained a material loss from these instruments nor does it anticipate any material adverse effect on its net income or financial position in the future.
The Company recognizes all derivatives as either assets or liabilities in the consolidated balance sheets and measures those instruments at fair value. In addition, fair value adjustments will affect either shareholders’ equity/partners’ capital or net income depending on whether the derivative instruments qualify as a hedge for accounting purposes and, if so, the nature of the hedging activity. When the terms of an underlying transaction are modified, or when the underlying transaction is terminated or completed, all changes in the fair value of the instrument are marked-to-market with changes in value included in net income each period until the
F-26
instrument matures. Any derivative instrument used for risk management that does not meet the hedging criteria is marked-to-market each period. The Company does not use derivatives for trading or speculative purposes.
Leases and Revenue Recognition
Rental income attributable to residential leases is recorded on a straight-line basis over the term of the lease when reasonably assured they are collectible, which is not materially different than if it were recorded when due from residents and recognized monthly as it was earned. Leases entered into between a resident and a property for the rental of an apartment unit are generally year-to-year, renewable upon consent of both parties on an annual or monthly basis. Rental income attributable to non-residential leases is also recorded on a straight-line basis over the term of the lease when reasonably assured they are collectible. Non-residential leases generally have
The majority of the Company’s revenue is derived from residential, non-residential and other lease income, which are accounted for under the lease standard effective January 1, 2019. Our revenue streams have the same timing and pattern of revenue recognition across our reportable segments, with consistent allocations between the lease and revenue recognition standards.
The Company is a lessor for its residential and non-residential leases and is a lessee for its corporate headquarters and regional offices and ground leases for land underlying current operating properties or projects under development. If applicable, lease agreements must be evaluated to determine the accounting treatment as a finance or operating lease in accordance with the lease standard. A lease is classified as a finance lease if it meets any of the following criteria: (a) Ownership of the underlying asset is transferred to the lessee by the end of the lease term; (b) the lessee has and is reasonably certain to exercise an option to purchase the underlying asset; (c) the lease term is for the major part of the remaining economic life of the underlying asset; (d)
The lease standard also requires lessees to recognize on the balance sheet: (a) a liability for the lease obligation (initially measured at the present value of the future lease payments not yet paid over the lease term); and (b) an asset for its right to use the underlying asset (initially equal to the lease liability). The discount rate for the lease is the rate implicit in the lease or, if that rate cannot be readily determined, the incremental borrowing rate. As the Company does not know the amount of the lessors’ initial direct costs, it cannot readily determine the rate implicit in the lease and instead must apply the incremental borrowing rate. The Company uses estimates and judgments on the incremental borrowing rate used to calculate the present value of the future lease payments. Since the Company’s credit backs the corporate office lease obligations and the lease terms are generally
The Company’s revenue streams that are not accounted for under the lease standard include:
|
|
• |
Parking revenue – The Company’s parking revenue, not related to leasing, is derived primarily from monthly and transient daily parking and is accounted for at the point in time when control of the goods or services transfers to the customer and our performance obligation is satisfied. |
|
|
• |
Other rental and non-rental related revenue – The Company receives other income, including, but not limited to: (a) ancillary income, such as laundry, renters insurance and cable income; (b) net settlement income; and (c) miscellaneous fee income. |
|
|
• |
Gains or losses on sales of real estate properties – The Company accounts for the sale of real estate properties and any related gain recognition in accordance with the accounting guidance applicable to sales of real estate, which establishes standards for recognition of profit on all real estate sales transactions. The Company recognizes the sale, and associated gain or loss from the disposition, provided that the earnings process is complete and the Company does not have significant continuing involvement. A gain or loss is recognized when the criteria for an asset to be derecognized are met, which include when a contract exists and the buyer obtained control of the nonfinancial asset that was sold. |
See Note 8 for the Company’s rental income detail allocated between the lease and revenue recognition standards.
The Company’s allowance for doubtful accounts (which offsets accounts receivable and is included within other assets on the consolidated balance sheets) and bad debts (which reduce rental income on the consolidated statements of operations and comprehensive income) have historically been very modest, particularly in our residential business, given the quality of our resident base and asset class. However, due to the impact of the COVID-19 pandemic, the allowance for doubtful accounts and bad debts became elevated during 2020 and remained elevated in 2021. In accordance with the lease standard, if we determine the lease payments are not probable of collection (based on known troubled accounts, rent deferral plans granted, historical experience and other currently available evidence), we fully reserve for any unpaid amounts, deferred rent receivable, variable lease payments and straight-line receivable balances and recognize rental income only if cash is received. If the Company’s estimates of collectibility
F-27
differ from the cash received, then the timing and amount of the Company’s reported revenue could be impacted. See Note 8 for additional details.
Share-Based Compensation
The Company expenses share-based compensation for employee and trustee grants of restricted shares, restricted units and share options. Any common share of beneficial interest, $
Income and Other Taxes
EQR has elected to be taxed as a REIT. This, along with the nature of the operations of its operating properties, resulted in
The Coronavirus Aid, Relief, and Economic Security Act (the “CARES Act”) included tax provisions which increased allowable interest expense deductions for 2019 and 2020 (no increases for 2021) and increased the ability for taxpayers to use net operating losses. These provisions did not result in a material impact to the Company’s taxable income or tax liabilities.
The CARES Act also allowed corporations to request accelerated refunds of their alternative minimum tax (“AMT”) credit. Prior to enactment of this provision, the remaining credits would have been refunded in installments in 2020, 2021 and 2022. We received a refund of our remaining $
The Company’s provision for income and other tax expense (benefit) was as follows for the years ended December 31, 2021, 2020 and 2019 (amounts in thousands):
|
|
|
Year Ended December 31, |
|
|||||||||
|
|
|
2021 |
|
|
2020 |
|
|
2019 |
|
|||
|
State and local income, franchise and excise tax (benefit) |
|
$ |
|
|
|
$ |
|
|
|
$ |
|
|
|
Alternative minimum tax credit (benefit) (1) |
|
|
— |
|
|
|
— |
|
|
|
( |
) |
|
Income and other tax expense (benefit) (2) |
|
$ |
|
|
|
$ |
|
|
|
$ |
( |
) |
|
(1) |
As provided in recent tax legislation which repealed the AMT credit on corporations, in 2019 the Company claimed/received $ |
|
(2) |
All provisions for income tax amounts are current and none are deferred. |
During the years ended December 31, 2021, 2020 and 2019, the tax character of the Company’s dividends and distributions were as follows (unaudited):
|
|
|
Year Ended December 31, |
|
|||||||||
|
|
|
2021 (1) |
|
|
2020 (2) |
|
|
2019 (3) |
|
|||
|
Tax character of dividends and distributions: |
|
|
|
|
|
|
|
|
|
|
|
|
|
Ordinary dividends |
|
$ |
|
|
|
$ |
|
|
|
$ |
|
|
|
Long-term capital gain |
|
|
|
|
|
|
|
|
|
|
|
|
|
Unrecaptured section 1250 gain |
|
|
|
|
|
|
|
|
|
|
|
|
|
Dividends and distributions per |
|
|
|
|
|
|
|
|
|
|
|
|
|
Common Share/Unit outstanding |
|
$ |
|
|
|
$ |
|
|
|
$ |
|
|
|
(1) |
The Company’s fourth quarter 2021 dividends and distributions of $ |
|
(2) |
The Company’s fourth quarter 2020 dividends and distributions of $ |
|
(3) |
The Company’s fourth quarter 2019 dividends and distributions of $ |
F-28
The Company issued Internal Revenue Service (“IRS”) Form 1099-DIV to shareholders to report the tax character of Company distributions consistent with these amounts. The Company provides additional information to assist shareholders in the preparation of their tax returns. For 2021, the Company reported an AMT preference adjustment equal to $
The unaudited cost of land and depreciable property, net of accumulated depreciation, for federal income tax purposes as of December 31, 2021 and 2020 was approximately $
Principles of Consolidation
The Company may hold an interest in subsidiaries, partnerships, joint ventures and other similar entities and accounts for these interests in accordance with the consolidation guidance. The Company first determines whether to consolidate the entity as a variable interest entity (“VIE”) or voting interest entity, or to account for the interest under the equity method of accounting as an unconsolidated entity. In situations in which we have concluded that an entity qualifies as a VIE, it is generally because the equity investors of VIEs do not have sufficient equity at risk to finance their activities without additional subordinated financial support or do not have substantive voting rights. The Company consolidates an entity when it is considered to be the primary beneficiary of the VIE or when it controls the entity through ownership of a majority voting interest. A primary beneficiary has the power to direct the activities that most significantly impact the VIE’s performance and has the obligation to absorb the expected losses or the right to receive the expected residual returns that could potentially be significant to the VIE. In evaluating whether the entity is a VIE and/or the Company is the primary beneficiary of the entity, the Company considers several factors, including, but not limited to, proportionate share or ownership of the VIE, funding and financing sources, the business purpose of the entity, related parties, developer and property management fees and agreement terms regarding major decisions, participating and voting rights, contributions and distributions.
Investments in Unconsolidated Entities
The Company accounts for investments in unconsolidated entities under the equity method of accounting and measures the investments initially at cost. The Company subsequently adjusts the carrying amount by additional cash and non-cash contributions and distributions and its proportionate share of the earnings and losses of such entities. The proportionate share of the earnings and losses are also recognized in the consolidated statements of operations and comprehensive income. In addition, we may earn fees for providing property management services or construction oversight.
Noncontrolling Interests
A noncontrolling interest in a subsidiary (minority interest) is an ownership interest in the consolidated entity that should be reported as equity in the consolidated financial statements and separate from the parent company’s equity. In addition, consolidated net income is required to be reported at amounts that include the amounts attributable to both the parent and the noncontrolling interest and the amount of consolidated net income attributable to the parent and the noncontrolling interest are required to be disclosed on the face of the consolidated statements of operations and comprehensive income. See Note 3 for further discussion.
Operating Partnership: Net income is allocated to noncontrolling interests based on their respective ownership percentage of the Operating Partnership. The ownership percentage is calculated by dividing the number of OP Units held by the noncontrolling interests by the total OP Units held by the noncontrolling interests and EQR. Issuance of additional Common Shares and OP Units changes the ownership interests of both the noncontrolling interests and EQR. Such transactions and the related proceeds are treated as capital transactions.
Partially Owned Properties: The Company reflects noncontrolling interests in partially owned properties on the balance sheet for the portion of properties consolidated by the Company that are not wholly owned by the Company. The earnings or losses from those properties attributable to the noncontrolling interests are generally based on ownership percentage and are reflected as noncontrolling interests in partially owned properties in the consolidated statements of operations and comprehensive income.
Partners’ Capital
The “Limited Partners” of ERPOP include various individuals and entities that contributed their properties to ERPOP in exchange for OP Units. The “General Partner” of ERPOP is EQR. Net income is allocated to the Limited Partners based on their respective ownership percentage of ERPOP. The ownership percentage is calculated by dividing the number of OP Units held by the Limited Partners by the total OP Units held by the Limited Partners and the General Partner. Issuance of additional Common Shares and OP Units changes the ownership interests of both the Limited Partners and EQR. Such transactions and the related proceeds are treated as capital transactions.
F-29
Redeemable Noncontrolling Interests – Operating Partnership / Redeemable Limited Partners
The Company classifies Redeemable Noncontrolling Interests – Operating Partnership / Redeemable Limited Partners in the mezzanine section of the consolidated balance sheets for the portion of OP Units that EQR is required, either by contract or securities law, to deliver registered Common Shares to the exchanging OP Unit holder. The redeemable noncontrolling interest units / redeemable limited partner units are adjusted to the greater of carrying value or fair market value based on the Common Share price of EQR at the end of each respective reporting period. See Note 3 for further discussion.
Use of Estimates
In preparation of the Company’s financial statements in conformity with accounting principles generally accepted in the United States, management makes estimates and assumptions that affect the reported amounts of assets and liabilities and disclosure of contingent assets and liabilities at the date of the financial statements as well as the reported amounts of revenues and expenses during the reporting period. Actual results could differ from these estimates.
Reclassifications
Certain reclassifications considered necessary for a fair presentation have been made to the prior period financial statements in order to conform to the current year presentation. These reclassifications have not changed the results of operations or equity/capital.
Recently Issued Accounting Pronouncements
In August 2020, the Financial Accounting Standards Board (“FASB”) issued an amendment to the debt and equity financial instruments standards which simplifies the accounting for convertible instruments and accounting for contracts in an entity’s own equity. Instead of being required to assess whether an equity contract permits settlement in unregistered shares, which may require a legal analysis under the securities laws, entities will only analyze whether cash settlements are explicitly required when registered shares are unavailable. As a result, such contracts may potentially be classified in permanent rather than mezzanine equity, which may affect the way the Company’s OP Units are presented on its financial statements. The update is effective for the Company beginning on January 1, 2022, as the Company did not early adopt the standard as allowed on January 1, 2021. The Company is currently evaluating the impact of adopting the new standard on its consolidated results of operations and financial position.
Recently Adopted Accounting Pronouncements
In August 2021, the FASB issued an amendment to the presentation of financial statements standard which aligns the financial statements and disclosure requirements with those of the final rules released by the SEC in May 2020. The amendment changes the significance tests that determine what disclosures about significant business acquisitions are required, the periods the financial statements must cover and the pro forma financial information that must be included in certain reports. The amendment was effective for the Company upon issuance on August 9, 2021. The Company has not yet acquired businesses that exceed the threshold as defined by the standard, therefore, the amendment did not have a material effect on its consolidated results of operations and financial position.
In March 2020, the FASB issued an amendment to the reference rate reform standard which provides the option for a limited period of time to ease the potential burden in accounting for, or recognizing the effects of, reference rate reform on contract modifications and hedge accounting. An example of such reform is the expected market transition from the London Interbank Offered Rate (“LIBOR”) and other interbank offered rates to alternative reference rates. Entities that make this optional expedient election would not have to remeasure the contracts at the modification date or reassess the accounting treatment if certain criteria are met and would continue applying hedge accounting for relationships affected by reference rate reform. The new standard was effective for the Company upon issuance and elections can be made through December 31, 2022. The Company elected to apply the hedge accounting expedients related to probability and the assessments of effectiveness for future LIBOR-indexed cash flows to assume that the index upon which future hedged transactions will be based matches the index on the corresponding derivatives. Application of these expedients preserves the presentation of derivatives consistent with past presentation. The Company continues to evaluate the impact of the guidance and may apply other elections as applicable as additional changes in the market occur.
In April 2020, a FASB staff question and answer document was issued which intended to reduce the challenges of evaluating the enforceable rights and obligations of leases for concessions granted to lessees in response to the COVID-19 pandemic. We elected not to evaluate whether qualifying concessions provided by the Company in response to the COVID-19 pandemic are a lease modification, subject to the criteria that the total payments under the amended lease cannot result in a substantial increase in the rights of the lessor or obligations of the lessee. We also elected to treat the concessions as though they were contemplated as part of the existing contracts and therefore will not apply lease modification rules to the qualifying lease concession amendments. As such, deferrals deemed collectible are recorded as rental receivables with no change to timing of rental revenues and deferrals deemed non-collectible and abatements reduce rental revenues in the
F-30
deferral/abatement period and cause rental revenues to effectively follow a cash basis related to the changes. The accounting elections provided by the FASB mainly apply to the Company’s non-residential leases and the majority of the amendments will not require a straight-line adjustment. See Note 8 for additional discussion.
In June 2016, the FASB issued a standard which requires companies to adopt a new approach for estimating credit losses on certain types of financial instruments, such as trade and other receivables and loans. The standard requires entities to estimate a lifetime expected credit loss for most financial instruments, including trade receivables. In November 2018, the FASB issued an amendment excluding operating lease receivables accounted for under the lease standard from the scope of the credit losses standard. The Company adopted this standard as required effective January 1, 2020, and it did not have a material effect on its consolidated results of operations and financial position.
Other
The Company is the controlling partner in various consolidated partnerships owning
|
3. |
Equity, Capital and Other Interests |
The Company refers to “Common Shares” and “Units” (which refer to both OP Units and restricted units) as equity securities for EQR and “General Partner Units” and “Limited Partner Units” as equity securities for ERPOP. To provide a streamlined and more readable presentation of the disclosures for the Company and the Operating Partnership, several sections below refer to the respective terminology for each with the same financial information and separate sections are provided, where needed, to further distinguish any differences in financial information and terminology.
The following table presents the changes in the Company’s issued and outstanding Common Shares and Units for the years ended December 31, 2021, 2020 and 2019:
|
|
|
2021 |
|
|
2020 |
|
|
2019 |
|
|||
|
Common Shares |
|
|
|
|
|
|
|
|
|
|
|
|
|
Common Shares outstanding at January 1, |
|
|
|
|
|
|
|
|
|
|
|
|
|
Common Shares Issued: |
|
|
|
|
|
|
|
|
|
|
|
|
|
Conversion of OP Units |
|
|
|
|
|
|
|
|
|
|
|
|
|
Exercise of share options |
|
|
|
|
|
|
|
|
|
|
|
|
|
Employee Share Purchase Plan (ESPP) |
|
|
|
|
|
|
|
|
|
|
|
|
|
Restricted share grants, net |
|
|
|
|
|
|
|
|
|
|
|
|
|
Common Shares outstanding at December 31, |
|
|
|
|
|
|
|
|
|
|
|
|
|
Units |
|
|
|
|
|
|
|
|
|
|
|
|
|
Units outstanding at January 1, |
|
|
|
|
|
|
|
|
|
|
|
|
|
Restricted unit grants, net |
|
|
|
|
|
|
|
|
|
|
|
|
|
Conversion of OP Units to Common Shares |
|
|
( |
) |
|
|
( |
) |
|
|
( |
) |
|
Units outstanding at December 31, |
|
|
|
|
|
|
|
|
|
|
|
|
|
Total Common Shares and Units outstanding at December 31, |
|
|
|
|
|
|
|
|
|
|
|
|
|
Units Ownership Interest in Operating Partnership |
|
|
|
% |
|
|
|
% |
|
|
|
% |
F-31
The following table presents the changes in the Operating Partnership’s issued and outstanding General Partner Units and Limited Partner Units for the years ended December 31, 2021, 2020 and 2019:
|
|
|
2021 |
|
|
2020 |
|
|
2019 |
|
|||
|
General and Limited Partner Units |
|
|
|
|
|
|
|
|
|
|
|
|
|
General and Limited Partner Units outstanding at January 1, |
|
|
|
|
|
|
|
|
|
|
|
|
|
Issued to General Partner: |
|
|
|
|
|
|
|
|
|
|
|
|
|
Exercise of EQR share options |
|
|
|
|
|
|
|
|
|
|
|
|
|
EQR’s Employee Share Purchase Plan (ESPP) |
|
|
|
|
|
|
|
|
|
|
|
|
|
EQR’s restricted share grants, net |
|
|
|
|
|
|
|
|
|
|
|
|
|
Issued to Limited Partners: |
|
|
|
|
|
|
|
|
|
|
|
|
|
Restricted unit grants, net |
|
|
|
|
|
|
|
|
|
|
|
|
|
General and Limited Partner Units outstanding at December 31, |
|
|
|
|
|
|
|
|
|
|
|
|
|
Limited Partner Units |
|
|
|
|
|
|
|
|
|
|
|
|
|
Limited Partner Units outstanding at January 1, |
|
|
|
|
|
|
|
|
|
|
|
|
|
Limited Partner restricted unit grants, net |
|
|
|
|
|
|
|
|
|
|
|
|
|
Conversion of Limited Partner OP Units to EQR Common Shares |
|
|
( |
) |
|
|
( |
) |
|
|
( |
) |
|
Limited Partner Units outstanding at December 31, |
|
|
|
|
|
|
|
|
|
|
|
|
|
Limited Partner Units Ownership Interest in Operating Partnership |
|
|
|
% |
|
|
|
% |
|
|
|
% |
The equity positions of various individuals and entities that contributed their properties to the Operating Partnership in exchange for OP Units, as well as the equity positions of the holders of restricted units, are collectively referred to as the “Noncontrolling Interests – Operating Partnership” and “Limited Partners Capital,” respectively, for the Company and the Operating Partnership. Subject to certain exceptions (including the “book-up” requirements of restricted units), the Noncontrolling Interests – Operating Partnership/Limited Partners Capital may exchange their Units with EQR for Common Shares on a one-for-one basis. The carrying value of the Noncontrolling Interests – Operating Partnership/Limited Partners Capital (including redeemable interests) is allocated based on the number of Noncontrolling Interests – Operating Partnership/Limited Partners Capital in total in proportion to the number of Noncontrolling Interests – Operating Partnership/Limited Partners Capital in total plus the total number of Common Shares/General Partner Units. Net income is allocated to the Noncontrolling Interests – Operating Partnership/Limited Partners Capital based on the weighted average ownership percentage during the period.
The Operating Partnership has the right but not the obligation to make a cash payment instead of issuing Common Shares to any and all holders of Noncontrolling Interests – Operating Partnership/Limited Partners Capital requesting an exchange of their Noncontrolling Interests – Operating Partnership/Limited Partners Capital with EQR. Once the Operating Partnership elects not to redeem the Noncontrolling Interests – Operating Partnership/Limited Partners Capital for cash, EQR is obligated to deliver Common Shares to the exchanging holder of the Noncontrolling Interests – Operating Partnership/Limited Partners Capital.
The Noncontrolling Interests – Operating Partnership/Limited Partners Capital are classified as either mezzanine equity or permanent equity. If EQR is required, either by contract or securities law, to deliver registered Common Shares, such Noncontrolling Interests – Operating Partnership/Limited Partners Capital are differentiated and referred to as “Redeemable Noncontrolling Interests – Operating Partnership” and “Redeemable Limited Partners,” respectively. Instruments that require settlement in registered shares cannot be classified in permanent equity as it is not always completely within an issuer’s control to deliver registered shares. Therefore, settlement in cash is assumed and that responsibility for settlement in cash is deemed to fall to the Operating Partnership as the primary source of cash for EQR, resulting in presentation in the mezzanine section of the balance sheet. The Redeemable Noncontrolling Interests – Operating Partnership/Redeemable Limited Partners are adjusted to the greater of carrying value or fair market value based on the Common Share price of EQR at the end of each respective reporting period. EQR has the ability to deliver unregistered Common Shares for the remaining portion of the Noncontrolling Interests – Operating Partnership/Limited Partners Capital that are classified in permanent equity at December 31, 2021 and 2020.
The carrying value of the Redeemable Noncontrolling Interests – Operating Partnership/Redeemable Limited Partners is allocated based on the number of Redeemable Noncontrolling Interests – Operating Partnership/Redeemable Limited Partners in proportion to the number of Noncontrolling Interests – Operating Partnership/Limited Partners Capital in total. Such percentage of the total carrying value of Units/Limited Partner Units which is ascribed to the Redeemable Noncontrolling Interests – Operating Partnership/Redeemable Limited Partners is then adjusted to the greater of carrying value or fair market value as described above. As of December 31, 2021 and 2020, the Redeemable Noncontrolling Interests – Operating Partnership/Redeemable Limited Partners have a redemption value of approximately $
F-32
The following table presents the changes in the redemption value of the Redeemable Noncontrolling Interests – Operating Partnership/Redeemable Limited Partners for the years ended December 31, 2021, 2020 and 2019, respectively (amounts in thousands):
|
|
|
2021 |
|
|
2020 |
|
|
2019 |
|
|||
|
Balance at January 1, |
|
$ |
|
|
|
$ |
|
|
|
$ |
|
|
|
Change in market value |
|
|
|
|
|
|
( |
) |
|
|
|
|
|
Change in carrying value |
|
|
|
|
|
|
|
|
|
|
|
|
|
Balance at December 31, |
|
$ |
|
|
|
$ |
|
|
|
$ |
|
|
Net proceeds from EQR Common Share and Preferred Share (see definition below) offerings and proceeds from exercise of options for Common Shares are contributed by EQR to ERPOP. In return for those contributions, EQR receives a number of OP Units in ERPOP equal to the number of Common Shares it has issued in the equity offering (or in the case of a preferred equity offering, a number of preference units in ERPOP equal in number and having the same terms as the Preferred Shares issued in the equity offering). As a result, the net proceeds from Common Shares and Preferred Shares are allocated for the Company between shareholders’ equity and Noncontrolling Interests – Operating Partnership and for the Operating Partnership between General Partner’s Capital and Limited Partners Capital to account for the change in their respective percentage ownership of the underlying equity.
The Company’s declaration of trust authorizes it to issue up to
The following table presents the Company’s issued and outstanding Preferred Shares/Preference Units as of December 31, 2021 and 2020:
|
|
|
|
|
|
|
|
|
Amounts in thousands |
|
|||||
|
|
|
|
|
Annual |
|
|
|
|
|
|
|
|
|
|
|
|
|
Call |
|
Dividend Per |
|
|
December 31, |
|
|
December 31, |
|
|||
|
|
|
Date (1) |
|
Share/Unit (2) |
|
|
2021 |
|
|
2020 |
|
|||
|
Preferred Shares/Preference Units of beneficial interest, $ |
|
|
|
|
|
|
|
|
|
|
|
|
|
|
|
Units; liquidation value $ and outstanding as of December 31, 2021 and 2020 |
|
|
|
$ |
|
|
|
$ |
|
|
|
$ |
|
|
|
|
|
|
|
|
|
|
|
$ |
|
|
|
$ |
|
|
|
(1) |
On or after the call date, redeemable Preferred Shares/Preference Units may be redeemed for cash at the option of the Company or the Operating Partnership, respectively, in whole or in part, at a redemption price equal to the liquidation price per share/unit, plus accrued and unpaid distributions, if any. |
|
(2) |
Dividends on Preferred Shares/Preference Units are payable quarterly. |
Other
EQR and ERPOP currently have an active universal shelf registration statement for the issuance of equity and debt securities that automatically became effective upon filing with the SEC in June 2019 and expires in June 2022. Per the terms of ERPOP’s partnership agreement, EQR contributes the net proceeds of all equity offerings to the capital of ERPOP in exchange for additional OP Units (on a one-for-one Common Share per OP Unit basis) or preference units (on a one-for-one preferred share per preference unit basis).
The Company has an At-The-Market (“ATM”) share offering program which allows EQR to issue Common Shares from time to time into the existing trading market at current market prices or through negotiated transactions, including under forward sale arrangements. The current program matures in June 2022 and gives EQR the authority to issue up to
F-33
additional discussion). The actual forward price per share to be received by the Company upon settlement will be determined on the applicable settlement date based on adjustments made to the initial forward price to reflect the then-current overnight federal funds rate and the amount of dividends paid to holders of the Company’s Common Shares over the term of the forward sale agreement.
As of December 31, 2021, the Company had entered into such forward sale agreements under this program for a total of approximately
The Company may repurchase up to
|
4. |
Real Estate |
The following table summarizes the carrying amounts for the Company’s investment in real estate (at cost) as of December 31, 2021 and 2020 (amounts in thousands):
|
|
|
2021 |
|
|
2020 |
|
||
|
Land |
|
$ |
|
|
|
$ |
|
|
|
Depreciable property: |
|
|
|
|
|
|
|
|
|
Buildings and improvements |
|
|
|
|
|
|
|
|
|
Furniture, fixtures and equipment |
|
|
|
|
|
|
|
|
|
In-Place lease intangibles |
|
|
|
|
|
|
|
|
|
Projects under development: |
|
|
|
|
|
|
|
|
|
Land |
|
|
— |
|
|
|
|
|
|
Construction-in-progress |
|
|
|
|
|
|
|
|
|
Land held for development: |
|
|
|
|
|
|
|
|
|
Land |
|
|
|
|
|
|
|
|
|
Construction-in-progress |
|
|
|
|
|
|
|
|
|
Investment in real estate |
|
|
|
|
|
|
|
|
|
Accumulated depreciation |
|
|
( |
) |
|
|
( |
) |
|
Investment in real estate, net |
|
$ |
|
|
|
$ |
|
|
Acquisitions and Dispositions
During the year ended December 31, 2021, the Company acquired the following from unaffiliated parties (purchase price in thousands):
|
|
|
Properties |
|
|
Apartment Units |
|
|
Purchase Price |
|
|||
|
Rental Properties – Consolidated (1) |
|
|
|
|
|
|
|
|
|
$ |
|
|
|
Total |
|
|
|
|
|
|
|
|
|
$ |
|
|
|
(1) |
Purchase price includes an allocation of approximately $ |
During the year ended December 31, 2020, the Company acquired the following from unaffiliated parties (purchase price in thousands):
|
|
|
Properties |
|
|
Apartment Units |
|
|
Purchase Price |
|
|||
|
Rental Properties – Consolidated (1) |
|
|
|
|
|
|
|
|
|
$ |
|
|
|
Total |
|
|
|
|
|
|
|
|
|
$ |
|
|
|
(1) |
Purchase price includes an allocation of approximately $ |
F-34
During the year ended December 31, 2021, the Company disposed of the following to unaffiliated parties (sales price in thousands):
|
|
|
Properties |
|
|
Apartment Units |
|
|
Sales Price |
|
|||
|
Rental Properties – Consolidated |
|
|
|
|
|
|
|
|
|
$ |
|
|
|
Total |
|
|
|
|
|
|
|
|
|
$ |
|
|
The Company recognized a net gain on sales of real estate properties of approximately $
During the year ended December 31, 2020, the Company disposed of the following to unaffiliated parties (sales price in thousands):
|
|
|
Properties |
|
|
Apartment Units |
|
|
Sales Price |
|
|||
|
Rental Properties – Consolidated |
|
|
|
|
|
|
|
|
|
$ |
|
|
|
Land Parcels (two) |
|
|
— |
|
|
|
— |
|
|
|
|
|
|
Total |
|
|
|
|
|
|
|
|
|
$ |
|
|
The Company recognized a net gain on sales of real estate properties of approximately $
Impairment
During the year ended December 31, 2021, the Company recorded an approximate $
|
5. |
Commitments to Acquire/Dispose of Real Estate |
The Company has not entered into any agreements to acquire rental properties or land parcels as of the date of filing.
The Company has entered into separate agreements to dispose of the following (sales price and net book value in thousands):
|
|
|
Properties |
|
|
Apartment Units |
|
|
Sales Price |
|
|
Net Book Value at December 31, 2021 |
|
||||
|
Rental Properties – Consolidated |
|
|
|
|
|
|
|
|
|
$ |
|
|
|
$ |
|
|
|
Total |
|
|
|
|
|
|
|
|
|
$ |
|
|
|
$ |
|
|
The closing of pending transactions is subject to certain conditions and restrictions; therefore, there can be no assurance that the transactions will be consummated or that the final terms will not differ in material respects from any agreements summarized above. See Note 18 for discussion of the properties acquired or disposed of, if any, subsequent to December 31, 2021.
|
6. |
Investments in Partially Owned Entities |
The Company has invested in various entities with unrelated third parties which are either consolidated or accounted for under the equity method of accounting (unconsolidated).
Consolidated VIEs
In accordance with accounting standards for consolidation of VIEs, the Company consolidates ERPOP on EQR’s financial statements. As the sole general partner of ERPOP, EQR has exclusive control of ERPOP’s day-to-day management. The limited partners are not able to exercise substantive kick-out or participating rights. As a result, ERPOP qualifies as a VIE. EQR has a controlling financial interest in ERPOP and, thus, is ERPOP’s primary beneficiary. EQR has the power to direct the activities of ERPOP that most significantly impact ERPOP’s economic performance as well as the obligation to absorb losses or the right to receive benefits from ERPOP that could potentially be significant to ERPOP.
F-35
The Company has various equity interests in certain joint ventures that have been deemed to be VIEs, and the Company is the VIEs’ primary beneficiary. As a result, the joint ventures are required to be consolidated on the Company’s financial statements.
|
|
Operating Properties |
|
|
Project Under Development (1) |
|
||||||||||
|
|
Properties |
|
|
Apartment Units |
|
|
Project |
|
|
Apartment Units |
|
||||
|
Consolidated Joint Ventures (VIE) |
|
|
|
|
|
|
|
|
|
|
|
|
|
|
|
|
(1) |
The land under this project is subject to a long-term ground lease. |
The following table provides consolidated assets and liabilities related to the VIEs discussed above as of December 31, 2021 and 2020 (amounts in thousands):
|
|
December 31, 2021 |
|
|
December 31, 2020 |
|
||
|
Consolidated Assets |
$ |
|
|
|
$ |
|
|
|
Consolidated Liabilities |
$ |
|
|
|
$ |
|
|
Investments in Unconsolidated Entities
The following table and information summarizes the Company’s investments in unconsolidated entities, which are accounted for under the equity method of accounting as the requirements for consolidation are not met, as of December 31, 2021 and 2020 (amounts in thousands except for ownership percentage):
|
|
December 31, 2021 |
|
|
December 31, 2020 |
|
|
Ownership Percentage |
|
|||
|
Investments in Unconsolidated Entities: |
|
|
|
|
|
|
|
|
|
|
|
|
Operating Property (VIE) (1) |
$ |
|
|
|
$ |
|
|
|
|
|
|
|
Unconsolidated Development Joint Ventures (VIE) (2) |
|
|
|
|
|
— |
|
|
62% - 90% (4) |
|
|
|
Real Estate Technology (3) |
|
|
|
|
|
|
|
|
Varies |
|
|
|
Other |
|
( |
) |
|
|
( |
) |
|
Varies |
|
|
|
Investments in Unconsolidated Entities |
$ |
|
|
|
$ |
|
|
|
|
|
|
|
(1) |
Represents an unconsolidated interest in an entity that owns the land underlying |
|
(2) |
Represents unconsolidated interests in projects under development and land held for development. See further discussion below. |
|
(3) |
Represents unconsolidated investments in real estate technology funds/companies. |
|
(4) |
In certain instances, the joint venture agreements contain provisions for promoted interests in favor of our joint venture partner. If the terms of the promoted interest are attained, then our share of the proceeds from a sale or other capital event of the unconsolidated entity may be less than the indicated ownership percentage. |
The following table summarizes the Company’s unconsolidated joint ventures that were deemed to be VIEs as of December 31, 2021:
|
|
Operating Property (1) |
|
|
Projects Under Development (2) |
|
|
Land Held for Development (2), (3) |
|
|||||||||||
|
|
Entity |
|
|
Projects |
|
|
Apartment Units (4) |
|
|
Projects |
|
|
Apartment Units (4) |
|
|||||
|
Unconsolidated Joint Ventures (VIE) |
|
|
|
|
|
|
|
|
|
|
|
|
|
|
|
|
|
|
|
|
(1) |
Represents the operating property noted in the table above. |
|
(2) |
Represents separate unconsolidated joint ventures for the purpose of developing multifamily rental properties. |
|
(3) |
Represents separate unconsolidated joint ventures that are expected to start construction in 2022. |
|
(4) |
Represents the intended number of apartment units. |
F-36
New Joint Ventures
In August 2021, the Company entered into a strategic partnership with Toll Brothers, Inc. (“Toll”) to develop apartment communities in key markets. The Company and Toll will enter into separate joint venture agreements for each property, and the Company will account for these unconsolidated joint ventures under the equity method of accounting. Toll will act as the managing member of each project and receive developer fees. The Company, in certain circumstances, may act as the property manager, receive property management fees and have the right, but not the obligation, to acquire each property at fair market value upon stabilization. As of December 31, 2021, the Company and Toll entered into
The following table provides information on total unconsolidated development joint ventures entered into during the year ended December 31, 2021 (amounts in thousands except for number of unconsolidated joint ventures):
|
Number of unconsolidated joint ventures (1) (2) |
|
|
|
|
EQR's investments in unconsolidated entities – acquisitions |
$ |
|
|
|
(1) |
The entities qualify as VIEs, but the Company is not the primary beneficiary because it does not have the power to direct the activities that most significantly impact the VIE’s performance. Therefore, these entities are unconsolidated and recorded using the equity method of accounting. See Note 2 for additional discussion. |
|
(2) |
|
|
7. |
Restricted Deposits |
The following table presents the Company’s restricted deposits as of December 31, 2021 and 2020 (amounts in thousands):
|
|
|
December 31, 2021 |
|
|
December 31, 2020 |
|
||
|
Mortgage escrow deposits: |
|
|
|
|
|
|
|
|
|
Replacement reserves |
|
$ |
|
|
|
$ |
|
|
|
Mortgage principal reserves/sinking funds |
|
|
|
|
|
|
|
|
|
Mortgage escrow deposits |
|
|
|
|
|
|
|
|
|
Restricted cash: |
|
|
|
|
|
|
|
|
|
Tax-deferred (1031) exchange proceeds |
|
|
|
|
|
|
— |
|
|
Earnest money on pending acquisitions |
|
|
|
|
|
|
— |
|
|
Restricted deposits on real estate investments |
|
|
|
|
|
|
|
|
|
Resident security and utility deposits |
|
|
|
|
|
|
|
|
|
Other |
|
|
|
|
|
|
|
|
|
Restricted cash |
|
|
|
|
|
|
|
|
|
Restricted deposits |
|
$ |
|
|
|
$ |
|
|
|
8. |
Leases |
Lessor Accounting
The Company is the lessor for its residential and non-residential leases and these leases are accounted for as operating leases under the lease standard.
For the years ended December 31, 2021, 2020 and 2019, approximately
For the years ended December 31, 2021, 2020 and 2019, approximately
F-37
revenue recognition are the same. The collection of lease payments at lease commencement is probable and therefore the Company subsequently recognizes lease income over the lease term on a straight-line basis. Non-residential leases are renewable with market-based renewal options.
The Company elected the practical expedient to account for both its lease and non-lease components (specifically common area maintenance charges) as a single lease component under the lease standard.
The following table presents the lease income types relating to lease payments for residential and non-residential leases along with the total other rental income for the years ended December 31, 2021, 2020 and 2019 (amounts in thousands):
|
|
|
Year Ended December 31, 2021 |
|
|
Year Ended December 31, 2020 |
|
|
Year Ended December 31, 2019 |
|
|||||||||||||||||||||||||||
|
Income Type |
|
Residential Leases |
|
|
Non-Residential Leases |
|
|
Total |
|
|
Residential Leases |
|
|
Non-Residential Leases |
|
|
Total |
|
|
Residential Leases |
|
|
Non-Residential Leases |
|
|
Total |
|
|||||||||
|
Residential and non-residential rent |
|
$ |
|
|
|
$ |
|
|
|
$ |
|
|
|
$ |
|
|
|
$ |
|
|
|
$ |
|
|
|
$ |
|
|
|
$ |
|
|
|
$ |
|
|
|
Utility recoveries (RUBS income) (1) |
|
|
|
|
|
|
|
|
|
|
|
|
|
|
|
|
|
|
|
|
|
|
|
|
|
|
|
|
|
|
|
|
|
|
|
|
|
Parking rent |
|
|
|
|
|
|
|
|
|
|
|
|
|
|
|
|
|
|
|
|
|
|
|
|
|
|
|
|
|
|
|
|
|
|
|
|
|
Other lease revenue (2) |
|
|
( |
) |
|
|
|
|
|
|
( |
) |
|
|
( |
) |
|
|
( |
) |
|
|
( |
) |
|
|
|
|
|
|
( |
) |
|
|
|
|
|
Total lease revenue |
|
$ |
|
|
|
$ |
|
|
|
|
|
|
|
$ |
|
|
|
$ |
|
|
|
|
|
|
|
$ |
|
|
|
$ |
|
|
|
|
|
|
|
Parking revenue |
|
|
|
|
|
|
|
|
|
|
|
|
|
|
|
|
|
|
|
|
|
|
|
|
|
|
|
|
|
|
|
|
|
|
|
|
|
Other revenue |
|
|
|
|
|
|
|
|
|
|
|
|
|
|
|
|
|
|
|
|
|
|
|
|
|
|
|
|
|
|
|
|
|
|
|
|
|
Total other rental income (3) |
|
|
|
|
|
|
|
|
|
|
|
|
|
|
|
|
|
|
|
|
|
|
|
|
|
|
|
|
|
|
|
|
|
|
|
|
|
Rental income |
|
|
|
|
|
|
|
|
|
$ |
|
|
|
|
|
|
|
|
|
|
|
$ |
|
|
|
|
|
|
|
|
|
|
|
$ |
|
|
|
(1) |
RUBS income primarily consists of variable payments representing the recovery of utility costs from residents. |
|
(2) |
Other lease revenue consists of the revenue adjustment related to bad debt and other miscellaneous lease revenue. |
|
(3) |
Other rental income is accounted for under the revenue recognition standard. |
The economic impact of the pandemic on a subset of our residents and tenants has led to elevated levels of bad debt, which was reduced, in part, by governmental rental assistance payments paid on their behalf. We continue to work with our residents and tenants on payment plans and collections and our bad debt allowance policies remain consistent from those existing prior to the pandemic.
The following table presents residential and non-residential accounts receivable and straight-line receivable balances for the Company’s properties as of December 31, 2021 and 2020 (amounts in thousands):
|
|
|
Residential |
|
|
Non-Residential |
|
||||||||||
|
Balance Sheet (Other assets): |
|
December 31, 2021 |
|
|
December 31, 2020 |
|
|
December 31, 2021 |
|
|
December 31, 2020 |
|
||||
|
Resident/tenant accounts receivable balances |
|
$ |
|
|
|
$ |
|
|
|
$ |
|
|
|
$ |
|
|
|
Allowance for doubtful accounts |
|
|
( |
) |
|
|
( |
) |
|
|
( |
) |
|
|
( |
) |
|
Net receivable balances |
|
$ |
|
|
(1) |
$ |
|
|
|
$ |
|
|
|
$ |
|
|
|
|
|
|
|
|
|
|
|
|
|
|
|
|
|
|
|
|
|
Straight-line receivable balances |
|
$ |
|
|
|
$ |
|
|
|
$ |
|
|
|
$ |
|
|
|
(1) |
The Company held residential security deposits approximating |
The following table presents residential bad debt for the Company’s properties for the years ended December 31, 2021, 2020 and 2019 (amounts in thousands):
|
|
|
Year Ended December 31, |
|
|||||||||
|
Income Statement (Rental income): |
|
|
2021 |
|
|
|
2020 |
|
|
|
2019 |
|
|
Bad debt, net (1) |
|
$ |
|
|
|
$ |
|
|
|
$ |
|
|
|
% of rental income |
|
|
|
% |
|
|
|
% |
|
|
|
% |
|
(1) |
Bad debt, net benefited from additional resident payments due to governmental rental assistance programs of approximately $ |
Due to the impact of COVID-19 and the resulting economic impact on our non-residential tenants, we recognized a non-cash write-off of non-residential straight-line lease receivables of approximately $
F-38
Lessee Accounting
The Company is the lessee under various corporate office and ground leases for which the Company recognizes right-of-use (“ROU”) assets and related lease liabilities.
|
|
|
2021 |
|
|
2020 |
|
||
|
Right-of-use assets: |
|
|
|
|
|
|
|
|
|
Corporate office leases (operating) |
|
$ |
|
|
|
$ |
|
|
|
Ground leases (finance) |
|
|
|
|
|
|
|
|
|
Ground leases (operating) |
|
|
|
|
|
|
|
|
|
Right-of-use assets |
|
$ |
|
|
|
$ |
|
|
|
Lease liabilities: |
|
|
|
|
|
|
|
|
|
Corporate office leases (operating) |
|
$ |
|
|
|
$ |
|
|
|
Ground leases (finance) |
|
|
|
|
|
|
|
|
|
Ground leases (operating) |
|
|
|
|
|
|
|
|
|
Lease liabilities |
|
$ |
|
|
|
$ |
|
|
Corporate office leases
The Company leases
Ground leases
The Company maintains long-term ground leases for
Additional disclosures
The following tables illustrate the quantitative disclosures for lessees as of and for the years ended December 31, 2021, 2020 and 2019 (amounts in thousands):
|
|
|
Year Ended December 31, 2021 |
|
|
Year Ended December 31, 2020 |
|
|
Year Ended December 31, 2019 |
|
|||
|
Lease cost: |
|
|
|
|
|
|
|
|
|
|
|
|
|
Finance lease cost: |
|
|
|
|
|
|
|
|
|
|
|
|
|
Amortization of right-of-use assets (capitalized) |
|
$ |
|
|
|
$ |
— |
|
|
$ |
— |
|
|
Amortization of right-of-use assets (expensed) |
|
|
|
|
|
|
— |
|
|
|
— |
|
|
Interest on lease liabilities (capitalized) |
|
|
|
|
|
|
|
|
|
|
|
|
|
Interest on lease liabilities (expensed) |
|
|
|
|
|
|
— |
|
|
|
— |
|
|
Operating lease cost: |
|
|
|
|
|
|
|
|
|
|
|
|
|
Corporate office leases |
|
|
|
|
|
|
|
|
|
|
|
|
|
Ground leases |
|
|
|
|
|
|
|
|
|
|
|
|
|
Variable lease cost: |
|
|
|
|
|
|
|
|
|
|
|
|
|
Corporate office leases |
|
|
|
|
|
|
|
|
|
|
|
|
|
Ground leases |
|
|
|
|
|
|
|
|
|
|
|
|
|
Total lease cost |
|
$ |
|
|
|
$ |
|
|
|
$ |
|
|
F-39
|
|
|
December 31, 2021 |
|
|
December 31, 2020 |
|
|
December 31, 2019 |
|
|||
|
Other information: |
|
|
|
|
|
|
|
|
|
|
|
|
|
Cash paid for amounts included in the measurement of lease liabilities: |
|
|
|
|
|
|
|
|
|
|
|
|
|
Investing cash flows from finance leases |
|
$ |
|
|
|
$ |
|
|
|
$ |
|
|
|
Financing cash flows from finance leases |
|
$ |
|
|
|
$ |
— |
|
|
$ |
|
|
|
Operating cash flows from operating leases: |
|
|
|
|
|
|
|
|
|
|
|
|
|
Corporate office leases |
|
$ |
|
|
|
$ |
|
|
|
$ |
|
|
|
Ground leases |
|
$ |
|
|
|
$ |
|
|
|
$ |
|
|
|
ROU assets obtained in exchange for new finance lease liabilities |
|
$ |
— |
|
|
$ |
— |
|
|
$ |
|
|
|
ROU assets obtained in exchange for new operating lease liabilities: |
|
|
|
|
|
|
|
|
|
|
|
|
|
Corporate office leases |
|
$ |
— |
|
|
$ |
— |
|
|
$ |
|
|
|
Ground leases |
|
$ |
— |
|
|
$ |
— |
|
|
$ |
|
|
|
Weighted-average remaining lease term – finance leases |
|
|
|
|
|
|
|
|
|
|||
|
Weighted-average remaining lease term – operating leases: |
|
|
|
|
|
|
|
|
|
|
|
|
|
Corporate office leases |
|
|
|
|
|
|
|
|
|
|||
|
Ground leases |
|
|
|
|
|
|
|
|
|
|||
|
Weighted-average discount rate – finance leases |
|
|
|
% |
|
|
|
% |
|
|
|
% |
|
Weighted-average discount rate – operating leases: |
|
|
|
|
|
|
|
|
|
|
|
|
|
Corporate office leases |
|
|
|
% |
|
|
|
% |
|
|
|
% |
|
Ground leases |
|
|
|
% |
|
|
|
% |
|
|
|
% |
The following table summarizes the Company’s undiscounted cash flows for contractual obligations for minimum rent payments/receipts under operating and financing leases for the next five years and thereafter as of December 31, 2021:
|
(Payments)/Receipts Due by Year (in thousands) |
|
|||||||||||||||||||||||||||
|
|
|
2022 |
|
|
2023 |
|
|
2024 |
|
|
2025 |
|
|
2026 |
|
|
Thereafter |
|
|
Total |
|
|||||||
|
Finance Leases: |
|
|
|
|
|
|
|
|
|
|
|
|
|
|
|
|
|
|
|
|
|
|
|
|
|
|
|
|
|
Minimum Rent Payments (a) |
|
$ |
( |
) |
|
$ |
( |
) |
|
$ |
( |
) |
|
$ |
( |
) |
|
$ |
( |
) |
|
$ |
( |
) |
|
$ |
( |
) |
|
Operating Leases: |
|
|
|
|
|
|
|
|
|
|
|
|
|
|
|
|
|
|
|
|
|
|
|
|
|
|
|
|
|
Minimum Rent Payments (a) |
|
$ |
( |
) |
|
$ |
( |
) |
|
$ |
( |
) |
|
$ |
( |
) |
|
$ |
( |
) |
|
$ |
( |
) |
|
$ |
( |
) |
|
Minimum Rent Receipts (b) |
|
$ |
|
|
|
$ |
|
|
|
$ |
|
|
|
$ |
|
|
|
$ |
|
|
|
$ |
|
|
|
$ |
|
|
|
(a) |
Minimum basic rent due for corporate office leases and base rent due on ground leases where the Company is the lessee. |
|
(b) |
Minimum basic rent receipts due for various non-residential space where the Company is the lessor. Excludes residential leases due to their short-term nature. |
The following table provides a reconciliation of lease liabilities from our undiscounted cash flows for minimum rent payments as of December 31, 2021 (amounts in thousands):
|
|
|
2021 |
|
|
|
Total minimum rent payments |
|
$ |
|
|
|
Less: Lease discount |
|
|
( |
) |
|
Lease liabilities |
|
$ |
|
|
|
9. |
Debt |
EQR does not have any indebtedness as all debt is incurred by the Operating Partnership. Weighted average interest rates noted below for the years ended December 31, 2021 and 2020 include the effect of any derivative instruments and amortization of premiums/discounts/OCI (other comprehensive income) on debt and derivatives.
F-40
Mortgage Notes Payable
The following tables summarize the Company’s mortgage notes payable activity for the years ended December 31, 2021 and 2020, respectively (amounts in thousands):
|
|
|
Mortgage notes payable, net as of December 31, 2020 |
|
|
Proceeds |
|
|
Lump sum payoffs |
|
|
Scheduled principal repayments |
|
|
Amortization of premiums/ discounts |
|
|
Amortization of deferred financing costs, net (1) |
|
|
Mortgage notes payable, net as of December 31, 2021 |
|
|||||||
|
Fixed Rate Debt: |
|
|
|
|
|
|
|
|
|
|
|
|
|
|
|
|
|
|
|
|
|
|
|
|
|
|
|
|
|
Secured – Conventional |
|
$ |
|
|
|
$ |
|
|
(2) |
$ |
( |
) |
|
$ |
( |
) |
|
$ |
|
|
|
$ |
|
|
|
$ |
|
|
|
Floating Rate Debt: |
|
|
|
|
|
|
|
|
|
|
|
|
|
|
|
|
|
|
|
|
|
|
|
|
|
|
|
|
|
Secured – Conventional |
|
|
|
|
|
|
|
|
(3) |
|
— |
|
|
|
— |
|
|
|
— |
|
|
|
( |
) |
|
|
|
|
|
Secured – Tax Exempt |
|
|
|
|
|
|
— |
|
|
|
( |
) |
|
|
— |
|
|
|
|
|
|
|
|
|
|
|
|
|
|
Floating Rate Debt |
|
|
|
|
|
|
|
|
|
|
( |
) |
|
|
— |
|
|
|
|
|
|
|
( |
) |
|
|
|
|
|
Total |
|
$ |
|
|
|
$ |
|
|
|
$ |
( |
) |
|
$ |
( |
) |
|
$ |
|
|
|
$ |
|
|
|
$ |
|
|
|
(1) |
Represents amortization of deferred financing costs, net of debt financing costs. |
|
(2) |
Obtained |
|
(3) |
Variable rate construction mortgage debt that is non-recourse to the Company maturing on |
|
|
|
Mortgage notes payable, net as of December 31, 2019 |
|
|
Proceeds |
|
|
Lump sum payoffs |
|
|
Scheduled principal repayments |
|
|
Amortization of premiums/ discounts |
|
|
Amortization of deferred financing costs, net (1) |
|
|
Mortgage notes payable, net as of December 31, 2020 |
|
|||||||
|
Fixed Rate Debt: |
|
|
|
|
|
|
|
|
|
|
|
|
|
|
|
|
|
|
|
|
|
|
|
|
|
|
|
|
|
Secured – Conventional |
|
$ |
|
|
|
$ |
|
|
(2) |
$ |
( |
) |
|
$ |
( |
) |
|
$ |
|
|
|
$ |
( |
) |
|
$ |
|
|
|
Floating Rate Debt: |
|
|
|
|
|
|
|
|
|
|
|
|
|
|
|
|
|
|
|
|
|
|
|
|
|
|
|
|
|
Secured – Conventional |
|
|
|
|
|
|
|
|
(3) |
|
— |
|
|
|
— |
|
|
|
— |
|
|
|
|
|
|
|
|
|
|
Secured – Tax Exempt |
|
|
|
|
|
|
— |
|
|
|
— |
|
|
|
— |
|
|
|
|
|
|
|
|
|
|
|
|
|
|
Floating Rate Debt |
|
|
|
|
|
|
|
|
|
|
— |
|
|
|
— |
|
|
|
|
|
|
|
|
|
|
|
|
|
|
Total |
|
$ |
|
|
|
$ |
|
|
|
$ |
( |
) |
|
$ |
( |
) |
|
$ |
|
|
|
$ |
( |
) |
|
$ |
|
|
|
(1) |
Represents amortization of deferred financing costs, net of debt financing costs. |
|
(2) |
Obtained a |
|
(3) |
Variable rate construction mortgage debt that is non-recourse to the Company maturing on |
The following table summarizes certain interest rate and maturity date information as of and for the years ended December 31, 2021 and 2020, respectively:
|
|
|
December 31, 2021 |
|
|
December 31, 2020 |
|
|
Interest Rate Ranges |
|
|
|
|
|
|
|
Weighted Average Interest Rate |
|
|
|
|
|
|
|
Maturity Date Ranges |
|
|
|
|
|
|
As of December 31, 2021 and 2020, the Company had $
The historical cost, net of accumulated depreciation, of encumbered properties was $
F-41
Notes
The following tables summarize the Company’s notes activity for the years ended December 31, 2021 and 2020, respectively (amounts in thousands):
|
|
|
Notes, net as of December 31, 2020 |
|
|
Proceeds |
|
|
Lump sum payoffs |
|
|
Amortization of premiums/ discounts |
|
|
Amortization of deferred financing costs, net (1) |
|
|
Notes, net as of December 31, 2021 |
|
||||||
|
Fixed Rate Debt: |
|
|
|
|
|
|
|
|
|
|
|
|
|
|
|
|
|
|
|
|
|
|
|
|
|
Unsecured – Public |
|
$ |
|
|
|
$ |
|
|
(2) |
$ |
— |
|
|
$ |
|
|
|
$ |
( |
) |
|
$ |
|
|
|
(1) |
Represents amortization of deferred financing costs, net of debt financing costs. |
|
(2) |
Issued $ |
|
|
|
Notes, net as of December 31, 2019 |
|
|
Proceeds |
|
|
Lump sum payoffs |
|
|
Amortization of premiums/ discounts |
|
|
Amortization of deferred financing costs, net (1) |
|
|
Notes, net as of December 31, 2020 |
|
||||||
|
Fixed Rate Debt: |
|
|
|
|
|
|
|
|
|
|
|
|
|
|
|
|
|
|
|
|
|
|
|
|
|
Unsecured – Public |
|
$ |
|
|
|
$ |
— |
|
|
$ |
( |
) |
|
$ |
|
|
|
$ |
|
|
|
$ |
|
|
|
(1) |
Represents amortization of deferred financing costs, net of debt financing costs. |
The following table summarizes certain interest rate and maturity date information as of and for the years ended December 31, 2021 and 2020, respectively:
|
|
|
December 31, 2021 |
|
|
December 31, 2020 |
|
|
Interest Rate Ranges |
|
|
|
|
|
|
|
Weighted Average Interest Rate |
|
|
|
|
|
|
|
Maturity Date Ranges |
|
|
|
|
|
|
The Company’s unsecured public notes contain certain financial and operating covenants including, among other things, maintenance of certain financial ratios. The Company was in compliance with its unsecured public debt covenants for both the years ended December 31, 2021 and 2020.
EQR and ERPOP currently have an active universal shelf registration statement for the issuance of equity and debt securities that automatically became effective upon filing with the SEC in
Line of Credit and Commercial Paper
The Company has a $
The Company has an unsecured commercial paper note program under which it may borrow up to a maximum of $
F-42
The Company limits its utilization of the revolving credit facility in order to maintain liquidity to support its $
|
|
|
December 31, 2021 |
|
|
December 31, 2020 |
|
||
|
Unsecured revolving credit facility commitment |
|
$ |
|
|
|
$ |
|
|
|
Commercial paper balance outstanding |
|
|
( |
) |
|
|
( |
) |
|
Unsecured revolving credit facility balance outstanding |
|
|
— |
|
|
|
— |
|
|
Other restricted amounts |
|
|
( |
) |
|
|
( |
) |
|
Unsecured revolving credit facility availability |
|
$ |
|
|
|
$ |
|
|
Other
The following table summarizes the Company’s total debt extinguishment costs recorded as additional interest expense during the years ended December 31, 2021, 2020 and 2019, respectively (amounts in thousands):
|
|
|
December 31, 2021 |
|
|
December 31, 2020 |
|
|
December 31, 2019 |
|
|||
|
Prepayment premiums/penalties |
|
$ |
— |
|
|
$ |
|
|
|
$ |
|
|
|
Write-offs of unamortized deferred financing costs |
|
|
|
|
|
|
|
|
|
|
|
|
|
Write-offs of unamortized (premiums)/discounts/OCI |
|
|
— |
|
|
|
|
|
|
|
|
|
|
Total |
|
$ |
|
|
|
$ |
|
|
|
$ |
|
|
The following table provides a summary of the aggregate payments of principal on all debt for each of the next five years and thereafter as of December 31, 2021 (amounts in thousands):
|
Year |
|
Total |
|
|
|
2022 (1) |
|
$ |
|
|
|
2023 |
|
|
|
|
|
2024 |
|
|
|
|
|
2025 |
|
|
|
|
|
2026 |
|
|
|
|
|
Thereafter |
|
|
|
|
|
Subtotal |
|
|
|
|
|
Deferred Financing Costs and Unamortized (Discount) |
|
|
( |
) |
|
Total |
|
$ |
|
|
|
(1) |
Includes $ |
|
10. |
Fair Value Measurements |
The valuation of financial instruments requires the Company to make estimates and judgments that affect the fair value of the instruments. The Company, where possible, bases the fair values of its financial instruments on listed market prices and third-party quotes. Where these are not available, the Company bases its estimates on current instruments with similar terms and maturities or on other factors relevant to the financial instruments.
In the normal course of business, the Company is exposed to the effect of interest rate changes. The Company may seek to manage these risks by following established risk management policies and procedures including the use of derivatives to hedge interest rate risk on debt instruments. The Company may also use derivatives to manage commodity prices in the daily operations of the business.
During the year ended December 31, 2021, the Company purchased and sold investment securities and recognized a net gain on sale of $
A three-level valuation hierarchy exists for disclosure of fair value measurements. The valuation hierarchy is based upon the transparency of inputs to the valuation of an asset or liability as of the measurement date. A financial instrument’s categorization
F-43
within the valuation hierarchy is based upon the lowest level of input that is significant to the fair value measurement. The three levels are defined as follows:
|
|
• |
Level 1 – Inputs to the valuation methodology are quoted prices (unadjusted) for identical assets or liabilities in active markets. |
|
|
• |
Level 2 – Inputs to the valuation methodology include quoted prices for similar assets and liabilities in active markets, and inputs that are observable for the asset or liability, either directly or indirectly, for substantially the full term of the financial instrument. |
|
|
• |
Level 3 – Inputs to the valuation methodology are unobservable and significant to the fair value measurement. |
The Company’s derivative positions are valued using models developed by the respective counterparty as well as models applied internally by the Company that use as their inputs readily observable market parameters (such as forward yield curves and credit default swap data).
|
Fair Value Measurement Type |
|
Valuation Inputs |
|
|
|
|
|
|
|
|
|
|
|
|
|
|
|
|
The fair values of the Company’s financial instruments (other than mortgage notes payable, unsecured notes, commercial paper, line of credit and derivative instruments), including cash and cash equivalents and other financial instruments, approximate their carrying or contract value.
|
|
|
December 31, 2021 |
|
|
December 31, 2020 |
|
||||||||||
|
|
|
Carrying Value |
|
|
Estimated Fair Value (Level 2) |
|
|
Carrying Value |
|
|
Estimated Fair Value (Level 2) |
|
||||
|
Mortgage notes payable, net |
|
$ |
|
|
|
$ |
|
|
|
$ |
|
|
|
$ |
|
|
|
Unsecured debt, net |
|
|
|
|
|
|
|
|
|
|
|
|
|
|
|
|
|
Total debt, net |
|
$ |
|
|
|
$ |
|
|
|
$ |
|
|
|
$ |
|
|
The following tables provide a summary of the fair value measurements for each major category of assets and liabilities measured at fair value on a recurring basis and the location within the accompanying consolidated balance sheets at December 31, 2021 and 2020, respectively (amounts in thousands):
|
|
|
|
|
|
|
|
|
Fair Value Measurements at Reporting Date Using |
|
|||||||||
|
Description |
|
Balance Sheet Location |
|
12/31/2021 |
|
|
Quoted Prices in Active Markets for Identical Assets/Liabilities (Level 1) |
|
|
Significant Other Observable Inputs (Level 2) |
|
|
Significant Unobservable Inputs (Level 3) |
|
||||
|
Assets |
|
|
|
|
|
|
|
|
|
|
|
|
|
|
|
|
|
|
|
Supplemental Executive Retirement Plan |
|
Other Assets |
|
$ |
|
|
|
$ |
|
|
|
$ |
|
|
|
$ |
|
|
|
|
|
|
|
|
|
|
|
|
|
|
|
|
|
|
|
|
|
|
|
Liabilities |
|
|
|
|
|
|
|
|
|
|
|
|
|
|
|
|
|
|
|
Supplemental Executive Retirement Plan |
|
Other Liabilities |
|
$ |
|
|
|
$ |
|
|
|
$ |
|
|
|
$ |
|
|
|
|
|
|
|
|
|
|
|
|
|
|
|
|
|
|
|
|
|
|
|
Redeemable Noncontrolling Interests – |
|
|
|
|
|
|
|
|
|
|
|
|
|
|
|
|
|
|
|
Operating Partnership/Redeemable |
|
|
|
|
|
|
|
|
|
|
|
|
|
|
|
|
|
|
|
Limited Partners |
|
Mezzanine |
|
$ |
|
|
|
$ |
|
|
|
$ |
|
|
|
$ |
|
|
F-44
|
|
|
|
|
|
|
|
|
Fair Value Measurements at Reporting Date Using |
|
|||||||||
|
Description |
|
Balance Sheet Location |
|
12/31/2020 |
|
|
Quoted Prices in Active Markets for Identical Assets/Liabilities (Level 1) |
|
|
Significant Other Observable Inputs (Level 2) |
|
|
Significant Unobservable Inputs (Level 3) |
|
||||
|
Assets |
|
|
|
|
|
|
|
|
|
|
|
|
|
|
|
|
|
|
|
Supplemental Executive Retirement Plan |
|
Other Assets |
|
$ |
|
|
|
$ |
|
|
|
$ |
|
|
|
$ |
|
|
|
|
|
|
|
|
|
|
|
|
|
|
|
|
|
|
|
|
|
|
|
Liabilities |
|
|
|
|
|
|
|
|
|
|
|
|
|
|
|
|
|
|
|
Supplemental Executive Retirement Plan |
|
Other Liabilities |
|
$ |
|
|
|
$ |
|
|
|
$ |
|
|
|
$ |
|
|
|
|
|
|
|
|
|
|
|
|
|
|
|
|
|
|
|
|
|
|
|
Redeemable Noncontrolling Interests – |
|
|
|
|
|
|
|
|
|
|
|
|
|
|
|
|
|
|
|
Operating Partnership/Redeemable |
|
|
|
|
|
|
|
|
|
|
|
|
|
|
|
|
|
|
|
Limited Partners |
|
Mezzanine |
|
$ |
|
|
|
$ |
|
|
|
$ |
|
|
|
$ |
|
|
The following tables provide a summary of the effect of fair value hedges on the Company’s accompanying consolidated statements of operations and comprehensive income for the years ended December 31, 2021, 2020 and 2019, respectively (amounts in thousands):
|
December 31, 2021 Type of Fair Value Hedge |
|
Location of Gain/(Loss) Recognized in Income on Derivative |
|
Amount of Gain/(Loss) Recognized in Income on Derivative |
|
|
Hedged Item |
|
Income Statement Location of Hedged Item Gain/(Loss) |
|
Amount of Gain/(Loss) Recognized in Income on Hedged Item |
|
||
|
Derivatives designated as hedging instruments: |
|
|
|
|
|
|
|
|
|
|
|
|
|
|
|
Interest Rate Contracts: |
|
|
|
|
|
|
|
|
|
|
|
|
|
|
|
Interest Rate Swaps |
|
N/A |
|
$ |
— |
|
|
N/A |
|
N/A |
|
$ |
— |
|
|
Total |
|
|
|
$ |
— |
|
|
|
|
|
|
$ |
— |
|
|
December 31, 2020 Type of Fair Value Hedge |
|
Location of Gain/(Loss) Recognized in Income on Derivative |
|
Amount of Gain/(Loss) Recognized in Income on Derivative |
|
|
Hedged Item |
|
Income Statement Location of Hedged Item Gain/(Loss) |
|
Amount of Gain/(Loss) Recognized in Income on Hedged Item |
|
||
|
Derivatives designated as hedging instruments: |
|
|
|
|
|
|
|
|
|
|
|
|
|
|
|
Interest Rate Contracts: |
|
|
|
|
|
|
|
|
|
|
|
|
|
|
|
Interest Rate Swaps |
|
N/A |
|
$ |
— |
|
|
N/A |
|
N/A |
|
$ |
— |
|
|
Total |
|
|
|
$ |
— |
|
|
|
|
|
|
$ |
— |
|
|
December 31, 2019 Type of Fair Value Hedge |
|
Location of Gain/(Loss) Recognized in Income on Derivative |
|
Amount of Gain/(Loss) Recognized in Income on Derivative |
|
|
Hedged Item |
|
Income Statement Location of Hedged Item Gain/(Loss) |
|
Amount of Gain/(Loss) Recognized in Income on Hedged Item |
|
||
|
Derivatives designated as hedging instruments: |
|
|
|
|
|
|
|
|
|
|
|
|
|
|
|
Interest Rate Contracts: |
|
|
|
|
|
|
|
|
|
|
|
|
|
|
|
Interest Rate Swaps |
|
Interest expense |
|
$ |
|
|
|
Fixed rate debt |
|
Interest expense |
|
$ |
( |
) |
|
Total |
|
|
|
$ |
|
|
|
|
|
|
|
$ |
( |
) |
The following tables provide a summary of the effect of cash flow hedges on the Company’s accompanying consolidated statements of operations and comprehensive income for the years ended December 31, 2021, 2020 and 2019, respectively (amounts in thousands):
|
December 31, 2021 Type of Cash Flow Hedge |
|
Amount of Gain/(Loss) Recognized in OCI on Derivative |
|
|
Location of Gain/(Loss) Reclassified from Accumulated OCI into Income |
|
Amount of Gain/(Loss) Reclassified from Accumulated OCI into Income |
|
||
|
Derivatives designated as hedging instruments: |
|
|
|
|
|
|
|
|
|
|
|
Interest Rate Contracts: |
|
|
|
|
|
|
|
|
|
|
|
Forward Starting Swaps |
|
$ |
— |
|
|
Interest expense |
|
$ |
( |
) |
|
Total |
|
$ |
— |
|
|
|
|
$ |
( |
) |
F-45
|
December 31, 2020 Type of Cash Flow Hedge |
|
Amount of Gain/(Loss) Recognized in OCI on Derivative |
|
|
Location of Gain/(Loss) Reclassified from Accumulated OCI into Income |
|
Amount of Gain/(Loss) Reclassified from Accumulated OCI into Income |
|
||
|
Derivatives designated as hedging instruments: |
|
|
|
|
|
|
|
|
|
|
|
Interest Rate Contracts: |
|
|
|
|
|
|
|
|
|
|
|
Forward Starting Swaps |
|
$ |
( |
) |
|
Interest expense |
|
$ |
( |
) |
|
Total |
|
$ |
( |
) |
|
|
|
$ |
( |
) |
|
December 31, 2019 Type of Cash Flow Hedge |
|
Amount of Gain/(Loss) Recognized in OCI on Derivative |
|
|
Location of Gain/(Loss) Reclassified from Accumulated OCI into Income |
|
Amount of Gain/(Loss) Reclassified from Accumulated OCI into Income |
|
||
|
Derivatives designated as hedging instruments: |
|
|
|
|
|
|
|
|
|
|
|
Interest Rate Contracts: |
|
|
|
|
|
|
|
|
|
|
|
Forward Starting Swaps |
|
$ |
( |
) |
|
Interest expense |
|
$ |
( |
) |
|
Total |
|
$ |
( |
) |
|
|
|
$ |
( |
) |
As of December 31, 2021 and 2020, there were approximately $
In April 2020, the Company paid approximately $
In July 2019,
In June 2019, the Company paid approximately $
F-46
|
11. |
Earnings Per Share and Earnings Per Unit |
Equity Residential
The following tables set forth the computation of net income per share – basic and net income per share – diluted for the Company (amounts in thousands except per share amounts):
|
|
|
Year Ended December 31, |
|
|||||||||
|
|
|
2021 |
|
|
2020 |
|
|
2019 |
|
|||
|
Numerator for net income per share – basic: |
|
|
|
|
|
|
|
|
|
|
|
|
|
Net income |
|
$ |
|
|
|
$ |
|
|
|
$ |
|
|
|
Allocation to Noncontrolling Interests – Operating Partnership |
|
|
( |
) |
|
|
( |
) |
|
|
( |
) |
|
Net (income) loss attributable to Noncontrolling Interests – Partially Owned Properties |
|
|
( |
) |
|
|
( |
) |
|
|
( |
) |
|
Preferred distributions |
|
|
( |
) |
|
|
( |
) |
|
|
( |
) |
|
Numerator for net income per share – basic |
|
$ |
|
|
|
$ |
|
|
|
$ |
|
|
|
Numerator for net income per share – diluted: |
|
|
|
|
|
|
|
|
|
|
|
|
|
Net income |
|
$ |
|
|
|
$ |
|
|
|
$ |
|
|
|
Net (income) loss attributable to Noncontrolling Interests – Partially Owned Properties |
|
|
( |
) |
|
|
( |
) |
|
|
( |
) |
|
Preferred distributions |
|
|
( |
) |
|
|
( |
) |
|
|
( |
) |
|
Numerator for net income per share – diluted |
|
$ |
|
|
|
$ |
|
|
|
$ |
|
|
|
Denominator for net income per share – basic and diluted: |
|
|
|
|
|
|
|
|
|
|
|
|
|
Denominator for net income per share – basic |
|
|
|
|
|
|
|
|
|
|
|
|
|
Effect of dilutive securities: |
|
|
|
|
|
|
|
|
|
|
|
|
|
OP Units |
|
|
|
|
|
|
|
|
|
|
|
|
|
Long-term compensation shares/units |
|
|
|
|
|
|
|
|
|
|
|
|
|
ATM forward sales |
|
|
|
|
|
|
— |
|
|
|
— |
|
|
Denominator for net income per share – diluted |
|
|
|
|
|
|
|
|
|
|
|
|
|
Net income per share – basic |
|
$ |
|
|
|
$ |
|
|
|
$ |
|
|
|
Net income per share – diluted |
|
$ |
|
|
|
$ |
|
|
|
$ |
|
|
ERP Operating Limited Partnership
The following tables set forth the computation of net income per Unit – basic and net income per Unit – diluted for the Operating Partnership (amounts in thousands except per Unit amounts):
|
|
|
Year Ended December 31, |
|
|||||||||
|
|
|
2021 |
|
|
2020 |
|
|
2019 |
|
|||
|
Numerator for net income per Unit – basic and diluted: |
|
|
|
|
|
|
|
|
|
|
|
|
|
Net income |
|
$ |
|
|
|
$ |
|
|
|
$ |
|
|
|
Net (income) loss attributable to Noncontrolling Interests – Partially Owned Properties |
|
|
( |
) |
|
|
( |
) |
|
|
( |
) |
|
Allocation to Preference Units |
|
|
( |
) |
|
|
( |
) |
|
|
( |
) |
|
Numerator for net income per Unit – basic and diluted |
|
$ |
|
|
|
$ |
|
|
|
$ |
|
|
|
Denominator for net income per Unit – basic and diluted: |
|
|
|
|
|
|
|
|
|
|
|
|
|
Denominator for net income per Unit – basic |
|
|
|
|
|
|
|
|
|
|
|
|
|
Effect of dilutive securities: |
|
|
|
|
|
|
|
|
|
|
|
|
|
Dilution for Units issuable upon assumed exercise/vesting of the Company’s long-term compensation shares/units |
|
|
|
|
|
|
|
|
|
|
|
|
|
ATM forward sales |
|
|
|
|
|
|
— |
|
|
|
— |
|
|
Denominator for net income per Unit – diluted |
|
|
|
|
|
|
|
|
|
|
|
|
|
Net income per Unit – basic |
|
$ |
|
|
|
$ |
|
|
|
$ |
|
|
|
Net income per Unit – diluted |
|
$ |
|
|
|
$ |
|
|
|
$ |
|
|
|
|
|
|
|
|
|
|
|
|
|
|
|
|
|
12. |
Share Incentive Plans |
Any Common Shares issued pursuant to EQR’s incentive equity compensation and employee share purchase plans will result in ERPOP issuing OP Units to EQR on a one-for-one basis with ERPOP receiving the net cash proceeds of such issuances.
F-47
Overview of Share Incentive Plans
The 2019 Share Incentive Plan (the “2019 Plan”), as approved by the Company’s shareholders on June 27, 2019, expires on June 27, 2029 and reserves
Pursuant to the 2019 Plan and the 2011 Share Incentive Plan (the “2011 Plan”) (collectively the “Share Incentive Plans”), officers, trustees, key employees and consultants of the Company and its subsidiaries may be granted share options to acquire Common Shares (“Options”), including non-qualified share options (“NQSOs”), incentive share options (“ISOs”) and share appreciation rights (“SARs”), or may be granted restricted or non-restricted shares/units (including long-term incentive plan awards), subject to conditions and restrictions. Options, SARs, restricted shares and restricted units are sometimes collectively referred to herein as “Awards.”
The 2011 Plan will terminate when all outstanding Awards have expired or have been exercised/vested. The Board of Trustees may at any time amend or terminate the Share Incentive Plans, but termination will not affect Awards previously granted, absent immediate vesting and cash settlement. Any Options which had vested prior to such a termination would remain exercisable by the holder.
Employee Long-Term Compensation Awards
The following table summarizes the terms of Awards generally granted to employees:
|
|
|
Options |
|
Restricted Shares |
|
Restricted Units |
|
Overview |
|
|
|
|
|
|
|
Grant/Exercise Price |
|
|
|
|
|
|
|
Vesting Period |
|
|
|
|
|
|
|
Expiration |
|
|
|
Not applicable. |
|
|
|
Upon Employee Termination |
|
|
|
|
|
|
|
(1) |
Dividends/distributions paid on unvested restricted shares and units are included as a component of retained earnings and Noncontrolling Interest – Operating Partnership/Limited Partners Capital, respectively, and have not been considered in reducing net income available to Common Shares/Units in a manner similar to the Company’s preferred share/preference unit dividends for the earnings per share/Unit calculation. |
|
(2) |
A restricted unit will automatically convert to an OP Unit when the capital account of each restricted unit increases (“books-up”) to a specified target. The probability of a book-up occurring within the ten-year contractual life along with the liquidity risk associated with various hold period restrictions are both reflected in the discount. If the capital target is not attained within ten years following the date of issuance, the restricted unit will automatically be canceled and no compensation will be payable to the holder of such canceled restricted unit. If the capital target is attained and the restricted unit is converted to an OP Unit, it will not expire. |
F-48
Valuation Method of Share Options
The fair value of the Option grants is recognized over the requisite service/vesting period of the Options. The fair value for the Company’s Options was estimated at the time the Options were granted using the Black-Scholes option pricing model with the primary grant in each year having the following weighted average assumptions:
|
|
|
2021 |
|
|
2020 |
|
|
2019 |
|
|||
|
Expected volatility (1) |
|
|
|
% |
|
|
|
% |
|
|
|
% |
|
Expected life (2) |
|
|
|
|
|
|
|
|
|
|||
|
Expected dividend yield (3) |
|
|
|
% |
|
|
|
% |
|
|
|
% |
|
Risk-free interest rate (4) |
|
|
|
% |
|
|
|
% |
|
|
|
% |
|
Exercise price per share (5) |
|
$ |
|
|
|
$ |
|
|
|
$ |
|
|
|
Option valuation per share |
|
$ |
|
|
|
$ |
|
|
|
$ |
|
|
|
(1) |
Expected volatility – Estimated based on the historical volatility (the period matching the expected life) of EQR’s share price measured on a monthly basis. |
|
(2) |
Expected life – Approximates the actual weighted average life of all Options granted since the Company went public in 1993. |
|
(3) |
Expected dividend yield – Calculated by averaging the historical annual yield on EQR shares for a period matching the expected life of each grant, with the annual yield calculated by dividing actual regular dividends (excluding any special dividends) by the average price of EQR’s shares in a given year. |
|
(4) |
Risk-free interest rate – The most current U.S. Treasury rate available at the grant date for a period matching the expected life of each grant. |
|
(5) |
Exercise price per share – The closing share price of the Common Shares on the grant date. |
The valuation method and assumptions are the same as those the Company used in accounting for Option expense in its consolidated financial statements. The Black-Scholes option valuation model was developed for use in estimating the fair value of traded options that have no vesting restrictions and are fully transferable. This model is only one method of valuing options. Because the Company’s Options have characteristics significantly different from those of traded options, and because changes in the subjective input assumptions can materially affect the fair value estimate, the actual value of the Options to the recipient may be significantly different.
Long-Term Incentive Plan
The Company’s executive compensation program allows the Chairman, Chief Executive Officer and certain other executive officers to earn from
The LTI participants receive distributions only on restricted units awarded equal to
The grant date fair value of the TSR portion of the LTI awards is estimated using a multifactor Monte Carlo model to determine share prices for an absolute award for which the payout of the award only depends on EQR’s TSR and a set of relative awards for which the payout of the award depends on the spread of EQR’s TSR to the TSR of two indices: (a) the FTSE Nareit Apartment Index; and (b) the FTSE Nareit Equity Index. The grant date fair value of the Normalized FFO portion of the LTI awards is estimated using the closing price of EQR Common Shares on the grant date for the restricted shares and a discounted closing price of EQR Common Shares on the grant date for the restricted units to reflect the “book-up” and liquidity risk inherent in the units. The individual prices determined above are then weighted to arrive at the final values for each restricted share/unit as follows:
|
|
|
2021 |
|
|
2020 |
|
|
2019 |
|
|||
|
Weighted average fair value per restricted share |
|
$ |
|
|
|
$ |
|
|
|
$ |
|
|
|
Weighted average fair value per restricted unit |
|
$ |
|
|
|
$ |
|
|
|
$ |
|
|
The valuation method and assumptions are the same as those the Company used in accounting for restricted share/unit expense in its consolidated financial statements. The Monte Carlo valuation model is only one method of valuing awards. Because the
F-49
Company’s restricted shares/units have characteristics significantly different from those of traded shares/units, and because changes in the subjective input assumptions can materially affect the fair value estimate, the actual value of the restricted shares/units to the recipient may be significantly different.
Trustees
All Trustees, with the exception of the Company’s Chairman and employee Trustees, are granted Options, restricted shares and/or restricted units that vest one-year from the grant date that corresponds to the term for which he or she has been elected to serve. Since 2016, the Chairman has only received awards under the LTI plan (see further discussion above).
Retirement Benefits
The Company’s Share Incentive Plans provide for certain benefits upon retirement.
|
|
|
Age 62 for Employees |
|
Rule of 70 for Employees |
|
Age 72 for Trustees |
|
Eligibility |
|
|
|
|
|
|
|
Effect on unvested restricted shares, restricted units and Options |
|
|
|
|
|
|
|
Effect on LTI Plan |
|
|
||||
|
(1) |
The Rule of 70 is met when an employee’s years of service with the Company (which must be at least 15 years) plus his or her age (which must be at least 55 years) on the date of termination equals or exceeds 70 years. In addition, the employee must give the Company at least six months’ advance written notice of his or her intention to retire along with agreeing to certain other conditions. |
Under the Company’s definitions of retirement, some of its executive officers, including its Chief Executive Officer, and its Chairman are retirement eligible.
Compensation Expense and Award Activity
The following tables summarize compensation information regarding the restricted shares, restricted units, Options and Employee Share Purchase Plan (“ESPP”) for the three years ended December 31, 2021, 2020 and 2019.
|
|
|
Year Ended December 31, 2021 |
|
|||||||||||||||||
|
|
|
Compensation Expense |
|
|
Compensation Capitalized |
|
|
Restricted Units/Options In-Lieu of Bonus (1) |
|
|
Compensation Equity |
|
|
Dividends Incurred |
|
|||||
|
Restricted shares (2) |
|
$ |
|
|
|
$ |
|
|
|
$ |
|
|
|
$ |
|
|
|
$ |
|
|
|
Restricted units (2) |
|
|
|
|
|
|
|
|
|
|
|
|
|
|
|
|
|
|
|
|
|
Options |
|
|
|
|
|
|
|
|
|
|
|
|
|
|
|
|
|
|
|
|
|
ESPP discount |
|
|
|
|
|
|
|
|
|
|
|
|
|
|
|
|
|
|
|
|
|
Total |
|
$ |
|
|
|
$ |
|
|
|
$ |
|
|
|
$ |
|
|
|
$ |
|
|
|
|
|
Year Ended December 31, 2020 |
|
|||||||||||||||||
|
|
|
Compensation Expense |
|
|
Compensation Capitalized |
|
|
Restricted Units/Options In-Lieu of Bonus (1) |
|
|
Compensation Equity |
|
|
Dividends Incurred |
|
|||||
|
Restricted shares (2) |
|
$ |
|
|
|
$ |
|
|
|
$ |
|
|
|
$ |
|
|
|
$ |
|
|
|
Restricted units (2) |
|
|
|
|
|
|
|
|
|
|
|
|
|
|
|
|
|
|
|
|
|
Options |
|
|
|
|
|
|
|
|
|
|
|
|
|
|
|
|
|
|
|
|
|
ESPP discount |
|
|
|
|
|
|
|
|
|
|
|
|
|
|
|
|
|
|
|
|
|
Total |
|
$ |
|
|
|
$ |
|
|
|
$ |
|
|
|
$ |
|
|
|
$ |
|
|
F-50
|
|
|
Year Ended December 31, 2019 |
|
|||||||||||||||||
|
|
|
Compensation Expense |
|
|
Compensation Capitalized |
|
|
Restricted Units/Options In-Lieu of Bonus (1) |
|
|
Compensation Equity |
|
|
Dividends Incurred |
|
|||||
|
Restricted shares (2) |
|
$ |
|
|
|
$ |
|
|
|
$ |
|
|
|
$ |
|
|
|
$ |
|
|
|
Restricted units (2) |
|
|
|
|
|
|
|
|
|
|
|
|
|
|
|
|
|
|
|
|
|
Options |
|
|
|
|
|
|
|
|
|
|
|
|
|
|
|
|
|
|
|
|
|
ESPP discount |
|
|
|
|
|
|
|
|
|
|
|
|
|
|
|
|
|
|
|
|
|
Total |
|
$ |
|
|
|
$ |
|
|
|
$ |
|
|
|
$ |
|
|
|
$ |
|
|
|
(1) |
The Company allows eligible officers the ability to receive immediately vested restricted units (subject to the book-up provisions described above and a two-year hold restriction) or immediately vested Options in-lieu of any percentage of their annual cash bonus. |
|
(2) |
Includes LTI plan awards granted under the executive compensation program. |
Compensation expense is generally recognized for Awards as follows:
|
|
• |
Restricted shares, restricted units and Options – Straight-line method over the vesting period of the Options, shares or units regardless of cliff or ratable vesting distinctions. |
|
|
• |
LTI plan awards – Target amount is recognized under the straight-line method over the vesting period of the shares or units. |
|
|
• |
ESPP discount – Immediately upon the purchase of Common Shares each quarter. |
The Company accelerates the recognition of compensation expense for all Awards for those individuals approaching or meeting the retirement age criteria discussed above. The total compensation expense related to Awards not yet vested at December 31, 2021 is $
The table below summarizes the Award activity of the Share Incentive Plans for the three years ended December 31, 2021, 2020 and 2019:
|
|
|
Common Shares Subject to Options |
|
|
Weighted Average Exercise Price per Option |
|
|
Restricted Shares |
|
|
Weighted Average Fair Value per Restricted Share |
|
|
Restricted Units |
|
|
Weighted Average Fair Value per Restricted Unit |
|
||||||
|
Balance at December 31, 2018 |
|
|
|
|
|
$ |
|
|
|
|
|
|
|
$ |
|
|
|
|
|
|
|
$ |
|
|
|
Awards granted (1) |
|
|
|
|
|
$ |
|
|
|
|
|
|
|
$ |
|
|
|
|
|
|
|
$ |
|
|
|
Awards exercised/vested |
|
|
( |
) |
|
$ |
|
|
|
|
( |
) |
|
$ |
|
|
|
|
( |
) |
|
$ |
|
|
|
Awards forfeited |
|
|
( |
) |
|
$ |
|
|
|
|
( |
) |
|
$ |
|
|
|
|
( |
) |
|
$ |
|
|
|
Awards expired |
|
|
( |
) |
|
$ |
|
|
|
|
|
|
|
$ |
|
|
|
|
|
|
|
$ |
|
|
|
Balance at December 31, 2019 |
|
|
|
|
|
$ |
|
|
|
|
|
|
|
$ |
|
|
|
|
|
|
|
$ |
|
|
|
Awards granted (1) |
|
|
|
|
|
$ |
|
|
|
|
|
|
|
$ |
|
|
|
|
|
|
|
$ |
|
|
|
Awards exercised/vested |
|
|
( |
) |
|
$ |
|
|
|
|
( |
) |
|
$ |
|
|
|
|
( |
) |
|
$ |
|
|
|
Awards forfeited |
|
|
( |
) |
|
$ |
|
|
|
|
( |
) |
|
$ |
|
|
|
|
|
|
|
$ |
|
|
|
Awards expired |
|
|
( |
) |
|
$ |
|
|
|
|
|
|
|
$ |
|
|
|
|
|
|
|
$ |
|
|
|
Balance at December 31, 2020 |
|
|
|
|
|
$ |
|
|
|
|
|
|
|
$ |
|
|
|
|
|
|
|
$ |
|
|
|
Awards granted (1) |
|
|
|
|
|
$ |
|
|
|
|
|
|
|
$ |
|
|
|
|
|
|
|
$ |
|
|
|
Awards exercised/vested |
|
|
( |
) |
|
$ |
|
|
|
|
( |
) |
|
$ |
|
|
|
|
( |
) |
|
$ |
|
|
|
Awards forfeited |
|
|
( |
) |
|
$ |
|
|
|
|
( |
) |
|
$ |
|
|
|
|
( |
) |
|
$ |
|
|
|
Awards expired |
|
|
( |
) |
|
$ |
|
|
|
|
|
|
|
$ |
|
|
|
|
|
|
|
$ |
|
|
|
Balance at December 31, 2021 |
|
|
|
|
|
$ |
|
|
|
|
|
|
|
$ |
|
|
|
|
|
|
|
$ |
|
|
|
(1) |
Includes LTI plan awards granted under the executive compensation program. |
|
|
|
Amounts in thousands except per share amounts |
|
|||||||||
|
|
|
Year Ended December 31, |
|
|||||||||
|
|
|
2021 |
|
|
2020 |
|
|
2019 |
|
|||
|
Weighted average grant date fair value per share for Options granted |
|
$ |
|
|
|
$ |
|
|
|
$ |
|
|
|
Aggregate intrinsic value of Options exercised (1) |
|
$ |
|
|
|
$ |
|
|
|
$ |
|
|
|
Fair value of restricted shares vested |
|
$ |
|
|
|
$ |
|
|
|
$ |
|
|
|
Fair value of restricted units vested |
|
$ |
|
|
|
$ |
|
|
|
$ |
|
|
|
(1) |
These values were calculated as the difference between the strike price of the underlying awards and the per share price at which each respective award was exercised. |
F-51
The following table summarizes information regarding Options outstanding and exercisable at December 31, 2021 (aggregate intrinsic value is in thousands):
|
|
|
Options |
|
|
Weighted Average Remaining Contractual Life in Years |
|
|
Weighted Average Exercise Price |
|
|
Aggregate Intrinsic Value (1) |
|
||||
|
Options Outstanding |
|
|
|
|
|
|
|
|
|
$ |
|
|
|
$ |
|
|
|
Options Exercisable |
|
|
|
|
|
|
|
|
|
$ |
|
|
|
$ |
|
|
|
Vested and expected to vest |
|
|
|
|
|
|
|
|
|
$ |
|
|
|
$ |
|
|
|
(1) |
The aggregate intrinsic values were calculated as the excess, if any, between the Company’s closing share price of $ |
As of December 31, 2020 and 2019,
|
13. |
Employee Plans |
The Company established an Employee Share Purchase Plan to provide each employee and trustee the ability to annually acquire up to $
|
|
|
Year Ended December 31, |
|
|||||||||
|
|
|
2021 |
|
|
2020 |
|
|
2019 |
|
|||
|
Shares issued |
|
|
|
|
|
|
|
|
|
|
|
|
|
Issuance price ranges |
|
|
|
|
|
|
|
|
|
|||
|
Issuance proceeds |
|
$ |
|
|
|
$ |
|
|
|
$ |
|
|
The Company established a defined contribution plan (the “401(k) Plan”) to provide retirement benefits for employees that meet minimum employment criteria. The Company matches dollar for dollar up to the first
The Company established the SERP to provide certain officers and trustees an opportunity to defer a portion of their eligible compensation in order to save for retirement. The SERP is restricted to investments in Common Shares, certain marketable securities that have been specifically approved and cash equivalents. The deferred compensation liability represented in the SERP and the securities issued to fund such deferred compensation liability are consolidated by the Company and carried on the Company’s balance sheets, and the Company’s Common Shares held in the SERP are accounted for as a reduction to paid in capital (included in general partner’s capital in the Operating Partnership’s financial statements).
|
14. |
Distribution Reinvestment Plan |
On September 30, 2014, the Company filed with the SEC a Form S-3 Registration Statement to register
The 2014 DRIP provides holders of record and beneficial owners of Common Shares and Preferred Shares with a simple and convenient method of reinvesting cash dividends/distributions in additional Common Shares. Common Shares purchased under the 2014 DRIP may, at the option of EQR, be directly issued by EQR or purchased by EQR’s transfer agent in the open market using participants’ funds. The net proceeds from any Common Share issuances are contributed to ERPOP in exchange for OP Units.
|
15. |
Transactions with Related Parties |
The Company leases its corporate headquarters from an entity affiliated with EQR’s Chairman of the Board of Trustees. The lease term expires on
F-52
the years ended December 31, 2021, 2020 and 2019 were approximately $
|
16. |
Commitments and Contingencies |
Commitments
Joint Venture and Real Estate Technology Fund Commitments
We have entered into, and may continue in the future to enter into, joint ventures agreements with third-party partners for the development of multifamily rental properties, as well as real estate technology fund investments. The joint venture agreements with each development partner include buy-sell provisions that provide the right, but not the obligation, for the Company to acquire each respective partner’s interests or sell its interests at any time following the occurrence of certain pre-defined events described in the joint venture agreements. See Note 6 for additional discussion.
The following table summarizes the Company’s approximate real estate commitments at December 31, 2021 (amounts in thousands for remaining commitments):
|
|
|
|
|
|
|
|
|
|
|
Remaining |
|
|
|
|
|
Projects/Investments |
|
|
Apartment Units |
|
|
Commitments |
|
|||
|
Projects Under Development |
|
|
|
|
|
|
|
|
|
|
|
|
|
Consolidated |
|
|
|
|
|
|
|
|
|
$ |
|
|
|
Unconsolidated |
|
|
|
|
|
|
|
|
|
|
|
|
|
Total Projects Under Development (1) |
|
|
|
|
|
|
|
|
|
$ |
|
|
|
Real Estate Technology Investments |
|
|
|
|
|
|
— |
|
|
$ |
|
|
|
|
(1) |
Remaining commitments for total projects under development represent the gross amounts, with funds to be provided by the Company, its joint venture partners and/or applicable construction loans. |
As of December 31, 2021, the Company entered into a commitment agreement (the “Commitment Agreement”) with Toll to pursue the joint development of multifamily rental properties. Over the next
Employment Agreements
The Company has entered into a retirement benefits agreement with its Chairman and a deferred compensation agreement with
The following table summarizes the Company’s contractual obligations for deferred compensation for the next five years and thereafter as of December 31, 2021:
|
(Payments) Due by Year (in thousands) |
|
|||||||||||||||||||||||||||
|
|
|
2022 |
|
|
2023 |
|
|
2024 |
|
|
2025 |
|
|
2026 |
|
|
Thereafter |
|
|
Total |
|
|||||||
|
Other Long-Term Liabilities: |
|
|
|
|
|
|
|
|
|
|
|
|
|
|
|
|
|
|
|
|
|
|
|
|
|
|
|
|
|
Deferred Compensation (1) |
|
$ |
( |
) |
|
$ |
( |
) |
|
$ |
( |
) |
|
$ |
( |
) |
|
$ |
( |
) |
|
$ |
( |
) |
|
$ |
( |
) |
|
(1) |
Estimated payments to the Company’s Chairman and one former executive officer based on actual and estimated retirement dates. |
Contingencies
Litigation and Legal Matters
The Company, as an owner of real estate, is subject to various Federal, state and local laws, including, but not limited to, rent regulations and environmental laws. Compliance by the Company with existing laws has not had a material adverse effect on the
F-53
Company. However, the Company cannot predict the impact of new or changed laws or regulations, whether related to COVID-19 or otherwise, on its current properties or on properties that it may acquire in the future.
The Company does not believe there is any litigation pending or threatened against it that, individually or in the aggregate, may reasonably be expected to have a material adverse effect on the Company.
|
17. |
Reportable Segments |
Operating segments are defined as components of an enterprise that engage in business activities from which they may earn revenues and incur expenses and about which discrete financial information is available that is evaluated regularly by the chief operating decision maker. The chief operating decision maker decides how resources are allocated and assesses performance on a recurring basis at least quarterly.
The Company’s primary business is the acquisition, development and management of multifamily residential properties, which includes the generation of rental and other related income through the leasing of apartment units to residents. The chief operating decision maker evaluates the Company’s operating performance geographically by market and both on a same store and non-same store basis. While the Company does maintain a non-residential presence, it accounts for approximately
The Company’s development activities are other business activities that do not constitute an operating segment and as such, have been aggregated in the “Other” category in the tables presented below.
All revenues are from external customers and there is
The primary financial measure for the Company’s rental real estate segment is net operating income (“NOI”), which represents rental income less: 1) property and maintenance expense and 2) real estate taxes and insurance expense (all as reflected in the accompanying consolidated statements of operations and comprehensive income). The Company believes that NOI is helpful to investors as a supplemental measure of its operating performance because it is a direct measure of the actual operating results of the Company’s apartment properties. Revenues for all leases are reflected on a straight-line basis in accordance with GAAP for the current and comparable periods.
The following table presents a reconciliation of NOI from our rental real estate for the years ended December 31, 2021, 2020 and 2019, respectively (amounts in thousands):
|
|
|
Year Ended December 31, |
|
|||||||||
|
|
|
2021 |
|
|
2020 |
|
|
2019 |
|
|||
|
Rental income |
|
$ |
|
|
|
$ |
|
|
|
$ |
|
|
|
Property and maintenance expense |
|
|
( |
) |
|
|
( |
) |
|
|
( |
) |
|
Real estate taxes and insurance expense |
|
|
( |
) |
|
|
( |
) |
|
|
( |
) |
|
Total operating expenses |
|
|
( |
) |
|
|
( |
) |
|
|
( |
) |
|
Net operating income |
|
$ |
|
|
|
$ |
|
|
|
$ |
|
|
F-54
The following tables present NOI from our rental real estate for each segment for the years ended December 31, 2021, 2020 and 2019, respectively, as well as total assets and capital expenditures at December 31, 2021 and 2020, respectively (amounts in thousands):
|
|
|
Year Ended December 31, 2021 |
|
|
Year Ended December 31, 2020 |
|
|
Year Ended December 31, 2019 |
|
|||||||||||||||||||||||||||
|
|
|
Rental Income |
|
|
Operating Expenses |
|
|
NOI |
|
|
Rental Income |
|
|
Operating Expenses |
|
|
NOI |
|
|
Rental Income |
|
|
Operating Expenses |
|
|
NOI |
|
|||||||||
|
Same store (1) |
|
|
|
|
|
|
|
|
|
|
|
|
|
|
|
|
|
|
|
|
|
|
|
|
|
|
|
|
|
|
|
|
|
|
|
|
|
Los Angeles |
|
$ |
|
|
|
$ |
|
|
|
$ |
|
|
|
$ |
|
|
|
$ |
|
|
|
$ |
|
|
|
$ |
|
|
|
$ |
|
|
|
$ |
|
|
|
Orange County |
|
|
|
|
|
|
|
|
|
|
|
|
|
|
|
|
|
|
|
|
|
|
|
|
|
|
|
|
|
|
|
|
|
|
|
|
|
San Diego |
|
|
|
|
|
|
|
|
|
|
|
|
|
|
|
|
|
|
|
|
|
|
|
|
|
|
|
|
|
|
|
|
|
|
|
|
|
Subtotal - Southern California |
|
|
|
|
|
|
|
|
|
|
|
|
|
|
|
|
|
|
|
|
|
|
|
|
|
|
|
|
|
|
|
|
|
|
|
|
|
|
|
|
|
|
|
|
|
|
|
|
|
|
|
|
|
|
|
|
|
|
|
|
|
|
|
|
|
|
|
|
|
|
|
|
|
|
|
San Francisco |
|
|
|
|
|
|
|
|
|
|
|
|
|
|
|
|
|
|
|
|
|
|
|
|
|
|
|
|
|
|
|
|
|
|
|
|
|
Washington D.C. |
|
|
|
|
|
|
|
|
|
|
|
|
|
|
|
|
|
|
|
|
|
|
|
|
|
|
|
|
|
|
|
|
|
|
|
|
|
New York |
|
|
|
|
|
|
|
|
|
|
|
|
|
|
|
|
|
|
|
|
|
|
|
|
|
|
|
|
|
|
|
|
|
|
|
|
|
Seattle |
|
|
|
|
|
|
|
|
|
|
|
|
|
|
|
|
|
|
|
|
|
|
|
|
|
|
|
|
|
|
|
|
|
|
|
|
|
Boston |
|
|
|
|
|
|
|
|
|
|
|
|
|
|
|
|
|
|
|
|
|
|
|
|
|
|
|
|
|
|
|
|
|
|
|
|
|
Other Markets |
|
|
|
|
|
|
|
|
|
|
|
|
|
|
|
|
|
|
|
|
|
|
|
|
|
|
|
|
|
|
|
|
|
|
|
|
|
Total same store |
|
|
|
|
|
|
|
|
|
|
|
|
|
|
|
|
|
|
|
|
|
|
|
|
|
|
|
|
|
|
|
|
|
|
|
|
|
|
|
|
|
|
|
|
|
|
|
|
|
|
|
|
|
|
|
|
|
|
|
|
|
|
|
|
|
|
|
|
|
|
|
|
|
|
|
Non-same store/other (2) (3) |
|
|
|
|
|
|
|
|
|
|
|
|
|
|
|
|
|
|
|
|
|
|
|
|
|
|
|
|
|
|
|
|
|
|
|
|
|
Non-same store |
|
|
|
|
|
|
|
|
|
|
|
|
|
|
|
|
|
|
|
|
|
|
|
|
|
|
|
|
|
|
|
|
|
|
|
|
|
Other (3) |
|
|
|
|
|
|
|
|
|
|
|
|
|
|
|
|
|
|
|
|
|
|
|
|
|
|
|
|
|
|
|
|
|
|
|
|
|
Total non-same store/other |
|
|
|
|
|
|
|
|
|
|
|
|
|
|
|
|
|
|
|
|
|
|
|
|
|
|
|
|
|
|
|
|
|
|
|
|
|
|
|
|
|
|
|
|
|
|
|
|
|
|
|
|
|
|
|
|
|
|
|
|
|
|
|
|
|
|
|
|
|
|
|
|
|
|
|
Totals |
|
$ |
|
|
|
$ |
|
|
|
$ |
|
|
|
$ |
|
|
|
$ |
|
|
|
$ |
|
|
|
$ |
|
|
|
$ |
|
|
|
$ |
|
|
|
(1) |
For the years ended December 31, 2021 and 2020, same store primarily includes all properties acquired or completed that were stabilized prior to January 1, 2020, less properties subsequently sold, which represented |
|
(2) |
For the years ended December 31, 2021 and 2020, non-same store primarily includes properties acquired after January 1, 2020, plus any properties in lease-up and not stabilized as of January 1, 2020. For the year ended December 31, 2019, non-same store primarily includes properties acquired after January 1, 2019, plus any properties in lease-up and not stabilized as of January 1, 2019. |
|
(3) |
Other includes development, other corporate operations and operations prior to disposition for properties sold. |
|
|
|
Year Ended December 31, 2021 |
|
|
Year Ended December 31, 2020 |
|
||||||||||
|
|
|
Total Assets |
|
|
Capital Expenditures |
|
|
Total Assets |
|
|
Capital Expenditures |
|
||||
|
Same store (1) |
|
|
|
|
|
|
|
|
|
|
|
|
|
|
|
|
|
Los Angeles |
|
$ |
|
|
|
$ |
|
|
|
$ |
|
|
|
$ |
|
|
|
Orange County |
|
|
|
|
|
|
|
|
|
|
|
|
|
|
|
|
|
San Diego |
|
|
|
|
|
|
|
|
|
|
|
|
|
|
|
|
|
Subtotal - Southern California |
|
|
|
|
|
|
|
|
|
|
|
|
|
|
|
|
|
|
|
|
|
|
|
|
|
|
|
|
|
|
|
|
|
|
|
San Francisco |
|
|
|
|
|
|
|
|
|
|
|
|
|
|
|
|
|
Washington D.C. |
|
|
|
|
|
|
|
|
|
|
|
|
|
|
|
|
|
New York |
|
|
|
|
|
|
|
|
|
|
|
|
|
|
|
|
|
Seattle |
|
|
|
|
|
|
|
|
|
|
|
|
|
|
|
|
|
Boston |
|
|
|
|
|
|
|
|
|
|
|
|
|
|
|
|
|
Denver |
|
|
|
|
|
|
|
|
|
|
|
|
|
|
|
|
|
Total same store |
|
|
|
|
|
|
|
|
|
|
|
|
|
|
|
|
|
|
|
|
|
|
|
|
|
|
|
|
|
|
|
|
|
|
|
Non-same store/other (2) (3) |
|
|
|
|
|
|
|
|
|
|
|
|
|
|
|
|
|
Non-same store |
|
|
|
|
|
|
|
|
|
|
|
|
|
|
|
|
|
Other (3) |
|
|
|
|
|
|
|
|
|
|
|
|
|
|
|
|
|
Total non-same store/other |
|
|
|
|
|
|
|
|
|
|
|
|
|
|
|
|
|
|
|
|
|
|
|
|
|
|
|
|
|
|
|
|
|
|
|
Totals |
|
$ |
|
|
|
$ |
|
|
|
$ |
|
|
|
$ |
|
|
|
(1) |
Same store primarily includes all properties acquired or completed that were stabilized prior to January 1, 2020, less properties subsequently sold, which represented |
|
(2) |
Non-same store primarily includes properties acquired after January 1, 2020, plus any properties in lease-up and not stabilized as of January 1, 2020. |
|
(3) |
Other includes development, other corporate operations and capital expenditures for properties sold. |
|
18. |
Subsequent Events |
Subsequent to December 31, 2021, the Company:
|
|
• |
Acquired |
F-55
EQUITY RESIDENTIAL
ERP OPERATING LIMITED PARTNERSHIP
Schedule III - Real Estate and Accumulated Depreciation
Overall Summary
December 31, 2021
|
|
|
Properties |
|
|
Apartment Units |
|
|
Investment in Real Estate, Gross |
|
|
Accumulated Depreciation |
|
|
Investment in Real Estate, Net |
|
|
Encumbrances (1) |
|
||||||
|
Wholly Owned Unencumbered |
|
|
|
|
|
|
|
|
|
$ |
|
|
|
$ |
( |
) |
|
$ |
|
|
|
$ |
|
|
|
Wholly Owned Encumbered |
|
|
|
|
|
|
|
|
|
|
|
|
|
|
( |
) |
|
|
|
|
|
|
|
|
|
Wholly Owned Properties |
|
|
|
|
|
|
|
|
|
|
|
|
|
|
( |
) |
|
|
|
|
|
|
|
|
|
Partially Owned Unencumbered |
|
|
|
|
|
|
|
|
|
|
|
|
|
|
( |
) |
|
|
|
|
|
|
|
|
|
Partially Owned Encumbered |
|
|
|
|
|
|
|
|
|
|
|
|
|
|
( |
) |
|
|
|
|
|
|
|
|
|
Partially Owned Properties |
|
|
|
|
|
|
|
|
|
|
|
|
|
|
( |
) |
|
|
|
|
|
|
|
|
|
Total Unencumbered Properties |
|
|
|
|
|
|
|
|
|
|
|
|
|
|
( |
) |
|
|
|
|
|
|
|
|
|
Total Encumbered Properties |
|
|
|
|
|
|
|
|
|
|
|
|
|
|
( |
) |
|
|
|
|
|
|
|
|
|
Total Consolidated Investment in Real Estate |
|
|
|
|
|
|
|
|
|
$ |
|
|
|
$ |
( |
) |
|
$ |
|
|
|
$ |
|
|
|
(1) |
See attached Encumbrances Reconciliation. |
S-1
EQUITY RESIDENTIAL
ERP OPERATING LIMITED PARTNERSHIP
Schedule III - Real Estate and Accumulated Depreciation
Encumbrances Reconciliation
December 31, 2021
|
Portfolio/Entity Encumbrances |
|
Number of Properties Encumbered by |
|
|
See Properties With Note: |
|
Amount |
|
||
|
Archstone Master Property Holdings LLC (1) |
|
|
|
|
|
H |
|
$ |
|
|
|
Portfolio/Entity Encumbrances |
|
|
|
|
|
|
|
|
|
|
|
Individual Property Encumbrances |
|
|
|
|
|
|
|
|
|
|
|
Total Encumbrances per Financial Statements |
|
|
|
|
|
|
|
$ |
|
|
(1) Collateral also includes a $
S-2
EQUITY RESIDENTIAL
ERP OPERATING LIMITED PARTNERSHIP
Schedule III – Real Estate and Accumulated Depreciation
(Amounts in thousands)
The changes in total real estate for the years ended December 31, 2021, 2020 and 2019 are as follows:
|
|
|
2021 |
|
|
2020 |
|
|
2019 |
|
|||
|
Balance, beginning of year |
|
$ |
|
|
|
$ |
|
|
|
$ |
|
|
|
Acquisitions and development |
|
|
|
|
|
|
|
|
|
|
|
|
|
Improvements |
|
|
|
|
|
|
|
|
|
|
|
|
|
Dispositions and other |
|
|
( |
) |
|
|
( |
) |
|
|
( |
) |
|
Balance, end of year |
|
$ |
|
|
|
$ |
|
|
|
$ |
|
|
The changes in accumulated depreciation for the years ended December 31, 2021, 2020 and 2019 are as follows:
|
|
|
2021 |
|
|
2020 |
|
|
2019 |
|
|||
|
Balance, beginning of year |
|
$ |
|
|
|
$ |
|
|
|
$ |
|
|
|
Depreciation |
|
|
|
|
|
|
|
|
|
|
|
|
|
Dispositions and other |
|
|
( |
) |
|
|
( |
) |
|
|
( |
) |
|
Balance, end of year |
|
$ |
|
|
|
$ |
|
|
|
$ |
|
|
S-3
EQUITY RESIDENTIAL
ERP OPERATING LIMITED PARTNERSHIP
Schedule III - Real Estate and Accumulated Depreciation
December 31, 2021
|
Description |
|
|
Initial Cost to Company |
|
|
Cost Capitalized Subsequent to Acquisition (Improvements, net) (E) |
|
|
Gross Amount Carried at Close of Period 12/31/21 |
|
|
|
|
|||||||||||||||||||||||||||||||||||
|
Apartment Name |
|
Location |
|
Non-Residential Components |
|
|
Date of Construction |
|
Apartment Units |
|
|
Land |
|
|
Building & Fixtures |
|
|
Building & Fixtures |
|
|
Land |
|
|
Building & Fixtures (A) |
|
|
Total (B) |
|
|
Accumulated Depreciation (C) |
|
|
Investment in Real Estate, Net at 12/31/21 |
|
|
Encumbrances |
|
|||||||||||
|
Wholly Owned Unencumbered: |
|
|
|
|
|
|
|
|
|
|
|
|
|
|
|
|
|
|
|
|
|
|
|
|
|
|
|
|
|
|
|
|
|
|
|
|
|
|
|
|
|
|
|
|
|
|
|
|
|
100 K Apartments (fka 100K Street) |
|
|
|
|
— |
|
|
2018 |
|
|
|
|
|
$ |
|
|
|
$ |
|
|
|
$ |
|
|
|
$ |
|
|
|
$ |
|
|
|
$ |
|
|
|
$ |
( |
) |
|
$ |
|
|
|
$ |
|
|
|
140 Riverside Boulevard |
|
|
|
G |
|
|
2003 |
|
|
|
|
|
|
|
|
|
|
|
|
|
|
|
|
|
|
|
|
|
|
|
|
|
|
|
|
|
|
( |
) |
|
|
|
|
|
|
|
|
|
|
160 Riverside Boulevard |
|
|
|
G |
|
|
2001 |
|
|
|
|
|
|
|
|
|
|
|
|
|
|
|
|
|
|
|
|
|
|
|
|
|
|
|
|
|
|
( |
) |
|
|
|
|
|
|
|
|
|
|
170 Amsterdam |
|
|
|
G |
|
|
2015 |
|
|
|
|
|
|
|
|
|
|
|
|
|
|
|
|
|
|
|
|
|
|
|
|
|
|
|
|
|
|
( |
) |
|
|
|
|
|
|
|
|
|
|
175 Kent |
|
|
|
G |
|
|
2011 |
|
|
|
|
|
|
|
|
|
|
|
|
|
|
|
|
|
|
|
|
|
|
|
|
|
|
|
|
|
|
( |
) |
|
|
|
|
|
|
|
|
|
|
180 Montague (fka Brooklyn Heights) |
|
|
|
G |
|
|
2000 |
|
|
|
|
|
|
|
|
|
|
|
|
|
|
|
|
|
|
|
|
|
|
|
|
|
|
|
|
|
|
( |
) |
|
|
|
|
|
|
|
|
|
|
180 Riverside Boulevard |
|
|
|
G |
|
|
1998 |
|
|
|
|
|
|
|
|
|
|
|
|
|
|
|
|
|
|
|
|
|
|
|
|
|
|
|
|
|
|
( |
) |
|
|
|
|
|
|
|
|
|
|
1210 Mass |
|
|
|
G |
|
|
2004 |
|
|
|
|
|
|
|
|
|
|
|
|
|
|
|
|
|
|
|
|
|
|
|
|
|
|
|
|
|
|
( |
) |
|
|
|
|
|
|
|
|
|
|
1401 Joyce on Pentagon Row |
|
|
|
|
— |
|
|
2004 |
|
|
|
|
|
|
|
|
|
|
|
|
|
|
|
|
|
|
|
|
|
|
|
|
|
|
|
|
|
|
( |
) |
|
|
|
|
|
|
|
|
|
1500 Mass Ave |
|
|
|
G |
|
|
1951 |
|
|
|
|
|
|
|
|
|
|
|
|
|
|
|
|
|
|
|
|
|
|
|
|
|
|
|
|
|
|
( |
) |
|
|
|
|
|
|
|
|
|
|
1800 Oak (fka Rosslyn) |
|
|
|
G |
|
|
2003 |
|
|
|
|
|
|
|
|
|
|
|
|
|
|
|
|
|
|
|
|
|
|
|
|
|
|
|
|
|
|
( |
) |
|
|
|
|
|
|
|
|
|
|
2201 Pershing Drive |
|
|
|
G |
|
|
2012 |
|
|
|
|
|
|
|
|
|
|
|
|
|
|
|
|
|
|
|
|
|
|
|
|
|
|
|
|
|
|
( |
) |
|
|
|
|
|
|
|
|
|
|
2201 Wilson |
|
|
|
G |
|
|
2000 |
|
|
|
|
|
|
|
|
|
|
|
|
|
|
|
|
|
|
|
|
|
|
|
|
|
|
|
|
|
|
( |
) |
|
|
|
|
|
|
|
|
|
|
2400 M St |
|
|
|
G |
|
|
2006 |
|
|
|
|
|
|
|
|
|
|
|
|
|
|
|
|
|
|
|
|
|
|
|
|
|
|
|
|
|
|
( |
) |
|
|
|
|
|
|
|
|
|
|
315 on A |
|
|
|
G |
|
|
2013 |
|
|
|
|
|
|
|
|
|
|
|
|
|
|
|
|
|
|
|
|
|
|
|
|
|
|
|
|
|
|
( |
) |
|
|
|
|
|
|
|
|
|
|
340 Fremont (fka Rincon Hill) |
|
|
|
|
— |
|
|
2016 |
|
|
|
|
|
|
|
|
|
|
|
|
|
|
|
|
|
|
|
|
|
|
|
|
|
|
|
|
|
|
( |
) |
|
|
|
|
|
|
|
|
|
341 Nevins |
|
|
|
|
— |
|
|
(F) |
|
|
|
|
|
|
|
|
|
|
|
|
|
|
|
|
|
|
|
|
|
|
|
|
|
|
|
|
|
|
|
|
|
|
|
|
|
|
|
|
|
3003 Van Ness (fka Van Ness) |
|
|
|
|
— |
|
|
1970 |
|
|
|
|
|
|
|
|
|
|
|
|
|
|
|
|
|
|
|
|
|
|
|
|
|
|
|
|
|
|
( |
) |
|
|
|
|
|
|
|
|
|
425 Mass |
|
|
|
G |
|
|
2009 |
|
|
|
|
|
|
|
|
|
|
|
|
|
|
|
|
|
|
|
|
|
|
|
|
|
|
|
|
|
|
( |
) |
|
|
|
|
|
|
|
|
|
|
455 Eye Street |
|
|
|
G |
|
|
2017 |
|
|
|
|
|
|
|
|
|
|
|
|
|
|
|
|
|
|
|
|
|
|
|
|
|
|
|
|
|
|
( |
) |
|
|
|
|
|
|
|
|
|
|
4th and Hill |
|
|
|
|
— |
|
|
(F) |
|
|
|
|
|
|
|
|
|
|
|
|
|
|
|
|
|
|
|
|
|
|
|
|
|
|
|
|
|
|
|
|
|
|
|
|
|
|
|
|
|
55 West Fifth I & II (fka Townhouse Plaza and Gardens) |
|
|
|
|
— |
|
|
1964/1972 |
|
|
|
|
|
|
|
|
|
|
|
|
|
|
|
|
|
|
|
|
|
|
|
|
|
|
|
|
|
|
( |
) |
|
|
|
|
|
|
|
|
|
600 Washington |
|
|
|
G |
|
|
2004 |
|
|
|
|
|
|
|
|
|
|
|
|
|
|
|
|
|
|
|
|
|
|
|
|
|
|
|
|
|
|
( |
) |
|
|
|
|
|
|
|
|
|
|
660 Washington (fka Boston Common) |
|
|
|
G |
|
|
2006 |
|
|
|
|
|
|
|
|
|
|
|
|
|
|
|
|
|
|
|
|
|
|
|
|
|
|
|
|
|
|
( |
) |
|
|
|
|
|
|
|
|
|
|
70 Greene |
|
|
|
G |
|
|
2010 |
|
|
|
|
|
|
|
|
|
|
|
|
|
|
|
|
|
|
|
|
|
|
|
|
|
|
|
|
|
|
( |
) |
|
|
|
|
|
|
|
|
|
|
71 Broadway |
|
|
|
G |
|
|
1997 |
|
|
|
|
|
|
|
|
|
|
|
|
|
|
|
|
|
|
|
|
|
|
|
|
|
|
|
|
|
|
( |
) |
|
|
|
|
|
|
|
|
|
|
77 Bluxome |
|
|
|
|
— |
|
|
2007 |
|
|
|
|
|
|
|
|
|
|
|
|
|
|
|
|
|
|
|
|
|
|
|
|
|
|
|
|
|
|
( |
) |
|
|
|
|
|
|
|
|
|
77 Park Avenue (fka Hoboken) |
|
|
|
G |
|
|
2000 |
|
|
|
|
|
|
|
|
|
|
|
|
|
|
|
|
|
|
|
|
|
|
|
|
|
|
|
|
|
|
( |
) |
|
|
|
|
|
|
|
|
|
|
777 Sixth |
|
|
|
G |
|
|
2002 |
|
|
|
|
|
|
|
|
|
|
|
|
|
|
|
|
|
|
|
|
|
|
|
|
|
|
|
|
|
|
( |
) |
|
|
|
|
|
|
|
|
|
|
88 Hillside |
|
|
|
G |
|
|
2011 |
|
|
|
|
|
|
|
|
|
|
|
|
|
|
|
|
|
|
|
|
|
|
|
|
|
|
|
|
|
|
( |
) |
|
|
|
|
|
|
|
|
|
|
855 Brannan |
|
|
|
G |
|
|
2018 |
|
|
|
|
|
|
|
|
|
|
|
|
|
|
|
|
|
|
|
|
|
|
|
|
|
|
|
|
|
|
( |
) |
|
|
|
|
|
|
|
|
|
|
929 Mass (fka 929 House) |
|
|
|
G |
|
|
1975 |
|
|
|
|
|
|
|
|
|
|
|
|
|
|
|
|
|
|
|
|
|
|
|
|
|
|
|
|
|
|
( |
) |
|
|
|
|
|
|
|
|
|
|
Academy Village |
|
|
|
|
— |
|
|
1989 |
|
|
|
|
|
|
|
|
|
|
|
|
|
|
|
|
|
|
|
|
|
|
|
|
|
|
|
|
|
|
( |
) |
|
|
|
|
|
|
|
|
|
Acappella |
|
|
|
|
— |
|
|
2002 |
|
|
|
|
|
|
|
|
|
|
|
|
|
|
|
|
|
|
|
|
|
|
|
|
|
|
|
|
|
|
( |
) |
|
|
|
|
|
|
|
|
|
Alban Towers |
|
|
|
|
— |
|
|
1934 |
|
|
|
|
|
|
|
|
|
|
|
|
|
|
|
|
|
|
|
|
|
|
|
|
|
|
|
|
|
|
( |
) |
|
|
|
|
|
|
|
|
|
Alborada |
|
|
|
|
— |
|
|
1999 |
|
|
|
|
|
|
|
|
|
|
|
|
|
|
|
|
|
|
|
|
|
|
|
|
|
|
|
|
|
|
( |
) |
|
|
|
|
|
|
|
|
|
Alcott Apartments (fka West End Tower) |
|
|
|
G |
|
|
2021 |
|
|
|
|
|
|
|
|
|
|
|
|
|
|
|
|
|
|
|
|
|
|
|
|
|
|
|
|
|
|
( |
) |
|
|
|
|
|
|
|
|
|
|
Altitude (fka Village at Howard Hughes, The (Lots 1 & 2)) |
|
|
|
|
— |
|
|
2016 |
|
|
|
|
|
|
|
|
|
|
|
|
|
|
|
|
|
|
|
|
|
|
|
|
|
|
|
|
|
|
( |
) |
|
|
|
|
|
|
|
|
|
Alton, The (fka Millikan) |
|
|
|
|
— |
|
|
2017 |
|
|
|
|
|
|
|
|
|
|
|
|
|
|
|
|
|
|
|
|
|
|
|
|
|
|
|
|
|
|
( |
) |
|
|
|
|
|
|
|
|
|
Arbor Terrace |
|
|
|
|
— |
|
|
1979 |
|
|
|
|
|
|
|
|
|
|
|
|
|
|
|
|
|
|
|
|
|
|
|
|
|
|
|
|
|
|
( |
) |
|
|
|
|
|
|
|
|
|
Arches, The |
|
|
|
|
— |
|
|
1974 |
|
|
|
|
|
|
|
|
|
|
|
|
|
|
|
|
|
|
|
|
|
|
|
|
|
|
|
|
|
|
( |
) |
|
|
|
|
|
|
|
|
|
Artisan on Second |
|
|
|
|
— |
|
|
2008 |
|
|
|
|
|
|
|
|
|
|
|
|
|
|
|
|
|
|
|
|
|
|
|
|
|
|
|
|
|
|
( |
) |
|
|
|
|
|
|
|
|
S-4
EQUITY RESIDENTIAL
ERP OPERATING LIMITED PARTNERSHIP
Schedule III - Real Estate and Accumulated Depreciation
December 31, 2021
|
Description |
|
|
Initial Cost to Company |
|
|
Cost Capitalized Subsequent to Acquisition (Improvements, net) (E) |
|
|
Gross Amount Carried at Close of Period 12/31/21 |
|
|
|
|
|||||||||||||||||||||||||||||||||||
|
Apartment Name |
|
Location |
|
Non-Residential Components |
|
|
Date of Construction |
|
Apartment Units |
|
|
Land |
|
|
Building & Fixtures |
|
|
Building & Fixtures |
|
|
Land |
|
|
Building & Fixtures (A) |
|
|
Total (B) |
|
|
Accumulated Depreciation (C) |
|
|
Investment in Real Estate, Net at 12/31/21 |
|
|
Encumbrances |
|
|||||||||||
|
Artistry Emeryville (fka Emeryville) |
|
|
|
|
— |
|
|
1994 |
|
|
|
|
|
|
|
|
|
|
|
|
|
|
|
|
|
|
|
|
|
|
|
|
|
|
|
|
|
|
( |
) |
|
|
|
|
|
|
|
|
|
Atelier |
|
|
|
G |
|
|
2015 |
|
|
|
|
|
|
|
|
|
|
|
|
|
|
|
|
|
|
|
|
|
|
|
|
|
|
|
|
|
|
( |
) |
|
|
|
|
|
|
|
|
|
|
Avenue Two |
|
|
|
|
— |
|
|
1972 |
|
|
|
|
|
|
|
|
|
|
|
|
|
|
|
|
|
|
|
|
|
|
|
|
|
|
|
|
|
|
( |
) |
|
|
|
|
|
|
|
|
|
Axis at Shady Grove |
|
|
|
|
— |
|
|
2016 |
|
|
|
|
|
|
|
|
|
|
|
|
|
|
|
|
|
|
|
|
|
|
|
|
|
|
|
|
|
|
( |
) |
|
|
|
|
|
|
|
|
|
Azure (fka Mission Bay-Block 13) |
|
|
|
|
— |
|
|
2015 |
|
|
|
|
|
|
|
|
|
|
|
|
|
|
|
|
|
|
|
|
|
|
|
|
|
|
|
|
|
|
( |
) |
|
|
|
|
|
|
|
|
|
Bay Hill |
|
|
|
|
— |
|
|
2002 |
|
|
|
|
|
|
|
|
|
|
|
|
|
|
|
|
|
|
|
|
|
|
|
|
|
|
|
|
|
|
( |
) |
|
|
|
|
|
|
|
|
|
Beatrice, The |
|
|
|
|
— |
|
|
2010 |
|
|
|
|
|
|
|
|
|
|
|
|
|
|
|
|
|
|
|
|
|
|
|
|
|
|
|
|
|
|
( |
) |
|
|
|
|
|
|
|
|
|
Bella Vista I, II, III Combined |
|
|
|
|
— |
|
|
2003-2007 |
|
|
|
|
|
|
|
|
|
|
|
|
|
|
|
|
|
|
|
|
|
|
|
|
|
|
|
|
|
|
( |
) |
|
|
|
|
|
|
|
|
|
Belle Arts Condominium Homes, LLC |
|
|
|
|
— |
|
|
2000 |
|
|
|
|
|
|
|
|
|
|
|
|
|
|
|
|
|
|
|
|
|
|
|
|
|
|
|
|
|
|
( |
) |
|
|
|
|
|
|
|
|
|
Belle Fontaine |
|
|
|
|
— |
|
|
2003 |
|
|
|
|
|
|
|
|
|
|
|
|
|
|
|
|
|
|
|
|
|
|
|
|
|
|
|
|
|
|
( |
) |
|
|
|
|
|
|
|
|
|
Breakwater at Marina Del Rey |
|
|
|
|
— |
|
|
1964-1969 |
|
|
|
|
|
|
|
|
|
|
|
|
|
|
|
|
|
|
|
|
|
|
|
|
|
|
|
|
|
|
( |
) |
|
|
|
|
|
|
|
|
|
Briarwood (CA) |
|
|
|
|
— |
|
|
1985 |
|
|
|
|
|
|
|
|
|
|
|
|
|
|
|
|
|
|
|
|
|
|
|
|
|
|
|
|
|
|
( |
) |
|
|
|
|
|
|
|
|
|
Brodie, The |
|
|
|
|
— |
|
|
2016 |
|
|
|
|
|
|
|
|
|
|
|
|
|
|
|
|
|
|
|
|
|
|
|
|
|
|
|
|
|
|
( |
) |
|
|
|
|
|
|
|
|
|
Brooklyner, The (fka 111 Lawrence) |
|
|
|
G |
|
|
2010 |
|
|
|
|
|
|
|
|
|
|
|
|
|
|
|
|
|
|
|
|
|
|
|
|
|
|
|
|
|
|
( |
) |
|
|
|
|
|
|
|
|
|
|
C on Pico |
|
|
|
|
— |
|
|
2014 |
|
|
|
|
|
|
|
|
|
|
|
|
|
|
|
|
|
|
|
|
|
|
|
|
|
|
|
|
|
|
( |
) |
|
|
|
|
|
|
|
|
|
Carlyle Mill |
|
|
|
|
— |
|
|
2002 |
|
|
|
|
|
|
|
|
|
|
|
|
|
|
|
|
|
|
|
|
|
|
|
|
|
|
|
|
|
|
( |
) |
|
|
|
|
|
|
|
|
|
Carmel Terrace |
|
|
|
|
— |
|
|
1988-1989 |
|
|
|
|
|
|
|
|
|
|
|
|
|
|
|
|
|
|
|
|
|
|
|
|
|
|
|
|
|
|
( |
) |
|
|
|
|
|
|
|
|
|
Cascade |
|
|
|
G |
|
|
2017 |
|
|
|
|
|
|
|
|
|
|
|
|
|
|
|
|
|
|
|
|
|
|
|
|
|
|
|
|
|
|
( |
) |
|
|
|
|
|
|
|
|
|
|
Centennial (fka Centennial Court & Centennial Tower) |
|
|
|
G |
|
|
1991/2001 |
|
|
|
|
|
|
|
|
|
|
|
|
|
|
|
|
|
|
|
|
|
|
|
|
|
|
|
|
|
|
( |
) |
|
|
|
|
|
|
|
|
|
|
Centre Club Combined |
|
|
|
|
— |
|
|
1994 & 2002 |
|
|
|
|
|
|
|
|
|
|
|
|
|
|
|
|
|
|
|
|
|
|
|
|
|
|
|
|
|
|
( |
) |
|
|
|
|
|
|
|
|
|
Chelsea Square |
|
|
|
|
— |
|
|
1991 |
|
|
|
|
|
|
|
|
|
|
|
|
|
|
|
|
|
|
|
|
|
|
|
|
|
|
|
|
|
|
( |
) |
|
|
|
|
|
|
|
|
|
Chloe on Madison (fka 1401 E. Madison) |
|
|
|
G |
|
|
2019 |
|
|
|
|
|
|
|
|
|
|
|
|
|
|
|
|
|
|
|
|
|
|
|
|
|
|
|
|
|
|
( |
) |
|
|
|
|
|
|
|
|
|
|
Chloe on Union (fka Chloe) |
|
|
|
G |
|
|
2010 |
|
|
|
|
|
|
|
|
|
|
|
|
|
|
|
|
|
|
|
|
|
|
|
|
|
|
|
|
|
|
( |
) |
|
|
|
|
|
|
|
|
|
|
Church Corner |
|
|
|
G |
|
|
1987 |
|
|
|
|
|
|
|
|
|
|
|
|
|
|
|
|
|
|
|
|
|
|
|
|
|
|
|
|
|
|
( |
) |
|
|
|
|
|
|
|
|
|
|
Circa Fitzsimons |
|
|
|
|
— |
|
|
2020 |
|
|
|
|
|
|
|
|
|
|
|
|
|
|
|
|
|
|
|
|
|
|
|
|
|
|
|
|
|
|
( |
) |
|
|
|
|
|
|
|
|
|
City Gate at Cupertino (fka Cupertino) |
|
|
|
|
— |
|
|
1998 |
|
|
|
|
|
|
|
|
|
|
|
|
|
|
|
|
|
|
|
|
|
|
|
|
|
|
|
|
|
|
( |
) |
|
|
|
|
|
|
|
|
|
City Square Bellevue (fka Bellevue) |
|
|
|
G |
|
|
1998 |
|
|
|
|
|
|
|
|
|
|
|
|
|
|
|
|
|
|
|
|
|
|
|
|
|
|
|
|
|
|
( |
) |
|
|
|
|
|
|
|
|
|
|
Clarendon, The |
|
|
|
G |
|
|
2005 |
|
|
|
|
|
|
|
|
|
|
|
|
|
|
|
|
|
|
|
|
|
|
|
|
|
|
|
|
|
|
( |
) |
|
|
|
|
|
|
|
|
|
|
Cleo, The |
|
|
|
|
— |
|
|
1989 |
|
|
|
|
|
|
|
|
|
|
|
|
|
|
|
|
|
|
|
|
|
|
|
|
|
|
|
|
|
|
( |
) |
|
|
|
|
|
|
|
|
|
Connecticut Heights |
|
|
|
|
— |
|
|
1974 |
|
|
|
|
|
|
|
|
|
|
|
|
|
|
|
|
|
|
|
|
|
|
|
|
|
|
|
|
|
|
( |
) |
|
|
|
|
|
|
|
|
|
Corcoran House at DuPont Circle (fka DuPont Circle) |
|
|
|
G |
|
|
1961 |
|
|
|
|
|
|
|
|
|
|
|
|
|
|
|
|
|
|
|
|
|
|
|
|
|
|
|
|
|
|
( |
) |
|
|
|
|
|
|
|
|
|
|
Courthouse Plaza |
|
|
|
G |
|
|
1990 |
|
|
|
|
|
|
|
|
|
|
|
|
|
|
|
|
|
|
|
|
|
|
|
|
|
|
|
|
|
|
( |
) |
|
|
|
|
|
|
|
|
|
|
Creekside (San Mateo) |
|
|
|
|
— |
|
|
1985 |
|
|
|
|
|
|
|
|
|
|
|
|
|
|
|
|
|
|
|
|
|
|
|
|
|
|
|
|
|
|
( |
) |
|
|
|
|
|
|
|
|
|
Cronins Landing |
|
|
|
G |
|
|
1998 |
|
|
|
|
|
|
|
|
|
|
|
|
|
|
|
|
|
|
|
|
|
|
|
|
|
|
|
|
|
|
( |
) |
|
|
|
|
|
|
|
|
|
|
Crystal Place |
|
|
|
|
— |
|
|
1986 |
|
|
|
|
|
|
|
|
|
|
|
|
|
|
|
|
|
|
|
|
|
|
|
|
|
|
|
|
|
|
( |
) |
|
|
|
|
|
|
|
|
|
Dalton, The |
|
|
|
G |
|
|
2018 |
|
|
|
|
|
|
|
|
|
|
|
|
|
|
|
|
|
|
|
|
|
|
|
|
|
|
|
|
|
|
( |
) |
|
|
|
|
|
|
|
|
|
|
Deerwood (SD) |
|
|
|
|
— |
|
|
1990 |
|
|
|
|
|
|
|
|
|
|
|
|
|
|
|
|
|
|
|
|
|
|
|
|
|
|
|
|
|
|
( |
) |
|
|
|
|
|
|
|
|
|
Del Mar Ridge |
|
|
|
|
— |
|
|
1998 |
|
|
|
|
|
|
|
|
|
|
|
|
|
|
|
|
|
|
|
|
|
|
|
|
|
|
|
|
|
|
( |
) |
|
|
|
|
|
|
|
|
|
Eagle Canyon |
|
|
|
|
— |
|
|
1985 |
|
|
|
|
|
|
|
|
|
|
|
|
|
|
|
|
|
|
|
|
|
|
|
|
|
|
|
|
|
|
( |
) |
|
|
|
|
|
|
|
|
|
Edge, The (fka 4885 Edgemoor Lane) |
|
|
|
|
— |
|
|
2021 |
|
|
|
|
|
|
|
|
|
|
|
|
|
|
|
|
|
|
|
|
|
|
|
|
|
|
|
|
|
|
( |
) |
|
|
|
|
|
|
|
|
|
Edgemont at Bethesda Metro |
|
|
|
|
— |
|
|
1989 |
|
|
|
|
|
|
|
|
|
|
|
|
|
|
|
|
|
|
|
|
|
|
|
|
|
|
|
|
|
|
( |
) |
|
|
|
|
|
|
|
|
|
Emerson Place |
|
|
|
G |
|
|
1962 |
|
|
|
|
|
|
|
|
|
|
|
|
|
|
|
|
|
|
|
|
|
|
|
|
|
|
|
|
|
|
( |
) |
|
|
|
|
|
|
|
|
|
|
Encore at Sherman Oaks, The |
|
|
|
|
— |
|
|
1988 |
|
|
|
|
|
|
|
|
|
|
|
|
|
|
|
|
|
|
|
|
|
|
|
|
|
|
|
|
|
|
( |
) |
|
|
|
|
|
|
|
|
|
Eviva on Cherokee |
|
|
|
|
— |
|
|
2017 |
|
|
|
|
|
|
|
|
|
|
|
|
|
|
|
|
|
|
|
|
|
|
|
|
|
|
|
|
|
|
( |
) |
|
|
|
|
|
|
|
|
S-5
EQUITY RESIDENTIAL
ERP OPERATING LIMITED PARTNERSHIP
Schedule III - Real Estate and Accumulated Depreciation
December 31, 2021
|
Description |
|
|
Initial Cost to Company |
|
|
Cost Capitalized Subsequent to Acquisition (Improvements, net) (E) |
|
|
Gross Amount Carried at Close of Period 12/31/21 |
|
|
|
|
|||||||||||||||||||||||||||||||||||
|
Apartment Name |
|
Location |
|
Non-Residential Components |
|
|
Date of Construction |
|
Apartment Units |
|
|
Land |
|
|
Building & Fixtures |
|
|
Building & Fixtures |
|
|
Land |
|
|
Building & Fixtures (A) |
|
|
Total (B) |
|
|
Accumulated Depreciation (C) |
|
|
Investment in Real Estate, Net at 12/31/21 |
|
|
Encumbrances |
|
|||||||||||
|
Flora |
|
|
|
|
— |
|
|
2019 |
|
|
|
|
|
|
|
|
|
|
|
|
|
|
|
|
|
|
|
|
|
|
|
|
|
|
|
|
|
|
( |
) |
|
|
|
|
|
|
|
|
|
Fremont Center |
|
|
|
G |
|
|
2002 |
|
|
|
|
|
|
|
|
|
|
|
|
|
|
|
|
|
|
|
|
|
|
|
|
|
|
|
|
|
|
( |
) |
|
|
|
|
|
|
|
|
|
|
Gaithersburg Station |
|
|
|
G |
|
|
2013 |
|
|
|
|
|
|
|
|
|
|
|
|
|
|
|
|
|
|
|
|
|
|
|
|
|
|
|
|
|
|
( |
) |
|
|
|
|
|
|
|
|
|
|
Gateway at Malden Center |
|
|
|
G |
|
|
1988 |
|
|
|
|
|
|
|
|
|
|
|
|
|
|
|
|
|
|
|
|
|
|
|
|
|
|
|
|
|
|
( |
) |
|
|
|
|
|
|
|
|
|
|
Geary Court Yard |
|
|
|
|
— |
|
|
1990 |
|
|
|
|
|
|
|
|
|
|
|
|
|
|
|
|
|
|
|
|
|
|
|
|
|
|
|
|
|
|
( |
) |
|
|
|
|
|
|
|
|
|
Girard |
|
|
|
G |
|
|
2016 |
|
|
|
|
|
|
|
|
|
|
|
|
|
|
|
|
|
|
|
|
|
|
|
|
|
|
|
|
|
|
( |
) |
|
|
|
|
|
|
|
|
|
|
Hampshire Place |
|
|
|
|
— |
|
|
1989 |
|
|
|
|
|
|
|
|
|
|
|
|
|
|
|
|
|
|
|
|
|
|
|
|
|
|
|
|
|
|
( |
) |
|
|
|
|
|
|
|
|
|
Harbor Steps |
|
|
|
G |
|
|
2000 |
|
|
|
|
|
|
|
|
|
|
|
|
|
|
|
|
|
|
|
|
|
|
|
|
|
|
|
|
|
|
( |
) |
|
|
|
|
|
|
|
|
|
|
Hathaway |
|
|
|
|
— |
|
|
1987 |
|
|
|
|
|
|
|
|
|
|
|
|
|
|
|
|
|
|
|
|
|
|
|
|
|
|
|
|
|
|
( |
) |
|
|
|
|
|
|
|
|
|
Helios (fka 2nd+Pine) |
|
|
|
G |
|
|
2017 |
|
|
|
|
|
|
|
|
|
|
|
|
|
|
|
|
|
|
|
|
|
|
|
|
|
|
|
|
|
|
( |
) |
|
|
|
|
|
|
|
|
|
|
Heritage at Stone Ridge |
|
|
|
|
— |
|
|
2005 |
|
|
|
|
|
|
|
|
|
|
|
|
|
|
|
|
|
|
|
|
|
|
|
|
|
|
|
|
|
|
( |
) |
|
|
|
|
|
|
|
|
|
Heritage Ridge |
|
|
|
|
— |
|
|
1999 |
|
|
|
|
|
|
|
|
|
|
|
|
|
|
|
|
|
|
|
|
|
|
|
|
|
|
|
|
|
|
( |
) |
|
|
|
|
|
|
|
|
|
Hesby |
|
|
|
|
— |
|
|
2013 |
|
|
|
|
|
|
|
|
|
|
|
|
|
|
|
|
|
|
|
|
|
|
|
|
|
|
|
|
|
|
( |
) |
|
|
|
|
|
|
|
|
|
Highlands at South Plainfield |
|
|
|
|
— |
|
|
2000 |
|
|
|
|
|
|
|
|
|
|
|
|
|
|
|
|
|
|
|
|
|
|
|
|
|
|
|
|
|
|
( |
) |
|
|
|
|
|
|
|
|
|
Hikari |
|
|
|
G |
|
|
2007 |
|
|
|
|
|
|
|
|
|
|
|
|
|
|
|
|
|
|
|
|
|
|
|
|
|
|
|
|
|
|
( |
) |
|
|
|
|
|
|
|
|
|
|
Hudson Crossing |
|
|
|
G |
|
|
2003 |
|
|
|
|
|
|
|
|
|
|
|
|
|
|
|
|
|
|
|
|
|
|
|
|
|
|
|
|
|
|
( |
) |
|
|
|
|
|
|
|
|
|
|
Hudson Pointe |
|
|
|
|
— |
|
|
2003 |
|
|
|
|
|
|
|
|
|
|
|
|
|
|
|
|
|
|
|
|
|
|
|
|
|
|
|
|
|
|
( |
) |
|
|
|
|
|
|
|
|
|
Huxley, The |
|
|
|
|
— |
|
|
2018 |
|
|
|
|
|
|
|
|
|
|
|
|
|
|
|
|
|
|
|
|
|
|
|
|
|
|
|
|
|
|
( |
) |
|
|
|
|
|
|
|
|
|
Indie Deep Ellum |
|
|
|
G |
|
|
2020 |
|
|
|
|
|
|
|
|
|
|
|
|
|
|
|
|
|
|
|
|
|
|
|
|
|
|
|
|
|
|
( |
) |
|
|
|
|
|
|
|
|
|
|
Ivory Wood |
|
|
|
|
— |
|
|
2000 |
|
|
|
|
|
|
|
|
|
|
|
|
|
|
|
|
|
|
|
|
|
|
|
|
|
|
|
|
|
|
( |
) |
|
|
|
|
|
|
|
|
|
Jia (fka Chinatown Gateway) |
|
|
|
G |
|
|
2014 |
|
|
|
|
|
|
|
|
|
|
|
|
|
|
|
|
|
|
|
|
|
|
|
|
|
|
|
|
|
|
( |
) |
|
|
|
|
|
|
|
|
|
|
Junction 47 (fka West Seattle) |
|
|
|
G |
|
|
2015 |
|
|
|
|
|
|
|
|
|
|
|
|
|
|
|
|
|
|
|
|
|
|
|
|
|
|
|
|
|
|
( |
) |
|
|
|
|
|
|
|
|
|
|
Juniper Sandy Springs |
|
|
|
|
— |
|
|
2017 |
|
|
|
|
|
|
|
|
|
|
|
|
|
|
|
|
|
|
|
|
|
|
|
|
|
|
|
|
|
|
( |
) |
|
|
|
|
|
|
|
|
|
Kelvin, The (fka Modera) |
|
|
|
|
— |
|
|
2015 |
|
|
|
|
|
|
|
|
|
|
|
|
|
|
|
|
|
|
|
|
|
|
|
|
|
|
|
|
|
|
( |
) |
|
|
|
|
|
|
|
|
|
Kilby |
|
|
|
|
— |
|
|
2020 |
|
|
|
|
|
|
|
|
|
|
|
|
|
|
|
|
|
|
|
|
|
|
|
|
|
|
|
|
|
|
( |
) |
|
|
|
|
|
|
|
|
|
Laguna Clara |
|
|
|
|
— |
|
|
1972 |
|
|
|
|
|
|
|
|
|
|
|
|
|
|
|
|
|
|
|
|
|
|
|
|
|
|
|
|
|
|
( |
) |
|
|
|
|
|
|
|
|
|
Laguna Clara II |
|
|
|
|
— |
|
|
(F) |
|
|
|
|
|
|
|
|
|
|
|
|
|
|
|
|
|
|
|
|
|
|
|
|
|
|
|
|
|
|
|
|
|
|
|
|
|
|
|
|
|
Landings at Port Imperial |
|
|
|
|
— |
|
|
1999 |
|
|
|
|
|
|
|
|
|
|
|
|
|
|
|
|
|
|
|
|
|
|
|
|
|
|
|
|
|
|
( |
) |
|
|
|
|
|
|
|
|
|
Lane |
|
|
|
G |
|
|
2019 |
|
|
|
|
|
|
|
|
|
|
|
|
|
|
|
|
|
|
|
|
|
|
|
|
|
|
|
|
|
|
( |
) |
|
|
|
|
|
|
|
|
|
|
Lex, The |
|
|
|
|
— |
|
|
2017 |
|
|
|
|
|
|
|
|
|
|
|
|
|
|
|
|
|
|
|
|
|
|
|
|
|
|
|
|
|
|
( |
) |
|
|
|
|
|
|
|
|
|
Liberty Park |
|
|
|
|
— |
|
|
2000 |
|
|
|
|
|
|
|
|
|
|
|
|
|
|
|
|
|
|
|
|
|
|
|
|
|
|
|
|
|
|
( |
) |
|
|
|
|
|
|
|
|
|
Liberty Tower |
|
|
|
G |
|
|
2008 |
|
|
|
|
|
|
|
|
|
|
|
|
|
|
|
|
|
|
|
|
|
|
|
|
|
|
|
|
|
|
( |
) |
|
|
|
|
|
|
|
|
|
|
Lincoln Heights |
|
|
|
|
— |
|
|
1991 |
|
|
|
|
|
|
|
|
|
|
|
|
|
|
|
|
|
|
|
|
|
|
|
|
|
|
|
|
|
|
( |
) |
|
|
|
|
|
|
|
|
|
Lofts at Kendall Square (fka Kendall Square) |
|
|
|
|
— |
|
|
1998 |
|
|
|
|
|
|
|
|
|
|
|
|
|
|
|
|
|
|
|
|
|
|
|
|
|
|
|
|
|
|
( |
) |
|
|
|
|
|
|
|
|
|
Lofts at Kendall Square ll (fka 249 Third Street) |
|
|
|
G |
|
|
2019 |
|
|
|
|
|
|
|
|
|
|
|
|
|
|
|
|
|
|
|
|
|
|
|
|
|
|
|
|
|
|
( |
) |
|
|
|
|
|
|
|
|
|
|
Longacre House |
|
|
|
G |
|
|
2000 |
|
|
|
|
|
|
|
|
|
|
|
|
|
|
|
|
|
|
|
|
|
|
|
|
|
|
|
|
|
|
( |
) |
|
|
|
|
|
|
|
|
|
|
Longfellow Place |
|
|
|
G |
|
|
1975 |
|
|
|
|
|
|
|
|
|
|
|
|
|
|
|
|
|
|
|
|
|
|
|
|
|
|
|
|
|
|
( |
) |
|
|
|
|
|
|
|
|
|
|
Luna Upper Westside |
|
|
|
|
— |
|
|
2020 |
|
|
|
|
|
|
|
|
|
|
|
|
|
|
|
|
|
|
|
|
|
|
|
|
|
|
|
|
|
|
( |
) |
|
|
|
|
|
|
|
|
|
Madox |
|
|
|
G |
|
|
2013 |
|
|
|
|
|
|
|
|
|
|
|
|
|
|
|
|
|
|
|
|
|
|
|
|
|
|
|
|
|
|
( |
) |
|
|
|
|
|
|
|
|
|
|
Mantena |
|
|
|
G |
|
|
2012 |
|
|
|
|
|
|
|
|
|
|
|
|
|
|
|
|
|
|
|
|
|
|
|
|
|
|
|
|
|
|
( |
) |
|
|
|
|
|
|
|
|
|
|
Marina 41 (fka Marina Del Rey) |
|
|
|
|
— |
|
|
1973 |
|
|
|
|
|
|
|
|
|
|
|
|
|
|
|
|
|
|
|
|
|
|
|
|
|
|
|
|
|
|
( |
) |
|
|
|
|
|
|
|
|
|
Mariposa at Playa Del Rey (fka Playa Del Rey) |
|
|
|
|
— |
|
|
2004 |
|
|
|
|
|
|
|
|
|
|
|
|
|
|
|
|
|
|
|
|
|
|
|
|
|
|
|
|
|
|
( |
) |
|
|
|
|
|
|
|
|
|
Mark on 8th |
|
|
|
G |
|
|
2016 |
|
|
|
|
|
|
|
|
|
|
|
|
|
|
|
|
|
|
|
|
|
|
|
|
|
|
|
|
|
|
( |
) |
|
|
|
|
|
|
|
|
|
S-6
EQUITY RESIDENTIAL
ERP OPERATING LIMITED PARTNERSHIP
Schedule III - Real Estate and Accumulated Depreciation
December 31, 2021
|
Description |
|
|
Initial Cost to Company |
|
|
Cost Capitalized Subsequent to Acquisition (Improvements, net) (E) |
|
|
Gross Amount Carried at Close of Period 12/31/21 |
|
|
|
|
|||||||||||||||||||||||||||||||||||
|
Apartment Name |
|
Location |
|
Non-Residential Components |
|
|
Date of Construction |
|
Apartment Units |
|
|
Land |
|
|
Building & Fixtures |
|
|
Building & Fixtures |
|
|
Land |
|
|
Building & Fixtures (A) |
|
|
Total (B) |
|
|
Accumulated Depreciation (C) |
|
|
Investment in Real Estate, Net at 12/31/21 |
|
|
Encumbrances |
|
|||||||||||
|
Market Street Village |
|
|
|
|
— |
|
|
2006 |
|
|
|
|
|
|
|
|
|
|
|
|
|
|
|
|
|
|
|
|
|
|
|
|
|
|
|
|
|
|
( |
) |
|
|
|
|
|
|
|
|
|
Marlowe (fka Oakwood Crystal City) |
|
|
|
|
— |
|
|
1987 |
|
|
|
|
|
|
|
|
|
|
|
|
|
|
|
|
|
|
|
|
|
|
|
|
|
|
|
|
|
|
( |
) |
|
|
|
|
|
|
|
|
|
Milano Lofts |
|
|
|
G |
|
|
1925/2006 |
|
|
|
|
|
|
|
|
|
|
|
|
|
|
|
|
|
|
|
|
|
|
|
|
|
|
|
|
|
|
( |
) |
|
|
|
|
|
|
|
|
|
|
Mill Creek |
|
|
|
|
— |
|
|
1991 |
|
|
|
|
|
|
|
|
|
|
|
|
|
|
|
|
|
|
|
|
|
|
|
|
|
|
|
|
|
|
( |
) |
|
|
|
|
|
|
|
|
|
Milo |
|
|
|
|
— |
|
|
2020 |
|
|
|
|
|
|
|
|
|
|
|
|
|
|
|
|
|
|
|
|
|
|
|
|
|
|
|
|
|
|
|
|
|
|
|
|
|
|
|
|
|
Mosaic at Metro |
|
|
|
|
— |
|
|
2008 |
|
|
|
|
|
|
|
|
|
|
|
|
|
|
|
|
|
|
|
|
|
|
|
|
|
|
|
|
|
|
( |
) |
|
|
|
|
|
|
|
|
|
Mountain View Redevelopment |
|
|
|
|
— |
|
|
(F) |
|
|
|
|
|
|
|
|
|
|
|
|
|
|
|
|
|
|
|
|
|
|
|
|
|
|
|
|
|
|
|
|
|
|
|
|
|
|
|
|
|
Mozaic at Union Station |
|
|
|
|
— |
|
|
2007 |
|
|
|
|
|
|
|
|
|
|
|
|
|
|
|
|
|
|
|
|
|
|
|
|
|
|
|
|
|
|
( |
) |
|
|
|
|
|
|
|
|
|
Murray Hill Tower (fka Murray Hill) |
|
|
|
G |
|
|
1974 |
|
|
|
|
|
|
|
|
|
|
|
|
|
|
|
|
|
|
|
|
|
|
|
|
|
|
|
|
|
|
( |
) |
|
|
|
|
|
|
|
|
|
|
Next on Sixth |
|
|
|
G |
|
|
2017 |
|
|
|
|
|
|
|
|
|
|
|
|
|
|
|
|
|
|
|
|
|
|
|
|
|
|
|
|
|
|
( |
) |
|
|
|
|
|
|
|
|
|
|
North Pier at Harborside |
|
|
|
|
— |
|
|
2003 |
|
|
|
|
|
|
|
|
|
|
|
|
|
|
|
|
|
|
|
|
|
|
|
|
|
|
|
|
|
|
( |
) |
|
|
|
|
|
|
|
|
|
Northglen |
|
|
|
|
— |
|
|
1988 |
|
|
|
|
|
|
|
|
|
|
|
|
|
|
|
|
|
|
|
|
|
|
|
|
|
|
|
|
|
|
( |
) |
|
|
|
|
|
|
|
|
|
Northpark |
|
|
|
|
— |
|
|
1972 |
|
|
|
|
|
|
|
|
|
|
|
|
|
|
|
|
|
|
|
|
|
|
|
|
|
|
|
|
|
|
( |
) |
|
|
|
|
|
|
|
|
|
Oak Park Combined |
|
|
|
|
— |
|
|
1989 & 1990 |
|
|
|
|
|
|
|
|
|
|
|
|
|
|
|
|
|
|
|
|
|
|
|
|
|
|
|
|
|
|
( |
) |
|
|
|
|
|
|
|
|
|
Oaks |
|
|
|
|
— |
|
|
2000 |
|
|
|
|
|
|
|
|
|
|
|
|
|
|
|
|
|
|
|
|
|
|
|
|
|
|
|
|
|
|
( |
) |
|
|
|
|
|
|
|
|
|
Ocean Crest |
|
|
|
|
— |
|
|
1986 |
|
|
|
|
|
|
|
|
|
|
|
|
|
|
|
|
|
|
|
|
|
|
|
|
|
|
|
|
|
|
( |
) |
|
|
|
|
|
|
|
|
|
Odin (fka Tallman) |
|
|
|
|
— |
|
|
2015 |
|
|
|
|
|
|
|
|
|
|
|
|
|
|
|
|
|
|
|
|
|
|
|
|
|
|
|
|
|
|
( |
) |
|
|
|
|
|
|
|
|
|
Olivian at the Realm |
|
|
|
|
— |
|
|
2021 |
|
|
|
|
|
|
|
|
|
|
|
|
|
|
|
|
|
|
|
|
|
|
|
|
|
|
|
|
|
|
|
|
|
|
|
|
|
|
|
|
|
One Henry Adams |
|
|
|
G |
|
|
2016 |
|
|
|
|
|
|
|
|
|
|
|
|
|
|
|
|
|
|
|
|
|
|
|
|
|
|
|
|
|
|
( |
) |
|
|
|
|
|
|
|
|
|
|
One India Street (fka Oakwood Boston) |
|
|
|
G |
|
|
1901 |
|
|
|
|
|
|
|
|
|
|
|
|
|
|
|
|
|
|
|
|
|
|
|
|
|
|
|
|
|
|
( |
) |
|
|
|
|
|
|
|
|
|
|
Osprey |
|
|
|
G |
|
|
2020 |
|
|
|
|
|
|
|
|
|
|
|
|
|
|
|
|
|
|
|
|
|
|
|
|
|
|
|
|
|
|
( |
) |
|
|
|
|
|
|
|
|
|
|
Pacific Place |
|
|
|
|
— |
|
|
2008 |
|
|
|
|
|
|
|
|
|
|
|
|
|
|
|
|
|
|
|
|
|
|
|
|
|
|
|
|
|
|
( |
) |
|
|
|
|
|
|
|
|
|
Packard Building |
|
|
|
G |
|
|
2010 |
|
|
|
|
|
|
|
|
|
|
|
|
|
|
|
|
|
|
|
|
|
|
|
|
|
|
|
|
|
|
( |
) |
|
|
|
|
|
|
|
|
|
|
Parc 77 |
|
|
|
G |
|
|
1903 |
|
|
|
|
|
|
|
|
|
|
|
|
|
|
|
|
|
|
|
|
|
|
|
|
|
|
|
|
|
|
( |
) |
|
|
|
|
|
|
|
|
|
|
Parc Cameron |
|
|
|
G |
|
|
1927 |
|
|
|
|
|
|
|
|
|
|
|
|
|
|
|
|
|
|
|
|
|
|
|
|
|
|
|
|
|
|
( |
) |
|
|
|
|
|
|
|
|
|
|
Parc Coliseum |
|
|
|
G |
|
|
1910 |
|
|
|
|
|
|
|
|
|
|
|
|
|
|
|
|
|
|
|
|
|
|
|
|
|
|
|
|
|
|
( |
) |
|
|
|
|
|
|
|
|
|
|
Parc East Towers |
|
|
|
G |
|
|
1977 |
|
|
|
|
|
|
|
|
|
|
|
|
|
|
|
|
|
|
|
|
|
|
|
|
|
|
|
|
|
|
( |
) |
|
|
|
|
|
|
|
|
|
|
Parc on Powell (fka Parkside at Emeryville) |
|
|
|
G |
|
|
2015 |
|
|
|
|
|
|
|
|
|
|
|
|
|
|
|
|
|
|
|
|
|
|
|
|
|
|
|
|
|
|
( |
) |
|
|
|
|
|
|
|
|
|
|
Park Connecticut |
|
|
|
|
— |
|
|
2000 |
|
|
|
|
|
|
|
|
|
|
|
|
|
|
|
|
|
|
|
|
|
|
|
|
|
|
|
|
|
|
( |
) |
|
|
|
|
|
|
|
|
|
Park West (CA) |
|
|
|
|
— |
|
|
1987/1990 |
|
|
|
|
|
|
|
|
|
|
|
|
|
|
|
|
|
|
|
|
|
|
|
|
|
|
|
|
|
|
( |
) |
|
|
|
|
|
|
|
|
|
Parkside |
|
|
|
|
— |
|
|
1979 |
|
|
|
|
|
|
|
|
|
|
|
|
|
|
|
|
|
|
|
|
|
|
|
|
|
|
|
|
|
|
( |
) |
|
|
|
|
|
|
|
|
|
Pearl, The (WA) |
|
|
|
G |
|
|
2008 |
|
|
|
|
|
|
|
|
|
|
|
|
|
|
|
|
|
|
|
|
|
|
|
|
|
|
|
|
|
|
( |
) |
|
|
|
|
|
|
|
|
|
|
Pearl MDR (fka Oakwood Marina Del Rey) |
|
|
|
G |
|
|
1969 |
|
|
|
|
|
|
|
|
|
|
|
|
|
|
|
|
|
|
|
|
|
|
|
|
|
|
|
|
|
|
( |
) |
|
|
|
|
|
|
|
|
|
|
Pegasus |
|
|
|
G |
|
|
1949/2003 |
|
|
|
|
|
|
|
|
|
|
|
|
|
|
|
|
|
|
|
|
|
|
|
|
|
|
|
|
|
|
( |
) |
|
|
|
|
|
|
|
|
|
|
Portofino |
|
|
|
|
— |
|
|
1989 |
|
|
|
|
|
|
|
|
|
|
|
|
|
|
|
|
|
|
|
|
|
|
|
|
|
|
|
|
|
|
( |
) |
|
|
|
|
|
|
|
|
|
Portofino (Val) |
|
|
|
|
— |
|
|
1989 |
|
|
|
|
|
|
|
|
|
|
|
|
|
|
|
|
|
|
|
|
|
|
|
|
|
|
|
|
|
|
( |
) |
|
|
|
|
|
|
|
|
|
Portside Towers |
|
|
|
G |
|
|
1992-1997 |
|
|
|
|
|
|
|
|
|
|
|
|
|
|
|
|
|
|
|
|
|
|
|
|
|
|
|
|
|
|
( |
) |
|
|
|
|
|
|
|
|
|
|
Potrero 1010 |
|
|
|
G |
|
|
2016 |
|
|
|
|
|
|
|
|
|
|
|
|
|
|
|
|
|
|
|
|
|
|
|
|
|
|
|
|
|
|
( |
) |
|
|
|
|
|
|
|
|
|
|
Prado (fka Glendale) |
|
|
|
|
— |
|
|
1988 |
|
|
|
|
|
|
|
|
|
|
|
|
|
|
|
|
|
|
|
|
|
|
|
|
|
|
|
|
|
|
( |
) |
|
|
|
|
|
|
|
|
|
Prime, The |
|
|
|
|
— |
|
|
2002 |
|
|
|
|
|
|
|
|
|
|
|
|
|
|
|
|
|
|
|
|
|
|
|
|
|
|
|
|
|
|
( |
) |
|
|
|
|
|
|
|
|
|
Prism at Park Avenue South (fka 400 Park Avenue South) |
|
|
|
G |
|
|
2015 |
|
|
|
|
|
|
|
|
|
|
|
|
|
|
|
|
|
|
|
|
|
|
|
|
|
|
|
|
|
|
( |
) |
|
|
|
|
|
|
|
|
|
|
Promenade at Town Center I & II |
|
|
|
|
— |
|
|
2001 |
|
|
|
|
|
|
|
|
|
|
|
|
|
|
|
|
|
|
|
|
|
|
|
|
|
|
|
|
|
|
( |
) |
|
|
|
|
|
|
|
|
|
Providence |
|
|
|
|
— |
|
|
2000 |
|
|
|
|
|
|
|
|
|
|
|
|
|
|
|
|
|
|
|
|
|
|
|
|
|
|
|
|
|
|
( |
) |
|
|
|
|
|
|
|
|
S-7
EQUITY RESIDENTIAL
ERP OPERATING LIMITED PARTNERSHIP
Schedule III - Real Estate and Accumulated Depreciation
December 31, 2021
|
Description |
|
|
Initial Cost to Company |
|
|
Cost Capitalized Subsequent to Acquisition (Improvements, net) (E) |
|
|
Gross Amount Carried at Close of Period 12/31/21 |
|
|
|
|
|||||||||||||||||||||||||||||||||||
|
Apartment Name |
|
Location |
|
Non-Residential Components |
|
|
Date of Construction |
|
Apartment Units |
|
|
Land |
|
|
Building & Fixtures |
|
|
Building & Fixtures |
|
|
Land |
|
|
Building & Fixtures (A) |
|
|
Total (B) |
|
|
Accumulated Depreciation (C) |
|
|
Investment in Real Estate, Net at 12/31/21 |
|
|
Encumbrances |
|
|||||||||||
|
Quarry Hills |
|
|
|
|
— |
|
|
2006 |
|
|
|
|
|
|
|
|
|
|
|
|
|
|
|
|
|
|
|
|
|
|
|
|
|
|
|
|
|
|
( |
) |
|
|
|
|
|
|
|
|
|
Radiant Fairfax Ridge |
|
|
|
|
— |
|
|
2016 |
|
|
|
|
|
|
|
|
|
|
|
|
|
|
|
|
|
|
|
|
|
|
|
|
|
|
|
|
|
|
( |
) |
|
|
|
|
|
|
|
|
|
Radius Uptown |
|
|
|
|
— |
|
|
2017 |
|
|
|
|
|
|
|
|
|
|
|
|
|
|
|
|
|
|
|
|
|
|
|
|
|
|
|
|
|
|
( |
) |
|
|
|
|
|
|
|
|
|
Red 160 (fka Redmond Way) |
|
|
|
G |
|
|
2011 |
|
|
|
|
|
|
|
|
|
|
|
|
|
|
|
|
|
|
|
|
|
|
|
|
|
|
|
|
|
|
( |
) |
|
|
|
|
|
|
|
|
|
|
Redmond Court |
|
|
|
|
— |
|
|
1977 |
|
|
|
|
|
|
|
|
|
|
|
|
|
|
|
|
|
|
|
|
|
|
|
|
|
|
|
|
|
|
( |
) |
|
|
|
|
|
|
|
|
|
Regency Palms |
|
|
|
|
— |
|
|
1969 |
|
|
|
|
|
|
|
|
|
|
|
|
|
|
|
|
|
|
|
|
|
|
|
|
|
|
|
|
|
|
( |
) |
|
|
|
|
|
|
|
|
|
Reserve at Burlington, The |
|
|
|
|
— |
|
|
2019 |
|
|
|
|
|
|
|
|
|
|
|
|
|
|
|
|
|
|
|
|
|
|
|
|
|
|
|
|
|
|
( |
) |
|
|
|
|
|
|
|
|
|
Reserve at Clarendon Centre, The |
|
|
|
G |
|
|
2003 |
|
|
|
|
|
|
|
|
|
|
|
|
|
|
|
|
|
|
|
|
|
|
|
|
|
|
|
|
|
|
( |
) |
|
|
|
|
|
|
|
|
|
|
Reserve at Eisenhower, The |
|
|
|
|
— |
|
|
2002 |
|
|
|
|
|
|
|
|
|
|
|
|
|
|
|
|
|
|
|
|
|
|
|
|
|
|
|
|
|
|
( |
) |
|
|
|
|
|
|
|
|
|
Reserve at Empire Lakes |
|
|
|
|
— |
|
|
2005 |
|
|
|
|
|
|
|
|
|
|
|
|
|
|
|
|
|
|
|
|
|
|
|
|
|
|
|
|
|
|
( |
) |
|
|
|
|
|
|
|
|
|
Reserve at Fairfax Corner |
|
|
|
|
— |
|
|
2001 |
|
|
|
|
|
|
|
|
|
|
|
|
|
|
|
|
|
|
|
|
|
|
|
|
|
|
|
|
|
|
( |
) |
|
|
|
|
|
|
|
|
|
Reserve at Mountain View (fka Mountain View) |
|
|
|
|
— |
|
|
1965 |
|
|
|
|
|
|
|
|
|
|
|
|
|
|
|
|
|
|
|
|
|
|
|
|
|
|
|
|
|
|
( |
) |
|
|
|
|
|
|
|
|
|
Reserve at Potomac Yard |
|
|
|
|
— |
|
|
2002 |
|
|
|
|
|
|
|
|
|
|
|
|
|
|
|
|
|
|
|
|
|
|
|
|
|
|
|
|
|
|
( |
) |
|
|
|
|
|
|
|
|
|
Reserve at Town Center I-III (WA) |
|
|
|
G |
|
|
2001, 2009, 2014 |
|
|
|
|
|
|
|
|
|
|
|
|
|
|
|
|
|
|
|
|
|
|
|
|
|
|
|
|
|
|
( |
) |
|
|
|
|
|
|
|
|
|
|
Rianna I & II |
|
|
|
G |
|
|
2000/2002 |
|
|
|
|
|
|
|
|
|
|
|
|
|
|
|
|
|
|
|
|
|
|
|
|
|
|
|
|
|
|
( |
) |
|
|
|
|
|
|
|
|
|
|
Ridgewood Village I&II |
|
|
|
|
— |
|
|
1997 |
|
|
|
|
|
|
|
|
|
|
|
|
|
|
|
|
|
|
|
|
|
|
|
|
|
|
|
|
|
|
( |
) |
|
|
|
|
|
|
|
|
|
Riva Terra I (fka Redwood Shores) |
|
|
|
|
— |
|
|
1986 |
|
|
|
|
|
|
|
|
|
|
|
|
|
|
|
|
|
|
|
|
|
|
|
|
|
|
|
|
|
|
( |
) |
|
|
|
|
|
|
|
|
|
Riva Terra II (fka Harborside) |
|
|
|
|
— |
|
|
1986 |
|
|
|
|
|
|
|
|
|
|
|
|
|
|
|
|
|
|
|
|
|
|
|
|
|
|
|
|
|
|
( |
) |
|
|
|
|
|
|
|
|
|
Riverpark |
|
|
|
G |
|
|
2009 |
|
|
|
|
|
|
|
|
|
|
|
|
|
|
|
|
|
|
|
|
|
|
|
|
|
|
|
|
|
|
( |
) |
|
|
|
|
|
|
|
|
|
|
Rivington, The |
|
|
|
|
— |
|
|
1999 |
|
|
|
|
|
|
|
|
|
|
|
|
|
|
|
|
|
|
|
|
|
|
|
|
|
|
|
|
|
|
( |
) |
|
|
|
|
|
|
|
|
|
Rivington II, The |
|
|
|
|
— |
|
|
(F) |
|
|
|
|
|
|
|
|
|
|
|
|
|
|
|
|
|
|
|
|
|
|
|
|
|
|
|
|
|
|
|
|
|
|
|
|
|
|
|
|
|
Rosecliff II |
|
|
|
|
— |
|
|
2005 |
|
|
|
|
|
|
|
|
|
|
|
|
|
|
|
|
|
|
|
|
|
|
|
|
|
|
|
|
|
|
( |
) |
|
|
|
|
|
|
|
|
|
Sakura Crossing |
|
|
|
G |
|
|
2009 |
|
|
|
|
|
|
|
|
|
|
|
|
|
|
|
|
|
|
|
|
|
|
|
|
|
|
|
|
|
|
( |
) |
|
|
|
|
|
|
|
|
|
|
Saxton |
|
|
|
G |
|
|
2019 |
|
|
|
|
|
|
|
|
|
|
|
|
|
|
|
|
|
|
|
|
|
|
|
|
|
|
|
|
|
|
( |
) |
|
|
|
|
|
|
|
|
|
|
Seventh & James |
|
|
|
G |
|
|
1992 |
|
|
|
|
|
|
|
|
|
|
|
|
|
|
|
|
|
|
|
|
|
|
|
|
|
|
|
|
|
|
( |
) |
|
|
|
|
|
|
|
|
|
|
Sheffield Court |
|
|
|
|
— |
|
|
1986 |
|
|
|
|
|
|
|
|
|
|
|
|
|
|
|
|
|
|
|
|
|
|
|
|
|
|
|
|
|
|
( |
) |
|
|
|
|
|
|
|
|
|
Siena Terrace |
|
|
|
|
— |
|
|
1988 |
|
|
|
|
|
|
|
|
|
|
|
|
|
|
|
|
|
|
|
|
|
|
|
|
|
|
|
|
|
|
( |
) |
|
|
|
|
|
|
|
|
|
Skycrest |
|
|
|
|
— |
|
|
1999 |
|
|
|
|
|
|
|
|
|
|
|
|
|
|
|
|
|
|
|
|
|
|
|
|
|
|
|
|
|
|
( |
) |
|
|
|
|
|
|
|
|
|
Skyhouse South |
|
|
|
G |
|
|
2014 |
|
|
|
|
|
|
|
|
|
|
|
|
|
|
|
|
|
|
|
|
|
|
|
|
|
|
|
|
|
|
( |
) |
|
|
|
|
|
|
|
|
|
|
Skylark |
|
|
|
|
— |
|
|
1986 |
|
|
|
|
|
|
|
|
|
|
|
|
|
|
|
|
|
|
|
|
|
|
|
|
|
|
|
|
|
|
( |
) |
|
|
|
|
|
|
|
|
|
Skyview |
|
|
|
|
— |
|
|
1999 |
|
|
|
|
|
|
|
|
|
|
|
|
|
|
|
|
|
|
|
|
|
|
|
|
|
|
|
|
|
|
( |
) |
|
|
|
|
|
|
|
|
|
SoMa II |
|
|
|
|
— |
|
|
(F) |
|
|
|
|
|
|
|
|
|
|
|
|
|
|
|
|
|
|
|
|
|
|
|
|
|
|
|
|
|
|
|
|
|
|
|
|
|
|
|
|
|
Sonterra at Foothill Ranch |
|
|
|
|
— |
|
|
1997 |
|
|
|
|
|
|
|
|
|
|
|
|
|
|
|
|
|
|
|
|
|
|
|
|
|
|
|
|
|
|
( |
) |
|
|
|
|
|
|
|
|
|
South City Station (fka South San Francisco) |
|
|
|
G |
|
|
2007 |
|
|
|
|
|
|
|
|
|
|
|
|
|
|
|
|
|
|
|
|
|
|
|
|
|
|
|
|
|
|
( |
) |
|
|
|
|
|
|
|
|
|
|
Southwood |
|
|
|
|
— |
|
|
1985 |
|
|
|
|
|
|
|
|
|
|
|
|
|
|
|
|
|
|
|
|
|
|
|
|
|
|
|
|
|
|
( |
) |
|
|
|
|
|
|
|
|
|
Springline |
|
|
|
G |
|
|
2016 |
|
|
|
|
|
|
|
|
|
|
|
|
|
|
|
|
|
|
|
|
|
|
|
|
|
|
|
|
|
|
( |
) |
|
|
|
|
|
|
|
|
|
|
Square One |
|
|
|
|
— |
|
|
2014 |
|
|
|
|
|
|
|
|
|
|
|
|
|
|
|
|
|
|
|
|
|
|
|
|
|
|
|
|
|
|
( |
) |
|
|
|
|
|
|
|
|
|
STOA |
|
|
|
G |
|
|
2017 |
|
|
|
|
|
|
|
|
|
|
|
|
|
|
|
|
|
|
|
|
|
|
|
|
|
|
|
|
|
|
( |
) |
|
|
|
|
|
|
|
|
|
|
Summerset Village |
|
|
|
|
— |
|
|
1985 |
|
|
|
|
|
|
|
|
|
|
|
|
|
|
|
|
|
|
|
|
|
|
|
|
|
|
|
|
|
|
( |
) |
|
|
|
|
|
|
|
|
|
Ten23 (fka 500 West 23rd Street) |
|
|
|
G |
|
|
2011 |
|
|
|
|
|
|
|
|
|
|
|
|
|
|
|
|
|
|
|
|
|
|
|
|
|
|
|
|
|
|
( |
) |
|
|
|
|
|
|
|
|
|
|
Terraces, The |
|
|
|
G |
|
|
1975 |
|
|
|
|
|
|
|
|
|
|
|
|
|
|
|
|
|
|
|
|
|
|
|
|
|
|
|
|
|
|
( |
) |
|
|
|
|
|
|
|
|
|
|
Theo |
|
|
|
G |
|
|
2018 |
|
|
|
|
|
|
|
|
|
|
|
|
|
|
|
|
|
|
|
|
|
|
|
|
|
|
|
|
|
|
|
|
|
|
|
|
|
|
|
|
|
S-8
EQUITY RESIDENTIAL
ERP OPERATING LIMITED PARTNERSHIP
Schedule III - Real Estate and Accumulated Depreciation
December 31, 2021
|
Description |
|
|
Initial Cost to Company |
|
|
Cost Capitalized Subsequent to Acquisition (Improvements, net) (E) |
|
|
Gross Amount Carried at Close of Period 12/31/21 |
|
|
|
|
|||||||||||||||||||||||||||||||||||||
|
Apartment Name |
|
Location |
|
Non-Residential Components |
|
|
Date of Construction |
|
|
Apartment Units |
|
|
Land |
|
|
Building & Fixtures |
|
|
Building & Fixtures |
|
|
Land |
|
|
Building & Fixtures (A) |
|
|
Total (B) |
|
|
Accumulated Depreciation (C) |
|
|
Investment in Real Estate, Net at 12/31/21 |
|
|
Encumbrances |
|
||||||||||||
|
Third Square |
|
|
|
G |
|
|
2008/2009 |
|
|
|
|
|
|
|
|
|
|
|
|
|
|
|
|
|
|
|
|
|
|
|
|
|
|
|
|
|
|
|
( |
) |
|
|
|
|
|
|
|
|
||
|
Three20 |
|
|
|
G |
|
|
2013 |
|
|
|
|
|
|
|
|
|
|
|
|
|
|
|
|
|
|
|
|
|
|
|
|
|
|
|
|
|
|
|
( |
) |
|
|
|
|
|
|
|
|
||
|
Toscana |
|
|
|
|
— |
|
|
1991/1993 |
|
|
|
|
|
|
|
|
|
|
|
|
|
|
|
|
|
|
|
|
|
|
|
|
|
|
|
|
|
|
|
( |
) |
|
|
|
|
|
|
|
|
|
|
Town Square at Mark Center I&II |
|
|
|
|
— |
|
|
1996 |
|
|
|
|
|
|
|
|
|
|
|
|
|
|
|
|
|
|
|
|
|
|
|
|
|
|
|
|
|
|
|
( |
) |
|
|
|
|
|
|
|
|
|
|
Troy Boston |
|
|
|
G |
|
|
2015 |
|
|
|
|
|
|
|
|
|
|
|
|
|
|
|
|
|
|
|
|
|
|
|
|
|
|
|
|
|
|
|
( |
) |
|
|
|
|
|
|
|
|
||
|
Urbana (fka Market Street Landing) |
|
|
|
G |
|
|
2014 |
|
|
|
|
|
|
|
|
|
|
|
|
|
|
|
|
|
|
|
|
|
|
|
|
|
|
|
|
|
|
|
( |
) |
|
|
|
|
|
|
|
|
||
|
Uwajimaya Village |
|
|
|
|
— |
|
|
2002 |
|
|
|
|
|
|
|
|
|
|
|
|
|
|
|
|
|
|
|
|
|
|
|
|
|
|
|
|
|
|
|
( |
) |
|
|
|
|
|
|
|
|
|
|
Veloce |
|
|
|
G |
|
|
2009 |
|
|
|
|
|
|
|
|
|
|
|
|
|
|
|
|
|
|
|
|
|
|
|
|
|
|
|
|
|
|
|
( |
) |
|
|
|
|
|
|
|
|
||
|
Venue at the Promenade |
|
|
|
|
— |
|
|
2017 |
|
|
|
|
|
|
|
|
|
|
|
|
|
|
|
|
|
|
|
|
|
|
|
|
|
|
|
|
|
|
|
( |
) |
|
|
|
|
|
|
|
|
|
|
Verde Condominium Homes (fka Mission Verde, LLC) |
|
|
|
|
— |
|
|
1986 |
|
|
|
|
|
|
|
|
|
|
|
|
|
|
|
|
|
|
|
|
|
|
|
|
|
|
|
|
|
|
|
( |
) |
|
|
|
|
|
|
|
|
|
|
Veridian (fka Silver Spring) |
|
|
|
G |
|
|
2009 |
|
|
|
|
|
|
|
|
|
|
|
|
|
|
|
|
|
|
|
|
|
|
|
|
|
|
|
|
|
|
|
( |
) |
|
|
|
|
|
|
|
|
||
|
Versailles |
|
|
|
|
— |
|
|
1991 |
|
|
|
|
|
|
|
|
|
|
|
|
|
|
|
|
|
|
|
|
|
|
|
|
|
|
|
|
|
|
|
( |
) |
|
|
|
|
|
|
|
|
|
|
Versailles (K-Town) |
|
|
|
|
— |
|
|
2008 |
|
|
|
|
|
|
|
|
|
|
|
|
|
|
|
|
|
|
|
|
|
|
|
|
|
|
|
|
|
|
|
( |
) |
|
|
|
|
|
|
|
|
|
|
Victor on Venice |
|
|
|
G |
|
|
2006 |
|
|
|
|
|
|
|
|
|
|
|
|
|
|
|
|
|
|
|
|
|
|
|
|
|
|
|
|
|
|
|
( |
) |
|
|
|
|
|
|
|
|
||
|
Villa Solana |
|
|
|
|
— |
|
|
1984 |
|
|
|
|
|
|
|
|
|
|
|
|
|
|
|
|
|
|
|
|
|
|
|
|
|
|
|
|
|
|
|
( |
) |
|
|
|
|
|
|
|
|
|
|
Village at Del Mar Heights, The (fka Del Mar Heights) |
|
|
|
|
— |
|
|
1986 |
|
|
|
|
|
|
|
|
|
|
|
|
|
|
|
|
|
|
|
|
|
|
|
|
|
|
|
|
|
|
|
( |
) |
|
|
|
|
|
|
|
|
|
|
Virginia Square |
|
|
|
G |
|
|
2002 |
|
|
|
|
|
|
|
|
|
|
|
|
|
|
|
|
|
|
|
|
|
|
|
|
|
|
|
|
|
|
|
( |
) |
|
|
|
|
|
|
|
|
||
|
Vista 99 (fka Tasman) |
|
|
|
|
— |
|
|
2016 |
|
|
|
|
|
|
|
|
|
|
|
|
|
|
|
|
|
|
|
|
|
|
|
|
|
|
|
|
|
|
|
( |
) |
|
|
|
|
|
|
|
|
|
|
Vista Del Lago |
|
|
|
|
— |
|
|
1986-1988 |
|
|
|
|
|
|
|
|
|
|
|
|
|
|
|
|
|
|
|
|
|
|
|
|
|
|
|
|
|
|
|
( |
) |
|
|
|
|
|
|
|
|
|
|
Walden Park |
|
|
|
|
— |
|
|
1966 |
|
|
|
|
|
|
|
|
|
|
|
|
|
|
|
|
|
|
|
|
|
|
|
|
|
|
|
|
|
|
|
( |
) |
|
|
|
|
|
|
|
|
|
|
Water Park Towers |
|
|
|
|
— |
|
|
1989 |
|
|
|
|
|
|
|
|
|
|
|
|
|
|
|
|
|
|
|
|
|
|
|
|
|
|
|
|
|
|
|
( |
) |
|
|
|
|
|
|
|
|
|
|
Watertown Square |
|
|
|
G |
|
|
2005 |
|
|
|
|
|
|
|
|
|
|
|
|
|
|
|
|
|
|
|
|
|
|
|
|
|
|
|
|
|
|
|
( |
) |
|
|
|
|
|
|
|
|
||
|
Weaver, The |
|
|
|
G |
|
|
2020 |
|
|
|
|
|
|
|
|
|
|
|
|
|
|
|
|
|
|
|
|
|
|
|
|
|
|
|
|
|
|
|
|
|
|
|
|
|
|
|
|
|
||
|
West 96th |
|
|
|
G |
|
|
1987 |
|
|
|
|
|
|
|
|
|
|
|
|
|
|
|
|
|
|
|
|
|
|
|
|
|
|
|
|
|
|
|
( |
) |
|
|
|
|
|
|
|
|
||
|
West End Apartments (fka Emerson Place/CRP II) |
|
|
|
G |
|
|
2008 |
|
|
|
|
|
|
|
|
|
|
|
|
|
|
|
|
|
|
|
|
|
|
|
|
|
|
|
|
|
|
|
( |
) |
|
|
|
|
|
|
|
|
||
|
Westchester at Rockville |
|
|
|
|
— |
|
|
2009 |
|
|
|
|
|
|
|
|
|
|
|
|
|
|
|
|
|
|
|
|
|
|
|
|
|
|
|
|
|
|
|
( |
) |
|
|
|
|
|
|
|
|
|
|
Westerly |
|
|
|
G |
|
|
2021 |
|
|
|
|
|
|
|
|
|
|
|
|
|
|
|
|
|
|
|
|
|
|
|
|
|
|
|
|
|
|
|
( |
) |
|
|
|
|
|
|
|
|
||
|
Westmont |
|
|
|
G |
|
|
1986 |
|
|
|
|
|
|
|
|
|
|
|
|
|
|
|
|
|
|
|
|
|
|
|
|
|
|
|
|
|
|
|
( |
) |
|
|
|
|
|
|
|
|
||
|
Westside |
|
|
|
|
— |
|
|
2004 |
|
|
|
|
|
|
|
|
|
|
|
|
|
|
|
|
|
|
|
|
|
|
|
|
|
|
|
|
|
|
|
( |
) |
|
|
|
|
|
|
|
|
|
|
Westside Barrington (fka Westside Villas III) |
|
|
|
|
— |
|
|
1999 |
|
|
|
|
|
|
|
|
|
|
|
|
|
|
|
|
|
|
|
|
|
|
|
|
|
|
|
|
|
|
|
( |
) |
|
|
|
|
|
|
|
|
|
|
Westside Barry (Westside Villas VI) |
|
|
|
|
— |
|
|
1989 |
|
|
|
|
|
|
|
|
|
|
|
|
|
|
|
|
|
|
|
|
|
|
|
|
|
|
|
|
|
|
|
( |
) |
|
|
|
|
|
|
|
|
|
|
Westside Beloit (fka Westside Villas I) |
|
|
|
|
— |
|
|
1999 |
|
|
|
|
|
|
|
|
|
|
|
|
|
|
|
|
|
|
|
|
|
|
|
|
|
|
|
|
|
|
|
( |
) |
|
|
|
|
|
|
|
|
|
|
Westside Bundy (fka Westside Villas II) |
|
|
|
|
— |
|
|
1999 |
|
|
|
|
|
|
|
|
|
|
|
|
|
|
|
|
|
|
|
|
|
|
|
|
|
|
|
|
|
|
|
( |
) |
|
|
|
|
|
|
|
|
|
|
Westside Butler (fka Westside Villas IV) |
|
|
|
|
— |
|
|
1999 |
|
|
|
|
|
|
|
|
|
|
|
|
|
|
|
|
|
|
|
|
|
|
|
|
|
|
|
|
|
|
|
( |
) |
|
|
|
|
|
|
|
|
|
|
Westside Villas (fka Westside Villas V &VII) |
|
|
|
|
— |
|
|
1999 & 2001 |
|
|
|
|
|
|
|
|
|
|
|
|
|
|
|
|
|
|
|
|
|
|
|
|
|
|
|
|
|
|
|
( |
) |
|
|
|
|
|
|
|
|
|
|
Windridge (CA) |
|
|
|
|
— |
|
|
1989 |
|
|
|
|
|
|
|
|
|
|
|
|
|
|
|
|
|
|
|
|
|
|
|
|
|
|
|
|
|
|
|
( |
) |
|
|
|
|
|
|
|
|
|
|
Woodleaf |
|
|
|
|
— |
|
|
1984 |
|
|
|
|
|
|
|
|
|
|
|
|
|
|
|
|
|
|
|
|
|
|
|
|
|
|
|
|
|
|
|
( |
) |
|
|
|
|
|
|
|
|
|
|
Zephyr on the Park |
|
|
|
G |
|
|
2021 |
|
|
|
|
|
|
|
|
|
|
|
|
|
|
|
|
|
|
|
|
|
|
|
|
|
|
|
|
|
|
|
( |
) |
|
|
|
|
|
|
|
|
||
|
Management Business |
|
|
|
|
— |
|
|
(D) |
|
|
|
|
|
|
|
|
|
|
|
|
|
|
|
|
|
|
|
|
|
|
|
|
|
|
|
|
|
|
|
( |
) |
|
|
|
|
|
|
|
|
|
|
Operating Partnership |
|
|
|
|
— |
|
|
(F) |
|
|
|
|
|
|
|
|
|
|
|
|
|
|
|
|
|
|
|
|
|
|
|
|
|
|
|
|
|
|
|
|
|
|
|
|
|
|
|
|
|
|
|
Other |
|
|
|
|
— |
|
|
|
— |
|
|
|
|
|
|
|
|
|
|
|
|
|
|
|
|
|
|
|
|
|
|
|
|
|
|
|
|
|
|
|
( |
) |
|
|
|
|
|
|
|
|
|
Wholly Owned Unencumbered |
|
|
|
|
|
|
|
|
|
|
|
|
|
|
|
|
|
|
|
|
|
|
|
|
|
|
|
|
|
|
|
|
|
|
|
|
|
|
|
|
( |
) |
|
|
|
|
|
|
|
|
|
|
|
|
|
|
|
|
|
|
|
|
|
|
|
|
|
|
|
|
|
|
|
|
|
|
|
|
|
|
|
|
|
|
|
|
|
|
|
|
|
|
|
|
|
|
|
|
|
|
|
|
|
|
|
|
|
|
|
|
|
|
|
|
|
|
|
|
|
|
|
|
|
|
|
|
|
|
|
|
|
|
|
|
|
|
|
|
|
|
|
|
|
|
|
|
|
|
|
|
|
|
|
|
S-9
EQUITY RESIDENTIAL
ERP OPERATING LIMITED PARTNERSHIP
Schedule III - Real Estate and Accumulated Depreciation
December 31, 2021
|
Description |
|
|
Initial Cost to Company |
|
|
Cost Capitalized Subsequent to Acquisition (Improvements, net) (E) |
|
|
Gross Amount Carried at Close of Period 12/31/21 |
|
|
|
|
|||||||||||||||||||||||||||||||||||
|
Apartment Name |
|
Location |
|
Non-Residential Components |
|
|
Date of Construction |
|
Apartment Units |
|
|
Land |
|
|
Building & Fixtures |
|
|
Building & Fixtures |
|
|
Land |
|
|
Building & Fixtures (A) |
|
|
Total (B) |
|
|
Accumulated Depreciation (C) |
|
|
Investment in Real Estate, Net at 12/31/21 |
|
|
Encumbrances |
|
|||||||||||
|
Wholly Owned Encumbered: |
|
|
|
|
|
|
|
|
|
|
|
|
|
|
|
|
|
|
|
|
|
|
|
|
|
|
|
|
|
|
|
|
|
|
|
|
|
|
|
|
|
|
|
|
|
|
|
|
|
1111 Belle Pre (fka The Madison) |
|
|
|
G |
|
|
2014 |
|
|
|
|
|
|
|
|
|
|
|
|
|
|
|
|
|
|
|
|
|
|
|
|
|
|
|
|
|
|
( |
) |
|
|
|
|
|
|
|
|
|
|
2501 Porter |
|
|
|
|
— |
|
|
1988 |
|
|
|
|
|
|
|
|
|
|
|
|
|
|
|
|
|
|
|
|
|
|
|
|
|
|
|
|
|
|
( |
) |
|
|
|
|
|
(H) |
|
|
|
300 East 39th (fka East 39th) |
|
|
|
G |
|
|
2001 |
|
|
|
|
|
|
|
|
|
|
|
|
|
|
|
|
|
|
|
|
|
|
|
|
|
|
|
|
|
|
( |
) |
|
|
|
|
|
|
|
|
|
|
303 East 83rd (fka Camargue) |
|
|
|
G |
|
|
1976 |
|
|
|
|
|
|
|
|
|
|
|
|
|
|
|
|
|
|
|
|
|
|
|
|
|
|
|
|
|
|
( |
) |
|
|
|
|
|
(H) |
|
||
|
425 Broadway |
|
|
|
G |
|
|
2001 |
|
|
|
|
|
|
|
|
|
|
|
|
|
|
|
|
|
|
|
|
|
|
|
|
|
|
|
|
|
|
( |
) |
|
|
|
|
|
(H) |
|
||
|
Alcyone |
|
|
|
G |
|
|
2004 |
|
|
|
|
|
|
|
|
|
|
|
|
|
|
|
|
|
|
|
|
|
|
|
|
|
|
|
|
|
|
( |
) |
|
|
|
|
|
|
|
|
|
|
Artisan Square |
|
|
|
|
— |
|
|
2002 |
|
|
|
|
|
|
|
|
|
|
|
|
|
|
|
|
|
|
|
|
|
|
|
|
|
|
|
|
|
|
( |
) |
|
|
|
|
|
|
|
|
|
Avanti |
|
|
|
|
— |
|
|
1987 |
|
|
|
|
|
|
|
|
|
|
|
|
|
|
|
|
|
|
|
|
|
|
|
|
|
|
|
|
|
|
( |
) |
|
|
|
|
|
|
|
|
|
Avenir Apartments |
|
|
|
G |
|
|
2009 |
|
|
|
|
|
|
|
|
|
|
|
|
|
|
|
|
|
|
|
|
|
|
|
|
|
|
|
|
|
|
( |
) |
|
|
|
|
|
|
|
|
|
|
Calvert Woodley |
|
|
|
|
— |
|
|
1962 |
|
|
|
|
|
|
|
|
|
|
|
|
|
|
|
|
|
|
|
|
|
|
|
|
|
|
|
|
|
|
( |
) |
|
|
|
|
|
(H) |
|
|
|
City Pointe |
|
|
|
G |
|
|
2004 |
|
|
|
|
|
|
|
|
|
|
|
|
|
|
|
|
|
|
|
|
|
|
|
|
|
|
|
|
|
|
( |
) |
|
|
|
|
|
|
|
|
|
|
Cleveland House |
|
|
|
|
— |
|
|
1953 |
|
|
|
|
|
|
|
|
|
|
|
|
|
|
|
|
|
|
|
|
|
|
|
|
|
|
|
|
|
|
( |
) |
|
|
|
|
|
(H) |
|
|
|
Elevé |
|
|
|
G |
|
|
2013 |
|
|
|
|
|
|
|
|
|
|
|
|
|
|
|
|
|
|
|
|
|
|
|
|
|
|
|
|
|
|
( |
) |
|
|
|
|
|
|
|
|
|
|
Estancia at Santa Clara (fka Santa Clara) |
|
|
|
|
— |
|
|
2000 |
|
|
|
|
|
|
|
|
|
|
|
|
|
|
|
|
|
|
|
|
|
|
|
|
|
|
|
|
|
|
( |
) |
|
|
|
|
|
(H) |
|
|
|
Fairchase |
|
|
|
|
— |
|
|
2007 |
|
|
|
|
|
|
|
|
|
|
|
|
|
|
|
|
|
|
|
|
|
|
|
|
|
|
|
|
|
|
( |
) |
|
|
|
|
|
(H) |
|
|
|
Flats at DuPont Circle |
|
|
|
|
— |
|
|
1967 |
|
|
|
|
|
|
|
|
|
|
|
|
|
|
|
|
|
|
|
|
|
|
|
|
|
|
|
|
|
|
( |
) |
|
|
|
|
|
(H) |
|
|
|
Glo |
|
|
|
G |
|
|
2008 |
|
|
|
|
|
|
|
|
|
|
|
|
|
|
|
|
|
|
|
|
|
|
|
|
|
|
|
|
|
|
( |
) |
|
|
|
|
|
|
|
|
|
|
Heights on Capitol Hill |
|
|
|
G |
|
|
2006 |
|
|
|
|
|
|
|
|
|
|
|
|
|
|
|
|
|
|
|
|
|
|
|
|
|
|
|
|
|
|
( |
) |
|
|
|
|
|
|
|
|
|
|
Kelvin Court (fka Alta Pacific) |
|
|
|
|
— |
|
|
2008 |
|
|
|
|
|
|
|
|
|
|
|
|
|
|
|
|
|
|
|
|
|
|
|
|
|
|
|
|
|
|
( |
) |
|
|
|
|
|
|
|
|
|
Kenwood Mews |
|
|
|
|
— |
|
|
1991 |
|
|
|
|
|
|
|
|
|
|
|
|
|
|
|
|
|
|
|
|
|
|
|
|
|
|
|
|
|
|
( |
) |
|
|
|
|
|
|
|
|
|
La Terrazza at Colma Station |
|
|
|
G |
|
|
2005 |
|
|
|
|
|
|
|
|
|
|
|
|
|
|
|
|
|
|
|
|
|
|
|
|
|
|
|
|
|
|
( |
) |
|
|
|
|
|
|
|
|
|
|
Lindley Apartments |
|
|
|
|
— |
|
|
2004 |
|
|
|
|
|
|
|
|
|
|
|
|
|
|
|
|
|
|
|
|
|
|
|
|
|
|
|
|
|
|
( |
) |
|
|
|
|
|
|
|
|
|
Lofts 590 |
|
|
|
|
— |
|
|
2005 |
|
|
|
|
|
|
|
|
|
|
|
|
|
|
|
|
|
|
|
|
|
|
|
|
|
|
|
|
|
|
( |
) |
|
|
|
|
|
|
|
|
|
Longview Place |
|
|
|
|
— |
|
|
2004 |
|
|
|
|
|
|
|
|
|
|
|
|
|
|
|
|
|
|
|
|
|
|
|
|
|
|
|
|
|
|
( |
) |
|
|
|
|
|
|
|
|
|
Metro on First |
|
|
|
G |
|
|
2002 |
|
|
|
|
|
|
|
|
|
|
|
|
|
|
|
|
|
|
|
|
|
|
|
|
|
|
|
|
|
|
( |
) |
|
|
|
|
|
|
|
|
|
|
Moda |
|
|
|
G |
|
|
2009 |
|
|
|
|
|
|
|
|
|
|
|
|
|
|
|
|
|
|
|
|
|
|
|
|
|
|
|
|
|
|
( |
) |
|
|
|
|
|
(I) |
|
||
|
Montierra (CA) |
|
|
|
|
— |
|
|
1990 |
|
|
|
|
|
|
|
|
|
|
|
|
|
|
|
|
|
|
|
|
|
|
|
|
|
|
|
|
|
|
( |
) |
|
|
|
|
|
|
|
|
|
Notch |
|
|
|
|
— |
|
|
2020 |
|
|
|
|
|
|
|
|
|
|
|
|
|
|
|
|
|
|
|
|
|
|
|
|
|
|
|
|
|
|
( |
) |
|
|
|
|
|
|
|
|
|
Old Town Lofts |
|
|
|
G |
|
|
2014 |
|
|
|
|
|
|
|
|
|
|
|
|
|
|
|
|
|
|
|
|
|
|
|
|
|
|
|
|
|
|
( |
) |
|
|
|
|
|
|
|
|
|
|
Olympus Towers |
|
|
|
G |
|
|
2000 |
|
|
|
|
|
|
|
|
|
|
|
|
|
|
|
|
|
|
|
|
|
|
|
|
|
|
|
|
|
|
( |
) |
|
|
|
|
|
|
|
|
|
|
Park Place at San Mateo (fka San Mateo) |
|
|
|
G |
|
|
2001 |
|
|
|
|
|
|
|
|
|
|
|
|
|
|
|
|
|
|
|
|
|
|
|
|
|
|
|
|
|
|
( |
) |
|
|
|
|
|
(H) |
|
||
|
Skyhouse Denver |
|
|
|
G |
|
|
2017 |
|
|
|
|
|
|
|
|
|
|
|
|
|
|
|
|
|
|
|
|
|
|
|
|
|
|
|
|
|
|
( |
) |
|
|
|
|
|
|
|
|
|
|
SoMa Square Apartments (fka South Market) |
|
|
|
G |
|
|
1986 |
|
|
|
|
|
|
|
|
|
|
|
|
|
|
|
|
|
|
|
|
|
|
|
|
|
|
|
|
|
|
( |
) |
|
|
|
|
|
(H) |
|
||
|
Teresina |
|
|
|
|
— |
|
|
2000 |
|
|
|
|
|
|
|
|
|
|
|
|
|
|
|
|
|
|
|
|
|
|
|
|
|
|
|
|
|
|
( |
) |
|
|
|
|
|
|
|
|
|
Vantage Hollywood |
|
|
|
|
— |
|
|
1987 |
|
|
|
|
|
|
|
|
|
|
|
|
|
|
|
|
|
|
|
|
|
|
|
|
|
|
|
|
|
|
( |
) |
|
|
|
|
|
|
|
|
|
Vintage |
|
|
|
|
— |
|
|
2005-2007 |
|
|
|
|
|
|
|
|
|
|
|
|
|
|
|
|
|
|
|
|
|
|
|
|
|
|
|
|
|
|
( |
) |
|
|
|
|
|
|
|
|
|
Vintage at 425 Broadway (fka Promenade) |
|
|
|
G |
|
|
1934/2001 |
|
|
|
|
|
|
|
|
|
|
|
|
|
|
|
|
|
|
|
|
|
|
|
|
|
|
|
|
|
|
( |
) |
|
|
|
|
|
(H) |
|
||
|
West 54th |
|
|
|
G |
|
|
2001 |
|
|
|
|
|
|
|
|
|
|
|
|
|
|
|
|
|
|
|
|
|
|
|
|
|
|
|
|
|
|
( |
) |
|
|
|
|
|
|
|
|
|
|
Portfolio/Entity Encumbrances (1) |
|
|
|
|
|
|
|
|
|
|
|
|
|
|
|
|
|
|
|
|
|
|
|
|
|
|
|
|
|
|
|
|
|
|
|
|
|
|
|
|
|
|
|
|
|
|
|
|
|
Wholly Owned Encumbered |
|
|
|
|
|
|
|
|
|
|
|
|
|
|
|
|
|
|
|
|
|
|
|
|
|
|
|
|
|
|
|
|
|
|
|
|
|
|
( |
) |
|
|
|
|
|
|
|
|
S-10
EQUITY RESIDENTIAL
ERP OPERATING LIMITED PARTNERSHIP
Schedule III - Real Estate and Accumulated Depreciation
December 31, 2021
|
Description |
|
|
Initial Cost to Company |
|
|
Cost Capitalized Subsequent to Acquisition (Improvements, net) (E) |
|
|
Gross Amount Carried at Close of Period 12/31/21 |
|
|
|
|
|||||||||||||||||||||||||||||||||||
|
Apartment Name |
|
Location |
|
Non-Residential Components |
|
|
Date of Construction |
|
Apartment Units |
|
|
Land |
|
|
Building & Fixtures |
|
|
Building & Fixtures |
|
|
Land |
|
|
Building & Fixtures (A) |
|
|
Total (B) |
|
|
Accumulated Depreciation (C) |
|
|
Investment in Real Estate, Net at 12/31/21 |
|
|
Encumbrances |
|
|||||||||||
|
Partially Owned Unencumbered: |
|
|
|
|
|
|
|
|
|
|
|
|
|
|
|
|
|
|
|
|
|
|
|
|
|
|
|
|
|
|
|
|
|
|
|
|
|
|
|
|
|
|
|
|
|
|
|
|
|
2300 Elliott |
|
|
|
G |
|
|
1992 |
|
|
|
|
|
|
|
|
|
|
|
|
|
|
|
|
|
|
|
|
|
|
|
|
|
|
|
|
|
|
( |
) |
|
|
|
|
|
|
|
|
|
|
Bellevue Meadows |
|
|
|
|
— |
|
|
1983 |
|
|
|
|
|
|
|
|
|
|
|
|
|
|
|
|
|
|
|
|
|
|
|
|
|
|
|
|
|
|
( |
) |
|
|
|
|
|
|
|
|
|
Canyon Ridge |
|
|
|
|
— |
|
|
1989 |
|
|
|
|
|
|
|
|
|
|
|
|
|
|
|
|
|
|
|
|
|
|
|
|
|
|
|
|
|
|
( |
) |
|
|
|
|
|
|
|
|
|
Country Oaks |
|
|
|
|
— |
|
|
1985 |
|
|
|
|
|
|
|
|
|
|
|
|
|
|
|
|
|
|
|
|
|
|
|
|
|
|
|
|
|
|
( |
) |
|
|
|
|
|
|
|
|
|
Harrison Square (fka Elliot Bay) |
|
|
|
G |
|
|
1992 |
|
|
|
|
|
|
|
|
|
|
|
|
|
|
|
|
|
|
|
|
|
|
|
|
|
|
|
|
|
|
( |
) |
|
|
|
|
|
|
|
|
|
|
Lantern Cove |
|
|
|
|
— |
|
|
1985 |
|
|
|
|
|
|
|
|
|
|
|
|
|
|
|
|
|
|
|
|
|
|
|
|
|
|
|
|
|
|
( |
) |
|
|
|
|
|
|
|
|
|
Radius Koreatown |
|
|
|
|
— |
|
|
2014/2016 |
|
|
|
|
|
|
|
|
|
|
|
|
|
|
|
|
|
|
|
|
|
|
|
|
|
|
|
|
|
|
( |
) |
|
|
|
|
|
|
|
|
|
Rosecliff |
|
|
|
|
— |
|
|
1990 |
|
|
|
|
|
|
|
|
|
|
|
|
|
|
|
|
|
|
|
|
|
|
|
|
|
|
|
|
|
|
( |
) |
|
|
|
|
|
|
|
|
|
Schooner Bay I |
|
|
|
|
— |
|
|
1985 |
|
|
|
|
|
|
|
|
|
|
|
|
|
|
|
|
|
|
|
|
|
|
|
|
|
|
|
|
|
|
( |
) |
|
|
|
|
|
|
|
|
|
Schooner Bay II |
|
|
|
|
— |
|
|
1985 |
|
|
|
|
|
|
|
|
|
|
|
|
|
|
|
|
|
|
|
|
|
|
|
|
|
|
|
|
|
|
( |
) |
|
|
|
|
|
|
|
|
|
St Johns West |
|
|
|
|
— |
|
|
2020 |
|
|
|
|
|
|
|
|
|
|
|
|
|
|
|
|
|
|
|
|
|
|
|
|
|
|
|
|
|
|
( |
) |
|
|
|
|
|
|
|
|
|
Venn at Main |
|
|
|
G |
|
|
2016 |
|
|
|
|
|
|
|
|
|
|
|
|
|
|
|
|
|
|
|
|
|
|
|
|
|
|
|
|
|
|
( |
) |
|
|
|
|
|
|
|
|
|
|
Virgil Square |
|
|
|
|
— |
|
|
1979 |
|
|
|
|
|
|
|
|
|
|
|
|
|
|
|
|
|
|
|
|
|
|
|
|
|
|
|
|
|
|
( |
) |
|
|
|
|
|
|
|
|
|
Partially Owned Unencumbered |
|
|
|
|
|
|
|
|
|
|
|
|
|
|
|
|
|
|
|
|
|
|
|
|
|
|
|
|
|
|
|
|
|
|
|
|
|
|
( |
) |
|
|
|
|
|
|
|
|
|
|
|
|
|
|
|
|
|
|
|
|
|
|
|
|
|
|
|
|
|
|
|
|
|
|
|
|
|
|
|
|
|
|
|
|
|
|
|
|
|
|
|
|
|
|
|
|
|
|
|
Partially Owned Encumbered: |
|
|
|
|
|
|
|
|
|
|
|
|
|
|
|
|
|
|
|
|
|
|
|
|
|
|
|
|
|
|
|
|
|
|
|
|
|
|
|
|
|
|
|
|
|
|
|
|
|
9th & W |
|
|
|
G |
|
|
(F) |
|
|
|
|
|
|
|
|
|
|
|
|
|
|
|
|
|
|
|
|
|
|
|
|
|
|
|
|
|
|
|
|
|
|
|
|
|
|
( |
) |
|
|
Aero Apartments |
|
|
|
G |
|
|
2021 |
|
|
|
|
|
|
|
|
|
|
|
|
|
|
|
|
|
|
|
|
|
|
|
|
|
|
|
|
|
|
( |
) |
|
|
|
|
|
|
|
|
|
|
Canyon Creek (CA) |
|
|
|
|
— |
|
|
1984 |
|
|
|
|
|
|
|
|
|
|
|
|
|
|
|
|
|
|
|
|
|
|
|
|
|
|
|
|
|
|
( |
) |
|
|
|
|
|
|
|
|
|
Wisconsin Place |
|
|
|
|
— |
|
|
2009 |
|
|
|
|
|
|
|
|
|
|
|
|
|
|
|
|
|
|
|
|
|
|
|
|
|
|
|
|
|
|
( |
) |
|
|
|
|
|
|
|
|
|
Partially Owned Encumbered |
|
|
|
|
|
|
|
|
|
|
|
|
|
|
|
|
|
|
|
|
|
|
|
|
|
|
|
|
|
|
|
|
|
|
|
|
|
|
( |
) |
|
|
|
|
|
|
|
|
|
|
|
|
|
|
|
|
|
|
|
|
|
|
|
|
|
|
|
|
|
|
|
|
|
|
|
|
|
|
|
|
|
|
|
|
|
|
|
|
|
|
|
|
|
|
|
|
|
|
|
Total Consolidated Investment in Real Estate |
|
|
|
|
|
|
|
|
|
|
|
|
|
$ |
|
|
|
$ |
|
|
|
$ |
|
|
|
$ |
|
|
|
$ |
|
|
|
$ |
|
|
|
$ |
( |
) |
|
$ |
|
|
|
$ |
|
|
(1)See attached Encumbrances Reconciliation.
S-11
EQUITY RESIDENTIAL
ERP OPERATING LIMITED PARTNERSHIP
Schedule III - Real Estate and Accumulated Depreciation
December 31, 2021
NOTES:
|
|
(A) |
The balance of furniture & fixtures included in the total investment in real estate amount was $ |
|
|
(B) |
The cost, net of accumulated depreciation, for Federal Income Tax purposes as of December 31, 2021 was approximately $ |
|
|
(C) |
The life to compute depreciation for building is |
|
|
(D) |
This asset consists of costs owned by the Management Business acquired/added at various acquisition dates and largely represents furniture, fixtures and equipment and computer equipment and software costs, which are generally depreciated over periods ranging from 3 to |
|
|
(E) |
Primarily represents capital expenditures for building improvements, replacements and renovations incurred subsequent to each property’s acquisition date. |
|
|
(F) |
Primarily represents land and/or construction-in-progress on projects either held for future development or projects currently under development. |
|
|
(G) |
A portion of these properties includes and/or will include non-residential components (consisting of retail and/or public parking garage operations). |
|
|
(H) |
See Encumbrances Reconciliation schedule. |
|
|
(I) |
Boot property for Bond Partnership mortgage pool. |
S-12