00000904982021FYfalsehttp://fasb.org/us-gaap/2021-01-31#AccountingStandardsUpdate201613MemberP1Yhttp://simmonsbank.com/20211231#PropertyPlantandEquipmentandRightofUseAssetafterAccumulatedDepreciationandAmortizationhttp://simmonsbank.com/20211231#PropertyPlantandEquipmentandRightofUseAssetafterAccumulatedDepreciationandAmortizationhttp://fasb.org/us-gaap/2021-01-31#AccountsPayableAndAccruedLiabilitiesCurrentAndNoncurrenthttp://fasb.org/us-gaap/2021-01-31#AccountsPayableAndAccruedLiabilitiesCurrentAndNoncurrent00000904982021-01-012021-12-3100000904982021-06-30iso4217:USD00000904982022-02-22xbrli:shares00000904982021-12-3100000904982020-12-31iso4217:USDxbrli:shares00000904982020-01-012020-12-3100000904982019-01-012019-12-310000090498us-gaap:FiduciaryAndTrustMember2021-01-012021-12-310000090498us-gaap:FiduciaryAndTrustMember2020-01-012020-12-310000090498us-gaap:FiduciaryAndTrustMember2019-01-012019-12-310000090498us-gaap:DepositAccountMember2021-01-012021-12-310000090498us-gaap:DepositAccountMember2020-01-012020-12-310000090498us-gaap:DepositAccountMember2019-01-012019-12-310000090498us-gaap:FinancialServiceOtherMember2021-01-012021-12-310000090498us-gaap:FinancialServiceOtherMember2020-01-012020-12-310000090498us-gaap:FinancialServiceOtherMember2019-01-012019-12-310000090498sfnc:MortgageLoansMember2021-01-012021-12-310000090498sfnc:MortgageLoansMember2020-01-012020-12-310000090498sfnc:MortgageLoansMember2019-01-012019-12-310000090498us-gaap:CreditAndDebitCardMember2021-01-012021-12-310000090498us-gaap:CreditAndDebitCardMember2020-01-012020-12-310000090498us-gaap:CreditAndDebitCardMember2019-01-012019-12-3100000904982019-12-3100000904982018-12-310000090498us-gaap:PreferredStockMember2018-12-310000090498us-gaap:CommonStockMember2018-12-310000090498us-gaap:AdditionalPaidInCapitalMember2018-12-310000090498us-gaap:AccumulatedOtherComprehensiveIncomeMember2018-12-310000090498us-gaap:RetainedEarningsMember2018-12-310000090498us-gaap:AccumulatedOtherComprehensiveIncomeMember2019-01-012019-12-310000090498us-gaap:RetainedEarningsMember2019-01-012019-12-310000090498us-gaap:CommonStockMember2019-01-012019-12-310000090498us-gaap:AdditionalPaidInCapitalMember2019-01-012019-12-310000090498sfnc:RelianceBancsharesInc.Member2019-01-012019-12-310000090498us-gaap:PreferredStockMembersfnc:RelianceBancsharesInc.Member2019-01-012019-12-310000090498us-gaap:CommonStockMembersfnc:RelianceBancsharesInc.Member2019-01-012019-12-310000090498us-gaap:AdditionalPaidInCapitalMembersfnc:RelianceBancsharesInc.Member2019-01-012019-12-310000090498sfnc:LandrumCompanyMember2019-01-012019-12-310000090498sfnc:LandrumCompanyMemberus-gaap:PreferredStockMember2019-01-012019-12-310000090498sfnc:LandrumCompanyMemberus-gaap:CommonStockMember2019-01-012019-12-310000090498sfnc:LandrumCompanyMemberus-gaap:AdditionalPaidInCapitalMember2019-01-012019-12-310000090498us-gaap:PreferredStockMember2019-01-012019-12-310000090498us-gaap:PreferredStockMember2019-12-310000090498us-gaap:CommonStockMember2019-12-310000090498us-gaap:AdditionalPaidInCapitalMember2019-12-310000090498us-gaap:AccumulatedOtherComprehensiveIncomeMember2019-12-310000090498us-gaap:RetainedEarningsMember2019-12-310000090498srt:CumulativeEffectPeriodOfAdoptionAdjustmentMemberus-gaap:RetainedEarningsMember2019-12-310000090498srt:CumulativeEffectPeriodOfAdoptionAdjustmentMember2019-12-310000090498us-gaap:AccumulatedOtherComprehensiveIncomeMember2020-01-012020-12-310000090498us-gaap:RetainedEarningsMember2020-01-012020-12-310000090498us-gaap:CommonStockMember2020-01-012020-12-310000090498us-gaap:AdditionalPaidInCapitalMember2020-01-012020-12-310000090498us-gaap:PreferredStockMember2020-12-310000090498us-gaap:CommonStockMember2020-12-310000090498us-gaap:AdditionalPaidInCapitalMember2020-12-310000090498us-gaap:AccumulatedOtherComprehensiveIncomeMember2020-12-310000090498us-gaap:RetainedEarningsMember2020-12-310000090498us-gaap:AccumulatedOtherComprehensiveIncomeMember2021-01-012021-12-310000090498us-gaap:RetainedEarningsMember2021-01-012021-12-310000090498us-gaap:CommonStockMember2021-01-012021-12-310000090498us-gaap:AdditionalPaidInCapitalMember2021-01-012021-12-310000090498sfnc:LandmarkBankMember2021-01-012021-12-310000090498us-gaap:CommonStockMembersfnc:LandmarkBankMember2021-01-012021-12-310000090498sfnc:LandmarkBankMemberus-gaap:AdditionalPaidInCapitalMember2021-01-012021-12-310000090498sfnc:TriumphMember2021-01-012021-12-310000090498us-gaap:CommonStockMembersfnc:TriumphMember2021-01-012021-12-310000090498us-gaap:AdditionalPaidInCapitalMembersfnc:TriumphMember2021-01-012021-12-310000090498us-gaap:PreferredStockMember2021-01-012021-12-310000090498us-gaap:PreferredStockMember2021-12-310000090498us-gaap:CommonStockMember2021-12-310000090498us-gaap:AdditionalPaidInCapitalMember2021-12-310000090498us-gaap:AccumulatedOtherComprehensiveIncomeMember2021-12-310000090498us-gaap:RetainedEarningsMember2021-12-31sfnc:centersfnc:segment0000090498us-gaap:EmployeeStockOptionMember2019-01-012019-12-310000090498us-gaap:EmployeeStockOptionMember2021-01-012021-12-310000090498us-gaap:EmployeeStockOptionMember2020-01-012020-12-310000090498sfnc:LandmarkCommunityBankMember2021-10-082021-10-080000090498sfnc:LandmarkCommunityBankMember2021-10-08sfnc:branch0000090498sfnc:LandmarkCommunityBankMember2019-10-300000090498sfnc:LandmarkCommunityBankMembersfnc:FairValueAdjustmentsMember2019-10-310000090498sfnc:LandmarkCommunityBankMember2019-10-310000090498sfnc:LandmarkCommunityBankMembersfnc:CoreDepositPremiumMember2019-10-300000090498sfnc:LandmarkCommunityBankMembersfnc:FairValueAdjustmentsMembersfnc:CoreDepositPremiumMember2019-10-310000090498sfnc:LandmarkCommunityBankMembersfnc:CoreDepositPremiumMember2019-10-310000090498sfnc:LandmarkCommunityBankMember2019-10-312019-10-310000090498sfnc:TriumphBancsharesIncMember2021-10-082021-10-080000090498sfnc:TriumphBancsharesIncMember2021-10-080000090498sfnc:TriumphBancsharesIncMember2019-10-300000090498sfnc:TriumphBancsharesIncMembersfnc:FairValueAdjustmentsMember2019-10-310000090498sfnc:TriumphBancsharesIncMember2019-10-310000090498sfnc:TriumphBancsharesIncMembersfnc:CoreDepositPremiumMember2019-10-300000090498sfnc:TriumphBancsharesIncMembersfnc:FairValueAdjustmentsMembersfnc:CoreDepositPremiumMember2019-10-310000090498sfnc:TriumphBancsharesIncMembersfnc:CoreDepositPremiumMember2019-10-310000090498sfnc:TriumphBancsharesIncMember2019-10-312019-10-310000090498sfnc:LandrumCompanyMemberus-gaap:CommonClassAMember2019-10-310000090498us-gaap:PreferredClassBMembersfnc:LandrumCompanyMember2019-10-310000090498sfnc:LandrumCompanyMemberus-gaap:SeriesEPreferredStockMember2019-10-312019-10-310000090498sfnc:LandrumCompanyMemberus-gaap:SeriesDPreferredStockMember2019-10-312019-10-31xbrli:pure0000090498sfnc:LandrumCompanyMember2019-10-312019-10-310000090498sfnc:LandrumCompanyMemberus-gaap:PreferredStockMember2019-10-312019-10-310000090498sfnc:LandrumCompanyMemberus-gaap:SeriesDPreferredStockMember2019-10-310000090498sfnc:LandrumCompanyMember2019-10-300000090498sfnc:LandrumCompanyMember2019-10-310000090498sfnc:LandrumCompanyMembersfnc:FairValueAdjustmentsMember2019-10-310000090498sfnc:LandrumCompanyMembersfnc:CoreDepositPremiumMember2019-10-300000090498sfnc:LandrumCompanyMembersfnc:FairValueAdjustmentsMembersfnc:CoreDepositPremiumMember2019-10-310000090498sfnc:LandrumCompanyMembersfnc:CoreDepositPremiumMember2019-10-310000090498sfnc:LandrumCompanyMemberus-gaap:OtherIntangibleAssetsMember2019-10-300000090498sfnc:LandrumCompanyMembersfnc:FairValueAdjustmentsMemberus-gaap:OtherIntangibleAssetsMember2019-10-310000090498sfnc:LandrumCompanyMemberus-gaap:OtherIntangibleAssetsMember2019-10-310000090498sfnc:SeriesAorBPreferredStockMembersfnc:RelianceBancsharesInc.Member2019-04-122019-04-120000090498us-gaap:SeriesCPreferredStockMembersfnc:RelianceBancsharesInc.Member2019-04-122019-04-120000090498sfnc:RelianceBancsharesInc.Member2019-04-122019-04-120000090498us-gaap:SeriesCPreferredStockMembersfnc:RelianceBancsharesInc.Member2019-10-290000090498sfnc:RelianceBancsharesInc.Member2019-04-110000090498sfnc:RelianceBancsharesInc.Member2019-04-120000090498sfnc:FairValueAdjustmentsMembersfnc:RelianceBancsharesInc.Member2019-04-120000090498sfnc:SpiritOfTexasBancsharesIncMember2021-11-192021-11-190000090498sfnc:SpiritOfTexasBancsharesIncMember2021-11-170000090498sfnc:SpiritOfTexasBancsharesIncMember2021-11-19sfnc:loan00000904982021-07-012021-09-300000090498us-gaap:USGovernmentAgenciesDebtSecuritiesMember2021-12-310000090498us-gaap:MortgageBackedSecuritiesIssuedByPrivateEnterprisesMember2021-12-310000090498us-gaap:USStatesAndPoliticalSubdivisionsMember2021-12-310000090498sfnc:OtherSecuritiesMember2021-12-310000090498us-gaap:MortgageBackedSecuritiesIssuedByPrivateEnterprisesMember2020-12-310000090498us-gaap:USStatesAndPoliticalSubdivisionsMember2020-12-310000090498sfnc:OtherSecuritiesMember2020-12-310000090498us-gaap:CommercialMortgageBackedSecuritiesMember2021-12-310000090498us-gaap:ResidentialMortgageBackedSecuritiesMember2021-12-310000090498us-gaap:CommercialMortgageBackedSecuritiesMember2020-12-310000090498us-gaap:ResidentialMortgageBackedSecuritiesMember2020-12-310000090498us-gaap:USTreasurySecuritiesMember2021-12-310000090498us-gaap:USGovernmentAgenciesDebtSecuritiesMember2020-12-310000090498us-gaap:USStatesAndPoliticalSubdivisionsMember2021-01-012021-12-310000090498sfnc:OtherSecuritiesMember2021-01-012021-12-310000090498us-gaap:USStatesAndPoliticalSubdivisionsMember2019-12-310000090498sfnc:OtherSecuritiesMember2019-12-310000090498us-gaap:USStatesAndPoliticalSubdivisionsMembersrt:CumulativeEffectPeriodOfAdoptionAdjustmentMember2019-12-310000090498sfnc:OtherSecuritiesMembersrt:CumulativeEffectPeriodOfAdoptionAdjustmentMember2019-12-310000090498us-gaap:USStatesAndPoliticalSubdivisionsMember2020-01-012020-12-310000090498sfnc:OtherSecuritiesMember2020-01-012020-12-310000090498sfnc:BondAaaAAARatingMembersfnc:NotGuaranteedorPreRefundedMemberus-gaap:USStatesAndPoliticalSubdivisionsMember2021-12-310000090498sfnc:BondAaaAAARatingMemberus-gaap:USStatesAndPoliticalSubdivisionsMembersfnc:OtherCreditEnhancementorInsuranceMember2021-12-310000090498sfnc:BondAaaAAARatingMemberus-gaap:USStatesAndPoliticalSubdivisionsMembersfnc:PreRefundedMember2021-12-310000090498sfnc:BondAaaAAARatingMemberus-gaap:USStatesAndPoliticalSubdivisionsMember2021-12-310000090498sfnc:BondAaaAAARatingMembersfnc:OtherSecuritiesMember2021-12-310000090498sfnc:BondAaAARatingMembersfnc:NotGuaranteedorPreRefundedMemberus-gaap:USStatesAndPoliticalSubdivisionsMember2021-12-310000090498sfnc:BondAaAARatingMemberus-gaap:USStatesAndPoliticalSubdivisionsMembersfnc:OtherCreditEnhancementorInsuranceMember2021-12-310000090498sfnc:BondAaAARatingMemberus-gaap:USStatesAndPoliticalSubdivisionsMembersfnc:PreRefundedMember2021-12-310000090498sfnc:BondAaAARatingMemberus-gaap:USStatesAndPoliticalSubdivisionsMember2021-12-310000090498sfnc:BondAaAARatingMembersfnc:OtherSecuritiesMember2021-12-310000090498sfnc:NotGuaranteedorPreRefundedMemberus-gaap:USStatesAndPoliticalSubdivisionsMembersfnc:BondARatingMember2021-12-310000090498us-gaap:USStatesAndPoliticalSubdivisionsMembersfnc:OtherCreditEnhancementorInsuranceMembersfnc:BondARatingMember2021-12-310000090498us-gaap:USStatesAndPoliticalSubdivisionsMembersfnc:PreRefundedMembersfnc:BondARatingMember2021-12-310000090498us-gaap:USStatesAndPoliticalSubdivisionsMembersfnc:BondARatingMember2021-12-310000090498sfnc:OtherSecuritiesMembersfnc:BondARatingMember2021-12-310000090498sfnc:NotGuaranteedorPreRefundedMemberus-gaap:USStatesAndPoliticalSubdivisionsMembersfnc:BondBaaBBBRatingMember2021-12-310000090498us-gaap:USStatesAndPoliticalSubdivisionsMembersfnc:BondBaaBBBRatingMembersfnc:OtherCreditEnhancementorInsuranceMember2021-12-310000090498us-gaap:USStatesAndPoliticalSubdivisionsMembersfnc:BondBaaBBBRatingMembersfnc:PreRefundedMember2021-12-310000090498us-gaap:USStatesAndPoliticalSubdivisionsMembersfnc:BondBaaBBBRatingMember2021-12-310000090498sfnc:BondBaaBBBRatingMembersfnc:OtherSecuritiesMember2021-12-310000090498sfnc:NotGuaranteedorPreRefundedMemberus-gaap:USStatesAndPoliticalSubdivisionsMembersfnc:BondNotRatedMember2021-12-310000090498us-gaap:USStatesAndPoliticalSubdivisionsMembersfnc:BondNotRatedMembersfnc:OtherCreditEnhancementorInsuranceMember2021-12-310000090498us-gaap:USStatesAndPoliticalSubdivisionsMembersfnc:BondNotRatedMembersfnc:PreRefundedMember2021-12-310000090498us-gaap:USStatesAndPoliticalSubdivisionsMembersfnc:BondNotRatedMember2021-12-310000090498sfnc:BondNotRatedMembersfnc:OtherSecuritiesMember2021-12-310000090498sfnc:NotGuaranteedorPreRefundedMemberus-gaap:USStatesAndPoliticalSubdivisionsMember2021-12-310000090498us-gaap:USStatesAndPoliticalSubdivisionsMembersfnc:OtherCreditEnhancementorInsuranceMember2021-12-310000090498us-gaap:USStatesAndPoliticalSubdivisionsMembersfnc:PreRefundedMember2021-12-310000090498us-gaap:HeldtomaturitySecuritiesMember2021-01-012021-12-310000090498us-gaap:HeldtomaturitySecuritiesMember2020-01-012020-12-310000090498us-gaap:HeldtomaturitySecuritiesMember2019-01-012019-12-310000090498us-gaap:AvailableforsaleSecuritiesMember2021-01-012021-12-310000090498us-gaap:AvailableforsaleSecuritiesMember2020-01-012020-12-310000090498us-gaap:AvailableforsaleSecuritiesMember2019-01-012019-12-310000090498us-gaap:BondsMember2021-01-012021-12-310000090498us-gaap:BondsMember2020-01-012020-12-310000090498sfnc:TexasBranchesMember2020-02-280000090498sfnc:TexasBranchesMemberus-gaap:DisposalGroupHeldforsaleNotDiscontinuedOperationsMember2020-02-280000090498sfnc:ColoradoBranchesMember2020-05-180000090498sfnc:ColoradoBranchesMemberus-gaap:DisposalGroupHeldforsaleNotDiscontinuedOperationsMember2020-05-180000090498sfnc:TexasAndColoradoBranchesMemberus-gaap:DisposalGroupHeldforsaleNotDiscontinuedOperationsMember2020-01-012020-12-310000090498sfnc:IllinoisBranchMember2021-03-120000090498sfnc:IllinoisBranchMemberus-gaap:DisposalGroupHeldforsaleNotDiscontinuedOperationsMember2021-03-120000090498sfnc:IllinoisBranchMemberus-gaap:DisposalGroupHeldforsaleNotDiscontinuedOperationsMember2021-01-012021-12-310000090498us-gaap:DisposalGroupHeldforsaleNotDiscontinuedOperationsMember2021-12-310000090498us-gaap:CreditCardReceivablesMemberus-gaap:ConsumerPortfolioSegmentMember2021-12-310000090498us-gaap:CreditCardReceivablesMemberus-gaap:ConsumerPortfolioSegmentMember2020-12-310000090498us-gaap:ConsumerPortfolioSegmentMembersfnc:OtherConsumerLoansMember2021-12-310000090498us-gaap:ConsumerPortfolioSegmentMembersfnc:OtherConsumerLoansMember2020-12-310000090498us-gaap:ConsumerPortfolioSegmentMember2021-12-310000090498us-gaap:ConsumerPortfolioSegmentMember2020-12-310000090498us-gaap:ConstructionLoansMembersfnc:RealEstatePortfolioSegmentMember2021-12-310000090498us-gaap:ConstructionLoansMembersfnc:RealEstatePortfolioSegmentMember2020-12-310000090498sfnc:RealEstatePortfolioSegmentMembersrt:SingleFamilyMember2021-12-310000090498sfnc:RealEstatePortfolioSegmentMembersrt:SingleFamilyMember2020-12-310000090498sfnc:OtherCommercialLoansMembersfnc:RealEstatePortfolioSegmentMember2021-12-310000090498sfnc:OtherCommercialLoansMembersfnc:RealEstatePortfolioSegmentMember2020-12-310000090498sfnc:RealEstatePortfolioSegmentMember2021-12-310000090498sfnc:RealEstatePortfolioSegmentMember2020-12-310000090498us-gaap:CommercialPortfolioSegmentMembersfnc:CommercialLoansMember2021-12-310000090498us-gaap:CommercialPortfolioSegmentMembersfnc:CommercialLoansMember2020-12-310000090498sfnc:AgriculturalLoansMemberus-gaap:CommercialPortfolioSegmentMember2021-12-310000090498sfnc:AgriculturalLoansMemberus-gaap:CommercialPortfolioSegmentMember2020-12-310000090498us-gaap:CommercialPortfolioSegmentMember2021-12-310000090498us-gaap:CommercialPortfolioSegmentMember2020-12-310000090498us-gaap:UnallocatedFinancingReceivablesMember2021-12-310000090498us-gaap:UnallocatedFinancingReceivablesMember2020-12-310000090498srt:MinimumMember2021-01-012021-12-310000090498srt:MaximumMember2021-01-012021-12-310000090498sfnc:COVID19PandemicMember2021-12-310000090498sfnc:COVID19PandemicMember2020-12-310000090498us-gaap:CreditCardReceivablesMemberus-gaap:ConsumerPortfolioSegmentMembersfnc:FinancingReceivables30To89DaysPastDueMember2021-12-310000090498us-gaap:FinancingReceivablesEqualToGreaterThan90DaysPastDueMemberus-gaap:CreditCardReceivablesMemberus-gaap:ConsumerPortfolioSegmentMember2021-12-310000090498us-gaap:FinancialAssetPastDueMemberus-gaap:CreditCardReceivablesMemberus-gaap:ConsumerPortfolioSegmentMember2021-12-310000090498us-gaap:FinancialAssetNotPastDueMemberus-gaap:CreditCardReceivablesMemberus-gaap:ConsumerPortfolioSegmentMember2021-12-310000090498us-gaap:ConsumerPortfolioSegmentMembersfnc:OtherConsumerLoansMembersfnc:FinancingReceivables30To89DaysPastDueMember2021-12-310000090498us-gaap:FinancingReceivablesEqualToGreaterThan90DaysPastDueMemberus-gaap:ConsumerPortfolioSegmentMembersfnc:OtherConsumerLoansMember2021-12-310000090498us-gaap:FinancialAssetPastDueMemberus-gaap:ConsumerPortfolioSegmentMembersfnc:OtherConsumerLoansMember2021-12-310000090498us-gaap:FinancialAssetNotPastDueMemberus-gaap:ConsumerPortfolioSegmentMembersfnc:OtherConsumerLoansMember2021-12-310000090498us-gaap:ConsumerPortfolioSegmentMembersfnc:FinancingReceivables30To89DaysPastDueMember2021-12-310000090498us-gaap:FinancingReceivablesEqualToGreaterThan90DaysPastDueMemberus-gaap:ConsumerPortfolioSegmentMember2021-12-310000090498us-gaap:FinancialAssetPastDueMemberus-gaap:ConsumerPortfolioSegmentMember2021-12-310000090498us-gaap:FinancialAssetNotPastDueMemberus-gaap:ConsumerPortfolioSegmentMember2021-12-310000090498us-gaap:ConstructionLoansMembersfnc:RealEstatePortfolioSegmentMembersfnc:FinancingReceivables30To89DaysPastDueMember2021-12-310000090498us-gaap:FinancingReceivablesEqualToGreaterThan90DaysPastDueMemberus-gaap:ConstructionLoansMembersfnc:RealEstatePortfolioSegmentMember2021-12-310000090498us-gaap:FinancialAssetPastDueMemberus-gaap:ConstructionLoansMembersfnc:RealEstatePortfolioSegmentMember2021-12-310000090498us-gaap:ConstructionLoansMemberus-gaap:FinancialAssetNotPastDueMembersfnc:RealEstatePortfolioSegmentMember2021-12-310000090498sfnc:RealEstatePortfolioSegmentMembersrt:SingleFamilyMembersfnc:FinancingReceivables30To89DaysPastDueMember2021-12-310000090498us-gaap:FinancingReceivablesEqualToGreaterThan90DaysPastDueMembersfnc:RealEstatePortfolioSegmentMembersrt:SingleFamilyMember2021-12-310000090498us-gaap:FinancialAssetPastDueMembersfnc:RealEstatePortfolioSegmentMembersrt:SingleFamilyMember2021-12-310000090498us-gaap:FinancialAssetNotPastDueMembersfnc:RealEstatePortfolioSegmentMembersrt:SingleFamilyMember2021-12-310000090498sfnc:OtherCommercialLoansMembersfnc:RealEstatePortfolioSegmentMembersfnc:FinancingReceivables30To89DaysPastDueMember2021-12-310000090498us-gaap:FinancingReceivablesEqualToGreaterThan90DaysPastDueMembersfnc:OtherCommercialLoansMembersfnc:RealEstatePortfolioSegmentMember2021-12-310000090498us-gaap:FinancialAssetPastDueMembersfnc:OtherCommercialLoansMembersfnc:RealEstatePortfolioSegmentMember2021-12-310000090498us-gaap:FinancialAssetNotPastDueMembersfnc:OtherCommercialLoansMembersfnc:RealEstatePortfolioSegmentMember2021-12-310000090498sfnc:RealEstatePortfolioSegmentMembersfnc:FinancingReceivables30To89DaysPastDueMember2021-12-310000090498us-gaap:FinancingReceivablesEqualToGreaterThan90DaysPastDueMembersfnc:RealEstatePortfolioSegmentMember2021-12-310000090498us-gaap:FinancialAssetPastDueMembersfnc:RealEstatePortfolioSegmentMember2021-12-310000090498us-gaap:FinancialAssetNotPastDueMembersfnc:RealEstatePortfolioSegmentMember2021-12-310000090498us-gaap:CommercialPortfolioSegmentMembersfnc:CommercialLoansMembersfnc:FinancingReceivables30To89DaysPastDueMember2021-12-310000090498us-gaap:FinancingReceivablesEqualToGreaterThan90DaysPastDueMemberus-gaap:CommercialPortfolioSegmentMembersfnc:CommercialLoansMember2021-12-310000090498us-gaap:FinancialAssetPastDueMemberus-gaap:CommercialPortfolioSegmentMembersfnc:CommercialLoansMember2021-12-310000090498us-gaap:FinancialAssetNotPastDueMemberus-gaap:CommercialPortfolioSegmentMembersfnc:CommercialLoansMember2021-12-310000090498sfnc:AgriculturalLoansMemberus-gaap:CommercialPortfolioSegmentMembersfnc:FinancingReceivables30To89DaysPastDueMember2021-12-310000090498us-gaap:FinancingReceivablesEqualToGreaterThan90DaysPastDueMembersfnc:AgriculturalLoansMemberus-gaap:CommercialPortfolioSegmentMember2021-12-310000090498us-gaap:FinancialAssetPastDueMembersfnc:AgriculturalLoansMemberus-gaap:CommercialPortfolioSegmentMember2021-12-310000090498sfnc:AgriculturalLoansMemberus-gaap:FinancialAssetNotPastDueMemberus-gaap:CommercialPortfolioSegmentMember2021-12-310000090498us-gaap:CommercialPortfolioSegmentMembersfnc:FinancingReceivables30To89DaysPastDueMember2021-12-310000090498us-gaap:FinancingReceivablesEqualToGreaterThan90DaysPastDueMemberus-gaap:CommercialPortfolioSegmentMember2021-12-310000090498us-gaap:FinancialAssetPastDueMemberus-gaap:CommercialPortfolioSegmentMember2021-12-310000090498us-gaap:FinancialAssetNotPastDueMemberus-gaap:CommercialPortfolioSegmentMember2021-12-310000090498us-gaap:UnallocatedFinancingReceivablesMembersfnc:FinancingReceivables30To89DaysPastDueMember2021-12-310000090498us-gaap:FinancingReceivablesEqualToGreaterThan90DaysPastDueMemberus-gaap:UnallocatedFinancingReceivablesMember2021-12-310000090498us-gaap:FinancialAssetPastDueMemberus-gaap:UnallocatedFinancingReceivablesMember2021-12-310000090498us-gaap:UnallocatedFinancingReceivablesMemberus-gaap:FinancialAssetNotPastDueMember2021-12-310000090498sfnc:FinancingReceivables30To89DaysPastDueMember2021-12-310000090498us-gaap:FinancingReceivablesEqualToGreaterThan90DaysPastDueMember2021-12-310000090498us-gaap:FinancialAssetPastDueMember2021-12-310000090498us-gaap:FinancialAssetNotPastDueMember2021-12-310000090498us-gaap:CreditCardReceivablesMemberus-gaap:ConsumerPortfolioSegmentMembersfnc:FinancingReceivables30To89DaysPastDueMember2020-12-310000090498us-gaap:FinancingReceivablesEqualToGreaterThan90DaysPastDueMemberus-gaap:CreditCardReceivablesMemberus-gaap:ConsumerPortfolioSegmentMember2020-12-310000090498us-gaap:FinancialAssetPastDueMemberus-gaap:CreditCardReceivablesMemberus-gaap:ConsumerPortfolioSegmentMember2020-12-310000090498us-gaap:FinancialAssetNotPastDueMemberus-gaap:CreditCardReceivablesMemberus-gaap:ConsumerPortfolioSegmentMember2020-12-310000090498us-gaap:ConsumerPortfolioSegmentMembersfnc:OtherConsumerLoansMembersfnc:FinancingReceivables30To89DaysPastDueMember2020-12-310000090498us-gaap:FinancingReceivablesEqualToGreaterThan90DaysPastDueMemberus-gaap:ConsumerPortfolioSegmentMembersfnc:OtherConsumerLoansMember2020-12-310000090498us-gaap:FinancialAssetPastDueMemberus-gaap:ConsumerPortfolioSegmentMembersfnc:OtherConsumerLoansMember2020-12-310000090498us-gaap:FinancialAssetNotPastDueMemberus-gaap:ConsumerPortfolioSegmentMembersfnc:OtherConsumerLoansMember2020-12-310000090498us-gaap:ConsumerPortfolioSegmentMembersfnc:FinancingReceivables30To89DaysPastDueMember2020-12-310000090498us-gaap:FinancingReceivablesEqualToGreaterThan90DaysPastDueMemberus-gaap:ConsumerPortfolioSegmentMember2020-12-310000090498us-gaap:FinancialAssetPastDueMemberus-gaap:ConsumerPortfolioSegmentMember2020-12-310000090498us-gaap:FinancialAssetNotPastDueMemberus-gaap:ConsumerPortfolioSegmentMember2020-12-310000090498us-gaap:ConstructionLoansMembersfnc:RealEstatePortfolioSegmentMembersfnc:FinancingReceivables30To89DaysPastDueMember2020-12-310000090498us-gaap:FinancingReceivablesEqualToGreaterThan90DaysPastDueMemberus-gaap:ConstructionLoansMembersfnc:RealEstatePortfolioSegmentMember2020-12-310000090498us-gaap:FinancialAssetPastDueMemberus-gaap:ConstructionLoansMembersfnc:RealEstatePortfolioSegmentMember2020-12-310000090498us-gaap:ConstructionLoansMemberus-gaap:FinancialAssetNotPastDueMembersfnc:RealEstatePortfolioSegmentMember2020-12-310000090498sfnc:RealEstatePortfolioSegmentMembersrt:SingleFamilyMembersfnc:FinancingReceivables30To89DaysPastDueMember2020-12-310000090498us-gaap:FinancingReceivablesEqualToGreaterThan90DaysPastDueMembersfnc:RealEstatePortfolioSegmentMembersrt:SingleFamilyMember2020-12-310000090498us-gaap:FinancialAssetPastDueMembersfnc:RealEstatePortfolioSegmentMembersrt:SingleFamilyMember2020-12-310000090498us-gaap:FinancialAssetNotPastDueMembersfnc:RealEstatePortfolioSegmentMembersrt:SingleFamilyMember2020-12-310000090498sfnc:OtherCommercialLoansMembersfnc:RealEstatePortfolioSegmentMembersfnc:FinancingReceivables30To89DaysPastDueMember2020-12-310000090498us-gaap:FinancingReceivablesEqualToGreaterThan90DaysPastDueMembersfnc:OtherCommercialLoansMembersfnc:RealEstatePortfolioSegmentMember2020-12-310000090498us-gaap:FinancialAssetPastDueMembersfnc:OtherCommercialLoansMembersfnc:RealEstatePortfolioSegmentMember2020-12-310000090498us-gaap:FinancialAssetNotPastDueMembersfnc:OtherCommercialLoansMembersfnc:RealEstatePortfolioSegmentMember2020-12-310000090498sfnc:RealEstatePortfolioSegmentMembersfnc:FinancingReceivables30To89DaysPastDueMember2020-12-310000090498us-gaap:FinancingReceivablesEqualToGreaterThan90DaysPastDueMembersfnc:RealEstatePortfolioSegmentMember2020-12-310000090498us-gaap:FinancialAssetPastDueMembersfnc:RealEstatePortfolioSegmentMember2020-12-310000090498us-gaap:FinancialAssetNotPastDueMembersfnc:RealEstatePortfolioSegmentMember2020-12-310000090498us-gaap:CommercialPortfolioSegmentMembersfnc:CommercialLoansMembersfnc:FinancingReceivables30To89DaysPastDueMember2020-12-310000090498us-gaap:FinancingReceivablesEqualToGreaterThan90DaysPastDueMemberus-gaap:CommercialPortfolioSegmentMembersfnc:CommercialLoansMember2020-12-310000090498us-gaap:FinancialAssetPastDueMemberus-gaap:CommercialPortfolioSegmentMembersfnc:CommercialLoansMember2020-12-310000090498us-gaap:FinancialAssetNotPastDueMemberus-gaap:CommercialPortfolioSegmentMembersfnc:CommercialLoansMember2020-12-310000090498sfnc:AgriculturalLoansMemberus-gaap:CommercialPortfolioSegmentMembersfnc:FinancingReceivables30To89DaysPastDueMember2020-12-310000090498us-gaap:FinancingReceivablesEqualToGreaterThan90DaysPastDueMembersfnc:AgriculturalLoansMemberus-gaap:CommercialPortfolioSegmentMember2020-12-310000090498us-gaap:FinancialAssetPastDueMembersfnc:AgriculturalLoansMemberus-gaap:CommercialPortfolioSegmentMember2020-12-310000090498sfnc:AgriculturalLoansMemberus-gaap:FinancialAssetNotPastDueMemberus-gaap:CommercialPortfolioSegmentMember2020-12-310000090498us-gaap:CommercialPortfolioSegmentMembersfnc:FinancingReceivables30To89DaysPastDueMember2020-12-310000090498us-gaap:FinancingReceivablesEqualToGreaterThan90DaysPastDueMemberus-gaap:CommercialPortfolioSegmentMember2020-12-310000090498us-gaap:FinancialAssetPastDueMemberus-gaap:CommercialPortfolioSegmentMember2020-12-310000090498us-gaap:FinancialAssetNotPastDueMemberus-gaap:CommercialPortfolioSegmentMember2020-12-310000090498us-gaap:UnallocatedFinancingReceivablesMembersfnc:FinancingReceivables30To89DaysPastDueMember2020-12-310000090498us-gaap:FinancingReceivablesEqualToGreaterThan90DaysPastDueMemberus-gaap:UnallocatedFinancingReceivablesMember2020-12-310000090498us-gaap:FinancialAssetPastDueMemberus-gaap:UnallocatedFinancingReceivablesMember2020-12-310000090498us-gaap:UnallocatedFinancingReceivablesMemberus-gaap:FinancialAssetNotPastDueMember2020-12-310000090498sfnc:FinancingReceivables30To89DaysPastDueMember2020-12-310000090498us-gaap:FinancingReceivablesEqualToGreaterThan90DaysPastDueMember2020-12-310000090498us-gaap:FinancialAssetPastDueMember2020-12-310000090498us-gaap:FinancialAssetNotPastDueMember2020-12-310000090498sfnc:COVID19PandemicMembersfnc:ExtendedMaturityandPaymentDeferralMember2021-01-012021-12-310000090498sfnc:COVID19PandemicMembersfnc:ExtendedMaturityandPaymentDeferralMember2021-12-310000090498sfnc:COVID19PandemicMembersfnc:ExtendedMaturityandPaymentDeferralMember2020-01-012020-12-310000090498sfnc:COVID19PandemicMembersfnc:ExtendedMaturityandPaymentDeferralMember2020-12-310000090498sfnc:LoansExcludingAcquiredLoansMembersfnc:RealEstatePortfolioSegmentMemberus-gaap:PerformingFinancingReceivableMembersrt:SingleFamilyMember2021-01-012021-12-310000090498sfnc:LoansExcludingAcquiredLoansMembersfnc:RealEstatePortfolioSegmentMemberus-gaap:PerformingFinancingReceivableMembersrt:SingleFamilyMember2021-12-310000090498us-gaap:NonperformingFinancingReceivableMembersfnc:LoansExcludingAcquiredLoansMembersfnc:RealEstatePortfolioSegmentMembersrt:SingleFamilyMember2021-01-012021-12-310000090498us-gaap:NonperformingFinancingReceivableMembersfnc:LoansExcludingAcquiredLoansMembersfnc:RealEstatePortfolioSegmentMembersrt:SingleFamilyMember2021-12-310000090498sfnc:LoansExcludingAcquiredLoansMembersfnc:RealEstatePortfolioSegmentMembersrt:SingleFamilyMember2021-01-012021-12-310000090498sfnc:LoansExcludingAcquiredLoansMembersfnc:RealEstatePortfolioSegmentMembersrt:SingleFamilyMember2021-12-310000090498sfnc:LoansExcludingAcquiredLoansMembersfnc:OtherCommercialLoansMembersfnc:RealEstatePortfolioSegmentMemberus-gaap:PerformingFinancingReceivableMember2021-01-012021-12-310000090498sfnc:LoansExcludingAcquiredLoansMembersfnc:OtherCommercialLoansMembersfnc:RealEstatePortfolioSegmentMemberus-gaap:PerformingFinancingReceivableMember2021-12-310000090498us-gaap:NonperformingFinancingReceivableMembersfnc:LoansExcludingAcquiredLoansMembersfnc:OtherCommercialLoansMembersfnc:RealEstatePortfolioSegmentMember2021-01-012021-12-310000090498us-gaap:NonperformingFinancingReceivableMembersfnc:LoansExcludingAcquiredLoansMembersfnc:OtherCommercialLoansMembersfnc:RealEstatePortfolioSegmentMember2021-12-310000090498sfnc:LoansExcludingAcquiredLoansMembersfnc:OtherCommercialLoansMembersfnc:RealEstatePortfolioSegmentMember2021-01-012021-12-310000090498sfnc:LoansExcludingAcquiredLoansMembersfnc:OtherCommercialLoansMembersfnc:RealEstatePortfolioSegmentMember2021-12-310000090498sfnc:LoansExcludingAcquiredLoansMembersfnc:RealEstatePortfolioSegmentMemberus-gaap:PerformingFinancingReceivableMember2021-01-012021-12-310000090498sfnc:LoansExcludingAcquiredLoansMembersfnc:RealEstatePortfolioSegmentMemberus-gaap:PerformingFinancingReceivableMember2021-12-310000090498us-gaap:NonperformingFinancingReceivableMembersfnc:LoansExcludingAcquiredLoansMembersfnc:RealEstatePortfolioSegmentMember2021-01-012021-12-310000090498us-gaap:NonperformingFinancingReceivableMembersfnc:LoansExcludingAcquiredLoansMembersfnc:RealEstatePortfolioSegmentMember2021-12-310000090498sfnc:LoansExcludingAcquiredLoansMembersfnc:RealEstatePortfolioSegmentMember2021-01-012021-12-310000090498sfnc:LoansExcludingAcquiredLoansMembersfnc:RealEstatePortfolioSegmentMember2021-12-310000090498sfnc:LoansExcludingAcquiredLoansMemberus-gaap:CommercialPortfolioSegmentMemberus-gaap:PerformingFinancingReceivableMembersfnc:CommercialLoansMember2021-01-012021-12-310000090498sfnc:LoansExcludingAcquiredLoansMemberus-gaap:CommercialPortfolioSegmentMemberus-gaap:PerformingFinancingReceivableMembersfnc:CommercialLoansMember2021-12-310000090498us-gaap:NonperformingFinancingReceivableMembersfnc:LoansExcludingAcquiredLoansMemberus-gaap:CommercialPortfolioSegmentMembersfnc:CommercialLoansMember2021-01-012021-12-310000090498us-gaap:NonperformingFinancingReceivableMembersfnc:LoansExcludingAcquiredLoansMemberus-gaap:CommercialPortfolioSegmentMembersfnc:CommercialLoansMember2021-12-310000090498sfnc:LoansExcludingAcquiredLoansMemberus-gaap:CommercialPortfolioSegmentMembersfnc:CommercialLoansMember2021-01-012021-12-310000090498sfnc:LoansExcludingAcquiredLoansMemberus-gaap:CommercialPortfolioSegmentMembersfnc:CommercialLoansMember2021-12-310000090498sfnc:LoansExcludingAcquiredLoansMemberus-gaap:CommercialPortfolioSegmentMemberus-gaap:PerformingFinancingReceivableMember2021-01-012021-12-310000090498sfnc:LoansExcludingAcquiredLoansMemberus-gaap:CommercialPortfolioSegmentMemberus-gaap:PerformingFinancingReceivableMember2021-12-310000090498us-gaap:NonperformingFinancingReceivableMembersfnc:LoansExcludingAcquiredLoansMemberus-gaap:CommercialPortfolioSegmentMember2021-01-012021-12-310000090498us-gaap:NonperformingFinancingReceivableMembersfnc:LoansExcludingAcquiredLoansMemberus-gaap:CommercialPortfolioSegmentMember2021-12-310000090498sfnc:LoansExcludingAcquiredLoansMemberus-gaap:CommercialPortfolioSegmentMember2021-01-012021-12-310000090498sfnc:LoansExcludingAcquiredLoansMemberus-gaap:CommercialPortfolioSegmentMember2021-12-310000090498sfnc:LoansExcludingAcquiredLoansMemberus-gaap:PerformingFinancingReceivableMember2021-01-012021-12-310000090498sfnc:LoansExcludingAcquiredLoansMemberus-gaap:PerformingFinancingReceivableMember2021-12-310000090498sfnc:LoansExcludingAcquiredLoansMemberus-gaap:NonperformingFinancingReceivableMember2021-01-012021-12-310000090498sfnc:LoansExcludingAcquiredLoansMemberus-gaap:NonperformingFinancingReceivableMember2021-12-310000090498sfnc:LoansExcludingAcquiredLoansMember2021-01-012021-12-310000090498sfnc:LoansExcludingAcquiredLoansMember2021-12-310000090498sfnc:LoansExcludingAcquiredLoansMembersfnc:RealEstatePortfolioSegmentMemberus-gaap:PerformingFinancingReceivableMembersrt:SingleFamilyMember2020-01-012020-12-310000090498sfnc:LoansExcludingAcquiredLoansMembersfnc:RealEstatePortfolioSegmentMemberus-gaap:PerformingFinancingReceivableMembersrt:SingleFamilyMember2020-12-310000090498us-gaap:NonperformingFinancingReceivableMembersfnc:LoansExcludingAcquiredLoansMembersfnc:RealEstatePortfolioSegmentMembersrt:SingleFamilyMember2020-01-012020-12-310000090498us-gaap:NonperformingFinancingReceivableMembersfnc:LoansExcludingAcquiredLoansMembersfnc:RealEstatePortfolioSegmentMembersrt:SingleFamilyMember2020-12-310000090498sfnc:LoansExcludingAcquiredLoansMembersfnc:RealEstatePortfolioSegmentMembersrt:SingleFamilyMember2020-01-012020-12-310000090498sfnc:LoansExcludingAcquiredLoansMembersfnc:RealEstatePortfolioSegmentMembersrt:SingleFamilyMember2020-12-310000090498sfnc:LoansExcludingAcquiredLoansMembersfnc:OtherCommercialLoansMembersfnc:RealEstatePortfolioSegmentMemberus-gaap:PerformingFinancingReceivableMember2020-01-012020-12-310000090498sfnc:LoansExcludingAcquiredLoansMembersfnc:OtherCommercialLoansMembersfnc:RealEstatePortfolioSegmentMemberus-gaap:PerformingFinancingReceivableMember2020-12-310000090498us-gaap:NonperformingFinancingReceivableMembersfnc:LoansExcludingAcquiredLoansMembersfnc:OtherCommercialLoansMembersfnc:RealEstatePortfolioSegmentMember2020-01-012020-12-310000090498us-gaap:NonperformingFinancingReceivableMembersfnc:LoansExcludingAcquiredLoansMembersfnc:OtherCommercialLoansMembersfnc:RealEstatePortfolioSegmentMember2020-12-310000090498sfnc:LoansExcludingAcquiredLoansMembersfnc:OtherCommercialLoansMembersfnc:RealEstatePortfolioSegmentMember2020-01-012020-12-310000090498sfnc:LoansExcludingAcquiredLoansMembersfnc:OtherCommercialLoansMembersfnc:RealEstatePortfolioSegmentMember2020-12-310000090498sfnc:LoansExcludingAcquiredLoansMembersfnc:RealEstatePortfolioSegmentMemberus-gaap:PerformingFinancingReceivableMember2020-01-012020-12-310000090498sfnc:LoansExcludingAcquiredLoansMembersfnc:RealEstatePortfolioSegmentMemberus-gaap:PerformingFinancingReceivableMember2020-12-310000090498us-gaap:NonperformingFinancingReceivableMembersfnc:LoansExcludingAcquiredLoansMembersfnc:RealEstatePortfolioSegmentMember2020-01-012020-12-310000090498us-gaap:NonperformingFinancingReceivableMembersfnc:LoansExcludingAcquiredLoansMembersfnc:RealEstatePortfolioSegmentMember2020-12-310000090498sfnc:LoansExcludingAcquiredLoansMembersfnc:RealEstatePortfolioSegmentMember2020-01-012020-12-310000090498sfnc:LoansExcludingAcquiredLoansMembersfnc:RealEstatePortfolioSegmentMember2020-12-310000090498sfnc:LoansExcludingAcquiredLoansMemberus-gaap:CommercialPortfolioSegmentMemberus-gaap:PerformingFinancingReceivableMembersfnc:CommercialLoansMember2020-01-012020-12-310000090498sfnc:LoansExcludingAcquiredLoansMemberus-gaap:CommercialPortfolioSegmentMemberus-gaap:PerformingFinancingReceivableMembersfnc:CommercialLoansMember2020-12-310000090498us-gaap:NonperformingFinancingReceivableMembersfnc:LoansExcludingAcquiredLoansMemberus-gaap:CommercialPortfolioSegmentMembersfnc:CommercialLoansMember2020-01-012020-12-310000090498us-gaap:NonperformingFinancingReceivableMembersfnc:LoansExcludingAcquiredLoansMemberus-gaap:CommercialPortfolioSegmentMembersfnc:CommercialLoansMember2020-12-310000090498sfnc:LoansExcludingAcquiredLoansMemberus-gaap:CommercialPortfolioSegmentMembersfnc:CommercialLoansMember2020-01-012020-12-310000090498sfnc:LoansExcludingAcquiredLoansMemberus-gaap:CommercialPortfolioSegmentMembersfnc:CommercialLoansMember2020-12-310000090498sfnc:LoansExcludingAcquiredLoansMemberus-gaap:CommercialPortfolioSegmentMemberus-gaap:PerformingFinancingReceivableMember2020-01-012020-12-310000090498sfnc:LoansExcludingAcquiredLoansMemberus-gaap:CommercialPortfolioSegmentMemberus-gaap:PerformingFinancingReceivableMember2020-12-310000090498us-gaap:NonperformingFinancingReceivableMembersfnc:LoansExcludingAcquiredLoansMemberus-gaap:CommercialPortfolioSegmentMember2020-01-012020-12-310000090498us-gaap:NonperformingFinancingReceivableMembersfnc:LoansExcludingAcquiredLoansMemberus-gaap:CommercialPortfolioSegmentMember2020-12-310000090498sfnc:LoansExcludingAcquiredLoansMemberus-gaap:CommercialPortfolioSegmentMember2020-01-012020-12-310000090498sfnc:LoansExcludingAcquiredLoansMemberus-gaap:CommercialPortfolioSegmentMember2020-12-310000090498sfnc:LoansExcludingAcquiredLoansMemberus-gaap:PerformingFinancingReceivableMember2020-01-012020-12-310000090498sfnc:LoansExcludingAcquiredLoansMemberus-gaap:PerformingFinancingReceivableMember2020-12-310000090498sfnc:LoansExcludingAcquiredLoansMemberus-gaap:NonperformingFinancingReceivableMember2020-01-012020-12-310000090498sfnc:LoansExcludingAcquiredLoansMemberus-gaap:NonperformingFinancingReceivableMember2020-12-310000090498sfnc:LoansExcludingAcquiredLoansMember2020-01-012020-12-310000090498sfnc:LoansExcludingAcquiredLoansMember2020-12-310000090498sfnc:RealEstatePortfolioSegmentMembersrt:SingleFamilyMember2021-01-012021-12-310000090498sfnc:RealEstatePortfolioSegmentMembersrt:SingleFamilyMemberus-gaap:ExtendedMaturityMember2021-01-012021-12-310000090498us-gaap:ContractualInterestRateReductionMembersfnc:RealEstatePortfolioSegmentMembersrt:SingleFamilyMember2021-01-012021-12-310000090498sfnc:OtherCommercialLoansMembersfnc:RealEstatePortfolioSegmentMember2021-01-012021-12-310000090498sfnc:OtherCommercialLoansMembersfnc:RealEstatePortfolioSegmentMemberus-gaap:ExtendedMaturityMember2021-01-012021-12-310000090498sfnc:OtherCommercialLoansMemberus-gaap:ContractualInterestRateReductionMembersfnc:RealEstatePortfolioSegmentMember2021-01-012021-12-310000090498sfnc:RealEstatePortfolioSegmentMember2021-01-012021-12-310000090498sfnc:RealEstatePortfolioSegmentMemberus-gaap:ExtendedMaturityMember2021-01-012021-12-310000090498us-gaap:ContractualInterestRateReductionMembersfnc:RealEstatePortfolioSegmentMember2021-01-012021-12-310000090498sfnc:RealEstatePortfolioSegmentMembersrt:SingleFamilyMember2020-01-012020-12-310000090498sfnc:RealEstatePortfolioSegmentMembersrt:SingleFamilyMemberus-gaap:ExtendedMaturityMember2020-01-012020-12-310000090498us-gaap:ContractualInterestRateReductionMembersfnc:RealEstatePortfolioSegmentMembersrt:SingleFamilyMember2020-01-012020-12-310000090498sfnc:RealEstatePortfolioSegmentMember2020-01-012020-12-310000090498sfnc:RealEstatePortfolioSegmentMemberus-gaap:ExtendedMaturityMember2020-01-012020-12-310000090498us-gaap:ContractualInterestRateReductionMembersfnc:RealEstatePortfolioSegmentMember2020-01-012020-12-310000090498sfnc:OtherCommercialLoansMembersfnc:RealEstatePortfolioSegmentMember2020-01-012020-12-310000090498us-gaap:RealEstateAcquiredInSatisfactionOfDebtMembersfnc:RealEstatePortfolioSegmentMember2021-01-012021-12-310000090498us-gaap:RealEstateAcquiredInSatisfactionOfDebtMembersfnc:RealEstatePortfolioSegmentMember2020-01-012020-12-310000090498us-gaap:ResidentialRealEstateMember2021-12-310000090498us-gaap:ResidentialRealEstateMember2020-12-310000090498us-gaap:RealEstateAcquiredInSatisfactionOfDebtMemberus-gaap:ResidentialRealEstateMember2021-12-310000090498us-gaap:RealEstateAcquiredInSatisfactionOfDebtMemberus-gaap:ResidentialRealEstateMember2020-12-310000090498us-gaap:CreditCardReceivablesMemberus-gaap:ConsumerPortfolioSegmentMembersfnc:FinancialAsset30to89DaysPastDueMember2021-12-310000090498us-gaap:CreditCardReceivablesMemberus-gaap:ConsumerPortfolioSegmentMembersfnc:FinancingReceivablesEqualToGreaterThan30DaysPastDueMember2021-12-310000090498us-gaap:ConsumerPortfolioSegmentMembersfnc:FinancialAsset30to89DaysPastDueMembersfnc:OtherConsumerLoansMember2021-12-310000090498us-gaap:ConsumerPortfolioSegmentMembersfnc:FinancingReceivablesEqualToGreaterThan30DaysPastDueMembersfnc:OtherConsumerLoansMember2021-12-310000090498us-gaap:ConstructionLoansMembersfnc:RealEstatePortfolioSegmentMemberus-gaap:PassMember2021-12-310000090498us-gaap:ConstructionLoansMembersfnc:RealEstatePortfolioSegmentMemberus-gaap:SpecialMentionMember2021-12-310000090498us-gaap:ConstructionLoansMemberus-gaap:SubstandardMembersfnc:RealEstatePortfolioSegmentMember2021-12-310000090498us-gaap:DoubtfulMemberus-gaap:ConstructionLoansMembersfnc:RealEstatePortfolioSegmentMember2021-12-310000090498us-gaap:ConstructionLoansMembersfnc:RealEstatePortfolioSegmentMemberus-gaap:CriticizedMember2021-12-310000090498sfnc:RealEstatePortfolioSegmentMembersfnc:FinancialAsset30to89DaysPastDueMembersrt:SingleFamilyMember2021-12-310000090498sfnc:RealEstatePortfolioSegmentMembersfnc:FinancingReceivablesEqualToGreaterThan30DaysPastDueMembersrt:SingleFamilyMember2021-12-310000090498sfnc:OtherCommercialLoansMembersfnc:RealEstatePortfolioSegmentMemberus-gaap:PassMember2021-12-310000090498sfnc:OtherCommercialLoansMembersfnc:RealEstatePortfolioSegmentMemberus-gaap:SpecialMentionMember2021-12-310000090498us-gaap:SubstandardMembersfnc:OtherCommercialLoansMembersfnc:RealEstatePortfolioSegmentMember2021-12-310000090498us-gaap:DoubtfulMembersfnc:OtherCommercialLoansMembersfnc:RealEstatePortfolioSegmentMember2021-12-310000090498sfnc:OtherCommercialLoansMembersfnc:RealEstatePortfolioSegmentMemberus-gaap:CriticizedMember2021-12-310000090498us-gaap:CommercialPortfolioSegmentMemberus-gaap:PassMembersfnc:CommercialLoansMember2021-12-310000090498us-gaap:CommercialPortfolioSegmentMemberus-gaap:SpecialMentionMembersfnc:CommercialLoansMember2021-12-310000090498us-gaap:SubstandardMemberus-gaap:CommercialPortfolioSegmentMembersfnc:CommercialLoansMember2021-12-310000090498us-gaap:DoubtfulMemberus-gaap:CommercialPortfolioSegmentMembersfnc:CommercialLoansMember2021-12-310000090498us-gaap:CommercialPortfolioSegmentMembersfnc:CommercialLoansMemberus-gaap:CriticizedMember2021-12-310000090498sfnc:AgriculturalLoansMemberus-gaap:CommercialPortfolioSegmentMemberus-gaap:PassMember2021-12-310000090498sfnc:AgriculturalLoansMemberus-gaap:CommercialPortfolioSegmentMemberus-gaap:SpecialMentionMember2021-12-310000090498sfnc:AgriculturalLoansMemberus-gaap:SubstandardMemberus-gaap:CommercialPortfolioSegmentMember2021-12-310000090498us-gaap:DoubtfulMembersfnc:AgriculturalLoansMemberus-gaap:CommercialPortfolioSegmentMember2021-12-310000090498sfnc:AgriculturalLoansMemberus-gaap:CommercialPortfolioSegmentMemberus-gaap:CriticizedMember2021-12-310000090498us-gaap:UnallocatedFinancingReceivablesMembersfnc:FinancialAsset30to89DaysPastDueMember2021-12-310000090498us-gaap:UnallocatedFinancingReceivablesMembersfnc:FinancingReceivablesEqualToGreaterThan30DaysPastDueMember2021-12-310000090498sfnc:CriticizedAndPastDueMember2021-12-310000090498us-gaap:CreditCardReceivablesMemberus-gaap:ConsumerPortfolioSegmentMembersfnc:FinancialAsset30to89DaysPastDueMember2020-12-310000090498us-gaap:CreditCardReceivablesMemberus-gaap:ConsumerPortfolioSegmentMembersfnc:FinancingReceivablesEqualToGreaterThan30DaysPastDueMember2020-12-310000090498us-gaap:ConsumerPortfolioSegmentMembersfnc:FinancialAsset30to89DaysPastDueMembersfnc:OtherConsumerLoansMember2020-12-310000090498us-gaap:ConsumerPortfolioSegmentMembersfnc:FinancingReceivablesEqualToGreaterThan30DaysPastDueMembersfnc:OtherConsumerLoansMember2020-12-310000090498us-gaap:ConstructionLoansMembersfnc:RealEstatePortfolioSegmentMemberus-gaap:PassMember2020-12-310000090498us-gaap:ConstructionLoansMembersfnc:RealEstatePortfolioSegmentMemberus-gaap:SpecialMentionMember2020-12-310000090498us-gaap:ConstructionLoansMemberus-gaap:SubstandardMembersfnc:RealEstatePortfolioSegmentMember2020-12-310000090498us-gaap:DoubtfulMemberus-gaap:ConstructionLoansMembersfnc:RealEstatePortfolioSegmentMember2020-12-310000090498us-gaap:ConstructionLoansMembersfnc:RealEstatePortfolioSegmentMemberus-gaap:CriticizedMember2020-12-310000090498sfnc:RealEstatePortfolioSegmentMembersfnc:FinancialAsset30to89DaysPastDueMembersrt:SingleFamilyMember2020-12-310000090498sfnc:RealEstatePortfolioSegmentMembersfnc:FinancingReceivablesEqualToGreaterThan30DaysPastDueMembersrt:SingleFamilyMember2020-12-310000090498sfnc:OtherCommercialLoansMembersfnc:RealEstatePortfolioSegmentMemberus-gaap:PassMember2020-12-310000090498sfnc:OtherCommercialLoansMembersfnc:RealEstatePortfolioSegmentMemberus-gaap:SpecialMentionMember2020-12-310000090498us-gaap:SubstandardMembersfnc:OtherCommercialLoansMembersfnc:RealEstatePortfolioSegmentMember2020-12-310000090498us-gaap:DoubtfulMembersfnc:OtherCommercialLoansMembersfnc:RealEstatePortfolioSegmentMember2020-12-310000090498sfnc:OtherCommercialLoansMembersfnc:RealEstatePortfolioSegmentMemberus-gaap:CriticizedMember2020-12-310000090498us-gaap:CommercialPortfolioSegmentMemberus-gaap:PassMembersfnc:CommercialLoansMember2020-12-310000090498us-gaap:CommercialPortfolioSegmentMemberus-gaap:SpecialMentionMembersfnc:CommercialLoansMember2020-12-310000090498us-gaap:SubstandardMemberus-gaap:CommercialPortfolioSegmentMembersfnc:CommercialLoansMember2020-12-310000090498us-gaap:DoubtfulMemberus-gaap:CommercialPortfolioSegmentMembersfnc:CommercialLoansMember2020-12-310000090498us-gaap:CommercialPortfolioSegmentMembersfnc:CommercialLoansMemberus-gaap:CriticizedMember2020-12-310000090498sfnc:AgriculturalLoansMemberus-gaap:CommercialPortfolioSegmentMemberus-gaap:PassMember2020-12-310000090498sfnc:AgriculturalLoansMemberus-gaap:CommercialPortfolioSegmentMemberus-gaap:SpecialMentionMember2020-12-310000090498sfnc:AgriculturalLoansMemberus-gaap:SubstandardMemberus-gaap:CommercialPortfolioSegmentMember2020-12-310000090498us-gaap:DoubtfulMembersfnc:AgriculturalLoansMemberus-gaap:CommercialPortfolioSegmentMember2020-12-310000090498sfnc:AgriculturalLoansMemberus-gaap:CommercialPortfolioSegmentMemberus-gaap:CriticizedMember2020-12-310000090498us-gaap:UnallocatedFinancingReceivablesMembersfnc:FinancialAsset30to89DaysPastDueMember2020-12-310000090498us-gaap:UnallocatedFinancingReceivablesMembersfnc:FinancingReceivablesEqualToGreaterThan30DaysPastDueMember2020-12-310000090498sfnc:CriticizedAndPastDueMember2020-12-310000090498us-gaap:ConstructionLoansMembersfnc:RealEstatePortfolioSegmentMemberus-gaap:RealEstateMember2021-12-310000090498us-gaap:ConstructionLoansMembersfnc:RealEstatePortfolioSegmentMembersfnc:SecuredEnergyProductionAssetsMember2021-12-310000090498sfnc:OtherBusinessAssetsMemberus-gaap:ConstructionLoansMembersfnc:RealEstatePortfolioSegmentMember2021-12-310000090498sfnc:RealEstatePortfolioSegmentMemberus-gaap:RealEstateMembersrt:SingleFamilyMember2021-12-310000090498sfnc:RealEstatePortfolioSegmentMembersfnc:SecuredEnergyProductionAssetsMembersrt:SingleFamilyMember2021-12-310000090498sfnc:OtherBusinessAssetsMembersfnc:RealEstatePortfolioSegmentMembersrt:SingleFamilyMember2021-12-310000090498sfnc:OtherCommercialLoansMembersfnc:RealEstatePortfolioSegmentMemberus-gaap:RealEstateMember2021-12-310000090498sfnc:OtherCommercialLoansMembersfnc:RealEstatePortfolioSegmentMembersfnc:SecuredEnergyProductionAssetsMember2021-12-310000090498sfnc:OtherBusinessAssetsMembersfnc:OtherCommercialLoansMembersfnc:RealEstatePortfolioSegmentMember2021-12-310000090498us-gaap:CommercialPortfolioSegmentMembersfnc:CommercialLoansMemberus-gaap:RealEstateMember2021-12-310000090498us-gaap:CommercialPortfolioSegmentMembersfnc:SecuredEnergyProductionAssetsMembersfnc:CommercialLoansMember2021-12-310000090498sfnc:OtherBusinessAssetsMemberus-gaap:CommercialPortfolioSegmentMembersfnc:CommercialLoansMember2021-12-310000090498us-gaap:RealEstateMember2021-12-310000090498sfnc:SecuredEnergyProductionAssetsMember2021-12-310000090498sfnc:OtherBusinessAssetsMember2021-12-310000090498us-gaap:ConstructionLoansMembersfnc:RealEstatePortfolioSegmentMemberus-gaap:RealEstateMember2020-12-310000090498us-gaap:ConstructionLoansMembersfnc:RealEstatePortfolioSegmentMembersfnc:SecuredEnergyProductionAssetsMember2020-12-310000090498sfnc:OtherBusinessAssetsMemberus-gaap:ConstructionLoansMembersfnc:RealEstatePortfolioSegmentMember2020-12-310000090498sfnc:RealEstatePortfolioSegmentMemberus-gaap:RealEstateMembersrt:SingleFamilyMember2020-12-310000090498sfnc:RealEstatePortfolioSegmentMembersfnc:SecuredEnergyProductionAssetsMembersrt:SingleFamilyMember2020-12-310000090498sfnc:OtherBusinessAssetsMembersfnc:RealEstatePortfolioSegmentMembersrt:SingleFamilyMember2020-12-310000090498sfnc:OtherCommercialLoansMembersfnc:RealEstatePortfolioSegmentMemberus-gaap:RealEstateMember2020-12-310000090498sfnc:OtherCommercialLoansMembersfnc:RealEstatePortfolioSegmentMembersfnc:SecuredEnergyProductionAssetsMember2020-12-310000090498sfnc:OtherBusinessAssetsMembersfnc:OtherCommercialLoansMembersfnc:RealEstatePortfolioSegmentMember2020-12-310000090498us-gaap:CommercialPortfolioSegmentMembersfnc:CommercialLoansMemberus-gaap:RealEstateMember2020-12-310000090498us-gaap:CommercialPortfolioSegmentMembersfnc:SecuredEnergyProductionAssetsMembersfnc:CommercialLoansMember2020-12-310000090498sfnc:OtherBusinessAssetsMemberus-gaap:CommercialPortfolioSegmentMembersfnc:CommercialLoansMember2020-12-310000090498us-gaap:RealEstateMember2020-12-310000090498sfnc:SecuredEnergyProductionAssetsMember2020-12-310000090498sfnc:OtherBusinessAssetsMember2020-12-310000090498sfnc:LoansExcludingAcquiredLoansMemberus-gaap:CreditCardReceivablesMemberus-gaap:ConsumerPortfolioSegmentMember2020-12-310000090498sfnc:LoansExcludingAcquiredLoansMembersfnc:OtherLoansMember2020-12-310000090498sfnc:LoansExcludingAcquiredLoansMemberus-gaap:CommercialPortfolioSegmentMembersrt:CumulativeEffectPeriodOfAdoptionAdjustmentMember2020-12-310000090498sfnc:LoansExcludingAcquiredLoansMembersfnc:RealEstatePortfolioSegmentMembersrt:CumulativeEffectPeriodOfAdoptionAdjustmentMember2020-12-310000090498sfnc:LoansExcludingAcquiredLoansMemberus-gaap:CreditCardReceivablesMemberus-gaap:ConsumerPortfolioSegmentMembersrt:CumulativeEffectPeriodOfAdoptionAdjustmentMember2020-12-310000090498sfnc:LoansExcludingAcquiredLoansMembersfnc:OtherLoansMembersrt:CumulativeEffectPeriodOfAdoptionAdjustmentMember2020-12-310000090498sfnc:LoansExcludingAcquiredLoansMembersrt:CumulativeEffectPeriodOfAdoptionAdjustmentMember2020-12-310000090498sfnc:LoansExcludingAcquiredLoansMemberus-gaap:CreditCardReceivablesMemberus-gaap:ConsumerPortfolioSegmentMember2021-01-012021-12-310000090498sfnc:LoansExcludingAcquiredLoansMembersfnc:OtherLoansMember2021-01-012021-12-310000090498sfnc:LoansExcludingAcquiredLoansMemberus-gaap:CreditCardReceivablesMemberus-gaap:ConsumerPortfolioSegmentMember2021-12-310000090498sfnc:LoansExcludingAcquiredLoansMembersfnc:OtherLoansMember2021-12-310000090498sfnc:LoansExcludingAcquiredLoansMemberus-gaap:CommercialPortfolioSegmentMember2019-12-310000090498sfnc:LoansExcludingAcquiredLoansMembersfnc:RealEstatePortfolioSegmentMember2019-12-310000090498sfnc:LoansExcludingAcquiredLoansMemberus-gaap:CreditCardReceivablesMemberus-gaap:ConsumerPortfolioSegmentMember2019-12-310000090498sfnc:LoansExcludingAcquiredLoansMembersfnc:OtherLoansMember2019-12-310000090498sfnc:LoansExcludingAcquiredLoansMember2019-12-310000090498sfnc:LoansExcludingAcquiredLoansMemberus-gaap:CommercialPortfolioSegmentMembersrt:CumulativeEffectPeriodOfAdoptionAdjustmentMember2019-12-310000090498sfnc:LoansExcludingAcquiredLoansMembersfnc:RealEstatePortfolioSegmentMembersrt:CumulativeEffectPeriodOfAdoptionAdjustmentMember2019-12-310000090498sfnc:LoansExcludingAcquiredLoansMemberus-gaap:CreditCardReceivablesMemberus-gaap:ConsumerPortfolioSegmentMembersrt:CumulativeEffectPeriodOfAdoptionAdjustmentMember2019-12-310000090498sfnc:LoansExcludingAcquiredLoansMembersfnc:OtherLoansMembersrt:CumulativeEffectPeriodOfAdoptionAdjustmentMember2019-12-310000090498sfnc:LoansExcludingAcquiredLoansMembersrt:CumulativeEffectPeriodOfAdoptionAdjustmentMember2019-12-310000090498sfnc:LoansExcludingAcquiredLoansMemberus-gaap:CreditCardReceivablesMemberus-gaap:ConsumerPortfolioSegmentMember2020-01-012020-12-310000090498sfnc:LoansExcludingAcquiredLoansMembersfnc:OtherLoansMember2020-01-012020-12-310000090498sfnc:LoansExcludingAcquiredLoansMemberus-gaap:CommercialPortfolioSegmentMember2018-12-310000090498sfnc:LoansExcludingAcquiredLoansMembersfnc:RealEstatePortfolioSegmentMember2018-12-310000090498sfnc:LoansExcludingAcquiredLoansMemberus-gaap:CreditCardReceivablesMemberus-gaap:ConsumerPortfolioSegmentMember2018-12-310000090498sfnc:LoansExcludingAcquiredLoansMembersfnc:OtherLoansMember2018-12-310000090498sfnc:LoansExcludingAcquiredLoansMember2018-12-310000090498sfnc:LoansExcludingAcquiredLoansMemberus-gaap:CommercialPortfolioSegmentMember2019-01-012019-12-310000090498sfnc:LoansExcludingAcquiredLoansMembersfnc:RealEstatePortfolioSegmentMember2019-01-012019-12-310000090498sfnc:LoansExcludingAcquiredLoansMemberus-gaap:CreditCardReceivablesMemberus-gaap:ConsumerPortfolioSegmentMember2019-01-012019-12-310000090498sfnc:LoansExcludingAcquiredLoansMembersfnc:OtherLoansMember2019-01-012019-12-310000090498sfnc:LoansExcludingAcquiredLoansMember2019-01-012019-12-310000090498us-gaap:FinancialAssetOtherThanFinancialAssetAcquiredWithCreditDeteriorationMembersfnc:OtherCommercialLoansMembersfnc:RealEstatePortfolioSegmentMembersfnc:SecuredEnergyProductionAssetsMemberus-gaap:InternalInvestmentGradeMember2021-01-012021-12-310000090498sfnc:MoodysS2RatingMemberus-gaap:FinancialAssetOtherThanFinancialAssetAcquiredWithCreditDeteriorationMembersfnc:OtherCommercialLoansMembersfnc:RealEstatePortfolioSegmentMembersfnc:SecuredEnergyProductionAssetsMember2021-01-012021-12-310000090498us-gaap:FinancialAssetOtherThanFinancialAssetAcquiredWithCreditDeteriorationMembersfnc:MoodysS3RatingMembersfnc:OtherCommercialLoansMembersfnc:RealEstatePortfolioSegmentMembersfnc:SecuredEnergyProductionAssetsMember2021-01-012021-12-3100000904982020-07-012020-09-30sfnc:credit0000090498us-gaap:CommercialPortfolioSegmentMember2020-01-012020-12-310000090498sfnc:OtherCommercialLoansMembersfnc:RealEstatePortfolioSegmentMembersfnc:SecuredEnergyProductionAssetsMember2020-01-012020-12-310000090498us-gaap:CommercialPortfolioSegmentMembersfnc:LandmarkBankMember2021-01-012021-12-310000090498sfnc:RealEstatePortfolioSegmentMembersfnc:LandmarkBankMember2021-01-012021-12-310000090498us-gaap:CreditCardReceivablesMemberus-gaap:ConsumerPortfolioSegmentMembersfnc:LandmarkBankMember2021-01-012021-12-310000090498sfnc:OtherLoansMembersfnc:LandmarkBankMember2021-01-012021-12-310000090498us-gaap:CommercialPortfolioSegmentMembersfnc:TriumphMember2021-01-012021-12-310000090498sfnc:RealEstatePortfolioSegmentMembersfnc:TriumphMember2021-01-012021-12-310000090498us-gaap:CreditCardReceivablesMemberus-gaap:ConsumerPortfolioSegmentMembersfnc:TriumphMember2021-01-012021-12-310000090498sfnc:OtherLoansMembersfnc:TriumphMember2021-01-012021-12-310000090498us-gaap:LandMember2021-12-310000090498us-gaap:LandMember2020-12-310000090498us-gaap:BuildingAndBuildingImprovementsMember2021-12-310000090498us-gaap:BuildingAndBuildingImprovementsMember2020-12-310000090498us-gaap:FurnitureAndFixturesMember2021-12-310000090498us-gaap:FurnitureAndFixturesMember2020-12-310000090498sfnc:SoftwareMember2021-12-310000090498sfnc:SoftwareMember2020-12-310000090498us-gaap:ConstructionInProgressMember2021-12-310000090498us-gaap:ConstructionInProgressMember2020-12-310000090498sfnc:LandrumCompanyMember2019-12-310000090498sfnc:RelianceBancsharesInc.Member2019-12-310000090498sfnc:LandrumCompanyMember2020-01-012020-12-310000090498sfnc:TriumphMember2021-12-310000090498sfnc:LandmarkBankMember2021-12-3100000904982021-04-012021-06-300000090498srt:MinimumMembersfnc:CoreDepositPremiumMember2021-01-012021-12-310000090498sfnc:CoreDepositPremiumMembersrt:MaximumMember2021-01-012021-12-310000090498sfnc:CoreDepositPremiumMember2020-12-310000090498sfnc:CoreDepositPremiumMember2019-12-310000090498sfnc:CoreDepositPremiumMember2021-01-012021-12-310000090498sfnc:CoreDepositPremiumMember2020-01-012020-12-310000090498sfnc:CoreDepositPremiumMember2021-12-310000090498sfnc:BooksOfBusinessIntangibleMember2020-12-310000090498sfnc:BooksOfBusinessIntangibleMember2019-12-310000090498sfnc:BooksOfBusinessIntangibleMember2021-01-012021-12-310000090498sfnc:BooksOfBusinessIntangibleMember2020-01-012020-12-310000090498sfnc:BooksOfBusinessIntangibleMember2021-12-310000090498sfnc:CoreDepositPremiumMember2019-01-012019-12-310000090498sfnc:BooksOfBusinessIntangibleMember2019-01-012019-12-310000090498sfnc:MetropolitanMember2021-12-310000090498us-gaap:DomesticCountryMemberus-gaap:EarliestTaxYearMember2021-01-012021-12-310000090498us-gaap:StateAndLocalJurisdictionMemberus-gaap:EarliestTaxYearMember2021-01-012021-12-310000090498us-gaap:USGovernmentAgenciesDebtSecuritiesMemberus-gaap:MaturityOvernightMember2021-12-310000090498us-gaap:USGovernmentAgenciesDebtSecuritiesMemberus-gaap:MaturityUpTo30DaysMember2021-12-310000090498us-gaap:USGovernmentAgenciesDebtSecuritiesMemberus-gaap:Maturity30To90DaysMember2021-12-310000090498us-gaap:USGovernmentAgenciesDebtSecuritiesMemberus-gaap:MaturityOver90DaysMember2021-12-310000090498us-gaap:USGovernmentAgenciesDebtSecuritiesMemberus-gaap:MaturityOvernightMember2020-12-310000090498us-gaap:USGovernmentAgenciesDebtSecuritiesMemberus-gaap:MaturityUpTo30DaysMember2020-12-310000090498us-gaap:USGovernmentAgenciesDebtSecuritiesMemberus-gaap:Maturity30To90DaysMember2020-12-310000090498us-gaap:USGovernmentAgenciesDebtSecuritiesMemberus-gaap:MaturityOver90DaysMember2020-12-310000090498us-gaap:FederalHomeLoanBankAdvancesMembersrt:MinimumMember2021-12-310000090498us-gaap:FederalHomeLoanBankAdvancesMembersrt:MaximumMember2021-12-310000090498us-gaap:FederalHomeLoanBankAdvancesMember2021-12-310000090498us-gaap:FederalHomeLoanBankAdvancesMember2020-12-310000090498sfnc:OtherLongTermDebtMember2021-12-310000090498sfnc:OtherLongTermDebtMember2020-12-310000090498sfnc:FederalHomeLoanBankAdvanceandOtherLongTermDebtMember2021-12-310000090498sfnc:FederalHomeLoanBankAdvanceandOtherLongTermDebtMember2020-12-310000090498us-gaap:SubordinatedDebtMember2021-12-310000090498sfnc:SubordinatedNotesPayableDue04012028Memberus-gaap:SubordinatedDebtMemberus-gaap:LondonInterbankOfferedRateLIBORMember2021-01-012021-12-310000090498sfnc:SubordinatedNotesPayableDue04012028Memberus-gaap:SubordinatedDebtMember2021-12-310000090498sfnc:SubordinatedNotesPayableDue04012028Memberus-gaap:SubordinatedDebtMember2020-12-310000090498sfnc:TrustPreferredSecuritiesDue9152037Memberus-gaap:SubordinatedDebtMemberus-gaap:LondonInterbankOfferedRateLIBORMember2021-01-012021-12-310000090498sfnc:TrustPreferredSecuritiesDue9152037Memberus-gaap:SubordinatedDebtMember2021-12-310000090498sfnc:TrustPreferredSecuritiesDue9152037Memberus-gaap:SubordinatedDebtMember2020-12-310000090498us-gaap:SubordinatedDebtMembersfnc:TrustPreferredSecuritiesDue662037Memberus-gaap:LondonInterbankOfferedRateLIBORMember2021-01-012021-12-310000090498us-gaap:SubordinatedDebtMembersfnc:TrustPreferredSecuritiesDue662037Member2021-12-310000090498us-gaap:SubordinatedDebtMembersfnc:TrustPreferredSecuritiesDue662037Member2020-12-310000090498us-gaap:SubordinatedDebtMembersfnc:TrustPreferredSecuritiesDue12152035Memberus-gaap:LondonInterbankOfferedRateLIBORMember2021-01-012021-12-310000090498us-gaap:SubordinatedDebtMembersfnc:TrustPreferredSecuritiesDue12152035Member2021-12-310000090498us-gaap:SubordinatedDebtMembersfnc:TrustPreferredSecuritiesDue12152035Member2020-12-310000090498us-gaap:SubordinatedDebtMembersfnc:TrustPreferredSecuritiesDue6152037Memberus-gaap:LondonInterbankOfferedRateLIBORMember2021-01-012021-12-310000090498us-gaap:SubordinatedDebtMembersfnc:TrustPreferredSecuritiesDue6152037Member2021-12-310000090498us-gaap:SubordinatedDebtMembersfnc:TrustPreferredSecuritiesDue6152037Member2020-12-310000090498us-gaap:SubordinatedDebtMembersfnc:TrustPreferredSecuritiesDue12152036Memberus-gaap:LondonInterbankOfferedRateLIBORMember2021-01-012021-12-310000090498us-gaap:SubordinatedDebtMembersfnc:TrustPreferredSecuritiesDue12152036Member2021-12-310000090498us-gaap:SubordinatedDebtMembersfnc:TrustPreferredSecuritiesDue12152036Member2020-12-310000090498sfnc:SubordinatedDebtandUnsecuredDebtMember2021-12-310000090498sfnc:SubordinatedDebtandUnsecuredDebtMember2020-12-310000090498us-gaap:SubordinatedDebtMember2018-03-310000090498us-gaap:SubordinatedDebtMemberus-gaap:LondonInterbankOfferedRateLIBORMember2018-03-012018-03-310000090498sfnc:FederalHomeLoanBankOwnstheOptionsFOTOAdvancesMember2021-12-310000090498sfnc:FederalHomeLoanBankOwnstheOptionsFOTOAdvancesMembersrt:MinimumMember2021-01-012021-12-310000090498sfnc:FederalHomeLoanBankOwnstheOptionsFOTOAdvancesMembersrt:MaximumMember2021-01-012021-12-3100000904982009-02-270000090498srt:MaximumMember2009-02-270000090498us-gaap:SeriesDPreferredStockMembersfnc:RelianceBancsharesInc.Member2019-10-2900000904982018-04-1800000904982018-04-1900000904982012-07-2300000904982019-10-2200000904982020-03-0500000904982021-07-230000090498us-gaap:CommonClassAMemberus-gaap:SubsequentEventMember2022-01-310000090498sfnc:EmployeeStockPurchasePlan2015Member2021-01-012021-12-310000090498sfnc:SpecialEmployeeStockPurchasePlan2015Member2021-01-012021-12-310000090498us-gaap:RestrictedStockMember2018-12-310000090498sfnc:StockUnitsMember2018-12-310000090498us-gaap:RestrictedStockMember2019-01-012019-12-310000090498sfnc:StockUnitsMember2019-01-012019-12-310000090498us-gaap:RestrictedStockMember2019-12-310000090498sfnc:StockUnitsMember2019-12-310000090498us-gaap:RestrictedStockMember2020-01-012020-12-310000090498sfnc:StockUnitsMember2020-01-012020-12-310000090498us-gaap:RestrictedStockMember2020-12-310000090498sfnc:StockUnitsMember2020-12-310000090498us-gaap:RestrictedStockMember2021-01-012021-12-310000090498sfnc:StockUnitsMember2021-01-012021-12-310000090498us-gaap:RestrictedStockMember2021-12-310000090498sfnc:StockUnitsMember2021-12-310000090498sfnc:Range01Member2021-01-012021-12-310000090498sfnc:Range01Member2021-12-310000090498sfnc:Range02Member2021-01-012021-12-310000090498sfnc:Range02Member2021-12-310000090498sfnc:Range03Member2021-01-012021-12-310000090498sfnc:Range03Member2021-12-310000090498sfnc:Range04Member2021-01-012021-12-310000090498sfnc:Range04Member2021-12-310000090498sfnc:Range05Member2021-01-012021-12-310000090498sfnc:Range05Member2021-12-310000090498sfnc:Range06Member2021-01-012021-12-310000090498sfnc:Range06Member2021-12-310000090498sfnc:Range07Member2021-01-012021-12-310000090498sfnc:Range07Member2021-12-310000090498us-gaap:RestrictedStockUnitsRSUMember2018-12-310000090498us-gaap:RestrictedStockUnitsRSUMember2019-01-012019-12-310000090498us-gaap:RestrictedStockUnitsRSUMember2019-12-310000090498us-gaap:RestrictedStockUnitsRSUMember2020-01-012020-12-310000090498us-gaap:RestrictedStockUnitsRSUMember2020-12-310000090498us-gaap:RestrictedStockUnitsRSUMember2021-01-012021-12-310000090498us-gaap:RestrictedStockUnitsRSUMember2021-12-310000090498sfnc:TransfersofLoanstoForeclosedAssetsHeldforSaleMember2021-01-012021-12-310000090498sfnc:TransfersofLoanstoForeclosedAssetsHeldforSaleMember2020-01-012020-12-310000090498sfnc:TransfersofLoanstoForeclosedAssetsHeldforSaleMember2019-01-012019-12-310000090498sfnc:TransferOfPremisesToForeclosedAssetsAndOtherRealEstateOwnedMember2021-01-012021-12-310000090498sfnc:TransferOfPremisesToForeclosedAssetsAndOtherRealEstateOwnedMember2020-01-012020-12-310000090498sfnc:TransferOfPremisesToForeclosedAssetsAndOtherRealEstateOwnedMember2019-01-012019-12-310000090498us-gaap:FairValueMeasurementsRecurringMemberus-gaap:USTreasurySecuritiesMember2021-12-310000090498us-gaap:FairValueMeasurementsRecurringMemberus-gaap:FairValueInputsLevel1Memberus-gaap:USTreasurySecuritiesMember2021-12-310000090498us-gaap:FairValueInputsLevel2Memberus-gaap:FairValueMeasurementsRecurringMemberus-gaap:USTreasurySecuritiesMember2021-12-310000090498us-gaap:FairValueInputsLevel3Memberus-gaap:FairValueMeasurementsRecurringMemberus-gaap:USTreasurySecuritiesMember2021-12-310000090498us-gaap:FairValueMeasurementsRecurringMemberus-gaap:USGovernmentAgenciesDebtSecuritiesMember2021-12-310000090498us-gaap:FairValueMeasurementsRecurringMemberus-gaap:USGovernmentAgenciesDebtSecuritiesMemberus-gaap:FairValueInputsLevel1Member2021-12-310000090498us-gaap:FairValueInputsLevel2Memberus-gaap:FairValueMeasurementsRecurringMemberus-gaap:USGovernmentAgenciesDebtSecuritiesMember2021-12-310000090498us-gaap:FairValueInputsLevel3Memberus-gaap:FairValueMeasurementsRecurringMemberus-gaap:USGovernmentAgenciesDebtSecuritiesMember2021-12-310000090498us-gaap:FairValueMeasurementsRecurringMemberus-gaap:MortgageBackedSecuritiesIssuedByPrivateEnterprisesMember2021-12-310000090498us-gaap:FairValueMeasurementsRecurringMemberus-gaap:MortgageBackedSecuritiesIssuedByPrivateEnterprisesMemberus-gaap:FairValueInputsLevel1Member2021-12-310000090498us-gaap:FairValueInputsLevel2Memberus-gaap:FairValueMeasurementsRecurringMemberus-gaap:MortgageBackedSecuritiesIssuedByPrivateEnterprisesMember2021-12-310000090498us-gaap:FairValueInputsLevel3Memberus-gaap:FairValueMeasurementsRecurringMemberus-gaap:MortgageBackedSecuritiesIssuedByPrivateEnterprisesMember2021-12-310000090498us-gaap:FairValueMeasurementsRecurringMemberus-gaap:USStatesAndPoliticalSubdivisionsMember2021-12-310000090498us-gaap:FairValueMeasurementsRecurringMemberus-gaap:USStatesAndPoliticalSubdivisionsMemberus-gaap:FairValueInputsLevel1Member2021-12-310000090498us-gaap:FairValueInputsLevel2Memberus-gaap:FairValueMeasurementsRecurringMemberus-gaap:USStatesAndPoliticalSubdivisionsMember2021-12-310000090498us-gaap:FairValueInputsLevel3Memberus-gaap:FairValueMeasurementsRecurringMemberus-gaap:USStatesAndPoliticalSubdivisionsMember2021-12-310000090498us-gaap:FairValueMeasurementsRecurringMembersfnc:OtherSecuritiesMember2021-12-310000090498us-gaap:FairValueMeasurementsRecurringMembersfnc:OtherSecuritiesMemberus-gaap:FairValueInputsLevel1Member2021-12-310000090498us-gaap:FairValueInputsLevel2Memberus-gaap:FairValueMeasurementsRecurringMembersfnc:OtherSecuritiesMember2021-12-310000090498us-gaap:FairValueInputsLevel3Memberus-gaap:FairValueMeasurementsRecurringMembersfnc:OtherSecuritiesMember2021-12-310000090498us-gaap:FairValueMeasurementsRecurringMember2021-12-310000090498us-gaap:FairValueMeasurementsRecurringMemberus-gaap:FairValueInputsLevel1Member2021-12-310000090498us-gaap:FairValueInputsLevel2Memberus-gaap:FairValueMeasurementsRecurringMember2021-12-310000090498us-gaap:FairValueInputsLevel3Memberus-gaap:FairValueMeasurementsRecurringMember2021-12-310000090498us-gaap:FairValueMeasurementsRecurringMemberus-gaap:USGovernmentAgenciesDebtSecuritiesMember2020-12-310000090498us-gaap:FairValueMeasurementsRecurringMemberus-gaap:USGovernmentAgenciesDebtSecuritiesMemberus-gaap:FairValueInputsLevel1Member2020-12-310000090498us-gaap:FairValueInputsLevel2Memberus-gaap:FairValueMeasurementsRecurringMemberus-gaap:USGovernmentAgenciesDebtSecuritiesMember2020-12-310000090498us-gaap:FairValueInputsLevel3Memberus-gaap:FairValueMeasurementsRecurringMemberus-gaap:USGovernmentAgenciesDebtSecuritiesMember2020-12-310000090498us-gaap:FairValueMeasurementsRecurringMemberus-gaap:MortgageBackedSecuritiesIssuedByPrivateEnterprisesMember2020-12-310000090498us-gaap:FairValueMeasurementsRecurringMemberus-gaap:MortgageBackedSecuritiesIssuedByPrivateEnterprisesMemberus-gaap:FairValueInputsLevel1Member2020-12-310000090498us-gaap:FairValueInputsLevel2Memberus-gaap:FairValueMeasurementsRecurringMemberus-gaap:MortgageBackedSecuritiesIssuedByPrivateEnterprisesMember2020-12-310000090498us-gaap:FairValueInputsLevel3Memberus-gaap:FairValueMeasurementsRecurringMemberus-gaap:MortgageBackedSecuritiesIssuedByPrivateEnterprisesMember2020-12-310000090498us-gaap:FairValueMeasurementsRecurringMemberus-gaap:USStatesAndPoliticalSubdivisionsMember2020-12-310000090498us-gaap:FairValueMeasurementsRecurringMemberus-gaap:USStatesAndPoliticalSubdivisionsMemberus-gaap:FairValueInputsLevel1Member2020-12-310000090498us-gaap:FairValueInputsLevel2Memberus-gaap:FairValueMeasurementsRecurringMemberus-gaap:USStatesAndPoliticalSubdivisionsMember2020-12-310000090498us-gaap:FairValueInputsLevel3Memberus-gaap:FairValueMeasurementsRecurringMemberus-gaap:USStatesAndPoliticalSubdivisionsMember2020-12-310000090498us-gaap:FairValueMeasurementsRecurringMembersfnc:OtherSecuritiesMember2020-12-310000090498us-gaap:FairValueMeasurementsRecurringMembersfnc:OtherSecuritiesMemberus-gaap:FairValueInputsLevel1Member2020-12-310000090498us-gaap:FairValueInputsLevel2Memberus-gaap:FairValueMeasurementsRecurringMembersfnc:OtherSecuritiesMember2020-12-310000090498us-gaap:FairValueInputsLevel3Memberus-gaap:FairValueMeasurementsRecurringMembersfnc:OtherSecuritiesMember2020-12-310000090498us-gaap:FairValueMeasurementsRecurringMember2020-12-310000090498us-gaap:FairValueMeasurementsRecurringMemberus-gaap:FairValueInputsLevel1Member2020-12-310000090498us-gaap:FairValueInputsLevel2Memberus-gaap:FairValueMeasurementsRecurringMember2020-12-310000090498us-gaap:FairValueInputsLevel3Memberus-gaap:FairValueMeasurementsRecurringMember2020-12-310000090498us-gaap:FairValueMeasurementsNonrecurringMember2021-12-310000090498us-gaap:FairValueMeasurementsNonrecurringMemberus-gaap:FairValueInputsLevel1Member2021-12-310000090498us-gaap:FairValueInputsLevel2Memberus-gaap:FairValueMeasurementsNonrecurringMember2021-12-310000090498us-gaap:FairValueInputsLevel3Memberus-gaap:FairValueMeasurementsNonrecurringMember2021-12-310000090498us-gaap:FairValueMeasurementsNonrecurringMember2020-12-310000090498us-gaap:FairValueMeasurementsNonrecurringMemberus-gaap:FairValueInputsLevel1Member2020-12-310000090498us-gaap:FairValueInputsLevel2Memberus-gaap:FairValueMeasurementsNonrecurringMember2020-12-310000090498us-gaap:FairValueInputsLevel3Memberus-gaap:FairValueMeasurementsNonrecurringMember2020-12-310000090498us-gaap:CollateralPledgedMember2021-12-310000090498us-gaap:CollateralPledgedMember2020-12-310000090498us-gaap:CarryingReportedAmountFairValueDisclosureMember2021-12-310000090498us-gaap:EstimateOfFairValueFairValueDisclosureMemberus-gaap:FairValueInputsLevel1Member2021-12-310000090498us-gaap:FairValueInputsLevel2Memberus-gaap:EstimateOfFairValueFairValueDisclosureMember2021-12-310000090498us-gaap:FairValueInputsLevel3Memberus-gaap:EstimateOfFairValueFairValueDisclosureMember2021-12-310000090498us-gaap:EstimateOfFairValueFairValueDisclosureMember2021-12-310000090498us-gaap:CarryingReportedAmountFairValueDisclosureMembersfnc:LegacyLoansMember2021-12-310000090498us-gaap:EstimateOfFairValueFairValueDisclosureMemberus-gaap:FairValueInputsLevel1Membersfnc:LegacyLoansMember2021-12-310000090498us-gaap:FairValueInputsLevel2Memberus-gaap:EstimateOfFairValueFairValueDisclosureMembersfnc:LegacyLoansMember2021-12-310000090498us-gaap:FairValueInputsLevel3Memberus-gaap:EstimateOfFairValueFairValueDisclosureMembersfnc:LegacyLoansMember2021-12-310000090498us-gaap:EstimateOfFairValueFairValueDisclosureMembersfnc:LegacyLoansMember2021-12-310000090498sfnc:NonInterestBearingTransactionAccountsMemberus-gaap:CarryingReportedAmountFairValueDisclosureMember2021-12-310000090498sfnc:NonInterestBearingTransactionAccountsMemberus-gaap:EstimateOfFairValueFairValueDisclosureMemberus-gaap:FairValueInputsLevel1Member2021-12-310000090498us-gaap:FairValueInputsLevel2Membersfnc:NonInterestBearingTransactionAccountsMemberus-gaap:EstimateOfFairValueFairValueDisclosureMember2021-12-310000090498us-gaap:FairValueInputsLevel3Membersfnc:NonInterestBearingTransactionAccountsMemberus-gaap:EstimateOfFairValueFairValueDisclosureMember2021-12-310000090498sfnc:NonInterestBearingTransactionAccountsMemberus-gaap:EstimateOfFairValueFairValueDisclosureMember2021-12-310000090498us-gaap:CarryingReportedAmountFairValueDisclosureMembersfnc:InterestBearingTransactionAccountsAndSavingsDepositsMember2021-12-310000090498us-gaap:EstimateOfFairValueFairValueDisclosureMemberus-gaap:FairValueInputsLevel1Membersfnc:InterestBearingTransactionAccountsAndSavingsDepositsMember2021-12-310000090498us-gaap:FairValueInputsLevel2Memberus-gaap:EstimateOfFairValueFairValueDisclosureMembersfnc:InterestBearingTransactionAccountsAndSavingsDepositsMember2021-12-310000090498us-gaap:FairValueInputsLevel3Memberus-gaap:EstimateOfFairValueFairValueDisclosureMembersfnc:InterestBearingTransactionAccountsAndSavingsDepositsMember2021-12-310000090498us-gaap:EstimateOfFairValueFairValueDisclosureMembersfnc:InterestBearingTransactionAccountsAndSavingsDepositsMember2021-12-310000090498us-gaap:CarryingReportedAmountFairValueDisclosureMembersfnc:TimeDepositsMember2021-12-310000090498us-gaap:EstimateOfFairValueFairValueDisclosureMembersfnc:TimeDepositsMemberus-gaap:FairValueInputsLevel1Member2021-12-310000090498us-gaap:FairValueInputsLevel2Memberus-gaap:EstimateOfFairValueFairValueDisclosureMembersfnc:TimeDepositsMember2021-12-310000090498us-gaap:FairValueInputsLevel3Memberus-gaap:EstimateOfFairValueFairValueDisclosureMembersfnc:TimeDepositsMember2021-12-310000090498us-gaap:EstimateOfFairValueFairValueDisclosureMembersfnc:TimeDepositsMember2021-12-310000090498us-gaap:CarryingReportedAmountFairValueDisclosureMember2020-12-310000090498us-gaap:EstimateOfFairValueFairValueDisclosureMemberus-gaap:FairValueInputsLevel1Member2020-12-310000090498us-gaap:FairValueInputsLevel2Memberus-gaap:EstimateOfFairValueFairValueDisclosureMember2020-12-310000090498us-gaap:FairValueInputsLevel3Memberus-gaap:EstimateOfFairValueFairValueDisclosureMember2020-12-310000090498us-gaap:EstimateOfFairValueFairValueDisclosureMember2020-12-310000090498us-gaap:CarryingReportedAmountFairValueDisclosureMembersfnc:LegacyLoansMember2020-12-310000090498us-gaap:EstimateOfFairValueFairValueDisclosureMemberus-gaap:FairValueInputsLevel1Membersfnc:LegacyLoansMember2020-12-310000090498us-gaap:FairValueInputsLevel2Memberus-gaap:EstimateOfFairValueFairValueDisclosureMembersfnc:LegacyLoansMember2020-12-310000090498us-gaap:FairValueInputsLevel3Memberus-gaap:EstimateOfFairValueFairValueDisclosureMembersfnc:LegacyLoansMember2020-12-310000090498us-gaap:EstimateOfFairValueFairValueDisclosureMembersfnc:LegacyLoansMember2020-12-310000090498sfnc:NonInterestBearingTransactionAccountsMemberus-gaap:CarryingReportedAmountFairValueDisclosureMember2020-12-310000090498sfnc:NonInterestBearingTransactionAccountsMemberus-gaap:EstimateOfFairValueFairValueDisclosureMemberus-gaap:FairValueInputsLevel1Member2020-12-310000090498us-gaap:FairValueInputsLevel2Membersfnc:NonInterestBearingTransactionAccountsMemberus-gaap:EstimateOfFairValueFairValueDisclosureMember2020-12-310000090498us-gaap:FairValueInputsLevel3Membersfnc:NonInterestBearingTransactionAccountsMemberus-gaap:EstimateOfFairValueFairValueDisclosureMember2020-12-310000090498sfnc:NonInterestBearingTransactionAccountsMemberus-gaap:EstimateOfFairValueFairValueDisclosureMember2020-12-310000090498us-gaap:CarryingReportedAmountFairValueDisclosureMembersfnc:InterestBearingTransactionAccountsAndSavingsDepositsMember2020-12-310000090498us-gaap:EstimateOfFairValueFairValueDisclosureMemberus-gaap:FairValueInputsLevel1Membersfnc:InterestBearingTransactionAccountsAndSavingsDepositsMember2020-12-310000090498us-gaap:FairValueInputsLevel2Memberus-gaap:EstimateOfFairValueFairValueDisclosureMembersfnc:InterestBearingTransactionAccountsAndSavingsDepositsMember2020-12-310000090498us-gaap:FairValueInputsLevel3Memberus-gaap:EstimateOfFairValueFairValueDisclosureMembersfnc:InterestBearingTransactionAccountsAndSavingsDepositsMember2020-12-310000090498us-gaap:EstimateOfFairValueFairValueDisclosureMembersfnc:InterestBearingTransactionAccountsAndSavingsDepositsMember2020-12-310000090498us-gaap:CarryingReportedAmountFairValueDisclosureMembersfnc:TimeDepositsMember2020-12-310000090498us-gaap:EstimateOfFairValueFairValueDisclosureMembersfnc:TimeDepositsMemberus-gaap:FairValueInputsLevel1Member2020-12-310000090498us-gaap:FairValueInputsLevel2Memberus-gaap:EstimateOfFairValueFairValueDisclosureMembersfnc:TimeDepositsMember2020-12-310000090498us-gaap:FairValueInputsLevel3Memberus-gaap:EstimateOfFairValueFairValueDisclosureMembersfnc:TimeDepositsMember2020-12-310000090498us-gaap:EstimateOfFairValueFairValueDisclosureMembersfnc:TimeDepositsMember2020-12-310000090498sfnc:CreditCardCommitmentsToExtendCreditMember2021-12-310000090498sfnc:OtherLoanCommitmentsToExtendCreditMember2021-12-310000090498sfnc:CreditCardCommitmentsToExtendCreditMember2020-12-310000090498sfnc:OtherLoanCommitmentsToExtendCreditMember2020-12-310000090498us-gaap:FixedRateResidentialMortgageMember2021-12-310000090498us-gaap:FixedRateResidentialMortgageMember2020-12-310000090498srt:MinimumMember2020-01-012020-12-310000090498srt:MaximumMember2020-01-012020-12-310000090498sfnc:StandbyLettersOfCredit1Member2021-12-310000090498sfnc:StandbyLettersOfCredit1Member2020-12-310000090498us-gaap:FederalHomeLoanBankCertificatesAndObligationsFHLBMember2021-12-310000090498us-gaap:FederalHomeLoanBankCertificatesAndObligationsFHLBMember2020-12-310000090498us-gaap:FederalHomeLoanBankCertificatesAndObligationsFHLBMember2021-01-012021-12-310000090498us-gaap:FederalHomeLoanBankCertificatesAndObligationsFHLBMember2020-01-012020-12-310000090498srt:CumulativeEffectPeriodOfAdoptionAdjustmentMember2020-01-010000090498us-gaap:AccountingStandardsUpdate201712Member2019-03-310000090498us-gaap:AccountingStandardsUpdate201712Member2019-01-012019-03-310000090498us-gaap:AccountingStandardsUpdate201602Member2019-01-010000090498us-gaap:FairValueHedgingMember2021-12-310000090498us-gaap:FairValueHedgingMember2020-12-310000090498us-gaap:InterestRateSwapMember2021-12-310000090498us-gaap:InterestRateSwapMember2020-12-310000090498sfnc:RiskParticipationAgreementsMember2021-12-310000090498us-gaap:EnergyRelatedDerivativeMember2021-12-310000090498us-gaap:EnergyRelatedDerivativeMember2020-12-310000090498sfnc:SimmonsFirstNationalCorporationMember2021-12-310000090498sfnc:SimmonsFirstNationalBankMember2021-12-310000090498sfnc:SimmonsFirstNationalCorporationMember2020-12-310000090498sfnc:SimmonsFirstNationalBankMember2020-12-310000090498srt:ParentCompanyMember2021-12-310000090498srt:ParentCompanyMember2020-12-310000090498srt:ParentCompanyMember2021-01-012021-12-310000090498srt:ParentCompanyMember2020-01-012020-12-310000090498srt:ParentCompanyMember2019-01-012019-12-310000090498srt:ParentCompanyMember2019-12-310000090498srt:ParentCompanyMember2018-12-31
UNITED STATES
SECURITIES AND EXCHANGE COMMISSION
Washington, D.C. 20549
FORM 10-K
(Mark One)
| | | | | | | | |
| ☒ | ANNUAL REPORT PURSUANT TO SECTION 13 OR 15(d) OF THE SECURITIES EXCHANGE ACT OF 1934 |
For the fiscal year ended December 31, 2021
OR
| | | | | |
| ☐ | TRANSITION REPORT PURSUANT TO SECTION 13 OR 15(d) OF THE SECURITIES EXCHANGE ACT OF 1934 |
For the transition period from _____ to _____
Commission file number 000-06253
 SIMMONS FIRST NATIONAL CORPORATION
(Exact name of registrant as specified in its charter)
| | | | | |
| Arkansas | 71-0407808 |
| (State or other jurisdiction of | (I.R.S. Employer |
| incorporation or organization) | Identification No.) |
| | |
| 501 Main Street | 71601 |
| Pine Bluff | (Zip Code) |
| Arkansas | |
| (Address of principal executive offices) | |
(870) 541-1000
(Registrant’s telephone number, including area code)
Securities registered pursuant to Section 12(b) of the Act:
| | | | | | | | | | | | | | |
| Title of each class | | Trading Symbol(s) | | Name of each exchange on which registered |
| Common stock, par value $0.01 per share | | SFNC | | The Nasdaq Global Select Market |
Securities registered pursuant to Section 12(g) of the Act: None
Indicate by check mark if the registrant is a well-known seasoned issuer, as defined in Rule 405 of the Securities Act. ☒ Yes ☐ No
Indicate by check mark if the registrant is not required to file reports pursuant to Section 13 or Section 15(d) of the Act. ☐ Yes ☒ No
Indicate by check mark whether the registrant (1) has filed all reports required to be filed by Section 13 or 15(d) of the Securities Exchange Act of 1934 during the preceding 12 months (or for such shorter period that the registrant was required to file such reports), and (2) has been subject to such filing requirements for the past 90 days. ☒ Yes ☐ No
Indicate by check mark whether the registrant has submitted electronically every Interactive Data File required to be submitted pursuant to Rule 405 of Regulation S-T (§ 232.405 of this chapter) during the preceding 12 months (or for such shorter period that the registrant was required to submit and post such files). ☒ Yes ☐ No
Indicate by check mark whether the registrant is a large accelerated filer, an accelerated filer, a non-accelerated filer, a smaller reporting company, or an emerging growth company. See definitions of “large accelerated filer,” “accelerated filer,” “smaller reporting company,” and “emerging growth company” in Rule 12b-2 of the Exchange Act.
| | | | | | | | | | | | | | | | | |
| Large accelerated filer | ☒ | Accelerated filer | ☐ | Non-accelerated filer | ☐ |
| Smaller reporting company | ☐ | Emerging Growth company | ☐ | | |
If an emerging growth company, indicate by check mark if the registrant has elected not to use the extended transition period for complying with any new or revised financial accounting standards provided pursuant to Section 13(a) of the Exchange Act. ☐
Indicate by check mark whether the registrant has filed a report on and attestation to its management’s assessment of the effectiveness of its internal control over financial reporting under Section 404(b) of the Sarbanes-Oxley Act (15 U.S.C. 7262(b)) by the registered public accounting firm that prepared or issued its audit report. ☒
Indicate by check mark whether the registrant is a shell company (as defined in Rule 12b-2 of the Act.). ☐ Yes ☒ No
The aggregate market value of the Registrant’s Common Stock, par value $0.01 per share, held by non-affiliates on June 30, 2021, was $3,104,087,782 based upon the last trade price as reported on the Nasdaq Global Select Market® of $29.34.
The number of shares outstanding of the Registrant’s Common Stock as of February 22, 2022, was 112,374,863.
DOCUMENTS INCORPORATED BY REFERENCE
Portions of the Proxy Statement for the 2022 Annual Meeting of Shareholders of the Registrant to be held on April 27, 2022, are incorporated by reference into Part III of this Form 10-K.
SIMMONS FIRST NATIONAL CORPORATION
ANNUAL REPORT ON FORM 10-K
INDEX
CAUTIONARY NOTE REGARDING FORWARD-LOOKING STATEMENTS
Certain statements contained in this Annual Report on Form 10-K may not be based on historical facts and should be considered “forward-looking statements” within the meaning of the Private Securities Litigation Reform Act of 1995. These forward-looking statements may be identified by reference to a future period(s) or by the use of forward-looking terminology, such as “anticipate,” “believe,” “budget,” “contemplate,” “continue,” estimate,” “expect,” “foresee,” “intend,” “indicate,” “likely,” “target,” “plan,” “positions,” “prospects,” “project,” “predict,” or “potential,” by future conditional verbs such as “could,” “may,” “might,” “should,” “will,” or “would,” by variations of such words or by similar expressions. These forward-looking statements include, without limitation, those relating to the Company’s future growth, acquisitions and their expected benefits, revenue, expenses, assets, asset quality, profitability, earnings, accretion, dividends, customer service, lending capacity and lending activity, investment in digital channels, critical accounting policies, net interest margin, non-interest revenue, market conditions related to and the impact of the Company’s stock repurchase program, consumer behavior and liquidity, the Company’s ability to recruit and retain key employees, the adequacy of the allowance for credit losses, the impacts of the COVID-19 pandemic and the ability of the Company to manage the impacts of the COVID-19 pandemic, the impacts of the Company’s and its customers’ participation in the Paycheck Protection Program, income tax deductions, credit quality, the level of credit losses from lending commitments, net interest revenue, interest rate sensitivity, loan loss experience, liquidity, the Company’s expectations regarding actions by the Federal Home Loan Banks (“FHLB”) including with respect to the FHLB’s option to terminate FOTO advances, capital resources, market risk, plans for investments in securities, effect of pending and future litigation (including the results of the overdraft fee litigation against the Company that is described in this annual report), acquisition strategy and activity, legal and regulatory limitations and compliance and competition.
These forward-looking statements involve risks and uncertainties, and may not be realized due to a variety of factors, including, without limitation: changes in the Company’s operating, acquisition, or expansion strategy; the effects of future economic conditions (including unemployment levels and slowdowns in economic growth), governmental monetary and fiscal policies, as well as legislative and regulatory changes, including in response to the COVID-19 pandemic; the impacts of the COVID-19 pandemic on the Company’s operations and performance; the ultimate effect of measures the Company takes or has taken in response to the COVID-19 pandemic; the severity and duration of the COVID-19 pandemic, including the effectiveness of vaccination efforts and developments with respect to COVID-19 variants; the pace of recovery when the COVID-19 pandemic subsides and the heightened impact it has on many of the risks described herein and in other reports we file with the Securities and Exchange Commission (“SEC”); changes in real estate values; changes in interest rates; changes in the level and composition of deposits, loan demand, and the values of loan collateral, securities and interest sensitive assets and liabilities; changes in the securities markets generally or the price of the Company’s common stock specifically; developments in information technology affecting the financial industry; cyber threats, attacks or events; reliance on third parties for the provision of key services; further changes in accounting principles relating to loan loss recognition; uncertainty and disruption associated with the discontinued use of the London Inter-Bank Offered Rate; the costs of evaluating possible acquisitions and the risks inherent in integrating acquisitions; possible adverse rulings; judgements, settlements, and other outcomes of pending or future litigation, including litigation or actions arising from the Company’s participation in and administration of programs related to the COVID-19 pandemic (including, among others, the PPP); the effects of competition from other commercial banks, thrifts, mortgage banking firms, consumer finance companies, credit unions, securities brokerage firms, insurance companies, money market and other mutual funds and other financial institutions operating in our market area and elsewhere, including institutions operating regionally, nationally and internationally, together with such competitors offering banking products and services by mail, telephone, computer and the internet; the failure of assumptions underlying the establishment of reserves for possible credit losses, fair value for loans, other real estate owned, and those factors set forth under Item 1A. “Risk Factors” of this report and other cautionary statements set forth elsewhere in this report. Many of these factors are beyond our ability to predict or control, and actual results could differ materially from those in the forward-looking statements due to these factors and others. In addition, as a result of these and other factors, our past financial performance should not be relied upon as an indication of future performance.
We believe the assumptions and expectations that underlie or are reflected in our forward-looking statements are reasonable, based on information available to us on the date hereof. However, given the described uncertainties and risks, we cannot guarantee our future performance or results of operations or whether our future performance will differ materially from the performance reflected in or implied by our forward-looking statements, and you should not place undue reliance on these forward-looking statements. Any forward-looking statement speaks only as of the date hereof, and we undertake no obligation to update or revise any forward-looking statements, whether as a result of new information, future events or otherwise, and all written or oral forward-looking statements attributable to us are expressly qualified in their entirety by this section.
PART I
ITEM 1. BUSINESS
Company Overview
Simmons First National Corporation, an Arkansas corporation organized in 1968, is a financial holding company registered under the Bank Holding Company Act of 1956, as amended. The terms “Company,” “we,” “us,” and “our” refer to Simmons First National Corporation and, where appropriate, its subsidiaries. The Company is headquartered in Pine Bluff, Arkansas, and had total consolidated assets of $24.7 billion, total consolidated loans of $12.0 billion, total consolidated deposits of $19.4 billion and equity capital of $3.2 billion, each as of December 31, 2021. The Company, through its subsidiaries, provides banking and other financial products and services in markets located in Arkansas, Kansas, Missouri, Oklahoma, Tennessee and Texas.
We seek to build shareholder value by, among other things, focusing on strong asset quality, maintaining strong capital, managing our liquidity position, improving our operational efficiency and opportunistically growing our business, both organically and through mergers with and acquisitions of other financial institutions. Our business philosophy centers on building strong, deep customer relationships through excellent customer service and integrity in our operations. While we have grown in recent years into a regional financial institution and one of the largest bank/financial holding companies headquartered in the State of Arkansas, we continue to emphasize, where practicable, a community-based mindset focused on local associates responding to local banking needs and making business decisions in the markets they serve. Those efforts, though, are buttressed by experienced, centralized support functions in select, critical areas. While we serve a variety of customers and industries, we are not dependent on any single customer or industry.
Subsidiary Bank
The Company’s lead subsidiary, Simmons Bank (“Simmons Bank” or the “Bank”), is an Arkansas state-chartered bank that has been in operation since 1903.
Simmons Bank provides banking and other financial products and services to individuals and businesses using a network of approximately 199 financial centers in Arkansas, Kansas, Missouri, Oklahoma, Tennessee and Texas. Simmons Bank offers commercial banking products and services to business and other corporate customers. Simmons Bank extends loans for a broad range of corporate purposes, including financing commercial real estate, construction of particular properties, commercial and industrial uses, acquisition and equipment financings, and other general corporate needs. Simmons Bank also engages in small business administration (“SBA”) and agricultural finance lending, and it offers corporate credit card products, as well as corporate deposit products and treasury management services.
In addition, Simmons Bank offers a variety of consumer banking products and services, including savings, time, and checking deposit products; ATM services; internet and mobile banking platforms; overdraft facilities; real estate, home equity, and other consumer loans and lines of credit; consumer credit card products; and safe deposit boxes. Simmons Bank also maintains a networking arrangement with a third-party broker-dealer that offers brokerage services to Simmons Bank customers, as well as a trust department that provides a variety of trust, investment, agency, and custodial services for individual and corporate clients (including, among other things, administration of estates and personal trusts, and management of investment accounts).
Additionally, Simmons First Insurance Services, Inc. and Simmons First Insurance Services of TN, LLC are wholly-owned subsidiaries of Simmons Bank and are insurance agencies that offer various lines of personal and corporate insurance coverage to individual and commercial customers.
Community and Metro Bank Strategy
Historically, the Company utilized separately chartered community bank subsidiaries to provide full-service banking products and services across our footprint. During 2014, we consolidated all separately chartered banks into Simmons Bank in order to more effectively meet the increased regulatory burden facing banks, reduce certain operating costs, and more efficiently perform operational duties. To both effectively compete in and service the needs of the different types of markets that are now included in our footprint, Simmons Bank now operates using two main groups, a community banking group and a metro banking group, within its geographic footprint. Currently, Simmons Bank’s community and metro banking groups are organized as follows:
| | | | | |
| Community Banking Group | Metro Banking Group |
Arkansas Community Division (East Central Arkansas; North Central Arkansas; Northeast Arkansas; Arkansas River Valley; South Arkansas; and South Central Arkansas) | Central Arkansas and Tennessee Division (Little Rock, Arkansas; Memphis, Tennessee; Nashville, Tennessee) |
| |
Tennessee Community Division (East Tennessee and West Tennessee) | St. Louis Division (St. Louis, Missouri) |
| |
MO/OK/TX Community Division (Central Missouri; South Central Missouri; Southwest Missouri; Southeast Oklahoma; Stillwater, Oklahoma; North Texas) | Texas Division (Dallas, Texas; Ft. Worth, Texas; North Dallas, Texas) |
| Western Division (Northwest Arkansas; Kansas City, Missouri/Kansas; Wichita, Kansas; Oklahoma City, Oklahoma; Tulsa, Oklahoma |
Growth Strategy
Over the past 32 years, as we have expanded our markets and services, our growth strategy has evolved and diversified. We have used varying acquisition and internal branching methods to enter key growth markets and increase the size of our footprint.
Since 1990, we have completed 20 whole bank acquisitions, one trust company acquisition, five bank branch acquisitions, one bankruptcy (363) acquisition, four FDIC failed bank acquisitions and four Resolution Trust Corporation failed thrift acquisitions. The following summary provides additional details concerning our more recent acquisition activity.
In 2013, we completed the acquisition of Metropolitan National Bank (“Metropolitan” or “MNB”) from Rogers Bancshares, Inc. (“RBI”). The purchase was completed through an auction of the MNB stock by the U. S. Bankruptcy Court as a part of the Chapter 11 proceeding of RBI. MNB, which was headquartered in Little Rock, Arkansas, served central and northwest Arkansas and had total assets of $950 million. Upon completion of the acquisition, MNB and our Rogers, Arkansas chartered bank, Simmons First Bank of Northwest Arkansas were merged into Simmons Bank. As an in-market acquisition, MNB had significant branch overlap with our existing branch footprint. We completed the systems conversion for MNB on March 21, 2014, and simultaneously closed 27 branch locations that had overlapping footprints with other locations.
On August 31, 2014, we completed the acquisition of Delta Trust & Banking Corporation (“Delta Trust”), including its wholly-owned bank subsidiary, Delta Trust & Bank. Also headquartered in Little Rock, Arkansas, Delta Trust had total assets of $420 million. The acquisition further expanded Simmons Bank's presence in south, central and northwest Arkansas and allowed us the opportunity to provide services that had not previously been offered with the addition of Delta Trust's insurance agency and securities brokerage service. We merged Delta Trust & Bank into Simmons Bank and completed the systems conversion on October 24, 2014. At that time, we also closed 4 branch locations with overlapping footprints.
In February 2015, we completed the acquisition of Liberty Bancshares, Inc. (“Liberty”), including its wholly-owned bank subsidiary, Liberty Bank. Liberty was headquartered in Springfield, Missouri, served southwest Missouri and had total assets of $1.1 billion. The acquisition enhanced Simmons Bank’s presence not only in southwest Missouri but also in the St. Louis and Kansas City metropolitan areas. The acquisition also allowed us the opportunity to provide services that we had not previously offered in these areas such as trust and securities brokerage services. In addition, Liberty’s expertise in SBA lending enhanced our commercial offerings throughout our geographies. We merged Liberty Bank into Simmons Bank and completed the systems conversion in April 2015.
Also in February 2015, we completed the acquisition of Community First Bancshares, Inc. (“Community First”), including its wholly-owned bank subsidiary, First State Bank. Community First was headquartered in Union City, Tennessee, served customers throughout Tennessee and had total assets of $1.9 billion. The acquisition expanded our footprint into Tennessee and allowed us the opportunity to provide additional services to customers in this area and expand our community banking strategy. In addition,
Community First’s expertise in SBA and consumer lending benefited our customers across each region. We merged First State Bank into Simmons Bank and completed the systems conversion in September 2015.
In October 2015, we completed the acquisition of Ozark Trust & Investment Corporation (“Ozark Trust”), including its wholly-owned non-deposit trust company, Trust Company of the Ozarks. Headquartered in Springfield, Missouri, Ozark Trust had over $1 billion in assets under management and provided a wide range of financial services for its clients including investment management, trust services, IRA rollover or transfers, successor trustee services, personal representatives and custodial services. As our first acquisition of a fee-only financial firm, Ozark Trust provided a new wealth management capability that could be leveraged across the Company’s entire geographic footprint.
In September 2016, we completed the acquisition of Citizens National Bank (“Citizens”), headquartered in Athens, Tennessee. Citizens had total assets of $585 million and strengthened our position in east Tennessee by nine branches. The acquisition expanded our footprint in east Tennessee and allowed us the opportunity to provide additional services to customers in this area and expand our community banking strategy. We merged Citizens into Simmons Bank and completed the systems conversion in October 2016.
In May 2017, we completed the acquisition of Hardeman County Investment Company, Inc. (“Hardeman”), headquartered in Jackson, Tennessee, including its wholly-owned bank subsidiary, First South Bank. We acquired approximately $463 million in assets and strengthened our position in the western Tennessee market. We merged First South Bank into Simmons Bank and completed the systems conversion in September 2017. As part of the systems conversion, we consolidated or closed three existing Simmons Bank and two First South Bank branches due to overlapping footprint.
In October 2017, we completed the acquisition of First Texas BHC, Inc. (“First Texas”), headquartered in Fort Worth, Texas, including its wholly-owned bank subsidiary, Southwest Bank. Southwest Bank had total assets of $2.4 billion. This acquisition allowed us to enter the Texas banking markets, and it also strengthened our specialty product offerings in the areas of SBA lending and trust services. The systems conversion was completed in February 2018, at which time Southwest Bank was merged into Simmons Bank.
Also in October 2017, we completed the acquisition of Southwest Bancorp, Inc. (“OKSB”), including its wholly-owned bank subsidiary, Bank SNB. Headquartered in Stillwater, Oklahoma, OKSB provided us with $2.7 billion in assets, allowed us additional entry into the Oklahoma, Texas and Colorado banking markets, and strengthened our Kansas franchise and our product offerings in the healthcare and real estate industries. The systems conversion was completed in May 2018, at which time Bank SNB was merged into Simmons Bank.
In April 2019, we completed the acquisition of Reliance Bancshares, Inc. (“Reliance”), headquartered in Des Peres, Missouri -part of the greater St. Louis metropolitan area, including its wholly-owned bank subsidiary, Reliance Bank. We acquired approximately $1.5 billion in assets and added 22 branches to the Simmons Bank footprint, substantially enhancing our retail presence within the St. Louis market, and entering the state of Illinois for the first time. The systems conversion was completed in April 2019, at which time Reliance Bank was merged into Simmons Bank.
In October 2019, we completed the acquisition of The Landrum Company (“Landrum”), headquartered in Columbia, Missouri, including its wholly-owned bank subsidiary, Landmark Bank. We acquired approximately $3.4 billion in assets and further strengthened our position in Missouri, Oklahoma and Texas. The systems conversion was completed in February 2020, at which time Landmark Bank merged into Simmons Bank. In connection with the systems conversion, we closed five existing Landmark Bank branches.
In October 2021, we completed the acquisition of Landmark Community Bank (“Landmark”), headquartered in Collierville, Tennessee, as well as the acquisition of Triumph Bancshares, Inc. (“Triumph”), including its wholly-owned bank subsidiary, Triumph Bank, headquartered in Memphis, Tennessee. Landmark had total assets of $968.5 million, while Triumph provided us with $848.2 million in assets. These combined acquisitions allowed us to expand our existing footprint in Tennessee and to further enhance our scale in two of our key Tennessee growth markets – Memphis and Nashville. The systems conversions for both Landmark and Triumph Bank were completed in October 2021, at which time Landmark and Triumph Bank were merged into Simmons Bank.
Additionally, on November 19, 2021, we announced the Company had entered into an Agreement and Plan of Merger (“Spirit Agreement”) with Spirit of Texas Bancshares, Inc. (“Spirit”), headquartered in Conroe, Texas, including its wholly-owned bank subsidiary, Spirit of Texas Bank SSB. See Note 2, Acquisitions, in the accompanying Notes to the Consolidated Financial Statements for additional information related to this acquisition.
Merger and Acquisition Strategy
Merger and acquisition activities are an important part of the Company’s growth strategy. We intend to focus our near-term merger and acquisition strategy on traditional mergers and acquisitions. We continue to believe that the current economic conditions combined with the possibility of a more restrictive bank regulatory environment will cause many financial institutions to seek merger partners in the near-to-intermediate future. We also believe our community banking philosophy, access to capital and successful merger and acquisition history positions us as a purchaser of choice for community and regional banks seeking a strong partner.
We expect that our target areas for mergers and acquisitions will continue to be primarily banks operating in growth markets within our existing footprint of Arkansas, Kansas, Missouri, Oklahoma, Tennessee and Texas. In addition, we will pursue opportunities with financial service companies with specialty lines of business within the existing markets as and when they arise.
As consolidations continue to unfold in the banking industry, the management of risk is an important consideration in how the Company evaluates and consummates these transactions. The senior management teams of both the Company and Simmons Bank have extensive experience in acquiring banks, branches and deposits and post-acquisition integration of operations. We believe this experience positions us to continue to successfully acquire and integrate banks.
The process of merging or acquiring banking organizations is extremely complex; it requires a great deal of time and effort from both buyer and seller. The business, legal, operational, organizational, accounting, and tax issues all must be addressed if the merger or acquisition is to be successful. Throughout the process, valuation is an important aspect of the decision-making process, from initial target analysis through integration of the entities. Merger and acquisition strategies are vitally important in order to derive the maximum benefit out of a potential deal.
Strategic considerations that can cause an acquirer or a target institution to explore or support a merger or acquisition transaction include, among other things:
•Potentially retaining the target institution’s senior management and providing them with an appealing level of autonomy post-integration. We intend to continue to pursue negotiated community and regional bank acquisitions, and we believe that our history with respect to such acquisitions has positioned us as an acquirer of choice for community and regional banks.
•Encouraging acquired banks, their boards and their associates to maintain their community involvement, while empowering the banks to offer a broader array of financial products and services. We believe this approach leads to enhanced profitability of the combined franchise after the acquisition.
•Taking advantage of future opportunities that can be exploited when the two companies are combined. Companies need to position themselves to take advantage of emerging trends in the marketplace.
•Strengthening the bench. One company may have a major weakness (such as poor distribution or service delivery) whereas the other company has some significant strength. By combining the two companies, each company fills in strategic gaps that are essential for long-term survival.
•Acquiring human resources and intellectual capital can help improve innovative thinking and development within the Company.
•Acquiring a regional or multi-state bank can provide the Company with access to emerging/established markets and/or increased products and services.
•Providing additional scale and market share within our existing footprint.
Loan Risk Assessment
As part of our ongoing risk assessment and analysis, the Company utilizes credit policies and procedures, internal credit expertise and several internal layers of review. The internal layers of ongoing review include Division Presidents, Division and Senior Credit Officers, the Chief Credit Officer and Corporate Credit Officer, Division Loan Committees, an Agriculture Loan Committee, an Executive Loan Committee, Senior Credit Committee, and a Directors’ Credit Committee.
Additionally, the Company has an Asset Quality Review Committee comprised of management that meets quarterly to review the adequacy of the allowance for credit losses. The Committee reviews the status of past due, non-performing and other impaired loans, reserve ratios, and additional performance indicators for Simmons Bank. The appropriateness of the allowance for credit losses is determined based upon the aforementioned performance factors, and provision adjustments are made accordingly.
The Board of Directors reviews the adequacy of its allowance for credit losses on a periodic basis giving consideration to past due loans, non-performing loans, other impaired loans, and current economic conditions. Our loan review department monitors loan information monthly. In order to verify the accuracy of the monthly analysis of the allowance for credit losses, the loan review department performs a detailed review of each loan product on an annual basis or more often if warranted. Additionally, we have instituted a Special Asset Committee for the purpose of reviewing criticized loans in regard to collateral adequacy, workout strategies and proper reserve allocations.
Competition
There is significant competition among commercial banks in our various market areas. In addition, we also compete with other providers of financial services, such as savings and loan associations, credit unions, finance companies, securities firms, insurance companies, full service brokerage firms, discount brokerage firms and fintech companies. Some of our competitors have greater resources and, as such, may have higher lending limits and may offer other services that we do not provide. Some of our competitors operate only in digital channels, which may result in those competitors investing greater resources in information technology and digital product and service delivery without the overhead associated with a branch network. We generally compete on the basis of customer service and responsiveness to customer needs, available loan and deposit products, the rates of interest charged on loans, the rates of interest paid for funds, and the availability and pricing of trust and brokerage services.
Nonbank competitors are increasingly offering products and services that traditionally were bank products. Many of these nonbank competitors are not subject to the same extensive federal regulations that govern bank holding companies and federally insured banks, which may allow them to offer greater lending limits and certain products and services that the Company and its affiliates do not provide.
Principal Offices and Available Information
Our principal executive offices are located at 501 Main Street, Pine Bluff, Arkansas 71601, and our telephone number is (870) 541-1000. We also have corporate offices located at 601 E. 3rd Street, Little Rock, Arkansas 72201. We maintain a website at http://www.simmonsbank.com. On this website under the Investor Relations section, we make our filings with the SEC (including our annual reports on Form 10-K, quarterly reports on Form 10-Q, current reports on Form 8-K, and amendments to those reports filed or furnished pursuant to Section 13(a) or 15(d) of the Securities Exchange Act of 1934, as amended) available free of charge as soon as reasonably practicable after we electronically file such material with, or furnish it to, the SEC. In addition, our website contains other news and announcements about the Company and its subsidiaries.
Human Capital
Our associates are a critical component of our success. Because our business depends on our ability to attract, develop, and retain highly qualified, skilled lending, operations, information technology, and other associates, as well as managers who are experienced and effective at leading their respective departments, we have implemented wide-ranging programs focused on identifying and recruiting new talent, as well as enhancing the skills, qualifications, and satisfaction of our current associate base, under the umbrella program “Banking on Our People.” In recruiting, we employ a variety of strategies, including, among other things, the use of in-house recruiters, search firms, and employment agencies, designed to attract qualified and diverse candidates. We offer, among other opportunities, student internships and a management trainee program that provides recent graduates the opportunity to gain insight into several Company departments. We believe our compensation program, which, in addition to base and incentive compensation, includes health, retirement, and an array of other benefit plans and programs, is competitive within the financial industry, and we periodically review our plans and programs, as well as market surveys, to help ensure that our compensation program is consistent with our level of performance and that we have a current understanding of peer practices.
We provide our associates a variety of professional development opportunities, including participation in industry conferences, instructor-led continuing education and training sessions, as well as online training sessions that focus, among other things, on industry, regulatory, business, and leadership topics. We offer mentorship opportunities through our “Simmons Sidekick” and “Ambassadors” programs, and we provide tuition reimbursement for associates to attend a higher education facility to obtain bachelor’s and master’s degrees that are relevant to the finance industry and/or their positions within the Company. We seek to promote from within the Company when feasible and have established programs, such as our “Next Generation Leadership Program,” to help develop future managerial talent.
We are committed to maintaining a strong culture that not only earns loyalty but also serves as a catalyst for growth. Our values-based culture is memorialized in a set of “Culture Cornerstones” that are communicated to all associates and incorporated in various ways throughout our operations. We strive for all five of our Culture Cornerstones - Better Together; Integrity; Passion; High Performance; and Pursue Growth - to be reflected in everything we do, including how we interact with each other, how we
interact with our customers, and how we interact with our vendors and business partners. We are also committed to promoting our associates’ well-being. Our wellness program, “Ultimate You,” assists associates in improving their level of physical, financial, and mental fitness through offerings such as discounted gym memberships, financial literacy training, channels for counseling, and health-focused challenges and contests. Finally, our inclusion program, “We Are Simmons,” celebrates and supports the unique perspectives, experiences, and backgrounds of our associates. We believe these differences help us better serve our customers and make us stronger as a whole. In connection with this program, we recently introduced Employee Resource Groups for veterans, women, African Americans, and LGBTQIA+ associates.
As of December 31, 2021, the Company and its subsidiaries had approximately 2,877 full time equivalent associates. None of our associates are represented by any union or similar groups, and we have not experienced any labor disputes or strikes arising from any such organized labor groups. We consider our relationship with our associates to be good and strive to operate with an “open door policy” where associate concerns and issues can be discussed anytime directly with leadership or human resources. We have been recognized with “Best Places to Work” awards in several of our markets.
SUPERVISION AND REGULATION
The Company
The Company, as a bank holding company, is subject to both federal and state regulation. Under federal law, a bank holding company generally must obtain approval from the Board of Governors of the Federal Reserve System (“FRB”) before acquiring ownership or control of the assets or stock of a bank or a bank holding company. Prior to approval of any proposed acquisition, the FRB will review the effect on competition of the proposed acquisition, as well as other regulatory issues.
The federal law generally prohibits a bank holding company from directly or indirectly engaging in non-banking activities. This prohibition does not include loan servicing, liquidating activities or other activities so closely related to banking as to be a proper incident thereto. Bank holding companies, including the Company, which have elected to qualify as financial holding companies, are authorized to engage in financial activities. Financial activities include any activity that is financial in nature or any activity that is incidental or complimentary to a financial activity.
As a financial holding company, we are required to file with the FRB an annual report and such additional information as may be required by law. From time to time, the FRB examines the financial condition of the Company and its subsidiaries. Bank holding companies are not permitted to engage in unsafe and unsound banking practices. The FRB, through civil and criminal sanctions, is authorized to exercise enforcement powers over bank holding companies (including financial holding companies) and non-banking subsidiaries, to limit activities that represent unsafe or unsound practices or constitute violations of law.
Federal law also requires the Company to act as a source of financial and managerial strength for our bank subsidiary and to commit resources to support that subsidiary. This support may be required by federal banking agencies even at times when a bank holding company may not have the resources to provide the support. Further, if the FRB believes that a bank holding company’s activities, assets or affiliates represent a significant risk to the financial safety, soundness or stability of its subsidiary bank, then the FRB could require that bank holding company to terminate the activities, liquidate the assets or divest the affiliates. Federal banking agencies, including the FRB, may require these and other actions in support of a subsidiary bank even if such actions are not in the best interests of the bank holding company or its stockholders.
We are subject to certain laws and regulations of the State of Arkansas applicable to financial and bank holding companies, including examination and supervision by the Arkansas Bank Commissioner. Under Arkansas law, a financial or bank holding company is prohibited from owning more than one subsidiary bank if any subsidiary bank owned by the holding company has been chartered for less than five years and, further, requires the approval of the Arkansas Bank Commissioner for any acquisition of more than 25% of the capital stock of any other bank located in the State of Arkansas. No bank acquisition may be approved if, after such acquisition, the holding company would control, directly or indirectly, banks having 25% of the total bank deposits in the State of Arkansas, excluding deposits of other banks and public funds.
Additionally, under federal and state law, acquisitions of the Company’s common stock above certain thresholds or in connection with certain governance rights or business relationships may be subject to certain regulatory restrictions, including prior notice and approval requirements, and investors in the Company’s common stock are responsible for ensuring that they comply with these restrictions to the extent they are applicable.
Federal legislation allows bank holding companies (including financial holding companies) from any state to acquire banks located in any state without regard to state law, provided that the holding company (1) is well capitalized, (2) is well managed, (3) would not control more than 10% of the insured deposits in the United States or more than 30% of the insured deposits in such state, and (4) such bank has been in existence at least five years if so required by the applicable state law.
The principal source of the Company’s liquidity is dividends from Simmons Bank, the payment of which is subject to certain limitations imposed by federal and state laws. The approval of the Arkansas Bank Commissioner is, for instance, required if the total of all dividends declared by an Arkansas state bank in any calendar year exceeds seventy-five percent (75%) of the total of its net profits, as defined, for that year combined with seventy-five percent (75%) of its retained net profits of the preceding year. Under the foregoing dividend restrictions, and while maintaining its “well capitalized” status, at December 31, 2021, Simmons Bank had paid to the Company all available dividends. While past dividends are not necessarily indicative of amounts that may be paid or available to be paid in future periods, net profits of Simmons Bank and cash balances at the Company are projected to be sufficient to pay quarterly dividends on the Company’s common stock at current levels and interest and principal on the Company’s debt as well as meet other liquidity needs.
In 2019, final rules were adopted that, among other things, eliminated a prior approval requirement in the Basel III Capital Rules (discussed below) for a bank holding company to repurchase shares of its common stock, provided that the bank holding company is well capitalized both before and after the proposed repurchase, well-managed, and not the subject of any unresolved supervisory issues. However, a bank holding company’s repurchases of shares of its common stock may, in certain circumstances, be subject to approval or notice requirements under other regulations, policies, or supervisory expectations of the bank holding company’s regulators, may be discouraged by regulators in the form of supervisory feedback on the bank holding company’s regulatory capital levels or plan, and must comply with all applicable state and federal corporate and securities laws and regulations.
Subsidiary Bank
Simmons Bank is an Arkansas state-chartered bank and a member of the Federal Reserve System through the Federal Reserve Bank of St. Louis. Due to the Company’s typical acquisition process, there may be brief periods of time during which the Company may operate another subsidiary bank that the Company acquired through a merger with a target bank holding company as a separate subsidiary while preparing for the merger and integration of that subsidiary bank into Simmons Bank. However, it is the Company’s intent to generally maintain Simmons Bank as the Company’s sole subsidiary bank.
The lending powers of the subsidiary bank are generally subject to certain restrictions, including the amount which may be loaned to a single borrower. Our subsidiary bank is a member of the FDIC, which provides insurance on deposits of each member bank up to applicable limits by the Deposit Insurance Fund. For this protection, our bank pays a statutory assessment to the FDIC each year.
Furthermore, as a member of the Federal Reserve System, our subsidiary bank is required by law to maintain reserves against its transaction deposits as required by the FRB. The reserves must be held in cash or with the FRB. Banks are permitted to meet this requirement by maintaining the specified amount as an average balance over a two-week period. During 2020, due to the COVID-19 pandemic, the FRB acting pursuant to the Federal Reserve Act reduced the reserve requirements to zero until further notice. As a result, as of December 31, 2021, the Company’s reserve balances were zero.
Pursuant to federal laws and regulations, national and state-chartered banks may establish branches in their home states, as well as in other states. Applications to establish branches must be filed with the appropriate primary federal regulator and, where applicable, the bank’s state regulatory authority. As an Arkansas state-chartered bank, our subsidiary bank files branch applications with both the FRB and the Arkansas State Bank Department.
Federal laws and regulations also restrict banks, including our subsidiary bank, from establishing certain tying arrangements. In particular, subject to certain exceptions, banks, including our subsidiary bank, are prohibited from extending credit, leasing or selling property, furnishing services, or varying prices on the condition that the customer obtain an additional product or service from the bank or its affiliates or not obtain services of a competitor of the bank or its affiliates.
Transactions with Affiliates and Insiders
Under federal law, transactions between insured depository institutions and their affiliates are governed by Sections 23A and 23B of the Federal Reserve Act and its implementing regulation, Regulation W. In a bank holding company context, at a minimum, the parent holding company of a bank, any companies which are controlled by such parent holding company, and financial subsidiaries of the bank, are affiliates of the bank. Generally, Sections 23A and 23B of the Federal Reserve Act are intended to
protect insured depository institutions from losses arising from transactions with non-insured affiliates by limiting the extent to which a bank or its subsidiaries may engage in covered transactions with any one affiliate and with all affiliates of the bank in the aggregate, and requiring that such transactions be on terms consistent with safe and sound banking practices.
Loans to executive officers, directors, or any person who directly or indirectly, or acting through or in concert with one or more persons, owns, controls, or has the power to vote more than 10% of any class of voting securities of a bank (“10% Shareholders”), are subject to Sections 22(g) and 22(h) of the Federal Reserve Act and their corresponding regulations (Regulation O) and Section 13(k) of the Exchange Act relating to the prohibition on personal loans to executives (which exempts financial institutions in compliance with the insider lending restrictions of Section 22(h) of the Federal Reserve Act). Among other things, these loans must be made on terms substantially the same as those prevailing on transactions made to unaffiliated individuals, except that such insiders may receive preferential loans made under a benefit or compensation program that is widely available to the bank's employees and does not give preference to the insider over the employees, and certain extensions of credit to those persons must first be approved in advance by a disinterested majority of the entire Board of Directors. Section 22(h) of the Federal Reserve Act and its implementing regulation, Regulation O, prohibits loans to any directors, executive officers, and principal stockholders and their related interests where the aggregate amount exceeds an amount equal to 15% of an institution’s unimpaired capital and surplus plus an additional 10% of unimpaired capital and surplus in the case of loans that are fully secured by readily marketable collateral, or when the aggregate amount on all of the extensions of credit outstanding to all of these persons would exceed the Bank’s unimpaired capital and unimpaired surplus. Section 22(g) of the Federal Reserve Act places additional limitations on loans to executive officers and identifies limited circumstances in which the Bank is permitted to extend credit to executive officers.
As a result, our subsidiary bank is limited in its ability to make extensions of credit to the Company, investing in the stock or other securities of the Company, and engaging in other affiliated financial transactions with the Company.
Potential Enforcement Action for Bank Holding Companies and Banks
Enforcement proceedings seeking civil or criminal sanctions may be instituted against any bank, any financial or bank holding company, any director, officer, employee or agent of the bank or holding company, which is believed by the federal banking agencies to be violating any administrative pronouncement or engaged in unsafe and unsound practices. In more serious cases, enforcement actions may include the issuance of directives to increase capital; the issuance of formal and informal agreements; the imposition of civil monetary penalties; the issuance of a cease and desist order that can be judicially enforced; the issuance of removal and prohibition orders against officers, directors, and other institution-affiliated parties; the termination of a bank’s deposit insurance; the appointment of a conservator or receiver for a bank; and the enforcement of such actions through injunctions or restraining orders based upon a judicial determination that the agency would be harmed if such equitable relief was not granted.
Risk-Weighted Capital Requirements for the Company and the Subsidiary Bank
Effective January 1, 2015, the Company and its subsidiary bank became subject to new capital regulations (“Basel III Capital Rules”) adopted by the Federal Reserve in July 2013 establishing a new comprehensive capital framework for U.S. banks. The Basel III Capital Rules were fully implemented as of January 1, 2019. For a tabular summary of our risk-weighted capital ratios, see “Management’s Discussion and Analysis of Financial Condition and Results of Operations – Capital” and Note 23, Stockholders’ Equity, of the Notes to Consolidated Financial Statements.
The Basel III Capital Rules include a common equity Tier 1 capital to risk-weighted assets (“CET1”) ratio of 4.5% and a common equity Tier 1 capital conservation buffer of 2.5% of risk-weighted assets. CET1 generally consists of common stock; retained earnings; accumulated other comprehensive income and certain minority interests; all subject to applicable regulatory adjustments and deductions. The Company and its subsidiary bank must hold a capital conservation buffer composed of CET1 capital above its minimum risk-based capital requirements.
A banking organization’s qualifying total capital consists of two components: Tier 1 Capital and Tier 2 Capital. Tier 1 Capital is an amount equal to the sum of common stockholders’ equity, hybrid capital instruments (instruments with characteristics of debt and equity) in an amount up to 25% of Tier 1 Capital, certain preferred stock and the minority interest in the equity accounts of consolidated subsidiaries. For bank holding companies and financial holding companies, goodwill (net of any deferred tax liability associated with that goodwill) may not be included in Tier 1 Capital. Identifiable intangible assets may be included in Tier 1 Capital for banking organizations, in accordance with certain further requirements. At least 50% of the banking organization’s total regulatory capital must consist of Tier 1 Capital.
Tier 2 Capital is an amount equal to the sum of the qualifying portion of the allowance for credit losses, certain preferred stock not included in Tier 1, hybrid capital instruments (instruments with characteristics of debt and equity), certain long-term debt
securities and eligible term subordinated debt, in an amount up to 50% of Tier 1 Capital. The eligibility of these items for inclusion as Tier 2 Capital is subject to certain additional requirements and limitations of the federal banking agencies.
The Basel III Capital Rules expanded the risk-weighting categories from the previous four Basel I-derived categories (0%, 20%, 50% and 100%) to a much larger and more risk-sensitive number of categories, depending on the nature of the assets, generally ranging from 0% for U.S. government and agency securities, to 600% for certain equity exposures, and resulting in higher risk weights for a variety of asset categories, including many residential mortgages and certain commercial real estate.
Accordingly, under the fully-phased in Basel III Capital Rules, the capital standards applicable to the Company include an additional capital conservation buffer of 2.5% of CET1, effectively resulting in minimum ratios inclusive of the capital conservation buffer of (1) CET1 to risk-weighted assets of at least 7.0%, (2) Tier 1 capital to risk-weighted assets of at least 8.5%, and (3) Total capital to risk-weighted assets of at least 10.5%.
In August 2020, the FRB, along with the other federal bank regulatory agencies, adopted a final rule that allows the Company and the Bank to phase-in the impact of adopting the Current Expected Credit Losses (or “CECL”) methodology up to two years, with a three-year period to phase out the cumulative benefit to regulatory capital provided during the two year delay.
Prompt Corrective Action
The Basel III Capital Rules also affected the FDIC’s prompt correction action standards. Those standards seek to address problems associated with undercapitalized financial institutions and provide for five capital categories: well capitalized, adequately capitalized, undercapitalized, significantly undercapitalized, and critically undercapitalized.
For purposes of prompt corrective action, to be:
•well capitalized, a bank must have a total risk based capital ratio of at least 10%, a Tier 1 risk based capital ratio of at least 8%, a CET1 risk based capital ratio of at least 6.5%, and a Tier 1 leverage ratio of at least 5%;
•adequately capitalized, a bank must have a total risk based capital ratio of at least 8%, a Tier 1 risk based capital ratio of at least 6%, a CET1 risk based capital ratio of at least 4.5%, and a Tier 1 leverage ratio of at least 4%;
•undercapitalized, a bank would have a total risk based capital ratio of less than 8%, a Tier 1 risk based capital ratio of less than 6%, a CET1 risk based capital ratio of less than 4.5%, and a Tier 1 leverage ratio of less than 4%;
•significantly undercapitalized, a bank would have a total risk based capital ratio of less than 6%, a Tier 1 risk based capital ratio of less than 4%, a CET1 risk based capital ratio of less than 3%, and a Tier 1 leverage ratio of less than 3%; and
•critically undercapitalized, a bank would have a ratio of tangible equity to total assets that is less than or equal to 2%.
Institutions that fall into the latter three categories are subject to restrictions on their growth and are required to submit a capital restoration plan. There is also a method by which an institution may be downgraded to a lower capital category based on supervisory factors other than capital. As of December 31, 2021, Simmons Bank was “well capitalized” based on the aforementioned ratios.
Federal Deposit Insurance Corporation Improvement Act
The Federal Deposit Insurance Corporation Improvement Act (“FDICIA”), enacted in 1991, requires the FDIC to increase assessment rates for insured banks and authorizes one or more “special assessments,” as necessary for the repayment of funds borrowed by the FDIC or any other necessary purpose. As directed in FDICIA, the FDIC has adopted a transitional risk-based assessment system, under which the assessment rate for insured banks will vary according to the level of risk incurred in the bank’s activities. The risk category and risk-based assessment for a bank is determined, in part, from its prompt corrective action, as well capitalized, adequately capitalized or undercapitalized. Please refer to the section below titled FDIC Deposit Insurance and Assessments for more information.
Pursuant to the FDICIA and Federal Deposit Insurance Act (“FDIA”), the federal banking agencies must promptly mandate corrective actions by banks that fail to meet the capital and related requirements in order to minimize losses to the FDIC and the Deposit Insurance Fund. As of December 31, 2021, the Bank was well capitalized under these regulations.
The federal banking agencies are also required by FDICIA to prescribe standards for banks and bank holding companies (including financial holding companies) relating to operations and management, asset quality, earnings, stock valuation and compensation. A bank or bank holding company that fails to comply with such standards will be required to submit a plan
designed to achieve compliance. If no plan is submitted or the plan is not implemented, the bank or holding company would become subject to additional regulatory action or enforcement proceedings.
A variety of other provisions included in FDICIA may affect the operations of the Company and the subsidiary bank, including reporting requirements, regulatory standards for real estate lending, “truth in savings” provisions, and the requirement that a depository institution give 90 days prior notice to customers and regulatory authorities before closing any branch.
Dodd-Frank Wall Street Reform and Consumer Protection Act
Enacted in 2010, the Dodd-Frank Wall Street Reform and Consumer Protection Act (“Dodd-Frank Act”), significantly changed the regulation of financial institutions and the financial services industry. The Dodd-Frank Act included provisions affecting large and small financial institutions alike, including several provisions that profoundly affected how community banks, thrifts, and small bank and thrift holding companies are regulated. Among other things, these provisions relaxed rules regarding interstate branching, allow financial institutions to pay interest on business checking accounts, and revised capital requirements on bank and thrift holding companies.
The Dodd-Frank Act also established the Bureau of Consumer Financial Protection (“CFPB”) as an independent entity within the Federal Reserve and provided it with the authority to promulgate consumer protection regulations applicable to all entities offering consumer financial services or products, including banks. Additionally, the Dodd-Frank Act included a series of provisions covering mortgage loan origination standards affecting, among other things, originator compensation, minimum repayment standards, and pre-payment penalties. The Dodd-Frank Act contained numerous other provisions affecting financial institutions of all types, many of which have an impact on our operating environment, including among other things, our regulatory compliance costs. However, the Dodd-Frank Act does not prevent states from adopting stricter consumer protection standards than those promulgated by the CFPB. State regulation of financial products and potential enforcement actions could also adversely affect the Company’s business, financial condition, or operations.
The EGRRCPA
In May 2018, the Economic Growth, Regulatory Reform, and Consumer Protection Act (“EGRRCPA”) was enacted, which, among other things, amended certain provisions of the Dodd-Frank Act as well as statutes administered by the FRB and the FDIC. The EGRRCPA provides targeted regulatory relief to financial institutions while preserving the existing framework under which U.S. financial institutions are regulated. The EGRRCPA relieves bank holding companies with less than $100 billion in assets, such as the Company, from the enhanced prudential standards imposed under Section 165 of the Dodd-Frank Act (including, but not limited to, resolution planning and enhanced liquidity and risk management requirements). Please see the section below titled Impacts of Growth for more information.
In addition to amending the Dodd Frank Act, the EGRRCPA also includes certain additional banking-related provisions, consumer protection provisions and securities law-related provisions. Many of the EGRRCPA’s changes were implemented through rules finalized by the federal banking agencies over the course of 2019. These rules and their enforcement are subject to the substantial regulatory discretion of the federal banking agencies. The Company continues to evaluate the impact of the EGRRCPA as it is further implemented by the federal banking agencies.
Volcker Rule
Section 619 of the Dodd-Frank Act, commonly known as the “Volcker Rule,” restricts the ability of banking entities from: (i) engaging in “proprietary trading” and (ii) investing in or sponsoring certain covered funds, subject to certain limited exceptions. Under the Volcker Rule, the term “covered funds” is defined as any issuer that would be an investment company under the Investment Company Act but for the exemption in Section 3(c)(1) or 3(c)(7) of that Act. There are also several exemptions from the definition of covered fund, including, among other things, loan securitizations, joint ventures, certain types of foreign funds, entities issuing asset-backed commercial paper, and registered investment companies. The EGRRCPA and the subsequently promulgated inter-agency agency rules have aimed at simplifying and tailoring certain requirements related to the Volcker Rule.
Brokered Deposits
Section 29 of the FDIA and the FDIC regulations promulgated thereunder limit the ability of any bank to accept, renew or roll over any brokered deposit unless it is well capitalized or, with the FDIC’s approval, adequately capitalized. However, a result of the EGRRCPA, the FDIC has undertaken a comprehensive review of its regulatory approach to brokered deposits, including reciprocal deposits, and interest rate caps applicable to banks that are less than well capitalized. In December 2020, the FDIC issued a final rulemaking to modernize its brokered deposit regulations. Among other things, the final rule establishes a new
framework for analyzing certain provisions of the “deposit broker” definition and establishes certain automatic “primary purpose” exemptions from the deposit broker definition, as well as revises certain interest rate restrictions that apply to less than well capitalized insured depository institutions. The final rule became effective April 1, 2021; and full compliance was required by January 1, 2022. Implementation of the final rule did not have a material impact on our subsidiary bank.
FDIC Deposit Insurance and Assessments
Our customer deposit accounts are insured up to applicable limits by the FDIC’s Deposit Insurance Fund (“DIF”) up to $250,000 per separately insured depositor. Simmons Bank is required to pay deposit insurance assessments to maintain the DIF. Because Simmons Bank’s assets exceed $10 billion, its deposit insurance assessment is based on a scoring system that examines the institution’s supervisory ratings and certain financial measures. The scoring system assesses risk measures to produce two scores, a performance score and a loss severity score, that are combined and converted to an initial assessment rate. The FDIC has the ability to make discretionary adjustments to the total score based upon significant risk factors not adequately captured in the calculations.
As described above in the section titled Potential Enforcement Action for Bank Holding Companies and Banks, the FDIC may terminate deposit insurance upon a finding that an institution has engaged in unsafe and unsound practices, is in an unsafe or unsound condition to continue operations, or has violated any applicable law, regulation, rule, order or condition imposed by the FDIC.
Community Reinvestment Act
The Community Reinvestment Act of 1977 (“CRA”) requires that federal banking agencies evaluate the record of each financial institution in meeting the credit needs of the market areas they serve, including low and moderate-income (“LMI”) individuals and communities. These activities are also considered in connection with, among other things, applications for mergers, acquisitions and the opening of a branch or facility, and negative results of these evaluations could prevent us from engaging in these types of transactions. Simmons Bank received a “satisfactory” CRA rating during its most recent exam.
During recent years, the federal prudential regulatory agencies have been engaged in efforts to revise the regulations implementing the CRA. The Company will monitor developments with respect to proposals concerning these regulations and assess the impact, if any, of the proposed changes to the CRA regulations.
UDAP and UDAAP
Federal laws, including Section 5 of the Federal Trade Commission Act, prohibit financial institutions from engaging in unfair or deceptive acts or practices (“UDAP”) in or affecting commerce. The Dodd-Frank Act expanded regulation in this space to apply to unfair, deceptive or abusive acts or practices (“UDAAP”) and delegated to the CFPB supervision and enforcement authority for UDAAP with respect to our subsidiary bank and rulemaking authority with respect to UDAAP. These laws have been used to, among other things, address certain problematic practices that may not fall directly within the scope of other banking or consumer protection laws.
Financial Privacy and Data Security
The Company is subject to federal laws, including the Gramm-Leach-Bliley Act of 1999 (“GLBA”), and certain state laws containing consumer privacy protection and data security provisions. These federal and state laws, and the rules and regulations promulgated thereunder impose restrictions on our ability to disclose non-public information concerning consumers to nonaffiliated third parties. These laws, rules and regulations also mandate the distribution of privacy policies to consumers, as well as provide consumers an ability to prevent our disclosure of their information under certain circumstances.
In addition, the GLBA requires that financial institutions, such as our subsidiary bank, implement comprehensive written information security programs that include administrative, technical, and physical safeguards to protect consumer information and data. Further, pursuant to interpretive guidance issued under the GLBA and certain state laws, financial institutions are also required to notify customers of security breaches that result in unauthorized access to their nonpublic personal information.
Although these laws and regulations impose compliance costs and create obligations and, in some cases, reporting obligations, and compliance with all of the laws, regulations, and reporting obligations may require significant resources of the Company and our subsidiary bank, these laws and regulations do not materially affect our products, services or other business activities.
Anti-Money Laundering and Anti-Terrorism
Simmons Bank is subject to the Uniting and Strengthening America by Providing Appropriate Tools Required to Intercept and Obstruct Terrorism Act of 2001 (also known as the “PATRIOT Act”), the Bank Secrecy Act (“BSA”) and rules and regulations of the Office of Foreign Assets Control (“OFAC”).
Under Title III of the PATRIOT Act, all financial institutions are required to take certain measures to identify their customers, prevent money laundering, monitor customer transactions, and report suspicious activity to U.S. law enforcement agencies. Financial institutions also are required to respond to requests for information from federal banking agencies and law enforcement agencies. Information sharing among financial institutions for the above purposes is encouraged by an exemption granted to complying financial institutions from the privacy provisions of the GLBA and other privacy laws.
Among other things, Simmons Bank is required to establish an anti-money laundering (“AML”) program which includes the designation of a BSA officer, the establishment and maintenance of BSA/AML training, the establishment and maintenance of BSA/AML policies and procedures, independent testing of the AML program, and compliance with customer due diligence requirements. Our subsidiary bank must also employ enhanced due diligence under certain conditions. Compliance with BSA/AML requirements is routinely examined by regulators, and failure of a financial institution to meet its requirements in combating AML and anti-terrorism activities could result in severe penalties for the institution, including, among other things, the inability to receive the requisite regulatory approvals for mergers and acquisition.
Further, OFAC administers economic sanctions imposed by the federal government that affect transactions with foreign countries, individuals, and others (as the “OFAC Rules”). The OFAC Rules target many countries as well as specially designated nationals and blocked persons (collectively, “SDNs”) and take many different forms. Blocked assets (property and bank deposits) that are associated with such countries and SDNs cannot be paid out, withdrawn, set off, or transferred in any manner without a license from OFAC. Failure to comply with the OFAC Rules can result in serious legal and reputational consequences.
In December 2020, the U.S. Congress enacted the National Defense Authorization Act (the “NDAA”) that, among other provisions, made significant updates to the federal BSA/AML regulations that aims to eliminate the use of shell companies that facilitate the laundering of criminal proceeds. In December 2021, the Financial Crimes Enforcement Network (“FinCEN”) issued rules to implement a national beneficial ownership reporting framework and to update the customer due diligence requirements that apply to the Company and the Bank to be consistent with this framework. The Company and the Bank continue to monitor legislative, regulatory and supervisory developments related thereto.
Federal Home Loan Bank of Dallas
Simmons Bank is a member of the Federal Home Loan Bank of Dallas (“FHLB-Dallas”), which is one of 11 regional Federal Home Loan Banks (“FHLBs”) that provide funding to their members for making housing loans as well as for affordable housing and community development loans. Each FHLB serves as a reserve, or central bank, for the members within its assigned region and makes loans to its members in accordance with policies and procedures established by the board of directors of that FHLB. As a member, Simmons Bank must purchase and maintain stock in FHLB-Dallas. At December 31, 2021, Simmons Bank’s total investment in FHLB-Dallas was $64.2 million.
Incentive Compensation
The Dodd-Frank Act requires the federal banking agencies and the SEC to establish joint regulations or guidelines prohibiting incentive-based payment arrangements at specified regulated entities, including the Company and our subsidiary bank, with at least $1 billion in total consolidated assets that encourage inappropriate risks by providing an executive officer, employee, director, or principal shareholder with excessive compensation, fees, or benefits that could lead to material financial loss to the entity. The federal banking agencies and the SEC most recently proposed such regulations in 2016, but the regulations have not yet been finalized. However, in 2021 the SEC signaled a renewed interest in these matters by re-opening the comment period on a proposed rule regarding clawbacks of incentive-based executive compensation, which was originally proposed in 2015.
The Dodd-Frank Act also requires publicly traded companies to give stockholders a non-binding vote on executive compensation at least every three years and on so-called “golden parachute” payments in connection with approvals of mergers and acquisitions. The Company gives stockholders a non-binding vote on executive compensation annually.
Impacts of Growth
Because the Company and Simmons Bank have exceeded $10 billion in assets, each of the Company and the Bank are subject to heightened requirements (as compared to smaller community banking organizations) that are imposed by various federal banking law and regulations.
Among other things, the Dodd-Frank Act, through the Durbin Amendment, and associated Federal Reserve regulations cap the interchange rate on debit card transactions that can be charged by banks that, together with their affiliates, have at least $10 billion in assets at $0.21 per transaction plus five basis points multiplied by the value of the transaction. The cap goes into effect July 1st of the year following the year in which a bank reaches the $10 billion asset threshold. Simmons Bank became subject to the interchange rate cap effective July 1, 2018.
As of December 31, 2017, the Company exceeded $15 billion in total assets and the grandfather provisions applicable to its trust preferred securities no longer apply, and trust preferred securities are no longer included as Tier 1 capital. Trust preferred securities and qualifying subordinated debt are included as total Tier 2 capital.
The Dodd-Frank Act also previously required banks and bank holding companies with more than $10 billion in assets to adhere to certain enhanced prudential standards, including requirements to conduct annual stress tests, report the results to regulators and publicly disclose such results. However, as a result of regulatory reform finalized following passage of the EGRRCPA, the Company and Simmons Bank are no longer required to conduct an annual stress test of capital under the Dodd-Frank Act. Further, as a result of passage of the EGRRCPA, bank holding companies with less than $100 billion in assets, such as the Company, are exempt from the resolution planning, enhanced liquidity standards, and risk management requirements imposed under Section 165 of the Dodd-Frank Act. In anticipation of becoming subject to these requirements, the Company and Simmons Bank had begun the necessary preparations, including undertaking a gap analysis, implementing enhancements to the audit and compliance departments, and investing in various information technology systems. Notwithstanding that federal banking agencies will not take action with respect to these enhanced prudential standards, the Company and its subsidiary bank will continue to review their capital planning and risk management practices in connection with the regular supervisory processes of the FRB.
Additionally, the Dodd-Frank Act established the CFPB and granted it supervisory authority over banks with total assets of more than $10 billion. Simmons Bank is subject to CFPB oversight with respect to its compliance with federal consumer financial laws. Simmons Bank continues to be subject to the oversight of its other regulators with respect to matters outside the scope of the CFPB’s jurisdiction. The CFPB has broad rule-making, supervisory, examination and enforcement authority, as well as expanded data collecting and enforcement powers, all of which impacts the operations of Simmons Bank.
Pending Legislation
Because of concerns relating to, among other things, competitiveness and the safety and soundness of the banking industry, Congress and state legislatures often consider a number of wide-ranging proposals for altering the structure, regulation, and competitive relationships of the nation’s financial institutions and of those chartered in a particular state legislature’s jurisdiction. We cannot predict whether or in what form any proposals will be adopted or the extent to which our business may be affected.
Effect of Governmental Monetary Policies
The FRB uses monetary policy tools to impact interest rates, credit market conditions and money market conditions and to influence general economic conditions, including employment, market interest and inflation rates. These policies can have a significant impact on the absolute levels and distribution of deposits, loans and investment securities, as well as on market interest rates charged on loans or paid for deposits and other borrowings. Monetary policies of the FRB have in the past had a significant effect on the operating results of bank holding companies and their subsidiary banks, such as the Company and Simmons Bank, and may have similar effects in the future.
ITEM 1A. RISK FACTORS
In addition to the other information contained in this report, including the information contained in “Cautionary Note Regarding Forward-Looking Statements,” investors in our securities should carefully consider the factors discussed below. An investment in our securities involves risks. The factors below, among others, could materially and adversely affect our business, financial condition, results of operations, liquidity or capital position, or cause our results to differ materially from our historical results or the results expressed or implied in our forward-looking statements. Additionally, investors should not interpret the disclosure of a risk to imply that the risk has not already materialized.
Risks Related to the COVID-19 Pandemic
The COVID-19 pandemic and resulting economic conditions have adversely impacted our business, and may adversely impact our business in the future, as well as our customers and third-party vendors; and the ultimate severity of these impacts is dependent on future events, including the scope and duration of, and governmental responses to, the pandemic, that are highly uncertain and challenging to predict.
The COVID-19 pandemic and responses to it have impacted, and are likely to continue to adversely impact, our business, results of operations, and financial condition, as well as those of our customers and third-party vendors. The COVID-19 pandemic has caused significant disruptions to the global economy and the lives of people around the world. As a result of the pandemic, governmental authorities, businesses, and the public have taken unprecedented actions designed to limit the scope and duration of the COVID-19 pandemic, as well as mitigate its effects. However, at this time, we are unable to determine whether these actions have been or will be effective, or how long it may take for the pandemic to subside.
Many responses to the COVID-19 pandemic have adversely impacted the businesses of many of our customers. If these responses are ultimately unsuccessful, we could continue to experience material adverse impacts to our business, financial condition, and results of operations. Additionally, changes due to COVID-19 may continue to have adverse impacts on the Company’s business due to, among other things, reduced effectiveness of operations, unavailability of personnel (including due to illness), and increased cybersecurity risks related to use of remote technology. We may experience financial losses and declines in our financial condition due to a number of factors associated with the pandemic, including, among other things, deteriorations in credit quality, past due loans, challenges faced by our third-party vendors who provide key services, and charge offs resulting from difficulties faced by our hospitality, retail, restaurant, energy, and other borrowers as a result of the pandemic and responses to it. Loan payment deferral programs and government assistance programs, such as the Paycheck Protection Program (“PPP”), may be masking credit deterioration in the Company’s loan portfolio by making standard measures of identifying developing financial weakness in a customer or a loan portfolio less applicable, which may cause our credit quality to decline and adversely impact our allowance for credit losses and/or require additional provisions.
The COVID-19 pandemic has contributed to significant volatility in the financial markets. Depending on the extent and duration of the COVID-19 pandemic, and perceptions regarding national and global recovery from the pandemic, volatility in the financial markets may continue which may adversely impact the price of the Company’s common stock.
The ultimate severity of adverse impacts of the COVID-19 pandemic will depend on future developments, including, among other things, how long the pandemic lasts, how successful vaccination efforts are, the significant spread of new strains of the virus, and whether additional restrictions are imposed on businesses and individuals. If the severity of the COVID-19 pandemic worsens, additional actions may be taken by federal, state, and local governments to contain COVID-19 or treat its impact. Even after the COVID-19 pandemic has subsided, we may continue to experience adverse impacts to our business as a result of any economic recession or depression that has occurred or may occur in the future, or as a result of changes in the behavior of customers, businesses and their employees. Additionally, the COVID-19 pandemic may also have the effect of heightening many of the other risks described herein and in other filings we make with the SEC.
Risks Related to the Company’s Lending Activities
The mismanagement of our credit risks could result in serious harm to our business.
There are a variety of risks inherent in making loans, including, among others, risks inherent with dealing with borrowers and guarantors, risks associated with potential future changes in the value of the collateral supporting the loans, the risk that a loan may not be repaid, and the risks associated with changes in economic or industry conditions. As part of our ongoing efforts to minimize these credit-related risks, we utilize credit policies and procedures, internal credit expertise and several internal layers of review for the loans we make. We also actively monitor our concentrations of loans and carefully evaluate the credit underwriting practices of acquired institutions. However, there can be no assurance that these underwriting and monitoring procedures will reduce these risks, and the inability to properly manage our credit risk could have a material adverse effect on our business, which, in turn, could impact our financial condition and results of operations.
Deteriorating credit quality in our credit card portfolio may adversely impact us.
We have a sizeable consumer credit card portfolio. Although we experienced a decreased amount of net charge-offs in our credit card portfolio in recent years, the amount of net charge-offs could worsen. While we continue to experience a better performance with respect to net charge-offs than the national average in our credit card portfolio, our net charge-offs were 1.40% and 1.60% of our average outstanding credit card balances for the years ended December 31, 2021 and 2020, respectively. Future downturns in the economy could adversely affect consumers in a more delayed fashion compared to commercial businesses in general. Increasing unemployment and diminished asset values may prevent our credit card customers from repaying their credit card balances which could result in an increased amount of our net charge-offs that could have a material adverse effect on our unsecured credit card portfolio.
We may not maintain an appropriate allowance for credit losses.
It is likely that some portion of our loans will become delinquent, and some loans may only be partially repaid or may never be repaid. We maintain an allowance for credit losses, which is a reserve established through a provision for credit losses charged to expense, that results from management’s review of the existing portfolio and management’s assessment of the portfolio’s collectability. Our methodology for establishing the appropriateness of the allowance for credit losses inherently involves a high degree of subjectivity and judgment and requires management to make significant estimates and predictions regarding credit risks, future market conditions, and other factors, all of which are subject to material changes and may not necessarily be in our control. If our methodology is flawed, or if we experience changes in market or economic conditions, or in conditions of our borrowers, the allowance may become inadequate, which would result in additional provisions to increase the allowance to an appropriate level. This could negatively impact our business, including through a material decrease in our earnings. In addition, prudential regulators also periodically review our allowance for credit losses and have the ability, based on their perspective, which may be different from ours, to require that we make adjustments to the allowance, which could also have a negative effect on our results of operations or financial condition.
We rely on the mortgage secondary market from time to time to provide liquidity.
We sell certain mortgage loans we originate to certain agencies and other purchasers. We rely, in part, on the agencies to purchase loans meeting their requirements to reduce our credit risk and to provide funding for additional loans we desire to originate. There is no guarantee that the agencies will not materially limit their purchases of conforming loans due to capital constraints, a change in the criteria for conforming loans or other factors. If we are unable to continue to sell conforming loans to the agencies, our ability to fund, and thus originate, additional mortgage loans may be adversely affected, which would adversely affect our results of operations.
Sales of our loans are subject to a variety of risks.
In relation to any sale of one or more of our loan portfolios, we may make certain representations and warranties to the purchaser concerning the loans sold and the procedures under which those loans were originated and serviced. If those representations and warranties prove to be incorrect, we may be required to indemnify the purchaser for any related losses or be required to repurchase certain loans that were sold. In some cases where such obligations are invoked by the purchaser, the loans may be non-performing or in default, leaving us without a remedy available against a solvent counterparty to the loan. Our results of operations may be adversely affected if we are not able to recover our losses resulting from these indemnity payments and repurchases.
Loans made through federal programs are dependent on the federal government’s continuation and support of these programs and on our compliance with program requirements.
We participate in various U.S. government agency loan guarantee programs, including programs operated by the SBA. If we fail to follow any applicable regulations, guidelines or policies associated with a particular guarantee program, any loans we originate as part of that program may lose the associated guarantee, exposing us to credit risk we would not otherwise be exposed to, or result in our inability to continue originating loans under such programs, either of which could have a material adverse effect on our business, financial condition or results of operations.
We participated as a lender in both rounds of the PPP. The PPP loans are fully guaranteed as to payment of principal and interest by the SBA and we believe that the majority of these loans will be forgiven. However, there can be no assurance that the borrowers will use or have used the funds appropriately or will have satisfied the staffing or payment requirements to qualify for forgiveness in whole or in part. Any portion of the loan that is not forgiven must be repaid by the borrower. In the event of a loss resulting from a default on a PPP loan and a determination by the SBA that there was a deficiency in the manner in which the PPP loan was originated, funded or serviced by us, which may or may not be related to an ambiguity in the laws, rules or guidance regarding operation of the PPP, the SBA may deny its liability under the guaranty, reduce the amount of the guaranty, or, if we have already been paid under the guaranty, seek recovery from us of any loss related to the deficiency.
Risks Related to Market Interest Rates
Changes in interest rates and monetary policy could adversely affect our profitability.
Our net income and cash flows depend to a significant extent on the difference between interest rates earned on interest-earning assets and the rates paid on interest-bearing liabilities. These rates are highly sensitive to many factors beyond our control, including general economic conditions and credit and monetary policies of governmental authorities. Changes in the credit or monetary policies of governmental authorities, particularly the Federal Reserve, could significantly impact market interest rates and our financial performance. For instance, changes in the nature of open market transactions in U.S. government securities, the discount rate or the federal funds rate on bank borrowings, and reserve requirements against bank deposits, could lead to increases in the costs associated with our business. In addition, such changes could influence the interest we receive on loans and securities and the amount of interest we pay on deposits. If the interest rates we pay on deposits increases at a faster rate than the interest we receive on loans and other investments, then our net interest income could be adversely affected. If the Federal Reserve raises interest rates, we may not be able to reflect increasing interest rates in rates charged on loans or paid on deposits due to competitive pressures, which would negatively impact our financial condition and results of operations. In addition, the impact of these changes may be magnified if we do not effectively manage the relative sensitivity of our assets and liabilities to changes in market interest rates, and our ability to manage such relative sensitivity may be adversely impacted by competitive conditions in the banking industry and in the financial markets. Due to the changing conditions in the national economy, we cannot predict with certainty how future changes in interest rates, deposit levels, and loan demand will impact our business and profitability.
Changes in the method pursuant to which the London Interbank Offered Rate (“LIBOR”) and other benchmark rates are determined, as well as the discontinuance and replacement of LIBOR as a reference rate, could adversely impact our business and results of operations.
LIBOR and certain other interest rate benchmarks are the subject of recent national and international reform. Intercontinental Exchange, Inc. the company that administers LIBOR, stated in March 2021 that it intends to cease the publication of one week and two-month LIBOR rates immediately after the LIBOR publication on December 31, 2021, and the remaining LIBOR rates immediately following the LIBOR publication on June 30, 2023. The U.S. federal banking agencies have issued statements to encourage U.S. banks to transition away from U.S. dollar LIBOR as soon as practicable and not to enter into new contracts that use U.S. dollar LIBOR after December 31, 2021. Due to LIBOR’s extensive use across financial markets, the transition away from LIBOR may pose risks and challenges to financial markets and financial institutions, including the Company, and liquidity in certain interbank markets on which LIBOR estimates are based has been declining. At this time, it is not possible to predict whether and to what extent banks will continue to provide submissions for the calculation of LIBOR. Similarly, at this time, it is not possible to predict whether LIBOR will continue to be viewed as an acceptable market benchmark, what rate or rates may become the generally accepted alternatives to LIBOR, or what the effect of any such changes in views or alternatives may be on the markets for LIBOR-linked financial instruments.
Certain of our LIBOR-based financial products and contracts, including, but not limited to, hedging products, debt obligations, investments, and loans, extend beyond 2021. We are continuing to assess the impact that a cessation or market replacement of LIBOR would have on these various products and contracts and working to transition many LIBOR based products and contracts
to other interest rate structures. The market transition away from LIBOR to alternative reference rates is a complex process and could have a range of effects on the Company’s business, financial condition and results of operations, including but not limited to by (i) adversely affecting the interest rates received or paid on the revenues and expenses associated with, or the value of the Company’s LIBOR-based assets and liabilities; (ii) adversely affecting the interest rates paid on or received from other securities or financial arrangements, given LIBOR’s historically prominent role in determining market interest rates globally, or (iii) resulting in disputes, litigation or other actions with borrowers or other counterparties about the interpretation or enforceability of certain fallback language contained in LIBOR-based loans, securities or other contracts. The discontinuation of LIBOR could result in operational, legal and compliance risks and, if we are unable to adequately manage such risks and transition from LIBOR to new reference rates, our business, financial condition, results of operations and future prospects may be adversely impacted.
Our cost of funds may increase as a result of general economic conditions, interest rates and competitive pressures.
Our cost of funds may increase as a result of general economic conditions, fluctuations in interest rates and competitive pressures. We have traditionally obtained funds principally through local deposits as we have a base of lower cost transaction deposits. Our costs of funds and our profitability and liquidity are likely to be adversely affected if we have to rely upon higher cost borrowings from other institutional lenders or brokers to fund loan demand or liquidity needs. Also, changes in our deposit mix and growth could adversely affect our profitability and the ability to expand our loan portfolio.
Risks Related to Our Business, Industry, and Markets
Our business may be adversely affected by conditions in the financial markets and general economic conditions.
Changes in economic conditions could cause the values of assets and liabilities recorded in the financial statements to change rapidly, resulting in material future adjustments in asset values, the allowance for credit losses, or capital that could negatively impact the Company’s ability to meet regulatory capital requirements and maintain sufficient liquidity.
The Great Recession elevated unemployment levels and negatively impacted consumer confidence. It also had a detrimental impact on industry-wide performance nationally as well as the Company’s market areas. While improvement in several economic indicators have been noted since 2013, including increasing consumer confidence levels, increased economic activity and a continued decline in unemployment levels as a result of the COVID-19 pandemic led to extensive additional disruptions to the economy generally during 2020 and 2021.
Past market conditions have also led to the failure or merger of a number of prominent financial institutions. Financial institution failures or near-failures can result in further losses as a consequence of defaults on securities issued by them and defaults under contracts entered into with such entities as counterparties. Furthermore, declining asset values, defaults on mortgages and consumer loans, and the lack of market and investor confidence, as well as other factors, can all combine to increase credit default swap spreads, to cause rating agencies to lower credit ratings, and to otherwise increase the cost and decrease the availability of liquidity, despite very significant declines in Federal Reserve borrowing rates and other government actions. In the Great Recession, some banks and other lenders suffered significant losses and became reluctant to lend, even on a secured basis, due to the increased risk of default and the impact of declining asset values on the value of collateral. The foregoing can significantly weaken the strength and liquidity of some financial institutions worldwide.
The Company’s financial performance generally, and in particular the ability of borrowers to pay interest on and repay principal of outstanding loans and the value of collateral securing those loans, is highly dependent upon the business environment in the states where we operate, and in the United States as a whole. A favorable business environment is generally characterized by, among other factors, economic growth, efficient capital markets, low inflation, high business and investor confidence and strong business earnings. Unfavorable or uncertain economic and market conditions can be caused by declines in economic growth, business activity or investor or business confidence; limitations on the availability or increases in the cost of credit and capital; increases in inflation or interest rates; natural disasters; or a combination of these or other factors.
The business environment in the states where we operate could deteriorate and adversely affect the credit quality of our loans and our results of operations and financial condition. There can be no assurance that business and economic conditions will remain stable in the near term. If financial market volatility worsens, or if there are more disruptions in the financial markets, including disruptions to the United States or international banking systems, there can be no assurance that we will not experience an adverse effect, which may be material, on our ability to access capital and on our business, financial condition and results of operations.
Our concentration of banking activities in Arkansas, Kansas, Missouri, Oklahoma, Tennessee and Texas, including our real estate loan portfolio, makes us more vulnerable to adverse conditions in the particular local markets in which we operate.
Our subsidiary bank operates primarily within the states of Arkansas, Kansas, Missouri, Oklahoma, Tennessee and Texas, where the majority of the buildings and properties securing our loans and the businesses of our customers are located. Our financial condition, results of operations and cash flows are subject to changes in the economic conditions in these six states, the ability of our borrowers to repay their loans, and the value of the collateral securing such loans. We largely depend on the continued growth and stability of the communities we serve for our continued success. Declines in the economies of these communities or the states in general could adversely affect our ability to generate new loans or to receive repayments of existing loans, and our ability to attract new deposits, thus adversely affecting our net income, profitability and financial condition.
The ability of our borrowers to repay their loans could also be adversely impacted by the significant changes in market conditions in the region or by changes in local real estate markets, including deflationary effects on collateral value caused by property foreclosures. This could result in an increase in our charge-offs and provision for credit losses. Either of these events would have an adverse impact on our results of operations.
A significant decline in general economic conditions caused by inflation, recession, unemployment, acts of terrorism or other factors beyond our control could also have an adverse effect on our financial condition and results of operations. In addition, because multi-family and commercial real estate loans represent the majority of our real estate loans outstanding, a decline in tenant occupancy due to such factors or for other reasons could adversely impact the ability of our borrowers to repay their loans on a timely basis, which could have a negative impact on our results of operations.
We face strong competition from other banks, bank holding companies, and financial services companies.
In the markets we serve, the businesses of banking and financial services are fiercely competitive. Many of our competitors offer the same, or similar, products and services within our market areas. Some of our competitors are able to offer a broader range of products and services than we do. These competitors include banks with nationwide presences, regional banks, and community banks (who may have greater flexibility in their operational strategies than we possess). We also face competition from many other types of financial institutions, including, among others, credit unions, finance companies, insurance companies, brokerage and investment banking firms. Certain nonbank competitors of the Company are increasingly offering products and services that traditionally were banking products due to technological advances, and many of these nonbank competitors are not subject to the same extensive federal regulations that govern bank holding companies and federally insured banks. As a result, some of the competitors in our markets have the ability to offer products and services that we are unable to offer or to offer such products and services at more competitive rates. If we are unable to effectively compete for customers, we may lose loan and deposit market share, as well as experience reductions in net interest margin, fee income, and profitability, and our business, financial condition, and results of operations could be adversely affected.
Changes in service delivery channels and emerging technologies pose a competitive risk.
Advancements in technology have created the ability for financial transactions that have historically often involved traditional banks to be conducted through alternative channels. For example, consumers can now hold funds in brokerage accounts and internet-only banks, or indeed with essentially any bank that provides for online account opening and online banking. Consumers can also complete transactions such as the purchase or sale of goods and services, the payment of bills, and the transfer of funds without the direct assistance of banks. Indeed, non-traditional financial services firms, such as financial technology (FinTech) companies, have begun to offer a variety of services traditionally provided by banks and other financial institutions. The resulting increased competition could result in the loss of fee income and customer deposits, which could negatively impact our financial condition, results of operations, and liquidity. It could also require additional, costly investments in technology to remain competitive.
We anticipate that new technologies will continue to emerge that may be superior to, or render obsolete, the technologies currently used by the Company and the Bank in their products and services. Developing or acquiring access to new technologies and incorporating those technologies into our products and services, or using them to expand our products and services, in each case in a way that enables us to remain competitive, may require significant investments, may take considerable time to complete, and ultimately may not be successful.
Our growth and expansion strategy may not be successful, and our market value and profitability may suffer.
We have historically employed, as important parts of our business strategy, growth through acquisitions of banks and, to a lesser extent, through branch acquisitions and de novo branching. Any future acquisitions in which we might engage will be accompanied by the risks commonly encountered in acquisitions. These risks include, among other risks:
•credit risk associated with the acquired bank’s loans and investments;
•difficulty of integrating operations and personnel; and
•potential disruption of our ongoing business.
In addition to pursuing the acquisition of existing viable financial institutions as opportunities arise we may also continue to engage in de novo branching to further our growth strategy. De novo branching and growing through acquisition involve numerous risks, including the following:
•the inability to obtain all required regulatory approvals;
•the significant costs and potential operating losses associated with establishing a de novo branch or a new bank;
•the inability to secure the services of qualified senior management;
•the local market may not accept the services of a new bank owned and managed by a bank holding company headquartered outside of the market area of the new bank;
•the risk of encountering an economic downturn in the new market;
•the inability to obtain attractive locations within a new market at a reasonable cost; and
•the additional strain on management resources and internal systems and controls.
We expect that competition for suitable acquisition candidates will be significant. We may compete with other banks or financial service companies that are seeking to acquire our acquisition candidates, many of which are larger competitors and have greater financial and other resources. We cannot assure you that we will be able to successfully identify and acquire suitable acquisition targets on acceptable terms and conditions. Further, we cannot assure you that we will be successful in overcoming these risks or any other problems encountered in connection with acquisitions and de novo branching. Our inability to overcome these risks could have an adverse effect on our ability to achieve our business and growth strategy and maintain or increase our market value and profitability.
The value of our goodwill and other intangible assets may decline in the future.
As of December 31, 2021, we had $1.1 billion of goodwill and $106.2 million of other intangible assets. A significant decline in our expected future cash flows, a significant adverse change in the business climate, slower economic growth or a significant and sustained decline in the price of our common stock, any or all of which could be materially impacted by many of the risk factors discussed herein, may necessitate our taking charges in the future related to the impairment of our goodwill. Future regulatory actions could also have a material impact on assessments of goodwill for impairment. If we were to conclude that a future write-down of our goodwill is necessary, we would record the appropriate charge, which could have a material adverse effect on our results of operations.
Identifiable intangible assets other than goodwill consist of core deposit intangibles, books of business, and other intangible assets. Adverse events or circumstances could impact the recoverability of these intangible assets including loss of core deposits, significant losses of customer accounts and/or balances, increased competition or adverse changes in the economy. To the extent these intangible assets are deemed unrecoverable, a non-cash impairment charge would be recorded, which could have a material adverse effect on our results of operations.
Damage to our reputation could significantly harm our business.
Our ability to attract and retain customers, employees, and acquisition partners is influenced by our reputation. A negative opinion of our business can develop in connection with a variety of circumstances, including issues with our lending practices, regulatory compliance, risk management, corporate governance, customer service, community involvement, integration of acquired institutions, and third-party service providers. Our reputation could also be harmed through regulatory proceedings by governmental authorities, litigation, or cybersecurity events. Reputational damage could also impact our relationships with investors, our credit ratings and our ability to access capital markets.
If we are unsuccessful in developing new, and adapting our current, products and services so that they respond to changing industry standards and customer preferences, our business may suffer.
We provide a variety of commercial and consumer banking, as well as other financial, products and services designed to meet a broad range of needs. While many of these products and services are traditional both in their characteristics and their delivery channels, advancements in technology, changes in the regulatory environment, and evolving customer preferences require that we continuously evaluate the terms under which we provide our existing products and services (including, among other things, interest rates and loan covenants), the methods by which we deliver them (including the use of online and mobile banking), and the potential for new products and services in order to remain competitive. These efforts, though, could require substantial investments, and we can provide no assurance that we will develop new products and services, or adequately adapt our existing products and services, in a timely or successful manner. Our inability to do so could harm our business and adversely affect our results of operations and reputation. Furthermore, any new line of business and/or new product or service could require the establishment of new key and other controls and have a significant impact on our existing system of internal controls. Failure to successfully manage these risks in the development and implementation of new lines of business and/or new products or services could have a material adverse effect on our business and, in turn, our financial condition and results of operations.
Risks Related to the Company’s Operations
We are subject to fraud risk, which could have a material adverse effect on our business and results of operations.
Fraud is a major, and increasing, operational risk, particularly for financial institutions. We continue to experience fraud attempts and losses through, for example, deposit fraud (such as wire fraud and check fraud) and loan fraud. Fraud may also arise from the misconduct of our employees. The methods used to perpetrate and combat fraud continue to evolve, particularly as advances in technology occur. While we seek to be vigilant in the prevention, detection, and remediation of fraud events, some fraud loss is unavoidable, and the risk of major fraud loss cannot be eliminated.
A lack of liquidity could impair our ability to fund our business and thereby adversely affect our financial condition and results of operations.
Liquidity is a critical component of our business. To ensure adequate liquidity to fund our operations, we rely heavily on our ability to generate deposits and effectively manage both the repayment of loans and the maturity schedules of our investment securities. Our most important source of funds is deposits, but sources of funds also include, among other things, cash flows from operations, maturities and sales of investment securities, and borrowings from the Federal Reserve and Federal Home Loan Bank. Our access to funding sources in amounts adequate to finance our activities, or on terms that are acceptable to us, could be impaired by factors that affect us specifically or the financial services industry or economy in general. This could result in a lack of liquidity, which could materially and adversely affect our business.
Our models and estimations may be inadequate, which could lead to significant losses and regulatory scrutiny.
To assist with the management of our credit, liquidity, operations, and compliance functions and risks, we have developed, and currently use, various models and other analytical tools, including certain estimations. The models and estimations often take into account assumptions and historical trends and are, in some case, based on subjective judgments. As such, the models and estimations may not be effective in identifying and managing risks, which could adversely impact our financial condition and results of operations. Inadequate models may also result in compliance failures, which could lead to increased scrutiny by our regulators.
We may not be able to raise the additional capital we need to grow and, as a result, our ability to expand our operations could be materially impaired.
Federal and state regulatory authorities require us and our subsidiary bank to maintain adequate levels of capital to support our operations. Many circumstances could require us to seek additional capital, such as:
•faster than anticipated growth;
•reduced earning levels;
•operating losses;
•changes in economic conditions;
•revisions in regulatory requirements; or
•additional acquisition opportunities.
Our ability to raise additional capital will largely depend on our financial performance, and on conditions in the capital markets which are outside our control. Moreover, if we need to raise capital in the future, we may have to do so when many other financial institutions are also seeking to raise capital and would, as a result, have to compete with those institutions for investors which could adversely impact the price at which we are able to offer our securities. If we need additional capital but cannot raise it on terms acceptable to us, our ability to expand our operations or to engage in acquisitions could be materially impaired.
Our business is heavily reliant on information technology systems, facilities, and processes; and a disruption in those systems, facilities, and processes, or a breach, including cyber-attacks, in the security of our systems, could have significant, negative impact on our business, result in the disclosure of confidential information, and create significant financial and legal exposure for us.
Our businesses are dependent on our ability and the ability of our third-party service providers to process, record and monitor a large number of transactions. If the financial, accounting, data processing or other operating systems and facilities fail to operate properly, become disabled, experience security breaches or have other significant shortcomings, our results of operations could be materially adversely affected.
Although we and our third party service providers devote significant resources to maintain and regularly upgrade our systems and processes that are designed to protect the security of computer systems, software, networks and other technology assets and the confidentiality, integrity and availability of information belonging to us and our customers, there is no assurance that our security systems and those of our third party service providers will provide absolute security. Financial services institutions and companies engaged in data processing have reported breaches in the security of their websites or other systems, some of which have involved sophisticated and targeted attacks intended to obtain unauthorized access to confidential information, destroy data, disable or degrade service, or sabotage systems, often through the introduction of computer viruses or malware, cyber-attacks and other means. Certain financial institutions in the United States have also experienced attacks from technically sophisticated and well-resourced third parties that were intended to disrupt normal business activities by making internet banking systems inaccessible to customers for extended periods. These “denial-of-service” attacks have not breached our data security systems, but require substantial resources to defend, and may affect customer satisfaction and behavior.
Despite our efforts and those of our third party service providers to ensure the integrity of our systems, it is possible that we may not be able to anticipate or to implement effective preventive measures against all security breaches of these types, especially because the techniques used change frequently or are not recognized until launched, and because security attacks can originate from a wide variety of sources, including persons who are involved with organized crime or associated with external service providers or who may be linked to terrorist organizations or hostile foreign governments. Those parties may also attempt to fraudulently induce employees, customers or other users of our systems to disclose sensitive information in order to gain access to our data or that of our customers or clients. These risks may increase in the future as we continue to increase our mobile payments and other internet-based product offerings and expand our internal usage of web-based products and applications. Furthermore, because certain of our employees are working, or may work, remotely due to the COVID-19 pandemic or otherwise, there is an increased risk of disruption to our systems because remote networks and infrastructure may not be as secure as in our office environment. If our security systems were penetrated or circumvented, it could cause serious negative consequences for us, including significant disruption of our operations, misappropriation of our confidential information or that of our customers, or damage our computers or systems and those of our customers and counterparties, and could result in violations of applicable privacy and other laws, financial loss to us or to our customers, loss of confidence in our security measures, customer dissatisfaction, significant litigation exposure, and harm to our reputation, all of which could have a material adverse effect on us.
We depend on qualified employees and key personnel to operate and lead our business, and we may not be able to attract or retain them in the future.
A critical component of our success is the ability to attract, develop and retain highly qualified, skilled lending, operations, information technology, and other employees, as well as managers who are experienced and effective at leading their respective departments. We have an experienced group of senior management and other key personnel that our board of directors believes is capable of managing and growing our business. In many areas of the financial services industry, competition for key personnel is fierce, and the departure of those individuals from our business presents risk that we will be unable to attract, develop and retain suitable successors, which could have a material, adverse impact on our competitive position in the marketplace.
Our business is heavily reliant on a variety of third-party service providers.
We rely on a large number of vendors to provide products and services that we need for our day-to-day operations, particularly in the areas of loan and deposit operations, information technology, and security. This reliance exposes us to the risk that the vendors will not perform in accordance with the applicable contractual arrangements or service level agreements, as well as risks resulting from defective products, poor performance of services, disruption in a product or service, vendor contracts, or loss of a product or service if a vendor ceases doing business because of its own financial or operational difficulties. These risks, if realized, could result in significant disruptions to our business, which could have a material adverse impact on our financial condition and results of operations. While we maintain a vendor management program designed to assist in the oversight and monitoring of our third-party service providers, there can be no assurance that we will not experience service-related issues associated with our vendors.
Our controls and procedures may fail, or our employees may not adhere to them.
It is critical that our internal controls, disclosure controls and procedures, and corporate governance policies and procedures be effective in order to provide assurance that our financial reports and disclosures are materially accurate. A failure or circumvention of our controls and procedures, or a failure to comply with regulations related to controls and procedures, could have a material adverse effect on our business, financial condition, and results of operations, as well as cause reputational harm, which could limit our ability to access the capital markets.
Accounting standards periodically change and the application of our accounting policies and methods may require management to make estimates about matters that are uncertain.
The regulatory bodies that establish accounting standards, including, among others, FASB and the SEC, periodically revise or issue new financial accounting and reporting standards that govern the preparation of our consolidated financial statements. The effect of such revised or new standards on our financial statements can be difficult to predict and can materially impact how we record and report our financial condition and results of operations. For example, in June 2016, the FASB issued Accounting Standards Update (“ASU”) 2016-13, Measurement of Credit Losses on Financial Instruments, that substantially changed the accounting for credit losses and other financial assets held by banks, financial institutions and other organizations. The standard removed the existing “probable” threshold in generally accepted accounting principles (“US GAAP”) for recognizing credit losses and instead requires companies to reflect their estimate of credit losses over the life of the financial assets. Companies must consider all relevant information when estimating expected credit losses, including details about past events, current conditions, and reasonable and supportable forecasts. We adopted an optional three-year phase-in period for the day-one adverse regulatory capital impact upon adoption of the standard with the additional two year delay allowed by regulators in response to the COVID-19 pandemic. The adoption of the standard resulted in an overall material increase in the allowance for credit losses. However, the impact at adoption was influenced by our portfolios' composition and quality at the adoption date and economic conditions and forecasts at that time.
In addition, our management must exercise judgment in appropriately applying many of our accounting policies and methods so they comply with generally accepted accounting principles. In some cases, management may have to select a particular accounting policy or method from two or more alternatives. In some cases, the accounting policy or method chosen might be reasonable under the circumstances and yet might result in our reporting materially different amounts than would have been reported if we had selected a different policy or method. Accounting policies are critical to fairly presenting our financial condition and results of operations and may require management to make difficult, subjective or complex judgments about matters that are uncertain.
Risks Related to the Company’s Legal and Regulatory Environment
Financial legislative and regulatory initiatives could adversely affect the results of our operations.
We are subject to extensive governmental regulation, supervision, legislation, and control. For instance, in response to the financial crisis affecting the banking system and financial markets, the Dodd-Frank Act was enacted in 2010, as well as several programs that have been initiated by the U.S. Treasury, the FRB, and the FDIC. See “Item 1. Business - Supervision and Regulation” included herein for more information regarding regulatory burden and supervision.
Some of the provisions of legislation and regulation that have adversely impacted the Company include the “Durbin Amendment” to the Dodd-Frank Act, which mandates a limit to debit card interchange fees, and Regulation E amendments to the EFTA regarding overdraft fees. Future financial legislation and regulatory initiatives can limit the type of products we offer, the methods by which we offer them, and the prices at which they are offered. These provisions can also increase our costs in offering these products.
The CFPB, Federal Reserve, and Arkansas State Bank Department have broad rulemaking, supervisory and examination authority, as well as data collection and enforcement powers. The scope and impact of the regulators’ actions can significantly impact the operations of the Company and the financial services industry in general.
These laws, regulations, and changes can increase our costs of regulatory compliance. They also can significantly affect the markets in which we do business, the markets for and value of our investments, and our ongoing operations, costs, and profitability. The ultimate impact of the provisions in legislative and regulatory initiatives on the Company’s business and results of operations also depends upon regulatory interpretation and rulemaking. As a result, we are unable to predict the ultimate impact of future legislation or regulation, including the extent to which it could increase costs or limit our ability to pursue business opportunities in an efficient manner, or otherwise adversely affect our business, financial condition and results of operations.
Our failure to comply with applicable banking laws and regulations could result in significant monetary penalties, restrict our ability to execute our growth strategy, and have other material adverse impacts on our business.
We are charged with maintaining compliance with all applicable banking laws and regulations, including, among others, fair lending, CRA, consumer compliance, BSA and anti-money laundering, capital, and other regulations described herein under “Item 1. Business - Supervision and Regulation.” Various agencies, including, without limitation, the FRB, CFPB, Arkansas State Bank Department, and the Department of Justice, have the ability to institute proceedings to address compliance failures. Should those agencies be successful in the case of such a proceeding, we could become subject to material sanctions, including, among other things, monetary penalties and restrictions on our ability to engage in mergers and acquisitions and other growth-oriented activities. Compliance failures may also result in litigation instituted by private parties, including consumers, which could result in material adverse impacts on our business.
We are subject to litigation in the ordinary course of our business, and adverse rulings, judgements, settlements, and other outcomes of such litigation, as well as our associated legal expenses may adversely affect our results.
From time to time, we are subject to litigation. Litigation and claims can arise in various contexts, including, among others, our lending activities, employment practices, commercial agreements, fiduciary responsibilities, compliance programs, and other general business matters. These claims and legal actions, including supervisory actions by our regulators, could involve large amounts in controversy, significant fines or penalties, and substantial legal costs necessary for our defense. The outcome of litigation and regulatory matters, as well as the timing associated with resolving these matters, are inherently hard to predict. Substantial legal liability, which may not be insured, and significant regulatory actions against us could materially and adversely impact our business operations, including our ability to engage in mergers and acquisitions, our results of operations, and our financial condition.
The Federal Reserve Board’s source of strength doctrine could require that we divert capital to our subsidiary bank instead of applying available capital towards planned uses, such as engaging in acquisitions or paying dividends to shareholders.
The FRB’s policies and regulations require that a bank holding company, including a financial holding company, serve as a source of financial strength to its subsidiary banks, and further provide that a bank holding company may not conduct operations in an unsafe or unsound manner. It is the FRB’s policy that a bank holding company should stand ready to use available resources to provide adequate capital to its subsidiary banks during periods of financial stress or adversity, such as during periods of significant loan losses, and that such holding company should maintain the financial flexibility and capital-raising capacity to obtain additional resources for assisting its subsidiary banks if such a need were to arise.
A bank holding company’s failure to meet its obligations to serve as a source of strength to its subsidiary banks will generally be considered an unsafe and unsound banking practice or a violation of the FRB’s regulations, or both. Accordingly, if the financial condition of our subsidiary bank was to deteriorate, we could be compelled to provide financial support to our subsidiary bank at a time when, absent such FRB policy, we may not deem it advisable to provide such assistance. Under such circumstances, there is a possibility that we may not either have adequate available capital or feel sufficiently confident regarding our financial condition, to enter into acquisitions, pay dividends, or engage in other corporate activities.
We may incur environmental liabilities with respect to properties to which we take title.
A significant portion of our loan portfolio is secured by real property. In the course of our business, we may own or foreclose and take title to real estate and could become subject to environmental liabilities with respect to these properties. We may become responsible to a governmental agency or third parties for property damage, personal injury, investigation and clean-up costs incurred by those parties in connection with environmental contamination, or may be required to investigate or clean-up hazardous or toxic substances, or chemical releases at a property. The costs associated with environmental investigation or remediation activities could be substantial. If we were to become subject to significant environmental liabilities, it could have a material adverse effect on our results of operations and financial condition.
We may be subject to allegations of intellectual property infringement or may fail to effectively protect our own intellectual property rights.
Our competition, or other third parties, may allege that we have violated their intellectual property rights. For example, we may unintentionally infringe upon the rights of third parties through the use of infringing software or other types of content provided by vendors. Alternatively, failure to effectively protect our own intellectual property through trade secret, copyright, patents, and other legal means, may result in it being used to the benefit of others and to the detriment of our business. A successful claim of infringement could subject us to money damages, require significant license or royalty fees, or result in restrictions preventing us from using certain software or technology, thereby impeding our delivery of products or services. Even if ultimately unsuccessful, the financial cost of a legal defense and the diversion of management’s attention from our business may prove costly.
Risks Related to the Company’s Securities
The holders of our subordinated notes and subordinated debentures have rights that are senior to those of our common shareholders. If we defer payments of interest on our outstanding subordinated debentures or if certain defaults relating to those debentures occur, we will be prohibited from declaring or paying dividends or distributions on, and from making liquidation payments with respect to, our common stock.
We have subordinated debentures issued in connection with trust preferred securities. Payments of the principal and interest on the trust preferred securities are unconditionally guaranteed by us. The subordinated debentures are senior to our shares of common stock. As a result, we must make payments on the subordinated debentures (and the related trust preferred securities) before any dividends can be paid on our common stock. In addition, in the event of our bankruptcy, dissolution or liquidation, the holders of both the subordinated debentures and the subordinated notes must be satisfied before any distributions can be made to the holders of our common stock. We have the right to defer distributions on the subordinated debentures (and the related trust preferred securities) for up to five years, during which time no dividends may be paid to holders of our capital stock. If we elect to defer or if we default with respect to our obligations to make payments on these subordinated debentures, this would likely have a material adverse effect on the market value of our common stock. Moreover, without notice to or consent from the holders of our common stock, we may issue additional series of subordinated debt securities in the future with terms similar to those of our existing subordinated debt securities or enter into other financing agreements that limit our ability to purchase or to pay dividends or distributions on our capital stock.
We may be unable to, or choose not to, pay dividends on our common stock.
We cannot assure you of our ability to continue to pay dividends. Our ability to pay dividends depends on the following factors, among others:
•We may not have sufficient earnings since our primary source of income, the payment of dividends to us by our subsidiary bank, is subject to federal and state laws that limit the ability of the bank to pay dividends;
•FRB policy requires bank holding companies to pay cash dividends on common stock only out of net income available over the past year and only if prospective earnings retention is consistent with the organization’s expected future needs and financial condition; and
•Our Board of Directors may determine that, even though funds are available for dividend payments, retaining the funds for internal uses, such as expansion of our operations, is a better strategy.
If we fail to pay dividends, capital appreciation, if any, of our common stock may be the sole opportunity for gains on an investment in our common stock. In addition, in the event our subsidiary bank becomes unable to pay dividends to us, we may not be able to service our debt or pay our other obligations or pay dividends on our common stock. Accordingly, our inability to receive dividends from our subsidiary bank could also have a material adverse effect on our business, financial condition and results of operations and the value of your investment in our common stock. Our subsidiary bank’s ability to pay dividends or
make other payments to us, as well as our ability to pay dividends on our common stock, is limited by the bank’s obligation to maintain sufficient capital and by other general regulatory restrictions on its dividends, including restrictions imposed by state laws and regulations.
There may be future sales of additional common stock or preferred stock or other dilution of our equity, which may adversely affect the value of our common stock.
We are not restricted from issuing additional common stock or preferred stock, including any securities that are convertible into or exchangeable for, or that represent the right to receive, common stock or preferred stock or any substantially similar securities. The value of our common stock could decline as a result of sales by us of a large number of shares of common stock or preferred stock or similar securities in the market or the perception that such sales could occur.
Shares of our common stock, as well as our other securities, are not insured deposits and may lose value.
Shares of the Company’s common stock, as well as our other securities, are not savings accounts, deposits, or other obligations of any depository institution, and those shares are not insured by the FDIC or any other governmental agency or instrumentality or private insurer. Investments in shares of the Company’s common stock or other securities, therefore, are subject to investment risk, including the possible loss of principal.
Anti-takeover provisions could negatively impact our shareholders.
Provisions of our articles of incorporation and by-laws and federal banking laws, including regulatory approval requirements, could make it more difficult for a third party to acquire us, even if doing so would be perceived to be beneficial to our shareholders. The combination of these provisions effectively inhibits a non-negotiated merger or other business combination, which, in turn, could adversely affect the market price of our common stock. These provisions could also discourage proxy contests and make it more difficult for holders of our common stock to elect directors other than the candidates nominated by our Board of Directors.
General Risk Factors
Our management has broad discretion over the use of proceeds from future stock offerings.
Although we generally indicate our intent to use the proceeds from stock offerings for general corporate purposes, including funding internal growth and selected future acquisitions, our Board of Directors retains significant discretion with respect to the use of the proceeds from possible future offerings. If we use the funds to acquire other businesses, there can be no assurance that any business we acquire will be successfully integrated into our operations or otherwise perform as expected.
Our recent results do not indicate our future results and may not provide guidance to assess the risk of an investment in our common stock.
We may not be able to sustain our historical rate of growth or be able to expand our business. Various factors, such as economic conditions, regulatory and legislative considerations and competition, may also impede or prohibit our ability to expand our market presence. We may also be unable to identify advantageous acquisition opportunities or, once identified, enter into transactions to make such acquisitions. If we are not able to successfully grow our business, our financial condition and results of operations could be adversely affected.
Weather-related events or natural or man-made disasters could cause a disruption in our business or have other effects which could adversely impact our financial condition and results of operations.
We have operations in the mid-south and certain great plains states, areas susceptible to tornados and severe weather events. In addition, our operations and a significant number of our branches are located in the New Madrid Seismic Zone. While we have in place a business continuity plan, such events could potentially disrupt our operations or result in physical damage to our branch office locations. Severe weather events or earthquakes could also impact the value of any collateral we hold, or significantly disrupt the local economies in the markets that we serve, manifesting in a decline in loan originations, as well as an increase in the risk of delinquencies, defaults, and foreclosures.
ITEM 1B. UNRESOLVED STAFF COMMENTS
None.
ITEM 2. PROPERTIES
The principal offices of the Company and of its subsidiary bank, Simmons Bank, consist of an eleven-story office building and adjacent office space located in the downtown business district of the city of Pine Bluff, Arkansas. A portion of those offices is subject to a ground lease that expires March 31, 2057. We have additional corporate offices located in Little Rock, Arkansas, including a twelve-story office building in Little Rock’s River Market district.
The Company and its subsidiaries own or lease additional offices in the states of Arkansas, Kansas, Missouri, Oklahoma, Tennessee and Texas. The Company and its subsidiaries conduct financial operations from approximately 199 financial centers located in communities throughout Arkansas, Kansas, Missouri, Oklahoma, Tennessee and Texas. We believe our properties are suitable and adequate for our present operations.
ITEM 3. LEGAL PROCEEDINGS
The information contained in Note 22, Contingent Liabilities, of the Notes to Consolidated Financial Statements in Part II, Item 8 of this report is incorporated herein by reference.
ITEM 4. MINE SAFETY DISCLOSURES
Not applicable.
PART II
ITEM 5. MARKET FOR REGISTRANT’S COMMON EQUITY, RELATED STOCKHOLDER MATTERS AND ISSUER PURCHASES OF EQUITY SECURITIES
Our common stock is listed on the Nasdaq Global Select Market under the symbol “SFNC.”
As of February 22, 2022, there were approximately 2,278 shareholders of record of our common stock. See the Cash Dividends discussion in the Capital section of Part II, Item 7, Management’s Discussion and Analysis of Financial Condition and Results of Operations, for additional information regarding cash dividends.
Issuer Purchases of Equity Securities
Effective July 23, 2021, our Board of Directors approved an amendment to the Company’s stock repurchase program originally approved in October 2019 and first amended in March 2020 (“2019 Program”) that increased the amount of our Class A Common Stock that may be repurchased under the 2019 Program from a maximum of $180 million to a maximum of $276.5 million and extended the term of the 2019 Program from October 31, 2021, to October 31, 2022 (unless terminated sooner). The repurchase authorization under the 2019 Program was substantially exhausted during January 2022.
On January 27, 2022, we announced a new stock repurchase program (the “2022 Program”) under which we may repurchase up to $175 million of our Class A Common Stock currently issued and outstanding. The 2022 Program replaced the 2019 Program. The timing, pricing, and amount of any repurchases under the 2022 Program will be determined by management at its discretion based on a variety of factors, including but not limited to, trading volume and market price of our common stock, corporate considerations, the Company working capital and investment requirements, general market and economic conditions, and legal requirements. Under the 2022 Program, we may repurchase shares of our Class A Common Stock through open market and privately negotiated transactions or otherwise. The 2022 Program does not obligate us to repurchase any of our Class A Common Stock and may be modified, discontinued, or suspended at any time without prior notice. We anticipate funding for the 2022 Program to come from available sources of liquidity, including cash on hand and future cash flow.
Information concerning our purchases of common stock during the quarter ended December 31, 2021 is as follows:
| | | | | | | | | | | | | | | | | | | | | | | |
| Period | Total Number of Shares Purchased (1) | | Average Price Paid per Share | | Total Number of Shares Purchased as Part of Publicly Announced Plans or Programs | | Approximate Dollar Value of Shares that May Yet Be Purchased Under the Plans or Programs |
| October 1 - 31, 2021 | 457,687 | | | $ | 30.47 | | | 457,687 | | | $ | 84,583,000 | |
| November 1 - 30, 2021 | 325,000 | | | 29.23 | | | 325,000 | | | $ | 75,082,000 | |
| December 1 - 31, 2021 | 1,842,661 | | | 29.58 | | | 1,842,661 | | | $ | 20,585,000 | |
| Total | 2,625,348 | | | $ | 29.69 | | | 2,625,348 | | | |
_________________________
(1)No shares of restricted stock were purchased in connection with employee tax withholding obligations under employee compensation plans, which are not purchases under any publicly announced plan.
Performance Graph
The performance graph below compares the cumulative total shareholder return on the Company’s Common Stock with the cumulative total return of the Nasdaq Composite Index, the SNL U.S. Bank & Thrift Index, the Russell 2000 Index and KBW Regional Banking Index. The graph assumes an investment of $100 on December 31, 2016 and reinvestment of dividends on the date of payment without commissions. The performance graph represents past performance and should not be considered as an indication of future performance. In the preceding year, the Company selected the NASDAQ Composite and SNL U.S. Bank & Thrift Index as the indexes with which to compare its performance. The Company is replacing these indexes with the Russell 2000 Index and the KBW Regional Banking Index, respectively, as we believe these indexes are more representative of companies similar in size and market capitalization to the Company. In addition, the Company is a member of the Russell 2000 Index and, during 2021, was added as a member of the KBW Regional Bank Index.
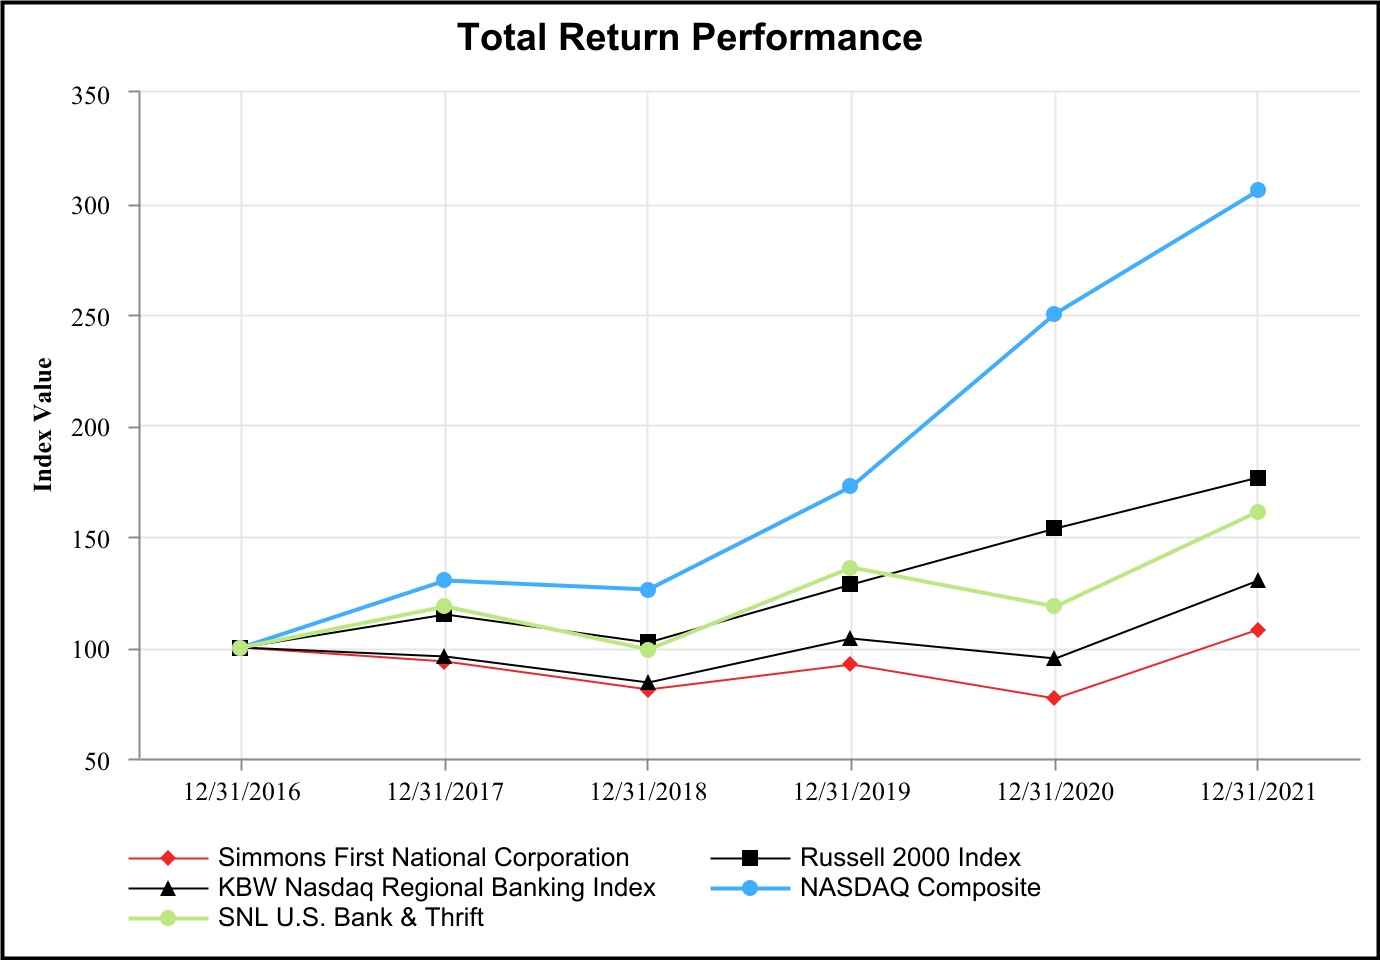
| | | | | | | | | | | | | | | | | | | | | | | | | | | | | | | | | | | | | | |
| | | Period Ending |
| Index | | 12/31/2016 | | 12/31/2017 | | 12/31/2018 | | 12/31/2019 | | 12/31/2020 | | 12/31/2021 |
| Simmons First National Corporation | | 100.00 | | | 93.56 | | | 80.70 | | | 91.91 | | | 76.98 | | | 108.04 | |
| Russell 2000 Index | | 100.00 | | | 114.63 | | | 101.99 | | | 127.98 | | | 153.49 | | | 176.18 | |
| KBW Nasdaq Regional Banking Index | | 100.00 | | | 95.60 | | | 84.00 | | | 104.05 | | | 95.02 | | | 129.84 | |
| Nasdaq Composite | | 100.00 | | | 129.73 | | | 126.08 | | | 172.41 | | | 250.08 | | | 305.63 | |
| SNL U.S. Bank & Thrift | | 100.00 | | | 118.21 | | | 98.75 | | | 135.64 | | | 118.33 | | | 160.89 | |
ITEM 6. [RESERVED]
ITEM 7. MANAGEMENT’S DISCUSSION AND ANALYSIS OF FINANCIAL CONDITION AND RESULTS OF OPERATIONS
The following discussion and analysis presents the more significant factors that affected our financial condition as of December 31, 2021 and 2020 and results of operations for each of the years then ended. Refer to “Management’s Discussion and Analysis of Financial Condition and Results of Operations” included in our Annual Report on Form 10-K filed with the SEC on February 25, 2021 (the “2020 Form 10-K”) for a discussion and analysis of the more significant factors that affected periods prior to 2020, which are incorporated herein by reference. Certain reclassifications have been made to make prior periods comparable. This discussion and analysis should be read in conjunction with our financial statements, notes thereto and other financial information appearing elsewhere in this report, as well as the cautionary note regarding forward-looking statements and the risks discussed in Item 1A of Part I of this Form 10-K.
| | |
| Critical Accounting Estimates |
Overview
The preparation of financial statements in conformity with US GAAP requires management to make estimates and assumptions that affect the amounts reported in the financial statements and accompanying notes. While we base estimates on historical experience, current information and other factors deemed to be relevant, actual results could differ from those estimates.
We consider accounting estimates to be critical to reported financial results if (i) the accounting estimate requires management to make assumptions about matters that are highly uncertain and (ii) different estimates that management reasonably could have used for the accounting estimate in the current period, or changes in the accounting estimate that are reasonably likely to occur from period to period, could have a material impact on our financial statements.
The accounting policies that we view as critical to us are those relating to estimates and judgments regarding (a) the determination of the adequacy of the allowance for credit losses, (b) acquisition accounting and valuation of loans, (c) the valuation of goodwill and the useful lives applied to intangible assets, (d) the valuation of stock-based compensation plans and (e) income taxes.
Allowance for Credit Losses
The allowance for credit losses is a reserve established through a provision for credit losses charged to expense, which represents management’s best estimate of lifetime expected losses based on reasonable and supportable forecasts, historical loss experience, and other qualitative considerations. The allowance, in the judgment of management, is necessary to reserve for expected credit losses and risks inherent in the loan portfolio. Our allowance for credit loss methodology includes reserve factors calculated to estimate current expected credit losses to amortized cost balances over the remaining contractual life of the portfolio, adjusted for prepayments, in accordance with Accounting Standard Codification (“ASC”) Topic 326-20, Financial Instruments - Credit Losses. Accordingly, the methodology is based on our reasonable and supportable economic forecasts, historical loss experience, and other qualitative adjustments. For further information see the section Allowance for Credit Losses below.
Our evaluation of the allowance for credit losses is inherently subjective as it requires material estimates. The actual amounts of credit losses realized in the near term could differ from the amounts estimated in arriving at the allowance for credit losses reported in the financial statements. On January 1, 2020, the Company adopted the new Current Expected Credit Losses, or “CECL”, methodology. See Note 20, New Accounting Standards, in the accompanying Notes to Consolidated Financial Statements for additional information.
Prior to the adoption of the CECL methodology in 2020, the allowance for credit losses was calculated monthly based on management’s assessment of several factors such as (1) historical loss experience based on volumes and types, (2) volume and trends in delinquencies and nonaccruals, (3) lending policies and procedures including those for credit losses, collections and recoveries, (4) national, state and local economic trends and conditions, (5) external factors and pressure from competition, (6) the experience, ability and depth of lending management and staff, (7) seasoning of new products obtained and new markets entered through acquisition and (8) other factors and trends that affected specific loans and categories of loans. We established general allocations for each major loan category. This category also included allocations to loans which were collectively evaluated for loss such as credit cards, one-to-four family owner occupied residential real estate loans and other consumer loans. General reserves were established, based upon the aforementioned factors and allocated to the individual loan categories. Allowances were accrued for probable losses on specific loans evaluated for impairment for which the basis of each loan, including accrued interest, exceeded the discounted amount of expected future collections of interest and principal or, alternatively, the fair value of loan collateral.
Acquisition Accounting, Loans
We account for our acquisitions under ASC Topic 805, Business Combinations, which requires the use of the acquisition method of accounting. All identifiable assets acquired, including loans, are recorded at fair value. The fair value for acquired loans at the time of acquisition is based on a variety of factors including discounted expected cash flows, adjusted for estimated prepayments and credit losses. In accordance with ASC 326, the fair value adjustment is recorded as premium or discount to the unpaid principal balance of each acquired loan. Loans that have been identified as having experienced a more-than-insignificant deterioration in credit quality since origination are purchased credit deteriorated (“PCD”) loans. The net premium or discount on PCD loans is adjusted by our allowance for credit losses recorded at the time of acquisition. The remaining net premium or discount is accreted or amortized into interest income over the remaining life of the loan using a constant yield method. The net premium or discount on loans that are not classified as PCD (“non-PCD”), that includes credit and non-credit components, is accreted or amortized into interest income over the remaining life of the loan using a constant yield method. We then record the necessary allowance for credit losses on the non-PCD loans through provision for credit losses expense.
Goodwill and Intangible Assets
Goodwill represents the excess of the cost of an acquisition over the fair value of the net assets acquired. Other intangible assets represent purchased assets that also lack physical substance but can be separately distinguished from goodwill because of contractual or other legal rights or because the asset is capable of being sold or exchanged either on its own or in combination with a related contract, asset or liability. We perform an annual goodwill impairment test, and more than annually if circumstances warrant, in accordance with ASC Topic 350, Intangibles – Goodwill and Other, as amended by ASU 2011-08 – Testing Goodwill for Impairment and ASU 2017-04 - Intangibles – Goodwill and Other. ASC Topic 350 requires that goodwill and intangible assets that have indefinite lives be reviewed for impairment annually or more frequently if certain conditions occur. Our assessment depends on several assumptions which are dependent on market and economic conditions. Impairment losses on recorded goodwill, if any, will be recorded as operating expenses.
Stock-Based Compensation Plans
We have adopted various stock-based compensation plans. The plans provide for the grant of incentive stock options, nonqualified stock options, stock appreciation rights, restricted stock awards, restricted stock units and performance stock units. Pursuant to the plans, shares are reserved for future issuance by the Company upon exercise of stock options or awarding of restricted stock, restricted stock units or performance stock units granted to directors, officers and other key employees. In accordance with ASC Topic 718, Compensation – Stock Compensation, the fair value of each option award is estimated on the date of grant using the Black-Scholes option-pricing model that uses various assumptions. This model requires the input of highly subjective assumptions, changes to which can materially affect the fair value estimate. For additional information, see Note 15, Employee Benefit Plans, in the accompanying Notes to Consolidated Financial Statements included elsewhere in this report.
Income Taxes
We are subject to the federal income tax laws of the United States, and the tax laws of the states and other jurisdictions where we conduct business. Due to the complexity of these laws, taxpayers and the taxing authorities may subject these laws to different interpretations. Management must make conclusions and estimates about the application of these innately intricate laws, related regulations, and case law. When preparing the Company’s income tax returns, management attempts to make reasonable interpretations of the tax laws. Taxing authorities have the ability to challenge management’s analysis of the tax law or any reinterpretation management makes in its ongoing assessment of facts and the developing case law. Management assesses the reasonableness of its effective tax rate quarterly based on its current estimate of net income and the applicable taxes expected for the full year. On a quarterly basis, management also reviews circumstances and developments in tax law affecting the reasonableness of deferred tax assets and liabilities and reserves for contingent tax liabilities.
Our net income available to common shareholders for the year ended December 31, 2021 was $271.1 million, or $2.46 diluted earnings per share, compared to $254.9 million, or $2.31 diluted earnings per share, for the same period in 2020. Included in both 2021 and 2020 results were non-core items related to our acquisitions, gains associated with the sale of branches and branch right sizing initiatives, and with respect to our 2020 results only, early retirement program expenses. Excluding all non-core items, core earnings for the year ended December 31, 2021 were $278.3 million, or $2.53 core diluted earnings per share, compared to $264.3 million, or $2.40 core diluted earnings per share, in 2020. See GAAP Reconciliation of Non-GAAP Financial Measures for additional discussion and reconciliation of non-GAAP measures.
Simmons Bank was named to Forbes magazine’s list of “World’s Best Banks” for the second consecutive year and ranked among the top 30 banks in Forbes’ list of “America’s Best Banks” for 2021. We continue to introduce new and innovative products and services using digital channels to provide an enhanced customer experience to “bank when you want, where you want”.
On March 12, 2021, we completed the sale of four Simmons Bank locations in the Metro East area of Southern Illinois, near St. Louis. We recognized a gain of $5.3 million on the sale of the Illinois branches.
We completed the acquisitions of Landmark Community Bank (or “Landmark”) and Triumph Bancshares, Inc. (or “Triumph”), including its wholly-owned bank subsidiary, Triumph Bank, in October 2021, while simultaneously completing the systems conversion of both banks. We were able to obtain all necessary approvals, close and complete the systems conversions of the two banks within approximately four months of the announcement, which we believe speaks to the outstanding team we have developed. See Note 2, Acquisitions, in the accompanying Notes to Consolidated Financial Statements for additional information related to these acquisitions.
Additionally, on November 19, 2021, we announced the Company had entered into the Spirit Agreement with Spirit, headquartered in Conroe, Texas, including its wholly-owned bank subsidiary, Spirit of Texas Bank SSB. See Note 2, Acquisitions, in the accompanying Notes to Consolidated Financial Statements for additional information related to this acquisition.
During the fourth quarter of 2021, Simmons Bank announced a first-of-its-kind multi-university corporate sponsorship program designed to support female student athletes and serve as a program for developing women leaders in the corporate world, and we also donated $2.5 million to the Simmons First Foundation.
Continuing on the trends from 2020, in 2021 our digital banking transactions as a percentage of total transactions increased by an additional 23%, while mobile deposit transactions increased 30% and mobile deposit dollars increased 68% when compared to 2020. These increases were driven by new digital account products and enhanced digital only processes.
We continue to evaluate our branch network as part of our analysis of the profitability of our operations and the efficiency with which we deliver banking services to our markets, including, among other things, changes in customer traffic and preferences. During 2021, we closed 15 branches while opening 3 branches. In September 2021, we purchased a 90,000 square foot building in west Little Rock, Arkansas, that will afford us a great opportunity to strategically position certain teams in a centralized location as well as opening a full-service branch and drive-thru to better service our customers in that area.
Stockholders’ equity as of December 31, 2021 was $3.2 billion, book value per share was $28.82 and tangible book value per common share was $17.71. Our ratio of common stockholders’ equity to total assets was 13.1% and the ratio of tangible common stockholders’ equity to tangible assets was 8.5% at December 31, 2021. See GAAP Reconciliation of Non-GAAP Financial Measures for additional discussion and reconciliation of non-GAAP measures. The Company’s Tier I leverage ratio of 9.1%, as well as our other regulatory capital ratios, remain significantly above the “well capitalized” minimum requirements. See Table 18 – Risk-Based Capital for regulatory capital ratios.
Total interest bearing balances due from banks and federal funds sold were $1.4 billion at December 31, 2021, a decrease of $1.8 billion from the same period in 2020. We had accumulated additional liquidity at December 31, 2020 as a result of the ongoing effects of the COVID-19 pandemic, including economic stimulus legislation, reduced credit card balances, tepid loan demand and fewer overdraft activities. We were able to reduce these interest bearing balances during 2021 through our redeployment of excess cash, mainly through purchases of investment securities and repurchases of our common stock.
Total loans were $12.0 billion at December 31, 2021, a decrease of $888.4 million, or 6.9%, from the same period in 2020. During 2021, we originated $318.9 million in Round 2 PPP loans to our customers, compared to $975.6 Round 1 PPP loans originated during 2020.
| | | | | |
| Total |
| (Dollars in thousands) | PPP Loans |
| Beginning balance, January 1, 2021 | $ | 904,673 | |
| PPP loan originations | 318,919 | |
| Acquired PPP loans | 15,573 | |
| PPP loan forgiveness and repayments | (1,122,506) | |
| Ending balance, December 31, 2021 | $ | 116,659 | |
We continue to closely monitor the COVID-19 pandemic and expect to make future changes to respond as this situation continues to evolve. Further economic downturns caused by the COVID-19 pandemic, a delayed economic recovery from the COVID-19 pandemic, or a delayed recovery from the COVID-19 pandemic due to difficulties with vaccine distribution or effectiveness or new variants of the novel coronavirus, could result in increased deterioration in credit quality, past due loans, loans charge offs and collateral value declines, which could cause our results of operations and financial condition to be negatively impacted.
At December 31, 2021, the allowance for credit losses on loans was $205.3 million, a decrease of $32.7 million from December 31, 2020. The decrease was predominately related to economic recovery from the effects of the COVID-19 pandemic, coupled with improved credit quality metrics and improved macroeconomic factors that were considered as part of the Company’s CECL methodology.
In our discussion and analysis of our financial condition and results of operation in this Item 7, “Management’s Discussion and Analysis of Financial Condition and Results of Operations,” we provide certain financial information determined by methods other than in accordance with US GAAP. We believe the presentation of non-GAAP financial measures provides a meaningful basis for period-to-period and company-to-company comparisons, which we believe will assist investors and analysts in analyzing the core financial measures of the Company and predicting future performance. See the GAAP Reconciliation of Non-GAAP Measures section below for additional discussion and reconciliations of non-GAAP measures.
Simmons First National Corporation is an Arkansas-based financial holding company that, as of December 31, 2021, has approximately $24.7 billion in consolidated assets and, through its subsidiaries, conducts financial operations in Arkansas, Kansas, Missouri, Oklahoma, Tennessee and Texas.
Net interest income, our principal source of earnings, is the difference between the interest income generated by earning assets and the total interest cost of the deposits and borrowings obtained to fund those assets. Factors that determine the level of net interest income include the volume of earning assets and interest bearing liabilities, yields earned and rates paid, the level of non-performing loans and the amount of non-interest bearing liabilities supporting earning assets. Net interest income is analyzed in the discussion and tables below on a fully taxable equivalent basis. The adjustment to convert certain income to a fully taxable equivalent basis consists of dividing tax-exempt income by one minus the combined federal and state income tax rate of 26.135%.
The FRB sets various benchmark interest rates which influence the general market rates of interest, including the deposit and loan rates offered by financial institutions. Between December 2015 and December 2018, the FRB had been gradually raising benchmark interest rates. The FRB target for the federal funds rate, which is the cost to banks of immediately available overnight funds, increased from 0% - 0.50% in December 2015 and gradually increased to 2.25% - 2.50% over a three year period. The federal funds rate was flat until the FRB began to lower the rate in August 2019 and ultimately reduced it to 1.50% - 1.75% in October 2019. During March 2020, the Federal Open Market Committee (“FOMC”) of the FRB substantially reduced interest rates in response to the economic crisis brought on by the COVID-19 pandemic. The federal funds rate was cut to a range of 0.00% - 0.25% and rates have continued to remain low through 2021.
Our loan portfolio is significantly affected by changes in the prime interest rate. The prime interest rate, which is the rate offered on loans to borrowers with strong credit, also increased from 3.25% to 5.50% during the years 2015 through 2018. The prime interest rate remained flat until it began to decrease in July 2019 and was eventually reduced to 4.75% in October 2019. Similarly to the reduction in the federal funds rate, the prime rate was cut to 3.25% in mid-March of 2020 in response to the COVID-19
pandemic and remained unchanged through 2021, although in late 2021 and early 2022 markets have begun to anticipate multiple rate increases by the Federal Reserve during 2022.
Our practice is to limit exposure to interest rate movements by maintaining a significant portion of earning assets and interest bearing liabilities in short-term repricing. In the last several years, on average, approximately 43% of our loan portfolio and approximately 78% of our time deposits have repriced in one year or less. Our current interest rate sensitivity shows that approximately 43% of our loans and 82% of our time deposits will reprice in the next year.
For the year ended December 31, 2021, net interest income on a fully taxable equivalent basis was $610.8 million, a decrease of $40.0 million, or 6.1%, over the same period in 2020. The decrease in net interest income was primarily the result of an $80.4 million decrease in interest income, partially offset by a $40.5 million decrease in interest expense.
The reduction in interest income primarily resulted from a decrease of $132.9 million in interest income on loans partially offset by an increase of $55.5 million in interest income on investment securities. Regarding the decrease in interest income on loans during 2021, the decline in loan volume resulted in a decrease of $115.7 million in interest income, while a 12 basis point decline in yield resulted in a $17.2 million decrease in interest income during the year ended December 31, 2021. The loan yield for 2021 was 4.71% compared to 4.83% for 2020. The PPP loan yield was approximately 6.05% (including accretion of net fees), which increased the loan yield by 8 basis points. Excluding the PPP loans, loan yield for 2021 was 4.63%. The decrease in our loan volume during 2021 was primarily due to weak loan demand throughout 2020 and 2021 as a result of the COVID-19 pandemic. Furthermore, the decline in loan volume also reflects the substantial governmental stimulus to support the economy during the COVID-19 pandemic, which we believe contributed to an increase in the level of loan paydowns and payoffs, including loan forgiveness in accordance with the PPP.
Included in interest income is the additional yield accretion recognized as a result of updated estimates of the cash flows of our loans acquired. Each quarter, we estimate the cash flows expected to be collected from the loans acquired, and adjustments may or may not be required. The cash flows estimate may increase or decrease based on payment histories and loss expectations of the loans. The resulting adjustment to interest income is spread on a level-yield basis over the remaining expected lives of the loans. For the years ended December 31, 2021, 2020 and 2019 interest income included $22.1 million, $41.5 million and $41.2 million, respectively, for the yield accretion recognized on loans acquired.
The $40.5 million decrease in interest expense is mostly due to the decline in our deposit account rates. Interest expense decreased $41.6 million due to the decrease in rate of 35 basis points on interest-bearing deposit accounts, partially offset by an increase of $2.9 million related to approximately $1.31 billion in average deposit growth.
Our net interest margin on a fully tax equivalent basis was 2.89% for the year ended December 31, 2021, down 49 basis points from 2020. Normalized for all accretion, our core net interest margin (non-GAAP) at December 31, 2021 and 2020 was 2.79% and 3.16%, respectively. The decreases in the net interest margin and the core net interest margin were primarily due to the aforementioned decline in net interest income coupled with the lower interest rate environment and additional liquidity created in response to the COVID-19 pandemic. We purchased investment securities which added approximately $3.93 billion to our average investment securities portfolio during 2021. The impact of these items on net interest margin for the year 2021 was 9 basis points, bringing the net interest margin adjusted for PPP loans and additional liquidity (non-GAAP) to 2.80%. See GAAP Reconciliation of Non-GAAP Financial Measures for additional discussion and reconciliation of non-GAAP measures. We believe we are poised to opportunistically redeploy the excess liquidity in to higher earning assets during 2022, as market conditions permit.
During March 2020, the FOMC substantially reduced interest rates in response to the economic crisis brought on by the COVID-19 pandemic and rates remained at historically low levels throughout 2021. As such, our variable rate loan portfolio has repriced to a lower yield and, in response to offset the decline, we have worked to lower our cost of deposits. In addition, our decreased net interest margin is being driven by the decrease in our non-PPP loan portfolio as a result of the COVID-19 pandemic.
Over the course of 2022, we expect a slight improvement in our net interest margin. Our non-PPP loan portfolio declined during 2021 as a result of continued impact related to the COVID-19 pandemic, but our loan pipeline continued rebuilding with increased volume in each quarter throughout 2021 and we expect modest organic loan growth during 2022. The increases we are seeing in our commercial pipeline are being driven by new business units as well as growth across all regions of our footprint.
Tables 1 and 2 reflect an analysis of net interest income on a fully taxable equivalent basis for the years ended December 31, 2021, 2020 and 2019, respectively, as well as changes in fully taxable equivalent net interest margin for the years 2021 versus 2020 and 2020 versus 2019.
Table 1: Analysis of Net Interest Margin
(FTE = Fully Taxable Equivalent using an effective tax rate of 26.135%)
| | | | | | | | | | | | | | | | | |
| | Years Ended December 31, |
| (In thousands) | 2021 | | 2020 | | 2019 |
| Interest income | $ | 671,061 | | | $ | 759,718 | | | $ | 783,123 | |
| FTE adjustment | 19,231 | | | 11,001 | | | 7,322 | |
| Interest income - FTE | 690,292 | | | 770,719 | | | 790,445 | |
| Interest expense | 79,529 | | | 119,984 | | | 181,370 | |
| Net interest income - FTE | $ | 610,763 | | | $ | 650,735 | | | $ | 609,075 | |
| | | | | |
| Yield on earning assets - FTE | 3.27 | % | | 4.00 | % | | 5.00 | % |
| Cost of interest bearing liabilities | 0.52 | % | | 0.84 | % | | 1.49 | % |
| Net interest spread - FTE | 2.75 | % | | 3.16 | % | | 3.51 | % |
| Net interest margin - FTE | 2.89 | % | | 3.38 | % | | 3.85 | % |
Table 2: Changes in Fully Taxable Equivalent Net Interest Margin
| | | | | | | | | | | |
| (In thousands) | 2021 vs. 2020 | | 2020 vs. 2019 |
| Increase (decrease) due to change in earning assets | $ | (40,169) | | | $ | 96,617 | |
| Decrease due to change in earning asset yields | (40,258) | | | (116,343) | |
| Decrease due to change in interest bearing liabilities | (2,191) | | | (19,031) | |
| Increase due to change in interest rates paid on interest bearing liabilities | 42,646 | | | 80,417 | |
| Increase (decrease) in net interest income | $ | (39,972) | | | $ | 41,660 | |
Table 3 shows, for each major category of earning assets and interest bearing liabilities, the average (computed on a daily basis) amount outstanding, the interest earned or expensed on such amount and the average rate earned or expensed for each of the years in the three-year period ended December 31, 2021. The table also shows the average rate earned on all earning assets, the average rate expensed on all interest bearing liabilities, the net interest spread and the net interest margin for the same periods. The analysis is presented on a fully taxable equivalent basis. Nonaccrual loans were included in average loans for the purpose of calculating the rate earned on total loans.
Table 3: Average Balance Sheets and Net Interest Income Analysis
(FTE = Fully Taxable Equivalent using an effective tax rate of 26.135%)
| | | | | | | | | | | | | | | | | | | | | | | | | | | | | | | | | | | | | | | | | | | | | | | | | | | | | |
| | Years Ended December 31, |
| | 2021 | | 2020 | | 2019 |
| | Average | | Income/ | | Yield/ | | Average | | Income/ | | Yield/ | | Average | | Income/ | | Yield/ |
| (In thousands) | Balance | | Expense | | Rate (%) | | Balance | | Expense | | Rate (%) | | Balance | | Expense | | Rate (%) |
| ASSETS | | | | | | | | | | | | | | | | | |
| Earning assets: | | | | | | | | | | | | | | | | | |
Interest bearing balances due from banks and federal funds sold | $ | 2,376,421 | | | $ | 2,795 | | | 0.12 | | | $ | 1,970,852 | | | $ | 4,383 | | | 0.22 | | | $ | 451,946 | | | $ | 7,486 | | | 1.66 | |
Investment securities - taxable | 4,512,564 | | | 58,976 | | | 1.31 | | | 1,813,640 | | | 35,039 | | | 1.93 | | | 1,717,566 | | | 43,618 | | | 2.54 | |
Investment securities - non-taxable | 2,343,117 | | | 71,207 | | | 3.04 | | | 1,113,851 | | | 39,666 | | | 3.56 | | | 681,231 | | | 26,675 | | | 3.92 | |
Mortgage loans held for sale | 55,204 | | | 1,565 | | | 2.83 | | | 113,854 | | | 3,031 | | | 2.66 | | | 35,815 | | | 1,326 | | | 3.70 | |
| Loans | 11,810,480 | | | 555,749 | | | 4.71 | | | 14,260,689 | | | 688,600 | | | 4.83 | | | 12,938,013 | | | 711,340 | | | 5.50 | |
Total interest earning assets | 21,097,786 | | | 690,292 | | | 3.27 | | | 19,272,886 | | | 770,719 | | | 4.00 | | | 15,824,571 | | | 790,445 | | | 5.00 | |
| Non-earning assets | 2,394,522 | | | | | | | 2,317,859 | | | | | | | 2,047,177 | | | | | |
| Total assets | $ | 23,492,308 | | | | | | | $ | 21,590,745 | | | | | | | $ | 17,871,748 | | | | | |
| | | | | | | | | | | | | | | | | |
| LIABILITIES AND STOCKHOLDERS’ EQUITY | | | | | | | | | | |
| Liabilities: | | | | | | | | | | | | | | | | | |
Interest bearing liabilities: | | | | | | | | | | | | | | | | | |
Interest bearing transaction and savings deposits | $ | 10,638,665 | | | $ | 19,568 | | | 0.18 | | | $ | 9,128,936 | | | $ | 38,462 | | | 0.42 | | | $ | 7,417,104 | | | $ | 80,314 | | | 1.08 | |
| Time deposits | 2,804,851 | | | 21,604 | | | 0.77 | | | 3,006,768 | | | 41,398 | | | 1.38 | | | 3,094,094 | | | 58,697 | | | 1.90 | |
Total interest bearing deposits | 13,443,516 | | | 41,172 | | | 0.31 | | | 12,135,704 | | | 79,860 | | | 0.66 | | | 10,511,198 | | | 139,011 | | | 1.32 | |
Federal funds purchased and securities sold under agreements to repurchase | 247,448 | | | 579 | | | 0.23 | | | 362,629 | | | 1,715 | | | 0.47 | | | 128,547 | | | 1,010 | | | 0.79 | |
| Other borrowings | 1,340,185 | | | 19,495 | | | 1.45 | | | 1,353,738 | | | 19,652 | | | 1.45 | | | 1,199,274 | | | 23,008 | | | 1.92 | |
Subordinated debt and debentures | 383,182 | | | 18,283 | | | 4.77 | | | 385,294 | | | 18,757 | | | 4.87 | | | 359,804 | | | 18,341 | | | 5.10 | |
Total interest bearing liabilities | 15,414,331 | | | 79,529 | | | 0.52 | | | 14,237,365 | | | 119,984 | | | 0.84 | | | 12,198,823 | | | 181,370 | | | 1.49 | |
| | | | | | | | | | | | | | | | | |
Non-interest bearing liabilities: | | | | | | | | | | | | | | | | | |
Non-interest bearing deposits | 4,836,839 | | | | | | | 4,225,618 | | | | | | | 3,021,917 | | | | | |
| Other liabilities | 169,140 | | | | | | | 205,956 | | | | | | | 251,631 | | | | | |
| Total liabilities | 20,420,310 | | | | | | | 18,668,939 | | | | | | | 15,472,371 | | | | | |
| Stockholders’ equity | 3,071,998 | | | | | | | 2,921,806 | | | | | | | 2,399,377 | | | | | |
Total liabilities and stockholders’ equity | $ | 23,492,308 | | | | | | | $ | 21,590,745 | | | | | | | $ | 17,871,748 | | | | | |
| Net interest spread | | | | | 2.75 | | | | | | | 3.16 | | | | | | | 3.51 | |
| Net interest margin | | | $ | 610,763 | | | 2.89 | | | | | $ | 650,735 | | | 3.38 | | | | | $ | 609,075 | | | 3.85 | |
Table 4 shows changes in interest income and interest expense resulting from changes in volume and changes in interest rates for the years 2021 versus 2020 and 2020 versus 2019. The changes in interest rate and volume have been allocated to changes in average volume and changes in average rates in proportion to the relationship of absolute dollar amounts of the changes in rates and volume.
Table 4: Volume/Rate Analysis
| | | | | | | | | | | | | | | | | | | | | | | | | | | | | | | | | | | |
| | Years Ended December 31, |
| | 2021 vs. 2020 | | 2020 vs. 2019 |
| | | Yield/ | | | | | | Yield/ | | |
| (In thousands, on a fully taxable equivalent basis) | Volume | | Rate | | Total | | Volume | | Rate | | Total |
| Increase (decrease) in: | | | | | | | | | | | |
| Interest income: | | | | | | | | | | | |
Interest bearing balances due from banks and federal funds sold | $ | 773 | | | $ | (2,361) | | | $ | (1,588) | | | $ | 7,840 | | | $ | (10,943) | | | $ | (3,103) | |
| Investment securities - taxable | 38,285 | | | (14,348) | | | 23,937 | | | 2,329 | | | (10,908) | | | (8,579) | |
| Investment securities - non-taxable | 38,110 | | | (6,569) | | | 31,541 | | | 15,597 | | | (2,606) | | | 12,991 | |
| Mortgage loans held for sale | (1,651) | | | 185 | | | (1,466) | | | 2,170 | | | (465) | | | 1,705 | |
| Loans | (115,686) | | | (17,165) | | | (132,851) | | | 68,681 | | | (91,421) | | | (22,740) | |
| Total | (40,169) | | | (40,258) | | | (80,427) | | | 96,617 | | | (116,343) | | | (19,726) | |
| | | | | | | | | | | |
| Interest expense: | | | | | | | | | | | |
| Interest bearing transaction and savings accounts | 5,548 | | | (24,442) | | | (18,894) | | | 15,431 | | | (57,283) | | | (41,852) | |
| Time deposits | (2,618) | | | (17,176) | | | (19,794) | | | (1,615) | | | (15,684) | | | (17,299) | |
Federal funds purchased and securities sold under agreements to repurchase | (439) | | | (697) | | | (1,136) | | | 1,238 | | | (533) | | | 705 | |
| Other borrowings | (197) | | | 40 | | | (157) | | | 2,713 | | | (6,069) | | | (3,356) | |
| Subordinated notes and debentures | (103) | | | (371) | | | (474) | | | 1,264 | | | (848) | | | 416 | |
| Total | 2,191 | | | (42,646) | | | (40,455) | | | 19,031 | | | (80,417) | | | (61,386) | |
| Increase (decrease) in net interest income | $ | (42,360) | | | $ | 2,388 | | | $ | (39,972) | | | $ | 77,586 | | | $ | (35,926) | | | $ | 41,660 | |
| | |
| Provision for Credit Losses |
The provision for credit losses represents management’s determination of the amount necessary to be charged against the current period’s earnings in order to maintain the allowance for credit losses at a level considered appropriate in relation to the estimated lifetime risk inherent in the loan portfolio. The level of provision to the allowance is based on management’s judgment, with consideration given to the composition, maturity and other qualitative characteristics of the portfolio, assessment of current economic conditions, past due and non-performing loans and historical net credit loss experience. It is management’s practice to review the allowance on a monthly basis and, after considering the factors previously noted, to determine the level of provision made to the allowance.
Management updates credit loss forecasts using multiple Moody’s economic scenarios, the most recent of which were published in December 2021. The baseline economic forecast was weighted 65%, while the downside scenario of S-2 was weighted 17% and the upside scenario of S-1 was weighted 18%. The weighting of the forecasts is characterized by, among others, continual increase of CRE prices, increasing market rates, and declining national unemployment rates. The baseline economic forecast as of December 2020 was weighted 68%, while the downside scenario of S-2 was weighted 15% and the upside scenario of S-1 was weighted 17%. The weightings reflect management’s sentiment around the published forecasted scenarios by Moody’s at that specific time.
During 2021, the Company recaptured $32.7 million of its provision for credit losses, while the provision for credit loss expense during 2020 and 2019 was $75.0 million and $43.2 million, respectively. The recapture of credit losses during 2021 was driven by improved credit quality metrics, improved macroeconomic factors, and a maturing and amortizing loan portfolio. This recapture was partially offset by $22.7 million in provision for credit loss expense for estimated lifetime credit losses for non-purchase credit deteriorated loans acquired through the acquisitions of Landmark and Triumph during the fourth quarter. The increase
during 2020 was primarily driven by the adoption of CECL and the related change in methodology which is based on qualitative adjustments, intended to account for potential problem credits that have not materialized into any identifiable metrics or delinquencies. During 2020, certain industries were more adversely impacted by the current and expected economic scenarios, such as the restaurant, retail, and hotel industries. Also, 2020 included an additional provision related to problem energy credits, ultimately charged-off during the second quarter of 2020 for a total of $32.6 million, that experienced further deterioration beginning in first quarter of 2020 and were negatively impacted by the sharp decline in commodity pricing. The remainder of the increase was related to the economic impact of the COVID-19 pandemic that is incorporated in our allowance for credit losses. The increase in provision expense during 2019 was necessary to maintain an appropriate allowance for credit losses for the company’s growing portfolio. Significant loan growth in our markets required an allowance to be established for those loans through an increased provision.
Additionally, during 2019, a special provision was made related to White Star, in which we were a participant in a shared national credit. White Star became the subject of bankruptcy proceedings during 2019, and in September 2019, the bankruptcy court authorized the sale of White Star assets through a Section 363 proceeding under the U.S. Bankruptcy Code. Our portion of the shared national credit was $19.1 million. Based upon the anticipated net proceeds from the pending bankruptcy sale, our loss recorded in 2019 was $14.7 million. As a result, we recorded additional provision expense of $15 million to increase the allowance to an appropriate level. Additionally, a provision of $2.5 million was made during 2019 as a result of identifying certain loans specific to an acquired portfolio in our Dallas market which were poorly structured or were poorly managed post-funding.
Non-interest income is principally derived from recurring fee income, which includes service charges, wealth management fees and debit and credit card fees. Non-interest income also includes income on the sale of mortgage loans, income from the increase in cash surrender values of bank owned life insurance and gains (losses) from sales of securities.
Total non-interest income was $191.8 million in 2021, compared to $239.8 million in 2020 and $197.9 million in 2019. Non-interest income for 2021 decreased $48.0 million, or 20.0%, from 2020.
The majority of the decrease during 2021 was related to the decline in gain on sale of securities and mortgage lending income compared to 2020. We sold $342.6 million of investment securities resulting in a net gain of $15.5 million in 2021, compared to the sale of $1.72 billion of securities resulting in a net gain of $54.8 million in 2020. The majority of the investment securities sold in 2020 were sold in March 2020, in response to the unfolding events of the COVID-19 pandemic, as we focused on the creation of additional liquidity, strengthening our balance sheet, and funding PPP loans originated during 2020.
While we continued to see a low mortgage interest rate environment and strong housing markets during 2021, mortgage lending income decreased $12.7 million during 2021 due to decreases in the value of derivative contracts related to the mortgage banking operations and the slowing of the demand compared to 2020. We originated $1.13 billion and $1.31 billion in mortgage loans during 2021 and 2020, respectively.
We realized $5.3 million on the gain on sale of the Illinois Branch Sale in 2021, compared to the combined gains on sale from the Texas Branch Sale and Colorado Branch Sale of $8.1 million in 2020. The decrease of $3.1 million related to these non-core items contributed to the overall decrease in 2021.
These decreases were partially offset by an increase of $3.5 million in debit and credit fees as a result of additional transactions due to the changes in customer spending habits and an increase of $3.1 million in bank owned life insurance income due to our increased investment in bank owned life insurance during 2021.
Table 5 shows non-interest income for the years ended December 31, 2021, 2020 and 2019, respectively, as well as changes in 2021 from 2020 and in 2020 from 2019.
Table 5: Non-Interest Income
| | | | | | | | | | | | | | | | | | | | | | | | | | | | | | | | | | | | | | | | | |
| | Years Ended December 31, | | 2021
Change from | | 2020
Change from |
| (Dollars in thousands) | 2021 | | 2020 | | 2019 | | 2020 | | 2019 |
| Wealth management fees | $ | 31,172 | | | $ | 30,386 | | | $ | 27,353 | | | $ | 786 | | | 2.6 | % | | $ | 3,033 | | | 11.1 | % |
| Service charges on deposit accounts | 43,231 | | | 43,082 | | | 44,782 | | | 149 | | | 0.4 | | | (1,700) | | | (3.8) | |
| Other service charges and fees | 7,696 | | | 6,624 | | | 5,824 | | | 1,072 | | | 16.2 | | | 800 | | | 13.7 | |
| Mortgage lending income | 21,798 | | | 34,469 | | | 15,017 | | | (12,671) | | | (36.8) | | | 19,452 | | | 129.5 | |
| Debit and credit card fees | 28,245 | | | 24,711 | | | 22,137 | | | 3,534 | | | 14.3 | | | 2,574 | | | 11.6 | |
| Bank owned life insurance income | 8,902 | | | 5,815 | | | 4,768 | | | 3,087 | | | 53.1 | | | 1,047 | | | 22.0 | |
| Gain on sale of securities, net | 15,498 | | | 54,806 | | | 13,314 | | | (39,308) | | | (71.7) | | | 41,492 | | | * |
| Gain on sale of Visa Inc. class B common stock | — | | | — | | | 42,860 | | | — | | | — | | | (42,860) | | | (100.0) | |
| Gain on sale of branches | 5,316 | | | 8,368 | | | — | | | (3,052) | | | (36.5) | | | 8,368 | | | * |
| Other income | 29,957 | | | 31,508 | | | 21,824 | | | (1,551) | | | (4.9) | | | 9,684 | | | 44.4 | |
| Total non-interest income | $ | 191,815 | | | $ | 239,769 | | | $ | 197,879 | | | $ | (47,954) | | | 20.0 | % | | $ | 41,890 | | | 21.2 | % |
_________________________
*Not meaningful
Recurring fee income (service charges, wealth management fees, debit and credit card fees and other fees) for 2021 was $110.3 million, an increase of $5.5 million, or 5.3%, when compared with the 2020 amounts, primarily the result of additional transactions due to the changes in customer spending habits.
Non-interest expense consists of salaries and employee benefits, occupancy, equipment, foreclosure losses and other expenses necessary for our operations. Management remains committed to controlling the level of non-interest expense through the continued use of expense control measures. We utilize an extensive profit planning and reporting system involving all subsidiaries. Based on a needs assessment of the business plan for the upcoming year, monthly and annual profit plans are developed, including manpower and capital expenditure budgets. These profit plans are subject to extensive initial reviews and monitored by management monthly. Variances from the plan are reviewed monthly and, when required, management takes corrective action intended to ensure financial goals are met. We also regularly monitor staffing levels at each subsidiary to ensure productivity and overhead are in line with existing workload requirements.
Non-interest expense for 2021 was $483.6 million, a decrease of $1.1 million, or 0.2%, from 2020. Included in 2021 were $15.4 million of pre-tax non-core items: $15.9 million of merger-related costs due to the Landmark and Triumph acquisitions and a $0.5 million benefit from net branch-right sizing costs. Normalizing for these non-core costs, along with non-core early retirement program expenses in 2020, core non-interest expense for the year ended December 31, 2021 increased $5.0 million, or 1.1%, from the prior year. See the Reconciliation of Non-GAAP Measures section for details of the non-core items.
The 2021 decrease in non-interest expense was primarily due to a $14.6 million decrease in branch right sizing expenses from 2020, partially offset by an $11.4 million increase in merger related costs related to the Landmark and Triumph acquisitions. Additionally, salaries and employee benefits increased by $6.8 million due to associates being hired in lending, wealth and mortgage as we continue to actively recruit new producers. Furniture and equipment expense decreased by $4.1 million due to the realization of expected synergies from the continuous evaluation of our branch network and the branch sales and closures throughout 2021 and 2020. The decrease in deposit insurance during 2021 was due to lower assessment rates primarily driven by our improving asset quality metrics as well as balance sheet liquidity. Marketing costs include a $2.5 million donation to the Simmons First Foundation.
Non-interest expense for 2020 was $484.7 million, an increase of $30.8 million, or 6.8%, from 2019. Normalizing for the non-core costs, core non-interest expense for 2020 increased $52.2 million, or 12.7%, from the prior year. The increase during 2020 was largely due to additional operating costs related to the Landrum and Reliance acquisitions during 2019 and the Next Generation Banking (“NGB”) technology initiative. Incremental software and technology expenditures of $14.6 million were
primarily related to this initiative. Marketing costs include a $3.0 million donation to the Simmons First Foundation for grants to support environmental conservation projects throughout the Simmons Bank footprint.
The increase in deposit insurance expense during 2020 was due to a credit assessment received from the FDIC during the third and fourth quarters of 2019 in the amount of $4.7 million. The FDIC’s Deposit Insurance Fund Reserve Ratio reached 1.35% as of September 30, 2018, and we were notified by the FDIC that Simmons Bank was entitled to $4.0 million in assessment credits. In addition, Landmark Bank had $745,000 in assessment credits at acquisition. We were able to utilize both the Simmons Bank and Landmark Bank credits during the last half of 2019.
Amortization of intangibles recorded for the years ended December 31, 2021, 2020 and 2019, was $13.5 million, $13.5 million and $11.8 million, respectively. See Note 8, Goodwill and Other Intangible Assets, in the accompanying Notes to Consolidated Financial Statements for additional information regarding our intangibles.
Table 6 below shows non-interest expense for the years ended December 31, 2021, 2020 and 2019, respectively, as well as changes in 2021 from 2020 and in 2020 from 2019.
Table 6: Non-Interest Expense
| | | | | | | | | | | | | | | | | | | | | | | | | | | | | | | | | | | | | | | | | |
| | Years Ended December 31, | | 2021
Change from | | 2020
Change from |
| (Dollars in thousands) | 2021 | | 2020 | | 2019 | | 2020 | | 2019 |
| Salaries and employee benefits | $ | 246,335 | | | $ | 239,573 | | | $ | 224,331 | | | $ | 6,762 | | | 2.8 | % | | $ | 15,242 | | | 6.8 | % |
| Early retirement program | — | | | 2,901 | | | 3,464 | | | (2,901) | | | (100.0) | | | (563) | | | (16.3) | |
| Occupancy expense, net | 38,797 | | | 37,556 | | | 32,008 | | | 1,241 | | | 3.3 | | | 5,548 | | | 17.3 | |
| Furniture and equipment expense | 19,890 | | | 24,038 | | | 18,220 | | | (4,148) | | | (17.3) | | | 5,818 | | | 31.9 | |
Other real estate and foreclosure expense | 2,121 | | | 1,752 | | | 3,442 | | | 369 | | | 21.1 | | | (1,690) | | | (49.1) | |
| Deposit insurance | 6,973 | | | 9,184 | | | 4,416 | | | (2,211) | | | (24.1) | | | 4,768 | | | 108.0 | |
| Merger related costs | 15,911 | | | 4,531 | | | 36,379 | | | 11,380 | | | 251.2 | | | (31,848) | | | (87.6) | |
| Other operating expenses: | | | | | | | | | | | | | |
| Professional services | 18,921 | | | 18,688 | | | 16,897 | | | 233 | | | 1.3 | | | 1,791 | | | 10.6 | |
| Postage | 8,276 | | | 7,538 | | | 6,363 | | | 738 | | | 9.8 | | | 1,175 | | | 18.5 | |
| Telephone | 6,234 | | | 8,833 | | | 7,685 | | | (2,599) | | | (29.4) | | | 1,148 | | | 14.9 | |
| Credit card expenses | 11,112 | | | 10,199 | | | 9,011 | | | 913 | | | 9.0 | | | 1,188 | | | 13.2 | |
| Marketing | 22,234 | | | 19,396 | | | 16,499 | | | 2,838 | | | 14.6 | | | 2,897 | | | 17.6 | |
| Software and technology | 40,608 | | | 39,724 | | | 25,146 | | | 884 | | | 2.2 | | | 14,578 | | | 58.0 | |
| Operating supplies | 2,766 | | | 3,322 | | | 2,322 | | | (556) | | | (16.7) | | | 1,000 | | | 43.1 | |
| Amortization of intangibles | 13,494 | | | 13,495 | | | 11,805 | | | (1) | | | — | | | 1,690 | | | 14.3 | |
| Branch right sizing expense | (537) | | | 14,097 | | | 3,129 | | | (14,634) | | | (103.8) | | | 10,968 | | | * |
| Other expense | 30,454 | | | 29,909 | | | 32,843 | | | 545 | | | 1.8 | | | (2,934) | | | (8.9) | |
| Total non-interest expense | $ | 483,589 | | | $ | 484,736 | | | $ | 453,960 | | | $ | (1,147) | | | (0.2) | % | | $ | 30,776 | | | 6.8 | % |
_________________________
*Not meaningful
The provision for income taxes for 2021 was $61.3 million, compared to $64.9 million in 2020 and $64.3 million in 2019. The effective income tax rates for the years ended 2021, 2020 and 2019 were 18.4%, 20.3% and 21.2%, respectively.
Our loan portfolio averaged $11.81 billion during 2021 and $14.26 billion during 2020. As of December 31, 2021, total loans were $12.01 billion, compared to $12.90 billion on December 31, 2020, a decrease of $888.4 million, or 6.9%. The decline in the overall loan balance during 2021 reflects the tepid loan demand as a result of the economic uncertainty stemming from the COVID-19 pandemic, in addition to payoffs of PPP loans during the year. The most significant components of the loan portfolio were loans to businesses (commercial loans, commercial real estate loans and agricultural loans) and individuals (consumer loans, credit card loans and single-family residential real estate loans).
The decline in the overall loan balance discussed above was partially offset by the 2021 acquisitions of Landmark and Triumph. Our acquisition of Landmark provided $789.3 million in total loans after purchase accounting discounts. Our acquisition of Triumph provided $700.4 million in total loans after purchase accounting discounts. See Note 2, Acquisitions, in the accompanying Notes to Consolidated Financial Statements for additional information related to these acquisitions.
We seek to manage our credit risk by diversifying our loan portfolio, determining that borrowers have adequate sources of cash flow for loan repayment without liquidation of collateral, obtaining and monitoring collateral, providing an appropriate allowance for credit losses and regularly reviewing loans through the internal loan review process. The loan portfolio is diversified by borrower, purpose, industry and geographic region. We seek to use diversification within the loan portfolio to reduce credit risk, thereby minimizing the adverse impact on the portfolio, if weaknesses develop in either the economy or a particular segment of borrowers. Collateral requirements are based on credit assessments of borrowers and may be used to recover the debt in case of default. We use the allowance for credit losses as a method to value the loan portfolio at its estimated collectible amount. Loans are regularly reviewed to facilitate the identification and monitoring of deteriorating credits.
Consumer loans consist of credit card loans and other consumer loans. Consumer loans were $355.4 million at December 31, 2021, or 3.0% of total loans, compared to $391.2 million, or 3.0% of total loans at December 31, 2020. The decrease in consumer loans was primarily due to loan payoffs and pay downs due to additional customer liquidity driven by the government economic stimulus programs in response to the COVID-19 pandemic.
The credit card portfolio balance at December 31, 2021, decreased by $1.8 million when compared to the same period in 2020. Our credit card portfolio has remained a stable source of lending for several years.
Real estate loans consist of construction and development (“C&D”) loans, single family residential loans and other CRE loans. Real estate loans were $9.17 billion at December 31, 2021, or 76.3% of total loans, compared to $9.22 billion, or 71.5% of total loans at December 31, 2020, a decrease of $56.5 million, or 0.6%. Our C&D loans decreased by $269.9 million, or 16.9%, single family residential loans increased by $221.3 million, or 11.8%, and CRE loans decreased by $8.0 million, or 0.1%. The fluctuations in real estate loan balances were largely due to less activity as a result of the COVID-19 pandemic and the acquired loans during 2021. In the near term, we expect to continue to manage our C&D and CRE portfolio concentration by developing deeper relationships with our customers.
Commercial loans consist of non-real estate loans related to business and agricultural loans. Total commercial loans were $2.16 billion at December 31, 2021, or 18.0% of total loans, compared to $2.75 billion, or 21.3% of total loans at December 31, 2020, a decrease of $589.5 million, or 21.4%. During 2021, we originated $318.9 million under the PPP Round 2 program. Our non-agricultural commercial loan portfolio decreased overall during 2021 due to the expected reimbursements from the SBA related to PPP loan forgiveness of both PPP Round 1 and Round 2 loans, totaling $1.12 billion in 2021. As of December 31, 2021, the balance in our PPP loan portfolio was $116.7 million.
Loan demand appears to be returning to more normalized levels. For the fifth consecutive quarter, we experienced an increase in commercial loan demand. Our loan pipeline consisting of all loan opportunities was $2.31 billion at December 31, 2021 compared to $673.7 million at December 31, 2020. The pipeline includes $619.6 million in loans approved and ready to close at the end of the year.
Other loans mainly consists of mortgage warehouse lending. Mortgage volume, while still strong, declined during 2021 when compared to 2020, leading to a decrease of $206.5 million in other loans primarily from mortgage warehouse lines of credit.
The balances of loans outstanding at the indicated dates are reflected in Table 7, according to type of loan.
Table 7: Loan Portfolio
| | | | | | | | | | | | | | | | | | | | | | | | | | | | | |
| | Years Ended December 31, |
| (In thousands) | 2021 | | 2020 | | 2019 | | 2018 | | 2017 |
| Consumer: | | | | | | | | | |
| Credit cards | $ | 187,052 | | | $ | 188,845 | | | $ | 204,802 | | | $ | 204,173 | | | $ | 185,422 | |
| Other consumer | 168,318 | | | 202,379 | | | 249,694 | | | 215,763 | | | 336,393 | |
| Total consumer | 355,370 | | | 391,224 | | | 454,496 | | | 419,936 | | | 521,815 | |
| Real Estate: | | | | | | | | | |
| Construction and development | 1,326,371 | | | 1,596,255 | | | 2,236,861 | | | 1,736,817 | | | 1,296,698 | |
| Single family residential | 2,101,975 | | | 1,880,673 | | | 2,442,064 | | | 1,994,716 | | | 1,934,167 | |
| Other commercial | 5,738,904 | | | 5,746,863 | | | 6,205,599 | | | 5,073,994 | | | 4,881,415 | |
| Total real estate | 9,167,250 | | | 9,223,791 | | | 10,884,524 | | | 8,805,527 | | | 8,112,280 | |
| Commercial: | | | | | | | | | |
| Commercial | 1,992,043 | | | 2,574,386 | | | 2,495,516 | | | 2,192,497 | | | 1,809,374 | |
| Agricultural | 168,717 | | | 175,905 | | | 315,454 | | | 166,225 | | | 156,244 | |
| Total commercial | 2,160,760 | | | 2,750,291 | | | 2,810,970 | | | 2,358,722 | | | 1,965,618 | |
| Other | 329,123 | | | 535,591 | | | 275,714 | | | 139,081 | | | 180,390 | |
| Total loans before allowance for credit losses | $ | 12,012,503 | | | $ | 12,900,897 | | | $ | 14,425,704 | | | $ | 11,723,266 | | | $ | 10,780,103 | |
Table 8 reflects the remaining maturities and interest rate sensitivity of loans at December 31, 2021.
Table 8: Maturity and Interest Rate Sensitivity of Loans
| | | | | | | | | | | | | | | | | | | | | | | | | | | | | |
| | 1 year | | Over 1 year through | | Over 5 years through | | Over | | |
| (In thousands) | or less | | 5 years | | 15 years | | 15 years | | Total |
| Consumer | $ | 197,763 | | | $ | 142,041 | | | $ | 96 | | | $ | 15,470 | | | $ | 355,370 | |
| Real estate | 3,722,185 | | | 4,931,856 | | | 459,453 | | | 53,756 | | | 9,167,250 | |
| Commercial | 1,291,316 | | | 798,768 | | | 48,115 | | | 22,561 | | | 2,160,760 | |
| Other | 329,123 | | | — | | | — | | | — | | | 329,123 | |
| Total | $ | 5,540,387 | | | $ | 5,872,665 | | | $ | 507,664 | | | $ | 91,787 | | | $ | 12,012,503 | |
| | | | | | | | | |
| Predetermined rate | | | | | | | | | |
| Consumer | $ | 110,600 | | | $ | 37,701 | | | $ | 11 | | | $ | 15,470 | | | $ | 163,782 | |
| Real estate | 2,056,889 | | | 2,922,518 | | | 208,010 | | | 49,927 | | | 5,237,344 | |
| Commercial | 613,045 | | | 356,825 | | | 23,368 | | | 3,499 | | | 996,737 | |
| Other | 99,217 | | | — | | | — | | | — | | | 99,217 | |
| Total | $ | 2,879,751 | | | $ | 3,317,044 | | | $ | 231,389 | | | $ | 68,896 | | | $ | 6,497,080 | |
| | | | | | | | | |
| Floating rate | | | | | | | | | |
| Consumer | $ | 87,163 | | | $ | 104,340 | | | $ | 85 | | | $ | — | | | $ | 191,588 | |
| Real estate | 1,665,296 | | | 2,009,338 | | | 251,443 | | | 3,829 | | | 3,929,906 | |
| Commercial | 678,271 | | | 441,943 | | | 24,747 | | | 19,062 | | | 1,164,023 | |
| Other | 229,906 | | | — | | | — | | | — | | | 229,906 | |
| Total | $ | 2,660,636 | | | $ | 2,555,621 | | | $ | 276,275 | | | $ | 22,891 | | | $ | 5,515,423 | |
Non-performing loans are comprised of (a) nonaccrual loans, (b) loans that are contractually past due 90 days and (c) other loans for which terms have been restructured to provide a reduction or deferral of interest or principal, because of deterioration in the financial position of the borrower. The subsidiary bank recognizes income principally on the accrual basis of accounting. When loans are classified as nonaccrual, generally, the accrued interest is charged off and no further interest is accrued. Loans, excluding credit card loans, are placed on a nonaccrual basis either: (1) when there are serious doubts regarding the collectibility of principal or interest, or (2) when payment of interest or principal is 90 days or more past due and either (i) not fully secured or (ii) not in the process of collection. If a loan is determined by management to be uncollectible, the portion of the loan determined to be uncollectible is then charged to the allowance for credit losses.
When credit card loans reach 90 days past due and there are attachable assets, the accounts are considered for litigation. Credit card loans are generally charged off when payment of interest or principal exceeds 150 days past due. The credit card recovery group pursues account holders until it is determined, on a case-by-case basis, to be uncollectible.
Total non-performing assets decreased $67.6 million from December 31, 2020 to December 31, 2021. Nonaccrual loans decreased by $54.7 million during 2021, in addition to a decrease in foreclosed assets held for sale of $12.4 million. The decrease in nonaccrual loans was primarily due to an overall improvement in economic conditions while the decrease in foreclosed assets held for sale and other real estate owned is primarily the result of the disposition of one commercial building in the St. Louis area and the disposition of one piece of commercial land with net book values at the time of sale of $6.5 million and $2.8 million, respectively.
Non-performing assets, including troubled debt restructurings (“TDRs”) and acquired foreclosed assets, as a percent of total assets were 0.33% at December 31, 2021 compared to 0.66% at December 31, 2020.
Total non-performing assets increased by $28.6 million from December 31, 2019 to December 31, 2020. Nonaccrual loans increased by $29.5 million during 2020, partially offset by a decrease in foreclosed assets held for sale of $728,000. The increase in nonaccrual loans during 2020 is primarily related to one energy loan totaling $22.0 million which moved to nonaccrual during the fourth quarter of 2020. The remaining increase was related to various other CRE loans and commercial loan relationships.
Total non-performing assets increased by $33.1 million from December 31, 2018 to December 31, 2019. Nonaccrual loans increased by $37.5 million during 2019, primarily commercial loans, partially offset by a decrease in foreclosed assets held for sale decreased by $6.4 million.
Total non-performing assets decreased by $23.2 million from December 31, 2017, to December 31, 2018. Nonaccrual loans decreased by $13.3 million during 2018, primarily commercial loans. Foreclosed assets held for sale decreased by $6.6 million.
During 2018, we sold approximately $32 million of substandard rated loans that consisted of both legacy and acquired loans. The loans had adequate reserves, thus no provision expense was required. However, the sale increased net charge-offs by approximately $4.6 million.
From time to time, including in connection with the COVID-19 pandemic, certain borrowers are experiencing declines in income and cash flow. As a result, these borrowers are seeking to reduce contractual cash outlays, the most prominent being debt payments. In an effort to preserve our net interest margin and earning assets, we are open to working with existing customers in order to maximize the collectibility of the debt.
When we restructure a loan to a borrower that is experiencing financial difficulty and grant a concession that we would not otherwise consider, a “troubled debt restructuring,” or “TDR,” results and the Company classifies the loan as a TDR. The Company grants various types of concessions, primarily interest rate reduction and/or payment modifications or extensions, with an occasional forgiveness of principal.
Once an obligation has been restructured because of such credit problems, it continues to be considered a TDR until paid in full; or, if an obligation yields a market interest rate and no longer has any concession regarding payment amount or amortization, then it is not considered a TDR at the beginning of the calendar year after the year in which the improvement takes place. Our TDR balance decreased to $6.9 million at December 31, 2021 compared to $7.5 million at December 31, 2020, and increased slightly when compared to $7.4 million at December 31, 2019.
TDRs are individually evaluated for expected credit losses. We assess the exposure for each modification, either by the fair value of the underlying collateral or the present value of expected cash flows, and determine if a specific allowance for credit losses is needed.
We return TDRs to accrual status only if (1) all contractual amounts due can reasonably be expected to be repaid within a prudent period, and (2) repayment has been in accordance with the contract for a sustained period, typically at least six months.
The provisions in the CARES Act included an election to not apply the guidance on accounting for TDRs to loan modifications, such as extensions or deferrals, related to COVID-19 made between March 1, 2020 and the earlier of (i) December 31, 2020 or (ii) 60 days after the President terminates the COVID-19 national emergency declaration. The relief can only be applied to modifications for borrowers that were not more than 30 days past due as of December 31, 2019. The Company elected to adopt these provisions of the CARES Act and is following the Interagency Statement on Loan Modifications and Reporting for Financial Institutions Working with Customers Affected by the Coronavirus (Revised) issued by regulatory agencies. In response to the concerns related to the expiration of the applicable period for which the election to not apply the guidance on accounting for TDRs to loan modifications, the CARES Act was amended in late fourth quarter of 2020 to extend COVID-19 relief related to loan modifications from the earlier of (i) January 1, 2022 or (ii) 60 days after the President terminates the COVID-19 national emergency declaration. As of December 31, 2021, the Company had 51 COVID-19 loan modifications outstanding with an aggregate principal amount of $8.6 million.
We continue to maintain good asset quality, compared to the industry. Strong asset quality remains a primary focus of our company. The allowance for credit losses as a percent of total loans was 1.71% as of December 31, 2021. Non-performing loans equaled 0.57% of total loans. Non-performing assets were 0.31% of total assets, a 33 basis point increase from December 31, 2020. The allowance for credit losses was 300% of non-performing loans. Our annualized net charge-offs to total loans for 2021 was 0.13%. Excluding credit cards, the annualized net charge-offs to total loans for the same period was 0.11%. Annualized net credit card charge-offs to total credit card loans were 1.40%, compared to 1.60% during 2020, and 27 basis points better than the most recently published industry average charge-off ratio as reported by the Federal Reserve for all banks.
We do not own any securities backed by subprime mortgage assets, and offer no mortgage loan products that target subprime borrowers.
Table 9 presents information concerning non-performing assets, including nonaccrual loans at amortized cost and foreclosed assets held for sale.
Table 9: Non-performing Assets
| | | | | | | | | | | | | | | | | | | | | | | | | | | | | |
| | Years Ended December 31, |
| (Dollars in thousands) | 2021 | | 2020 | | 2019 | | 2018 | | 2017 |
Nonaccrual loans (1) | $ | 68,204 | | | $ | 122,879 | | | $ | 93,330 | | | $ | 55,841 | | | $ | 69,127 | |
| Loans past due 90 days or more (principal or interest payments) | 349 | | | 578 | | | 856 | | | 226 | | | 3,488 | |
| Total non-performing loans | 68,553 | | | 123,457 | | | 94,186 | | | 56,067 | | | 72,615 | |
| Other non-performing assets: | | | | | | | | | |
| Foreclosed assets held for sale and other real estate owned | 6,032 | | | 18,393 | | | 19,121 | | | 25,565 | | | 32,118 | |
| Other non-performing assets | 1,667 | | | 2,016 | | | 1,964 | | | 553 | | | 675 | |
| Total other non-performing assets | 7,699 | | | 20,409 | | | 21,085 | | | 26,118 | | | 32,793 | |
| Total non-performing assets | $ | 76,252 | | | $ | 143,866 | | | $ | 115,271 | | | $ | 82,185 | | | $ | 105,408 | |
| | | | | | | | | |
| Performing TDRs | $ | 4,289 | | | $ | 3,138 | | | $ | 5,887 | | | $ | 7,436 | | | $ | 7,925 | |
| Allowance for credit losses to non-performing loans | 300 | % | | 193 | % | | 72 | % | | 101 | % | | 58 | % |
| Non-performing loans to total loans | 0.57 | % | | 0.96 | % | | 0.65 | % | | 0.48 | % | | 0.67 | % |
| Non-performing assets (including performing TDRs) to total assets | 0.33 | % | | 0.66 | % | | 0.57 | % | | 0.54 | % | | 0.75 | % |
| Non-performing assets to total assets | 0.31 | % | | 0.64 | % | | 0.54 | % | | 0.50 | % | | 0.70 | % |
_________________________
(1) Includes nonaccrual TDRs of approximately $2.7 million, $4.4 million, $1.6 million, $6.3 million and $3.4 million at December 31, 2021, 2020, 2019, 2018 and 2017, respectively.
There was no interest income on nonaccrual loans recorded for the years ended December 31, 2021, 2020 and 2019.
Allowance for Credit Losses
The allowance for credit losses is a reserve established through a provision for credit losses charged to expense which represents management’s best estimate of lifetime expected losses based on reasonable and supportable forecasts, historical loss experience, and other qualitative considerations.
Loans with similar risk characteristics such as loan type, collateral type, and internal risk ratings are aggregated into homogeneous segments for assessment. Reserve factors are based on estimated probability of default and loss given default for each segment. The estimates are determined based on economic forecasts over the reasonable and supportable forecast period based on projected performance of economic variables that have a statistical correlation with the historical loss experience of the segments. For contractual periods that extend beyond the one-year forecast period, the estimates revert to average historical loss experiences over a one-year period on a straight-line basis.
We also include qualitative adjustments to the allowance based on factors and considerations that have not otherwise been fully accounted for. Qualitative adjustments include, but are not limited to:
•Changes in asset quality - Adjustments related to trending credit quality metrics including delinquency, nonperforming loans, charge-offs, and risk ratings that may not be fully accounted for in the reserve factor.
•Changes in the nature and volume of the portfolio - Adjustments related to current changes in the loan portfolio that are not fully represented or accounted for in the reserve factors.
•Changes in lending and loan monitoring policies and procedures - Adjustments related to current changes in lending and loan monitoring procedures as well as review of specific internal policy compliance metrics.
•Changes in the experience, ability, and depth of lending management and other relevant staff - Adjustments to measure increasing or decreasing credit risk related to lending and loan monitoring management.
•Changes in the value of underlying collateral of collateralized loans - Adjustments related to improving or deterioration of the value of underlying collateral that are not fully captured in the reserve factors.
•Changes in and the existence and effect of any concentrations of credit - Adjustments related to credit risk of specific industries that are not fully captured in the reserve factors.
•Changes in regional and local economic and business conditions and developments - Adjustments related to expected and current economic conditions at a regional or local-level that are not fully captured within our reasonable and supportable forecast.
•Data imprecisions due to limited historical loss data - Adjustments related to limited historical loss data that is representative of the collective loan portfolio.
Loans that do not share similar risk characteristics are evaluated on an individual basis. These evaluations are typically performed on loans with a deteriorated internal risk rating or that are classified as a TDR. The allowance for credit loss is determined based on several methods including estimating the fair value of the underlying collateral or the present value of expected cash flows.
Additional information related to net charge-offs is shown in Table 10.
Table 10: Ratio of Net Charge-offs to Average Loans
| | | | | | | | | | | | | | | | | |
| (Dollars in thousands) | Net Charge-offs | | Average Loans | | Ratio of Net Charge-offs to Average Loans |
| 2021 | | | | | |
| Credit cards | $ | (2,577) | | | $ | 180,975 | | | (1.42) | % |
| Other consumer | (649) | | | 181,573 | | | (0.36) | % |
| Real estate | (5,781) | | | 8,678,137 | | | (0.07) | % |
| Commercial | (5,953) | | | 2,363,701 | | | (0.25) | % |
| Other | — | | | 406,094 | | | — | % |
| Total | $ | (14,960) | | | $ | 11,810,480 | | | (0.13) | % |
| | | | | |
| 2020 | | | | | |
| Credit cards | $ | (3,099) | | | $ | 189,488 | | | (1.64) | % |
| Other consumer | (2,557) | | | 223,347 | | | (1.14) | % |
| Real estate | (12,883) | | | 10,487,469 | | | (0.12) | % |
| Commercial | (45,520) | | | 2,894,537 | | | (1.57) | % |
| Other | — | | | 465,848 | | | — | % |
| Total | $ | (64,059) | | | $ | 14,260,689 | | | (0.45) | % |
| | | | | |
Allowance for Credit Losses Allocation
As of December 31, 2021, the allowance for credit losses reflected a decrease of approximately $32.7 million from December 31, 2020 while loans decreased $888.4 million over the same period. The allocation in each category within the allowance generally reflects the overall changes in the loan portfolio mix. During the first quarter of 2020, we recorded an additional allowance for credit losses for loans of approximately $151.4 million due to the adoption of CECL.
The significant impact to the allowance for credit losses at the date of CECL’s adoption was driven by the substantial amount of loans acquired held by the Company. We had approximately one third of total loans categorized as acquired at the adoption date with very little reserve allocated to them due to the previous incurred loss impairment methodology. As such, the amount of the CECL adoption impact was greater on the Company when compared to a non-acquisitive bank.
The decrease in the allowance for credit losses during 2021 was predominately related to economic recovery from the effects of the COVID-19 pandemic and the decline in our loan portfolio. While the economic conditions appear to be improving, certain industries continue to be more adversely impacted than others by this pandemic, such as the restaurant, retail and hotel industries, and there remains uncertainty regarding how borrowers in these industries will recover. Our allowance for credit losses at December 31, 2021 was considered appropriate given the considerable amount of uncertainty as to the structure and timing of potential economic recovery, the impact of new COVID-19 variants, future of government assistance related to COVID-19 recovery efforts and other related factors.
The following table sets forth the sum of the amounts of the allowance for credit losses attributable to individual loans within each category, or loan categories in general. The table also reflects the percentage of loans in each category to the total loan portfolio for each of the periods indicated. The allowance for credit losses by loan category is determined by i) our estimated reserve factors by category including applicable qualitative adjustments and ii) any specific allowance allocations that are identified on individually evaluated loans. The amounts shown are not necessarily indicative of the actual future losses that may occur within individual categories.
Table 11: Allocation of Allowance for Credit Losses
| | | | | | | | | | | | | | | | | | | | | | | | | | | | | | | | | | | | | | | | | | | | | | | | | | | | | | | | | | | |
| | December 31, |
| | 2021 | | 2020 | | 2019 | | 2018 | | 2017 |
| (Dollars in thousands) | Allowance Amount | | % of loans (1) | | Allowance Amount | | % of loans (1) | | Allowance Amount | | % of loans (1) | | Allowance Amount | | % of loans (1) | | Allowance Amount | | % of loans (1) |
| Credit cards | $ | 3,987 | | | 1.6% | | $ | 7,472 | | | 1.4% | | $ | 4,051 | | | 1.4% | | $ | 3,923 | | | 1.7% | | $ | 3,784 | | | 1.7% |
| Other consumer | 2,676 | | | 1.4% | | 4,100 | | | 1.6% | | 1,998 | | | 1.7% | | 2,380 | | | 1.9% | | 3,489 | | | 3.1% |
| Real estate | 179,270 | | | 76.3% | | 182,868 | | | 71.5% | | 39,161 | | | 75.5% | | 29,838 | | | 75.1% | | 27,699 | | | 75.3% |
| Commercial | 17,458 | | | 18.0% | | 42,093 | | | 21.3% | | 22,863 | | | 19.5% | | 20,514 | | | 20.1% | | 7,007 | | | 18.2% |
| Other | 1,941 | | | 2.7% | | 1,517 | | | 4.2% | | 171 | | | 1.9% | | 39 | | | 1.2% | | 107 | | | 1.7% |
| Total | $ | 205,332 | | | 100.0% | | $ | 238,050 | | | 100.0% | | $ | 68,244 | | | 100.0% | | $ | 56,694 | | | 100.0% | | $ | 42,086 | | | 100.0% |
| | | | | | | | | | | | | | | | | | | |
| Allowance for credit losses to period-end loans | 1.71 | % | | | | 1.85 | % | | | | 0.47 | % | | | | 0.48 | % | | | | 0.39 | % | | |
_________________________
(1) Percentage of loans in each category to total loans.
| | |
| Investments and Securities |
Our securities portfolio is the second largest component of earning assets and provides a significant source of revenue. Securities within the portfolio are classified as either held-to-maturity (“HTM”), available-for-sale (“AFS”) or trading.
HTM securities, which include any security for which we have the positive intent and ability to hold until maturity, are carried at historical cost adjusted for amortization of premiums and accretion of discounts. Premiums and discounts are amortized and accreted, respectively, to interest income using the constant effective yield method over the security’s estimated life. Prepayments are anticipated for mortgage-backed and SBA securities. Premiums on callable securities are amortized to their earliest call date.
AFS securities, which include any security for which the Company has no immediate plan to sell but which may be sold in the future, are carried at fair value. Realized gains and losses, based on specifically identified amortized cost of the individual security, are included in other income. Unrealized gains and losses are recorded, net of related income tax effects, in stockholders’ equity. Premiums and discounts are amortized and accreted, respectively, to interest income using the constant effective yield method over the estimated life of the security. Prepayments are anticipated for mortgage-backed and SBA securities. Premiums on callable securities are amortized to their earliest call date.
Our philosophy regarding investments is conservative based on investment type and maturity. Investments in the portfolio primarily include U.S. Treasury securities, U.S. Government agencies, mortgage-backed securities and municipal securities. Our general policy is not to invest in derivative type investments or high-risk securities, except for collateralized mortgage-backed securities for which collection of principal and interest is not subordinated to significant superior rights held by others.
HTM and AFS investment securities were $1.53 billion and $7.1 billion, respectively, at December 31, 2021, compared to the HTM amount of $333.0 million and AFS amount of $3.47 billion at December 31, 2020.
As of December 31, 2021, $597.3 million, or 6.9%, of our total portfolio was invested in obligations of U.S. government agencies, 0.2% of which will mature in one year or less.
Our investment portfolio as of December 31, 2021 also included $3.03 billion, or 35.1%, of tax-exempt obligations of state and political subdivisions. A portion of the state and political subdivision debt obligations are rated bonds, primarily issued in states in which we are located, and are evaluated on an ongoing basis. During 2020 in an effort to balance our interest risk profile, we decided to increase our asset allocation in the tax-exempt securities portfolio due to the acceleration of pre-payment speeds for mortgage-backed securities. We continue to invest in high credit tax-exempt securities with a weighted average rating of AA. There are no securities of any one state or political subdivision issuer exceeding ten percent of our stockholders’ equity at December 31, 2021.
We had approximately $4.52 billion, or 52.3%, of our total portfolio invested in mortgaged-backed securities at December 31, 2021. These mortgage-backed securities were issued by agencies of the U.S. government.
As anticipated, our security portfolio increased during 2021 as we reinvested PPP loan repayments and utilized additional liquidity held in cash and cash equivalents. During 2021, we purchased $5.27 billion of investment securities. We will continue to look for opportunities to maximize the value of the investment portfolio.
During the third quarter of 2021, we began utilizing interest rate swaps designated as fair value hedges to mitigate the effect of changing interest rates on the fair values of $1.0 billion of fixed rate callable municipal securities held in the AFS portfolio. These swap agreements involve the payment of fixed interest rates with a weighted average of 1.21% in exchange for variable interest rates based on federal funds rates and consist of a two year forward start date and maturity dates varying between 2028 and 2029.
Additionally, during the third quarter of 2021, we transferred, at fair value, $500.8 million of securities from the AFS portfolio to the HTM portfolio. The related net unrealized gains of $1.0 million remained in accumulated other comprehensive income (loss) at December 31, 2021 and will be amortized over the remaining life of the securities. No gains or losses on these securities were recognized at the time of transfer.
The adoption of ASU 2016-13 at the beginning of 2020 required us to replace the existing impairment models for financial assets, which includes investment securities. Under this model, an estimate of expected credit losses that represents all contractual cash flows that is deemed uncollectible over the contractual life of the financial asset must be recorded. Based upon our analysis of the underlying risk characteristics of the AFS portfolio, including credit ratings and other qualitative factors, no allowance for credit losses related to AFS securities was deemed necessary at December 31, 2021. Our allowance for credit losses related to HTM
securities was $1.3 million at December 31, 2021. Our allowance for credit losses related to HTM and AFS securities was $2.9 million and $312,000, respectively, at December 31, 2020.
An allowance for credit losses related to mortgage-backed securities and U.S. government agencies was not recorded as of December 31, 2021 due to those securities being explicitly or implicitly guaranteed by the U.S. government, are highly rated by major rating agencies and have a long history of no credit losses. See Note 3, Investment Securities, in the accompanying Notes to Consolidated Financial Statements for additional information related to our allowance for credit losses on investment securities held.
We had $15.9 million of gross realized gains and $422,000 of gross realized losses from the sale of securities during the year ended December 31, 2021 compared to $54.8 million of gross realized gains and $15,000 of gross realized losses from the sale of securities during the year ended December 31, 2020.
We have the ability and intent to hold the securities classified as HTM until they mature, at which time we expect to receive full value for the securities. The contractual terms of those investments do not permit the issuer to settle the securities at a price less than the amortized cost bases of the investments. Furthermore, as of December 31, 2021, we also had the ability and intent to hold the securities classified as AFS for a period of time sufficient for a recovery of cost. The unrealized losses are largely due to increases in market interest rates over the yields available at the time the underlying securities were purchased. The fair value is expected to recover as the bonds approach their maturity date or repricing date or if market yields for such investments decline. We do not believe any of the securities are impaired due to reasons of credit quality. Accordingly, as of December 31, 2021, we believe the declines in fair value detailed in the table below are temporary.
Table 12 presents the amortized cost, fair value and allowance for credit losses on investment securities for each of the years indicated.
Table 12: Investment Securities
| | | | | | | | | | | | | | | | | | | | | | | | | | | | | | | | | | | |
| (In thousands) | Amortized Cost | | Allowance
for Credit Losses | | Net Carrying Amount | | Gross Unrealized
Gains | | Gross Unrealized
(Losses) | | Estimated Fair
Value |
| Held-to-maturity | | | | | | | | | | | |
| | | | | | | | | | | |
| December 31, 2021 | | | | | | | | | | | |
| U.S. Government agencies | $ | 232,609 | | | $ | — | | | $ | 232,609 | | | $ | — | | | $ | (7,914) | | | $ | 224,695 | |
| Mortgage-backed securities | 70,342 | | | — | | | 70,342 | | | 232 | | | (1,425) | | | 69,149 | |
| State and political subdivisions | 1,210,248 | | | (1,197) | | | 1,209,051 | | | 6,166 | | | (8,462) | | | 1,206,755 | |
| Other securities | 17,301 | | | (82) | | | 17,219 | | | — | | | (440) | | | 16,779 | |
| Total HTM | $ | 1,530,500 | | | $ | (1,279) | | | $ | 1,529,221 | | | $ | 6,398 | | | $ | (18,241) | | | $ | 1,517,378 | |
| | | | | | | | | | | |
| December 31, 2020 | | | | | | | | | | | |
| Mortgage-backed securities | $ | 22,354 | | | $ | — | | | $ | 22,354 | | | $ | 683 | | | $ | — | | | $ | 23,037 | |
| State and political subdivisions | 312,416 | | | (2,307) | | | 310,109 | | | 8,148 | | | (30) | | | 318,227 | |
| Other securities | 1,176 | | | (608) | | | 568 | | | 93 | | | — | | | 661 | |
| Total HTM | $ | 335,946 | | | $ | (2,915) | | | $ | 333,031 | | | $ | 8,924 | | | $ | (30) | | | $ | 341,925 | |
| | | | | | | | | | | | | | | | | | | | | | | | | | | | | | | | | | | |
| (In thousands) | Amortized
Cost | | Allowance for Credit Losses | | Gross Unrealized
Gains | | Gross Unrealized
(Losses) | | Estimated Fair
Value | | |
| Available-for-sale | | | | | | | | | | | |
| | | | | | | | | | | |
| December 31, 2021 | | | | | | | | | | | |
| U.S. Treasury | $ | 300 | | | $ | — | | | $ | — | | | $ | — | | | $ | 300 | | | |
| U.S. Government agencies | 374,754 | | | — | | | 495 | | | (10,608) | | | 364,641 | | | |
| Mortgage-backed securities | 4,485,548 | | | — | | | 6,307 | | | (43,239) | | | 4,448,616 | | | |
| State and political subdivisions | 1,791,097 | | | — | | | 30,556 | | | (1,995) | | | 1,819,658 | | | |
| Other securities | 479,162 | | | — | | | 6,647 | | | (5,479) | | | 480,330 | | | |
| Total AFS | $ | 7,130,861 | | | $ | — | | | $ | 44,005 | | | $ | (61,321) | | | $ | 7,113,545 | | | |
| | | | | | | | | | | |
| December 31, 2020 | | | | | | | | | | | |
| U.S. Government agencies | $ | 477,693 | | | $ | — | | | $ | 844 | | | $ | (1,300) | | | $ | 477,237 | | | |
| Mortgage-backed securities | 1,374,769 | | | — | | | 21,261 | | | (1,094) | | | 1,394,936 | | | |
| State and political subdivisions | 1,416,136 | | | (217) | | | 55,111 | | | (307) | | | 1,470,723 | | | |
| Other securities | 128,445 | | | (95) | | | 2,447 | | | (95) | | | 130,702 | | | |
| Total AFS | $ | 3,397,043 | | | $ | (312) | | | $ | 79,663 | | | $ | (2,796) | | | $ | 3,473,598 | | | |
Table 13 reflects the amortized cost and estimated fair value of securities at December 31, 2021, by contractual maturity and the weighted average yields (for tax-exempt obligations on a fully taxable equivalent basis, assuming a 26.135% tax rate) of such securities. Expected maturities will differ from contractual maturities because borrowers may have the right to call or prepay obligations, with or without call or prepayment penalties.
Table 13: Maturity Distribution of Investment Securities
| | | | | | | | | | | | | | | | | | | | | | | | | | | | | | | | | | | | | | | | | | | | | | | |
| | December 31, 2021 |
| | | | Over | | Over | | | | | | | | | | |
| | | | 1 year | | 5 years | | | | | | Total |
| | 1 year | | through | | through | | Over | | No fixed | | Amortized | | Par | | Fair |
| (In thousands) | or less | | 5 years | | 10 years | | 10 years | | maturity | | Cost | | Value | | Value |
| Held-to-Maturity | | | | | | | | | | | | | | | |
| U.S. Government agencies | $ | — | | $ | — | | $ | — | | $ | 232,609 | | $ | — | | $ | 232,609 | | $ | 236,350 | | | $ | 224,695 | |
| Mortgage-backed securities | — | | — | | — | | — | | 70,342 | | 70,342 | | 68,730 | | | 69,149 | |
| State and political subdivisions | 5,333 | | 4,801 | | 9,780 | | 1,190,334 | | — | | 1,210,248 | | 1,199,362 | | | 1,206,755 | |
| Other securities | — | | — | | 17,301 | | — | | — | | 17,301 | | 16,958 | | | 16,779 | |
| Total | $ | 5,333 | | $ | 4,801 | | $ | 27,081 | | $ | 1,422,943 | | | $ | 70,342 | | $ | 1,530,500 | | $ | 1,521,400 | | | $ | 1,517,378 | |
| | | | | | | | | | | | | | | |
| Percentage of total | 0.4 | % | | 0.3 | % | | 1.8 | % | | 92.9 | % | | 4.6 | % | | 100.0 | % | | | | |
| | | | | | | | | | | | | | | |
| Weighted average yield | 2.7 | % | | 3.1 | % | | 2.5 | % | | 2.0 | % | | 1.7 | % | | 2.0 | % | | | | |
| | | | | | | | | | | | | | | |
| Available-for-Sale | | | | | | | | | | | | | | | |
| U.S. Treasury | $ | 300 | | $ | — | | $ | — | | $ | — | | $ | — | | $ | 300 | | $ | 300 | | | $ | 300 | |
| U.S. Government agencies | — | | 12,431 | | 105,787 | | 256,536 | | — | | 374,754 | | 372,018 | | | 364,641 | |
| Mortgage-backed securities | — | | — | | — | | — | | 4,485,548 | | 4,485,548 | | 4,370,613 | | | 4,448,616 | |
| State and political subdivisions | 7,521 | | 17,229 | | 23,282 | | 1,743,065 | | — | | 1,791,097 | | 1,704,788 | | | 1,819,658 | |
| Other securities | — | | 31,796 | | 403,016 | | 43,725 | | 625 | | 479,162 | | 470,867 | | | 480,330 | |
| Total | $ | 7,821 | | $ | 61,456 | | $ | 532,085 | | $ | 2,043,326 | | | $ | 4,486,173 | | | $ | 7,130,861 | | | $ | 6,918,586 | | | $ | 7,113,545 | |
| | | | | | | | | | | | | | | |
| Percentage of total | 0.1 | % | | 0.9 | % | | 7.5 | % | | 28.6 | % | | 62.9 | % | | 100.0 | % | | | | |
| | | | | | | | | | | | | | | |
| Weighted average yield | 1.9 | % | | 1.5 | % | | 2.6 | % | | 2.1 | % | | 1.0 | % | | 1.4 | % | | | | |
Deposits are our primary source of funding for earning assets and are primarily developed through our network of approximately 199 financial centers. We offer a variety of products designed to attract and retain customers with a continuing focus on developing core deposits. Our core deposits consist of all deposits excluding time deposits of more than $250,000 and brokered deposits. As of December 31, 2021, core deposits comprised 93.5% of our total deposits.
We continually monitor the funding requirements along with competitive interest rates in the markets we serve. Because of our community banking philosophy, our executives in the local markets, with oversight by the Asset Liability Committee and the Bank’s Treasury Department, establish the interest rates offered on both core and non-core deposits. This approach ensures that the interest rates being paid are competitively priced for each particular deposit product and structured to meet the funding requirements. We believe we are paying a competitive rate when compared with pricing in those markets.
We manage our interest expense through deposit pricing. We believe that additional funds can be attracted and deposit growth can be accelerated through deposit pricing if we experience increased loan demand or other liquidity needs. We can also utilize brokered deposits as an additional source of funding to meet liquidity needs. We are continually monitoring and looking for opportunities to fairly reprice our deposits while remaining competitive in this current challenging rate environment.
Our total deposits as of December 31, 2021, were $19.37 billion, an increase of $2.38 billion from December 31, 2020. The 2021 acquisitions of Landmark and Triumph contributed $1.52 billion to this increase. Non-interest bearing transaction accounts, interest bearing transaction accounts and savings accounts totaled $16.91 billion at December 31, 2021, compared to $14.15 billion at December 31, 2020, a $2.76 billion increase. Total time deposits decreased $379.9 million to $2.45 billion at December 31, 2021, from $2.83 billion at December 31, 2020. We had $466.0 million and $512.3 million of brokered deposits at December 31, 2021, and December 31, 2020, respectively. Our uninsured deposits as of December 31, 2021 and 2020 were $7.48 billion and $5.98 billion, respectively.
Both consumer and commercial deposit balances have grown since the COVID-19 related the various economic stimulus legislation packages. We are managing our balance sheet and our net interest margin by continuing to eliminate several high-cost deposits related to public funds and brokered deposits as well as hone our product offerings to give customers flexibility of choice while maintaining the ability to adjust interest rates timely in the current rate environment.
Table 14 reflects the classification of the average deposits and the average rate paid on each deposit category which is in excess of 10 percent of average total deposits for the three years ended December 31, 2021.
Table 14: Average Deposit Balances and Rates
| | | | | | | | | | | | | | | | | | | | | | | | | | | | | | | | | | | |
| | December 31, |
| | 2021 | | 2020 | | 2019 |
| (In thousands) | Average Amount | | Average Rate Paid | | Average Amount | | Average Rate Paid | | Average Amount | | Average Rate Paid |
| Non-interest bearing transaction accounts | $ | 4,836,839 | | | — | % | | $ | 4,225,618 | | | — | % | | $ | 3,021,917 | | | — | % |
Interest bearing transaction and savings deposits | 10,638,665 | | | 0.18 | % | | 9,128,936 | | | 0.42 | % | | 7,417,104 | | | 1.08 | % |
| Time deposits | 2,804,851 | | | 0.77 | % | | 3,006,768 | | | 1.38 | % | | 3,094,094 | | | 1.90 | % |
| Total | $ | 18,280,355 | | | 0.23 | % | | $ | 16,361,322 | | | 0.49 | % | | $ | 13,533,115 | | | 1.03 | % |
The Company’s maturities of time deposits not covered by deposit insurance at December 31, 2021 are presented in Table 15.
Table 15: Maturities of Time Deposits Not Covered by Deposit Insurance
| | | | | | | | | | | |
| December 31, 2021 |
| (In thousands) | Balance | | Percent |
| Maturing | | | |
| Three months or less | $ | 196,897 | | | 39.6 | % |
| Over 3 months to 6 months | 101,374 | | | 20.4 | % |
| Over 6 months to 12 months | 111,881 | | | 22.5 | % |
| Over 12 months | 87,472 | | | 17.6 | % |
| Total | $ | 497,624 | | | 100.0 | % |
| | |
| Federal Funds Purchased and Securities Sold Under Agreements to Repurchase |
Federal funds purchased and securities sold under agreements to repurchase were $185.4 million at December 31, 2021, as compared to $299.1 million at December 31, 2020.
We have historically funded our growth in earning assets through the use of core deposits, large certificates of deposits from local markets, reciprocal brokered deposits, FHLB borrowings and Federal funds purchased. Management anticipates that these sources will provide necessary funding in the foreseeable future.
| | |
| Other Borrowings and Subordinated Debentures |
Our total debt was $1.72 billion at December 31, 2021 and December 31, 2020. The outstanding balance for December 31, 2021 includes $1.31 billion in FHLB long-term advances; $330.0 million in subordinated notes; $54.1 million of trust preferred securities and unamortized debt issuance costs; and $31.8 million of other long-term debt.
The FHLB long-term advances outstanding at the end of 2021 included $1.30 billion of FHLB Owns the Option (“FOTO”) advances that are a low cost, fixed-rate source of funding in return for granting to FHLB the flexibility to choose a termination date earlier than the maturity date. Our FOTO advances outstanding at the end of the year had original maturity dates of 10 years to 15 years with lockout periods that have expired. During the fourth quarter of 2020, we reclassified the FOTO advances as long-term advances due to the current low interest rate environment and the expectation that FHLB will not exercise the option to terminate the FOTO advances prior to its stated maturity date. We continually analyze the possibility of the FHLB exercising the options along with the market expected rate outcome. We also held typical FHLB short-term advances, with original maturities of less than one year, at various times during 2021, as well as in previous years. At December 31, 2021, the Company had $98,000 of FHLB advances outstanding with original or expected maturities of one year or less.
A summary of information related to our FHLB short-term advances, including FOTO advances in 2020 and 2019, is presented in Table 16.
Table 16: Short-Term Borrowings
| | | | | | | | | | | | | | | | | |
| | December 31, |
| (Dollars in thousands) | 2021 | | 2020 | | 2019 |
| Amount outstanding at year-end | $ | — | | | $ | — | | | $ | 1,250,000 | |
| Weighted-average interest rate at year-end | — | % | | — | % | | 1.44 | % |
| Maximum amount outstanding at any month-end during the year | $ | — | | | $ | 1,350,000 | | | $ | 1,435,000 | |
| Average amount outstanding during the year | $ | — | | | $ | 1,094,808 | | | $ | 1,183,873 | |
| Weighted-average interest rate for the year | — | % | | 1.69 | % | | 1.89 | % |
We assumed trust preferred securities and other subordinated debt in an aggregate principal amount, net of discounts, of $33.9 million related to the Landrum acquisition during 2019. During 2020, we repaid $5.9 million of other subordinated debt acquired from Landrum.
In March 2018, we issued $330.0 million in aggregate principal amount of 5.00% Fixed-to-Floating Rate Subordinated Notes (“Notes”) at a public offering price equal to 100% of the aggregate principal amount of the Notes. We incurred $3.6 million in debt issuance costs related to the offering. The Notes will mature on April 1, 2028 and will be subordinated in right of payment to the payment of our other existing and future senior indebtedness, including all our general creditors. The Notes are obligations of the Company only and are not obligations of, and are not guaranteed by, any of its subsidiaries.
Aggregate annual maturities of debt at December 31, 2021 are presented in Table 17.
Table 17: Maturities of Debt
| | | | | |
| | Annual Maturities |
| Year | (In thousands) |
| 2022 | $ | 1,833 | |
| 2023 | 1,789 | |
| 2024 | 2,425 | |
| 2025 | 4,956 | |
| 2026 | 1,881 | |
| Thereafter | 1,709,220 | |
| Total | $ | 1,722,104 | |
Overview
At December 31, 2021, total capital was $3.25 billion. Capital represents shareholder ownership in the Company – the book value of assets in excess of liabilities. At December 31, 2021, our common equity to asset ratio was 13.14% compared to 13.31% at year-end 2020.
Capital Stock
On February 27, 2009, at a special meeting, our shareholders approved an amendment to the Articles of Incorporation to establish 40,040,000 authorized shares of preferred stock, $0.01 par value. The aggregate liquidation preference of all shares of preferred stock cannot exceed $80.0 million.
On October 29, 2019, we filed Amended and Restated Articles of Incorporation (“October Amended Articles”) with the Arkansas Secretary of State. The October Amended Articles classified and designated Series D Preferred Stock, Par Value $0.01 Per Share, out of our authorized preferred stock. On November 30, 2021, we redeemed all of the Series D Preferred Stock, including accrued and unpaid dividends.
On March 31, 2021, we filed a shelf registration with the SEC. The shelf registration statement provides increased flexibility and more efficient access to raise capital from time to time through the sale of common stock, preferred stock, debt securities, depository shares, warrants, purchase contracts, purchase units, subscription rights, units or a combination thereof, subject to market conditions. Specific terms and prices are determined at the time of any offering under a separate prospectus supplement that we are required to file with the SEC at the time of the specific offering.
On April 19, 2018, shareholders of the Company approved an increase in the number of authorized shares of Common Stock from 120,000,000 to 175,000,000.
Stock Repurchase
On October 22, 2019, we announced a stock repurchase program (the “2019 Program”) under which we could repurchase up to $60.0 million of our Class A Common Stock currently issued and outstanding. On March 5, 2020, we announced an amendment to the 2019 Program that increased the maximum amount that could be repurchased under the 2019 Program from $60.0 million to $180.0 million. Effective July 23, 2021, a second amendment was approved that increased the maximum amount that could be repurchased to $276.5 million.
During 2021, we repurchased 4,562,469 shares of the Company’s common stock at an average price of $29.03 per share under the 2019 Program. We repurchased 5,956,700 shares at an average price of $19.03 per share under the 2019 Program during 2020.
During January 2022, we substantially exhausted the remaining capacity under the 2019 Program and authorized a new stock repurchase program (the “2022 Program”) under which we may repurchase up to $175.0 million of our Class A Common Stock currently issued and outstanding. The 2022 Program replaced the 2019 Program.
Under the 2022 Program, we may repurchase shares of our common stock through open market and privately negotiated transactions or otherwise. The timing, pricing, and amount of any repurchases under the 2022 Program will be determined by management at its discretion based on a variety of factors, including, but not limited to, trading volume and market price of our common stock, corporate considerations, our working capital and investment requirements, general market and economic conditions, and legal requirements. The 2022 Program does not obligate us to repurchase any common stock and may be modified, discontinued, or suspended at any time without prior notice. We anticipate funding for the 2022 Program to come from available sources of liquidity, including cash on hand and future cash flow.
Cash Dividends
We declared cash dividends on our common stock of $0.72 per share for the twelve months ended December 31, 2021, compared to $0.68 per share for the twelve months ended December 31, 2020, an increase of $0.04, or 6%. The timing and amount of future dividends are at the discretion of our Board of Directors and will depend upon our consolidated earnings, financial condition, liquidity and capital requirements, the amount of cash dividends paid to us by our subsidiaries, applicable government regulations and policies and other factors considered relevant by our Board of Directors. Our Board of Directors anticipates that we will continue to pay quarterly dividends in amounts determined based on the factors discussed above. However, there can be no assurance that we will continue to pay dividends on our common stock at the current levels or at all.
Parent Company Liquidity
The primary liquidity needs of the Parent Company are the payment of dividends to shareholders, the funding of debt obligations and cash needs for acquisitions. The primary sources for meeting these liquidity needs are the current cash on hand at the parent company and the future dividends received from Simmons Bank. Payment of dividends by Simmons Bank is subject to various regulatory limitations. The Company continually assesses its capital and liquidity needs and the best way to meet them, including, without limitation, through capital raising in the market via stock or debt offerings. See Item 7A, “Quantitative and Qualitative Disclosures About Market Risk”, for additional information regarding the parent company’s liquidity, which is incorporated herein by reference.
Risk-Based Capital
The Company and Simmons Bank are subject to various regulatory capital requirements administered by the federal banking agencies. Failure to meet minimum capital requirements can initiate certain mandatory and possibly additional discretionary actions by regulators that, if undertaken, could have a direct material effect on our financial statements. Under capital adequacy guidelines and the regulatory framework for prompt corrective action, we must meet specific capital guidelines that involve quantitative measures of our assets, liabilities and certain off-balance-sheet items as calculated under regulatory accounting practices. Our capital amounts and classifications are also subject to qualitative judgments by the regulators about components, risk weightings and other factors.
Quantitative measures established by regulation to ensure capital adequacy require us to maintain minimum amounts and ratios (set forth in the table below) of total, Tier 1 and common equity Tier 1 capital (as defined in the regulations) to risk-weighted assets (as defined) and of Tier 1 capital (as defined) to average assets (as defined). Management believes that, as of December 31, 2021, we met all capital adequacy requirements to which we are subject.
As of the most recent notification from regulatory agencies, Simmons Bank was well capitalized under the regulatory framework for prompt corrective action. To be categorized as well capitalized, the Company and Simmons Bank must maintain minimum total risk-based, Tier 1 risk-based, common equity Tier 1 risk-based and Tier 1 leverage ratios as set forth in the table. There are no conditions or events since that notification that management believes have changed the bank’s categories.
Our risk-based capital ratios at December 31, 2021 and 2020 are presented in Table 18 below:
Table 18: Risk-Based Capital
| | | | | | | | | | | |
| | December 31, |
| (Dollars in thousands) | 2021 | | 2020 |
| Tier 1 capital: | | | |
| Stockholders’ equity | $ | 3,248,841 | | | $ | 2,976,656 | |
| CECL transition provision | 114,458 | | | 131,430 | |
| Goodwill and other intangible assets | (1,226,686) | | | (1,163,797) | |
| Unrealized gain on available-for-sale securities, net of income taxes | 10,545 | | | (59,726) | |
| Total Tier 1 capital | 2,147,158 | | | 1,884,563 | |
| Tier 2 capital: | | | |
| Trust preferred securities and subordinated debt | 384,131 | | | 382,874 | |
| Qualifying allowance for credit losses and reserve for unfunded commitments | 71,853 | | | 89,546 | |
| Total Tier 2 capital | 455,984 | | | 472,420 | |
| Total risk-based capital | $ | 2,603,142 | | | $ | 2,356,983 | |
| | | | |
| Risk weighted assets | $ | 15,538,967 | | | $ | 14,048,608 | |
| | | |
| Assets for leverage ratio | $ | 23,647,901 | | | $ | 20,765,127 | |
| | | | |
| Ratios at end of year: | | | |
| Common equity Tier 1 ratio (CET1) | 13.82 | % | | 13.41 | % |
| Tier 1 leverage ratio | 9.08 | % | | 9.08 | % |
Tier 1 leverage ratio, excluding average PPP loans (non-GAAP) (1) | 9.15 | % | | 9.50 | % |
| Tier 1 risk-based capital ratio | 13.82 | % | | 13.41 | % |
| Total risk-based capital ratio | 16.75 | % | | 16.78 | % |
| Minimum guidelines: | | | |
| Common equity Tier 1 ratio (CET1) | 4.50 | % | | 4.50 | % |
| Tier 1 leverage ratio | 4.00 | % | | 4.00 | % |
| Tier 1 risk-based capital ratio | 6.00 | % | | 6.00 | % |
| Total risk-based capital ratio | 8.00 | % | | 8.00 | % |
_________________________
(1) PPP loans are 100% federally guaranteed and have a zero percent risk-weight for regulatory capital ratios. Tier 1 leverage ratio, excluding average PPP loans is a non-GAAP measurement.
Regulatory Capital Changes
In December 2018, the Federal Reserve, Office of the Comptroller of the Currency and Federal Deposit Insurance Corporation (“FDIC”) (collectively, the “agencies”) issued a final rule revising regulatory capital rules in anticipation of the adoption of ASU 2016-13 that provided an option to phase in over a three year period on a straight line basis the day-one impact of the adoption on earnings and Tier 1 capital (the “CECL Transition Provision”).
In March 2020, in response to the COVID-19 pandemic, the agencies issued a new regulatory capital rule revising the CECL Transition Provision to delay the estimated impact on regulatory capital stemming from the implementation of ASU 2016-13. The rule provides banking organizations that implement CECL before the end of 2020 the option to delay for two years an estimate of CECL’s effect on regulatory capital, followed by a three-year transition period (the “2020 CECL Transition Provision”). The Company elected to apply the 2020 CECL Transition Provision.
The Basel III Capital Rules define the components of capital and address other issues affecting the numerator in banking institutions’ regulatory capital ratios. The rules also address risk weights and other issues affecting the denominator in banking institutions’ regulatory capital ratios with a more risk-sensitive approach. The Basel III Capital Rules established risk-weighting
categories depending on the nature of the assets, generally ranging from 0% for U.S. government and agency securities, to 600% for certain equity exposures.
The final rules included a new common equity Tier 1 capital to risk-weighted assets ratio of 4.5% and a common equity Tier 1 capital conservation buffer of 2.5% of risk-weighted assets. The rules also set the minimum ratio of Tier 1 capital to risk-weighted assets to 6.0% and require a minimum leverage ratio of 4.0%.
Prior to December 31, 2017, Tier 1 capital included common equity Tier 1 capital and certain additional Tier 1 items as provided under the Basel III Capital Rules. The Tier 1 capital for the Company consisted of common equity Tier 1 capital and trust preferred securities. The Basel III Capital Rules include certain provisions that require trust preferred securities to be phased out of qualifying Tier 1 capital when assets surpass $15 billion. As of December 31, 2017, the Company exceeded $15 billion in total assets and the grandfather provisions applicable to its trust preferred securities no longer apply and trust preferred securities are no longer included as Tier 1 capital. Trust preferred securities and qualifying subordinated debt of $384.1 million is included as Tier 2 and total capital as of December 31, 2021.
Liquidity
In the normal course of business we have entered into a number of contractual obligations and have made commitments to make future payments. Refer to the accompanying notes to consolidated financial statements elsewhere in this report for the expected timing of such payments as of December 31, 2021. Examples of these commitments include but are not limited to long-term debt financing (Note 12, Other Borrowings and Subordinated Debentures), operating lease obligations (Note, 6, Right-of-Use Lease Assets and Lease Liabilities), time deposits with stated maturity dates (Note 9, Time Deposits), and unfunded loan commitments and letters of credit (Note 19, Commitments and Credit Risk).
| | |
| GAAP Reconciliation of Non-GAAP Financial Measures |
The tables below present computations of core earnings (net income excluding non-core items {merger-related costs, early retirement program costs, net branch right sizing costs, gain on sale of branches}) (non-GAAP) and core diluted earnings per share (non-GAAP) as well as a computation of tangible book value per common share (non-GAAP), tangible common equity to tangible assets (non-GAAP), core net interest margin (non-GAAP), core other income (non-GAAP), core non-interest expense (non-GAAP), core return on average assets (non-GAAP), return on tangible common equity (non-GAAP), core return on average common equity (non-GAAP), core return on tangible common equity (non-GAAP), and efficiency ratio (non-GAAP). The tables below also present computations of certain figures that are exclusive of the impact of PPP loans: the ratios of Tier 1 leverage ratio excluding average PPP loans (non-GAAP), net interest income and net interest margin, each adjusted for PPP loans and additional liquidity (each non-GAAP), and loan yield excluding PPP loans (non-GAAP). Non-core items are included in financial results presented in accordance with generally accepted accounting principles (GAAP).
We believe the exclusion of these non-core items in expressing earnings and certain other financial measures, including “core earnings,” provides a meaningful basis for period-to-period and company-to-company comparisons, which management believes will assist investors and analysts in analyzing the core financial measures of the Company and predicting future performance. These non-GAAP financial measures are also used by management to assess the performance of the Company’s business because management does not consider these non-core items to be relevant to ongoing financial performance. Management and the Board of Directors utilize “core earnings” (non-GAAP) for the following purposes:
• Preparation of the Company’s operating budgets
• Monthly financial performance reporting
• Monthly “flash” reporting of consolidated results (management only)
• Investor presentations of Company performance
We believe the presentation of “core earnings” on a diluted per share basis, “core diluted earnings per share” (non-GAAP) and core net interest margin (non-GAAP), provides a meaningful basis for period-to-period and company-to-company comparisons, which management believes will assist investors and analysts in analyzing the core financial measures of the Company and predicting future performance. These non-GAAP financial measures are also used by management to assess the performance of the Company’s business, because management does not consider these non-core items to be relevant to ongoing financial performance on a per share basis. Management and the Board of Directors utilize “core diluted earnings per share” (non-GAAP) for the following purposes:
• Calculation of annual performance-based incentives for certain executives
• Calculation of long-term performance-based incentives for certain executives
• Investor presentations of Company performance
We have $1.25 billion and $1.19 billion total goodwill and other intangible assets for the periods ended December 31, 2021 and 2020, respectively. Because our acquisition strategy has resulted in a high level of intangible assets, management believes useful calculations include tangible book value per common share (non-GAAP), tangible common equity to tangible assets (non-GAAP) and return on tangible equity (non-GAAP).
We believe the exclusion of PPP loans or their impact, as applicable, in expressing earnings and certain other financial measures provides a meaningful basis for period-to-period and company-to-company comparisons because PPP loans are 100% federally guaranteed and have very low interest rates. The Company’s non-GAAP financial measures that exclude PPP loans or their impact include the ratios of “Tier 1 leverage ratio excluding average PPP loans” (non-GAAP), “core net interest income” and “net interest margin,” each adjusted for PPP loans and additional liquidity (each non-GAAP), and “loan yield excluding PPP loans” (non-GAAP). Additional liquidity is defined as average interest bearing balances due from banks greater than normal liquidity levels. Management believes these non-GAAP presentations will assist investors and analysts in analyzing the core financial measures of the Company, including the performance of the Company’s loan portfolio and the Company’s regulatory capital position, and predicting future performance. Management and the Board of Directors utilize these non-GAAP financial measures for financial performance reporting and investor presentations of Company performance.
We believe that presenting these non-GAAP financial measures will permit investors and analysts to assess the performance of the Company on the same basis as that is applied by management and the Board of Directors.
Non-GAAP financial measures have inherent limitations, are not required to be uniformly applied and are not audited. To mitigate these limitations, we have procedures in place to identify and approve each item that qualifies as non-core to ensure that the
Company’s “core” results are properly reflected for period-to-period comparisons. Although these non-GAAP financial measures are frequently used by stakeholders in the evaluation of a company, they have limitations as analytical tools and should not be considered in isolation or as a substitute for analyses of results as reported under GAAP. In particular, a measure of earnings that excludes non-core items does not represent the amount that effectively accrues directly to stockholders (i.e., non-core items are included in earnings and stockholders’ equity). Additionally, similarly titled non-GAAP financial measures used by other companies may not be computed in the same or similar fashion.
All per share data has been restated to reflect the retroactive effect of the two-for-one stock split which occurred during February 2018.
During 2021, non-core items consisted of $15.9 million of merger-related costs, related to the Landmark and Triumph acquisitions and net branch right sizing gains of $0.9 million, primarily due to branch closures across our footprint during the year. Additionally, we had total gains on sale of branches of $5.3 million due to the Illinois Branch Sale. The net after-tax impact of these items was $7.2 million, or $0.07 per diluted earnings per share.
During 2020, non-core items consisted of $4.5 million of merger-related costs, related to the Landrum and Reliance acquisitions, and $2.9 million in early retirement program expenses. We also had non-core net branch right sizing costs of $13.7 million, primarily due to branch closures across our footprint during the year. Additionally, we had total gains on sale of branches of $8.4 million mostly due to the gains on sale from the Texas Branch Sale and Colorado Branch Sale. The net after-tax impact of these items was $9.4 million, or $0.09 per diluted earnings per share.
During 2019, non-core items consisted of $36.4 million of merger-related costs, related to the Landrum and Reliance acquisitions, and $3.5 million in early retirement program expenses. In addition, we had non-core branch right sizing costs of $3.1 million, primarily related to the relocation of the Little Rock, Arkansas corporate offices. The net after-tax impact of these items was $31.7 million, or $0.32 per diluted earnings per share.
See Table 19 below for the reconciliation of core earnings, which exclude non-core items for the periods presented.
Table 19: Reconciliation of Core Earnings (non-GAAP)
| | | | | | | | | | | | | | | | | |
| (In thousands, except per share data) | 2021 | | 2020 | | 2019 |
| Twelve months ended | | | | | |
| | | | | |
| Net income available to common stockholders | $ | 271,109 | | | $ | 254,852 | | | $ | 237,828 | |
| Non-core items: | | | | | |
| Gain on sale of branches | (5,316) | | | (8,368) | | | — | |
| Merger related costs | 15,911 | | | 4,531 | | | 36,379 | |
| Early retirement program | — | | | 2,901 | | | 3,464 | |
| Branch right sizing, net | (906) | | | 13,727 | | | 3,129 | |
Tax effect (1) | (2,532) | | | (3,343) | | | (11,234) | |
| Net non-core items | 7,157 | | | 9,448 | | | 31,738 | |
| Core earnings (non-GAAP) | $ | 278,266 | | | $ | 264,300 | | | $ | 269,566 | |
| | | | | |
| Diluted earnings per share | $ | 2.46 | | | $ | 2.31 | | | $ | 2.41 | |
| Non-core items: | | | | | |
| Gain on sale of branches | (0.05) | | | (0.07) | | | — | |
| Merger related costs | 0.15 | | | 0.04 | | | 0.37 | |
| Early retirement program | — | | | 0.03 | | | 0.03 | |
| Branch right sizing, net | (0.01) | | | 0.12 | | | 0.03 | |
Tax effect (1) | (0.02) | | | (0.03) | | | (0.11) | |
| Net non-core items | 0.07 | | | 0.09 | | | 0.32 | |
| Core diluted earnings per share (non-GAAP) | $ | 2.53 | | | $ | 2.40 | | | $ | 2.73 | |
_________________________
(1) Effective tax rate of 26.135%.
See Table 20 below for the reconciliation of core other income and core non-interest expense for the periods presented.
Table 20: Reconciliation of Core Other Income and Core Non-Interest Expense (non-GAAP)
| | | | | | | | | | | | | | | | | |
| (In thousands) | 2021 | | 2020 | | 2019 |
| Other income | $ | 35,273 | | | $ | 39,876 | | | $ | 64,684 | |
| Gain on sale of branches | (5,316) | | | (8,368) | | | — | |
| Branch right sizing | (369) | | | (370) | | | — | |
| Core other income (non-GAAP) | $ | 29,588 | | | $ | 31,138 | | | $ | 64,684 | |
| | | | | |
| Non-interest expense | $ | 483,589 | | | $ | 484,736 | | | $ | 453,960 | |
| Non-core items: | | | | | |
| Merger related costs | (15,911) | | | (4,531) | | | (36,379) | |
| Early retirement program | — | | | (2,901) | | | (3,464) | |
| Branch right sizing | 537 | | | (14,097) | | | (3,129) | |
| Total non-core items | (15,374) | | | (21,529) | | | (42,972) | |
| Core non-interest expense (non-GAAP) | $ | 468,215 | | | $ | 463,207 | | | $ | 410,988 | |
See Table 21 below for the reconciliation of tangible book value per common share.
Table 21: Reconciliation of Tangible Book Value per Common Share (non-GAAP)
| | | | | | | | | | | | | | | | | |
| (In thousands, except per share data) | 2021 | | 2020 | | 2019 |
| Total stockholders’ equity | $ | 3,248,841 | | | $ | 2,976,656 | | | $ | 2,988,924 | |
| Preferred stock | — | | | (767) | | | (767) | |
| Total common stockholders’ equity | 3,248,841 | | | 2,975,889 | | | 2,988,157 | |
| Intangible assets: | | | | | |
| Goodwill | (1,146,007) | | | (1,075,305) | | | (1,055,520) | |
| Other intangible assets | (106,235) | | | (111,110) | | | (127,340) | |
| Total intangibles | (1,252,242) | | | (1,186,415) | | | (1,182,860) | |
| Tangible common stockholders’ equity | $ | 1,996,599 | | | $ | 1,789,474 | | | $ | 1,805,297 | |
| Shares of common stock outstanding | 112,715,444 | | | 108,077,662 | | | 113,628,601 | |
| | | | | |
| Book value per common share | $ | 28.82 | | | $ | 27.53 | | | $ | 26.30 | |
| | | | | |
| Tangible book value per common share (non-GAAP) | $ | 17.71 | | | $ | 16.56 | | | $ | 15.89 | |
See Table 22 below for the calculation of tangible common equity and the reconciliation of tangible common equity to tangible assets.
Table 22: Reconciliation of Tangible Common Equity and the Ratio of Tangible Common Equity to Tangible Assets (non-GAAP)
| | | | | | | | | | | | | | | | | |
| (Dollars in thousands) | 2021 | | 2020 | | 2019 |
| Total common stockholders’ equity | $ | 3,248,841 | | | $ | 2,975,889 | | | $ | 2,988,157 | |
| Intangible assets: | | | | | |
| Goodwill | (1,146,007) | | | (1,075,305) | | | (1,055,520) | |
| Other intangible assets | (106,235) | | | (111,110) | | | (127,340) | |
| Total intangibles | (1,252,242) | | | (1,186,415) | | | (1,182,860) | |
| Tangible common stockholders’ equity | $ | 1,996,599 | | | $ | 1,789,474 | | | $ | 1,805,297 | |
| | | | | |
| Total assets | $ | 24,724,759 | | | $ | 22,359,752 | | | $ | 21,259,143 | |
| Intangible assets: | | | | | |
| Goodwill | (1,146,007) | | | (1,075,305) | | | (1,055,520) | |
| Other intangible assets | (106,235) | | | (111,110) | | | (127,340) | |
| Total intangibles | (1,252,242) | | | (1,186,415) | | | (1,182,860) | |
| Tangible assets | $ | 23,472,517 | | | $ | 21,173,337 | | | $ | 20,076,283 | |
| | | | | |
| PPP loans | (116,659) | | | (904,673) | | | |
| Total assets excluding PPP loans | $ | 24,608,100 | | | $ | 21,455,079 | | | |
| Tangible assets excluding PPP loans | $ | 23,355,858 | | | $ | 20,268,664 | | | |
| | | | | |
| Ratio of common equity to assets | 13.14 | % | | 13.31 | % | | 14.06 | % |
Ratio of tangible common equity to tangible assets (non-GAAP) | 8.51 | % | | 8.45 | % | | 8.99 | % |
See Table 23 below for the calculation of Tier 1 leverage ratio excluding average PPP loans for the period presented.
Table 23: Reconciliation of Tier 1 Leverage Ratio Excluding Average PPP Loans (non-GAAP)
| | | | | | | | |
| (Dollars in thousands) | 2021 | 2020 |
| Total Tier 1 capital | $ | 2,147,158 | | $ | 1,884,563 | |
| | |
| Adjusted average assets for leverage ratio | $ | 23,647,901 | | $ | 20,765,127 | |
| Average PPP loans | (172,130) | | (937,544) | |
| Adjusted average assets excluding average PPP loans | $ | 23,475,771 | | $ | 19,827,583 | |
| | |
| Tier 1 leverage ratio | 9.08 | % | 9.08 | % |
| Tier 1 leverage ratio excluding average PPP loans (non-GAAP) | 9.15 | % | 9.50 | % |
See Table 24 below for the calculation of core return on average assets.
Table 24: Calculation of Core Return on Average Assets (non-GAAP)
| | | | | | | | | | | | | | | | | |
| (Dollars in thousands) | 2021 | | 2020 | | 2019 |
| Twelve months ended | | | | | |
| | | | | |
| Net income available to common stockholders | $ | 271,109 | | | $ | 254,852 | | | $ | 237,828 | |
| Net non-core items, net of taxes, adjustment | 7,157 | | | 9,448 | | | 31,738 | |
| Core earnings | $ | 278,266 | | | $ | 264,300 | | | $ | 269,566 | |
| | | | | |
| Average total assets | $ | 23,492,308 | | | $ | 21,590,745 | | | $ | 17,871,748 | |
| | | | | |
| Return on average assets | 1.15 | % | | 1.18 | % | | 1.33 | % |
| Core return on average assets (non-GAAP) | 1.18 | % | | 1.22 | % | | 1.51 | % |
See Table 25 below for the calculation of return on tangible common equity.
Table 25: Calculation of Core Return on Tangible Common Equity (non-GAAP)
| | | | | | | | | | | | | | | | | |
| (Dollars in thousands) | 2021 | | 2020 | | 2019 |
| Twelve months ended | | | | | |
| | | | | |
Net income available to common stockholders | $ | 271,109 | | | $ | 254,852 | | | $ | 237,828 | |
| Amortization of intangibles, net of taxes | 9,967 | | | 9,968 | | | 8,720 | |
Total income available to common stockholders | $ | 281,076 | | | $ | 264,820 | | | $ | 246,548 | |
| | | | | |
| Net non-core items, net of taxes | 7,157 | | | 9,448 | | | 31,738 | |
| Core earnings | 278,266 | | | 264,300 | | | 269,566 | |
| Amortization of intangibles, net of taxes | 9,967 | | | 9,968 | | | 8,720 | |
Total core income available to common stockholders | $ | 288,233 | | | $ | 274,268 | | | $ | 278,286 | |
| | | | | |
| Average common stockholders’ equity | $ | 3,071,313 | | | $ | 2,921,039 | | | $ | 2,396,024 | |
| Average intangible assets: | | | | | |
| Goodwill | (1,090,967) | | | (1,065,190) | | | (921,635) | |
| Other intangible assets | (105,820) | | | (118,812) | | | (104,000) | |
| Total average intangibles | (1,196,787) | | | (1,184,002) | | | (1,025,635) | |
Average tangible common stockholders’ equity | $ | 1,874,526 | | | $ | 1,737,037 | | | $ | 1,370,389 | |
| | | | | |
| Return on average common equity | 8.83 | % | | 8.72 | % | | 9.93 | % |
Return on average tangible common equity (non-GAAP) | 14.99 | % | | 15.25 | % | | 17.99 | % |
Core return on average common equity (non-GAAP) | 9.06 | % | | 9.05 | % | | 11.25 | % |
| Core return on average tangible common equity (non-GAAP) | 15.38 | % | | 15.79 | % | | 20.31 | % |
See Table 26 below for the calculation of core net interest margin for the periods presented.
Table 26: Reconciliation of Core Net Interest Margin (non-GAAP)
| | | | | | | | | | | | | | | | | |
| (Dollars in thousands) | 2021 | | 2020 | | 2019 |
| Twelve months ended | | | | | |
| | | | | |
| Net interest income | $ | 591,532 | | | $ | 639,734 | | | $ | 601,753 | |
| FTE adjustment | 19,231 | | | 11,001 | | | 7,322 | |
| Fully tax equivalent net interest income | 610,763 | | | 650,735 | | | 609,075 | |
| Total accretable yield | (22,129) | | | (41,507) | | | (41,244) | |
| Core net interest income | $ | 588,634 | | | $ | 609,228 | | | $ | 567,831 | |
| | | | | |
| PPP loan and additional liquidity interest income | (36,011) | | | (18,539) | | | |
| Net interest income adjusted for PPP loans and additional liquidity | $ | 574,752 | | | $ | 632,196 | | | |
| | | | | |
| Average earning assets | $ | 21,097,786 | | | $ | 19,272,886 | | | $ | 15,824,571 | |
| Average PPP loan balance and additional liquidity | (595,222) | | | (1,854,016) | | | |
| Average earnings assets adjusted for PPP loans and additional liquidity | $ | 20,502,564 | | | $ | 17,418,870 | | | |
| | | | | |
| Net interest margin | 2.89 | % | | 3.38 | % | | 3.85 | % |
| Core net interest margin (non-GAAP) | 2.79 | % | | 3.16 | % | | 3.59 | % |
| Net interest margin adjusted for PPP loans and additional liquidity (non-GAAP) | 2.80 | % | | 3.63 | % | | |
See Table 27 below for the calculation of the efficiency ratio for the periods presented.
Table 27: Calculation of Efficiency Ratio (non-GAAP)
| | | | | | | | | | | | | | | | | |
| (Dollars in thousands) | 2021 | | 2020 | | 2019 |
| Twelve months ended | | | | | |
| | | | | |
| Non-interest expense | $ | 483,589 | | | $ | 484,736 | | | $ | 453,960 | |
| Non-core non-interest expense adjustment | (15,374) | | | (21,529) | | | (42,972) | |
Other real estate and foreclosure expense adjustment | (2,121) | | | (1,706) | | | (3,282) | |
| Amortization of intangibles adjustment | (13,494) | | | (13,495) | | | (11,805) | |
| Efficiency ratio numerator | $ | 452,600 | | | $ | 448,006 | | | $ | 395,901 | |
| | | | | |
| Net-interest income | $ | 591,532 | | | $ | 639,734 | | | $ | 601,753 | |
| Non-interest income | 191,815 | | | 239,769 | | | 197,879 | |
| Non-core non-interest income adjustment | (5,685) | | | (8,738) | | | — | |
| Fully tax-equivalent adjustment | 19,231 | | | 11,001 | | | 7,322 | |
| Gain on sale of securities | (15,498) | | | (54,806) | | | (13,314) | |
| Efficiency ratio denominator | $ | 781,395 | | | $ | 826,960 | | | $ | 793,640 | |
| | | | | |
| Efficiency ratio (non-GAAP) | 57.92 | % | | 54.18 | % | | 49.88 | % |
See Table 28 below for the calculation of loan yield excluding PPP loans for the period presented.
Table 28: Reconciliation of Loan Yield Excluding PPP Loans (non-GAAP)
| | | | | | | | |
| (Dollars in thousands) | 2021 | 2020 |
| Loan interest income - FTE | $ | 555,749 | | $ | 688,600 | |
| PPP loan interest income | (36,011) | | (15,861) | |
| Loan interest income excluding PPP loans | $ | 519,738 | | $ | 672,739 | |
| | |
| Average loan balance | $ | 11,810,480 | | $ | 14,260,689 | |
| Average PPP loan balance | (595,222) | | (637,006) | |
| Average loan balance excluding PPP loans | $ | 11,215,258 | | $ | 13,623,683 | |
| | |
| Loan yield - FTE | 4.71 | % | 4.83 | % |
| Loan yield excluding PPP loans (non-GAAP) - FTE | 4.63 | % | 4.94 | % |
ITEM 7A.QUANTITATIVE AND QUALITATIVE DISCLOSURES ABOUT MARKET RISK
| | |
| Liquidity and Market Risk Management |
Parent Company
The Company has leveraged its investment in its subsidiary bank and depends upon the dividends paid to it, as the sole shareholder of the subsidiary bank, as a principal source of funds for dividends to shareholders, stock repurchases and debt service requirements. At December 31, 2021, undivided profits of Simmons Bank were approximately $498.7 million, none of which were available for the payment of dividends to the Company without regulatory approval. In addition to dividends, other sources of liquidity for the Company are the sale of equity securities and the borrowing of funds.
Subsidiary Bank
Generally speaking, the Company’s subsidiary bank relies upon net inflows of cash from financing activities, supplemented by net inflows of cash from operating activities, to provide cash used in investing activities. Typical of most banking companies, significant financing activities include: deposit gathering; use of short-term borrowing facilities, such as federal funds purchased and repurchase agreements; and the issuance of long-term debt. The subsidiary bank’s primary investing activities include loan originations and purchases of investment securities, offset by loan payoffs and investment cash flows and maturities.
Liquidity represents an institution’s ability to provide funds to satisfy demands from depositors and borrowers by either converting assets into cash or accessing new or existing sources of incremental funds. A major responsibility of management is to maximize net interest income within prudent liquidity constraints. Internal corporate guidelines have been established to constantly measure liquid assets as well as relevant ratios concerning earning asset levels and purchased funds. The management and Board of Directors of the subsidiary bank monitor these same indicators and makes adjustments as needed.
Liquidity Management
The objective of our liquidity management is to access adequate sources of funding to ensure that cash flow requirements of depositors and borrowers are met in an orderly and timely manner. Sources of liquidity are managed so that reliance on any one funding source is kept to a minimum. Our liquidity sources are prioritized for both availability and time to activation.
Our liquidity is a primary consideration in determining funding needs and is an integral part of asset/liability management. Pricing of the liability side is a major component of interest margin and spread management. Adequate liquidity is a necessity in addressing this critical task. There are seven primary and secondary sources of liquidity available to the Company. The particular liquidity need and timeframe determine the use of these sources.
The first source of liquidity available to the Company is federal funds. Federal funds are available on a daily basis and are used to meet the normal fluctuations of a dynamic balance sheet. The Bank has approximately $415.0 million in federal funds lines of credit from upstream correspondent banks that can be accessed, when needed. In order to ensure availability of these upstream funds we test these borrowing lines at least annually. Historical monitoring of these funds has made it possible for us to project seasonal fluctuations and structure our funding requirements on a month-to-month basis.
Second, Simmons Bank has lines of credit available with the Federal Home Loan Bank. While we use portions of those lines to match off longer-term mortgage loans, we also use those lines to meet liquidity needs. Approximately $2.9 billion of these lines of credit are currently available, if needed, for liquidity.
A third source of liquidity is that we have the ability to access large wholesale deposits from both the public and private sector to fund short-term liquidity needs.
A fourth source of liquidity is the retail deposits available through our network of financial centers throughout Arkansas, Kansas, Missouri, Oklahoma, Tennessee and Texas. Although this method can be a somewhat more expensive alternative to supplying liquidity, this source can be used to meet intermediate term liquidity needs.
Fifth, we use a laddered investment portfolio that ensures there is a steady source of intermediate term liquidity. These funds can be used to meet seasonal loan patterns and other intermediate term balance sheet fluctuations. Approximately 82.3% of the investment portfolio is classified as available-for-sale. We also use securities held in the securities portfolio to pledge when obtaining public funds.
Sixth, we have a network of downstream correspondent banks from which we can access debt to meet liquidity needs.
Finally, we have the ability to access funds through the Federal Reserve Bank Discount Window.
We believe the various sources available are ample liquidity for short-term, intermediate-term and long-term liquidity.
Market Risk Management
Market risk arises from changes in interest rates. We have risk management policies to monitor and limit exposure to market risk. In asset and liability management activities, policies designed to minimize structural interest rate risk are in place. The measurement of market risk associated with financial instruments is meaningful only when all related and offsetting on- and off-balance-sheet transactions are aggregated, and the resulting net positions are identified.
Interest Rate Sensitivity
Interest rate risk represents the potential impact of interest rate changes on net income and capital resulting from mismatches in repricing opportunities of assets and liabilities over a period of time. A number of tools are used to monitor and manage interest rate risk, including simulation models and interest sensitivity gap analysis. Management uses simulation models to estimate the effects of changing interest rates and various balance sheet strategies on the level of the Company’s net income and capital. As a means of limiting interest rate risk to an acceptable level, management may alter the mix of floating and fixed-rate assets and liabilities, change pricing schedules, manage investment maturities during future security purchases, or enter into derivative contracts such as interest rate swaps.
The simulation model incorporates management’s assumptions regarding the level of interest rates or balance changes for indeterminate maturity deposits for a given level of market rate changes. These assumptions have been developed through anticipated pricing behavior. Key assumptions in the simulation models include the relative timing of prepayments, cash flows and maturities. These assumptions are inherently uncertain and, as a result, the model cannot precisely estimate net interest income or precisely predict the impact of a change in interest rates on net income or capital. Actual results will differ from simulated results due to the timing, magnitude and frequency of interest rate changes and changes in market conditions and management strategies, among other factors.
As of December 31, 2021, the model simulations projected that 100 and 200 basis point increases in interest rates would result in a positive variance in net interest income of 1.86% and 5.20%, respectively, relative to the base case over the next 12 months, while decreases in interest rates of 25 basis points would result in a negative variance in net interest income of 1.53% relative to the base case over the next 12 months. The likelihood of a decrease in interest rates in excess of 25 basis points as of December 31, 2021, is considered remote given current interest rate levels and indications that the Federal Reserve will raise rates in 2022. These are good faith estimates and assume that the composition of our interest sensitive assets and liabilities existing at each year-end will remain constant over the relevant twelve month measurement period and that changes in market interest rates are instantaneous and sustained across the yield curve regardless of duration of pricing characteristics of specific assets or liabilities. Also, this analysis does not contemplate any actions that we might undertake in response to changes in market interest rates. We believe these estimates are not necessarily indicative of what actually could occur in the event of immediate interest rate increases or decreases of this magnitude. As interest-bearing assets and liabilities reprice in different time frames and proportions to market interest rate movements, various assumptions must be made based on historical relationships of these variables in reaching any conclusion. Since these correlations are based on competitive and market conditions, we anticipate that our future results will likely be different from the foregoing estimates, and such differences could be material.
The table below presents our sensitivity to net interest income at December 31, 2021.
Table 29: Net Interest Income Sensitivity
| | | | | |
| Interest Rate Scenario | % Change from Base |
| Up 200 basis points | 5.20% |
| Up 100 basis points | 1.86% |
| Down 25 basis points | 1.53% |
ITEM 8. CONSOLIDATED FINANCIAL STATEMENTS AND SUPPLEMENTARY DATA
INDEX
| | | | | |
| |
Report of Independent Registered Public Accounting Firm (PCAOB ID 686) | |
| |
| |
| |
| |
| |
| |
| |
| |
Management’s Report on Internal Control Over Financial Reporting
The management of Simmons First National Corporation (the “Company”) is responsible for establishing and maintaining adequate internal control over financial reporting as defined in Rule 13a-15(f) under the Securities Exchange Act of 1934, as amended. The Company’s internal control over financial reporting is a process designed to provide reasonable assurance regarding the reliability of financial reporting and the preparation and fair presentation of the Company’s financial statements for external purposes in accordance with accounting principles generally accepted in the United States of America.
Because of inherent limitations, internal controls over financial reporting may not prevent or detect misstatements. Accordingly, even those systems determined to be effective can provide only reasonable assurance with respect to financial statement preparation and presentation.
Management assessed the effectiveness of the Company’s internal control over financial reporting as of December 31, 2021. In making this assessment, management used the criteria set forth in Internal Control – Integrated Framework (2013 edition) issued by the Committee of Sponsoring Organizations of the Treadway Commission (COSO). Based on this assessment, management has determined that the Company’s internal control over financial reporting as of December 31, 2021 is effective based on the specified criteria.
BKD, LLP, the independent registered public accounting firm that audited the consolidated financial statements of the Company included in this Annual Report on Form 10-K, has issued an audit report on the effectiveness of the Company’s internal control over financial reporting as of December 31, 2021. The report, which expresses an unqualified opinion on the effectiveness of the Company’s internal control over financial reporting as of December 31, 2021, immediately follows.
REPORT OF INDEPENDENT REGISTERED PUBLIC ACCOUNTING FIRM
To the Stockholders, Board of Directors and Audit Committee
Simmons First National Corporation
Pine Bluff, Arkansas
Opinion on the Internal Control over Financial Reporting
We have audited Simmons First National Corporation’s (the Company) internal control over financial reporting as of December 31, 2021, based on criteria established in Internal Control – Integrated Framework: (2013) issued by the Committee of Sponsoring Organizations of the Treadway Commission (COSO).
In our opinion, the Company maintained, in all material respects, effective internal control over financial reporting as of December 31, 2021, based on criteria established in Internal Control – Integrated Framework: (2013) issued by COSO.
We also have audited, in accordance with the standards of the Public Company Accounting Oversight Board (United States) (PCAOB), the consolidated financial statements of the Company and our report dated February 25, 2022, expressed an unqualified opinion.
Basis for Opinion
The Company’s management is responsible for maintaining effective internal control over financial reporting and for its assessment of the effectiveness of internal control over financial reporting, included in the accompanying management’s report. Our responsibility is to express an opinion on the Company’s internal control over financial reporting based on our audit.
We are a public accounting firm registered with the PCAOB and are required to be independent with respect to the Company in accordance with the U.S. federal securities laws and the applicable rules and regulations of the Securities and Exchange Commission and the PCAOB.
We conducted our audit in accordance with the standards of the PCAOB. Those standards require that we plan and perform the audit to obtain reasonable assurance about whether effective internal control over financial reporting was maintained in all material respects.
Our audit included obtaining an understanding of internal control over financial reporting, assessing the risk that a material weakness exists and testing and evaluating the design and operating effectiveness of internal control based on the assessed risk. Our audit also included performing such other procedures as we considered necessary in the circumstances. We believe that our audit provides a reasonable basis for our opinion.
Definitions and Limitations of Internal Control over Financial Reporting
A company’s internal control over financial reporting is a process designed to provide reasonable assurance regarding the reliability of financial reporting and the preparation of financial statements for external purposes in accordance with generally accepted accounting principles. A company’s internal control over financial reporting includes those policies and procedures that (1) pertain to the maintenance of records that, in reasonable detail, accurately and fairly reflect the transactions and dispositions of the assets of the company; (2) provide reasonable assurance that transactions are recorded as necessary to permit preparation of financial statements in accordance with generally accepted accounting principles, and that receipts and expenditures of the company are being made only in accordance with authorizations of management and directors of the company; and (3) provide reasonable assurance regarding prevention or timely detection of unauthorized acquisition, use or disposition of the company’s assets that could have a material effect on the financial statements.
Because of its inherent limitations, internal control over financial reporting may not prevent or detect misstatements. Also, projections of any evaluation of effectiveness to future periods are subject to the risk that controls may become inadequate because of changes in conditions or that the degree of compliance with the policies or procedures may deteriorate.
Little Rock, Arkansas
February 25, 2022
REPORT OF INDEPENDENT REGISTERED PUBLIC ACCOUNTING FIRM
To the Stockholders, Board of Directors and Audit Committee
Simmons First National Corporation
Pine Bluff, Arkansas
Opinion on the Financial Statements
We have audited the accompanying consolidated balance sheets of Simmons First National Corporation (the Company) as of December 31, 2021 and 2020, the related consolidated statements of income, comprehensive income, stockholders’ equity and cash flows for each of the years in the three-year period ended December 31, 2021, and the related notes (collectively referred to as the financial statements). In our opinion, the consolidated financial statements referred to above present fairly, in all material respects, the financial position of the Company as of December 31, 2021 and 2020, and the results of its operations and its cash flows for each of the years in the three-year period ended December 31, 2021, in conformity with accounting principles generally accepted in the United States of America.
We also have audited, in accordance with the standards of the Public Company Accounting Oversight Board (United States) (PCAOB), the Company’s internal control over financial reporting as of December 31, 2021, based on criteria established in Internal Control – Integrated Framework (2013 edition) issued by the Committee of Sponsoring Organizations of the Treadway Commission (COSO) and our report dated February 25, 2022, expressed an unqualified opinion on the effectiveness of the Company’s internal control over financial reporting.
Adoption of New Accounting Standard
As discussed in Notes 1, 3 and 5 to the consolidated financial statements, the Company has changed its method of accounting for the allowance for credit losses in 2020 due to the adoption of Accounting Standards Update No. 2016-13, Financial Instruments, Credit Losses (Topic 326): Measurement of Credit Losses on Financial Instruments.
Basis for Opinion
These financial statements are the responsibility of the Company's management. Our responsibility is to express an opinion on the Company's financial statements based on our audits.
We are a public accounting firm registered with the PCAOB and are required to be independent with respect to the Company in accordance with the U.S. federal securities laws and the applicable rules and regulations of the Securities and Exchange Commission and the PCAOB.
We conducted our audits in accordance with the standards of the PCAOB. Those standards require that we plan and perform the audits to obtain reasonable assurance about whether the financial statements are free of material misstatement, whether due to error or fraud. Our audits included performing procedures to assess the risks of material misstatement of the financial statements, whether due to error or fraud, and performing procedures that respond to those risks. Such procedures include examining, on a test basis, evidence regarding the amounts and disclosures in the financial statements. Our audits also included evaluating the accounting principles used and significant estimates made by management, as well as evaluating the overall presentation of the financial statements. We believe that our audits provide a reasonable basis for our opinion.
Critical Audit Matters
The critical audit matter communicated below is a matter arising from the current-period audit of the consolidated financial statements that was communicated or required to be communicated to the audit committee and that: (1) relates to accounts or disclosures that are material to the financial statements and (2) involved especially challenging, subjective or complex judgments. The communication of critical audit matters does not alter in any way our opinion on the consolidated financial statements, taken as a whole, and we are not, by communicating the critical audit matters below, providing separate opinions on the critical audit matters or on the accounts or disclosures to which they relate.
Allowance for Credit Losses
The Company’s loan portfolio totaled $12.01 billion as of December 31, 2021 and the allowance for credit losses on loans was $205.3 million. The Company’s unfunded loan commitments totaled $2.94 billion, with an allowance for credit loss of $22.4 million. The Company’s available-for-sale and held-to-maturity securities portfolios totaled $8.64 billion as of December 31,
2021, and the allowance for credit losses on securities was $1.3 million. Together these amounts represent the allowance for credit losses (“ACL”). As more fully described in the notes to the consolidated financial statements:
•For loans receivable, the ACL is a contra-asset valuation account, calculated in accordance with Topic 326 that is deducted from the amortized cost basis of loans to present the net amount expected to be collected.
•For unfunded loan commitments, the ACL is a liability account calculated in accordance with Topic 326, reported as a component of accrued interest and other liabilities.
•For securities, the ACL is a contra-valuation account that is deducted from the recorded basis of securities.
The amount of each allowance account represented management’s best estimate of current expected credit losses on those financial instruments considering all available information from internal and external sources, relevant to assessing exposure to credit loss over the contractual term of the instrument. Loans with similar risk characteristics are aggregated into homogenous segments for assessment. Reserve factors are based on estimated probability of default (PD) and loss given default (LGD) for each segment. The estimates include economic forecasts over the reasonable and supportable forecast period based on projected performance of economic variables that have a statistical relationship with the historical loss experience of the segments.
Management qualitatively adjusted model results for risk factors that were not considered within the modeling processes but were still relevant in assessing the expected credit losses within the loan pools. In some cases, management determined that an individual loan exhibited unique risk characteristics which differentiated the loan from other loans with the identified loan pools. In such cases the loans were evaluated for expected credit losses on an individual basis and excluded from the collective evaluation.
Auditing management’s estimate of the ACL involved a high degree of subjectivity due to the nature of the qualitative factor adjustments included in the ACL and complexities due to the implementation of probability of default and loss given default models. Management’s identification and measurement of the qualitative factor adjustments is highly judgmental and had a significant effect on the ACL.
The primary procedures we performed related to this critical audit matter included:
•Obtained an understanding of the Company’s process for establishing the ACL
•Evaluated and tested the design and operating effectiveness of related controls over the reliability and accuracy of data used to calculate and estimate the various components of the ACL including:
◦Loan data completeness and accuracy
◦Grouping of loans by segment
◦Model inputs utilized including PD, LGD, remaining life and prepayment speed
◦Approval of model assumptions selected
◦Establishment of qualitative factors
◦Loan risk ratings
•Tested the mathematical accuracy of the calculation of the ACL
•Performed reviews of individual credit files to evaluate the reasonableness of loan credit risk ratings
•Tested internally prepared loan reviews to evaluate the reasonableness of loan credit risk ratings
•Tested the completeness and accuracy of inputs utilized in the calculation of the ACL
•Evaluated the qualitative adjustments to the ACL including assessing the basis for adjustments and the reasonableness of the significant assumptions including consideration of impact of COVID-19
•Tested the reasonableness of specific reserves on individually reviewed loans
•Evaluated credit quality trends in delinquencies, non-accruals, charge-offs and loan risk ratings
•Considered the overall reasonableness of the ACL and compared to trends identified within peer groups
•Tested estimated utilization rate of unfunded loan commitments
•Reviewed documentation prepared to assess the methodology utilized by a third party performing the ACL calculation for securities for reasonableness
•Evaluated the accuracy and completeness of Topic 326 disclosures in the consolidated financial statements.
We have served as the Company’s auditor since 1972.
Little Rock, Arkansas
February 25, 2022
Simmons First National Corporation
Consolidated Balance Sheets
December 31, 2021 and 2020
| | | | | | | | | | | |
| (In thousands, except share data) | 2021 | | 2020 |
| | | |
| ASSETS | | | |
| Cash and non-interest bearing balances due from banks | $ | 209,190 | | | $ | 217,499 | |
| Interest bearing balances due from banks and federal funds sold | 1,441,463 | | | 3,254,653 | |
| Cash and cash equivalents | 1,650,653 | | | 3,472,152 | |
| Interest bearing balances due from banks – time | 1,882 | | | 1,579 | |
| Investment securities: | | | |
Held-to-maturity, net of allowance for credit losses of $1,279 and $2,915 at December 31, 2021 and 2020, respectively | 1,529,221 | | | 333,031 | |
Available-for-sale, net of allowance for credit losses of $0 and $312 at December 31, 2021 and 2020, respectively (amortized cost of $7,130,861 and $3,397,043 at December 31, 2021 and 2020, respectively) | 7,113,545 | | | 3,473,598 | |
| Total investments | 8,642,766 | | | 3,806,629 | |
| Mortgage loans held for sale | 36,356 | | | 137,378 | |
| Other assets held for sale | 100 | | | 100 | |
| Loans | 12,012,503 | | | 12,900,897 | |
| Allowance for credit losses on loans | (205,332) | | | (238,050) | |
| Net loans | 11,807,171 | | | 12,662,847 | |
| Premises and equipment | 483,469 | | | 441,692 | |
| Premises held for sale | — | | | 15,008 | |
| Foreclosed assets and other real estate owned | 6,032 | | | 18,393 | |
| Interest receivable | 72,990 | | | 72,597 | |
| Bank owned life insurance | 445,305 | | | 255,630 | |
| Goodwill | 1,146,007 | | | 1,075,305 | |
| Other intangible assets | 106,235 | | | 111,110 | |
| Other assets | 325,793 | | | 289,332 | |
| Total assets | $ | 24,724,759 | | | $ | 22,359,752 | |
| | | |
| LIABILITIES AND STOCKHOLDERS’ EQUITY | | | |
| Deposits: | | | |
| Non-interest bearing transaction accounts | $ | 5,325,318 | | | $ | 4,482,091 | |
| Interest bearing transaction accounts and savings deposits | 11,588,770 | | | 9,672,608 | |
| Time deposits | 2,452,460 | | | 2,832,327 | |
| Total deposits | 19,366,548 | | | 16,987,026 | |
| Federal funds purchased and securities sold under agreements to repurchase | 185,403 | | | 299,111 | |
| Other borrowings | 1,337,973 | | | 1,342,067 | |
| Subordinated debentures | 384,131 | | | 382,874 | |
| Other liabilities held for sale | — | | | 154,620 | |
| Accrued interest and other liabilities | 201,863 | | | 217,398 | |
| Total liabilities | 21,475,918 | | | 19,383,096 | |
| | | |
| Stockholders’ equity: | | | |
Preferred stock, 40,040,000 shares authorized; Series D, $0.01 par value, $1,000 liquidation value per share; 767 shares issued and outstanding at December 31, 2020 | — | | | 767 | |
Common stock, Class A, $0.01 par value; 175,000,000 shares authorized at December 31, 2021 and 2020; 112,715,444 and 108,077,662 shares issued and outstanding at December 31, 2021 and 2020, respectively | 1,127 | | | 1,081 | |
| Surplus | 2,164,989 | | | 2,014,076 | |
| Undivided profits | 1,093,270 | | | 901,006 | |
Accumulated other comprehensive income (loss) | (10,545) | | | 59,726 | |
| Total stockholders’ equity | 3,248,841 | | | 2,976,656 | |
| Total liabilities and stockholders’ equity | $ | 24,724,759 | | | $ | 22,359,752 | |
See Notes to Consolidated Financial Statements.
74
Simmons First National Corporation
Consolidated Statements of Income
Years Ended December 31, 2021, 2020 and 2019
| | | | | | | | | | | | | | | | | |
| (In thousands, except per share data) | 2021 | | 2020 | | 2019 |
| | | | | |
| INTEREST INCOME | | | | | |
| Loans, including fees | $ | 555,008 | | | $ | 687,771 | | | $ | 710,935 | |
| Interest bearing balances due from banks and federal funds sold | 2,795 | | | 4,383 | | | 7,486 | |
| Investment securities | 111,693 | | | 64,533 | | | 63,376 | |
| Mortgage loans held for sale | 1,565 | | | 3,031 | | | 1,326 | |
| TOTAL INTEREST INCOME | 671,061 | | | 759,718 | | | 783,123 | |
| | | | | |
| INTEREST EXPENSE | | | | | |
| Deposits | 41,172 | | | 79,860 | | | 139,011 | |
| Federal funds purchased and securities sold under agreements to repurchase | 579 | | | 1,715 | | | 1,010 | |
| Other borrowings | 19,495 | | | 19,652 | | | 23,008 | |
| Subordinated notes and debentures | 18,283 | | | 18,757 | | | 18,341 | |
| TOTAL INTEREST EXPENSE | 79,529 | | | 119,984 | | | 181,370 | |
| | | | | |
| NET INTEREST INCOME | 591,532 | | | 639,734 | | | 601,753 | |
| Provision for credit losses | (32,704) | | | 74,973 | | | 43,240 | |
| | | | | |
| NET INTEREST INCOME AFTER PROVISION FOR CREDIT LOSSES | 624,236 | | | 564,761 | | | 558,513 | |
| | | | | |
| NON-INTEREST INCOME | | | | | |
| Wealth management fees | 31,172 | | | 30,386 | | | 27,353 | |
| Service charges on deposit accounts | 43,231 | | | 43,082 | | | 44,782 | |
| Other service charges and fees | 7,696 | | | 6,624 | | | 5,824 | |
| Mortgage lending income | 21,798 | | | 34,469 | | | 15,017 | |
| Debit and credit card fees | 28,245 | | | 24,711 | | | 22,137 | |
| Bank owned life insurance income | 8,902 | | | 5,815 | | | 4,768 | |
| Gain on sale of securities, net | 15,498 | | | 54,806 | | | 13,314 | |
| Other income | 35,273 | | | 39,876 | | | 64,684 | |
| TOTAL NON-INTEREST INCOME | 191,815 | | | 239,769 | | | 197,879 | |
| | | | | |
| NON-INTEREST EXPENSE | | | | | |
| Salaries and employee benefits | 246,335 | | | 242,474 | | | 227,795 | |
| Occupancy expense, net | 38,797 | | | 37,556 | | | 32,008 | |
| Furniture and equipment expense | 19,890 | | | 24,038 | | | 18,220 | |
| Other real estate and foreclosure expense | 2,121 | | | 1,752 | | | 3,442 | |
| Deposit insurance | 6,973 | | | 9,184 | | | 4,416 | |
| Merger related costs | 15,911 | | | 4,531 | | | 36,379 | |
| Other operating expenses | 153,562 | | | 165,201 | | | 131,700 | |
| TOTAL NON-INTEREST EXPENSE | 483,589 | | | 484,736 | | | 453,960 | |
| | | | | |
| INCOME BEFORE INCOME TAXES | 332,462 | | | 319,794 | | | 302,432 | |
| Provision for income taxes | 61,306 | | | 64,890 | | | 64,265 | |
| | | | | |
| NET INCOME | 271,156 | | | 254,904 | | | 238,167 | |
| Preferred stock dividends | 47 | | | 52 | | | 339 | |
| NET INCOME AVAILABLE TO COMMON STOCKHOLDERS | $ | 271,109 | | | $ | 254,852 | | | $ | 237,828 | |
| BASIC EARNINGS PER SHARE | $ | 2.47 | | | $ | 2.32 | | | $ | 2.42 | |
| DILUTED EARNINGS PER SHARE | $ | 2.46 | | | $ | 2.31 | | | $ | 2.41 | |
See Notes to Consolidated Financial Statements.
75
Simmons First National Corporation
Consolidated Statements of Comprehensive Income
Years Ended December 31, 2021, 2020 and 2019
| | | | | | | | | | | | | | | | | |
| (In thousands) | 2021 | | 2020 | | 2019 |
| | | | | |
| NET INCOME | $ | 271,156 | | | $ | 254,904 | | | $ | 238,167 | |
| | | | | |
| OTHER COMPREHENSIVE INCOME (LOSS) | | | | | |
| Unrealized holding gains (losses) arising during the period on available-for-sale securities | (91,226) | | | 107,382 | | | 76,109 | |
| Unrealized holding gain on the transfer of held-to-maturity securities to available-for-sale per ASU 2017-12 | — | | | — | | | 2,547 | |
| Less: Reclassification adjustment for realized gains included in net income | 15,498 | | | 54,806 | | | 13,314 | |
| Less: Realized loss on available-for-sale securities interest rate hedges | (10,588) | | | — | | | — | |
| Net unrealized gains on securities transferred from available-for-sale to held-to-maturity during the period | 1,106 | | | — | | | — | |
| Less: Amortization of net unrealized gains on securities transferred from available-for-sale to held-to-maturity | (104) | | | — | | | — | |
| Other comprehensive income (loss), before tax effect | (95,134) | | | 52,576 | | | 65,342 | |
| | | | | |
| Less: Tax effect of other comprehensive income (loss) | (24,863) | | | 13,741 | | | 17,077 | |
| | | | | |
| TOTAL OTHER COMPREHENSIVE INCOME (LOSS) | (70,271) | | | 38,835 | | | 48,265 | |
| | | | | |
| COMPREHENSIVE INCOME | $ | 200,885 | | | $ | 293,739 | | | $ | 286,432 | |
See Notes to Consolidated Financial Statements.
76
Simmons First National Corporation
Consolidated Statements of Cash Flows
Years Ended December 31, 2021, 2020 and 2019
| | | | | | | | | | | | | | | | | |
| (In thousands) | 2021 | | 2020 | | 2019 |
| OPERATING ACTIVITIES | | | | | |
| Net income | $ | 271,156 | | | $ | 254,904 | | | $ | 238,167 | |
| Adjustments to reconcile net income to net cash provided by operating activities: | | | | |
| Depreciation and amortization | 47,220 | | | 49,038 | | | 36,257 | |
| Provision for credit losses | (32,704) | | | 74,973 | | | 43,240 | |
| Gain on sale of investments | (15,498) | | | (54,806) | | | (13,314) | |
| Net accretion of investment securities and assets | (52,781) | | | (56,771) | | | (53,619) | |
| Net amortization on borrowings | 1,257 | | | 541 | | | 394 | |
| Stock-based compensation expense | 15,868 | | | 13,197 | | | 12,921 | |
| Gain on sale of premises and equipment, net of impairment | (591) | | | (14) | | | — | |
| Gain on sale of foreclosed assets and other real estate owned | (932) | | | (391) | | | (33) | |
| Gain on sale of mortgage loans held for sale | (36,434) | | | (44,864) | | | (20,064) | |
| Gain on sale of other intangibles | — | | | (301) | | | — | |
| Gain on sale of branches | (5,316) | | | (8,094) | | | — | |
| Loss on sale of loans | — | | | — | | | 4,451 | |
| Gain on sale of Visa, Inc. class B common stock | — | | | — | | | (42,860) | |
| Fair value write-down of closed branches | — | | | 434 | | | — | |
| Deferred income taxes | 10,937 | | | (122) | | | 34,911 | |
| Income from bank owned life insurance | (9,477) | | | (7,206) | | | (4,854) | |
| Originations of mortgage loans held for sale | (1,034,716) | | | (1,206,818) | | | (755,500) | |
| Proceeds from sale of mortgage loans held for sale | 1,190,891 | | | 1,172,406 | | | 756,642 | |
| Changes in assets and liabilities: | | | | | |
| Interest receivable | 4,423 | | | (10,846) | | | 3,231 | |
| Other assets | (33,495) | | | (7,480) | | | 31,920 | |
| Accrued interest and other liabilities | (50,620) | | | 50,508 | | | (35,886) | |
| Income taxes payable | 8,592 | | | (15,745) | | | 20,074 | |
| Net cash provided by operating activities | 277,780 | | | 202,543 | | | 256,078 | |
| INVESTING ACTIVITIES | | | | | |
| Net collections (originations) of loans | 2,333,893 | | | 1,327,248 | | | 23,806 | |
| Proceeds from sale of loans | 28,033 | | | 49,736 | | | 104,587 | |
| Decrease in due from banks - time | 292 | | | 2,975 | | | 1,130 | |
| Purchases of premises and equipment, net | (47,861) | | | (13,272) | | | (67,831) | |
| Proceeds from sale of premises and equipment | 5,621 | | | 369 | | | — | |
| Proceeds from sale of foreclosed assets and other real estate owned | 21,983 | | | 10,788 | | | 17,986 | |
| Proceeds from sale of available-for-sale securities | 342,577 | | | 1,717,364 | | | 1,226,578 | |
| Proceeds from maturities of available-for-sale securities | 1,001,669 | | | 2,346,930 | | | 793,270 | |
| Purchases of available-for-sale securities | (5,266,148) | | | (4,140,963) | | | (1,708,948) | |
| Proceeds from maturities of held-to-maturity securities | 15,712 | | | 13,970 | | | 31,969 | |
| Purchases of held-to-maturity securities | (708,580) | | | (308,854) | | | — | |
| Proceeds from bank owned life insurance death benefits | 3,814 | | | 2,018 | | | 2,435 | |
| Purchases of bank owned life insurance | (160,000) | | | — | | | — | |
| Cash received in business combinations, net | 25,425 | | | — | | | 178,260 | |
| Disposition of assets and liabilities held for sale | (134,166) | | | 181,560 | | | 1,235 | |
| Net cash provided by (used in) investing activities | (2,537,736) | | | 1,189,869 | | | 604,477 | |
| FINANCING ACTIVITIES | | | | | |
| Net change in deposits | 847,494 | | | 1,086,713 | | | (404,826) | |
| Proceeds from issuance of other borrowings | — | | | — | | | 25,500 | |
| Repayments of subordinated debentures | (1,563) | | | (7,442) | | | — | |
| Dividends paid on preferred stock | (47) | | | (52) | | | (339) | |
| Dividends paid on common stock | (78,845) | | | (74,593) | | | (63,921) | |
| Net change in other borrowed funds | (80,254) | | | 45,983 | | | (240,806) | |
Net change in federal funds purchased and securities sold under agreements to repurchase | (116,562) | | | 148,966 | | | 40,207 | |
| Net shares (cancelled) issued under stock compensation plans | 290 | | | (4,087) | | | (2,389) | |
| Shares issued under employee stock purchase plan | 1,170 | | | 956 | | | 1,312 | |
| Repurchase of common stock | (132,459) | | | (113,327) | | | (10,128) | |
| Retirement of preferred stock | (767) | | | — | | | (42,000) | |
| Net cash provided by (used in) financing activities | 438,457 | | | 1,083,117 | | | (697,390) | |
| INCREASE (DECREASE) IN CASH EQUIVALENTS | (1,821,499) | | | 2,475,529 | | | 163,165 | |
| CASH AND CASH EQUIVALENTS, BEGINNING OF YEAR | 3,472,152 | | | 996,623 | | | 833,458 | |
| CASH AND CASH EQUIVALENTS, END OF YEAR | $ | 1,650,653 | | | $ | 3,472,152 | | | $ | 996,623 | |
See Notes to Consolidated Financial Statements.
77
Simmons First National Corporation
Consolidated Statements of Stockholders’ Equity
Years Ended December 31, 2021, 2020 and 2019
| | | | | | | | | | | | | | | | | | | | | | | | | | | | | | | | | | | |
| (In thousands, except share data) | Preferred Stock | | Common
Stock | | Surplus | | Accumulated
Other
Comprehensive
Income (Loss) | | Undivided
Profits | | Total |
| Balance, December 31, 2018 | $ | — | | | $ | 923 | | | $ | 1,597,944 | | | $ | (27,374) | | | $ | 674,941 | | | $ | 2,246,434 | |
| | | | | | | | | | | |
| Comprehensive income | — | | | — | | | — | | | 48,265 | | | 238,167 | | | 286,432 | |
Stock issued for employee stock purchase plan – 60,413 shares | — | | | 1 | | | 1,311 | | | — | | | — | | | 1,312 | |
Stock-based compensation plans, net – 261,200 shares | — | | | 3 | | | 10,529 | | | — | | | — | | | 10,532 | |
Stock issued for Reliance acquisition - 3,999,623 shares | 42,000 | | | 40 | | | 102,790 | | | — | | | — | | | 144,830 | |
Stock issued for Landrum acquisition - 17,349,722 shares | 767 | | | 173 | | | 414,832 | | | — | | | — | | | 415,772 | |
| Preferred stock retirement | (42,000) | | | — | | | — | | | — | | | — | | | (42,000) | |
Stock repurchases - 390,000 shares | — | | | (4) | | | (10,124) | | | — | | | — | | | (10,128) | |
| Dividends on preferred stock | — | | | — | | | — | | | — | | | (339) | | | (339) | |
Dividends on common stock – $0.64 per share | — | | | — | | | — | | | — | | | (63,921) | | | (63,921) | |
| | | | | | | | | | | |
| Balance, December 31, 2019 | 767 | | | 1,136 | | | 2,117,282 | | | 20,891 | | | 848,848 | | | 2,988,924 | |
| | | | | | | | | | | |
| Impact of ASU 2016-13 adoption | — | | | — | | | — | | | — | | | (128,101) | | | (128,101) | |
| Comprehensive income | — | | | — | | | — | | | 38,835 | | | 254,904 | | | 293,739 | |
Stock issued for employee stock purchase plan - 43,681 shares | — | | | 1 | | | 955 | | | — | | | — | | | 956 | |
Stock-based compensation plans, net - 362,080 shares | — | | | 3 | | | 9,107 | | | — | | | — | | | 9,110 | |
Stock repurchases - 5,956,700 shares | — | | | (59) | | | (113,268) | | | — | | | — | | | (113,327) | |
| Dividends on preferred stock | — | | | — | | | — | | | — | | | (52) | | | (52) | |
Dividends on common stock - $0.68 per share | — | | | — | | | — | | | — | | | (74,593) | | | (74,593) | |
| | | | | | | | | | | |
| Balance, December 31, 2020 | 767 | | | 1,081 | | | 2,014,076 | | | 59,726 | | | 901,006 | | | 2,976,656 | |
| | | | | | | | | | | |
| Comprehensive income | — | | | — | | | — | | | (70,271) | | | 271,156 | | | 200,885 | |
Stock issued for employee stock purchase plan - 60,697 shares | — | | | 1 | | | 1,169 | | | — | | | — | | | 1,170 | |
Stock-based compensation plans, net - 474,970 shares | — | | | 4 | | | 16,154 | | | — | | | — | | | 16,158 | |
Stock issued for Landmark acquisition - 4,499,872 shares | — | | | 45 | | | 138,146 | | | — | | | — | | | 138,191 | |
Stock issued for Triumph acquisition - 4,164,712 shares | — | | | 42 | | | 127,857 | | | — | | | — | | | 127,899 | |
| Preferred stock retirement | (767) | | | — | | | — | | | — | | | — | | | (767) | |
Stock repurchases - 4,562,469 shares | — | | | (46) | | | (132,413) | | | — | | | — | | | (132,459) | |
| Dividends on preferred stock | — | | | — | | | — | | | — | | | (47) | | | (47) | |
Dividends on common stock – $0.72 per share | — | | | — | | | — | | | — | | | (78,845) | | | (78,845) | |
| | | | | | | | | | | |
| Balance, December 31, 2021 | $ | — | | | $ | 1,127 | | | $ | 2,164,989 | | | $ | (10,545) | | | $ | 1,093,270 | | | $ | 3,248,841 | |
See Notes to Consolidated Financial Statements.
78
Simmons First National Corporation
Notes to Consolidated Financial Statements
NOTE 1: SUMMARY OF SIGNIFICANT ACCOUNTING POLICIES
Nature of Operations and Principles of Consolidation
Simmons First National Corporation (“Company”) is a Mid-South financial holding company headquartered in Pine Bluff, Arkansas, and the parent company of Simmons Bank, an Arkansas state-chartered bank that has been in operation since 1903 (“Simmons Bank” or the “Bank”). Simmons First Insurance Services, Inc. and Simmons First Insurance Services of TN, LLC are wholly-owned subsidiaries of Simmons Bank and are insurance agencies that offer various lines of personal and corporate insurance coverage to individual and commercial customers. The Company, through its subsidiaries, offers, among other things, consumer, real estate and commercial loans; checking, savings and time deposits; and specialized products and services (such as credit cards, trust and fiduciary services, investments, agricultural finance lending, equipment lending, insurance and Small Business Administration (“SBA”) lending) from approximately 199 financial centers as of December 31, 2021, located throughout market areas in Arkansas, Kansas, Missouri, Oklahoma, Tennessee and Texas.
The consolidated financial statements include the accounts of the Company and its subsidiaries. Significant intercompany accounts and transactions have been eliminated in consolidation.
Simmons Bank is an Arkansas state-chartered bank and a member of the Federal Reserve System through the Federal Reserve Bank of St. Louis. Due to the Company’s typical acquisition process, there may be brief periods of time during which the Company may operate another subsidiary bank that the Company acquired through a merger with a target bank holding company as a separate subsidiary while preparing for the merger and integration of that subsidiary bank into Simmons Bank. However, it is the Company’s intent to generally maintain Simmons Bank as the Company’s sole subsidiary bank.
Operating Segments
Operating segments are components of an enterprise about which separate financial information is available that is regularly evaluated by the chief operating decision maker in deciding how to allocate resources and in assessing performance. The Company is organized on a divisional basis, with divisions grouped based on community and metro markets located within the Company’s footprint. Each of the divisions, as well as their respective groups, provide a group of similar community banking services, including such products and services as loans; time deposits, checking and savings accounts; treasury management, personal and corporate trust services; credit cards; investment management; insurance; and securities and investment services. Loan products include consumer, real estate, commercial, agricultural, equipment, warehouse lending and SBA lending. The individual bank divisions have similar operating and economic characteristics. While the chief operating decision maker monitors the revenue streams of the various products, services, branch locations, divisions and groups, operations are managed, financial performance is evaluated, and management makes decisions on how to allocate resources, on a Company-wide basis. Accordingly, the divisions and their respective groups are considered by management to be aggregated into one reportable operating segment.
The Company also considers its trust, investment and insurance services to be operating segments. Information on these segments is not reported separately since they do not meet the quantitative thresholds under Accounting Standards Codification (“ASC”) Topic 280-10-50-12.
Use of Estimates
The preparation of financial statements, in accordance with US GAAP, requires management to make estimates and assumptions that affect the reported amounts of assets, liabilities, income items and expenses and disclosure of contingent assets and liabilities. The estimates and assumptions used in the accompanying consolidated financial statements are based upon management’s evaluation of the relevant facts and circumstances as of the date of the consolidated financial statements and actual results may differ from these estimates. Such estimates include, but are not limited to, the Company’s allowance for credit losses.
Material estimates that are particularly susceptible to significant change relate to the determination of the allowance for credit losses, the valuation of real estate acquired in connection with foreclosures or in satisfaction of loans and the valuation of acquired loans. Management obtains independent appraisals for significant properties in connection with the determination of the allowance for credit losses and the valuation of foreclosed assets.
Reclassifications
During 2021, certain debit and credit card transaction fees were reclassified from non-interest expense to non-interest income. These transaction fees, as well as additional certain prior year amounts, have been reclassified to conform to the current year financial statement presentation. These changes and reclassifications did not impact previously reported net income or comprehensive income and were not material to the consolidated financial statements.
During 2020, the Company moved equity securities from the available-for-sale investment securities into other assets as well as the related income which moved from interest income to non-interest income. The change had no impact on net income.
Various items within the accompanying consolidated financial statements for previous years have been reclassified to provide more comparative information. These reclassifications were not material to the consolidated financial statements.
Cash Equivalents
The Company considers all liquid investments with original maturities of three months or less to be cash equivalents. For purposes of the consolidated statements of cash flows, cash and cash equivalents are considered to include cash and non-interest bearing balances due from banks, interest bearing balances due from banks and federal funds sold and securities purchased under agreements to resell. At December 31, 2021, nearly all of the interest-bearing and non-interest bearing deposits were uninsured with nearly all of these balances held at the Federal Reserve Bank.
Investment Securities
Held-to-maturity securities (“HTM”), which include any security for which the Company has the positive intent and ability to hold until maturity, are carried at historical cost adjusted for amortization of premiums and accretion of discounts. Premiums and discounts are amortized and accreted, respectively, to interest income using the constant effective yield method over the estimated life of the security. Prepayments are anticipated for mortgage-backed and SBA securities. Premiums on callable securities are amortized to their earliest call date.
Available-for-sale securities (“AFS”), which include any security for which the Company has no immediate plan to sell but which may be sold in the future, are carried at fair value. Realized gains and losses, based on specifically identified amortized cost of the individual security, are included in other income. Unrealized gains and losses are recorded, net of related income tax effects, in stockholders’ equity. Premiums and discounts are amortized and accreted, respectively, to interest income using the constant effective yield method over the estimated life of the security. Prepayments are anticipated for mortgage-backed and SBA securities. Premiums on callable securities are amortized to their earliest call date.
Trading securities, if any, which include any security held primarily for near-term sale, are carried at fair value. Gains and losses on trading securities are included in other income.
Allowance for Credit Losses - Investment Securities
Allowance for Credit Losses - HTM Securities - The Company measures expected credit losses on HTM securities on a collective basis by major security type, with each type sharing similar risk characteristics. The estimate of expected credit losses considers historical credit loss information that is adjusted for current conditions and reasonable and supportable forecasts. The Company has made the election to exclude accrued interest receivable on HTM securities from the estimate of credit losses and report accrued interest separately on the consolidated balance sheets.
Allowance for Credit Losses - AFS Securities - For AFS securities in an unrealized loss position, the Company first evaluates whether it intends to sell, or whether it is more likely than not that it will be required to sell, the security before recovery of its amortized cost basis. If either of these criteria regarding intent or requirement to sell is met, the AFS security amortized cost basis is written down to fair value through income. If the criteria is not met, the Company is required to assess whether the decline in fair value has resulted from credit losses or noncredit-related factors. If the assessment indicates a credit loss exists, the present value of cash flows expected to be collected from the security are compared to the amortized cost basis of the security. If the present value of cash flows expected to be collected is less than the amortized cost basis, a credit loss exists, and an allowance for credit loss is recorded through income as a component of provision for credit loss expense. If the assessment indicates that a credit loss does not exist, the Company records the decline in fair value through other comprehensive income, net of related income tax effects. The Company has made the election to exclude accrued interest receivable on AFS securities from the estimate of credit losses and report accrued interest separately on the consolidated balance sheets. Changes in the allowance for credit losses are recorded as provision for (or reversal of) credit loss expense. Losses are charged against the allowance when management
believes the uncollectibility of an AFS security is confirmed or when either of the criteria regarding intent or requirement to sell is met.
Mortgage Loans Held For Sale
Mortgage Loans Held for Sale are carried at fair value which is determined on an aggregate basis. Adjustments to fair value are recognized monthly and reflected in earnings. The Company regularly sells mortgages into the capital markets to mitigate the effects of interest rate volatility during the period from the time an interest rate lock commitment (“IRLC”) is issued until the IRLC funds creating a mortgage loan held for sale and its subsequent sale into the secondary/capital markets. Loan sales are typically executed on a mandatory basis. Under a mandatory commitment, the Company agrees to deliver a specified dollar amount with predetermined terms by a certain date. Generally, the commitment is not loan specific, and any combination of loans can be delivered into the outstanding commitment provided the terms fall within the parameters of the commitment. Upon failure to deliver, the Company is subject to fees based on market movement.
The IRLCs are derivative instruments; their fair values at December 31, 2021 and 2020 were not material. Gains and losses resulting from sales of mortgage loans are recognized when the respective loans are sold to correspondent lenders, investors or aggregators. Gains and losses are determined by the difference between the sale price and the carrying amount in the loans sold, net of discounts collected, or premiums paid. Hedge instruments are, likewise, carried at fair value and associated gains/losses are realized at time of settlement.
Loans
Loans that management has the intent and ability to hold for the foreseeable future or until maturity or pay-offs are reported at their amortized cost basis, which is the unpaid principal balance outstanding, net of unearned income, deferred loan fees and costs, premiums and discounts associated with acquisition date fair value adjustments on acquired loans, and any direct principal charge-offs. The Company has made a policy election to exclude accrued interest from the amortized cost basis of loans and report accrued interest separately from the related loan balance on the consolidated balance sheets.
For loans amortized at cost, interest income is accrued based on the unpaid principal balance. Loan origination fees, net of certain direct origination costs, as well as premiums and discounts, are deferred and amortized as a level yield adjustment over the respective term of the loan.
The accrual of interest on loans, except on certain government guaranteed loans, is discontinued at the time the loan is 90 days past due unless the credit is well-secured and in process of collection. Past due status is based on contractual terms of the loan. In all cases, loans are placed on non-accrual or charged off at an earlier date if collection of principal or interest is considered doubtful.
Discounts and premiums on purchased residential real estate loans are amortized to income using the interest method over the remaining period to contractual maturity, adjusted for anticipated prepayments. Discounts and premiums on purchased consumer loans are recognized over the expected lives of the loans using methods that approximate the interest method.
Further information regarding accounting policies related to past due loans, non-accrual loans, and troubled-debt restructurings is presented in Note 5, Loans and Allowance for Credit Losses. Additionally, for discussion of the Company’s accounting for acquired loans, see Acquisition Accounting, Loans later in this section.
Allowance for Credit Losses
The allowance for credit losses is a reserve established through a provision for credit losses charged to expense, which represents management’s best estimate of lifetime expected losses based on reasonable and supportable forecasts, historical loss experience, and other qualitative considerations. The allowance, in the judgment of management, is necessary to reserve for expected credit losses and risks inherent in the loan portfolio. The Company’s allowance for credit loss methodology includes reserve factors calculated to estimate current expected credit losses to amortized cost balances over the remaining contractual life of the portfolio, adjusted for prepayments, in accordance with ASC Topic 326-20, Financial Instruments - Credit Losses. Accordingly, the methodology is based on the Company’s reasonable and supportable economic forecasts, historical loss experience, and other qualitative adjustments. Management’s evaluation of the allowance for credit losses is inherently subjective as it requires material estimates. It is management’s practice to review the allowance on a monthly basis, and after considering the factors previously noted, to determine the level of provision made to the allowance.
Loans with similar risk characteristics such as loan type, collateral type, and internal risk ratings are aggregated into homogeneous segments for assessment. Reserve factors are based on estimated probability of default and loss given default for each segment. The estimates are determined based on economic forecasts over the reasonable and supportable forecast period based on projected performance of economic variables that have a statistical relationship with the historical loss experience of the segments. For contractual periods that extend beyond the one-year forecast period, the estimates revert to average historical loss experiences over a one-year period on a straight-line basis.
The Company also includes qualitative adjustments to the allowance based on factors and considerations that have not otherwise been fully accounted for. Qualitative adjustments include, but are not limited to:
•Changes in asset quality - Adjustments related to trending credit quality metrics including delinquency, nonperforming loans, charge-offs, and risk ratings that may not be fully accounted for in the reserve factor.
•Changes in the nature and volume of the portfolio - Adjustments related to current changes in the loan portfolio that are not fully represented or accounted for in the reserve factors.
•Changes in lending and loan monitoring policies and procedures - Adjustments related to current changes in lending and loan monitoring procedures as well as review of specific internal policy compliance metrics.
•Changes in the experience, ability, and depth of lending management and other relevant staff - Adjustments to measure increasing or decreasing credit risk related to lending and loan monitoring management.
•Changes in the value of underlying collateral of collateralized loans - Adjustments related to improving or deterioration of the value of underlying collateral that are not fully captured in the reserve factors.
•Changes in and the existence and effect of any concentrations of credit - Adjustments related to credit risk of specific industries that are not fully captured in the reserve factors.
•Changes in regional and local economic and business conditions and developments - Adjustments related to expected and current economic conditions at a regional or local-level that are not fully captured within the Company’s reasonable and supportable forecast.
•Data imprecisions due to limited historical loss data - Adjustments related to limited historical loss data that is representative of the collective loan portfolio.
Collateral Dependent Loans
Loans that do not share risk characteristics are evaluated on an individual basis. For collateral dependent financial assets where the Company has determined that foreclosure of the collateral is probable, or where the borrower is experiencing financial difficulty and the Company expects repayment of the financial asset to be provided substantially through the operation or sale of the collateral, the allowance for credit loss is measured based on the difference between the fair value of the collateral and the amortized cost basis of the asset as of the measurement date. When repayment is expected to be from the operation of the collateral, expected credit losses are calculated as the amount by which the amortized cost basis of the financial asset exceeds the present value of expected cash flows from the operation of the collateral. When repayment is expected to be from the sale of the collateral, expected credit losses are calculated as the amount by which the amortized costs basis of the financial asset exceeds the fair value of the underlying collateral less estimated cost to sell. The allowance for credit losses may be zero if the fair value of the collateral at the measurement date exceeds the amortized cost basis of the financial asset.
For a collateral dependent loan, the Company’s evaluation process includes a valuation by appraisal or other collateral analysis adjusted for selling costs, when appropriate. This valuation is compared to the remaining outstanding principal balance of the loan. If a loss is determined to be probable, the loss is included in the allowance for credit losses as a specific allocation. If the loan is not collateral dependent, the measurement of loss is based on the difference between the expected and contractual future cash flows of the loan.
Reserve for Unfunded Commitments
In addition to the allowance for credit losses, the Company has established a reserve for unfunded commitments, classified in other liabilities, representing expected credit losses over the contractual period for which the Company is exposed to credit risk resulting from a contractual obligation to extend credit. This reserve is maintained at a level management believes to be sufficient to absorb losses arising from unfunded loan commitments. The adequacy of the reserve for unfunded commitments is determined quarterly based on methodology similar to the methodology for determining the allowance for credit losses. The allowance for credit loss is reported as a component of accrued interest and other liabilities in the consolidated balance sheets. Adjustments to the allowance are reported in the income statement as a component of the provision for credit losses.
Acquisition Accounting, Loans
The Company accounts for its acquisitions under ASC Topic 805, Business Combinations, which requires the use of the acquisition method of accounting. All identifiable assets acquired, including loans, are recorded at fair value. The fair value for acquired loans at the time of acquisition is based on a variety of factors including discounted expected cash flows, adjusted for estimated prepayments and credit losses. In accordance with ASC 326, the fair value adjustment is recorded as premium or discount to the unpaid principal balance of each acquired loan. Loans that have been identified as having experienced a more-than-insignificant deterioration in credit quality since origination is a purchased credit deteriorated (“PCD”) loan. The net premium or discount on PCD loans is adjusted by the Company’s allowance for credit losses recorded at the time of acquisition. The remaining net premium or discount is accreted or amortized into interest income over the remaining life of the loan using a constant yield method. The net premium or discount on loans that are not classified as PCD (“non-PCD”), that includes credit and non-credit components, is accreted or amortized into interest income over the remaining life of the loan using a constant yield method. The Company then records the necessary allowance for credit losses on the non-PCD loans through provision for credit losses expense.
For further discussion of our acquisition and loan accounting, see Note 2, Acquisitions, and Note 5, Loans and Allowance for Credit Losses.
Trust Assets
Trust assets (other than cash deposits) held by the Company in fiduciary or agency capacities for its customers are not included in the accompanying consolidated balance sheets since such items are not assets of the Company.
Premises and Equipment
Depreciable assets are stated at cost less accumulated depreciation. Depreciation is charged to expense using the straight-line method over the estimated useful lives of the assets. Leasehold improvements are capitalized and amortized by the straight-line method over the terms of the respective leases or the estimated useful lives of the improvements, whichever is shorter. Right-of-use lease assets are operating leases with a term greater than one year and are included in premises and equipment.
Foreclosed Assets Held For Sale
Assets acquired by foreclosure or in settlement of debt and held for sale are valued at estimated fair value less estimated cost to sell as of the date of foreclosure. Management evaluates the value of foreclosed assets held for sale periodically and any decreases in the fair value are charged to other expense.
Bank Owned Life Insurance
The Company maintains bank-owned life insurance policies on certain current and former employees and directors, which are recorded at their cash surrender values as determined by the insurance carriers. The appreciation in the cash surrender value of the policies is recognized as a component of non-interest income in the Company’s consolidated statements of income.
Goodwill and Intangible Assets
Goodwill represents the excess of the cost of an acquisition over the fair value of the net assets acquired. Other intangible assets represent purchased assets that also lack physical substance but can be separately distinguished from goodwill because of contractual or other legal rights or because the asset is capable of being sold or exchanged either on its own or in combination with a related contract, asset or liability. The Company performs an annual goodwill impairment test, and more than annually if circumstances warrant, in accordance with ASC Topic 350, Intangibles – Goodwill and Other, as amended by Accounting Standards Update (“ASU”) 2011-08 - Testing Goodwill for Impairment. ASC Topic 350 requires that goodwill and intangible assets that have indefinite lives be reviewed for impairment annually, or more frequently if certain conditions occur. Intangible assets with finite lives are amortized over the estimated life of the asset, and are reviewed for impairment whenever events or changes in circumstances indicated that the carrying value may not be recoverable. Impairment losses on recorded goodwill, if any, will be recorded as operating expenses.
Derivative Financial Instruments
The Company may enter into derivative contracts for the purposes of managing exposure to interest rate risk to meet the financing needs of its customers. A derivative instrument is a financial tool which derives its value from the value of some other financial
instrument, variable index, including certain hedging instruments embedded in other contracts. These products are primarily designed to reduce interest rate risk for either the Company or its customers who proactively manage these risks.
The Company records all derivatives on the balance sheet at fair value. In an effort to meet the financing needs of its customers and mitigate the impact of changing interest rates on the fair value of AFS securities, the Company has entered into fair value hedges. Fair value hedges include interest rate swap agreements on fixed rate loans and fixed rate callable AFS securities. To qualify for hedge accounting, derivatives must be highly effective at reducing the risk associated with the exposure being hedged and must be designated as a hedge at the point of inception of the derivative contract.
For derivatives designated as hedging the exposure to changes in the fair value of the hedged item, the gain or loss is recognized in earnings in the period of change together with the offsetting loss or gain of the hedging instrument. The fair value hedges are considered to be highly effective and any hedge ineffectiveness was deemed not material. Fair value adjustments related to cash flow hedges are recorded in other comprehensive income and are reclassified to earnings when the hedged transaction is reflected in earnings.
Securities Sold Under Agreements to Repurchase
The Company sells securities under agreements to repurchase to meet customer needs for sweep accounts. At the point funds deposited by customers become investable, those funds are used to purchase securities owned by the Company and held in its general account with the designation of Customers’ Securities. A third party maintains control over the securities underlying overnight repurchase agreements. The securities involved in these transactions are generally U.S. Treasury or Federal Agency issues. Securities sold under agreements to repurchase generally mature on the banking day following that on which the investment was initially purchased and are treated as collateralized financing transactions which are recorded at the amounts at which the securities were sold plus accrued interest. Interest rates and maturity dates of the securities involved vary and are not intended to be matched with funds from customers.
Revenue from Contracts with Customers
ASC Topic 606, Revenue from Contracts with Customers, applies to all contracts with customers to provide goods or services in the ordinary course of business. However, Topic 606 specifically does not apply to revenue related to financial instruments, guarantees, insurance contracts, leases, or nonmonetary exchanges. Given these scope exceptions, interest income recognition and measurement related to loans and investments securities, the Company’s two largest sources of revenue, are not accounted for under Topic 606. Also, the Company does not use Topic 606 to account for gains or losses on its investments in securities, loans, and derivatives due to the scope exceptions.
Certain revenue streams, such as service charges on deposit accounts, gains or losses on the sale of OREO, and trust income, fall under the scope of Topic 606 and the Company must recognize revenue at an amount that reflects the consideration to which the Company expects to be entitled in exchange for transferring goods or services to a customer. Topic 606 is applied using five steps: 1) identify the contract with the customer, 2) identify the performance obligations in the contract, 3) determine the transaction price, 4) allocate the transaction price to the performance obligations in the contract, and 5) recognize revenue when (or as) the entity satisfies a performance obligation.
The Company has evaluated the nature of all contracts with customers that fall under the scope of Topic 606 and determined that further disaggregation of revenue from contracts with customers into categories was not necessary. There has not been significant revenue recognized in the current reporting periods resulting from performance obligations satisfied in previous periods. In addition, there has not been a significant change in timing of revenues received from customers.
A description of performance obligations for each type of contract with customers is as follows:
Service charges on deposit accounts – The Company’s primary source of funding comes from deposit accounts with its customers. Customers pay certain fees to access their cash on deposit including, but not limited to, non-transactional fees such as account maintenance, dormancy or statement rendering fees, and certain transaction-based fees such as ATM, wire transfer, overdraft or returned check fees. The Company generally satisfies its performance obligations as services are rendered. The transaction prices are fixed, and are charged either on a periodic basis or based on activity.
Sale of OREO – In the normal course of business, the Company will enter into contracts with customers to sell OREO, which has generally been foreclosed upon by the Company. The Company generally satisfies its performance obligation upon conveyance of property from the Company to the customer, generally by way of an executed agreement. The transaction price is fixed, and on
occasion the Company will finance a portion of the proceeds the customers uses to purchase the property. These properties are generally sold without recourse or warranty.
Wealth Management Fees – The Company enters into contracts with its customers to manage assets for investment, and/or transact on their accounts. The Company generally satisfies its performance obligations as services are rendered. The management fee is a fixed percentage-based fee calculated upon the average balance of assets under management and is charged to customers on a monthly basis.
Bankcard Fee Income – Periodic bankcard fees, net of direct origination costs, are recognized as revenue on a straight-line basis over the period the fee entitles the cardholder to use the card.
Income Taxes
The Company accounts for income taxes in accordance with income tax accounting guidance in ASC Topic 740, Income Taxes. The income tax accounting guidance results in two components of income tax expense: current and deferred. Current income tax expense reflects taxes to be paid or refunded for the current period by applying the provisions of the enacted tax law to the taxable income or excess of deductions over revenues. The Company determines deferred income taxes using the liability (or balance sheet) method. Under this method, the net deferred tax asset or liability is based on the tax effects of the differences between the book and tax bases of assets and liabilities, and enacted changes in tax rates and laws are recognized in the period in which they occur.
Deferred income tax expense results from changes in deferred tax assets and liabilities between periods. Deferred tax assets are recognized if it is more likely than not, based on the technical merits, that the tax position will be realized or sustained upon examination. The term more likely than not means a likelihood of more than 50 percent; the terms examined and upon examination also include resolution of the related appeals or litigation processes, if any. A tax position that meets the more-likely-than-not recognition threshold is initially and subsequently measured as the largest amount of tax benefit that has a greater than 50 percent likelihood of being realized upon settlement with a taxing authority that has full knowledge of all relevant information. The determination of whether or not a tax position has met the more-likely-than-not recognition threshold considers the facts, circumstances and information available at the reporting date and is subject to management’s judgment. Deferred tax assets are reduced by a valuation allowance if, based on the weight of evidence available, it is more likely than not that some portion or all of a deferred tax asset will not be realized.
The Company files consolidated income tax returns with its subsidiaries.
Earnings Per Share
Basic earnings per share are computed based on the weighted average number of shares outstanding during each year. Diluted earnings per share are computed using the weighted average common shares and all potential dilutive common shares outstanding during the period.
The computation of per share earnings is as follows:
| | | | | | | | | | | | | | | | | |
| (In thousands, except per share data) | 2021 | | 2020 | | 2019 |
| Net income available to common stockholders | $ | 271,109 | | | $ | 254,852 | | | $ | 237,828 | |
| | | | | |
| Average common shares outstanding | 109,577 | | | 109,860 | | | 98,351 | |
| Average potential dilutive common shares | 621 | | | 313 | | | 446 | |
| Average diluted common shares | 110,198 | | | 110,173 | | | 98,797 | |
| | | | | |
| Basic earnings per share | $ | 2.47 | | | $ | 2.32 | | | $ | 2.42 | |
| Diluted earnings per share | $ | 2.46 | | | $ | 2.31 | | | $ | 2.41 | |
There were no stock options excluded from earnings per share calculations due to the related stock option exercise price exceeding the average market price for the years ended December 31, 2021 and 2019. There were approximately 653,718 stock options excluded from the year ended December 31, 2020 earnings per share calculation due to the related stock option exercise price exceeding the average market price.
Stock-Based Compensation
The Company has adopted various stock-based compensation plans. The plans provide for the grant of incentive stock options, nonqualified stock options, stock appreciation rights, restricted stock awards, restricted stock units and performance stock units. Pursuant to the plans, shares are reserved for future issuance by the Company, upon exercise of stock options or awarding of performance or bonus shares granted to directors, officers and other key employees. In accordance with ASC Topic 718, Compensation – Stock Compensation, the fair value of each option award is estimated on the date of grant using the Black-Scholes option-pricing model that uses various assumptions. This model requires the input of highly subjective assumptions, changes to which can materially affect the fair value estimate. For additional information, see Note 15, Employee Benefit Plans.
NOTE 2: ACQUISITIONS
Landmark Community Bank
On October 8, 2021, the Company completed its acquisition of Landmark Community Bank (“Landmark”) pursuant to the terms of the Agreement and Plan of Merger dated as of June 4, 2021 (“Landmark Agreement”), at which time Landmark merged with and into Simmons Bank, with Simmons Bank continuing as the surviving entity. The Company issued 4,499,872 shares of its common stock valued at approximately $138.2 million as of October 8, 2021, plus $6,451,727.43 in cash, in exchange for all outstanding shares of Landmark capital stock (and common stock equivalents) to effect the merger.
Prior to the acquisition, Landmark, headquartered in Collierville, Tennessee, conducted banking business from 8 branches located in the Memphis and Nashville, Tennessee, metropolitan areas. Including the effects of the acquisition method accounting adjustments, the Company acquired approximately $968.5 million in assets, including approximately $789.3 million in loans (inclusive of loan discounts), and approximately $802.7 million in deposits.
Goodwill of $31.7 million was recorded as a result of the transaction. The merger strengthened the Company’s market share and brought forth additional opportunities in the Company’s current footprint, which gave rise to the goodwill recorded. The goodwill will not be deductible for tax purposes.
A summary, at fair value, of the assets acquired and liabilities assumed in the Landmark acquisition, as of the acquisition date, is as follows:
| | | | | | | | | | | | | | | | | |
| (In thousands) | Acquired from Landmark | | Fair Value Adjustments | | Fair Value |
| Assets Acquired | | | | | |
| Cash and due from banks | $ | 27,591 | | | $ | — | | | $ | 27,591 | |
| Due from banks - time | 100 | | | — | | | 100 | |
| Investment securities | 114,793 | | | (265) | | | 114,528 | |
| Loans acquired | 785,551 | | | 3,767 | | | 789,318 | |
| Allowance for credit losses on loans | (5,980) | | | 3,621 | | | (2,359) | |
| Premises and equipment | 9,540 | | | (4,099) | | | 5,441 | |
| Bank owned life insurance | 21,287 | | | — | | | 21,287 | |
| Core deposit intangible | 88 | | | 4,071 | | | 4,159 | |
| Other assets | 13,036 | | | (4,608) | | | 8,428 | |
| Total assets acquired | $ | 966,006 | | | $ | 2,487 | | | $ | 968,493 | |
| | | | | |
| | | | | | | | | | | | | | | | | |
| (In thousands) | Acquired from Landmark | | Fair Value Adjustments | | Fair Value |
| Liabilities Assumed | | | | | |
| Deposits: | | | | | |
| Non-interest bearing transaction accounts | $ | 110,393 | | | $ | — | | | $ | 110,393 | |
| Interest bearing transaction accounts and savings deposits | 425,777 | | | — | | | 425,777 | |
| Time deposits | 266,835 | | | (334) | | | 266,501 | |
| Total deposits | 803,005 | | | (334) | | | 802,671 | |
| Other borrowings | 47,023 | | | — | | | 47,023 | |
| Accrued interest and other liabilities | 8,459 | | | (3,122) | | | 5,337 | |
| Total liabilities assumed | 858,487 | | | (3,456) | | | 855,031 | |
| Equity | 107,519 | | | (107,519) | | | — | |
| Total equity assumed | 107,519 | | | (107,519) | | | — | |
| Total liabilities and equity assumed | $ | 966,006 | | | $ | (110,975) | | | $ | 855,031 | |
| Net assets acquired | | | | | 113,462 | |
| Purchase price | | | | | 145,195 | |
| Goodwill | | | | | $ | 31,733 | |
The purchase price allocation and certain fair value measurements remain preliminary due to the timing of the merger. Management will continue to review the estimated fair values and evaluate the assumed tax positions. The Company expects to finalize its analysis of the acquired assets and assumed liabilities in this transaction within one year of the completion of the merger. Therefore, adjustments to the estimated amounts and carrying values may occur.
The Company’s operating results include the operating results of the acquired assets and assumed liabilities of Landmark subsequent to the acquisition date.
Triumph Bancshares, Inc.
On October 8, 2021, the Company completed its merger with Triumph Bancshares, Inc. (“Triumph”) pursuant to the terms of the Agreement and Plan of Merger dated as of June 4, 2021 (“Triumph Agreement”), at which time Triumph merged with and into the Company, with the Company continuing as the surviving corporation. The Company issued 4,164,712 shares of its common stock valued at approximately $127.9 million as of October 8, 2021, plus $1,693,402.93 in cash, in exchange for all outstanding shares of Triumph capital stock (and common stock equivalents) to effect the merger.
Prior to the acquisition, Triumph, headquartered in Memphis, Tennessee, conducted banking business through its subsidiary bank, Triumph Bank, from 6 branches located in the Memphis and Nashville, Tennessee, metropolitan areas. Including the effects of the acquisition method accounting adjustments, the Company acquired approximately $848.2 million in assets, including approximately $700.4 million in loans (inclusive of loan discounts), and approximately $719.7 million in deposits.
Goodwill of $39.0 million was recorded as a result of the transaction. The merger strengthened the Company’s market share and brought forth additional opportunities in the Company’s current footprint, which gave rise to the goodwill recorded. The goodwill will not be deductible for tax purposes.
A summary, at fair value, of the assets acquired and liabilities assumed in the Triumph acquisition, as of the acquisition date, is as follows:
| | | | | | | | | | | | | | | | | |
| (In thousands) | Acquired from Triumph | | Fair Value Adjustments | | Fair Value |
| Assets Acquired | | | | | |
| Cash and due from banks | $ | 7,484 | | | $ | — | | | $ | 7,484 | |
| Due from banks - time | 495 | | | — | | | 495 | |
| Investment securities | 130,571 | | | (1,106) | | | 129,465 | |
| Loans acquired | 702,460 | | | (2,020) | | | 700,440 | |
| Allowance for credit losses on loans | (12,617) | | | 1,525 | | | (11,092) | |
| Premises and equipment | 2,774 | | | 484 | | | 3,258 | |
| Goodwill | 1,550 | | | (1,550) | | | — | |
| Core deposit intangible | — | | | 5,136 | | | 5,136 | |
| Other assets | 12,806 | | | 209 | | | 13,015 | |
| Total assets acquired | $ | 845,523 | | | $ | 2,678 | | | $ | 848,201 | |
| | | | | |
| Liabilities Assumed | | | | | |
| Deposits: | | | | | |
| Non-interest bearing transaction accounts | $ | 115,729 | | | $ | — | | | $ | 115,729 | |
| Interest bearing transaction accounts and savings deposits | 383,434 | | | — | | | 383,434 | |
| Time deposits | 219,477 | | | 1,094 | | | 220,571 | |
| Total deposits | 718,640 | | | 1,094 | | | 719,734 | |
| Other borrowings | 2,854 | | | — | | | 2,854 | |
| Subordinated debentures | 30,700 | | | — | | | 30,700 | |
| Accrued interest and other liabilities | 2,882 | | | 455 | | | 3,337 | |
| Total liabilities assumed | 755,076 | | | 1,549 | | | 756,625 | |
| Equity | 90,446 | | | (90,446) | | | — | |
| Total equity assumed | 90,446 | | | (90,446) | | | — | |
| Total liabilities and equity assumed | $ | 845,522 | | | $ | (88,897) | | | $ | 756,625 | |
| Net assets acquired | | | | | 91,576 | |
| Purchase price | | | | | 130,544 | |
| Goodwill | | | | | $ | 38,968 | |
The purchase price allocation and certain fair value measurements remain preliminary due to the timing of the merger. Management will continue to review the estimated fair values and evaluate the assumed tax positions. The Company expects to finalize its analysis of the acquired assets and assumed liabilities in this transaction within one year of the completion of the merger. Therefore, adjustments to the estimated amounts and carrying values may occur.
The Company’s operating results include the operating results of the acquired assets and assumed liabilities of Triumph subsequent to the acquisition date.
The Landrum Company
On October 31, 2019, the Company completed its merger with The Landrum Company (“Landrum”) pursuant to the terms of the Agreement and Plan of Merger dated as of July 30, 2019 (“Landrum Agreement”), at which time Landrum merged with and into the Company, with the Company continuing as the surviving corporation. Pursuant to the terms of the Landrum Agreement, the shares of Landrum Class A Common Voting Stock, par value $0.01 per share, and Landrum Class B Common Nonvoting Stock, par value $0.01 per share, were converted into the right to receive, in the aggregate, approximately 17,350,000 shares of the Company’s common stock and each share of Landrum’s series E preferred stock was converted into the right to receive one share of the Company’s comparable series D preferred stock. The Company issued 17,349,722 shares of its common stock and 767 shares of its series D preferred stock, par value $0.01 per share, in exchange for all outstanding shares of Landrum capital stock to effect the merger.
Prior to the acquisition, Landrum, headquartered in Columbia, Missouri, conducted banking business through its subsidiary bank, Landmark Bank, from 39 branches located in Missouri, Oklahoma and Texas. Including the effects of the acquisition method accounting adjustments, the Company acquired approximately $3.4 billion in assets, including approximately $2.0 billion in loans (inclusive of loan discounts), and approximately $3.0 billion in deposits. The systems conversion occurred on February 14, 2020, at which time Landmark Bank merged into Simmons Bank, with Simmons Bank as the surviving institution.
Goodwill of $151.1 million was recorded as a result of the transaction. The merger strengthened the Company’s market share and brought forth additional opportunities in the Company’s current footprint, which gave rise to the goodwill recorded. The goodwill will not be deductible for tax purposes.
A summary, at fair value, of the assets acquired and liabilities assumed in the Landrum acquisition, as of the acquisition date, is as follows:
| | | | | | | | | | | | | | | | | |
| (In thousands) | Acquired from Landrum | | Fair Value Adjustments | | Fair Value |
| Assets Acquired | | | | | |
| Cash and due from banks | $ | 215,285 | | | $ | — | | | $ | 215,285 | |
| Due from banks - time | 248 | | | — | | | 248 | |
| Investment securities | 1,021,755 | | | 4,228 | | | 1,025,983 | |
| Loans acquired | 2,049,137 | | | (43,651) | | | 2,005,486 | |
| Allowance for loan losses | (22,736) | | | 22,736 | | | — | |
| Foreclosed assets | 373 | | | (183) | | | 190 | |
| Premises and equipment | 63,878 | | | 18,781 | | | 82,659 | |
| Bank owned life insurance | 19,206 | | | — | | | 19,206 | |
| Goodwill | 407 | | | (407) | | | — | |
| Core deposit intangible | — | | | 24,345 | | | 24,345 | |
| Other intangibles | 412 | | | 4,704 | | | 5,116 | |
| Other assets | 33,924 | | | (13,290) | | | 20,634 | |
| Total assets acquired | $ | 3,381,889 | | | $ | 17,263 | | | $ | 3,399,152 | |
| | | | | |
| Liabilities Assumed | | | | | |
| Deposits: | | | | | |
| Non-interest bearing transaction accounts | $ | 716,675 | | | $ | — | | | $ | 716,675 | |
| Interest bearing transaction accounts and savings deposits | 1,465,429 | | | — | | | 1,465,429 | |
| Time deposits | 867,197 | | | 299 | | | 867,496 | |
| Total deposits | 3,049,301 | | | 299 | | | 3,049,600 | |
| Other borrowings | 10,055 | | | — | | | 10,055 | |
| Subordinated debentures | 34,794 | | | (877) | | | 33,917 | |
| Accrued interest and other liabilities | 31,057 | | | 9,869 | | | 40,926 | |
| Total liabilities assumed | 3,125,207 | | | 9,291 | | | 3,134,498 | |
| Equity | 256,682 | | | (256,682) | | | — | |
| Total equity assumed | 256,682 | | | (256,682) | | | — | |
| Total liabilities and equity assumed | $ | 3,381,889 | | | $ | (247,391) | | | $ | 3,134,498 | |
| Net assets acquired | | | | | 264,654 | |
| Purchase price | | | | | 415,779 | |
| Goodwill | | | | | $ | 151,125 | |
During 2020, the Company finalized its analysis of the loans acquired along with other acquired assets and assumed liabilities.
The Company’s operating results include the operating results of the acquired assets and assumed liabilities of Landrum subsequent to the acquisition date.
Reliance Bancshares, Inc.
On April 12, 2019, the Company completed its merger with Reliance Bancshares, Inc. (“Reliance”), headquartered in the St. Louis, Missouri, metropolitan area, pursuant to the terms of the Agreement and Plan of Merger (“Reliance Agreement”), dated November 13, 2018, as amended February 11, 2019. In the merger, each outstanding share of Reliance common stock, as well as each Reliance common stock equivalent, was canceled and converted into the right to receive shares of the Company’s common stock and/or cash in accordance with the terms of the Reliance Agreement. In addition, each share of Reliance’s Series A Preferred Stock and Series B Preferred Stock was converted into the right to receive one share of Simmons’ comparable Series A Preferred Stock or Series B Preferred Stock, respectively, and each share of Reliance’s Series C Preferred Stock was converted into the right to receive one share of Simmons’ comparable Series C Preferred Stock (unless the holder of such Series C Preferred Stock elected to receive alternate consideration in accordance with the Reliance Agreement). The Company issued 3,999,623 shares of its common stock and paid $62.7 million in cash to effect the merger. The Company also issued $42.0 million of its Series A Preferred Stock and Series B Preferred Stock. On May 13, 2019, the Company redeemed all of the preferred stock issued in connection with the merger, and paid all accrued and unpaid dividends up to the date of redemption. On October 29, 2019, the Company amended its Amended and Restated Articles of Incorporation to cancel the Series C Preferred Stock, having 140 authorized shares, of which no shares were ever issued or outstanding.
Prior to the acquisition, Reliance conducted banking business through its subsidiary bank, Reliance Bank, from 22 branches located in Missouri and Illinois. Including the effects of the acquisition method accounting adjustments, the Company acquired approximately $1.5 billion in assets, including approximately $1.1 billion in loans (inclusive of loan discounts), and approximately $1.2 billion in deposits. Contemporaneously with the completion of the Reliance merger, Reliance Bank was merged into Simmons Bank, with Simmons Bank as the surviving institution.
Goodwill of $78.5 million was recorded as a result of the transaction. The merger strengthened the Company’s market share and brought forth additional opportunities in the Company’s St. Louis metropolitan area footprint, which gave rise to the goodwill recorded. The goodwill will not be deductible for tax purposes.
A summary, at fair value, of the assets acquired and liabilities assumed in the Reliance transaction, as of the acquisition date, is as follows:
| | | | | | | | | | | | | | | | | |
| (In thousands) | Acquired from Reliance | | Fair Value Adjustments | | Fair Value |
| Assets Acquired | | | | | |
| Cash and due from banks | $ | 25,693 | | | $ | — | | | $ | 25,693 | |
| Due from banks - time | 502 | | | — | | | 502 | |
| Investment securities | 287,983 | | | (1,873) | | | 286,110 | |
| Loans acquired | 1,138,527 | | | (41,657) | | | 1,096,870 | |
| Allowance for loan losses | (10,808) | | | 10,808 | | | — | |
| Foreclosed assets | 11,092 | | | (5,180) | | | 5,912 | |
| Premises and equipment | 32,452 | | | (3,001) | | | 29,451 | |
| Bank owned life insurance | 39,348 | | | — | | | 39,348 | |
| Core deposit intangible | — | | | 18,350 | | | 18,350 | |
| Other assets | 25,165 | | | 6,911 | | | 32,076 | |
| Total assets acquired | $ | 1,549,954 | | | $ | (15,642) | | | $ | 1,534,312 | |
| | | | | |
| | | | | | | | | | | | | | | | | |
| (In thousands) | Acquired from Reliance | | Fair Value Adjustments | | Fair Value |
| Liabilities Assumed | | | | | |
| Deposits: | | | | | |
| Non-interest bearing transaction accounts | $ | 108,845 | | | $ | (33) | | | $ | 108,812 | |
| Interest bearing transaction accounts and savings deposits | 639,798 | | | — | | | 639,798 | |
| Time deposits | 478,415 | | | (1,758) | | | 476,657 | |
| Total deposits | 1,227,058 | | | (1,791) | | | 1,225,267 | |
| Securities sold under agreement to repurchase | 14,146 | | | — | | | 14,146 | |
| Other borrowings | 162,900 | | | (5,500) | | | 157,400 | |
| Accrued interest and other liabilities | 8,185 | | | 268 | | | 8,453 | |
| Total liabilities assumed | 1,412,289 | | | (7,023) | | | 1,405,266 | |
| Equity | 137,665 | | | (137,665) | | | — | |
| Total equity assumed | 137,665 | | | (137,665) | | | — | |
| Total liabilities and equity assumed | $ | 1,549,954 | | | $ | (144,688) | | | $ | 1,405,266 | |
| Net assets acquired | | | | | 129,046 | |
| Purchase price | | | | | 207,539 | |
| Goodwill | | | | | $ | 78,493 | |
During 2020, the Company finalized its analysis of the loans acquired along with other acquired assets and assumed liabilities.
The Company’s operating results include the operating results of the acquired assets and assumed liabilities of Reliance subsequent to the acquisition date.
The following is a description of the methods used to determine the fair values of significant assets and liabilities presented in the acquisitions above.
Cash and due from banks and time deposits due from banks – The carrying amount of these assets is a reasonable estimate of fair value based on the short-term nature of these assets.
Investment securities – Investment securities were acquired with an adjustment to fair value based upon quoted market prices if material. Otherwise, the carrying amount of these assets was deemed to be a reasonable estimate of fair value.
Loans acquired – Fair values for loans were based on a discounted cash flow methodology that considered factors including the type of loan and related collateral, classification status, fixed or variable interest rate, term of loan and whether or not the loan was amortizing, and current discount rates. The discount rates used for loans are based on current market rates for new originations of comparable loans and include adjustments for liquidity concerns. The discount rate does not include a factor for credit losses as that has been included in the estimated cash flows. Loans were grouped together according to similar characteristics and were treated in the aggregate when applying various valuation techniques. See Note 5, Loans and Allowance for Credit Losses, in the accompanying Notes to Consolidated Financial Statements for additional information related to purchased financial assets with credit deterioration.
Foreclosed assets – These assets are presented at the estimated present values that management expects to receive when the properties are sold, net of related costs of disposal.
Premises and equipment – Bank premises and equipment were acquired with an adjustment to fair value, which represents the difference between the Company’s current analysis of property and equipment values completed in connection with the acquisition and book value acquired.
Bank owned life insurance – Bank owned life insurance is carried at its current cash surrender value, which is the most reasonable estimate of fair value.
Goodwill – The consideration paid as a result of the acquisition exceeded the fair value of the assets acquired, resulting in an intangible asset, goodwill. Goodwill established prior to the acquisitions, if applicable, was written off.
Core deposit intangible – This intangible asset represents the value of the relationships that the acquired banks had with their deposit customers. The fair value of this intangible asset was estimated based on a discounted cash flow methodology that gave appropriate consideration to expected customer attrition rates, cost of the deposit base and the net maintenance cost attributable to customer deposits. Any core deposit intangible established prior to the acquisitions, if applicable, was written off.
Other intangibles – These intangible assets represent the value of the relationship that Landrum had with their trust and wealth management customers. The fair value of these intangible assets was estimated based on a combination of discounted cash flow methodology and a market valuation approach. Intangible assets for Landrum also included mortgage servicing rights. Other intangibles established prior to the acquisitions, if applicable, were written off.
Other assets – The fair value adjustment results from certain assets whose value was estimated to be more or less than book value, such as certain prepaid assets, receivables and other miscellaneous assets. Otherwise, the carrying amount of these assets was deemed to be a reasonable estimate of fair value.
Deposits – The fair values used for the demand and savings deposits that comprise the transaction accounts acquired, by definition equal the amount payable on demand at the acquisition date. The Company performed a fair value analysis of the estimated weighted average interest rate of the certificates of deposits compared to the current market rates and recorded a fair value adjustment for the difference when material.
Securities sold under agreement to repurchase – The carrying amount of securities sold under agreement to repurchase is a reasonable estimate of fair value based on the short-term nature of these liabilities.
Other borrowings – The fair value of other borrowings is estimated based on borrowing rates currently available to the Company for borrowings with similar terms and maturities.
Subordinated debentures – The fair value of subordinated debentures is estimated based on borrowing rates currently available to the Company for borrowings with similar terms and maturities.
Accrued interest and other liabilities – The fair value adjustment results from certain liabilities whose value was estimated to be more or less than book value, such as certain accounts payable and other miscellaneous liabilities. The adjustment also establishes a liability for unfunded commitments equal to the fair value of that liability at the date of acquisition. The carrying amount of accrued interest and the remainder of other liabilities was deemed to be a reasonable estimate of fair value.
Spirit of Texas Bancshares, Inc. (Pending Acquisition)
On November 19, 2021, the Company announced that it had entered into an Agreement and Plan of Merger (“Spirit Agreement”) with Spirit of Texas Bancshares, Inc. (“Spirit”), headquartered in Conroe, Texas, to acquire Spirit, including its wholly-owned bank subsidiary, Spirit of Texas Bank SSB. According to the terms and subject to the conditions of the Spirit Agreement, upon consummation of the transaction, holders of Spirit’s common stock and common stock equivalents will receive, in the aggregate, 18,325,000 shares of the Company’s common stock, subject to certain conditions and potential adjustments under the Agreement, including substituting cash for the Company’s common stock to the extent necessary to cash out Spirit’s stock options and warrants (the “Merger Consideration”). Based on the closing price of $31.73 for Simmons common stock on November 17, 2021, the Merger Consideration would have an implied aggregate value of approximately $581 million.
Spirit conducts banking business from 37 locations primarily in the Texas Triangle – consisting of the Dallas-Fort Worth, Houston, San Antonio and Austin metropolitan areas – with additional locations in the Bryan-College Station, Corpus Christi and Tyler metropolitan areas, along with offices in North Central and South Texas. As of December 31, 2021, Spirit had approximately $3.3 billion in assets, $2.3 billion in loans and $2.8 billion in deposits. Completion of the transaction is expected during the second quarter of 2022 and is subject to certain closing conditions, including approval by the shareholders of Spirit, as well as customary regulatory approvals. Simultaneously with the closing of the transaction, Spirit Bank is expected to be merged with and into Simmons Bank.
NOTE 3: INVESTMENT SECURITIES
Held-to-maturity (“HTM”) securities, which include any security for which the Company has the positive intent and ability to hold until maturity, are carried at historical cost adjusted for amortization of premiums and accretion of discounts. Premiums and discounts are amortized and accreted, respectively, to interest income using the constant effective yield method over the security’s estimated life. Prepayments are anticipated for mortgage-backed and SBA securities. Premiums on callable securities are amortized to their earliest call date.
Available-for-sale (“AFS”) securities, which include any security for which the Company has no immediate plan to sell but which may be sold in the future, are carried at fair value. Realized gains and losses, based on specifically identified amortized cost of the individual security, are included in other income. Unrealized gains and losses are recorded, net of related income tax effects, in stockholders’ equity, further discussed below. Premiums and discounts are amortized and accreted, respectively, to interest income using the constant effective yield method over the estimated life of the security. Prepayments are anticipated for mortgage-backed and SBA securities. Premiums on callable securities are amortized to their earliest call date.
During the third quarter of 2021, the Company transferred, at fair value, $500.8 million of securities from the AFS portfolio to the HTM portfolio. The related net unrealized gains of $1.0 million remained in accumulated other comprehensive income (loss) at December 31, 2021 and will be amortized over the remaining life of the securities. No gains or losses on these securities were recognized at the time of transfer.
The amortized cost, fair value and allowance for credit losses of investment securities that are classified as HTM are as follows:
| | | | | | | | | | | | | | | | | | | | | | | | | | | | | | | | | | | |
| (In thousands) | Amortized Cost | | Allowance
for Credit Losses | | Net Carrying Amount | | Gross Unrealized
Gains | | Gross Unrealized
(Losses) | | Estimated Fair
Value |
| Held-to-maturity | | | | | | | | | | | |
| | | | | | | | | | | |
| December 31, 2021 | | | | | | | | | | | |
| U.S. Government agencies | 232,609 | | | — | | | 232,609 | | | — | | | (7,914) | | | 224,695 | |
| Mortgage-backed securities | $ | 70,342 | | | $ | — | | | $ | 70,342 | | | $ | 232 | | | $ | (1,425) | | | $ | 69,149 | |
| State and political subdivisions | 1,210,248 | | | (1,197) | | | 1,209,051 | | | 6,166 | | | (8,462) | | | 1,206,755 | |
| Other securities | 17,301 | | | (82) | | | 17,219 | | | — | | | (440) | | | 16,779 | |
| Total HTM | $ | 1,530,500 | | | $ | (1,279) | | | $ | 1,529,221 | | | $ | 6,398 | | | $ | (18,241) | | | $ | 1,517,378 | |
| | | | | | | | | | | |
| December 31, 2020 | | | | | | | | | | | |
| Mortgage-backed securities | 22,354 | | | — | | | 22,354 | | | 683 | | | — | | | 23,037 | |
| State and political subdivisions | $ | 312,416 | | | $ | (2,307) | | | $ | 310,109 | | | $ | 8,148 | | | $ | (30) | | | $ | 318,227 | |
| Other securities | 1,176 | | | (608) | | | 568 | | | 93 | | | — | | | 661 | |
| Total HTM | $ | 335,946 | | | $ | (2,915) | | | $ | 333,031 | | | $ | 8,924 | | | $ | (30) | | | $ | 341,925 | |
Mortgage-backed securities (“MBS”) are commercial MBS, secured by commercial properties, and residential MBS, generally secured by single-family residential properties. All mortgage-backed securities included in the table above were issued by U.S. government agencies or corporations. As of December 31, 2021, HTM MBS consisted of $4.9 million and $65.5 million of commercial MBS and residential MBS, respectively. As of December 31, 2020, HTM MBS consisted of $7.7 million and $14.7 million of commercial MBS and residential MBS, respectively.
The amortized cost, fair value and allowance for credit losses of investment securities that are classified as AFS are as follows:
| | | | | | | | | | | | | | | | | | | | | | | | | | | | | |
| (In thousands) | Amortized
Cost | | Allowance for Credit Losses | | Gross Unrealized
Gains | | Gross Unrealized
(Losses) | | Estimated Fair
Value |
| Available-for-sale | | | | | | | | | |
| | | | | | | | | |
| December 31, 2021 | | | | | | | | | |
| U.S. Treasury | 300 | | | — | | | — | | | — | | | 300 | |
| U.S. Government agencies | $ | 374,754 | | | $ | — | | | $ | 495 | | | $ | (10,608) | | | $ | 364,641 | |
| Mortgage-backed securities | 4,485,548 | | | — | | | 6,307 | | | (43,239) | | | 4,448,616 | |
| State and political subdivisions | 1,791,097 | | | — | | | 30,556 | | | (1,995) | | | 1,819,658 | |
| Other securities | 479,162 | | | — | | | 6,647 | | | (5,479) | | | 480,330 | |
| Total AFS | $ | 7,130,861 | | | $ | — | | | $ | 44,005 | | | $ | (61,321) | | | $ | 7,113,545 | |
| | | | | | | | | |
| December 31, 2020 | | | | | | | | | |
| U.S. Government agencies | $ | 477,693 | | | $ | — | | | $ | 844 | | | $ | (1,300) | | | $ | 477,237 | |
| Mortgage-backed securities | 1,374,769 | | | — | | | 21,261 | | | (1,094) | | | 1,394,936 | |
| State and political subdivisions | 1,416,136 | | | (217) | | | 55,111 | | | (307) | | | 1,470,723 | |
| Other securities | 128,445 | | | (95) | | | 2,447 | | | (95) | | | 130,702 | |
| Total AFS | $ | 3,397,043 | | | $ | (312) | | | $ | 79,663 | | | $ | (2,796) | | | $ | 3,473,598 | |
All mortgage-backed securities included in the table above were issued by U.S. government agencies or corporations. As of December 31, 2021, AFS MBS consisted of $1.53 billion and $2.92 billion of commercial MBS and residential MBS, respectively. As of December 31, 2020, AFS MBS consisted of $406.1 million and $988.8 million of commercial MBS and residential MBS, respectively.
Accrued interest receivable on HTM and AFS securities at December 31, 2021 was $9.7 million and $23.4 million, respectively, and is included in interest receivable on the consolidated balance sheets. The Company has made the election to exclude all accrued interest receivable from securities from the estimate of credit losses.
The following table summarizes the Company’s AFS investments in an unrealized loss position for which an allowance for credit loss has not been recorded as of December 31, 2021, aggregated by investment category and length of time that individual securities have been in a continuous unrealized loss position:
| | | | | | | | | | | | | | | | | | | | | | | | | | | | | | | | | | | |
| | Less Than 12 Months | | 12 Months or More | | Total |
| (In thousands) | Estimated
Fair
Value | | Gross
Unrealized
Losses | | Estimated
Fair
Value | | Gross
Unrealized
Losses | | Estimated
Fair
Value | | Gross
Unrealized
Losses |
| Available-for-sale | | | | | | | | | | | |
| U.S. Government agencies | $ | 152,908 | | | $ | (3,297) | | | $ | 160,913 | | | $ | (7,311) | | | $ | 313,821 | | | $ | (10,608) | |
| Mortgage-backed securities | 3,632,822 | | | (33,551) | | | 323,683 | | | (9,688) | | | 3,956,505 | | | (43,239) | |
| State and political subdivisions | 530,647 | | | (709) | | | 29,565 | | | (1,286) | | | 560,212 | | | (1,995) | |
| Other securities | 228,182 | | | (5,240) | | | 6,984 | | | (239) | | | 235,166 | | | (5,479) | |
| Total AFS | $ | 4,544,559 | | | $ | (42,797) | | | $ | 521,145 | | | $ | (18,524) | | | $ | 5,065,704 | | | $ | (61,321) | |
As of December 31, 2021, the Company’s investment portfolio included $7.11 billion of AFS securities, of which $5.07 billion, or 71.2%, were in an unrealized loss position that are not deemed to have credit losses. A portion of the unrealized losses were related to the Company’s mortgage-backed securities, which are issued and guaranteed by U.S. government-sponsored entities and agencies, and the Company’s state and political securities, specifically investments in insured fixed rate municipal bonds for which the issuers continue to make timely principal and interest payments under the contractual terms of the securities.
Furthermore, the decline in fair value for each of the above AFS securities is attributable to the rates for those investments yielding less than current market rates. Management does not believe any of the securities are impaired due to reasons of credit quality. Management believes the declines in fair value for the securities are temporary. Management does not have the intent to
sell the securities, and management believes it is more likely than not the Company will not have to sell the securities before recovery of their amortized cost basis.
Allowance for Credit Losses
All MBS held by the Company are issued by U.S. government-sponsored entities and agencies. These securities are either explicitly or implicitly guaranteed by the U.S. government, are highly rated by major rating agencies and have a long history of no credit losses. Accordingly, no allowance for credit losses has been recorded for these securities.
Regarding securities issued by state and political subdivisions and other HTM securities, management considers (i) issuer bond ratings, (ii) historical loss rates for given bond ratings, (iii) whether issuers continue to make timely principal and interest payments under the contractual terms of the securities, (iv) internal forecasts, (v) whether or not such securities provide insurance or other credit enhancement or are pre-refunded by the issuers.
The following table details activity in the allowance for credit losses by investment security type for the years ended December 31, 2021 and 2020 on the Company’s HTM and AFS securities held.
| | | | | | | | | | | | | | | | | |
| (In thousands) | State and Political Subdivisions | | Other Securities | | Total |
| December 31, 2021 | | | | | |
| | | | | |
| Held-to-maturity | | | | | |
| Beginning balance, January 1, 2021 | $ | 2,307 | | | $ | 608 | | | $ | 2,915 | |
| Provision for credit loss expense | (1,110) | | | (73) | | | (1,183) | |
| Securities charged-off | — | | | (600) | | | (600) | |
| Recoveries | — | | | 147 | | | 147 | |
| Ending balance, December 31, 2021 | $ | 1,197 | | | $ | 82 | | | $ | 1,279 | |
| | | | | |
| Available-for-sale | | | | | |
| Beginning balance, January 1, 2021 | $ | 217 | | | $ | 95 | | | $ | 312 | |
| Reduction due to sales | — | | | (11) | | | (11) | |
| Net decrease in allowance on previously impaired securities | (217) | | | (84) | | | (301) | |
| Ending balance, December 31, 2021 | $ | — | | | $ | — | | | $ | — | |
| | | | | |
| December 31, 2020 | | | | | |
| Held-to-maturity | | | | | |
| Beginning balance, January 1, 2020 | $ | — | | | $ | — | | | $ | — | |
| Impact of ASU 2016-13 adoption | 58 | | | 311 | | | 369 | |
| Provision for credit loss expense | 2,249 | | | 297 | | | 2,546 | |
| Ending balance, December 31, 2020 | $ | 2,307 | | | $ | 608 | | | $ | 2,915 | |
| | | | | |
| Available-for-sale | | | | | |
| Beginning balance, January 1, 2020 | $ | — | | | $ | — | | | $ | — | |
| Impact of ASU 2016-13 adoption | 373 | | | — | | | 373 | |
| Credit losses on securities not previously recorded | 199 | | | 113 | | | 312 | |
| Reduction due to sales | (244) | | | — | | | (244) | |
| Net decrease in allowance on previously impaired securities | (111) | | | (18) | | | (129) | |
| Ending balance, December 31, 2020 | $ | 217 | | | $ | 95 | | | $ | 312 | |
Based upon the Company’s analysis of the underlying risk characteristics of its AFS portfolio, including credit ratings and other qualitative factors, as previously discussed, there was no provision for credit losses related to AFS securities recorded in the last half of 2021. During the year ended December 31, 2021 and 2020, the provision for credit losses was reduced by $312,000 and $61,000, respectively, related to AFS securities.
The following table summarizes bond ratings for the Company’s HTM portfolio issued by state and political subdivisions and other securities as of December 31, 2021:
| | | | | | | | | | | | | | | | | | | | | | | | | | | | | |
| State and Political Subdivisions | | |
| (In thousands) | Not Guaranteed or Pre-Refunded | | Other Credit Enhancement or Insurance | | Pre-Refunded | | Total | | Other Securities |
| Aaa/AAA | $ | 129,473 | | | $ | 102,712 | | | $ | — | | | $ | 232,185 | | | $ | — | |
| Aa/AA | 481,887 | | | 316,345 | | | — | | | 798,232 | | | — | |
| A | 42,727 | | | 89,643 | | | — | | | 132,370 | | | — | |
| Baa/BBB | — | | | 13,539 | | | | | 13,539 | | | |
| Not Rated | 6,207 | | | 27,715 | | | — | | | 33,922 | | | 17,301 | |
| Total | $ | 660,294 | | | $ | 549,954 | | | $ | — | | | $ | 1,210,248 | | | $ | 17,301 | |
Historical loss rates associated with securities having similar grades as those in the Company’s portfolio have generally not been significant. Pre-refunded securities, if any, have been defeased by the issuer and are fully secured by cash and/or U.S. Treasury securities held in escrow for payment to holders when the underlying call dates of the securities are reached. Securities with other credit enhancement or insurance continue to make timely principal and interest payments under the contractual terms of the securities. Accordingly, no allowance for credit losses has been recorded for these securities as there is no current expectation of credit losses related to these securities.
Income earned on securities for the years ended December 31, 2021, 2020 and 2019, is as follows:
| | | | | | | | | | | | | | | | | |
| (In thousands) | 2021 | | 2020 | | 2019 |
| Taxable: | | | | | |
| Held-to-maturity | $ | 4,208 | | | $ | 985 | | | $ | 1,207 | |
| Available-for-sale | 54,768 | | | 34,054 | | | 42,412 | |
| | | | | |
| Non-taxable: | | | | | |
| Held-to-maturity | 16,047 | | | 919 | | | 1,412 | |
| Available-for-sale | 36,670 | | | 28,575 | | | 18,345 | |
| Total | $ | 111,693 | | | $ | 64,533 | | | $ | 63,376 | |
The amortized cost and estimated fair value by maturity of securities are shown in the following table as of December 31, 2021. Securities are classified according to their contractual maturities without consideration of principal amortization, potential prepayments or call options. Accordingly, actual maturities may differ from contractual maturities.
| | | | | | | | | | | | | | | | | | | | | | | | | | |
| | | Held-to-Maturity | | Available-for-Sale |
| (In thousands) | | Amortized
Cost | | Fair
Value | | Amortized
Cost | | Fair
Value |
| One year or less | | $ | 5,333 | | | $ | 5,396 | | | $ | 7,821 | | | $ | 7,845 | |
| After one through five years | | 4,801 | | | 5,023 | | | 61,456 | | | 61,669 | |
| After five through ten years | | 27,081 | | | 25,874 | | | 532,085 | | | 533,711 | |
| After ten years | | 1,422,943 | | | 1,411,936 | | | 2,043,326 | | | 2,061,081 | |
| Securities not due on a single maturity date | | 70,342 | | | 69,149 | | | 4,485,547 | | | 4,448,615 | |
| Other securities (no maturity) | | — | | | — | | | 626 | | | 624 | |
| Total | | $ | 1,530,500 | | | $ | 1,517,378 | | | $ | 7,130,861 | | | $ | 7,113,545 | |
The carrying value, which approximates the fair value, of securities pledged as collateral, to secure public deposits and for other purposes, amounted to $3.9 billion at December 31, 2021 and $2.0 billion at December 31, 2020.
The Company sold approximately $342.6 million of investment securities compared to approximately $1.7 billion of investment securities during 2021 and 2020, respectively. The increase in securities sold in 2020 was in large part related to efforts by the Company to increase liquidity in response to the early stages of the COVID-19 pandemic. There were approximately $15.9 million of gross realized gains and $422,000 of gross realized losses from the sale of securities during the year ended December 31, 2021. There were approximately $54.8 million of gross realized gains and $15,000 of gross realized losses from the sale of securities during the year ended December 31, 2020. There were approximately $13.3 million of gross realized gains and $4,000 of gross realized losses from the sale of securities during the year ended December 31, 2019. The income tax expense/benefit related to security gains/losses was 26.135% of the gross amounts in 2021, 2020 and 2019.
The Company has entered into various fair value hedging transactions to mitigate the impact of changing interest rates on the fair value of AFS securities. See Note 21: Derivative Instruments for disclosure of the gains and losses recognized on derivative instruments and the cumulative fair value hedging adjustments to the carrying amount of the hedged securities.
NOTE 4: OTHER ASSETS AND OTHER LIABILITIES HELD FOR SALE
Texas Branch Sale
On December 20, 2019, Simmons Bank entered into a Branch Purchase and Assumption Agreement (the “Spirit Branch Agreement”) with Spirit of Texas Bank, SSB (“Spirit Bank”), a wholly-owned subsidiary of Spirit of Texas Bancshares, Inc.
On February 28, 2020, Spirit Bank completed its purchase of certain assets and assumption of certain liabilities (“Texas Branch Sale”) associated with five Simmons Bank locations in Austin, San Antonio, and Tilden, Texas (collectively, the “Texas Branches”). Pursuant to the terms of the Spirit Branch Agreement, Spirit Bank assumed certain deposit liabilities and acquired certain loans, as well as cash, real property, personal property and other fixed assets associated with the Texas Branches. The loan and deposit balances of the Texas Branches were $260.3 million and $139.5 million, respectively.
Colorado Branch Sale
On February 10, 2020, Simmons Bank entered into a Branch Purchase and Assumption Agreement (the “First Western Agreement”) with First Western Trust Bank (“First Western”), a wholly-owned subsidiary of First Western Financial, Inc.
On May 18, 2020, First Western completed its purchase of certain assets and assumption of certain liabilities (“Colorado Branch Sale”) associated with four Simmons Bank locations in Denver, Englewood, Highlands Ranch, and Lone Tree, Colorado (collectively, the “Colorado Branches”). Pursuant to the terms of the First Western Agreement, First Western assumed certain deposit liabilities and acquired certain loans, as well as cash, personal property and other fixed assets associated with the Colorado Branches. The loan and deposit balances of the Colorado Branches were $120.4 million and $63.1 million, respectively.
During 2020, the Company recognized a combined gain on sale of $8.1 million related to the Texas Branch Sale and Colorado Branch Sale.
Illinois Branch Sale
On November 30, 2020, Simmons Bank entered into a Branch Purchase and Assumption Agreement (the “Citizens Equity Agreement”) with Citizens Equity First Credit Union (“CEFCU”).
On March 12, 2021, CEFCU completed its purchase of certain assets and assumption of certain liabilities (the “Illinois Branch Sale”) associated with four Simmons Bank locations in the Metro East area of Southern Illinois, near St. Louis (collectively, the “Illinois Branches”). Pursuant to the terms of the Citizens Equity Agreement, CEFCU assumed certain deposit liabilities and acquired certain loans, as well as cash, personal property and other fixed assets associated with the Illinois Branches. The loan and deposit balances of the Illinois Branches were $354,000 and $137.9 million, respectively.
During 2021, the Company recognized a gain on sale of $5.3 million related to the Illinois Branches.
As of December 31, 2021, there were no outstanding other assets and other liabilities held for sale.
NOTE 5: LOANS AND ALLOWANCE FOR CREDIT LOSSES
At December 31, 2021, the Company’s loan portfolio was $12.01 billion, compared to $12.90 billion at December 31, 2020. The various categories of loans are summarized as follows:
| | | | | | | | | | | |
| (In thousands) | 2021 | | 2020 |
| Consumer: | | | |
| Credit cards | $ | 187,052 | | | $ | 188,845 | |
| Other consumer | 168,318 | | | 202,379 | |
| Total consumer | 355,370 | | | 391,224 | |
| Real estate: | | | |
| Construction and development | 1,326,371 | | | 1,596,255 | |
| Single family residential | 2,101,975 | | | 1,880,673 | |
| Other commercial | 5,738,904 | | | 5,746,863 | |
| Total real estate | 9,167,250 | | | 9,223,791 | |
| Commercial: | | | |
| Commercial | 1,992,043 | | | 2,574,386 | |
| Agricultural | 168,717 | | | 175,905 | |
| Total commercial | 2,160,760 | | | 2,750,291 | |
| Other | 329,123 | | | 535,591 | |
| Total loans | $ | 12,012,503 | | | $ | 12,900,897 | |
The above table presents total loans at amortized cost. The difference between amortized cost and unpaid principal balance is primarily premiums and discounts associated with acquisition date fair value adjustments on acquired loans as well as net deferred origination fees totaling $21.5 million and $57.3 million at December 31, 2021 and 2020, respectively.
Accrued interest on loans, which is excluded from the amortized cost of loans held for investment, totaled $39.8 million and $54.4 million at December 31, 2021 and 2020, respectively, and is included in interest receivable on the consolidated balance sheets.
Loan Origination/Risk Management – The Company seeks to manage its credit risk by diversifying its loan portfolio, determining that borrowers have adequate sources of cash flow for loan repayment without liquidation of collateral; obtaining and monitoring collateral; providing an adequate allowance for credit losses by regularly reviewing loans through the internal loan review process. The loan portfolio is diversified by borrower, purpose and industry. The Company seeks to use diversification within the loan portfolio to reduce its credit risk, thereby minimizing the adverse impact on the portfolio if weaknesses develop in either the economy or a particular segment of borrowers. Collateral requirements are based on credit assessments of borrowers and may be used to recover the debt in case of default.
Consumer – The consumer loan portfolio consists of credit card loans and other consumer loans. Credit card loans are diversified by geographic region to reduce credit risk and minimize any adverse impact on the portfolio. Although they are regularly reviewed to facilitate the identification and monitoring of creditworthiness, credit card loans are unsecured loans, making them more susceptible to economic downturns resulting in increasing unemployment. Other consumer loans include direct and indirect installment loans and account overdrafts. Loans in this portfolio segment are sensitive to unemployment and other key consumer economic measures.
Real estate – The real estate loan portfolio consists of construction and development loans (“C&D”), single family residential loans and commercial loans. C&D and commercial real estate (“CRE”) loans can be particularly sensitive to valuation of real estate. CRE cycles are inevitable. The long planning and production process for new properties and rapid shifts in business conditions and employment create an inherent tension between supply and demand for commercial properties. While general economic trends often move individual markets in the same direction over time, the timing and magnitude of changes are determined by other forces unique to each market. CRE cycles tend to be local in nature and longer than other credit cycles. Factors influencing the CRE market are traditionally different from those affecting residential real estate markets; thereby making predictions for one market based on the other difficult. Additionally, submarkets within CRE – such as office, industrial, apartment, retail and hotel – also experience different cycles, providing an opportunity to lower the overall risk through diversification across types of CRE loans. Management realizes that local demand and supply conditions will also mean that different geographic areas will experience cycles of different amplitude and length. The Company monitors these loans closely.
Commercial – The commercial loan portfolio includes commercial and agricultural loans, representing loans to commercial customers and farmers for use in normal business or farming operations to finance working capital needs, equipment purchases or other expansion projects. Paycheck Protection Program (“PPP”) loans are also included in the commercial loan portfolio. Collection risk in this portfolio is driven by the creditworthiness of the underlying borrowers, particularly cash flow from customers’ business or farming operations. The Company continues its efforts to keep loan terms short, reducing the negative impact of upward movement in interest rates. Term loans are generally set up with one or three year balloons, and the Company has instituted a pricing mechanism for commercial loans. It is standard practice to require personal guaranties on commercial loans for closely-held or limited liability entities.
Paycheck Protection Program Loans - The Company originated loans pursuant to multiple PPP appropriations of the CARES Act which provided 100% federally guaranteed loans for small businesses to cover up to 24 weeks of payroll costs and assist with mortgage interest, rent and utilities. Notably, these small business loans may be forgiven by the SBA if borrowers maintain their payrolls and satisfy certain other conditions. PPP loans have a zero percent risk-weight for regulatory capital ratios. As of December 31, 2021 and 2020, the total outstanding balance of PPP loans was $116.7 million and $904.7 million, respectively.
Nonaccrual and Past Due Loans – Loans are considered past due if the required principal and interest payments have not been received as of the date such payments were due. Loans are placed on nonaccrual status when, in management’s opinion, the borrower may be unable to meet payment obligations as they become due, as well as when required by regulatory provisions. Loans may be placed on nonaccrual status regardless of whether or not such loans are considered past due. When interest accrual is discontinued, all unpaid accrued interest is reversed. Interest income is subsequently recognized only to the extent cash payments are received in excess of principal due. Loans are returned to accrual status when all the principal and interest amounts contractually due are brought current and future payments are reasonably assured.
The amortized cost basis of nonaccrual loans segregated by class of loans are as follows:
| | | | | | | | | | | |
| (In thousands) | 2021 | | 2020 |
| Consumer: | | | |
| Credit cards | $ | 377 | | | $ | 301 | |
| Other consumer | 381 | | | 1,219 | |
| Total consumer | 758 | | | 1,520 | |
| Real estate: | | | |
| Construction and development | 2,296 | | | 3,625 | |
| Single family residential | 19,268 | | | 28,062 | |
| Other commercial | 26,953 | | | 24,155 | |
| Total real estate | 48,517 | | | 55,842 | |
| Commercial: | | | |
| Commercial | 18,774 | | | 65,244 | |
| Agricultural | 152 | | | 273 | |
| Total commercial | 18,926 | | | 65,517 | |
| Other | 3 | | | — | |
| Total | $ | 68,204 | | | $ | 122,879 | |
As of December 31, 2021 and 2020, nonaccrual loans for which there was no related allowance for credit losses had an amortized cost of $14.5 million and $16.8 million, respectively. These loans are individually assessed and do not hold an allowance due to being adequately collateralized under the collateral-dependent valuation method.
An age analysis of the amortized cost basis of past due loans, including nonaccrual loans, segregated by class of loans is as follows:
| | | | | | | | | | | | | | | | | | | | | | | | | | | | | | | | | | | | | | |
| (In thousands) | | Gross
30-89 Days
Past Due | | 90 Days
or More
Past Due | | Total
Past Due | | Current | | Total
Loans | | 90 Days
Past Due &
Accruing |
| December 31, 2021 | | | | | | | | | | | | |
| Consumer: | | | | | | | | | | | | |
| Credit cards | | $ | 847 | | | $ | 413 | | | $ | 1,260 | | | $ | 185,792 | | | $ | 187,052 | | | $ | 247 | |
| Other consumer | | 1,149 | | | 130 | | | 1,279 | | | 167,039 | | | 168,318 | | | — | |
| Total consumer | | 1,996 | | | 543 | | | 2,539 | | | 352,831 | | | 355,370 | | | 247 | |
| Real estate: | | | | | | | | | | | | |
| Construction and development | | 114 | | | 504 | | | 618 | | | 1,325,753 | | | 1,326,371 | | | — | |
| Single family residential | | 11,313 | | | 9,398 | | | 20,711 | | | 2,081,264 | | | 2,101,975 | | | 102 | |
| Other commercial | | 2,474 | | | 12,268 | | | 14,742 | | | 5,724,162 | | | 5,738,904 | | | — | |
| Total real estate | | 13,901 | | | 22,170 | | | 36,071 | | | 9,131,179 | | | 9,167,250 | | | 102 | |
| Commercial: | | | | | | | | | | | | |
| Commercial | | 4,812 | | | 10,074 | | | 14,886 | | | 1,977,157 | | | 1,992,043 | | | — | |
| Agricultural | | 13 | | | 117 | | | 130 | | | 168,587 | | | 168,717 | | | — | |
| Total commercial | | 4,825 | | | 10,191 | | | 15,016 | | | 2,145,744 | | | 2,160,760 | | | — | |
| Other | | — | | | 3 | | | 3 | | | 329,120 | | | 329,123 | | | — | |
| Total | | $ | 20,722 | | | $ | 32,907 | | | $ | 53,629 | | | $ | 11,958,874 | | | $ | 12,012,503 | | | $ | 349 | |
| | | | | | | | | | | | |
| December 31, 2020 | | | | | | | | | | | | |
| Consumer: | | | | | | | | | | | | |
| Credit cards | | $ | 708 | | | $ | 256 | | | $ | 964 | | | $ | 187,881 | | | $ | 188,845 | | | $ | 256 | |
| Other consumer | | 2,771 | | | 302 | | | 3,073 | | | 199,306 | | | 202,379 | | | 13 | |
| Total consumer | | 3,479 | | | 558 | | | 4,037 | | | 387,187 | | | 391,224 | | | 269 | |
| Real estate: | | | | | | | | | | | | |
| Construction and development | | 1,375 | | | 3,089 | | | 4,464 | | | 1,591,791 | | | 1,596,255 | | | — | |
| Single family residential | | 23,726 | | | 14,339 | | | 38,065 | | | 1,842,608 | | | 1,880,673 | | | 253 | |
| Other commercial | | 2,660 | | | 9,586 | | | 12,246 | | | 5,734,617 | | | 5,746,863 | | | — | |
| Total real estate | | 27,761 | | | 27,014 | | | 54,775 | | | 9,169,016 | | | 9,223,791 | | | 253 | |
| Commercial: | | | | | | | | | | | | |
| Commercial | | 7,514 | | | 7,429 | | | 14,943 | | | 2,559,443 | | | 2,574,386 | | | 56 | |
| Agricultural | | 226 | | | 187 | | | 413 | | | 175,492 | | | 175,905 | | | — | |
| Total commercial | | 7,740 | | | 7,616 | | | 15,356 | | | 2,734,935 | | | 2,750,291 | | | 56 | |
| Other | | 92 | | | — | | | 92 | | | 535,499 | | | 535,591 | | | — | |
| Total | | $ | 39,072 | | | $ | 35,188 | | | $ | 74,260 | | | $ | 12,826,637 | | | $ | 12,900,897 | | | $ | 578 | |
When the Company restructures a loan to a borrower that is experiencing financial difficulty and grants a concession that it would not otherwise consider, a “troubled debt restructuring” (“TDR”) results and the Company classifies the loan as a TDR. The Company grants various types of concessions, primarily interest rate reduction and/or payment modifications or extensions, with an occasional forgiveness of principal.
Once an obligation has been restructured because of such credit problems, it continues to be considered a TDR until paid in full; or, if an obligation yields a market interest rate and no longer has any concession regarding payment amount or amortization, then it is not considered a TDR at the beginning of the calendar year after the year in which the improvement takes place. The Company returns TDRs to accrual status only if (1) all contractual amounts due can reasonably be expected to be repaid within a prudent period, and (2) repayment has been in accordance with the contract for a sustained period, typically at least six months.
The provisions in the CARES Act included an election to not apply the guidance on accounting for TDRs to loan modifications, such as extensions or deferrals, related to COVID-19 made between March 1, 2020 and the earlier of (i) December 31, 2020 or (ii) 60 days after the President terminates the COVID-19 national emergency declaration. In March 2020, the federal financial institution regulatory agencies issued an interagency statement encouraging financial institutions to work constructively with borrowers affected by COVID-19 and provided information regarding loan modifications. The relief can only be applied to modifications for borrowers that were not more than 30 days past due as of December 31, 2019. The Company elected to adopt these provisions of the CARES Act. In response to the concerns related to the expiration of the applicable period for which the election to not apply the guidance on accounting for TDRs to loan modifications, the CARES Act was amended in late fourth quarter of 2020 to extend COVID-19 relief related to loan modifications from the earlier of (i) January 1, 2022 or (ii) 60 days after the President terminates the COVID-19 national emergency declaration. As of December 31, 2021, the Company had 51 COVID-19 loan modifications outstanding in the amount of $8.6 million, compared to 3,729 modifications outstanding in the amount of $2.99 billion as of December 31, 2020. The majority of COVID-19 loan modifications have returned to performing status or paid off.
TDRs are individually evaluated for expected credit losses. The Company assesses the exposure for each modification, either by the fair value of the underlying collateral or the present value of expected cash flows, and determines if a specific allowance for credit losses is needed.
The following table presents a summary of TDRs segregated by class of loans.
| | | | | | | | | | | | | | | | | | | | | | | | | | | | | | | | | | | | | | |
| | | Accruing TDR Loans | | Nonaccrual TDR Loans | | Total TDR Loans |
| (Dollars in thousands) | | Number | | Balance | | Number | | Balance | | Number | | Balance |
| December 31, 2021 | | | | | | | | | | | | |
| Real estate: | | | | | | | | | | | | |
| Single-family residential | | 28 | | | $ | 3,087 | | | 14 | | | $ | 1,196 | | | 42 | | | $ | 4,283 | |
| Other commercial | | 1 | | | 766 | | | 2 | | | 48 | | | 3 | | | 814 | |
| Total real estate | | 29 | | | 3,853 | | | 16 | | | 1,244 | | | 45 | | | 5,097 | |
| Commercial: | | | | | | | | | | | | |
| Commercial | | 2 | | | 436 | | | 2 | | | 1,406 | | | 4 | | | 1,842 | |
| Total commercial | | 2 | | | 436 | | | 2 | | | 1,406 | | | 4 | | | 1,842 | |
| Total | | 31 | | | $ | 4,289 | | | 18 | | | $ | 2,650 | | | 49 | | | $ | 6,939 | |
| | | | | | | | | | | | |
| December 31, 2020 | | | | | | | | | | | | |
| Real estate: | | | | | | | | | | | | |
| Single-family residential | | 28 | | | 2,463 | | | 18 | | | 2,736 | | | 46 | | | 5,199 | |
| Other commercial | | 1 | | | 49 | | | 1 | | | 12 | | | 2 | | | 61 | |
| Total real estate | | 29 | | | 2,512 | | | 19 | | | 2,748 | | | 48 | | | 5,260 | |
| Commercial: | | | | | | | | | | | | |
| Commercial | | 3 | | | 626 | | | 3 | | | 1,627 | | | 6 | | | 2,253 | |
| Total commercial | | 3 | | | 626 | | | 3 | | | 1,627 | | | 6 | | | 2,253 | |
| Total | | 32 | | | $ | 3,138 | | | 22 | | | $ | 4,375 | | | 54 | | | $ | 7,513 | |
The following table presents loans that were restructured as TDRs during the years ended December 31, 2021 and 2020 segregated by class of loans.
| | | | | | | | | | | | | | | | | | | | | | | | | | | | | | | | | | | | | | |
| | | | | | | | | Modification Type | | |
| (Dollars in thousands) | | Number of
Loans | | Balance Prior
to TDR | | Balance at December 31, | | Change in
Maturity
Date | | Change in
Rate | | Financial Impact
on Date of
Restructure |
| Year Ended December 31, 2021 | | | | | | | | | | | | |
| Real estate: | | | | | | | | | | | | |
| Single-family residential | | 3 | | | 274 | | | 197 | | | — | | | 197 | | | — | |
| Other commercial | | 1 | | | 784 | | | 766 | | | — | | | 766 | | | — | |
| Total real estate | | 4 | | | $ | 1,058 | | | $ | 963 | | | $ | — | | | $ | 963 | | | $ | — | |
| | | | | | | | | | | | |
| Year Ended December 31, 2020 | | | | | | | | | | | | |
| Real estate: | | | | | | | | | | | | |
| Single-family residential | | 5 | | | $ | 1,948 | | | $ | 1,896 | | | $ | 1,896 | | | $ | — | | | $ | — | |
| Total real estate | | 5 | | | $ | 1,948 | | | $ | 1,896 | | | $ | 1,896 | | | $ | — | | | $ | — | |
During the year ended December 31, 2021, the Company modified four loans with a recorded investment of $1,058,000 prior to modification which were deemed troubled debt restructuring. The restructured loans were modified by deferring amortized principal payments, changing the maturity dates and requiring interest-only payments for a period of up to 12 months. A specific reserve of $5,129 was determined necessary for these loans as of December 31, 2021. Additionally, there was no immediate financial impact from the restructuring of these loans as it was not considered necessary to charge-off interest or principal on the date of restructure. During the year ended December 31, 2021, nine of the previously restructured loans with prior balances of $1,002,874 were paid off.
During the year ended December 31, 2020, the Company modified five loans with a recorded investment of $1,948,000 prior to modification which were deemed troubled debt restructuring. The restructured loans were modified by deferring amortized principal payments, changing the maturity dates and requiring interest-only payments for a period of up to 12 months. Based upon the fair value of the collateral, a specific reserve of $51,300 was determined as necessary for these loans as of December 31, 2020. Also, there was no immediate financial impact from the restructuring of these loans, as it was not considered necessary to charge-off interest or principal on the date of restructure. During the year ended December 31, 2020, six of the previously restructured loans with prior balances of $837,265 were paid off.
There was no loans considered TDRs for which a payment default occurred during the year ended December 31, 2021. During the year ended December 31, 2020, there was one commercial loan with an outstanding balance of $2.1 million considered a TDR for which a payment default occurred. The Company defines a payment default as a payment received more than 90 days after its due date.
The Company had no TDRs with pre-modification loan balances for which OREO was received in full or partial satisfaction of the loans during the years ended December 31, 2021 and 2020. At December 31, 2021 and 2020, the Company had $1,806,000 and $7,182,000, respectively, of consumer mortgage loans secured by residential real estate properties for which formal foreclosure proceedings are in process. At December 31, 2021 and 2020, the Company had $831,000 and $3,172,000, respectively, of OREO secured by residential real estate properties.
Credit Quality Indicators – As part of the on-going monitoring of the credit quality of the Company’s loan portfolio, management tracks certain credit quality indicators including trends related to (i) the weighted-average risk rating of commercial and real estate loans, (ii) the level of classified commercial and real estate loans, (iii) net charge-offs, (iv) non-performing loans (see details above) and (v) the general economic conditions of the Company’s local markets.
The Company utilizes a risk rating matrix to assign a risk rate to each of its commercial and real estate loans. Risk ratings are updated on an ongoing basis and are subject to change by continuous loan monitoring processes including lending management monitoring, executive management and board committee oversight, and independent credit review. A description of the general characteristics of the risk ratings is as follows:
•Pass (Excellent) – This category includes loans which are virtually free of credit risk. Borrowers in this category represent the highest credit quality and greatest financial strength.
•Pass (Good) - Loans under this category possess a nominal risk of default. This category includes borrowers with strong financial strength and superior financial ratios and trends. These loans are generally fully secured by cash or equivalents (other than those rated “excellent”).
•Pass (Acceptable – Average) - Loans in this category are considered to possess a normal level of risk. Borrowers in this category have satisfactory financial strength and adequate cash flow coverage to service debt requirements. If secured, the perfected collateral should be of acceptable quality and within established borrowing parameters.
•Pass (Monitor) - Loans in the Watch (Monitor) category exhibit an overall acceptable level of risk, but that risk may be increased by certain conditions, which represent “red flags”. These “red flags” require a higher level of supervision or monitoring than the normal “Pass” rated credit. The borrower may be experiencing these conditions for the first time, or it may be recovering from weakness, which at one time justified a higher rating. These conditions may include: weaknesses in financial trends; marginal cash flow; one-time negative operating results; non-compliance with policy or borrowing agreements; poor diversity in operations; lack of adequate monitoring information or lender supervision; questionable management ability/stability.
•Special Mention - A loan in this category has potential weaknesses that deserve management’s close attention. If left uncorrected, these potential weaknesses may result in deterioration of the repayment prospects for the asset or in the institution’s credit position at some future date. Special Mention loans are not adversely classified (although they are “criticized”) and do not expose an institution to sufficient risk to warrant adverse classification. Borrowers may be experiencing adverse operating trends or an ill-proportioned balance sheet. Non-financial characteristics of a Special Mention rating may include management problems, pending litigation, a non-existent or ineffective loan agreement or other material structural weakness, and/or other significant deviation from prudent lending practices.
•Substandard - A Substandard loan is inadequately protected by the current sound worth and paying capacity of the borrower or of the collateral pledged, if any. Loans so classified must have a well-defined weakness, or weaknesses, that jeopardize the liquidation of the debt. The loans are characterized by the distinct possibility that the Company will sustain some loss if the deficiencies are not corrected. This does not imply ultimate loss of the principal, but may involve burdensome administrative expenses and the accompanying cost to carry the loan.
•Doubtful - A loan classified Doubtful has all the weaknesses inherent in a substandard loan except that the weaknesses make collection or liquidation in full (on the basis of currently existing facts, conditions, and values) highly questionable and improbable. Doubtful borrowers are usually in default, lack adequate liquidity or capital, and lack the resources necessary to remain an operating entity. The possibility of loss is extremely high, but because of specific pending events that may strengthen the asset, its classification as loss is deferred. Pending factors include: proposed merger or acquisition; liquidation procedures; capital injection; perfection of liens on additional collateral; and refinancing plans. Loans classified as Doubtful are placed on nonaccrual status.
•Loss - Loans classified Loss are considered uncollectible and of such little value that their continuance as bankable assets is not warranted. This classification does not mean that the loans has absolutely no recovery or salvage value, but rather it is not practical or desirable to defer writing off this basically worthless loan, even though partial recovery may be affected in the future. Borrowers in the Loss category are often in bankruptcy, have formally suspended debt repayments, or have otherwise ceased normal business operations. Loans should be classified as Loss and charged-off in the period in which they become uncollectible.
The Company monitors credit quality in the consumer portfolio by delinquency status. The delinquency status of loans is updated daily. A description of the delinquency credit quality indicators is as follows:
•Current - Loans in this category are either current in payments or are under 30 days past due. These loans are considered to have a normal level of risk.
•30-89 Days Past Due - Loans in this category are between 30 and 89 days past due and are subject to the Company’s loss mitigation process. These loans are considered to have a moderate level of risk.
•90+ Days Past Due - Loans in this category are 90 days or more past due and are placed on nonaccrual status. These loans have been subject to the Company’s loss mitigation process and foreclosure and/or charge-off proceedings have commenced.
Effective April 2021, the Company implemented an expanded, dual risk rating scale that utilizes quantitative models and qualitative factors (“score cards”) to assist in determining the appropriate risk rating for its commercial loans. This dual risk rating methodology incorporates a “probability of default” analysis which utilizes quantified metrics such as loan terms and financial performance, as well as a “loss given default” analysis which utilizes collateral values and economics of the market, among other attributes. Model outputs are reviewed and analyzed to ensure the projected risk levels are commensurate with underwriting and credit leader expectations. The expanded risk rating scale includes Probability of Default levels of 1 – 16 and Loss Given Default levels of A – I. The expanded scale allows for more granular recognition of risk and diversification of grading among traditional Pass grades. Implementation of the expanded risk rating scale did not have a material impact on the results of the allowance for credit losses calculation.
The following is a reconciliation between the expanded risk rating scale and the Company’s traditional risk rating segments utilized within the commercial loan classes presented in the credit quality indicator tables.
•Pass - Includes loans with an expanded risk rating of 1 through 11. Loans with a risk rating of 10 and 11 equate to loans included on management’s “watch list” and is intended to be utilized on a temporary basis for pass grade borrowers where a significant risk-modifying action is anticipated in the near term.
•Special Mention - Includes loans with an expanded risk rating of 12.
•Substandard - Includes loans with an expanded risk rating of 13 and 14.
•Doubtful and loss - Includes loans with an expanded risk rating of 15 and 16.
The following table presents a summary of loans by credit quality indicator, as of December 31, 2021 segregated by class of loans.
| | | | | | | | | | | | | | | | | | | | | | | | | | | | | | | | | | | | | | | | | | | | | | | | | | | | | |
| Term Loans Amortized Cost Basis by Origination Year | | | | | | |
| (In thousands) | 2021 | | 2020 | | 2019 | | 2018 | | 2017 | | 2016 and Prior | | Lines of Credit (“LOC”) Amortized Cost Basis | | LOC Converted to Term Loans Amortized Cost Basis | | Total |
| Consumer - credit cards | | | | | | | | | | | | | | | | | |
| Delinquency: | | | | | | | | | | | | | | | | | |
| Current | $ | — | | | $ | — | | | $ | — | | | $ | — | | | $ | — | | | $ | — | | | $ | 185,792 | | | $ | — | | | $ | 185,792 | |
| 30-89 days past due | — | | | — | | | — | | | — | | | — | | | — | | | 847 | | | — | | | 847 | |
| 90+ days past due | — | | | — | | | — | | | — | | | — | | | — | | | 413 | | | — | | | 413 | |
| Total consumer - credit cards | — | | | — | | | — | | | — | | | — | | | — | | | 187,052 | | | — | | | 187,052 | |
| Consumer - other | | | | | | | | | | | | | | | | | |
| Delinquency: | | | | | | | | | | | | | | | | | |
| Current | 97,830 | | | 21,885 | | | 11,712 | | | 6,756 | | | 5,416 | | | 3,833 | | | 19,607 | | | — | | | $ | 167,039 | |
| 30-89 days past due | 265 | | | 121 | | | 164 | | | 49 | | | 219 | | | 156 | | | 175 | | | — | | | 1,149 | |
| 90+ days past due | 23 | | | 23 | | | 28 | | | 21 | | | 13 | | | 22 | | | — | | | — | | | 130 | |
| Total consumer - other | 98,118 | | | 22,029 | | | 11,904 | | | 6,826 | | | 5,648 | | | 4,011 | | | 19,782 | | | — | | | 168,318 | |
| Real estate - C&D | | | | | | | | | | | | | | | | | |
| Risk rating: | | | | | | | | | | | | | | | | | |
| Pass | 74,813 | | | 83,729 | | | 28,803 | | | 17,349 | | | 8,505 | | | 9,319 | | | 1,074,617 | | | 20,285 | | | $ | 1,317,420 | |
| Special mention | — | | | — | | | 270 | | | — | | | — | | | 47 | | | — | | | — | | | 317 | |
| Substandard | 191 | | | 77 | | | 16 | | | 54 | | | 324 | | | 423 | | | 5,598 | | | 1,951 | | | 8,634 | |
| Doubtful and loss | — | | | — | | | — | | | — | | | — | | | — | | | — | | | — | | | — | |
| Total real estate - C&D | 75,004 | | | 83,806 | | | 29,089 | | | 17,403 | | | 8,829 | | | 9,789 | | | 1,080,215 | | | 22,236 | | | 1,326,371 | |
| Real estate - SF residential | | | | | | | | | | | | | | | | | |
| Delinquency: | | | | | | | | | | | | | | | | | |
| Current | 419,605 | | | 335,788 | | | 185,190 | | | 260,037 | | | 193,110 | | | 421,957 | | | 256,155 | | | 9,422 | | | $ | 2,081,264 | |
| 30-89 days past due | 1,061 | | | 883 | | | 1,662 | | | 791 | | | 1,077 | | | 4,360 | | | 1,479 | | | — | | | 11,313 | |
| 90+ days past due | 27 | | | 561 | | | 507 | | | 1,199 | | | 1,358 | | | 5,104 | | | 570 | | | 72 | | | 9,398 | |
| Total real estate - SF residential | 420,693 | | | 337,232 | | | 187,359 | | | 262,027 | | | 195,545 | | | 431,421 | | | 258,204 | | | 9,494 | | | 2,101,975 | |
| Real estate - other commercial | | | | | | | | | | | | | | | | | |
| Risk rating: | | | | | | | | | | | | | | | | | |
| Pass | 1,349,746 | | | 807,701 | | | 375,824 | | | 267,696 | | | 476,029 | | | 537,493 | | | 1,409,099 | | | 164,856 | | | 5,388,444 | |
| Special mention | 28,151 | | | 30,981 | | | 2,799 | | | 6,650 | | | 39,361 | | | 4,801 | | | 38,638 | | | 1,608 | | | 152,989 | |
| Substandard | 28,137 | | | 10,186 | | | 5,243 | | | 10,806 | | | 30,060 | | | 27,107 | | | 53,860 | | | 32,072 | | | 197,471 | |
| Doubtful and loss | — | | | — | | | — | | | — | | | — | | | — | | | — | | | — | | | — | |
| Total real estate - other commercial | 1,406,034 | | | 848,868 | | | 383,866 | | | 285,152 | | | 545,450 | | | 569,401 | | | 1,501,597 | | | 198,536 | | | 5,738,904 | |
| Commercial | | | | | | | | | | | | | | | | | |
| Risk rating: | | | | | | | | | | | | | | | | | |
| Pass | 455,499 | | | 187,517 | | | 80,486 | | | 57,437 | | | 36,529 | | | 57,099 | | | 1,004,971 | | | 41,885 | | | 1,921,423 | |
| Special mention | 670 | | | 2,482 | | | 1,066 | | | 189 | | | 261 | | | 2,770 | | | 8,500 | | | 10,499 | | | 26,437 | |
| Substandard | 3,436 | | | 18,381 | | | 4,397 | | | 1,196 | | | 578 | | | 850 | | | 8,242 | | | 7,103 | | | 44,183 | |
| Doubtful and loss | — | | | — | | | — | | | — | | | — | | | — | | | — | | | — | | | — | |
| Total commercial | 459,605 | | | 208,380 | | | 85,949 | | | 58,822 | | | 37,368 | | | 60,719 | | | 1,021,713 | | | 59,487 | | | 1,992,043 | |
| Commercial - agriculture | | | | | | | | | | | | | | | | | |
| Risk rating: | | | | | | | | | | | | | | | | | |
| Pass | 32,780 | | | 20,230 | | | 10,253 | | | 3,646 | | | 2,364 | | | 459 | | | 98,245 | | | 327 | | | 168,304 | |
| Special mention | — | | | — | | | — | | | — | | | — | | | — | | | — | | | — | | | — | |
| Substandard | 191 | | | 25 | | | 27 | | | 53 | | | 22 | | | 3 | | | 23 | | | 69 | | | 413 | |
| Doubtful and loss | — | | | — | | | — | | | — | | | — | | | — | | | — | | | — | | | — | |
| Total commercial - agriculture | 32,971 | | | 20,255 | | | 10,280 | | | 3,699 | | | 2,386 | | | 462 | | | 98,268 | | | 396 | | | 168,717 | |
| Other | | | | | | | | | | | | | | | | | |
| Delinquency: | | | | | | | | | | | | | | | | | |
| Current | 24,247 | | | 4,740 | | | 1,236 | | | 22,438 | | | 6,692 | | | 5,578 | | | 264,189 | | | — | | | 329,120 | |
| 30-89 days past due | — | | | — | | | — | | | — | | | — | | | — | | | — | | | — | | | — | |
| 90+ days past due | — | | | — | | | — | | | — | | | — | | | 3 | | | — | | | — | | | 3 | |
| Total other | 24,247 | | | 4,740 | | | 1,236 | | | 22,438 | | | 6,692 | | | 5,581 | | | 264,189 | | | — | | | 329,123 | |
| Total | $ | 2,516,672 | | | $ | 1,525,310 | | | $ | 709,683 | | | $ | 656,367 | | | $ | 801,918 | | | $ | 1,081,384 | | | $ | 4,431,020 | | | $ | 290,149 | | | $ | 12,012,503 | |
The following table presents a summary of loans by credit quality indicator, as of December 31, 2020 segregated by class of loans.
| | | | | | | | | | | | | | | | | | | | | | | | | | | | | | | | | | | | | | | | | | | | | | | | | | | | | |
| Term Loans Amortized Cost Basis by Origination Year | | | | | | |
| (In thousands) | 2020 | | 2019 | | 2018 | | 2017 | | 2016 | | 2015 and Prior | | Lines of Credit (“LOC”) Amortized Cost Basis | | LOC Converted to Term Loans Amortized Cost Basis | | Total |
| Consumer - credit cards | | | | | | | | | | | | | | | | | |
| Delinquency: | | | | | | | | | | | | | | | | | |
| Current | $ | — | | | $ | — | | | $ | — | | | $ | — | | | $ | — | | | $ | — | | | $ | 187,881 | | | $ | — | | | $ | 187,881 | |
| 30-89 days past due | — | | | — | | | — | | | — | | | — | | | — | | | 708 | | | — | | | 708 | |
| 90+ days past due | — | | | — | | | — | | | — | | | — | | | — | | | 256 | | | — | | | 256 | |
| Total consumer - credit cards | — | | | — | | | — | | | — | | | — | | | — | | | 188,845 | | | — | | | 188,845 | |
| Consumer - other | | | | | | | | | | | | | | | | | |
| Delinquency: | | | | | | | | | | | | | | | | | |
| Current | 69,334 | | | 44,215 | | | 27,525 | | | 21,995 | | | 19,023 | | | 2,530 | | | 14,684 | | | — | | | $ | 199,306 | |
| 30-89 days past due | 234 | | | 441 | | | 327 | | | 658 | | | 689 | | | 84 | | | 338 | | | — | | | 2,771 | |
| 90+ days past due | 79 | | | 58 | | | 25 | | | 80 | | | 40 | | | 12 | | | 8 | | | — | | | 302 | |
| Total consumer - other | 69,647 | | | 44,714 | | | 27,877 | | | 22,733 | | | 19,752 | | | 2,626 | | | 15,030 | | | — | | | 202,379 | |
| Real estate - C&D | | | | | | | | | | | | | | | | | |
| Risk rating: | | | | | | | | | | | | | | | | | |
| Pass | 165,990 | | | 35,989 | | | 31,279 | | | 15,960 | | | 9,233 | | | 4,807 | | | 1,272,870 | | | 23,251 | | | $ | 1,559,379 | |
| Special mention | 2,728 | | | 344 | | | 259 | | | 2,107 | | | 19 | | | — | | | 9,613 | | | — | | | 15,070 | |
| Substandard | 294 | | | 2,069 | | | 404 | | | 449 | | | 342 | | | 320 | | | 17,914 | | | 14 | | | 21,806 | |
| Doubtful and loss | — | | | — | | | — | | | — | | | — | | | — | | | — | | | — | | | — | |
| Total real estate - C&D | 169,012 | | | 38,402 | | | 31,942 | | | 18,516 | | | 9,594 | | | 5,127 | | | 1,300,397 | | | 23,265 | | | 1,596,255 | |
| Real estate - SF residential | | | | | | | | | | | | | | | | | |
| Delinquency: | | | | | | | | | | | | | | | | | |
| Current | 473,340 | | | 209,810 | | | 297,308 | | | 235,429 | | | 183,229 | | | 236,395 | | | 196,505 | | | 10,592 | | | $ | 1,842,608 | |
| 30-89 days past due | 6,300 | | | 2,258 | | | 2,593 | | | 2,610 | | | 2,058 | | | 6,050 | | | 1,781 | | | 76 | | | 23,726 | |
| 90+ days past due | 557 | | | 1,853 | | | 2,735 | | | 2,582 | | | 832 | | | 3,852 | | | 1,928 | | | — | | | 14,339 | |
| Total real estate - SF residential | 480,197 | | | 213,921 | | | 302,636 | | | 240,621 | | | 186,119 | | | 246,297 | | | 200,214 | | | 10,668 | | | 1,880,673 | |
| Real estate - other commercial | | | | | | | | | | | | | | | | | |
| Risk rating: | | | | | | | | | | | | | | | | | |
| Pass | 1,563,245 | | | 525,750 | | | 375,303 | | | 518,534 | | | 372,679 | | | 284,098 | | | 1,445,428 | | | 181,949 | | | 5,266,986 | |
| Special mention | 100,085 | | | 4,346 | | | 10,738 | | | 19,943 | | | 26,245 | | | 10,608 | | | 63,305 | | | 23,435 | | | 258,705 | |
| Substandard | 66,737 | | | 9,418 | | | 24,380 | | | 14,067 | | | 3,744 | | | 11,158 | | | 52,182 | | | 39,486 | | | 221,172 | |
| Doubtful and loss | — | | | — | | | — | | | — | | | — | | | — | | | — | | | — | | | — | |
| Total real estate - other commercial | 1,730,067 | | | 539,514 | | | 410,421 | | | 552,544 | | | 402,668 | | | 305,864 | | | 1,560,915 | | | 244,870 | | | 5,746,863 | |
| Commercial | | | | | | | | | | | | | | | | | |
| Risk rating: | | | | | | | | | | | | | | | | | |
| Pass | 1,168,085 | | | 154,740 | | | 110,383 | | | 65,757 | | | 35,198 | | | 45,568 | | | 803,751 | | | 56,648 | | | 2,440,130 | |
| Special mention | 5,707 | | | 342 | | | 465 | | | 972 | | | 54 | | | — | | | 12,318 | | | 22,546 | | | 42,404 | |
| Substandard | 23,227 | | | 4,495 | | | 1,586 | | | 730 | | | 276 | | | 334 | | | 53,682 | | | 7,522 | | | 91,852 | |
| Doubtful and loss | — | | | — | | | — | | | — | | | — | | | — | | | — | | | — | | | — | |
| Total commercial | 1,197,019 | | | 159,577 | | | 112,434 | | | 67,459 | | | 35,528 | | | 45,902 | | | 869,751 | | | 86,716 | | | 2,574,386 | |
| Commercial - agriculture | | | | | | | | | | | | | | | | | |
| Risk rating: | | | | | | | | | | | | | | | | | |
| Pass | 36,128 | | | 19,144 | | | 10,014 | | | 4,671 | | | 1,916 | | | 340 | | | 101,238 | | | 1,560 | | | 175,011 | |
| Special mention | — | | | 79 | | | 13 | | | 299 | | | — | | | 6 | | | 34 | | | — | | | 431 | |
| Substandard | 86 | | | 101 | | | 64 | | | 47 | | | 12 | | | 10 | | | 68 | | | 75 | | | 463 | |
| Doubtful and loss | — | | | — | | | — | | | — | | | — | | | — | | | — | | | — | | | — | |
| Total commercial - agriculture | 36,214 | | | 19,324 | | | 10,091 | | | 5,017 | | | 1,928 | | | 356 | | | 101,340 | | | 1,635 | | | 175,905 | |
| Other | | | | | | | | | | | | | | | | | |
| Delinquency: | | | | | | | | | | | | | | | | | |
| Current | 125 | | | 4,260 | | | 27,256 | | | 6,489 | | | 2,628 | | | 6,065 | | | 488,676 | | | — | | | 535,499 | |
| 30-89 days past due | 59 | | | — | | | — | | | — | | | 33 | | | — | | | — | | | — | | | 92 | |
| 90+ days past due | — | | | — | | | — | | | — | | | — | | | — | | | — | | | — | | | — | |
| Total other | 184 | | | 4,260 | | | 27,256 | | | 6,489 | | | 2,661 | | | 6,065 | | | 488,676 | | | — | | | 535,591 | |
| Total | $ | 3,682,340 | | | $ | 1,019,712 | | | $ | 922,657 | | | $ | 913,379 | | | $ | 658,250 | | | $ | 612,237 | | | $ | 4,725,168 | | | $ | 367,154 | | | $ | 12,900,897 | |
Allowance for Credit Losses
Allowance for Credit Losses – The allowance for credit losses is a reserve established through a provision for credit losses charged to expense, which represents management’s best estimate of lifetime expected losses based on reasonable and supportable forecasts, historical loss experience, and other qualitative considerations. The allowance, in the judgment of management, is necessary to reserve for expected loan losses and risks inherent in the loan portfolio. The Company’s allowance for credit loss methodology includes reserve factors calculated to estimate current expected credit losses to amortized cost balances over the remaining contractual life of the portfolio, adjusted for the effective interest rate used to discount prepayments, in accordance with ASC Topic 326-20, Financial Instruments - Credit Losses. Accordingly, the methodology is based on the Company’s reasonable and supportable economic forecasts, historical loss experience, and other qualitative adjustments.
Loans with similar risk characteristics such as loan type, collateral type, and internal risk ratings are aggregated into homogeneous segments for assessment. Reserve factors are based on estimated probability of default and loss given default for each segment. The estimates are determined based on economic forecasts over the reasonable and supportable forecast period based on projected performance of economic variables that have a statistical relationship with the historical loss experience of the segments. For contractual periods that extend beyond the one-year forecast period, the estimates revert to average historical loss experiences over a one-year period on a straight-line basis.
The Company also includes qualitative adjustments to the allowance based on factors and considerations that have not otherwise been fully accounted for. Qualitative adjustments include, but are not limited to:
•Changes in asset quality - Adjustments related to trending credit quality metrics including delinquency, non-performing loans, charge-offs, and risk ratings that may not be fully accounted for in the reserve factor.
•Changes in the nature and volume of the portfolio - Adjustments related to current changes in the loan portfolio that are not fully represented or accounted for in the reserve factors.
•Changes in lending and loan monitoring policies and procedures - Adjustments related to current changes in lending and loan monitoring procedures as well as review of specific internal policy compliance metrics.
•Changes in the experience, ability, and depth of lending management and other relevant staff - Adjustments to measure increasing or decreasing credit risk related to lending and loan monitoring management.
•Changes in the value of underlying collateral of collateralized loans - Adjustments related to improving or deterioration of the value of underlying collateral that are not fully captured in the reserve factors.
•Changes in and the existence and effect of any concentrations of credit - Adjustments related to credit risk of specific industries that are not fully captured in the reserve factors.
•Changes in regional and local economic and business conditions and developments - Adjustments related to expected and current economic conditions at a regional or local-level that are not fully captured within the Company’s reasonable and supportable forecast.
•Data imprecisions due to limited historical loss data - Adjustments related to limited historical loss data that is representative of the collective loan portfolio.
Loans that do not share similar risk characteristics are evaluated on an individual basis. These evaluations are typically performed on loans with a deteriorated internal risk rating or are classified as a troubled debt restructuring. The allowance for credit loss is determined based on several methods including estimating the fair value of the underlying collateral or the present value of expected cash flows.
For a collateral dependent loan, the Company’s evaluation process includes a valuation by appraisal or other collateral analysis adjusted for selling costs, when appropriate. This valuation is compared to the remaining outstanding principal balance of the loan. If a loss is determined to be probable, the loss is included in the allowance for credit losses as a specific allocation. If the loan is not collateral dependent, the measurement of loss is based on the difference between the expected and contractual future cash flows of the loan.
Loans for which the repayment is expected to be provided substantially through the operation or sale of collateral and where the borrower is experiencing financial difficulty had an amortized cost of $47.1 million and $70.0 million as of December 31, 2021 and 2020, respectively, as further detailed in the table below. The collateral securing these loans consist of commercial real estate properties, residential properties, other business assets, and secured energy production assets.
| | | | | | | | | | | | | | | | | | | | | | | |
| (In thousands) | Real Estate Collateral | | Energy | | Other Collateral | | Total |
| December 31, 2021 | | | | | | | |
| Construction and development | $ | 2,489 | | | $ | — | | | $ | — | | | $ | 2,489 | |
| Single family residential | 1,838 | | | — | | | — | | | 1,838 | |
| Other commercial real estate | 32,849 | | | — | | | — | | | 32,849 | |
| Commercial | — | | | — | | | 9,913 | | | 9,913 | |
| Total | $ | 37,176 | | | $ | — | | | $ | 9,913 | | | $ | 47,089 | |
| | | | | | | |
| December 31, 2020 | | | | | | | |
| Construction and development | $ | 1,539 | | | $ | — | | | $ | — | | | $ | 1,539 | |
| Single family residential | 6,950 | | | — | | | — | | | 6,950 | |
| Other commercial real estate | — | | | 40,703 | | | 5,741 | | | 46,444 | |
| Commercial | 15,065 | | | — | | | — | | | 15,065 | |
| Total | $ | 23,554 | | | $ | 40,703 | | | $ | 5,741 | | | $ | 69,998 | |
The following table details activity in the allowance for credit losses by portfolio segment for the years ended December 31, 2021, 2020 and 2019. Allocation of a portion of the allowance to one category of loans does not preclude its availability to absorb losses in other categories.
| | | | | | | | | | | | | | | | | | | | | | | | | | | | | |
| (In thousands) | Commercial | | Real
Estate | | Credit
Card | | Other
Consumer
and Other | | Total |
| December 31, 2021 | | | | | | | | | |
| Beginning balance, January 1, 2021 | $ | 42,093 | | | $ | 182,868 | | | $ | 7,472 | | | $ | 5,617 | | | $ | 238,050 | |
| Acquisition adjustment for PCD loans | 3,349 | | | 10,101 | | | — | | | 1 | | | 13,451 | |
| Provision for credit loss expense | (22,031) | | | (7,918) | | | (908) | | | (352) | | | (31,209) | |
| Charge-offs | (10,613) | | | (10,691) | | | (3,625) | | | (2,053) | | | (26,982) | |
| Recoveries | 4,660 | | | 4,910 | | | 1,048 | | | 1,404 | | | 12,022 | |
| Net charge-offs | (5,953) | | | (5,781) | | | (2,577) | | | (649) | | | (14,960) | |
| Ending balance, December 31, 2021 | $ | 17,458 | | | $ | 179,270 | | | $ | 3,987 | | | $ | 4,617 | | | $ | 205,332 | |
| | | | | | | | | |
| December 31, 2020 | | | | | | | | | |
| Beginning balance, January 1, 2020 - prior to adoption of CECL | $ | 22,863 | | | $ | 39,161 | | | $ | 4,051 | | | $ | 2,169 | | | $ | 68,244 | |
| Impact of CECL adoption | 22,733 | | | 114,314 | | | 2,232 | | | 12,098 | | | 151,377 | |
| Provision for credit loss expense | 42,017 | | | 42,276 | | | 4,288 | | | (6,093) | | | 82,488 | |
| Charge-offs | (48,736) | | | (13,788) | | | (4,113) | | | (4,022) | | | (70,659) | |
| Recoveries | 3,216 | | | 905 | | | 1,014 | | | 1,465 | | | 6,600 | |
| Net charge-offs | (45,520) | | | (12,883) | | | (3,099) | | | (2,557) | | | (64,059) | |
| Ending balance, December 31, 2020 | $ | 42,093 | | | $ | 182,868 | | | $ | 7,472 | | | $ | 5,617 | | | $ | 238,050 | |
| | | | | | | | | |
| December 31, 2019 | | | | | | | | | |
| Beginning balance, January 1, 2019 | $ | 20,514 | | | $ | 29,838 | | | $ | 3,923 | | | $ | 2,419 | | | $ | 56,694 | |
| Provision for credit loss expense | 24,434 | | | 12,714 | | | 3,692 | | | 2,400 | | | 43,240 | |
| Charge-offs | (23,352) | | | (3,892) | | | (4,585) | | | (5,007) | | | (36,836) | |
| Recoveries | 1,267 | | | 501 | | | 1,021 | | | 2,357 | | | 5,146 | |
| Net charge-offs | (22,085) | | | (3,391) | | | (3,564) | | | (2,650) | | | (31,690) | |
| Ending balance, December 31, 2019 | $ | 22,863 | | | $ | 39,161 | | | $ | 4,051 | | | $ | 2,169 | | | $ | 68,244 | |
As of December 31, 2021, the Company’s allowance for credit losses was considered sufficient based upon expected loan level cash flows that were supported by economic forecasts. Provision expense was recaptured during the year based upon improved asset credit quality metrics combined with improved Moody’s economic modeling scenarios. The Company updated credit loss forecasts using multiple Moody’s economic scenarios published in December 2021. The baseline economic forecast was weighted 65% by the Company, while the downside scenario of S-2 was weighted 17% and the upside scenario of S-1 was weighted 18%. The weighting of the forecasts is characterized by, among others, continual increase of CRE prices, increasing market rates and declining national unemployment rates. While forecasts in various sectors have improved as of December 31, 2021 when compared with the prior year, the Company continues to closely monitor the scenarios as the economy emerges from the pandemic.
The primary driver for the provision for credit losses for the year ended December 31, 2020 was related to concern over the economic stresses related to COVID-19. Additionally, specific provisions were made for two energy credits that were previously identified as problem loans that were impacted by the sharp decline in commodity pricing. Four energy credits within the Commercial segment were charged off during 2020 for a total of $32.6 million.
Reserve for Unfunded Commitments
In addition to the allowance for credit losses, the Company has established a reserve for unfunded commitments, classified in other liabilities. This reserve is maintained at a level management believes to be sufficient to absorb losses arising from unfunded loan commitments. The reserve for unfunded commitments was $22.4 million, as of December 31, 2021 and 2020 respectively. The adequacy of the reserve for unfunded commitments is determined quarterly based on methodology similar to the methodology for determining the allowance for credit losses. No adjustment was made to the reserve for unfunded commitments during 2021 as it was considered sufficient to cover any loss expectations.
Provision for Credit Losses
Provision for credit losses is determined by the Company as the amount to be added to the allowance for credit loss accounts for various types of financial instruments including loans, securities and off-balance-sheet credit exposure after net charge-offs have been deducted to bring the allowance to a level which, in management's best estimate, is necessary to absorb expected credit losses over the lives of the respective financial instruments.
The components of provision for credit losses for the years ended December 31 were as follows:
| | | | | | | | | | | | | | | | | |
| (In thousands) | 2021 | | 2020 | | 2019 |
| Provision for credit losses related to: | | | | | |
| Loans | $ | (31,209) | | | $ | 82,488 | | | $ | 43,240 | |
| Unfunded commitments | — | | | (10,000) | | | — | |
| Securities - HTM | (1,183) | | | 2,546 | | | — | |
| Securities - AFS | (312) | | | (61) | | | — | |
| Total | $ | (32,704) | | | $ | 74,973 | | | $ | 43,240 | |
Provision for credit losses in 2019 was calculated under the prior incurred loss accounting methodology. Furthermore, provision for credit losses related to unfunded commitments was previously reported as a component of other non-interest expense.
Purchased Credit Deteriorated Loans
Purchased loans that reflect a more-than-insignificant deterioration of credit from origination are considered PCD. For PCD loans, the initial estimate of expected credit losses is recognized in the allowance for credit loss on the date of acquisition using the same methodology as discussed in the Allowance for Credit Losses section included above.
The following table provides a summary of loans purchased as part of the Landmark acquisition with credit deterioration at acquisition:
| | | | | | | | | | | | | | | | | | | | | | | | | | | | | |
| (In thousands) | Commercial | | Real
Estate | | Credit
Card | | Other
Consumer
and Other | | Total |
| Unpaid principal balance | 11,046 | | | 55,549 | | | — | | | 67 | | | 66,662 | |
| PCD allowance for credit loss at acquisition | (350) | | | (2,008) | | | — | | | (1) | | | (2,359) | |
| Non-credit related discount | (160) | | | (2,415) | | | — | | | (2) | | | (2,577) | |
| Fair value of PCD loans | 10,536 | | | 51,126 | | | — | | | 64 | | | 61,726 | |
The following table provides a summary of loans purchased as part of the Triumph acquisition with credit deterioration at acquisition:
| | | | | | | | | | | | | | | | | | | | | | | | | | | | | |
| (In thousands) | Commercial | | Real
Estate | | Credit
Card | | Other
Consumer
and Other | | Total |
| Unpaid principal balance | 40,466 | | | 80,803 | | | — | | | 15 | | | 121,284 | |
| PCD allowance for credit loss at acquisition | (2,999) | | | (8,093) | | | — | | | — | | | (11,092) | |
| Non-credit related discount | (279) | | | (1,314) | | | — | | | (1) | | | (1,594) | |
| Fair value of PCD loans | 37,188 | | | 71,396 | | | — | | | 14 | | | 108,598 | |
NOTE 6: RIGHT-OF-USE LEASE ASSETS AND LEASE LIABILITIES
The Company accounts for its leases in accordance with ASC Topic 842, Leases, which requires recognition of most leases, including operating leases, with a term greater than 12 months on the balance sheet. At lease commencement, the lease contract is reviewed to determine whether the contract is a finance lease or an operating lease; a lease liability is recognized on a discounted basis, related to the Company’s obligation to make lease payments; and a right-of-use asset is also recognized related to the Company’s right to use, or control the use of, a specified asset for the lease term. The Company accounts for lease and non-lease components (such as taxes, insurance and common area maintenance costs) separately as such amounts are generally readily determinable under the lease contracts. Lease payments over the expected term are discounted using the Company’s FHLB advance rates for borrowings of similar term. If it is reasonably certain that a renewal or termination option will be exercised, the effects of such options are included in the determination of the expected lease term. Leases with an initial term of 12 months or less are not recorded on the balance sheet; the Company recognizes lease expense for these leases on a straight-line basis over the lease term.
The Company’s leases are classified as operating leases with a term, including expected renewal or termination options, greater than one year, and are related to certain office facilities and office equipment. The following table presents information related to the Company’s right-of-use lease assets, included in premises and equipment, and lease liabilities, included in other liabilities, at December 31, 2021 and 2020.
| | | | | | | | | | | |
| (Dollars in thousands) | 2021 | | 2020 |
| Right-of-use lease assets | $ | 48,855 | | | $ | 31,348 | |
| Lease liabilities | $ | 49,321 | | | $ | 31,433 | |
| | | |
| Weighted average remaining lease term | 7.96 years | | 6.55 years |
| Weighted average discount rate | 2.00 | % | | 3.09 | % |
Operating lease cost for the years ended December 31, 2021, 2020 and 2019 was $11,530,000, $13,103,000, and $13,560,000, respectively.
The Company’s remaining undiscounted minimum lease payments on operating leases as of December 31, 2021 are as follows:
| | | | | |
| Year | (In thousands) |
| 2022 | $ | 11,441 | |
| 2023 | 8,850 | |
| 2024 | 6,786 | |
| 2025 | 5,483 | |
| 2026 | 4,549 | |
| Thereafter | 16,773 | |
| Total undiscounted minimum lease payments | 53,882 | |
| Less: Net present value adjustment | 4,561 | |
| Lease liability included in other liabilities | $ | 49,321 | |
NOTE 7: PREMISES AND EQUIPMENT
Premises and equipment are stated at cost less accumulated depreciation and amortization. Total premises and equipment, net at December 31, 2021 and December 31, 2020 were as follows:
| | | | | | | | | | | |
| (In thousands) | 2021 | | 2020 |
| Right-of-use lease assets | $ | 48,855 | | | $ | 31,348 | |
| Premises and equipment: | | | |
| Land | 101,728 | | | 90,953 | |
| Buildings and improvements | 320,844 | | | 293,338 | |
| Furniture, fixtures and equipment | 107,122 | | | 100,863 | |
| Software | 66,947 | | | 64,877 | |
| Construction in progress | 9,117 | | | 763 | |
| Accumulated depreciation and amortization | (171,144) | | | (140,450) | |
| Total premises and equipment, net | $ | 483,469 | | | $ | 441,692 | |
NOTE 8: GOODWILL AND OTHER INTANGIBLE ASSETS
Goodwill is tested annually, or more often than annually, if circumstances warrant, for impairment. If the implied fair value of goodwill is lower than its carrying amount, goodwill impairment is indicated, and goodwill is written down to its implied fair value. Subsequent increases in goodwill value are not recognized in the financial statements. Goodwill totaled $1.15 billion at December 31, 2021 and $1.08 billion at December 31, 2020.
During 2019, the Company recorded $131.3 million and $78.5 million of goodwill as a result of its acquisitions of Landrum and Reliance, respectively. Goodwill increased $19.8 million during 2020 due to the continued assessment of the fair value and assumed tax position of the Landrum acquisition that was finalized during the third quarter of 2020. The Company recorded $39.0 million and $31.7 million of goodwill related to its acquisitions of Triumph and Landmark during 2021, respectively.
Goodwill impairment was neither indicated nor recorded in 2021, 2020 or 2019. During the first quarter of 2020, the Company’s share price began to decline as the markets in the United States responded to the global COVID-19 pandemic. As a result of that economic decline, the effect on share price and other factors, the Company performed an interim goodwill impairment assessment during each quarter of 2020 and concluded no impairment existed during each period. Due to the improved market and economic conditions during 2021, and the related effects on the Company’s share price, the Company did not perform any interim goodwill impairment assessments in addition to the annual impairment test. An interim goodwill impairment analysis will be performed by the Company if the stock price falls below the book value per share for a full quarter. During the second quarter of 2021, the Company performed an annual goodwill impairment analysis and concluded no impairment existed. While the goodwill impairment analysis indicated no impairment at December 31, 2021, the Company’s assessment depends on several assumptions which are dependent on market and economic conditions, and future changes in those conditions could impact the Company’s assessment in the future.
Core deposit premiums represent the value of the relationships that acquired banks had with their deposit customers and are amortized over periods ranging from 10 years to 15 years and are periodically evaluated, at least annually, as to the recoverability of their carrying value. Other intangible assets represent the value of other acquired relationships, including relationships with trust and wealth management customers, and are being amortized over various periods ranging from 10 years to 15 years.
Changes in the carrying amount and accumulated amortization of the Company’s core deposit premiums and other intangible assets at December 31, 2021 and 2020 were as follows:
| | | | | | | | | | | |
| (In thousands) | 2021 | | 2020 |
| Core deposit premiums: | | | |
| Balance, beginning of year | $ | 97,363 | | | $ | 111,808 | |
Acquisitions(1) | 9,295 | | | — | |
Disposition of intangible asset(2) | (674) | | | (2,324) | |
| Amortization | (12,122) | | | (12,121) | |
| Balance, end of year | 93,862 | | | 97,363 | |
| Books of business and other intangibles: | | | |
| Balance, beginning of year | 13,747 | | | 15,532 | |
| | | |
| Disposition of intangible asset | — | | | (413) | |
| Amortization | (1,374) | | | (1,372) | |
| Balance, end of year | 12,373 | | | 13,747 | |
| Total other intangible assets, net | $ | 106,235 | | | $ | 111,110 | |
_________________________
(1) Core deposit premiums of $5.1 million and $4.2 million were recorded during 2021 as part of the Triumph and Landmark acquisitions, respectively. See Note 2, Acquisitions, for additional information on acquisitions completed in 2021.
(2) Adjustments recorded for the premiums on certain deposit liabilities associated with the sale of banking operations.
The carrying basis and accumulated amortization of the Company’s other intangible assets at December 31, 2021 and 2020 were as follows:
| | | | | | | | | | | |
| (In thousands) | 2021 | | 2020 |
| Core deposit premiums: | | | |
| Gross carrying amount | $ | 153,496 | | | $ | 146,355 | |
| Accumulated amortization | (59,634) | | | (48,992) | |
| Core deposit premiums, net | 93,862 | | | 97,363 | |
| Books of business and other intangibles: | | | |
| Gross carrying amount | 19,937 | | | 19,937 | |
| Accumulated amortization | (7,564) | | | (6,190) | |
| Books of business and other intangibles, net | 12,373 | | | 13,747 | |
| Total other intangible assets, net | $ | 106,235 | | | $ | 111,110 | |
Core deposit premium amortization expense recorded for the years ended December 31, 2021, 2020 and 2019 was $12.1 million, $12.1 million and $10.7 million, respectively. Amortization expense recorded for books of business and other intangibles was $1.4 million, $1.4 million, and $1.1 million for the years ended December 31, 2021, 2020 and 2019, respectively.
The Company’s estimated remaining amortization expense on other intangible assets as of December 31, 2021 is as follows:
| | | | | |
| Year | (In thousands) |
| 2022 | $ | 13,894 | |
| 2023 | 13,612 | |
| 2024 | 12,709 | |
| 2025 | 10,125 | |
| 2026 | 9,652 | |
| Thereafter | 46,243 | |
| Total | $ | 106,235 | |
NOTE 9: TIME DEPOSITS
Time deposits included approximately $784.9 million and $889.8 million of certificates of deposit over $250,000 at December 31, 2021 and 2020, respectively.
Brokered time deposits were $466.0 million and $512.3 million at December 31, 2021 and 2020, respectively. Maturities of all time deposits at December 31, 2021 are as follows:
| | | | | |
| Year | (In thousands) |
| 2022 | $ | 1,998,105 | |
| 2023 | 307,625 | |
| 2024 | 97,887 | |
| 2025 | 34,903 | |
| 2026 | 13,352 | |
| Thereafter | 588 | |
| Total | $ | 2,452,460 | |
Deposits are the Company’s primary funding source for loans and investment securities. The mix and repricing alternatives can significantly affect the cost of this source of funds and, therefore, impact the interest margin.
NOTE 10: INCOME TAXES
The provision for income taxes for the years ended December 31 is comprised of the following components:
| | | | | | | | | | | | | | | | | |
| (In thousands) | 2021 | | 2020 | | 2019 |
| Income taxes currently payable | $ | 50,369 | | | $ | 65,012 | | | $ | 29,354 | |
| Deferred income taxes | 10,937 | | | (122) | | | 34,911 | |
| Provision for income taxes | $ | 61,306 | | | $ | 64,890 | | | $ | 64,265 | |
The tax effects of temporary differences between the tax basis of assets and liabilities and their financial reporting amounts that give rise to deferred income tax assets and liabilities, and their approximate tax effects, are as follows as of December 31, 2021 and 2020:
| | | | | | | | | | | |
| (In thousands) | 2021 | | 2020 |
| Deferred tax assets: | | | |
| Loans acquired | $ | 4,832 | | | $ | 10,100 | |
| Allowance for credit losses | 48,462 | | | 58,028 | |
| Valuation of foreclosed assets | 628 | | | 1,673 | |
| Tax NOLs from acquisition | 13,537 | | | 16,028 | |
| Deferred compensation payable | 3,426 | | | 3,060 | |
| Accrued equity and other compensation | 5,776 | | | 5,905 | |
| Acquired securities | 223 | | | 587 | |
| Right-of-use lease liability | 11,984 | | | 7,835 | |
| Unrealized loss on available-for-sale securities | 8,164 | | | — | |
| Allowance for unfunded commitments | 5,442 | | | 5,583 | |
| Other | 7,202 | | | 7,600 | |
| Gross deferred tax assets | 109,676 | | | 116,399 | |
| Deferred tax liabilities: | | | |
| Goodwill and other intangible amortization | (38,329) | | | (38,882) | |
| Accumulated depreciation | (26,347) | | | (34,667) | |
| Right-of-use lease asset | (11,871) | | | (7,813) | |
| Unrealized gain on available-for-sale securities | — | | | (17,521) | |
| Unrealized gain on swaps | (2,767) | | | — | |
| Other | (3,718) | | | (4,021) | |
| Gross deferred tax liabilities | (83,032) | | | (102,904) | |
| Net deferred tax asset | $ | 26,644 | | | $ | 13,495 | |
A reconciliation of income tax expense at the statutory rate to the Company’s actual income tax expense is shown below for the years ended December 31:
| | | | | | | | | | | | | | | | | |
| (In thousands) | 2021 | | 2020 | | 2019 |
| Computed at the statutory rate | $ | 69,807 | | | $ | 67,143 | | | $ | 63,442 | |
| Increase (decrease) in taxes resulting from: | | | | | |
| State income taxes, net of federal tax benefit | 4,452 | | | 6,402 | | | 5,860 | |
| Discrete items related to share-based compensation | (17) | | | 375 | | | (38) | |
| Tax exempt interest income | (11,510) | | | (6,726) | | | (4,390) | |
| Tax exempt earnings on bank owned life insurance | (1,212) | | | (1,214) | | | (852) | |
| Federal tax credits | (2,260) | | | (2,177) | | | (939) | |
| Other differences, net | 2,046 | | | 1,087 | | | 1,182 | |
| Actual tax provision | $ | 61,306 | | | $ | 64,890 | | | $ | 64,265 | |
The Company follows ASC Topic 740, Income Taxes, which prescribes a recognition threshold and a measurement attribute for the financial statement recognition and measurement of a tax position taken or expected to be taken in a tax return. Benefits from tax positions should be recognized in the financial statements only when it is more likely than not that the tax position will be sustained upon examination by the appropriate taxing authority that would have full knowledge of all relevant information. A tax position that meets the more-likely-than-not recognition threshold is measured at the largest amount of benefit that is greater than fifty percent likely of being realized upon ultimate settlement. Tax positions that previously failed to meet the more-likely-than-not recognition threshold should be recognized in the first subsequent financial reporting period in which that threshold is met. Previously recognized tax positions that no longer meet the more-likely-than-not recognition threshold should be derecognized in the first subsequent financial reporting period in which that threshold is no longer met. ASC Topic 740 also provides guidance on the accounting for and disclosure of unrecognized tax benefits, interest and penalties. The Company has no history of expiring net
operating loss carryforwards and is projecting significant pre-tax and financial taxable income in future years. The Company expects to fully realize its deferred tax assets in the future.
The amount of unrecognized tax benefits may increase or decrease in the future for various reasons including adding amounts for current tax year positions, expiration of open income tax returns due to the statutes of limitation, changes in management’s judgment about the level of uncertainty, status of examinations, litigation and legislative activity and the addition or elimination of uncertain tax positions. Section 382 of the Internal Revenue Code imposes an annual limit on the ability of a corporation that undergoes an “ownership change” to use its U.S. net operating losses to reduce its tax liability. The Company has engaged in three tax-free reorganization transactions in which acquired net operating losses are limited pursuant to Section 382. In total, approximately $60.9 million of federal net operating losses subject to the IRC Section 382 annual limitation are expected to be utilized by the Company, of which $30.9 million is related to the Reliance acquisition that closed during 2019 and $1.9 million is related to the Landmark acquisition that closed during the fourth quarter of 2021. All of the acquired Reliance net operating losses are expected to be fully utilized by 2027, with the remaining acquired net operating loss carryforwards expected to be fully utilized by 2036.
The Company files income tax returns in the U.S. federal jurisdiction. The Company’s U.S. federal income tax returns are open and subject to examinations from the 2018 tax year and forward. The Company’s various state income tax returns are generally open from the 2018 and later tax return years based on individual state statute of limitations.
NOTE 11: SECURITIES SOLD UNDER AGREEMENTS TO REPURCHASE
The Company utilizes securities sold under agreements to repurchase to facilitate the needs of its customers and to facilitate secured short-term funding needs. Securities sold under agreements to repurchase are stated at the amount of cash received in connection with the transaction. The Company monitors collateral levels on a continuous basis. The Company may be required to provide additional collateral based on the fair value of the underlying securities. Securities pledged as collateral under repurchase agreements are maintained with the Company’s safekeeping agents.
The gross amount of recognized liabilities for repurchase agreements was $170.4 million and $248.9 million at December 31, 2021 and 2020, respectively. The remaining contractual maturity of the securities sold under agreements to repurchase in the consolidated balance sheets as of December 31, 2021 and 2020 is presented in the following tables.
| | | | | | | | | | | | | | | | | | | | | | | | | | | | | |
| | Remaining Contractual Maturity of the Agreements |
| (In thousands) | Overnight and
Continuous | | Up to 30 Days | | 30-90 Days | | Greater than
90 Days | | Total |
| December 31, 2021 | | | | | | | | | |
| Repurchase agreements: | | | | | | | | | |
| U.S. Government agencies | $ | 170,403 | | | $ | — | | | $ | — | | | $ | — | | | $ | 170,403 | |
| | | | | | | | | |
| December 31, 2020 | | | | | | | | | |
| Repurchase agreements: | | | | | | | | | |
| U.S. Government agencies | $ | 248,861 | | | $ | — | | | $ | — | | | $ | — | | | $ | 248,861 | |
NOTE 12: OTHER BORROWINGS AND SUBORDINATED NOTES AND DEBENTURES
Debt at December 31, 2021 and 2020 consisted of the following components:
| | | | | | | | | | | |
| (In thousands) | 2021 | | 2020 |
| Other Borrowings | | | |
FHLB advances, net of discount, due 2022 to 2035, 0.23% to 7.37%, secured by real estate loans | $ | 1,306,143 | | | $ | 1,308,674 | |
| Other long-term debt | 31,830 | | | 33,393 | |
| Total other borrowings | 1,337,973 | | | 1,342,067 | |
| | | |
| Subordinated Notes and Debentures | | | |
Subordinated notes payable, due 4/1/2028, fixed-to-floating rate (fixed rate of 5.00% through 3/31/2023, floating rate of 2.15% above the three month LIBOR rate, reset quarterly) | 330,000 | | | 330,000 | |
Trust preferred securities, net of discount, due 9/15/2037, floating rate of 1.37% above the three month LIBOR rate, reset quarterly | 10,310 | | | 10,310 | |
Trust preferred securities, net of discount, due 6/6/2037, floating rate of 1.57% above the three month LIBOR rate, reset quarterly, callable without penalty | 10,310 | | | 10,310 | |
Trust preferred securities, due 12/15/2035, floating rate of 1.45% above the three month LIBOR rate, reset quarterly, callable without penalty | 6,702 | | | 6,702 | |
Trust preferred securities, net of discount, due 6/15/2037, floating rate of 1.85% above the three month LIBOR rate, reset quarterly, callable without penalty | 25,329 | | | 25,172 | |
Trust preferred securities, net of discount, due 12/15/2036, floating rate of 1.85% above the three month LIBOR rate, reset quarterly, callable without penalty | 3,041 | | | 3,023 | |
| Unamortized debt issuance costs | (1,561) | | | (2,643) | |
| Total subordinated notes and debentures | 384,131 | | | 382,874 | |
Total other borrowings and subordinated debt | $ | 1,722,104 | | | $ | 1,724,941 | |
In March 2018, the Company issued $330.0 million in aggregate principal amount, of 5.00% Fixed-to-Floating Rate Subordinated Notes (“Notes”) at a public offering price equal to 100% of the aggregate principal amount of the Notes. The Company incurred $3.6 million in debt issuance costs related to the offering during March 2018. The Notes will mature on April 1, 2028 and will bear interest at an initial fixed rate of 5.00% per annum, payable semi-annually in arrears. From and including April 1, 2023 to, but excluding, the maturity date or the date of earlier redemption, the interest rate will reset quarterly to an annual interest rate equal to the then-current three month London Interbank Offered Rate (“LIBOR”) rate plus 215 basis points, payable quarterly in arrears. The Notes will be subordinated in right of payment to the payment of the Company’s other existing and future senior indebtedness, including all of its general creditors. The Notes are obligations of the Company only and are not obligations of, and are not guaranteed by, any of its subsidiaries. The Company used a portion of the net proceeds from the sale of the Notes to repay certain outstanding indebtedness. The Notes qualify for Tier 2 capital treatment.
The terms of the Company’s Notes and trust preferred securities utilize the three month LIBOR rate to determine the interest rate and expense due each quarter. The Company is currently reviewing all applicable documents and working with the debt holders and all relevant parties to determine the alternate interest rate index to be utilized, or other impacts, when the relevant LIBOR rate is discontinued.
The Company had total FHLB advances of $1.31 billion at December 31, 2021, of which $1.30 billion are FHLB Owns the Option (“FOTO”) advances. FOTO advances are a low cost, fixed-rate source of funding in return for granting to FHLB the flexibility to choose a termination date earlier than the maturity date. Typically, FOTO exercise dates follow a specified lockout period at the beginning of the term when FHLB cannot terminate the FOTO advance. If FHLB exercises its option to terminate the FOTO advance at one of the specified option exercise dates, there is no termination or prepayment fee, and replacement funding will be available at then-prevailing market rates, subject to FHLB’s credit and collateral requirements. The Company’s FOTO advances outstanding at the end of the year have original maturity dates of ten years to fifteen years with lockout periods that have expired. During the fourth quarter of 2020, the Company reclassified the FOTO advances as long-term advances due to the current low interest rate environment and the expectation that FHLB will not exercise the option to terminate the FOTO advances prior to its stated maturity date. The possibility of the FHLB exercising the options is continually analyzed by the Company along with the market expected rate outcome. At December 31, 2021, the FHLB advances outstanding were secured by mortgage loans and investment securities totaling approximately $4.3 billion and the Company had approximately $2.9 billion of
additional advances available from the FHLB. At December 31, 2021, the Company had $98,000 of FHLB advances outstanding with original or expected maturities of one year or less.
The trust preferred securities are tax-advantaged issues that qualify for inclusion as Tier 2 capital at December 31, 2021. Distributions on these securities are included in interest expense on long-term debt. Each of the trusts is a statutory business trust organized for the sole purpose of issuing trust securities and investing the proceeds thereof in junior subordinated debentures of the Company, the sole asset of each trust. The preferred securities of each trust represent preferred beneficial interests in the assets of the respective trusts and are subject to mandatory redemption upon payment of the junior subordinated debentures held by the trust. The common securities of each trust are wholly-owned by the Company. Each trust’s ability to pay amounts due on the trust preferred securities is solely dependent upon the Company making payments on the related junior subordinated debentures. The Company’s obligations under the junior subordinated securities and other relevant trust agreements, in the aggregate, constitute a full and unconditional guarantee by the Company of each respective trust’s obligations under the trust securities issued by each respective trust.
The Company’s long-term debt primarily includes subordinated debt and long-term FHLB advances with an original maturity of greater than one year. Aggregate annual maturities of long-term debt at December 31, 2021, are as follows:
| | | | | |
| Year | (In thousands) |
| 2022 | $ | 1,833 | |
| 2023 | 1,789 | |
| 2024 | 2,425 | |
| 2025 | 4,956 | |
| 2026 | 1,881 | |
| Thereafter | 1,709,220 | |
| Total | $ | 1,722,104 | |
NOTE 13: CAPITAL STOCK
On February 27, 2009, at a special meeting, the Company’s shareholders approved an amendment to the Articles of Incorporation to establish 40,040,000 authorized shares of preferred stock, $0.01 par value. The aggregate liquidation preference of all shares of preferred stock cannot exceed $80.0 million.
On October 29, 2019, the Company filed Amended and Restated Articles of Incorporation (“October Amended Articles”) with the Arkansas Secretary of State. The October Amended Articles classified and designated Series D Preferred Stock, Par Value $0.01 Per Share, out of the Company’s authorized preferred stock. On November 30, 2021, the Company redeemed all of the Series D Preferred Stock, including accrued and unpaid dividends.
On March 31, 2021, the Company filed a shelf registration with the SEC. The shelf registration statement provides increased flexibility and more efficient access to raise capital from time to time through the sale of common stock, preferred stock, debt securities, depository shares, warrants, purchase contracts, purchase units, subscription rights, units or a combination thereof, subject to market conditions. Specific terms and prices are determined at the time of any offering under a separate prospectus supplement that the Company is required to file with the SEC at the time of the specific offering.
On April 19, 2018, shareholders of the Company approved an increase in the number of authorized shares from 120,000,000 to 175,000,000.
On July 23, 2012, the Company approved a stock repurchase program which authorized the repurchase of up to 1,700,000 shares of common stock. On October 22, 2019, the Company announced a new stock repurchase program (“2019 Program”) that replaced the stock repurchase program approved on July 23, 2012, under which the Company may repurchase up to $60.0 million of its Class A Common Stock currently issued and outstanding. On March 5, 2020, the Company announced an amendment to the 2019 Program that increased the maximum amount that may be repurchased under the 2019 Program from $60.0 million to $180.0 million. Effective July 23, 2021, the Company approved a second amendment that increased the maximum amount that may be repurchased under the 2019 Program to $276.5 million.
During 2021, the Company repurchased 4,562,469 shares at an average price of $29.03 per share under the 2019 Program. Market conditions and the Company’s capital needs will drive decisions regarding additional, future stock repurchases. The Company repurchased 5,956,700 shares at an average price of $19.03 per share during 2020.
During January 2022, the Company substantially exhausted the remaining capacity under the 2019 Program and authorized a new stock repurchase program (the “2022 Program”) under which the Company may repurchase up to $175.0 million of its Class A common stock currently issued and outstanding.
Under the 2022 Program, which replaced the 2019 Program, the Company may repurchase shares of its common stock through open market and privately negotiated transactions or otherwise. The timing, pricing, and amount of any repurchases under the 2022 Program will be determined by the Company’s management at its discretion based on a variety of factors, including, but not limited to, trading volume and market price of the Company’s common stock, corporate considerations, the Company’s working capital and investment requirements, general market and economic conditions, and legal requirements. The 2022 Program does not obligate the Company to repurchase any common stock and may be modified, discontinued, or suspended at any time without prior notice. The Company anticipates funding for this 2022 Program to come from available sources of liquidity, including cash on hand and future cash flow.
NOTE 14: TRANSACTIONS WITH RELATED PARTIES
At December 31, 2021 and 2020, Simmons Bank had extensions of credit to executive officers and directors and to companies in which Simmons Bank’s executive officers or directors were principal owners in the amount of $6.2 million at December 31, 2021 and $6.5 million at December 31, 2020.
| | | | | | | | | | | |
| (In thousands) | 2021 | | 2020 |
| Balance, beginning of year | $ | 6,536 | | | $ | 20,138 | |
| New extensions of credit | 1,487 | | | 4,022 | |
| Repayments | (1,807) | | | (17,624) | |
| Balance, end of year | $ | 6,216 | | | $ | 6,536 | |
In management’s opinion, such loans and other extensions of credit, deposits and vendor contracts (which were not material) were made in the ordinary course of business and were made on substantially the same terms (including interest rates and collateral) as those prevailing at the time for comparable transactions with unrelated persons or through a competitive bid process. Further, in management’s opinion, these extensions of credit did not involve more than the normal risk of collectability or present other unfavorable features.
NOTE 15: EMPLOYEE BENEFIT PLANS
Retirement Plans
The Company offers a qualified 401(k) Plan in which the Company makes matching contributions to encourage employees to save money for their retirement. The 401(k) Plan covers substantially all employees. Under the terms of the 401(k) Plan, employees may defer a portion of their eligible pay, up to the maximum allowed by I.R.S. regulation, and the Company matches 100% of the first 3% of compensation and 50% of the next 2% of compensation for a total match of 4% of eligible pay for each participant who defers 5% or more of his or her eligible pay. Additionally, the Company may make profit-sharing contributions to the 401(k) Plan which are allocated among participants based upon 401(k) Plan compensation without regard to participant contributions. Contribution expense to the plan totaled $13.9 million, $10.3 million and $13.0 million in 2021, 2020 and 2019, respectively.
The Company also provides deferred compensation agreements with certain active and retired officers. The agreements provide monthly payments of retirement compensation for either stated periods or for the life of the participant. The charges to income for the plans were $2.7 million for 2021, $2.7 million for 2020 and $2.3 million for 2019. Such charges reflect the straight-line accrual over the employment period of the present value of benefits due each participant, as of their full eligibility date, using an appropriate discount factor.
Employee Stock Purchase Plan
The Company established an Employee Stock Purchase Plan in 2015 which generally allows participants to make contributions of up to $25,000 per year, for the purpose of acquiring the Company’s common stock. At the end of each plan year, full shares of the Company’s stock are purchased for each employee based on that employee’s contributions. The Company has issued both general and special stock offerings under the plan. Substantially all employees are eligible for the general stock offering, under which full shares of the Company’s stock are purchased for an amount equal to 95% of their fair market value at the end of the plan year, or, if lower, 95% of their fair market value at the beginning of the plan year.
The special stock offering is available to substantially all non-highly compensated employees with at least six months of service, and these employees may allocate up to $10,000 to this offering. Under the special stock offering, full shares of the Company’s stock are purchased for an amount equal to 85% of their fair market value at the end of the plan year, or, if lower, 85% of their fair market value at the beginning of the plan year.
Stock-Based Compensation Plans
The Company’s Board of Directors has adopted various stock-based compensation plans. The plans provide for the grant of incentive stock options, nonqualified stock options, stock appreciation rights, restricted stock awards, restricted stock units and performance stock units. Pursuant to the plans, shares are reserved for future issuance by the Company upon exercise of stock options or awards of restricted stock, restricted stock units, or performance stock units granted to directors, officers and other key employees.
Stock-based compensation expense for all stock-based compensation awards is based on the grant date fair value. For all awards except stock option awards, the grant date fair value is the market value per share as of the grant date. For stock option awards, the fair value is estimated at the date of grant using the Black-Scholes option-pricing model. This model requires the input of highly subjective assumptions, changes to which can materially affect the fair value estimate. Additionally, there may be other factors that would otherwise have a significant effect on the value of employee stock options granted but are not considered by the model. Accordingly, while management believes that the Black-Scholes option-pricing model provides a reasonable estimate of fair value, the model does not necessarily provide the best single measure of fair value for the Company’s employee stock options.
The fair value of each option award is estimated on the date of grant using the Black-Scholes option-pricing model that uses various assumptions. Expected volatility is based on historical volatility of the Company’s stock and other factors. The Company uses historical data to estimate option exercise and employee termination within the valuation model. The expected term of options granted is derived from the output of the option valuation model and represents the period of time that options granted are expected to be outstanding. The risk-free rate for periods within the contractual life of the option is based on the U.S. Treasury yield curve in effect at the time of grant. Forfeitures are estimated at the time of grant, and are based partially on historical experience.
The table below summarizes the transactions under the Company’s active stock compensation plans at December 31, 2021, 2020 and 2019, and changes during the years then ended:
| | | | | | | | | | | | | | | | | | | | | | | | | | | | | | | | | | | | | | |
| | | Stock Options
Outstanding | | Non-vested Stock Awards Outstanding | | Non-vested Stock Units Outstanding |
| (Shares in thousands) | | Number of Shares | | Weighted
Average
Exercise
Price | | Number of Shares | | Weighted Average Grant-Date Fair Value | | Number of Shares | | Weighted Average Grant-Date Fair Value |
| Balance, December 31, 2018 | | 695 | | | $ | 22.42 | | | 72 | | | $ | 21.45 | | | 817 | | | $ | 27.65 | |
| Granted | | — | | | — | | | — | | | — | | | 842 | | | 26.05 | |
| Stock options exercised | | (3) | | | 12.79 | | | — | | | — | | | — | | | — | |
| Stock awards/units vested (earned) | | — | | | — | | | (49) | | | 20.72 | | | (405) | | | 26.75 | |
| Forfeited/expired | | — | | | — | | | (2) | | | 21.82 | | | (102) | | | 28.10 | |
| | | | | | | | | | | | |
| Balance, December 31, 2019 | | 692 | | | 22.46 | | | 21 | | | 23.19 | | | 1,152 | | | 26.79 | |
| Granted | | — | | | — | | | — | | | — | | | 568 | | | 21.69 | |
| Stock options exercised | | (1) | | | 10.71 | | | — | | | — | | | — | | | — | |
| Stock awards/units vested (earned) | | — | | | — | | | (16) | | | 23.41 | | | (550) | | | 25.90 | |
| Forfeited/expired | | (33) | | | 22.49 | | | — | | | — | | | (138) | | | 26.12 | |
| | | | | | | | | | | | |
| Balance, December 31, 2020 | | 658 | | | 22.48 | | | 5 | | | 22.35 | | | 1,032 | | | 24.53 | |
| Granted | | — | | | — | | | — | | | — | | | 599 | | | 29.20 | |
| Stock options exercised | | (185) | | | 22.42 | | | — | | | — | | | — | | | — | |
| Stock awards/units vested (earned) | | — | | | — | | | (3) | | | 22.48 | | | (433) | | | 25.61 | |
| Forfeited/expired | | — | | | — | | | — | | | — | | | (87) | | | 25.86 | |
| | | | | | | | | | | | |
| Balance, December 31, 2021 | | 473 | | | $ | 22.50 | | | 2 | | | $ | 22.20 | | | 1,111 | | | $ | 26.49 | |
| | | | | | | | | | | | |
| Exercisable, December 31, 2021 | | 473 | | | $ | 22.50 | | | | | | | | | |
The following table summarizes information about stock options under the plans outstanding at December 31, 2021:
| | | | | | | | | | | | | | | | | | | | | | | | | | | | | | | | | | | | | | | | | | | | |
| | | | | | Options Outstanding | | Options Exercisable |
| Range of Exercise Prices | | Number
of Shares
(In thousands) | | Weighted
Average
Remaining
Contractual
Life (Years) | | Weighted
Average
Exercise
Price | | Number
of Shares
(In thousands) | | Weighted
Average
Exercise
Price |
| $ | 10.65 | | | — | | $ | 10.65 | | | 3 | | 1.08 | | $10.65 | | 3 | | $10.65 |
| 20.29 | | | — | | 20.29 | | | 47 | | 3.00 | | 20.29 | | 47 | | 20.29 |
| 20.36 | | | — | | 20.36 | | | 1 | | 2.88 | | 20.36 | | 1 | | 20.36 |
| 22.20 | | | — | | 22.20 | | | 51 | | 3.23 | | 22.20 | | 51 | | 22.20 |
| 22.75 | | | — | | 22.75 | | | 293 | | 3.61 | | 22.75 | | 293 | | 22.75 |
| 23.51 | | | — | | 23.51 | | | 71 | | 4.05 | | 23.51 | | 71 | | 23.51 |
| 24.07 | | | — | | 24.07 | | | 7 | | 3.71 | | 24.07 | | 7 | | 24.07 |
| | | | | | | | | | | | | | |
| $ | 10.65 | | | — | | $ | 24.07 | | | 473 | | 3.56 | | $22.50 | | 473 | | $22.50 |
The table below summarizes the Company’s performance stock unit activity for the years ended December 31, 2021, 2020 and 2019:
| | | | | | | | |
| (In thousands) | | Performance Stock Units |
| Non-vested, December 31, 2018 | | 177 | |
| Granted | | 118 | |
| Vested (earned) | | (93) | |
| Forfeited | | (3) | |
| | |
| Non-vested, December 31, 2019 | | 199 | |
| Granted | | 122 | |
| Vested (earned) | | (81) | |
| Forfeited | | (18) | |
| | |
| Non-vested, December 31, 2020 | | 222 | |
| Granted | | 97 | |
| Vested (earned) | | (57) | |
| Forfeited | | (5) | |
| | |
| Non-vested, December 31, 2021 | | 257 | |
Stock-based compensation expense was $15.9 million in 2021, $13.2 million in 2020 and $12.9 million in 2019. Stock-based compensation expense is recognized ratably over the requisite service period for all stock-based awards. There was no unrecognized stock-based compensation expense related to stock options at December 31, 2021. Unrecognized stock-based compensation expense related to non-vested stock awards and stock units was $16.1 million at December 31, 2021. At such date, the weighted-average period over which this unrecognized expense is expected to be recognized was 1.7 years.
The intrinsic value of stock options outstanding and stock options exercisable at December 31, 2021 was $3.3 million. Aggregate intrinsic value represents the difference between the Company’s closing stock price on the last trading day of the period, which was $29.58 at December 31, 2021, and the exercise price multiplied by the number of options outstanding. There were 184,888 stock options exercised in 2021 with an intrinsic value of $1.3 million. There were 900 stock options exercised in 2020 with an intrinsic value of $10,000. There were 3,050 stock options exercised in 2019 with an intrinsic value of $43,000.
The fair value of the Company’s employee stock options granted is estimated on the date of grant using the Black-Scholes option-pricing model. This model requires the input of highly subjective assumptions, changes to which can materially affect the fair value estimate. There were no stock options granted during the years ended December 31, 2021, 2020 and 2019.
NOTE 16: ADDITIONAL CASH FLOW INFORMATION
The following is a summary of the Company’s additional cash flow information during the years ended December 31:
| | | | | | | | | | | | | | | | | |
| (In thousands) | 2021 | | 2020 | | 2019 |
| Interest paid | $ | 82,914 | | | $ | 123,995 | | | $ | 182,541 | |
| Income taxes paid | 55,202 | | | 47,777 | | | 51,999 | |
| Transfers of loans to foreclosed assets held for sale | 4,322 | | | 10,712 | | | 4,760 | |
| Transfers of premises to foreclosed assets and other real estate owned | — | | | 3,120 | | | 647 | |
| Transfers of premises to premises held for sale | — | | | 11,200 | | | — | |
| Transfers of other real estate owned to premises held for sale | — | | | 4,163 | | | — | |
| Transfer of premises held for sale to other real estate owned | 4,368 | | | — | | | — | |
| Transfer of premises held for sale to premises | 5,610 | | | — | | | — | |
Right-of-use lease assets obtained in exchange for lessee operating lease liabilities (adoption of ASU 2016-02) | — | | | — | | | 32,757 | |
| Transfers of available-for-sale to held-to-maturity securities | 500,809 | | | — | | | — | |
Transfers of held-to-maturity to available-for-sale securities | — | | | — | | | 216,373 | |
Transfers of loans to other assets held for sale | — | | | 114,925 | | | 259,939 | |
Transfers of deposits to other liabilities held for sale | — | | | 213,025 | | | 159,853 | |
NOTE 17: OTHER INCOME AND OTHER OPERATING EXPENSES
Other income for the year ended December 31, 2021 was $35.3 million and included the gain on sale related to the Illinois Branch Sale of $5.3 million. Other income for the year ended December 31, 2020 was $39.9 million, which included the gain on sales related to the Texas Branch Sale and Colorado Branch Sale of $8.1 million, and other income for the year ended December 31, 2019 was $64.7 million, that primarily consisted of the gain on sale of Visa Inc. class B common stock of $42.9 million.
Other operating expenses consisted of the following during the years ended December 31:
| | | | | | | | | | | | | | | | | |
| (In thousands) | 2021 | | 2020 | | 2019 |
| Professional services | $ | 18,921 | | | $ | 18,688 | | | $ | 16,897 | |
| Postage | 8,276 | | | 7,538 | | | 6,363 | |
| Telephone | 6,234 | | | 8,833 | | | 7,685 | |
| Credit card expense | 11,112 | | | 10,199 | | | 9,011 | |
| Marketing | 22,234 | | | 19,396 | | | 16,499 | |
| Software and technology | 40,608 | | | 39,724 | | | 25,146 | |
| Operating supplies | 2,766 | | | 3,322 | | | 2,322 | |
| Amortization of intangibles | 13,494 | | | 13,495 | | | 11,805 | |
| Branch right sizing expense | (537) | | | 14,097 | | | 3,129 | |
| Other expense | 30,454 | | | 29,909 | | | 32,843 | |
| Total other operating expenses | $ | 153,562 | | | $ | 165,201 | | | $ | 131,700 | |
NOTE 18: FAIR VALUE MEASUREMENTS
ASC Topic 820, Fair Value Measurements defines fair value, establishes a framework for measuring fair value and expands disclosures about fair value measurements.
ASC Topic 820 defines fair value as the price that would be received to sell an asset or paid to transfer a liability in an orderly transaction between market participants at the measurement date. The guidance also establishes a fair value hierarchy that requires the use of observable inputs and minimizes the use of unobservable inputs when measuring fair value. Topic 820 describes three levels of inputs that may be used to measure fair value:
•Level 1 Inputs – Quoted prices in active markets for identical assets or liabilities.
•Level 2 Inputs – Observable inputs other than Level 1 prices, such as quoted prices for similar assets or liabilities in active markets; quoted prices for similar assets or liabilities in markets that are not active; or other inputs that are observable or can be corroborated by observable market data for substantially the full term of the assets or liabilities.
•Level 3 Inputs – Unobservable inputs that are supported by little or no market activity and that are significant to the fair value of the assets or liabilities.
In general, fair value is based upon quoted market prices, where available. If such quoted market prices are not available, fair value is based upon internally developed models that primarily use, as inputs, observable market-based parameters. Valuation adjustments may be made to ensure that financial instruments are recorded at fair value. These adjustments may include amounts to reflect counterparty credit quality and the Company’s creditworthiness, among other things, as well as unobservable parameters. Any such valuation adjustments are applied consistently over time. The Company’s valuation methodologies may produce a fair value calculation that may not be indicative of net realizable value or reflective of future fair values. While management believes the Company’s valuation methodologies are appropriate and consistent with other market participants, the use of different methodologies or assumptions to determine the fair value of certain financial instruments could result in a different estimate of fair value at the reporting date. Furthermore, the reported fair value amounts have not been comprehensively revalued since the presentation dates, and therefore, estimates of fair value after the balance sheet date may differ significantly from the amounts presented herein. A more detailed description of the valuation methodologies used for assets and liabilities measured at fair value, as well as the general classification of such instruments pursuant to the valuation hierarchy, is set forth below.
Following is a description of the inputs and valuation methodologies used for assets measured at fair value on a recurring basis and recognized in the accompanying consolidated balance sheets, as well as the general classification of such assets pursuant to the valuation hierarchy.
Available-for-sale securities – Where quoted market prices are available in an active market, securities are classified within Level 1 of the valuation hierarchy. Level 1 securities would include highly liquid government bonds, mortgage products and certain other financial products. Other securities classified as available-for-sale are reported at fair value utilizing Level 2 inputs. For these securities, the Company obtains fair value measurements from an independent pricing service. The fair value measurements consider observable data that may include dealer quotes, market spreads, cash flows, the U.S. Treasury yield curve, live trading levels, trade execution data, market consensus prepayment speeds, credit information and the security’s terms and conditions, among other things. In order to ensure the fair values are consistent with ASC Topic 820, the Company periodically checks the fair values by comparing them to another pricing source, such as Bloomberg. The availability of pricing confirms Level 2 classification in the fair value hierarchy. The third-party pricing service is subject to an annual review of internal controls (AT-C 320), which is made available for the Company’s review. In certain cases where Level 1 or Level 2 inputs are not available, securities are classified within Level 3 of the hierarchy. The Company’s investment in U.S. Treasury securities, if any, is reported at fair value utilizing Level 1 inputs. The remainder of the Company’s available-for-sale securities are reported at fair value utilizing Level 2 inputs.
Mortgage loans held for sale – Mortgage loans held for sale are reported at fair value on an aggregate basis. Adjustments to fair value are recognized monthly and reflected in earnings. In determining the fair value of loans held for sale, the Company may consider outstanding investor commitments, discounted cash flow analyses with market assumptions or the fair value of the collateral if the loan is collateral dependent. Such loans are classified within either Level 2 or Level 3 of the fair value hierarchy. Where assumptions are made using significant unobservable inputs, such loans held for sale are classified as Level 3. At December 31, 2021 and 2020, the aggregate fair value of mortgage loans held for sale exceeded their cost.
Derivative instruments – The Company’s derivative instruments are reported at fair value utilizing Level 2 inputs. The Company obtains fair value measurements from dealer quotes.
Other assets and other liabilities held for sale – The Company’s other assets and other liabilities held for sale are reported at fair value utilizing Level 3 inputs. See Note 4, Other Assets and Other Liabilities Held for Sale.
The following table sets forth the Company’s financial assets by level within the fair value hierarchy that were measured at fair value on a recurring basis as of December 31, 2021 and 2020.
| | | | | | | | | | | | | | | | | | | | | | | |
| | | | Fair Value Measurements |
| (In thousands) | Fair Value | | Quoted Prices in
Active Markets for
Identical Assets
(Level 1) | | Significant Other
Observable Inputs
(Level 2) | | Significant
Unobservable Inputs
(Level 3) |
| December 31, 2021 | | | | | | | |
| Available-for-sale securities | | | | | | | |
| U.S. Treasury | $ | 300 | | | $ | 300 | | | $ | — | | | $ | — | |
| U.S. Government agencies | 364,641 | | | — | | | 364,641 | | | — | |
| Mortgage-backed securities | 4,448,616 | | | — | | | 4,448,616 | | | — | |
| State and political subdivisions | 1,819,658 | | | — | | | 1,819,658 | | | — | |
| Other securities | 480,330 | | | — | | | 480,330 | | | — | |
| Mortgage loans held for sale | 36,356 | | | — | | | — | | | 36,356 | |
| Derivative asset | 25,852 | | | — | | | 25,852 | | | — | |
| Derivative liability | (15,443) | | | — | | | (15,443) | | | — | |
| | | | | | | |
| December 31, 2020 | | | | | | | |
| Available-for-sale securities | | | | | | | |
| U.S. Government agencies | 477,237 | | | — | | | 477,237 | | | — | |
| Mortgage-backed securities | 1,394,936 | | | — | | | 1,394,936 | | | — | |
| State and political subdivisions | 1,470,723 | | | — | | | 1,470,723 | | | — | |
| Other securities | 130,702 | | | — | | | 130,702 | | | — | |
| Mortgage loans held for sale | 137,378 | | | — | | | — | | | 137,378 | |
| Derivative asset | 35,846 | | | — | | | 35,846 | | | — | |
| Other liabilities held for sale | (154,620) | | | — | | | — | | | (154,620) | |
| Derivative liability | (36,141) | | | — | | | (36,141) | | | — | |
Certain financial assets and liabilities are measured at fair value on a nonrecurring basis; that is, the instruments are not measured at fair value on an ongoing basis but are subject to fair value adjustments in certain circumstances. Financial assets and liabilities measured at fair value on a nonrecurring basis include the following:
Individually assessed loans (collateral-dependent) – When the Company has a specific expectation to initiate, or has initiated, foreclosure proceedings, and when the repayment of a loan is expected to be substantially dependent on the liquidation of underlying collateral, the relationship is deemed collateral-dependent. Fair value of the loan is determined by establishing an allowance for credit loss for any exposure based on the valuation of the underlying collateral. The valuation of the collateral is determined by either an independent third-party appraisal or other collateral analysis. Discounts can be made by the Company based upon the overall evaluation of the independent appraisal. Collateral-dependent loans are classified within Level 3 of the fair value hierarchy due to the unobservable inputs used in determining their fair value such as collateral values and the borrower’s underlying financial condition. Collateral values supporting the individually assessed loans are evaluated quarterly for updates to appraised values or adjustments due to non-current valuations.
Foreclosed assets and other real estate owned – Foreclosed assets and other real estate owned are reported at fair value, less estimated costs to sell. At foreclosure, if the fair value, less estimated costs to sell, of the real estate acquired is less than the Company’s recorded investment in the related loan, a write-down is recognized through a charge to the allowance for credit losses. Additionally, valuations are periodically performed by management and any subsequent reduction in value is recognized by a charge to income. The fair value of foreclosed assets and other real estate owned is estimated using Level 3 inputs based on unobservable market data.
The significant unobservable inputs (Level 3) used in the fair value measurement of collateral for collateral-dependent loans and foreclosed assets primarily relate to the specialized discounting criteria applied to the borrower’s reported amount of collateral. The amount of the collateral discount depends upon the condition and marketability of the collateral, as well as other factors which may affect the collectability of the loan. Management’s assessment of the significance of a particular input to the fair value measurement in its entirety requires judgment and considers factors specific to the asset. It is reasonably possible that a change in the estimated fair value for instruments measured using Level 3 inputs could occur in the future. As the Company’s primary objective in the event of default would be to liquidate the collateral to settle the outstanding balance of the loan, collateral that is less marketable would receive a larger discount.
The following table sets forth the Company’s financial assets by level within the fair value hierarchy that were measured at fair value on a nonrecurring basis as of December 31, 2021 and 2020.
| | | | | | | | | | | | | | | | | | | | | | | |
| | | | Fair Value Measurements Using |
| (In thousands) | Fair Value | | Quoted Prices in
Active Markets for
Identical Assets
(Level 1) | | Significant Other
Observable Inputs
(Level 2) | | Significant
Unobservable Inputs
(Level 3) |
| December 31, 2021 | | | | | | | |
Individually assessed loans (1) (2) (collateral-dependent) | $ | 47,089 | | | $ | — | | | $ | — | | | $ | 47,089 | |
Foreclosed assets and other real estate owned (1) | 4,875 | | | — | | | — | | | 4,875 | |
| | | | | | | |
| December 31, 2020 | | | | | | | |
Individually assessed loans (1) (2) (collateral-dependent) | $ | 66,209 | | | $ | — | | | $ | — | | | $ | 66,209 | |
Foreclosed assets and other real estate owned (1) | 17,074 | | | — | | | — | | | 17,074 | |
______________________
(1) These amounts represent the resulting carrying amounts on the consolidated balance sheets for collateral-dependent loans and foreclosed assets and other real estate owned for which fair value re-measurements took place during the period.
(2) Identified reserves of $4,214,000 and $13,725,000 were related to collateral-dependent loans for which fair value re-measurements took place during the years ended December 31, 2021 and 2020, respectively.
ASC Topic 825, Financial Instruments, requires disclosure in annual and interim financial statements of the fair value of financial assets and financial liabilities, including those financial assets and financial liabilities that are not measured and reported at fair value on a recurring basis or nonrecurring basis. The following methods and assumptions were used to estimate the fair value of each class of financial instruments not previously disclosed.
Cash and cash equivalents – The carrying amount for cash and cash equivalents approximates fair value (Level 1).
Interest bearing balances due from banks – The fair value of interest bearing balances due from banks – time is estimated using a discounted cash flow calculation that applies the rates currently offered on deposits of similar remaining maturities (Level 2).
Held-to-maturity securities – Fair values for held-to-maturity securities equal quoted market prices, if available, such as for highly liquid government bonds (Level 1). If quoted market prices are not available, fair values are estimated based on quoted market prices of similar securities. For these securities, the Company obtains fair value measurements from an independent pricing service. The fair value measurements consider observable data that may include dealer quotes, market spreads, cash flows, the U.S. Treasury yield curve, live trading levels, trade execution data, market consensus prepayment speeds, credit information and the security’s terms and conditions, among other things (Level 2). In certain cases where Level 1 or Level 2 inputs are not available, securities are classified within Level 3 of the hierarchy.
Loans – The fair value of loans is estimated by discounting the future cash flows, using the current rates at which similar loans would be made to borrowers with similar credit ratings and for the same remaining maturities. Additional factors considered include the type of loan and related collateral, variable or fixed rate, classification status, remaining term, interest rate, historical delinquencies, loan to value ratios, current market rates and remaining loan balance. The loans were grouped together according to similar characteristics and were treated in the aggregate when applying various valuation techniques. The discount rates used for loans were based on current market rates for new originations of similar loans. Estimated credit losses were also factored into the projected cash flows of the loans. The fair value of loans is estimated on an exit price basis incorporating the above factors (Level 3).
Deposits – The fair value of demand deposits, savings accounts and money market deposits is the amount payable on demand at the reporting date (i.e., their carrying amount) (Level 2). The fair value of fixed-maturity time deposits is estimated using a discounted cash flow calculation that applies the rates currently offered for deposits of similar remaining maturities (Level 3).
Federal Funds purchased, securities sold under agreement to repurchase and short-term debt – The carrying amount for Federal funds purchased, securities sold under agreement to repurchase and short-term debt are a reasonable estimate of fair value (Level 2).
Other borrowings – For short-term instruments, the carrying amount is a reasonable estimate of fair value. For long-term debt, rates currently available to the Company for debt with similar terms and remaining maturities are used to estimate the fair value (Level 2).
Subordinated debentures – The fair value of subordinated debentures is estimated using the rates that would be charged for subordinated debentures of similar remaining maturities (Level 2).
Accrued interest receivable/payable – The carrying amounts of accrued interest approximated fair value (Level 2).
Commitments to extend credit, letters of credit and lines of credit – The fair value of commitments is estimated using the fees currently charged to enter into similar agreements, taking into account the remaining terms of the agreements and the present creditworthiness of the counterparties. For fixed rate loan commitments, fair value also considers the difference between current levels of interest rates and the committed rates. The fair values of letters of credit and lines of credit are based on fees currently charged for similar agreements or on the estimated cost to terminate or otherwise settle the obligations with the counterparties at the reporting date.
The fair value of a financial instrument is the current amount that would be exchanged between willing parties, other than in a forced liquidation. Fair value is best determined based upon quoted market prices. However, in many instances, there are no quoted market prices for the Company’s various financial instruments. In cases where quoted market prices are not available, fair values are based on estimates using present value or other valuation techniques. Those techniques are significantly affected by the assumptions used, including the discount rate and estimates of future cash flows. Accordingly, the fair value estimates may not be realized in an immediate settlement of the instrument.
The estimated fair values, and related carrying amounts, of the Company’s financial instruments are as follows:
| | | | | | | | | | | | | | | | | | | | | | | | | | | | | |
| | Carrying | | Fair Value Measurements |
| (In thousands) | Amount | | Level 1 | | Level 2 | | Level 3 | | Total |
| December 31, 2021 | | | | | | | | | |
| Financial assets: | | | | | | | | | |
| Cash and cash equivalents | $ | 1,650,653 | | | $ | 1,650,653 | | | $ | — | | | $ | — | | | $ | 1,650,653 | |
| Interest bearing balances due from banks - time | 1,882 | | | — | | | 1,882 | | | — | | | 1,882 | |
| Held-to-maturity securities, net | 1,529,221 | | | — | | | 1,517,378 | | | — | | | 1,517,378 | |
| Interest receivable | 72,990 | | | — | | | 72,990 | | | — | | | 72,990 | |
| Loans, net | 11,807,171 | | | — | | | — | | | 11,922,735 | | | 11,922,735 | |
| | | | | | | | | |
| Financial liabilities: | | | | | | | | | |
| Non-interest bearing transaction accounts | 5,325,318 | | | — | | | 5,325,318 | | | — | | | 5,325,318 | |
Interest bearing transaction accounts and savings deposits | 11,588,770 | | | — | | | 11,588,770 | | | — | | | 11,588,770 | |
| Time deposits | 2,452,460 | | | — | | | — | | | 2,451,055 | | | 2,451,055 | |
Federal funds purchased and securities sold under agreements to repurchase | 185,403 | | | — | | | 185,403 | | | — | | | 185,403 | |
| Other borrowings | 1,337,973 | | | — | | | 1,393,711 | | | — | | | 1,393,711 | |
| Subordinated notes and debentures | 384,131 | | | — | | | 394,464 | | | — | | | 394,464 | |
| Interest payable | 6,759 | | | — | | | 6,759 | | | — | | | 6,759 | |
| | | | | | | | | |
| December 31, 2020 | | | | | | | | | |
| Financial assets: | | | | | | | | | |
| Cash and cash equivalents | $ | 3,472,152 | | | $ | 3,472,152 | | | $ | — | | | $ | — | | | $ | 3,472,152 | |
| Interest bearing balances due from banks - time | 1,579 | | | — | | | 1,579 | | | — | | | 1,579 | |
| Held-to-maturity securities, net | 333,031 | | | — | | | 341,925 | | | — | | | 341,925 | |
| Interest receivable | 72,597 | | | — | | | 72,597 | | | — | | | 72,597 | |
| Loans, net | 12,662,847 | | | — | | | — | | | 12,736,991 | | | 12,736,991 | |
| | | | | | | | | |
| Financial liabilities: | | | | | | | | | |
| Non-interest bearing transaction accounts | 4,482,091 | | | — | | | 4,482,091 | | | — | | | 4,482,091 | |
Interest bearing transaction accounts and savings deposits | 9,672,608 | | | — | | | 9,672,608 | | | — | | | 9,672,608 | |
| Time deposits | 2,832,327 | | | — | | | — | | | 2,848,621 | | | 2,848,621 | |
Federal funds purchased and securities sold under agreements to repurchase | 299,111 | | | — | | | 299,111 | | | — | | | 299,111 | |
| Other borrowings | 1,342,067 | | | — | | | 1,448,625 | | | — | | | 1,448,625 | |
| Subordinated debentures | 382,874 | | | — | | | 398,827 | | | — | | | 398,827 | |
| Interest payable | 8,887 | | | — | | | 8,887 | | | — | | | 8,887 | |
The fair value of commitments to extend credit, letters of credit and lines of credit is not presented since management believes the fair value to be insignificant.
NOTE 19: COMMITMENTS AND CREDIT RISK
The Company grants agri-business, commercial and residential loans to customers primarily throughout Arkansas, Kansas, Missouri, Oklahoma, Tennessee and Texas, along with credit card loans to customers throughout the United States. Commitments to extend credit are agreements to lend to a customer as long as there is no violation of any condition established in the contract. Commitments generally have fixed expiration dates or other termination clauses and may require payment of a fee. Since a portion of the commitments may expire without being drawn upon, the total commitment amounts do not necessarily represent future cash requirements. Each customer’s creditworthiness is evaluated on a case-by-case basis. The amount of collateral obtained, if deemed necessary, is based on management’s credit evaluation of the counterparty. Collateral held varies, but may include accounts receivable, inventory, property, plant and equipment, commercial real estate and residential real estate.
At December 31, 2021, the Company had outstanding commitments to extend credit aggregating approximately $685.3 million and $3.41 billion for credit card commitments and other loan commitments, respectively. At December 31, 2020, the Company had outstanding commitments to extend credit aggregating approximately $671.5 million and $2.36 billion for credit card commitments and other loan commitments, respectively.
As of December 31, 2021 and 2020, the Company had outstanding commitments to originate fixed-rate mortgage loans of approximately $108.5 million and $214.0 million respectively. The commitments extend over varying periods of time with the majority being disbursed within a thirty-day period.
Standby letters of credit are conditional commitments issued by the Company to guarantee the performance of a customer to a third party. Those guarantees are primarily issued to support public and private borrowing arrangements, including commercial paper, bond financing and similar transactions. The credit risk involved in issuing letters of credit is essentially the same as that involved in extending loans to customers. The Company had total outstanding letters of credit amounting to $37.7 million and $49.0 million at December 31, 2021 and 2020, respectively, with terms ranging from 9 months to 15 years. At December 31, 2021 and 2020, the Company had no deferred revenue under standby letter of credit agreements.
The Company has purchased letters of credit from the FHLB as security for certain public deposits. The amount of the letters of credit was $59.1 million and $1.55 billion at December 31, 2021 and 2020, respectively, and they expire in less than one year from issuance.
At December 31, 2021, the Company did not have concentrations of 5% or more of the investment portfolio in bonds issued by a single municipality.
NOTE 20: NEW ACCOUNTING STANDARDS
Recently Adopted Accounting Standards
Reference Rate Reform – In March 2020, the FASB issued ASU No. 2020-04, Reference Rate Reform (Topic 848): Facilitation of the Effects of Reference Rate Reform on Financial Reporting (“ASU 2020-04”), which provides relief for companies preparing for discontinuation of interest rates such as LIBOR. LIBOR is a benchmark interest rate referenced in a variety of agreements that are used by numerous entities. On March 5, 2021, the U.K. Financial Conduct Authority (“FCA”) announced that the majority of LIBOR rates will no longer be published after December 31, 2021, although a number of key settings will continue until June 2023, to support the rundown of legacy contracts only. As a result, LIBOR should be discontinued as a reference rate.
Other interest rates used globally could also be discontinued for similar reasons. ASU 2020-04 provides optional expedients and exceptions to contracts, hedging relationships and other transactions affected by reference rate reform. The main provisions for contract modifications include optional relief by allowing the modification as a continuation of the existing contract without additional analysis and other optional expedients regarding embedded features. Optional expedients for hedge accounting permits changes to critical terms of hedging relationships and to the designated benchmark interest rate in a fair value hedge and also provides relief for assessing hedge effectiveness for cash flow hedges. Companies are able to apply ASU 2020-04 immediately; however, the guidance will only be available for a limited time (generally through December 31, 2022). The Company formed a LIBOR Transition Team in 2020, has created standard LIBOR replacement language for new and modified loan notes, and is monitoring the remaining loans with LIBOR rates monthly to ensure progress in updating these loans with acceptable LIBOR replacement language or converting them to other interest rates. The Company has not been offering LIBOR-indexed rates originated by other banks, subject to the Company’s determination that the LIBOR replacement language in the loan documents meets the Company’s standards. Pursuant to the Interagency Statement on LIBOR Transition issued in November 2020, the Company will not enter into any new LIBOR-based credit agreements after December 31, 2021. The adoption of ASU 2020-04 has not had a material impact on the Company’s financial position or results of operations.
In January 2021, the FASB issued ASU No. 2021-01, Reference Rate Reform (Topic 848): Scope (“ASU 2021-01”), which clarifies that certain optional expedients and exceptions in ASC 848 for contract modifications and hedge accounting apply to derivatives that are affected by the changes in the interest rates used for margining, discounting, or contract price alignment for derivative instruments that are being implemented as part of the market-wide transition to new reference rates (commonly referred to as the “discounting transition”). ASU 2021-01 also amends the expedients and exceptions in ASC 848 to capture the incremental consequences of the scope clarification and to tailor the existing guidance to derivative instruments affected by the discounting transition. ASU 2021-01 was effective upon issuance and generally can be applied through December 31, 2022. ASU 2021-01 did not have a material impact on the Company’s financial position or results of operations.
Income Taxes – In December 2019, the FASB issued ASU No. 2019-12, Income Taxes (Topic 740): Simplifying the Accounting for Income Taxes (“ASU 2019-12”), that removes certain exceptions for investments, intraperiod allocations and interim calculations, and adds guidance to reduce complexity in accounting for income taxes. ASU 2019-12 introduces the following new guidance: i) guidance to evaluate whether a step-up in tax basis of goodwill relates to a business combination in which book goodwill was recognized or a separate transaction and ii) a policy election to not allocate consolidated income taxes when a member of a consolidated tax return is not subject to income tax. Additionally, ASU 2019-12 changes the following current guidance: i) making an intraperiod allocation, if there is a loss in continuing operations and gains outside of continuing operations, ii) determining when a deferred tax liability is recognized after an investor in a foreign entity transitions to or from the equity method of accounting, iii) accounting for tax law changes and year-to-date losses in interim periods, and iv) determining how to apply the income tax guidance to franchise taxes that are partially based on income. ASU 2019-12 is effective for fiscal years, and interim periods within those fiscal years beginning after December 15, 2020. The adoption of ASU 2019-12 did not have a material impact on the Company’s operations, financial position or disclosures.
Fair Value Measurement Disclosures – In August 2018, the FASB issued ASU No. 2018-13, Fair Value Measurement (Topic 820): Disclosure Framework-Changes to the Disclosure Requirements for Fair Value Measurement (“ASU 2018-13”), that eliminates, amends and adds disclosure requirements for fair value measurements. These amendments are part of FASB’s disclosure review project and are expected to reduce costs for preparers while providing more decision-useful information for financial statement users. The eliminated disclosure requirements include the 1) the amount of, and reasons for, transfers between Level 1 and Level 2 of the fair value hierarchy; 2) the policy of timing of transfers between levels of the fair value hierarchy; and 3) the valuation processes for Level 3 fair value measurements. Among other modifications, the amended disclosure requirements remove the term “at a minimum” from the phrase “an entity shall disclose at a minimum” to promote the appropriate exercise of discretion by entities and clarifies that the measurement uncertainty disclosure is to communicate information about the uncertainty in measurement as of the reporting date. Under the new disclosure requirements, entities must disclose the changes in
unrealized gains or losses included in other comprehensive income for recurring Level 3 fair value measurements held at the end of the reporting period and the range and weighted average used to develop significant unobservable inputs for Level 3 fair value measurements. ASU 2018-13 is effective for fiscal years beginning after December 15, 2019, and interim periods within those fiscal years, with early adoption permitted. The adoption of ASU 2018-13 did not have a material impact on the Company’s fair value disclosures.
Credit Losses on Financial Instruments – In June 2016, the FASB issued ASU No. 2016-13, Financial Instruments - Credit Losses (Topic 326): Measurement of Credit Losses on Financial Instruments (“ASU 2016-13”), which requires earlier measurement of credit losses, expands the range of information considered in determining expected credit losses and enhances disclosures. The main objective of ASU 2016-13 is to provide financial statement users with more decision-useful information about the expected credit losses on financial instruments and other commitments to extend credit held by a reporting entity at each reporting date. The amendments replace the incurred loss impairment methodology in current US GAAP with a methodology (the current expected credit losses, or “CECL”, methodology) that reflects expected credit losses and requires consideration of a broader range of reasonable and supportable information to inform credit loss estimates.
The CECL methodology utilizes a lifetime “expected credit loss” measurement objective for the recognition of credit losses for loans, held-to-maturity debt securities and other receivables measured at amortized cost at the time the financial asset is originated or acquired. The allowance for credit losses is adjusted each period for changes in expected lifetime credit losses. This methodology replaces the multiple existing impairment methods in current guidance, which generally require that a loss be incurred before it is recognized. Within the life cycle of a loan or other financial asset, this new guidance will generally result in the earlier recognition of the provision for credit losses and the related allowance for credit losses than current practice. For available-for-sale debt securities that the Company intends to hold and where fair value is less than cost, credit-related impairment, if any, will be recognized through an allowance for credit losses and adjusted each period for changes in credit risk.
The effective date for these amendments is for fiscal years beginning after December 15, 2019, including interim periods within those fiscal years. In preparation for implementation of ASU 2016-13, the Company formed a cross functional team that assessed its data and system needs and evaluated the potential impact of adopting the new guidance. The Company anticipated a significant change in the processes and procedures to calculate the loan losses, including changes in assumptions and estimates to consider expected credit losses over the life of the loan versus the prior accounting practice that utilized the incurred loss model.
On March 27, 2020, the CARES Act was signed in to law by the President of the United States and allowed the option to temporarily defer or suspend the adoption of ASU 2016-13. During the deferral, a registrant would continue to use the incurred loss model for the allowance for loan and lease losses and would be in accordance with US GAAP. The Company has not elected to temporarily defer the adoption of ASU 2016-13 and adopted the new standard as of January 1, 2020. Upon adoption, the Company recorded an additional allowance for credit losses on loans of approximately $151.4 million and an adjustment to the reserve for unfunded commitments recorded in other liabilities of $24.0 million. The Company also recorded an additional allowance for credit losses on investment securities of $742,000. The impact at adoption was reflected as an adjustment to beginning retained earnings, net of income taxes, in the amount of $128.1 million.
The significant impact to the Company’s allowance for credit losses at the date of adoption was driven by the substantial amount of loans acquired held by the Company. The Company had approximately one third of total loans categorized as acquired at the adoption date with very little reserve allocated to them due to the previous incurred loss impairment methodology. As such, the amount of the CECL adoption impact was greater on the Company when compared to a non-acquisitive bank.
In December 2018, the Federal Reserve, Office of the Comptroller of the Currency and FDIC (collectively, the “agencies”) issued a final rule revising regulatory capital rules in anticipation of the adoption of ASU 2016-13 that provided an option to phase in over a three year period on a straight line basis the day-one impact on earnings and Tier 1 capital (the “CECL Transition Provision”).
In March 2020 and in response to the COVID-19 pandemic, the agencies issued a new regulatory capital rule revising the CECL Transition Provision to delay the estimated impact on regulatory capital stemming from the implementation of ASU 2016-13. The rule provides banking organizations that implement CECL before the end of 2020 the option to delay for two years an estimate of CECL’s effect on regulatory capital, followed by a three-year transition period (the “2020 CECL Transition Provision”). The Company elected to apply the 2020 CECL Transition Provision.
Derivatives and Hedging: Targeted Improvements - In August 2017, the FASB issued ASU No. 2017-12, Derivatives and Hedging (Topic 815): Targeted Improvements to Accounting for Hedging Activities (“ASU 2017-12”), that changes both the designation and measurement guidance for qualifying hedging relationships and the presentation of hedge results in order to better align a company’s risk management activities and financial reporting for hedging relationships. In summary, this amendment 1) expands the types of transactions eligible for hedge accounting; 2) eliminates the separate measurement and presentation of hedge ineffectiveness; 3) simplifies the requirements around the assessment of hedge effectiveness; 4) provides companies more time to finalize hedge documentation; and 5) enhances presentation and disclosure requirements. The effective date was for fiscal years beginning after December 15, 2018, and interim periods within those fiscal years, with early adoption permitted. All transition requirements and elections should be applied to existing hedging relationships on the date of adoption and the effects should be reflected as of the beginning of the fiscal year of adoption. As part of this new guidance, entities are allowed to designate as the hedged item, an amount that is not expected to be affected by prepayments, defaults or other events affecting the timing and amount of cash flows in a closed portfolio of prepayable financial instruments (this is referred to as the “last-of-layer” method). Under the last-of-layer method, entities are able to reclassify, only at the time of adoption, eligible callable debt securities from held-to-maturity to available-for-sale without tainting its intentions to hold future debt securities to maturity. The available-for-sale security must be reported at fair value and any unrealized gain or loss must be recorded as an adjustment to other comprehensive income upon adoption. The Company evaluated its held-to-maturity portfolio during the first quarter 2019 and identified certain municipal bonds with a fair value of $216.4 million that met the last-of-layer criteria under ASU 2017-12 and as a result, reclassified those to available-for-sale and recorded an unrealized gain of $2.5 million in accumulated other comprehensive income during the first quarter of 2019.
Leases - In February 2016, the FASB issued ASU No. 2016-02, Leases (Topic 842) (“ASU 2016-02”), that establishes the principles to report transparent and economically neutral information about the assets and liabilities that arise from leases. The new guidance results in a more consistent representation of the rights and obligations arising from leases by requiring lessees to recognize the lease asset and lease liabilities that arise from leases in the consolidated balance sheet and to disclose qualitative and quantitative information about lease transactions, such as information about variable lease payments and options to renew and terminate leases. The effective date was for fiscal years beginning after December 15, 2018, including interim periods within those fiscal years. ASU 2016-02 requires entities to adopt the new lease standard using a modified retrospective transition method, meaning an entity initially applies the new lease standard at the beginning of the earliest period presented in the financial statements. Due to complexities associated with using this method, in July 2018, the FASB issued ASU No. 2018-11, Leases (Topic 842): Targeted Improvements, to relieve entities of the requirement to present prior comparative years’ results when they adopt the new lease standard and giving entities the option to recognize the cumulative effect of applying the new standard as an adjustment to the opening balance of retained earnings. Adoption of ASU 2016-02 resulted in the recognition of right-of-use assets of $32.8 million and right-of-use liabilities of $32.8 million on the consolidated balance sheet with no material impact to the results of operations. The Company has elected to adopt the guidance using the optional transition method, which allows for a modified retrospective method of adoption with a cumulative effect adjustment to retained earnings without restating comparable periods. The Company also elected the relief package of practical expedients for which there is no requirement to reassess existence of leases, their classification, and initial direct costs as well as an exemption for short-term leases with a term of less than one year, whereby the Company did not recognize a lease liability or right-of-use asset on the consolidated balance sheet but instead will recognize lease payments as an expense over the lease term as appropriate. See Note 6, Right-of-Use Lease Assets and Lease Liabilities, for additional information related to the Company’s right-of-use lease obligations.
Recently Issued Accounting Standards
Leases - In July 2021, the FASB issued ASU No. 2021-05, Leases (Topic 842): Lessors-Certain Leases with Variable Lease Payments (“ASU 2021-05”), that amends lease classification requirements for lessors. In accordance with ASU 2021-05, lessors should classify and account for a lease that have variable lease payments that do not depend on a reference index rate as an operating lease if both of the following criteria are met: i) the lease would have been classified as a sales-type lease or a direct financing lease under the previous lease classification criteria and ii) sales-type or direct financing lease classification would result in a Day 1 loss. ASU 2021-05 is effective for public business entities for fiscal years, and interim periods within those fiscal years, beginning after December 15, 2021, with early adoption permitted. The Company has evaluated the impact this standard will have on its results of operations, financial position or disclosures, and it is not expected to have a material impact.
Presently, the Company is not aware of any other changes to the Accounting Standards Codification that will have a material impact on the Company’s present or future financial position or results of operations.
NOTE 21: DERIVATIVE INSTRUMENTS
The Company utilizes derivative instruments to manage exposure to various types of interest rate risk for itself and its customers within policy guidelines. Transactions should only be entered into with an associated underlying exposure. All derivative instruments are carried at fair value.
Derivative contracts involve the risk of dealing with institutional derivative counterparties and their ability to meet contractual terms. Institutional counterparties must have an investment grade credit rating and be approved by the Company’s asset/liability management committee. In arranging these products for its customers, the Company assumes additional credit risk from the customer and from the dealer counterparty with whom the transaction is undertaken. Credit risk exists due to the default credit risk created in the exchange of the payments over a period of time. Credit exposure on interest rate swaps is limited to the net favorable value and interest payments of all swaps with each counterparty. Access to collateral in the event of default is reasonably assured. Therefore, credit exposure may be reduced by the amount of collateral pledged by the counterparty.
Hedge Structures
The Company will seek to enter derivative structures that most effectively address the risk exposure and structural terms of the underlying position being hedged. The term and notional principal amount of a hedge transaction will not exceed the term or principal amount of the underlying exposure. In addition, the Company will use hedge indices which are the same as, or highly correlated to, the index or rate on the underlying exposure. Derivative credit exposure is monitored on an ongoing basis for each customer transaction and aggregate exposure to each counterparty is tracked. The Company has set a maximum outstanding notional contract amount at 10% of the Company’s assets.
Fair Value Hedges
For derivative instruments that are designated and qualify as a fair value hedge, the gain or loss on the derivative instrument as well as the offsetting loss or gain on the hedged asset or liability attributable to the hedged risk are recognized in current earnings. The gain or loss on the derivative instrument is presented on the same income statement line item as the earnings effect of the hedged item. During the third quarter of 2021, the Company began utilizing interest rate swaps designated as fair value hedges to mitigate the effect of changing interest rates on the fair values of fixed rate callable AFS securities. The hedging strategy converts the fixed interest rates to variable interest rates based on federal funds rates.
The following table summarizes the fair value hedges recorded in the accompanying consolidated balance sheets.
| | | | | | | | | | | | | | | | | | | | | | | | | | | | | | | | |
| | | | December 31, 2021 | | December 31, 2020 |
| (In thousands) | Balance Sheet Location | Weighted Average Pay Rate | Receive Rate | Notional | | Fair Value | | Notional | | Fair Value |
| Derivative assets | Other assets | 1.21% | Federal Funds | $ | 1,001,715 | | | $ | 10,524 | | | $ | — | | | $ | — | |
The following amounts were recorded on the balance sheet related to carrying amounts and cumulative basis adjustments for fair value hedges.
| | | | | | | | | | | | | | | | | | | | | | | |
| Carrying Amount of Hedged Assets | | Cumulative Amount of Fair Value Hedging Adjustment Included in the Carrying Amount of Hedged Assets |
| Line Item on the Balance Sheet (In thousands) | 2021 | | 2020 | | 2021 | | 2020 |
| Investment securities - Available-for-sale | $ | 1,063,173 | | | $ | — | | | $ | 10,524 | | | $ | — | |
Customer Risk Management Interest Rate Swaps
The Company’s qualified loan customers have the opportunity to participate in its interest rate swap program for the purpose of managing interest rate risk on their variable rate loans with the Company. The Company enters into such agreements with customers, then offsetting agreements are executed between the Company and an approved dealer counterparty to minimize market risk from changes in interest rates. The counterparty contracts are identical to customer contracts in terms of notional amounts, interest rates, and maturity dates, except for a fixed pricing spread or fee paid to the Company by the dealer counterparty. These interest rate swaps carry varying degrees of credit, interest rate and market or liquidity risks. The fair value of these derivative instruments is recognized as either derivative assets or liabilities in the accompanying consolidated balance sheets. The Company has a limited number of swaps that are standalone without a similar agreement with the loan customer.
The following table summarizes the fair values of loan derivative contracts recorded in the accompanying consolidated balance sheets for the years ended December 31, 2021 and 2020.
| | | | | | | | | | | | | | | | | | | | | | | |
| 2021 | | 2020 |
| (In thousands) | Notional | | Fair Value | | Notional | | Fair Value |
| Derivative assets | $ | 318,428 | | | $ | 15,328 | | | $ | 408,881 | | | $ | 35,846 | |
| Derivative liabilities | 321,985 | | | 15,443 | | | 417,941 | | | 36,141 | |
Risk Participation Agreements
The Company has a limited number of Risk Participation Agreement swaps, that are associated with loan participations, where the Company is not the counterparty to the interest rate swaps that are associated with the risk participation sold. The interest rate swap mark to market only impacts the Company if the swap is in a liability position to the counterparty and the customer defaults on payments to the counterparty. The notional amount of these contingent agreements is $37.8 million as of December 31, 2021.
Energy Hedging
The Company provides energy derivative services to qualifying, high quality oil and gas borrowers for hedging purposes. The Company serves as an intermediary on energy derivative products between the Company’s borrowers and dealers. The Company will only enter into back-to-back trades, thus maintaining a balanced book between the dealer and the borrower.
Energy hedging risk exposure to the Company’s customer increases as energy prices for crude oil and natural gas rise. As prices decrease, exposure to the exchange increases. These risks are mitigated by customer credit underwriting policies and establishing a predetermined hedge line for each borrower and by monitoring the exchange margin.
The outstanding notional value as of December 31, 2021 for energy hedging Customer Sell to Company swaps were $12.1 million and the corresponding Company Sell to Dealer swaps were $12.1 million and the corresponding net fair value of the derivative asset and derivative liability was $199,000. The outstanding notional value as of December 31, 2020 for energy hedging Customer Sell to Company swaps were $14.8 million and the corresponding Company Sell to Dealer swaps were $14.8 million and the corresponding net fair value of the derivative asset and derivative liability was $536,000.
NOTE 22: CONTINGENT LIABILITIES
In the ordinary course of its operations, the Company and its subsidiaries are parties to various legal proceedings incidental to the conduct of our business, including proceedings based on breach of contract claims, lender liability claims, and other ordinary-course claims, some of which seek substantial relief or damages.
On May 22, 2019, Danny Walkingstick and Whitnye Fort filed a putative class action complaint against Simmons Bank in the United States District Court for the Western District of Missouri. The operative complaint alleges that Simmons Bank improperly charges overdraft fees on transactions that did not actually overdraw customers’ accounts by utilizing the checking account’s “available balance” to assess overdraft fees instead of the “ledger balance.” Plaintiffs’ claims include breach of contract and unjust enrichment, and they seek to represent a proposed class of all Simmons Bank checking account customers who were assessed an overdraft fee on a transaction that purportedly did not overdraw the account. Plaintiffs seek unspecified damages, costs, attorneys’ fees, pre- and post-judgment interest, and other relief as the Court deems proper for themselves and the putative class. Simmons Bank denies the allegations but has reached a settlement in principle with the plaintiffs to resolve this matter, subject to the preparation and execution of a mutually acceptable settlement agreement and release, as well as the court’s approval. The settlement is not expected to have a material adverse effect on the Company’s business, consolidated results of operations, financial condition, or cash flows.
On January 14, 2020, Susanne Pace filed a putative class action complaint in the Circuit Court of Boone County, Missouri against Landmark Bank, formerly a wholly-owned subsidiary of The Landrum Company, to which Simmons Bank is a successor by merger in connection with the Company’s acquisition of The Landrum Company, which closed in October 2019. The complaint alleges that Landmark Bank improperly charged overdraft fees where a transaction was initially authorized on sufficient funds but later settled negative due to intervening transactions. The complaint asserts a claim for breach of contract, which incorporates the implied duty of good faith and fair dealing. Plaintiff seeks to represent a proposed class of all Landmark Bank checking account customers from Missouri who were allegedly charged overdraft fees on transactions that did not overdraw their checking account. Plaintiff seeks unspecified actual, statutory, and punitive damages as well as costs, attorneys’ fees, prejudgment interest, an injunction, and other relief as the Court deems proper for herself and the putative class. Simmons Bank denies the allegations but has reached a settlement in principle with the plaintiff to resolve this matter, subject to the preparation and execution of a mutually acceptable settlement agreement and release, as well as the court’s approval. The settlement is not expected to have a material adverse effect on the Company’s business, consolidated results of operations, financial condition, or cash flows.
On June 29, 2020, Shunda Wilkins, Diann Graham, and David Watson filed a putative class action complaint against Simmons Bank in the United States District Court for the Eastern District of Arkansas. The complaint alleges that Simmons Bank improperly charges multiple insufficient funds or overdraft fees when a merchant resubmits a rejected payment request. The complaint asserts claims for breach of contract and unjust enrichment. Plaintiffs seek to represent a proposed class of all Simmons Bank checking account customers who were charged multiple insufficient funds or overdraft fees on resubmitted payment requests. Plaintiffs seek unspecified damages, costs, attorney’s fees, pre-judgment interest, an injunction, and other relief as the Court deems proper for themselves and the purported class. Simmons Bank denies the allegations and is vigorously defending the matter.
On May 13, 2021, Susanne Pace filed a second putative class action complaint in the circuit court of Boone County, Missouri against Landmark Bank, to which Simmons Bank is a successor by merger, which was removed to the United States District Court for the Western District of Missouri, Central Division. The complaint alleged that Landmark Bank improperly charged multiple insufficient funds or overdraft fees when a merchant or other originator resubmits a rejected payment request. The complaint asserted claims for breach of contract, including breach of the covenant of good faith and fair dealing. Plaintiff sought to represent a proposed class of all Landmark Bank checking account customers who were charged multiple insufficient funds or overdraft fees on resubmitted payment requests. Plaintiff sought unspecified damages, costs, attorney’s fees, pre- and post-judgment interest, an injunction, and other relief as the Court deems proper for herself and the purported class. Simmons Bank denies the allegations, and on January 11, 2022, the Court granted Simmons Bank’s motion to compel arbitration.
We establish reserves for legal proceedings when potential losses become probable and can be reasonably estimated. While the ultimate resolution (including amounts thereof) of any legal proceedings, including the matters described above, cannot be determined at this time, based on information presently available and after consultation with legal counsel, management believes that the ultimate outcome in such proceedings, either individually or in the aggregate, will not have a material adverse effect on our business, consolidated results of operations, financial condition, or cash flows. It is possible, however, that future developments could result in an unfavorable outcome for or resolution of any of these proceedings, which may be material to our results of operations for a given fiscal period.
NOTE 23: STOCKHOLDERS’ EQUITY
Simmons Bank, the Company’s subsidiary bank, is subject to legal limitations on dividends that can be paid to the parent company without prior approval of the applicable regulatory agencies. The approval of the Commissioner of the Arkansas State Bank Department is required if the total of all dividends declared by an Arkansas state bank in any calendar year exceeds seventy-five percent (75%) of the total of its net profits, as defined, for that year combined with seventy-five percent (75%) of its retained net profits of the preceding year. Under the foregoing dividend restrictions, and while maintaining its “well capitalized” status, at December 31, 2021, Simmons Bank had paid to the Company all available dividends. While past dividends are not necessarily indicative of amounts that may be paid, or available to be paid in future periods, net profits of Simmons Bank and cash balances at the Company are projected to be sufficient to pay quarterly dividends on the Company’s common stock at current levels and interest and principal on the Company’s debt as well as meet other liquidity needs.
The Company’s bank subsidiary is subject to various regulatory capital requirements administered by the federal banking agencies. Failure to meet minimum capital requirements can initiate certain mandatory and possibly additional discretionary actions by regulators that, if undertaken, could have a direct material effect on the Company’s financial statements. Under capital adequacy guidelines and the regulatory framework for prompt corrective action, the Company and its bank subsidiary must meet specific capital guidelines that involve quantitative measures of their assets, liabilities and certain off-balance-sheet items as calculated under regulatory accounting practices. The Company’s capital amounts and classifications are also subject to qualitative judgments by the regulators about components, risk weightings and other factors.
The risk-based capital guidelines of the Federal Reserve Board and the Arkansas State Bank Department include the definitions for (1) a well-capitalized institution, (2) an adequately-capitalized institution, and (3) an undercapitalized institution. Under the Basel III Rules effective January 1. 2015, the criteria for a well-capitalized institution are: a 5% “Tier l leverage capital” ratio, an 8% “Tier 1 risk-based capital” ratio, 10% “total risk-based capital” ratio; and a 6.5% “common equity Tier 1 (CET1)” ratio. CET1 generally consists of common stock; retained earnings; accumulated other comprehensive income and certain minority interests; all subject to applicable regulatory adjustments and deductions.
The Company and Simmons Bank, must hold a capital conservation buffer of 2.5% composed of CET1 capital above its minimum risk-based capital requirements. Failure to meet this capital conservation buffer would result in additional limits on dividends, other distributions and discretionary bonuses.
Quantitative measures established by regulation to ensure capital adequacy require the Company to maintain minimum amounts and ratios (set forth in the table below) of total, Tier 1 and common equity Tier 1 capital (as defined in the regulations) to risk-weighted assets (as defined) and of Tier 1 capital (as defined) to average assets (as defined). As of December 31, 2021, the Company and its subsidiary bank met all capital adequacy requirements under the Basel III Capital Rules and exceeded the fully phased in capital conservation buffer.
As of the most recent notification from regulatory agencies, the subsidiary bank was well capitalized under the regulatory framework for prompt corrective action. To be categorized as well capitalized, the Company and the Bank must maintain minimum total risk-based, Tier 1 risk-based, common equity Tier 1 risk-based and Tier 1 leverage ratios as set forth in the table. There are no conditions or events since that notification that management believes have changed these categories.
The Company’s and the subsidiary bank’ actual capital amounts and ratios are presented in the following table.
| | | | | | | | | | | | | | | | | | | | | | | | | | | | | | | | | | | |
| | Actual | | Minimum
For Capital
Adequacy Purposes | | To Be Well
Capitalized Under
Prompt Corrective
Action Provision |
| (In thousands) | Amount | | Ratio (%) | | Amount | | Ratio (%) | | Amount | | Ratio (%) |
| December 31, 2021 | | | | | | | | | | | |
| Total Risk-Based Capital Ratio | | | | | | | | | | | |
| Simmons First National Corporation | $ | 2,603,142 | | | 16.7 | | | $ | 1,247,014 | | | 8.0 | | | N/A | | |
| Simmons Bank | 2,389,704 | | | 15.4 | | | 1,241,405 | | | 8.0 | | | 1,551,756 | | | 10.0 | |
| Tier 1 Risk-Based Capital Ratio | | | | | | | | | | | |
| Simmons First National Corporation | 2,147,158 | | | 13.8 | | | 933,547 | | | 6.0 | | | N/A | | |
| Simmons Bank | 2,317,855 | | | 15.0 | | | 927,142 | | | 6.0 | | | 1,236,189 | | | 8.0 | |
| Common Equity Tier 1 Capital Ratio | | | | | | | | | | | |
| Simmons First National Corporation | 2,147,158 | | | 13.8 | | | 700,160 | | | 4.5 | | | N/A | | |
| Simmons Bank | 2,317,855 | | | 15.0 | | | 695,357 | | | 4.5 | | | 1,004,404 | | | 6.5 | |
| Tier 1 Leverage Ratio | | | | | | | | | | | |
| Simmons First National Corporation | 2,147,158 | | | 9.1 | | | 943,806 | | | 4.0 | | | N/A | | |
| Simmons Bank | 2,317,855 | | | 9.8 | | | 946,063 | | | 4.0 | | | 1,182,579 | | | 5.0 | |
| | | | | | | | | | | |
| December 31, 2020 | | | | | | | | | | | |
| Total Risk-Based Capital Ratio | | | | | | | | | | | |
| Simmons First National Corporation | $ | 2,356,982 | | | 16.8 | | | $ | 1,122,372 | | | 8.0 | | | N/A | | |
| Simmons Bank | 2,136,253 | | | 15.3 | | | 1,116,995 | | | 8.0 | | | 1,396,244 | | | 10.0 | |
| Tier 1 Risk-Based Capital Ratio | | | | | | | | | | | |
| Simmons First National Corporation | 1,884,562 | | | 13.4 | | | 843,834 | | | 6.0 | | | N/A | | |
| Simmons Bank | 2,046,711 | | | 14.6 | | | 841,114 | | | 6.0 | | | 1,121,485 | | | 8.0 | |
| Common Equity Tier 1 Capital Ratio | | | | | | | | | | | |
| Simmons First National Corporation | 1,883,795 | | | 13.4 | | | 632,618 | | | 4.5 | | | N/A | | |
| Simmons Bank | 2,046,711 | | | 14.6 | | | 630,836 | | | 4.5 | | | 911,207 | | | 6.5 | |
| Tier 1 Leverage Ratio | | | | | | | | | | | |
| Simmons First National Corporation | 1,884,562 | | | 9.1 | | | 828,379 | | | 4.0 | | | N/A | | |
| Simmons Bank | 2,046,711 | | | 9.9 | | | 826,954 | | | 4.0 | | | 1,033,692 | | | 5.0 | |
| | | | | | | | | | | |
NOTE 24: CONDENSED FINANCIAL INFORMATION (PARENT COMPANY ONLY)
Condensed Balance Sheets
December 31, 2021 and 2020
| | | | | | | | | | | |
| (In thousands) | 2021 | | 2020 |
| ASSETS | | | |
| Cash and cash equivalents | $ | 175,711 | | | $ | 172,083 | |
| Investment securities | 2,932 | | | 1,648 | |
| Investments in wholly-owned subsidiaries | 3,444,624 | | | 3,165,791 | |
| Loans | 2610 | | | 471 | |
| Intangible assets, net | 133 | | | 133 | |
| Premises and equipment | 23,861 | | | 25,606 | |
| Other assets | 53,877 | | | 56,257 | |
| TOTAL ASSETS | $ | 3,703,748 | | | $ | 3,421,989 | |
| | | |
| LIABILITIES | | | |
| Long-term debt | $ | 406,552 | | | $ | 406,859 | |
| Other liabilities | 48,355 | | | 38,474 | |
| Total liabilities | 454,907 | | | 445,333 | |
| | | |
| STOCKHOLDERS’ EQUITY | | | |
| Preferred stock | — | | | 767 | |
| Common stock | 1,127 | | | 1,081 | |
| Surplus | 2,164,989 | | | 2,014,076 | |
| Undivided profits | 1,093,270 | | | 901,006 | |
| Accumulated other comprehensive gain (loss): | | | |
Unrealized appreciation on available-for-sale securities, net of income taxes of $(3,731) and $21,132 at December 31, 2020 and 2019 respectively | (10,545) | | | 59,726 | |
| Total stockholders’ equity | 3,248,841 | | | 2,976,656 | |
| TOTAL LIABILITIES AND STOCKHOLDERS’ EQUITY | $ | 3,703,748 | | | $ | 3,421,989 | |
Condensed Statements of Income
Years Ended December 31, 2021, 2020 and 2019
| | | | | | | | | | | | | | | | | |
| (In thousands) | 2021 | | 2020 | | 2019 |
| INCOME | | | | | |
| Dividends from subsidiaries | $ | 227,310 | | | $ | 311,253 | | | $ | 67,893 | |
| Other income | 1,080 | | | 762 | | | 13,658 | |
| Income | 228,390 | | | 312,015 | | | 81,551 | |
| EXPENSE | 44,847 | | | 37,204 | | | 40,594 | |
Income before income taxes and equity in undistributed net income of subsidiaries | 183,543 | | | 274,811 | | | 40,957 | |
| Provision for income taxes | (11,314) | | | (9,438) | | | (5,680) | |
| | | | | |
| Income before equity in undistributed net income of subsidiaries | 194,857 | | | 284,249 | | | 46,637 | |
| Equity in undistributed net income of subsidiaries | 76,299 | | | (29,345) | | | 191,530 | |
| | | | | |
| NET INCOME | 271,156 | | | 254,904 | | | 238,167 | |
| Preferred stock dividends | 47 | | | 52 | | | 339 | |
| | | | | |
| NET INCOME AVAILABLE TO COMMON STOCKHOLDERS | $ | 271,109 | | | $ | 254,852 | | | $ | 237,828 | |
Condensed Statements of Comprehensive Income
Years Ended December 31, 2021, 2020 and 2019
| | | | | | | | | | | | | | | | | |
| (In thousands) | 2021 | | 2020 | | 2019 |
| NET INCOME | $ | 271,156 | | | $ | 254,904 | | | $ | 238,167 | |
| | | | | |
| OTHER COMPREHENSIVE INCOME (LOSS) | | | | | |
| Equity in other comprehensive income (loss) of subsidiaries | (70,271) | | | 38,835 | | | 48,265 | |
| | | | | |
| COMPREHENSIVE INCOME | $ | 200,885 | | | $ | 293,739 | | | $ | 286,432 | |
Condensed Statements of Cash Flows
Years Ended December 31, 2021, 2020 and 2019
| | | | | | | | | | | | | | | | | |
| (In thousands) | 2021 | | 2020 | | 2019 |
| CASH FLOWS FROM OPERATING ACTIVITIES | | | | | |
| | | | | |
| Net income | $ | 271,156 | | | $ | 254,904 | | | $ | 238,167 | |
| Items not requiring (providing) cash | | | | | |
| Stock-based compensation expense | 15,868 | | | 13,197 | | | 12,921 | |
| Depreciation and amortization | 1,805 | | | 1,796 | | | 1,637 | |
| Deferred income taxes | 3,347 | | | 1,583 | | | (3,632) | |
| Equity in undistributed net income of bank subsidiaries | (76,299) | | | 29,345 | | | (191,530) | |
| | | | | |
| Changes in: | | | | | |
| Other assets | (2,099) | | | (27,056) | | | 3,299 | |
| Other liabilities | 11,109 | | | 7,790 | | | (2,648) | |
| Net cash provided by operating activities | 224,887 | | | 281,559 | | | 58,214 | |
| | | | | |
| CASH FLOWS FROM INVESTING ACTIVITIES | | | | | |
| | | | | |
| Net collections of loans | (2,139) | | | 186 | | | 117 | |
| Net (purchases of) proceeds from premises and equipment | (83) | | | (7) | | | (23,184) | |
| (Advances to) repayment for subsidiaries | — | | | (15,363) | | | — | |
| Proceeds from maturities of available-for-sale securities | — | | | — | | | 2,544 | |
| Purchases of available-for-sale securities | — | | | — | | | (439) | |
| Cash paid in business combinations | (6,818) | | | — | | | (36,811) | |
| Other, net | 2 | | | 185 | | | 29 | |
| Net cash used in investing activities | (9,038) | | | (14,999) | | | (57,744) | |
| | | | | |
| CASH FLOWS FROM FINANCING ACTIVITIES | | | | | |
| | | | | |
| (Repayment) issuance of long-term debt, net | (1,563) | | | (7,442) | | | 2,000 | |
| (Cancellation) issuance of common stock, net | 1,460 | | | (3,131) | | | (1,077) | |
| Stock repurchases | (132,459) | | | (113,327) | | | (10,128) | |
| Dividends paid on preferred stock | (47) | | | (52) | | | (339) | |
| Dividends paid on common stock | (78,845) | | | (74,593) | | | (63,921) | |
| Preferred stock retirement | (767) | | | — | | | (42,000) | |
| Net cash used in financing activities | (212,221) | | | (198,545) | | | (115,465) | |
| | | | | |
| INCREASE (DECREASE) IN CASH AND CASH EQUIVALENTS | 3,628 | | | 68,015 | | | (114,995) | |
| | | | | |
| CASH AND CASH EQUIVALENTS, BEGINNING OF YEAR | 172,083 | | | 104,068 | | | 219,063 | |
| | | | | |
| CASH AND CASH EQUIVALENTS, END OF YEAR | $ | 175,711 | | | $ | 172,083 | | | $ | 104,068 | |
ITEM 9. CHANGES IN AND DISAGREEMENTS WITH ACCOUNTANTS ON ACCOUNTING AND FINANCIAL DISCLOSURE
None.
ITEM 9A. CONTROLS AND PROCEDURES
(a) Evaluation of Disclosure Controls and Procedures. Under the supervision and with the participation of our management, including the Company’s Chief Executive Officer, Chief Financial Officer and Chief Accounting Officer, an evaluation of the effectiveness of the Company’s disclosure controls and procedures (as defined in Rule 13a-15(e) and Rule 15d-15(e) under the Exchange Act) was carried out as of the end of the period covered by this Annual Report on Form 10-K. Based upon that evaluation, the Chief Executive Officer, Chief Financial Officer and Chief Accounting Officer have concluded that the Company’s current disclosure controls and procedures were effective as of the end of the period covered by this report.
(b) Changes in Internal Controls. Our management, including the Company’s Chief Executive Officer, Chief Financial Officer and Chief Accounting Officer, regularly review our disclosure controls and procedures and make changes intended to ensure the quality of our financial reporting. There were no changes in our internal control over financial reporting during the Company’s fourth quarter of its 2021 fiscal year that have materially affected, or are reasonably likely to materially affect, the Company’s internal control over financial reporting.
(c) Management’s Report on Internal Control Over Financial Reporting. Management’s report on internal control over financial reporting, as well as the audit report of BKD, LLP on the Company’s internal control over financial reporting are included in Item 8, Consolidated Financial Statements and Supplementary Data, of this Annual Report on Form 10-K and are incorporated herein by this reference.
ITEM 9B. OTHER INFORMATION
None.
ITEM 9C. DISCLOSURE REGARDING FOREIGN JURISDICTIONS THAT PREVENT INSPECTIONS
Not applicable.
PART III
ITEM 10. DIRECTORS, EXECUTIVE OFFICERS AND CORPORATE GOVERNANCE
Incorporated herein by reference from the Company’s definitive proxy statement for the Annual Meeting of Stockholders to be held April 27, 2022, to be filed pursuant to Regulation 14A within 120 days of the Company’s fiscal year-end.
ITEM 11. EXECUTIVE COMPENSATION
Incorporated herein by reference from the Company’s definitive proxy statement for the Annual Meeting of Stockholders to be held April 27, 2022, to be filed pursuant to Regulation 14A within 120 days of the Company’s fiscal year-end.
ITEM 12. SECURITY OWNERSHIP OF CERTAIN BENEFICIAL OWNERS AND MANAGEMENT AND RELATED STOCKHOLDER MATTERS
Incorporated herein by reference from the Company’s definitive proxy statement for the Annual Meeting of Stockholders to be held April 27, 2022, to be filed pursuant to Regulation 14A within 120 days of the Company’s fiscal year-end.
ITEM 13. CERTAIN RELATIONSHIPS AND RELATED TRANSACTIONS, AND DIRECTOR INDEPENDENCE
Incorporated herein by reference from the Company’s definitive proxy statement for the Annual Meeting of Stockholders to be held April 27, 2022, to be filed pursuant to Regulation 14A within 120 days of the Company’s fiscal year-end.
ITEM 14. PRINCIPAL ACCOUNTING FEES AND SERVICES
Incorporated herein by reference from the Company’s definitive proxy statement for the Annual Meeting of Stockholders to be held April 27, 2022, to be filed pursuant to Regulation 14A within 120 days of the Company’s fiscal year-end.
PART IV
ITEM 15. EXHIBITS AND FINANCIAL STATEMENT SCHEDULES
(a) 1 and 2. Financial Statements and any Financial Statement Schedules
The financial statements and financial statement schedules listed in the accompanying index to the consolidated financial statements and financial statement schedules are filed as part of this report.
(b) Listing of Exhibits
| | | | | | | | |
| Exhibit No. | | Description |
| | Stock Purchase Agreement by and between Simmons First National Corporation and Rogers Bancshares, Inc., dated as of September 10, 2013 (incorporated by reference to Exhibit 10.1 to Simmons First National Corporation’s Current Report on Form 8-K filed on September 17, 2013 (File No. 000-06253)). |
| | |
| | Agreement and Plan of Merger, dated as of March 24, 2014, by and between Simmons First National Corporation and Delta Trust & Banking Corporation (incorporated by reference to Annex A to the Joint Proxy Statement/Prospectus filed by Simmons First National Corporation on July 23, 2014 (File No. 000-06253)). |
| | |
| | Agreement and Plan of Merger, dated as of May 6, 2014, by and between Simmons First National Corporation and Community First Bancshares, Inc., as amended on September 11, 2014 (incorporated by reference to Annex A to the Joint Proxy Statement/Prospectus filed by Simmons First National Corporation on October 8, 2014 (File No. 000-06253)). |
| | | |
| | Agreement and Plan of Merger, dated as of May 27, 2014, by and between Simmons First National Corporation and Liberty Bancshares, Inc., as amended on September 11, 2014 (incorporated by reference to Annex B to the Joint Proxy Statement/Prospectus filed by Simmons First National Corporation on October 8, 2014 (File No. 000-06253)). |
| | |
| | Agreement and Plan of Merger, dated as of April 28, 2015, by and between Simmons First National Corporation and Ozark Trust & Investment Corporation (incorporated by reference to Exhibit 10.1 to Simmons First National Corporation’s Current Report on Form 8-K for April 29, 2015 (File No. 000-06253)). |
| | | |
| | Stock Purchase Agreement by and among Citizens National Bank, Citizens National Bancorp, Inc. and Simmons First National Corporation, dated as of May 18, 2016 (incorporated by reference to Exhibit 2.1 to Simmons First National Corporation’s Current Report on Form 8-K for May 18, 2016 (File No. 000-06253)). |
| | | |
| | Agreement and Plan of Merger, dated as of November 17, 2016, by and between Simmons First National Corporation and Hardeman County Investment Company, Inc. (incorporated by reference to Exhibit 2.1 to Simmons First National Corporation’s Current Report on Form 8-K for November 17, 2016 (File No. 000-06253)). |
| | | |
| | Agreement and Plan of Merger, dated as of December 14, 2016, by and between Simmons First National Corporation and Southwest Bancorp, Inc., as amended on July 19, 2017 (incorporated by reference to Exhibit 2.11 to Simmons First National Corporation’s Quarterly Report on Form 10-Q for the quarter ended June 30, 2017 (File No. 000-06253)). |
| | | |
| | Agreement and Plan of Merger, dated as of January 23, 2017, by and between Simmons First National Corporation and First Texas, BHC, Inc., as amended on July 19, 2017 (incorporated by reference to Exhibit 2.12 to Simmons First National Corporation’s Quarterly Report on Form 10-Q for the quarter ended June 30, 2017 (File No. 000-06253)). |
| | | |
| | Agreement and Plan of Merger, dated as of November 13, 2018, by and between Simmons First National Corporation and Reliance Bancshares, Inc., as amended on February 11, 2019 (incorporated by reference to Annex A to the Proxy Statement/Prospectus filed pursuant to Rule 424(b)(3) by Simmons First National Corporation filed on March 4, 2019 (File No. 333-229378)). |
| | |
| | Agreement and Plan of Merger, dated as of July 30, 2019, by and between Simmons First National Corporation and The Landrum Company (incorporated by reference to Exhibit 2.1 to Simmons First National Corporation Current Report on Form 8-K filed on July 31, 2019 (File No. 000-6253)). |
| | |
| | | | | | | | |
| Exhibit No. | | Description |
| | Agreement and Plan of Merger, dated as of June 4, 2021, by and among Simmons First National Corporation, Simmons Bank and Landmark Community Bank (incorporated by reference to Annex A to the Registration Statement on Form S-4 filed under the Securities Act of 1933 by Simmons First National Corporation on July 21, 2021 (File No. 333-258059)). |
| | |
| | Agreement and Plan of Merger, dated as of June 4, 2021, by and between Simmons First National Corporation and Triumph Bancshares, Inc. (incorporated by reference to Annex B to the Registration Statement on Form S-4 filed under the Securities Act of 1933 by Simmons First National Corporation on July 21, 2021 (File No. 333-258059)). |
| | |
| | Agreement and Plan of Merger, dated as of November 18, 2021, by and between Simmons First National Corporation and Spirit of Texas Bancshares, Inc. (incorporated by reference to Annex A to the Registration Statement on Form S-4 filed under the Securities Act of 1933 by Simmons First National Corporation on January 18, 2022 (File No. 333-261842)). |
| | |
| | Amended and Restated Articles of Incorporation of Simmons First National Corporation, as amended on July 14, 2021 (incorporated by reference to Exhibit 3.1 to the Registration Statement on Form S-4 filed under the Securities Act of 1933 by Simmons First National Corporation on July 21, 2021 (File No. 333-258059)). |
| | | |
| | Amended and Restated By-Laws of Simmons First National Corporation (incorporated by reference to Exhibit 3.1 to Simmons First National Corporation’s Current Report on Form 8-K filed on February 18, 2022 (File No. 000-06253)). |
| | | |
| 4.1 | | Instruments defining the rights of security holders, including indentures. Simmons First National Corporation hereby agrees to furnish copies of instruments defining the rights of holders of long-term debt of the Corporation and its consolidated subsidiaries to the U.S. Securities and Exchange Commission upon request. No issuance of debt exceeds ten percent of the total assets of the Corporation and its subsidiaries on a consolidated basis. |
| | |
| | Description of Registrant’s Securities.* |
| | | |
| | Second Amended and Restated Simmons First National Corporation 2015 Incentive Plan (incorporated by reference to Exhibit 10.1 to Amendment No. 1 to Simmons First National Corporation’s Current Report on Form 8-K filed on April 7, 2020 (File No. 000-06253)).^ |
| | |
| | Form of Associate Restricted Stock Unit Award Certificate and Terms and Conditions. (incorporated by reference to Exhibit 10.2 to Simmons First National Corporation’s Annual Report on Form 10-K for the year ended December 31, 2020 (File No. 000-06253)).^ |
| | |
| | Form of Associate Performance Share Unit Award Certificate and Terms and Conditions (2020) (incorporated by reference to Exhibit 10.3 to Simmons First National Corporation’s Annual Report on Form 10-K for the year ended December 31, 2020 (File No. 000-06253)).^ |
| | |
| | Form of Associate Performance Share Unit Award Certificate and Terms and Conditions (2021).*^ |
| | |
| | Form of Associate Cash Award Certificate and Terms and Conditions.*^ |
| | |
| | Form of Director Restricted Stock Unit Award Certificate and Terms and Conditions. (incorporated by reference to Exhibit 10.5 to Simmons First National Corporation’s Annual Report on Form 10-K for the year ended December 31, 2020 (File No. 000-06253)).^ |
| | |
| | Deferred Compensation Agreement for Marty D. Casteel dated January 22, 2018 (incorporated by reference to Exhibit 10.3 to Simmons First National Corporation’s Annual Report on Form 10-K for the year ended December 31, 2017 (File No. 000-06253)).^ |
| | |
| | Deferred Compensation Agreement for George A. Makris, Jr. dated January 2, 2013 (incorporated by reference to Exhibit 10.2 to Simmons First National Corporation’s Current Report on Form 8-K filed on January 7, 2013 (File No. 000-06253)).^ |
| | |
| | Amendment to Deferred Compensation Agreement for George A. Makris, Jr. dated January 25, 2018 (incorporated by reference to Exhibit 10.4 to Simmons First National Corporation’s Annual Report on Form 10-K for the year ended December 31, 2017 (File No. 000-06253)).^ |
| | |
| | | | | | | | |
| Exhibit No. | | Description |
| | Amended and Restated Deferred Compensation Agreement for Robert A. Fehlman effective February 27, 2017 (incorporated by reference to Exhibit 10.25 to Simmons First National Corporation’s Annual Report on Form 10-K for the year ended December 31, 2016 (File No. 000-06253)).^ |
| | |
| | First Amended and Restated Executive Change in Control Severance Agreement for George A. Makris, Jr. dated March 26, 2021 (incorporated by reference to Exhibit 10.2 to Simmons First National Corporation’s Current Report on Form 8-K filed on April 1, 2021 (File No. 000-06253)).^ |
| | |
| | First Amended and Restated Executive Change in Control Severance Agreement for Stephen C. Massanelli dated March 26, 2021 (incorporated by reference to Exhibit 10.3 to Simmons First National Corporation’s Current Report on Form 8-K filed on April 1, 2021 (File No. 000-06253)).^ |
| | |
| | Deferred Compensation Agreement for Marty D. Casteel dated January 25, 2010 (incorporated by reference to Exhibit 10.3 to Simmons First National Corporation’s Current Report on Form 8-K filed on January 29, 2010 (File No. 000-06253)).^ |
| | |
| | Amended and Restated Executive Severance Agreement for Robert A. Fehlman dated March 1, 2006 (incorporated by reference to Exhibit 10.3 to Simmons First National Corporation’s Current Report on Form 8-K filed on March 2, 2006 (File No. 000-06253)).^ |
| | | |
| | First Amendment to Amended and Restated Executive Severance Agreement for Robert A. Fehlman dated March, 1, 2006. (incorporated by reference to Exhibit 10.14 to Simmons First National Corporation’s Annual Report on Form 10-K for the year ended December 31, 2020 (File No. 000-06253)).^ |
| | |
| | Second Amendment to Amended and Restated Executive Severance Agreement for Robert A. Fehlman dated March 1, 2006. (incorporated by reference to Exhibit 10.15 to Simmons First National Corporation’s Annual Report on Form 10-K for the year ended December 31, 2020 (File No. 000-06253)).^ |
| | |
| | Deferred Compensation Agreement for Jennifer B. Compton dated February 28, 2017 (incorporated by reference to Exhibit 10.11 to Simmons First National Corporation’s Annual Report on Form 10-K for the year ended December 31, 2019 (File No. 000-06235)).^ |
| | |
| | First Amended and Restated Executive Change in Control Severance Agreement for Jennifer B. Compton dated March 26, 2021 (incorporated by reference to Exhibit 10.5 to Simmons First National Corporation’s Quarterly Report on Form 10-Q for the quarter ended March 31, 2021 (File No. 000-06253)).^ |
| | |
| | First Amended and Restated Executive Change in Control Severance Agreement for Paul Kanneman dated March 26, 2021 (incorporated by reference to Exhibit 10.8 to Simmons First National Corporation’s Quarterly Report on Form 10-Q for the quarter ended March 31, 2021 (File No. 000-06253)).^ |
| | |
| | First Amended and Restated Executive Change in Control Severance Agreement for David Garner dated March 26, 2021 (incorporated by reference to Exhibit 10.7 to Simmons First National Corporation’s Quarterly Report on Form 10-Q for the quarter ended March 31, 2021 (File No. 000-06253)).^ |
| | |
| | First Amended and Restated Executive Change in Control Severance Agreement for George A. Makris III dated March 26, 2021 (incorporated by reference to Exhibit 10.6 to Simmons First National Corporation’s Quarterly Report on Form 10-Q for the quarter ended March 31, 2021 (File No. 000-06253)).^ |
| | |
| | First Amended and Restated Executive Change in Control Severance Agreement for John Barber dated March 26, 2021 (incorporated by reference to Exhibit 10.9 to Simmons First National Corporation’s Quarterly Report on Form 10-Q for the quarter ended March 31, 2021 (File No. 000-06253)).^ |
| | |
| | First Amended and Restated Executive Change in Control Severance Agreement for Matthew S. Reddin dated March 26, 2021 (incorporated by reference to Exhibit 10.4 to Simmons First National Corporation’s Quarterly Report on Form 10-Q for the quarter ended March 31, 2021 (File No. 000-06253)).^ |
| | |
| | Deferred Compensation Agreement for Matthew Reddin dated March 7, 2017. (incorporated by reference to Exhibit 10.23 to Simmons First National Corporation’s Annual Report on Form 10-K for the year ended December 31, 2020 (File No. 000-06253)).^ |
| | |
| | | | | | | | |
| Exhibit No. | | Description |
| | Deferred Compensation Agreement for David Garner dated January 2, 2020 (incorporated by reference to Exhibit 10.1 to Simmons First National Corporation’s Quarterly Report on Form 10-Q for the quarter ended March 31, 2020 (File No. 000-06253)).^ |
| | |
| | Form of Indemnification Agreement (incorporated by reference to Exhibit 10.1 to Simmons First National Corporation’s Quarterly Report on Form 10-Q for the quarter ended March 31, 2021 (File No. 000-06253)).^ |
| | |
| | Indemnification Agreement for James M. Brogdon dated July 30, 2021 (incorporated by reference to Exhibit 10.1 to Simmons First National Corporation’s Current Report on Form 8-K filed on August 5, 2021 (File No. 000-06253)).^ |
| | |
| | Executive Change in Control Severance Agreement for James M. Brogdon dated July 30, 2021 (incorporated by reference to Exhibit 10.2 to Simmons First National Corporation’s Current Report on Form 8-K filed on August 5, 2021 (File No. 000-06253)).^ |
| | |
| | Deferred Compensation Agreement for James M. Brogdon dated July 30, 2021 (incorporated by reference to Exhibit 10.3 to Simmons First National Corporation’s Current Report on Form 8-K filed on August 5, 2021 (File No. 000-06253)).^ |
| | |
| | Amended and Restated Simmons First National Corporation Code of Ethics (as amended and restated on July 23, 2020) (incorporated by reference to Exhibit 14.1 to Simmons First National Corporation’s Current Report on Form 8-K filed on July 28, 2020 (File No. 000-06253)). |
| | |
| | Finance Group Code of Ethics, dated July 2003 (incorporated by reference to Exhibit 14 to Simmons First National Corporation’s Annual Report on Form 10-K for the year ended December 31, 2003 (File No. 000-06253)). |
| | |
| | Subsidiaries of the Registrant.* |
| | |
| | Consent of BKD, LLP.* |
| | |
| | Rule 13a-15(e) and 15d-15(e) Certification – George A. Makris, Jr., Chairman and Chief Executive Officer.* |
| | | |
| | Rule 13a-15(e) and 15d-15(e) Certification – James M. Brogdon, Executive Vice President, Chief Financial Officer and Treasurer.* |
| | | |
| | Rule 13a-15(e) and 15d-15(e) Certification – David W. Garner, Executive Vice President, Executive Director of Finance and Accounting and Chief Accounting Officer.* |
| | | |
| | Certification Pursuant to 18 U.S.C. Sections 1350, as Adopted Pursuant to Section 906 of the Sarbanes-Oxley Act of 2002 – George A. Makris, Jr., Chairman and Chief Executive Officer.* |
| | | |
| | Certification Pursuant to 18 U.S.C. Sections 1350, as Adopted Pursuant to Section 906 of the Sarbanes-Oxley Act of 2002 – James M. Brogdon, Executive Vice President, Chief Financial Officer and Treasurer.* |
| | | |
| | Certification Pursuant to 18 U.S.C. Sections 1350, as Adopted Pursuant to Section 906 of the Sarbanes-Oxley Act of 2002 – David W. Garner, Executive Vice President, Executive Director of Finance and Accounting and Chief Accounting Officer.* |
| | | |
| 101.INS | | XBRL Instance Document - the instance document does not appear in the Interactive Data File because its XBRL tags are embedded within the Inline XBRL document. ** |
| | | |
| 101.SCH | | Inline XBRL Taxonomy Extension Schema.** |
| | | |
| 101.CAL | | Inline XBRL Taxonomy Extension Calculation Linkbase.** |
| | | |
| 101.DEF | | Inline XBRL Taxonomy Extension Definition Linkbase.** |
| | | |
| 101.LAB | | Inline XBRL Taxonomy Extension Labels Linkbase. ** |
| | | |
| 101.PRE | | Inline XBRL Taxonomy Extension Presentation Linkbase.** |
| | | | | | | | |
| Exhibit No. | | Description |
| | |
| 104 | | Cover Page Interactive Data File (formatted as Inline XBRL and contained in Exhibit 101). ** |
______________________________________________________________________________________________
| | | | | | | | |
| * | | Filed herewith |
| ** | | Pursuant to Rule 406T of Regulation S-T, these interactive data files are deemed not filed or part of a registration statement or prospectus for purposes of Sections 11 or 12 of the Securities Act of 1933, as amended, are deemed not filed for purposes of Section 18 of the Securities Exchange Act of 1934, as amended, and otherwise are not subject to liability under those sections. |
| ^ | | Management contract or a compensatory plan or arrangement. |
ITEM 16. FORM 10-K SUMMARY
None.
SIGNATURES
Pursuant to the requirements of Section 13 or 15 (d) of the Securities Exchange Act of 1934, the Registrant has duly caused this report to be signed on its behalf by the undersigned, thereunto duly authorized.
| | | | | | | | | | | |
| | /s/ George Makris, III | | February 25, 2022 |
| | George Makris, III, Secretary | | |
Pursuant to the requirements of the Securities and Exchange Act of 1934, this report has been signed below by the following persons on behalf of the registrant and in the capacities indicated on or about February 25, 2022.
| | | | | | | | |
| Signature | | Title |
| | | |
| /s/ George A. Makris, Jr. | | Chairman, Chief Executive Officer |
| George A. Makris, Jr. | | and Director (Principal Executive Officer) |
| | | |
| /s/ James M. Brogdon | | Executive Vice President, Chief Financial Officer |
| James M. Brogdon | | and Treasurer (Principal Financial Officer) |
| | |
| /s/ David W. Garner | | Executive Vice President, Executive Director of Finance and |
| David W. Garner | | and Accounting and Chief Accounting Officer |
| | | (Principal Accounting Officer) |
| | | |
| /s/ Jay D. Burchfield | | Director |
| Jay D. Burchfield | | |
| | | |
| /s/ Marty D. Casteel | | Director |
| Marty D. Casteel | | |
| | |
| /s/ William E. Clark II | | Director |
| William E. Clark II | | |
| | | |
| /s/ Steven A. Cossé | | Director |
| Steven A. Cossé | | |
| | |
| /s/ Mark C. Doramus | | Director |
| Mark C. Doramus | | |
| | | |
| /s/ Edward Drilling | | Director |
| Edward Drilling | | |
| | | |
| /s/ Eugene Hunt | | Director |
| Eugene Hunt | | |
| | | |
| /s/ Jerry M. Hunter | | Director |
| Jerry M. Hunter | | |
| | |
| | |
| | | | | | | | |
| /s/ Susan S. Lanigan | | Director |
| Susan S. Lanigan | | |
| | | |
| /s/ W. Scott McGeorge | | Director |
| W. Scott McGeorge | | |
| | | |
| | Director |
| Tom Purvis | | |
| | | |
| /s/ Robert L. Shoptaw | | Director |
| Robert L. Shoptaw | | |
| | |
| /s/ Julie L. Stackhouse | | Director |
| Julie L. Stackhouse | | |
| | |
| /s/ Russell Teubner | | Director |
| Russell Teubner | | |
| | | |
| | Director |
| Malynda K. West | | |