Exhibit 99.1
![]()
July 25, 2023
Simmons First National Corporation Reports Second Quarter 2023 Results
| Bob Fehlman, Simmons’ Chief Executive Officer, commented on second quarter 2023 results: |
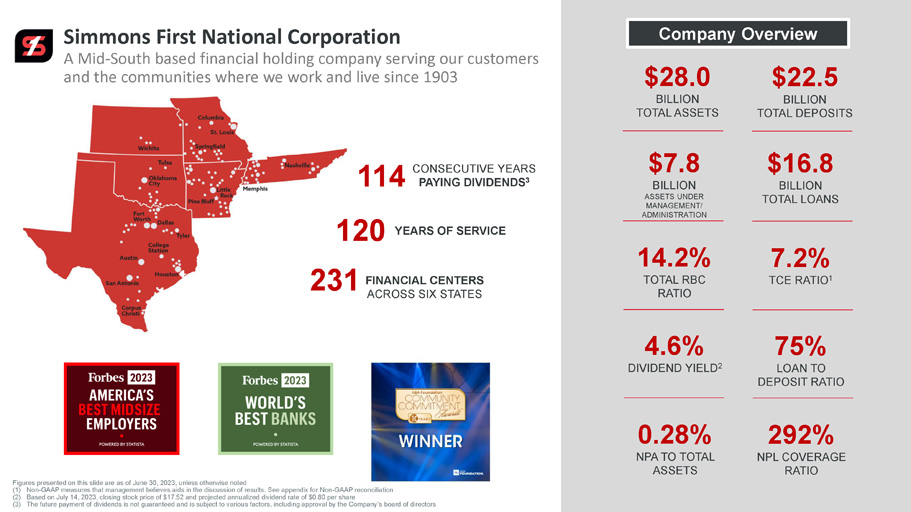
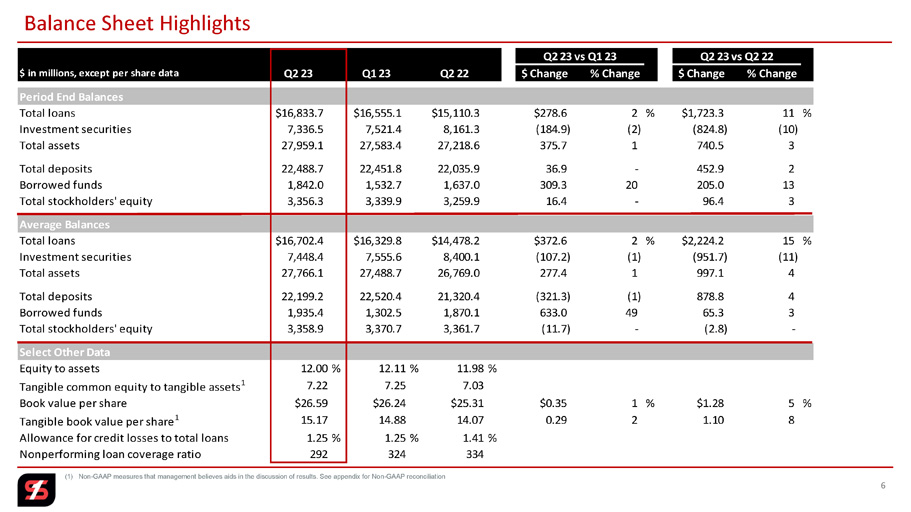
Simmons posted net income of $58.3 million and diluted earnings per share of $0.46 for the quarter. Adjusted earnings1 were $61.1 million and adjusted diluted earnings per share1 were $0.48. Balance sheet growth was steady, with total loans ending the quarter at $16.8 billion, up 2 percent, and total deposits at $22.5 billion, up slightly, both on a linked quarter basis.
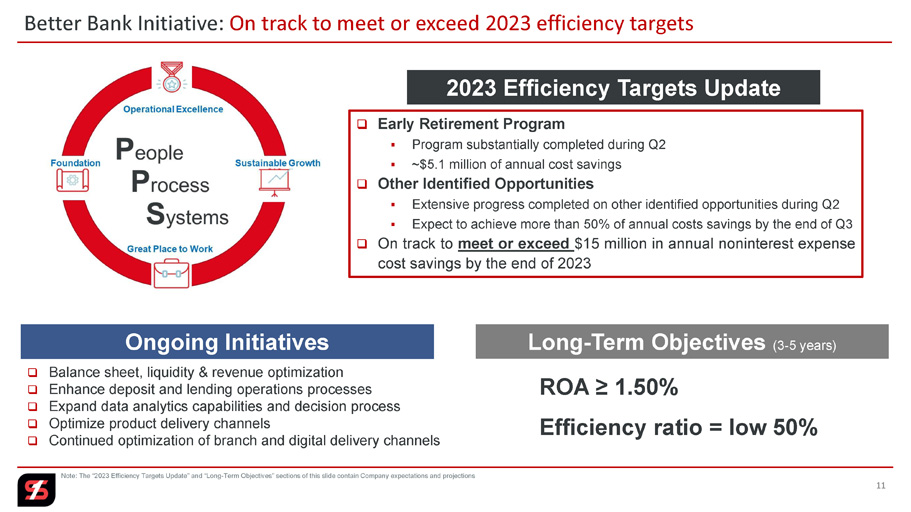
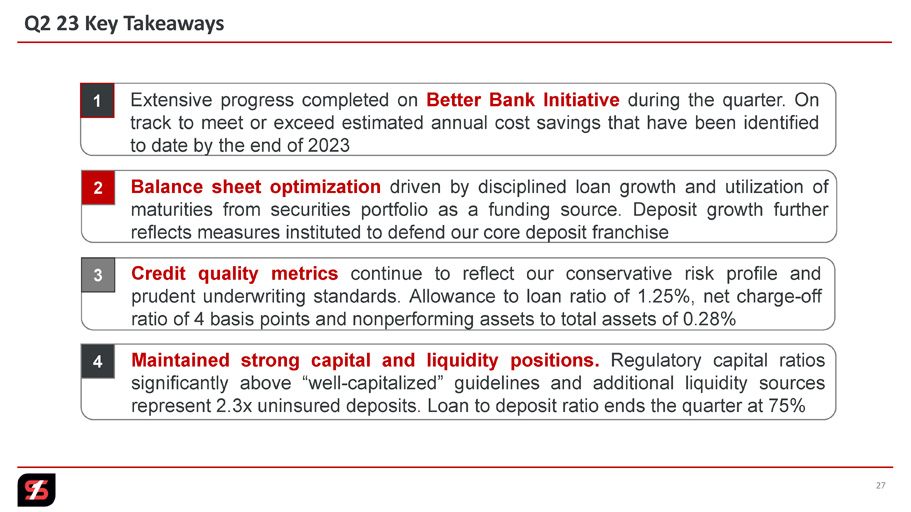
Our Better Bank Initiative, which is focused on programs designed to optimize operational processes and increase capacity to capitalize on organic growth opportunities, achieved continued success across multiple fronts. During the quarter, we substantially completed our early retirement program, which is expected to result in approximately $5.1 million in annual cost savings. Extensive progress was also completed on other identified opportunities related to process improvements and streamlining or upgrading systems; and, as a result, we are on track to meet or exceed the estimated $15 million in annual cost savings we have identified to date by the end of 2023.
While we continue to navigate the challenging economic environment, like many in our industry we have experienced an increase in funding costs given the rapid rise in interest rates and resulting steps taken to defend our core customer deposit base. Given our strong liquidity and capital positions, our focus on maintaining prudent underwriting standards and our 120-year history, we believe we are in a position to continue to serve our customers and expand market share across our attractive footprint.
| Financial Highlights | 2Q23 | 1Q23 | 2Q22 | Q2 23 Highlights | |
| Balance Sheet (in millions) |
Metrics as of quarter end:
· Net income of $58.3 million and diluted EPS of $0.46
· Adjusted earnings1 of $61.1 million and adjusted diluted EPS1 of $0.48
· Strong expense management with noninterest expense down 2% on a linked quarter basis
· Maintained strong funding and liquidity positions as deposits increased on a linked quarter basis and coverage of uninsured deposits rose to 2.3x
· Disciplined loan growth as total loans increased 2% on a linked quarter basis
· 4 bps of net charge-offs; ACL to total loans unchanged at 1.25%
· Book value per share up 5% and tangible book value per share1 up 8%, both year-over-year
· Repurchased 1.1 million shares in the quarter | ||||
| Total deposits | $22,489 | $22,452 | $22,036 | ||
| Total loans | 16,834 | 16,555 | 15,110 | ||
| Total investment securities | 7,337 | 7,521 | 8,161 | ||
| Total shareholders’ equity | 3,356 | 3,340 | 3,260 | ||
| Asset Quality | |||||
| Net charge-off ratio | 0.04% | 0.03% | 0.02% | ||
| Nonperforming loan ratio | 0.43 | 0.38 | 0.42 | ||
| Nonperforming assets to total assets | 0.28 | 0.26 | 0.26 | ||
| Allowance for credit losses to total loans | 1.25 | 1.25 | 1.41 | ||
| Nonperforming loan coverage ratio | 292 | 324 | 334 | ||
| Capital Ratios | |||||
| Equity to assets | 12.00% | 12.11% | 11.98% | ||
| Tangible common equity (TCE) ratio 1 | 7.22 | 7.25 | 7.03 | ||
| Common equity tier 1 (CET1) ratio | 11.92 | 11.87 | 12.10 | ||
| Total risk-based capital ratio | 14.17 | 14.47 | 14.83 | ||
| Liquidity ($ in millions) | |||||
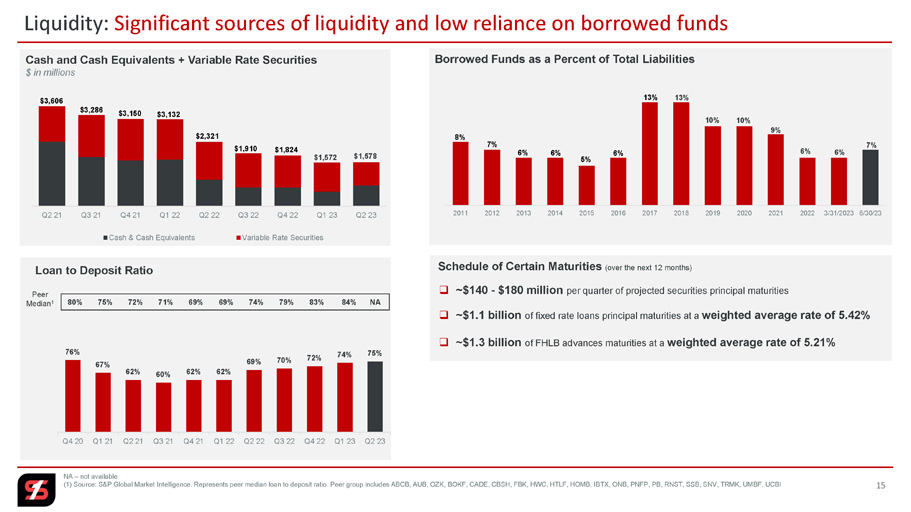
| Loan to deposit ratio | 74.85% | 73.74% | 68.57% | ||
| Borrowed funds to total liabilities | 7.49% | 6.32% | 6.83% | ||
| Uninsured deposits | $ 4,817 | $ 5,268 | $6,516 | ||
| Additional liquidity sources | $11,096 | $10,780 | $7,808 | ||
| Coverage ratio of uninsured deposits | 2.3x | 2.0x | 1.2x | ||
| Performance Measures (in millions) | |||||
| Total revenue | $208.2 | $223.7 | $225.3 | ||
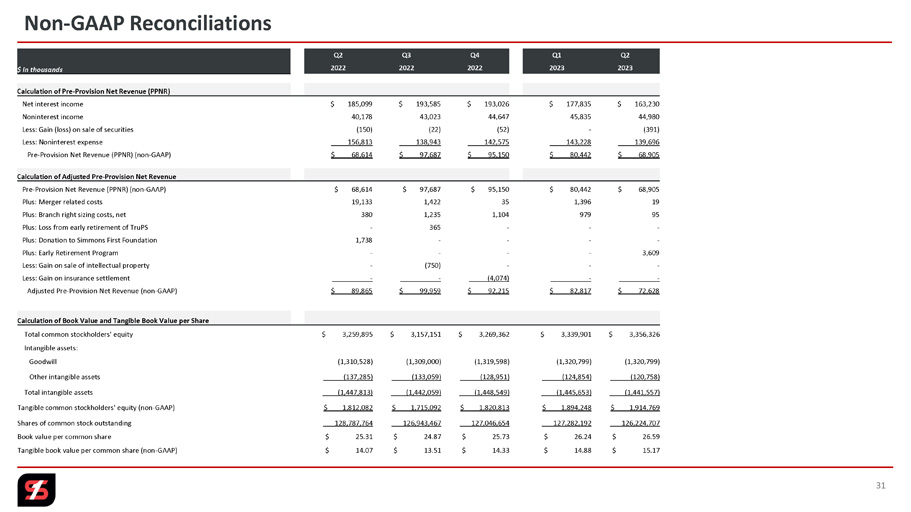
| Pre-provision net revenue1 | 68.9 | 80.4 | 68.6 | ||
| Adjusted pre-provision net revenue1 | 72.6 | 82.8 | 89.9 | ||
| Provision for credit losses on loans | 0.1 | 10.9 | 33.9 | ||
| Provision for credit losses on securities | - | 13.3 | - | ||
| Noninterest income | 45.0 | 45.8 | 40.2 | ||
| Noninterest expense | 139.7 | 143.2 | 156.8 |
P.O. BOX 7009 501 MAIN STREET PINE BLUFF, ARKANSAS 71611-7009 (870) 541-1000 www.simmonsbank.com
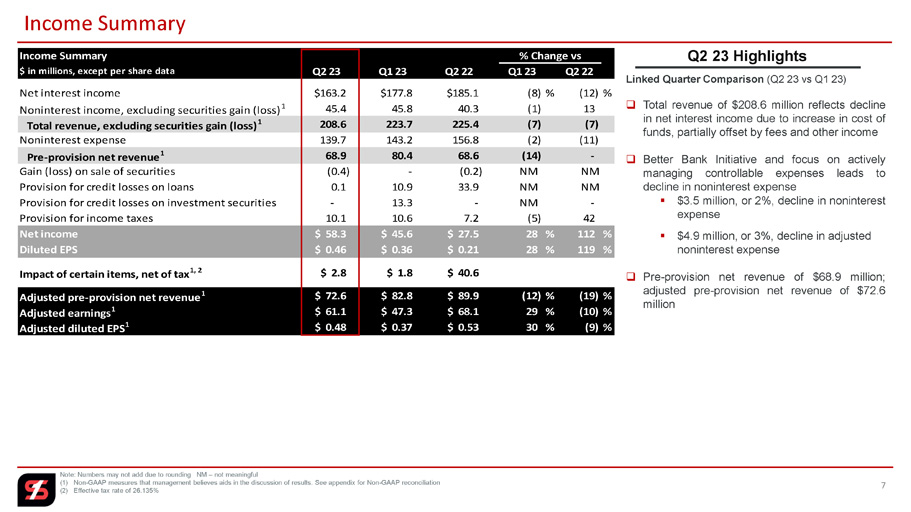
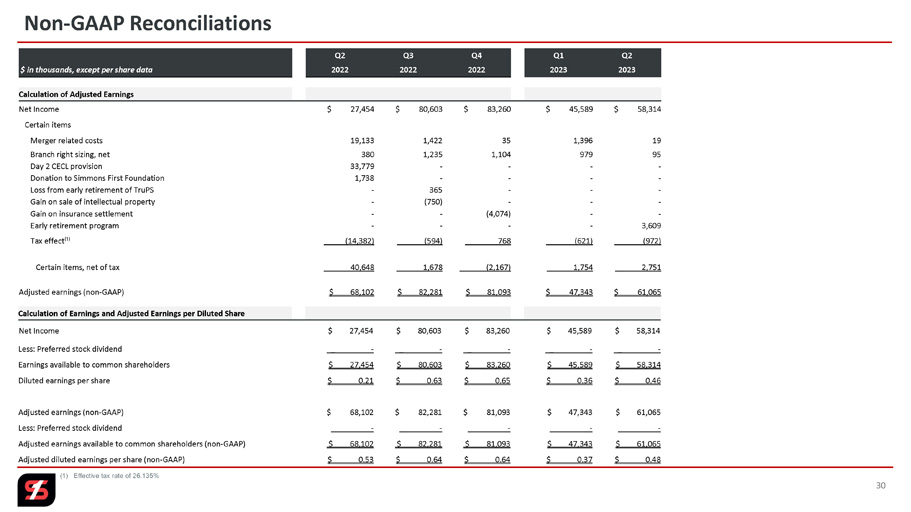
Simmons First National Corporation (NASDAQ: SFNC) (Simmons or Company) today reported net income of $58.3 million for the second quarter of 2023, compared to $45.6 million in the first quarter of 2023 and $27.5 million in the second quarter of 2022. Diluted earnings per share were $0.46 for the second quarter of 2023, compared to $0.36 in the first quarter of 2023 and $0.21 in the second quarter of 2022. Adjusted earnings1 for the second quarter of 2023 were $61.1 million, compared to $47.3 million in the first quarter of 2023 and $68.1 million in the second quarter of 2022. A summary of certain items, consisting primarily of merger related costs, branch right-sizing costs and early retirement program costs are described in the “Reconciliation of Non-GAAP Financial Measures” tables below.
Net Interest Income
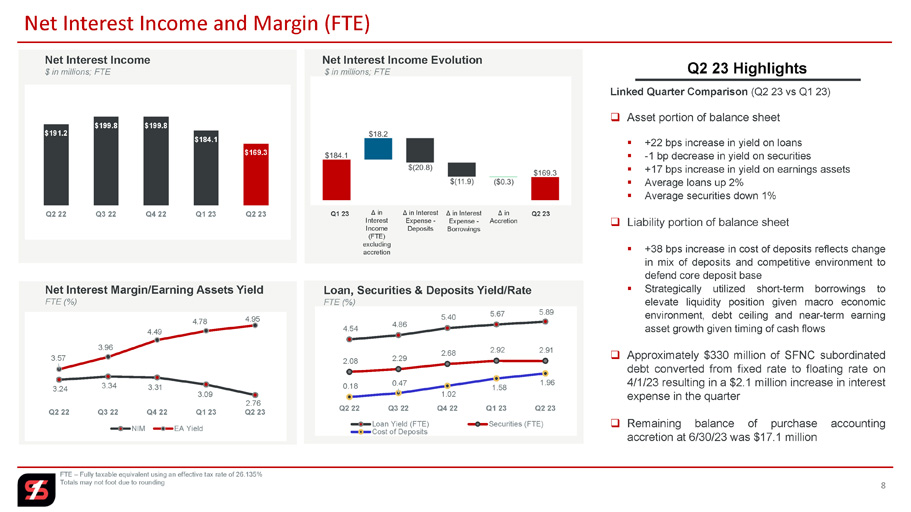
Net interest income for the second quarter of 2023 totaled $163.2 million, compared to $177.8 million in the first quarter of 2023 and $185.1 million for the second quarter of 2022. Included in net interest income is accretion recognized on assets acquired, which totaled $2.3 million in the second quarter of 2023, $2.6 million in the first quarter of 2023 and $9.9 million in the second quarter of 2022. On a linked quarter basis, interest income increased $18.1 million, while interest expense increased $32.7 million reflecting the competitive interest rate environment and resulting pricing measures to defend the core deposit base, continued customer migration to higher rate deposit products and a strategic decision to utilize short-term borrowings to elevate our liquidity position given the macroeconomic environment and the debt ceiling debate. On April 1, 2023, approximately $330.0 million of the Company’s outstanding subordinated debt converted from fixed rate to floating rate, resulting in a $2.1 million increase in interest expense during the quarter.
The yield on loans for the second quarter of 2023 was 5.89 percent, compared to 5.67 percent in the first quarter of 2023 and 4.54 percent in the second quarter of 2022. The yield on investment securities for the second quarter of 2023 was 2.91 percent, compared to 2.92 percent in the first quarter of 2023 and 2.08 percent in the second quarter of 2022. Cost of deposits for the second quarter of 2023 was 1.96 percent, compared to 1.58 percent in the first quarter of 2023 and 0.18 percent in the second quarter of 2022. The increase in the cost of deposits reflected the dramatic increase in interest rates, customer migration to higher rate deposit products and increased competition for deposits. The net interest margin on a fully taxable equivalent basis for the second quarter of 2023 was 2.76 percent, compared to 3.09 percent in the first quarter of 2023 and 3.24 percent in the second quarter of 2022.
| Q2 23 | Q1 23 | Q4 22 | Q3 22 | Q2 22 | ||||||||||||||||
| Loan yield (FTE)2 | 5.89 | % | 5.67 | % | 5.40 | % | 4.86 | % | 4.54 | % | ||||||||||
| Investment securities yield (FTE)2 | 2.91 | 2.92 | 2.68 | 2.29 | 2.08 | |||||||||||||||
| Cost of interest bearing deposits | 2.57 | 2.10 | 1.41 | 0.65 | 0.25 | |||||||||||||||
| Cost of deposits | 1.96 | 1.58 | 1.02 | 0.47 | 0.18 | |||||||||||||||
| Cost of borrowed funds | 5.31 | 4.29 | 3.92 | 2.66 | 2.13 | |||||||||||||||
| Net interest spread (FTE)2 | 2.10 | 2.52 | 2.87 | 3.11 | 3.11 | |||||||||||||||
| Net interest margin (FTE)2 | 2.76 | 3.09 | 3.31 | 3.34 | 3.24 | |||||||||||||||
Noninterest Income
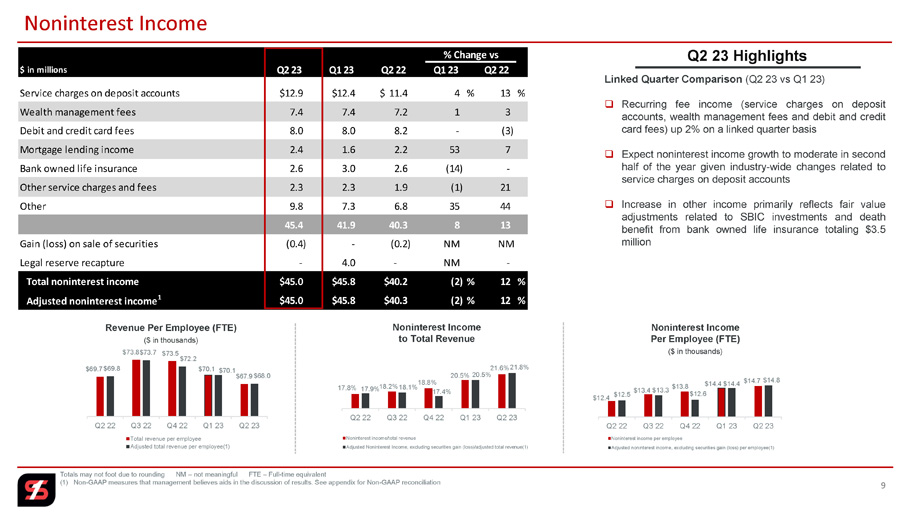
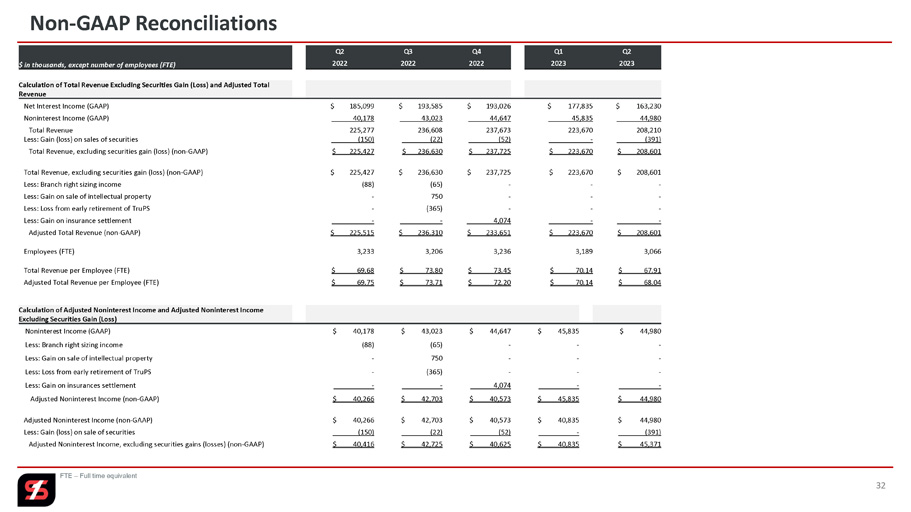
Noninterest income for the second quarter of 2023 was $45.0 million, compared to $45.8 million in the first quarter of 2023 and $40.2 million in the second quarter of 2022. Included in first quarter 2023 results is a $4.0 million legal reserve recapture associated with previously disclosed legal matters. On a linked quarter and year-over-year basis, most fee-based businesses posted positive gains, led by service charges on deposits accounts, wealth management fees and mortgage lending income, offset in part by a decline in bank owned life insurance. Other noninterest income increased on a year-over year basis, primarily as a result of fair value adjustments associated with certain equity investments and death benefits from bank owned life insurance.
Noninterest Income $ in millions | Q2 23 | Q1 23 | Q4 22 | Q3 22 | Q2 22 | |||||||||||||||
| Service charges on deposit accounts | $ | 12.9 | $ | 12.4 | $ | 11.9 | $ | 12.6 | $ | 11.4 | ||||||||||
| Wealth management fees | 7.4 | 7.4 | 8.2 | 8.6 | 7.2 | |||||||||||||||
| Debit and credit card fees | 8.0 | 8.0 | 7.8 | 7.7 | 8.2 | |||||||||||||||
| Mortgage lending income | 2.4 | 1.6 | 1.1 | 2.6 | 2.2 | |||||||||||||||
| Other service charges and fees | 2.3 | 2.3 | 2.0 | 2.1 | 1.9 | |||||||||||||||
| Bank owned life insurance | 2.6 | 3.0 | 3.0 | 2.9 | 2.6 | |||||||||||||||
| Gain (loss) on sale of securities | (0.4 | ) | - | (0.1 | ) | - | (0.2 | ) | ||||||||||||
| Gain on insurance settlement | - | - | 4.1 | - | - | |||||||||||||||
| Other income | 9.8 | 11.3 | 6.6 | 6.7 | 6.8 | |||||||||||||||
| Adjusted other income1 | 9.8 | 11.3 | 6.6 | 6.3 | 6.9 | |||||||||||||||
Noninterest Expense
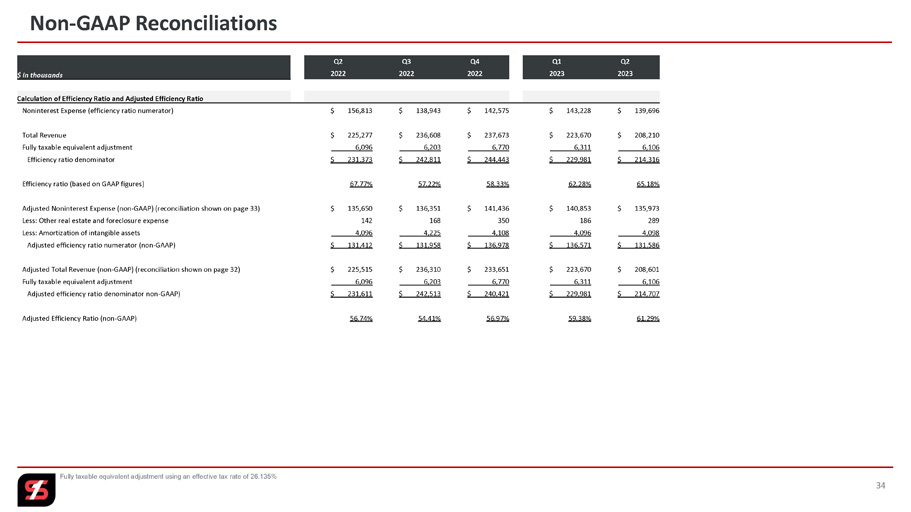
Noninterest expense for the second quarter of 2023 was $139.7 million, compared to $143.2 million in the first quarter of 2023 and $156.8 million in the second quarter of 2022. Included in noninterest expense are certain items consisting primarily of merger related costs, branch right sizing costs and early retirement program costs, totaling $3.7 million in the second quarter of 2023, $2.4 million in the first quarter of 2023 and $21.2 million in the second quarter of 2022. Excluding these items (which are described in the “Reconciliation of Non-GAAP Financial Measures” tables below), adjusted noninterest expense1 was $136.0 million in the second quarter of 2023, $140.9 million in the first quarter of 2023 and $135.7 million in the second quarter of 2022. The decrease in adjusted noninterest expense on a linked quarter basis was primarily attributable to successful execution of our Better Bank Initiative as well as a $3.0 million incentive accrual adjustment recorded in the second quarter of 2023.
Noninterest Expense $ in millions | Q2 23 | Q1 23 | Q4 22 | Q3 22 | Q2 22 | |||||||||||||||
| Salaries and employee benefits | $ | 74.7 | $ | 77.0 | $ | 73.0 | $ | 71.9 | $ | 74.1 | ||||||||||
| Occupancy expense, net | 11.4 | 11.6 | 11.6 | 11.7 | 11.0 | |||||||||||||||
| Furniture and equipment | 5.1 | 5.1 | 5.4 | 5.4 | 5.1 | |||||||||||||||
| Deposit insurance | 5.2 | 4.9 | 3.7 | 3.3 | 2.8 | |||||||||||||||
| Other real estate and foreclosure expense | 0.3 | 0.2 | 0.4 | 0.2 | 0.1 | |||||||||||||||
| Merger related costs | - | 1.4 | - | 1.4 | 19.1 | |||||||||||||||
| Other operating expenses | 42.9 | 43.1 | 48.5 | 45.1 | 44.5 | |||||||||||||||
| Adjusted salaries and employee benefits1 | 71.1 | 77.0 | 73.0 | 71.9 | 74.1 | |||||||||||||||
| Adjusted other operating expenses1 | 43.0 | 42.3 | 47.5 | 44.1 | 42.7 | |||||||||||||||
| Efficiency ratio | 65.18 | % | 62.28 | % | 58.33 | % | 57.22 | % | 67.77 | % | ||||||||||
| Adjusted efficiency ratio1 | 61.29 | % | 59.38 | % | 56.97 | % | 54.41 | % | 56.74 | % | ||||||||||
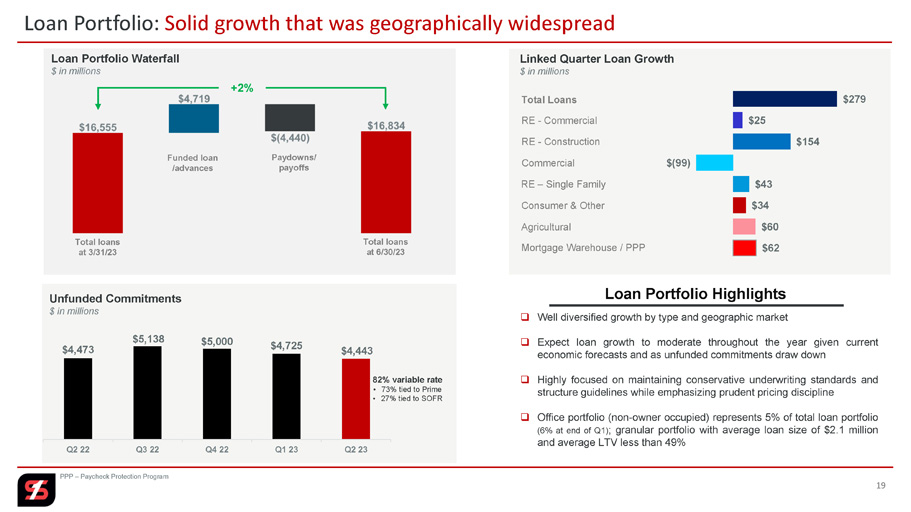
Loans and Unfunded Loan Commitments
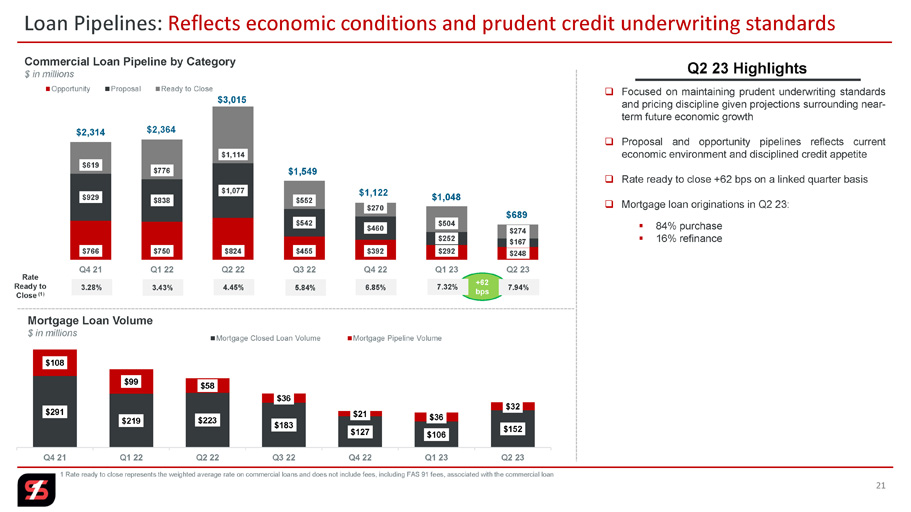
Total loans at the end of the second quarter of 2023 were $16.8 billion, an increase of $279 million, or 2 percent, compared to $16.6 billion at the end of the first quarter of 2023. On a year-over-year basis, total loans were up $1.7 billion, or 11 percent. While loan growth has moderated as expected, the increase in total loans on a linked quarter basis was broad-based, both in terms of industry type and geographic market. Unfunded commitments at the end of the second quarter of 2023 were $4.4 million, compared to $4.7 billion at the end of the first quarter of 2023 and $4.5 billion at the end of the second quarter of 2022. While unfunded commitments are considered a key indicator of future loan growth, the rapid increase in interest rates, coupled with softer economic conditions, have resulted in lower activity in our commercial loan pipeline. Commercial loans approved and ready to close at the end of the second quarter of 2023 totaled $274 million, and the rate on ready to close commercial loans was 7.94 percent, up 62 basis points on a linked quarter basis.
| $ in millions | Q2 23 | Q1 23 | Q4 22 | Q3 22 | Q2 22 | |||||||||||||||
| Total loans | $ | 16,834 | $ | 16,555 | $ | 16,142 | $ | 15,607 | $ | 15,110 | ||||||||||
| Unfunded loan commitments | $ | 4,443 | $ | 4,725 | $ | 5,000 | $ | 5,138 | $ | 4,473 | ||||||||||
Deposits
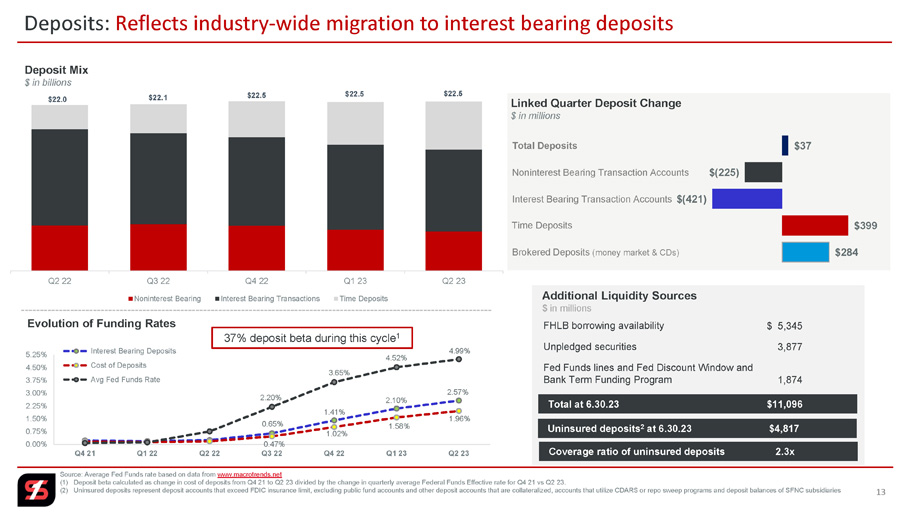
Total deposits at the end of the second quarter of 2023 were $22.5 billion, up slightly from the end of the first quarter of 2023, and up $453 million compared to the second quarter of 2022. Noninterest bearing deposits totaled $5.3 billion at the end of the second quarter of 2023, compared to $5.5 billion at the end of the first quarter of 2023 and $6.1 billion at the end of the second quarter of 2022. Interest bearing transaction accounts totaled $10.9 billion at the end of the second quarter of 2023, compared to $11.3 billion at the end of the first quarter of 2023 and $12.8 billion at the end of the second quarter of 2022. Time deposits totaled $6.4 billion at the end of the second quarter of 2023, compared to $5.7 billion at the end of the first quarter of 2023 and $3.2 billion at the end of the second quarter of 2022. The change in mix of deposits, both on a linked quarter and year-over-year basis, reflects continued customer migration into higher rate deposits, principally certificates of deposits, given the rapid rise in interest rates, as well as increased market competition. The loan to deposit ratio ended the second quarter of 2023 at 75 percent, compared to 74 percent at the end of the first quarter of 2023 and 69 percent at the end of the second quarter of 2022.
| $ in millions | Q2 23 | Q1 23 | Q4 22 | Q3 22 | Q2 22 | |||||||||||||||
| Noninterest bearing deposits | $ | 5,265 | $ | 5,489 | $ | 6,017 | $ | 6,218 | $ | 6,057 | ||||||||||
| Interest bearing transaction accounts | 10,866 | 11,284 | 11,763 | 12,104 | 12,816 | |||||||||||||||
| Time deposits | 6,358 | 5,679 | 4,768 | 3,827 | 3,163 | |||||||||||||||
| Total deposits | $ | 22,489 | $ | 22,452 | $ | 22,548 | $ | 22,149 | $ | 22,036 | ||||||||||
| Noninterest bearing deposits to total deposits | 23 | % | 24 | % | 27 | % | 28 | % | 27 | % | ||||||||||
| Total loans to total deposits | 75 | 74 | 72 | 70 | 69 | |||||||||||||||
Asset Quality
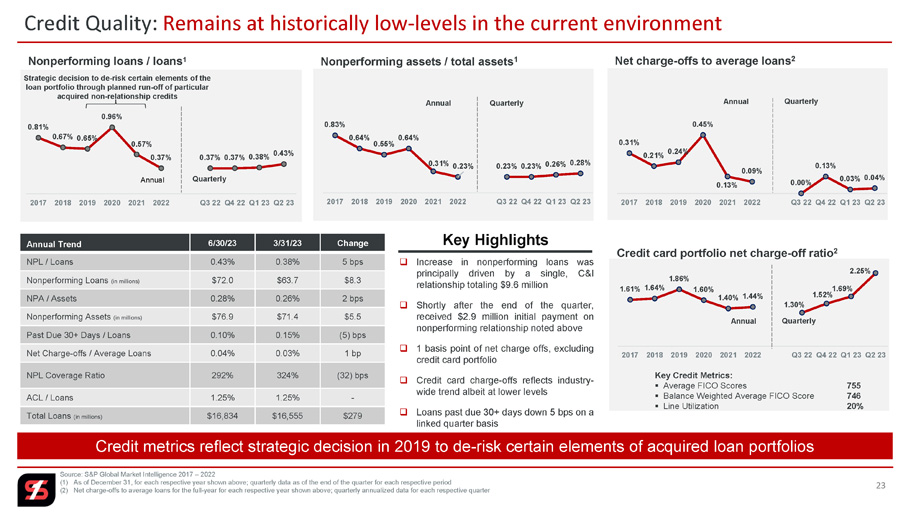
Total nonperforming loans at the end of the second quarter of 2023 were $72.0 million, compared to $63.7 million at the end of the first quarter of 2023 and $63.6 million at the end of the second quarter of 2022. Total nonperforming assets as a percentage of total assets were 0.28 percent at the end of the second quarter of 2023, compared to 0.26 percent at the end of both the first quarter of 2023 and the second quarter of 2022. The increase in nonperforming assets on a linked quarter basis was primarily due to a single, commercial relationship totaling $9.6 million, offset, in part, by a $2.8 million decrease in other nonperforming assets. Shortly after the end of the quarter, an initial payment of $2.9 million was received on the commercial relationship previously noted. Net charge-offs as a percentage of average loans for the second quarter of 2023 were 4 basis points, compared to 3 basis points in the first quarter of 2023 and 2 basis points in the second quarter of 2022. Net charge-offs as a percentage of average total loans, excluding credit cards, were 1 basis point for the second quarter of 2023.
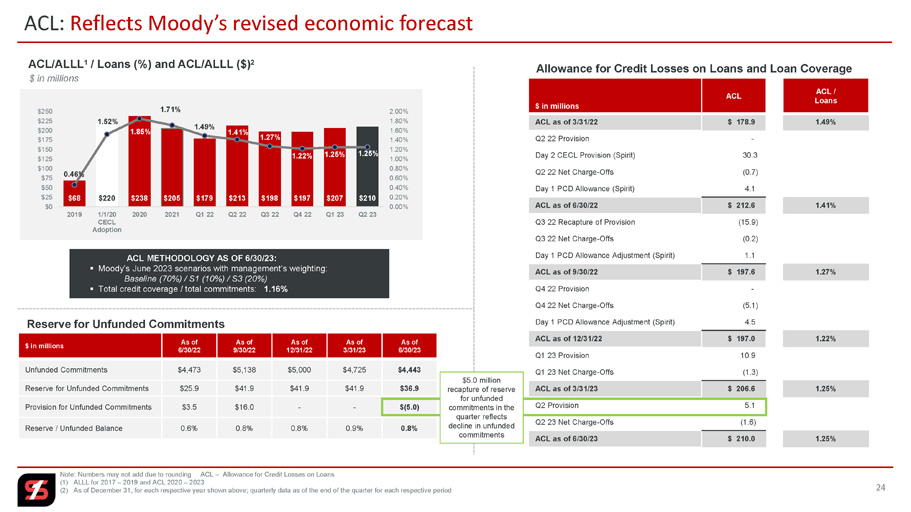
Provision for credit losses totaled $0.1 million in the second quarter of 2023, compared to $33.9 million in the second quarter of 2022. Included in the year ago period was $30.3 million of Day 2 CECL provision recorded in connection with the Company’s acquisition of Spirt of Texas Bancshares, Inc. The allowance for credit losses on loans at the end of the second quarter of 2023 was $210.0 million compared to $206.6 million at the end of the first quarter of 2023 and $212.6 million at the end of the second quarter of 2022. The allowance for credit losses as a percentage of total loans at the end of the second quarter of 2023 was 1.25 percent, unchanged on a linked quarter basis. The nonperforming loan coverage ratio ended the quarter at 292 percent, compared to 324 percent at the end of the first quarter of 2023 and 334 percent at the end of the second quarter of 2022. The reserve for unfunded commitments totaled $36.9 million at the end of the second quarter of 2023, compared to $41.9 million at the end of the first quarter of 2023 and $25.9 million at the end of the second quarter of 2022. The decrease in the reserve for unfunded commitments on a linked quarter basis was primarily due to a decline in unfunded commitments resulting from customers utilizing lines of credit.
| $ in millions | Q2 23 | Q1 23 | Q4 22 | Q3 22 | Q2 22 | |||||||||||||||
| Allowance for credit losses on loans to total loans | 1.25 | % | 1.25 | % | 1.22 | % | 1.27 | % | 1.41 | % | ||||||||||
| Allowance for credit losses on loans to nonperforming loans | 292 | 324 | 334 | 342 | 334 | |||||||||||||||
| Nonperforming loans to total loans | 0.43 | 0.38 | 0.37 | 0.37 | 0.42 | |||||||||||||||
| Net charge-off ratio (annualized) | 0.04 | 0.03 | 0.13 | - | 0.02 | |||||||||||||||
| Net charge-off ratio YTD (annualized) | 0.04 | 0.03 | 0.09 | 0.07 | 0.11 | |||||||||||||||
| Total nonperforming loans | $ | 72.0 | $ | 63.7 | $ | 58.9 | $ | 57.8 | $ | 63.6 | ||||||||||
| Total other nonperforming assets | 4.9 | 7.7 | 3.6 | 4.7 | 6.4 | |||||||||||||||
| Total nonperforming assets | $ | 76.9 | $ | 71.4 | $ | 62.5 | $ | 62.5 | $ | 70.0 | ||||||||||
| Reserve for unfunded commitments | $ | 36.9 | $ | 41.9 | $ | 41.9 | $ | 41.9 | $ | 25.9 | ||||||||||
Capital
Total common stockholders’ equity at the end of the second quarter of 2023 was $3.4 billion, compared to $3.3 billion at the end of both the first quarter of 2023 and the second quarter of 2022. Book value per share at the end of the second quarter of 2023 was $26.59, compared to $26.24 at the end of the first quarter of 2023 and $25.31 at the end of the second quarter of 2022. Tangible book value per share1 was $15.17 at the end of the second quarter of 2023, compared to $14.88 per share at the end of the first quarter of 2023 and $14.07 at the end of the second quarter of 2022. Stockholders’ equity to total assets at June 30, 2023, was 12.0 percent, compared to 12.1 percent at the end of the first quarter of 2023 and unchanged from the levels reported at the end of the second quarter of 2022. Tangible common equity to tangible assets1 was 7.2 percent at June 30, 2023, compared to 7.3 percent at the end of the first quarter of 2023 and 7.0 percent at the end of the second quarter of 2022. All of Simmons’ regulatory capital ratios continue to significantly exceed “well capitalized” guidelines.
| Q2 23 | Q1 23 | Q4 22 | Q3 22 | Q2 22 | ||||||||||||||||
| Stockholders’ equity to total assets | 12.0 | % | 12.1 | % | 11.9 | % | 11.7 | % | 12.0 | % | ||||||||||
| Tangible common equity to tangible assets1 | 7.2 | 7.3 | 7.0 | 6.7 | 7.0 | |||||||||||||||
| Common equity tier 1 (CET1) ratio | 11.9 | 11.9 | 11.9 | 11.7 | 12.1 | |||||||||||||||
| Tier 1 leverage ratio | 9.2 | 9.2 | 9.3 | 9.2 | 9.2 | |||||||||||||||
| Tier 1 risk-based capital ratio | 11.9 | 11.9 | 11.9 | 11.7 | 12.1 | |||||||||||||||
| Total risk-based capital ratio | 14.2 | 14.5 | 14.2 | 14.1 | 14.8 | |||||||||||||||
Share Repurchase Program
During the second quarter of 2023, Simmons repurchased approximately 1.1 million shares of its Class A common stock at an average price of $17.75 under its 2022 stock repurchase program (2022 Program). Remaining authorization under the 2022 Program as of June 30, 2023, was approximately $60 million. Market conditions and our capital needs will drive the decision regarding future stock repurchases; the timing, pricing and amount of any repurchases under the 2022 Program will be determined by Simmons’ management at its discretion; and the 2022 Program does not obligate Simmons to repurchase any common stock and may be modified, discontinued or suspended at any time without prior notice.
__________________________________________________________
(1) Non-GAAP measurement. See “Non-GAAP Financial Measures” and “Reconciliation of Non-GAAP Financial Measures” below
(2) FTE – fully taxable equivalent using an effective tax rate of 26.135%
Conference Call
Management will conduct a live conference call to review this information beginning at 9:00 a.m. Central Time today, Tuesday, July 25, 2023. Interested persons can listen to this call by dialing toll-free 1-844-481-2779 (North America only) and asking for the Simmons First National Corporation conference call, conference ID 10180510. In addition, the call will be available live or in recorded version on Simmons’ website at simmonsbank.com for at least 60 days following the date of the call.
Simmons First National Corporation
Simmons First National Corporation (NASDAQ: SFNC) is a Mid-South based financial holding company that has paid cash dividends to its shareholders for 114 consecutive years. Its principal subsidiary, Simmons Bank, operates 231 branches in Arkansas, Kansas, Missouri, Oklahoma, Tennessee and Texas. Founded in 1903, Simmons Bank offers comprehensive financial solutions delivered with a client-centric approach. In 2023, Simmons Bank was recognized by Forbes as one of America’s Best Midsize Employers and among the World’s Best Banks for the fourth consecutive year. In 2022, Simmons Bank was named to Forbes’ list of "America's Best Banks" for the second consecutive year. Additional information about Simmons Bank can be found on our website at simmonsbank.com, by following @Simmons_Bank on Twitter or by visiting our newsroom.
Non-GAAP Financial Measures
This press release contains financial information determined by methods other than in accordance with U.S. generally accepted accounting principles (GAAP). The Company’s management uses these non-GAAP financial measures in their analysis of the Company’s performance. These measures adjust GAAP performance measures to, among other things, include the tax benefit associated with revenue items that are tax-exempt, as well as exclude from net income (including on a per share diluted basis), pre-tax, pre-provision earnings, net charge-offs, income available to common shareholders, non-interest income, and non-interest expense certain income and expense items attributable to, for example, merger activity (primarily including merger-related expenses and Day 2 CECL provisions), gains and/or losses on sale of branches, net branch right-sizing initiatives, loss on redemption of trust preferred securities and gain on sale of intellectual property. In addition, the Company also presents certain figures based on tangible common stockholders’ equity, tangible assets and tangible book value, which exclude goodwill and other intangible assets. The Company further presents certain figures that are exclusive of the impact of PPP loans, deposits and/or loans acquired through acquisitions, mortgage warehouse loans, and/or energy loans, or gains and/or losses on the sale of securities. The Company’s management believes that these non-GAAP financial measures are useful to investors because they, among other things, present the results of the Company’s ongoing operations without the effect of mergers or other items not central to the Company’s ongoing business, as well as normalize for tax effects, the effects of the PPP, and certain other effects. Management, therefore, believes presentations of these non-GAAP financial measures provide useful supplemental information that is essential to a proper understanding of the operating results of the Company’s ongoing businesses, and management uses these non-GAAP financial measures to assess the performance of the Company’s ongoing businesses as related to prior financial periods. These non-GAAP disclosures should not be viewed as a substitute for operating results determined in accordance with GAAP, nor are they necessarily comparable to non-GAAP performance measures that may be presented by other companies. Where non-GAAP financial measures are used, the comparable GAAP financial measure, as well as the reconciliation to the comparable GAAP financial measure, can be found in the tables of this release.
Forward-Looking Statements
Certain statements in this press release may not be based on historical facts and should be considered “forward-looking statements” within the meaning of the Private Securities Litigation Reform Act of 1995. These forward-looking statements, including, without limitation, statements made in Mr. Fehlman’s quote, may be identified by reference to future periods or by the use of forward-looking terminology, such as “believe,” “budget,” “expect,” “foresee,” “anticipate,” “intend,” “indicate,” “target,” “estimate,” “plan,” “project,” “continue,” “contemplate,” “positions,” “prospects,” “predict,” or “potential,” by future conditional verbs such as “will,” “would,” “should,” “could,” “might” or “may,” or by variations of such words or by similar expressions. These forward-looking statements include, without limitation, statements relating to Simmons’ future growth, business strategies, lending capacity and lending activity, loan demand, revenue, assets, asset quality, profitability, dividends, net interest margin, non-interest revenue, share repurchase program, acquisition strategy, digital banking initiatives, the Company’s ability to recruit and retain key employees, the estimated cost savings associated with the Company’s Better Bank Initiative, the adequacy of the allowance for credit losses, and future economic conditions and interest rates. Any forward-looking statement speaks only as of the date of this news release, and Simmons undertakes no obligation to update these forward-looking statements to reflect events or circumstances that occur after the date of this news release. By nature, forward-looking statements are based on various assumptions and involve inherent risk and uncertainties. Various factors, including, but not limited to, changes in economic conditions, changes in credit quality, changes in interest rates and related governmental policies, changes in loan demand, changes in deposit flows, changes in real estate values, changes in the assumptions used in making the forward-looking statements, changes in the securities markets generally or the price of Simmons’ common stock specifically, and changes in information technology affecting the financial industry; changes in customer behaviors, including consumer spending, borrowing, and saving habits; the effects of the COVID-19 pandemic on, among other things, the Company’s operations, liquidity, and credit quality; general economic and market conditions; market disruptions including pandemics or significant health hazards, severe weather conditions, natural disasters, terrorist activities, financial crises, political crises, war and other military conflicts (including the ongoing military conflict between Russia and Ukraine) or other major events, or the prospect of these events; the soundness of other financial institutions and indirect exposure related to the closings of Silicon Valley Bank (SVB), Signature Bank and Silvergate Bank and their impact on the broader market through other customers, suppliers and partners (or that the conditions which resulted in the liquidity concerns with SVB, Signature Bank and Silvergate Bank may also adversely impact, directly or indirectly, other financial institutions and market participants with which the Company has commercial or deposit relationships); increased inflation; the loss of key employees; increased competition in the markets in which the Company operates; increased unemployment; labor shortages; claims, damages, and fines related to litigation or government actions; changes in accounting principles relating to loan loss recognition (current expected credit losses); the Company’s ability to manage and successfully integrate its mergers and acquisitions and to fully realize cost savings and other benefits associated with those transactions; cyber threats, attacks or events; reliance on third parties for key services; government legislation; and other factors, many of which are beyond the control of the Company, could cause actual results to differ materially from those projected in or contemplated by the forward-looking statements. Additional information on factors that might affect the Company’s financial results is included in the Company’s Form 10-K for the year ended December 31, 2022, the Company’s Form 10-Q for the quarterly period ended March 31, 2023, and other reports that the Company has filed with or furnished to the U.S. Securities and Exchange Commission (the SEC), all of which are available from the SEC on its website, www.sec.gov. In addition, there can be no guarantee that the board of directors (Board) of Simmons will approve a quarterly dividend in future quarters, and the timing, payment, and amount of future dividends (if any) is subject to, among other things, the discretion of the Board and may differ significantly from past dividends.
FOR MORE INFORMATION CONTACT:
Ed Bilek, EVP, Director of Investor and Media Relations
ed.bilek@simmonsbank.com
205.612.3378 (cell)
| Simmons First National Corporation | SFNC | |||||||||||||||||||
| Consolidated End of Period Balance Sheets | ||||||||||||||||||||
| For the Quarters Ended | Jun 30 | Mar 31 | Dec 31 | Sep 30 | Jun 30 | |||||||||||||||
| (Unaudited) | 2023 | 2023 | 2022 | 2022 | 2022 | |||||||||||||||
| ($ in thousands) | ||||||||||||||||||||
| ASSETS | ||||||||||||||||||||
| Cash and noninterest bearing balances due from banks | $ | 181,268 | $ | 199,316 | $ | 200,616 | $ | 175,547 | $ | 193,473 | ||||||||||
| Interest bearing balances due from banks and federal funds sold | 564,644 | 325,135 | 481,506 | 503,863 | 771,374 | |||||||||||||||
| Cash and cash equivalents | 745,912 | 524,451 | 682,122 | 679,410 | 964,847 | |||||||||||||||
| Interest bearing balances due from banks - time | 545 | 795 | 795 | 1,290 | 1,535 | |||||||||||||||
| Investment securities - held-to-maturity | 3,756,754 | 3,765,483 | 3,759,706 | 3,787,076 | 3,819,682 | |||||||||||||||
| Investment securities - available-for-sale | 3,579,758 | 3,755,956 | 3,852,854 | 3,937,543 | 4,341,647 | |||||||||||||||
| Mortgage loans held for sale | 10,342 | 4,244 | 3,486 | 12,759 | 14,437 | |||||||||||||||
| Other loans held for sale | - | - | - | 2,292 | 16,375 | |||||||||||||||
| Loans: | ||||||||||||||||||||
| Loans | 16,833,653 | 16,555,098 | 16,142,124 | 15,607,135 | 15,110,344 | |||||||||||||||
| Allowance for credit losses on loans | (209,966 | ) | (206,557 | ) | (196,955 | ) | (197,589 | ) | (212,611 | ) | ||||||||||
| Net loans | 16,623,687 | 16,348,541 | 15,945,169 | 15,409,546 | 14,897,733 | |||||||||||||||
| Premises and equipment | 562,025 | 564,497 | 548,741 | 549,932 | 553,062 | |||||||||||||||
| Foreclosed assets and other real estate owned | 3,909 | 2,721 | 2,887 | 3,612 | 4,084 | |||||||||||||||
| Interest receivable | 103,431 | 98,775 | 102,892 | 86,637 | 82,332 | |||||||||||||||
| Bank owned life insurance | 494,370 | 493,191 | 491,340 | 488,364 | 486,355 | |||||||||||||||
| Goodwill | 1,320,799 | 1,320,799 | 1,319,598 | 1,309,000 | 1,310,528 | |||||||||||||||
| Other intangible assets | 120,758 | 124,854 | 128,951 | 133,059 | 137,285 | |||||||||||||||
| Other assets | 636,833 | 579,139 | 622,520 | 675,554 | 588,707 | |||||||||||||||
| Total assets | $ | 27,959,123 | $ | 27,583,446 | $ | 27,461,061 | $ | 27,076,074 | $ | 27,218,609 | ||||||||||
| LIABILITIES AND STOCKHOLDERS' EQUITY | ||||||||||||||||||||
| Deposits: | ||||||||||||||||||||
| Noninterest bearing transaction accounts | $ | 5,264,962 | $ | 5,489,434 | $ | 6,016,651 | $ | 6,218,283 | $ | 6,057,186 | ||||||||||
| Interest bearing transaction accounts and savings deposits | 10,866,078 | 11,283,584 | 11,762,885 | 12,103,994 | 12,816,198 | |||||||||||||||
| Time deposits | 6,357,682 | 5,678,757 | 4,768,558 | 3,826,415 | 3,162,479 | |||||||||||||||
| Total deposits | 22,488,722 | 22,451,775 | 22,548,094 | 22,148,692 | 22,035,863 | |||||||||||||||
| Federal funds purchased and securities sold | ||||||||||||||||||||
| under agreements to repurchase | 102,586 | 142,862 | 160,403 | 168,513 | 155,101 | |||||||||||||||
| Other borrowings | 1,373,339 | 1,023,826 | 859,296 | 964,772 | 1,060,244 | |||||||||||||||
| Subordinated notes and debentures | 366,065 | 366,027 | 365,989 | 365,951 | 421,693 | |||||||||||||||
| Accrued interest and other liabilities | 272,085 | 259,055 | 257,917 | 270,995 | 285,813 | |||||||||||||||
| Total liabilities | 24,602,797 | 24,243,545 | 24,191,699 | 23,918,923 | 23,958,714 | |||||||||||||||
| Stockholders' equity: | ||||||||||||||||||||
| Common stock | 1,262 | 1,273 | 1,270 | 1,269 | 1,288 | |||||||||||||||
| Surplus | 2,516,398 | 2,533,589 | 2,530,066 | 2,527,153 | 2,569,060 | |||||||||||||||
| Undivided profits | 1,308,654 | 1,275,720 | 1,255,586 | 1,196,459 | 1,139,975 | |||||||||||||||
| Accumulated other comprehensive (loss) income | (469,988 | ) | (470,681 | ) | (517,560 | ) | (567,730 | ) | (450,428 | ) | ||||||||||
| Total stockholders' equity | 3,356,326 | 3,339,901 | 3,269,362 | 3,157,151 | 3,259,895 | |||||||||||||||
| Total liabilities and stockholders' equity | $ | 27,959,123 | $ | 27,583,446 | $ | 27,461,061 | $ | 27,076,074 | $ | 27,218,609 | ||||||||||
Page 1
| Simmons First National Corporation | SFNC | |||||||||||||||||||
| Consolidated Statements of Income - Quarter-to-Date | ||||||||||||||||||||
| For the Quarters Ended | Jun 30 | Mar 31 | Dec 31 | Sep 30 | Jun 30 | |||||||||||||||
| (Unaudited) | 2023 | 2023 | 2022 | 2022 | 2022 | |||||||||||||||
| ($ in thousands, except per share data) | ||||||||||||||||||||
| INTEREST INCOME | ||||||||||||||||||||
| Loans (including fees) | $ | 244,292 | $ | 227,498 | $ | 216,091 | $ | 187,347 | $ | 163,578 | ||||||||||
| Interest bearing balances due from banks and federal funds sold | 4,023 | 2,783 | 2,593 | 1,141 | 1,117 | |||||||||||||||
| Investment securities | 48,751 | 48,774 | 45,689 | 40,954 | 37,848 | |||||||||||||||
| Mortgage loans held for sale | 154 | 82 | 152 | 178 | 200 | |||||||||||||||
| Other loans held for sale | - | - | 59 | 998 | 2,063 | |||||||||||||||
| TOTAL INTEREST INCOME | 297,220 | 279,137 | 264,584 | 230,618 | 204,806 | |||||||||||||||
| INTEREST EXPENSE | ||||||||||||||||||||
| Time deposits | 53,879 | 39,538 | 22,434 | 8,204 | 2,875 | |||||||||||||||
| Other deposits | 54,485 | 47,990 | 34,615 | 17,225 | 6,879 | |||||||||||||||
| Federal funds purchased and securities | ||||||||||||||||||||
| sold under agreements to repurchase | 318 | 323 | 449 | 305 | 119 | |||||||||||||||
| Other borrowings | 18,612 | 8,848 | 9,263 | 6,048 | 4,844 | |||||||||||||||
| Subordinated notes and debentures | 6,696 | 4,603 | 4,797 | 5,251 | 4,990 | |||||||||||||||
| TOTAL INTEREST EXPENSE | 133,990 | 101,302 | 71,558 | 37,033 | 19,707 | |||||||||||||||
| NET INTEREST INCOME | 163,230 | 177,835 | 193,026 | 193,585 | 185,099 | |||||||||||||||
| PROVISION FOR CREDIT LOSSES | ||||||||||||||||||||
| Provision for credit losses on loans | 5,061 | 10,916 | 26 | (15,897 | ) | 30,406 | ||||||||||||||
| Provision for credit losses on unfunded commitments | (5,000 | ) | - | - | 16,000 | 3,453 | ||||||||||||||
| Provision for credit losses on investment securities - AFS | (1,326 | ) | 12,800 | - | - | - | ||||||||||||||
| Provision for credit losses on investment securities - HTM | 1,326 | 500 | - | - | - | |||||||||||||||
| TOTAL PROVISION FOR CREDIT LOSSES | 61 | 24,216 | 26 | 103 | 33,859 | |||||||||||||||
| NET INTEREST INCOME AFTER PROVISION | ||||||||||||||||||||
| FOR CREDIT LOSSES | 163,169 | 153,619 | 193,000 | 193,482 | 151,240 | |||||||||||||||
| NONINTEREST INCOME | ||||||||||||||||||||
| Service charges on deposit accounts | 12,882 | 12,437 | 11,892 | 12,560 | 11,379 | |||||||||||||||
| Debit and credit card fees | 7,986 | 7,952 | 7,845 | 7,685 | 8,224 | |||||||||||||||
| Wealth management fees | 7,440 | 7,365 | 8,151 | 8,562 | 7,214 | |||||||||||||||
| Mortgage lending income | 2,403 | 1,570 | 1,139 | 2,593 | 2,240 | |||||||||||||||
| Bank owned life insurance income | 2,555 | 2,973 | 2,975 | 2,902 | 2,563 | |||||||||||||||
| Other service charges and fees (includes insurance income) | 2,262 | 2,282 | 2,023 | 2,085 | 1,871 | |||||||||||||||
| Gain (loss) on sale of securities | (391 | ) | - | (52 | ) | (22 | ) | (150 | ) | |||||||||||
| Gain on insurance settlement | - | - | 4,074 | - | - | |||||||||||||||
| Other income | 9,843 | 11,256 | 6,600 | 6,658 | 6,837 | |||||||||||||||
| TOTAL NONINTEREST INCOME | 44,980 | 45,835 | 44,647 | 43,023 | 40,178 | |||||||||||||||
| NONINTEREST EXPENSE | ||||||||||||||||||||
| Salaries and employee benefits | 74,723 | 77,038 | 73,018 | 71,923 | 74,135 | |||||||||||||||
| Occupancy expense, net | 11,410 | 11,578 | 11,620 | 11,674 | 11,004 | |||||||||||||||
| Furniture and equipment expense | 5,128 | 5,051 | 5,392 | 5,394 | 5,104 | |||||||||||||||
| Other real estate and foreclosure expense | 289 | 186 | 350 | 168 | 142 | |||||||||||||||
| Deposit insurance | 5,201 | 4,893 | 3,680 | 3,278 | 2,812 | |||||||||||||||
| Merger-related costs | 19 | 1,396 | 35 | 1,422 | 19,133 | |||||||||||||||
| Other operating expenses | 42,926 | 43,086 | 48,480 | 45,084 | 44,483 | |||||||||||||||
| TOTAL NONINTEREST EXPENSE | 139,696 | 143,228 | 142,575 | 138,943 | 156,813 | |||||||||||||||
| NET INCOME BEFORE INCOME TAXES | 68,453 | 56,226 | 95,072 | 97,562 | 34,605 | |||||||||||||||
| Provision for income taxes | 10,139 | 10,637 | 11,812 | 16,959 | 7,151 | |||||||||||||||
| NET INCOME | $ | 58,314 | $ | 45,589 | $ | 83,260 | $ | 80,603 | $ | 27,454 | ||||||||||
| BASIC EARNINGS PER SHARE | $ | 0.46 | $ | 0.36 | $ | 0.66 | $ | 0.63 | $ | 0.21 | ||||||||||
| DILUTED EARNINGS PER SHARE | $ | 0.46 | $ | 0.36 | $ | 0.65 | $ | 0.63 | $ | 0.21 | ||||||||||
Page 2
| Simmons First National Corporation | SFNC | |||||||||||||||||||
| Consolidated Risk-Based Capital | ||||||||||||||||||||
| For the Quarters Ended | Jun 30 | Mar 31 | Dec 31 | Sep 30 | Jun 30 | |||||||||||||||
| (Unaudited) | 2023 | 2023 | 2022 | 2022 | 2022 | |||||||||||||||
| ($ in thousands) | ||||||||||||||||||||
| Tier 1 capital | ||||||||||||||||||||
| Stockholders' equity | $ | 3,356,326 | $ | 3,339,901 | $ | 3,269,362 | $ | 3,157,151 | $ | 3,259,895 | ||||||||||
| CECL transition provision (1) | 61,746 | 61,746 | 92,619 | 92,619 | 92,619 | |||||||||||||||
| Disallowed intangible assets, net of deferred tax | (1,406,500 | ) | (1,410,141 | ) | (1,412,667 | ) | (1,416,453 | ) | (1,423,323 | ) | ||||||||||
| Unrealized loss (gain) on AFS securities | 469,988 | 470,681 | 517,560 | 567,730 | 450,428 | |||||||||||||||
| Total Tier 1 capital | 2,481,560 | 2,462,187 | 2,466,874 | 2,401,047 | 2,379,619 | |||||||||||||||
| Tier 2 capital | ||||||||||||||||||||
| Subordinated notes and debentures | 366,065 | 366,027 | 365,989 | 365,951 | 421,693 | |||||||||||||||
| Subordinated debt phase out | (66,000 | ) | - | - | - | - | ||||||||||||||
| Qualifying allowance for loan losses and | ||||||||||||||||||||
| reserve for unfunded commitments | 169,409 | 173,077 | 115,627 | 116,257 | 114,733 | |||||||||||||||
| Total Tier 2 capital | 469,474 | 539,104 | 481,616 | 482,208 | 536,426 | |||||||||||||||
| Total risk-based capital | $ | 2,951,034 | $ | 3,001,291 | $ | 2,948,490 | $ | 2,883,255 | $ | 2,916,045 | ||||||||||
| Risk weighted assets | $ | 20,821,075 | $ | 20,748,605 | $ | 20,738,727 | $ | 20,470,918 | $ | 19,669,149 | ||||||||||
| Adjusted average assets for leverage ratio | $ | 26,896,289 | $ | 26,632,691 | $ | 26,407,061 | $ | 25,986,938 | $ | 25,807,113 | ||||||||||
| Ratios at end of quarter | ||||||||||||||||||||
| Equity to assets | 12.00 | % | 12.11 | % | 11.91 | % | 11.66 | % | 11.98 | % | ||||||||||
| Tangible common equity to tangible assets (2) | 7.22 | % | 7.25 | % | 7.00 | % | 6.69 | % | 7.03 | % | ||||||||||
| Common equity Tier 1 ratio (CET1) | 11.92 | % | 11.87 | % | 11.90 | % | 11.73 | % | 12.10 | % | ||||||||||
| Tier 1 leverage ratio | 9.23 | % | 9.24 | % | 9.34 | % | 9.24 | % | 9.22 | % | ||||||||||
| Tier 1 risk-based capital ratio | 11.92 | % | 11.87 | % | 11.90 | % | 11.73 | % | 12.10 | % | ||||||||||
| Total risk-based capital ratio | 14.17 | % | 14.47 | % | 14.22 | % | 14.08 | % | 14.83 | % | ||||||||||
(1) The Company has elected to use the CECL transition provision allowed for in the year of adopting ASC 326.
(2) Calculations of tangible common equity to tangible assets and the reconciliations to GAAP are included in the schedules accompanying this release.
Page 3
| Simmons First National Corporation | SFNC | |||||||||||||||||||
| Consolidated Investment Securities | ||||||||||||||||||||
| For the Quarters Ended | Jun 30 | Mar 31 | Dec 31 | Sep 30 | Jun 30 | |||||||||||||||
| (Unaudited) | 2023 | 2023 | 2022 | 2022 | 2022 | |||||||||||||||
| ($ in thousands) | ||||||||||||||||||||
| Investment Securities - End of Period | ||||||||||||||||||||
| Held-to-Maturity | ||||||||||||||||||||
| U.S. Government agencies | $ | 451,737 | $ | 451,052 | $ | 448,012 | $ | 447,400 | $ | 446,789 | ||||||||||
| Mortgage-backed securities | 1,193,118 | 1,201,418 | 1,190,781 | 1,214,882 | 1,244,713 | |||||||||||||||
| State and political subdivisions | 1,859,022 | 1,859,970 | 1,860,992 | 1,865,203 | 1,868,924 | |||||||||||||||
| Other securities | 252,877 | 253,043 | 259,921 | 259,591 | 259,256 | |||||||||||||||
| Total held-to-maturity (net of credit losses) | 3,756,754 | 3,765,483 | 3,759,706 | 3,787,076 | 3,819,682 | |||||||||||||||
| Available-for-Sale | ||||||||||||||||||||
| U.S. Treasury | $ | 2,209 | $ | 2,220 | $ | 2,197 | $ | 2,191 | $ | 1,441 | ||||||||||
| U.S. Government agencies | 176,564 | 181,843 | 184,279 | 188,060 | 198,333 | |||||||||||||||
| Mortgage-backed securities | 2,282,328 | 2,433,530 | 2,542,902 | 2,670,348 | 2,963,934 | |||||||||||||||
| State and political subdivisions | 885,505 | 895,896 | 871,074 | 822,509 | 915,255 | |||||||||||||||
| Other securities | 233,152 | 242,467 | 252,402 | 254,435 | 262,684 | |||||||||||||||
| Total available-for-sale (net of credit losses) | 3,579,758 | 3,755,956 | 3,852,854 | 3,937,543 | 4,341,647 | |||||||||||||||
| Total investment securities (net of credit losses) | $ | 7,336,512 | $ | 7,521,439 | $ | 7,612,560 | $ | 7,724,619 | $ | 8,161,329 | ||||||||||
| Fair value - HTM investment securities | $ | 3,094,958 | $ | 3,148,976 | $ | 3,063,233 | $ | 2,984,040 | $ | 3,278,962 | ||||||||||
Page 4
| Simmons First National Corporation | SFNC | |||||||||||||||||||
| Consolidated Loans | ||||||||||||||||||||
| For the Quarters Ended | Jun 30 | Mar 31 | Dec 31 | Sep 30 | Jun 30 | |||||||||||||||
| (Unaudited) | 2023 | 2023 | 2022 | 2022 | 2022 | |||||||||||||||
| ($ in thousands) | ||||||||||||||||||||
| Loan Portfolio - End of Period | ||||||||||||||||||||
| Consumer: | ||||||||||||||||||||
| Credit cards | $ | 209,452 | $ | 188,590 | $ | 196,928 | $ | 192,559 | $ | 189,684 | ||||||||||
| Other consumer | 148,333 | 142,817 | 152,882 | 180,604 | 204,692 | |||||||||||||||
| Total consumer | 357,785 | 331,407 | 349,810 | 373,163 | 394,376 | |||||||||||||||
| Real Estate: | ||||||||||||||||||||
| Construction | 2,930,586 | 2,777,122 | 2,566,649 | 2,372,294 | 2,082,688 | |||||||||||||||
| Single-family residential | 2,633,365 | 2,589,831 | 2,546,115 | 2,467,008 | 2,357,942 | |||||||||||||||
| Other commercial real estate | 7,546,130 | 7,520,964 | 7,468,498 | 7,249,891 | 7,082,055 | |||||||||||||||
| Total real estate | 13,110,081 | 12,887,917 | 12,581,262 | 12,089,193 | 11,522,685 | |||||||||||||||
| Commercial: | ||||||||||||||||||||
| Commercial | 2,569,330 | 2,669,731 | 2,632,290 | 2,525,218 | 2,612,256 | |||||||||||||||
| Agricultural | 280,541 | 220,641 | 205,623 | 263,539 | 218,743 | |||||||||||||||
| Total commercial | 2,849,871 | 2,890,372 | 2,837,913 | 2,788,757 | 2,830,999 | |||||||||||||||
| Other | 515,916 | 445,402 | 373,139 | 356,022 | 362,284 | |||||||||||||||
| Total loans | $ | 16,833,653 | $ | 16,555,098 | $ | 16,142,124 | $ | 15,607,135 | $ | 15,110,344 | ||||||||||
Page 5
| Simmons First National Corporation | SFNC | |||||||||||||||||||
| Consolidated Allowance and Asset Quality | ||||||||||||||||||||
| For the Quarters Ended | Jun 30 | Mar 31 | Dec 31 | Sep 30 | Jun 30 | |||||||||||||||
| (Unaudited) | 2023 | 2023 | 2022 | 2022 | 2022 | |||||||||||||||
| ($ in thousands) | ||||||||||||||||||||
| Allowance for Credit Losses on Loans | ||||||||||||||||||||
| Beginning balance | $ | 206,557 | $ | 196,955 | $ | 197,589 | $ | 212,611 | $ | 178,924 | ||||||||||
| Day 1 PCD allowance from acquisitions: | ||||||||||||||||||||
| Spirit of Texas (04/08/2022) | - | - | 4,523 | 1,057 | 4,043 | |||||||||||||||
| Total Day 1 PCD allowance | - | - | 4,523 | 1,057 | 4,043 | |||||||||||||||
| Loans charged off: | ||||||||||||||||||||
| Credit cards | 1,409 | 1,076 | 1,035 | 903 | 1,004 | |||||||||||||||
| Other consumer | 666 | 456 | 439 | 505 | 518 | |||||||||||||||
| Real estate | 435 | 1,204 | 3,392 | 130 | 115 | |||||||||||||||
| Commercial | 1,225 | 413 | 5,389 | 1,874 | 688 | |||||||||||||||
| Total loans charged off | 3,735 | 3,149 | 10,255 | 3,412 | 2,325 | |||||||||||||||
| Recoveries of loans previously charged off: | ||||||||||||||||||||
| Credit cards | 298 | 234 | 251 | 250 | 249 | |||||||||||||||
| Other consumer | 436 | 240 | 230 | 278 | 302 | |||||||||||||||
| Real estate | 878 | 294 | 4,117 | 1,982 | 391 | |||||||||||||||
| Commercial | 471 | 1,067 | 475 | 720 | 621 | |||||||||||||||
| Total recoveries | 2,083 | 1,835 | 5,073 | 3,230 | 1,563 | |||||||||||||||
| Net loans charged off | 1,652 | 1,314 | 5,182 | 182 | 762 | |||||||||||||||
| Provision for credit losses on loans | 5,061 | 10,916 | 25 | (15,897 | ) | 30,406 | ||||||||||||||
| Balance, end of quarter | $ | 209,966 | $ | 206,557 | $ | 196,955 | $ | 197,589 | $ | 212,611 | ||||||||||
| Nonperforming assets | ||||||||||||||||||||
| Nonperforming loans: | ||||||||||||||||||||
| Nonaccrual loans | $ | 71,279 | $ | 63,218 | $ | 58,434 | $ | 57,534 | $ | 62,670 | ||||||||||
| Loans past due 90 days or more | 738 | 437 | 507 | 242 | 904 | |||||||||||||||
| Total nonperforming loans | 72,017 | 63,655 | 58,941 | 57,776 | 63,574 | |||||||||||||||
| Other nonperforming assets: | ||||||||||||||||||||
| Foreclosed assets and other real estate owned | 3,909 | 2,721 | 2,887 | 3,612 | 4,084 | |||||||||||||||
| Other nonperforming assets | 1,013 | 5,012 | 644 | 1,146 | 2,314 | |||||||||||||||
| Total other nonperforming assets | 4,922 | 7,733 | 3,531 | 4,758 | 6,398 | |||||||||||||||
| Total nonperforming assets | $ | 76,939 | $ | 71,388 | $ | 62,472 | $ | 62,534 | $ | 69,972 | ||||||||||
| Performing FDMs (modifications to borrowers | ||||||||||||||||||||
| experiencing financial difficulty) | $ | 2,996 | $ | 2,183 | $ | 1,849 | $ | 1,869 | $ | 2,655 | ||||||||||
| Ratios | ||||||||||||||||||||
| Allowance for credit losses on loans to total loans | 1.25 | % | 1.25 | % | 1.22 | % | 1.27 | % | 1.41 | % | ||||||||||
| Allowance for credit losses to nonperforming loans | 292 | % | 324 | % | 334 | % | 342 | % | 334 | % | ||||||||||
| Nonperforming loans to total loans | 0.43 | % | 0.38 | % | 0.37 | % | 0.37 | % | 0.42 | % | ||||||||||
| Nonperforming assets (including performing FDMs) | ||||||||||||||||||||
| to total assets | 0.29 | % | 0.27 | % | 0.23 | % | 0.24 | % | 0.27 | % | ||||||||||
| Nonperforming assets to total assets | 0.28 | % | 0.26 | % | 0.23 | % | 0.23 | % | 0.26 | % | ||||||||||
| Annualized net charge offs to average loans (QTD) | 0.04 | % | 0.03 | % | 0.13 | % | 0.00 | % | 0.02 | % | ||||||||||
| Annualized net charge offs to average loans (YTD) | 0.04 | % | 0.03 | % | 0.09 | % | 0.07 | % | 0.11 | % | ||||||||||
| Annualized net credit card charge offs to | ||||||||||||||||||||
| average credit card loans (QTD) | 2.25 | % | 1.69 | % | 1.52 | % | 1.30 | % | 1.55 | % | ||||||||||
Page 6
| Simmons First National Corporation | SFNC | |||||||||||||||||||||||||||||||||||
| Consolidated - Average Balance Sheet and Net Interest Income Analysis | ||||||||||||||||||||||||||||||||||||
| For the Quarters Ended | ||||||||||||||||||||||||||||||||||||
| (Unaudited) | ||||||||||||||||||||||||||||||||||||
| Three Months Ended Jun 2023 | Three Months Ended Mar 2023 | Three Months Ended Jun 2022 | ||||||||||||||||||||||||||||||||||
| ($ in thousands) | Average Balance | Income/ Expense | Yield/ Rate | Average Balance | Income/ Expense | Yield/ Rate | Average Balance | Income/ Expense | Yield/ Rate | |||||||||||||||||||||||||||
| ASSETS | ||||||||||||||||||||||||||||||||||||
| Earning assets: | ||||||||||||||||||||||||||||||||||||
| Interest bearing balances due from banks | ||||||||||||||||||||||||||||||||||||
| and federal funds sold | $ | 404,639 | $ | 4,023 | 3.99 | % | $ | 315,307 | $ | 2,783 | 3.58 | % | $ | 777,098 | $ | 1,117 | 0.58 | % | ||||||||||||||||||
| Investment securities - taxable | 4,821,231 | 32,745 | 2.72 | % | 4,930,945 | 32,804 | 2.70 | % | 5,674,470 | 21,794 | 1.54 | % | ||||||||||||||||||||||||
| Investment securities - non-taxable (FTE) | 2,627,192 | 21,253 | 3.24 | % | 2,624,642 | 21,522 | 3.33 | % | 2,725,610 | 21,733 | 3.20 | % | ||||||||||||||||||||||||
| Mortgage loans held for sale | 9,560 | 154 | 6.46 | % | 5,470 | 82 | 6.08 | % | 17,173 | 200 | 4.67 | % | ||||||||||||||||||||||||
| Other loans held for sale | - | - | 0.00 | % | - | - | 0.00 | % | 22,114 | 2,063 | 37.42 | % | ||||||||||||||||||||||||
| Loans - including fees (FTE) | 16,702,403 | 245,151 | 5.89 | % | 16,329,761 | 228,257 | 5.67 | % | 14,478,183 | 163,995 | 4.54 | % | ||||||||||||||||||||||||
| Total interest earning assets (FTE) | 24,565,025 | 303,326 | 4.95 | % | 24,206,125 | 285,448 | 4.78 | % | 23,694,648 | 210,902 | 3.57 | % | ||||||||||||||||||||||||
| Non-earning assets | 3,201,114 | 3,282,607 | 3,074,384 | |||||||||||||||||||||||||||||||||
| Total assets | $ | 27,766,139 | $ | 27,488,732 | $ | 26,769,032 | ||||||||||||||||||||||||||||||
| LIABILITIES AND STOCKHOLDERS' EQUITY | ||||||||||||||||||||||||||||||||||||
| Interest bearing liabilities: | ||||||||||||||||||||||||||||||||||||
| Interest bearing transaction and | ||||||||||||||||||||||||||||||||||||
| savings accounts | $ | 11,011,746 | $ | 54,485 | 1.98 | % | $ | 11,722,591 | $ | 47,990 | 1.66 | % | $ | 12,807,502 | $ | 6,879 | 0.22 | % | ||||||||||||||||||
| Time deposits | 5,911,139 | 53,879 | 3.66 | % | 5,155,055 | 39,538 | 3.11 | % | 2,586,567 | 2,875 | 0.45 | % | ||||||||||||||||||||||||
| Total interest bearing deposits | 16,922,885 | 108,364 | 2.57 | % | 16,877,646 | 87,528 | 2.10 | % | 15,394,069 | 9,754 | 0.25 | % | ||||||||||||||||||||||||
| Federal funds purchased and securities | ||||||||||||||||||||||||||||||||||||
| sold under agreement to repurchase | 119,985 | 318 | 1.06 | % | 148,673 | 323 | 0.88 | % | 210,280 | 119 | 0.23 | % | ||||||||||||||||||||||||
| Other borrowings | 1,449,403 | 18,612 | 5.15 | % | 787,783 | 8,848 | 4.56 | % | 1,241,501 | 4,844 | 1.56 | % | ||||||||||||||||||||||||
| Subordinated notes and debentures | 366,047 | 6,696 | 7.34 | % | 366,009 | 4,603 | 5.10 | % | 418,327 | 4,990 | 4.78 | % | ||||||||||||||||||||||||
| Total interest bearing liabilities | 18,858,320 | 133,990 | 2.85 | % | 18,180,111 | 101,302 | 2.26 | % | 17,264,177 | 19,707 | 0.46 | % | ||||||||||||||||||||||||
| Noninterest bearing liabilities: | ||||||||||||||||||||||||||||||||||||
| Noninterest bearing deposits | 5,276,267 | 5,642,779 | 5,926,304 | |||||||||||||||||||||||||||||||||
| Other liabilities | 272,628 | 295,191 | 216,848 | |||||||||||||||||||||||||||||||||
| Total liabilities | 24,407,215 | 24,118,081 | 23,407,329 | |||||||||||||||||||||||||||||||||
| Stockholders' equity | 3,358,924 | 3,370,651 | 3,361,703 | |||||||||||||||||||||||||||||||||
| Total liabilities and stockholders' equity | $ | 27,766,139 | $ | 27,488,732 | $ | 26,769,032 | ||||||||||||||||||||||||||||||
| Net interest income (FTE) | $ | 169,336 | $ | 184,146 | $ | 191,195 | ||||||||||||||||||||||||||||||
| Net interest spread (FTE) | 2.10 | % | 2.52 | % | 3.11 | % | ||||||||||||||||||||||||||||||
| Net interest margin (FTE) | 2.76 | % | 3.09 | % | 3.24 | % | ||||||||||||||||||||||||||||||
Page 7
| Simmons First National Corporation | SFNC | |||||||||||||||||||
| Consolidated - Selected Financial Data | ||||||||||||||||||||
| For the Quarters Ended | Jun 30 | Mar 31 | Dec 31 | Sep 30 | Jun 30 | |||||||||||||||
| (Unaudited) | 2023 | 2023 | 2022 | 2022 | 2022 | |||||||||||||||
| ($ in thousands, except share data) | ||||||||||||||||||||
| QUARTER-TO-DATE | ||||||||||||||||||||
| Financial Highlights - As Reported | ||||||||||||||||||||
| Net Income | $ | 58,314 | $ | 45,589 | $ | 83,260 | $ | 80,603 | $ | 27,454 | ||||||||||
| Diluted earnings per share | 0.46 | 0.36 | 0.65 | 0.63 | 0.21 | |||||||||||||||
| Return on average assets | 0.84 | % | 0.67 | % | 1.22 | % | 1.19 | % | 0.41 | % | ||||||||||
| Return on average common equity | 6.96 | % | 5.49 | % | 10.27 | % | 9.71 | % | 3.28 | % | ||||||||||
| Return on tangible common equity (non-GAAP) (1) | 12.85 | % | 10.25 | % | 19.29 | % | 17.99 | % | 6.28 | % | ||||||||||
| Net interest margin (FTE) | 2.76 | % | 3.09 | % | 3.31 | % | 3.34 | % | 3.24 | % | ||||||||||
| Efficiency ratio (2) | 65.18 | % | 62.28 | % | 58.33 | % | 57.22 | % | 67.77 | % | ||||||||||
| FTE adjustment | 6,106 | 6,311 | 6,770 | 6,203 | 6,096 | |||||||||||||||
| Average diluted shares outstanding | 127,379,976 | 127,516,478 | 127,505,996 | 128,336,422 | 128,720,078 | |||||||||||||||
| Shares repurchased under plan | 1,128,087 | - | - | 1,883,713 | 2,035,324 | |||||||||||||||
| Average price of shares repurchased | 17.73 | - | - | 23.91 | 24.59 | |||||||||||||||
| Cash dividends declared per common share | 0.200 | 0.200 | 0.190 | 0.190 | 0.190 | |||||||||||||||
| Accretable yield on acquired loans | 2,267 | 2,579 | 4,473 | 5,834 | 9,898 | |||||||||||||||
| Financial Highlights - Adjusted (non-GAAP) (1) | ||||||||||||||||||||
| Adjusted earnings | $ | 61,065 | $ | 47,343 | $ | 81,093 | $ | 82,281 | $ | 68,102 | ||||||||||
| Adjusted diluted earnings per share | 0.48 | 0.37 | 0.64 | 0.64 | 0.53 | |||||||||||||||
| Adjusted return on average assets | 0.88 | % | 0.70 | % | 1.18 | % | 1.21 | % | 1.02 | % | ||||||||||
| Adjusted return on average common equity | 7.29 | % | 5.70 | % | 10.01 | % | 9.92 | % | 8.13 | % | ||||||||||
| Adjusted return on tangible common equity | 13.42 | % | 10.62 | % | 18.81 | % | 18.35 | % | 14.65 | % | ||||||||||
| Adjusted efficiency ratio (2) | 61.29 | % | 59.38 | % | 56.97 | % | 54.41 | % | 56.74 | % | ||||||||||
| YEAR-TO-DATE | ||||||||||||||||||||
| Financial Highlights - GAAP | ||||||||||||||||||||
| Net Income | $ | 103,903 | $ | 45,589 | $ | 256,412 | $ | 173,152 | $ | 92,549 | ||||||||||
| Diluted earnings per share | 0.82 | 0.36 | 2.06 | 1.40 | 0.77 | |||||||||||||||
| Return on average assets | 0.76 | % | 0.67 | % | 0.97 | % | 0.88 | % | 0.72 | % | ||||||||||
| Return on average common equity | 6.23 | % | 5.49 | % | 7.87 | % | 7.07 | % | 5.71 | % | ||||||||||
| Return on tangible common equity (non-GAAP) (1) | 11.55 | % | 10.25 | % | 14.33 | % | 12.77 | % | 10.24 | % | ||||||||||
| Net interest margin (FTE) | 2.92 | % | 3.09 | % | 3.17 | % | 3.12 | % | 3.01 | % | ||||||||||
| Efficiency ratio (2) | 63.68 | % | 62.28 | % | 62.14 | % | 63.54 | % | 67.14 | % | ||||||||||
| FTE adjustment | 12,417 | 6,311 | 24,671 | 17,901 | 11,698 | |||||||||||||||
| Average diluted shares outstanding | 127,421,034 | 127,516,478 | 124,470,184 | 123,387,503 | 120,826,798 | |||||||||||||||
| Cash dividends declared per common share | 0.400 | 0.200 | 0.760 | 0.570 | 0.380 | |||||||||||||||
| Financial Highlights - Adjusted (non-GAAP) (1) | ||||||||||||||||||||
| Adjusted earnings | $ | 108,408 | $ | 47,343 | $ | 298,635 | $ | 217,542 | $ | 135,261 | ||||||||||
| Adjusted diluted earnings per share | 0.85 | 0.37 | 2.40 | 1.76 | 1.12 | |||||||||||||||
| Adjusted return on average assets | 0.79 | % | 0.70 | % | 1.13 | % | 1.11 | % | 1.06 | % | ||||||||||
| Adjusted return on average common equity | 6.50 | % | 5.70 | % | 9.16 | % | 8.88 | % | 8.35 | % | ||||||||||
| Adjusted return on tangible common equity | 12.03 | % | 10.62 | % | 16.59 | % | 15.89 | % | 14.70 | % | ||||||||||
| Adjusted efficiency ratio (2) | 60.30 | % | 59.38 | % | 57.50 | % | 57.69 | % | 59.56 | % | ||||||||||
| END OF PERIOD | ||||||||||||||||||||
| Book value per share | $ | 26.59 | $ | 26.24 | $ | 25.73 | $ | 24.87 | $ | 25.31 | ||||||||||
| Tangible book value per share | 15.17 | 14.88 | 14.33 | 13.51 | 14.07 | |||||||||||||||
| Shares outstanding | 126,224,707 | 127,282,192 | 127,046,654 | 126,943,467 | 128,787,764 | |||||||||||||||
| Full-time equivalent employees | 3,066 | 3,189 | 3,236 | 3,206 | 3,233 | |||||||||||||||
| Total number of financial centers | 231 | 231 | 230 | 230 | 233 | |||||||||||||||
(1) Non-GAAP measurement that management believes aids in the understanding and discussion of results. Reconciliations to GAAP are included in the schedules accompanying this release.
(2) Efficiency ratio is noninterest expense as a percent of net interest income (fully taxable equivalent) and noninterest revenues. Adjusted efficiency ratio is noninterest expense before foreclosed property expense, amortization of intangibles and certain adjusting items as a percent of net interest income (fully taxable equivalent) and noninterest revenues, excluding gains and losses from securities transactions and certain adjusting items, and is a non-GAAP measurement.
Page 8
| Simmons First National Corporation | SFNC | |||||||||||||||||||
| Reconciliation Of Non-GAAP Financial Measures - Adjusted Earnings - Quarter-to-Date | ||||||||||||||||||||
| For the Quarters Ended | Jun 30 | Mar 31 | Dec 31 | Sep 30 | Jun 30 | |||||||||||||||
| (Unaudited) | 2023 | 2023 | 2022 | 2022 | 2022 | |||||||||||||||
| (in thousands, except per share data) | ||||||||||||||||||||
| QUARTER-TO-DATE | ||||||||||||||||||||
| Net income | $ | 58,314 | $ | 45,589 | $ | 83,260 | $ | 80,603 | $ | 27,454 | ||||||||||
| Certain items: | ||||||||||||||||||||
| (Gain) loss from early retirement of TruPS | - | - | - | 365 | - | |||||||||||||||
| Gain on sale of intellectual property | - | - | - | (750 | ) | - | ||||||||||||||
| Gain on insurance settlement | - | - | (4,074 | ) | - | - | ||||||||||||||
| Donation to Simmons First Foundation | - | - | - | - | 1,738 | |||||||||||||||
| Merger related costs | 19 | 1,396 | 35 | 1,422 | 19,133 | |||||||||||||||
| Early retirement program | 3,609 | - | - | - | - | |||||||||||||||
| Branch right sizing (net) | 95 | 979 | 1,104 | 1,235 | 380 | |||||||||||||||
| Day 2 CECL provision | - | - | - | - | 33,779 | |||||||||||||||
| Tax effect (1) | (972 | ) | (621 | ) | 768 | (594 | ) | (14,382 | ) | |||||||||||
| Certain items, net of tax | 2,751 | 1,754 | (2,167 | ) | 1,678 | 40,648 | ||||||||||||||
| Adjusted earnings (non-GAAP) | $ | 61,065 | $ | 47,343 | $ | 81,093 | $ | 82,281 | $ | 68,102 | ||||||||||
| Diluted earnings per share | $ | 0.46 | $ | 0.36 | $ | 0.65 | $ | 0.63 | $ | 0.21 | ||||||||||
| Certain items: | ||||||||||||||||||||
| (Gain) loss from early retirement of TruPS | - | - | - | - | - | |||||||||||||||
| Gain on sale of intellectual property | - | - | - | (0.01 | ) | - | ||||||||||||||
| Gain on insurance settlement | - | - | (0.03 | ) | ||||||||||||||||
| Donation to Simmons First Foundation | - | - | - | - | 0.01 | |||||||||||||||
| Merger related costs | - | 0.01 | - | 0.01 | 0.15 | |||||||||||||||
| Early retirement program | 0.03 | - | - | - | - | |||||||||||||||
| Branch right sizing (net) | - | 0.01 | 0.01 | 0.01 | - | |||||||||||||||
| Day 2 CECL provision | - | - | - | - | 0.27 | |||||||||||||||
| Tax effect (1) | (0.01 | ) | (0.01 | ) | 0.01 | - | (0.11 | ) | ||||||||||||
| Certain items, net of tax | 0.02 | 0.01 | (0.01 | ) | 0.01 | 0.32 | ||||||||||||||
| Adjusted diluted earnings per share (non-GAAP) | $ | 0.48 | $ | 0.37 | $ | 0.64 | $ | 0.64 | $ | 0.53 | ||||||||||
(1) Effective tax rate of 26.135%.
| Reconciliation of Certain Noninterest Income and Expense Items (non-GAAP) | ||||||||||||||||||||
| QUARTER-TO-DATE | ||||||||||||||||||||
| Noninterest income | $ | 44,980 | $ | 45,835 | $ | 44,647 | $ | 43,023 | $ | 40,178 | ||||||||||
| Certain noninterest income items (1) | ||||||||||||||||||||
| Gain on insurance settlement | - | - | (4,074 | ) | - | - | ||||||||||||||
| (Gain) loss from early retirement of TruPS | - | - | - | 365 | - | |||||||||||||||
| Gain on sale of intellectual property | - | - | - | (750 | ) | - | ||||||||||||||
| Branch right sizing income | - | - | - | 65 | 88 | |||||||||||||||
| Adjusted noninterest income (non-GAAP) | $ | 44,980 | $ | 45,835 | $ | 40,573 | $ | 42,703 | $ | 40,266 | ||||||||||
| Other income | $ | 9,843 | $ | 11,256 | $ | 6,600 | $ | 6,658 | $ | 6,837 | ||||||||||
| Certain other income items (1) | ||||||||||||||||||||
| (Gain) loss from early retirement of TruPS | - | - | - | 365 | - | |||||||||||||||
| Gain on sale of intellectual property | - | - | - | (750 | ) | - | ||||||||||||||
| Branch right sizing income | - | - | - | 65 | 88 | |||||||||||||||
| Adjusted other income (non-GAAP) | $ | 9,843 | $ | 11,256 | $ | 6,600 | $ | 6,338 | $ | 6,925 | ||||||||||
| Noninterest expense | $ | 139,696 | $ | 143,228 | $ | 142,575 | $ | 138,943 | $ | 156,813 | ||||||||||
| Certain noninterest expense items (1) | ||||||||||||||||||||
| Merger related costs | (19 | ) | (1,396 | ) | (35 | ) | (1,422 | ) | (19,133 | ) | ||||||||||
| Early retirement program | (3,609 | ) | - | - | - | - | ||||||||||||||
| Donation to Simmons First Foundation | - | - | - | - | (1,738 | ) | ||||||||||||||
| Branch right sizing expense | (95 | ) | (979 | ) | (1,104 | ) | (1,170 | ) | (292 | ) | ||||||||||
| Adjusted noninterest expense (non-GAAP) | $ | 135,973 | $ | 140,853 | $ | 141,436 | $ | 136,351 | $ | 135,650 | ||||||||||
| Salaries and employee benefits | $ | 74,723 | $ | 77,038 | $ | 73,018 | $ | 71,923 | $ | 74,135 | ||||||||||
| Certain salaries and employee benefits items (1) | ||||||||||||||||||||
| Early retirement program | (3,609 | ) | - | - | - | - | ||||||||||||||
| Other | - | - | - | - | - | |||||||||||||||
| Adjusted salaries and employee benefits (non-GAAP) | $ | 71,114 | $ | 77,038 | $ | 73,018 | $ | 71,923 | $ | 74,135 | ||||||||||
| Other operating expenses | $ | 42,926 | $ | 43,086 | $ | 48,480 | $ | 45,084 | $ | 44,483 | ||||||||||
| Certain other operating expenses items (1) | ||||||||||||||||||||
| Donation to Simmons First Foundation | - | - | - | - | (1,738 | ) | ||||||||||||||
| Branch right sizing expense | 53 | (816 | ) | (953 | ) | (973 | ) | (7 | ) | |||||||||||
| Adjusted other operating expenses (non-GAAP) | $ | 42,979 | $ | 42,270 | $ | 47,527 | $ | 44,111 | $ | 42,738 | ||||||||||
(1) Certain items include gain from early retirement of trust preferred securities, gain on sale of intellectual property, gain on insurance settlement, donation to Simmons First Foundation, merger related costs, early retirement program costs, branch right sizing costs and Day 2 CECL provision.
Page 9
| Simmons First National Corporation | SFNC | |||||||||||||||||||
| Reconciliation Of Non-GAAP Financial Measures - Adjusted Earnings - Year-to-Date | ||||||||||||||||||||
| For the Quarters Ended | Jun 30 | Mar 31 | Dec 31 | Sep 30 | Jun 30 | |||||||||||||||
| (Unaudited) | 2023 | 2023 | 2022 | 2022 | 2022 | |||||||||||||||
| (in thousands, except per share data) | ||||||||||||||||||||
| YEAR-TO-DATE | ||||||||||||||||||||
| Net income | $ | 103,903 | $ | 45,589 | $ | 256,412 | $ | 173,152 | $ | 92,549 | ||||||||||
| Certain items: | ||||||||||||||||||||
| (Gain) loss from early retirement of TruPS | - | - | 365 | 365 | - | |||||||||||||||
| Gain on sale of intellectual property | - | - | (750 | ) | (750 | ) | - | |||||||||||||
| Gain on insurance settlement | - | - | (4,074 | ) | - | - | ||||||||||||||
| Donation to Simmons First Foundation | - | - | 1,738 | 1,738 | 1,738 | |||||||||||||||
| Merger related costs | 1,415 | 1,396 | 22,476 | 22,441 | 21,019 | |||||||||||||||
| Early retirement program | 3,609 | - | - | - | - | |||||||||||||||
| Branch right sizing (net) | 1,074 | 979 | 3,628 | 2,524 | 1,289 | |||||||||||||||
| Day 2 CECL provision | - | - | 33,779 | 33,779 | 33,779 | |||||||||||||||
| Tax effect (1) | (1,593 | ) | (621 | ) | (14,939 | ) | (15,707 | ) | (15,113 | ) | ||||||||||
| Certain items, net of tax | 4,505 | 1,754 | 42,223 | 44,390 | 42,712 | |||||||||||||||
| Adjusted earnings (non-GAAP) | $ | 108,408 | $ | 47,343 | $ | 298,635 | $ | 217,542 | $ | 135,261 | ||||||||||
| Diluted earnings per share | $ | 0.82 | $ | 0.36 | $ | 2.06 | $ | 1.40 | $ | 0.77 | ||||||||||
| Certain items: | ||||||||||||||||||||
| (Gain) loss from early retirement of TruPS | - | - | - | - | - | |||||||||||||||
| Gain on sale of intellectual property | - | - | (0.01 | ) | (0.01 | ) | - | |||||||||||||
| Gain on insurance settlement | - | - | (0.03 | ) | - | - | ||||||||||||||
| Donation to Simmons First Foundation | - | - | 0.01 | 0.01 | 0.01 | |||||||||||||||
| Merger related costs | 0.01 | 0.01 | 0.18 | 0.18 | 0.17 | |||||||||||||||
| Early retirement program | 0.03 | - | - | - | - | |||||||||||||||
| Branch right sizing (net) | 0.01 | 0.01 | 0.03 | 0.02 | 0.01 | |||||||||||||||
| Day 2 CECL provision | - | - | 0.28 | 0.28 | 0.28 | |||||||||||||||
| Tax effect (1) | (0.02 | ) | (0.01 | ) | (0.12 | ) | (0.12 | ) | (0.12 | ) | ||||||||||
| Certain items, net of tax | 0.03 | 0.01 | 0.34 | 0.36 | 0.35 | |||||||||||||||
| Adjusted diluted earnings per share (non-GAAP) | $ | 0.85 | $ | 0.37 | $ | 2.40 | $ | 1.76 | $ | 1.12 | ||||||||||
(1) Effective tax rate of 26.135%.
| Reconciliation of Certain Noninterest Income and Expense Items (non-GAAP) | ||||||||||||||||||||
| YEAR-TO-DATE | ||||||||||||||||||||
| Noninterest income | $ | 90,815 | $ | 45,835 | $ | 170,066 | $ | 125,419 | $ | 82,396 | ||||||||||
| Certain noninterest income items (1) | ||||||||||||||||||||
| Gain on insurance settlement | - | - | (4,074 | ) | - | - | ||||||||||||||
| (Gain) loss from early retirement of TruPS | - | - | 365 | 365 | - | |||||||||||||||
| Gain on sale of intellectual property | - | - | (750 | ) | (750 | ) | - | |||||||||||||
| Branch right sizing income | - | - | 153 | 153 | 88 | |||||||||||||||
| Adjusted noninterest income (non-GAAP) | $ | 90,815 | $ | 45,835 | $ | 165,760 | $ | 125,187 | $ | 82,484 | ||||||||||
| Other income | $ | 21,099 | $ | 11,256 | $ | 27,361 | $ | 20,761 | $ | 14,103 | ||||||||||
| Certain other income items (1) | ||||||||||||||||||||
| (Gain) loss from early retirement of TruPS | - | - | 365 | 365 | - | |||||||||||||||
| Gain on sale of intellectual property | - | - | (750 | ) | (750 | ) | - | |||||||||||||
| Branch right sizing income | - | - | 153 | 153 | 88 | |||||||||||||||
| Adjusted other income (non-GAAP) | $ | 21,099 | $ | 11,256 | $ | 27,129 | $ | 20,529 | $ | 14,191 | ||||||||||
| Noninterest expense | $ | 282,924 | $ | 143,228 | $ | 566,748 | $ | 424,173 | $ | 285,230 | ||||||||||
| Certain noninterest expense items (1) | ||||||||||||||||||||
| Merger related costs | (1,415 | ) | (1,396 | ) | (22,476 | ) | (22,441 | ) | (21,019 | ) | ||||||||||
| Early retirement program | (3,609 | ) | - | - | - | - | ||||||||||||||
| Donation to Simmons First Foundation | - | - | (1,738 | ) | (1,738 | ) | (1,738 | ) | ||||||||||||
| Branch right sizing expense | (1,074 | ) | (979 | ) | (3,475 | ) | (2,371 | ) | (1,201 | ) | ||||||||||
| Adjusted noninterest expense (non-GAAP) | $ | 276,826 | $ | 140,853 | $ | 539,059 | $ | 397,623 | $ | 261,272 | ||||||||||
| Salaries and employee benefits | $ | 151,761 | $ | 77,038 | $ | 286,982 | $ | 213,964 | $ | 142,041 | ||||||||||
| Certain salaries and employee benefits items (1) | ||||||||||||||||||||
| Early retirement program | (3,609 | ) | - | - | - | - | ||||||||||||||
| Other | - | - | - | - | - | |||||||||||||||
| Adjusted salaries and employee benefits (non-GAAP) | $ | 148,152 | $ | 77,038 | $ | 286,982 | $ | 213,964 | $ | 142,041 | ||||||||||
| Other operating expenses | $ | 86,012 | $ | 43,086 | $ | 179,693 | $ | 131,213 | $ | 86,129 | ||||||||||
| Certain other operating expenses items (1) | ||||||||||||||||||||
| Donation to Simmons First Foundation | - | - | (1,738 | ) | (1,738 | ) | (1,738 | ) | ||||||||||||
| Branch right sizing expense | (763 | ) | (816 | ) | (2,650 | ) | (1,697 | ) | (724 | ) | ||||||||||
| Adjusted other operating expenses (non-GAAP) | $ | 85,249 | $ | 42,270 | $ | 175,305 | $ | 127,778 | $ | 83,667 | ||||||||||
(1) Certain items include gain from early retirement of trust preferred securities, gain on sale of intellectual property, gain on insurance settlement, donation to Simmons First Foundation, merger related costs, early retirement program costs, branch right sizing costs and Day 2 CECL provision.
Page 10
| Simmons First National Corporation | SFNC | |||||||||||||||||||
| Reconciliation Of Non-GAAP Financial Measures - End of Period | ||||||||||||||||||||
| For the Quarters Ended | Jun 30 | Mar 31 | Dec 31 | Sep 30 | Jun 30 | |||||||||||||||
| (Unaudited) | 2023 | 2023 | 2022 | 2022 | 2022 | |||||||||||||||
| ($ in thousands, except per share data) | ||||||||||||||||||||
| Calculation of Tangible Common Equity and the Ratio of Tangible Common Equity to Tangible Assets | ||||||||||||||||||||
| Total common stockholders' equity | $ | 3,356,326 | $ | 3,339,901 | $ | 3,269,362 | $ | 3,157,151 | $ | 3,259,895 | ||||||||||
| Intangible assets: | ||||||||||||||||||||
| Goodwill | (1,320,799 | ) | (1,320,799 | ) | (1,319,598 | ) | (1,309,000 | ) | (1,310,528 | ) | ||||||||||
| Other intangible assets | (120,758 | ) | (124,854 | ) | (128,951 | ) | (133,059 | ) | (137,285 | ) | ||||||||||
| Total intangibles | (1,441,557 | ) | (1,445,653 | ) | (1,448,549 | ) | (1,442,059 | ) | (1,447,813 | ) | ||||||||||
| Tangible common stockholders' equity | $ | 1,914,769 | $ | 1,894,248 | $ | 1,820,813 | $ | 1,715,092 | $ | 1,812,082 | ||||||||||
| Total assets | $ | 27,959,123 | $ | 27,583,446 | $ | 27,461,061 | $ | 27,076,074 | $ | 27,218,609 | ||||||||||
| Intangible assets: | ||||||||||||||||||||
| Goodwill | (1,320,799 | ) | (1,320,799 | ) | (1,319,598 | ) | (1,309,000 | ) | (1,310,528 | ) | ||||||||||
| Other intangible assets | (120,758 | ) | (124,854 | ) | (128,951 | ) | (133,059 | ) | (137,285 | ) | ||||||||||
| Total intangibles | (1,441,557 | ) | (1,445,653 | ) | (1,448,549 | ) | (1,442,059 | ) | (1,447,813 | ) | ||||||||||
| Tangible assets | $ | 26,517,566 | $ | 26,137,793 | $ | 26,012,512 | $ | 25,634,015 | $ | 25,770,796 | ||||||||||
| Ratio of common equity to assets | 12.00 | % | 12.11 | % | 11.91 | % | 11.66 | % | 11.98 | % | ||||||||||
| Ratio of tangible common equity to tangible assets | 7.22 | % | 7.25 | % | 7.00 | % | 6.69 | % | 7.03 | % | ||||||||||
| Calculation of Tangible Book Value per Share | ||||||||||||||||||||
| Total common stockholders' equity | $ | 3,356,326 | $ | 3,339,901 | $ | 3,269,362 | $ | 3,157,151 | $ | 3,259,895 | ||||||||||
| Intangible assets: | ||||||||||||||||||||
| Goodwill | (1,320,799 | ) | (1,320,799 | ) | (1,319,598 | ) | (1,309,000 | ) | (1,310,528 | ) | ||||||||||
| Other intangible assets | (120,758 | ) | (124,854 | ) | (128,951 | ) | (133,059 | ) | (137,285 | ) | ||||||||||
| Total intangibles | (1,441,557 | ) | (1,445,653 | ) | (1,448,549 | ) | (1,442,059 | ) | (1,447,813 | ) | ||||||||||
| Tangible common stockholders' equity | $ | 1,914,769 | $ | 1,894,248 | $ | 1,820,813 | $ | 1,715,092 | $ | 1,812,082 | ||||||||||
| Shares of common stock outstanding | 126,224,707 | 127,282,192 | 127,046,654 | 126,943,467 | 128,787,764 | |||||||||||||||
| Book value per common share | $ | 26.59 | $ | 26.24 | $ | 25.73 | $ | 24.87 | $ | 25.31 | ||||||||||
| Tangible book value per common share | $ | 15.17 | $ | 14.88 | $ | 14.33 | $ | 13.51 | $ | 14.07 | ||||||||||
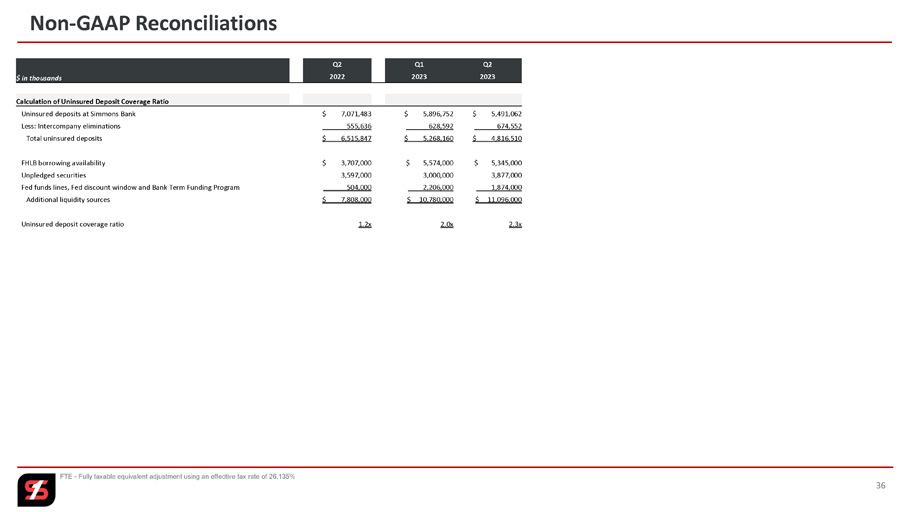
| Calculation of Uninsured Deposit Coverage Ratio | ||||||||||||||||||||
| Uninsured deposits at Simmons Bank | $ | 5,491,062 | $ | 5,896,752 | $ | 7,267,220 | $ | 7,071,483 | ||||||||||||
| Less: Intercompany eliminations | 674,552 | 628,592 | 527,542 | 555,636 | ||||||||||||||||
| Total uninsured deposits | $ | 4,816,510 | $ | 5,268,160 | $ | 6,739,678 | $ | 6,515,847 | ||||||||||||
| FHLB borrowing availability | $ | 5,345,000 | $ | 5,574,000 | $ | 5,442,000 | $ | 3,707,000 | ||||||||||||
| Unpledged securities | 3,877,000 | 3,000,000 | 3,180,000 | 3,597,000 | ||||||||||||||||
| Fed funds lines, Fed discount window and | ||||||||||||||||||||
| Bank Term Funding Program | 1,874,000 | 2,206,000 | 1,982,000 | 504,000 | ||||||||||||||||
| Additional liquidity sources | $ | 11,096,000 | $ | 10,780,000 | $ | 10,604,000 | $ | 7,808,000 | ||||||||||||
| Uninsured deposit coverage ratio | 2.3 | 2.0 | 1.6 | 1.2 | ||||||||||||||||
Page 11
| Simmons First National Corporation | SFNC | |||||||||||||||||||
| Reconciliation Of Non-GAAP Financial Measures - Quarter-to-Date | ||||||||||||||||||||
| For the Quarters Ended | Jun 30 | Mar 31 | Dec 31 | Sep 30 | Jun 30 | |||||||||||||||
| (Unaudited) | 2023 | 2023 | 2022 | 2022 | 2022 | |||||||||||||||
| ($ in thousands) | ||||||||||||||||||||
| Calculation of Adjusted Return on Average Assets | ||||||||||||||||||||
| Net income | $ | 58,314 | $ | 45,589 | $ | 83,260 | $ | 80,603 | $ | 27,454 | ||||||||||
| Certain items (non-GAAP) | ||||||||||||||||||||
| (Gain) loss from early retirement of TruPS | - | - | - | 365 | - | |||||||||||||||
| Gain on sale of intellectual property | - | - | - | (750 | ) | - | ||||||||||||||
| Gain on insurance settlement | - | - | (4,074 | ) | - | - | ||||||||||||||
| Donation to Simmons First Foundation | - | - | - | - | 1,738 | |||||||||||||||
| Merger related costs | 19 | 1,396 | 35 | 1,422 | 19,133 | |||||||||||||||
| Early retirement program | 3,609 | - | - | - | - | |||||||||||||||
| Branch right sizing (net) | 95 | 979 | 1,104 | 1,235 | 380 | |||||||||||||||
| Day 2 CECL provision | - | - | - | - | 33,779 | |||||||||||||||
| Tax effect of certain items (2) | (972 | ) | (621 | ) | 768 | (594 | ) | (14,382 | ) | |||||||||||
| Adjusted earnings (non-GAAP) | $ | 61,065 | $ | 47,343 | $ | 81,093 | $ | 82,281 | $ | 68,102 | ||||||||||
| Average total assets | $ | 27,766,139 | $ | 27,488,732 | $ | 27,180,575 | $ | 26,868,731 | $ | 26,769,032 | ||||||||||
| Return on average assets | 0.84 | % | 0.67 | % | 1.22 | % | 1.19 | % | 0.41 | % | ||||||||||
| Adjusted return on average assets (non-GAAP) | 0.88 | % | 0.70 | % | 1.18 | % | 1.21 | % | 1.02 | % | ||||||||||
| Calculation of Return on Tangible Common Equity | ||||||||||||||||||||
| Net income available to common stockholders | $ | 58,314 | $ | 45,589 | $ | 83,260 | $ | 80,603 | $ | 27,454 | ||||||||||
| Amortization of intangibles, net of taxes | 3,026 | 3,026 | 3,035 | 3,121 | 3,025 | |||||||||||||||
| Total income available to common stockholders | $ | 61,340 | $ | 48,615 | $ | 86,295 | $ | 83,724 | $ | 30,479 | ||||||||||
| Certain items (non-GAAP) | ||||||||||||||||||||
| (Gain) loss from early retirement of TruPS | - | - | - | 365 | - | |||||||||||||||
| Gain on sale of intellectual property | - | - | - | (750 | ) | - | ||||||||||||||
| Gain on insurance settlement | - | - | (4,074 | ) | - | - | ||||||||||||||
| Donation to Simmons First Foundation | - | - | - | - | 1,738 | |||||||||||||||
| Merger related costs | 19 | 1,396 | 35 | 1,422 | 19,133 | |||||||||||||||
| Early retirement program | 3,609 | - | - | - | - | |||||||||||||||
| Branch right sizing (net) | 95 | 979 | 1,104 | 1,235 | 380 | |||||||||||||||
| Day 2 CECL provision | - | - | - | - | 33,779 | |||||||||||||||
| Tax effect of certain items (2) | (972 | ) | (621 | ) | 768 | (594 | ) | (14,382 | ) | |||||||||||
| Adjusted earnings (non-GAAP) | 61,065 | 47,343 | 81,093 | 82,281 | 68,102 | |||||||||||||||
| Amortization of intangibles, net of taxes | 3,026 | 3,026 | 3,035 | 3,121 | 3,025 | |||||||||||||||
| Total adjusted earnings available to common stockholders (non-GAAP) | $ | 64,091 | $ | 50,369 | $ | 84,128 | $ | 85,402 | $ | 71,127 | ||||||||||
| Average common stockholders' equity | $ | 3,358,924 | $ | 3,370,651 | $ | 3,214,912 | $ | 3,292,071 | $ | 3,361,703 | ||||||||||
| Average intangible assets: | ||||||||||||||||||||
| Goodwill | (1,320,799 | ) | (1,319,624 | ) | (1,309,124 | ) | (1,309,804 | ) | (1,299,821 | ) | ||||||||||
| Other intangibles | (123,173 | ) | (127,394 | ) | (131,229 | ) | (135,718 | ) | (114,195 | ) | ||||||||||
| Total average intangibles | (1,443,972 | ) | (1,447,018 | ) | (1,440,353 | ) | (1,445,522 | ) | (1,414,016 | ) | ||||||||||
| Average tangible common stockholders' equity (non-GAAP) | $ | 1,914,952 | $ | 1,923,633 | $ | 1,774,559 | $ | 1,846,549 | $ | 1,947,687 | ||||||||||
| Return on average common equity | 6.96 | % | 5.49 | % | 10.27 | % | 9.71 | % | 3.28 | % | ||||||||||
| Return on tangible common equity | 12.85 | % | 10.25 | % | 19.29 | % | 17.99 | % | 6.28 | % | ||||||||||
| Adjusted return on average common equity (non-GAAP) | 7.29 | % | 5.70 | % | 10.01 | % | 9.92 | % | 8.13 | % | ||||||||||
| Adjusted return on tangible common equity (non-GAAP) | 13.42 | % | 10.62 | % | 18.81 | % | 18.35 | % | 14.65 | % | ||||||||||
| Calculation of Efficiency Ratio and Adjusted Efficiency Ratio (1) | ||||||||||||||||||||
| Noninterest expense (efficiency ratio numerator) | $ | 139,696 | $ | 143,228 | $ | 142,575 | $ | 138,943 | $ | 156,813 | ||||||||||
| Certain noninterest expense items (non-GAAP) | ||||||||||||||||||||
| Merger related costs | (19 | ) | (1,396 | ) | (35 | ) | (1,422 | ) | (19,133 | ) | ||||||||||
| Early retirement program | (3,609 | ) | - | - | - | - | ||||||||||||||
| Donation to Simmons First Foundation | - | - | - | - | (1,738 | ) | ||||||||||||||
| Branch right sizing expense | (95 | ) | (979 | ) | (1,104 | ) | (1,170 | ) | (292 | ) | ||||||||||
| Other real estate and foreclosure expense adjustment | (289 | ) | (186 | ) | (350 | ) | (168 | ) | (142 | ) | ||||||||||
| Amortization of intangibles adjustment | (4,098 | ) | (4,096 | ) | (4,108 | ) | (4,225 | ) | (4,096 | ) | ||||||||||
| Adjusted efficiency ratio numerator | $ | 131,586 | $ | 136,571 | $ | 136,978 | $ | 131,958 | $ | 131,412 | ||||||||||
| Net interest income | $ | 163,230 | $ | 177,835 | $ | 193,026 | $ | 193,585 | $ | 185,099 | ||||||||||
| Noninterest income | 44,980 | 45,835 | 44,647 | 43,023 | 40,178 | |||||||||||||||
| Fully tax-equivalent adjustment (effective tax rate of 26.135%) | 6,106 | 6,311 | 6,770 | 6,203 | 6,096 | |||||||||||||||
| Efficiency ratio denominator | 214,316 | 229,981 | 244,443 | 242,811 | 231,373 | |||||||||||||||
| Certain noninterest income items (non-GAAP) | ||||||||||||||||||||
| Gain on insurance settlement | - | - | (4,074 | ) | - | - | ||||||||||||||
| (Gain) loss from early retirement of TruPS | - | - | - | 365 | - | |||||||||||||||
| Gain on sale of intellectual property | - | - | - | (750 | ) | - | ||||||||||||||
| Branch right sizing income | - | - | - | 65 | 88 | |||||||||||||||
| (Gain) loss on sale of securities | 391 | - | 52 | 22 | 150 | |||||||||||||||
| Adjusted efficiency ratio denominator | $ | 214,707 | $ | 229,981 | $ | 240,421 | $ | 242,513 | $ | 231,611 | ||||||||||
| Efficiency ratio (1) | 65.18 | % | 62.28 | % | 58.33 | % | 57.22 | % | 67.77 | % | ||||||||||
| Adjusted efficiency ratio (non-GAAP) (1) | 61.29 | % | 59.38 | % | 56.97 | % | 54.41 | % | 56.74 | % | ||||||||||
(1) Efficiency ratio is noninterest expense as a percent of net interest income (fully taxable equivalent) and noninterest revenues. Adjusted efficiency ratio is noninterest expense before foreclosed property expense, amortization of intangibles and certain adjusting items as a percent of net interest income (fully taxable equivalent) and noninterest revenues, excluding gains and losses from securities transactions and certain adjusting items, and is a non-GAAP measurement.
(2) Effective tax rate of 26.135%.
Page 12
| Simmons First National Corporation | SFNC | |||||||||||||||||||
| Reconciliation Of Non-GAAP Financial Measures - Quarter-to-Date (continued) | ||||||||||||||||||||
| For the Quarters Ended | Jun 30 | Mar 31 | Dec 31 | Sep 30 | Jun 30 | |||||||||||||||
| (Unaudited) | 2023 | 2023 | 2022 | 2022 | 2022 | |||||||||||||||
| ($ in thousands) | ||||||||||||||||||||
| Calculation of Pre-Provision Net Revenue (PPNR) | ||||||||||||||||||||
| Net interest income | $ | 163,230 | $ | 177,835 | $ | 193,026 | $ | 193,585 | $ | 185,099 | ||||||||||
| Noninterest income | 44,980 | 45,835 | 44,647 | 43,023 | 40,178 | |||||||||||||||
| Revenue | 208,210 | 223,670 | 237,673 | 236,608 | 225,277 | |||||||||||||||
| Less: Gain (loss) on sale of securities | (391 | ) | - | (52 | ) | (22 | ) | (150 | ) | |||||||||||
| Less: Noninterest expense | 139,696 | 143,228 | 142,575 | 138,943 | 156,813 | |||||||||||||||
| Pre-Provision Net Revenue (PPNR) | $ | 68,905 | $ | 80,442 | $ | 95,150 | $ | 97,687 | $ | 68,614 | ||||||||||
| Calculation of Adjusted Pre-Provision Net Revenue | ||||||||||||||||||||
| Pre-Provision Net Revenue (PPNR) | $ | 68,905 | $ | 80,442 | $ | 95,150 | $ | 97,687 | $ | 68,614 | ||||||||||
| Plus: Loss from early retirement of TruPS | - | - | - | 365 | - | |||||||||||||||
| Less: Gain on sale of intellectual property | - | - | - | (750 | ) | - | ||||||||||||||
| Less: Gain on insurance settlement | - | - | (4,074 | ) | - | - | ||||||||||||||
| Plus: Donation to Simmons First Foundation | - | - | - | - | 1,738 | |||||||||||||||
| Plus: Merger related costs | 19 | 1,396 | 35 | 1,422 | 19,133 | |||||||||||||||
| Plus: Early retirement program costs | 3,609 | - | - | - | - | |||||||||||||||
| Plus: Branch right sizing costs | 95 | 979 | 1,104 | 1,235 | 380 | |||||||||||||||
| Adjusted Pre-Provision Net Revenue | $ | 72,628 | $ | 82,817 | $ | 92,215 | $ | 99,959 | $ | 89,865 | ||||||||||
Page 13
| Simmons First National Corporation | SFNC | |||||||||||||||||||
| Reconciliation Of Non-GAAP Financial Measures - Year-to-Date | ||||||||||||||||||||
| For the Quarters Ended | Jun 30 | Mar 31 | Dec 31 | Sep 30 | Jun 30 | |||||||||||||||
| (Unaudited) | 2023 | 2023 | 2022 | 2022 | 2022 | |||||||||||||||
| ($ in thousands) | ||||||||||||||||||||
| Calculation of Adjusted Return on Average Assets | ||||||||||||||||||||
| Net income | $ | 103,903 | $ | 45,589 | $ | 256,412 | $ | 173,152 | $ | 92,549 | ||||||||||
| Certain items (non-GAAP) | ||||||||||||||||||||
| (Gain) loss from early retirement of TruPS | - | - | 365 | 365 | - | |||||||||||||||
| Gain on sale of intellectual property | - | - | (750 | ) | (750 | ) | - | |||||||||||||
| Gain on insurance settlement | - | - | (4,074 | ) | - | - | ||||||||||||||
| Donation to Simmons First Foundation | - | - | 1,738 | 1,738 | 1,738 | |||||||||||||||
| Merger related costs | 1,415 | 1,396 | 22,476 | 22,441 | 21,019 | |||||||||||||||
| Early retirement program | 3,609 | - | - | - | - | |||||||||||||||
| Branch right sizing (net) | 1,074 | 979 | 3,628 | 2,524 | 1,289 | |||||||||||||||
| Day 2 CECL provision | - | - | 33,779 | 33,779 | 33,779 | |||||||||||||||
| Tax effect of certain items (2) | (1,593 | ) | (621 | ) | (14,939 | ) | (15,707 | ) | (15,113 | ) | ||||||||||
| Adjusted earnings (non-GAAP) | $ | 108,408 | $ | 47,343 | $ | 298,635 | $ | 217,542 | $ | 135,261 | ||||||||||
| Average total assets | $ | 27,628,202 | $ | 27,488,732 | $ | 26,418,838 | $ | 26,162,136 | $ | 25,802,982 | ||||||||||
| Return on average assets | 0.76 | % | 0.67 | % | 0.97 | % | 0.88 | % | 0.72 | % | ||||||||||
| Adjusted return on average assets (non-GAAP) | 0.79 | % | 0.70 | % | 1.13 | % | 1.11 | % | 1.06 | % | ||||||||||
| Calculation of Return on Tangible Common Equity | ||||||||||||||||||||
| Net income available to common stockholders | $ | 103,903 | $ | 45,589 | $ | 256,412 | $ | 173,152 | $ | 92,549 | ||||||||||
| Amortization of intangibles, net of taxes | 6,052 | 3,026 | 11,756 | 8,721 | 5,600 | |||||||||||||||
| Total income available to common stockholders | $ | 109,955 | $ | 48,615 | $ | 268,168 | $ | 181,873 | $ | 98,149 | ||||||||||
| Certain items (non-GAAP) | ||||||||||||||||||||
| (Gain) loss from early retirement of TruPS | $ | - | $ | - | $ | 365 | $ | 365 | $ | - | ||||||||||
| Gain on sale of intellectual property | - | - | (750 | ) | (750 | ) | - | |||||||||||||
| Gain on insurance settlement | - | - | (4,074 | ) | - | - | ||||||||||||||
| Donation to Simmons First Foundation | - | - | 1,738 | 1,738 | 1,738 | |||||||||||||||
| Merger related costs | 1,415 | 1,396 | 22,476 | 22,441 | 21,019 | |||||||||||||||
| Early retirement program | 3,609 | - | - | - | - | |||||||||||||||
| Branch right sizing (net) | 1,074 | 979 | 3,628 | 2,524 | 1,289 | |||||||||||||||
| Day 2 CECL provision | - | - | 33,779 | 33,779 | 33,779 | |||||||||||||||
| Tax effect of certain items (2) | (1,593 | ) | (621 | ) | (14,939 | ) | (15,707 | ) | (15,113 | ) | ||||||||||
| Adjusted earnings (non-GAAP) | 108,408 | 47,343 | 298,635 | 217,542 | 135,261 | |||||||||||||||
| Amortization of intangibles, net of taxes | 6,052 | 3,026 | 11,756 | 8,721 | 5,600 | |||||||||||||||
| Total adjusted earnings available to common stockholders (non-GAAP) | $ | 114,460 | $ | 50,369 | $ | 310,391 | $ | 226,263 | $ | 140,861 | ||||||||||
| Average common stockholders' equity | $ | 3,364,755 | $ | 3,370,651 | $ | 3,259,664 | $ | 3,274,743 | $ | 3,265,935 | ||||||||||
| Average intangible assets: | ||||||||||||||||||||
| Goodwill | (1,320,215 | ) | (1,319,624 | ) | (1,266,762 | ) | (1,252,486 | ) | (1,223,352 | ) | ||||||||||
| Other intangibles | (125,272 | ) | (127,394 | ) | (121,622 | ) | (118,385 | ) | (109,575 | ) | ||||||||||
| Total average intangibles | (1,445,487 | ) | (1,447,018 | ) | (1,388,384 | ) | (1,370,871 | ) | (1,332,927 | ) | ||||||||||
| Average tangible common stockholders' equity (non-GAAP) | $ | 1,919,268 | $ | 1,923,633 | $ | 1,871,280 | $ | 1,903,872 | $ | 1,933,008 | ||||||||||
| Return on average common equity | 6.23 | % | 5.49 | % | 7.87 | % | 7.07 | % | 5.71 | % | ||||||||||
| Return on tangible common equity | 11.55 | % | 10.25 | % | 14.33 | % | 12.77 | % | 10.24 | % | ||||||||||
| Adjusted return on average common equity (non-GAAP) | 6.50 | % | 5.70 | % | 9.16 | % | 8.88 | % | 8.35 | % | ||||||||||
| Adjusted return on tangible common equity (non-GAAP) | 12.03 | % | 10.62 | % | 16.59 | % | 15.89 | % | 14.70 | % | ||||||||||
| Calculation of Efficiency Ratio and Adjusted Efficiency Ratio (1) | ||||||||||||||||||||
| Noninterest expense (efficiency ratio numerator) | $ | 282,924 | $ | 143,228 | $ | 566,748 | $ | 424,173 | $ | 285,230 | ||||||||||
| Certain noninterest expense items (non-GAAP) | ||||||||||||||||||||
| Merger related costs | (1,415 | ) | (1,396 | ) | (22,476 | ) | (22,441 | ) | (21,019 | ) | ||||||||||
| Early retirement program | (3,609 | ) | - | - | - | - | ||||||||||||||
| Donation to Simmons First Foundation | - | - | (1,738 | ) | (1,738 | ) | (1,738 | ) | ||||||||||||
| Branch right sizing expense | (1,074 | ) | (979 | ) | (3,475 | ) | (2,371 | ) | (1,201 | ) | ||||||||||
| Other real estate and foreclosure expense adjustment | (475 | ) | (186 | ) | (1,003 | ) | (653 | ) | (485 | ) | ||||||||||
| Amortization of intangibles adjustment | (8,194 | ) | (4,096 | ) | (15,915 | ) | (11,807 | ) | (7,582 | ) | ||||||||||
| Adjusted efficiency ratio numerator | $ | 268,157 | $ | 136,571 | $ | 522,141 | $ | 385,163 | $ | 253,205 | ||||||||||
| Net interest income | $ | 341,065 | $ | 177,835 | $ | 717,316 | $ | 524,290 | $ | 330,705 | ||||||||||
| Noninterest income | 90,815 | 45,835 | 170,066 | 125,419 | 82,396 | |||||||||||||||
| Fully tax-equivalent adjustment (effective tax rate of 26.135%) | 12,417 | 6,311 | 24,671 | 17,901 | 11,698 | |||||||||||||||
| Efficiency ratio denominator | 444,297 | 229,981 | 912,053 | 667,610 | 424,799 | |||||||||||||||
| Certain noninterest income items (non-GAAP) | ||||||||||||||||||||
| Gain on insurance settlement | - | - | (4,074 | ) | - | - | ||||||||||||||
| (Gain) loss from early retirement of TruPS | - | - | 365 | 365 | - | |||||||||||||||
| Gain on sale of intellectual property | - | - | (750 | ) | (750 | ) | - | |||||||||||||
| Branch right sizing income | - | - | 153 | 153 | 88 | |||||||||||||||
| (Gain) loss on sale of securities | 391 | - | 278 | 226 | 204 | |||||||||||||||
| Adjusted efficiency ratio denominator | $ | 444,688 | $ | 229,981 | $ | 908,025 | $ | 667,604 | $ | 425,091 | ||||||||||
| Efficiency ratio (1) | 63.68 | % | 62.28 | % | 62.14 | % | 63.54 | % | 67.14 | % | ||||||||||
| Adjusted efficiency ratio (non-GAAP) (1) | 60.30 | % | 59.38 | % | 57.50 | % | 57.69 | % | 59.56 | % | ||||||||||
(1) Efficiency ratio is noninterest expense as a percent of net interest income (fully taxable equivalent) and noninterest revenues. Adjusted efficiency ratio is noninterest expense before foreclosed property expense, amortization of intangibles and certain adjusting items as a percent of net interest income (fully taxable equivalent) and noninterest revenues, excluding gains and losses from securities transactions and certain adjusting items, and is a non-GAAP measurement.
(2) Effective tax rate of 26.135%.
Page 14