Exhibit 99.1
FOR RELEASE (10.27.2021) | Katie A. Lorenson, Chief Financial Officer 952.417.3725 (Office) |

ALERUS FINANCIAL CORPORATION REPORTS
THIRD QUARTER 2021 NET INCOME OF $13.1 MILLION
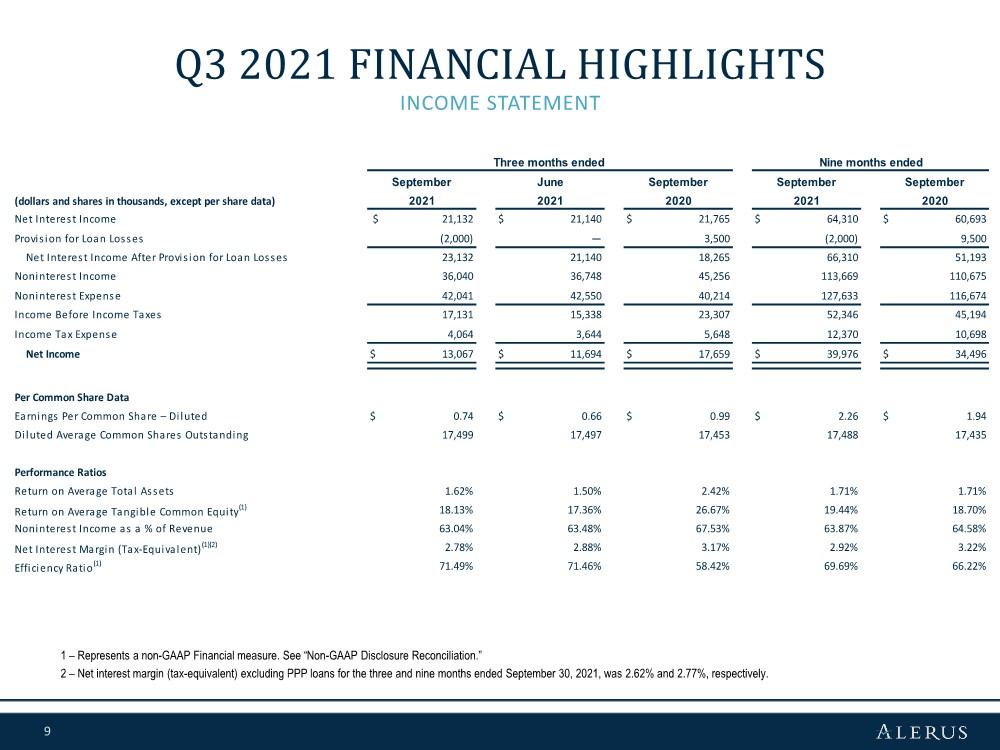
GRAND FORKS, N.D. (October 27, 2021) – Alerus Financial Corporation (Nasdaq: ALRS) reported net income of $13.1 million for the third quarter of 2021, or $0.74 per diluted common share, compared to net income of $11.7 million, or $0.66 per diluted common share, for the second quarter of 2021, and net income of $17.7 million, or $0.99 per diluted common share, for the third quarter of 2020.
CEO Comments
Chairman, President, and Chief Executive Officer Randy Newman said, “Our diversified business model continues to drive strong financial performance, as we ended the third quarter with a return on tangible common equity of over 18.0%. We generated $57.2 million of revenue through continued momentum in our retirement, wealth management and mortgage businesses, while net interest income and loan growth (excluding Paycheck Protection Program, or PPP, loans) showed incremental improvement with average total earning assets growing 10.6% year-over-year. Credit quality was better than expected with another net recovery quarter driving a negative provision for the quarter. Tangible book value grew over 7.0% from a year ago, which includes the intangibles recognized in the December 2020 acquisition of the Denver based, 24HourFlex/RPS. During the quarter, we converted 24HourFlex clients to Alerus and are pleased to see exceptional client retention and growth. We greatly appreciate all of our employees for their continued hard work, remarkable ongoing engagement and dedication to serving our clients, and their ability to help us produce strong returns for our shareholders.”
Quarterly Highlights
| ◾ | Return on average total assets of 1.62%, compared to 1.50% for the second quarter of 2021 |
| ◾ | Return on average tangible common equity(1) of 18.13%, compared to 17.36% for the second quarter of 2021 |
| ◾ | Net interest margin (tax-equivalent)(1) was 2.78%, compared to 2.88% for the second quarter of 2021 |
| ◾ | Allowance for loan losses to total loans, excluding PPP loans was 1.89%, compared to 2.00% as of December 31, 2020 |
| ◾ | Efficiency ratio(1) of 71.49%, compared to 71.46% for the second quarter of 2021 |
| ◾ | Noninterest income for the second quarter of 2021 was 63.04% of total revenue, compared to 63.48% for the second quarter of 2021 |
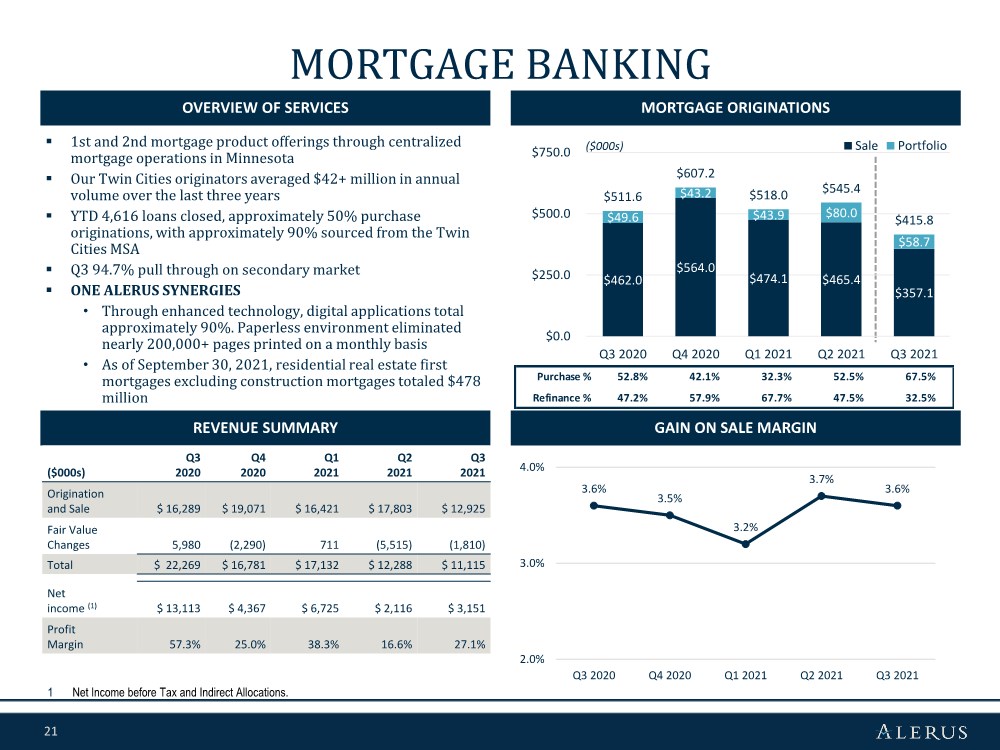
| ◾ | Mortgage originations totaled $415.8 million, a 23.8% decrease from the second quarter of 2021 |
| ◾ | Investment securities increased $425.5 million, or 71.8%, since December 31, 2020 |
| ◾ | Loans held for sale decreased $61.5 million, or 50.3%, since December 31, 2020 |
| ◾ | Loans held for investment decreased $179.0 million, or 9.0%, since December 31, 2020. Excluding PPP loans, loans held for investment decreased $14.1 million, or 0.8%, since December 31, 2020 |
| ◾ | Deposits increased $141.1 million, or 5.5%, since December 31, 2020 |
| (1) | Represents a non-GAAP financial measure. See “Non-GAAP to GAAP Reconciliations and Calculation of Non-GAAP Financial Measures.” |
Selected Financial Data (unaudited)
| | As of and for the | | |||||||||||||
| | Three months ended | | Nine months ended | | |||||||||||
| | September 30, | | June 30, | | September 30, | | September 30, | | September 30, | | |||||
(dollars and shares in thousands, except per share data) |
| 2021 |
| 2021 |
| 2020 |
| 2021 |
| 2020 |
| |||||
Performance Ratios | |
|
| |
|
| |
|
| |
|
| |
|
| |
Return on average total assets | |
| 1.62 | % |
| 1.50 | % |
| 2.42 | % |
| 1.71 | % |
| 1.71 | % |
Return on average common equity | |
| 14.68 | % |
| 13.82 | % |
| 22.31 | % |
| 15.61 | % |
| 15.17 | % |
Return on average tangible common equity (1) | |
| 18.13 | % |
| 17.36 | % |
| 26.67 | % |
| 19.44 | % |
| 18.70 | % |
Noninterest income as a % of revenue | |
| 63.04 | % |
| 63.48 | % |
| 67.53 | % |
| 63.87 | % |
| 64.58 | % |
Net interest margin (tax-equivalent) (1) | |
| 2.78 | % |
| 2.88 | % |
| 3.17 | % |
| 2.92 | % |
| 3.22 | % |
Efficiency ratio (1) | |
| 71.49 | % |
| 71.46 | % |
| 58.42 | % |
| 69.69 | % |
| 66.22 | % |
Net charge-offs/(recoveries) to average loans | | | (0.06) | % |
| — | % |
| (0.11) | % |
| 0.01 | % |
| 0.15 | % |
Dividend payout ratio | |
| 21.62 | % |
| 24.24 | % |
| 15.15 | % | | 20.80 | % | | 23.20 | % |
Per Common Share | |
|
| |
|
| |
|
| |
|
| |
|
| |
Earnings per common share - basic | | $ | 0.75 | | $ | 0.67 | | $ | 1.01 | | $ | 2.29 | | $ | 1.98 | |
Earnings per common share - diluted | | $ | 0.74 | | $ | 0.66 | | $ | 0.99 | | $ | 2.26 | | $ | 1.94 | |
Dividends declared per common share | | $ | 0.16 | | $ | 0.16 | | $ | 0.15 | | $ | 0.47 | | $ | 0.45 | |
Tangible book value per common share (1) | | $ | 17.46 | | $ | 16.89 | | $ | 16.31 | | | | | | | |
Average common shares outstanding - basic | |
| 17,205 | |
| 17,194 | |
| 17,121 | |
| 17,182 | |
| 17,101 | |
Average common shares outstanding - diluted | |
| 17,499 | |
| 17,497 | |
| 17,453 | |
| 17,488 | |
| 17,435 | |
Other Data | |
|
| |
|
| |
|
| | | | | | | |
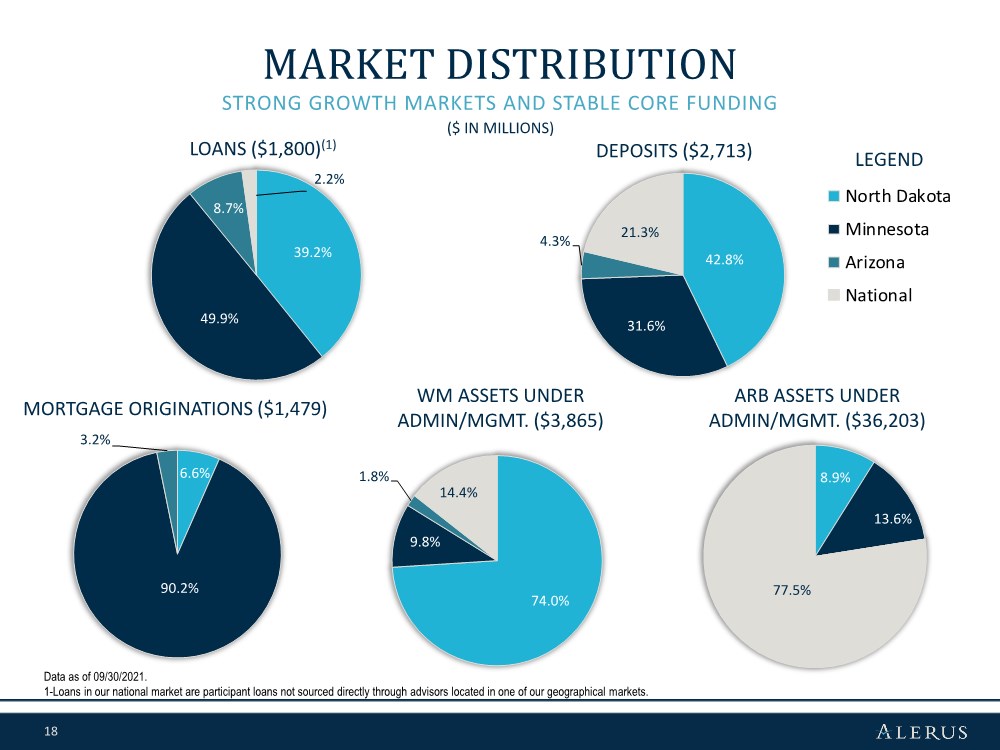
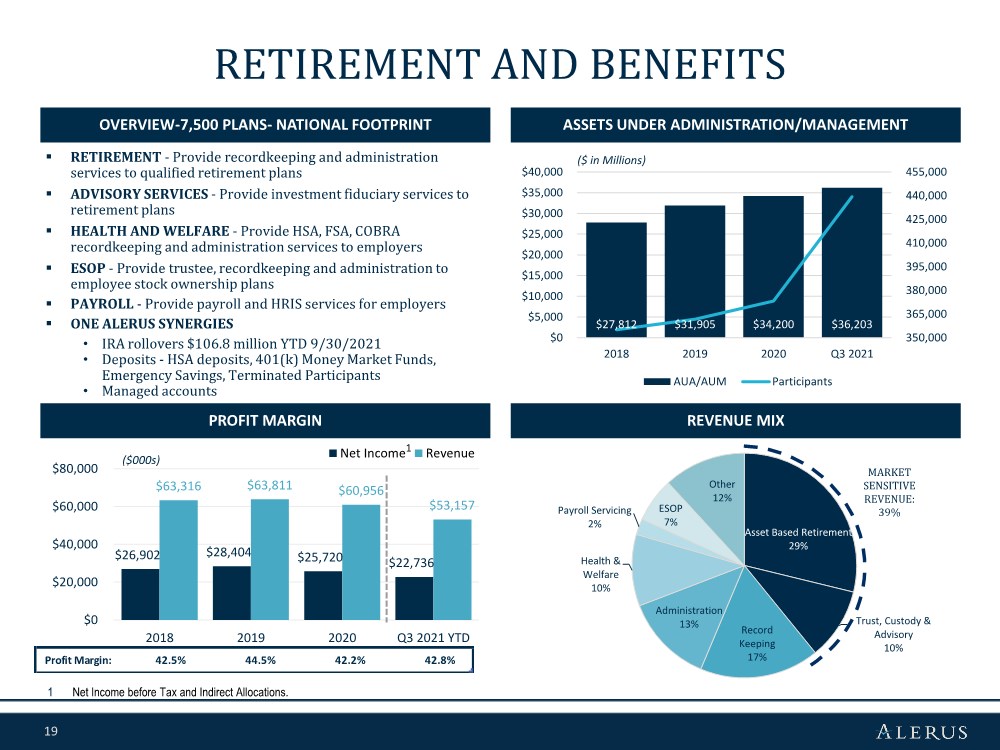
Retirement and benefit services assets under administration/management | | $ | 36,202,553 | | $ | 36,964,961 | | $ | 30,470,645 | | | | | | | |
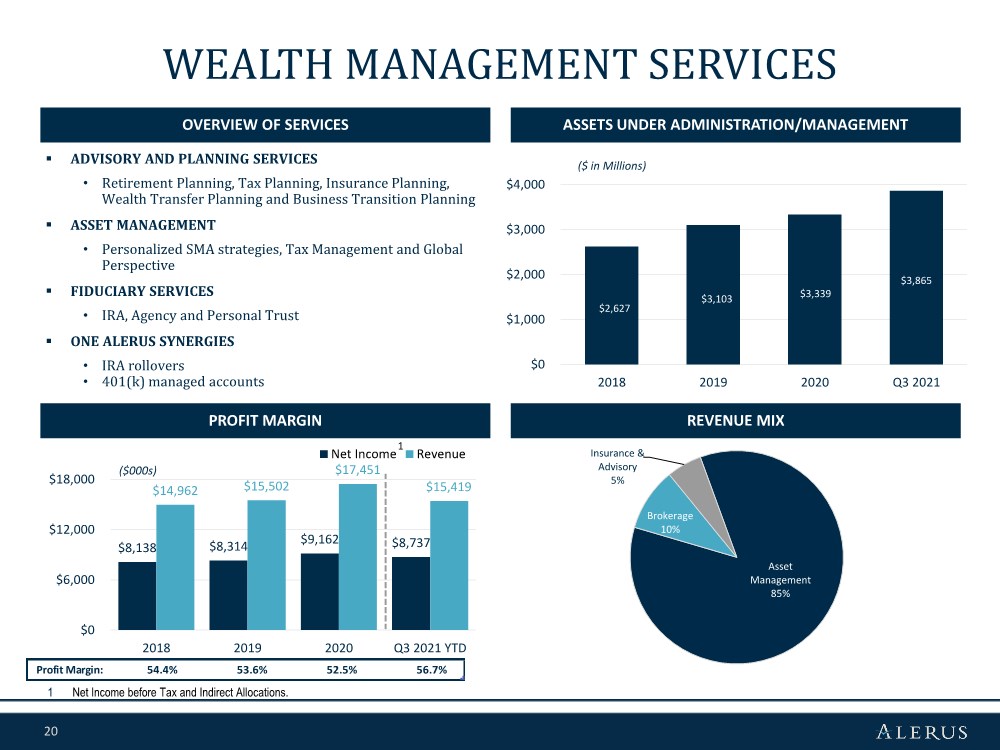
Wealth management assets under administration/management | |
| 3,865,062 | | | 3,538,959 | | | 3,043,173 | |
| | | | | |
Mortgage originations | |
| 415,792 | | | 545,437 | | | 511,605 | | $ | 1,479,243 | | $ | 1,171,811 | |
Results of Operations
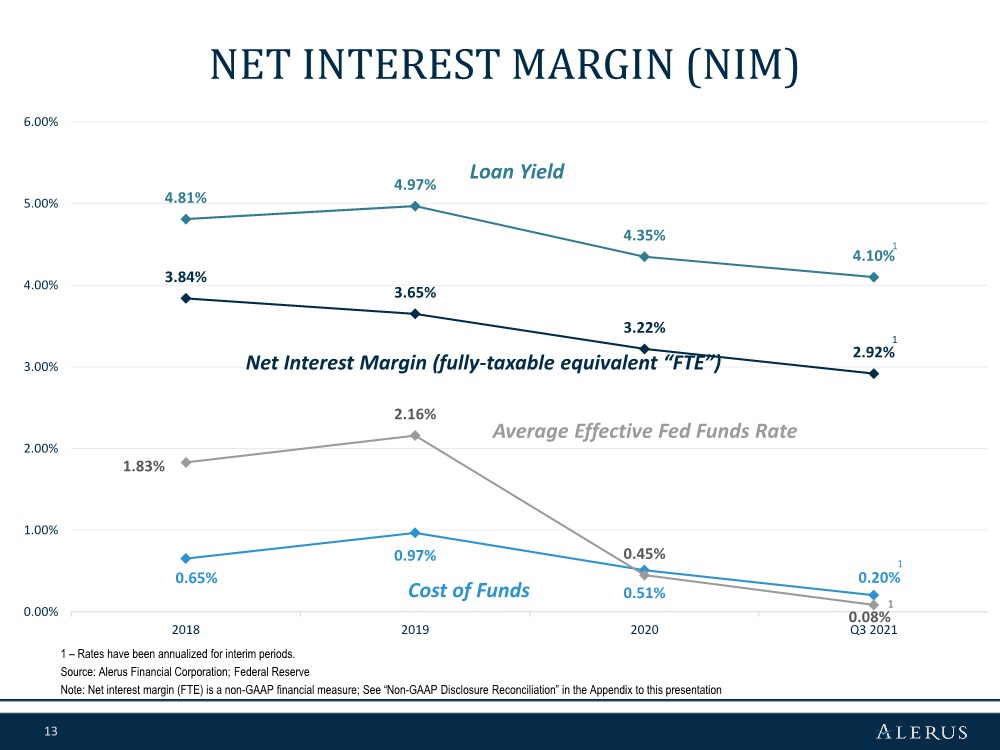
Net Interest Income
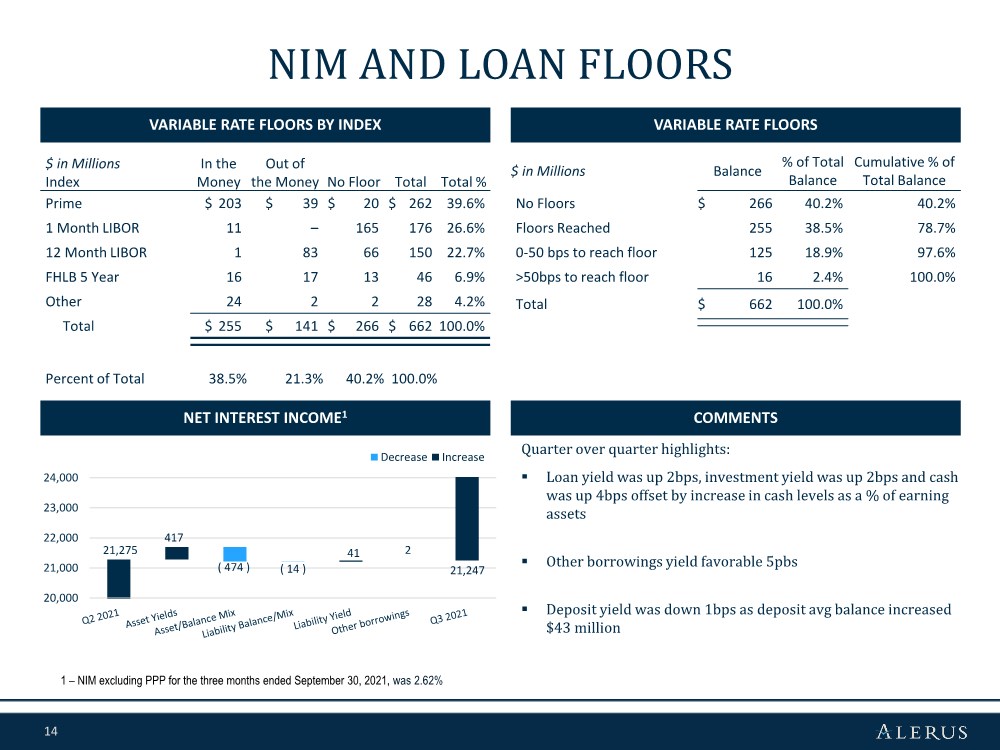
Net interest income for the third quarter of 2021 was $21.1 million, unchanged from the second quarter of 2021. Net interest income decreased $633 thousand, or 2.9%, from $21.8 million for the third quarter of 2020. During the third quarter of 2021, average interest earning assets increased $77.3 million, primarily due to increases of $90.1 million in interest-bearing deposits with banks and $68.6 million in investment securities, partially offset by decreases of $67.1 million in loans held for investment and $14.2 million in loans held for sale. The change in the balance sheet mix resulted in a 12 basis point decrease in the average earning asset yield. Net interest income earned from PPP loans during the third quarter of 2021 totaled $2.1 million, a decrease of $502 thousand, from the $2.6 million earned during the second quarter. The cost of interest-bearing liabilities had a modest decrease of 1 basis point from the second quarter of 2021.
Net interest margin (tax-equivalent), a non-GAAP financial measure, was 2.78% for the third quarter of 2021, a 10 basis point decrease from 2.88% for the second quarter of 2021, and a 39 basis point decrease from 3.17% in the third quarter of 2020. The linked quarter decrease was primarily due to lower yields on interest earning assets. Excluding PPP loans, net interest margin was 2.62% for the third quarter of 2021, a 13 basis point decrease from 2.75% for the second quarter of 2021. The year over year decrease was primarily attributable to the historically low and flat yield curve and a more liquid balance sheet mix which resulted in a 58 basis point decrease in interest earning asset yields. The decrease in earning asset yield was offset by a 27 basis point decrease in the average rate paid on interest-bearing liabilities.
Noninterest Income
Noninterest income for the third quarter of 2021 was $36.0 million, a $708 thousand, or 1.9%, decrease from the second quarter of 2021. The decrease was primarily driven by a $1.2 million decrease in mortgage banking revenue, a result of a decrease of $129.6 million in mortgage originations. The decrease in mortgage banking revenue was partially offset by modest increases in both retirement and benefit services and wealth management revenue.
Noninterest income for the third quarter of 2021 decreased $9.2 million, or 20.4%, from $45.3 million in the third quarter of 2020. This decrease was primarily due to an $11.2 million decrease in mortgage banking revenue, a result of a $7.8 million decrease in the fair market value on the secondary market hedge, a decrease of $95.8 million in mortgage originations, and a 4 basis point decrease in the gain on sale margin. Partially offsetting this decrease was a $2.9 million increase in retirement and benefit services
2
income, primarily driven by the revenue attributable to the acquisition of Retirement Planning Services, Inc. (doing business as RPS Plan Administrators and 24HourFlex), or RPS, and a $893 thousand increase in document restatement fees. In addition, wealth management revenue increased $809 thousand, or 18.0%, primarily driven by organic growth and market increases in assets under management.
Noninterest Expense
Noninterest expense for the third quarter of 2021 was $42.0 million, a decrease of $509 thousand, or 1.2%, compared to the second quarter of 2021. The decrease was primarily due to decreases of $1.0 million in compensation expense, $514 thousand in employee benefits and taxes, partially offset by increases of $374 thousand in business services, software and technology expense and $198 thousand in other noninterest expense. The decreases in compensation expense and employee taxes and benefits were primarily attributable to the $129.6 million decrease in mortgage originations from the previous quarter, partially offset by other personnel related accruals. The increase in business services, software and technology expense is primarily a result of non-recurring expenses related to investments in automated processing and integration expenses associated with the acquisition of RPS. The increase in other noninterest expense is primarily attributable to a $234 thousand increase in the provision for unfunded commitments. The increase in the provision for unfunded commitments was a result of lower credit line utilization. Unfunded commitments increased 2.0% from the second quarter of 2021.
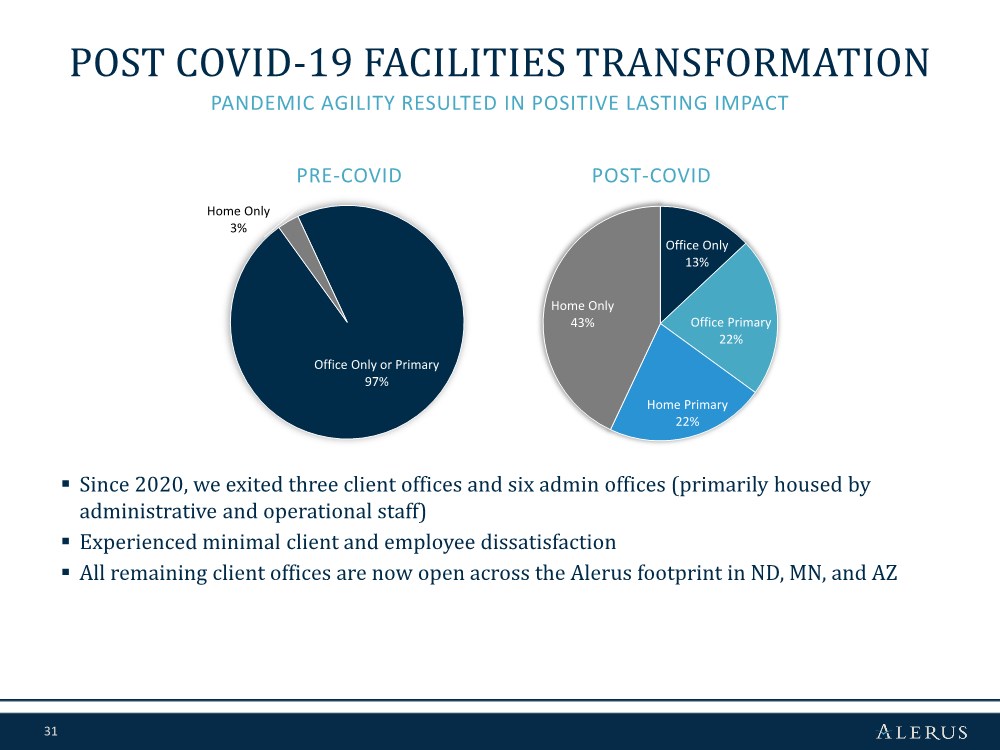
Noninterest expense for the third quarter of 2021 increased $1.8 million, or 4.5%, from $40.2 million in the third quarter of 2020. The increase was primarily attributable to increases of business services, software and technology expense as well as compensation expense, partially offset by decreased occupancy and equipment expense. Business services, software and technology expense increased primarily as a result of our increased investment in processing innovations as previously stated. Additionally, compensation expense increased as a result of the acquisition of RPS, as the number of full time employees increased from 790 employees in the third quarter of 2020 to 825 employees in the third quarter of 2021. Occupancy and equipment expense decreased due to the closure of certain offices in 2021 due to our transition to a hybrid work environment.
Financial Condition
Total assets were $3.2 billion as of September 30, 2021, an increase of $161.4 million, or 5.4%, from December 31, 2020. The overall increase in total assets included an increase of $425.5 million in investment securities, partially offset by a $179.0 million decrease in loans held for investment and a $61.5 million decrease in loans held for sale. The decrease in loans held for investment was primarily due to PPP loan balances decreasing by $164.9 million from December 31, 2020.
Loans
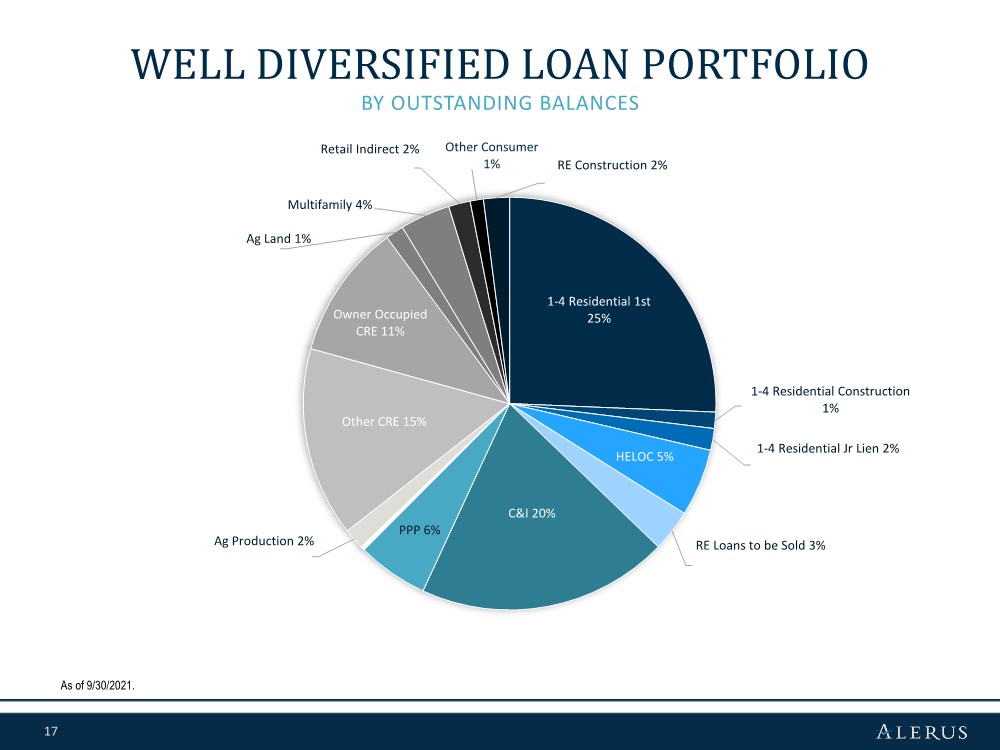
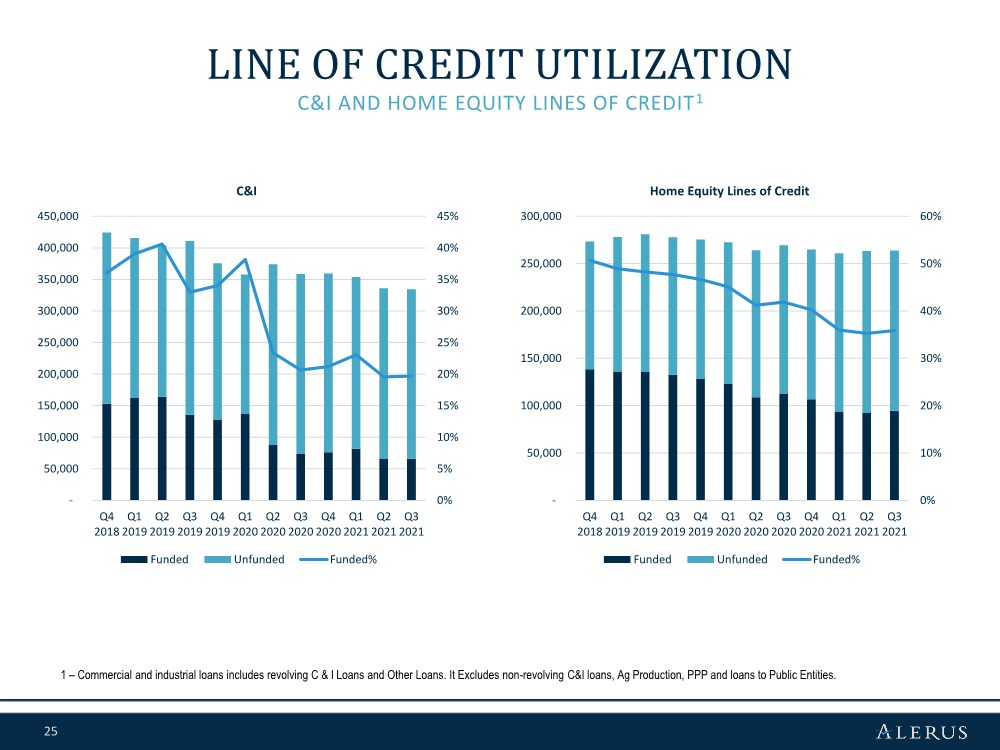
Total loans were $1.80 billion as of September 30, 2021, a decrease of $179.0 million, or 9.0%, from December 31, 2020. The decrease was primarily due to a $185.3 million decrease in the commercial and industrial loan portfolio, primarily attributable to a $164.9 million decrease in PPP loans. Excluding PPP loans, the commercial loan portfolio decreased by $16.5 million, or 1.6%, from December 31, 2020, primarily as a result of lower credit line utilization. The outstanding balances of lines of credit decreased $2.0 million, or 0.4%, from December 31, 2020. The consumer loan portfolio increased $2.5 million from December 31, 2020, due to a net increase of $24.8 million in residential real estate mortgages, which was partially offset by a decrease in other consumer loans as a result of discontinuing our indirect auto lending.
3
The following table presents the composition of our loan portfolio as of the dates indicated:
| | | | | | | | | | | |||||
| | September 30, | | June 30, | | March 31, | | December 31, | | September 30, | |||||
(dollars in thousands) |
| 2021 | | 2021 | | 2021 | | 2020 | | 2020 | |||||
Commercial |
| |
|
| |
|
| |
|
| |
|
| |
|
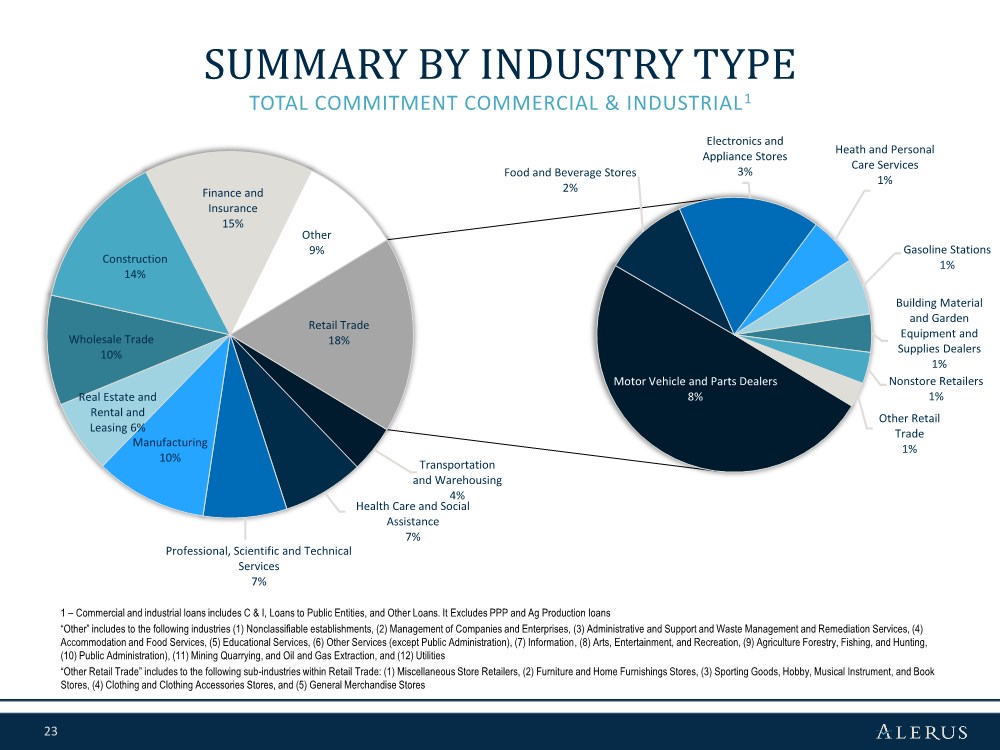
Commercial and industrial (1) | | $ | 506,599 | | $ | 572,734 | | $ | 678,029 | | $ | 691,858 | | $ | 789,036 |
Real estate construction | |
| 37,751 | |
| 36,549 | |
| 40,473 | |
| 44,451 | |
| 33,169 |
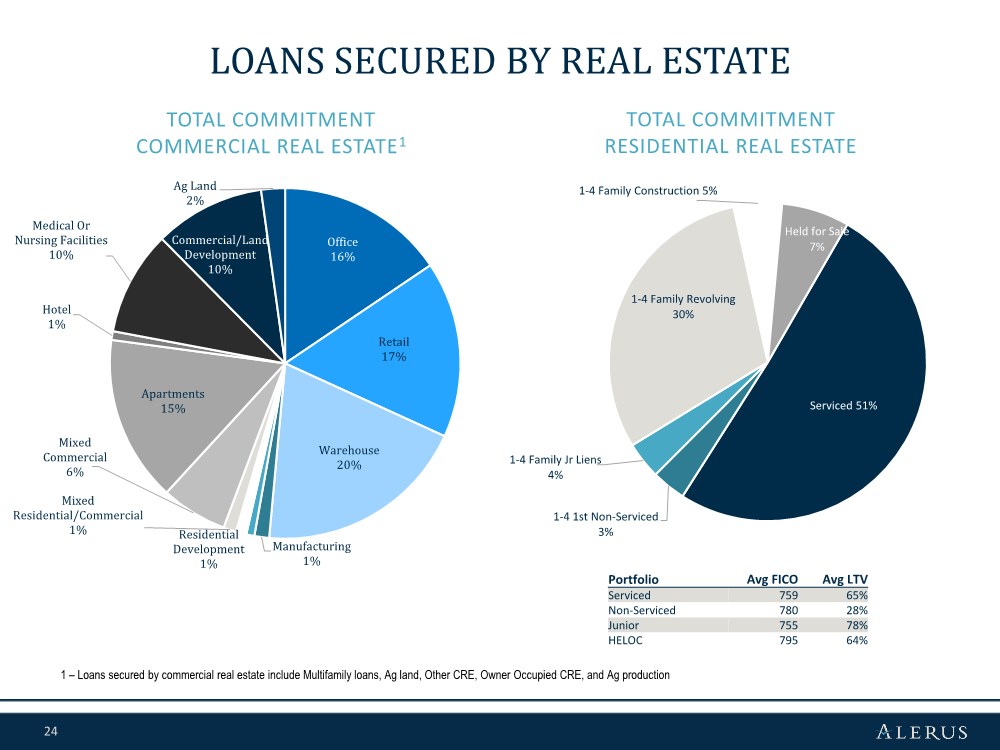
Commercial real estate | |
| 573,518 | |
| 567,987 | |
| 569,451 | |
| 563,007 | |
| 535,216 |
Total commercial | |
| 1,117,868 | |
| 1,177,270 | |
| 1,287,953 | |
| 1,299,316 | |
| 1,357,421 |
Consumer | |
|
| |
|
| |
|
| |
|
| |
|
|
Residential real estate first mortgage | |
| 501,339 | |
| 470,822 | |
| 454,958 | |
| 463,370 | |
| 469,050 |
Residential real estate junior lien | |
| 130,243 | |
| 130,180 | |
| 130,299 | |
| 143,416 | |
| 152,487 |
Other revolving and installment | |
| 50,936 | |
| 57,040 | |
| 64,135 | |
| 73,273 | |
| 79,461 |
Total consumer | |
| 682,518 | |
| 658,042 | |
| 649,392 | |
| 680,059 | |
| 700,998 |
Total loans | | $ | 1,800,386 | | $ | 1,835,312 | | $ | 1,937,345 | | $ | 1,979,375 | | $ | 2,058,419 |
| (1) | Includes PPP loans of $103.5 million at September 30, 2021, $165.0 million at June 30, 2021, $256.8 million at March 31, 2021, $268.4 million at December 31, 2020 and $348.9 million at September 30, 2020. |
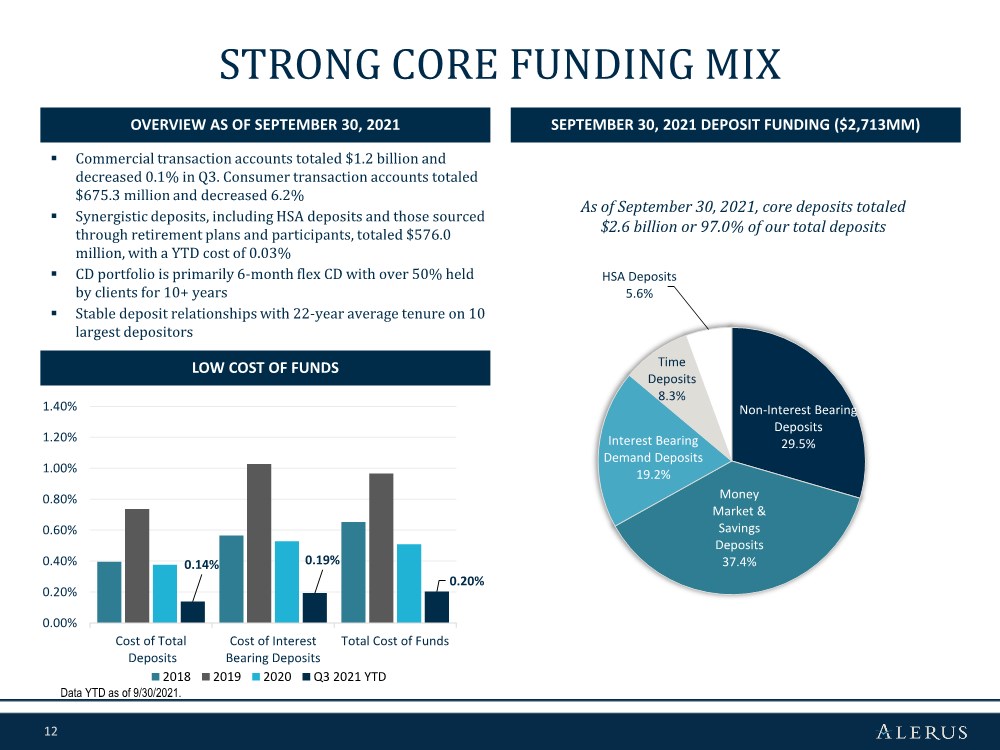
Deposits
Total deposits were $2.71 billion as of September 30, 2021, an increase of $141.1 million, or 5.5%, from December 31, 2020. Interest-bearing deposits increased $98.7 million, while noninterest-bearing deposits increased $42.3 million. Key drivers of the increase included ongoing higher depositor balances due to the uncertain economic environment, government stimulus programs and volatile financial markets. Synergistic deposits decreased $19.6 million to $576.0 million as retirement participants transitioned balances back into the markets. Excluding synergistic deposits, commercial transaction deposits increased $112.5 million, or 10.2%, while consumer transaction deposits increased, $31.2 million, or 4.8%, since December 31, 2020. Noninterest-bearing deposits as a percentage of total deposits were 29.4% as of September 30, 2021 compared to 29.3% as of December 31, 2020.
The following table presents the composition of our deposit portfolio as of the dates indicated:
| | September 30, | | June 30, | | March 31, | | December 31, | | September 30, | |||||
(dollars in thousands) |
| 2021 |
| 2021 |
| 2021 |
| 2020 |
| 2020 | |||||
Noninterest-bearing demand | | $ | 797,062 | | $ | 758,820 | | $ | 775,434 | | $ | 754,716 | | $ | 693,450 |
Interest-bearing | |
|
| |
|
| |
|
| |
|
| |
|
|
Interest-bearing demand | |
| 673,916 | |
| 736,043 | |
| 674,466 | |
| 618,900 | |
| 590,366 |
Savings accounts | |
| 92,632 | |
| 89,437 | |
| 87,492 | |
| 79,902 | |
| 78,659 |
Money market savings | |
| 924,678 | |
| 920,831 | |
| 967,273 | |
| 909,137 | |
| 892,473 |
Time deposits | |
| 224,800 | |
| 205,809 | |
| 212,908 | |
| 209,338 | |
| 207,422 |
Total interest-bearing | |
| 1,916,026 | |
| 1,952,120 | |
| 1,942,139 | |
| 1,817,277 | |
| 1,768,920 |
Total deposits | | $ | 2,713,088 | | $ | 2,710,940 | | $ | 2,717,573 | | $ | 2,571,993 | | $ | 2,462,370 |
Asset Quality
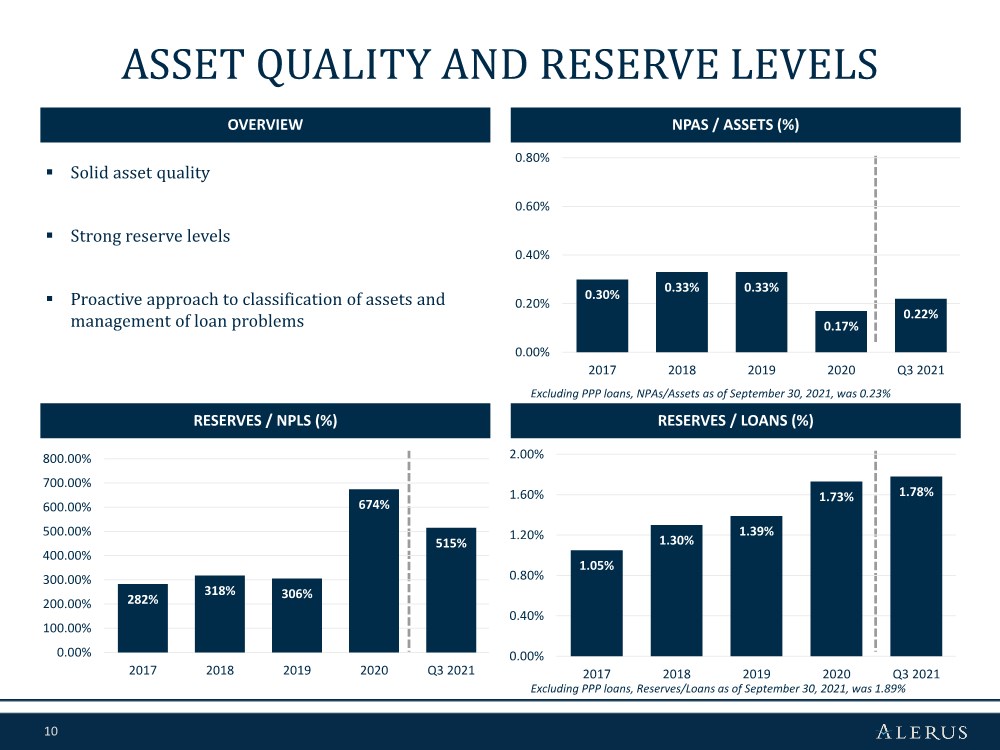
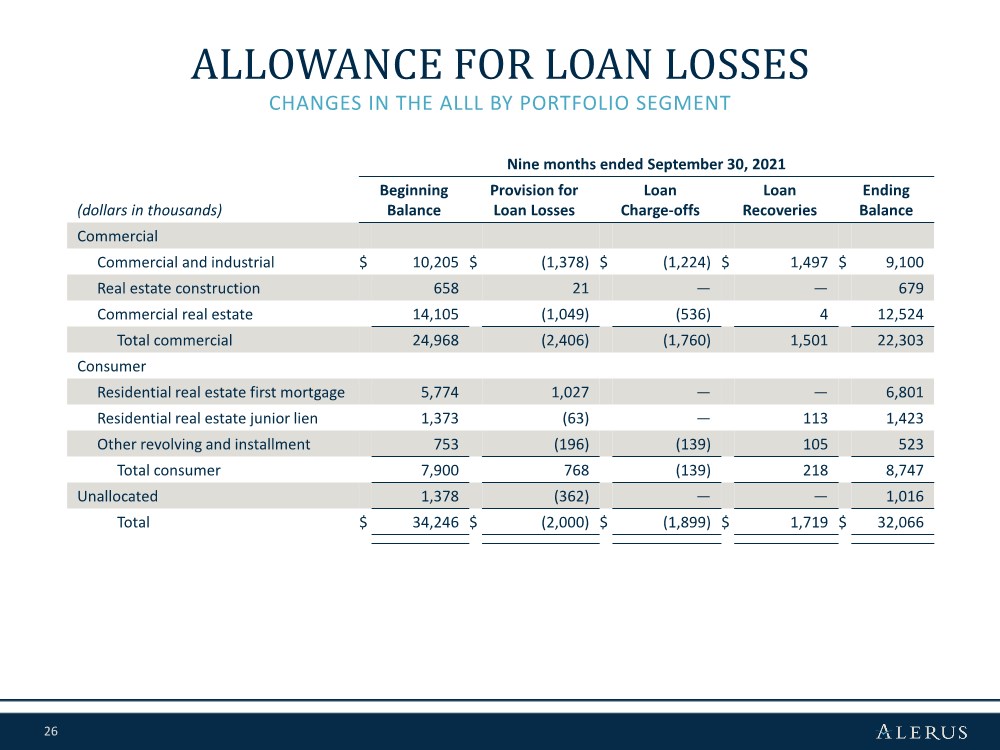
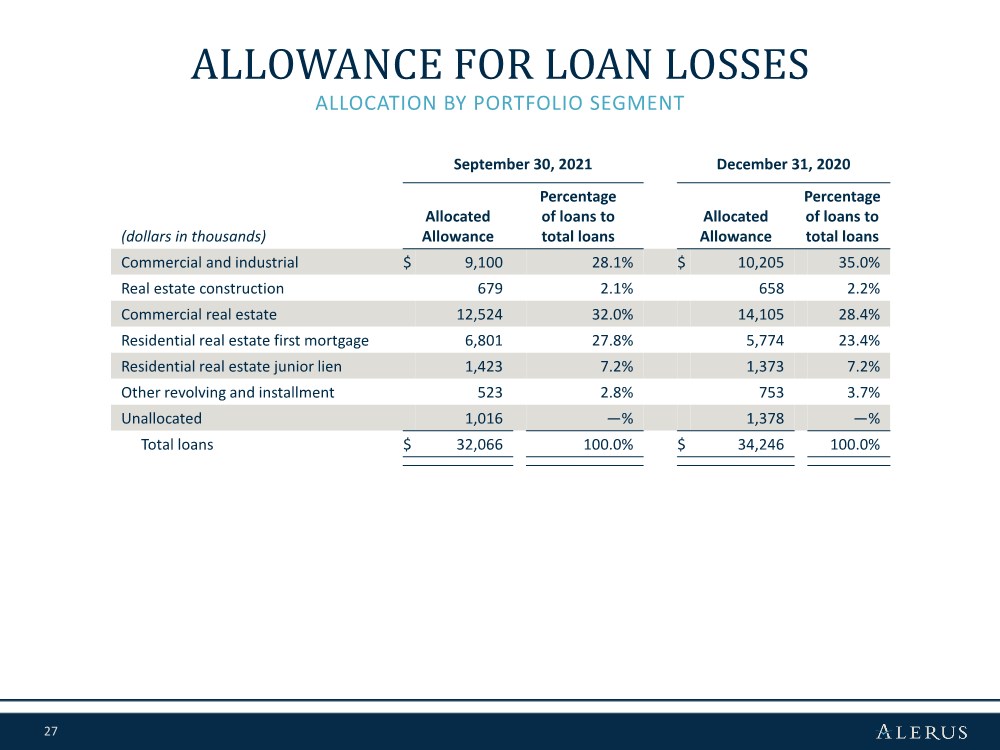
Total nonperforming assets were $7.1 million as of September 30, 2021, an increase of $1.9 million, or 37.9%, from December 31, 2020. As of September 30, 2021, the allowance for loan losses was $32.1 million, or 1.78% of total loans, compared to $34.2 million, or 1.73% of total loans, as of December 31, 2020. Excluding PPP loans, the ratio of allowance for loan losses to total loans was 1.89% at September 30, 2021, compared to 2.00% as of December 31, 2020.
4
The following table presents selected asset quality data as of and for the periods indicated:
| | As of and for the three months ended | | |||||||||||||
| | September 30, | | June 30, | | March 31, | | December 31, | | September 30, | | |||||
(dollars in thousands) |
| 2021 |
| 2021 |
| 2021 |
| 2020 |
| 2020 |
| |||||
Nonaccrual loans | | $ | 6,229 | | $ | 6,960 | | $ | 4,756 | | $ | 5,050 | | $ | 4,795 | |
Accruing loans 90+ days past due | |
| — | |
| — | |
| — | | | 30 | |
| — | |
Total nonperforming loans | |
| 6,229 | |
| 6,960 | |
| 4,756 | |
| 5,080 | |
| 4,795 | |
OREO and repossessed assets | |
| 862 | |
| 858 | |
| 139 | |
| 63 | |
| 10 | |
Total nonperforming assets | | $ | 7,091 | | $ | 7,818 | | $ | 4,895 | | $ | 5,143 | | $ | 4,805 | |
Net charge-offs/(recoveries) | | | (302) | | | (6) | | | 488 | | | (1,509) | | | (581) | |
Net charge-offs/(recoveries) to average loans | | | (0.06) | % | | — | % | | 0.10 | % | | (0.30) | % | | (0.11) | % |
Nonperforming loans to total loans | | | 0.35 | % | | 0.38 | % | | 0.25 | % | | 0.26 | % | | 0.23 | % |
Nonperforming assets to total assets | | | 0.22 | % | | 0.25 | % | | 0.16 | % | | 0.17 | % | | 0.17 | % |
Allowance for loan losses to total loans | | | 1.78 | % | | 1.84 | % | | 1.74 | % | | 1.73 | % | | 1.52 | % |
Allowance for loan losses to nonperforming loans | | | 515 | % | | 485 | % | | 710 | % | | 674 | % | | 654 | % |
For the third quarter of 2021, we had net recoveries of $302 thousand compared to net recoveries of $6 thousand for the second quarter of 2021 and $581 thousand of net recoveries for the third quarter of 2020.
There was a $2.0 million reversal of provision for loan losses recorded for the third quarter of 2021, a $2.0 million decrease from the second quarter of 2021, and a decrease of $5.5 million from the third quarter of 2020. The negative provision in the third quarter of 2021 was driven by net recoveries in four of the last five quarters and continuous improvements of credit quality indicators and economic conditions.
The ratio of nonperforming loans to total loans at September 30, 2021 was 0.35%. Excluding PPP loans, the ratio of nonperforming loans to total loans was 0.37% at September 30, 2021. Nonperforming assets as a percentage of total assets was 0.22% at September 30, 2021. Excluding PPP loans, nonperforming assets as a percentage of total assets would have been 0.23% at September 30, 2021.
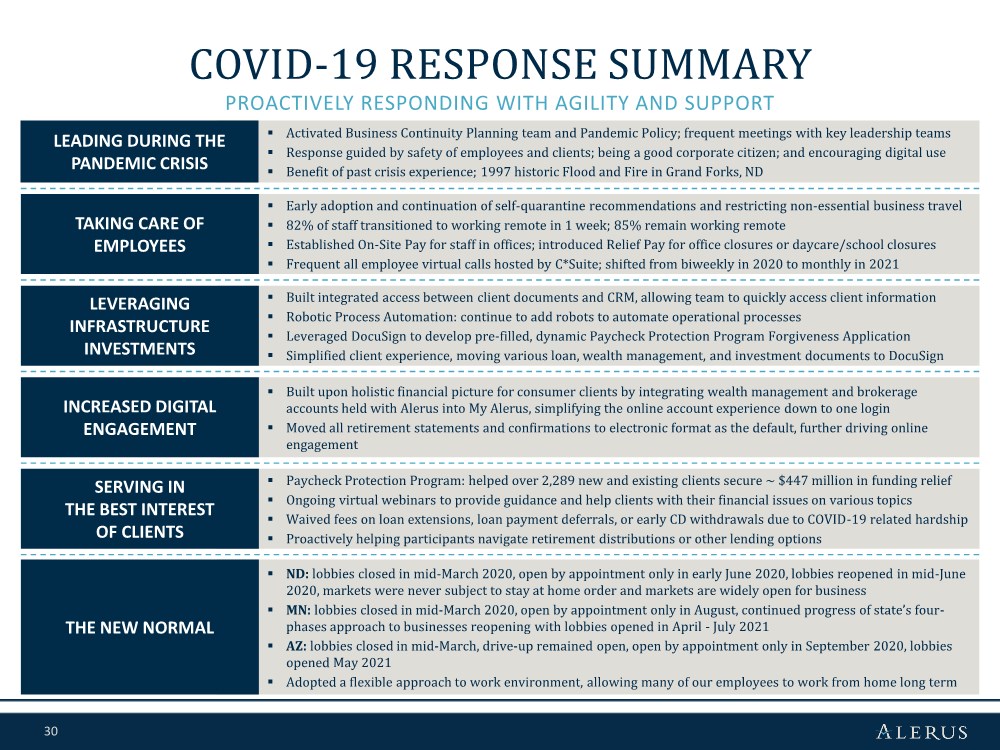
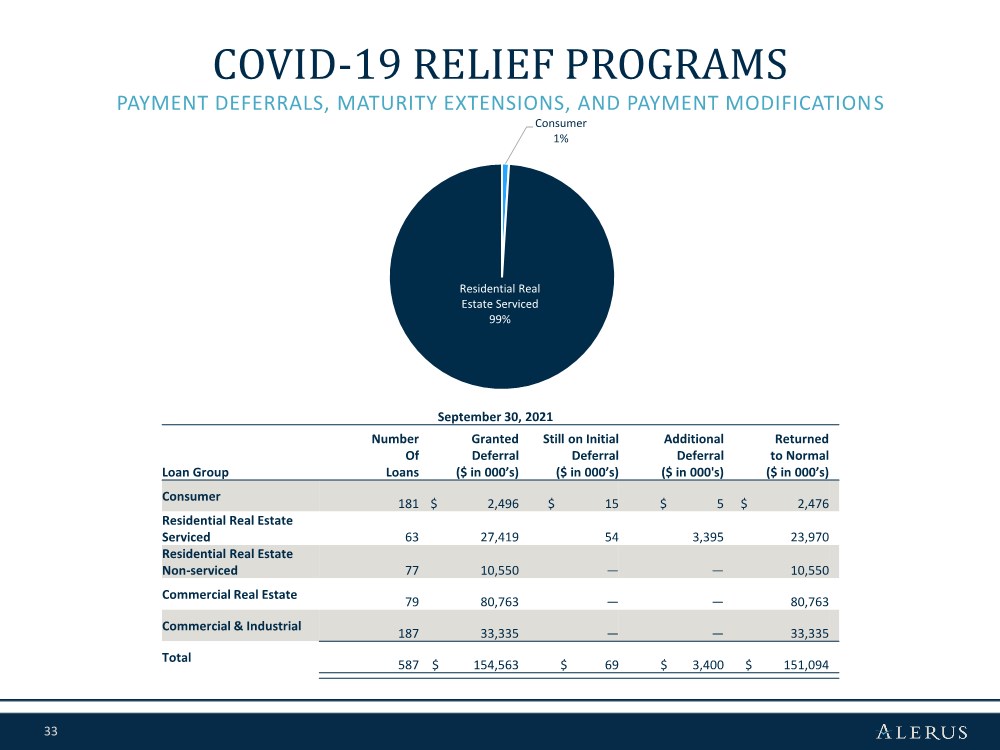
Beginning in 2020, in accordance with the Interagency Statement on Loan Modifications and Reporting for Financial Institutions as issued on April 7, 2020, through September 30, 2021, we had entered into principal and interest deferrals on 587 loans, representing $154.5 million in total outstanding principal balances. Of those loans, 8 loans with a total outstanding principal balance of $3.4 million have been granted additional deferrals, 2 loans with a total outstanding principal balance of $69 thousand remain on the first deferral and the remaining loans have been returned to normal payment status. These loan modifications are not considered troubled debt restructurings.
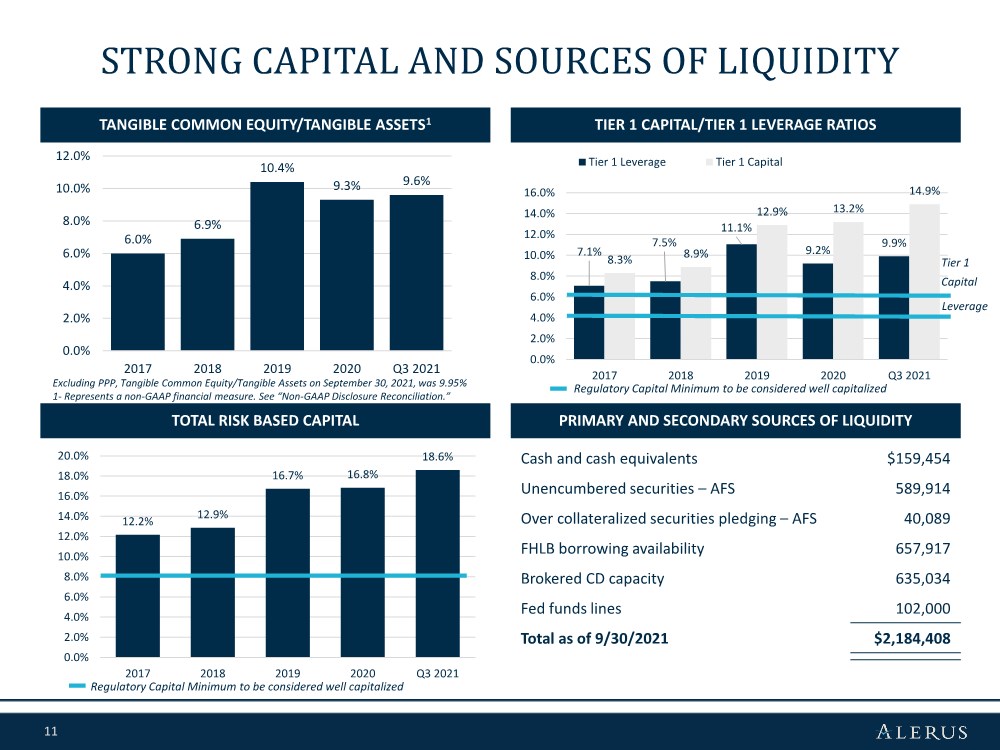
Capital
Total stockholders’ equity was $353.2 million as of September 30, 2021, an increase of $23.0 million, or 7.0%, from December 31, 2020. Tangible book value per common share, a non-GAAP financial measure, increased to $17.46 as of September 30, 2021, from $16.00 as of December 31, 2020. Tangible common equity to tangible assets, a non-GAAP financial measure, increased to 9.62% as of September 30, 2021, from 9.27% as of December 31, 2020.
5
The following table presents our capital ratios as of the dates indicated:
|
| September 30, |
| December 31, |
| September 30, | | |||
|
| 2021 |
| 2020 |
| 2020 | | |||
Capital Ratios(1) | | | | | | | | | | |
Alerus Financial Corporation Consolidated | | | | | | | | | | |
Common equity tier 1 capital to risk weighted assets | | | 14.52 | % | | 12.75 | % | | 13.08 | % |
Tier 1 capital to risk weighted assets | | | 14.93 | % | | 13.15 | % | | 13.48 | % |
Total capital to risk weighted assets | | | 18.58 | % | | 16.79 | % | | 17.13 | % |
Tier 1 capital to average assets | | | 9.88 | % | | 9.24 | % | | 9.76 | % |
Tangible common equity / tangible assets (2) | |
| 9.62 | % |
| 9.27 | % |
| 9.78 | % |
| | | | | | | | | | |
Alerus Financial, N.A. | | | | | | | | | | |
Common equity tier 1 capital to risk weighted assets | | | 13.77 | % | | 12.10 | % | | 12.47 | % |
Tier 1 capital to risk weighted assets | | | 13.77 | % | | 12.10 | % | | 12.47 | % |
Total capital to risk weighted assets | | | 15.03 | % | | 13.36 | % | | 13.72 | % |
Tier 1 capital to average assets | | | 9.11 | % | | 8.50 | % | | 9.03 | % |
| (1) | Capital ratios for the current quarter are to be considered preliminary until the Call Report for Alerus Financial, N.A. is filed. |
| (2) | Represents a non-GAAP financial measure. See “Non-GAAP to GAAP Reconciliations and Calculation of Non-GAAP Financial Measures.” |
Conference Call
The Company will host a conference call at 9:00 a.m. Central Time on Thursday, October 28, 2021, to discuss its financial results. The call can be accessed via telephone at (888) 317-6016. A recording of the call and transcript will be available on the Company’s investor relations website at investors.alerus.com following the call.
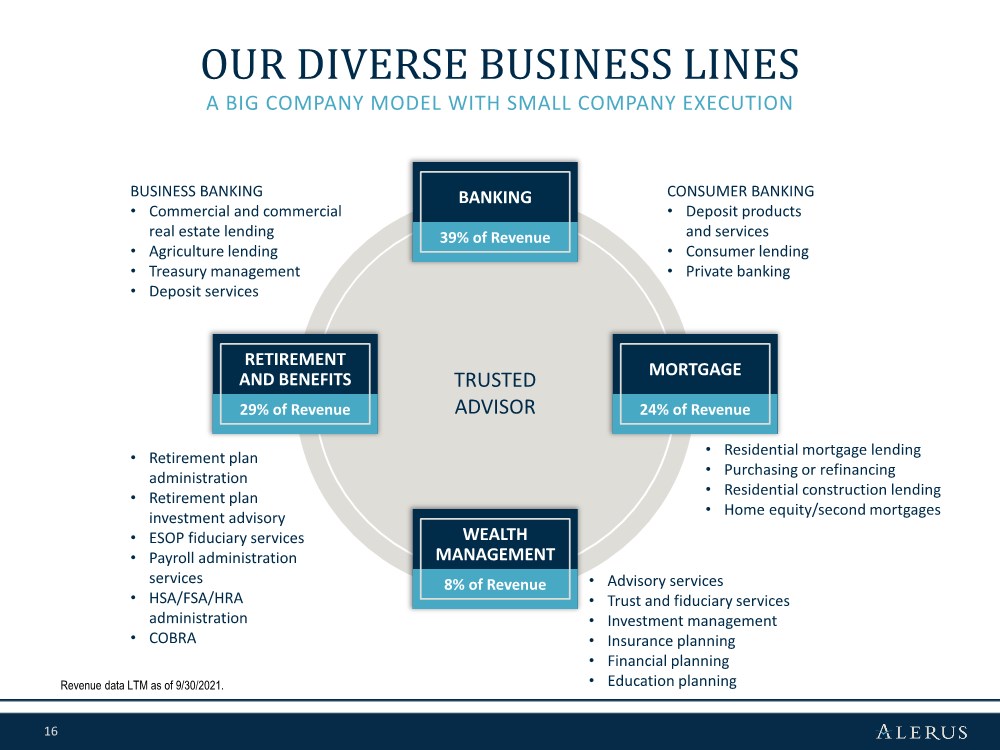
About Alerus Financial Corporation
Alerus Financial Corporation is a diversified financial services company headquartered in Grand Forks, ND. Through its subsidiary, Alerus Financial, N.A., Alerus provides innovative and comprehensive financial solutions to business and consumer clients through four distinct business segments—banking, retirement and benefit services, wealth management, and mortgage. Alerus provides clients with a primary point of contact to help fully understand the unique needs and delivery channel preferences of each client. Clients are provided with competitive products, valuable insight and sound advice supported by digital solutions designed to meet the clients’ needs. Alerus Financial banking and wealth management offices are located in Grand Forks and Fargo, ND, the Minneapolis-St. Paul, MN metropolitan area, and Scottsdale and Mesa, AZ. Alerus Retirement and Benefits plan administration offices are located in St. Paul, MN, East Lansing, MI, and Littleton, CO.
Non-GAAP Financial Measures
Some of the financial measures included in this press release are not measures of financial performance recognized by U.S. Generally Accepted Accounting Principles, or GAAP. These non-GAAP financial measures include the ratio of tangible common equity to tangible assets, tangible common equity per share, return on average tangible common equity, net interest margin (tax-equivalent), and the efficiency ratio. Management uses these non-GAAP financial measures in its analysis of its performance, and believes financial analysts and investors frequently use these measures, and other similar measures, to evaluate capital adequacy. Reconciliations of non-GAAP disclosures used in this press release to the comparable GAAP measures are provided in the accompanying tables. Management, banking regulators, many financial analysts and other investors use these measures in conjunction with more traditional bank capital ratios to compare the capital adequacy of banking organizations with significant amounts of goodwill or other intangible assets, which typically stem from the use of the purchase accounting method of accounting for mergers and acquisitions.
These non-GAAP financial measures should not be considered in isolation or as a substitute for total stockholders’ equity, total assets, book value per share, return on average assets, return on average equity, or any other measure calculated in accordance with GAAP. Moreover, the manner in which we calculate these non-GAAP financial measures may differ from that of other companies reporting measures with similar names.
Forward-Looking Statements
This press release contains “forward-looking statements” within the meaning of the safe harbor provisions of the U.S. Private Securities Litigation Reform Act of 1995. Forward-looking statements include, without limitation, statements concerning plans, estimates, calculations, forecasts and projections with respect to the anticipated future performance of Alerus Financial Corporation.
6
These statements are often, but not always, identified by words such as “may”, “might”, “should”, “could”, “predict”, “potential”, “believe”, “expect”, “continue”, “will”, “anticipate”, “seek”, “estimate”, “intend”, “plan”, “projection”, “would”, “annualized”, “target” and “outlook”, or the negative version of those words or other comparable words of a future or forward-looking nature. Examples of forward-looking statements include, among others, statements we make regarding our projected growth, anticipated future financial performance, financial condition, credit quality, management’s long-term performance goals and the future plans and prospects of Alerus Financial Corporation.
Forward-looking statements are neither historical facts nor assurances of future performance. Instead, they are based only on our current beliefs, expectations and assumptions regarding the future of our business, future plans and strategies, projections, anticipated events and trends, the economy and other future conditions. Because forward-looking statements relate to the future, they are subject to inherent uncertainties, risks and changes in circumstances that are difficult to predict and many of which are outside of our control. Our actual results and financial condition may differ materially from those indicated in the forward-looking statements. Therefore, you should not rely on any of these forward-looking statements. Important factors that could cause our actual results and financial condition to differ materially from those indicated in the forward-looking statements include, among others, the following: the effects of the COVID-19 pandemic, including its effects on the economic environment, our clients, and our operations, including due to supply chain disruptions as well as any changes to federal, state, or local government laws, regulations, or orders in response to the pandemic; our ability to successfully manage credit risk and maintain an adequate level of allowance for loan losses; new or revised accounting standards, including as a result of the implementation of the new Current Expected Credit Loss Standard; business and economic conditions generally and in the financial services industry, nationally and within our market areas; the overall health of the local and national real estate market; concentrations within our loan portfolio; the level of nonperforming assets on our balance sheet; our ability to implement our organic and acquisition growth strategies; the impact of economic or market conditions on our fee-based services; our ability to continue to grow our retirement and benefit services business; our ability to continue to originate a sufficient volume of residential mortgages; the occurrence of fraudulent activity, breaches or failures of our information security controls or cybersecurity-related incidents; interruptions involving our information technology and telecommunications systems or third-party servicers; potential losses incurred in connection with mortgage loan repurchases; the composition of our executive management team and our ability to attract and retain key personnel; rapid technological change in the financial services industry; increased competition in the financial services industry; our ability to successfully manage liquidity risk; the effectiveness of our risk management framework; the commencement and outcome of litigation and other legal proceedings and regulatory actions against us or to which we may become subject; potential impairment to the goodwill we recorded in connection with our past acquisitions; the extensive regulatory framework that applies to us; the impact of recent and future legislative and regulatory changes; interest rate risks associated with our business; fluctuations in the values of the securities held in our securities portfolio; governmental monetary, trade and fiscal policies; severe weather, natural disasters, widespread disease or pandemics, such as the COVID-19 global pandemic, acts of war or terrorism or other adverse external events; any material weaknesses in our internal control over financial reporting; developments and uncertainty related to the future use and availability of some reference rates, such as the London Interbank Offered Rate, as well as other alternative rates; changes to U.S. or state tax laws, regulations and guidance, including recent proposals to increase the federal corporate tax rate; our success at managing the risks involved in the foregoing items; and any other risks described in the “Risk Factors” sections of the reports filed by Alerus Financial Corporation with the Securities and Exchange Commission.
Any forward-looking statement made by us in this press release is based only on information currently available to us and speaks only as of the date on which it is made. We undertake no obligation to publicly update any forward-looking statement, whether written or oral, that may be made from time to time, whether as a result of new information, future developments or otherwise.
7
Alerus Financial Corporation and Subsidiaries
Consolidated Balance Sheets
(dollars and shares in thousands, except per share data)
|
| September 30, |
| December 31, | ||
|
| 2021 |
| 2020 | ||
Assets |
| (Unaudited) |
| (Audited) | ||
Cash and cash equivalents | | $ | 159,454 | | $ | 172,962 |
Investment securities | |
|
| |
|
|
Available-for-sale, at fair value | |
| 655,282 | |
| 592,342 |
Held-to-maturity, at carrying value | |
| 362,586 | |
| — |
Loans held for sale | |
| 60,912 | |
| 122,440 |
Loans | |
| 1,800,386 | |
| 1,979,375 |
Allowance for loan losses | |
| (32,066) | |
| (34,246) |
Net loans | |
| 1,768,320 | |
| 1,945,129 |
Land, premises and equipment, net | |
| 18,403 | |
| 20,289 |
Operating lease right-of-use assets | |
| 3,821 | |
| 6,918 |
Accrued interest receivable | |
| 8,836 | |
| 9,662 |
Bank-owned life insurance | |
| 32,954 | |
| 32,363 |
Goodwill | |
| 30,201 | |
| 30,201 |
Other intangible assets | |
| 22,593 | |
| 25,919 |
Servicing rights | |
| 1,776 | |
| 1,987 |
Deferred income taxes, net | |
| 11,609 | |
| 9,409 |
Other assets | |
| 38,422 | |
| 44,150 |
Total assets | | $ | 3,175,169 | | $ | 3,013,771 |
Liabilities and Stockholders’ Equity | |
|
| |
|
|
Deposits | |
|
| |
|
|
Noninterest-bearing | | $ | 797,062 | | $ | 754,716 |
Interest-bearing | |
| 1,916,026 | |
| 1,817,277 |
Total deposits | |
| 2,713,088 | |
| 2,571,993 |
Long-term debt | |
| 58,963 | |
| 58,735 |
Operating lease liabilities | |
| 4,428 | |
| 7,861 |
Accrued expenses and other liabilities | |
| 45,495 | |
| 45,019 |
Total liabilities | |
| 2,821,974 | |
| 2,683,608 |
Stockholders’ equity | |
|
| |
|
|
Preferred stock, $1 par value, 2,000,000 shares authorized: 0 issued and outstanding | | | — | | | — |
Common stock, $1 par value, 30,000,000 shares authorized: 17,208,077 and 17,125,270 issued and outstanding | |
| 17,208 | |
| 17,125 |
Additional paid-in capital | |
| 91,783 | |
| 90,237 |
Retained earnings | |
| 243,638 | |
| 212,163 |
Accumulated other comprehensive income (loss) | |
| 566 | |
| 10,638 |
Total stockholders’ equity | |
| 353,195 | |
| 330,163 |
Total liabilities and stockholders’ equity | | $ | 3,175,169 | | $ | 3,013,771 |
8
Alerus Financial Corporation and Subsidiaries
Consolidated Statements of Income
(dollars and shares in thousands, except per share data)
| | Three months ended | | Nine months ended | |||||||||||
| | September 30, | | June 30, | | September 30, | | September 30, | | September 30, | |||||
|
| 2021 |
| 2021 |
| 2020 |
| 2021 |
| 2020 | |||||
Interest Income | | (Unaudited) | | (Unaudited) | | (Unaudited) | | (Unaudited) | | (Unaudited) | |||||
Loans, including fees | | $ | 18,888 | | $ | 19,324 | | $ | 21,962 | | $ | 58,779 | | $ | 63,876 |
Investment securities | |
|
| |
|
| |
|
| |
|
| |
|
|
Taxable | |
| 3,249 | |
| 2,897 | |
| 1,973 | |
| 8,547 | |
| 5,497 |
Exempt from federal income taxes | |
| 225 | |
| 233 | |
| 238 | |
| 694 | |
| 712 |
Other | |
| 185 | |
| 130 | |
| 116 | |
| 432 | |
| 816 |
Total interest income | |
| 22,547 | |
| 22,584 | |
| 24,289 | |
| 68,452 | |
| 70,901 |
Interest Expense | |
|
| |
|
| |
|
| |
|
| |
|
|
Deposits | |
| 880 | |
| 906 | |
| 1,683 | |
| 2,781 | |
| 7,633 |
Long-term debt | |
| 535 | |
| 538 | |
| 841 | |
| 1,361 | |
| 2,575 |
Total interest expense | |
| 1,415 | |
| 1,444 | |
| 2,524 | |
| 4,142 | |
| 10,208 |
Net interest income | |
| 21,132 | |
| 21,140 | |
| 21,765 | |
| 64,310 | |
| 60,693 |
Provision for loan losses | |
| (2,000) | |
| — | |
| 3,500 | |
| (2,000) | |
| 9,500 |
Net interest income after provision for loan losses | |
| 23,132 | |
| 21,140 | |
| 18,265 | |
| 66,310 | |
| 51,193 |
Noninterest Income | |
|
| |
|
| |
|
| |
|
| |
|
|
Retirement and benefit services | |
| 18,031 | |
| 17,871 | |
| 15,104 | |
| 53,157 | |
| 45,034 |
Wealth management | |
| 5,295 | |
| 5,138 | |
| 4,486 | |
| 15,419 | |
| 12,644 |
Mortgage banking | |
| 11,116 | |
| 12,287 | |
| 22,269 | |
| 40,535 | |
| 44,860 |
Service charges on deposit accounts | |
| 357 | |
| 330 | |
| 355 | |
| 1,025 | |
| 1,075 |
Net gains (losses) on investment securities | |
| 11 | |
| — | |
| 1,428 | |
| 125 | |
| 2,722 |
Other | |
| 1,230 | |
| 1,122 | |
| 1,614 | |
| 3,408 | |
| 4,340 |
Total noninterest income | |
| 36,040 | |
| 36,748 | |
| 45,256 | |
| 113,669 | |
| 110,675 |
Noninterest Expense | |
|
| |
|
| |
|
| |
|
| |
|
|
Compensation | |
| 23,291 | |
| 24,309 | |
| 22,740 | |
| 71,298 | |
| 62,684 |
Employee taxes and benefits | |
| 5,058 | |
| 5,572 | |
| 5,033 | |
| 16,443 | |
| 15,088 |
Occupancy and equipment expense | |
| 2,063 | |
| 1,918 | |
| 2,511 | |
| 6,212 | |
| 7,615 |
Business services, software and technology expense | |
| 5,332 | |
| 4,958 | |
| 4,378 | |
| 15,266 | |
| 13,501 |
Intangible amortization expense | |
| 1,088 | |
| 1,088 | |
| 990 | |
| 3,327 | |
| 2,971 |
Professional fees and assessments | |
| 1,503 | |
| 1,509 | |
| 1,070 | |
| 4,484 | |
| 3,303 |
Marketing and business development | |
| 865 | |
| 769 | |
| 929 | |
| 2,310 | |
| 2,088 |
Supplies and postage | |
| 549 | |
| 503 | |
| 248 | |
| 1,583 | |
| 1,630 |
Travel | |
| 174 | |
| 36 | |
| 26 | |
| 236 | |
| 338 |
Mortgage and lending expenses | |
| 1,231 | |
| 1,199 | |
| 1,434 | |
| 3,762 | |
| 3,916 |
Other | |
| 887 | |
| 689 | |
| 855 | |
| 2,712 | |
| 3,540 |
Total noninterest expense | |
| 42,041 | |
| 42,550 | |
| 40,214 | |
| 127,633 | |
| 116,674 |
Income before income taxes | |
| 17,131 | |
| 15,338 | |
| 23,307 | |
| 52,346 | |
| 45,194 |
Income tax expense | |
| 4,064 | |
| 3,644 | |
| 5,648 | |
| 12,370 | |
| 10,698 |
Net income | | $ | 13,067 | | $ | 11,694 | | $ | 17,659 | | $ | 39,976 | | $ | 34,496 |
Per Common Share Data | | | | | | | | | | | | | | | |
Earnings per common share | | $ | 0.75 | | $ | 0.67 | | $ | 1.01 | | $ | 2.29 | | $ | 1.98 |
Diluted earnings per common share | | $ | 0.74 | | $ | 0.66 | | $ | 0.99 | | $ | 2.26 | | $ | 1.94 |
Dividends declared per common share | | $ | 0.16 | | $ | 0.16 | | $ | 0.15 | | $ | 0.47 | | $ | 0.45 |
Average common shares outstanding | |
| 17,205 | |
| 17,194 | |
| 17,121 | |
| 17,182 | |
| 17,101 |
Diluted average common shares outstanding | |
| 17,499 | |
| 17,497 | |
| 17,453 | |
| 17,488 | |
| 17,435 |
9
Alerus Financial Corporation and Subsidiaries
Non-GAAP to GAAP Reconciliations and Calculation of Non-GAAP Financial Measures (unaudited)
(dollars and shares in thousands, except per share data)
|
| September 30, | | June 30, | | December 31, | | September 30, | | ||||
|
| 2021 |
| 2021 |
| 2020 |
| 2020 | | ||||
Tangible Common Equity to Tangible Assets |
| | | | | | | | | | | | |
Total common stockholders’ equity | | $ | 353,195 | | $ | 344,391 | | $ | 330,163 | | $ | 322,003 | |
Less: Goodwill | |
| 30,201 | |
| 30,201 | |
| 30,201 | |
| 27,329 | |
Less: Other intangible assets | |
| 22,593 | |
| 23,680 | |
| 25,919 | |
| 15,421 | |
Tangible common equity (a) | |
| 300,401 | |
| 290,510 | |
| 274,043 | |
| 279,253 | |
Total assets | |
| 3,175,169 | |
| 3,157,229 | |
| 3,013,771 | |
| 2,898,809 | |
Less: Goodwill | |
| 30,201 | |
| 30,201 | |
| 30,201 | |
| 27,329 | |
Less: Other intangible assets | |
| 22,593 | |
| 23,680 | |
| 25,919 | |
| 15,421 | |
Tangible assets (b) | |
| 3,122,375 | |
| 3,103,348 | |
| 2,957,651 | |
| 2,856,059 | |
Tangible common equity to tangible assets (a)/(b) | |
| 9.62 | % |
| 9.36 | % |
| 9.27 | % |
| 9.78 | % |
Tangible Book Value Per Common Share | | | | | | | | | | | | | |
Total common stockholders’ equity | | $ | 353,195 | | $ | 344,391 | | $ | 330,163 | | $ | 322,003 | |
Less: Goodwill | |
| 30,201 | |
| 30,201 | |
| 30,201 | | | 27,329 | |
Less: Other intangible assets | |
| 22,593 | |
| 23,680 | |
| 25,919 | |
| 15,421 | |
Tangible common equity (c) | |
| 300,401 | |
| 290,510 | |
| 274,043 | |
| 279,253 | |
Total common shares issued and outstanding (d) | |
| 17,208 | |
| 17,198 | |
| 17,125 | |
| 17,122 | |
Tangible book value per common share (c)/(d) | | $ | 17.46 | | $ | 16.89 | | $ | 16.00 | | $ | 16.31 | |
| | Three months ended | | Nine months ended | | |||||||||||
| | September 30, | | June 30, | | September 30, | | September 30, | | September 30, | | |||||
| | 2021 |
| 2021 |
| 2020 | | 2021 |
| 2020 | | |||||
Return on Average Tangible Common Equity | | | | | | | | | | | | | | | | |
Net income | | $ | 13,067 | | $ | 11,694 | | $ | 17,659 | | $ | 39,976 | | $ | 34,496 | |
Add: Intangible amortization expense (net of tax) | |
| 860 | |
| 860 | |
| 782 | |
| 2,628 | |
| 2,347 | |
Net income, excluding intangible amortization (e) | |
| 13,927 | |
| 12,554 | |
| 18,441 | |
| 42,604 | |
| 36,843 | |
Average total equity | |
| 353,196 | |
| 339,439 | |
| 314,921 | |
| 342,344 | |
| 303,825 | |
Less: Average goodwill | |
| 30,201 | |
| 30,201 | |
| 27,329 | |
| 30,201 | |
| 27,329 | |
Less: Average other intangible assets (net of tax) | |
| 18,272 | |
| 19,123 | |
| 12,565 | |
| 19,124 | |
| 13,343 | |
Average tangible common equity (f) | |
| 304,723 | |
| 290,115 | |
| 275,027 | |
| 293,019 | |
| 263,153 | |
Return on average tangible common equity (e)/(f) | |
| 18.13 | % |
| 17.36 | % |
| 26.67 | % |
| 19.44 | % |
| 18.70 | % |
Net Interest Margin (tax-equivalent) | |
|
| |
|
| |
|
| |
|
| |
|
| |
Net interest income | | $ | 21,132 | | $ | 21,140 | | $ | 21,765 | | $ | 64,310 | | $ | 60,693 | |
Tax-equivalent adjustment | |
| 115 | |
| 135 | |
| 116 | |
| 392 | |
| 325 | |
Tax-equivalent net interest income (g) | |
| 21,247 | |
| 21,275 | |
| 21,881 | |
| 64,702 | |
| 61,018 | |
Average earning assets (h) | |
| 3,035,798 | |
| 2,958,468 | |
| 2,744,758 | |
| 2,958,742 | |
| 2,534,038 | |
Net interest margin (tax-equivalent) (g)/(h) | |
| 2.78 | % |
| 2.88 | % |
| 3.17 | % |
| 2.92 | % |
| 3.22 | % |
Efficiency Ratio | |
|
| |
|
| |
|
| |
|
| |
|
| |
Noninterest expense | | $ | 42,041 | | $ | 42,550 | | $ | 40,214 | | $ | 127,633 | | $ | 116,674 | |
Less: Intangible amortization expense | |
| 1,088 | |
| 1,088 | |
| 990 | |
| 3,327 | |
| 2,971 | |
Adjusted noninterest expense (i) | |
| 40,953 | |
| 41,462 | |
| 39,224 | |
| 124,306 | |
| 113,703 | |
Net interest income | |
| 21,132 | |
| 21,140 | |
| 21,765 | |
| 64,310 | |
| 60,693 | |
Noninterest income | |
| 36,040 | |
| 36,748 | |
| 45,256 | |
| 113,669 | |
| 110,675 | |
Tax-equivalent adjustment | |
| 115 | |
| 135 | |
| 116 | |
| 392 | |
| 325 | |
Total tax-equivalent revenue (j) | |
| 57,287 | |
| 58,023 | |
| 67,137 | |
| 178,371 | |
| 171,693 | |
Efficiency ratio (i)/(j) | |
| 71.49 | % |
| 71.46 | % |
| 58.42 | % |
| 69.69 | % |
| 66.22 | % |
10
Alerus Financial Corporation and Subsidiaries
Analysis of Average Balances, Yields, and Rates (unaudited)
(dollars in thousands)
| | Three months ended | | Nine months ended | ||||||||||||||||||||||||||
| | September 30, 2021 | | June 30, 2021 | | September 30, 2020 | | September 30, 2021 | | September 30, 2020 | ||||||||||||||||||||
| | | | | Average | | | | | Average | | | | | Average | | | | | Average | | | | | Average | |||||
| | Average | | Yield/ | | Average | | Yield/ | | Average | | Yield/ | | Average | | Yield/ | | Average | | Yield/ | ||||||||||
|
| Balance |
| Rate |
| Balance |
| Rate |
| Balance |
| Rate |
| Balance |
| Rate |
| Balance |
| Rate | ||||||||||
Interest Earning Assets | | | | | | | | | | | | | | | | | | | | | | | | | | | | | | |
Interest-bearing deposits with banks | | $ | 281,768 | | 0.16 | % | | $ | 191,695 | | 0.12 | % | | $ | 169,770 |
| 0.12 | % | | $ | 219,636 | | 0.14 | % | | $ | 162,134 | | 0.51 | % |
Investment securities (1) | |
| 869,421 | | 1.61 | % | |
| 800,812 | | 1.60 | % | |
| 443,705 |
| 2.04 | % | |
| 778,307 | | 1.62 | % | |
| 383,591 | | 2.23 | % |
Loans held for sale | |
| 57,233 | | 2.40 | % | |
| 71,447 | | 2.26 | % | |
| 90,634 |
| 2.44 | % | |
| 70,218 | | 2.25 | % | |
| 64,555 | | 2.64 | % |
Loans | |
|
| |
| | |
|
| |
| | |
|
|
|
| | |
|
| |
| | |
|
| |
| |
Commercial: | |
|
| |
| | |
|
| |
| | |
|
|
|
| | |
|
| |
| | |
|
| |
| |
Commercial and industrial | |
| 544,811 | | 4.95 | % | |
| 627,613 | | 4.55 | % | |
| 782,853 |
| 4.34 | % | |
| 615,310 | | 4.73 | % | |
| 667,742 | | 4.48 | % |
Real estate construction | |
| 37,743 | | 3.99 | % | |
| 42,511 | | 4.28 | % | |
| 32,747 |
| 4.47 | % | |
| 41,812 | | 4.17 | % | |
| 30,385 | | 4.64 | % |
Commercial real estate | |
| 567,696 | | 3.67 | % | |
| 568,827 | | 3.71 | % | |
| 525,514 |
| 4.02 | % | |
| 565,861 | | 3.72 | % | |
| 515,761 | | 4.31 | % |
Total commercial | |
| 1,150,250 | | 4.29 | % | |
| 1,238,951 | | 4.15 | % | |
| 1,341,114 |
| 4.22 | % | |
| 1,222,983 | | 4.24 | % | |
| 1,213,888 | | 4.41 | % |
Consumer | |
|
| |
| | |
|
| |
| | |
|
|
|
| | |
|
| |
| | |
|
| |
| |
Residential real estate first mortgage | |
| 487,699 | | 3.32 | % | |
| 459,278 | | 3.53 | % | |
| 460,995 |
| 3.96 | % | |
| 468,395 | | 3.53 | % | |
| 460,505 | | 4.05 | % |
Residential real estate junior lien | |
| 129,239 | | 4.57 | % | |
| 129,544 | | 4.58 | % | |
| 153,326 |
| 4.54 | % | |
| 132,145 | | 4.67 | % | |
| 163,332 | | 4.84 | % |
Other revolving and installment | |
| 53,683 | | 4.45 | % | |
| 60,213 | | 4.31 | % | |
| 79,343 |
| 4.50 | % | |
| 60,785 | | 4.37 | % | |
| 80,169 | | 4.58 | % |
Total consumer | |
| 670,621 | | 3.65 | % | |
| 649,035 | | 3.81 | % | |
| 693,664 |
| 4.15 | % | |
| 661,325 | | 3.84 | % | |
| 704,006 | | 4.30 | % |
Total loans (1) | |
| 1,820,871 | | 4.05 | % | |
| 1,887,986 | | 4.04 | % | |
| 2,034,778 |
| 4.20 | % | |
| 1,884,308 | | 4.10 | % | |
| 1,917,894 | | 4.37 | % |
Federal Reserve/FHLB stock | |
| 6,505 | | 4.33 | % | |
| 6,528 | | 4.36 | % | |
| 5,871 |
| 4.40 | % | |
| 6,273 | | 4.37 | % | |
| 5,864 | | 4.58 | % |
Total interest earning assets | |
| 3,035,798 | | 2.96 | % | |
| 2,958,468 | | 3.08 | % | |
| 2,744,758 |
| 3.54 | % | |
| 2,958,742 | | 3.11 | % | |
| 2,534,038 | | 3.75 | % |
Noninterest earning assets | | | 155,079 | | | | | | 161,272 | | | | | | 163,386 | | | | | | 161,077 | | | | | | 156,144 | | | |
Total assets | | $ | 3,190,877 | |
| | | $ | 3,119,740 | |
| | | $ | 2,908,144 |
|
| | | $ | 3,119,819 | |
| | | $ | 2,690,182 | |
| |
Interest-Bearing Liabilities | |
|
| |
| | |
|
| |
| | |
|
|
|
| | |
|
| |
| | |
|
| |
| |
Interest-bearing demand deposits | | $ | 692,873 | | 0.14 | % | | $ | 697,789 | | 0.14 | % | | $ | 589,633 |
| 0.27 | % | | $ | 678,015 | | 0.15 | % | | $ | 528,024 | | 0.34 | % |
Money market and savings deposits | |
| 1,009,564 | | 0.14 | % | |
| 1,015,358 | | 0.14 | % | |
| 961,669 |
| 0.32 | % | |
| 1,018,347 | | 0.15 | % | |
| 889,039 | | 0.66 | % |
Time deposits | |
| 217,756 | | 0.50 | % | |
| 208,338 | | 0.56 | % | |
| 204,969 |
| 0.98 | % | |
| 212,297 | | 0.57 | % | |
| 201,747 | | 1.29 | % |
Short-term borrowings | |
| 10 | | — | % | |
| — | | — | % | |
| — |
| — | % | |
| 3 | | — | % | |
| 107 | | — | % |
Long-term debt | |
| 58,968 | | 3.60 | % | |
| 58,996 | | 3.66 | % | |
| 58,739 |
| 5.70 | % | |
| 48,002 | | 3.79 | % | |
| 58,747 | | 5.85 | % |
Total interest-bearing liabilities | |
| 1,979,171 | | 0.28 | % | |
| 1,980,481 | | 0.29 | % | |
| 1,815,010 |
| 0.55 | % | |
| 1,956,664 | | 0.28 | % | |
| 1,677,664 | | 0.81 | % |
Noninterest-Bearing Liabilities and Stockholders' Equity | | | | | | | | | | | | | | | | | | | | | | | | | | | | | | |
Noninterest-bearing deposits | |
| 799,854 | |
| | |
| 755,773 | |
| | |
| 698,594 |
|
| | |
| 762,685 | |
| | |
| 651,971 | |
| |
Other noninterest-bearing liabilities | | | 58,656 | | | | | | 44,047 | | | | | | 79,619 | | | | | | 58,126 | | | | | | 56,722 | | | |
Stockholders’ equity | |
| 353,196 | |
| | |
| 339,439 | |
| | |
| 314,921 |
|
| | |
| 342,344 | |
| | |
| 303,825 | |
| |
Total liabilities and stockholders’ equity | | $ | 3,190,877 | |
| | | $ | 3,119,740 | |
| | | $ | 2,908,144 |
|
| | | $ | 3,119,819 | |
| | | $ | 2,690,182 | |
| |
Net interest rate spread | |
| | | 2.68 | % | |
|
| | 2.79 | % | |
|
|
| 2.99 | % | |
|
| | 2.83 | % | |
|
| | 2.94 | % |
Net interest margin, tax-equivalent (2) | |
| | | 2.78 | % | |
|
| | 2.88 | % | |
|
|
| 3.17 | % | |
|
| | 2.92 | % | |
|
| | 3.22 | % |
| (1) | Taxable-equivalent adjustment was calculated utilizing a marginal income tax rate of 21.0%. |
| (2) | Represents a non-GAAP financial measure. See “Non-GAAP to GAAP Reconciliations and Calculation of Non-GAAP Financial Measures.” |
11