UNITED STATES
SECURITIES AND EXCHANGE COMMISSION
Washington, D.C. 20549

FORM 10-K
ANNUAL REPORT PURSUANT TO SECTION 13 OR 15(d) OF THE SECURITIES EXCHANGE ACT OF 1934 | |
For the fiscal year ended December 31, 2019
or
TRANSITION REPORT PURSUANT TO SECTION 13 OR 15(d) OF THE SECURITIES EXCHANGE ACT OF 1934 | |
Commission file number 1-12936
(Exact name of registrant as specified in its charter)
(State or other jurisdiction of incorporation or organization) | (I.R.S. Employer Identification No.) | |
(Address of principal executive offices)
(217 ) 228-6011
(Registrant’s telephone number, including area code)
Securities registered pursuant to Section 12(b) of the Act:
Title of each class | Trading Symbol | Name of each exchange on which registered |
Securities registered pursuant to Section 12(g) of the Act: None
Indicate by check mark if the registrant is a well-known seasoned issuer, as defined by Rule 405 of the Securities Act. Yes ☐ No ☑
Indicate by check mark if the registrant is not required to file reports pursuant to Section 13 or Section 15(d) of the Act. Yes ☐ No ☑
Indicate by check mark whether the registrant (1) has filed all reports required to be filed by Section 13 or 15(d) of the Securities Exchange Act of 1934 during the preceding 12 months (or such shorter period that the registrant was required to file such reports) and (2) has been subject to such filing requirements for the past 90 days. Yes ☑ No ☐
Indicate by check mark whether the registrant has submitted electronically every Interactive Data File required to be submitted and posted pursuant to Rule 405 of Regulation S-T during the preceding 12 months (or for such shorter period that the registrant was required to submit and post such files). Yes ☑ No ☐
Indicate by check mark whether the registrant is a large accelerated filer, an accelerated filer, a non-accelerated filer, a smaller reporting company, or an emerging growth company. See the definitions of “large accelerated filer,” “accelerated filer,” “smaller reporting company”, and "emerging growth company" in Rule 12b-2 of the Exchange Act.
Large accelerated filer | ☐ | ☑ | ||
Non-accelerated filer (Do not check if a smaller reporting company) | ☐ | Smaller reporting company | ||
Emerging growth company | ||||
If an emerging growth company, indicate by check mark if the registrant has elected not to use the extended transition period for complying with any new or revised financial accounting standards provided pursuant to Section 13(a) of the Exchange Act. ☐
Indicate by check mark whether the registrant is a shell company (as defined in Rule 12b-2 of the Act). Yes ☐ No ☑
The aggregate market value of the shares of common stock of the registrant held by non-affiliates as of June 28, 2019, was approximately $162 million based upon the last reported sale price of the common stock on the New York Stock Exchange on June 28, 2019.
Indicate the number of shares of Titan International, Inc. outstanding: 60,361,992 shares of common stock, $0.0001 par value, as of February 25, 2020.
DOCUMENTS INCORPORATED BY REFERENCE
Portions of the registrant’s definitive proxy statement for the annual meeting of stockholders, to be held on June 11, 2020, are incorporated by reference into Part III of this Form 10-K.
TITAN INTERNATIONAL, INC.
Index to Annual Report on Form 10-K
Page | ||
2
FORWARD-LOOKING STATEMENTS
This Form 10-K contains forward-looking statements, which are covered by the "Safe Harbor for Forward-Looking Statements" provided by the Private Securities Litigation Reform Act of 1995. Readers can identify these statements by the fact that they do not relate strictly to historical or current facts. The Company tried to identify forward-looking statements in this report by using words such as “anticipates,” “estimates,” “expects,” “intends,” “plans,” and “believes,” and similar expressions or future or conditional verbs such as “will,” “should,” “would,” “may,” and “could.” These forward-looking statements include, among other items, statements relating to the following:
• | The Company's financial performance; |
• | Anticipated trends in the Company’s business; |
• | Expectations with respect to the end-user markets into which the Company sells its products (including agricultural equipment, earthmoving/construction equipment, and consumer products); |
• | Future expenditures for capital projects; |
• | The Company’s ability to continue to control costs and maintain quality; |
• | The Company's ability to meet conditions of loan agreements; |
• | The Company’s business strategies, including its intention to introduce new products; |
• | Expectations concerning the performance and success of the Company’s existing and new products; and |
• | The Company’s intention to consider and pursue acquisition and divestiture opportunities. |
Readers of this Form 10-K should understand that these forward-looking statements are based on the Company’s current expectations and assumptions about future events and are subject to a number of risks, uncertainties, and changes in circumstances that are difficult to predict, including those in Part 1, Item 1A of this report, “Risk Factors,” certain of which are beyond the Company’s control.
Actual results could differ materially from those expressed in, or implied by, these forward-looking statements as a result of various factors, including:
• | The effect of a recession on the Company and its customers and suppliers; |
• | Changes in the Company’s end-user markets into which the Company sells its products as a result of domestic and world economic or regulatory influences or otherwise; |
• | Changes in the marketplace, including new products and pricing changes by the Company’s competitors; |
• | Ability to maintain satisfactory labor relations; |
• | Unfavorable outcomes of legal proceedings; |
• | The Company's ability to comply with current or future regulations applicable to the Company's business and the industry in which it competes or any actions taken or orders issued by regulatory authorities; |
• | Availability and price of raw materials; |
• | Levels of operating efficiencies; |
• | The effects of the Company's indebtedness and its compliance with the terms thereof; |
• | Changes in the interest rate environment and their effects on the Company's outstanding indebtedness; |
• | Unfavorable product liability and warranty claims; |
• | Actions of domestic and foreign governments, including the imposition of additional tariffs; |
• | Geopolitical and economic uncertainties relating to the countries in which the Company operates or does business; |
• | Risks associated with acquisitions, including difficulty in integrating operations and personnel, disruption of ongoing business, and increased expenses; |
• | Results of investments; |
• | The effects of potential processes to explore various strategic transactions, including potential dispositions; |
• | Fluctuations in currency translations; |
• | Climate change and related laws and regulations; |
3
• | Risks associated with environmental laws and regulations; |
• | Risks relating to our manufacturing facilities, including that any of our material facilities may become inoperable; and |
• | Risks related to financial reporting, internal controls, tax accounting, and information systems. |
Any changes in such factors could lead to significantly different results. Any assumptions that are inaccurate or do not prove to be correct could have a material adverse effect on the Company’s ability to achieve the results as indicated in forward-looking statements. Forward-looking statements speak only as of the date of this report. The Company undertakes no obligation to publicly update or revise any forward-looking statements, whether as a result of new information, future events, or otherwise. In light of these risks and uncertainties, there can be no assurance that the forward-looking information and assumptions contained in this document will in fact transpire. The reader should not place undue reliance on the forward-looking statements included in this report or that may be made elsewhere from time to time by the Company, or on its behalf. All forward-looking statements attributable to Titan are expressly qualified by these cautionary statements.
PART I
ITEM 1 – BUSINESS
OVERVIEW
Titan International, Inc., together with its subsidiaries (Titan or the Company), is a global wheel, tire, and undercarriage industrial manufacturer and supplier that services customers across the globe. Titan traces its roots to the Electric Wheel Company in Quincy, Illinois, which was founded in 1890. Titan was originally incorporated in 1983 and has increased its global footprint and enhanced product offerings through major acquisitions which include the following:
• | 2005 - The Goodyear Tire & Rubber Company’s North American farm tire assets |
• | 2006 - Off-the-road (OTR) tire assets of Continental Tire North America |
• | 2011 - The Goodyear Tire & Rubber Company's Latin American farm tire business |
• | 2012 - 56% controlling interest in Planet Corporation Group, now known as Titan Australia |
• | 2013/2014 - a noncontrolling interest in Voltyre-Prom, a leading producer of agricultural and industrial tires, which owns and operates an over two million square foot manufacturing facility located in Volgograd Russia; and |
• | 2018 - the remaining 44% interest in Titan Australia |
• | 2019 - additional 21.4% noncontrolling interest in Voltyre-Prom (from 42.9% to 64.3%) |
As a leading manufacturer in the off-highway industry, Titan produces a broad range of products to meet the specifications of original equipment manufacturers (OEMs) and aftermarket customers in the agricultural, earthmoving/construction, and consumer markets. Titan manufactures and sells certain tires under the Goodyear Farm Tire and Titan Tire brands and has complete research and development facilities to validate wheel and rim designs.
BUSINESS SEGMENTS
Titan designs and manufactures products for OEMs and aftermarket customers in the agricultural, earthmoving/construction, and consumer markets. For additional information concerning the revenues, expenses, income from operations, and assets attributable to each of the segments in which the Company operates, see Note 28 to the Company's consolidated financial statements, included in Part II, Item 8 of this annual report.
AGRICULTURAL SEGMENT
Titan’s agricultural rims, wheels, tires, and undercarriage systems and components are manufactured for use on various agricultural equipment, including tractors, combines, skidders, plows, planters, and irrigation equipment, and are sold directly to OEMs and to the aftermarket through independent distributors, equipment dealers, and Titan’s distribution centers. The wheels and rims range in diameter from nine inches to 54 inches, with the 54-inch diameter being the largest agricultural wheel manufactured in North America. Basic configurations are combined with distinct variations (such as different centers and a wide range of material thickness) allowing the Company to offer a broad line of products to meet customer specifications. Titan’s agricultural tires range from approximately one foot to approximately seven feet in outside diameter and from five inches to 55 inches in width. The Company offers the added value of delivering a complete wheel and tire assembly to OEM and aftermarket customers.
4
EARTHMOVING/CONSTRUCTION SEGMENT
The Company manufactures rims, wheels, tires, and undercarriage systems and components for various types of OTR earthmoving, mining, military, construction, and forestry equipment, including skid steers, aerial lifts, cranes, graders and levelers, scrapers, self-propelled shovel loaders, articulated dump trucks, load transporters, haul trucks, backhoe loaders, crawler tractors, lattice cranes, shovels, and hydraulic excavators. The Company provides OEM and aftermarket customers with a broad range of earthmoving/construction wheels ranging in diameter from 15 to 63 inches and in weight from 125 pounds to 7,000 pounds. The 63-inch diameter wheel is the largest manufactured in North America for the earthmoving/construction market. Titan’s earthmoving/construction tires range from approximately three feet to approximately 13 feet in outside diameter and in weight from 50 pounds to 12,500 pounds. The Company also offers the added value of wheel and tire assembly for certain applications in the earthmoving/construction segment.
CONSUMER SEGMENT
Titan manufactures bias truck tires in Latin America and light truck tires in Russia. Titan also offers select products for ATVs, turf, and golf cart applications. This segment also includes sales that do not readily fall into the Company's other segments.
COMPETITIVE STRENGTHS
Titan’s strong market position in the off-highway wheel, tire, and undercarriage market and its long-term core customer relationships contribute to the Company’s competitive strengths. Titan's production of both wheels and tires enables the Company to provide a one-stop solution for its customers' wheel and tire assembly needs. These strengths, along with Titan’s dedication to the off-highway equipment market, continue to drive the Company forward.
• | Strong Market Position |
As a result of Titan’s offering of a broad range of specialized wheels, tires, assemblies, and undercarriage systems and components, Titan is a leader in the global off-highway market. Through an extensive dealer network and sales force, the Company is able to reach an increasing number of aftermarket and OEM customers which build Titan’s image and brand recognition. The Company’s production of the Goodyear Farm Tire brand in North America, Latin America, Europe, the Middle East and Africa contributes to overall visibility and customer confidence. Years of product design and engineering experience have enabled Titan to improve existing products and develop new ones, such as Low Sidewall (LSW®), which have been well received in the marketplace. Titan believes it has benefited from significant barriers to entry, such as the substantial investment necessary to replicate the Company’s manufacturing equipment and numerous tools, dies and molds, many of which are used in custom processes.
• | Wheel and Tire Manufacturing Capabilities |
The Company’s position as a manufacturer of both wheels and tires allows Titan to mount and deliver one of the largest selections of off-highway assemblies in North America. Both standard and LSW assemblies are delivered as a single, complete unit based on each customer’s specific requirements. Titan offers this value-added service for wheel and tire assemblies for the agricultural, earthmoving/construction, and consumer segments.
• | Long-Term Core Customer Relationships |
The Company’s top customers, including global leaders in agricultural and construction equipment manufacturing, have been purchasing products from Titan or its predecessors for numerous years. Customers including AGCO Corporation, Caterpillar Inc., CNH Global N.V., Deere & Company, Hitachi, Ltd., Kubota Corporation, Liebherr, and Volvo have helped sustain Titan’s market leading position in wheel, tire, assembly, and undercarriage products.
BUSINESS STRATEGY
Titan’s strategy is to become the worldwide leader in manufacturing and distribution of wheels, tires, assemblies and undercarriage products and to serve our customers' needs through product innovation and quality service in the Company's key markets: agriculture, earthmoving/construction, and consumer. Other strategic considerations include:
• | Tire Technology |
The Company has developed an LSW tire technology, featuring a larger rim diameter and a smaller sidewall than standard tires. With LSW tire technology, which has been widely adopted within the automotive industry, users experience reduced power hop, road lope, soil compaction, and fuel consumption as well as improved safety and performance. Both power hop and road lope can disturb ride quality and impede equipment performance. The benefits correspond to Titan’s markets through superior comfort, ride and fuel economy. Titan continues to enhance the LSW technology and expand its LSW product and other tire offerings in both the agricultural and construction segments.
5
• | Increase Aftermarket Tire Business |
The Company has concentrated on increasing Titan's presence in the tire aftermarket, which historically has been somewhat less cyclical than the OEM market. The aftermarket also offers the potential for higher profit margins and is a larger market. Titan’s strategy to enhance the Company's aftermarket platform focuses on improving the customer experience and product positioning in key sales markets. To support this strategy, the Company has a dedicated salesforce for the tire aftermarket.
• | Improve Operating Efficiencies |
The Company regularly works to improve the operating efficiency of assets and manufacturing facilities. Titan integrates each facility’s strengths through, among others, transfer of equipment and business to the facilities that are best equipped to handle the work, which enables Titan to increase utilization and spread operating costs over a greater volume of products. Titan continues to implement a comprehensive program to refurbish, modernize, and enhance the technology of its manufacturing equipment. Titan has also made investments to streamline processes, increase productivity, and lower costs in the selling, general and administrative areas.
• | Enhance Design Capabilities and New Product Development |
Equipment manufacturers constantly face changing industry dynamics. Titan directs its business and marketing strategy to understand and address the needs of customers and demonstrate the advantages of products. In particular, the Company often collaborates with customers in the design of new and enhanced products and recommends modified products to customers based on the Company's own market information. These value-added services enhance Titan’s relationships with customers. The Company tests new designs and technologies and develops manufacturing methods to improve product quality, performance, and cost.
• | Reduction of Non-Core Assets and Other Strategic Considerations |
The Company is exploring reducing non-core assets and improving underperforming assets in an effort to improve cash flow and working capital and reduce debt. The Company’s expertise in the manufacture of off-highway wheels, tires, and undercarriage systems and components has permitted it to take advantage of opportunities to acquire businesses that complement this product line. In the future, Titan may consider strategic partnerships, joint ventures or make additional strategic acquisitions of businesses that have an off-highway focus. The Company continually explores worldwide opportunities to expand its manufacturing and distribution capabilities in order to serve new and existing geographies.
COMPETITION
The Company competes with several domestic and international companies, some of which are larger and have greater financial and marketing resources than Titan. The Company believes it is a primary source of steel wheels and rims to the majority of its North American customers. Major competitors in the off-highway wheel market include GKN Wheels, Ltd., Trelleborg Group, and Topy Industries, Ltd. Significant competitors in the off-highway tire market include Alliance Tire Company Ltd., Balkrishna Industries Limited (BKT), Bridgestone/Firestone, Michelin, Mitas a.s., and Pirelli. Significant competitors in the undercarriage market include Berco and Caterpillar.
The Company competes on the basis of price, quality, sales support, customer service, design capability, and delivery time. The Company's position of manufacturing both the wheel and the tire allows Titan to provide innovative assembly solutions for our customers, creating a competitive advantage in the marketplace. The Company’s ability to compete with international competitors may be adversely affected by various factors, including currency fluctuations and tariffs imposed by domestic and foreign governments. Titan owns the molds and dies used to produce its wheels and tires. However, certain of the Company’s OEM customers could elect to manufacture their own products to meet their requirements or to otherwise compete with the Company. The Company may be adversely affected by increased competition in the markets in which it operates, or competitors developing products that are more effective, less expensive, or otherwise rendering certain of Titan’s products less competitive. From time to time, certain of the Company’s competitors have reduced their prices in particular product categories, which has prompted Titan to reduce prices as well. There can be no assurance that competitors of the Company will not further reduce prices in the future or that any such reductions would not have a material adverse effect on the Company.
OPERATIONS
Titan’s operations include manufacturing wheels, manufacturing tires, combining these wheels and tires into assemblies, and manufacturing undercarriage systems and components for use in the agricultural, earthmoving/construction, and consumer markets. These operations entail many manufacturing processes in order to complete the finished products.
6
• | Wheel Manufacturing Process |
Most agricultural wheels are produced using a rim and a center disc. A rim is produced by first cutting large steel sheets to required width and length specifications. These steel sections are rolled and welded to form a circular rim, which is flared and formed in the rollform operation. The majority of discs are manufactured using presses that both blank and form the center to specifications in multiple stage operations. The Company e-coats wheels using a multi-step process prior to the final paint top coating.
Large earthmoving/construction steel wheels are manufactured from hot and cold-rolled steel sections. Hot-rolled sections are generally used to increase cross section thickness in high stress areas of large diameter wheels. A special cold forming process for certain wheels is used to increase cross section thickness while reducing the number of wheel components. Rims are built from a series of hoops that are welded together to form a rim base. The complete rim base is made from either three or five separate parts that lock together after the rubber tire has been fitted to the wheel, the parts have been fully assembled, and the assembly inflated.
For most wheels in our consumer segment, the Company manufactures rims and center discs from rolled and flat steel. Rims are rolled and welded, and discs are stamped and formed from the sheets. The manufacturing process then entails welding the rims to the centers and painting the assembled product.
• | Tire Manufacturing Process |
The first stage in tire production is the mixing of rubber, carbon black, and chemicals to form various rubber compounds. These rubber compounds are then extruded and processed with textile or steel materials to make specific components. These components – beads (wire bundles that anchor the tire with the wheel), plies (layers of fabric that give the tire strength), belts (fabric or steel fabric wrapped under the tread in some tires), tread, and sidewall – are then assembled into an uncured tire carcass. The uncured carcass is placed into a press that molds and vulcanizes the carcass under set time, temperature, and pressure into a finished tire.
• | Wheel and Tire Assemblies |
The Company’s position as a manufacturer of both wheels and tires allows Titan to mount and deliver one of the largest selections of off-highway assemblies in North America. Titan offers this value-added service of one-stop solution for wheel and tire assemblies for the agricultural, earthmoving/construction, and consumer segments. Both standard and LSW assemblies are delivered as a single, complete unit based on each customer’s specific requirements.
• | Undercarriage Manufacturing Process |
The undercarriage components (track groups, track and carrier rollers, idler assemblies, and sprockets) are all manufactured from steel and produced according to customer specifications.
All of the track groups produced by the Company are built from four major parts: shoes, right and left hand links, pins, and bushings. Shoes are manufactured from steel cast in the Company foundry or obtained from different shapes of hot rolled profiles (depending on application), sheared to length, and then heat treated for high wear bending and breaking resistance. Right and left hand links are hot forged, trimmed, mass heat treated, machined, and finally induction hardened on rail surface for optimal wear and fatigue resistance. Pins are made from round bars that are cut, machined, heat treated, and surface finished. Bushings are generally cold extruded, machined, mass heat treated, and finally carburized or induction hardened for wear resistance and optimal toughness.
The lifetime lubricated and maintenance-free track and carrier rollers are assembled with two major components: single or double flange roller shells (typically hot forged in halves, deep hardened, friction or arc welded, and finish machined with metallurgical characteristics depending upon size and application) and shafts (generally cut from bars or forged, mass heat treated, rough machined, induction hardened, and ground).
The idler assemblies are also lifetime lubricated, for virtually no maintenance. They are offered with cast (single web or hollow design) or fabricated shells, depending on size and application, and feature induction-hardened tread surfaces for optimal wear resistance.
The sprockets, designed to transfer the machine driving loads from the final drive to the track, are produced cast or forged in several geometric options, depending upon size and application. They are also heat treated for wear resistance and cracking resistance.
The undercarriage systems, custom designed and produced by the Company, consist of a structured steel fabricated frame, all the undercarriage components mentioned above (track groups, track and carrier rollers, idler assemblies, and sprockets) and a final drive. They are completely assembled in house, for consistent quality.
7
• | Quality Control |
The Company is ISO certified at all four main domestic manufacturing facilities located in Bryan, Ohio; Des Moines, Iowa; Freeport, Illinois; and Quincy, Illinois, as well as the majority of the foreign manufacturing facilities. The ISO series is a set of related and internationally recognized standards of management and quality assurance. The standards specify guidelines for establishing, documenting, and maintaining a system to ensure quality. The ISO certifications are a testament to Titan’s dedication to providing quality products for its customers.
• | International Operations |
The Company operates manufacturing facilities in Latin America, Europe and Russia. The Latin American, European and Russian operations accounted for 18%, 22%, and 6% of the Company's net sales, respectively, for the year ended December 31, 2019 and 17%, 23% and 6% of net sales, respectively, for the year ended December 31, 2018.
RAW MATERIALS
Steel, natural rubber, synthetic rubber, carbon black, bead wire, and fabric are the primary raw materials used by the Company. To ensure a consistent steel supply, Titan purchases raw steel from various steel mills and maintains relationships with steel processors for steel preparation. The Company is not dependent on any single producer for its steel supply; however, some components do have limited suppliers. Rubber and other raw materials for tire manufacture represent some of the Company’s largest commodity expenses. Titan has developed a procurement strategy and practice designed to mitigate price risk and lower cost. Titan buys rubber in markets where there are usually several sources of supply. In addition to the development of key domestic suppliers, the Company’s strategic procurement plan includes international steel and rubber suppliers to assure competitive price and quality in the global marketplace. As is customary in the industry, the Company does not have long-term contracts for the purchase of steel or rubber and, therefore, purchases are subject to price fluctuations.
RESEARCH, DEVELOPMENT, AND ENGINEERING
The Company’s research, development, and engineering staff tests original designs and technologies and develops new manufacturing methods to improve product performance. Titan’s engineering and manufacturing resources are focused on designing quality products that address the needs of our customers and end-users across the markets that Titan serves. Titan’s team of experienced engineers continuously work on new and improved engineered solutions that evolve with today’s applications for the off-highway wheel, tire, and assembly markets. Titan's advantage as both a wheel and tire manufacturer allows the Company to design, test, and bring to market innovative solutions to meet the specific needs of its customers. For example, Titan has developed the LSW technology, featuring a larger rim diameter and a smaller sidewall than standard tires, which helps reduce power hop, road lope, soil compaction, and provides improved safety and performance. Research and development (R&D) expenses are expensed as incurred. R&D costs were $9.9 million, $11.1 million, and $10.3 million for the years ended December 31, 2019, 2018, and 2017, respectively.
CUSTOMERS
Titan’s 10 largest customers accounted for 38% of net sales for the year ended December 31, 2019, and 35% for the year ended December 31, 2018. Net sales to Deere & Company in Titan's agricultural, earthmoving/construction, and consumer segments combined represented 11% of the Company's consolidated revenues for the year ended December 31, 2019. No other customer accounted for 10% or more of Titan's net sales in 2019. Management believes the Company is not dependent on any single customer; however, certain products are dependent on a few customers. While the loss of any substantial customer could impact Titan’s business, the Company believes that its diverse product mix and customer base should minimize a longer-term impact caused by any such loss.
ORDER BACKLOG
The Company's backlog of orders is not considered material to, or a significant factor in, evaluating and understanding any of the Company's business segments or Titan's businesses considered as a whole.
MARKETING AND DISTRIBUTION
The Company employs an internal sales force and utilizes several manufacturing representative firms for sales in North America, Europe, Latin America, the CIS region, and other worldwide locations. Sales representatives are primarily organized within geographic regions.
Titan distributes wheels, tires, assemblies, and undercarriage systems directly to OEMs. The distribution of aftermarket tires occurs primarily through a network of independent and OEM-affiliated dealers.
8
SEASONALITY
Agricultural equipment sales are seasonal by nature. Farmers generally order equipment to be delivered before the growing season. Shipments to OEMs in the agricultural industry in the U.S. and Europe usually peak during the Company’s first and second quarters for the spring planting period, while shipments in Latin America usually peak during the Company's second and third quarters for the fall planting period. Earthmoving/construction and consumer segments have historically experienced higher demand in the first and second quarters. These segments are affected by mining, building, and economic conditions.
EMPLOYEES
At December 31, 2019, the Company employed approximately 6,200 people worldwide, including approximately 4,200 located outside the United States.
At December 31, 2019, the employees at each of the Company's Bryan, Ohio; Freeport, Illinois; and Des Moines, Iowa facilities, which collectively account for approximately 37% of the Company’s U.S. employees, were covered by collective bargaining agreements which are scheduled to expire in November 2021.
Outside the United States, the Company enters into employment agreements in those countries in which such relationships are mandatory or customary. The provisions of these agreements generally correspond in each case with the required or customary terms in the subject jurisdiction.
PATENTS, TRADEMARKS, AND ROYALTIES
The Company owns various patents and trademarks and continues to apply for patent protection for new products. Due to the difficult nature of predicting the interpretation of patent laws, the Company cannot anticipate or predict any material adverse effect on its operations, cash flows, or financial condition to the extent the Company is unable to protect its patents or should the Company be found to be infringing others' patents.
The Company has trademark license agreements with The Goodyear Tire & Rubber Company to manufacture and sell certain farm tires under the Goodyear name. These agreements cover sales in North America, Latin America, Europe, the Middle East, Africa, Russia, and other Commonwealth of Independent States countries. Each of these agreements is scheduled to expire in 2025. The Company also has a trademark license agreement with Goodyear to manufacture and sell certain non-farm tire products in Latin America under the Goodyear name.
ENVIRONMENTAL LAWS AND REGULATIONS
The Company's policy is to conduct its global operations in accordance with all applicable laws, regulations and other requirements. In the ordinary course of business, similar to other industrial manufacturing companies, Titan is subject to extensive and evolving federal, state, local, and international environmental laws and regulations. From time to time, the Company has, and may in the future, incurred costs and additional charges associated with environmental compliance and cleanup projects, including remediation activities. As appropriate, the Company makes provisions for the estimated financial impact of potential environmental cleanup activities. The Company’s policy is to accrue environmental cleanup-related costs of a non-capital nature when those costs are believed to be probable and can be reasonably estimated. Expenditures that extend the life of the related property, or mitigate or prevent future environmental contamination, are capitalized. The Company does not currently anticipate any material capital expenditures for environmental control facilities. The quantification of environmental exposures requires an assessment of many factors, including changing laws and regulations, advances in environmental technologies, the quality of information available related to specific sites, the assessment stage of the site investigation, preliminary findings, and the length of time involved in remediation or settlement. Due to the difficult nature of predicting future environmental costs, the Company may not be able to anticipate or predict with certainty the potential material adverse effect on its operations, cash flows, or financial condition as a result of efforts to comply with, or any future liability under, environmental laws, regulations or other requirements.
9
AVAILABLE INFORMATION
The Company’s annual report on Form 10-K, quarterly reports on Form 10-Q, current reports on Form 8-K, and any amendments to those reports are made available, without charge, through the Company’s website located at www.titan-intl.com under "Investor Relations" as soon as reasonably practicable after they are filed with the Securities and Exchange Commission (SEC). You can also obtain copies of these materials by accessing the SEC’s website at www.SEC.gov. The following documents are also posted on the Company’s website:
• | Corporate Governance Policy |
• | Code of Business Conduct |
• | Audit Committee Charter |
• | Compensation Committee Charter |
• | Nominating Committee Charter |
• | Corporate Governance Committee Charter |
Printed copies of these documents are available, without charge, by writing to: Titan International, Inc.,
c/o Corporate Secretary, 2701 Spruce Street, Quincy, IL 62301.
The information on, or that may be accessed through, the aforementioned websites is not incorporated into this filing and should not be considered a part of this filing.
ITEM 1A – RISK FACTORS
The Company is subject to various risks and uncertainties that it believes are significant to our business. These risks relate to or arise out of the nature of the Company's business and overall business, economic, financial, legal, and other factors or conditions that may affect the Company. In addition to risks discussed elsewhere in this report, the following are factors that could, individually or in the aggregate, materially adversely affect the Company’s business, financial condition and results of operations and cause the Company's actual results to differ from past results and/or those anticipated, estimated or projected. In addition, other risks not presently known to the Company or that the Company currently believes to be immaterial may also adversely affect the Company’s business, financial condition and results of operations, perhaps materially. It is impossible to predict or identify all such risks and uncertainties and, as a result, you should not consider the following factors to be a complete discussion of all risks or uncertainties that may impact the Company’s business, financial condition or results of operations.
• | The Company is exposed to price fluctuations of key commodities. |
The Company uses various raw materials, most significantly steel, natural rubber, synthetic rubber, carbon black, bead wire, and fabric in manufacturing its products across all of its market segments. The Company does not generally enter into long-term commodity contracts and does not use derivative commodity instruments to hedge exposures to commodity market price fluctuations. Therefore, the Company is exposed to price fluctuations of key commodities. Although the Company attempts to pass on certain material price increases to its customers, there is no assurance that the Company will be able to do so in the future. Any increase in the price of steel and rubber that is not passed on to customers could result in declining margins and have a material adverse effect on Titan’s financial condition and results of operations.
• | The Company relies on a limited number of suppliers. |
The Company currently relies on a limited number of suppliers for certain key commodities, which consist primarily of steel and rubber, in the manufacturing of Titan products. If the Company’s suppliers are unable to provide raw materials to Titan in a timely manner, or are unable to meet our quality, quantity or cost requirements, the Company may not in all cases be able to promptly obtain substitute sources. Any extended delay in receiving critical materials could impair Titan’s ability to deliver products to its customers. The loss of key suppliers, the inability to establish relationships with replacement suppliers, or the inability of Titan's suppliers to meet price, quality, quantity, and delivery requirements could have a significant adverse impact on the Company’s results of operations.
10
• | The Company’s revolving credit facility and other debt obligations contain covenants that could limit the Company's financial and operational flexibility. |
The Company’s revolving credit facility, the indenture relating to the Company’s 6.50% senior secured notes due 2023 and other debt obligations contain covenants and restrictions that may impact the Company’s business. See “Management’s Discussion and Analysis of Financial Condition and Results of Operations - Liquidity and Capital Resources - Debt Restrictions” below for a further discussion of these covenants and restrictions. A breach of one or more of the covenants could result in adverse consequences that could negatively impact the Company's business, results of operations and financial condition. These consequences could limit Titan’s ability to respond to market conditions, to provide for unanticipated capital investments, to raise additional debt or equity capital, to pay dividends, or to take advantage of business opportunities, including future acquisitions. Titan’s ability to comply with the covenants may be affected by events beyond its control, including prevailing economic, financial, and industry conditions.
• | The Company operates in cyclical industries and is subject to changes in the economy. |
The Company's sales are substantially dependent on three major industries: agricultural equipment, earthmoving/construction equipment, and consumer products. The business activity levels in these industries are subject to specific industry and general economic cycles. Any downturn in these industries or the general economy could drive decreases in demand for Titan’s products and have a material adverse effect on Titan’s business.
The agricultural equipment industry is affected by crop prices, farm income and farmland values, weather, export markets, and government policies. The earthmoving/construction industry is affected by the levels of government and private construction spending and replacement demand. The mining industry, which is within the earthmoving/construction industry, is affected by raw material commodity prices. The consumer products industry is affected by consumer disposable income, weather, competitive pricing, energy prices, and consumer attitudes. In addition, the performance of these industries is sensitive to interest rate and foreign exchange rate changes and varies with the overall level of economic activity. The cyclicality and volatility of the industries on which our sales are substantially dependent results in significant fluctuations in profits and cash flow from period to period and over the business cycle.
• | The Company’s revenues are seasonal in nature due to Titan’s dependence on seasonal industries. |
The agricultural, earthmoving/construction, and consumer markets are seasonal, with typically lower sales during the second half of the year. This seasonality in demand has resulted in fluctuations in the Company’s revenues and operating results between the first half and the second half of the year. Because much of Titan’s overhead expenses are fixed, seasonal trends can cause volatility in profit margins and Titan's financial condition, especially during slower periods.
• | The Company’s customer base is relatively concentrated. |
The Company’s ten largest customers, which are primarily original equipment manufacturers (OEMs), accounted for 38% of Titan’s net sales for 2019. Net sales to Deere & Company represented 11% of total 2019 sales. No other customer accounted for 10% or more of Titan's net sales in 2019. Titan’s business could be adversely affected if one of its larger customers reduces, or otherwise eliminates in full, its purchases from Titan due to work stoppages or slow-downs, financial difficulties, as a result of termination provisions, competitive pricing, or other reasons. There is also continuing pressure from OEMs to reduce costs, including the cost of products and services purchased from outside suppliers such as Titan, and in that regard OEMs may develop in-house tire and wheel capabilities. There can be no assurance that Titan will be able to maintain its long-term relationships with its major customers which could have an adverse effect on the Company's results of operations.
• | The Company may be adversely affected by changes in government regulations and policies. |
Domestic and foreign political developments and government regulations and policies directly affect the agricultural, earthmoving/construction, and consumer products industries in the United States and abroad. Regulations and policies in the agricultural industry such as those concerning greenhouse gas emissions in the United States and ongoing U.S. budget issues could negatively impact the Company's business. The earthmoving/construction industry is affected by changes in construction activity, housing starts, and other regulations related to the mining and the construction of roads, bridges, and infrastructure. The modification or adoption of existing laws, regulations, or policies could have an adverse effect on any one or more of these industries and, therefore, on Titan’s business.
11
Additionally, on January 31, 2020, the United Kingdom (UK) officially withdrew from the EU (Brexit), subject to a transition period until December 31, 2020, which could be extended up to two years under certain conditions (the Brexit Transition Period). There is uncertainty as to the scope, nature and terms of the relationship between the UK and the EU after the Brexit Transition Period. This uncertainty could adversely impact customer or investor confidence, result in additional market volatility, legal uncertainty and divergent national laws and regulations.
• | The Company is subject to corporate governance requirements, and costs related to compliance with, or failure to comply with, existing and future requirements could adversely affect Titan’s business. |
The Company is subject to corporate governance requirements under the Sarbanes-Oxley Act of 2002, as well as rules and regulations of the Securities and Exchange Commission (SEC), the Public Company Accounting Oversight Board (PCAOB), and the New York Stock Exchange (NYSE). These laws, rules, and regulations continue to evolve and may become increasingly restrictive in the future. Failure to comply with these laws, rules, and regulations may have a material adverse effect on Titan’s reputation, financial condition, and the value of the Company’s securities.
• | The Company is subject to risks associated with maintaining adequate disclosure controls and internal controls over financial reporting. |
Failure to maintain adequate financial and management processes and controls could affect the accuracy and timing of the Company's financial reporting. Testing and maintaining effective internal control over financial reporting and disclosures involves significant costs and could divert management's attention from other matters that are important to Titan's business. If the Company does not maintain adequate financial and management personnel, processes, and controls, it may not be able to accurately report its financial performance on a timely basis, the Company may be otherwise unable to comply with the periodic reporting requirements of the Securities and Exchange Commission and the listing of the Company’s common stock on the NYSE could be suspended or terminated, each of which could have a material adverse effect on the confidence in the Company's financial reporting, its credibility in the marketplace, and the trading price of Titan's common stock.
• | The Company faces substantial competition from domestic and international companies. |
The Company competes with several domestic and international competitors, some of which are larger and have greater financial and marketing resources than Titan. Titan competes on the basis of price, quality, sales support, customer service, design capability, and delivery time. The Company’s ability to compete with international competitors may be adversely affected various factors including, currency fluctuations and tariffs imposed by domestic and foreign governments. In addition, certain OEM customers could elect to manufacture certain products to meet their own requirements or to otherwise compete with Titan. The success of the Company's business depends in large part on its ability to provide comprehensive wheel and tire assemblies to its customers. The development or enhancement by Titan's competitors of similar capabilities could adversely affect its business.
There can be no assurance that Titan’s businesses will not be adversely affected by increased competition in the Company’s markets, or that competitors will not develop products that are more effective or less expensive than Titan products or which could render certain products less competitive. From time to time certain competitors have reduced prices in particular product categories, which has caused Titan to reduce prices. There can be no assurance that in the future Titan’s competitors will not further reduce prices or that any such reductions would not have a material adverse effect on Titan’s business.
• | The Company may be affected by unfair trade. |
Titan faces intense competition from producers both in the United States and around the world, some of which may engage in unfair trade practices. For example, in early January 2016, Titan, along with the United Steel, Paper and Forestry, Rubber, Manufacturing, Energy, Allied Industrial and Service Worker International Union, AFL-CIO, CLC of Pittsburgh, Pennsylvania, filed petitions with the U.S. Department of Commerce (DOC) and the U.S. International Trade Commission (ITC) alleging that imported off-the-road tires from India and Sri Lanka and wheel and tire assemblies from China were being dumped and/or subsidized and were a cause of material injury to the domestic industry. Unfair trade may have a material adverse effect on Titan's business.
• | The Company could be negatively impacted if Titan fails to maintain satisfactory labor relations. |
Titan is party to collective bargaining agreements covering a portion of the Company's workforce. If Titan is unable to maintain satisfactory labor relations with its employees covered by collective bargaining agreements, these employees could engage in strikes, or the Company may otherwise experience work slowdowns or be subject to other labor actions. Any such actions, and any other labor disputes with the Company’s employees domestically or internationally, could materially disrupt its operations. Future collective bargaining agreements may impose significant additional costs on Titan, which could adversely affect its financial condition and results of operations.
12
• | Unfavorable outcomes of legal proceedings could adversely affect Titan's results of operations. |
The Company is a party to routine legal proceedings arising out of the normal course of business. Due to the difficult nature of predicting unresolved and future legal claims, the Company cannot anticipate or predict any material adverse effect on its consolidated financial condition, results of operations, or cash flows as a result of efforts to comply with, or its liabilities pertaining to, legal judgments. Any adverse outcome in any litigation involving Titan or any of its subsidiaries could negatively affect the Company's business, reputation, and financial condition.
• | Acquisitions/divestitures may require significant resources and/or result in significant losses, costs, or liabilities. |
Any future acquisitions or divestitures will depend on the Company’s ability to identify suitable opportunities, to negotiate acceptable terms, and to finance acquisitions. Titan will also face competition for suitable acquisition candidates, which may increase costs. In addition, acquisitions and divestitures require significant managerial attention, which may be diverted from current operations. Furthermore, acquisitions and divestitures of businesses or facilities entail a number of additional risks and challenges including: integrating acquisitions with existing operations; and separating operations in connection with dispositions; applying internal controls and processes throughout the acquired business; potential disruption of the Company's ongoing business; inability to maintain key customer, supplier, and employee relationships; potential that transactions do not produce satisfactory returns on a timely basis or at all; and exposure to unanticipated liabilities.
International acquisitions or divestitures may be more complex and time consuming. Also, international acquisitions and divestitures may include a number of additional risks, including the integration of acquisitions or separation of divestitures in compliance with foreign laws and regulations and business and accounting systems.
Subject to the terms of its existing indebtedness, the Company may finance future acquisitions with cash from operations, additional indebtedness, and/or by issuing additional equity securities. These commitments may impair the operation of Titan’s businesses. In addition, the Company could face financial risks associated with incurring additional indebtedness, such as reducing liquidity and access to financing markets and increasing the amount of cash flow required to service such indebtedness.
• | The Company has international operations and purchases raw material from foreign suppliers |
The Company had total aggregate net sales outside the United States of approximately $776.1 million, $890.5 million, and $826.2 million for the years ended December 31, 2019, 2018, and 2017, respectively. Net sales outside the United States have become a significant proportion of total net sales, accounting for 54% of net sales for the year ended December 31, 2019, and 56 % for each of the years ended December 31, 2018, and 2017. Net sales from these international operations are expected to continue to represent a similar portion of total net sales for the foreseeable future.
International Operations and Sales – International operations and sales are subject to a number of risks and restrictions, that are not generally applicable to Titan’s North American operations including, but not limited to, risks with respect to currency exchange rates, economic and political destabilization, other disruption of foreign markets, restrictive actions by foreign governments (such as restrictions on transfer of funds, export duties, and quotas and foreign customs) and local epidemics or pandemics such as the new coronavirus that originated in China. Other risks include changes in foreign laws regarding trade and investment; difficulties in establishing and maintaining relationships with respect to product distribution and support; nationalization; reforms of United States laws and policies affecting trade, restrictions on foreign investment, and restrictions on loans to foreign entities; and changes in foreign tax and other laws. There may also be restrictions on the Company's ability to repatriate earnings and investments from international operations. There can be no assurance that one or a combination of these factors will not have a material adverse effect on the Company’s ability to increase or maintain its international sales and results of operations.
Foreign Suppliers – The Company purchases raw materials from foreign suppliers. The production costs, profit margins, and competitive position of the Company are affected by the strength of the currencies in countries where Titan purchases goods, relative to the strength of the currencies in countries where the products are sold. The Company’s results of operations, cash flows, and financial position may be affected by fluctuations in foreign currencies.
13
• | The Company is subject to anti-corruption laws and regulations. |
The Company has international operations and must comply with anti-corruption laws and regulations including the U.S. Foreign Corrupt Practices Act (FCPA). These anti-bribery laws generally prohibit companies and their intermediaries from making improper payments or providing anything of value for the purpose of obtaining or retaining business. The FCPA prohibits these payments regardless of local customs and practices. Safeguards that Titan may implement to discourage these practices could prove to be ineffective, and violations of these laws may result in criminal or civil sanctions or other liabilities or proceedings against Titan and could adversely affect the Company's business and reputation.
• | The Company may be subject to product liability and warranty claims. |
The Company warrants its products to be free of certain defects and, accordingly, may be subject, in the ordinary course of business, to product liability or product warranty claims. Losses may result or be alleged to result from defects in Titan products, which could subject the Company to claims for damages, including consequential damages. There can be no assurance that the Company's insurance coverage will be adequate for liabilities actually incurred or that adequate insurance will be available on terms acceptable to the Company. Any claims relating to defective products that result in liability exceeding Titan’s insurance coverage could have a material adverse effect on Titan's financial condition and results of operations. Further, claims of defects could result in negative publicity against Titan, which could adversely affect the Company’s business and reputation.
• | The Company may be adversely affected by a disruption in, or failure of, information technology systems. |
In the ordinary course of business, the Company relies upon information technology systems, some of which are managed by third parties, to process, transmit, and store electronic information. Technology systems are used in a variety of business processes and activities, including purchasing, manufacturing, distribution, invoicing, and financial reporting. The Company utilizes security measures and business continuity plans to prevent, detect, and remediate damage from computer viruses, natural disasters, unauthorized access (whether through cybersecurity attacks or otherwise), utility failures, and other similar disruptions. Despite Titan's security measures and safeguards, a security breach or information technology system interruption or failure may disrupt and affect the Company's business, resulting in customer dissatisfaction, potential legal claims and adversely affect Titan’s results of operations and financial conditions. There can be no assurance that any such security measures or plans will be sufficient to mitigate all potential risks to Titan's systems, networks, and information. Further a significant theft, loss, or fraudulent use of customer or employee information could adversely impact the Company's reputation and could result in unauthorized release of confidential or otherwise protected information, significant costs, fines, and litigation, including with respect to enhanced cybersecurity protection and remediation costs. The Company is currently undergoing upgrades and improvements to its core enterprise resource planning (ERP) systems which are ‘cloud based’. Despite adequate security measures, these systems are vulnerable to disruption of service and security breaches as mentioned above. Further, investment in the ‘cloud based’ systems may have an adverse impact on short-term results of operations and financial condition.
• | The Company is subject to governmental laws, regulations and other legal obligations related to privacy and data protection. |
The legislative and regulatory framework for privacy and data protection issues worldwide is rapidly evolving and is likely to remain uncertain for the foreseeable future. Titan collects personally identifiable information (PII) and other data as integral parts of its business processes and activities. This data is subject to a variety of U.S. and international laws and regulations, including oversight by various regulatory or other governmental bodies. Many foreign countries and governmental bodies, including the European Union, Canada, and other relevant jurisdictions where we conduct business, have laws and regulations concerning the collection and use of PII and other data obtained from their residents or by businesses operating within their jurisdiction that are more restrictive than those in the U.S. Additionally, in 2016, the European Union adopted the General Data Protection Regulation (GDPR) that imposes more stringent data protection requirements and provides for greater penalties for noncompliance. Any inability, or perceived inability, to adequately address privacy and data protection concerns, even if unfounded, or comply with applicable laws, regulations, policies, industry standards, contractual obligations, or other legal obligations could result in additional cost and liability to the Company or Company officials, damage our reputation, inhibit sales, and otherwise adversely affect our business.
14
• | The Company is subject to risks associated with climate change regulations. |
Governmental regulatory bodies in the United States and other countries have adopted, or are contemplating introducing regulatory changes in response to the potential impacts of climate change. Laws and regulations regarding climate change and energy usage may impact the Company directly through higher costs for energy and raw materials. The Company’s customers may also be affected by climate change regulations that may impact future purchases of the Company's products. Physical climate change may potentially have a large impact on the Company’s two largest industry segments, agriculture and earthmoving/construction. The potential impacts of climate change and climate change regulations are highly uncertain at this time, and the Company cannot anticipate or predict any material adverse effect on its consolidated financial condition, results of operations, or cash flows as a result of climate change and climate change regulations.
• | The Company is subject to risks associated with environmental laws and regulations. |
The Company’s operations are subject to federal, state, local, and foreign laws and regulations governing, among other things, emissions to air, discharge to waters, and the generation, handling, storage, transportation, treatment, and disposal of waste and other materials. The Company’s operations entail risks in these areas, and there can be no assurance that Titan will not incur material costs or liabilities, including in connection with complying with the laws and regulations and any required remediation. In addition, potentially significant expenditures could be required in order to comply with evolving environmental and health and safety laws, regulations, or requirements that may be adopted or imposed in the future. Titan’s customers may also be affected by environmental laws and regulations that may impact future purchases of the Company's products.
• | The Company is subject to foreign currency translation risk. |
The Company operates in many worldwide locations and transacts business in many foreign currencies. Titan's financial statements are reported in U.S. dollars with financial statements of international subsidiaries being initially recorded in foreign currencies and translated into U.S. dollars. Large fluctuations in currency exchange rates between the U.S. dollar and other global currencies may have a material adverse impact on the Company's financial condition, results of operations, and liquidity.
• | The Company may incur additional tax expense or tax exposure. |
The Company is subject to income taxes in the United States and numerous foreign jurisdictions, and has domestic and international tax liabilities which are dependent upon the distribution of income among these different jurisdictions. Titan's income tax provision and cash tax liability in the future could be adversely affected by numerous factors, including income before taxes being lower than anticipated in countries with lower statutory tax rates and higher than anticipated in countries with higher statutory tax rates, changes in the valuation of deferred tax assets and liabilities, and changes in tax laws and regulations.
• | The Company is subject to risks related to uncertainties in global and regional economic conditions. |
Our results of operations are materially affected by economic conditions globally, regionally and in the particular industries we serve. The demand for our products tends to be cyclical and can be significantly reduced in periods of economic weakness characterized by lower levels of government and business investment, lower levels of business confidence, lower corporate earnings, high real interest rates, lower credit activity or tighter credit conditions, higher unemployment and lower consumer spending. Economic conditions vary across regions and countries, and demand for our products generally increases in those regions and countries experiencing economic growth and investment. Slower economic growth or a change in the global mix of regions and countries experiencing economic growth and investment could have an adverse effect on our business, results of operations and financial condition.
• | The Company is not insured against all potential losses and could be harmed by natural disasters, catastrophes, or sabotage. |
The Company's business activities involve substantial investments in manufacturing facilities and products are produced at a limited number of locations. These facilities could be materially damaged, including as a result of natural disasters, such as fires, floods, tornadoes, hurricanes, and earthquakes, or by sabotage. The Company could incur uninsured losses and liabilities arising from such events, as well as damage to its reputation, and/or suffer material losses in operational capacity and efficiency, which could have a material adverse impact on Titan's business, financial condition, and results of operations.
ITEM 1B – UNRESOLVED STAFF COMMENTS
None.
15
ITEM 2 – PROPERTIES
The Company’s properties with total square footage above one million, all of which are owned by the Company,
are detailed by the location, size, and focus of each facility as provided in the table below (amounts in thousands):
Approximate square footage | ||||||||
Location | Owned | Use | Segment | |||||
Volzhsky, Russia | 2,153 | Manufacturing, distribution | All segments | |||||
Union City, Tennessee | 2,149 | Manufacturing, distribution | All segments | |||||
Des Moines, Iowa | 1,930 | Manufacturing, distribution | All segments | |||||
Sao Paulo, Brazil | 1,282 | Manufacturing, distribution | All segments | |||||
Quincy, Illinois | 1,205 | Manufacturing, distribution | All segments | |||||
Freeport, Illinois | 1,202 | Manufacturing, distribution | All segments | |||||
The Company’s total properties by continent are detailed by the location, size, and focus as provided in the table below (amounts in thousands):
Approximate square footage | ||||||||||
Location | Owned | Leased | Use | Segment | ||||||
North America | 8,596 | 535 | Manufacturing, distribution | All segments | ||||||
Europe | 3,910 | 19 | Manufacturing, distribution | All segments | ||||||
South America | 2,929 | 104 | Manufacturing, distribution | All segments | ||||||
Australia | 1,205 | Manufacturing, distribution | All segments | |||||||
Asia | 646 | 281 | Manufacturing, distribution | All segments | ||||||
The Company considers each of its facilities to be in good condition and adequate for present use. Management believes that the Company has sufficient capacity to meet current market demand with the active facilities.
ITEM 3 – LEGAL PROCEEDINGS
The Company is subject, from time to time, to certain legal proceedings and claims arising out of the normal course of its business, which cover a wide range of matters, including environmental issues, product liability, contracts, and labor and employment matters. See Note 24 to the Company's consolidated financial statements in Part IV, Item 15 of this Form 10-K for further discussion.
ITEM 4 – MINE SAFETY DISCLOSURES
None.
16
PART II
ITEM 5 | – MARKET FOR REGISTRANT’S COMMON EQUITY, RELATED STOCKHOLDER MATTERS AND ISSUER PURCHASES OF EQUITY SECURITIES |
The Company’s common stock is traded on the New York Stock Exchange (NYSE) under the symbol TWI. As of February 25, 2020, there were approximately 350 holders of record of Titan common stock.
PERFORMANCE COMPARISON GRAPH
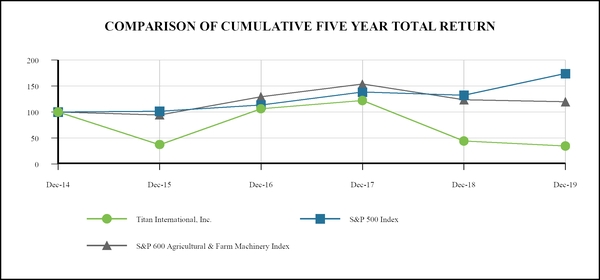
The performance graph below compares cumulative total return on the Company’s common stock over the past five years against the cumulative total return of the Standard & Poor’s 600 Agricultural & Farm Machinery Index, and against the Standard & Poor’s 500 Stock Index. The graph depicts the value on December 31, 2019, of a $100 investment made on December 31, 2014, in Company common stock and each of the other two indices, with all dividends reinvested. The stock price performance reflected below is based on historical results and is not necessarily indicative of future stock price performance.
The performance graph is not deemed to be “soliciting material” or to be “filed” with the SEC for the purposes of Section 18 of the Securities Exchange Act of 1934, as amended (the Exchange Act) or otherwise subject to the liabilities under that Section, and shall not be deemed to be incorporated by reference into any filing of Titan under the Securities Act of 1933 or the Exchange Act.
Fiscal Year Ended December 31, | |||||||||||||||||||||||
2014 | 2015 | 2016 | 2017 | 2018 | 2019 | ||||||||||||||||||
Titan International, Inc. | $ | 100.00 | $ | 37.18 | $ | 106.07 | $ | 122.09 | $ | 44.29 | $ | 34.58 | |||||||||||
S&P 500 Index | 100.00 | 101.38 | 113.51 | 138.29 | 132.23 | 173.86 | |||||||||||||||||
S&P 600 Agricultural & Farm Machinery Index | 100.00 | 94.38 | 129.33 | 153.70 | 123.57 | 119.70 | |||||||||||||||||
17
ITEM 6 – SELECTED FINANCIAL DATA
The selected financial data presented below, as of and for the years ended December 31, 2019, 2018, 2017, 2016, and 2015, are derived from the Company’s consolidated financial statements, as audited by Grant Thornton LLP, an independent registered public accounting firm, for the years ended December 31, 2019, 2018, 2017, 2016, and 2015, and should be read in conjunction with the Company’s Management’s Discussion and Analysis of Financial Condition and Results of Operations and our audited consolidated financial statements and notes thereto.
Year Ended December 31, | |||||||||||||||||||
(All amounts in thousands, except per share data) | 2019 | 2018 | 2017 | 2016 | 2015 | ||||||||||||||
Net sales | $ | 1,448,666 | $ | 1,602,408 | $ | 1,468,922 | $ | 1,265,497 | $ | 1,394,771 | |||||||||
Asset impairment and inventory write-down | — | — | 9,917 | — | — | ||||||||||||||
Gross profit | 129,004 | 198,266 | 160,311 | 141,415 | 136,583 | ||||||||||||||
(Loss) income from operations | (28,432 | ) | 42,244 | (11,151 | ) | (22,400 | ) | (25,505 | ) | ||||||||||
Loss on senior note repurchase | — | — | (18,646 | ) | — | — | |||||||||||||
(Loss) income before income taxes | (48,044 | ) | 19,807 | (52,876 | ) | (36,474 | ) | (55,072 | ) | ||||||||||
Net (loss) income | (51,519 | ) | 13,045 | (64,079 | ) | (39,755 | ) | (89,828 | ) | ||||||||||
Net loss attributable to noncontrolling interests | (3,094 | ) | (3,042 | ) | (4,037 | ) | (2,150 | ) | (14,654 | ) | |||||||||
Net (loss) income attributable to Titan | (48,425 | ) | 16,087 | (60,042 | ) | (37,605 | ) | (75,174 | ) | ||||||||||
Net (loss) income per share – basic | (0.84 | ) | .06 | (1.12 | ) | (.87 | ) | (1.73 | ) | ||||||||||
Net (loss) income per share – diluted | (0.84 | ) | .06 | (1.12 | ) | (.87 | ) | (1.73 | ) | ||||||||||
Dividends declared per common share | 0.02 | 0.02 | 0.02 | 0.02 | 0.02 | ||||||||||||||
As of December 31, | |||||||||||||||||||
(All amounts in thousands) | 2019 | 2018 | 2017 | 2016 | 2015 | ||||||||||||||
Working capital, excluding cash | $ | 250,310 | $ | 322,728 | $ | 266,701 | $ | 215,250 | $ | 246,279 | |||||||||
Current assets | 644,262 | 779,481 | 783,193 | 729,181 | 716,564 | ||||||||||||||
Total assets | 1,114,307 | 1,251,256 | 1,290,112 | 1,265,896 | 1,273,793 | ||||||||||||||
Long-term debt (a) | 443,349 | 409,572 | 407,171 | 408,760 | 475,443 | ||||||||||||||
Total equity | 238,988 | 270,097 | 310,084 | 292,879 | 351,246 | ||||||||||||||
(a) | Excludes amounts due within one year and classified as a current liability. |
ITEM 7 – MANAGEMENT’S DISCUSSION AND ANALYSIS OF FINANCIAL CONDITION AND RESULTS OF OPERATIONS
MANAGEMENT’S DISCUSSION AND ANALYSIS
Management’s discussion and analysis of financial condition and results of operations (MD&A) is designed to provide a reader of the financial statements included in this annual report with a narrative from the perspective of the management of Titan International, Inc. (together with its subsidiaries, Titan, or the Company) on Titan’s financial condition, results of operations, liquidity, and other factors which may affect the Company’s future results. You should read the following discussion and analysis in conjunction with "Item 6. Selected Financial Data" and our consolidated financial statements and related notes in "Item 8. Financial Statements and Supplementary Data." The following discussion includes forward-looking statements about our business, financial condition, and results of operations, including discussions about management’s expectations for our business. These statements represent projections, beliefs, and expectations based on current circumstances and conditions and in light of recent events and trends, and you should not construe these statements either as assurances of performance or as promises of a given course of action. Instead, various known and unknown factors are likely to cause our actual performance and management’s actions to vary, and the results of these variances may be both material and adverse. See “Forward-Looking Statements” and "Item 1A. Risk Factors" in Part 1 of this Form 10-K.
18
BUSINESS
For a description of the Company’s business and segments see Part 1, Item 1 of this Form 10-K.
MARKET CONDITIONS AND OUTLOOK
AGRICULTURAL MARKET OUTLOOK
Agriculture-related commodity prices remain low as a result of ongoing tariffs and trade concerns. Within North America, concerns about current economic conditions coupled with extraordinarily bad weather in the spring of 2019 led farmers to be less inclined to make large investments in their farming equipment. In 2020, market conditions for North America and Europe are expected to remain soft while it is anticipated that Russia and Latin America will experience modest growth. Major OEMs are forecasting 2020 agricultural equipment sales to be generally flat in North America. Many variables, including weather, volatility in the price of commodities, grain prices, export markets, foreign currency exchange rates, government policies, subsidies, and the demand for used equipment can greatly impact the Company's performance in the agricultural market in a given period.
EARTHMOVING/CONSTRUCTION MARKET OUTLOOK
The earthmoving/construction market had a strong start in the beginning of 2019 but experienced declines during the rest of 2019 due to global economic uncertainty. Demand for larger construction equipment used for highways and infrastructure, which had been steady after several years of strong growth, began to tighten in 2019. Mining industry equipment demand also began to soften within certain regions in the second half of 2019. Construction is mainly driven by GDP by country and the need for infrastructure developments. We anticipate modest declines for small and medium-sized earthmoving/construction equipment used in the housing and commercial construction sectors in 2020. Mining is primarily driven by both the demand for and pricing of commodities. Demand for Titan's products in the mining industry for 2020 is anticipated to be generally flat as compared to 2019. The earthmoving/construction segment is affected by many variables, including commodity prices, road construction, infrastructure, government appropriations, housing starts, and other macroeconomic drivers.
CONSUMER MARKET OUTLOOK
The consumer market consists of several different distinct product lines within different regions. These products include light truck tires, turf equipment, specialty products, and train brakes. Overall, the Company expects modest growth within this market in 2020. The consumer segment is affected by many variables including consumer spending, interest rates, government policies, and other macroeconomic drivers.
19
SUMMARY OF RESULTS OF OPERATIONS
The following table sets forth the Company’s statement of operations expressed as a percentage of net sales for the periods indicated. This table and subsequent discussions should be read in conjunction with the Company’s audited consolidated financial statements and notes thereto included elsewhere in this annual report.
As a Percentage of Net Sales Year ended December 31, | ||||||||
2019 | 2018 | 2017 | ||||||
Net sales | 100.0 | % | 100.0 | % | 100.0 | % | ||
Cost of sales | 91.1 | 87.6 | 88.4 | |||||
Asset impairment | — | — | 0.7 | |||||
Gross profit | 8.9 | 12.4 | 10.9 | |||||
Selling, general and administrative expenses | 9.5 | 8.4 | 10.3 | |||||
Research and development | 0.7 | 0.7 | 0.7 | |||||
Royalty expense | 0.7 | 0.7 | 0.7 | |||||
(Loss) income from operations | (2.0 | ) | 2.6 | (0.8 | ) | |||
Interest expense | (2.3 | ) | (1.9 | ) | (2.0 | ) | ||
Loss on senior note repurchase | — | — | (1.3 | ) | ||||
Foreign exchange gain (loss) | 0.3 | (0.7 | ) | (0.1 | ) | |||
Other income | 0.7 | 1.2 | 0.6 | |||||
(Loss) income before income taxes | (3.3 | ) | 1.2 | (3.6 | ) | |||
Income tax provision | 0.2 | 0.4 | 0.8 | |||||
Net (loss) income | (3.5 | )% | 0.8 | % | (4.4 | )% | ||
Net loss attributable to noncontrolling interests | (0.2 | ) | (0.2 | ) | (0.3 | ) | ||
Net (loss) income attributable to Titan | (3.3 | )% | 1.0 | % | (4.1 | )% | ||
In addition, the following table sets forth components of the Company’s net sales classified by segment:
(amounts in thousands) | 2019 | 2018 | 2017 | ||||||||
Agricultural | $ | 652,558 | $ | 694,268 | $ | 690,238 | |||||
Earthmoving/construction | 648,753 | 741,733 | 608,894 | ||||||||
Consumer | 147,355 | 166,407 | 169,790 | ||||||||
Total | $ | 1,448,666 | $ | 1,602,408 | $ | 1,468,922 | |||||
20
FISCAL YEAR ENDED DECEMBER 31, 2019, COMPARED TO FISCAL YEAR ENDED DECEMBER 31, 2018
RESULTS OF OPERATIONS
Highlights for the year ended December 31, 2019, compared to 2018 (amounts in thousands):
2019 | 2018 | % Increase (Decrease) | ||||||||
Net sales | $ | 1,448,666 | $ | 1,602,408 | (9.6 | )% | ||||
Cost of sales | 1,319,662 | 1,404,142 | (6 | )% | ||||||
Gross profit | 129,004 | 198,266 | (34.9 | )% | ||||||
Selling, general and administrative expenses | 137,697 | 134,789 | 2.2 | % | ||||||
Research and development expenses | 9,859 | 11,146 | (11.5 | )% | ||||||
Royalty expense | 9,880 | 10,087 | (2.1 | )% | ||||||
(Loss) income from operations | (28,432 | ) | 42,244 | 167.3 | % | |||||
Net Sales
Net sales for the year ended December 31, 2019, were $1.45 billion, compared to $1.60 billion for the year ended December 31, 2018, a decrease of 9.6%, driven by sales decreases in all segments. This decrease reflects ongoing economic and weather challenges in the agricultural sector and a tightening of the construction market which significantly impacted our undercarriage business. Global trade issues were a major factor for the market challenges that were encountered. Overall, net sales volume was down 10.0% and unfavorable currency translation further decreased net sales by 3.4%. Favorable price/mix partially offset these declines and contributed a 3.8% increase in net sales.
Cost of Sales and Gross Profit
Cost of sales was $1.32 billion for the year ended December 31, 2019, compared to $1.40 billion for 2018. Gross profit for 2019 was $129.0 million, or 8.9% of net sales, compared to $198.3 million, or 12.4% of net sales, for 2018. The decrease in gross profit and margin was driven by lower sales volume, production inefficiencies and higher material costs, particularly in North American wheel operations relating to elevated steel inventories and related costs in the second and third quarters of 2019. The impact on 2019 costs and gross profit related to North American wheel operations was approximately $15 million versus 2018.
Selling, General and Administrative Expenses
Selling, general and administrative (SG&A) expenses for the year ended December 31, 2019, were $137.7 million, or 9.5% of net sales, up 2.2%, compared to $134.8 million, or 8.4% of net sales, for 2018. The increase in SG&A expenses was primarily driven by an increase in technology expense in North America related to stabilization of the current ERP platform and investments in corporate systems. In addition, during 2019, the Company incurred approximately $2.7 million related to a postponed public listing of its subsidiary, ITM, which produces undercarriage products on a global scale. The increased costs were partially offset by lower bonus and sales commission expense.
Research and Development Expenses
Research and development (R&D) expenses for the year ended December 31, 2019, were $9.9 million, or 0.7% of net sales, compared to $11.1 million, or 0.7% of net sales, for 2018. The decrease in expenses was primarily attributable to lower salaries, benefits and facility costs due to more focused efforts in North America and undercarriage as compared to more significant product developments in 2018.
Royalty Expense
The Company has trademark license agreements with The Goodyear Tire & Rubber Company to manufacture and sell certain farm tires under the Goodyear name. These agreements cover sales in North America, Latin America, Europe, the Middle East, Africa, Russia, and other Commonwealth of Independent States countries. Each of these agreements is scheduled to expire in 2025. Royalty expenses for the year ended December 31, 2019, were $9.9 million, compared to $10.1 million for 2018.
(Loss) Income from Operations
Loss from operations for the year ended December 31, 2019, was $28.4 million, or 2.0% of net sales, compared to income of $42.2 million, or 2.6% of net sales, for 2018. This decrease in income was primarily driven by lower net sales and the net result of the items previously discussed.
21
OTHER PROFIT/LOSS ITEMS
Interest Expense
Interest expense for 2019 and 2018 was $33.1 million and $30.5 million, respectively. The increase in interest expense was primarily due to increased borrowings under Titan's revolving credit facility and increased borrowing rates.
Foreign Exchange Gain (Loss)
Foreign currency gain was $4.0 million for the year ended December 31, 2019, compared to a loss of $11.2 million for the year ended December 31, 2018. Foreign currency gain or loss is the result of the translation of intercompany loans at certain foreign subsidiaries which are denominated in local currencies, not the reporting currency, the United States dollar. Since such loans are expected to be settled in cash at some point in the future, these loans are adjusted each reporting period to reflect the current exchange rates. Latin American, Australian, Canadian and Russian currencies all experienced significant fluctuations in 2019 as compared to 2018, which drove the Company's favorability in foreign currency translation. The Company uses derivative financial instruments from time to time on such intercompany loans as well as other actions to reduce foreign exchange exposures.
Other Income
Other income was $9.5 million for the year ended December 31, 2019, as compared to other income of $19.2 million for 2018, a decrease of $9.7 million. The decrease in 2019 was primarily attributable to 2018 non-recurring legal settlements of $9.9 million.
Provision for Income Taxes
The Company recorded tax expense for income taxes of $3.5 million and $6.8 million for the years ended December 31, 2019 and 2018, respectively. The Company's effective tax rate was (7)% in 2019 and 34% in 2018.
The Company’s 2019 and 2018 income tax expense and rates differed from the amount of income tax determined by applying the U.S. Federal income tax rate to pre-tax income primarily as a result of U.S. and certain foreign jurisdictions that incurred a full valuation allowance on deferred tax assets created by current year projected losses and a reduction of the liability for unrecognized tax positions. In addition, there were non-deductible royalty expenses and statutorily required income adjustments made in certain foreign jurisdictions that negatively impacted the tax rate for the years ended December 31, 2019 and 2018.
Net (Loss) Income
Net loss for the year ended December 31, 2019, was $51.5 million, compared to net income of $13.0 million for 2018. Basic earnings per share was $(0.84) for the year ended December 31, 2019, as compared to $0.06 for 2018. Diluted earnings per share was $(0.84) for the year ended December 31, 2019, as compared to $0.06 for 2018. The Company's lower net income and earnings per share were due to the items previously discussed.
SEGMENT INFORMATION
Segment Summary (Amounts in thousands)
2019 | Agricultural | Earthmoving/ Construction | Consumer | Corporate/ Unallocated Expenses | Consolidated Totals | |||||||||||||||
Net sales | $ | 652,558 | $ | 648,753 | $ | 147,355 | $ | — | $ | 1,448,666 | ||||||||||
Gross profit | 55,971 | 57,678 | 15,355 | — | 129,004 | |||||||||||||||
(Loss) income from operations | 10,991 | (1,892 | ) | 1,849 | (39,380 | ) | (28,432 | ) | ||||||||||||
2018 | ||||||||||||||||||||
Net sales | $ | 694,268 | $ | 741,733 | $ | 166,407 | $ | — | $ | 1,602,408 | ||||||||||
Gross profit | 94,217 | 80,056 | 23,993 | — | 198,266 | |||||||||||||||
Income (loss) from operations | 62,065 | 31,141 | 11,994 | (62,956 | ) | 42,244 | ||||||||||||||
22
Agricultural Segment Results
Agricultural segment results were as follows:
(Amounts in thousands) | 2019 | 2018 | % Decrease | |||||||
Net sales | $ | 652,558 | $ | 694,268 | (6.0 | )% | ||||
Gross profit | 55,971 | 94,217 | (40.6 | )% | ||||||
Income from operations | 10,991 | 62,065 | (82.3 | )% | ||||||
Net sales in the agricultural market were $652.6 million for the year ended December 31, 2019, as compared to $694.3 million for 2018, a decrease of 6.0%. Overall, a volume decrease of 13.2% and unfavorable foreign currency translation of 3.3% contributed to the decrease in net sales while favorable price/mix, experienced by all geographic locations except for Australia, partially offset this decrease with a 10.5% positive impact on net sales. Lower sales volumes were primarily caused by challenging market conditions and economic softness in most geographies as well as ongoing global trade issues. In addition, we experienced underperformance in our North American Wheel operations from reductions of steel inventory at higher than current prices, which compressed gross profit by approximately $12 million during the year.
Gross profit in the agricultural market was $56.0 million, or 8.6% of net sales, for 2019, as compared to $94.2 million, or 13.6% of net sales, for 2018. The decrease in gross profit was driven by lower sales volumes, unfavorable foreign currency translation and production inefficiencies. Income from operations in the agricultural market was $11.0 million for the year 2019, as compared to $62.1 million for 2018.
Earthmoving/Construction Segment Results
Earthmoving/construction segment results were as follows:
(Amounts in thousands) | 2019 | 2018 | % Decrease | |||||||
Net sales | $ | 648,753 | $ | 741,733 | (12.5 | )% | ||||
Gross profit | 57,678 | 80,056 | (28.0 | )% | ||||||
(Loss) income from operations | (1,892 | ) | 31,141 | (106 | )% | |||||
The Company's earthmoving/construction market net sales were $648.8 million for the year ended December 31, 2019, compared to $741.7 million for 2018, a decrease of 12.5%. The decrease in earthmoving/construction net sales was driven by decreased volume of 9.3% and unfavorable foreign currency translation of 3.3% of net sales. Price/mix was flat year over year. Lower sales volume was experienced in most geographies, except Latin America, and also a result of tightening within the construction market which was most impactful in our undercarriage business.
Gross profit in the earthmoving/construction market was $57.7 million, or 8.9% of net sales, for the year ended December 31, 2019, as compared to $80.1 million, or 10.8% of net sales, for ended December 31, 2018. The Company's earthmoving/construction market loss from operations was $1.9 million for the year 2019, as compared to income from operations of $31.1 million for 2018. The decrease in both gross profit and income from operations in 2019, compared to the same period in 2018, was primarily due to the lower sales volume and the unfavorable impact it had on production efficiencies, particularly in the European facilities that produce the Company's undercarriage products.
Consumer Segment Results
Consumer segment results were as follows:
(Amounts in thousands) | 2019 | 2018 | % Decrease | |||||||
Net sales | $ | 147,355 | $ | 166,407 | (11.4 | )% | ||||
Gross profit | 15,355 | 23,993 | (36.0 | )% | ||||||
Income from operations | 1,849 | 11,994 | (84.6 | )% | ||||||
23
Consumer market net sales were $147.4 million for the year ended December 31, 2019, compared to $166.4 million for 2018, a decrease of 11.4%. The decrease in consumer net sales was primarily due to unfavorable price/mix of 7.6% and unfavorable foreign currency translation, primarily in Latin America, which negatively impacted net sales by 4.0%. Sales volumes were essentially flat with lower volume in Latin America and Russia offset by higher volumes in other geographies.
Gross profit from the consumer market was $15.4 million for 2019, or 10.4% of net sales, compared to $24.0 million, or 14.4% of net sales, for 2018. Consumer segment income from operations was $1.8 million for 2019, as compared to $12.0 million for 2018.
Corporate & Unallocated Expenses
Income from operations on a segment basis does not include corporate expenses which totaled $39.4 million for the year ended December 31, 2019, down 37.5% compared to $63.0 million for 2018. Corporate expenses, composed of selling, general and administrative expenses, of approximately $39.4 million and $63.0 million for the years ended December 31, 2019 and 2018, respectively. The decrease was due to lower salaries and benefits as well as an increase in allocations to the other segments as compared to the prior year.
FISCAL YEAR ENDED DECEMBER 31, 2018, COMPARED TO FISCAL YEAR ENDED DECEMBER 31, 2017
The comparison of the 2018 results to 2017 has been omitted from this Form 10-K and can be found in the Company's Form 10-K for the fiscal year ended December 31, 2018 filed with the SEC on March 7, 2019.
LIQUIDITY AND CAPITAL RESOURCES
Cash Flows
As of December 31, 2019, the Company had $66.8 million of cash, a decrease of $14.9 million from December 31, 2018, due to the following items:
Operating Cash Flows
Summary of cash flows from operating activities:
(Amounts in thousands) | Year ended December 31, | ||||||||||
2019 | 2018 | Change | |||||||||
Net (loss) income | $ | (51,519 | ) | $ | 13,045 | $ | (64,564 | ) | |||
Depreciation and amortization | 54,376 | 57,618 | (3,242 | ) | |||||||
Deferred income tax provision | (2,300 | ) | (2,291 | ) | (9 | ) | |||||
Accounts receivable | 56,832 | (36,092 | ) | 92,924 | |||||||
Inventories | 63,654 | (77,919 | ) | 141,573 | |||||||
Prepaid and other current assets | 1,912 | (5,377 | ) | 7,289 | |||||||
Accounts payable | (53,183 | ) | 29,364 | (82,547 | ) | ||||||
Other current liabilities | (10,155 | ) | (2,866 | ) | (7,289 | ) | |||||
Other liabilities | (5,438 | ) | (3,444 | ) | (1,994 | ) | |||||
Other operating activities | (8,737 | ) | (8,214 | ) | (523 | ) | |||||
Net cash provided by (used for) operating activities | $ | 45,442 | $ | (36,176 | ) | $ | 81,618 | ||||
For the year ended December 31, 2019, operating activities provided cash of $45.4 million, driven by decreases in inventories and accounts receivable of $63.7 million and $56.8 million, respectively, partially offset by decreases from accounts payable of $53.2 million and liabilities of $15.6 million. Included in net loss of $51.5 million were non-cash charges for depreciation and amortization of $54.4 million.
24
Operating activity cash increased by $81.6 million when comparing 2019 to 2018. This dramatic improvement was due to liquidation of working capital as a result of company-wide initiatives surrounding inventory management partially offset by the impact of lower sales in 2019, which resulted in a decrease of $64.6 million in net income.
Summary of the components of cash conversion cycle:
December 31, | December 31, | ||||
2019 | 2018 | ||||
Days sales outstanding | 56 | 61 | |||
Days inventory outstanding | 111 | 115 | |||
Days payable outstanding | (53 | ) | (62 | ) | |
Cash conversion cycle | 114 | 114 | |||
Days inventory outstanding decreased by 4 days during 2019 from 2018 due to strategic inventory management. During 2019 and beyond, days inventory outstanding is expected to continue to decrease as a result of recently improved planning systems to ensure more accurate demand forecasting and strategic sourcing of raw materials.
Investing Cash Flows
Summary of cash flows from investing activities:
(Amounts in thousands) | Year ended December 31, | ||||||||||
2019 | 2018 | Change | |||||||||
Capital expenditures | $ | (36,414 | ) | $ | (39,000 | ) | $ | 2,586 | |||
Sale of Wheels India Limited shares | 19,021 | — | 19,021 | ||||||||
Payments related to redeemable noncontrolling interest | (71,722 | ) | — | (71,722 | ) | ||||||
Other investing activities | (3,476 | ) | 2,069 | (5,545 | ) | ||||||
Cash used for investing activities | $ | (92,591 | ) | $ | (36,931 | ) | $ | (55,660 | ) | ||
Net cash used for investing activities was $92.6 million in 2019, compared to cash used of $36.9 million in 2018. The Company invested a total of $36.4 million in capital expenditures in 2019, compared to $39.0 million in 2018. Capital expenditures represent various equipment purchases and improvements to enhance production capabilities of Titan’s existing business and maintain existing equipment. The Company made payments of $71.7 million in satisfaction of obligations relating to the settlement put option under the Shareholders' Agreement. See Note 13 for additional information. In September 2019, the Company sold shares of its investment in Wheels India Limited for $19.0 million.
Financing Cash Flows
Summary of cash flows from financing activities:
(Amounts in thousands) | Year ended December 31, | ||||||||||
2019 | 2018 | Change | |||||||||
Proceeds from borrowings | $ | 134,227 | $ | 57,294 | $ | 76,933 | |||||
Payment on debt | (100,901 | ) | (38,557 | ) | (62,344 | ) | |||||
Dividends paid | (1,204 | ) | (1,201 | ) | (3 | ) | |||||
Cash provided by financing activities | $ | 32,122 | $ | 17,536 | $ | 14,586 | |||||
Net cash provided by financing activities was $32.1 million in 2019 due to proceeds from borrowings of $134.2 million partially offset by debt payments of $100.9 million.
25
Debt Restrictions
The Company’s revolving credit facility (credit facility) and indenture relating to the 6.50% senior secured notes due 2023 contain various restrictions which include:
• | When remaining availability under the credit facility is less than 10% of the total commitment under the credit facility ($12.5 million as of December 31, 2019), the Company is required to maintain a minimum fixed charge coverage ratio of not less than 1.0 to 1.0 (calculated quarterly on a trailing four quarter basis); |
• | Limits on dividends and repurchases of the Company’s stock; |
• | Restrictions on the ability of the Company to make additional borrowings, or to consolidate, merge, or otherwise fundamentally change the ownership of the Company; |
• | Limitations on investments, dispositions of assets, and guarantees of indebtedness; and |
• | Other customary affirmative and negative covenants. |
These restrictions could limit the Company’s ability to respond to market conditions, provide for unanticipated capital investments, raise additional debt or equity capital, pay dividends, or take advantage of business opportunities, including future acquisitions.
LIQUIDITY OUTLOOK
At December 31, 2019, the Company had $66.8 million of cash and cash equivalents. At December 31, 2019, under the Company's $125 million credit facility, there were borrowings of $36 million. Titan’s availability under this domestic facility may be less than $125 million as a result of any outstanding letters of credit and the balance of accounts receivable and inventory at certain of its domestic subsidiaries. At December 31, 2019, an outstanding letter of credit totaled $11.5 million and the remaining amount available under the revolving credit facility was $30.8 million, based upon eligible accounts receivable and inventory balances. The cash and cash equivalents balance of $66.8 million includes $60.6 million held in foreign countries. The Company's current plans do not demonstrate a need to repatriate the foreign amounts to fund U.S. operations due to focus on non-core asset sales and availability under the credit facility.
Capital expenditures for 2020 are forecasted to be approximately $35 million. These capital expenditures are anticipated to be used primarily to enhance the Company’s existing facilities and manufacturing capabilities and drive productivity gains.
Cash payments for interest are currently forecasted to be approximately $30 million in 2020, based on the Company's year-end 2019 debt balances and debt maturities.
In the near future, Titan may pursue sales of non-core or idle assets to generate cash flow and improve working capital. Going forward, the Company may seek to grow by making acquisitions which will depend on its ability to identify suitable acquisition candidates, negotiate acceptable terms for their acquisition, and finance those acquisitions.
Subject to the terms of the agreements governing Titan's outstanding indebtedness, the Company may finance future acquisitions with cash on hand, cash from operations, additional indebtedness, issuing additional equity securities, and divestitures.
Cash on hand, anticipated internal cash flows from operations, and utilization of remaining available borrowings are expected to provide sufficient liquidity for working capital needs, debt maturities, capital expenditures, and potential acquisitions. Potential divestitures are also a means to provide for future liquidity needs.
26
CONTRACTUAL OBLIGATIONS
The Company’s contractual obligations at December 31, 2019, consisted of the following (amounts in thousands):
Payments due by period | ||||||||||||||||||||
Contractual Obligations | Total | Less than 1 year | 1-3 years | 3-5 years | More than 5 years | |||||||||||||||
6.50% senior secured notes due 2023 | $ | 400,000 | $ | — | $ | — | $ | 400,000 | $ | — | ||||||||||
Other debt and capital leases | 108,642 | 61,253 | 44,204 | 1,636 | 1,549 | |||||||||||||||
Interest expense (a) | 107,002 | 30,379 | 52,790 | 23,833 | — | |||||||||||||||
Operating leases | 28,487 | 8,244 | 11,261 | 5,399 | 3,583 | |||||||||||||||
Purchase obligations | 22,731 | 17,853 | 4,610 | 268 | — | |||||||||||||||
Other long-term liabilities (b) | 32,200 | 4,800 | 16,400 | 11,000 | — | |||||||||||||||
Total | $ | 699,062 | $ | 122,529 | $ | 129,265 | $ | 442,136 | $ | 5,132 | ||||||||||
(a) | Interest expense is estimated based on the Company’s year-end 2019 debt balances, maturities, and interest rates. The estimates assume the credit facility borrowings are paid off during 2020. The Company’s actual debt balances and interest rates may fluctuate in the future; therefore, actual interest payments may vary from those payments detailed in the above table. |
(b) | Other long-term liabilities represent the Company’s estimated funding requirements for defined benefit pension plans. The Company’s liability for pensions is based on a number of assumptions, including discount rates, rates of return on investments, mortality rates, and other factors. Certain of these assumptions are determined with the assistance of outside actuaries. Assumptions are based on past experience and anticipated future trends and are subject to a number of risks and uncertainties and may lead to significantly different pension liability funding requirements. |
OFF-BALANCE SHEET ARRANGEMENTS
As of December 31, 2019, the Company did not have any off-balance sheet arrangements (as defined in Item 303(a)(4) of Regulation S-K).
CRITICAL ACCOUNTING POLICIES AND ESTIMATES
Preparation of financial statements and related disclosures in compliance with accounting principles generally accepted in the United States of America requires the application of technical accounting rules and guidance, as well as the use of estimates. The Company’s application of such rules and guidance involves assumptions that require difficult subjective judgments regarding many factors, which, in and of themselves, could materially impact the financial statements and disclosures. A future change in the estimates, assumptions, or judgments applied in determining the following matters, among others, could have a material impact on future financial statements and disclosures.
Asset and Business Acquisitions
The allocation of purchase price for asset and business acquisitions requires management estimates and judgment as to expectations for future cash flows of the acquired assets and business and the allocation of those cash flows to identifiable intangible assets in determining the estimated fair value for purchase price allocations. If the actual results differ from the estimates and judgments used in determining the purchase price allocations, impairment losses could occur. To aid in establishing the value of any intangible assets at the time of acquisition, the Company typically engages a professional appraisal firm.
Inventories
Inventories are valued at the lower of cost or net realizable value. Net realizable value is estimated based on current selling prices. Inventory costs are calculated using the first in, first out (FIFO) method or average cost method. Estimated provisions are established for slow-moving and obsolete inventory.
27
Income Taxes
Deferred tax assets and liabilities are recognized for the future tax consequences attributable to differences between the financial statement carrying amounts and the respective tax basis of assets and liabilities. Deferred tax assets and liabilities are measured using the enacted tax rates that are expected to apply in the years the temporary differences are expected to be settled or realized. A valuation allowance is recorded for the portion of the deferred tax assets for which it is more likely than not that a tax benefit will not be realized. Management’s judgment is required to determine the provision for income taxes, deferred tax assets and liabilities, and valuation allowances against deferred tax assets.
Retirement Benefit Obligations
Pension benefit obligations are based on various assumptions used by third-party actuaries in calculating these amounts. These assumptions include discount rates, expected return on plan assets, mortality rates, and other factors. Revisions in assumptions and actual results that differ from the assumptions affect future expenses, cash funding requirements, and obligations. The Company has three frozen defined benefit pension plans in the United States and pension plans in several foreign countries. For more information concerning these obligations, see Note 22 for additional information.
The effect of hypothetical changes to selected assumptions on the Company’s frozen pension benefit obligations would be as follows (amounts in thousands):
December 31, 2019 | 2020 | ||||||
Assumptions | Percentage Change | Increase (Decrease) PBO (a) | Increase (Decrease) Equity | Increase (Decrease) Expense | |||
Pension | |||||||
Discount rate | +/-5 | $(5,015)/$5,472 | $5,015/$(5,472) | $(227)/$259 | |||
Expected return on assets | +/-5 | $(385)/$385 | |||||
(a) | Projected benefit obligation (PBO) for pension plans. |
Product Warranties
The Company provides limited warranties on workmanship on its products in all market segments. The majority of the Company's products are subject to a limited warranty that ranges between less than one year and ten years, with certain product warranties being prorated after the first year. Actual warranty experience may differ from historical experience. The Company calculates an estimated warranty liability based on past warranty experience and the sales of products subject to that experience. The Company records warranty expense based on warranty payments made and changes to the estimated warranty liability. The Company's warranty liability was $14.3 million at December 31, 2019, and $16.3 million at December 31, 2018. The Company recorded warranty expense of $5.0 million for the year ended December 31, 2019, and $4.2 million for the year ended December 31, 2018. The Company's estimated warranty liability and expense increased primarily as the result of higher net sales of product with historical warranty experience.
Impairment of Long-Lived Assets
The Company reviews fixed assets to assess recoverability from future operations whenever events and circumstances indicate that the carrying values may not be recoverable. Factors that could result in an impairment review include, but are not limited to, a current period cash flow loss combined with a history of cash flow losses, current cash flows that may be insufficient to recover the investment in the property over the remaining useful life, or a projection that demonstrates continuing losses associated with the use of a long-lived asset, significant changes in the manner of use of the assets, or significant changes in business strategies. Impairment losses are recognized in operating results when expected undiscounted cash flows are less than the carrying value of the asset. Impairment losses are measured as the excess of the carrying value of the asset over the discounted expected future cash flows or the estimated fair value of the asset.
28
MARKET RISK
Foreign Currency Risk
The Company is exposed to the impact of foreign currency fluctuations in certain countries in which it operates. The exposure to foreign currency movements is limited in many countries because the operating revenues and expenses of the Company's various subsidiaries and business units are substantially in the local currency of the country in which they operate. To the extent that borrowings, sales, purchases, revenues, expenses or other transactions are not in the local currency of the subsidiary, the Company is exposed to currency risk and may enter into foreign exchange derivative contracts to mitigate the currency risk. The Company is exposed to fluctuations in the Australian dollar, Brazilian real, British pound, euro, Russian ruble and other global currencies. The Company’s net investment in foreign entities translated into U.S. dollars was $287.0 million at December 31, 2019, and $347.1 million at December 31, 2018. The hypothetical potential loss in value of the Company’s net investment in foreign entities resulting from a 10% adverse change in foreign currency exchange rates at December 31, 2019, would have been approximately $28.7 million.
Commodity Price Risk
The Company does not generally enter into long-term commodity pricing contracts and does not use derivative commodity instruments to hedge its exposures to commodity market price fluctuations. Therefore, the Company is exposed to price fluctuations of its key commodities, which consist primarily of steel, natural rubber, synthetic rubber, and carbon black. The Company attempts to pass on certain material price increases and decreases to its customers, depending on market conditions.
Interest Rate Risk
The Company is exposed to interest rate risk on its variable debt. The Company has a $125 million credit facility that has a variable interest rate. As of December 31, 2019, the amount available under the credit facility was $30.8 million. If the credit facility were fully drawn to available funds, a change in the interest rate of 100 basis points, or 1%, would have changed the Company’s interest expense by approximately $0.8 million. At December 31, 2019, there were $36.0 borrowings under the credit facility.
ITEM 7A – QUANTITATIVE AND QUALITATIVE DISCLOSURES ABOUT MARKET RISK
Reference is made to Part II, Item 7 of this report.
ITEM 8 – FINANCIAL STATEMENTS AND SUPPLEMENTARY DATA
Reference is made to Part IV, Item 15 of this report, “Exhibits and Financial Statement Schedules.”
ITEM 9 | – CHANGES IN AND DISAGREEMENTS WITH ACCOUNTANTS ON ACCOUNTING AND FINANCIAL DISCLOSURE |
None.
ITEM 9A – CONTROLS AND PROCEDURES
Evaluation of Disclosure Controls and Procedures
Titan management, including the Chief Executive Officer and Chief Financial Officer, evaluated the effectiveness of the design and operation of the Company's disclosure controls and procedures (as defined under Rules 13a-15(e) and 15d-15(e) promulgated under the Exchange Act) as of December 31, 2019. Based on that evaluation, the Chief Executive Officer and Chief Financial Officer concluded that, as of December 31, 2019, Titan's disclosure controls and procedures were effective to provide reasonable assurance that information required to be disclosed by Titan in the reports that it files or submits under the Exchange Act are recorded, processed, summarized, and reported accurately and within the time frames specified in the SEC's rules and forms and accumulated and communicated to Titan management, including the Chief Executive Officer and the Chief Financial Officer, as appropriate to allow timely decisions regarding required disclosure.
Changes in Internal Control over Financial Reporting
There were no changes in Titan's internal control over financial reporting (as defined in Exchange Act Rules 13a-15(f) and 15d-15(f)) that occurred during the fourth quarter of fiscal 2019 that have materially affected, or are reasonably likely to materially affect, the Company's internal control over financial reporting.
29
Management's Report on Internal Control over Financial Reporting
Titan management is responsible for establishing and maintaining adequate internal control over financial reporting, as defined in Rules 13a-15(f) and 15d-15(f) under the Exchange Act. The Company's internal control over financial reporting is designed to provide reasonable assurance regarding the reliability of financial reporting and the preparation of financial statements for external purposes in accordance with generally accepted accounting principles in the United States. Internal control over financial reporting includes those policies, procedures, and activities that:
• | pertain to the maintenance of records that, in reasonable detail, accurately and fairly reflect the transactions and dispositions of assets of the Company; |
• | provide reasonable assurance that transactions are recorded as necessary to permit preparation of financial statements in accordance with generally accepted accounting principles, and that receipts and expenditures of the Company are being made only in accordance with authorizations of management and directors of the Company; and |
• | provide reasonable assurance regarding prevention or timely detection of unauthorized acquisition, use, or disposition of the Company's assets that could have a material effect on the financial statements. |
Titan management, including the Chief Executive Officer and Chief Financial Officer, assessed the effectiveness of the Company's internal control over financial reporting as of December 31, 2019. In making this assessment, management used the criteria set forth by the Committee of Sponsoring Organizations of the Treadway Commission (COSO) in the "Internal Control-Integrated Framework (2013)." Based on this assessment, management concluded that the Company maintained effective internal control over financial reporting as of December 31, 2019.
The effectiveness of Titan's internal control over financial reporting as of December 31, 2019, has been audited by Grant Thornton LLP, an independent registered public accounting firm, as stated in their report within this Form 10-K.
Inherent Limitations on the Effectiveness of Controls
Because of its inherent limitations, the Company's disclosure controls and procedures or internal controls over financial reporting may not prevent or detect all misstatements or fraud. A control system, no matter how well conceived and operated, can provide only reasonable, not absolute, assurance that the objectives of the control system are met. Further, the design of a control system must reflect the fact that there are resource constraints, and the benefits of controls must be considered relative to their costs. Due to the inherent limitations in a cost-effective control system, no evaluation of controls can provide absolute assurance that misstatements due to error or fraud will not occur or that all control issues and instances of fraud, if any, within the Company have been detected.
These inherent limitations include the realities that judgments in decision-making can be faulty and that breakdowns can occur due to simple error or mistake. Controls can also be circumvented by the individual acts of some persons, by collusion of two or more people, or by management override of the controls. Also, projections of any evaluation of effectiveness to future periods are subject to the risk that controls may become inadequate because of changes in conditions, or that the degree of compliance with the policies or procedures may deteriorate.
ITEM 9B – OTHER INFORMATION
None.
30
PART III
ITEM 10 – DIRECTORS, EXECUTIVE OFFICERS, AND CORPORATE GOVERNANCE
Directors
Information required by this item regarding the Company’s directors is incorporated herein by reference to the Company’s 2020 Proxy Statement under the captions “Proposal #1 - Election of Directors,” “Committees of the Board of Directors; Meetings” and “Corporate Governance.”
Executive Officers
The names, ages, and positions of all executive officers of the Company are listed below, followed by a brief account of their business experience during the past five years. Officers are normally appointed annually by the Board of Directors at a meeting immediately following the Annual Meeting of Stockholders. There is no arrangement or understanding between any officer and any other person pursuant to which an officer was selected.
Paul G. Reitz, 47, joined the Company in July 2010 as Chief Financial Officer. Mr. Reitz was appointed President in February 2014. In December 2016, Mr. Reitz was appointed President and Chief Executive Officer.
David A. Martin, 52, joined the Company in June 2018 as Chief Financial Officer. Prior to joining Titan, Mr. Martin served from 1993 to 2018 in various roles at Aegion Corporation, a global technology/service provider maintaining, protecting and strengthening infrastructure, primarily pipelines, that is listed on the NASDAQ Global Select Market. Mr. Martin’s roles included Chief Financial Officer from 2007 to November 2017.
Michael G. Troyanovich, 62, joined the Company in August 2011 as Assistant General Counsel. Mr. Troyanovich was appointed Secretary in December 2012, and General Counsel in June 2013.
Business Conduct Policy
The Company adopted a business conduct policy, which is applicable to directors, officers and employees. The Company has also adopted corporate governance guidelines. The business conduct policy and corporate governance guidelines are available under the investor information category of the Company’s website, www.titan-intl.com. The Company intends to satisfy disclosure requirements regarding amendments to or waivers from its business conduct policy by posting such information on its website. Printed copies of the business conduct policy and corporate governance guidelines are available, without charge, by writing to: Titan International, Inc., c/o Corporate Secretary, 2701 Spruce Street, Quincy, IL 62301.
ITEM 11 – EXECUTIVE COMPENSATION
Information required by this item regarding executive compensation is incorporated herein by reference to the Company’s 2020 Proxy Statement under the caption “Compensation of Executive Officers.”
ITEM 12– SECURITY OWNERSHIP OF CERTAIN BENEFICIAL OWNERS AND MANAGEMENT AND RELATED STOCKHOLDER MATTERS
Information required by this item regarding security ownership is incorporated herein by reference to the Company’s 2020 Proxy Statement under the caption “Security Ownership of Certain Beneficial Owners and Management.”
ITEM 13 – CERTAIN RELATIONSHIPS AND RELATED TRANSACTIONS AND DIRECTOR INDEPENDENCE
Information required by this item regarding relationships and related party transactions is incorporated herein by reference to the Company’s 2020 Proxy Statement under the captions “Certain Relationships and Related Party Transactions” and “Corporate Governance” and also appears in Note 27 of the Company’s Notes to Consolidated Financial Statements.
ITEM 14 – PRINCIPAL ACCOUNTING FEES AND SERVICES
Information required by this item regarding audit fees and services is incorporated by reference herein to the Company’s 2020 Proxy Statement under the caption “Audit and Other Fees.”
31
PART IV
ITEM 15 – EXHIBITS AND FINANCIAL STATEMENT SCHEDULES
(a) 1. | ||
2. | ||
3. | ||
The accompanying Exhibit Index is incorporated herein by reference.
32
TITAN INTERNATIONAL, INC.
Exhibit Index
Annual Report on Form 10-K
Exhibit No. | DESCRIPTION |
3.1 (a) | |
3.2 (a) | |
4.1 * | |
4.2 (b) | |
4.3 (b) | |
10.1 (c) | |
10.2 (d) | |
10.3 (e) | |
10.4 (f) | |
10.5 (g) | |
10.6 (h) | |
10.7 (i) | |
10.8 (j) | |
10.9 (k) | |
10.10 (l) | |
10.11 (m) | |
10.12 (n) | |
10.13 (o) | |
10.14 (p) | |
21* | |
31.1* | |
31.2* | |
32* | |
101.SCH | XBRL Taxonomy Extension Schema Document |
101.CAL | XBRL Taxonomy Extension Calculation Linkbase Document |
101.DEF | XBRL Taxonomy Extension Definition Linkbase Document |
101.LAB | XBRL Taxonomy Extension Label Linkbase Document |
101.PRE | XBRL Taxonomy Extension Presentation Linkbase Document |
104 | Cover Page Interactive Data File (formatted as Inline XBRL and contained in Exhibit 101) |
* Filed herewith
** Confidential treatment has been granted with respect to certain portions of this exhibit. Omitted portions have been filed separately with the Securities and Exchange Commission.
(a) | Incorporated by reference to the same numbered exhibit contained in the Company’s Current Report on Form 8-K filed on June 29, 2015 (No. 1-12936). |
33
(b) | Incorporated by reference to the same numbered exhibit contained in the Company’s Current Report on Form 8-K filed on November 20, 2017 (No. 1-12936). |
(c) | Incorporated by reference to Appendix A of the Company’s Definitive Proxy Statement filed on March 28, 2011. |
(d) | Incorporated by reference to exhibit 10.1 contained in the Company's Current Report on Form 8-K filed on December 23, 2015 (No. 1-12936). |
(e) | Incorporated by reference to exhibit 10.3 contained in the Company's Current Report on Form 8-K filed on December 9, 2016 (No. 1-12936). |
(f) | Incorporated by reference to exhibit 10.3 contained in the Company's Current Report on Form 8-K filed on December 23, 2015 (No. 1-12936). |
(g) | Incorporated by reference to exhibit 10 contained in the Company's Current Report on Form 8-K filed on June 15, 2018 (No. 1-12936). |
(h) | Incorporated by reference to exhibit 10.1 contained in the Company's Form 10-Q for the quarterly period ended March 31, 2016 (No. 1-12936). |
(i) | Incorporated by reference to exhibit 10 contained in the Company's Current Report on Form 8-K filed on February 29, 2016 (No. 1-12936). |
(j) | Incorporated by reference to exhibit 10 contained in the Company's Current Report on Form 8-K filed on October 3, 2016 (No. 1-12936). |
(k) | Incorporated by reference to exhibit 10 contained in the Company's Current Report on Form 8-K filed on February 23, 2017 (No. 1-12936). |
(l) | Incorporated by reference to exhibit 10 contained in the Company's Form 10-Q for the quarterly period ended September 30, 2018 (No. 1-12936). |
(m) | Incorporated by reference to exhibit 10 contained in the Company's Current Report on Form 8-K filed on February 11, 2019 (No 1-12936). |
(n) | Incorporated by reference to exhibit 10 contained in the Company's Current Report on Form 8-K filed on February 25, 2019 (No 1-12936). |
(o) | Incorporated by reference to exhibit 10 contained in the Company's Current Report on Form 8-K filed on May 21, 2019 (No 1-12936). |
(p) | Incorporated by reference to exhibit 10 contained in the Company's Current Report on Form 10-Q for the quarterly period ended September 30, 2019 (No 1-12936). |
ITEM 16 – FORM 10-K SUMMARY
None.
34
SIGNATURES
Pursuant to the requirements of Sections 13 or 15(d) of the Securities Exchange Act of 1934, the registrant has duly caused this Report to be signed on its behalf by the undersigned, thereunto duly authorized.
TITAN INTERNATIONAL, INC. | |
(Registrant) | |
Date: | March 3, 2020 | By: | /s/ PAUL G. REITZ |
Paul G. Reitz | |||
President and Chief Executive Officer | |||
Pursuant to the requirements of the Securities Exchange Act of 1934, this Report has been signed below by the following persons on behalf of the registrant and in the capacities indicated on March 3, 2020.
Signatures | Capacity | |
/s/ PAUL G. REITZ | President, Chief Executive Officer and Director | |
Paul G. Reitz | (Principal Executive Officer) | |
/s/ DAVID A. MARTIN | SVP and Chief Financial Officer | |
David A. Martin | (Principal Financial Officer) | |
/s/ AMY S. EVANS | VP, Chief Accounting Officer | |
Amy S. Evans | (Principal Accounting Officer) | |
/s/ MAURICE M. TAYLOR JR. | Chairman | |
Maurice M. Taylor Jr. | ||
/s/ RICHARD M. CASHIN JR. | Director | |
Richard M. Cashin Jr. | ||
/s/ GARY L. COWGER | Director | |
Gary L. Cowger | ||
/s/ ALBERT J. FEBBO | Director | |
Albert J. Febbo | ||
/s/ MAX A. GUINN | Director | |
Max A. Guinn | ||
/s/ DR. MARK RACHESKY | Director | |
Dr. Mark Rachesky | ||
/s/ ANTHONY L. SOAVE | Director | |
Anthony L. Soave | ||
35
Management’s Responsibility for Financial Statements
Management is responsible for the preparation of the Company’s consolidated financial statements included in this annual report on Form 10-K. Management believes that the consolidated financial statements fairly reflect the Company’s financial transactions and the financial statements reasonably present the Company’s financial position and results of operations in conformity with accounting principles generally accepted in the United States of America.
The Board of Directors of the Company has an Audit Committee comprised entirely of outside directors who are independent of management. The Committee meets periodically with management, the internal auditors, and the independent registered public accounting firm to review accounting control, auditing, and financial reporting matters. The Audit Committee is responsible for the appointment of the independent registered public accounting firm and approval of their fees.
The independent registered public accounting firm audits the Company’s consolidated financial statements in accordance with the standards of the Public Company Accounting Oversight Board (United States). The consolidated financial statements as of December 31, 2019 have been audited by Grant Thornton LLP, an independent registered public accounting firm, as stated in their report, which is included herein.
F- 1
Report of Independent Registered Public Accounting Firm
Board of Directors and Shareholders
Titan International, Inc.
Opinion on the financial statements
We have audited the accompanying consolidated balance sheets of Titan International, Inc. (a Delaware corporation) and subsidiaries (the “Company”) as of December 31, 2019 and 2018, the related consolidated statements of comprehensive income (loss), changes in shareholders’ equity, and cash flows for each of the three years in the period ended December 31, 2019, and the related notes and financial statement schedule (collectively referred to as the “financial statements”). In our opinion, the financial statements present fairly, in all material respects, the financial position of the Company as of December 31, 2019 and 2018, and the results of its operations and its cash flows for each of the three years in the period ended December 31, 2019, in conformity with accounting principles generally accepted in the United States of America.
We also have audited, in accordance with the standards of the Public Company Accounting Oversight Board (United States) (“PCAOB”), the Company’s internal control over financial reporting as of December 31, 2019, based on criteria established in the 2013 Internal Control-Integrated Framework issued by the Committee of Sponsoring Organizations of the Treadway Commission (“COSO”), and our report dated March 3, 2020 expressed an unqualified opinion.
Change in accounting principle
As discussed in Note 1 to the consolidated financial statements, the Company has changed its method of accounting for lease arrangements in 2019 due to the adoption of Accounting Standards Update (ASU) No. 2016-02, Leases (Topic 842).
Basis for opinion
These financial statements are the responsibility of the Company’s management. Our responsibility is to express an opinion on the Company’s financial statements based on our audits. We are a public accounting firm registered with the PCAOB and are required to be independent with respect to the Company in accordance with the U.S. federal securities laws and the applicable rules and regulations of the Securities and Exchange Commission and the PCAOB.
We conducted our audits in accordance with the standards of the PCAOB. Those standards require that we plan and perform the audit to obtain reasonable assurance about whether the financial statements are free of material misstatement, whether due to error or fraud. Our audits included performing procedures to assess the risks of material misstatement of the financial statements, whether due to error or fraud, and performing procedures that respond to those risks. Such procedures included examining, on a test basis, evidence supporting the amounts and disclosures in the financial statements. Our audits also included evaluating the accounting principles used and significant estimates made by management, as well as evaluating the overall presentation of the financial statements. We believe that our audits provide a reasonable basis for our opinion.
/s/ Grant Thornton LLP
We have served as the Company’s auditor since 2012.
Chicago, Illinois
March 3, 2020
F- 2
Report of Independent Registered Public Accounting Firm
Board of Directors and Shareholders
Titan International, Inc.
Opinion on internal control over financial reporting
We have audited the internal control over financial reporting of Titan International, Inc. (a Delaware corporation) and subsidiaries (the “Company”) as of December 31, 2019, based on criteria established in the 2013 Internal Control-Integrated Framework issued by the Committee of Sponsoring Organizations of the Treadway Commission (“COSO”). In our opinion, the Company maintained, in all material respects, effective internal control over financial reporting as of December 31, 2019, based on criteria established in the 2013 Internal Control-Integrated Framework issued by COSO.
We also have audited, in accordance with the standards of the Public Company Accounting Oversight Board (United States) (“PCAOB”), the consolidated financial statements of the Company as of and for the year ended December 31, 2019, and our report dated March 3, 2020 expressed an unqualified opinion on those financial statements.
Basis for opinion
The Company’s management is responsible for maintaining effective internal control over financial reporting and for its assessment of the effectiveness of internal control over financial reporting, included in the accompanying Management’s Report on Internal Control over Financial Reporting. Our responsibility is to express an opinion on the Company’s internal control over financial reporting based on our audit. We are a public accounting firm registered with the PCAOB and are required to be independent with respect to the Company in accordance with the U.S. federal securities laws and the applicable rules and regulations of the Securities and Exchange Commission and the PCAOB.
We conducted our audit in accordance with the standards of the PCAOB. Those standards require that we plan and perform the audit to obtain reasonable assurance about whether effective internal control over financial reporting was maintained in all material respects. Our audit included obtaining an understanding of internal control over financial reporting, assessing the risk that a material weakness exists, testing and evaluating the design and operating effectiveness of internal control based on the assessed risk, and performing such other procedures as we considered necessary in the circumstances. We believe that our audit provides a reasonable basis for our opinion.
Definition and limitations of internal control over financial reporting
A company’s internal control over financial reporting is a process designed to provide reasonable assurance regarding the reliability of financial reporting and the preparation of financial statements for external purposes in accordance with generally accepted accounting principles. A company’s internal control over financial reporting includes those policies and procedures that (1) pertain to the maintenance of records that, in reasonable detail, accurately and fairly reflect the transactions and dispositions of the assets of the company; (2) provide reasonable assurance that transactions are recorded as necessary to permit preparation of financial statements in accordance with generally accepted accounting principles, and that receipts and expenditures of the company are being made only in accordance with authorizations of management and directors of the company; and (3) provide reasonable assurance regarding prevention or timely detection of unauthorized acquisition, use, or disposition of the company’s assets that could have a material effect on the financial statements.
Because of its inherent limitations, internal control over financial reporting may not prevent or detect misstatements. Also, projections of any evaluation of effectiveness to future periods are subject to the risk that controls may become inadequate because of changes in conditions, or that the degree of compliance with the policies or procedures may deteriorate.
/s/ Grant Thornton LLP
Chicago, Illinois
March 3, 2020
F- 3
TITAN INTERNATIONAL, INC.
CONSOLIDATED STATEMENTS OF OPERATIONS
(All amounts in thousands, except per share data)
Year ended December 31, | |||||||||||
2019 | 2018 | 2017 | |||||||||
Net sales | $ | $ | $ | ||||||||
Cost of sales | |||||||||||
Asset impairment | |||||||||||
Gross profit | |||||||||||
Selling, general and administrative expenses | |||||||||||
Research and development expenses | |||||||||||
Royalty expense | |||||||||||
(Loss) income from operations | ( | ) | ( | ) | |||||||
Interest expense | ( | ) | ( | ) | ( | ) | |||||
Loss on senior note repurchase | ( | ) | |||||||||
Foreign exchange gain (loss) | ( | ) | ( | ) | |||||||
Other income | |||||||||||
(Loss) income before income taxes | ( | ) | ( | ) | |||||||
Provision for income taxes | |||||||||||
Net (loss) income | ( | ) | ( | ) | |||||||
Net loss attributable to noncontrolling interests | ( | ) | ( | ) | ( | ) | |||||
Net (loss) income attributable to Titan | ( | ) | ( | ) | |||||||
Redemption value adjustment | ( | ) | ( | ) | ( | ) | |||||
Net (loss) income applicable to common shareholders | $ | ( | ) | $ | $ | ( | ) | ||||
(Loss) Earnings per common share: | |||||||||||
Basic | $ | ( | ) | $ | $ | ( | ) | ||||
Diluted | $ | ( | ) | $ | $ | ( | ) | ||||
Average common shares and equivalents outstanding: | |||||||||||
Basic | |||||||||||
Diluted | |||||||||||
Dividends declared per common share: | $ | $ | $ | ||||||||
See accompanying Notes to Consolidated Financial Statements.
F- 4
TITAN INTERNATIONAL, INC.
CONSOLIDATED STATEMENTS OF COMPREHENSIVE INCOME (LOSS)
(All amounts in thousands)
Year ended December 31, | |||||||||||
2019 | 2018 | 2017 | |||||||||
Net (loss) income | $ | ( | ) | $ | $ | ( | ) | ||||
Currency translation adjustment | ( | ) | ( | ) | |||||||
Pension liability adjustments, net of tax of $133, $(104), and $151, respectively | ( | ) | |||||||||
Comprehensive loss | ( | ) | ( | ) | ( | ) | |||||
Net comprehensive loss attributable to redeemable and noncontrolling interests | ( | ) | ( | ) | ( | ) | |||||
Comprehensive loss attributable to Titan | $ | ( | ) | $ | ( | ) | $ | ( | ) | ||
See accompanying Notes to Consolidated Financial Statements.
F- 5
TITAN INTERNATIONAL, INC.
CONSOLIDATED BALANCE SHEETS
(All amounts in thousands, except share data)
December 31, | |||||||
2019 | 2018 | ||||||
Assets | |||||||
Current assets | |||||||
Cash and cash equivalents | $ | $ | |||||
Accounts receivable (net of allowance of $3,714 and $3,404, respectively) | |||||||
Inventories | |||||||
Prepaid and other current assets | |||||||
Total current assets | |||||||
Property, plant and equipment, net | |||||||
Operating lease assets | |||||||
Deferred income taxes | |||||||
Other long-term assets | |||||||
Total assets | $ | $ | |||||
Liabilities | |||||||
Current liabilities | |||||||
Short-term debt | $ | $ | |||||
Accounts payable | |||||||
Other current liabilities | |||||||
Total current liabilities | |||||||
Long-term debt | |||||||
Deferred income taxes | |||||||
Other long-term liabilities | |||||||
Total liabilities | |||||||
Commitments and contingencies: Notes 10, 24, 25 and 26 | |||||||
Redeemable noncontrolling interest | |||||||
Equity | |||||||
Titan stockholders' equity | |||||||
Common stock ($0.0001 par, 120,000,000 shares authorized, 60,710,983 issued at December 2019 and 60,715,356 at December 2018) | |||||||
Additional paid-in capital | |||||||
Retained deficit | ( | ) | ( | ) | |||
Treasury stock (at cost, 427,771 shares at December 2019 and 798,383 shares at December 2018) | ( | ) | ( | ) | |||
Accumulated other comprehensive loss | ( | ) | ( | ) | |||
Total Titan stockholders’ equity | |||||||
Noncontrolling interests | ( | ) | |||||
Total equity | |||||||
Total liabilities and equity | $ | $ | |||||
See accompanying Notes to Consolidated Financial Statements.
F- 6
TITAN INTERNATIONAL, INC.
CONSOLIDATED STATEMENTS OF CHANGES IN EQUITY
(All amounts in thousands, except share data)
Number of common shares | Common stock | Additional paid-in capital | Retained earnings (deficit) | Treasury stock | Stock reserved for deferred compensation | Accumulated other comprehensive income (loss) | Total Titan Equity | Non-controlling interest | Total Equity | |||||||||||||||||||||||||||||
Balance January 1, 2017 | $ | $ | $ | $ | ( | ) | $ | ( | ) | $ | ( | ) | $ | $ | ( | ) | $ | |||||||||||||||||||||
Net loss * | ( | ) | ( | ) | ( | ) | ( | ) | ||||||||||||||||||||||||||||||
CTA, net of tax * | ( | ) | ||||||||||||||||||||||||||||||||||||
Pension liability adjustments, net of tax | ||||||||||||||||||||||||||||||||||||||
Note Conversion | ||||||||||||||||||||||||||||||||||||||
Dividends declared | ( | ) | ( | ) | ( | ) | ||||||||||||||||||||||||||||||||
Redemption value adjustment | ( | ) | ( | ) | ( | ) | ||||||||||||||||||||||||||||||||
Stock-based compensation | ||||||||||||||||||||||||||||||||||||||
Deferred compensation transactions | ( | ) | ( | ) | ||||||||||||||||||||||||||||||||||
Issuance of treasury stock under 401(k) plan | ||||||||||||||||||||||||||||||||||||||
Balance December 31, 2017 | ( | ) | ( | ) | ( | ) | ( | ) | ( | ) | ||||||||||||||||||||||||||||
Net loss * | ( | ) | ||||||||||||||||||||||||||||||||||||
CTA, net of tax * | ( | ) | ( | ) | ( | ) | ||||||||||||||||||||||||||||||||
Pension liability adjustments, net of tax | ( | ) | ( | ) | ( | ) | ||||||||||||||||||||||||||||||||
Dividends declared | ( | ) | ( | ) | ( | ) | ||||||||||||||||||||||||||||||||
Accounting standards adoption | ||||||||||||||||||||||||||||||||||||||
Acquisition of additional interest | ( | ) | ( | ) | ( | ) | ( | ) | ||||||||||||||||||||||||||||||
Redemption value adjustment | ( | ) | ( | ) | ( | ) | ||||||||||||||||||||||||||||||||
Stock-based compensation | ||||||||||||||||||||||||||||||||||||||
VIE consolidation and distributions | ( | ) | ( | ) | ||||||||||||||||||||||||||||||||||
Deferred compensation transactions | ||||||||||||||||||||||||||||||||||||||
Issuance of treasury stock under 401(k) plan | ||||||||||||||||||||||||||||||||||||||
Balance December 31, 2018 | ( | ) | ( | ) | ( | ) | ( | ) | ||||||||||||||||||||||||||||||
Net (loss) income * | ( | ) | ( | ) | ( | ) | ( | ) | ||||||||||||||||||||||||||||||
CTA, net of tax * | ( | ) | ( | ) | ( | ) | ||||||||||||||||||||||||||||||||
Pension liability adjustments, net of tax | ||||||||||||||||||||||||||||||||||||||
Dividends declared | ( | ) | ( | ) | ( | ) | ||||||||||||||||||||||||||||||||
Accounting standards adoption | ( | ) | ( | ) | ( | ) | ||||||||||||||||||||||||||||||||
Acquisition of additional interest | ( | ) | ||||||||||||||||||||||||||||||||||||
Redeemable noncontrolling interest activity | ||||||||||||||||||||||||||||||||||||||
Redemption value adjustment | ( | ) | ( | ) | ( | ) | ||||||||||||||||||||||||||||||||
Stock-based compensation | ||||||||||||||||||||||||||||||||||||||
VIE deconsolidation and distributions | ( | ) | ( | ) | ||||||||||||||||||||||||||||||||||
Record initial NCI | ||||||||||||||||||||||||||||||||||||||
Issuance of treasury stock under 401(k) plan | ( | ) | ||||||||||||||||||||||||||||||||||||
Balance December 31, 2019 | $ | — | $ | $ | ( | ) | $ | ( | ) | $ | $ | ( | ) | $ | $ | $ | ||||||||||||||||||||||
* Net income (loss) excludes income (loss) attributable to redeemable noncontrolling interest of $84 , $(1,091 ), and $(819 ) for 2017, 2018, and 2019, respectively. CTA excludes $1,907 , $(4,496 ), and $683 for 2017, 2018, and 2019, respectively.
See accompanying Notes to Consolidated Financial Statements.
F- 7
TITAN INTERNATIONAL, INC.
CONSOLIDATED STATEMENTS OF CASH FLOWS
(All amounts in thousands)
Year ended December 31, | |||||||||||
Cash flows from operating activities: | 2019 | 2018 | 2017 | ||||||||
Net (loss) income | $ | ( | ) | $ | $ | ( | ) | ||||
Adjustments to reconcile net (loss) income to net cash provided by (used for) operating activities: | |||||||||||
Depreciation and amortization | |||||||||||
Asset impairment | |||||||||||
Deferred income tax provision | ( | ) | ( | ) | |||||||
Gain on investment sale | ( | ) | |||||||||
Loss on note repurchase | |||||||||||
Stock-based compensation | |||||||||||
Issuance of treasury stock under 401(k) plan | |||||||||||
Foreign currency translation loss | ( | ) | |||||||||
(Increase) decrease in assets: | |||||||||||
Accounts receivable | ( | ) | ( | ) | |||||||
Inventories | ( | ) | ( | ) | |||||||
Prepaid and other current assets | ( | ) | |||||||||
Other long-term assets | ( | ) | ( | ) | |||||||
Increase (decrease) in liabilities: | |||||||||||
Accounts payable | ( | ) | |||||||||
Other current liabilities | ( | ) | ( | ) | |||||||
Other liabilities | ( | ) | ( | ) | ( | ) | |||||
Net cash provided by (used for) operating activities | ( | ) | ( | ) | |||||||
Cash flows from investing activities: | |||||||||||
Capital expenditures | ( | ) | ( | ) | ( | ) | |||||
Sale of Wheels India Limited shares | |||||||||||
Certificates of deposit | |||||||||||
Payments related to redeemable noncontrolling interest | ( | ) | |||||||||
Other | ( | ) | |||||||||
Net cash (used for) provided by investing activities | ( | ) | ( | ) | |||||||
Cash flows from financing activities: | |||||||||||
Proceeds from borrowings | |||||||||||
Repurchase of senior secured notes | ( | ) | |||||||||
Payment on debt | ( | ) | ( | ) | ( | ) | |||||
Dividends paid | ( | ) | ( | ) | ( | ) | |||||
Net cash provided by (used for) financing activities | ( | ) | |||||||||
Effect of exchange rate changes on cash | ( | ) | |||||||||
Net decrease in cash and cash equivalents | ( | ) | ( | ) | ( | ) | |||||
Cash and cash equivalents, beginning of year | |||||||||||
Cash and cash equivalents, end of year | $ | $ | $ | ||||||||
Supplemental information: | |||||||||||
Interest paid | $ | $ | $ | ||||||||
Income taxes paid, net of refunds received | $ | $ | $ | ||||||||
Non-cash information: | |||||||||||
Deferred compensation obligation paid through the transfer of trust assets | $ | $ | $ | ||||||||
Issuance of common stock for convertible debt payment | $ | $ | $ | ||||||||
See accompanying Notes to Consolidated Financial Statements.
F- 8
TITAN INTERNATIONAL, INC.
NOTES TO CONSOLIDATED FINANCIAL STATEMENTS
1. |
Business
Titan International, Inc. and its subsidiaries (Titan or the Company) are leading manufacturers of wheels, tires, and undercarriage systems and components for off-highway vehicles used in the agricultural, earthmoving/construction, and consumer segments. Titan manufactures both wheels and tires for the majority of these market applications, allowing the Company to provide the value-added service of delivering complete wheel and tire assemblies. The Company offers a broad range of products that are manufactured to meet the specifications of original equipment manufacturers (OEMs) and/or the requirements of aftermarket customers.
Principles of consolidation
The consolidated financial statements include the accounts of all majority-owned subsidiaries and variable interest entities in which Titan is the primary beneficiary. Investments in companies in which Titan does not own a majority interest, but which Titan has the ability to exercise significant influence over operating and financial policies are accounted for using the equity method. Investments in other companies are carried at cost. All significant intercompany accounts and transactions have been eliminated.
Cash and cash equivalents
The Company considers short-term debt securities with an original maturity of three months or less to be cash equivalents. The cash in the Company's U.S. banks is not fully insured by the Federal Deposit Insurance Corporation. The Company had $60.6 million and $55.6 million of cash in foreign bank accounts at December 31, 2019 and 2018, respectively. The Company's cash in its foreign bank accounts is not fully insured.
Accounts receivable and allowance for doubtful accounts
The Company carries its accounts receivable at their face amounts less an allowance for doubtful accounts. An allowance for uncollectible receivables is recorded based upon known bad debt risks and past loss history. Actual collection experience may differ from the current estimate of net receivables.
Inventories
Inventories are valued at the lower of cost or net realizable value. The Company’s inventories are valued under the first in, first out (FIFO) method or average cost method. Net realizable value is estimated based on current selling prices. Estimated provisions are established for slow-moving and obsolete inventory.
Property, plant, and equipment have been recorded at cost. Depreciation is provided using the straight-line method over the following estimated useful lives of the related assets:
Years | |
Building and improvements | 25 - 40 |
Machinery and equipment | 7 - 20 |
Tools, dies, and molds | 2 - 9 |
Maintenance and repairs are expensed as incurred. When property, plant, and equipment are retired or otherwise disposed of, the related cost and accumulated depreciation are eliminated, and any gain or loss on disposition is included in the accompanying Consolidated Statements of Operations.
Interest is capitalized on fixed asset projects which are constructed over a period of time. The amount of interest capitalized is determined by applying a weighted average interest rate to the average amount of accumulated expenditures for the asset during the period. The interest rate used is based on the rates applicable to borrowings outstanding during the period. No interest was capitalized in 2019 or 2018. Interest capitalized was $0.3 million for the year ended December 31, 2017.
F- 9
TITAN INTERNATIONAL, INC.
NOTES TO CONSOLIDATED FINANCIAL STATEMENTS
Fair value of financial instruments
The Company records all financial instruments, including cash and cash equivalents, accounts receivable, notes receivable, accounts payable, and notes payable at cost, which approximates fair value due to their short term or stated rates. Investments in marketable equity securities are recorded at fair value. The 6.50 % senior secured notes due 2023, issued on November 20, 2017 (senior secured notes) were carried at cost of $396.0 million at December 31, 2019. The fair value of the senior secured notes due 2023 at December 31, 2019, as obtained through an independent pricing source, was approximately $337.0 million.
Investments
The Company had an equity method investment of $34.0 million in Wheels India Limited (Wheels India) as of December 31, 2019, representing a 23.8 % ownership. This equity method investment is included in other long-term assets in the Consolidated Balance Sheets. The value of this investment based on the December 31, 2019, market price was $48.2 million. In February 2020, the Company completed the sale of shares of Wheels India reducing the ownership percentage to 20%. See Note 31 for additional information. The Company assesses the carrying value of its equity method investments whenever events and circumstances indicate that the carrying values may not be recoverable. Investment write-downs, if necessary, are recognized in operating results when expected undiscounted future cash flows are less than the carrying value of the asset. These write-downs, if any, are measured as the excess of the carrying value of the asset over the discounted expected future cash flows or the estimated fair value of the asset.
The Company uses the cost method to account for investments in entities that are not consolidated or accounted for under the equity method. Under the cost method, investments are reported at cost in other long-term assets on the Consolidated Balance Sheets. The fair values of cost method investments are not estimated if there are no identified events or changes in circumstances that may have a significant adverse effect on the fair values of the investments.
Foreign currency translation
The financial statements of the Company’s foreign subsidiaries are translated to United States currency. Assets and liabilities are translated to United States dollars at period-end exchange rates. Income and expense items are translated at average rates of exchange prevailing during the period. Translation adjustments are included in “Accumulated other comprehensive loss” in stockholders’ equity. Gains and losses that result from foreign currency transactions are included in the accompanying Consolidated Statements of Operations.
Revenue recognition
The Company records sales revenue when products are shipped to customers and both title and the risks and rewards of ownership are transferred. Provisions are established for sales returns and uncollectible accounts based on historical experience. Should trends change, adjustments would be necessary to the estimated provisions.
Cost of sales
Cost of sales is comprised primarily of direct materials and supplies consumed in the manufacturing of the Company’s products, as well as manufacturing labor, depreciation expense, and overhead expense necessary to acquire and convert the purchased materials and supplies into a finished product. Cost of sales also includes all purchasing, receiving, inspection, internal transfers, and related distribution costs.
Selling, general, and administrative expense
Research and development expense
Research and development (R&D) expenses are expensed as incurred. R&D costs were $9.9 million, $11.1 million, and $10.3 million for the years ended December 31, 2019, 2018, and 2017, respectively.
Advertising
Advertising expenses are included in SG&A expense and are expensed as incurred. Advertising costs were approximately $3.7 million, $3.1 million and $3.9 million for the years ended December 31, 2019, 2018 and 2017, respectively.
F- 10
TITAN INTERNATIONAL, INC.
NOTES TO CONSOLIDATED FINANCIAL STATEMENTS
Warranty costs
The Company provides limited warranties on workmanship on its products in all market segments. The provision for estimated warranty costs is made in the period when such costs become probable and is based on past warranty experience. See Note 9 for additional information.
Income taxes
Deferred income tax provisions are determined using the liability method to recognize deferred tax assets and liabilities. This method is based upon differences between the financial statement carrying amounts and the respective tax basis of assets and liabilities using enacted tax rates that are expected to apply in the years the temporary differences are expected to be settled or realized. Valuation allowances are recorded where it is considered more likely than not that some portion or all of the deferred tax assets will not be realized. Tax benefits are recognized only for tax positions that are more likely than not to be sustained upon examination by tax authorities.
Earnings per share
Basic earnings per share (EPS) is computed by dividing consolidated net earnings applicable to common shareholders by the weighted average number of common shares outstanding. Diluted EPS is computed by dividing adjusted consolidated net earnings applicable to common shareholders by the sum of the weighted average number of common shares outstanding and the weighted average number of potential common shares outstanding. Potential common shares consist of outstanding options under the Company’s stock compensation plans.
Environmental liabilities
Stock-based compensation
The Company has one stock-based compensation plan, which is described in Note 23. Compensation expense for stock-based compensation is recognized over the requisite service period at the estimated fair value of the award at the grant date. The Company granted 80,000 ; and 89,200 stock options in 2018, and 2017, respectively; none were granted in 2019. The Company granted 355,201 and 376,500 restricted stock awards in 2019 and 2018, respectively; none were granted in 2017.
Use of estimates
Adoption of new accounting standards
On January 1, 2019, the Company adopted Accounting Standards Update (ASU) No. 2016-02, "Leases (Topic 842)" (the New Lease Standard) to increase transparency and comparability among entities by recognizing lease assets and liabilities on the balance sheet and disclosing key information about lease arrangements. Titan elected the modified retrospective with cumulative effect transition approach to adopt the New Lease Standard and thus did not restate its comparative periods in the year of transition. The Company adopted the practical expedients of the New Lease Standard which include (i) not reassessing whether expired or existing contracts contain leases, (ii) not reassessing the lease classification for any expired or existing leases, and (iii) not revaluing initial direct costs for existing leases. The Company did not elect the hindsight practical expedient. The adoption of this standard resulted in the recognition of operating lease right-of-use assets and corresponding lease liabilities on the Condensed Consolidated Balance Sheet, which resulted in a net credit adjustment to retained earnings as of January 1, 2019, of $0.6 million. The New Lease Standard did not materially impact the Company's operating results or liquidity. Further disclosures related to the New Lease Standard are included in Note 25, Leases.
The Company adopted ASU No. 2018-02, "Reclassification of Certain Tax Effects from Accumulated Other Comprehensive Income" effective January 1, 2019. The amendments in this update allow a reclassification from accumulated other comprehensive income to retained earnings for stranded tax effects resulting from the 2017 Tax Cuts and Jobs Act (the 2017 TCJA). Consequently, the amendments eliminate the stranded tax effects resulting from the 2017 TCJA and improve the usefulness of information reported to financial statement users. As a result of adopting this standard, the Company recorded a $4.9 million reclassification to decrease accumulated other comprehensive income and increase retained earnings as of January 1, 2019.
F- 11
TITAN INTERNATIONAL, INC.
NOTES TO CONSOLIDATED FINANCIAL STATEMENTS
The Company adopted the Financial Accounting Standards Board (FASB) Accounting Standards Codification (ASC) Topic 606, "Revenue from Contracts with Customers" (the New Revenue Standard), effective January 1, 2018, using the modified retrospective approach which requires the recognition of the cumulative effect of initially applying the standard as an adjustment to opening retained earnings for the fiscal year beginning January 1, 2018. The adoption of the New Revenue Standard resulted in the recognition of an immaterial cumulative adjustment to opening retained earnings as of January 1, 2018, and had an immaterial effect on the Company’s financial position and results of operations. Results for reporting periods beginning after January 1, 2018, are presented under the New Revenue Standard, which prescribes that an entity should recognize revenue to depict the transfer of promised goods or services to customers in an amount that reflects the consideration to which the entity expects to be entitled in exchange for those goods or services. Titan recognizes revenue when the performance obligations specified in the Company's contracts have been satisfied. Titan's contracts typically contain a single performance obligation that is fulfilled on the date of delivery based on shipping terms stipulated in the contract. The impact of the Company's adoption of the New Revenue Standard on net sales was immaterial and the disaggregation of revenues, which is based on the major markets the Company serves, has not changed from how it is presented in Note 28, Segment and Geographical Information.
The Company adopted ASU No. 2017-07, “Compensation - Retirement Benefits (Topic 715): Improving the Presentation of Net Periodic Pension Cost and Net Periodic Postretirement Benefit Cost" on January 1, 2018, using the retrospective transition method. This standard changed the presentation of net periodic pension and postretirement benefit cost (net benefit cost) within the Condensed Consolidated Statement of Operations. Under the previous guidance, net benefit cost was reported as an employee cost within operating income. The amendment requires the bifurcation of net benefit cost, with the service cost component to be presented with other employee compensation costs in operating income, while the other components will be reported separately outside of income from operations.
The Company early-adopted ASU No. 2018-15, "Intangibles - Goodwill and Other - Internal-Use Software (Subtopic 350-40): Customer's Accounting for Implementation Costs Incurred in a Cloud Computing Arrangement That Is a Service Contract," effective September 30, 2018, using the retrospective approach. ASU 2018-15 requires a customer in a hosting arrangement that is a service contract to apply the guidance on internal-use software to determine which implementation costs to recognize as an asset and which costs to expense. Costs to develop or obtain internal-use software that cannot be capitalized under Subtopic 350-40, such as training costs and certain data conversion costs, also cannot be capitalized for a hosting arrangement that is a service contract. The amendments in this update require a customer in a hosting arrangement that is a service contract to determine whether an implementation activity relates to the preliminary project stage, the application development stage, or the post-implementation stage. Costs for implementation activities in the application development stage will be capitalized depending on the nature of the costs, while costs incurred during the preliminary project and post-implementation stages will be expensed. As a result of the adoption of this accounting standard, the Company capitalized an aggregate of $7.4 million of implementation costs for the year ended December 31, 2018, from selling, general and administration in the Condensed Consolidated Statement of Operations to other assets in the Condensed Consolidated Balance Sheets.
In March 2018, the FASB issued ASU No. 2018-05, "Income Taxes (Topic 740): Amendments to SEC Paragraphs Pursuant to SEC Staff Accounting Bulletin No. 118." This ASU updates the income tax accounting in US GAAP to reflect the SEC's interpretive guidance released on December 22, 2017, when the 2017 TCJA was enacted.
In May 2017, the FASB issued ASU No. 2017-09, "Stock Compensation (Topic 718): Scope of Modification Accounting." This update provides guidance about which changes to the terms or conditions of a share-based payment award require an entity to apply modification accounting. Disclosure requirements under Topic 718 remain unchanged. The Company adopted ASU 2017-09 effective January 1, 2018. The adoption of this guidance did not have a material effect on the Company's condensed consolidated financial statements; no changes were made to the terms or conditions of share-based payments.
In August 2016, the FASB issued ASU No. 2016-15, "Statement of Cash Flows (Topic 230): Classification of Certain Cash Receipts and Cash Payments." This update addresses eight specific cash flow issues with the objective of reducing the existing diversity in practice. The Company adopted this guidance effective January 1, 2018, with no resulting changes to the Company's condensed consolidated financial statements.
F- 12
TITAN INTERNATIONAL, INC.
NOTES TO CONSOLIDATED FINANCIAL STATEMENTS
Accounting standards issued but not yet adopted
In August 2018, the FASB issued ASU No. 2018-13, "Disclosure Framework - Changes to the Disclosure Requirements for Fair Value Measurement." The amendments in this update modify the disclosure requirements on fair value measurements in Topic 820, Fair Value Measurement. The amendments in this update are effective for fiscal years beginning after December 15, 2019. The adoption of this guidance is not expected to have a material effect on the Company's condensed consolidated financial statements.
In August 2018, the FASB issued ASU No. 2018-14, "Disclosure Framework - Changes to the Disclosure Requirements for Defined Benefit Plans." The amendments in this update modify the disclosure requirements for employers that sponsor defined benefit pension or other postretirement plans. The amendments in this update are effective for fiscal years ending after December 15, 2020. The adoption of this guidance is not expected to have a material effect on the Company's condensed consolidated financial statements.
2. ACCOUNTS RECEIVABLE
Accounts receivable at December 31, 2019 and 2018, consisted of the following (amounts in thousands):
2019 | 2018 | ||||||
Accounts receivable | $ | $ | |||||
Allowance for doubtful accounts | ( | ) | ( | ) | |||
Accounts receivable, net | $ | $ | |||||
Accounts receivable are reduced by an estimated allowance for doubtful accounts which is based on known risks and historical losses.
3. INVENTORIES
Inventories at December 31, 2019 and 2018, consisted of the following (amounts in thousands):
2019 | 2018 | ||||||
Raw material | $ | $ | |||||
Work-in-process | |||||||
Finished goods | |||||||
$ | $ | ||||||
F- 13
TITAN INTERNATIONAL, INC.
NOTES TO CONSOLIDATED FINANCIAL STATEMENTS
4. PREPAID AND OTHER CURRENT ASSETS
Prepaid and other current assets at December 31, 2019 and 2018, consisted of the following (amounts in thousands):
2019 | 2018 | ||||||
Factory supplies | $ | $ | |||||
Value added tax | |||||||
Prepaid expense | |||||||
Contract receivable | |||||||
Prepaid insurance | |||||||
Deposits | |||||||
Prepaid taxes | |||||||
Duty receivable | |||||||
Derivative financial instruments | |||||||
Volume rebate | |||||||
Other | |||||||
$ | $ | ||||||
5. PROPERTY, PLANT, AND EQUIPMENT
Property, plant, and equipment at December 31, 2019 and 2018, consisted of the following (amounts in thousands):
2019 | 2018 | ||||||
Land and improvements | $ | $ | |||||
Buildings and improvements | |||||||
Machinery and equipment | |||||||
Tools, dies, and molds | |||||||
Construction-in-process | |||||||
Less accumulated depreciation | ( | ) | ( | ) | |||
$ | $ | ||||||
Depreciation, including depreciation on capital leases, related to property, plant, and equipment for the years 2019, 2018, and 2017 totaled $50.9 million, $53.9 million, and $54.3 million, respectively.
F- 14
TITAN INTERNATIONAL, INC.
NOTES TO CONSOLIDATED FINANCIAL STATEMENTS
6. OTHER LONG-TERM ASSETS
Other long-term assets at December 31, 2019 and 2018, consisted of the following (amounts in thousands):
2019 | 2018 | ||||||
Investment in Wheels India Limited | $ | $ | |||||
Prepaid software | |||||||
Amortizable intangibles | |||||||
Other equity investments | |||||||
Manufacturing spares | |||||||
Notes receivable | |||||||
Deferred financing costs | |||||||
Other | |||||||
$ | $ | ||||||
7. INTANGIBLE ASSETS
The components of intangible assets for each of the years ended December 31, 2019 and 2018, were as follows (amounts in thousands):
Weighted- Average Useful Lives (in Years) | 2019 | 2018 | |||||||
Amortizable intangible assets: | |||||||||
Customer relationships | $ | $ | |||||||
Patents, trademarks, and other | |||||||||
Total at cost | |||||||||
Less accumulated amortization | ( | ) | ( | ) | |||||
$ | $ | ||||||||
Amortization related to intangible assets for the years 2019, 2018, and 2017 totaled $2.2 million, $2.3 million, and $3.0 million, respectively.
The estimated aggregate amortization expense at December 31, 2019, for each of the years (or other periods) set forth below was as follows (amounts in thousands):
2020 | $ | ||
2021 | |||
2022 | |||
2023 | |||
2024 | |||
Thereafter | |||
$ | |||
F- 15
TITAN INTERNATIONAL, INC.
NOTES TO CONSOLIDATED FINANCIAL STATEMENTS
8. OTHER CURRENT LIABILITIES
Other current liabilities at December 31, 2019 and 2018, consisted of the following (amounts in thousands):
2019 | 2018 | ||||||
Wages and benefits | $ | $ | |||||
Warranty | |||||||
Insurance | |||||||
Incentive compensation | |||||||
Operating lease liability | |||||||
Customer deposits | |||||||
Customer rebates | |||||||
Accrued other taxes | |||||||
Accrued interest | |||||||
Italian government grant | |||||||
Other | |||||||
$ | $ | ||||||
9. WARRANTY
Changes in the warranty liability for the periods set forth below consisted of the following (amounts in thousands):
2019 | 2018 | ||||||
Warranty liability, January 1 | $ | $ | |||||
Provision for warranty liabilities | |||||||
Warranty payments made | ( | ) | ( | ) | |||
Warranty liability, December 31 | $ | $ | |||||
The Company provides limited warranties on workmanship on its products in all market segments. The majority of the Company’s products are subject to a limited warranty that ranges between less than one year and ten years, with certain product warranties being prorated after the first year. The Company calculates a provision for warranty expense based on past warranty experience. Warranty accruals are included as a component of other current liabilities on the Consolidated Balance Sheets.
10. REVOLVING CREDIT FACILITY AND LONG-TERM DEBT
Long-term debt consisted of the following as of the dates set forth below (amounts in thousands):
December 31, 2019 | |||||||||||
Principal Balance | Unamortized Debt Issuance | Net Carrying Amount | |||||||||
6.50% senior secured notes due 2023 | $ | $ | ( | ) | $ | ||||||
Titan Europe credit facilities | |||||||||||
Revolving credit facility | |||||||||||
Other debt | |||||||||||
Capital leases | |||||||||||
Total debt | ( | ) | |||||||||
Less amounts due within one year | |||||||||||
Total long-term debt | $ | $ | ( | ) | $ | ||||||
F- 16
TITAN INTERNATIONAL, INC.
NOTES TO CONSOLIDATED FINANCIAL STATEMENTS
December 31, 2018 | |||||||||||
Principal Balance | Unamortized Debt Issuance | Net Carrying Amount | |||||||||
6.50% senior secured notes due 2023 | $ | $ | ( | ) | $ | ||||||
Titan Europe credit facilities | |||||||||||
Other debt | $ | ||||||||||
Capital leases | $ | ||||||||||
Total debt | ( | ) | |||||||||
Less amounts due within one year | |||||||||||
Total long-term debt | $ | $ | ( | ) | $ | ||||||
The weighted-average interest rates on total short-term borrowings, excluding current maturities of long-term debt, at December 31, 2019 and December 31, 2018, were 6.5 % and 6.9 %, respectively.
Aggregate maturities of long-term debt at December 31, 2019, for each of the years (or other periods) set forth below were as follows (amounts in thousands):
2020 | $ | ||
2021 | |||
2022 | |||
2023 | |||
2024 | |||
Thereafter | |||
$ | |||
6.50% senior secured notes due 2023
The Company’s 6.50 % senior secured notes (senior secured notes due 2023) were issued on November 20, 2017, and are due November 2023. Including the impact of debt issuance costs, these notes had an effective yield of 6.79 % at issuance. These notes are secured by the land and buildings of the following subsidiaries of the Company: Titan Tire Corporation, Titan Tire Corporation of Bryan, Titan Tire Corporation of Freeport, and Titan Wheel Corporation of Illinois.
Titan Europe credit facilities
The Titan Europe credit facilities included borrowings from various institutions totaling $43.6 million in aggregate principal amount at December 31, 2019. Maturity dates on this debt range from less than one year to three years. The Titan Europe facilities are primarily secured by the assets of Titan's subsidiaries in Italy, Spain, Germany, and Brazil.
Revolving credit facility
The Company has a $125 million revolving credit facility (credit facility) with agent BMO Harris Bank N.A. and other financial institutions party thereto. The credit facility is collateralized by accounts receivable and inventory of certain of the Company’s domestic subsidiaries and is scheduled to mature in February 2022. From time to time Titan's availability under this credit facility may be less than $125 million as a result of outstanding letters of credit and eligible accounts receivable and inventory balances at certain of its domestic subsidiaries. At December 31, 2019, under the credit facility there were $36.0 million in borrowings, an $11.5 million letter of credit and the amount available under the facility totaled $30.8 million based on eligible accounts receivable and inventory balances.
Other Debt
F- 17
TITAN INTERNATIONAL, INC.
NOTES TO CONSOLIDATED FINANCIAL STATEMENTS
11. OTHER LONG-TERM LIABILITIES
Other long-term liabilities at December 31, 2019 and 2018, consisted of the following (amounts in thousands):
2019 | 2018 | ||||||
Accrued pension liabilities | $ | $ | |||||
Operating lease liability | |||||||
Italian government grant | |||||||
Contingencies | |||||||
Income tax liabilities | |||||||
Other | |||||||
$ | $ | ||||||
12. DERIVATIVE FINANCIAL INSTRUMENTS
The Company uses financial derivatives to mitigate its exposure to volatility in foreign currency exchange rates. These derivative financial instruments are recognized at fair value. The Company has not designated these financial instruments as hedging instruments. Any gain or loss on the re-measurement of the fair value is recorded as an offset to currency exchange gain/loss. For the year ended December 31, 2019, the Company recorded currency exchange loss of $0.9 million related to these derivatives. For the year ended December 31, 2018, the Company recorded currency exchange gain of $0.5 million related to these derivatives.
13. REDEEMABLE NONCONTROLLING INTEREST
The Company, in partnership with One Equity Partners (OEP) and the Russian Direct Investment Fund (RDIF), owned all of the equity interests in Voltyre-Prom, a leading producer of agricultural and industrial tires in Volgograd, Russia. The Company is party to a shareholders' agreement with OEP and RDIF (Shareholders' Agreement) which was entered into in connection with the acquisition of Voltyre-Prom. The agreement contains a settlement put option which was exercisable during a six-month period beginning July 9, 2018. The settlement put option required Titan to purchase the equity interests from OEP and RDIF in Voltyre-Prom with cash or Titan common stock, at a value set by the agreement. The value set by the agreement was the greater of: the aggregate of the investment of the selling party and an amount representing an internal rate of return of 8%, or the last twelve months of EBITDA multiplied by 5.5 less net debt times the selling party's ownership percentage.
On November 14, 2018, the Company received notification of exercise of the put option from RDIF. On February 11, 2019, the Company entered into a definitive agreement (the "Agreement") with an affiliate of RDIF relating to the put option that was exercised by RDIF. The transactions contemplated by the Agreement closed on February 22, 2019. Under the terms of the Agreement, in full satisfaction of the settlement put option that was exercised by RDIF, Titan paid to RDIF $25 million in cash at the closing of the transaction, and agreed, subject to the completion of regulatory approval, to issue to RDIF in a private placement 4,032,259 restricted shares of Titan common stock. Due to pending regulatory approval, the issuance of the restricted shares of Titan common stock pursuant to the Agreement was not completed as of December 31, 2019. Immediately following the closing, RDIF continued to own the same interest in Voltyre-Prom, subject to the terms of the Agreement and the Shareholders’ Agreement. Titan has retained the right to buy back the Titan shares from RDIF for $25 million until February 12, 2022, the three-year anniversary of the signing of the Agreement, and, if the stock buyback is consummated within the first year of the closing under the Agreement at the time of such buyback, RDIF would be required to convey to Titan, based on current ownership, a 10.71% interest in Voltyre-Prom, resulting in RDIF reducing its interest in Voltyre-Prom from 35.7% to 25%.
On January 8, 2019, the Company received notification of exercise of the put option from OEP. During the second quarter of 2019, the Company made a payment to OEP in the amount of $16.0 million representing the majority of the interest on the amount due to OEP with respect to the put option. On July 30, 2019, Titan Luxembourg S.à r.l. (the “Titan Purchaser”), a subsidiary of the Company, entered into a sale purchase agreement (the “OEP Agreement”) with subsidiaries of OEP, relating to the settlement put option under the Shareholders’ Agreement that was exercised by OEP. Pursuant to the terms of the OEP Agreement, on July 31, 2019, the Titan Purchaser paid to OEP $30.7 million in cash, which, together with the Titan Purchaser’s
F- 18
TITAN INTERNATIONAL, INC.
NOTES TO CONSOLIDATED FINANCIAL STATEMENTS
prior payment to OEP of $16.0 million during the second quarter of 2019, were made in full satisfaction of the settlement put option exercised by OEP under the Shareholders’ Agreement. Immediately following the closing, OEP ceased to have any ownership interests in, and the Titan Purchaser and RDIF owned 64.3 % and 35.7 %, respectively, of, Voltyre-Prom.
As of December 31, 2019, the value of the redeemable noncontrolling interest held by RDIF was recorded at $25 million, the value of the shares of restricted stock to be issued pursuant to the terms of the Agreement.
The following is a reconciliation of redeemable noncontrolling interest as of December 31, 2019 and 2018 (amounts in thousands):
Balance at January 1, 2018 | $ | ||
Loss attributable to redeemable noncontrolling interest | ( | ) | |
Currency translation | ( | ) | |
Redemption value adjustment | |||
Balance at December 31, 2018 | $ | ||
Reclassification as a result of Agreement regarding put option | ( | ) | |
Payment of redeemable noncontrolling interest | ( | ) | |
Loss attributable to redeemable noncontrolling interest | ( | ) | |
Currency translation | |||
Redemption value adjustment | |||
Balance at December 31, 2019 | $ | ||
This obligation represents the value of the restricted shares of Titan common stock due to RDIF on December 31, 2019, and is presented in the Condensed Consolidated Balance Sheet in redeemable noncontrolling interest, which is treated as mezzanine equity.
14. ACCUMULATED OTHER COMPREHENSIVE LOSS
Accumulated other comprehensive loss consisted of the following at the dates set forth below (amounts in thousands):
Currency Translation Adjustments | Unrecognized Losses and Prior Service Cost | Total | |||||||||
Balance at January 1, 2018 | $ | ( | ) | $ | ( | ) | $ | ( | ) | ||
Currency translation adjustments | ( | ) | — | ( | ) | ||||||
Defined benefit pension plan entries: | |||||||||||
Amortization of unrecognized losses and prior service cost, net of tax of $(104) | — | ( | ) | ( | ) | ||||||
Reclassification as a result of ownership change | ( | ) | — | ( | ) | ||||||
Balance at December 31, 2018 | ( | ) | ( | ) | ( | ) | |||||
Currency translation adjustments | ( | ) | — | ( | ) | ||||||
Defined benefit pension plan entries: | |||||||||||
Amortization of unrecognized losses and prior service cost, net of tax of $133 | — | ||||||||||
Reclassification as result of ownership change | ( | ) | — | ( | ) | ||||||
Reclassification from AOCI to retained earnings - adoption of ASU 2018-02 | ( | ) | ( | ) | |||||||
Balance at December 31, 2019 | $ | ( | ) | $ | ( | ) | $ | ( | ) | ||
F- 19
TITAN INTERNATIONAL, INC.
NOTES TO CONSOLIDATED FINANCIAL STATEMENTS
15. STOCKHOLDERS’ EQUITY
The Company did not repurchase any shares of Titan common stock in 2019, 2018, or 2017. The Company records treasury stock using the cost method. Titan paid aggregate cash dividends of $.02 per share of common stock in each of 2019, 2018, and 2017. Dividends declared totaled $1.2 million for each of 2019, 2018 and 2017.
16. FAIR VALUE MEASUREMENTS
Accounting standards for fair value measurements establish a three-tier fair value hierarchy, which prioritizes the inputs used in measuring fair value. These tiers are defined as follows:
Level 1 – Quoted prices in active markets for identical instruments.
Level 2 – Inputs other than quoted prices in active markets that are either directly or indirectly observable.
Level 3 – Unobservable inputs for which little or no market data exists, therefore requiring an entity to develop its own assumptions.
Assets and liabilities measured at fair value on a recurring basis consisted of the following at the dates set forth below (amounts in thousands):
December 31, 2019 | December 31, 2018 | ||||||||||||||||||||||||||||||
Total | Level 1 | Level 2 | Level 3 | Total | Level 1 | Level 2 | Level 3 | ||||||||||||||||||||||||
Derivative financial instruments asset | $ | $ | $ | $ | $ | $ | $ | $ | |||||||||||||||||||||||
17. VARIABLE INTEREST ENTITIES
The Company holds a variable interest in two joint ventures for which the Company is the primary beneficiary. Both of the joint ventures operate distribution facilities that primarily distribute mining products. Titan is the 50 % owner of one of these distribution facilities, which is located in Canada, and the 40 % owner of the other such facility, which is located in Australia. The Company’s variable interests in these two joint ventures relate to sales of Titan product to these entities, consigned inventory, and working capital loans. Titan also is party to a joint venture that is the consortium that owns Voltyre-Prom, of which Titan originally was a 43 % owner. On July 31, 2019, Titan purchased additional shares resulting in Titan having a 64.3 % ownership in the consortium and the joint venture became a majority owned entity and is no longer a variable interest entity. See Note 13 for additional information.
The Company also held a variable interest in five other entities for which Titan was the primary beneficiary. Each of these entities provided specific manufacturing related services at the Company's Tennessee facility. Titan's variable interest in these entities relates to financial support to the entities through providing many of the assets used by these entities in their business. The Company owns no equity in these entities. In December 2019, the Company delivered a notice of termination of the supply agreement with three of these entities and the Company no longer holds a variable interest in them. The Company still holds a variable interest in the remaining two entities.
As the primary beneficiary of these variable interest entities (VIEs), the VIEs’ assets, liabilities, and results of operations are included in the Company’s consolidated financial statements as of, and for the year ended, December 31, 2019. The other equity holders’ interests are reflected in “Net loss attributable to noncontrolling interests” in the Consolidated Statements of Operations and “Noncontrolling interests” in the Consolidated Balance Sheets.
F- 20
TITAN INTERNATIONAL, INC.
NOTES TO CONSOLIDATED FINANCIAL STATEMENTS
The following table summarizes the carrying amount of the VIEs’ assets and liabilities included in the Company’s Consolidated Balance Sheets at December 31, 2019 and 2018 (amounts in thousands):
2019 | 2018 | ||||||
Cash and cash equivalents | $ | $ | |||||
Inventory | |||||||
Other current assets | |||||||
Property, plant, and equipment, net | |||||||
Other noncurrent assets | |||||||
Total assets | $ | $ | |||||
Current liabilities | |||||||
Noncurrent liabilities | |||||||
Total liabilities | $ | $ | |||||
All assets in the above table can only be used to settle obligations of the consolidated VIE to which the respective assets relate. Liabilities are nonrecourse obligations. Amounts presented in the table above are adjusted for intercompany eliminations.
The Company holds a variable interest in certain VIEs which are not consolidated because Titan is not the primary beneficiary. The Company's involvement with these entities is in the form of direct equity interests and prepayments and purchases of materials. The maximum exposure to loss represents the loss of assets recognized by Titan relating to non-consolidated entities and amounts due to the non-consolidated assets. The assets and liabilities recognized in Titan's Consolidated Balance Sheets related to Titan's interest in these non-consolidated VIEs and the Company's maximum exposure to loss relating to non-consolidated VIEs were as follows at December 31, 2019 and 2018 (amounts in thousands):
2019 | 2018 | ||||||
Investments | $ | $ | |||||
Other current assets | |||||||
Total VIE assets | |||||||
Accounts payable | |||||||
Maximum exposure to loss | $ | $ | |||||
18. ASSET IMPAIRMENT
On September 21, 2017, a fire occurred at a facility of Titan Tire Reclamation Corporation (TTRC), a subsidiary of the Company, located in Fort McMurray, AB. The TTRC facility contains six thermal vacuum recovery (TVR) units, which are large, contained capsules used to recycle large mining tires. The fire started within one of the TVR units and was contained to a building housing three of the TVR units. As a result of the damage caused by the fire, Titan recorded an asset impairment of $9.9 million. Titan carries both casualty and property insurance for its facilities and equipment, as well as business interruption insurance. The asset impairment amount was partially offset by an initial insurance advance received in the amount of $1.6 million. No additional insurance proceeds were accrued as of December 31, 2019 or December 31, 2018.
F- 21
TITAN INTERNATIONAL, INC.
NOTES TO CONSOLIDATED FINANCIAL STATEMENTS
19. ROYALTY EXPENSE
The Company has trademark license agreements with The Goodyear Tire & Rubber Company to manufacture and sell certain farm tires under the Goodyear name. These agreements cover sales in North America, Latin America, Europe, the Middle East, Africa, Russia, and other Commonwealth of Independent States countries. Each of these agreements is scheduled to expire in 2025. Royalty expenses recorded for the years ended December 31, 2019, 2018, and 2017, were $9.9 million, $10.1 million, and $10.5 million, respectively.
20. OTHER INCOME (EXPENSE)
Other income (expense) consisted of the following for the years set forth below (amounts in thousands):
2019 | 2018 | 2017 | |||||||||
Gain on Wheels India Limited share sale | $ | $ | $ | ||||||||
Equity investment income | |||||||||||
Building rental income | |||||||||||
Interest income | |||||||||||
Investment gain related to investments for deferred compensation | |||||||||||
Other income (expense) | ( | ) | ( | ) | |||||||
$ | $ | $ | |||||||||
21. INCOME TAXES
Income (loss) before income taxes, consisted of the following for the years set forth below (amounts in thousands):
2019 | 2018 | 2017 | |||||||||
Domestic | $ | ( | ) | $ | ( | ) | $ | ( | ) | ||
Foreign | |||||||||||
$ | ( | ) | $ | $ | ( | ) | |||||
The income tax provision was as follows for the years set forth below (amounts in thousands):
2019 | 2018 | 2017 | |||||||||
Current | |||||||||||
Federal | $ | ( | ) | $ | ( | ) | $ | ||||
State | ( | ) | ( | ) | |||||||
Foreign | |||||||||||
Deferred | |||||||||||
Federal | |||||||||||
State | |||||||||||
Foreign | ( | ) | ( | ) | |||||||
( | ) | ( | ) | ||||||||
Income tax provision | $ | $ | $ | ||||||||
F- 22
TITAN INTERNATIONAL, INC.
NOTES TO CONSOLIDATED FINANCIAL STATEMENTS
The income tax provision differs from the amount of income tax determined by applying the statutory U.S. federal income tax rate to pre-tax income (loss) as a result of the following:
2019 | 2018 | 2017 | ||||||
Statutory U.S. federal tax rate | % | % | % | |||||
Unrecognized tax positions | ( | ) | ( | ) | ||||
Impact of foreign income | ( | ) | ( | ) | ( | ) | ||
Valuation allowance | ( | ) | ( | ) | ||||
State taxes, net | ( | ) | ||||||
Nondeductible royalty | ( | ) | ( | ) | ||||
Tax Cuts and Jobs Act | ( | ) | ||||||
Other, net | ( | ) | ||||||
Effective tax rate | ( | )% | % | ( | )% | |||
The effective tax rate for the year ended December 31, 2019, was (7.2 )% as compared to 34.1 % for the year ended December 31, 2018. For 2019 and 2017, the Company recorded a pre-tax loss and had a negative effective tax rate which represents tax expense in the consolidated financial statements.
In jurisdictions where the Company operates its businesses, management analyzes the ability to utilize its deferred tax assets arising from losses in its cyclical business. The Company continues to record a valuation allowance in several jurisdictions, including the U.S., various U.S. states, Italy, Australia, and Luxembourg as these amounts remain more likely than not that the deferred tax assets would not be utilized. The Company recorded a valuation allowance of $13.9 million and $(0.1 ) million on the net deferred tax asset in 2019 and 2018, respectively. This amount is primarily related to net operating losses generated from operations in these certain countries.
The Company is involved in various tax matters, for some of which the outcome is uncertain. The IRS issued a final audit report during 2017 for the tax years 2010 through 2014. The Company recorded a net expense of $0.5 million to reflect the final audit results. The Company believes that it has adequate tax reserves to address open tax matters acknowledging that the outcome and timing of these events are uncertain.
F- 23
TITAN INTERNATIONAL, INC.
NOTES TO CONSOLIDATED FINANCIAL STATEMENTS
Deferred income taxes reflect the net tax effects of temporary differences between the carrying amounts of assets and liabilities for financial reporting purposes and the amounts used for income tax purposes. Significant components of the Company’s deferred tax assets and liabilities at December 31, 2019 and 2018, were as follows (amounts in thousands):
2019 | 2018 | ||||||
Deferred tax assets: | |||||||
Net operating loss carryforwards | $ | $ | |||||
Pension | |||||||
Inventory | |||||||
Warranty | |||||||
Employee benefits and related costs | |||||||
Prepaid royalties | |||||||
Interest limitation | |||||||
Lease liability | |||||||
Other | |||||||
Deferred tax assets | |||||||
Deferred tax liabilities: | |||||||
Fixed assets | ( | ) | ( | ) | |||
Intangible assets | ( | ) | ( | ) | |||
Lease assets | ( | ) | |||||
Other | ( | ) | ( | ) | |||
Deferred tax liabilities | ( | ) | ( | ) | |||
Subtotal | |||||||
Valuation allowance | ( | ) | ( | ) | |||
Net deferred tax liability | $ | ( | ) | $ | ( | ) | |
As of December 31, 2019 and 2018, certain tax loss carryforwards of $129.6 million and $121.8 million were available with $3.4 million expiring between 2019 and 2024 and $126.2 million expiring after 2024. At December 31, 2019, a valuation allowance of $164.7 million has been established. The net change in the valuation allowance was $13.1 million and $3.3 million for 2019 and 2018, respectively. The majority of the valuation allowance is related to deferred tax assets in the U.S., Italy, Australia, and Luxembourg.
The Company has $177.8 million of Federal net operating loss carryforward, a portion of which expires starting in 2034. Additionally, the Company has $261.6 million of state net operating losses and $309.2 million of foreign loss carryforwards.
The Tax Cuts and Jobs Act was enacted on December 22, 2017. The Tax Cuts and Jobs Act includes a number of changes in existing tax law impacting businesses, including a one-time deemed repatriation of cumulative undistributed foreign earnings and a permanent reduction in the U.S. federal statutory rate from 35 % to 21 %, effective on January 1, 2018. Under U.S. GAAP, changes in tax rates and tax law are accounted for in the period of enactment and deferred tax assets and liabilities are re-measured at the enacted tax rate. The re-measured U.S. net deferred asset was fully offset by a change in the valuation allowance. The Company’s net cumulative undistributed foreign earnings were a cumulative loss and therefore no additional income tax expense related to the one-time deemed repatriation toll charge was recorded in 2017.
As a result of the Tax Cuts and Jobs Act, the Company can repatriate future foreign earnings back to the U.S. when needed with minimal additional taxes other than state income and foreign withholding tax. The Company has not changed its indefinite reinvestment assertion in light of the Tax Cuts and Jobs Act and has not accrued any potential incremental taxes which could be incurred if any foreign earnings are repatriated. The Company has not calculated the potential foreign withholding taxes as the Company does not expect to repatriate those earnings.
F- 24
TITAN INTERNATIONAL, INC.
NOTES TO CONSOLIDATED FINANCIAL STATEMENTS
The Company or one of its subsidiaries files income tax returns in the U.S., Federal and State, and various foreign jurisdictions. The Company’s major locations are in the U.S., Italy, Australia, Russia, and Brazil. The IRS issued a final audit report in 2017 for the 2010-2014 U.S. Federal tax returns and the Company adjusted its uncertain tax reserves. Italy has open tax years from 2014-2019. Russia has open tax years from 2016-2019. Australia has open tax years from 2015-2019 and Brazil has open tax years from 2013-2019.
The Company has applied the provisions of ASC 740, “Income Taxes” related to unrecognized tax benefits. At December 31, 2019, 2018, and 2017, the unrecognized tax benefits were $4.5 million, $8.9 million, and $11.4 million, respectively. As of December 31, 2019, $4.5 million of unrecognized tax benefits would have affected income tax expense if the tax benefits were recognized. The majority of the accrual in unrecognized tax benefits relates to potential state tax exposures. Although management cannot predict with any degree of certainty the timing of ultimate resolution of matters under review by various taxing jurisdictions, it is possible that the Company’s gross unrecognized tax benefits balance will decrease by approximately $3 million within the next twelve months.
A reconciliation of the total amounts of unrecognized tax benefits at December 31 were as follows (amounts in thousands):
2019 | 2018 | 2017 | |||||||||
Balance at January 1 | $ | $ | $ | ||||||||
Increases to tax positions taken during the current year | |||||||||||
Increases to tax positions taken during the prior years | |||||||||||
Decreases to tax positions taken during prior years | ( | ) | ( | ) | ( | ) | |||||
Decreases due to lapse of statutes of limitations | ( | ) | ( | ) | ( | ) | |||||
Settlements | ( | ) | ( | ) | |||||||
Foreign exchange | ( | ) | ( | ) | |||||||
Balance at December 31 | $ | $ | $ | ||||||||
The Company accrues interest and penalties related to unrecognized tax benefits in income tax expense. The amount of interest and penalties related to unrecognized tax benefits recorded in income tax expense was $(1.0 ) million, $(0.5 ) million, and $0.5 million at December 31, 2019, 2018 and 2017. The reconciliation of unrecognized tax benefits above does not include accrued interest and penalties of $1.4 million, $2.4 million, and $2.9 million, at December 31, 2019, 2018, and 2017, respectively.
22. EMPLOYEE BENEFIT PLANS
Pension plans
The Company has three frozen defined benefit pension plans covering certain employees or former employees of three U.S. subsidiaries. The Company also has pension plans covering certain employees of several foreign subsidiaries. The Company’s policy is to fund pension costs as required by law, which is consistent with the funding requirements of federal laws and regulations. Certain foreign subsidiaries maintain unfunded pension plans consistent with local practices and requirements.
The Company’s recorded liability for pensions is based on a number of assumptions, including discount rates, rates of return on investments, mortality rates, and other factors. Certain of these assumptions are determined by the Company with the assistance of outside actuaries. Assumptions are based on past experience and anticipated future trends. These assumptions are reviewed on a regular basis and revised when appropriate.
F- 25
TITAN INTERNATIONAL, INC.
NOTES TO CONSOLIDATED FINANCIAL STATEMENTS
The following table provides the change in benefit obligation, change in plan assets, funded status, and amounts recognized in the Consolidated Balance Sheet of the defined benefit pension plans as of December 31, 2019 and 2018 (amounts in thousands):
Change in benefit obligation: | 2019 | 2018 | |||||
Benefit obligation at beginning of year | $ | $ | |||||
Plan amendments | ( | ) | |||||
Service cost | |||||||
Interest cost | |||||||
Actuarial (gain) loss | ( | ) | |||||
Benefits paid | ( | ) | ( | ) | |||
Foreign currency translation | ( | ) | |||||
Benefit obligation at end of year | $ | $ | |||||
Change in plan assets: | |||||||
Fair value of plan assets at beginning of year | $ | $ | |||||
Actual return on plan assets | ( | ) | |||||
Employer contributions | |||||||
Benefits paid | ( | ) | ( | ) | |||
Foreign currency translation | ( | ) | |||||
Fair value of plan assets at end of year | $ | $ | |||||
Unfunded status at end of year | $ | ( | ) | $ | ( | ) | |
Amounts recognized in Consolidated Balance Sheet: | |||||||
Noncurrent assets | $ | $ | |||||
Current liabilities | ( | ) | ( | ) | |||
Noncurrent liabilities | ( | ) | ( | ) | |||
Net amount recognized in the Consolidated Balance Sheet | $ | ( | ) | $ | ( | ) | |
The pension benefit obligation included $93.2 million of pension benefit obligation for the three frozen plans in the U.S. and $20.4 million of pension benefit obligation for plans at foreign subsidiaries. The fair value of plan assets included $79.8 million of plan assets for the three frozen plans in the U.S. and $1.6 million of plan assets for foreign plans.
Amounts recognized in accumulated other comprehensive loss: | |||||||
2019 | 2018 | ||||||
Unrecognized prior service cost | $ | $ | ( | ) | |||
Unrecognized net loss | ( | ) | ( | ) | |||
Deferred tax effect of unrecognized items | |||||||
Net amount recognized in accumulated other comprehensive loss | $ | ( | ) | $ | ( | ) | |
The weighted-average assumptions used in the actuarial computation that derived the benefit obligations at December 31 were as follows: | 2019 | 2018 | |||
Discount rate | % | % | |||
Expected long-term return on plan assets | % | % | |||
F- 26
TITAN INTERNATIONAL, INC.
NOTES TO CONSOLIDATED FINANCIAL STATEMENTS
The following table provides the components of net periodic pension cost for the plans, settlement cost, and the assumptions used in the measurement of the Company’s benefit obligation for the years ended December 31, 2019, 2018, and 2017 (amounts in thousands):
Components of net periodic benefit cost and other amounts recognized in other comprehensive income (loss) | |||||||||||
Net periodic benefit cost: | 2019 | 2018 | 2017 | ||||||||
Service cost | $ | $ | $ | ||||||||
Interest cost | |||||||||||
Assumed return on assets | ( | ) | ( | ) | ( | ) | |||||
Amortization of unrecognized prior service cost | |||||||||||
Amortization of net unrecognized loss | |||||||||||
Net periodic pension cost | $ | $ | $ | ||||||||
Service cost is recorded as cost of sales in the Consolidated Statement of Operations while all other components are recorded in other income. The estimated net loss and prior service cost that will be amortized from accumulated other comprehensive income (loss) into net periodic benefit cost over the next fiscal year are $2.9 million and $(0.1 ) million, respectively.
The weighted-average assumptions used in the actuarial computation that derived net periodic pension cost for the years ended December 31, 2019, 2018, and 2017 were as follows:
2019 | 2018 | 2017 | ||||||
Discount rate | % | % | % | |||||
Expected long-term return on plan assets | % | % | % | |||||
The allocation of the fair value of plan assets was as follows:
Percentage of Plan Assets at December 31, | Target Allocation | ||||||
Asset Category | 2019 | 2018 | 2019 | ||||
U.S. equities (a) | % | % | 40% - 80% | ||||
Fixed income | % | % | 20% - 50% | ||||
Cash and cash equivalents | % | % | 0% - 20% | ||||
International equities (a) | % | % | 0% - 16% | ||||
REITs | % | % | |||||
% | % | ||||||
(a) | Total equities may not exceed |
The majority of the Company's foreign plans do not have plan assets. The foreign plans which have plan assets holds these plan assets in an insurance or money market fund.
F- 27
TITAN INTERNATIONAL, INC.
NOTES TO CONSOLIDATED FINANCIAL STATEMENTS
The fair value of the plan assets by asset categories consisted of the following as of the dates set forth below (amounts in thousands):
Fair Value Measurements as of December 31, 2019 | |||||||||||||||
Total | Level 1 | Level 2 | Level 3 | ||||||||||||
Money market funds | $ | $ | $ | $ | |||||||||||
Common stock | |||||||||||||||
Bonds and securities | |||||||||||||||
Mutual and insurance funds | |||||||||||||||
Totals | $ | $ | $ | $ | |||||||||||
Assets measured at net asset value (a) | |||||||||||||||
$ | |||||||||||||||
Fair Value Measurements as of December 31, 2018 | |||||||||||||||
Total | Level 1 | Level 2 | Level 3 | ||||||||||||
Money market funds | $ | $ | $ | $ | |||||||||||
Common stock | |||||||||||||||
Bonds and securities | |||||||||||||||
Mutual and insurance funds | |||||||||||||||
Totals | $ | $ | $ | $ | |||||||||||
Assets measured at net asset value (a) | |||||||||||||||
$ | |||||||||||||||
(a) | Assets measured at net asset value consist of common / collective trusts. |
The Company invests in a diversified portfolio consisting of an array of asset classes in an attempt to maximize returns while minimizing risk. These asset classes include U.S. equities, fixed income, cash and cash equivalents, international equities and REITs. The investment objectives are to provide for the growth and preservation of plan assets on a long-term basis through investments in: investment grade securities that provide investment returns that meet or exceed the Standard & Poor’s 500 Index and investment grade fixed income securities that provide investment returns that meet or exceed the Barclays Capital Aggregate Bond Index. The U.S. equities asset category included the Company’s common stock in the amount of $0.6 million (approximately one percent of total plan assets) at December 31, 2019, and $0.8 million (approximately one percent of total plan assets) at December 31, 2018.
The fair value of money market funds, stock, bonds, U.S. government securities and mutual funds is determined based on valuation for identical instruments in active markets.
The long-term rate of return for plan assets is determined using a weighted-average of long-term historical approximate returns on cash and cash equivalents, fixed income securities, and equity securities considering the anticipated investment allocation within the plans. The expected return on plan assets is anticipated to be 6.9 % over the long-term. This rate assumes long-term historical returns of approximately 8.5 % for equities and approximately 4.0 % for fixed income securities using the plans’ target allocation percentages. Professional investment firms, none of which are Titan employees, manage the plan assets.
Although the 2020 minimum pension funding calculations are not finalized, the Company estimates those funding requirements will be approximately $4.8 million.
F- 28
TITAN INTERNATIONAL, INC.
NOTES TO CONSOLIDATED FINANCIAL STATEMENTS
Projected benefit payments from the plans as of December 31, 2019, are estimated as follows (amounts in thousands):
2020 | $ | ||
2021 | |||
2022 | |||
2023 | |||
2024 | |||
2025-2029 | |||
401(k)/Defined contribution plans
The Company sponsors two 401(k) retirement savings plans in the U.S. and a number of defined contribution plans at foreign subsidiaries. One U.S. plan is for the benefit of substantially all employees who are not covered by a collective bargaining arrangement. Titan provides a 50 % matching contribution in the form of the Company’s common stock on the first 6 % of the employee’s contribution in this plan. The Company issued 266,121 shares, 54,517 shares and 49,242 shares of treasury stock in connection with this 401(k) plan during 2019, 2018, and 2017, respectively. Expenses to the Company related to this common stock matching contribution were $1.2 million, $0.6 million, and $0.5 million for 2019, 2018, and 2017, respectively. The other U.S. 401(k) plan is for employees covered by collective bargaining agreements and does not include a Company matching contribution. Expenses related to foreign defined contribution plans were $3.9 million, $4.1 million, and $3.8 million for 2019, 2018, and 2017, respectively.
23. STOCK COMPENSATION
The Company recorded stock compensation of $1.5 million, $1.1 million, and $1.5 million in 2019, 2018, and 2017, respectively. Options to the Board of Directors vest immediately. All options outstanding at December 31, 2019 are scheduled to expire 10 years from the grant date. The restricted stock awards vest over a period of three years.
2005 Equity Incentive Plan
The Company adopted the 2005 Equity Incentive Plan to provide stock compensation as a means of attracting and retaining qualified independent directors and employees for the Company. A total of 1.3 million shares are available for future issuance under the equity incentive plan at December 31, 2019. The exercise price of stock options may not be less than the fair market value of the common stock on the date of the grant. The vesting and term of each option is set by the Board of Directors. The Company granted no stock options under this plan in 2019, 80,000 stock options under this plan in 2018, and 89,200 stock options under this plan in 2017. The Company granted 355,201 restricted stock awards under this plan in 2019 and 376,500 restricted stock awards under this plan in 2018. The Company did not grant any restricted stock awards under this plan in 2017.
Stock Options
The following is a summary of activity in stock options during the year ended December 31, 2019:
Shares Subject to Option | Weighted- Average Exercise Price | Weighted- Average Remaining Contractual Life (in Years) | Aggregate Intrinsic Value (in thousands) | |||||||||
Outstanding, December 31, 2018 | $ | |||||||||||
Granted | ||||||||||||
Exercised | ||||||||||||
Forfeited/Expired | ( | ) | ( | ) | ||||||||
Outstanding, December 31, 2019 | $ | |||||||||||
Exercisable, December 31, 2019 | $ | |||||||||||
F- 29
TITAN INTERNATIONAL, INC.
NOTES TO CONSOLIDATED FINANCIAL STATEMENTS
Additional Stock Option Information (all amounts in thousands, except for per share data):
2019 | 2018 | 2017 | |||||||||
Weighted-average fair value per share of stock options granted | $ | $ | $ | ||||||||
Grant date fair value of stock options vested | |||||||||||
No options were exercised in 2019, 2018 and 2017. The Company currently uses treasury shares to satisfy any stock option exercises. At December 31, 2019 and 2018, the Company had 0.4 million and 0.8 million shares of treasury stock, respectively.
Valuation Assumptions
The Company uses the Black-Scholes option pricing model to determine the fair value of its stock options. The determination of the fair value of stock option awards on the date of grant using option pricing models is affected by the Company’s stock price, as well as assumptions regarding a number of complex and subjective variables. These variables include the Company’s expected stock price volatility over the expected term of the awards, actual and projected stock option exercise behaviors, risk-free interest rates, and expected dividends. The expected term of options represents the period of time over which options are expected to be outstanding and is estimated based on historical experience. Expected volatility is based on the historical volatility of the Company’s common stock calculated over the expected term of the option. The risk-free interest rate is based on U.S. Treasury yields in effect at the date of grant.
Weighted average assumptions used for stock options issued in 2019, 2018, and 2017:
2019 | 2018 | 2017 | ||||||
Expected life (in years) | 0 | |||||||
Expected volatility | % | % | % | |||||
Expected dividends | % | % | % | |||||
Risk-free interest rate | % | % | % | |||||
Restricted Stock
Shares | Weighted Average Grant Date Fair Value | |||
Unvested at December 31, 2018 | ||||
Granted | ||||
Vested | ( | ) | ||
Forfeited/Expired | ( | ) | ||
Unvested at December 31, 2019 | ||||
Pre-tax unrecognized compensation expense for unvested restricted stock was $2.4 million at December 31, 2019, and will be recognized as an expense over a weighted-average period of 1.3 years.
The fair value of restricted stock vested, based on the stock's fair value on the vesting date, was $0.6 million, $0.3 million, and $1.5 million for the years ended December 31, 2019, 2018, and 2017, respectively.
F- 30
TITAN INTERNATIONAL, INC.
NOTES TO CONSOLIDATED FINANCIAL STATEMENTS
24. LITIGATION
The Company is a party to routine legal proceedings arising out of the normal course of business. Due to the difficult nature of predicting unresolved and future legal claims, the Company cannot anticipate or predict the material adverse effect on its consolidated financial condition, results of operations, or cash flows as a result of efforts to comply with, or liabilities pertaining to, legal judgments.
At December 31, 2019, two of Titan’s subsidiaries were involved in litigation concerning environmental laws and regulations.
In June 2015, Titan Tire Corporation (Titan Tire) and Dico, Inc. (Dico) appealed a U.S. District Court order granting the U.S. motion for summary judgment that found Dico liable for violating the Comprehensive Environmental Response, Compensation, and Liability Act of 1980 (CERCLA) and an Environmental Protection Agency (EPA) Administrative Order and awarded response costs, civil penalties, and punitive damages.
In December 2015, the United States Court of Appeals for the Eighth Circuit reversed the District Court’s summary judgment order with respect to “arranger” liability for Titan Tire and Dico under CERCLA and the imposition of punitive damages against Dico for violating the EPA Administrative Order, but affirmed the summary judgment order imposing civil penalties in the amount of $1.62 million against Dico for violating the EPA Administrative Order. The case was remanded to the District Court for a new trial on the remaining issues.
The trial occurred in April 2017. On September 5, 2017, the District Court issued an order: (a) concluding Titan Tire and Dico arranged for the disposal of a hazardous substance in violation of 42 U.S.C. § 9607(a); (b) holding Titan Tire and Dico jointly and severally liable for $5.45 million in response costs previously incurred and reported by the United States relating to the alleged violation, including enforcement costs and attorney’s fees; and (c) awarding a declaratory judgment holding Titan Tire and Dico jointly and severally liable for all additional response costs previously incurred but not yet reported or to be incurred in the future, including enforcement costs and attorney’s fees. The District Court also held Dico liable for $5.45 million in punitive damages under 42 U.S.C. § 9607(c)(3) for violating a unilateral administrative order. The punitive damages award does not apply to Titan Tire. The Company accrued a contingent liability of $6.5 million, representing $5.45 million in costs incurred by the United States and $1.05 million of additional response costs, for this order in the quarter ended September 30, 2017. As of December 31, 2019, the $6.5 million contingent liability remains outstanding.
Titan Tire and Dico appealed the case to the United States Court of Appeals for the Eighth Circuit. On April 11, 2019, the U.S. Court of Appeals for the Eighth Circuit affirmed the District Court’s September 5, 2017, order. Thereafter, Dico and Titan Tire filed a petition for rehearing with the U.S. Court of Appeals for the Eighth Circuit, which was denied in August 2019. As a result of the current judgment in favor of the United States, and pursuant to Iowa Code § 624.23, a judgment lien exists over Titan Tire’s real property in the State of Iowa. Titan Tire maintains a supersedeas bond in the amount of $6 million relating to the judgment. The United States has indicated that it does not currently intend to take steps to execute on this judgment lien in light of ongoing settlement discussions between the parties. However, there can be no assurance that the parties will settle this matter on terms acceptable to the parties.
F- 31
TITAN INTERNATIONAL, INC.
NOTES TO CONSOLIDATED FINANCIAL STATEMENTS
25. LEASES
The Company leases certain buildings and equipment under both operating and finance leases. Certain lease agreements provide for renewal options, fair value purchase options, and payment of property taxes, maintenance, and insurance by the Company. Under ASC 842, the Company made an accounting policy election, by class of underlying asset, not to separate non-lease components such as those previously stated from lease components and instead will treat the lease agreement as a single lease component for all asset classes. Operating right-of-use (ROU) assets represent the Company's right to use an underlying asset for the lease term and lease liabilities represent Titan's obligations to make lease payments arising from the lease. The majority of Titan's leases are operating leases. Operating lease ROU assets and liabilities are recognized at the lease commencement date based on the present value of lease payments over the lease term. As most of Titan's leases do not provide an implicit interest rate, the Company used its incremental borrowing rate (6.79%), based on the information available at the lease commencement date, in determining the present value of lease payments. Operating lease expense is recognized on a straight-line basis over the lease term and is included in cost of sales and selling, general and administrative expenses on the Consolidated Statement of Operations. Amortization expense associated with finance leases is included in cost of sales and selling, general and administrative expenses, and interest expense associated with finance leases is included in interest expense in the Consolidated Statement of Operations. Short-term operating leases, which have an initial term of twelve months or less, are not recorded on the balance sheet.
Supplemental balance sheet information related to leases was as follows (amounts in thousands):
Balance Sheet Classification | December 31, 2019 | ||||
Operating lease ROU assets | Operating lease assets | $ | |||
Operating lease current liabilities | Other current liabilities | $ | |||
Operating lease long-term liabilities | Other long-term liabilities | ||||
Total operating lease liabilities | $ | ||||
Finance lease, gross | Property, plant & equipment, net | $ | |||
Finance lease accumulated depreciation | Property, plant & equipment, net | ( | ) | ||
Finance lease, net | $ | ||||
Finance lease current liabilities | Other current liabilities | $ | |||
Finance lease long-term liabilities | Long-term debt | ||||
Total finance lease liabilities | $ | ||||
At December 31, 2019, maturity of lease liabilities were as follows (amounts in thousands):
Operating Leases | Finance Leases | ||||||
2020 | $ | $ | |||||
2021 | |||||||
2022 | |||||||
2023 | |||||||
2024 | |||||||
Thereafter | |||||||
Total future minimum lease payments | $ | $ | |||||
Less imputed interest | |||||||
$ | $ | ||||||
Weighted average remaining lease term (in years) | |||||||
Supplemental cash flow information related to leases for year ended December 31, 2019 were as follows: operating cash flows from operating leases were $9.6 million and operating cash flows from finance leases were $0.3 million.
F- 32
TITAN INTERNATIONAL, INC.
NOTES TO CONSOLIDATED FINANCIAL STATEMENTS
26. PURCHASE OBLIGATIONS
At December 31, 2019, the Company's expected cash outflow resulting from non-cancellable purchase obligations are summarized by year in the table below (amounts in thousands):
2020 | $ | ||
2021 | |||
2022 | |||
2023 | |||
Thereafter | |||
Total non-cancellable purchase obligations | $ | ||
27. RELATED PARTY TRANSACTIONS
The Company sells products and pays commissions to companies controlled by persons related to the Chairman of the Company, Mr. Maurice Taylor. The related party is Mr. Fred Taylor, who is Mr. Maurice Taylor’s brother. The companies which Mr. Fred Taylor is associated with that do business with Titan include the following: Blacksmith OTR, LLC; F.B.T. Enterprises; Green Carbon, Inc; Silverstone, Inc.; and OTR Wheel Engineering, Inc. During 2019, 2018, and 2017, sales of Titan product to these companies were approximately $1.1 million, $1.2 million, and $1.5 million, respectively. Titan had trade receivables due from these companies of approximately $0.1 million at December 31, 2019, and 2018. On other sales referred to Titan from these manufacturing representative companies, commissions were approximately $1.5 million, $1.7 million, and $1.9 million during 2019, 2018, and 2017, respectively. Titan had purchases from these companies of approximately $0.4 million, and $0.6 million during 2018, and 2017, respectively.
In July 2013, the Company entered into a Shareholders’ Agreement with OEP and RDIF to acquire Voltyre-Prom. Mr. Richard M. Cashin Jr., a director of the Company, is the President of OEP, which owned 21.4 % of the joint venture at June 30, 2019. The Shareholders’ Agreement contained a settlement put option which potentially required the Company to purchase equity interests in the joint venture from OEP and RDIF at a value set by the agreement. On January 8, 2019, the Company received notification of exercise of the put option from OEP. During the second quarter of 2019, the Company made a payment to OEP in the amount of $16 million representing the majority of the interest on the amount due to OEP. On July 30, 2019, the Titan Purchaser entered into the OEP Agreement with subsidiaries of OEP, relating to the settlement put option under the Shareholders’ Agreement that was exercised by OEP. Pursuant to the terms of the OEP Agreement, on July 31, 2019, the Titan Purchaser paid to OEP $30.7 million in cash, which, together with the Titan Purchaser’s prior payment to OEP of $16 million during the second quarter of 2019, were made in full satisfaction of the settlement put option exercised by OEP under the Shareholders’ Agreement. Immediately following the closing, OEP ceased to have any ownership interests in, and the Titan Purchaser and RDIF owned 64.3 % and 35.7 %, respectively, of, Voltyre-Prom. See Note 13 for additional information.
In July of 2018, a deferred compensation obligation with the Chairman of the Company, Mr. Maurice Taylor, was paid through the transfer of $14.3 million of assets held in a trust.
28. SEGMENT AND GEOGRAPHICAL INFORMATION
The Company has aggregated its operating units into reportable segments based on its three customer markets: agricultural, earthmoving/construction, and consumer. These segments are based on the information used by the chief executive officer to make certain operating decisions, allocate portions of capital expenditures and assess segment performance. The accounting policies of the segments are the same as those described in Note 1, “Description of Business and Significant Accounting Policies.” Segment external revenues, expenses, and income from operations are determined on the basis of the results of operations of operating units of manufacturing facilities. Segment assets are generally determined on the basis of the tangible assets located at such operating units’ manufacturing facilities and the intangible assets associated with the acquisitions of such operating units. However, certain operating units’ goodwill and property, plant, and equipment balances are carried at the corporate level.
F- 33
TITAN INTERNATIONAL, INC.
NOTES TO CONSOLIDATED FINANCIAL STATEMENTS
Titan is organized primarily on the basis of products being included in three marketing segments, with each reportable segment including wheels, tires, wheel/tire assemblies, and undercarriage systems and components.
The table below presents information about certain operating results of segments as reviewed by the chief operating decision maker of the Company as of and for the years ended December 31, 2019, 2018, and 2017 (amounts in thousands):
2019 | 2018 | 2017 | |||||||||
Revenues from external customers | |||||||||||
Agricultural | $ | $ | $ | ||||||||
Earthmoving/construction | |||||||||||
Consumer | |||||||||||
$ | $ | $ | |||||||||
Gross profit | |||||||||||
Agricultural | $ | $ | $ | ||||||||
Earthmoving/construction | |||||||||||
Consumer | |||||||||||
$ | $ | $ | |||||||||
Income (loss) from operations | |||||||||||
Agricultural | $ | $ | $ | ||||||||
Earthmoving/construction | ( | ) | |||||||||
Consumer | |||||||||||
Corporate & Unallocated | ( | ) | ( | ) | ( | ) | |||||
Loss from operations | ( | ) | ( | ) | |||||||
Interest expense | ( | ) | ( | ) | ( | ) | |||||
Loss on senior note repurchase | ( | ) | |||||||||
Foreign exchange gain (loss) | ( | ) | ( | ) | |||||||
Other income, net | |||||||||||
Income (loss) before income taxes | $ | ( | ) | $ | $ | ( | ) | ||||
Capital expenditures | |||||||||||
Agricultural | $ | $ | $ | ||||||||
Earthmoving/construction | |||||||||||
Consumer | |||||||||||
Corporate & Unallocated | ( | ) | |||||||||
$ | $ | $ | |||||||||
Depreciation & amortization | |||||||||||
Agricultural | $ | $ | $ | ||||||||
Earthmoving/construction | |||||||||||
Consumer | |||||||||||
Corporate & Unallocated | |||||||||||
$ | $ | $ | |||||||||
Total assets | |||||||||||
Agricultural | $ | $ | $ | ||||||||
Earthmoving/construction | |||||||||||
Consumer | |||||||||||
Corporate & Unallocated (a) | |||||||||||
$ | $ | $ | |||||||||
(a) Unallocated assets included cash of approximately $9 million, $32 million, and $72 million at year-end 2019, 2018, and 2017, respectively .
F- 34
TITAN INTERNATIONAL, INC.
NOTES TO CONSOLIDATED FINANCIAL STATEMENTS
The table below presents information by geographic area. Revenues from external customers were determined based on the location of the selling subsidiary. Geographic information as of and for the years ended December 31, 2019, 2018, and 2017 was as follows (amounts in thousands):
2019 | 2018 | 2017 | |||||||||
Net Sales | |||||||||||
United States | $ | $ | $ | ||||||||
Europe / CIS | |||||||||||
Latin America | |||||||||||
Other international | |||||||||||
$ | $ | $ | |||||||||
Long-Lived Assets | |||||||||||
United States | $ | $ | $ | ||||||||
Europe / CIS | |||||||||||
Latin America | |||||||||||
Other international | |||||||||||
$ | $ | $ | |||||||||
29. EARNINGS PER SHARE
Earnings per share for 2019, 2018, and 2017 were as follows (amounts in thousands, except per share data):
2019 | 2018 | 2017 | |||||||||
Net (loss) income attributable to Titan | $ | ( | ) | $ | $ | ( | ) | ||||
Redemption value adjustment | ( | ) | ( | ) | ( | ) | |||||
Net (loss) income applicable to common shareholders | $ | ( | ) | $ | $ | ( | ) | ||||
Determination of Shares: | |||||||||||
Weighted average shares outstanding (basic) | |||||||||||
Effect of stock options/trusts | |||||||||||
Weighted average shares outstanding (diluted) | |||||||||||
Earnings per share: | |||||||||||
Basic and Diluted | $ | ( | ) | $ | $ | ( | ) | ||||
The effect of stock options/trusts and convertible notes has been excluded for 2019 and 2017, as the effect would have been antidilutive. The weighted average share amount excluded for stock options/trusts was $0.0 million for 2019 and 2017, respectively. The weighted average share amount excluded for convertible notes was $0.0 million for 2017.
F- 35
TITAN INTERNATIONAL, INC.
NOTES TO CONSOLIDATED FINANCIAL STATEMENTS
30. SUPPLEMENTARY DATA – QUARTERLY FINANCIAL INFORMATION (UNAUDITED)
(All amounts in thousands, except per share data)
Quarter ended | March 31 | June 30 | September 30 | December 31 | Year ended December 31 | |||||||||||||||
2019 | ||||||||||||||||||||
Net sales | $ | $ | $ | $ | $ | |||||||||||||||
Gross profit | ||||||||||||||||||||
Net income (loss) | ( | ) | ( | ) | ( | ) | ( | ) | ||||||||||||
Net income (loss) attributable to Titan | ( | ) | ( | ) | ( | ) | ( | ) | ||||||||||||
Per share amounts: | ||||||||||||||||||||
Basic | ( | ) | ( | ) | ( | ) | ( | ) | ||||||||||||
Diluted | ( | ) | ( | ) | ( | ) | ( | ) | ||||||||||||
2018 | ||||||||||||||||||||
Net sales | $ | $ | $ | $ | $ | |||||||||||||||
Gross profit | ||||||||||||||||||||
Net loss | ( | ) | ||||||||||||||||||
Net loss attributable to Titan | ( | ) | ||||||||||||||||||
Per share amounts: | ||||||||||||||||||||
Basic | ( | ) | ( | ) | ||||||||||||||||
Diluted | ( | ) | ( | ) | ||||||||||||||||
31. SUBSEQUENT EVENTS
32. SUBSIDIARY GUARANTOR FINANCIAL INFORMATION
The Company's 6.50% senior secured notes due 2023 are guaranteed by the following 100% owned subsidiaries of the Company: Titan Tire Corporation, Titan Tire Corporation of Bryan, Titan Tire Corporation of Freeport, and Titan Wheel Corporation of Illinois. The note guarantees are full and unconditional, joint and several obligations of the guarantors. The guarantees of the guarantor subsidiaries are subject to release in limited circumstances only upon the occurrence of certain customary conditions. The following condensed consolidating financial statements are presented using the equity method of accounting. Certain sales & marketing expenses recorded by non-guarantor subsidiaries have not been allocated to the guarantor subsidiaries.
F- 36
TITAN INTERNATIONAL, INC.
NOTES TO CONSOLIDATED FINANCIAL STATEMENTS
(Amounts in thousands) | Consolidating Condensed Statements of Operations Year Ended December 31, 2019 | ||||||||||||||||||
Titan Intl., Inc. (Parent) | Guarantor Subsidiaries | Non-Guarantor Subsidiaries | Eliminations | Consolidated | |||||||||||||||
Net sales | $ | $ | $ | $ | ( | ) | $ | ||||||||||||
Cost of sales | ( | ) | |||||||||||||||||
Gross (loss) profit | ( | ) | |||||||||||||||||
Selling, general, and administrative expenses | |||||||||||||||||||
Research and development expenses | |||||||||||||||||||
Royalty expense | |||||||||||||||||||
(Loss) income from operations | ( | ) | ( | ) | ( | ) | ( | ) | |||||||||||
Interest expense | ( | ) | ( | ) | ( | ) | ( | ) | |||||||||||
Intercompany interest income (expense) | ( | ) | |||||||||||||||||
Foreign exchange loss | ( | ) | ( | ) | |||||||||||||||
Other income (expense) | ( | ) | |||||||||||||||||
Loss before income taxes | ( | ) | ( | ) | ( | ) | ( | ) | |||||||||||
(Benefit) provision for income taxes | ( | ) | |||||||||||||||||
Equity in (loss) earnings of subsidiaries | ( | ) | ( | ) | |||||||||||||||
Net (loss) income | ( | ) | ( | ) | ( | ) | ( | ) | |||||||||||
Net loss noncontrolling interests | ( | ) | ( | ) | |||||||||||||||
Net (loss) income attributable to Titan | $ | ( | ) | $ | ( | ) | $ | ( | ) | $ | $ | ( | ) | ||||||
(Amounts in thousands) | Consolidating Condensed Statements of Operations Year Ended December 31, 2018 | ||||||||||||||||||
Titan Intl., Inc. (Parent) | Guarantor Subsidiaries | Non-Guarantor Subsidiaries | Eliminations | Consolidated | |||||||||||||||
Net sales | $ | $ | $ | $ | ( | ) | $ | ||||||||||||
Cost of sales | ( | ) | ( | ) | |||||||||||||||
Gross profit (loss) | |||||||||||||||||||
Selling, general, and administrative expenses | |||||||||||||||||||
Research and development expenses | |||||||||||||||||||
Royalty expense | |||||||||||||||||||
(Loss) income from operations | ( | ) | |||||||||||||||||
Interest expense | ( | ) | ( | ) | ( | ) | |||||||||||||
Intercompany interest income (expense) | ( | ) | |||||||||||||||||
Foreign exchange loss | ( | ) | ( | ) | ( | ) | |||||||||||||
Other income (loss) | ( | ) | |||||||||||||||||
(Loss) income before income taxes | ( | ) | |||||||||||||||||
(Benefit) provision for income taxes | ( | ) | |||||||||||||||||
Equity in earnings (loss) of subsidiaries | ( | ) | ( | ) | |||||||||||||||
Net income (loss) | ( | ) | |||||||||||||||||
Net loss noncontrolling interests | ( | ) | ( | ) | |||||||||||||||
Net income (loss) attributable to Titan | $ | $ | $ | $ | ( | ) | $ | ||||||||||||
F- 37
TITAN INTERNATIONAL, INC.
NOTES TO CONSOLIDATED FINANCIAL STATEMENTS
(Amounts in thousands) | Consolidating Condensed Statements of Operations Year Ended December 31, 2017 | ||||||||||||||||||
Titan Intl., Inc. (Parent) | Guarantor Subsidiaries | Non-Guarantor Subsidiaries | Eliminations | Consolidated | |||||||||||||||
Net sales | $ | $ | $ | $ | $ | ||||||||||||||
Cost of sales | |||||||||||||||||||
Asset impairment | |||||||||||||||||||
Gross (loss) profit | ( | ) | |||||||||||||||||
Selling, general, and administrative expenses | |||||||||||||||||||
Research and development expenses | |||||||||||||||||||
Royalty expense | |||||||||||||||||||
(Loss) income from operations | ( | ) | ( | ) | |||||||||||||||
Interest expense | ( | ) | ( | ) | ( | ) | |||||||||||||
Loss on senior note repurchase | ( | ) | ( | ) | |||||||||||||||
Intercompany interest income (expense) | ( | ) | |||||||||||||||||
Foreign exchange gain | ( | ) | ( | ) | ( | ) | ( | ) | |||||||||||
Other income (loss) | ( | ) | |||||||||||||||||
(Loss) income before income taxes | ( | ) | ( | ) | ( | ) | |||||||||||||
(Benefit) provision for income taxes | ( | ) | |||||||||||||||||
Equity in (loss) earnings of subsidiaries | ( | ) | ( | ) | |||||||||||||||
Net (loss) income | ( | ) | ( | ) | ( | ) | |||||||||||||
Net loss noncontrolling interests | ( | ) | ( | ) | |||||||||||||||
Net (loss) income attributable to Titan | $ | ( | ) | $ | $ | ( | ) | $ | $ | ( | ) | ||||||||
F- 38
TITAN INTERNATIONAL, INC.
NOTES TO CONSOLIDATED FINANCIAL STATEMENTS
(Amounts in thousands) | Consolidating Condensed Statements of Comprehensive Income (Loss) For the Year Ended December 31, 2019 | ||||||||||||||||||
Titan Intl., Inc. (Parent) | Guarantor Subsidiaries | Non-Guarantor Subsidiaries | Eliminations | Consolidated | |||||||||||||||
Net (loss) income | $ | ( | ) | $ | ( | ) | $ | ( | ) | $ | $ | ( | ) | ||||||
Currency translation adjustment, net | ( | ) | ( | ) | ( | ) | |||||||||||||
Pension liability adjustments, net of tax | ( | ) | |||||||||||||||||
Comprehensive (loss) income | ( | ) | ( | ) | ( | ) | ( | ) | |||||||||||
Net comprehensive loss attributable to noncontrolling interests | ( | ) | ( | ) | |||||||||||||||
Comprehensive (loss) income attributable to Titan | $ | ( | ) | $ | ( | ) | $ | ( | ) | $ | $ | ( | ) | ||||||
(Amounts in thousands) | Consolidating Condensed Statements of Comprehensive Income (Loss) For the Year Ended December 31, 2018 | ||||||||||||||||||
Titan Intl., Inc. (Parent) | Guarantor Subsidiaries | Non-Guarantor Subsidiaries | Eliminations | Consolidated | |||||||||||||||
Net income (loss) | $ | $ | $ | $ | ( | ) | $ | ||||||||||||
Currency translation adjustment, net | ( | ) | ( | ) | ( | ) | |||||||||||||
Pension liability adjustments, net of tax | ( | ) | ( | ) | ( | ) | |||||||||||||
Comprehensive (loss) income | ( | ) | ( | ) | ( | ) | |||||||||||||
Net comprehensive loss attributable to noncontrolling interests | ( | ) | ( | ) | |||||||||||||||
Comprehensive (loss) income attributable to Titan | $ | ( | ) | $ | $ | ( | ) | $ | $ | ( | ) | ||||||||
(Amounts in thousands) | Consolidating Condensed Statements of Comprehensive Income (Loss) For the Year Ended December 31, 2017 | ||||||||||||||||||
Titan Intl., Inc. (Parent) | Guarantor Subsidiaries | Non-Guarantor Subsidiaries | Eliminations | Consolidated | |||||||||||||||
Net (loss) income | $ | ( | ) | $ | $ | ( | ) | $ | $ | ( | ) | ||||||||
Currency translation adjustment, net | ( | ) | |||||||||||||||||
Pension liability adjustments, net of tax | ( | ) | ( | ) | |||||||||||||||
Comprehensive (loss) income | ( | ) | ( | ) | ( | ) | |||||||||||||
Net comprehensive income attributable to noncontrolling interests | ( | ) | ( | ) | |||||||||||||||
Comprehensive (loss) income attributable to Titan | $ | ( | ) | $ | $ | $ | ( | ) | $ | ( | ) | ||||||||
F- 39
TITAN INTERNATIONAL, INC.
NOTES TO CONSOLIDATED FINANCIAL STATEMENTS
(Amounts in thousands) | Consolidating Condensed Balance Sheets December 31, 2019 | ||||||||||||||||||
Titan Intl., Inc. (Parent) | Guarantor Subsidiaries | Non-Guarantor Subsidiaries | Eliminations | Consolidated | |||||||||||||||
Assets | |||||||||||||||||||
Cash and cash equivalents | $ | $ | $ | $ | $ | ||||||||||||||
Accounts receivable | |||||||||||||||||||
Inventories | |||||||||||||||||||
Prepaid and other current assets | |||||||||||||||||||
Total current assets | |||||||||||||||||||
Property, plant, and equipment, net | |||||||||||||||||||
Investment in subsidiaries | ( | ) | |||||||||||||||||
Other long-term assets | |||||||||||||||||||
Total assets | $ | $ | $ | $ | ( | ) | $ | ||||||||||||
Liabilities and Stockholders’ Equity | |||||||||||||||||||
Short-term debt | $ | $ | $ | $ | $ | ||||||||||||||
Accounts payable | |||||||||||||||||||
Other current liabilities | |||||||||||||||||||
Total current liabilities | |||||||||||||||||||
Long-term debt | |||||||||||||||||||
Other long-term liabilities | |||||||||||||||||||
Intercompany accounts | ( | ) | |||||||||||||||||
Redeemable noncontrolling interest | |||||||||||||||||||
Titan stockholders' equity | ( | ) | |||||||||||||||||
Noncontrolling interests | |||||||||||||||||||
Total liabilities and stockholders’ equity | $ | $ | $ | $ | ( | ) | $ | ||||||||||||
F- 40
TITAN INTERNATIONAL, INC.
NOTES TO CONSOLIDATED FINANCIAL STATEMENTS
(Amounts in thousands) | Consolidating Condensed Balance Sheets December 31, 2018 | ||||||||||||||||||
Titan Intl., Inc. (Parent) | Guarantor Subsidiaries | Non-Guarantor Subsidiaries | Eliminations | Consolidated | |||||||||||||||
Assets | |||||||||||||||||||
Cash and cash equivalents | $ | $ | $ | $ | $ | ||||||||||||||
Accounts receivable | |||||||||||||||||||
Inventories | |||||||||||||||||||
Prepaid and other current assets | |||||||||||||||||||
Total current assets | |||||||||||||||||||
Property, plant, and equipment, net | |||||||||||||||||||
Investment in subsidiaries | ( | ) | |||||||||||||||||
Other long-term assets | |||||||||||||||||||
Total assets | $ | $ | $ | $ | ( | ) | $ | ||||||||||||
Liabilities and Stockholders’ Equity | |||||||||||||||||||
Short-term debt | $ | $ | $ | $ | $ | ||||||||||||||
Accounts payable | |||||||||||||||||||
Other current liabilities | |||||||||||||||||||
Total current liabilities | |||||||||||||||||||
Long-term debt | |||||||||||||||||||
Other long-term liabilities | |||||||||||||||||||
Intercompany accounts | ( | ) | |||||||||||||||||
Redeemable noncontrolling interest | |||||||||||||||||||
Titan stockholders’ equity | ( | ) | |||||||||||||||||
Noncontrolling interests | ( | ) | ( | ) | |||||||||||||||
Total liabilities and stockholders’ equity | $ | $ | $ | $ | ( | ) | $ | ||||||||||||
F- 41
TITAN INTERNATIONAL, INC.
NOTES TO CONSOLIDATED FINANCIAL STATEMENTS
(Amounts in thousands) | Consolidating Condensed Statements of Cash Flows Year Ended December 31, 2019 | ||||||||||||||
Titan Intl., Inc. (Parent) | Guarantor Subsidiaries | Non-Guarantor Subsidiaries | Consolidated | ||||||||||||
Net cash provided by operating activities | $ | $ | $ | $ | |||||||||||
Cash flows from investing activities: | |||||||||||||||
Capital expenditures | ( | ) | ( | ) | ( | ) | ( | ) | |||||||
Sale of Wheels India shares | |||||||||||||||
Payments related to redeemable noncontrolling interest | ( | ) | ( | ) | |||||||||||
Other, net | ( | ) | ( | ) | |||||||||||
Net cash used for investing activities | ( | ) | ( | ) | ( | ) | ( | ) | |||||||
Cash flows from financing activities: | |||||||||||||||
Proceeds from borrowings | |||||||||||||||
Payment on debt | ( | ) | ( | ) | ( | ) | ( | ) | |||||||
Dividends paid | ( | ) | ( | ) | |||||||||||
Net cash provided by (used for) financing activities | ( | ) | |||||||||||||
Effect of exchange rate change on cash | |||||||||||||||
Net (decrease) increase in cash and cash equivalents | ( | ) | ( | ) | |||||||||||
Cash and cash equivalents, beginning of period | |||||||||||||||
Cash and cash equivalents, end of period | $ | $ | $ | $ | |||||||||||
(Amounts in thousands) | Consolidating Condensed Statements of Cash Flows Year Ended December 31, 2018 | ||||||||||||||
Titan Intl., Inc. (Parent) | Guarantor Subsidiaries | Non-Guarantor Subsidiaries | Consolidated | ||||||||||||
Net cash (used for) provided by operating activities | $ | ( | ) | $ | $ | ( | ) | $ | ( | ) | |||||
Cash flows from investing activities: | |||||||||||||||
Capital expenditures | ( | ) | ( | ) | ( | ) | ( | ) | |||||||
Other, net | |||||||||||||||
Net cash used for investing activities | ( | ) | ( | ) | ( | ) | ( | ) | |||||||
Cash flows from financing activities: | |||||||||||||||
Proceeds from borrowings | |||||||||||||||
Payment on debt | ( | ) | ( | ) | |||||||||||
Dividends paid | ( | ) | ( | ) | |||||||||||
Net cash (used for) provided by financing activities | ( | ) | |||||||||||||
Effect of exchange rate change on cash | ( | ) | ( | ) | |||||||||||
Net decrease in cash and cash equivalents | ( | ) | ( | ) | ( | ) | ( | ) | |||||||
Cash and cash equivalents, beginning of period | |||||||||||||||
Cash and cash equivalents, end of period | $ | $ | $ | $ | |||||||||||
F- 42
TITAN INTERNATIONAL, INC.
NOTES TO CONSOLIDATED FINANCIAL STATEMENTS
(Amounts in thousands) | Consolidating Condensed Statements of Cash Flows Year Ended December 31, 2017 | ||||||||||||||
Titan Intl., Inc. (Parent) | Guarantor Subsidiaries | Non-Guarantor Subsidiaries | Consolidated | ||||||||||||
Net cash (used for) provided by operating activities | $ | ( | ) | $ | $ | $ | ( | ) | |||||||
Cash flows from investing activities: | |||||||||||||||
Capital expenditures | ( | ) | ( | ) | ( | ) | ( | ) | |||||||
Increase in restricted cash deposits | |||||||||||||||
Other, net | |||||||||||||||
Net cash provided by (used for) investing activities | ( | ) | ( | ) | |||||||||||
Cash flows from financing activities: | |||||||||||||||
Proceeds from borrowings | |||||||||||||||
Repurchase of senior notes | ( | ) | ( | ) | |||||||||||
Payment on debt | ( | ) | ( | ) | ( | ) | |||||||||
Dividends paid | ( | ) | ( | ) | |||||||||||
Net cash (used for) provided by financing activities | ( | ) | ( | ) | |||||||||||
Effect of exchange rate change on cash | |||||||||||||||
Net (decrease) increase in cash and cash equivalents | ( | ) | ( | ) | |||||||||||
Cash and cash equivalents, beginning of period | |||||||||||||||
Cash and cash equivalents, end of period | $ | $ | $ | $ | |||||||||||
F- 43
TITAN INTERNATIONAL, INC.
SCHEDULE II – VALUATION AND QUALIFYING ACCOUNTS
(Amounts in thousands)
Description | Balance at beginning of year | Additions to costs and expenses | Deductions | Balance at end of year | |||||||||||
Year ended December 31, 2019 | |||||||||||||||
Reserve deducted in the balance sheet from the assets to which it applies | |||||||||||||||
Allowance for doubtful accounts | $ | $ | $ | ( | ) | $ | |||||||||
Year ended December 31, 2018 | |||||||||||||||
Reserve deducted in the balance sheet from the assets to which it applies | |||||||||||||||
Allowance for doubtful accounts | $ | $ | $ | ( | ) | $ | |||||||||
Year ended December 31, 2017 | |||||||||||||||
Reserve deducted in the balance sheet from the assets to which it applies | |||||||||||||||
Allowance for doubtful accounts | $ | $ | ( | ) | $ | ( | ) | $ | |||||||
S- 1