UNITED STATES
SECURITIES AND EXCHANGE COMMISSION
WASHINGTON, D. C. 20549
FORM 10-K
ANNUAL REPORT PURSUANT TO SECTION 13 OR 15(d) OF THE SECURITIES EXCHANGE ACT OF 1934 | |
For the Fiscal Year Ended: | |
OR
TRANSITION REPORT PURSUANT TO SECTION 13 OR 15(d) OF THE SECURITIES EXCHANGE ACT OF 1934 | |
For the transition period from | to | ||
Commission File Number: | (Vornado Realty Trust) | |
Commission File Number: | (Vornado Realty L.P.) | |
(Exact name of registrants as specified in its charter)
Vornado Realty Trust | ||||
(State or other jurisdiction of incorporation or organization) | (I.R.S. Employer Identification Number) | |||
Vornado Realty L.P. | ||||
(State or other jurisdiction of incorporation or organization) | (I.R.S. Employer Identification Number) | |||
(Address of principal executive offices) (Zip Code) | |||
(Registrants’ telephone number, including area code) | |
N/A | |
(Former name, former address and former fiscal year, if changed since last report) | |
Securities registered pursuant to Section 12(b) of the Act:
Registrant | Title of Each Class | Trading Symbol(s) | Name of Exchange on Which Registered | |||
Vornado Realty Trust | ||||||
Cumulative Redeemable Preferred Shares of beneficial interest, liquidation preference $25.00 per share: | ||||||
Vornado Realty Trust | ||||||
Vornado Realty Trust | ||||||
Vornado Realty Trust | ||||||
Securities registered pursuant to Section 12(g) of the Act:
Registrant | Title of Each Class | |
Vornado Realty Trust | ||
Vornado Realty L.P. | ||
Indicate by check mark if the registrant is a well-known seasoned issuer, as defined in Rule 405 of the Securities Act.
Vornado Realty Trust: Yes ☑ No ☐ Vornado Realty L.P.: Yes ☐ No ☑
Indicate by check mark if the registrant is not required to file reports pursuant to Section 13 or Section 15(d) of the Act.
Vornado Realty Trust: Yes ☐ No ☑ Vornado Realty L.P.: Yes ☐ No ☑
Indicate by check mark whether the registrant: (1) has filed all reports required to be filed by Section 13 or 15(d) of the Securities Exchange Act of 1934 during the preceding 12 months (or for such shorter period that the registrant was required to file such reports), and (2) has been subject to such filing requirements for the past 90 days.
Vornado Realty Trust: Yes ☑ No ☐ Vornado Realty L.P.: Yes ☑ No ☐
Indicate by check mark whether the registrant has submitted electronically every Interactive Data File required to be submitted pursuant to Rule 405 of Regulation S-T (232.405 of this chapter) during the preceding 12 months (or for such shorter period that the registrant was required to submit and post such files).
Vornado Realty Trust: Yes ☑ No ☐ Vornado Realty L.P.: Yes ☑ No ☐
Indicate by check mark whether the registrant is a large accelerated filer, an accelerated filer, a non-accelerated filer, a smaller reporting company or an emerging growth company. See the definitions of “large accelerated filer,” “accelerated filer,” "non-accelerated filer," “smaller reporting company” and “emerging growth company” in Rule 12b-2 of the Exchange Act.
Vornado Realty Trust:
☑ | ☐ | Accelerated Filer | ||
☐ | Non-Accelerated Filer | Smaller Reporting Company | ||
Emerging Growth Company | ||||
Vornado Realty L.P.:
☐ | Large Accelerated Filer | ☐ | Accelerated Filer | |
☑ | Smaller Reporting Company | |||
Emerging Growth Company | ||||
If an emerging growth company, indicate by check mark if the registrant has elected not to use the extended transition period for complying with any new or revised financial accounting standards provided pursuant to Section 13(a) of the Exchange Act. ☐
Indicate by check mark whether the registrant is a shell company (as defined in Rule 12b-2 of the Exchange Act).
Vornado Realty Trust: Yes ☐ No ☑ Vornado Realty L.P.: Yes ☐ No ☑
The aggregate market value of the voting and non-voting common shares held by non-affiliates of Vornado Realty Trust, i.e. by persons other than officers and trustees of Vornado Realty Trust, was $11,264,516,000 at June 30, 2019.
As of December 31, 2019, there were 190,985,677 common shares of beneficial interest outstanding of Vornado Realty Trust.
There is no public market for the Class A units of limited partnership interest of Vornado Realty L.P. Based on the June 30, 2019 closing share price of Vornado Realty Trust’s common shares, which are issuable upon redemption of the Class A units, the aggregate market value of the Class A units held by non-affiliates of Vornado Realty L.P., i.e. by persons other than Vornado Realty Trust and its officers and trustees, was $670,609,000 at June 30, 2019.
Documents Incorporated by Reference
Part III: Portions of Proxy Statement for Annual Meeting of Vornado Realty Trust’s Shareholders to be held on May 14, 2020.
EXPLANATORY NOTE
This report combines the Annual Reports on Form 10-K for the fiscal year ended December 31, 2019 of Vornado Realty Trust and Vornado Realty L.P. Unless stated otherwise or the context otherwise requires, references to “Vornado” refer to Vornado Realty Trust, a Maryland real estate investment trust (“REIT”), and references to the “Operating Partnership” refer to Vornado Realty L.P., a Delaware limited partnership. References to the “Company,” “we,” “us” and “our” mean collectively Vornado, the Operating Partnership and those subsidiaries consolidated by Vornado.
The Operating Partnership is the entity through which we conduct substantially all of our business and own, either directly or through subsidiaries, substantially all of our assets. Vornado is the sole general partner and also a 93.1% limited partner of the Operating Partnership. As the sole general partner of the Operating Partnership, Vornado has exclusive control of the Operating Partnership’s day-to-day management.
Under the limited partnership agreement of the Operating Partnership, unitholders may present their Class A units for redemption at any time (subject to restrictions agreed upon at the time of issuance of the units that may restrict such right for a period of time). Class A units may be tendered for redemption to the Operating Partnership for cash; Vornado, at its option, may assume that obligation and pay the holder either cash or Vornado common shares on a one-for-one basis. Because the number of Vornado common shares outstanding at all times equals the number of Class A units owned by Vornado, the redemption value of each Class A unit is equivalent to the market value of one Vornado common share, and the quarterly distribution to a Class A unitholder is equal to the quarterly dividend paid to a Vornado common shareholder. This one-for-one exchange ratio is subject to specified adjustments to prevent dilution. Vornado generally expects that it will elect to issue its common shares in connection with each such presentation for redemption rather than having the Operating Partnership pay cash. With each such exchange or redemption, Vornado’s percentage ownership in the Operating Partnership will increase. In addition, whenever Vornado issues common shares other than to acquire Class A units of the Operating Partnership, Vornado must contribute any net proceeds it receives to the Operating Partnership and the Operating Partnership must issue to Vornado an equivalent number of Class A units of the Operating Partnership. This structure is commonly referred to as an umbrella partnership REIT, or UPREIT.
The Company believes that combining the Annual Reports on Form 10-K of Vornado and the Operating Partnership into this single report provides the following benefits:
• | enhances investors’ understanding of Vornado and the Operating Partnership by enabling investors to view the business as a whole in the same manner as management views and operates the business; |
• | eliminates duplicative disclosure and provides a more streamlined and readable presentation because a substantial portion of the disclosure applies to both Vornado and the Operating Partnership; and |
• | creates time and cost efficiencies in the preparation of one combined report instead of two separate reports. |
The Company believes it is important to understand the few differences between Vornado and the Operating Partnership in the context of how Vornado and the Operating Partnership operate as a consolidated company. The financial results of the Operating Partnership are consolidated into the financial statements of Vornado. Vornado does not have any significant assets, liabilities or operations, other than its investment in the Operating Partnership. The Operating Partnership, not Vornado, generally executes all significant business relationships other than transactions involving the securities of Vornado. The Operating Partnership holds substantially all of the assets of Vornado. The Operating Partnership conducts the operations of the business and is structured as a partnership with no publicly traded equity. Except for the net proceeds from equity offerings by Vornado, which are contributed to the capital of the Operating Partnership in exchange for Class A units of partnership in the Operating Partnership, and the net proceeds of debt offerings by Vornado, which are contributed to the Operating Partnership in exchange for debt securities of the Operating Partnership, as applicable, the Operating Partnership generates all remaining capital required by the Company’s business. These sources may include working capital, net cash provided by operating activities, borrowings under the revolving credit facility, the issuance of secured and unsecured debt and equity securities and proceeds received from the disposition of certain properties.
To help investors better understand the key differences between Vornado and the Operating Partnership, certain information for Vornado and the Operating Partnership in this report has been separated, as set forth below:
• | Item 5. Market for Registrant’s Common Equity, Related Stockholder Matters and Issuer Purchases of Equity Securities; |
• | Item 6. Selected Financial Data; |
• | Item 7. Management’s Discussion and Analysis of Financial Condition and Results of Operations includes information specific to each entity, where applicable; and |
• | Item 8. Financial Statements and Supplementary Data which includes the following specific disclosures for Vornado Realty Trust and Vornado Realty L.P.: |
• | Note 11. Redeemable Noncontrolling Interests/Redeemable Partnership Units |
• | Note 12. Shareholders' Equity/Partners' Capital |
• | Note 15. Stock-based Compensation |
• | Note 19. Income Per Share/Income Per Class A Unit |
• | Note 24. Summary of Quarterly Results (Unaudited) |
This report also includes separate Part II, Item 9A. Controls and Procedures sections and separate Exhibits 31 and 32 certifications for each of Vornado and the Operating Partnership in order to establish that the requisite certifications have been made and that Vornado and the Operating Partnership are compliant with Rule 13a-15 or Rule 15d-15 of the Securities Exchange Act of 1934 and 18 U.S.C. §1350.
INDEX
Item | Financial Information: | Page Number | |||
____________________
(1) | These items are omitted in whole or in part because Vornado, the Operating Partnership’s sole general partner, will file a definitive Proxy Statement pursuant to Regulation 14A under the Securities Exchange Act of 1934 with the Securities and Exchange Commission no later than 120 days after December 31, 2019, portions of which are incorporated by reference herein. |
5
FORWARD-LOOKING STATEMENTS
Certain statements contained herein constitute forward‑looking statements as such term is defined in Section 27A of the Securities Act of 1933, as amended, and Section 21E of the Securities Exchange Act of 1934, as amended. Forward-looking statements are not guarantees of future performance. They represent our intentions, plans, expectations and beliefs and are subject to numerous assumptions, risks and uncertainties. Our future results, financial condition and business may differ materially from those expressed in these forward-looking statements. You can find many of these statements by looking for words such as “approximates,” “believes,” “expects,” “anticipates,” “estimates,” “intends,” “plans,” “would,” “may” or other similar expressions in this Annual Report on Form 10‑K. We also note the following forward-looking statements: in the case of our development and redevelopment projects, the estimated completion date, estimated project cost and cost to complete; and estimates of future capital expenditures, dividends to common and preferred shareholders and operating partnership distributions. Many of the factors that will determine the outcome of these and our other forward-looking statements are beyond our ability to control or predict. For further discussion of factors that could materially affect the outcome of our forward-looking statements, see “Item 1A. Risk Factors” in this Annual Report on Form 10-K.
For these statements, we claim the protection of the safe harbor for forward-looking statements contained in the Private Securities Litigation Reform Act of 1995. You are cautioned not to place undue reliance on our forward-looking statements, which speak only as of the date of this Annual Report on Form 10-K or the date of any document incorporated by reference. All subsequent written and oral forward-looking statements attributable to us or any person acting on our behalf are expressly qualified in their entirety by the cautionary statements contained or referred to in this section. We do not undertake any obligation to release publicly any revisions to our forward-looking statements to reflect events or circumstances occurring after the date of this Annual Report on Form 10-K.
6
PART I
ITEM 1. | BUSINESS |
Vornado is a fully‑integrated REIT and conducts its business through, and substantially all of its interests in properties are held by, the Operating Partnership, a Delaware limited partnership. Accordingly, Vornado’s cash flow and ability to pay dividends to its shareholders are dependent upon the cash flow of the Operating Partnership and the ability of its direct and indirect subsidiaries to first satisfy their obligations to creditors. Vornado is the sole general partner of, and owned approximately 93.1% of the common limited partnership interest in the Operating Partnership as of December 31, 2019.
We currently own all or portions of:
New York:
• | 19.1 million square feet of Manhattan office in 35 properties; |
• | 2.3 million square feet of Manhattan street retail in 70 properties; |
• | 1,991 units in 10 residential properties; |
• | The 1,700 room Hotel Pennsylvania located on Seventh Avenue at 33rd Street in the heart of the Penn District; and |
• | A 32.4% interest in Alexander’s, Inc. (“Alexander’s”) (NYSE: ALX), which owns seven properties in the greater New York metropolitan area, including 731 Lexington Avenue, the 1.3 million square foot Bloomberg, L.P. headquarters building. |
Other Real Estate and Investments:
• | The 3.7 million square foot theMART in Chicago; |
• | A 70% controlling interest in 555 California Street, a three-building office complex in San Francisco’s financial district aggregating 1.8 million square feet; |
• | A 25.0% interest in Vornado Capital Partners, our real estate fund (the "Fund"). We are the general partner and investment manager of the Fund; and |
• | Other real estate and investments. |
OBJECTIVES AND STRATEGY
Our business objective is to maximize Vornado shareholder value. We intend to achieve this objective by continuing to pursue our investment philosophy and to execute our operating strategies through:
• | maintaining a superior team of operating and investment professionals and an entrepreneurial spirit; |
• | investing in properties in select markets, such as New York City, where we believe there is a high likelihood of capital appreciation; |
• | acquiring quality properties at a discount to replacement cost and where there is a significant potential for higher rents; |
• | developing and redeveloping our existing properties to increase returns and maximize value; and |
• | investing in operating companies that have a significant real estate component. |
We expect to finance our growth, acquisitions and investments using internally generated funds, proceeds from asset sales and by accessing the public and private capital markets. We may also offer Vornado common or preferred shares or Operating Partnership units in exchange for property and may repurchase or otherwise reacquire these securities in the future.
DISPOSITIONS
We contributed seven properties to Fifth Avenue and Times Square JV and transferred a 48.5% common interest in the joint venture to a group of institutional investors for net cash proceeds of $1.179 billion. We retained the remaining 51.5% common interest and an aggregate $1.828 billion of preferred equity interests in certain of the properties.
We also completed the following sale transactions during 2019:
• | $1.61 billion net proceeds from the sale of 54 condominium units at 220 Central Park South; |
• | $168 million sale of all of our 18,468,969 common shares of Lexington Realty Trust; |
• | $109 million conversion and sale of all of our 5,717,184 partnership units of Urban Edge Properties; |
• | $100 million sale of our 25% interest in 330 Madison Avenue; and |
• | $50 million sale of 3040 M Street. |
7
FINANCINGS
We completed the following financing transactions during 2019:
• | $1.50 billion unsecured revolving credit facilities (increased from $1.25 billion) extended to March 2024, lowering the interest |
rate from LIBOR plus 1.00% to LIBOR plus 0.90%;
• | $800 million refinancing of 650 Madison Avenue ($161 million at our 20.1% interest); |
• | $580 million refinancing of 100 West 33rd Street; |
• | $575 million mortgage loan repayment on PENN2 with proceeds from our unsecured revolving credit facilities; |
• | $500 million financing of 640 Fifth Avenue ($260 million at our 52% interest) with proceeds used for the redemption of our |
temporary preferred equity in the property;
• | $400 million redemption of all of the outstanding 5.00% senior unsecured notes; |
• | $375 million mortgage loan on 888 Seventh Avenue extended to December 2025; |
• | $168 million refinancing of 61 Ninth Avenue ($76 million at our 45.1% interest); |
• | $146 million refinancing of 512 West 22nd Street ($80 million at our 55% interest); |
• | $145 million refinancing of Lucida ($36 million at our 25% interest); |
• | $96 million refinancing of 435 Seventh Avenue; |
• | $86 million refinancing of 50-70 West 93rd Street ($43 million at our 49.9% interest); |
• | $75 million refinancing of 606 Broadway ($38 million at our 50% interest); |
• | $60 million refinancing of 825 Seventh Avenue ($30 million at our 50% interest); and |
• | $737 million which fully repaid the $950 million 220 Central Park South loan. |
DEVELOPMENT AND REDEVELOPMENT EXPENDITURES
220 Central Park South
We are constructing a residential condominium tower containing 397,000 salable square feet at 220 Central Park South ("220 CPS"). The development cost of this project (exclusive of land cost of $515.4 million) is estimated to be approximately $1.450 billion, of which $1.373 billion has been expended as of December 31, 2019.
Penn District
We are redeveloping PENN1, a 2,545,000 square foot office building located on 34th Street between Seventh and Eighth Avenue. The development cost of this project is estimated to be $325,000,000, of which $69,006,000 has been expended as of December 31, 2019.
We are redeveloping PENN2, a 1,795,000 square foot (as expanded) office building, located on the west side of Seventh Avenue between 31st and 33rd Street. The development cost of this project is estimated to be $750,000,000, of which $40,820,000 has been expended as of December 31, 2019.
We are also making districtwide improvements within the Penn District. The development cost of these improvements is estimated to be $100,000,000, of which $6,314,000 has been expended as of December 31, 2019.
Our 95.0% joint venture (the remaining 5.0% is owned by the Related Companies ("Related")) is developing the Farley Office and Retail Building (the "Project"), which will include approximately 844,000 rentable square feet of commercial space, comprised of approximately 730,000 square feet of office space and approximately 114,000 square feet of retail space. The total development cost of the Project is estimated to be approximately $1,030,000,000. As of December 31, 2019, $597,600,000 has been expended.
The joint venture has entered into a development agreement with Empire State Development (“ESD”), an entity of New York State, to build the adjacent Moynihan Train Hall, with Vornado and Related each guaranteeing the joint venture's obligations. The joint venture has entered into a design-build contract with Skanska Moynihan Train Hall Builders pursuant to which they will build the Moynihan Train Hall, thereby fulfilling all of the joint venture's obligations to ESD. The obligations of Skanska Moynihan Train Hall Builders have been bonded by Skanska USA and bear a full guaranty from Skanska AB. The development expenditures for the Moynihan Train Hall are estimated to be approximately $1.6 billion, which will be funded by governmental agencies.
On December 19, 2019, we paid Kmart Corporation $34,000,000, of which $10,000,000 is expected to be reimbursed, to early terminate their 141,000 square foot retail space lease at PENN1 which was scheduled to expire in January 2036.
We recently entered into a development agreement with Metropolitan Transportation Authority to oversee the development of the Long Island Rail Road 33rd Street entrance at Penn Station which Skanska USA Civil Northeast, Inc. will construct under a fixed price contract for $120,805,000.
Other
We are redeveloping a 78,000 square foot Class A office building at 345 Montgomery Street, a part of our 555 California Street complex in San Francisco (70.0% interest) located at the corner of California and Pine Street. The development cost of this project is estimated to be approximately $50,000,000, of which our share is $35,000,000. As of December 31, 2019, $48,087,000 has been expended, of which our share is $33,661,000.
8
DEVELOPMENT AND REDEVELOPMENT EXPENDITURES - CONTINUED
Other - continued
We are redeveloping a 165,000 square foot office building at 825 Seventh Avenue, located at the corner of 53rd Street and Seventh Avenue (50.0% interest). The redevelopment cost of this project is estimated to be approximately $30,000,000, of which our share is $15,000,000. As of December 31, 2019, $23,128,000 has been expended, of which our share is $11,564,000.
We are also evaluating other development and redevelopment opportunities at certain of our properties in Manhattan including, in particular, the Penn District.
There can be no assurance that the above projects will be completed, completed on schedule or within budget.
COMPETITION
We compete with a large number of real estate investors, property owners and developers, some of which may be willing to accept lower returns on their investments. Principal factors of competition are rents charged, sales prices, attractiveness of location, the quality of the property and the breadth and the quality of services provided. Our success depends upon, among other factors, trends of the global, national, regional and local economies, the financial condition and operating results of current and prospective tenants and customers, availability and cost of capital, construction and renovation costs, taxes, governmental regulations, legislation, population and employment trends. See "Risk Factors" in Item 1A for additional information regarding these factors.
SEGMENT DATA
We operate in the following reportable segments: New York and Other. Financial information related to these reportable segments for the years ended December 31, 2019, 2018 and 2017 is set forth in Note 25 – Segment Information to our consolidated financial statements in this Annual Report on Form 10-K.
SEASONALITY
Our revenues and expenses are subject to seasonality during the year which impacts quarterly net earnings, cash flows and funds from operations, and therefore impacts comparisons of the current quarter to the previous quarter. The New York segment has historically experienced higher utility costs in the first and third quarters of the year.
TENANTS ACCOUNTING FOR OVER 10% OF REVENUES
None of our tenants accounted for more than 10% of total revenues in any of the years ended December 31, 2019, 2018 and 2017.
CERTAIN ACTIVITIES
We do not base our acquisitions and investments on specific allocations by type of property. We have historically held our properties for long‑term investment; however, it is possible that properties in our portfolio may be sold or otherwise disposed of when circumstances warrant. Further, we have not adopted a policy that limits the amount or percentage of assets which could be invested in a specific property or property type. Generally our activities are reviewed and may be modified from time to time by Vornado’s Board of Trustees without the vote of our shareholders or Operating Partnership unitholders.
EMPLOYEES
As of December 31, 2019, we have approximately 4,008 employees, of which 273 are corporate staff. The New York segment has 3,562 employees, including 2,914 employees of Building Maintenance Services LLC, a wholly owned subsidiary, which provides cleaning, security and engineering services primarily to our New York properties and 462 employees at the Hotel Pennsylvania. theMART has 173 employees. The foregoing does not include employees of partially owned entities.
PRINCIPAL EXECUTIVE OFFICES
Our principal executive offices are located at 888 Seventh Avenue, New York, New York 10019; telephone (212) 894‑7000.
MATERIALS AVAILABLE ON OUR WEBSITE
Copies of our Annual Report on Form 10‑K, Quarterly Reports on Form 10‑Q, Current Reports on Form 8‑K and amendments to those reports, as well as Reports on Forms 3, 4 and 5 regarding officers, trustees or 10% beneficial owners, filed or furnished pursuant to Section 13(a), 15(d) or 16(a) of the Securities Exchange Act of 1934 are available free of charge through our website (www.vno.com) as soon as reasonably practicable after they are electronically filed with, or furnished to, the Securities and Exchange Commission. Also available on our website are copies of our Audit Committee Charter, Compensation Committee Charter, Corporate Governance and Nominating Committee Charter, Code of Business Conduct and Ethics, and Corporate Governance Guidelines. In the event of any changes to these charters or the code or guidelines, changed copies will also be made available on our website. Copies of these documents are also available directly from us free of charge. Our website also includes other financial and non-financial information, including certain non-GAAP financial measures, none of which is a part of this Annual Report on Form 10-K. Copies of our filings under the Securities Exchange Act of 1934 are also available free of charge from us, upon request.
9
ITEM 1A. | RISK FACTORS |
Material factors that may adversely affect our business, operations and financial condition are summarized below. We refer to the equity and debt securities of both Vornado and the Operating Partnership as our “securities” and the investors who own shares of Vornado or units of the Operating Partnership, or both, as our “equity holders.” The risks and uncertainties described herein may not be the only ones we face. Additional risks and uncertainties not presently known to us or that we currently believe to be immaterial may also adversely affect our business, operations and financial condition. See “Forward-Looking Statements” contained herein on page 6.
OUR INVESTMENTS ARE CONCENTRATED IN THE NEW YORK CITY METROPOLITAN AREA AND CIRCUMSTANCES AFFECTING THIS AREA GENERALLY COULD MATERIALLY AND ADVERSELY AFFECT OUR BUSINESS.
A significant portion of our properties is located in the New York City Metropolitan area and is affected by the economic cycles and risks inherent to this area.
In 2019, approximately 87% of our net operating income ("NOI", a non-GAAP measure) came from properties located in the New York City metropolitan area. We may continue to concentrate a significant portion of our future acquisitions, development and redevelopment in this area. Real estate markets are subject to economic downturns and we cannot predict how economic conditions will impact this market in either the short or long term. Declines in the economy or declines in real estate markets in the New York City metropolitan area could hurt our financial performance and the value of our properties. In addition to the factors affecting the national economic condition generally, the factors affecting economic conditions in this region include:
• | financial performance and productivity of the media, advertising, professional services, financial, technology, retail, insurance and real estate industries; |
• | business layoffs or downsizing; |
• | industry slowdowns; |
• | relocations of businesses; |
• | changing demographics; |
• | increased telecommuting and use of alternative work places; |
• | changes in the number of domestic and international tourists to our markets (including as a result of changes in the relative strengths of world currencies); |
• | infrastructure quality; |
• | changes in rates or the treatment of the deductibility of state and local taxes; and |
• | any oversupply of, or reduced demand for, real estate. |
It is impossible for us to ensure the accuracy of predictions of the future or the effect of trends in the economic and investment climates of the geographic areas in which we concentrate, and more generally of the United States, or the real estate markets in these areas. Local, national or global economic downturns could negatively affect our businesses and profitability.
We are subject to risks that affect the general and New York City retail environments.
Certain of our properties are Manhattan retail properties. Approximately 22% of our NOI is from Manhattan retail properties. As such, these properties are affected by the general and New York City retail environments, including the level of consumer spending and consumer confidence, Manhattan tourism, the threat of terrorism, increasing competition from on-line retailers, other retailers, and outlet malls, and the impact of technological change upon the retail environment generally. These factors could adversely affect the financial condition of our retail tenants, or result in the bankruptcy of such tenants, and the willingness of retailers to lease space in our retail locations, which could have an adverse effect on our business and profitability.
Terrorist attacks may adversely affect the value of our properties and our ability to generate cash flow.
We have significant investments in the New York City, Chicago and San Francisco metropolitan areas. In response to a terrorist attack or the perceived threat of terrorism, tenants in these areas may choose to relocate their businesses to less populated, lower-profile areas of the United States that may be perceived to be less likely targets of future terrorist activity and fewer customers may choose to patronize businesses in these areas. This, in turn, would trigger a decrease in the demand for space in these areas, which could increase vacancies in our properties and force us to lease space on less favorable terms. Furthermore, we may experience increased costs in security, equipment and personnel. As a result, the value of our properties and the level of our revenues and cash flows could decline materially.
10
Natural disasters and the effects of climate change could have a concentrated impact on the areas where we operate and could adversely impact our results.
Our investments are concentrated in the New York, Chicago and San Francisco metropolitan areas. Natural disasters, including earthquakes, storms, tornados, floods and hurricanes, could cause significant damage to our properties and the surrounding environment or area. Potentially adverse consequences of “global warming,” including rising sea levels, could similarly have an impact on our properties and the economies of the metropolitan areas in which we operate. Over time, these conditions could result in declining demand for office space in our buildings or the inability of us to operate the buildings at all. Climate change may also have indirect effects on our business by increasing the cost of (or making unavailable) property insurance on terms we find acceptable, increasing the cost of energy at our properties and requiring us to expend funds as we seek to repair and protect our properties against such risks. The incurrence of these losses, costs or business interruptions may adversely affect our operating and financial results.
REAL ESTATE INVESTMENTS’ VALUE AND INCOME FLUCTUATE DUE TO VARIOUS FACTORS.
Our performance and the value of an investment in us are subject to risks associated with our real estate assets and with the real estate industry.
The value of our real estate and the value of an investment in us fluctuates depending on conditions in the general economy and the real estate business. These conditions may also adversely impact our revenues and cash flows.
The factors that affect the value of our real estate investments include, among other things:
• | global, national, regional and local economic conditions; |
• | competition from other available space; |
• | local conditions such as an oversupply of space or a reduction in demand for real estate in the area; |
• | how well we manage our properties; |
• | the development and/or redevelopment of our properties; |
• | changes in market rental rates; |
• | the timing and costs associated with property improvements and rentals; |
• | whether we are able to pass all or portions of any increases in operating costs through to tenants; |
• | changes in real estate taxes and other expenses; |
• | the ability of state and local governments to operate within their budgets; |
• | whether tenants and users such as customers and shoppers consider a property attractive; |
• | changes in consumer preferences adversely affecting retailers and retail store values; |
• | changes in space utilization by our tenants due to technology, economic conditions and business environment; |
• | the financial condition of our tenants, including the extent of tenant bankruptcies or defaults; |
• | consequences of any armed conflict involving, or terrorist attacks against, the United States or individual acts of violence in public spaces; |
• | trends in office real estate; |
• | the impact on our retail tenants and demand for retail space at our properties due to increased competition from online shopping; |
• | availability of financing on acceptable terms or at all; |
• | inflation or deflation; |
• | fluctuations in interest rates; |
• | our ability to obtain adequate insurance; |
• | changes in zoning laws and taxation; |
• | government regulation; |
• | potential liability under environmental or other laws or regulations; |
• | natural disasters; |
• | general competitive factors; and |
• | climate changes. |
The rents or sales proceeds we receive and the occupancy levels at our properties may decline as a result of adverse changes in any of these factors. If rental revenues, sales proceeds and/or occupancy levels decline, we generally would expect to have less cash available for operating costs, to pay indebtedness and for distribution to equity holders. In addition, some of our major expenses, including mortgage payments, real estate taxes and maintenance costs generally do not decline when the related rents decline.
11
Capital markets and economic conditions can materially affect our liquidity, financial condition and results of operations as well as the value of an investment in our debt and equity securities.
There are many factors that can affect the value of our debt and equity securities, including the state of the capital markets and the economy. Demand for office and retail space typically declines nationwide due to an economic downturn, bankruptcies, downsizing, layoffs and cost cutting. Government action or inaction may adversely affect the state of the capital markets. The cost and availability of credit may be adversely affected by illiquid credit markets and wider credit spreads, which may adversely affect our liquidity and financial condition, including our results of operations, and the liquidity and financial condition of our tenants. Our inability or the inability of our tenants to timely refinance maturing liabilities and access the capital markets to meet liquidity needs may materially affect our financial condition and results of operations and the value of our securities.
U.S. federal tax reform legislation now and in the future could affect REITs generally, the geographic markets in which we operate, the trading of our shares and our results of operations, both positively and negatively, in ways that are difficult to anticipate.
The Tax Cuts and Jobs Act of 2017 (the “2017 Act”) represented sweeping tax reform legislation that made significant changes to corporate and individual tax rates and the calculation of taxes, as well as international tax rules. As a REIT, we are generally not required to pay federal taxes otherwise applicable to regular corporations if we comply with the various tax regulations governing REITs. Shareholders, however, are generally required to pay taxes on REIT dividends. The 2017 Act and future tax reform legislation could impact our share price or how shareholders and potential investors view an investment in REITs. For example, the decrease in corporate tax rates in the 2017 Act could decrease the attractiveness of the REIT structure relative to companies that are not organized as REITs. In addition, while certain elements of the 2017 Act do not impact us directly as a REIT, they could impact the geographic markets in which we operate as well as our tenants in ways, both positive and negative, that are difficult to anticipate. For example, the limitation in the 2017 Act on the deductibility of certain state and local taxes may make operating in jurisdictions that impose such taxes at higher rates less desirable than operating in jurisdictions imposing such taxes at lower rates. The overall impact of the 2017 Act also depends on the future interpretations and regulations that may be issued by U.S. tax authorities, and it is possible that future guidance could adversely impact us.
Real estate is a competitive business and that competition may adversely impact us.
We compete with a large number of real estate investors, property owners and developers, some of which may be willing to accept lower returns on their investments. Principal factors of competition are rents charged, sales prices, attractiveness of location, the quality of the property and the breadth and the quality of services provided. Substantially all of our properties face competition from similar properties in the same market, which may adversely impact the rents we can charge at those properties and our results of operations.
Competition for acquisitions may reduce the number of acquisition opportunities available to us and increase the costs of those acquisitions.
We may acquire properties when we are presented with attractive opportunities. We may face competition for acquisition opportunities from other well-capitalized investors, including publicly traded and privately held REITs, private real estate funds, domestic and foreign financial institutions, life insurance companies, sovereign wealth funds, pension trusts, partnerships and individual investors, which may adversely affect us because that competition may cause an increase in the purchase price for a desired acquisition property or result in a competitor acquiring the desired property instead of us.
If we are unable to successfully acquire additional properties, our ability to grow our business could be adversely affected. In addition, increases in the cost of acquisition opportunities could adversely affect our results of operations.
We depend on leasing space to tenants on economically favorable terms and collecting rent from tenants who may not be able to pay.
Our financial results depend significantly on leasing space in our properties to tenants on economically favorable terms. In addition, because a majority of our income comes from renting of real property, our income, funds available to pay indebtedness and funds available for distribution to equity holders will decrease if a significant number of our tenants cannot pay their rent or if we are not able to maintain occupancy levels on favorable terms. If a tenant does not pay its rent, we may not be able to enforce our rights as landlord without delays and may incur substantial legal and other costs. Even if we are able to enforce our rights, a tenant may not have recoverable assets.
We may be adversely affected by trends in office real estate.
Approximately 72% of our NOI is from our office properties. Telecommuting, flexible work schedules, open workplaces and teleconferencing are becoming more common. These practices enable businesses to reduce their office space requirements. There is also an increasing trend among some businesses to utilize shared office spaces and co-working spaces. A continuation of the movement towards these practices could, over time, erode the overall demand for office space and, in turn, place downward pressure on occupancy, rental rates and property valuations.
12
We may be unable to renew leases or relet space as leases expire.
When our tenants decide not to renew their leases upon their expiration, we may not be able to relet the space. Even if tenants do renew or we can relet the space, the terms of renewal or reletting, considering among other things, the cost of improvements to the property and leasing commissions, may be less favorable than the terms in the expired leases. In addition, changes in space utilization by our tenants may impact our ability to renew or relet space without the need to incur substantial costs in renovating or redesigning the internal configuration of the relevant property. If we are unable to promptly renew the leases or relet the space at similar rates or if we incur substantial costs in renewing or reletting the space, our cash flow and ability to service debt obligations and pay dividends and distributions to equity holders could be adversely affected.
Bankruptcy or insolvency of tenants may decrease our revenue, net income and available cash.
From time to time, some of our tenants have declared bankruptcy, and other tenants may declare bankruptcy or become insolvent in the future. The bankruptcy or insolvency of a major tenant could cause us to suffer lower revenues and operational difficulties, including leasing the remainder of the property. As a result, the bankruptcy or insolvency of a major tenant could result in decreased net income and funds available to pay our indebtedness or make distributions to equity holders.
The occurrence of cyber incidents, or a deficiency in our cyber security, as well as other disruptions of our IT networks and related systems, could negatively impact our business by causing a disruption to our operations, a compromise or corruption of our confidential information, and/or damage to our business relationships or reputation, all of which could negatively impact our financial results.
We face risks associated with security breaches, whether through cyber attacks or cyber intrusions over the Internet, malware, computer viruses, attachments to e-mails, persons who access our systems from inside or outside our organization, and other significant disruptions of our IT networks and related systems. The risk of a security breach or disruption, particularly through cyber attack or cyber intrusion, including by computer hackers, foreign governments and cyber terrorists, has generally increased as the number, intensity and sophistication of attempted attacks and intrusions from around the world have increased. Although we have not experienced cyber incidents that are individually, or in the aggregate, material, we have experienced cyber attacks in the past, which have thus far been mitigated by preventative, detective, and responsive measures that we have put in place. Our IT networks and related systems are essential to the operation of our business and our ability to perform day-to-day operations (including managing our building systems) and, in some cases, may be critical to the operations of certain of our tenants. Although we make efforts to maintain the security and integrity of these types of IT networks and related systems, and we have implemented various measures to manage the risk of a security breach or disruption, there can be no assurance that our security efforts and measures will be effective or that attempted security breaches or disruptions would not be successful or damaging. Unauthorized parties, whether within or outside our company, may disrupt or gain access to our systems, or those of third parties with whom we do business, through human error, misfeasance, fraud, trickery, or other forms of deceit, including break-ins, use of stolen credentials, social engineering, phishing, computer viruses or other malicious codes, and similar means of unauthorized and destructive tampering. Even the most well protected information, networks, systems and facilities remain potentially vulnerable because the techniques used in such attempted security breaches evolve and generally are not recognized until launched against a target, and in some cases are designed to not be detected and, in fact, may not be detected. Accordingly, we may be unable to anticipate these techniques or to implement adequate security barriers or other preventative measures, and thus it is impossible for us to entirely mitigate this risk.
A security breach or other significant disruption involving our IT networks and related systems could disrupt the proper functioning of our networks and systems and therefore our operations and/or those of certain of our tenants; result in the unauthorized access to, and destruction, loss, theft, misappropriation or release of, proprietary, confidential, sensitive or otherwise valuable information of ours or others, which others could use to compete against us or which could expose us to damage claims by third-parties for disruptive, destructive or otherwise harmful purposes and outcomes; result in our inability to maintain the building systems relied upon by our tenants for the efficient use of their leased space; require significant management attention and resources to remedy any damages that result; subject us to litigation claims for breach of contract, damages, credits, fines, penalties, governmental investigations and enforcement actions or termination of leases or other agreements; or damage our reputation among our tenants and investors generally. Any or all of the foregoing could have a material adverse effect on our results of operations, financial condition and cash flows.
A cyber attack or systems failure could interfere with our ability to comply with financial reporting requirements, which could adversely affect us. A cyber attack could also compromise the confidential information of our employees, tenants, customers and vendors. A successful attack could disrupt and materially affect our business operations, including damaging relationships with tenants, customers and vendors. Any compromise of our information security systems could also result in a violation of applicable privacy and other laws, significant legal and financial exposure, damage to our reputation, loss or misuse of the information (which may be confidential, proprietary and/or commercially sensitive in nature) and a loss of confidence in our security measures, which could harm our business.
13
Some of our potential losses may not be covered by insurance.
For our properties except the Farley Office and Retail Building, we maintain general liability insurance with limits of $300,000,000 per occurrence and per property, and all risk property and rental value insurance with limits of $2.0 billion per occurrence, with sub-limits for certain perils such as flood and earthquake. Our California properties have earthquake insurance with coverage of $350,000,000 per occurrence and in the aggregate, subject to a deductible in the amount of 5% of the value of the affected property. We maintain coverage for certified terrorism acts with limits of $6.0 billion per occurrence and in the aggregate (as listed below), $1.2 billion for non-certified acts of terrorism, and $5.0 billion per occurrence and in the aggregate for terrorism involving nuclear, biological, chemical and radiological (“NBCR”) terrorism events, as defined by the Terrorism Risk Insurance Act of 2002, as amended to date and which has been extended through December 2027.
Penn Plaza Insurance Company, LLC (“PPIC”), our wholly owned consolidated subsidiary, acts as a re-insurer with respect to a portion of all risk property and rental value insurance and a portion of our earthquake insurance coverage, and as a direct insurer for coverage for acts of terrorism including NBCR acts. Coverage for acts of terrorism (excluding NBCR acts) is fully reinsured by third party insurance companies and the Federal government with no exposure to PPIC. For NBCR acts, PPIC is responsible for a deductible of $1,430,413 and 20% of the balance of a covered loss and the Federal government is responsible for the remaining portion of a covered loss. We are ultimately responsible for any loss incurred by PPIC.
For the Farley Office and Retail Building, we maintain general liability insurance with limits of $100,000,000 per occurrence, and builder’s risk insurance including coverage for existing property and development activities of $2.8 billion per occurrence and in the aggregate. We maintain coverage for certified and non-certified terrorism acts with limits of $1.0 billion per occurrence and in the aggregate.
We continue to monitor the state of the insurance market and the scope and costs of coverage for acts of terrorism and other events. However, we cannot anticipate what coverage will be available on commercially reasonable terms in the future. We are responsible for uninsured losses and for deductibles and losses in excess of our insurance coverage, which could be material.
Our debt instruments, consisting of mortgage loans secured by our properties, senior unsecured notes and revolving credit agreements contain customary covenants requiring us to maintain insurance. Although we believe that we have adequate insurance coverage for purposes of these agreements, we may not be able to obtain an equivalent amount of coverage at reasonable costs in the future. Further, if lenders insist on greater coverage than we are able to obtain it could adversely affect our ability to finance or refinance our properties and expand our portfolio.
Compliance or failure to comply with the Americans with Disabilities Act ("ADA") or other safety regulations and requirements could result in substantial costs.
ADA generally requires that public buildings, including our properties, meet certain Federal requirements related to access and use by disabled persons. Noncompliance could result in the imposition of fines by the Federal government or the award of damages to private litigants and/or legal fees to their counsel. From time to time persons have asserted claims against us with respect to some of our properties under the ADA, but to date such claims have not resulted in any material expense or liability. If, under the ADA, we are required to make substantial alterations and capital expenditures in one or more of our properties, including the removal of access barriers, it could adversely affect our financial condition and results of operations, as well as the amount of cash available for distribution to equity holders.
Our properties are subject to various federal, state and local regulatory requirements, such as state and local fire and life safety requirements. If we fail to comply with these requirements, we could incur fines or private damage awards. We do not know whether existing requirements will change or whether compliance with future requirements will require significant unanticipated expenditures that will affect our cash flow and results of operations.
Changes in the method pursuant to which the LIBOR rates are determined and phasing out of LIBOR after 2021 may affect our financial results.
The chief executive of the United Kingdom Financial Conduct Authority ("FCA"), which regulates the London Interbank Offered Rate ("LIBOR"), announced that the FCA intends to stop compelling banks to submit rates for the calculation of LIBOR after 2021. In response, the Federal Reserve Board and the Federal Reserve Bank of New York organized the Alternative Reference Rates Committee which identified the Secured Overnight Financing Rate ("SOFR") as its preferred alternative to USD-LIBOR in derivatives and other financial contracts. It is not possible to predict the effect of these changes, including when LIBOR will cease to be available or when there will be sufficient liquidity in the SOFR markets.
We have outstanding debt and derivatives with variable rates that are indexed to LIBOR. In the transition from the use of LIBOR to SOFR or other alternatives, the level of interest payments we incur may change. In addition, although certain of our LIBOR based obligations provide for alternative methods of calculating the interest rate payable on certain of our obligations (including transition to an alternative benchmark rate) if LIBOR is not reported, uncertainty as to the extent and manner of future changes may result in interest rates and/or payments that are higher than, lower than or that do not otherwise correlate over time with the interest rates and/or payments that would have been made on our obligations if LIBOR was available in its current form. Use of alternative interest rates or other LIBOR reforms could result in increased volatility or a tightening of credit markets which could adversely affect our ability to obtain cost-effective financing.
14
We may incur significant costs to comply with environmental laws and environmental contamination may impair our ability to lease and/or sell real estate.
Our operations and properties are subject to various federal, state and local laws and regulations concerning the protection of the environment, including air and water quality, hazardous or toxic substances and health and safety. Under some environmental laws, a current or previous owner or operator of real estate may be required to investigate and clean up hazardous or toxic substances released at a property. The owner or operator may also be held liable to a governmental entity or to third parties for property damage or personal injuries and for investigation and clean-up costs incurred by those parties because of the contamination. These laws often impose liability without regard to whether the owner or operator knew of the release of the substances or caused the release. The presence of contamination or the failure to remediate contamination may also impair our ability to sell or lease real estate or to borrow using the real estate as collateral. Other laws and regulations govern indoor and outdoor air quality including those that can require the abatement or removal of asbestos-containing materials in the event of damage, demolition, renovation or remodeling and govern emissions of and exposure to asbestos fibers in the air. The maintenance and removal of lead paint and certain electrical equipment containing polychlorinated biphenyls (PCBs) are also regulated by federal and state laws. We are also subject to risks associated with human exposure to chemical or biological contaminants such as molds, pollens, viruses and bacteria which, above certain levels, can be alleged to be connected to allergic or other health effects and symptoms in susceptible individuals. Our predecessor companies may be subject to similar liabilities for activities of those companies in the past. We could incur fines for environmental compliance and be held liable for the costs of remedial action with respect to the foregoing regulated substances or related claims arising out of environmental contamination or human exposure to contamination at or from our properties.
Each of our properties has been subject to varying degrees of environmental assessment. To date, these environmental assessments have not revealed any environmental condition material to our business. However, identification of new compliance concerns or undiscovered areas of contamination, changes in the extent or known scope of contamination, human exposure to contamination or changes in clean-up or compliance requirements could result in significant costs to us.
In addition, we may become subject to costs or taxes, or increases therein, associated with natural resource or energy usage (such as a “carbon tax”). These costs or taxes could increase our operating costs and decrease the cash available to pay our obligations or distribute to equity holders.
We face risks associated with our tenants being designated “Prohibited Persons” by the Office of Foreign Assets Control and similar requirements.
Pursuant to Executive Order 13224 and other laws, the Office of Foreign Assets Control of the United States Department of the Treasury (“OFAC”) maintains a list of persons designated as terrorists or who are otherwise blocked or banned (“Prohibited Persons”) from conducting business or engaging in transactions in the United States and thereby restricts our doing business with such persons. In addition, our leases, loans and other agreements may require us to comply with OFAC and related requirements, and any failure to do so may result in a breach of such agreements. If a tenant or other party with whom we conduct business is placed on the OFAC list or is otherwise a party with whom we are prohibited from doing business, we may be required to terminate the lease or other agreement or face other penalties. Any such termination could result in a loss of revenue or otherwise negatively affect our financial results and cash flows.
WE MAY ACQUIRE OR SELL ASSETS OR ENTITIES OR DEVELOP PROPERTIES. OUR FAILURE OR INABILITY TO CONSUMMATE THESE TRANSACTIONS OR MANAGE THE RESULTS OF THESE TRANSACTIONS COULD ADVERSELY AFFECT OUR OPERATIONS AND FINANCIAL RESULTS.
We face risks associated with property acquisitions.
We have acquired in the past and intend to continue to pursue the acquisition of properties and portfolios of properties, including, but not limited to, large portfolios that could increase our size and result in alterations to our capital structure. Our acquisition activities and their success are subject to the following risks:
• | even if we enter into an acquisition agreement for a property, we may be unable to complete that acquisition after making a non-refundable deposit and incurring certain other acquisition-related costs; |
• | we may be unable to obtain or assume financing for acquisitions on favorable terms or at all; |
• | acquired properties may fail to perform as expected; |
• | the actual costs of repositioning, redeveloping or maintaining acquired properties may be greater than our estimates and may require significantly greater time and attention of management than anticipated; |
• | the acquisition agreement will likely contain conditions to closing, including completion of due diligence investigations to our satisfaction or other conditions that are not within our control, which may not be satisfied; |
• | acquired properties may be located in new markets where we may face risks associated with a lack of market knowledge or understanding of the local economy, lack of business relationships in the area, costs associated with opening a new regional office and unfamiliarity with local governmental and permitting procedures; |
• | we may acquire real estate through the acquisition of the ownership entity subjecting us to the risks of that entity and we may be exposed to the liabilities of properties or companies acquired, some of which we may not be aware of at the time of acquisition; and |
15
• | we may be unable to quickly and efficiently integrate new acquisitions, particularly acquisitions of portfolios of properties, into our existing operations, and this could have an adverse effect on our results of operations and financial condition. |
Any delay or failure on our part to identify, negotiate, finance and consummate such acquisitions in a timely manner and on favorable terms, or operate acquired properties to meet our financial expectations, could impede our growth and have an adverse effect on us, including our financial condition, results of operations, cash flow and the market value of our securities.
We are exposed to risks associated with property redevelopment and repositioning that could adversely affect us, including our financial condition and results of operations.
We continue to engage in redevelopment and repositioning activities with respect to our properties, and, accordingly, we are subject to certain risks, which could adversely affect us, including our financial condition and results of operations. These risks include, without limitation, (i) the availability and pricing of financing on favorable terms or at all; (ii) the availability and timely receipt of zoning and other regulatory approvals; (iii) the potential for the fluctuation of occupancy rates and rents at redeveloped properties, which may result in our investment not being profitable; (iv) start up, repositioning and redevelopment costs may be higher than anticipated; (v) cost overruns and untimely completion of construction (including risks beyond our control, such as weather or labor conditions, or material shortages); (vi) the potential that we may fail to recover expenses already incurred if we abandon development or redevelopment opportunities after we begin to explore them; (vii) the potential that we may expend funds on and devote management time to projects which we do not complete; (viii) the inability to complete leasing of a property on schedule or at all, resulting in an increase in construction or redevelopment costs; and (ix) the possibility that properties will be leased at below expected rental rates. These risks could result in substantial unanticipated delays or expenses and could prevent the initiation or the completion of redevelopment activities, any of which could have an adverse effect on our financial condition, results of operations, cash flow, the market value of our common shares and ability to satisfy our principal and interest obligations and to make distributions to our shareholders.
From time to time we have made, and in the future we may seek to make one or more material acquisitions. The announcement of such a material acquisition may result in a rapid and significant decline in the price of our securities.
We are continuously looking at material transactions that we believe will maximize shareholder value. However, an announcement by us of one or more significant acquisitions could result in a quick and significant decline in the price of our securities.
It may be difficult to sell real estate quickly, which may limit our flexibility.
Real estate investments are relatively illiquid. Consequently, we may have limited ability to dispose of assets in our portfolio promptly in response to changes in economic or other conditions which could have an adverse effect on our sources of working capital and our ability to satisfy our debt obligations.
We may not be permitted to dispose of certain properties or pay down the debt associated with those properties when we might otherwise desire to do so without incurring additional costs. In addition, when we dispose of or sell assets, we may not be able to reinvest the sales proceeds and earn similar returns.
As part of an acquisition of a property, or a portfolio of properties, we may agree, and in the past have agreed, not to dispose of the acquired properties or reduce the mortgage indebtedness for a long-term period, unless we pay certain of the resulting tax costs of the seller. These agreements could result in us holding on to properties that we would otherwise sell and not pay down or refinance. In addition, when we dispose of or sell assets, we may not be able to reinvest the sales proceeds and earn returns similar to those generated by the assets that were sold.
From time to time we have made, and in the future we may seek to make investments in companies over which we do not have sole control. Some of these companies operate in industries with different risks than investing and operating real estate.
From time to time we have made, and in the future we may seek to make, investments in companies that we may not control, including, but not limited to, Alexander’s, our Fifth Avenue and Times Square JV, and other equity and loan investments. Although these businesses generally have a significant real estate component, some of them operate in businesses that are different from investing and operating real estate. Consequently, we are subject to operating and financial risks of those industries and to the risks associated with lack of control, such as having differing objectives than our partners or the entities in which we invest, or becoming involved in disputes, or competing directly or indirectly with these partners or entities. In addition, we rely on the internal controls and financial reporting controls of these entities and their failure to maintain effectiveness or comply with applicable standards may adversely affect us.
16
We are subject to risks involved in real estate activity through joint ventures and private equity real estate funds.
We currently own properties through joint ventures and private equity real estate funds with other persons and entities and may in the future acquire or own properties through joint ventures and funds when we believe circumstances warrant the use of such structures. Joint venture and fund investments involve risk, including: the possibility that our partners might refuse to make capital contributions when due and therefore we may be forced to make contributions to maintain the value of the property; that we may be responsible to our partners for indemnifiable losses; that our partners might at any time have business or economic goals that are inconsistent with ours; and that our partners may be in a position to take action or withhold consent contrary to our recommendations, instructions or requests. We and our respective joint venture partners may each have the right to trigger a buy-sell, put right or forced sale arrangement, which could cause us to sell our interest, or acquire our partner’s interest, or to sell the underlying asset, at a time when we otherwise would not have initiated such a transaction, without our consent or on unfavorable terms. In some instances, joint venture and fund partners may have competing interests in our markets that could create conflicts of interest. These conflicts may include compliance with the REIT requirements, and our REIT status could be jeopardized if any of our joint ventures or funds do not operate in compliance with REIT requirements. To the extent our partners do not meet their obligations to us or our joint ventures or funds, or they take action inconsistent with the interests of the joint venture or fund, we may be adversely affected.
OUR ORGANIZATIONAL AND FINANCIAL STRUCTURE GIVES RISE TO OPERATIONAL AND FINANCIAL RISKS.
We may not be able to obtain capital to make investments.
We depend primarily on external financing to fund the growth of our business. This is because one of the requirements of the Internal Revenue Code of 1986, as amended, for a REIT is that it distributes 90% of its taxable income, excluding net capital gains, to its shareholders. This, in turn, requires the Operating Partnership to make distributions to its unitholders. There is a separate requirement to distribute net capital gains or pay a corporate level tax in lieu thereof. Our access to debt or equity financing depends on the willingness of third parties to lend or make equity investments and on conditions in the capital markets generally. Although we believe that we will be able to finance any investments we may wish to make in the foreseeable future, there can be no assurance that new financing will be available or available on acceptable terms. For information about our available sources of funds, see “Management’s Discussion and Analysis of Financial Condition and Results of Operations — Liquidity and Capital Resources” and the notes to the consolidated financial statements in this Annual Report on Form 10-K.
We depend on dividends and distributions from our direct and indirect subsidiaries. The creditors and preferred equity holders of these subsidiaries are entitled to amounts payable to them by the subsidiaries before the subsidiaries may pay any dividends or distributions to us.
Substantially all of Vornado’s assets are held through its Operating Partnership that holds substantially all of its properties and assets through subsidiaries. The Operating Partnership’s cash flow is dependent on cash distributions to it by its subsidiaries, and in turn, substantially all of Vornado’s cash flow is dependent on cash distributions to it by the Operating Partnership. The creditors of each of Vornado’s direct and indirect subsidiaries are entitled to payment of that subsidiary’s obligations to them, when due and payable, before distributions may be made by that subsidiary to its equity holders. Thus, the Operating Partnership’s ability to make distributions to its equity holders depends on its subsidiaries’ ability first to satisfy their obligations to their creditors and then to make distributions to the Operating Partnership. Likewise, Vornado’s ability to pay dividends to its holders of common and preferred shares depends on the Operating Partnership’s ability first to satisfy its obligations to its creditors and make distributions to holders of its preferred units and then to make distributions to Vornado.
Furthermore, the holders of preferred units of the Operating Partnership are entitled to receive preferred distributions before payment of distributions to the Operating Partnership’s equity holders, including Vornado. Thus, Vornado’s ability to pay cash dividends to its equity holders and satisfy its debt obligations depends on the Operating Partnership’s ability first to satisfy its obligations to its creditors and make distributions to holders of its preferred units and then to its equity holders, including Vornado. As of December 31, 2019, there were four series of preferred units of the Operating Partnership not held by Vornado with a total liquidation value of $55,075,000.
In addition, Vornado’s participation in any distribution of the assets of any of its direct or indirect subsidiaries upon the liquidation, reorganization or insolvency, is only after the claims of the creditors, including trade creditors and preferred equity holders, are satisfied.
We have a substantial amount of indebtedness that could affect our future operations.
As of December 31, 2019, our consolidated mortgages and unsecured indebtedness, excluding related premium, discount and deferred financing costs, net, totaled $7.4 billion. We are subject to the risks normally associated with debt financing, including the risk that our cash flow from operations will be insufficient to meet our required debt service. Our debt service costs generally will not be reduced if developments in the market or at our properties, such as the entry of new competitors or the loss of major tenants, cause a reduction in the income from our properties. Should such events occur, our operations may be adversely affected. If a property is mortgaged to secure payment of indebtedness and income from such property is insufficient to pay that indebtedness, the property could be foreclosed upon by the mortgagee resulting in a loss of income and a decline in our total asset value.
17
We have outstanding debt, and the amount of debt and its cost may increase and refinancing may not be available on acceptable terms.
We rely on both secured and unsecured, variable rate and non-variable rate debt to finance acquisitions and development activities and for working capital. If we are unable to obtain debt financing or refinance existing indebtedness upon maturity, our financial condition and results of operations would likely be adversely affected. In addition, the cost of our existing debt may increase, especially in the case of a rising interest rate environment, and we may not be able to refinance our existing debt in sufficient amounts or on acceptable terms. If the cost or amount of our indebtedness increases or we cannot refinance our debt in sufficient amounts or on acceptable terms, we are at risk of credit ratings downgrades and default on our obligations that could adversely affect our financial condition and results of operations.
Covenants in our debt instruments could adversely affect our financial condition and our acquisitions and development activities.
The mortgages on our properties contain customary covenants such as those that limit our ability, without the prior consent of the applicable lender, to further mortgage the applicable property or to discontinue insurance coverage. Our unsecured indebtedness and debt that we may obtain in the future may contain customary restrictions, requirements and other limitations on our ability to incur indebtedness, including covenants that limit our ability to incur debt based upon the level of our ratio of total debt to total assets, our ratio of secured debt to total assets, our ratio of EBITDA to interest expense, and fixed charges, and that require us to maintain a certain ratio of unencumbered assets to unsecured debt. Our ability to borrow is subject to compliance with these and other covenants. In addition, failure to comply with our covenants could cause a default under the applicable debt instrument, and we may then be required to repay such debt with capital from such other sources or give possession of a secured property to the lender. Under those circumstances, other sources of capital may not be available to us or may be available only on unattractive terms.
A downgrade in our credit ratings could materially and adversely affect our business and financial condition.
Our credit rating and the credit ratings assigned to our debt securities and our preferred shares could change based upon, among other things, our results of operations and financial condition. These ratings are subject to ongoing evaluation by credit rating agencies, and any rating could be changed or withdrawn by a rating agency in the future if, in its judgment, circumstances warrant such action. Moreover, these credit ratings are not recommendations to buy, sell or hold our common shares or any other securities. If any of the credit rating agencies that have rated our securities downgrades or lowers its credit rating, or if any credit rating agency indicates that it has placed any such rating on a “watch list” for a possible downgrading or lowering, or otherwise indicates that its outlook for that rating is negative, such action could have a material adverse effect on our costs and availability of funding, which could in turn have a material adverse effect on our financial condition, results of operations, cash flows, the trading/redemption price of our securities, and our ability to satisfy our debt service obligations and to pay dividends and distributions to our equity holders.
Vornado may fail to qualify or remain qualified as a REIT and may be required to pay federal income taxes at corporate rates.
Although we believe that Vornado will remain organized and will continue to operate so as to qualify as a REIT for federal income tax purposes, Vornado may fail to remain so qualified. Qualifications are governed by highly technical and complex provisions of the Internal Revenue Code for which there are only limited judicial or administrative interpretations and depend on various facts and circumstances that are not entirely within our control. In addition, legislation, new regulations, administrative interpretations or court decisions may significantly change the relevant tax laws and/or the federal income tax consequences of qualifying as a REIT. If, with respect to any taxable year, Vornado fails to maintain its qualification as a REIT and does not qualify under statutory relief provisions, Vornado could not deduct distributions to shareholders in computing our taxable income and would have to pay federal income tax on its taxable income at regular corporate rates. The federal income tax payable would include any applicable alternative minimum tax. If Vornado had to pay federal income tax, the amount of money available to distribute to equity holders and pay its indebtedness would be reduced for the year or years involved, and Vornado would not be required to make distributions to shareholders in that taxable year and in future years until it was able to qualify as a REIT and did so. In addition, Vornado would also be disqualified from treatment as a REIT for the four taxable years following the year during which qualification was lost, unless Vornado were entitled to relief under the relevant statutory provisions.
We may face possible adverse federal tax audits and changes in federal tax laws, which may result in an increase in our tax liability.
In the normal course of business, certain entities through which we own real estate either have undergone or may undergo tax audits. Although we believe that we have substantial arguments in favor of our positions, in some instances there is no controlling precedent or interpretive guidance. There can be no assurance that audits will not occur with increased frequency or that the ultimate result of such audits will not have a material adverse effect on our results of operations.
At any time, the U.S. federal income tax laws governing REITs or the administrative interpretations of those laws may be amended, including with respect to our hotel ownership structure. We cannot predict if or when any new U.S. federal income tax law, regulation, or administrative interpretation, or any amendment to any existing U.S. federal income tax law, Treasury regulation or administrative interpretation, will be adopted, promulgated or become effective and any such law, regulation, or interpretation may take effect retroactively. Vornado, its taxable REIT subsidiaries, and our securityholders could be adversely affected by any such change in, or any new, U.S. federal income tax law, Treasury regulation or administrative interpretation.
18
We may face possible adverse state and local tax audits and changes in state and local tax law.
Because Vornado is organized and qualifies as a REIT, it is generally not subject to federal income taxes, but we are subject to certain state and local taxes. In the normal course of business, certain entities through which we own real estate either have undergone, or are currently undergoing, tax audits. Although we believe that we have substantial arguments in favor of our positions in the ongoing audits, in some instances there is no controlling precedent or interpretive guidance on the specific point at issue. There can be no assurance that audits will not occur with increased frequency or that the ultimate result of such audits will not have a material adverse effect on our results of operations.
From time to time changes in state and local tax laws or regulations are enacted, which may result in an increase in our tax liability. A shortfall in tax revenues for states and municipalities in which we operate may lead to an increase in the frequency and size of such changes. If such changes occur, we may be required to pay additional taxes on our assets or income. These increased tax costs could adversely affect our financial condition and results of operations and the amount of cash available for the payment of dividends and distributions to our security holders.
Loss of our key personnel could harm our operations and adversely affect the value of our common shares and Operating Partnership Class A units.
We are dependent on the efforts of Steven Roth, the Chairman of the Board of Trustees and Chief Executive Officer of Vornado. While we believe that we could find a replacement for him and other key personnel, the loss of their services could harm our operations and adversely affect the value of our securities.
VORNADO’S CHARTER DOCUMENTS AND APPLICABLE LAW MAY HINDER ANY ATTEMPT TO ACQUIRE US.
Vornado’s Amended and Restated Declaration of Trust (the “declaration of trust”) sets limits on the ownership of its shares.
Generally, for Vornado to maintain its qualification as a REIT under the Internal Revenue Code, not more than 50% in value of the outstanding shares of beneficial interest of Vornado may be owned, directly or indirectly, by five or fewer individuals at any time during the last half of Vornado’s taxable year. The Internal Revenue Code defines “individuals” for purposes of the requirement described in the preceding sentence to include some types of entities. Under Vornado’s declaration of trust, as amended, no person may own more than 6.7% of the outstanding common shares of any class, or 9.9% of the outstanding preferred shares of any class, with some exceptions for persons who held common shares in excess of the 6.7% limit before Vornado adopted the limit and other persons approved by Vornado’s Board of Trustees. In addition, our declaration of trust includes restrictions on ownership of our common shares and preferred shares to preserve our status as a "domestically controlled qualified investment entity" within the meaning of Section 897 (h)(4)(B) of the Internal Revenue Code of 1986, as amended. These restrictions on transferability and ownership may delay, deter or prevent a change in control of Vornado or other transaction that might involve a premium price or otherwise be in the best interest of equity holders.
The Maryland General Corporation Law (the “MGCL”) contains provisions that may reduce the likelihood of certain takeover transactions.
The MGCL imposes conditions and restrictions on certain “business combinations” (including, among other transactions, a merger, consolidation, share exchange, or, in certain circumstances, an asset transfer or issuance of equity securities) between a Maryland REIT and certain persons who beneficially own at least 10% of the corporation’s stock (an “interested shareholder”). Unless approved in advance by the board of trustees of the trust, or otherwise exempted by the statute, such a business combination is prohibited for a period of five years after the most recent date on which the interested shareholder became an interested shareholder. After such five-year period, a business combination with an interested shareholder must be: (a) recommended by the board of trustees of the trust, and (b) approved by the affirmative vote of at least (i) 80% of the trust’s outstanding shares entitled to vote and (ii) two-thirds of the trust’s outstanding shares entitled to vote which are not held by the interested shareholder with whom the business combination is to be effected, unless, among other things, the trust’s common shareholders receive a “fair price” (as defined by the statute) for their shares and the consideration is received in cash or in the same form as previously paid by the interested shareholder for his or her shares.
In approving a transaction, Vornado’s Board of Trustees may provide that its approval is subject to compliance, at or after the time of approval, with any terms and conditions determined by the Board of Trustees. Vornado’s Board of Trustees has adopted a resolution exempting any business combination between Vornado and any trustee or officer of Vornado or its affiliates. As a result, any trustee or officer of Vornado or its affiliates may be able to enter into business combinations with Vornado that may not be in the best interest of our equity holders. With respect to business combinations with other persons, the business combination provisions of the MGCL may have the effect of delaying, deferring or preventing a change in control of Vornado or other transaction that might involve a premium price or otherwise be in the best interest of our equity holders. The business combination statute may discourage others from trying to acquire control of Vornado and increase the difficulty of consummating any offer.
Title 3, Subtitle 8 of the MGCL permits our Board of Trustees, without shareholder approval and regardless of what is currently provided in our declaration of trust or bylaws, to implement certain takeover defenses, including adopting a classified board or increasing the vote required to remove a trustee. Such takeover defenses may have the effect of inhibiting a third party from making an acquisition proposal for us or of delaying, deferring or preventing a change in control of us under the circumstances that otherwise could provide our common shareholders with the opportunity to realize a premium over the then current market price.
19
Vornado may issue additional shares in a manner that could adversely affect the likelihood of certain takeover transactions.
Vornado’s declaration of trust authorizes the Board of Trustees to:
• | cause Vornado to issue additional authorized but unissued common shares or preferred shares; |
• | classify or reclassify, in one or more series, any unissued preferred shares; |
• | set the preferences, rights and other terms of any classified or reclassified shares that Vornado issues; and |
• | increase, without shareholder approval, the number of shares of beneficial interest that Vornado may issue. |
Vornado’s Board of Trustees could establish a series of preferred shares whose terms could delay, deter or prevent a change in control of Vornado, and therefore of the Operating Partnership, or other transaction that might involve a premium price or otherwise be in the best interest of our equity holders, although Vornado’s Board of Trustees does not now intend to establish a series of preferred shares of this kind. Vornado’s declaration of trust and bylaws contain other provisions that may delay, deter or prevent a change in control of Vornado or other transaction that might involve a premium price or otherwise be in the best interest of our equity holders.
We may change our policies without obtaining the approval of our equity holders.
Our operating and financial policies, including our policies with respect to acquisitions of real estate or other companies, growth, operations, indebtedness, capitalization, dividends and distributions, are exclusively determined by Vornado’s Board of Trustees. Accordingly, our equity holders do not control these policies.
OUR OWNERSHIP STRUCTURE AND RELATED-PARTY TRANSACTIONS MAY GIVE RISE TO CONFLICTS OF INTEREST.
Steven Roth and Interstate Properties may exercise substantial influence over us. They and some of Vornado’s other trustees and officers have interests or positions in other entities that may compete with us.
As of December 31, 2019, Interstate Properties, a New Jersey general partnership, and its partners beneficially owned an aggregate of approximately 7.1% of the common shares of beneficial interest of Vornado and 26.1% of the common stock of Alexander’s, which is described below. Steven Roth, David Mandelbaum and Russell B. Wight, Jr. are the three partners of Interstate Properties. Mr. Roth is the Chairman of the Board of Trustees and Chief Executive Officer of Vornado, the managing general partner of Interstate Properties, and the Chairman of the Board of Directors and Chief Executive Officer of Alexander’s. Messrs. Wight and Mandelbaum are Trustees of Vornado and Directors of Alexander’s.
Because of these overlapping interests, Mr. Roth and Interstate Properties and its partners may have substantial influence over Vornado, and therefore over the Operating Partnership. In addition, certain decisions concerning our operations or financial structure may present conflicts of interest among Messrs. Roth, Mandelbaum and Wight and Interstate Properties and our other equity holders. In addition, Mr. Roth, Interstate Properties and its partners, and Alexander’s currently and may in the future engage in a wide variety of activities in the real estate business which may result in conflicts of interest with respect to matters affecting us, such as which of these entities or persons, if any, may take advantage of potential business opportunities, the business focus of these entities, the types of properties and geographic locations in which these entities make investments, potential competition between business activities conducted, or sought to be conducted, competition for properties and tenants, possible corporate transactions such as acquisitions and other strategic decisions affecting the future of these entities.
We manage and lease the real estate assets of Interstate Properties under a management agreement for which we receive an annual fee equal to 4% of annual base rent and percentage rent. See Note 23 – Related Party Transactions to our consolidated financial statements in this Annual Report on Form 10-K for additional information.
There may be conflicts of interest between Alexander’s and us.
As of December 31, 2019, we owned 32.4% of the outstanding common stock of Alexander’s. Alexander’s is a REIT that has seven properties, which are located in the greater New York metropolitan area. In addition to the 2.3% that they indirectly own through Vornado, Interstate Properties, which is described above, and its partners owned 26.1% of the outstanding common stock of Alexander’s as of December 31, 2019. Mr. Roth is the Chairman of the Board of Trustees and Chief Executive Officer of Vornado, the managing general partner of Interstate Properties, and the Chairman of the Board of Directors and Chief Executive Officer of Alexander’s. Messrs. Wight and Mandelbaum are Trustees of Vornado and Directors of Alexander’s and general partners of Interstate Properties. Dr. Richard West is a Trustee of Vornado and a Director of Alexander’s. In addition, Joseph Macnow, our Executive Vice President – Chief Financial Officer and Chief Administrative Officer, is the Treasurer of Alexander’s and Matthew Iocco, our Executive Vice President – Chief Accounting Officer, is the Chief Financial Officer of Alexander’s.
We manage, develop and lease Alexander’s properties under management, development and leasing agreements under which we receive annual fees from Alexander’s. These agreements are described in Note 6 - Investments in Partially Owned Entities to our consolidated financial statements in this Annual Report on Form 10-K.
20
THE NUMBER OF SHARES OF VORNADO REALTY TRUST AND THE MARKET FOR THOSE SHARES GIVE RISE TO VARIOUS RISKS.
The trading price of Vornado’s common shares has been volatile and may continue to fluctuate.
The trading price of Vornado’s common shares has been volatile and may continue to fluctuate widely as a result of several factors, many of which are outside our control. In addition, the stock market is subject to fluctuations in the share prices and trading volumes that affect the market prices of the shares of many companies. These broad market fluctuations have in the past and may in the future adversely affect the market price of Vornado’s common shares and the redemption price of the Operating Partnership’s Class A units. Among those factors are:
• | our financial condition and performance; |
• | the financial condition of our tenants, including the extent of tenant bankruptcies or defaults; |
• | actual or anticipated quarterly fluctuations in our operating results and financial condition; |
• | our dividend policy; |
• | the reputation of REITs and real estate investments generally and the attractiveness of REIT equity securities in comparison to other equity securities, including securities issued by other real estate companies, and fixed income securities; |
• | uncertainty and volatility in the equity and credit markets; |
• | fluctuations in interest rates; |
• | changes in revenue or earnings estimates or publication of research reports and recommendations by financial analysts or actions taken by rating agencies with respect to our securities or those of other REITs; |
• | failure to meet analysts’ revenue or earnings estimates; |
• | speculation in the press or investment community; |
• | strategic actions by us or our competitors, such as acquisitions or restructurings; |
• | the extent of institutional investor interest in us; |
• | the extent of short-selling of Vornado common shares and the shares of our competitors; |
• | fluctuations in the stock price and operating results of our competitors; |
• | general financial and economic market conditions and, in particular, developments related to market conditions for REITs and other real estate related companies; |
• | domestic and international economic factors unrelated to our performance; |
• | changes in tax laws and rules; and |
• | all other risk factors addressed elsewhere in this Annual Report on Form 10-K. |
A significant decline in Vornado’s stock price could result in substantial losses for our equity holders.
Vornado has many shares available for future sale, which could hurt the market price of its shares and the redemption price of the Operating Partnership’s units.
The interests of equity holders could be diluted if we issue additional equity securities. As of December 31, 2019, Vornado had authorized but unissued, 59,014,323 common shares of beneficial interest, $.04 par value and 70,384,360 preferred shares of beneficial interest, no par value; of which 21,960,441 common shares are reserved for issuance upon redemption of Class A Operating Partnership units, convertible securities and employee stock options and 11,200,000 preferred shares are reserved for issuance upon redemption of preferred Operating Partnership units. Any shares not reserved may be issued from time to time in public or private offerings or in connection with acquisitions. In addition, common and preferred shares reserved may be sold upon issuance in the public market after registration under the Securities Act or under Rule 144 under the Securities Act or other available exemptions from registration. We cannot predict the effect that future sales of Vornado’s common and preferred shares or Operating Partnership Class A and preferred units will have on the market prices of our securities.
In addition, under Maryland law, Vornado’s Board of Trustees has the authority to increase the number of authorized shares without shareholder approval.
ITEM 1B. | UNRESOLVED STAFF COMMENTS |
There are no unresolved comments from the staff of the Securities and Exchange Commission as of the date of this Annual Report on Form 10-K.
21
ITEM 2. PROPERTIES
We operate in two reportable segments: New York and Other. The following pages provide details of our real estate properties as of December 31, 2019.
Square Feet | |||||||||||||||||
NEW YORK SEGMENT Property | % Ownership | Type | % Occupancy | In Service | Under Development or Not Available for Lease | Total Property | |||||||||||
PENN1 (ground leased through 2098)(1) | 100.0 | % | Office / Retail | 90.4 | % | 2,206,000 | 339,000 | 2,545,000 | |||||||||
1290 Avenue of the Americas | 70.0 | % | Office / Retail | 98.5 | % | 2,117,000 | — | 2,117,000 | |||||||||
PENN2 | 100.0 | % | Office / Retail | 100.0 | % | 1,232,000 | 383,000 | 1,615,000 | |||||||||
909 Third Avenue (ground leased through 2063)(1) | 100.0 | % | Office | 98.6 | % | 1,352,000 | — | 1,352,000 | |||||||||
Independence Plaza, Tribeca (1,327 units)(2) | 50.1 | % | Retail / Residential | 100.0 | % | (3) | 1,241,000 | 16,000 | 1,257,000 | ||||||||
280 Park Avenue(2) | 50.0 | % | Office / Retail | 97.4 | % | 1,262,000 | — | 1,262,000 | |||||||||
770 Broadway | 100.0 | % | Office / Retail | 99.3 | % | 1,182,000 | — | 1,182,000 | |||||||||
PENN11 | 100.0 | % | Office / Retail | 99.8 | % | 1,153,000 | — | 1,153,000 | |||||||||
90 Park Avenue | 100.0 | % | Office / Retail | 98.8 | % | 956,000 | — | 956,000 | |||||||||
One Park Avenue(2) | 55.0 | % | Office / Retail | 100.0 | % | 943,000 | — | 943,000 | |||||||||
888 Seventh Avenue (ground leased through 2067)(1) | 100.0 | % | Office / Retail | 92.7 | % | 885,000 | — | 885,000 | |||||||||
100 West 33rd Street | 100.0 | % | Office | 100.0 | % | 859,000 | — | 859,000 | |||||||||
Farley Office and Retail Building (ground and building leased through 2116)(1) | 95.0 | % | Office / Retail | (4 | ) | — | 844,000 | 844,000 | |||||||||
330 West 34th Street (65.2% ground leased through 2149)(1) | 100.0 | % | Office / Retail | 98.6 | % | 724,000 | — | 724,000 | |||||||||
85 Tenth Avenue(2) | 49.9 | % | Office / Retail | 100.0 | % | 627,000 | — | 627,000 | |||||||||
650 Madison Avenue(2) | 20.1 | % | Office / Retail | 98.0 | % | 601,000 | — | 601,000 | |||||||||
350 Park Avenue | 100.0 | % | Office / Retail | 97.8 | % | 571,000 | — | 571,000 | |||||||||
150 East 58th Street(5) | 100.0 | % | Office / Retail | 98.5 | % | 543,000 | — | 543,000 | |||||||||
7 West 34th Street(2) | 53.0 | % | Office / Retail | 100.0 | % | 477,000 | — | 477,000 | |||||||||
33-00 Northern Boulevard (Center Building) | 100.0 | % | Office | 95.5 | % | 471,000 | — | 471,000 | |||||||||
595 Madison Avenue | 100.0 | % | Office / Retail | 89.8 | % | 329,000 | — | 329,000 | |||||||||
640 Fifth Avenue(2) | 52.0 | % | Office / Retail | 96.2 | % | 315,000 | — | 315,000 | |||||||||
50-70 W 93rd Street (325 units)(2) | 49.9 | % | Residential | 96.6 | % | 283,000 | — | 283,000 | |||||||||
Manhattan Mall | 100.0 | % | Retail | 99.0 | % | 256,000 | — | 256,000 | |||||||||
40 Fulton Street | 100.0 | % | Office / Retail | 79.9 | % | 251,000 | — | 251,000 | |||||||||
4 Union Square South | 100.0 | % | Retail | 91.3 | % | 206,000 | — | 206,000 | |||||||||
260 Eleventh Avenue (ground leased through 2114)(1) | 100.0 | % | Office | 100.0 | % | 184,000 | — | 184,000 | |||||||||
512 W 22nd Street(2) | 55.0 | % | Office | 100.0 | % | 20,000 | 153,000 | 173,000 | |||||||||
825 Seventh Avenue | 51.2 | % | Office (2) / Retail | (4 | ) | — | 169,000 | 169,000 | |||||||||
61 Ninth Avenue (ground leased through 2115)(1)(2) | 45.1 | % | Office / Retail | 100.0 | % | 166,000 | — | 166,000 | |||||||||
1540 Broadway(2) | 52.0 | % | Retail | 100.0 | % | 161,000 | — | 161,000 | |||||||||
608 Fifth Avenue (ground leased through 2033)(1)(6) | 100.0 | % | Office / Retail | 92.4 | % | 93,000 | 44,000 | 137,000 | |||||||||
Paramus | 100.0 | % | Office | 87.2 | % | 129,000 | — | 129,000 | |||||||||
666 Fifth Avenue (2)(7) | 52.0 | % | Retail | 100.0 | % | 114,000 | — | 114,000 | |||||||||
1535 Broadway(2) | 52.0 | % | Retail / Theatre | 98.2 | % | 107,000 | — | 107,000 | |||||||||
57th Street (2 buildings)(2) | 50.0 | % | Office / Retail | 70.0 | % | 103,000 | — | 103,000 | |||||||||
689 Fifth Avenue(2) | 52.0 | % | Office / Retail | 85.3 | % | 98,000 | — | 98,000 | |||||||||
478-486 Broadway (2 buildings) (10 units) | 100.0 | % | Retail / Residential | 100.0 | % | (3) | 35,000 | 50,000 | 85,000 | ||||||||
150 West 34th Street | 100.0 | % | Retail | 100.0 | % | 78,000 | — | 78,000 | |||||||||
510 Fifth Avenue | 100.0 | % | Retail | 100.0 | % | 66,000 | — | 66,000 | |||||||||
655 Fifth Avenue(2) | 50.0 | % | Retail | 100.0 | % | 57,000 | — | 57,000 | |||||||||
155 Spring Street | 100.0 | % | Retail | 97.3 | % | 50,000 | — | 50,000 | |||||||||
435 Seventh Avenue | 100.0 | % | Retail | 100.0 | % | 43,000 | — | 43,000 | |||||||||
________________________________________
See notes on page 24.
22
ITEM 2. PROPERTIES – CONTINUED
Square Feet | ||||||||||||||||||
NEW YORK SEGMENT – CONTINUED Property | % Ownership | Type | % Occupancy | In Service | Under Development or Not Available for Lease | Total Property | ||||||||||||
692 Broadway | 100.0 | % | Retail | 100.0 | % | 36,000 | — | 36,000 | ||||||||||
606 Broadway | 50.0 | % | Office / Retail | 100.0 | % | 36,000 | — | 36,000 | ||||||||||
697-703 Fifth Avenue(2) | 44.8 | % | Retail | 100.0 | % | 26,000 | — | 26,000 | ||||||||||
715 Lexington Avenue | 100.0 | % | Retail | 100.0 | % | 16,000 | 6,000 | 22,000 | ||||||||||
1131 Third Avenue | 100.0 | % | Retail | 100.0 | % | 23,000 | — | 23,000 | ||||||||||
759-771 Madison Avenue (40 East 66th Street (5 units)) | 100.0 | % | Retail / Residential | 66.7 | % | (3) | 26,000 | — | 26,000 | |||||||||
131-135 West 33rd Street | 100.0 | % | Retail | 100.0 | % | 23,000 | — | 23,000 | ||||||||||
828-850 Madison Avenue | 100.0 | % | Retail | 42.4 | % | 14,000 | 4,000 | 18,000 | ||||||||||
443 Broadway | 100.0 | % | Retail | 100.0 | % | 16,000 | — | 16,000 | ||||||||||
334 Canal Street (4 units) | 100.0 | % | Retail / Residential | — | % | (3) | 15,000 | — | 15,000 | |||||||||
537 West 26th Street | 100.0 | % | Retail | — | % | 14,000 | — | 14,000 | ||||||||||
304 Canal Street (4 units) | 100.0 | % | Retail / Residential | — | % | (3) | 13,000 | — | 13,000 | |||||||||
677-679 Madison Avenue (8 units) | 100.0 | % | Retail / Residential | 100.0 | % | (3) | 13,000 | — | 13,000 | |||||||||
431 Seventh Avenue | 100.0 | % | Retail | 100.0 | % | 10,000 | — | 10,000 | ||||||||||
138-142 West 32nd Street | 100.0 | % | Retail | 100.0 | % | 8,000 | — | 8,000 | ||||||||||
148 Spring Street | 100.0 | % | Retail | 100.0 | % | 8,000 | — | 8,000 | ||||||||||
339 Greenwich Street | 100.0 | % | Retail | 100.0 | % | 8,000 | — | 8,000 | ||||||||||
150 Spring Street (1 unit) | 100.0 | % | Retail / Residential | 100.0 | % | (3) | 7,000 | — | 7,000 | |||||||||
966 Third Avenue | 100.0 | % | Retail | 100.0 | % | 7,000 | — | 7,000 | ||||||||||
968 Third Avenue(2) | 50.0 | % | Retail | 100.0 | % | 7,000 | — | 7,000 | ||||||||||
488 Eighth Avenue | 100.0 | % | Retail | 100.0 | % | 6,000 | — | 6,000 | ||||||||||
137 West 33rd Street | 100.0 | % | Retail | 100.0 | % | 3,000 | — | 3,000 | ||||||||||
57th Street (3 properties)(2) | 50.0 | % | Land | (4 | ) | — | — | — | ||||||||||
Eighth Avenue and 34th Street (4 properties) | 100.0 | % | Land | (4 | ) | — | — | — | ||||||||||
Other (3 buildings) | 100.0 | % | Retail | 70.0 | % | 15,000 | — | 15,000 | ||||||||||
Hotel Pennsylvania | 100.0 | % | Hotel | n/a | 1,400,000 | — | 1,400,000 | |||||||||||
Alexander's, Inc.: | ||||||||||||||||||
731 Lexington Avenue(2) | 32.4 | % | Office / Retail | 99.0 | % | 1,051,000 | 24,000 | 1,075,000 | ||||||||||
Rego Park II, Queens (6.6 acres)(2) | 32.4 | % | Retail | 91.5 | % | 609,000 | — | 609,000 | ||||||||||
Rego Park I, Queens (4.8 acres)(2) | 32.4 | % | Retail | 100.0 | % | 148,000 | 195,000 | 343,000 | ||||||||||
The Alexander Apartment Tower, Queens (312 units)(2) | 32.4 | % | Residential | 93.6 | % | 255,000 | — | 255,000 | ||||||||||
Flushing, Queens (1.0 acre ground leased through 2037)(1)(2) | 32.4 | % | Retail | 100.0 | % | 167,000 | — | 167,000 | ||||||||||
Paramus, New Jersey (30.3 acres ground leased to IKEA through 2041)(1)(2) | 32.4 | % | Retail | 100.0 | % | — | — | — | ||||||||||
Rego Park III (3.4 acres)(2) | 32.4 | % | — | (4 | ) | — | — | — | ||||||||||
Total New York Segment | 96.8 | % | 26,526,000 | 2,227,000 | 28,753,000 | |||||||||||||
Our Ownership Interest | 96.7 | % | 20,953,000 | 1,876,000 | 22,829,000 | |||||||||||||
________________________________________
See notes on page 24.
23
ITEM 2. PROPERTIES – CONTINUED
Square Feet | ||||||||||||||||||
OTHER SEGMENT Property | % Ownership | Type | % Occupancy | In Service | Under Development or Not Available for Lease | Total Property | ||||||||||||
theMART: | ||||||||||||||||||
theMART, Chicago | 100.0 | % | Office / Retail / Showroom | 94.6 | % | 3,674,000 | — | 3,674,000 | ||||||||||
Piers 92 and 94 (New York) (ground and building leased through 2110)(1) | 100.0 | % | — | — | % | 133,000 | 75,000 | 208,000 | ||||||||||
Other (2 properties)(2) | 50.0 | % | Retail | 100.0 | % | 19,000 | — | 19,000 | ||||||||||
Total theMART | 94.6 | % | 3,826,000 | 75,000 | 3,901,000 | |||||||||||||
Our Ownership Interest | 94.6 | % | 3,817,000 | 75,000 | 3,892,000 | |||||||||||||
555 California Street: | ||||||||||||||||||
555 California Street | 70.0 | % | Office / Retail | 99.7 | % | 1,506,000 | — | 1,506,000 | ||||||||||
315 Montgomery Street | 70.0 | % | Office / Retail | 100.0 | % | 235,000 | — | 235,000 | ||||||||||
345 Montgomery Street | 70.0 | % | Office / Retail | (4 | ) | — | 78,000 | 78,000 | ||||||||||
Total 555 California Street | 99.8 | % | 1,741,000 | 78,000 | 1,819,000 | |||||||||||||
Our Ownership Interest | 99.8 | % | 1,218,000 | 55,000 | 1,273,000 | |||||||||||||
Vornado Capital Partners Real Estate Fund ("Fund")(8) : | |||||||||||||||||
Crowne Plaza Times Square, NY (0.64 acres owned in fee; 0.18 acres ground leased through 2187 and 0.05 acres ground leased through 2035) (1)(9) | 75.3 | % | Office / Retail / Hotel | 99.9 | % | 246,000 | — | 246,000 | |||||||||
Lucida, 86th Street and Lexington Avenue, NY (ground leased through 2082)(1) (39 units) | 100.0 | % | Retail / Residential | 98.1 | % | (3) | 155,000 | — | 155,000 | ||||||||
1100 Lincoln Road, Miami, FL | 100.0 | % | Retail / Theatre | 86.5 | % | 130,000 | — | 130,000 | |||||||||
501 Broadway, NY | 100.0 | % | Retail | 100.0 | % | 9,000 | — | 9,000 | |||||||||
Total Real Estate Fund | 95.7 | % | 540,000 | — | 540,000 | ||||||||||||
Our Ownership Interest | 96.8 | % | 155,000 | — | 155,000 | ||||||||||||
Other: | |||||||||||||||||
Rosslyn Plaza (197 units)(2) | 46.2 | % | Office / Residential | 67.6 | % | (3) | 685,000 | 304,000 | 989,000 | ||||||||
Fashion Centre Mall(2) | 7.5 | % | Retail | 96.9 | % | 868,000 | — | 868,000 | |||||||||
Washington Tower(2) | 7.5 | % | Office | 75.0 | % | 170,000 | — | 170,000 | |||||||||
Wayne Towne Center, Wayne (ground leased through 2064)(1) | 100.0 | % | Retail | 100.0 | % | 682,000 | — | 682,000 | |||||||||
Annapolis (ground leased through 2042)(1) | 100.0 | % | Retail | 100.0 | % | 128,000 | — | 128,000 | |||||||||
Total Other | 89.9 | % | 2,533,000 | 304,000 | 2,837,000 | ||||||||||||
Our Ownership Interest | 92.7 | % | 1,198,000 | 140,000 | 1,338,000 | ||||||||||||
________________________________________
(1) | Term assumes all renewal options exercised, if applicable. |
(2) | Denotes property not consolidated in the accompanying consolidated financial statements and related financial data included in the Annual Report on Form 10-K. |
(3) | Excludes residential occupancy statistics. |
(4) | Properties under development or to be developed. |
(5) | Includes 962 Third Avenue (the Annex building to 150 East 58th Street) 50.0% ground leased through 2118(1). |
(6) | In August 2019, we delivered notice to the ground lessor that we will surrender the property in May 2020. |
(7) | 75,000 square feet is leased from 666 Fifth Avenue Office Condominium. |
(8) | We own a 25% interest in the Fund. The ownership percentage in this section represents the Fund's ownership in the underlying assets. |
(9) | We own a 32.9% economic interest through the Fund and the Crowne Plaza Joint Venture. |
24
NEW YORK
As of December 31, 2019, our New York segment consisted of 26.5 million square feet in 85 properties. The 26.5 million square feet is comprised of 19.1 million square feet of Manhattan office in 35 properties, 2.3 million square feet of Manhattan street retail in 70 properties, 1,991 units in 10 residential properties, the 1.4 million square foot Hotel Pennsylvania, and our 32.4% interest in Alexander’s, which owns seven properties in the greater New York metropolitan area. The New York segment also includes 10 garages totaling 1.7 million square feet (4,875 spaces) which are managed by, or leased to, third parties.
New York lease terms generally range from five to seven years for smaller tenants to as long as 20 years for major tenants, and may provide for extension options at market rates. Leases typically provide for periodic step‑ups in rent over the term of the lease and pass through to tenants their share of increases in real estate taxes and operating expenses over a base year. Electricity is provided to tenants on a sub-metered basis or included in rent based on surveys and adjusted for subsequent utility rate increases. Leases also typically provide for free rent and tenant improvement allowances for all or a portion of the tenant’s initial construction costs of its premises.
As of December 31, 2019, the occupancy rate for our New York segment was 96.7%.
Occupancy and weighted average annual rent per square foot (in service):
Office: | |||||||||||||||
Vornado's Ownership Interest | |||||||||||||||
As of December 31, | Total Property Square Feet | Square Feet | Occupancy Rate | Weighted Average Annual Escalated Rent Per Square Foot | |||||||||||
2019 | (1) | 19,070,000 | 16,195,000 | 96.9 | % | $ | 76.26 | ||||||||
2018 | 19,858,000 | 16,632,000 | 97.2 | % | 74.04 | ||||||||||
2017 | 20,256,000 | 16,982,000 | 97.1 | % | 71.09 | ||||||||||
2016 | 20,227,000 | 16,962,000 | 96.3 | % | 68.90 | ||||||||||
2015 | 19,918,000 | 16,734,000 | 97.1 | % | 66.42 | ||||||||||
Retail: | |||||||||||||||
Vornado's Ownership Interest | |||||||||||||||
As of December 31, | Total Property Square Feet | Square Feet | Occupancy Rate | Weighted Average Annual Escalated Rent Per Square Foot | |||||||||||
2019 | (1) | 2,300,000 | 1,842,000 | 94.5 | % | $ | 209.86 | ||||||||
2018 | 2,648,000 | 2,419,000 | 97.3 | % | 228.43 | ||||||||||
2017 | 2,720,000 | 2,471,000 | 96.9 | % | 217.17 | ||||||||||
2016 | 2,672,000 | 2,464,000 | 97.1 | % | 213.85 | ||||||||||
2015 | 2,596,000 | 2,396,000 | 96.1 | % | 202.72 | ||||||||||
Occupancy and average monthly rent per unit (in service):
Residential: | |||||||||||||||
Vornado's Ownership Interest | |||||||||||||||
As of December 31, | Number of Units | Number of Units | Occupancy Rate | Average Monthly Rent Per Unit | |||||||||||
2019 | 1,991 | 955 | 97.0 | % | $ | 3,889 | |||||||||
2018 | 1,999 | 963 | 96.6 | % | 3,803 | ||||||||||
2017 | 2,009 | 981 | 96.7 | % | 3,722 | ||||||||||
2016 | (2) | 2,004 | 977 | 95.7 | % | 3,576 | |||||||||
2015 | 1,711 | 886 | 95.0 | % | 3,495 | ||||||||||
________________________________________
(1) | Reflects the transfer of 45.4% of common equity in the properties contributed to the Fifth Avenue and Times Square JV on April 18, 2019. |
(2) | Includes The Alexander Apartment Tower (32.4% ownership) from the date of stabilization in the third quarter of 2016. |
25
NEW YORK – CONTINUED
Tenants accounting for 2% or more of revenues:
Tenant | Square Feet Leased | 2019 Revenues | Percentage of New York Total Revenues | Percentage of Total Revenues | |||||||||
IPG and affiliates | 924,000 | $ | 62,252,000 | 3.9 | % | 3.2 | % | ||||||
Facebook | 758,000 | 49,180,000 | 3.1 | % | 2.6 | % | |||||||
Macy's | 625,000 | 42,106,000 | 2.7 | % | 2.2 | % | |||||||
AXA Equitable Life Insurance | 481,000 | 42,492,000 | 2.7 | % | 2.2 | % | |||||||
Neuberger Berman Group LLC | 412,000 | 34,388,000 | 2.2 | % | 1.8 | % | |||||||
Ziff Brothers Investments, Inc. | 287,000 | 32,268,000 | 2.0 | % | 1.7 | % | |||||||
2019 rental revenue by tenants’ industry:
Industry | Percentage | ||
Office: | |||
Financial Services | 15 | % | |
Communications | 8 | % | |
Advertising/Marketing | 7 | % | |
Technology | 6 | % | |
Family Apparel | 5 | % | |
Legal Services | 4 | % | |
Insurance | 4 | % | |
Real Estate | 4 | % | |
Publishing | 3 | % | |
Government | 3 | % | |
Engineering, Architect,& Surveying | 3 | % | |
Banking | 2 | % | |
Entertainment and Electronics | 2 | % | |
Health Services | 1 | % | |
Pharmaceutical | 1 | % | |
Other | 8 | % | |
76 | % | ||
Retail: | |||
Family Apparel | 7 | % | |
Luxury Retail | 4 | % | |
Women's Apparel | 4 | % | |
Restaurants | 2 | % | |
Banking | 2 | % | |
Department Stores | 1 | % | |
Discount Stores | 1 | % | |
Other | 3 | % | |
24 | % | ||
Total | 100 | % | |
26
NEW YORK – CONTINUED
Lease expirations as of December 31, 2019, assuming none of the tenants exercise renewal options:
Number of Expiring Leases | Square Feet of Expiring Leases(1) | Percentage of New York Square Feet | Weighted Average Annual Rent of Expiring Leases | |||||||||||||
Year | Total | Per Square Foot | ||||||||||||||
Office: | ||||||||||||||||
Month to month | 10 | 39,000 | 0.3% | $ | 2,593,000 | $ | 66.49 | |||||||||
2020 | 89 | 1,090,000 | 7.1% | 76,599,000 | 70.27 | (2) | ||||||||||
2021 | 130 | 1,106,000 | 7.2% | 86,140,000 | 77.88 | |||||||||||
2022 | 83 | 668,000 | 4.3% | 43,998,000 | 65.87 | |||||||||||
2023 | 92 | 1,986,000 | 12.9% | 166,729,000 | 83.95 | |||||||||||
2024 | 110 | 1,484,000 | 9.6% | 123,761,000 | 83.40 | |||||||||||
2025 | 62 | 797,000 | (3) | 5.2% | 62,199,000 | 78.04 | ||||||||||
2026 | 82 | 1,205,000 | 7.8% | 92,434,000 | 76.71 | |||||||||||
2027 | 74 | 1,094,000 | 7.1% | 79,658,000 | 72.81 | |||||||||||
2028 | 47 | 890,000 | 5.8% | 62,039,000 | 69.71 | |||||||||||
2029 | 36 | 679,000 | 4.4% | 55,356,000 | 81.53 | |||||||||||
Retail: | ||||||||||||||||
Month to month | 16 | 29,000 | 2.1% | $ | 6,911,000 | $ | 238.31 | |||||||||
2020 | 29 | 104,000 | 7.4% | 22,696,000 | 218.24 | (4) | ||||||||||
2021 | 14 | 82,000 | 5.9% | 9,342,000 | 113.93 | |||||||||||
2022 | 8 | 25,000 | 1.8% | 6,713,000 | 268.52 | |||||||||||
2023 | 20 | 159,000 | 11.4% | 35,669,000 | 224.33 | |||||||||||
2024 | 19 | 187,000 | 13.4% | 44,697,000 | 239.02 | |||||||||||
2025 | 10 | 37,000 | 2.6% | 12,473,000 | 337.11 | |||||||||||
2026 | 14 | 71,000 | 5.1% | 26,134,000 | 368.08 | |||||||||||
2027 | 10 | 29,000 | 2.1% | 20,408,000 | 703.72 | |||||||||||
2028 | 13 | 25,000 | 1.8% | 12,750,000 | 510.00 | |||||||||||
2029 | 14 | 201,000 | 14.4% | 39,579,000 | 196.91 | |||||||||||
________________________________________
(1) | Excludes storage, vacancy and other. |
(2) | Based on current market conditions, we expect to re-lease this space at rents between $80 to $90 per square foot. |
(3) | Excludes 492,000 square feet leased at 909 Third Avenue to the U.S. Post Office through 2038 (including three 5-year renewal options) for which the annual escalated rent is $13.51 per square foot. |
(4) | Based on current market conditions, we expect to re-lease this space at rents between $200 to $225 per square foot. |
Alexander’s
As of December 31, 2019, we own 32.4% of the outstanding common stock of Alexander’s, which owns seven properties in the greater New York metropolitan area aggregating 2.4 million square feet, including 731 Lexington Avenue, the 1.3 million square foot Bloomberg L.P. headquarters building. Alexander’s had $974,836,000 of outstanding debt as of December 31, 2019, of which our pro rata share was $315,847,000, none of which is recourse to us.
Hotel Pennsylvania
We own the Hotel Pennsylvania which is located in New York City on Seventh Avenue at 33rd Street in the heart of the Penn District and consists of a hotel portion containing 1,000,000 square feet of hotel space with 1,700 rooms and a commercial portion containing 400,000 square feet of retail and office space.
For the Year Ended December 31, | |||||||||||||||||||
2019 | 2018 | 2017 | 2016 | 2015 | |||||||||||||||
Hotel Pennsylvania: | |||||||||||||||||||
Average occupancy rate | 82.1 | % | 86.4 | % | 87.3 | % | 84.7 | % | 90.7 | % | |||||||||
Average daily rate | $ | 137.67 | $ | 138.35 | $ | 139.09 | $ | 134.38 | $ | 147.46 | |||||||||
Revenue per available room | 113.08 | 119.47 | 121.46 | 113.84 | 133.69 | ||||||||||||||
27
OTHER REAL ESTATE AND INVESTMENTS
theMART
As of December 31, 2019, we own the 3.7 million square foot theMART in Chicago, whose largest tenant is Motorola Mobility at 609,000 square feet, the lease of which is guaranteed by Google. theMART is encumbered by a $675,000,000 mortgage loan that bears interest at a fixed rate of 2.70% and matures in September 2021. As of December 31, 2019, theMART had an occupancy rate of 94.6% and a weighted average annual rent per square foot of $48.54.
555 California Street
As of December 31, 2019, we own a 70% controlling interest in a three-building office complex containing 1.8 million square feet, located at California and Montgomery Streets in San Francisco’s financial district (“555 California Street”). 555 California Street is encumbered by a $548,075,000 mortgage loan that bears interest at a fixed rate of 5.10% and matures in September 2021. As of December 31, 2019, 555 California Street had an occupancy rate of 99.8% and a weighted average annual rent per square foot of $81.92.
Vornado Capital Partners Real Estate Fund (the “Fund”) and Crowne Plaza Times Square Hotel Joint Venture (the “Crowne Plaza Joint Venture”)
As of December 31, 2019, we own a 25.0% interest in the Fund, which is in wind down and currently has four investments, one of which is the Crowne Plaza Times Square Hotel in which we also own an additional interest through the Crowne Plaza Joint Venture. We are the general partner and investment manager of the Fund. As of December 31, 2019, these four investments are carried on our consolidated balance sheet at an aggregate fair value of $222,649,000, including the Crowne Plaza Joint Venture. As of December 31, 2019, our share of unfunded commitments was $11,242,000.
ITEM 3. | LEGAL PROCEEDINGS |
We are from time to time involved in legal actions arising in the ordinary course of business. In our opinion, after consultation with legal counsel, the outcome of such matters is not expected to have a material adverse effect on our financial position, results of operations or cash flows.
ITEM 4. | MINE SAFETY DISCLOSURES |
Not applicable.
28
PART II
ITEM 5. | MARKET FOR REGISTRANT’S COMMON EQUITY, RELATED STOCKHOLDER MATTERS AND ISSUER PURCHASES OF EQUITY SECURITIES |
Vornado Realty Trust
Vornado’s common shares are traded on the New York Stock Exchange under the symbol “VNO.”
As of February 1, 2020, there were 875 holders of record of Vornado common shares.
Vornado Realty L.P.
There is no established trading market for the Operating Partnership's Class A units. Class A units that are not held by Vornado may be tendered for redemption to the Operating Partnership for cash; Vornado, at its option, may assume that obligation and pay the holder either cash or Vornado common shares on a one-for-one basis. Because the number of Vornado common shares outstanding at all times equals the number of Class A units owned by Vornado, the redemption value of each Class A unit is equivalent to the market value of one Vornado common share, and the quarterly distribution to a Class A unit holder is equal to the quarterly dividend paid to a Vornado common shareholder.
As of February 1, 2020, there were 945 Class A unitholders of record.
Recent Sales of Unregistered Securities
During 2019, the Operating Partnership issued 1,493,309 Class A units in connection with equity awards issued pursuant to Vornado’s omnibus share plan, including with respect to grants of restricted Vornado common shares and restricted units of the Operating Partnership and upon conversion, surrender or exchange of the Operating Partnership’s units or Vornado stock options, and consideration received included $17,062,788 in cash proceeds. Such units were issued in reliance on an exemption from registration under Section 4(2) of the Securities Act of 1933, as amended.
From time to time, in connection with equity awards granted under our Omnibus Share Plan, we may withhold common shares for tax purposes or acquire common shares as part of the payment of the exercise price. Although we treat these as repurchases for certain financial statement purposes, these withheld or acquired shares are not considered by us as repurchases for this purpose.
Information relating to compensation plans under which Vornado’s equity securities are authorized for issuance is set forth under Part III, Item 12 of this Annual Report on Form 10-K and such information is incorporated by reference herein.
Recent Purchases of Equity Securities
None.
29
Performance Graph
The following graph is a comparison of the five-year cumulative return of Vornado’s common shares, the Standard & Poor’s 500 Index (the “S&P 500 Index”) and the National Association of Real Estate Investment Trusts’ (“NAREIT”) All Equity Index, a peer group index. The graph assumes that $100 was invested on December 31, 2014 in our common shares, the S&P 500 Index and the NAREIT All Equity Index and that all dividends were reinvested without the payment of any commissions. There can be no assurance that the performance of our shares will continue in line with the same or similar trends depicted in the graph below.
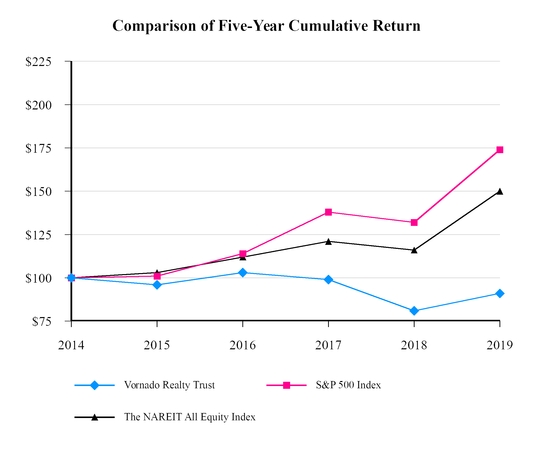
2014 | 2015 | 2016 | 2017 | 2018 | 2019 | ||||||||||||||||||
Vornado Realty Trust | $ | 100 | $ | 96 | $ | 103 | $ | 99 | $ | 81 | $ | 91 | |||||||||||
S&P 500 Index | 100 | 101 | 114 | 138 | 132 | 174 | |||||||||||||||||
The NAREIT All Equity Index | 100 | 103 | 112 | 121 | 116 | 150 | |||||||||||||||||
30
ITEM 6. SELECTED FINANCIAL DATA
Vornado Realty Trust
(Amounts in thousands, except per share amounts) | For the Year Ended December 31, | |||||||||||||||||||
2019(1) | 2018 | 2017 | 2016 | 2015 | ||||||||||||||||
Operating Data: | ||||||||||||||||||||
REVENUES: | ||||||||||||||||||||
Rental revenues | $ | 1,767,222 | $ | 2,007,333 | $ | 1,948,376 | $ | 1,883,656 | $ | 1,845,605 | ||||||||||
Fee and other income | 157,478 | 156,387 | 135,750 | 120,086 | 139,890 | |||||||||||||||
Total revenues | 1,924,700 | 2,163,720 | 2,084,126 | 2,003,742 | 1,985,495 | |||||||||||||||
EXPENSES: | ||||||||||||||||||||
Operating | (917,981 | ) | (963,478 | ) | (886,596 | ) | (844,566 | ) | (824,511 | ) | ||||||||||
Depreciation and amortization | (419,107 | ) | (446,570 | ) | (429,389 | ) | (421,023 | ) | (379,803 | ) | ||||||||||
General and administrative | (169,920 | ) | (141,871 | ) | (150,782 | ) | (143,643 | ) | (148,982 | ) | ||||||||||
(Expense) benefit from deferred compensation plan liability | (11,609 | ) | 2,480 | (6,932 | ) | (5,213 | ) | (111 | ) | |||||||||||
Transaction related costs, impairment losses and other | (106,538 | ) | (31,320 | ) | (1,776 | ) | (9,451 | ) | (12,511 | ) | ||||||||||
Total expenses | (1,625,155 | ) | (1,580,759 | ) | (1,475,475 | ) | (1,423,896 | ) | (1,365,918 | ) | ||||||||||
Income (loss) from partially owned entities | 78,865 | 9,149 | 15,200 | 168,948 | (9,947 | ) | ||||||||||||||
(Loss) income from real estate fund investments | (104,082 | ) | (89,231 | ) | 3,240 | (23,602 | ) | 74,081 | ||||||||||||
Interest and other investment income, net | 21,819 | 17,057 | 30,861 | 24,335 | 27,129 | |||||||||||||||
Income (loss) from deferred compensation plan assets | 11,609 | (2,480 | ) | 6,932 | 5,213 | 111 | ||||||||||||||
Interest and debt expense | (286,623 | ) | (347,949 | ) | (345,654 | ) | (330,240 | ) | (309,298 | ) | ||||||||||
Net gain on transfer to Fifth Avenue and Times Square JV | 2,571,099 | — | — | — | — | |||||||||||||||
Purchase price fair value adjustment | — | 44,060 | — | — | — | |||||||||||||||
Net gains on disposition of wholly owned and partially owned assets | 845,499 | 246,031 | 501 | 160,433 | 149,417 | |||||||||||||||
Income before income taxes | 3,437,731 | 459,598 | 319,731 | 584,933 | 551,070 | |||||||||||||||
Income tax (expense) benefit | (103,439 | ) | (37,633 | ) | (42,375 | ) | (7,923 | ) | 84,849 | |||||||||||
Income from continuing operations | 3,334,292 | 421,965 | 277,356 | 577,010 | 635,919 | |||||||||||||||
(Loss) income from discontinued operations | (30 | ) | 638 | (13,228 | ) | 404,912 | 223,511 | |||||||||||||
Net income | 3,334,262 | 422,603 | 264,128 | 981,922 | 859,430 | |||||||||||||||
Less net loss (income) attributable to noncontrolling interests in: | ||||||||||||||||||||
Consolidated subsidiaries | 24,547 | 53,023 | (25,802 | ) | (21,351 | ) | (55,765 | ) | ||||||||||||
Operating Partnership | (210,872 | ) | (25,672 | ) | (10,910 | ) | (53,654 | ) | (43,231 | ) | ||||||||||
Net income attributable to Vornado | 3,147,937 | 449,954 | 227,416 | 906,917 | 760,434 | |||||||||||||||
Preferred share dividends | (50,131 | ) | (50,636 | ) | (65,399 | ) | (75,903 | ) | (80,578 | ) | ||||||||||
Preferred share issuance costs | — | (14,486 | ) | — | (7,408 | ) | — | |||||||||||||
NET INCOME attributable to common shareholders | $ | 3,097,806 | $ | 384,832 | $ | 162,017 | $ | 823,606 | $ | 679,856 | ||||||||||
Per Share Data: | ||||||||||||||||||||
Income from continuing operations, net - basic | $ | 16.23 | $ | 2.02 | $ | 0.92 | $ | 2.35 | $ | 2.49 | ||||||||||
Income from continuing operations, net - diluted | 16.21 | 2.01 | 0.91 | 2.34 | 2.48 | |||||||||||||||
Net income per common share - basic | 16.23 | 2.02 | 0.85 | 4.36 | 3.61 | |||||||||||||||
Net income per common share - diluted | 16.21 | 2.01 | 0.85 | 4.34 | 3.59 | |||||||||||||||
Aggregate quarterly dividends | 2.64 | 2.52 | 2.62 | (2) | 2.52 | 2.52 | (3) | |||||||||||||
Special dividend declared on December 18, 2019 | 1.95 | — | — | — | — | |||||||||||||||
Balance Sheet Data: | ||||||||||||||||||||
Total assets | $ | 18,287,013 | $ | 17,180,794 | $ | 17,397,934 | $ | 20,814,847 | $ | 21,143,293 | ||||||||||
Real estate, at cost | 13,074,012 | 16,237,883 | 14,756,295 | 14,187,820 | 13,545,295 | |||||||||||||||
Accumulated depreciation and amortization | (3,015,958 | ) | (3,180,175 | ) | (2,885,283 | ) | (2,581,514 | ) | (2,356,728 | ) | ||||||||||
Debt, net | 7,406,609 | 9,836,621 | 9,729,487 | 9,446,670 | 9,095,670 | |||||||||||||||
Total equity | 7,310,978 | 5,107,883 | 5,007,701 | 7,618,496 | 7,476,078 | |||||||||||||||
____________________
(1) | Reflects the transfer of 45.4% of common equity in the properties contributed to the Fifth Avenue and Times Square JV on April 18, 2019. |
(2) | Post spin-off of JBG SMITH Properties (NYSE: JBGS) on July 17, 2017. |
(3) | Post spin-off of Urban Edge Properties (NYSE: UE) on January 15, 2015. |
31
ITEM 6. SELECTED FINANCIAL DATA – CONTINUED
Vornado Realty Trust
(Amounts in thousands) | For the Year Ended December 31, | ||||||||||||||||||
2019(1) | 2018 | 2017 | 2016 | 2015 | |||||||||||||||
Other Data: | |||||||||||||||||||
Funds From Operations ("FFO")(2): | |||||||||||||||||||
Net income attributable to common shareholders | $ | 3,097,806 | $ | 384,832 | $ | 162,017 | $ | 823,606 | $ | 679,856 | |||||||||
FFO adjustments: | |||||||||||||||||||
Depreciation and amortization of real property | 389,024 | 413,091 | 467,966 | 531,620 | 514,085 | ||||||||||||||
Net gains on sale of real estate | (178,711 | ) | (158,138 | ) | (3,797 | ) | (177,023 | ) | (289,117 | ) | |||||||||
Real estate impairment losses | 32,001 | 12,000 | — | 160,700 | 256 | ||||||||||||||
Net gain on transfer to Fifth Avenue and Times Square JV on April 18, 2019, net of $11,945 attributable to noncontrolling interests | (2,559,154 | ) | — | — | — | — | |||||||||||||
Net gain from sale of Urban Edge ("UE") common shares (sold on March 4, 2019) | (62,395 | ) | — | — | — | — | |||||||||||||
Decrease (increase) in fair value of marketable securities: | |||||||||||||||||||
Pennsylvania Real Estate Investment Trust ("PREIT") | 21,649 | — | — | — | — | ||||||||||||||
Lexington Realty Trust ("Lexington") (sold on March 1, 2019) | (16,068 | ) | 26,596 | — | — | — | |||||||||||||
Other | (48 | ) | (143 | ) | — | — | — | ||||||||||||
After-tax purchase price fair value adjustment on depreciable real estate | — | (27,289 | ) | — | — | — | |||||||||||||
Proportionate share of adjustments to equity in net income (loss) of partially owned entities to arrive at FFO: | |||||||||||||||||||
Depreciation and amortization of real property | 134,706 | 101,591 | 137,000 | 154,795 | 143,960 | ||||||||||||||
Net gains on sale of real estate | — | (3,998 | ) | (17,777 | ) | (2,853 | ) | (4,513 | ) | ||||||||||
Real estate impairment losses | — | — | 7,692 | 6,328 | 16,758 | ||||||||||||||
Decrease in fair value of marketable securities | 2,852 | 3,882 | — | — | — | ||||||||||||||
(2,236,144 | ) | 367,592 | 591,084 | 673,567 | 381,429 | ||||||||||||||
Noncontrolling interests' share of above adjustments | 141,679 | (22,746 | ) | (36,420 | ) | (41,267 | ) | (22,342 | ) | ||||||||||
FFO adjustments, net | (2,094,465 | ) | 344,846 | 554,664 | 632,300 | 359,087 | |||||||||||||
FFO attributable to common shareholders | 1,003,341 | 729,678 | 716,681 | 1,455,906 | 1,038,943 | ||||||||||||||
Convertible preferred share dividends | 57 | 62 | 77 | 86 | 92 | ||||||||||||||
Earnings allocated to Out-Performance Plan units | — | — | 1,047 | 1,591 | — | ||||||||||||||
FFO attributable to common shareholders plus assumed conversions(1) | $ | 1,003,398 | $ | 729,740 | $ | 717,805 | $ | 1,457,583 | $ | 1,039,035 | |||||||||
________________________________________
(1) | Reflects the transfer of 45.4% of common equity in the properties contributed to the Fifth Avenue and Times Square JV on April 18, 2019. |
(2) | FFO is computed in accordance with the definition adopted by the Board of Governors of the National Association of Real Estate Investment Trusts (“NAREIT”). NAREIT defines FFO as GAAP net income or loss adjusted to exclude net gains from sales of depreciable real estate assets, real estate impairment losses, depreciation and amortization expense from real estate assets and other specified items, including the pro rata share of such adjustments of unconsolidated subsidiaries. FFO and FFO per diluted share are non-GAAP financial measures used by management, investors and analysts to facilitate meaningful comparisons of operating performance between periods and among our peers because it excludes the effect of real estate depreciation and amortization and net gains on sales, which are based on historical costs and implicitly assume that the value of real estate diminishes predictably over time, rather than fluctuating based on existing market conditions. FFO does not represent cash generated from operating activities and is not necessarily indicative of cash available to fund cash requirements and should not be considered as an alternative to net income as a performance measure or cash flow as a liquidity measure. FFO may not be comparable to similarly titled measures employed by other companies. |
32
ITEM 6. SELECTED FINANCIAL DATA – CONTINUED
Vornado Realty L.P.
(Amounts in thousands, except per unit amounts) | For the Year Ended December 31, | |||||||||||||||||||
2019(1) | 2018 | 2017 | 2016 | 2015 | ||||||||||||||||
Operating Data: | ||||||||||||||||||||
REVENUES: | ||||||||||||||||||||
Rental revenues | $ | 1,767,222 | $ | 2,007,333 | $ | 1,948,376 | $ | 1,883,656 | $ | 1,845,605 | ||||||||||
Fee and other income | 157,478 | 156,387 | 135,750 | 120,086 | 139,890 | |||||||||||||||
Total revenues | 1,924,700 | 2,163,720 | 2,084,126 | 2,003,742 | 1,985,495 | |||||||||||||||
EXPENSES: | ||||||||||||||||||||
Operating | (917,981 | ) | (963,478 | ) | (886,596 | ) | (844,566 | ) | (824,511 | ) | ||||||||||
Depreciation and amortization | (419,107 | ) | (446,570 | ) | (429,389 | ) | (421,023 | ) | (379,803 | ) | ||||||||||
General and administrative | (169,920 | ) | (141,871 | ) | (150,782 | ) | (143,643 | ) | (148,982 | ) | ||||||||||
(Expense) benefit from deferred compensation plan liability | (11,609 | ) | 2,480 | (6,932 | ) | (5,213 | ) | (111 | ) | |||||||||||
Transaction related costs, impairment losses and other | (106,538 | ) | (31,320 | ) | (1,776 | ) | (9,451 | ) | (12,511 | ) | ||||||||||
Total expenses | (1,625,155 | ) | (1,580,759 | ) | (1,475,475 | ) | (1,423,896 | ) | (1,365,918 | ) | ||||||||||
Income (loss) from partially owned entities | 78,865 | 9,149 | 15,200 | 168,948 | (9,947 | ) | ||||||||||||||
(Loss) income from real estate fund investments | (104,082 | ) | (89,231 | ) | 3,240 | (23,602 | ) | 74,081 | ||||||||||||
Interest and other investment income, net | 21,819 | 17,057 | 30,861 | 24,335 | 27,129 | |||||||||||||||
Income (loss) from deferred compensation plan assets | 11,609 | (2,480 | ) | 6,932 | 5,213 | 111 | ||||||||||||||
Interest and debt expense | (286,623 | ) | (347,949 | ) | (345,654 | ) | (330,240 | ) | (309,298 | ) | ||||||||||
Net gain on transfer to Fifth Avenue and Times Square JV | 2,571,099 | — | — | — | — | |||||||||||||||
Purchase price fair value adjustment | — | 44,060 | — | — | — | |||||||||||||||
Net gains on disposition of wholly owned and partially owned assets | 845,499 | 246,031 | 501 | 160,433 | 149,417 | |||||||||||||||
Income before income taxes | 3,437,731 | 459,598 | 319,731 | 584,933 | 551,070 | |||||||||||||||
Income tax (expense) benefit | (103,439 | ) | (37,633 | ) | (42,375 | ) | (7,923 | ) | 84,849 | |||||||||||
Income from continuing operations | 3,334,292 | 421,965 | 277,356 | 577,010 | 635,919 | |||||||||||||||
(Loss) income from discontinued operations | (30 | ) | 638 | (13,228 | ) | 404,912 | 223,511 | |||||||||||||
Net income | 3,334,262 | 422,603 | 264,128 | 981,922 | 859,430 | |||||||||||||||
Less net loss (income) attributable to noncontrolling interests in consolidated subsidiaries | 24,547 | 53,023 | (25,802 | ) | (21,351 | ) | (55,765 | ) | ||||||||||||
Net income attributable to Vornado Realty L.P. | 3,358,809 | 475,626 | 238,326 | 960,571 | 803,665 | |||||||||||||||
Preferred unit distributions | (50,296 | ) | (50,830 | ) | (65,593 | ) | (76,097 | ) | (80,736 | ) | ||||||||||
Preferred unit issuance costs | — | (14,486 | ) | — | (7,408 | ) | — | |||||||||||||
NET INCOME attributable to Class A unitholders | $ | 3,308,513 | $ | 410,310 | $ | 172,733 | $ | 877,066 | $ | 722,929 | ||||||||||
Per Unit Data: | ||||||||||||||||||||
Income from continuing operations, net - basic | $ | 16.22 | $ | 2.01 | $ | 0.91 | $ | 2.34 | $ | 2.49 | ||||||||||
Income from continuing operations, net - diluted | 16.19 | 2.00 | 0.90 | 2.32 | 2.46 | |||||||||||||||
Net income per Class A unit - basic | 16.22 | 2.02 | 0.84 | 4.36 | 3.61 | |||||||||||||||
Net income per Class A unit - diluted | 16.19 | 2.00 | 0.83 | 4.32 | 3.57 | |||||||||||||||
Aggregate quarterly distributions | 2.64 | 2.52 | 2.62 | (2) | 2.52 | 2.52 | (3) | |||||||||||||
Special distribution declared on December 18, 2019 | 1.95 | — | — | — | — | |||||||||||||||
Balance Sheet Data: | ||||||||||||||||||||
Total assets | $ | 18,287,013 | $ | 17,180,794 | $ | 17,397,934 | $ | 20,814,847 | $ | 21,143,293 | ||||||||||
Real estate, at cost | 13,074,012 | 16,237,883 | 14,756,295 | 14,187,820 | 13,545,295 | |||||||||||||||
Accumulated depreciation and amortization | (3,015,958 | ) | (3,180,175 | ) | (2,885,283 | ) | (2,581,514 | ) | (2,356,728 | ) | ||||||||||
Debt, net | 7,406,609 | 9,836,621 | 9,729,487 | 9,446,670 | 9,095,670 | |||||||||||||||
Total equity | 7,310,978 | 5,107,883 | 5,007,701 | 7,618,496 | 7,476,078 | |||||||||||||||
________________________________________
(1) | Reflects the transfer of 45.4% of common equity in the properties contributed to the Fifth Avenue and Times Square JV on April 18, 2019. |
(2) | Post spin-off of JBG SMITH Properties (NYSE: JBGS) on July 17, 2017. |
(3) | Post spin-off of Urban Edge Properties (NYSE: UE) on January 15, 2015. |
33
ITEM 7. | MANAGEMENT'S DISCUSSION AND ANALYSIS OF FINANCIAL CONDITION AND RESULTS OF OPERATIONS |
Page Number | |
Overview | |
Overview - Leasing Activity | |
Critical Accounting Policies | |
Net Operating Income At Share by Segment for the Years Ended December 31, 2019 and 2018 | |
Results of Operations for the Year Ended December 31, 2019 Compared to December 31, 2018 | |
Supplemental Information: | |
Net Operating Income At Share by Segment for the Three Months Ended December 31, 2019 and 2018 | |
Three Months Ended December 31, 2019 Compared to December 31, 2018 | |
Net Operating Income At Share by Segment for the Three Months Ended December 31, 2019 and September 30, 2019 | |
Three Months Ended December 31, 2019 Compared to September 30, 2019 | |
Related Party Transactions | |
Liquidity and Capital Resources | |
Financing Activities and Contractual Obligations | |
Certain Future Cash Requirements | |
Cash Flows for the Year Ended December 31, 2019 Compared to December 31, 2018 | |
Capital Expenditures for the Year Ended December 31, 2019 | |
Capital Expenditures for the Year Ended December 31, 2018 | |
Funds From Operations for the Three Months and Years Ended December 31, 2019 and 2018 | |
34
Introduction
The following discussion should be read in conjunction with the financial statements and related notes included under Part II, Item 8 of this Annual Report on Form 10-K.
Our Management's Discussion and Analysis of Financial Condition and Results of Operations ("MD&A") within this section is focused on the years ended December 31, 2019 and 2018, including year-to-year comparisons between these years. Our MD&A for the year ended December 31, 2017, including year-to-year comparisons between 2018 and 2017, can be found in Part II, Item 7, Management's Discussion and Analysis of Financial Condition and Results of Operations in the Company's Annual Report on Form 10-K for the year ended December 31, 2018.
Overview
Vornado Realty Trust (“Vornado”) is a fully‑integrated real estate investment trust (“REIT”) and conducts its business through, and substantially all of its interests in properties are held by, Vornado Realty L.P., a Delaware limited partnership (the “Operating Partnership”). Accordingly, Vornado’s cash flow and ability to pay dividends to its shareholders are dependent upon the cash flow of the Operating Partnership and the ability of its direct and indirect subsidiaries to first satisfy their obligations to creditors. Vornado is the sole general partner of, and owned approximately 93.1% of the common limited partnership interest in the Operating Partnership as of December 31, 2019. All references to the “Company,” “we,” “us” and “our” mean collectively Vornado, the Operating Partnership and those subsidiaries consolidated by Vornado.
We own and operate office and retail properties with a concentration in the New York City metropolitan area. In addition, we have a 32.4% interest in Alexander’s, Inc. (“Alexander’s”) (NYSE: ALX), which owns seven properties in the greater New York metropolitan area, as well as interests in other real estate and investments.
Our business objective is to maximize Vornado shareholder value, which we measure by the total return provided to our shareholders. Below is a table comparing Vornado’s performance to the FTSE NAREIT Office Index (“Office REIT”) and the MSCI US REIT Index (“MSCI”) for the following periods ended December 31, 2019:
Total Return(1) | ||||||||||
Vornado | Office REIT | MSCI | ||||||||
Three-month | 5.8 | % | 7.0 | % | (0.8 | )% | ||||
One-year | 12.0 | % | 31.4 | % | 25.8 | % | ||||
Three-year | (11.9 | )% | 18.3 | % | 26.2 | % | ||||
Five-year | (9.2 | )% | 34.2 | % | 40.5 | % | ||||
Ten-year | 82.2 | % | 139.2 | % | 208.7 | % | ||||
____________________
(1) | Past performance is not necessarily indicative of future performance. |
We intend to achieve this objective by continuing to pursue our investment philosophy and to execute our operating strategies through:
• | maintaining a superior team of operating and investment professionals and an entrepreneurial spirit; |
• | investing in properties in select markets, such as New York City, where we believe there is a high likelihood of capital appreciation; |
• | acquiring quality properties at a discount to replacement cost and where there is a significant potential for higher rents; |
• | developing and redeveloping our existing properties to increase returns and maximize value; and |
• | investing in operating companies that have a significant real estate component. |
We expect to finance our growth, acquisitions and investments using internally generated funds, proceeds from asset sales and by accessing the public and private capital markets. We may also offer Vornado common or preferred shares or Operating Partnership units in exchange for property and may repurchase or otherwise reacquire these securities in the future.
We compete with a large number of real estate investors, property owners and developers, some of which may be willing to accept lower returns on their investments. Principal factors of competition are rents charged, sales prices, attractiveness of location, the quality of the property and the breadth and the quality of services provided. Our success depends upon, among other factors, trends of the global, national, regional and local economies, the financial condition and operating results of current and prospective tenants and customers, availability and cost of capital, construction and renovation costs, taxes, governmental regulations, legislation, population and employment trends. See “Risk Factors” in Item 1A for additional information regarding these factors.
35
Overview - continued
Quarter Ended December 31, 2019 Financial Results Summary
Net income attributable to common shareholders for the quarter ended December 31, 2019 was $193,217,000, or $1.01 per diluted share, compared to $100,494,000, or $0.53 per diluted share, for the prior year’s quarter. The quarters ended December 31, 2019 and 2018 include certain items that impact net income attributable to common shareholders, which are listed in the table on the following page. The aggregate of these items, net of amounts attributable to noncontrolling interests, increased net income attributable to common shareholders by $136,836,000, or $0.72 per diluted share, for the quarter ended December 31, 2019 and $51,058,000, or $0.27 per diluted share, for the quarter ended December 31, 2018.
Funds From Operations (“FFO”) attributable to common shareholders plus assumed conversions for the quarter ended December 31, 2019 was $311,876,000, or $1.63 per diluted share, compared to $210,100,000, or $1.10 per diluted share, for the prior year’s quarter. The quarters ended December 31, 2019 and 2018 include certain items that impact FFO, which are listed in the table on the following page. The aggregate of these items, net of amounts attributable to noncontrolling interests, increased FFO by $140,846,000, or $0.74 per diluted share, for the quarter ended December 31, 2019 and $40,226,000, or $0.21 per diluted share, for the quarter ended December 31, 2018.
Year Ended December 31, 2019 Financial Results Summary
Net income attributable to common shareholders for the year ended December 31, 2019 was $3,097,806,000, or $16.21 per diluted share, compared to $384,832,000, or $2.01 per diluted share, for the year ended December 31, 2018. The years ended December 31, 2019 and 2018 include certain items that impact net income attributable to common shareholders, which are listed in the table on the following page. The aggregate of these items, net of amounts attributable to noncontrolling interests, increased net income attributable to common shareholders by $2,921,090,000, or $15.29 per diluted share, for the year ended December 31, 2019 and $146,132,000, or $0.76 per diluted share, for the year ended December 31, 2018.
The increase in net income attributable to common shareholders was partially offset by (i) $10,447,000, or $0.05 per diluted share, of non-cash expense for the time-based equity compensation granted in connection with the new leadership group announced in April 2019, (ii) $9,416,000 (at share), or $0.05 per diluted share, from the non-cash write-off of straight-line rent receivables, and (iii) $8,477,000, or $0.04 per share, of non-cash expense for the accelerated vesting of previously issued restricted Operating Partnership units ("OP Units") and Vornado restricted stock due to the removal of the time-based vesting requirement for participants who have reached 65 years of age.
FFO attributable to common shareholders plus assumed conversions for the year ended December 31, 2019 was $1,003,398,000, or $5.25 per diluted share, compared to $729,740,000, or $3.82 per diluted share, for the year ended December 31, 2018. The years ended December 31, 2019 and 2018 include certain items that impact FFO, which are listed in the table on the following page. The aggregate of these items, net of amounts attributable to noncontrolling interests, increased FFO by $337,191,000, or $1.76 per diluted share, for the year ended December 31, 2019 and $16,252,000, or $0.09 per diluted share, for the year ended December 31, 2018.
The increase in FFO attributable to common shareholders plus assumed conversions was partially offset by (i) $10,447,000, or $0.05 per diluted share, of non-cash expense for the time-based equity compensation granted in connection with the new leadership group announced in April 2019, (ii) $9,416,000 (at share), or $0.05 per diluted share, from the non-cash write-off of straight-line rent receivables, and (iii) $8,477,000, or $0.04 per share, of non-cash expense for the accelerated vesting of previously issued OP Units and Vornado restricted stock due to the removal of the time-based vesting requirement for participants who have reached 65 years of age.
36
Overview - continued
The following table reconciles the difference between our net income attributable to common shareholders and our net income attributable to common shareholders, as adjusted:
(Amounts in thousands) | For the Three Months Ended December 31, | For the Year Ended December 31, | |||||||||||||
2019 | 2018 | 2019 | 2018 | ||||||||||||
Certain (income) expense items that impact net income attributable to common shareholders: | |||||||||||||||
After-tax net gain on sale of 220 Central Park South ("220 CPS") condominium units | $ | (173,655 | ) | $ | (67,336 | ) | $ | (502,565 | ) | $ | (67,336 | ) | |||
Our share of loss from real estate fund investments | 26,600 | 24,366 | 48,808 | 23,749 | |||||||||||
Mark-to-market decrease in Pennsylvania Real Estate Investment Trust ("PREIT") common shares (accounted for as a marketable security from March 12, 2019) | 2,438 | — | 21,649 | — | |||||||||||
Non-cash impairment losses and related write-offs (primarily 608 Fifth Avenue in 2019) | 565 | 12,000 | 109,157 | 12,000 | |||||||||||
After-tax purchase price fair value adjustment related to the increase in ownership of the Farley joint venture | — | (27,289 | ) | — | (27,289 | ) | |||||||||
Mark-to-market decrease (increase) in Lexington Realty Trust ("Lexington") common shares (sold on March 1, 2019) | — | 1,662 | (16,068 | ) | 26,596 | ||||||||||
Previously capitalized internal leasing costs(1) | — | (1,655 | ) | — | (5,538 | ) | |||||||||
Net gain on transfer to Fifth Avenue and Times Square retail JV on April 18, 2019, net of $11,945 attributable to noncontrolling interests | — | — | (2,559,154 | ) | — | ||||||||||
Net gains on sale of real estate (primarily our 25% interest in 330 Madison Avenue in 2019) | — | — | (178,769 | ) | (27,786 | ) | |||||||||
Net gain from sale of Urban Edge Properties ("UE") common shares (sold on March 4, 2019) | — | — | (62,395 | ) | — | ||||||||||
Prepayment penalty in connection with redemption of $400 million 5.00% senior unsecured notes due January 2022 | — | — | 22,540 | — | |||||||||||
Net gain on sale of our ownership interests in 666 Fifth Avenue Office Condominium | — | — | — | (134,032 | ) | ||||||||||
Our share of additional New York City transfer taxes | — | — | — | 23,503 | |||||||||||
Preferred share issuance costs | — | — | — | 14,486 | |||||||||||
Other | (2,034 | ) | 3,825 | (2,892 | ) | 5,886 | |||||||||
(146,086 | ) | (54,427 | ) | (3,119,689 | ) | (155,761 | ) | ||||||||
Noncontrolling interests' share of above adjustments | 9,250 | 3,369 | 198,599 | 9,629 | |||||||||||
Total of certain (income) expense items that impact net income attributable to common shareholders | $ | (136,836 | ) | $ | (51,058 | ) | $ | (2,921,090 | ) | $ | (146,132 | ) | |||
_______________________________________
See note below.
The following table reconciles the difference between our FFO attributable to common shareholders plus assumed conversions and our FFO attributable to common shareholders plus assumed conversions, as adjusted:
(Amounts in thousands) | For the Three Months Ended December 31, | For the Year Ended December 31, | |||||||||||||
2019 | 2018 | 2019 | 2018 | ||||||||||||
Certain (income) expense items that impact FFO attributable to common shareholders plus assumed conversions: | |||||||||||||||
After-tax net gain on sale of 220 CPS condominium units | $ | (173,655 | ) | $ | (67,336 | ) | $ | (502,565 | ) | $ | (67,336 | ) | |||
Our share of loss from real estate fund investments | 26,600 | 24,366 | 48,808 | 23,749 | |||||||||||
Previously capitalized internal leasing costs(1) | — | (1,655 | ) | — | (5,538 | ) | |||||||||
Non-cash impairment loss and related write-offs on 608 Fifth Avenue | — | — | 77,156 | — | |||||||||||
Prepayment penalty in connection with redemption of $400 million 5.00% senior unsecured notes due January 2022 | — | — | 22,540 | — | |||||||||||
Our share of additional New York City transfer taxes | — | — | — | 23,503 | |||||||||||
Preferred share issuance costs | — | — | — | 14,486 | |||||||||||
Other | (3,187 | ) | 1,745 | (6,119 | ) | (6,109 | ) | ||||||||
(150,242 | ) | (42,880 | ) | (360,180 | ) | (17,245 | ) | ||||||||
Noncontrolling interests' share of above adjustments | 9,396 | 2,654 | 22,989 | 993 | |||||||||||
Total of certain (income) expense items that impact FFO attributable to common shareholders plus assumed conversions, net | $ | (140,846 | ) | $ | (40,226 | ) | $ | (337,191 | ) | $ | (16,252 | ) | |||
_______________________________________
(1) | The three months and year ended December 31, 2018 have been reduced by $1,655 and $5,538, respectively, for previously capitalized internal leasing costs to present 2018 “as adjusted” financial results on a comparable basis with the current year as a result of the January 1, 2019 adoption of a new GAAP accounting standard under which internal leasing costs can no longer be capitalized. |
37
Overview - continued
Same Store Net Operating Income ("NOI") At Share
The percentage increase (decrease) in same store NOI at share and same store NOI at share - cash basis of our New York segment, theMART and 555 California Street are summarized below.
Total | New York(1) | theMART | 555 California Street | ||||||||
Same store NOI at share % increase (decrease): | |||||||||||
Year ended December 31, 2019 compared to December 31, 2018 | 2.1 | % | 0.5 | % | 15.9 | % | (2) | 9.7 | % | ||
Three months ended December 31, 2019 compared to December 31, 2018 | 7.1 | % | 2.6 | % | 114.3 | % | (3) | 3.3 | % | ||
Three months ended December 31, 2019 compared to September 30, 2019 | 1.7 | % | 3.0 | % | (7.4 | )% | (4.8 | )% | |||
Same store NOI at share - cash basis % increase (decrease): | |||||||||||
Year ended December 31, 2019 compared to December 31, 2018 | 3.6 | % | 1.6 | % | 18.6 | % | (2) | 12.7 | % | ||
Three months ended December 31, 2019 compared to December 31, 2018 | 6.6 | % | 1.7 | % | 100.0 | % | (3) | 4.1 | % | ||
Three months ended December 31, 2019 compared to September 30, 2019 | 2.6 | % | 3.9 | % | (4.8 | )% | (5.4 | )% | |||
________________________________________
(1) | Excluding Hotel Pennsylvania, same store NOI at share % increase: | ||
Year ended December 31, 2019 compared to December 31, 2018 | 0.9 | % | |
Three months ended December 31, 2019 compared to December 31, 2018 | 2.6 | % | |
Three months ended December 31, 2019 compared to September 30, 2019 | 1.7 | % | |
Excluding Hotel Pennsylvania, same store NOI at share - cash basis % increase: | |||
Year ended December 31, 2019 compared to December 31, 2018 | 2.2 | % | |
Three months ended December 31, 2019 compared to December 31, 2018 | 1.8 | % | |
Three months ended December 31, 2019 compared to September 30, 2019 | 2.6 | % | |
(2) | Primarily due to $11,131,000 of tenant reimbursement revenue received in 2019 related to real estate tax expense accrued in 2018. |
(3) | The three months ended December 31, 2018 includes an additional $12,814,000 real estate tax expense accrual due to an increase in the tax-assessed value of theMART. |
Calculations of same store NOI at share, reconciliations of our net income to NOI at share, NOI at share - cash basis and FFO and the reasons we consider these non-GAAP financial measures useful are provided in the following pages of Management’s Discussion and Analysis of the Financial Condition and Results of Operations.
220 CPS
During the three months ended December 31, 2019, we closed on the sale of 17 condominium units at 220 CPS for net proceeds of $565,863,000 resulting in a financial statement net gain of $203,893,000 which is included in "net gains on disposition of wholly owned and partially owned assets" on our consolidated statements of income. In connection with these sales, $30,238,000 of income tax expense was recognized on our consolidated statements of income. During the year ended December 31, 2019, we closed on the sale of 54 condominium units at 220 CPS for net proceeds of $1,605,356,000 resulting in a financial statement net gain of $604,393,000 which is included in "net gains on disposition of wholly owned and partially owned assets" on our consolidated statements of income. In connection with these sales, $101,828,000 of income tax expense was recognized on our consolidated statements of income. From inception to December 31, 2019, we closed on the sale of 65 units for aggregate net proceeds of $1,820,132,000. During the year ended December 31, 2019, we repaid the remaining $737,000,000 of the $950,000,000 220 CPS loan.
Dispositions
Lexington
On March 1, 2019, we sold all of our 18,468,969 common shares of Lexington, realizing net proceeds of $167,698,000. We recorded a $16,068,000 gain (mark-to-market increase), which is included in "interest and other investment income, net" on our consolidated statements of income for the year ended December 31, 2019.
UE
On March 4, 2019, we converted to common shares and sold all of our 5,717,184 partnership units of UE, realizing net proceeds of $108,512,000. The sale resulted in a net gain of $62,395,000 which is included in "net gains on disposition of wholly owned and partially owned assets" on our consolidated statements of income for the year ended December 31, 2019.
38
Overview - continued
Dispositions - continued
Fifth Avenue and Times Square JV
On April 18, 2019 (the “Closing Date”), we entered into a transaction agreement (the “Transaction Agreement”) with a group of institutional investors (the “Investors”). The Transaction Agreement provides for a series of transactions (collectively, the “Transaction”) pursuant to which (i) prior to the Closing Date, we contributed our interests in properties located at 640 Fifth Avenue, 655 Fifth Avenue, 666 Fifth Avenue, 689 Fifth Avenue, 697-703 Fifth Avenue, 1535 Broadway and 1540 Broadway (collectively, the “Properties”) to subsidiaries of a newly formed joint venture (“Fifth Avenue and Times Square JV”) and (ii) on the Closing Date, transferred a 48.5% common interest in Fifth Avenue and Times Square JV to the Investors. The 48.5% common interest in the joint venture represents an effective 47.2% interest in the Properties (of which 45.4% was transferred from Vornado). The Properties include approximately 489,000 square feet of retail space, 327,000 square feet of office space, signage associated with 1535 and 1540 Broadway, the parking garage at 1540 Broadway and the theater at 1535 Broadway.
We retained the remaining 51.5% common interest in Fifth Avenue and Times Square JV which represents an effective 51.0% interest in the Properties and an aggregate $1.828 billion of preferred equity interests in certain of the properties. We also provided $500,000,000 of temporary preferred equity on 640 Fifth Avenue until May 23, 2019 when mortgage financing was completed. All of the preferred equity has an annual coupon of 4.25% for the first five years, increasing to 4.75% for the next five years and thereafter at a formulaic rate. It can be redeemed under certain conditions on a tax deferred basis.
Net cash proceeds from the Transaction were $1.179 billion, after (i) deductions for the defeasance of a $390,000,000 mortgage loan on 666 Fifth Avenue and the repayment of a $140,000,000 mortgage loan on 655 Fifth Avenue, (ii) proceeds from a $500,000,000 mortgage loan on 640 Fifth Avenue, described below, (iii) approximately $23,000,000 used to purchase noncontrolling investors' interests and (iv) approximately $53,000,000 of transaction costs (including $17,000,000 of costs related to the defeasance of the 666 Fifth Avenue mortgage loan).
We continue to manage and lease the Properties. We share control with the Investors over major decisions of the joint venture, including decisions regarding leasing, operating and capital budgets, and refinancings. Accordingly, we no longer hold a controlling financial interest in the Properties which has been transferred to the joint venture. As a result, our investment in Fifth Avenue and Times Square JV is accounted for under the equity method from the date of transfer. The Transaction valued the Properties at $5.556 billion resulting in a financial statement net gain of $2.571 billion, before noncontrolling interest of $11,945,000, including the related step up in our basis of the retained portion of the assets to fair value. The net gain is included in "net gain on transfer to Fifth Avenue and Times Square JV" on our consolidated statements of income for the year ended December 31, 2019. The gain for tax purposes was approximately $735,000,000.
On May 23, 2019, we received $500,000,000 from the redemption of our temporary preferred equity in 640 Fifth Avenue. The temporary preferred equity was redeemed from the proceeds of a $500,000,000 mortgage financing that was completed on the property. The five-year loan, which is guaranteed by us, is interest-only at LIBOR plus 1.01%. The interest rate was swapped for four years to a fixed rate of 3.07%.
330 Madison Avenue
On July 11, 2019, we sold our 25% interest in 330 Madison Avenue to our joint venture partner. We received net proceeds of approximately $100,000,000 after deducting our share of the existing $500,000,000 mortgage loan resulting in a financial statement net gain of $159,292,000. The net gain is included in "net gains on disposition of wholly owned and partially owned assets" on our consolidated statements of income for the year ended December 31, 2019. The gain for tax purposes was approximately $139,000,000.
3040 M Street
On September 18, 2019, we completed the $49,750,000 sale of 3040 M Street, a 44,000 square foot retail building in Washington, DC, which resulted in a net gain of $19,477,000 which is included in “net gains on disposition of wholly owned and partially owned assets” on our consolidated statements of income for year ended December 31, 2019. The gain for tax purposes was approximately $19,000,000.
PREIT
On January 23, 2020, we sold all of our 6,250,000 common shares of PREIT, realizing net proceeds of $28,375,000. A $4,938,000 loss (mark-to-market decrease) will be recorded in the first quarter of 2020.
Financings
Senior Unsecured Notes
On March 1, 2019, we called for redemption all of our $400,000,000 5.00% senior unsecured notes. The notes, which were scheduled to mature in January 2022, were redeemed on April 1, 2019 at a redemption price of 105.51% of the principal amount plus accrued interest. In connection therewith, we expensed $22,540,000 relating to debt prepayment costs which is included in "interest and debt expense" on our consolidated statements of income for the year ended December 31, 2019.
39
Overview - continued
Financings - continued
Unsecured Revolving Credit
On March 26, 2019, we increased to $1.5 billion (from $1.25 billion) and extended to March 2024 (as fully extended) from February 2022 one of our two unsecured revolving credit facilities. The interest rate on the extended facility was lowered from LIBOR plus 1.00% to LIBOR plus 0.90%. The facility fee remains unchanged at 20 basis points.
Other Financings
On January 28, 2019, a joint venture in which we have a 45.1% interest, completed a $167,500,000 refinancing of 61 Ninth Avenue, a 166,000 square foot Manhattan office and retail property. The seven-year interest-only loan carries a rate of LIBOR plus 1.35% (3.07% as of December 31, 2019) and matures in January 2026. We realized net proceeds of approximately $31,000,000. The loan replaces the previous $90,000,000 construction loan that bore interest at LIBOR plus 3.05% and was scheduled to mature in December 2021.
On February 4, 2019, we completed a $95,700,000 refinancing of 435 Seventh Avenue, a 43,000 square foot Manhattan retail property. The interest-only loan carries a rate of LIBOR plus 1.30% (3.00% as of December 31, 2019) and matures in February 2024. The recourse loan replaces the previous $95,700,000 loan that bore interest at LIBOR plus 2.25% and was scheduled to mature in August 2019.
On February 12, 2019, we completed a $580,000,000 refinancing of 100 West 33rd Street, a 1.1 million square foot Manhattan property comprised of 859,000 square feet of office space and the 256,000 square foot Manhattan Mall. The interest-only loan carries a rate of LIBOR plus 1.55% (3.25% as of December 31, 2019) and matures in April 2024, with two one-year extension options. The loan replaces the previous $580,000,000 loan that bore interest at LIBOR plus 1.65% and was scheduled to mature in July 2020.
On May 24, 2019, we extended our $375,000,000 mortgage loan on 888 Seventh Avenue, a 885,000 square foot Manhattan office building, from December 2020 to December 2025. The interest rate on the new amortizing mortgage loan is LIBOR plus 1.70% (3.44% as of December 31, 2019). Pursuant to an existing swap agreement, the interest rate on the $375,000,000 mortgage loan has been swapped to 3.25% through December 2020.
On June 28, 2019, a joint venture in which we have a 55% interest, completed a $145,700,000 refinancing of 512 West 22nd Street, a 173,000 square foot Manhattan office building, of which $109,565,000 was outstanding as of December 31, 2019. The four-year interest-only loan carries a rate of LIBOR plus 2.00% (3.72% as of December 31, 2019) and matures in June 2023 with a one-year extension option. The loan replaces the previous $126,000,000 construction loan that bore interest at LIBOR plus 2.65% and was scheduled to mature in November 2019.
On July 25, 2019, a joint venture in which we have a 50% interest, completed a $60,000,000 refinancing of 825 Seventh Avenue, a 165,000 square foot Manhattan office building, of which $31,889,000 was outstanding as of December 31, 2019. The interest-only loan carries a rate of LIBOR plus 1.65% (3.40% as of December 31, 2019) and matures in July 2022 with a one-year extension option. The loan replaces the previous $20,500,000 loan that bore interest at LIBOR plus 1.40% and was scheduled to mature in September 2019.
On September 5, 2019, a consolidated joint venture, in which we have a 50% interest, completed a $75,000,000 refinancing of 606 Broadway, a 36,000 square foot Manhattan office and retail building, of which $67,804,000 was outstanding as of December 31, 2019. The interest-only loan carries a rate of LIBOR plus 1.80% (3.52% as of December 31, 2019) and matures in September 2024. In connection therewith, the joint venture purchased an interest rate cap that caps LIBOR at a rate of 4.00%. The loan replaces the previous $65,000,000 construction loan. The construction loan bore interest at LIBOR plus 3.00% and was scheduled to mature in May 2021.
On September 27, 2019, we repaid the $575,000,000 mortgage loan on PENN2 with proceeds from our unsecured revolving credit facilities. The mortgage loan was scheduled to mature in December 2019. PENN2 is a 1,795,000 square foot (as expanded) Manhattan office building currently under redevelopment.
On November 6, 2019, the Fund completed a $145,075,000 refinancing of Lucida, a 155,000 square foot Manhattan retail and residential property. The three-year interest-only loan carries a rate of LIBOR plus 1.85% (3.54% as of December 31, 2019) with two one-year extension options. The loan replaces the previous $146,000,000 loan that bore interest at LIBOR plus 1.55% and was scheduled to mature in December 2019.
On November 26, 2019, a joint venture in which we have a 20.1% interest, completed a $800,000,000 refinancing of 650 Madison Avenue, a 601,000 square foot Manhattan office and retail property. The ten-year interest-only loan carries a fixed rate of 3.49% and matures in December 2029. The loan replaces the previous $800,000,000 loan that bore interest at a fixed rate of 4.39% and was scheduled to mature in October 2020.
On December 23, 2019, a joint venture in which we have a 49.9% interest, completed a $85,500,000 refinancing, of which $82,500,000 was outstanding as of December 31, 2019, of 50-70 West 93rd Street, a 325-unit Manhattan residential complex. The five-year interest-only loan carries an interest rate of LIBOR plus 1.53%, which was swapped to a fixed rate of 3.14%, and matures in December 2024. The loan replaces the previous $80,000,000 loan that bore interest at LIBOR plus 1.70% and was scheduled to mature in August 2021, as extended.
40
Overview - continued
Leasing Activity
The leasing activity and related statistics in the tables below are based on leases signed during the period and are not intended to coincide with the commencement of rental revenue in accordance with accounting principles generally accepted in the United States of America (“GAAP”). Second generation relet space represents square footage that has not been vacant for more than nine months and tenant improvements and leasing commissions are based on our share of square feet leased during the period.
(Square feet in thousands) | New York | ||||||||||||||
Office | Retail | theMART | 555 California Street | ||||||||||||
Quarter Ended December 31, 2019: | |||||||||||||||
Total square feet leased | 173 | 94 | 52 | 30 | |||||||||||
Our share of square feet leased | 117 | 73 | 52 | 21 | |||||||||||
Initial rent(1) | $ | 101.67 | $ | 233.55 | $ | 50.26 | $ | 94.00 | |||||||
Weighted average lease term (years) | 6.6 | 9.4 | 5.0 | 5.0 | |||||||||||
Second generation relet space: | |||||||||||||||
Square feet | 54 | 52 | 50 | 21 | |||||||||||
GAAP basis: | |||||||||||||||
Straight-line rent(2) | $ | 93.62 | $ | 309.06 | $ | 50.96 | $ | 99.81 | |||||||
Prior straight-line rent | $ | 97.06 | $ | 308.17 | $ | 49.41 | $ | 49.77 | |||||||
Percentage (decrease) increase | (3.5 | )% | 0.3 | % | 3.1 | % | 100.5 | % | |||||||
Cash basis: | |||||||||||||||
Initial rent(1) | $ | 94.90 | $ | 335.00 | $ | 50.02 | $ | 94.00 | |||||||
Prior escalated rent | $ | 100.06 | $ | 300.90 | $ | 51.21 | $ | 54.49 | |||||||
Percentage (decrease) increase | (5.2 | )% | 11.3 | % | (2.3 | )% | 72.5 | % | |||||||
Tenant improvements and leasing commissions: | |||||||||||||||
Per square foot | $ | 89.30 | $ | 100.79 | $ | 26.91 | $ | 36.38 | |||||||
Per square foot per annum: | $ | 13.53 | $ | 10.72 | $ | 5.38 | $ | 7.28 | |||||||
Percentage of initial rent | 13.3 | % | 4.6 | % | 10.7 | % | 7.7 | % | |||||||
Year Ended December 31, 2019: | |||||||||||||||
Total square feet leased | 987 | 238 | 286 | 172 | |||||||||||
Our share of square feet leased | 793 | 207 | 286 | 120 | |||||||||||
Initial rent(1) | $ | 82.17 | $ | 175.35 | $ | 49.43 | $ | 88.70 | |||||||
Weighted average lease term (years) | 7.7 | 10.9 | 6.1 | 6.1 | |||||||||||
Second generation relet space: | |||||||||||||||
Square feet | 553 | 171 | 280 | 115 | |||||||||||
GAAP basis: | |||||||||||||||
Straight-line rent(2) | $ | 76.12 | $ | 198.05 | $ | 48.71 | $ | 93.86 | |||||||
Prior straight-line rent | $ | 72.18 | $ | 175.46 | $ | 44.01 | $ | 56.93 | |||||||
Percentage increase | 5.5 | % | 12.9 | % | 10.7 | % | 64.9 | % | |||||||
Cash basis: | |||||||||||||||
Initial rent(1) | $ | 77.51 | $ | 197.12 | $ | 49.25 | $ | 88.54 | |||||||
Prior escalated rent | $ | 74.10 | $ | 179.49 | $ | 47.08 | $ | 64.11 | |||||||
Percentage increase | 4.6 | % | 9.8 | % | 4.6 | % | 38.1 | % | |||||||
Tenant improvements and leasing commissions: | |||||||||||||||
Per square foot | $ | 83.82 | $ | 68.59 | $ | 33.87 | $ | 53.93 | |||||||
Per square foot per annum: | $ | 10.89 | $ | 6.29 | $ | 5.55 | $ | 8.84 | |||||||
Percentage of initial rent | 13.3 | % | 3.6 | % | 11.2 | % | 10.0 | % | |||||||
See notes on the following page.
41
Overview - continued
Leasing Activity – continued
(Square feet in thousands) | New York | ||||||||||||||
Office | Retail | theMART | 555 California Street | ||||||||||||
Year Ended December 31, 2018: | |||||||||||||||
Total square feet leased | 1,827 | 255 | 243 | 249 | |||||||||||
Our share of square feet leased: | 1,627 | 236 | 243 | 174 | |||||||||||
Initial rent(1) | $ | 79.03 | $ | 171.25 | $ | 53.47 | $ | 89.28 | |||||||
Weighted average lease term (years) | 9.6 | 5.5 | 5.8 | 10.3 | |||||||||||
Second generation relet space: | |||||||||||||||
Square feet | 1,347 | 216 | 232 | 62 | |||||||||||
GAAP basis: | |||||||||||||||
Straight-line rent(2) | $ | 81.57 | $ | 180.01 | $ | 54.11 | $ | 104.06 | |||||||
Prior straight-line rent | $ | 60.99 | $ | 232.98 | $ | 44.77 | $ | 77.46 | |||||||
Percentage increase (decrease) | 33.7 | % | (22.7 | )% | 20.9 | % | 34.3 | % | |||||||
Cash basis: | |||||||||||||||
Initial rent(1) | $ | 79.22 | $ | 164.74 | $ | 53.49 | $ | 97.28 | |||||||
Prior escalated rent | $ | 64.59 | $ | 166.35 | $ | 47.48 | $ | 85.77 | |||||||
Percentage increase (decrease) | 22.7 | % | (1.0 | )% | 12.7 | % | 13.4 | % | |||||||
Tenant improvements and leasing commissions: | |||||||||||||||
Per square foot | $ | 92.69 | $ | 59.17 | $ | 17.63 | $ | 94.98 | |||||||
Per square foot per annum: | $ | 9.66 | $ | 10.76 | $ | 3.04 | $ | 9.22 | |||||||
Percentage of initial rent | 12.2 | % | 6.3 | % | 5.7 | % | 10.3 | % | |||||||
______________________________________
(1) | Represents the cash basis weighted average starting rent per square foot, which is generally indicative of market rents. Most leases include free rent and periodic step-ups in rent which are not included in the initial cash basis rent per square foot but are included in the GAAP basis straight-line rent per square foot. |
(2) | Represents the GAAP basis weighted average rent per square foot that is recognized over the term of the respective leases, and includes the effect of free rent and periodic step-ups in rent. |
42
Overview - continued
Square footage (in service) and Occupancy as of December 31, 2019:
(Square feet in thousands) | Square Feet (in service) | ||||||||||
Number of properties | Total Portfolio | Our Share | Occupancy % | ||||||||
New York: | |||||||||||
Office | 35 | 19,070 | 16,195 | 96.9 | % | ||||||
Retail (includes retail properties that are in the base of our office properties) | 70 | 2,300 | 1,842 | 94.5 | % | ||||||
Residential - 1,679 units | 9 | 1,526 | 793 | 97.0 | % | ||||||
Alexander's, including 312 residential units | 7 | 2,230 | 723 | 96.5 | % | ||||||
Hotel Pennsylvania | 1 | 1,400 | 1,400 | ||||||||
26,526 | 20,953 | 96.7 | % | ||||||||
Other: | |||||||||||
theMART | 4 | 3,826 | 3,817 | 94.6 | % | ||||||
555 California Street | 3 | 1,741 | 1,218 | 99.8 | % | ||||||
Other | 10 | 2,533 | 1,198 | 92.7 | % | ||||||
8,100 | 6,233 | ||||||||||
Total square feet at December 31, 2019 | 34,626 | 27,186 | |||||||||
Square footage (in service) and Occupancy as of December 31, 2018:
(Square feet in thousands) | Square Feet (in service) | ||||||||||
Number of properties | Total Portfolio | Our Share | Occupancy % | ||||||||
New York: | |||||||||||
Office | 36 | 19,858 | 16,632 | 97.2 | % | ||||||
Retail (includes retail properties that are in the base of our office properties) | 71 | 2,648 | 2,419 | 97.3 | % | ||||||
Residential - 1,687 units | 10 | 1,533 | 800 | 96.6 | % | ||||||
Alexander's, including 312 residential units | 7 | 2,437 | 790 | 91.4 | % | ||||||
Hotel Pennsylvania | 1 | 1,400 | 1,400 | ||||||||
27,876 | 22,041 | 97.0 | % | ||||||||
Other: | |||||||||||
theMART | 3 | 3,694 | 3,685 | 94.7 | % | ||||||
555 California Street | 3 | 1,743 | 1,220 | 99.4 | % | ||||||
Other | 10 | 2,522 | 1,187 | 92.8 | % | ||||||
7,959 | 6,092 | ||||||||||
Total square feet at December 31, 2018 | 35,835 | 28,133 | |||||||||
43
Critical Accounting Policies
In preparing the consolidated financial statements we have made estimates and assumptions that affect the reported amounts of assets and liabilities at the date of the financial statements and the reported amounts of revenues and expenses during the reporting periods. Actual results could differ from those estimates. Set forth below is a summary of the accounting policies that we believe are critical to the preparation of our consolidated financial statements. The summary should be read in conjunction with the more complete discussion of our accounting policies included in Note 2 - Basis of Presentation and Significant Accounting Policies, Note 3 - Revenue Recognition and Note 20 - Leases to our consolidated financial statements in this Annual Report on Form 10-K.
Real Estate
Real estate is carried at cost, net of accumulated depreciation and amortization. Betterments, major renewals and certain costs directly related to the improvement and leasing of real estate are capitalized. Maintenance and repairs are expensed as incurred. For redevelopment of existing operating properties, the net book value of the existing property under redevelopment plus the cost for the construction and improvements incurred in connection with the redevelopment are capitalized to the extent the capitalized costs of the property do not exceed the estimated fair value of the redeveloped property when complete. If the cost of the redeveloped property, including the net book value of the existing property, exceeds the estimated fair value of the redeveloped property, the excess is charged to expense. Depreciation is recognized on a straight-line basis over the estimated useful lives which range from 7 to 40 years. Tenant allowances are amortized on a straight-line basis over the lives of the related leases, which approximate the useful lives of the assets.
Upon the acquisition of real estate, we assess the fair value of acquired assets (including land, buildings and improvements, identified intangibles, such as acquired above and below-market leases, acquired in-place leases and tenant relationships) and acquired liabilities and we allocate the purchase price based on these assessments which are on a relative fair value basis. We assess fair value based on estimated cash flow projections that utilize appropriate discount and capitalization rates and available market information. Estimates of future cash flows are based on a number of factors including historical operating results, known trends, and market/economic conditions. We amortize identified intangibles that have finite lives over the period they are expected to contribute directly or indirectly to the future cash flows of the property or business acquired.
As of December 31, 2019 and 2018, the carrying amounts of real estate, net of accumulated depreciation and amortization, were $10.1 billion and $13.1 billion, respectively. As of December 31, 2019 and 2018, the carrying amounts of identified intangible assets (including acquired above-market leases, tenant relationships and acquired in-place leases) were $30,965,000 and $136,781,000, respectively, and the carrying amounts of identified intangible liabilities, a component of “deferred revenue” on our consolidated balance sheets, were $53,539,000 and $161,594,000, respectively.
Our properties, including any related right-of-use assets and intangible assets, are individually reviewed for impairment whenever events or changes in circumstances indicate that the carrying amount may not be recoverable. An impairment exists when the carrying amount of an asset exceeds the aggregate projected future cash flows over the anticipated holding period on an undiscounted basis. An impairment loss is measured based on the excess of the property’s carrying amount over its estimated fair value. Impairment analyses are based on our current plans, intended holding periods and available market information at the time the analyses are prepared. If our estimates of the projected future cash flows, or market conditions change, our evaluation of impairment losses may be different and such differences could be material to our consolidated financial statements. The evaluation of anticipated discounted cash flows is subjective and is based, in part, on estimates and assumptions regarding future occupancy, rental rates, capital requirements, capitalization rates and discount rates that could differ materially from actual results. Plans to hold properties over longer periods decrease the likelihood of recording impairment losses.
Partially Owned Entities
We consolidate entities in which we have a controlling financial interest. In determining whether we have a controlling financial interest in a partially owned entity and the requirement to consolidate the accounts of that entity, we consider (i) whether the entity is a variable interest entity (“VIE”) in which we are the primary beneficiary or (ii) whether the entity is a voting interest entity in which we have a majority of the voting interests of the entity. We are deemed to be the primary beneficiary of a VIE when we have (i) the power to direct the activities of the VIE that most significantly impact the VIE’s economic performance and (ii) the obligation to absorb losses or receive benefits that could potentially be significant to the VIE. We generally do not control a partially owned entity if the approval of all of the partners/members is contractually required with respect to decisions that most significantly impact the performance of the partially owned entity. This includes decisions regarding operating/capital budgets, and the placement of new or additional financing secured by the assets of the venture, among others. We account for investments under the equity method when the requirements for consolidation are not met, and we have significant influence over the operations of the investee. Equity method investments are initially recorded at cost and subsequently adjusted for our share of net income or loss and cash contributions and distributions each period. Investments that do not qualify for consolidation or equity method accounting are accounted for under the cost method.
44
Critical Accounting Policies - continued
Partially Owned Entities - continued
Investments in partially owned entities are reviewed for impairment whenever events or changes in circumstances indicate that the carrying amount may not be recoverable. An impairment loss is recorded when there is a decline in the fair value below the carrying value and we conclude such decline is other-than-temporary. An impairment loss is measured based on the excess of the carrying amount of an investment over its estimated fair value. Impairment analyses are based on current plans, intended holding periods and available information at the time the analyses are prepared. The ultimate realization of our investments in partially owned entities is dependent on a number of factors, including the performance of each investment and market conditions. If our estimates of the projected future cash flows, the nature of development activities for properties for which such activities are planned and the estimated fair value of the investment change based on market conditions or otherwise, our evaluation of impairment losses may be different and such differences could be material to our consolidated financial statements. The evaluation of anticipated cash flows is subjective and is based, in part, on estimates and assumptions regarding future occupancy, rental rates, capital requirements, capitalization rates and discount rates that could differ materially from actual results.
As of December 31, 2019 and 2018, the carrying amounts of investments in partially owned entities were $4.0 billion and $0.9 billion, respectively.
Revenue Recognition
We have the following revenue sources and revenue recognition policies:
• | Rental revenues include revenues from the leasing of space at our properties to tenants, lease termination income, revenues from the Hotel Pennsylvania, trade shows and tenant services. |
◦ | Revenues from the leasing of space at our properties to tenants includes (i) lease components, including fixed and variable lease payments, and nonlease components which include reimbursement of common area maintenance expenses, and (ii) reimbursement of real estate taxes and insurance expenses. As lessor, we have elected to combine the lease and nonlease components of our operating lease agreements and account for the components as a single lease component. Revenues derived from fixed lease payments are recognized on a straight-line basis over the non-cancelable period of the lease, together with renewal options that are reasonably certain of being exercised. We commence rental revenue recognition when the underlying asset is available for use by the lessee. Revenue derived from the reimbursement of real estate taxes, insurance expenses and common area maintenance expenses are generally recognized in the same period as the related expenses are incurred. |
◦ | Lease termination income is recognized immediately if a tenant vacates or is recognized on a straight-line basis over the shortened remaining lease term. |
◦ | Hotel revenue arising from the operation of Hotel Pennsylvania consists of room revenue, food and beverage revenue, and banquet revenue. Room revenue is recognized when the rooms are made available for the guest. |
◦ | Trade shows revenue arising from the operation of trade shows is primarily booth rentals. This revenue is recognized upon the occurrence of the trade shows when the trade show booths are made available for use by the exhibitors. |
◦ | Tenant services revenue arises from sub-metered electric, elevator, trash removal and other services provided to tenants at their request. This revenue is recognized as the services are transferred. |
• | Fee and other income includes management, leasing and other revenue arising from contractual agreements with third parties or with partially owned entities and includes Building Maintenance Services LLC (“BMS”) cleaning, engineering and security services. This revenue is recognized as the services are transferred. |
We assess, on an individual lease basis, whether it is probable that we will collect the future lease payments. We consider the tenant's payment history and current credit status when assessing collectability. When collectability is not deemed probable, we write off the tenant's receivables, including straight-line rent receivables, and limit lease income to cash received. Changes to the collectability of our operating leases are recorded as adjustments to "rental revenues" on our consolidated statements of income. If our assessment of the collectability of revenue changes, the impact on our consolidated financial statements could be material.
Income Taxes
Vornado operates in a manner intended to enable it to continue to qualify as a REIT under Sections 856‑860 of the Internal Revenue Code of 1986, as amended. Under those sections, a REIT which distributes at least 90% of its REIT taxable income as a dividend to its shareholders each year and which meets certain other conditions will not be taxed on that portion of its taxable income which is distributed to its shareholders. Vornado distributes to its shareholders 100% of its REIT taxable income and therefore, no provision for Federal income taxes is required. If Vornado fails to distribute the required amount of income to its shareholders, or fails to meet other REIT requirements, it may fail to qualify as a REIT which may result in substantial adverse tax consequences.
Recent Accounting Pronouncements
See Note 2 – Basis of Presentation and Significant Accounting Policies to our consolidated financial statements in this Annual Report on Form 10-K for a discussion concerning recent accounting pronouncements.
45
NOI At Share by Segment for the Years Ended December 31, 2019 and 2018
NOI at share represents total revenues less operating expenses including our share of partially owned entities. NOI at share - cash basis represents NOI at share adjusted to exclude straight-line rental income and expense, amortization of acquired below and above market leases, net and other non-cash adjustments. We consider NOI at share - cash basis to be the primary non-GAAP financial measure for making decisions and assessing the unlevered performance of our segments as it relates to the total return on assets as opposed to the levered return on equity. As properties are bought and sold based on NOI at share - cash basis, we utilize this measure to make investment decisions as well as to compare the performance of our assets to that of our peers. NOI at share and NOI at share - cash basis should not be considered alternatives to net income or cash flow from operations and may not be comparable to similarly titled measures employed by other companies.
Below is a summary of NOI at share and NOI at share - cash basis by segment for the years ended December 31, 2019 and 2018.
(Amounts in thousands) | For the Year Ended December 31, 2019 | ||||||||||
Total | New York(1) | Other | |||||||||
Total revenues | $ | 1,924,700 | $ | 1,577,860 | $ | 346,840 | |||||
Operating expenses | (917,981 | ) | (758,304 | ) | (159,677 | ) | |||||
NOI - consolidated | 1,006,719 | 819,556 | 187,163 | ||||||||
Deduct: NOI attributable to noncontrolling interests in consolidated subsidiaries | (69,332 | ) | (40,896 | ) | (28,436 | ) | |||||
Add: NOI from partially owned entities | 322,390 | 294,168 | 28,222 | ||||||||
NOI at share | 1,259,777 | 1,072,828 | 186,949 | ||||||||
Non-cash adjustments for straight-line rents, amortization of acquired below-market leases, net and other | (6,060 | ) | (12,318 | ) | 6,258 | ||||||
NOI at share - cash basis | $ | 1,253,717 | $ | 1,060,510 | $ | 193,207 | |||||
________________________________________
(1) | Reflects the transfer of 45.4% of common equity in the properties contributed to the Fifth Avenue and Times Square JV on April 18, 2019. |
(Amounts in thousands) | For the Year Ended December 31, 2018 | ||||||||||
Total | New York | Other | |||||||||
Total revenues | $ | 2,163,720 | $ | 1,836,036 | $ | 327,684 | |||||
Operating expenses | (963,478 | ) | (806,464 | ) | (157,014 | ) | |||||
NOI - consolidated | 1,200,242 | 1,029,572 | 170,670 | ||||||||
Deduct: NOI attributable to noncontrolling interests in consolidated subsidiaries | (71,186 | ) | (48,490 | ) | (22,696 | ) | |||||
Add: NOI from partially owned entities | 253,564 | 195,908 | 57,656 | ||||||||
NOI at share | 1,382,620 | 1,176,990 | 205,630 | ||||||||
Non-cash adjustments for straight-line rents, amortization of acquired below-market leases, net and other | (44,704 | ) | (45,427 | ) | 723 | ||||||
NOI at share - cash basis | $ | 1,337,916 | $ | 1,131,563 | $ | 206,353 | |||||
46
NOI At Share by Segment for the Years Ended December 31, 2019 and 2018 - continued
The elements of our New York and Other NOI at share for the years ended December 31, 2019 and 2018 are summarized below.
(Amounts in thousands) | For the Year Ended December 31, | ||||||
2019 | 2018 | ||||||
New York: | |||||||
Office(1) | $ | 724,526 | $ | 743,001 | |||
Retail(1) | 273,217 | 353,425 | |||||
Residential | 23,363 | 23,515 | |||||
Alexander's | 44,325 | 45,133 | |||||
Hotel Pennsylvania | 7,397 | 11,916 | |||||
Total New York | 1,072,828 | 1,176,990 | |||||
Other: | |||||||
theMART(2) | 102,071 | 90,929 | |||||
555 California Street | 59,657 | 54,691 | |||||
Other investments(3) | 25,221 | 60,010 | |||||
Total Other | 186,949 | 205,630 | |||||
NOI at share | $ | 1,259,777 | $ | 1,382,620 | |||
________________________________________
(1) | Reflects the transfer of 45.4% of common equity in the properties contributed to the Fifth Avenue and Times Square JV on April 18, 2019. |
(2) | 2019 includes $11,131 of tenant reimbursement revenue related to real estate tax expense accrued in 2018. |
(3) | The year ended December 31, 2018 includes $20,032 from PREIT (accounted for as a marketable security beginning March 12, 2019), $12,145 from 666 Fifth Avenue Office Condominium (sold on August 3, 2018) and $11,822 from UE (sold on March 4, 2019). |
The elements of our New York and Other NOI at share - cash basis for the years ended December 31, 2019 and 2018 are summarized below.
(Amounts in thousands) | For the Year Ended December 31, | ||||||
2019 | 2018 | ||||||
New York: | |||||||
Office(1) | $ | 718,734 | $ | 726,108 | |||
Retail(1) | 267,655 | 324,219 | |||||
Residential | 21,894 | 22,076 | |||||
Alexander's | 45,093 | 47,040 | |||||
Hotel Pennsylvania | 7,134 | 12,120 | |||||
Total New York | 1,060,510 | 1,131,563 | |||||
Other: | |||||||
theMART(2) | 108,130 | 94,070 | |||||
555 California Street | 60,156 | 53,488 | |||||
Other investments(3) | 24,921 | 58,795 | |||||
Total Other | 193,207 | 206,353 | |||||
NOI at share - cash basis | $ | 1,253,717 | $ | 1,337,916 | |||
________________________________________
(1) | Reflects the transfer of 45.4% of common equity in the properties contributed to the Fifth Avenue and Times Square JV on April 18, 2019. |
(2) | 2019 includes $11,131 of tenant reimbursement revenue related to real estate tax expense accrued in 2018. |
(3) | The year ended December 31, 2018 includes $19,767 from PREIT (accounted for as a marketable security beginning March 12, 2019), $12,025 from 666 Fifth Avenue Office Condominium (sold on August 3, 2018) and $10,428 from UE (sold on March 4, 2019). |
47
Reconciliation of Net Income to NOI At Share and NOI At Share - Cash Basis for the Years Ended December 31, 2019 and 2018
(Amounts in thousands) | For the Year Ended December 31, | ||||||
2019 | 2018 | ||||||
Net income | $ | 3,334,262 | $ | 422,603 | |||
Depreciation and amortization expense | 419,107 | 446,570 | |||||
General and administrative expense | 169,920 | 141,871 | |||||
Transaction related costs, impairment losses and other | 106,538 | 31,320 | |||||
Income from partially owned entities | (78,865 | ) | (9,149 | ) | |||
Loss from real estate fund investments | 104,082 | 89,231 | |||||
Interest and other investment income, net | (21,819 | ) | (17,057 | ) | |||
Interest and debt expense | 286,623 | 347,949 | |||||
Net gain on transfer to Fifth Avenue and Times Square JV | (2,571,099 | ) | — | ||||
Purchase price fair value adjustment | — | (44,060 | ) | ||||
Net gains on disposition of wholly owned and partially owned assets | (845,499 | ) | (246,031 | ) | |||
Income tax expense | 103,439 | 37,633 | |||||
Loss (income) from discontinued operations | 30 | (638 | ) | ||||
NOI from partially owned entities | 322,390 | 253,564 | |||||
NOI attributable to noncontrolling interests in consolidated subsidiaries | (69,332 | ) | (71,186 | ) | |||
NOI at share | 1,259,777 | 1,382,620 | |||||
Non cash adjustments for straight-line rents, amortization of acquired below-market leases, net and other | (6,060 | ) | (44,704 | ) | |||
NOI at share - cash basis | $ | 1,253,717 | $ | 1,337,916 | |||
NOI At Share by Region
For the Year Ended December 31, | |||||
2019 | 2018 | ||||
Region: | |||||
New York City metropolitan area | 87 | % | 89 | % | |
Chicago, IL | 8 | % | 7 | % | |
San Francisco, CA | 5 | % | 4 | % | |
100 | % | 100 | % | ||
48
Results of Operations – Year Ended December 31, 2019 Compared to December 31, 2018
Revenues
Our revenues, which consist of rental revenues and fee and other income, were $1,924,700,000 for the year ended December 31, 2019 compared to $2,163,720,000 in the prior year, a decrease of $239,020,000. Below are the details of the (decrease) increase by segment:
(Amounts in thousands) | |||||||||||
(Decrease) increase due to: | Total | New York | Other | ||||||||
Rental revenues: | |||||||||||
Acquisitions, dispositions and other | $ | (8,877 | ) | $ | (8,195 | ) | $ | (682 | ) | ||
Development and redevelopment | (17,613 | ) | (17,991 | ) | 378 | ||||||
Hotel Pennsylvania | (4,034 | ) | (4,034 | ) | — | ||||||
Trade shows | (1,959 | ) | — | (1,959 | ) | ||||||
Properties transferred to Fifth Avenue and Times Square JV | (208,360 | ) | (208,360 | ) | — | ||||||
Same store operations | 732 | (20,406 | ) | (1) | 21,138 | ||||||
(240,111 | ) | (258,986 | ) | 18,875 | |||||||
Fee and other income: | |||||||||||
BMS cleaning fees | 4,317 | 4,270 | 47 | ||||||||
Management and leasing fees | 218 | 1,491 | (1,273 | ) | |||||||
Properties transferred to Fifth Avenue and Times Square JV | (833 | ) | (833 | ) | — | ||||||
Other income | (2,611 | ) | (4,118 | ) | 1,507 | ||||||
1,091 | 810 | 281 | |||||||||
Total (decrease) increase in revenues | $ | (239,020 | ) | $ | (258,176 | ) | $ | 19,156 | |||
________________________________________
(1) | Primarily due to (i) $9,882 of lower acquired below-market lease amortization in 2019 as a result of Old Navy's lease modification at 150 West 34th Street, and (ii) $5,967 from the non-cash write-off of straight-line rent receivables related to Topshop at 478-486 Broadway in 2019. |
49
Results of Operations – Year Ended December 31, 2019 Compared to December 31, 2018 - continued
Expenses
Our expenses, which consist primarily of operating, depreciation and amortization, general and administrative, expense from deferred compensation plan liability, and transaction related costs, impairment losses and other, were $1,625,155,000 for the year ended December 31, 2019 compared to $1,580,759,000 in the prior year, an increase of $44,396,000. Below are the details of the increase by segment:
(Amounts in thousands) | ||||||||||||
Increase (decrease) due to: | Total | New York | Other | |||||||||
Operating: | ||||||||||||
Acquisitions, dispositions and other | $ | (1,659 | ) | $ | (3,901 | ) | $ | 2,242 | ||||
Development and redevelopment | (4,831 | ) | (5,480 | ) | 649 | |||||||
Non-reimbursable expenses | (14,190 | ) | (13,222 | ) | (968 | ) | ||||||
Hotel Pennsylvania | 495 | 495 | — | |||||||||
Trade shows | 535 | — | 535 | |||||||||
BMS expenses | 3,188 | 3,141 | 47 | |||||||||
Properties transferred to Fifth Avenue and Times Square JV | (41,583 | ) | (41,583 | ) | — | |||||||
Same store operations | 12,548 | 12,390 | 158 | |||||||||
(45,497 | ) | (48,160 | ) | 2,663 | ||||||||
Depreciation and amortization: | ||||||||||||
Acquisitions, dispositions and other | 598 | 586 | 12 | |||||||||
Development and redevelopment | (6,454 | ) | (6,683 | ) | 229 | |||||||
Properties transferred to Fifth Avenue and Times Square JV | (56,545 | ) | (56,545 | ) | — | |||||||
Same store operations | 34,938 | 31,636 | 3,302 | |||||||||
(27,463 | ) | (31,006 | ) | 3,543 | ||||||||
General and administrative | 28,049 | (1) | 19,376 | 8,673 | ||||||||
Expense from deferred compensation plan liability | 14,089 | — | 14,089 | |||||||||
Transaction related costs, impairment losses and other | 75,218 | 75,846 | (2) | (628 | ) | |||||||
Total increase in expenses | $ | 44,396 | $ | 16,056 | $ | 28,340 | ||||||
____________________
(1) | 2019 includes (i) $10,447 of non-cash stock-based compensation expense for the time-based equity compensation granted in connection with the new leadership group announced in April 2019 (additional non-cash expense associated with these awards will be $9,603 in each of 2020 and 2021, $7,718 in 2022 and $2,655 in 2023), (ii) $8,477 of non-cash stock-based compensation expense for the accelerated vesting of previously issued OP Units and Vornado restricted stock due to the removal of the time-based vesting requirement for participants who have reached 65 years of age, and (iii) $5,538 of previously capitalized internal leasing costs as a result of the January 1, 2019 adoption of Accounting Standard Update 2016-02, Leases, under which internal leasing costs can no longer be capitalized. |
(2) | 2019 includes $101,925 of non-cash impairment losses and related write-offs, primarily 608 Fifth Avenue, partially offset by (i) $12,000 non-cash impairment loss in 2018 and (ii) $13,103 additional New York City real property transfer tax ("Transfer Tax") recognized in the first quarter of 2018 related to the acquisition of Independence Plaza. The joint venture that owns Independence Plaza, in which we have a 50.1% economic interest, recognized this expense based on the precedent established by the New York City Tax Appeals Tribunal (the "Tax Tribunal") decision regarding One Park Avenue. See Note 4 - Real Estate Fund Investments to the consolidated financial statements in Part II, Item 8 of this Annual Report on Form 10-K for additional information regarding this matter. |
50
Results of Operations – Year Ended December 31, 2019 Compared to December 31, 2018 - continued
Income from Partially Owned Entities
Below are the components of income (loss) from partially owned entities for the years ended December 31, 2019 and 2018.
(Amounts in thousands) | Percentage Ownership at December 31, 2019 | For the Year Ended December 31, | |||||||
2019 | 2018 | ||||||||
Our share of net income (loss): | |||||||||
Fifth Avenue and Times Square JV(1): | |||||||||
Equity in net income | 51.5% | $ | 31,130 | $ | — | ||||
Return on preferred equity, net of our share of the expense | 27,586 | — | |||||||
58,716 | — | ||||||||
Alexander's(2) | 32.4% | 23,779 | 15,045 | ||||||
Partially owned office buildings(3) | Various | (3,443 | ) | (3,085 | ) | ||||
Other investments(4) | Various | (187 | ) | (2,811 | ) | ||||
$ | 78,865 | $ | 9,149 | ||||||
____________________
(1) | The year ended December 31, 2019 includes our 51.5% ownership in the Fifth Avenue and Times Square JV since April 2019. See Note 6 - Investments in Partially Owned Entities to the consolidated financial statements in Part II, Item 8 of this Annual Report on Form 10-K for additional information. |
(2) | 2018 includes our $7,708 share of Alexander's additional Transfer Tax related to the November 2012 sale of Kings Plaza Regional Shopping Center. Alexander's recorded this expense based on the precedent established by the Tax Tribunal's decision regarding One Park Avenue. See Note 4 - Real Estate Fund Investments to the consolidated financial statements in Part II, Item 8 of this Annual Report on Form 10-K for additional information regarding this matter. |
(3) | Includes interests in 280 Park Avenue, 650 Madison Avenue, One Park Avenue, 7 West 34th Street, 330 Madison Avenue (sold on July 11, 2019), 512 West 22nd Street, 61 Ninth Avenue, 85 Tenth Avenue and others. 2018 includes our $4,978 share of additional Transfer Tax related to the March 2011 acquisition of One Park Avenue. See Note 4 - Real Estate Fund Investments to the consolidated financial statements in Part II, Item 8 of this Annual Report on Form 10-K for additional information regarding this matter. |
(4) | Includes interests in Independence Plaza, Fashion Centre Mall/Washington Tower, Rosslyn Plaza, 50-70 West 93rd Street, 666 Fifth Avenue Office Condominium (sold on August 3, 2018), UE (sold on March 4, 2019), PREIT (accounted for as a marketable security from March 12, 2019) and others. |
Loss from Real Estate Fund Investments
Below are the components of the loss from our real estate fund investments for the years ended December 31, 2019 and 2018.
(Amounts in thousands) | For the Year Ended December 31, | |||||||
2019 | 2018 | |||||||
Net investment income | $ | 2,027 | $ | 6,105 | ||||
Net unrealized loss on held investments | (106,109 | ) | (83,794 | ) | ||||
Net realized loss on exited investments | — | (912 | ) | |||||
Transfer tax | — | (10,630 | ) | (1) | ||||
Loss from real estate fund investments | (104,082 | ) | (89,231 | ) | ||||
Less loss attributable to noncontrolling interests in consolidated subsidiaries | 55,274 | 61,230 | ||||||
Loss from real estate fund investments net of controlling interests in consolidated subsidiaries(2) | $ | (48,808 | ) | $ | (28,001 | ) | ||
(1) | Due to the additional Transfer Tax related to the March 2011 acquisition of One Park Avenue which was recognized as a result of the Tax Tribunal decision in the first quarter of 2018. We appealed the Tax Tribunal's decision to the New York State Supreme Court, Appellate Division, First Department ("Appellate Division"). Our appeal was heard on April 2, 2019. On April 25, 2019, the Appellate Division entered a unanimous decision and order that confirmed the decision of the Tax Tribunal and dismissed our appeal. On June 20, 2019, we filed a motion to reargue the Appellate Division's decision or for leave to appeal to the New York State Court of Appeals. That motion was denied on December 12, 2019 and can no longer be appealed. |
(2) | 2018 includes $4,252 of loss related to One Park Avenue additional transfer taxes and reduction in carried interest. |
51
Results of Operations – Year Ended December 31, 2019 Compared to December 31, 2018 - continued
Interest and Other Investment Income, net
Below are the components of interest and other investment, net for the years ended December 31, 2019 and 2018.
(Amounts in thousands) | For the Year Ended December 31, | ||||||
2019 | 2018 | ||||||
Interest on cash and cash equivalents and restricted cash | $ | 13,380 | $ | 15,827 | |||
Interest on loans receivable(1) | 6,326 | 10,298 | |||||
Decrease in fair value of marketable securities | (5,533 | ) | (26,453 | ) | |||
Dividends on marketable securities | 3,938 | 13,339 | |||||
Other, net | 3,708 | 4,046 | |||||
$ | 21,819 | $ | 17,057 | ||||
____________________
(1) | 2018 includes $6,707 of profit participation in connection with an investment in a mezzanine loan which was previously repaid to us. |
Interest and Debt Expense
Interest and debt expense was $286,623,000 for the year ended December 31, 2019, compared to $347,949,000 in the prior year, a decrease of $61,326,000. This decrease was primarily due to (i) $30,245,000 of lower interest expense resulting from the repayment of the 220 CPS loan, (ii) $30,029,000 of lower interest expense resulting from the deconsolidation of mortgages payable of the properties contributed to Fifth Avenue and Times Square JV in April 2019, (iii) $15,137,000 of lower interest from the redemption of the $400,000,000 5.00% senior unsecured notes in April 2019, and (iv) $13,077,000 lower capital lease interest due to the acquisition of the fee interest in 1535 Broadway in September 2018, partially offset by (v) $22,540,000 of expense from debt prepayment costs relating to redemption of the senior unsecured notes, and (vi) $5,457,000 of higher interest from the interest rate swap on our $750,000,000 unsecured term loan.
Net Gain on Transfer to Fifth Avenue and Times Square JV
In April 2019, we recognized a $2,571,099,000 net gain from the transfer of common equity in the properties contributed to Fifth Avenue and Times Square JV, including the related step-up in our basis of the retained portion of the assets to fair value.
Purchase Price Fair Value Adjustment
The purchase price fair value adjustment of $44,060,000 for the year ended December 31, 2018 represents the difference between the estimated fair market value and the book basis of our 50.1% interest in the joint venture that is developing the Farley Office and Retail Building as a result of our increased ownership in the joint venture to 95.0% from 50.1%.
Net Gains on Disposition of Wholly Owned and Partially Owned Assets
Net gains on disposition of wholly owned and partially owned assets of $845,499,000 for the year ended December 31, 2019 primarily consists of (i) $604,393,000 of net gains on sale of 220 CPS condominium units, (ii) $159,292,000 net gain on sale of our 25% interest in 330 Madison Avenue, (iii) $62,395,000 net gain from the sale of all of our UE partnership units, and (iv) $19,477,000 net gain on sale of 3040 M Street. Net gains of $246,031,000 for the year ended December 31, 2018 primarily consists of (i) $134,032,000 net gain on the sale of our 49.5% interests in 666 Fifth Avenue Office Condominium, (ii) $81,224,000 net gain on sale of 220 CPS condominium units, (iii) $23,559,000 net gain on sale of 27 Washington Square North, and (iv) $7,308,000 net gain from repayment of our interest on the mortgage loan on 666 Fifth Avenue Office Condominium.
Income Tax Expense
For the year ended December 31, 2019, we had income tax expense of $103,439,000, compared to $37,633,000 in the prior year, an increase of $65,806,000. This increase was primarily due to $87,940,000 of higher income tax expense on the sale of 220 CPS condominium units, partially offset by $16,771,000 of expense in the year ended December 31, 2018 due to the $44,060,000 purchase price fair value adjustment recognized as a result of our increased ownership in the Farley Office and Retail Building joint venture.
52
Results of Operations – Year Ended December 31, 2019 Compared to December 31, 2018 - continued
(Loss) Income from Discontinued Operations
Loss from discontinued operations for the year ended December 31, 2019 was $30,000 compared to income of $638,000 in the prior year, a decrease in income of $668,000.
Net Loss Attributable to Noncontrolling Interests in Consolidated Subsidiaries
Net loss attributable to noncontrolling interests in consolidated subsidiaries was $24,547,000 for the year ended December 31, 2019, compared to $53,023,000 in the prior year, a decrease of $28,476,000. This decrease resulted primarily from (i) $11,945,000 net gain on transfer to Fifth Avenue and Times Square JV attributable to noncontrolling interests for the year ended December 31, 2019, (ii) $6,538,000 of additional Transfer Tax allocated to noncontrolling interests related to the acquisition of Independence Plaza for the year ended December 31, 2018, and (iii) $5,956,000 of lower net loss allocated to the noncontrolling interests of our real estate fund investments,
Net Income Attributable to Noncontrolling Interests in the Operating Partnership (Vornado Realty Trust)
Net income attributable to noncontrolling interests in the Operating Partnership was $210,872,000 for the year ended December 31, 2019, compared to $25,672,000 in the prior year, an increase of $185,200,000. The increase resulted primarily from higher net income subject to allocation to Class A unitholders due to the net gain on transfer to Fifth Avenue and Times Square JV.
Preferred Share Dividends of Vornado Realty Trust
Preferred share dividends were $50,131,000 for the year ended December 31, 2019, compared to $50,636,000 in the prior year, a decrease of $505,000.
Preferred Unit Distributions of Vornado Realty L.P.
Preferred unit distributions were $50,296,000 for the year ended December 31, 2019, compared to $50,830,000 in the prior year, a decrease of $534,000.
Preferred Share/Unit Issuance Costs
For the year ended December 31, 2018, we recognized preferred share/unit issuance costs of $14,486,000 representing the write-off of issuance costs upon the redemption of all the outstanding Series G and Series I cumulative redeemable preferred shares/units in January 2018.
53
Results of Operations – Year Ended December 31, 2019 Compared to December 31, 2018 - continued
Same Store Net Operating Income At Share
Same store NOI at share represents NOI at share from operations which are in service in both the current and prior year reporting periods. Same store NOI at share - cash basis is same store NOI at share adjusted to exclude straight-line rental income and expense, amortization of acquired below and above market leases, net and other non-cash adjustments. We present these non-GAAP measures to (i) facilitate meaningful comparisons of the operational performance of our properties and segments, (ii) make decisions on whether to buy, sell or refinance properties, and (iii) compare the performance of our properties and segments to those of our peers. Same store NOI at share and same store NOI at share - cash basis should not be considered alternatives to net income or cash flow from operations and may not be comparable to similarly titled measures employed by other companies.
Below are reconciliations of NOI at share to same store NOI at share for our New York segment, theMART, 555 California Street and other investments for the year ended December 31, 2019 compared to December 31, 2018.
(Amounts in thousands) | Total | New York | theMART | 555 California Street | Other | |||||||||||||||
NOI at share for the year ended December 31, 2019 | $ | 1,259,777 | $ | 1,072,828 | $ | 102,071 | $ | 59,657 | $ | 25,221 | ||||||||||
Less NOI at share from: | ||||||||||||||||||||
Acquisitions | (334 | ) | (334 | ) | — | — | — | |||||||||||||
Change in ownership interests in properties contributed to Fifth Avenue and Times Square JV | (5,479 | ) | (5,479 | ) | — | — | — | |||||||||||||
Dispositions | (7,420 | ) | (7,420 | ) | — | — | — | |||||||||||||
Development properties | (54,099 | ) | (54,099 | ) | — | — | — | |||||||||||||
Other non-same store (income) expense, net | (33,028 | ) | (5,585 | ) | (2,635 | ) | 413 | (25,221 | ) | |||||||||||
Same store NOI at share for the year ended December 31, 2019 | $ | 1,159,417 | $ | 999,911 | $ | 99,436 | $ | 60,070 | $ | — | ||||||||||
NOI at share for the year ended December 31, 2018 | $ | 1,382,620 | $ | 1,176,990 | $ | 90,929 | $ | 54,691 | $ | 60,010 | ||||||||||
Less NOI at share from: | ||||||||||||||||||||
Acquisitions | (121 | ) | (121 | ) | — | — | — | |||||||||||||
Change in ownership interests in properties contributed to Fifth Avenue and Times Square JV | (84,020 | ) | (84,020 | ) | — | — | — | |||||||||||||
Dispositions | (14,949 | ) | (14,949 | ) | — | — | — | |||||||||||||
Development properties | (74,720 | ) | (74,720 | ) | — | — | — | |||||||||||||
Other non-same store (income) expense, net | (72,930 | ) | (7,825 | ) | (5,155 | ) | 60 | (60,010 | ) | |||||||||||
Same store NOI at share for the year ended December 31, 2018 | $ | 1,135,880 | $ | 995,355 | $ | 85,774 | $ | 54,751 | $ | — | ||||||||||
Increase in same store NOI at share for the year ended December 31, 2019 compared to December 31, 2018 | $ | 23,537 | $ | 4,556 | $ | 13,662 | $ | 5,319 | $ | — | ||||||||||
% increase in same store NOI at share | 2.1 | % | 0.5 | % | (1) | 15.9 | % | (2) | 9.7 | % | — | % | ||||||||
____________________
(1) | Excluding Hotel Pennsylvania, same store NOI at share increased by 0.9%. |
(2) | Primarily due to $11,131 of tenant reimbursement revenue received in 2019 related to real estate tax expense accrued in 2018. |
54
Results of Operations – Year Ended December 31, 2019 Compared to December 31, 2018 - continued
Same Store Net Operating Income At Share - continued
Below are reconciliations of NOI at share - cash basis to same store NOI at share - cash basis for our New York segment, theMART, 555 California Street and other investments for the year ended December 31, 2019 compared to December 31, 2018.
(Amounts in thousands) | Total | New York | theMART | 555 California Street | Other | |||||||||||||||
NOI at share - cash basis for the year ended December 31, 2019 | $ | 1,253,717 | $ | 1,060,510 | $ | 108,130 | $ | 60,156 | $ | 24,921 | ||||||||||
Less NOI at share - cash basis from: | ||||||||||||||||||||
Acquisitions | (266 | ) | (266 | ) | — | — | — | |||||||||||||
Change in ownership interests in properties contributed to Fifth Avenue and Times Square JV | (5,183 | ) | (5,183 | ) | — | — | — | |||||||||||||
Dispositions | (8,219 | ) | (8,219 | ) | — | — | — | |||||||||||||
Development properties | (64,359 | ) | (64,359 | ) | — | — | — | |||||||||||||
Other non-same store (income) expense, net | (52,594 | ) | (24,892 | ) | (2,973 | ) | 192 | (24,921 | ) | |||||||||||
Same store NOI at share - cash basis for the year ended December 31, 2019 | $ | 1,123,096 | $ | 957,591 | $ | 105,157 | $ | 60,348 | $ | — | ||||||||||
NOI at share - cash basis for the year ended December 31, 2018 | $ | 1,337,916 | $ | 1,131,563 | $ | 94,070 | $ | 53,488 | $ | 58,795 | ||||||||||
Less NOI at share - cash basis from: | ||||||||||||||||||||
Acquisitions | (121 | ) | (121 | ) | — | — | — | |||||||||||||
Change in ownership interests in properties contributed to Fifth Avenue and Times Square JV | (79,427 | ) | (79,427 | ) | — | — | — | |||||||||||||
Dispositions | (14,764 | ) | (14,764 | ) | — | — | — | |||||||||||||
Development properties | (81,137 | ) | (81,137 | ) | — | — | — | |||||||||||||
Other non-same store (income) expense, net | (78,119 | ) | (14,011 | ) | (5,373 | ) | 60 | (58,795 | ) | |||||||||||
Same store NOI at share - cash basis for the year ended December 31, 2018 | $ | 1,084,348 | $ | 942,103 | $ | 88,697 | $ | 53,548 | $ | — | ||||||||||
Increase in same store NOI at share - cash basis for the year ended December 31, 2019 compared to December 31, 2018 | $ | 38,748 | $ | 15,488 | $ | 16,460 | $ | 6,800 | $ | — | ||||||||||
% increase in same store NOI at share - cash basis | 3.6 | % | 1.6 | % | (1) | 18.6 | % | (2) | 12.7 | % | — | % | ||||||||
____________________
(1) | Excluding Hotel Pennsylvania, same store NOI at share - cash basis increased by 2.2%. |
(2) | Primarily due to $11,131 of tenant reimbursement revenue received in 2019 related to real estate tax expense accrued in 2018. |
55
Supplemental Information
NOI At Share by Segment for the Three Months Ended December 31, 2019 and 2018
Below is a summary of NOI at share by segment for the three months ended December 31, 2019 and 2018.
(Amounts in thousands) | For the Three Months Ended December 31, 2019 | ||||||||||
Total | New York(1) | Other | |||||||||
Total revenues | $ | 460,968 | $ | 377,626 | $ | 83,342 | |||||
Operating expenses | (223,975 | ) | (184,231 | ) | (39,744 | ) | |||||
NOI - consolidated | 236,993 | 193,395 | 43,598 | ||||||||
Deduct: NOI attributable to noncontrolling interests in consolidated subsidiaries | (17,417 | ) | (9,885 | ) | (7,532 | ) | |||||
Add: NOI from partially owned entities | 85,990 | 82,774 | 3,216 | ||||||||
NOI at share | 305,566 | 266,284 | 39,282 | ||||||||
Non-cash adjustments for straight-line rents, amortization of acquired below-market leases, net and other | (6,590 | ) | (8,577 | ) | 1,987 | ||||||
NOI at share - cash basis | $ | 298,976 | $ | 257,707 | $ | 41,269 | |||||
________________________________________
(1) | Reflects the transfer of 45.4% of common equity in the properties contributed to the Fifth Avenue and Times Square JV on April 18, 2019. |
(Amounts in thousands) | For the Three Months Ended December 31, 2018 | ||||||||||
Total | New York | Other | |||||||||
Total revenues | $ | 543,417 | $ | 466,554 | $ | 76,863 | |||||
Operating expenses | (254,320 | ) | (206,696 | ) | (47,624 | ) | |||||
NOI - consolidated | 289,097 | 259,858 | 29,239 | ||||||||
Deduct: NOI attributable to noncontrolling interests in consolidated subsidiaries | (19,771 | ) | (13,837 | ) | (5,934 | ) | |||||
Add: NOI from partially owned entities | 60,205 | 49,178 | 11,027 | ||||||||
NOI at share | 329,531 | 295,199 | 34,332 | ||||||||
Non-cash adjustments for straight-line rents, amortization of acquired below-market leases, net and other | (5,532 | ) | (6,266 | ) | 734 | ||||||
NOI at share - cash basis | $ | 323,999 | $ | 288,933 | $ | 35,066 | |||||
56
Supplemental Information - continued
NOI At Share by Segment for the Three Months Ended December 31, 2019 and 2018 - continued
The elements of our New York and Other NOI at share for the three months ended December 31, 2019 and 2018 are summarized below.
(Amounts in thousands) | For the Three Months Ended December 31, | ||||||
2019 | 2018 | ||||||
New York: | |||||||
Office(1) | $ | 183,925 | $ | 186,832 | |||
Retail(1) | 59,728 | 85,549 | |||||
Residential | 5,835 | 5,834 | |||||
Alexander's | 10,626 | 11,023 | |||||
Hotel Pennsylvania | 6,170 | 5,961 | |||||
Total New York | 266,284 | 295,199 | |||||
Other: | |||||||
theMART(2) | 22,712 | 10,981 | |||||
555 California Street | 14,533 | 14,005 | |||||
Other investments(3) | 2,037 | 9,346 | |||||
Total Other | 39,282 | 34,332 | |||||
NOI at share | $ | 305,566 | $ | 329,531 | |||
________________________________________
(1) | Reflects the transfer of 45.4% of common equity in the properties contributed to the Fifth Avenue and Times Square JV on April 18, 2019. |
(2) | The three months ended December 31, 2018 includes an additional $12,814 real estate tax expense accrual due to an increase in the tax-assessed value of theMART. |
(3) | The three months ended December 31, 2018 includes $4,683 from PREIT (accounted for as a marketable security beginning March 12, 2019) and $3,198 from UE (sold on March 4, 2019). |
The elements of our New York and Other NOI at share - cash basis for the three months ended December 31, 2019 and 2018 are summarized below.
(Amounts in thousands) | For the Three Months Ended December 31, | ||||||
2019 | 2018 | ||||||
New York: | |||||||
Office(1) | $ | 180,762 | $ | 185,624 | |||
Retail(1) | 54,357 | 80,515 | |||||
Residential | 5,763 | 5,656 | |||||
Alexander's | 10,773 | 11,129 | |||||
Hotel Pennsylvania | 6,052 | 6,009 | |||||
Total New York | 257,707 | 288,933 | |||||
Other: | |||||||
theMART(2) | 24,646 | 12,758 | |||||
555 California Street | 14,491 | 13,784 | |||||
Other investments(3) | 2,132 | 8,524 | |||||
Total Other | 41,269 | 35,066 | |||||
NOI at share - cash basis | $ | 298,976 | $ | 323,999 | |||
________________________________________
(1) | Reflects the transfer of 45.4% of common equity in the properties contributed to the Fifth Avenue and Times Square JV on April 18, 2019. |
(2) | The three months ended December 31, 2018 includes an additional $12,814 real estate tax expense accrual due to an increase in the tax-assessed value of theMART. |
(3) | The three months ended December 31, 2018 includes $4,612 from PREIT (accounted for as a marketable security beginning March 12, 2019) and $2,320 from UE (sold on March 4, 2019). |
57
Supplemental Information - continued
Reconciliation of Net Income to NOI At Share and NOI At Share - Cash Basis for the Three Months Ended December 31, 2019 and 2018
(Amounts in thousands) | For the Three Months Ended December 31, | ||||||
2019 | 2018 | ||||||
Net income | $ | 160,676 | $ | 97,821 | |||
Depreciation and amortization expense | 92,926 | 112,869 | |||||
General and administrative expense | 39,791 | 32,934 | |||||
Transaction related costs, impairment losses and other | 3,223 | 14,637 | |||||
Income from partially owned entities | (22,726 | ) | (3,090 | ) | |||
Loss from real estate fund investments | 90,302 | 51,258 | |||||
Interest and other investment income, net | (5,889 | ) | (7,656 | ) | |||
Interest and debt expense | 59,683 | 83,175 | |||||
Purchase price fair value adjustment | — | (44,060 | ) | ||||
Net gains on disposition of wholly owned and partially owned assets | (203,835 | ) | (81,203 | ) | |||
Income tax expense | 22,897 | 32,669 | |||||
Income from discontinued operations | (55 | ) | (257 | ) | |||
NOI from partially owned entities | 85,990 | 60,205 | |||||
NOI attributable to noncontrolling interests in consolidated subsidiaries | (17,417 | ) | (19,771 | ) | |||
NOI at share | 305,566 | 329,531 | |||||
Non cash adjustments for straight-line rents, amortization of acquired below-market leases, net and other | (6,590 | ) | (5,532 | ) | |||
NOI at share - cash basis | $ | 298,976 | $ | 323,999 | |||
NOI At Share by Region
For the Three Months Ended December 31, | |||||
2019 | 2018 | ||||
Region: | |||||
New York City metropolitan area | 88 | % | 92 | % | |
Chicago, IL | 7 | % | 3 | % | |
San Francisco, CA | 5 | % | 5 | % | |
100 | % | 100 | % | ||
58
Supplemental Information - continued
Three Months Ended December 31, 2019 Compared to December 31, 2018
Same Store Net Operating Income At Share
Below are reconciliations of NOI at share to same store NOI at share for our New York segment, theMART, 555 California Street and other investments for the three months ended December 31, 2019 compared to December 31, 2018.
(Amounts in thousands) | Total | New York | theMART | 555 California Street | Other | |||||||||||||||
NOI at share for the three months ended December 31, 2019 | $ | 305,566 | $ | 266,284 | $ | 22,712 | $ | 14,533 | $ | 2,037 | ||||||||||
Less NOI at share from: | ||||||||||||||||||||
Acquisitions | (122 | ) | (122 | ) | — | — | — | |||||||||||||
Dispositions | (62 | ) | (62 | ) | — | — | — | |||||||||||||
Development properties | (16,082 | ) | (16,082 | ) | — | — | — | |||||||||||||
Other non-same store (income) expense, net | (8,164 | ) | (5,969 | ) | (172 | ) | 14 | (2,037 | ) | |||||||||||
Same store NOI at share for the three months ended December 31, 2019 | $ | 281,136 | $ | 244,049 | $ | 22,540 | $ | 14,547 | $ | — | ||||||||||
NOI at share for the three months ended December 31, 2018 | $ | 329,531 | $ | 295,199 | $ | 10,981 | $ | 14,005 | $ | 9,346 | ||||||||||
Less NOI at share from: | ||||||||||||||||||||
Change in ownership interests in properties contributed to Fifth Avenue and Times Square JV | (28,683 | ) | (28,683 | ) | — | — | — | |||||||||||||
Dispositions | (3,614 | ) | (3,614 | ) | — | — | — | |||||||||||||
Development properties | (21,797 | ) | (21,811 | ) | — | 14 | — | |||||||||||||
Other non-same store (income) expense, net | (13,041 | ) | (3,291 | ) | (463 | ) | 59 | (9,346 | ) | |||||||||||
Same store NOI at share for the three months ended December 31, 2018 | $ | 262,396 | $ | 237,800 | $ | 10,518 | $ | 14,078 | $ | — | ||||||||||
Increase in same store NOI at share for the three months ended December 31, 2019 compared to December 31, 2018 | $ | 18,740 | $ | 6,249 | $ | 12,022 | $ | 469 | $ | — | ||||||||||
% increase in same store NOI at share | 7.1 | % | 2.6 | % | (1) | 114.3 | % | (2) | 3.3 | % | — | % | ||||||||
____________________
(1) | Excluding Hotel Pennsylvania, same store NOI at share remained unchanged. |
(2) | The three months ended December 31, 2018 includes an additional $12,814 real estate tax expense accrual due to an increase in the tax-assessed value of theMART. |
59
Supplemental Information - continued
Three Months Ended December 31, 2019 Compared to December 31, 2018 - continued
Same Store Net Operating Income At Share - continued
Below are reconciliations of NOI at share - cash basis to same store NOI at share - cash basis for our New York segment, theMART,555 California Street and other investments for the three months ended December 31, 2019 compared to December 31, 2018.
(Amounts in thousands) | Total | New York | theMART | 555 California Street | Other | |||||||||||||||
NOI at share - cash basis for the three months ended December 31, 2019 | $ | 298,976 | $ | 257,707 | $ | 24,646 | $ | 14,491 | $ | 2,132 | ||||||||||
Less NOI at share - cash basis from: | ||||||||||||||||||||
Acquisitions | (54 | ) | (54 | ) | — | — | — | |||||||||||||
Dispositions | (66 | ) | (66 | ) | — | — | — | |||||||||||||
Development properties | (16,948 | ) | (16,948 | ) | — | — | — | |||||||||||||
Other non-same store income, net | (9,736 | ) | (7,373 | ) | (172 | ) | (59 | ) | (2,132 | ) | ||||||||||
Same store NOI at share - cash basis for the three months ended December 31, 2019 | $ | 272,172 | $ | 233,266 | $ | 24,474 | $ | 14,432 | $ | — | ||||||||||
NOI at share - cash basis for the three months ended December 31, 2018 | $ | 323,999 | $ | 288,933 | $ | 12,758 | $ | 13,784 | $ | 8,524 | ||||||||||
Less NOI at share - cash basis from: | ||||||||||||||||||||
Change in ownership interests in properties contributed to Fifth Avenue and Times Square JV | (27,243 | ) | (27,243 | ) | — | — | — | |||||||||||||
Dispositions | (3,870 | ) | (3,870 | ) | — | — | — | |||||||||||||
Development properties | (24,090 | ) | (24,104 | ) | — | 14 | — | |||||||||||||
Other non-same store (income) expense, net | (13,400 | ) | (4,416 | ) | (520 | ) | 60 | (8,524 | ) | |||||||||||
Same store NOI at share - cash basis for the three months ended December 31, 2018 | $ | 255,396 | $ | 229,300 | $ | 12,238 | $ | 13,858 | $ | — | ||||||||||
Increase in same store NOI at share - cash basis for the three months ended December 31, 2019 compared to December 31, 2018 | $ | 16,776 | $ | 3,966 | $ | 12,236 | $ | 574 | $ | — | ||||||||||
% increase in same store NOI at share - cash basis | 6.6 | % | 1.7 | % | (1) | 100.0 | % | (2) | 4.1 | % | — | % | ||||||||
____________________
(1) | Excluding Hotel Pennsylvania, same store NOI at share - cash basis increased by 1.8%. |
(2) | The three months ended December 31, 2018 includes an additional $12,814 real estate tax expense accrual due to an increase in the tax-assessed value of theMART. |
60
Supplemental Information - continued
NOI At Share by Segment for the Three Months Ended December 31, 2019 and September 30, 2019
Below is a summary of NOI at share and NOI at share - cash basis by segment for the three months ended December 31, 2019 and September 30, 2019.
(Amounts in thousands) | For the Three Months Ended December 31, 2019 | ||||||||||
Total | New York | Other | |||||||||
Total revenues | $ | 460,968 | $ | 377,626 | $ | 83,342 | |||||
Operating expenses | (223,975 | ) | (184,231 | ) | (39,744 | ) | |||||
NOI - consolidated | 236,993 | 193,395 | 43,598 | ||||||||
Deduct: NOI attributable to noncontrolling interests in consolidated subsidiaries | (17,417 | ) | (9,885 | ) | (7,532 | ) | |||||
Add: NOI from partially owned entities | 85,990 | 82,774 | 3,216 | ||||||||
NOI at share | 305,566 | 266,284 | 39,282 | ||||||||
Non-cash adjustments for straight-line rents, amortization of acquired below-market leases, net and other | (6,590 | ) | (8,577 | ) | 1,987 | ||||||
NOI at share - cash basis | $ | 298,976 | $ | 257,707 | $ | 41,269 | |||||
(Amounts in thousands) | For the Three Months Ended September 30, 2019 | ||||||||||
Total | New York | Other | |||||||||
Total revenues | $ | 465,961 | $ | 380,568 | $ | 85,393 | |||||
Operating expenses | (226,359 | ) | (188,159 | ) | (38,200 | ) | |||||
NOI - consolidated | 239,602 | 192,409 | 47,193 | ||||||||
Deduct: NOI attributable to noncontrolling interests in consolidated subsidiaries | (18,096 | ) | (9,574 | ) | (8,522 | ) | |||||
Add: NOI from partially owned entities | 86,024 | 82,649 | 3,375 | ||||||||
NOI at share | 307,530 | 265,484 | 42,046 | ||||||||
Non-cash adjustments for straight-line rents, amortization of acquired below-market leases, net and other | (4,037 | ) | (5,560 | ) | 1,523 | ||||||
NOI at share - cash basis | $ | 303,493 | $ | 259,924 | $ | 43,569 | |||||
61
Supplemental Information - continued
NOI At Share by Segment for the Three Months Ended December 31, 2019 and September 30, 2019 - continued
The elements of our New York and Other NOI at share for the three months ended December 31, 2019 and September 30, 2019 are summarized below.
(Amounts in thousands) | For the Three Months Ended | ||||||
December 31, 2019 | September 30, 2019 | ||||||
New York: | |||||||
Office | $ | 183,925 | $ | 177,469 | |||
Retail | 59,728 | 68,159 | |||||
Residential | 5,835 | 5,575 | |||||
Alexander's | 10,626 | 11,269 | |||||
Hotel Pennsylvania | 6,170 | 3,012 | |||||
Total New York | 266,284 | 265,484 | |||||
Other: | |||||||
theMART | 22,712 | 24,862 | |||||
555 California Street | 14,533 | 15,265 | |||||
Other investments | 2,037 | 1,919 | |||||
Total Other | 39,282 | 42,046 | |||||
NOI at share | $ | 305,566 | $ | 307,530 | |||
The elements of our New York and Other NOI at share - cash basis for the three months ended December 31, 2019 and September 30, 2019 are summarized below.
(Amounts in thousands) | For the Three Months Ended | ||||||
December 31, 2019 | September 30, 2019 | ||||||
New York: | |||||||
Office | $ | 180,762 | $ | 174,796 | |||
Retail | 54,357 | 65,636 | |||||
Residential | 5,763 | 5,057 | |||||
Alexander's | 10,773 | 11,471 | |||||
Hotel Pennsylvania | 6,052 | 2,964 | |||||
Total New York | 257,707 | 259,924 | |||||
Other: | |||||||
theMART | 24,646 | 26,588 | |||||
555 California Street | 14,491 | 15,325 | |||||
Other investments | 2,132 | 1,656 | |||||
Total Other | 41,269 | 43,569 | |||||
NOI at share - cash basis | $ | 298,976 | $ | 303,493 | |||
62
Supplemental Information - continued
Reconciliation of Net Income to NOI At Share and NOI At Share - Cash Basis for the Three Months Ended December 31, 2019 and September 30, 2019
(Amounts in thousands) | For the Three Months Ended | ||||||
December 31, 2019 | September 30, 2019 | ||||||
Net income | $ | 160,676 | $ | 363,849 | |||
Depreciation and amortization expense | 92,926 | 96,437 | |||||
General and administrative expense | 39,791 | 33,237 | |||||
Transaction related costs, impairment losses and other | 3,223 | 1,576 | |||||
Income from partially owned entities | (22,726 | ) | (25,946 | ) | |||
Loss (income) from real estate fund investments | 90,302 | (2,190 | ) | ||||
Interest and other investment income, net | (5,889 | ) | (3,045 | ) | |||
Interest and debt expense | 59,683 | 61,448 | |||||
Net gains on disposition of wholly owned and partially owned assets | (203,835 | ) | (309,657 | ) | |||
Income tax expense | 22,897 | 23,885 | |||||
(Income) loss from discontinued operations | (55 | ) | 8 | ||||
NOI from partially owned entities | 85,990 | 86,024 | |||||
NOI attributable to noncontrolling interests in consolidated subsidiaries | (17,417 | ) | (18,096 | ) | |||
NOI at share | 305,566 | 307,530 | |||||
Non cash adjustments for straight-line rents, amortization of acquired below-market leases, net and other | (6,590 | ) | (4,037 | ) | |||
NOI at share - cash basis | $ | 298,976 | $ | 303,493 | |||
63
Supplemental Information - continued
Three Months Ended December 31, 2019 Compared to September 30, 2019
Same Store Net Operating Income At Share
Below are reconciliations of NOI at share to same store NOI at share for our New York segment, theMART, 555 California Street and other investments for the three months ended December 31, 2019 compared to September 30, 2019.
(Amounts in thousands) | Total | New York | theMART | 555 California Street | Other | |||||||||||||||
NOI at share for the three months ended December 31, 2019 | $ | 305,566 | $ | 266,284 | $ | 22,712 | $ | 14,533 | $ | 2,037 | ||||||||||
Less NOI at share from: | ||||||||||||||||||||
Acquisitions | (118 | ) | (118 | ) | — | — | — | |||||||||||||
Dispositions | (62 | ) | (62 | ) | — | — | — | |||||||||||||
Development properties | (16,087 | ) | (16,087 | ) | — | — | — | |||||||||||||
Other non-same store (income) expense, net | (8,103 | ) | (5,968 | ) | (172 | ) | 74 | (2,037 | ) | |||||||||||
Same store NOI at share for the three months ended December 31, 2019 | $ | 281,196 | $ | 244,049 | $ | 22,540 | $ | 14,607 | $ | — | ||||||||||
NOI at share for the three months ended September 30, 2019 | $ | 307,530 | $ | 265,484 | $ | 24,862 | $ | 15,265 | $ | 1,919 | ||||||||||
Less NOI at share from: | ||||||||||||||||||||
Dispositions | (262 | ) | (262 | ) | — | — | — | |||||||||||||
Development properties | (19,429 | ) | (19,429 | ) | — | — | — | |||||||||||||
Other non-same store (income) expense, net | (11,254 | ) | (8,877 | ) | (532 | ) | 74 | (1,919 | ) | |||||||||||
Same store NOI at share for the three months ended September 30, 2019 | $ | 276,585 | $ | 236,916 | $ | 24,330 | $ | 15,339 | $ | — | ||||||||||
Increase (decrease) in same store NOI at share for the three months ended December 31, 2019 compared to September 30, 2019 | $ | 4,611 | $ | 7,133 | $ | (1,790 | ) | $ | (732 | ) | $ | — | ||||||||
% increase (decrease) in same store NOI at share | 1.7 | % | 3.0 | % | (1) | (7.4 | )% | (4.8 | )% | — | % | |||||||||
____________________
(1) | Excluding Hotel Pennsylvania, same store NOI at share increased by 1.7%. |
64
Supplemental Information - continued
Three Months Ended December 31, 2019 Compared to September 30, 2019 - continued
Same Store Net Operating Income At Share - continued
Below are reconciliations of NOI at share - cash basis to same store NOI at share - cash basis for our New York segment, theMART, 555 California Street and other investments for the three months ended December 31, 2019 compared to September 30, 2019.
(Amounts in thousands) | Total | New York | theMART | 555 California Street | Other | |||||||||||||||
NOI at share - cash basis for the three months ended December 31, 2019 | $ | 298,976 | $ | 257,707 | $ | 24,646 | $ | 14,491 | $ | 2,132 | ||||||||||
Less NOI at share - cash basis from: | ||||||||||||||||||||
Acquisitions | (49 | ) | (49 | ) | — | — | — | |||||||||||||
Dispositions | (66 | ) | (66 | ) | — | — | — | |||||||||||||
Development properties | (16,952 | ) | (16,952 | ) | — | — | — | |||||||||||||
Other non-same store income, net | (9,678 | ) | (7,374 | ) | (172 | ) | — | (2,132 | ) | |||||||||||
Same store NOI at share - cash basis for the three months ended December 31, 2019 | $ | 272,231 | $ | 233,266 | $ | 24,474 | $ | 14,491 | $ | — | ||||||||||
NOI at share - cash basis for the three months ended September 30, 2019 | $ | 303,493 | $ | 259,924 | $ | 26,588 | $ | 15,325 | $ | 1,656 | ||||||||||
Less NOI at share - cash basis from: | ||||||||||||||||||||
Dispositions | (693 | ) | (693 | ) | — | — | — | |||||||||||||
Development properties | (24,641 | ) | (24,641 | ) | — | — | — | |||||||||||||
Other non-same store income, net | (12,701 | ) | (10,174 | ) | (871 | ) | — | (1,656 | ) | |||||||||||
Same store NOI at share - cash basis for the three months ended September 30, 2019 | $ | 265,458 | $ | 224,416 | $ | 25,717 | $ | 15,325 | $ | — | ||||||||||
Increase (decrease) in same store NOI at share - cash basis for the three months ended December 31, 2019 compared to September 30, 2019 | $ | 6,773 | $ | 8,850 | $ | (1,243 | ) | $ | (834 | ) | $ | — | ||||||||
% increase (decrease) in same store NOI at share - cash basis | 2.6 | % | 3.9 | % | (1) | (4.8 | )% | (5.4 | )% | — | % | |||||||||
____________________
(1) | Excluding Hotel Pennsylvania, same store NOI at share - cash basis increased by 2.6%. |
65
Related Party Transactions
See Note 23 - Related Party Transactions to our consolidated financial statements in this Annual Report on Form 10-K for a discussion concerning related party transactions.
Liquidity and Capital Resources
Rental revenue is our primary source of cash flow and is dependent upon the occupancy and rental rates of our properties. Our cash requirements include property operating expenses, capital improvements, tenant improvements, debt service, leasing commissions, dividends to shareholders and distributions to unitholders of the Operating Partnership, as well as acquisition and development costs. Other sources of liquidity to fund cash requirements include proceeds from debt financings, including mortgage loans, senior unsecured borrowings, unsecured term loans and unsecured revolving credit facilities; proceeds from the issuance of common and preferred equity; and asset sales.
We anticipate that cash flow from continuing operations over the next twelve months will be adequate to fund our business operations, cash distributions to unitholders of the Operating Partnership, cash dividends to shareholders, debt amortization and recurring capital expenditures. Capital requirements for development expenditures and acquisitions may require funding from borrowings and/or equity offerings.
We expect to generate net cash of approximately $2 billion resulting from the sales of 100% of the 220 CPS residential condominium units, including $1 billion of after-tax net gain, of which $569,901,000 was recognized in our consolidated statements of income from inception to December 31, 2019. As of December 31, 2019, 91% of the condominium units are sold or under sales contracts, with closings scheduled through 2020.
We may from time to time purchase or retire outstanding debt securities or redeem our equity securities. Such purchases, if any, will depend on prevailing market conditions, liquidity requirements and other factors. The amounts involved in connection with these transactions could be material to our consolidated financial statements.
Dividends
On December 18, 2019, Vornado's Board of Trustees declared a special dividend of $1.95 per share to common shareholders of record on December 30, 2019 (the "Record Date"). On January 15, 2020, $372,380,000 of cash was paid to Vornado's common shareholders and $25,912,000 of cash was paid to non-affiliated unitholders of the Operating Partnership for the special dividend.
On January 15, 2020, Vornado declared a quarterly common dividend of $0.66 per share (an indicated annual rate of $2.64 per common share). This dividend, if declared by the Board of Trustees for all of 2020, would require Vornado to pay out approximately $504,000,000 of cash for common share dividends. In addition, during 2020, Vornado expects to pay approximately $50,000,000 of cash dividends on outstanding preferred shares and approximately $35,000,000 of cash distributions to unitholders of the Operating Partnership.
66
Liquidity and Capital Resources - continued
Financing Activities and Contractual Obligations
We have an effective shelf registration for the offering of our equity and debt securities that is not limited in amount due to our status as a “well-known seasoned issuer.” We have issued senior unsecured notes from a shelf registration statement that contain financial covenants that restrict our ability to incur debt, and that require us to maintain a level of unencumbered assets based on the level of our secured debt. Our unsecured revolving credit facilities contain financial covenants that require us to maintain minimum interest coverage and maximum debt to market capitalization ratios, and provide for higher interest rates in the event of a decline in our ratings below Baa3/BBB. Our unsecured revolving credit facilities also contain customary conditions precedent to borrowing, including representations and warranties, and contain customary events of default that could give rise to accelerated repayment, including such items as failure to pay interest or principal. As of December 31, 2019, we are in compliance with all of the financial covenants required by our senior unsecured notes and our unsecured revolving credit facilities.
As of December 31, 2019, we had $1,515,012,000 of cash and cash equivalents and $2,159,120,000 of borrowing capacity under our unsecured revolving credit facilities, net of letters of credit of $15,880,000. A summary of our consolidated debt as of December 31, 2019 and 2018 is presented below.
(Amounts in thousands) | As of December 31, 2019 | As of December 31, 2018 | |||||||||
Consolidated debt: | Balance | Weighted Average Interest Rate | Balance | Weighted Average Interest Rate | |||||||
Variable rate | $ | 1,643,500 | 3.09% | $ | 3,292,382 | 4.31% | |||||
Fixed rate | 5,801,516 | 3.57% | 6,603,465 | 3.65% | |||||||
Total | 7,445,016 | 3.46% | 9,895,847 | 3.87% | |||||||
Deferred financing costs, net and other | (38,407 | ) | (59,226 | ) | |||||||
Total, net | $ | 7,406,609 | $ | 9,836,621 | |||||||
Our consolidated outstanding debt, net of deferred financing costs and other, was $7,406,609,000 at December 31, 2019, a $2,430,012,000 decrease from the balance at December 31, 2018. During 2020 and 2021, $450,000,000 and $2,326,516,000, respectively, of our outstanding debt matures; we may refinance this maturing debt as it comes due or choose to repay it using cash and cash equivalents or our unsecured revolving credit facilities. We may also refinance or prepay other outstanding debt depending on prevailing market conditions, liquidity requirements and other factors. The amounts involved in connection with these transactions could be material to our consolidated financial statements.
Below is a schedule of our contractual obligations and commitments at December 31, 2019.
(Amounts in thousands) | Less than 1 Year | ||||||||||||||||||
Contractual cash obligations(1) (principal and interest(2)): | Total | 1 – 3 Years | 3 – 5 Years | Thereafter | |||||||||||||||
Notes and mortgages payable | $ | 6,190,143 | $ | 1,719,730 | $ | 2,812,979 | $ | 886,033 | $ | 771,401 | |||||||||
Operating leases | 1,206,060 | 28,192 | 60,351 | 62,636 | 1,054,881 | ||||||||||||||
Purchase obligations, primarily construction commitments | 679,579 | 558,568 | 121,011 | — | — | ||||||||||||||
Senior unsecured notes due 2025 | 529,406 | 15,750 | 31,500 | 31,500 | 450,656 | ||||||||||||||
Unsecured term loan | 866,233 | 29,038 | 58,076 | 779,119 | — | ||||||||||||||
Revolving credit facilities | 618,596 | 14,260 | 26,911 | 577,425 | — | ||||||||||||||
Other obligations(3) | 556,852 | 6,991 | 14,673 | 16,139 | 519,049 | ||||||||||||||
Total contractual cash obligations | $ | 10,646,869 | $ | 2,372,529 | $ | 3,125,501 | $ | 2,352,852 | $ | 2,795,987 | |||||||||
Commitments: | |||||||||||||||||||
Capital commitments to partially owned entities | $ | 12,643 | $ | 12,643 | $ | — | $ | — | $ | — | |||||||||
Standby letters of credit | 15,880 | 15,880 | — | — | — | ||||||||||||||
Total commitments | $ | 28,523 | $ | 28,523 | $ | — | $ | — | $ | — | |||||||||
____________________
(1) | Excludes committed tenant-related obligations as timing and amounts of payments are uncertain and may only be due upon satisfactory performance of certain conditions. |
(2) | Interest on variable rate debt is computed using rates in effect at December 31, 2019. |
(3) | Represents rent and fixed payments in lieu of real estate taxes due to Empire State Development ("ESD"), an entity of New York State, for the Farley Office and Retail Building. |
67
Liquidity and Capital Resources – continued
Financing Activities and Contractual Obligations – continued
Details of 2019 financing activities are provided in the “Overview” of Management’s Discussion and Analysis of Financial Conditions and Results of Operations. Details of 2018 financing activities are discussed below.
Preferred Securities
On January 4 and 11, 2018, we redeemed all of the outstanding 6.625% Series G and Series I cumulative redeemable preferred shares/ units at their redemption price of $25.00 per share/unit, or $470,000,000 in the aggregate, plus accrued and unpaid dividends/distributions through the date of redemption, and expensed $14,486,000 of previously capitalized issuance costs.
Unsecured Term Loan
On October 26, 2018, we extended our $750,000,000 unsecured term loan from October 2020 to February 2024. The interest rate on the extended unsecured term loan was lowered from LIBOR plus 1.15% to LIBOR plus 1.00%. In connection with the extension of our unsecured term loan, we entered into an interest rate swap from LIBOR plus 1.00% to a fixed rate of 3.87% through October 2023.
Secured Debt
On January 5, 2018, we completed a $100,000,000 refinancing of 33-00 Northern Boulevard (Center Building), a 471,000 square foot office building in Long Island City, New York. The seven-year loan is at LIBOR plus 1.80%, which was swapped to a fixed rate of 4.14%. We realized net proceeds of approximately $37,200,000 after repayment of the existing 4.43% $59,800,000 mortgage and closing costs.
On April 19, 2018, the joint venture between the Fund and the Crowne Plaza Joint Venture completed a $255,000,000 refinancing of the Crowne Plaza Times Square Hotel. The interest-only loan is at LIBOR plus 3.53% and matures in May 2020 with three one-year extension options. In connection therewith, the joint venture purchased an interest rate cap that caps LIBOR at a rate of 4.00%. The Crowne Plaza Times Square Hotel was previously encumbered by a $310,000,000 interest-only mortgage at LIBOR plus 2.80%, which was scheduled to mature in December 2018.
On June 11, 2018, the joint venture that owns Independence Plaza, a three-building 1,327-unit Manhattan residential complex completed a $675,000,000 refinancing of Independence Plaza. The seven-year interest-only loan matures in July 2025 and has a fixed rate of 4.25%. Our share of net proceeds, after repayment of the existing 3.48% $550,000,000 mortgage and closing costs, was $55,618,000.
On August 9, 2018, we completed a $120,000,000 refinancing of 4 Union Square South, a 206,000 square foot Manhattan retail property. The interest-only loan carries a rate of LIBOR plus 1.40% and matures in 2025, as extended. The property was previously encumbered by a $113,000,000 mortgage at LIBOR plus 2.15%, which was scheduled to mature in 2019.
On November 16, 2018, we completed a $205,000,000 refinancing of 150 West 34th Street, a 78,000 square foot Manhattan retail property. The interest-only loan carries a rate of LIBOR plus 1.88% and matures in 2024, as extended. Concurrently, we invested $105,000,000 in a participation in the refinanced mortgage loan, which earns interest at a rate of LIBOR plus 2.00% and also matures in 2024, as extended, and is included in "other assets" on our consolidated balance sheets. The property was previously encumbered by a mortgage of the same amount at LIBOR plus 2.25%, which was scheduled to mature in 2020.
Off-Balance Sheet Arrangements
Our off‑balance sheet arrangements consist primarily of our investments in joint ventures. All debt of our joint venture arrangements is non-recourse to us except for the mortgage loans secured by 640 Fifth Avenue and 7 West 34th Street, which we guaranteed and therefore are part of our tax basis. Our off-balance sheet arrangements are discussed in Note 6 - Investments in Partially Owned Entities and Note 22 - Commitments and Contingencies in our consolidated financial statements in this Annual Report on Form 10-K.
68
Liquidity and Capital Resources – continued
Certain Future Cash Requirements
Capital Expenditures
The following table summarizes anticipated 2020 capital expenditures.
(Amounts in millions, except per square foot data) | Total | New York | theMART | 555 California Street | |||||||||||
Expenditures to maintain assets | $ | 113.0 | $ | 90.0 | $ | 18.0 | $ | 5.0 | |||||||
Tenant improvements | 143.0 | 128.0 | 15.0 | — | |||||||||||
Leasing commissions | 47.0 | 42.0 | 5.0 | — | |||||||||||
Total recurring tenant improvements, leasing commissions and other capital expenditures | $ | 303.0 | $ | 260.0 | $ | 38.0 | $ | 5.0 | |||||||
Square feet budgeted to be leased (in thousands) | 2,000 | 400 | — | ||||||||||||
Weighted average lease term (years) | 10.0 | 8.5 | — | ||||||||||||
Tenant improvements and leasing commissions: | |||||||||||||||
Per square foot | $ | 85.00 | $ | 50.00 | $ | — | |||||||||
Per square foot per annum | 8.50 | 6.00 | — | ||||||||||||
The table above excludes anticipated capital expenditures of each of our partially owned non-consolidated subsidiaries, as these entities fund their capital expenditures without additional equity contributions from us.
Development and Redevelopment Expenditures
220 CPS
We are constructing a residential condominium tower containing 397,000 salable square feet at 220 CPS. The development cost of this project (exclusive of land cost of $515.4 million) is estimated to be approximately $1.450 billion, of which $1.373 billion has been expended as of December 31, 2019.
Penn District
We are redeveloping PENN1, a 2,545,000 square foot office building located on 34th Street between Seventh and Eighth Avenue. The development cost of this project is estimated to be $325,000,000, of which $69,006,000 has been expended as of December 31, 2019.
We are redeveloping PENN2, a 1,795,000 square foot (as expanded) office building, located on the west side of Seventh Avenue between 31st and 33rd Street. The development cost of this project is estimated to be $750,000,000, of which $40,820,000 has been expended as of December 31, 2019.
We are also making districtwide improvements within the Penn District. The development cost of these improvements is estimated to be $100,000,000, of which $6,314,000 has been expended as of December 31, 2019.
Our 95.0% joint venture (the remaining 5.0% is owned by the Related Companies ("Related")) is developing the Farley Office and Retail Building (the "Project"), which will include approximately 844,000 rentable square feet of commercial space, comprised of approximately 730,000 square feet of office space and approximately 114,000 square feet of retail space. The total development cost of the Project is estimated to be approximately $1,030,000,000. As of December 31, 2019, $597,600,000 has been expended.
The joint venture has entered into a development agreement with ESD to build the adjacent Moynihan Train Hall, with Vornado and Related each guaranteeing the joint venture's obligations. The joint venture has entered into a design-build contract with Skanska Moynihan Train Hall Builders pursuant to which they will build the Moynihan Train Hall, thereby fulfilling all of the joint venture's obligations to ESD. The obligations of Skanska Moynihan Train Hall Builders have been bonded by Skanska USA and bear a full guaranty from Skanska AB. The development expenditures for the Moynihan Train Hall are estimated to be approximately $1.6 billion, which will be funded by governmental agencies.
On December 19, 2019, we paid Kmart Corporation $34,000,000, of which $10,000,000 is expected to be reimbursed, to early terminate their 141,000 square foot retail space lease at PENN1 which was scheduled to expire in January 2036.
We recently entered into a development agreement with Metropolitan Transportation Authority to oversee the development of the Long Island Rail Road 33rd Street entrance at Penn Station which Skanska USA Civil Northeast, Inc. will construct under a fixed price contract for $120,805,000.
69
Liquidity and Capital Resources – continued
Development and Redevelopment Expenditures - continued
Other
We are redeveloping a 78,000 square foot Class A office building at 345 Montgomery Street, a part of our 555 California Street complex in San Francisco (70.0% interest) located at the corner of California and Pine Street. The development cost of this project is estimated to be approximately $50,000,000, of which our share is $35,000,000. As of December 31, 2019, $48,087,000 has been expended, of which our share is $33,661,000.
We are redeveloping a 165,000 square foot office building at 825 Seventh Avenue, located at the corner of 53rd Street and Seventh Avenue (50.0% interest). The redevelopment cost of this project is estimated to be approximately $30,000,000, of which our share is $15,000,000. As of December 31, 2019, $23,128,000 has been expended, of which our share is $11,564,000.
We are also evaluating other development and redevelopment opportunities at certain of our properties in Manhattan including, in particular, the Penn District.
There can be no assurance that the above projects will be completed, completed on schedule or within budget.
Insurance
For our properties except the Farley Office and Retail Building, we maintain general liability insurance with limits of $300,000,000 per occurrence and per property, and all risk property and rental value insurance with limits of $2.0 billion per occurrence, with sub-limits for certain perils such as flood and earthquake. Our California properties have earthquake insurance with coverage of $350,000,000 per occurrence and in the aggregate, subject to a deductible in the amount of 5% of the value of the affected property. We maintain coverage for certified terrorism acts with limits of $6.0 billion per occurrence and in the aggregate (as listed below), $1.2 billion for non-certified acts of terrorism, and $5.0 billion per occurrence and in the aggregate for terrorism involving nuclear, biological, chemical and radiological (“NBCR”) terrorism events, as defined by the Terrorism Risk Insurance Act of 2002, as amended to date and which has been extended through December 2027.
Penn Plaza Insurance Company, LLC (“PPIC”), our wholly owned consolidated subsidiary, acts as a re-insurer with respect to a portion of all risk property and rental value insurance and a portion of our earthquake insurance coverage, and as a direct insurer for coverage for acts of terrorism including NBCR acts. Coverage for acts of terrorism (excluding NBCR acts) is fully reinsured by third party insurance companies and the Federal government with no exposure to PPIC. For NBCR acts, PPIC is responsible for a deductible of $1,430,413 and 20% of the balance of a covered loss and the Federal government is responsible for the remaining portion of a covered loss. We are ultimately responsible for any loss incurred by PPIC.
For the Farley Office and Retail Building, we maintain general liability insurance with limits of $100,000,000 per occurrence, and builder’s risk insurance including coverage for existing property and development activities of $2.8 billion per occurrence and in the aggregate. We maintain coverage for certified and non-certified terrorism acts with limits of $1.0 billion per occurrence and in the aggregate.
We continue to monitor the state of the insurance market and the scope and costs of coverage for acts of terrorism and other events. However, we cannot anticipate what coverage will be available on commercially reasonable terms in the future. We are responsible for uninsured losses and for deductibles and losses in excess of our insurance coverage, which could be material.
Our debt instruments, consisting of mortgage loans secured by our properties, senior unsecured notes and revolving credit agreements contain customary covenants requiring us to maintain insurance. Although we believe that we have adequate insurance coverage for purposes of these agreements, we may not be able to obtain an equivalent amount of coverage at reasonable costs in the future. Further, if lenders insist on greater coverage than we are able to obtain it could adversely affect our ability to finance or refinance our properties and expand our portfolio.
70
Liquidity and Capital Resources – continued
Other Commitments and Contingencies
We are from time to time involved in legal actions arising in the ordinary course of business. In our opinion, after consultation with legal counsel, the outcome of such matters is not currently expected to have a material adverse effect on our financial position, results of operations or cash flows.
Each of our properties has been subjected to varying degrees of environmental assessment at various times. The environmental assessments did not reveal any material environmental contamination. However, there can be no assurance that the identification of new areas of contamination, changes in the extent or known scope of contamination, the discovery of additional sites, or changes in cleanup requirements would not result in significant costs to us.
In July 2018, we leased 78,000 square feet at 345 Montgomery Street in San Francisco, CA, to a subsidiary of Regus PLC, for an initial term of 15 years. The obligations under the lease were guaranteed by Regus PLC in an amount of up to $90,000,000. The tenant purported to terminate the lease prior to space delivery. We commenced a suit on October 23, 2019 seeking to enforce the lease and the guarantee.
Our mortgage loans are non-recourse to us, except for the mortgage loans secured by 640 Fifth Avenue, 7 West 34th Street and 435 Seventh Avenue, which we guaranteed and therefore are part of our tax basis. In certain cases we have provided guarantees or master leased tenant space. These guarantees and master leases terminate either upon the satisfaction of specified circumstances or repayment of the underlying loans. In addition, we have guaranteed the rent and payments in lieu of real estate taxes due to ESD, an entity of New York State, for the Farley Office and Retail Building. As of December 31, 2019, the aggregate dollar amount of these guarantees and master leases is approximately $1,524,000,000.
As of December 31, 2019, $15,880,000 of letters of credit were outstanding under one of our unsecured revolving credit facilities. Our unsecured revolving credit facilities contain financial covenants that require us to maintain minimum interest coverage and maximum debt to market capitalization ratios, and provide for higher interest rates in the event of a decline in our ratings below Baa3/BBB. Our unsecured revolving credit facilities also contain customary conditions precedent to borrowing, including representations and warranties, and also contain customary events of default that could give rise to accelerated repayment, including such items as failure to pay interest or principal.
The joint venture in which we own a 95.0% ownership interest was designated by ESD to develop the Farley Office and Retail Building. The joint venture entered into a development agreement with ESD and a design-build contract with Skanska Moynihan Train Hall Builders. Under the development agreement with ESD, the joint venture is obligated to build the Moynihan Train Hall, with Vornado and Related each guaranteeing the joint venture’s obligations. Under the design-build agreement, Skanska Moynihan Train Hall Builders is obligated to fulfill all of the joint venture’s obligations. The obligations of Skanska Moynihan Train Hall Builders have been bonded by Skanska USA and bear a full guaranty from Skanska AB.
As of December 31, 2019, we expect to fund additional capital to certain of our partially owned entities aggregating approximately $12,700,000.
As of December 31, 2019, we have construction commitments aggregating approximately $627,000,000.
Cash Flows for the Year Ended December 31, 2019 Compared to December 31, 2018
Our cash flow activities for the years ended December 31, 2019 and 2018 are summarized as follows:
(Amounts in thousands) | For the Year Ended December 31, | (Decrease) Increase in Cash Flow | |||||||||
2019 | 2018 | ||||||||||
Net cash provided by operating activities | $ | 662,539 | $ | 802,641 | $ | (140,102 | ) | ||||
Net cash provided by (used in) investing activities | 2,463,276 | (877,722 | ) | 3,340,998 | |||||||
Net cash used in financing activities | (2,235,589 | ) | (1,122,826 | ) | (1,112,763 | ) | |||||
Cash and cash equivalents and restricted cash was $1,607,131,000 at December 31, 2019, a $890,226,000 increase from the balance at December 31, 2018.
Net cash provided by operating activities of $662,539,000 for the year ended December 31, 2019 was comprised of $687,705,000 of cash from operations, including distributions of income from partially owned entities of $116,826,000 and a net decrease of $25,166,000 in cash due to the timing of cash receipts and payments related to changes in operating assets and liabilities.
71
Liquidity and Capital Resources – continued
Cash Flows for the Year Ended December 31, 2019 Compared to December 31, 2018 - continued
The following table details the cash provided by (used in) investing activities for the years ended December 31, 2019 and 2018:
(Amounts in thousands) | For the Year Ended December 31, | Increase (Decrease) in Cash Flow | |||||||||
2019 | 2018 | ||||||||||
Proceeds from sale of condominium units at 220 Central Park South | $ | 1,605,356 | $ | 214,776 | $ | 1,390,580 | |||||
Proceeds from transfer of interest in Fifth Avenue and Times Square JV (net of $35,562 of transaction costs and $10,899 of deconsolidated cash and restricted cash) | 1,248,743 | — | 1,248,743 | ||||||||
Development costs and construction in progress | (649,056 | ) | (418,186 | ) | (230,870 | ) | |||||
Proceeds from redemption of 640 Fifth Avenue preferred equity | 500,000 | — | 500,000 | ||||||||
Moynihan Train Hall expenditures | (438,935 | ) | (74,609 | ) | (364,326 | ) | |||||
Proceeds from sale of real estate and related investments | 324,201 | 219,731 | 104,470 | ||||||||
Additions to real estate | (233,666 | ) | (234,602 | ) | 936 | ||||||
Proceeds from sales of marketable securities | 168,314 | 4,101 | 164,213 | ||||||||
Acquisitions of real estate and other | (69,699 | ) | (574,812 | ) | 505,113 | ||||||
Distributions of capital from partially owned entities | 24,880 | 100,178 | (75,298 | ) | |||||||
Investments in partially owned entities | (18,257 | ) | (37,131 | ) | 18,874 | ||||||
Proceeds from repayments of loans receivable | 1,395 | 25,757 | (24,362 | ) | |||||||
Investments in loans receivable | — | (105,000 | ) | 105,000 | |||||||
Net consolidation of Farley Office and Retail Building | — | 2,075 | (2,075 | ) | |||||||
Net cash provided by (used in) investing activities | $ | 2,463,276 | $ | (877,722 | ) | $ | 3,340,998 | ||||
The following table details the cash used in financing activities for the years ended December 31, 2019 and 2018:
(Amounts in thousands) | For the Year Ended December 31, | (Decrease) Increase in Cash Flow | |||||||||
2019 | 2018 | ||||||||||
Repayments of borrowings | $ | (2,718,987 | ) | $ | (685,265 | ) | $ | (2,033,722 | ) | ||
Proceeds from borrowings | 1,108,156 | 526,766 | 581,390 | ||||||||
Dividends paid on common shares/Distributions to Vornado | (503,785 | ) | (479,348 | ) | (24,437 | ) | |||||
Moynihan Train Hall reimbursement from Empire State Development | 438,935 | 74,609 | 364,326 | ||||||||
Purchase of marketable securities in connection with defeasance of mortgage payable | (407,126 | ) | — | (407,126 | ) | ||||||
Distributions to redeemable security holders and noncontrolling interests in consolidated subsidiaries | (80,194 | ) | (76,149 | ) | (4,045 | ) | |||||
Dividends paid on preferred shares/Distributions to preferred unitholders | (50,131 | ) | (55,115 | ) | 4,984 | ||||||
Contributions from noncontrolling interests in consolidated subsidiaries | 17,871 | 61,062 | (43,191 | ) | |||||||
Prepayment penalty on redemption of senior unsecured notes due 2022 | (22,058 | ) | — | (22,058 | ) | ||||||
Debt issuance costs | (15,588 | ) | (12,908 | ) | (2,680 | ) | |||||
Repurchase of shares/Class A units related to stock compensation agreements and related tax withholdings and other | (8,692 | ) | (12,969 | ) | 4,277 | ||||||
Proceeds received from exercise of Vornado stock options and other | 6,903 | 7,309 | (406 | ) | |||||||
Redemption of preferred shares/units | (893 | ) | (470,000 | ) | 469,107 | ||||||
Debt prepayment and extinguishment costs | — | (818 | ) | 818 | |||||||
Net cash used in financing activities | $ | (2,235,589 | ) | $ | (1,122,826 | ) | $ | (1,112,763 | ) | ||
72
Liquidity and Capital Resources – continued
Capital Expenditures for the Year Ended December 31, 2019
Capital expenditures consist of expenditures to maintain assets, tenant improvement allowances and leasing commissions. Recurring capital expenditures include expenditures to maintain a property’s competitive position within the market and tenant improvements and leasing commissions necessary to re-lease expiring leases or renew or extend existing leases. Non-recurring capital improvements include expenditures to lease space that has been vacant for more than nine months and expenditures completed in the year of acquisition and the following two years that were planned at the time of acquisition, as well as tenant improvements and leasing commissions for space that was vacant at the time of acquisition of a property.
Below is a summary of amounts paid for capital expenditures and leasing commissions for the year ended December 31, 2019.
(Amounts in thousands) | Total | New York | theMART | 555 California Street | |||||||||||
Expenditures to maintain assets | $ | 93,226 | $ | 80,416 | $ | 9,566 | $ | 3,244 | |||||||
Tenant improvements | 98,261 | 84,870 | 9,244 | 4,147 | |||||||||||
Leasing commissions | 18,229 | 16,316 | 827 | 1,086 | |||||||||||
Recurring tenant improvements, leasing commissions and other capital expenditures | 209,716 | 181,602 | 19,637 | 8,477 | |||||||||||
Non-recurring capital expenditures | 30,374 | 28,269 | 332 | 1,773 | |||||||||||
Total capital expenditures and leasing commissions | $ | 240,090 | $ | 209,871 | $ | 19,969 | $ | 10,250 | |||||||
Development and Redevelopment Expenditures for the Year Ended December 31, 2019
Development and redevelopment expenditures consist of all hard and soft costs associated with the development or redevelopment of a property, including capitalized interest, debt and operating costs until the property is substantially completed and ready for its intended use. Our development project estimates below include initial leasing costs, which are reflected as non-recurring capital expenditures in the table above.
Below is a summary of amounts paid for development and redevelopment expenditures in the year ended December 31, 2019. These expenditures include interest and debt expense of $72,200,000, payroll of $16,014,000, and other soft costs (primarily architectural and engineering fees, permits, real estate taxes and professional fees) aggregating $83,463,000, which were capitalized in connection with the development and redevelopment of these projects.
(Amounts in thousands) | Total | New York | theMART | 555 California Street | Other | ||||||||||||||
Farley Office and Retail Building | $ | 265,455 | $ | 265,455 | $ | — | $ | — | $ | — | |||||||||
220 CPS | 181,177 | — | — | — | 181,177 | ||||||||||||||
PENN1 | 51,168 | 51,168 | — | — | — | ||||||||||||||
345 Montgomery Street | 29,441 | — | — | 29,441 | — | ||||||||||||||
PENN2 | 28,719 | 28,719 | — | — | — | ||||||||||||||
606 Broadway | 7,434 | 7,434 | — | — | — | ||||||||||||||
1535 Broadway | 1,031 | 1,031 | — | — | — | ||||||||||||||
Other | 84,631 | 78,128 | 2,322 | 3,896 | 285 | ||||||||||||||
$ | 649,056 | $ | 431,935 | $ | 2,322 | $ | 33,337 | $ | 181,462 | ||||||||||
73
Liquidity and Capital Resources – continued
Capital Expenditures for the Year Ended December 31, 2018
Below is a summary of amounts paid for capital expenditures and leasing commissions for the year ended December 31, 2018.
(Amounts in thousands) | Total | New York | theMART | 555 California Street | |||||||||||
Expenditures to maintain assets | $ | 92,386 | $ | 70,954 | $ | 13,282 | $ | 8,150 | |||||||
Tenant improvements | 100,191 | 76,187 | 15,106 | 8,898 | |||||||||||
Leasing commissions | 33,254 | 29,435 | 459 | 3,360 | |||||||||||
Recurring tenant improvements, leasing commissions and other capital expenditures | 225,831 | 176,576 | 28,847 | 20,408 | |||||||||||
Non-recurring capital expenditures | 43,135 | 31,381 | 260 | 11,494 | |||||||||||
Total capital expenditures and leasing commissions | $ | 268,966 | $ | 207,957 | $ | 29,107 | $ | 31,902 | |||||||
Development and Redevelopment Expenditures for the Year Ended December 31, 2018
Below is a summary of amounts paid for development and redevelopment expenditures in the year ended December 31, 2018. These expenditures include interest and debt expense of $73,166,000, payroll of $12,120,000, and other soft costs (primarily architectural and engineering fees, permits, real estate taxes and professional fees) aggregating $66,651,000, which were capitalized in connection with the development and redevelopment of these projects.
(Amounts in thousands) | Total | New York | theMART | 555 California Street | Other | ||||||||||||||
220 CPS | $ | 295,827 | $ | — | $ | — | $ | — | $ | 295,827 | |||||||||
Farley Office and Retail Building(1) | 18,995 | 18,995 | — | — | — | ||||||||||||||
345 Montgomery Street | 18,187 | — | — | 18,187 | — | ||||||||||||||
PENN2 | 16,288 | 16,288 | — | — | — | ||||||||||||||
606 Broadway | 15,959 | 15,959 | — | — | — | ||||||||||||||
PENN1 | 8,856 | 8,856 | — | — | — | ||||||||||||||
1535 Broadway | 8,645 | 8,645 | — | — | — | ||||||||||||||
Other | 35,429 | 20,372 | 10,790 | 445 | 3,822 | ||||||||||||||
$ | 418,186 | $ | 89,115 | $ | 10,790 | $ | 18,632 | $ | 299,649 | ||||||||||
____________________
(1) Includes amounts paid for development from October 30, 2018, the date of consolidation of the Farley Office and Retail Building.
Funds From Operations
Vornado Realty Trust
FFO is computed in accordance with the definition adopted by the Board of Governors of the National Association of Real Estate Investment Trusts (“NAREIT”). NAREIT defines FFO as GAAP net income or loss adjusted to exclude net gains from sales of depreciable real estate assets, real estate impairment losses, depreciation and amortization expense from real estate assets and other specified items, including the pro rata share of such adjustments of unconsolidated subsidiaries. FFO and FFO per diluted share are non-GAAP financial measures used by management, investors and analysts to facilitate meaningful comparisons of operating performance between periods and among our peers because it excludes the effect of real estate depreciation and amortization and net gains on sales, which are based on historical costs and implicitly assume that the value of real estate diminishes predictably over time, rather than fluctuating based on existing market conditions. FFO does not represent cash generated from operating activities and is not necessarily indicative of cash available to fund cash requirements and should not be considered as an alternative to net income as a performance measure or cash flow as a liquidity measure. FFO may not be comparable to similarly titled measures employed by other companies. The calculations of both the numerator and denominator used in the computation of income per share are disclosed in Note 19 – Income Per Share/Income Per Class A Unit, in our consolidated financial statements on page 130 of this Annual Report on Form 10-K.
74
FFO - continued
Vornado Realty Trust - continued
FFO attributable to common shareholders plus assumed conversions was $311,876,000, or $1.63 per diluted share, for the three months ended December 31, 2019, compared to $210,100,000, or $1.10 per diluted share, for the prior year's three months. FFO attributable to common shareholders plus assumed conversions was $1,003,398,000, or $5.25 per diluted share, for the year ended December 31, 2019, compared to $729,740,000, or $3.82 per diluted share, for the prior year. Details of certain items that impact FFO are discussed in the financial results summary of our “Overview.”
(Amounts in thousands, except per share amounts) | For the Three Months Ended December 31, | For the Year Ended December 31, | |||||||||||||
2019 | 2018 | 2019 | 2018 | ||||||||||||
Reconciliation of our net income attributable to common shareholders to FFO attributable to common shareholders plus assumed conversions: | |||||||||||||||
Net income attributable to common shareholders | $ | 193,217 | $ | 100,494 | $ | 3,097,806 | $ | 384,832 | |||||||
Per diluted share | $ | 1.01 | $ | 0.53 | $ | 16.21 | $ | 2.01 | |||||||
FFO adjustments: | |||||||||||||||
Depreciation and amortization of real property | $ | 85,609 | $ | 104,067 | $ | 389,024 | $ | 413,091 | |||||||
Net losses (gains) on sale of real estate | 58 | — | (178,711 | ) | (158,138 | ) | |||||||||
Real estate impairment losses | 565 | 12,000 | 32,001 | 12,000 | |||||||||||
Net gain on transfer to Fifth Avenue and Times Square JV on April 18, 2019, net of $11,945 attributable to noncontrolling interests | — | — | (2,559,154 | ) | — | ||||||||||
Net gain from sale of UE common shares (sold on March 4, 2019) | — | — | (62,395 | ) | — | ||||||||||
Decrease (increase) in fair value of marketable securities: | |||||||||||||||
PREIT | 2,438 | — | 21,649 | — | |||||||||||
Lexington (sold on March 1, 2019) | — | 1,662 | (16,068 | ) | 26,596 | ||||||||||
Other | — | (10 | ) | (48 | ) | (143 | ) | ||||||||
After-tax purchase price fair value adjustment on depreciable real estate | — | (27,289 | ) | — | (27,289 | ) | |||||||||
Proportionate share of adjustments to equity in net income of partially owned entities to arrive at FFO: | |||||||||||||||
Depreciation and amortization of real property | 37,389 | 24,309 | 134,706 | 101,591 | |||||||||||
Net gains on sale of real estate | — | — | — | (3,998 | ) | ||||||||||
Decrease in fair value of marketable securities | 864 | 2,081 | 2,852 | 3,882 | |||||||||||
126,923 | 116,820 | (2,236,144 | ) | 367,592 | |||||||||||
Noncontrolling interests' share of above adjustments | (8,278 | ) | (7,229 | ) | 141,679 | (22,746 | ) | ||||||||
FFO adjustments, net | $ | 118,645 | $ | 109,591 | $ | (2,094,465 | ) | $ | 344,846 | ||||||
FFO attributable to common shareholders | $ | 311,862 | $ | 210,085 | $ | 1,003,341 | $ | 729,678 | |||||||
Convertible preferred share dividends | 14 | 15 | 57 | 62 | |||||||||||
FFO attributable to common shareholders plus assumed conversions | $ | 311,876 | $ | 210,100 | $ | 1,003,398 | $ | 729,740 | |||||||
Per diluted share | $ | 1.63 | $ | 1.10 | $ | 5.25 | $ | 3.82 | |||||||
Reconciliation of Weighted Average Shares | |||||||||||||||
Weighted average common shares outstanding | 190,916 | 190,348 | 190,801 | 190,219 | |||||||||||
Effect of dilutive securities: | |||||||||||||||
Employee stock options and restricted share awards | 191 | 814 | 216 | 933 | |||||||||||
Convertible preferred shares | 33 | 37 | 34 | 37 | |||||||||||
Denominator for FFO per diluted share | 191,140 | 191,199 | 191,051 | 191,189 | |||||||||||
75
ITEM 7A. QUANTITATIVE AND QUALITATIVE DISCLOSURES ABOUT MARKET RISK
We have exposure to fluctuations in market interest rates. Market interest rates are sensitive to many factors that are beyond our control. Our exposure to a change in interest rates on our consolidated and non-consolidated debt (all of which arises out of non-trading activity) is as follows:
(Amounts in thousands, except per share and unit amounts) | 2019 | 2018 | |||||||||||||
December 31, Balance | Weighted Average Interest Rate | Effect of 1% Change In Base Rates | December 31, Balance | Weighted Average Interest Rate | |||||||||||
Consolidated debt: | |||||||||||||||
Variable rate | $ | 1,643,500 | 3.09% | $ | 16,435 | $ | 3,292,382 | 4.31% | |||||||
Fixed rate | 5,801,516 | 3.57% | — | 6,603,465 | 3.65% | ||||||||||
$ | 7,445,016 | 3.46% | 16,435 | $ | 9,895,847 | 3.87% | |||||||||
Pro rata share of debt of non-consolidated entities(1)(2): | |||||||||||||||
Variable rate | $ | 1,441,690 | 3.34% | 14,417 | $ | 1,237,388 | 4.06% | ||||||||
Fixed rate | 1,361,169 | 3.93% | — | 1,382,068 | 4.19% | ||||||||||
$ | 2,802,859 | 3.62% | 14,417 | $ | 2,619,456 | 4.13% | |||||||||
Noncontrolling interests’ share of consolidated subsidiaries | (339 | ) | |||||||||||||
Total change in annual net income attributable to the Operating Partnership | 30,513 | ||||||||||||||
Noncontrolling interests’ share of the Operating Partnership | (1,944 | ) | |||||||||||||
Total change in annual net income attributable to Vornado | $ | 28,569 | |||||||||||||
Total change in annual net income attributable to the Operating Partnership per diluted Class A unit | $ | 0.15 | |||||||||||||
Total change in annual net income attributable to Vornado per diluted share | $ | 0.15 | |||||||||||||
_______________________
(1) | As a result of the bankruptcy plan of reorganization for Toys "R" Us, Inc. ("Toys") being declared effective and our stock in Toys being canceled, we no longer hold an investment in Toys. Accordingly, no Toys debt is included in our pro rata share of debt of non-consolidated entities. |
(2) | Our pro rata share of debt of non-consolidated entities as of December 31, 2019 and 2018 is net of our $63,409 share of Alexander's participation in its Rego Park II shopping center mortgage loan which is considered partially extinguished as the participation interest is a reacquisition of debt. |
Derivatives and Hedging
We utilize various financial instruments to mitigate the impact of interest rate fluctuations on our cash flows and earnings, including hedging strategies, depending on our analysis of the interest rate environment and the costs and risks of such strategies. The following table summarizes our consolidated derivative instruments, all of which hedge variable rate debt, as of December 31, 2019.
(Amounts in thousands) | As of December 31, 2019 | |||||||||||||||
Variable Rate | ||||||||||||||||
Hedged Item (Interest rate swaps) | Fair Value | Notional Amount | Spread over LIBOR | Interest Rate | Swapped Rate | Expiration Date | ||||||||||
Included in other assets: | ||||||||||||||||
770 Broadway mortgage loan | $ | 4,045 | $ | 700,000 | L+175 | 3.46% | 2.56% | 9/20 | ||||||||
888 Seventh Avenue mortgage loan | 218 | 375,000 | L+170 | 3.44% | 3.25% | 12/20 | ||||||||||
Other | 64 | 175,000 | ||||||||||||||
$ | 4,327 | $ | 1,250,000 | |||||||||||||
Included in other liabilities: | ||||||||||||||||
Unsecured term loan | $ | 36,809 | $ | 750,000 | L+100 | 2.80% | 3.87% | 10/23 | ||||||||
33-00 Northern Boulevard mortgage loan | 3,545 | 100,000 | L+180 | 3.52% | 4.14% | 1/25 | ||||||||||
$ | 40,354 | $ | 850,000 | |||||||||||||
Fair Value of Debt
The estimated fair value of our consolidated debt is calculated based on current market prices and discounted cash flows at the current rate at which similar loans would be made to borrowers with similar credit ratings for the remaining term of such debt. As of December 31, 2019, the estimated fair value of our consolidated debt was $7,507,000,000.
76
ITEM 8. FINANCIAL STATEMENTS AND SUPPLEMENTARY DATA
INDEX TO FINANCIAL STATEMENTS
Page Number | |
Vornado Realty Trust | |
Consolidated Balance Sheets at December 31, 2019 and 2018 | |
Consolidated Statements of Income for the years ended December 31, 2019, 2018 and 2017 | |
Consolidated Statements of Comprehensive Income for the years ended December 31, 2019, 2018 and 2017 | |
Consolidated Statements of Changes in Equity for the years ended December 31, 2019, 2018 and 2017 | |
Consolidated Statements of Cash Flows for the years ended December 31, 2019, 2018 and 2017 | |
Vornado Realty L.P. | |
Consolidated Balance Sheets at December 31, 2019 and 2018 | |
Consolidated Statements of Income for the years ended December 31, 2019, 2018 and 2017 | |
Consolidated Statements of Comprehensive Income for the years ended December 31, 2019, 2018 and 2017 | |
Consolidated Statements of Changes in Equity for the years ended December 31, 2019, 2018 and 2017 | |
Consolidated Statements of Cash Flows for the years ended December 31, 2019, 2018 and 2017 | |
77
REPORT OF INDEPENDENT REGISTERED PUBLIC ACCOUNTING FIRM
Shareholders and Board of Trustees
Vornado Realty Trust
New York, New York
Opinion on the Financial Statements
We have audited the accompanying consolidated balance sheets of Vornado Realty Trust and subsidiaries (the "Company") as of December 31, 2019 and 2018, the related consolidated statements of income, comprehensive income, changes in equity, and cash flows for each of the three years in the period ended December 31, 2019, and the related notes and the schedule listed in the Index at Item 15 (collectively referred to as the "financial statements"). In our opinion, the financial statements present fairly, in all material respects, the financial position of the Company as of December 31, 2019 and 2018, and the results of its operations and its cash flows for each of the three years in the period ended December 31, 2019, in conformity with the accounting principles generally accepted in the United States of America.
We have also audited, in accordance with the standards of the Public Company Accounting Oversight Board (United States) (PCAOB), the Company's internal control over financial reporting as of December 31, 2019, based on criteria established in Internal Control - Integrated Framework (2013) issued by the Committee of Sponsoring Organizations of the Treadway Commission and our report dated February 18, 2020, expressed an unqualified opinion on the Company's internal control over financial reporting.
Basis for Opinion
These financial statements are the responsibility of the Company's management. Our responsibility is to express an opinion on the Company's financial statements based on our audits. We are a public accounting firm registered with the PCAOB and are required to be independent with respect to the Company in accordance with the US federal securities laws and the applicable rules and regulations of the Securities and Exchange Commission and the PCAOB.
We conducted our audits in accordance with the standards of the PCAOB. Those standards require that we plan and perform the audit to obtain reasonable assurance about whether the financial statements are free of material misstatement, whether due to error or fraud. Our audits included performing procedures to assess the risks of material misstatement of the financial statements, whether due to error or fraud, and performing procedures that respond to those risks. Such procedures included examining, on a test basis, evidence regarding the amounts and disclosures in the financial statements. Our audits also included evaluating the accounting principles used and significant estimates made by management, as well as evaluating the overall presentation of the financial statements. We believe that our audits provide a reasonable basis for our opinion.
Critical Audit Matters
The critical audit matters communicated below are matters arising from the current-period audit of the financial statements that were communicated or required to be communicated to the audit committee and that (1) relate to accounts or disclosures that are material to the financial statements and (2) involved our especially challenging, subjective, or complex judgments. The communication of critical audit matters does not alter in any way our opinion on the financial statements, taken as a whole, and we are not, by communicating the critical audit matters below, providing separate opinions on the critical audit matters or on the accounts or disclosures to which they relate.
Investments in Partially Owned Entities - Fifth Avenue and Times Square JV - Refer to Notes 2 and 6 to the financial statements
Critical Audit Matter Description
Prior to April 18, 2019, the Company contributed its interests in properties located at 640 Fifth Avenue, 655 Fifth Avenue, 666 Fifth Avenue, 689 Fifth Avenue, 697-703 Fifth Avenue, 1535 Broadway, and 1540 Broadway (collectively, the “Properties”) to subsidiaries of a newly formed joint venture (“Fifth Avenue and Times Square JV”). On April 18, 2019, the Company transferred a 48.5% common interest in the joint venture to a group of institutional investors (the “Investors”) and retained the remaining 51.5% common interest in the joint venture and an aggregate $1.828 billion of preferred equity interests in certain of the Properties. Net cash proceeds from the transaction were $1.179 billion. The Company continues to manage and lease the Properties. The Company shares control with the Investors over major decisions of the joint venture, including decisions regarding leasing, operating and capital budgets, and refinancings.
78
The Company performed a Variable Interest Entity (“VIE”) and a Voting Interest Entity (“VOE”) analysis for the entities in the organizational structure of the transaction and concluded Fifth Avenue and Times Square JV is a VOE. The Company also determined that the entities in the organizational structure did not meet the criteria to qualify as a VIE. Through its detailed analysis of the various decision-making rights and powers that each party possesses, management concluded that the Company and the Investors both have the ability to block or participate in the activities that most significantly impact the entity’s economic performance. The Company no longer held a controlling financial interest in the joint venture and as a result deconsolidated the joint venture and began accounting for the investment under the equity method of accounting from the date of transfer. The transaction valued the Properties at $5.556 billion. As a result, there was a step-up in basis of the Company’s retained portion of the Properties to fair value. The gain on transfer consisted of both the gain on the partial sale of the Company’s interest and the gain resulting from the step-up in basis of the retained interest to fair value, less transaction costs, to arrive at an overall net gain of $2.571 billion.
We identified the consolidation analysis as a critical audit matter because the consolidation analysis, specifically the determination of control, and the propriety of gain recognition, involved an interpretation of especially complex accounting principles generally accepted in the United States of America. The evaluation of management’s determination of control required an increased extent of effort.
How the Critical Audit Matter Was Addressed in the Audit
Our audit procedures related to the accounting treatment of the partial sale included, among other things, the following:
• | We tested the effectiveness of controls over management’s determination of control over the joint venture, the resulting deconsolidation of the Properties, and whether a gain or loss should be recognized. |
• | We read transaction agreements, traced and agreed the facts included in the Company’s accounting treatment memo to the agreements, and evaluated the assumptions used to arrive at the determined conclusion. |
• | We consulted with our consolidation subject matter experts to assess the reasonableness of the Company’s accounting conclusions. |
• | We evaluated whether the assumptions were consistent with evidence obtained in other areas of the audit. |
Critical Audit Matter Description
The Fifth Avenue and Times Square JV transaction valued the Properties at $5.556 billion resulting in a financial statement net gain of $2.571 billion. The value was allocated to the assets and liabilities of each property based on their relative fair values. The Company utilized the market approach and the income approach to determine relative fair values. The income approach utilizes the present value of future cash flows that are based on a number of factors, including significant management estimates related to discount rates and capitalization rates, to determine the value of each asset and liability by property.
We identified the valuation of the Properties as a critical audit matter because performing audit procedures to evaluate the reasonableness of the discount rates and capitalization rates used to determine the value of each asset and liability by property required a high degree of auditor judgment and an increased extent of effort, including the need to involve our fair value specialists.
How the Critical Audit Matter Was Addressed in the Audit
Our audit procedures related to the relative fair value of assets acquired and liabilities assumed for the Fifth Avenue and Times Square JV transaction included, among other things, the following:
• | We tested the effectiveness of controls over the Company’s review of the compilation of inputs related to the valuation and the determination of fair value of assets acquired and liabilities assumed, including management’s valuation methodology. |
• | With the assistance of our fair value specialists, we assessed the reasonableness of management’s significant assumptions, such as discount and capitalization rates, using comparable market data. |
• | With the assistance of our fair value specialists, we evaluated the reasonableness of the significant assumptions, including testing the source information underlying the determination of these assumptions, testing the mathematical accuracy of the calculation, and developing a range of independent estimates and comparing those to the assumptions selected by management. |
• | We evaluated whether the assumptions were consistent with evidence obtained in other areas of the audit. |
79
Impairment Losses - Refer to Notes 2, 14, and 16 to the financial statements
Critical Audit Matter Description
The Company’s properties, including any related right-of-use assets and intangible assets, are individually reviewed for impairment whenever events or changes in circumstances indicate that the carrying amount may not be recoverable. An impairment exists when the carrying amount of an asset exceeds the aggregate projected future cash flows over the anticipated holding period on an undiscounted basis. An impairment loss is measured based on the excess of the property’s carrying amount over its fair value. The Company’s undiscounted cash flows is subjective and is based, in part, on estimates and assumptions such as market rental rates and capitalization rates. In the event a property is not recoverable, the Company’s evaluation of anticipated discounted cash flows is subjective and is based, in part, on estimates and assumptions such as market rental rates, capitalization rates, and discount rates that could differ materially from actual results. The Company recognizes impairment losses within “Transaction related costs, impairment losses and other” within the consolidated statements of income. Total non-cash impairment losses for the year ended December 31, 2019 were $107,221,000.
We identified the impairment of long-lived assets as a critical audit matter because of the significant estimates and assumptions management makes to evaluate the recoverability and fair value of the assets, specifically the estimates of market rental rates, capitalization rates, and discount rates for each real estate asset. Performing audit procedures to evaluate the reasonableness of these estimates and assumptions required a high degree of auditor judgment and an increased extent of effort, including the need to involve our fair value specialists.
How the Critical Audit Matter Was Addressed in the Audit
Our audit procedures related to the undiscounted and discounted cash flow analyses included, among other things, the following:
• | We tested the effectiveness of controls over management’s evaluation of the recoverability of long-lived assets based on undiscounted cash flows and the measurement of impairment based on discounted cash flows, including those over the market rental rates, capitalization rates, and discount rates used in the assessment. |
• | With the assistance of our fair value specialists, we evaluated the reasonableness of significant assumptions in the undiscounted and discounted cash flow analyses, including estimates of market rental rates, capitalization rates, and discount rates, for properties with impairment indicators. We developed independent estimates of the market rental rates, capitalization rates, and discount rates, focusing on geographical location and property type and compared our independent estimates to the estimates and assumptions used by the Company. In addition, we tested the mathematical accuracy of the undiscounted and discounted cash flow analyses. |
• | We evaluated the reasonableness of management’s undiscounted and discounted cash flow analyses by comparing management’s projections to the Company’s historical results and external market sources. |
• | We evaluated whether the assumptions were consistent with evidence obtained in other areas of the audit. |
/s/ DELOITTE & TOUCHE LLP
New York, New York
February 18, 2020
We have served as the Company’s auditor since 1976.
80
VORNADO REALTY TRUST
CONSOLIDATED BALANCE SHEETS
(Amounts in thousands, except unit, share and per share amounts) | As of December 31, | ||||||
2019 | 2018 | ||||||
ASSETS | |||||||
Real estate, at cost: | |||||||
Land | $ | $ | |||||
Buildings and improvements | |||||||
Development costs and construction in progress | |||||||
Moynihan Train Hall development expenditures | |||||||
Leasehold improvements and equipment | |||||||
Total | |||||||
Less accumulated depreciation and amortization | ( | ) | ( | ) | |||
Real estate, net | |||||||
Right-of-use assets | |||||||
Cash and cash equivalents | |||||||
Restricted cash | |||||||
Marketable securities | |||||||
Tenant and other receivables | |||||||
Investments in partially owned entities | |||||||
Real estate fund investments | |||||||
220 Central Park South condominium units ready for sale | |||||||
Receivable arising from the straight-lining of rents | |||||||
Deferred leasing costs, net of accumulated amortization of $196,229 and $207,529 | |||||||
Identified intangible assets, net of accumulated amortization of $98,587 and $172,114 | |||||||
Other assets | |||||||
$ | $ | ||||||
LIABILITIES, REDEEMABLE NONCONTROLLING INTERESTS AND EQUITY | |||||||
Mortgages payable, net | $ | $ | |||||
Senior unsecured notes, net | |||||||
Unsecured term loan, net | |||||||
Unsecured revolving credit facilities | |||||||
Lease liabilities | |||||||
Moynihan Train Hall obligation | |||||||
Special dividend/distribution payable on January 15, 2020 | |||||||
Accounts payable and accrued expenses | |||||||
Deferred revenue | |||||||
Deferred compensation plan | |||||||
Other liabilities | |||||||
Total liabilities | |||||||
Commitments and contingencies | |||||||
Redeemable noncontrolling interests: | |||||||
Class A units - 13,298,956 and 12,544,477 units outstanding | |||||||
Series D cumulative redeemable preferred units - 141,401 and 177,101 units outstanding | |||||||
Total redeemable noncontrolling interests | |||||||
Shareholders' equity: | |||||||
Preferred shares of beneficial interest: no par value per share; authorized 110,000,000 shares; issued and outstanding 36,795,640 and 36,798,580 shares | |||||||
Common shares of beneficial interest: $0.04 par value per share; authorized 250,000,000 shares; issued and outstanding 190,985,677 and 190,535,499 shares | |||||||
Additional capital | |||||||
Earnings less than distributions | ( | ) | ( | ) | |||
Accumulated other comprehensive (loss) income | ( | ) | |||||
Total shareholders' equity | |||||||
Noncontrolling interests in consolidated subsidiaries | |||||||
Total equity | |||||||
$ | $ | ||||||
See notes to the consolidated financial statements.
81
VORNADO REALTY TRUST
CONSOLIDATED STATEMENTS OF INCOME
(Amounts in thousands, except per share amounts) | For the Year Ended December 31, | ||||||||||
2019 | 2018 | 2017 | |||||||||
REVENUES: | |||||||||||
Rental revenues | $ | $ | $ | ||||||||
Fee and other income | |||||||||||
Total revenues | |||||||||||
EXPENSES: | |||||||||||
Operating | ( | ) | ( | ) | ( | ) | |||||
Depreciation and amortization | ( | ) | ( | ) | ( | ) | |||||
General and administrative | ( | ) | ( | ) | ( | ) | |||||
(Expense) benefit from deferred compensation plan liability | ( | ) | ( | ) | |||||||
Transaction related costs, impairment losses and other | ( | ) | ( | ) | ( | ) | |||||
Total expenses | ( | ) | ( | ) | ( | ) | |||||
Income from partially owned entities | |||||||||||
(Loss) income from real estate fund investments | ( | ) | ( | ) | |||||||
Interest and other investment income, net | |||||||||||
Income (loss) from deferred compensation plan assets | ( | ) | |||||||||
Interest and debt expense | ( | ) | ( | ) | ( | ) | |||||
Net gain on transfer to Fifth Avenue and Times Square JV | |||||||||||
Purchase price fair value adjustment | |||||||||||
Net gains on disposition of wholly owned and partially owned assets | |||||||||||
Income before income taxes | |||||||||||
Income tax expense | ( | ) | ( | ) | ( | ) | |||||
Income from continuing operations | |||||||||||
(Loss) income from discontinued operations | ( | ) | ( | ) | |||||||
Net income | |||||||||||
Less net loss (income) attributable to noncontrolling interests in: | |||||||||||
Consolidated subsidiaries | ( | ) | |||||||||
Operating Partnership | ( | ) | ( | ) | ( | ) | |||||
Net income attributable to Vornado | |||||||||||
Preferred share dividends | ( | ) | ( | ) | ( | ) | |||||
Preferred share issuance costs | ( | ) | |||||||||
NET INCOME attributable to common shareholders | $ | $ | $ | ||||||||
INCOME PER COMMON SHARE - BASIC: | |||||||||||
Income from continuing operations, net | $ | $ | $ | ||||||||
Loss from discontinued operations, net | ( | ) | |||||||||
Net income per common share | $ | $ | $ | ||||||||
Weighted average shares outstanding | |||||||||||
INCOME PER COMMON SHARE - DILUTED: | |||||||||||
Income from continuing operations, net | $ | $ | $ | ||||||||
Loss from discontinued operations, net | ( | ) | |||||||||
Net income per common share | $ | $ | $ | ||||||||
Weighted average shares outstanding | |||||||||||
See notes to consolidated financial statements.
82
VORNADO REALTY TRUST
CONSOLIDATED STATEMENTS OF COMPREHENSIVE INCOME
(Amounts in thousands) | For the Year Ended December 31, | ||||||||||
2019 | 2018 | 2017 | |||||||||
Net income | $ | $ | $ | ||||||||
Other comprehensive (loss) income: | |||||||||||
(Reduction) increase in value of interest rate swaps and other | ( | ) | ( | ) | |||||||
Amounts reclassified from accumulated other comprehensive (loss) income relating to nonconsolidated subsidiaries | ( | ) | |||||||||
Other comprehensive (loss) income of nonconsolidated subsidiaries | ( | ) | |||||||||
Reduction in unrealized net gain on available-for-sale securities | ( | ) | |||||||||
Comprehensive income | |||||||||||
Less comprehensive (income) loss attributable to noncontrolling interests | ( | ) | ( | ) | |||||||
Comprehensive income attributable to Vornado | $ | $ | $ | ||||||||
See notes to consolidated financial statements.
83
VORNADO REALTY TRUST
CONSOLIDATED STATEMENTS OF CHANGES IN EQUITY
(Amounts in thousands, except per share amounts) | Common Shares | Additional Capital | Earnings Less Than Distributions | Accumulated Other Comprehensive Income (Loss) | Non- controlling Interests in Consolidated Subsidiaries | Total Equity | ||||||||||||||||||||||||||||
Preferred Shares | ||||||||||||||||||||||||||||||||||
Shares | Amount | Shares | Amount | |||||||||||||||||||||||||||||||
Balance, December 31, 2018 | $ | $ | $ | $ | ( | ) | $ | $ | $ | |||||||||||||||||||||||||
Net income attributable to Vornado | — | — | — | — | — | — | — | |||||||||||||||||||||||||||
Net loss attributable to noncontrolling interests in consolidated subsidiaries | — | — | — | — | — | — | — | ( | ) | ( | ) | |||||||||||||||||||||||
Dividends on common shares: | ||||||||||||||||||||||||||||||||||
Special dividend ($1.95 per share) | — | — | — | — | — | ( | ) | — | — | ( | ) | |||||||||||||||||||||||
Aggregate quarterly dividends (see Note 12 for dividends per share amounts) | — | — | — | — | — | ( | ) | — | — | ( | ) | |||||||||||||||||||||||
Dividends on preferred shares (see Note 12 for dividends per share amounts) | — | — | — | — | — | ( | ) | — | — | ( | ) | |||||||||||||||||||||||
Common shares issued: | ||||||||||||||||||||||||||||||||||
Upon redemption of Class A units, at redemption value | — | — | — | — | — | |||||||||||||||||||||||||||||
Under employees' share option plan | — | — | ( | ) | — | — | ( | ) | ||||||||||||||||||||||||||
Under dividend reinvestment plan | — | — | — | — | — | |||||||||||||||||||||||||||||
Contributions: | ||||||||||||||||||||||||||||||||||
Real estate fund investments | — | — | — | — | — | — | — | |||||||||||||||||||||||||||
Other | — | — | — | — | — | — | — | |||||||||||||||||||||||||||
Distributions | — | — | — | — | — | — | — | ( | ) | ( | ) | |||||||||||||||||||||||
Conversion of Series A preferred shares to common shares | ( | ) | ( | ) | — | — | — | |||||||||||||||||||||||||||
Deferred compensation shares and options | — | — | ( | ) | — | — | ||||||||||||||||||||||||||||
Amounts reclassified related to a nonconsolidated subsidiary | — | — | — | — | — | — | ( | ) | — | ( | ) | |||||||||||||||||||||||
Other comprehensive loss of nonconsolidated subsidiaries | — | — | — | — | — | — | ( | ) | — | ( | ) | |||||||||||||||||||||||
Reduction in value of interest rate swaps | — | — | — | — | — | — | ( | ) | — | ( | ) | |||||||||||||||||||||||
Unearned 2016 Out-Performance Plan awards acceleration | — | — | — | — | — | — | — | |||||||||||||||||||||||||||
Adjustments to carry redeemable Class A units at redemption value | — | — | — | — | — | — | — | |||||||||||||||||||||||||||
Redeemable noncontrolling interests' share of above adjustments | — | — | — | — | — | — | — | |||||||||||||||||||||||||||
Deconsolidation of partially owned entity | — | — | — | — | — | — | — | ( | ) | ( | ) | |||||||||||||||||||||||
Other | ( | ) | — | — | — | ( | ) | — | ( | ) | ||||||||||||||||||||||||
Balance, December 31, 2019 | $ | $ | $ | $ | ( | ) | $ | ( | ) | $ | $ | |||||||||||||||||||||||
See notes to consolidated financial statements.
84
VORNADO REALTY TRUST
CONSOLIDATED STATEMENTS OF CHANGES IN EQUITY - CONTINUED
(Amounts in thousands, except per share amount) | Common Shares | Additional Capital | Earnings Less Than Distributions | Accumulated Other Comprehensive Income (Loss) | Non- controlling Interests in Consolidated Subsidiaries | Total Equity | ||||||||||||||||||||||||||||
Preferred Shares | ||||||||||||||||||||||||||||||||||
Shares | Amount | Shares | Amount | |||||||||||||||||||||||||||||||
Balance, December 31, 2017 | $ | $ | $ | $ | ( | ) | $ | $ | $ | |||||||||||||||||||||||||
Cumulative effect of accounting change | — | — | — | — | — | ( | ) | — | ||||||||||||||||||||||||||
Net income attributable to Vornado | — | — | — | — | — | — | — | |||||||||||||||||||||||||||
Net loss attributable to noncontrolling interests in consolidated subsidiaries | — | — | — | — | — | — | — | ( | ) | ( | ) | |||||||||||||||||||||||
Dividends on common shares ($2.52 per share) | — | — | — | — | — | ( | ) | — | — | ( | ) | |||||||||||||||||||||||
Dividends on preferred shares | — | — | — | — | — | ( | ) | — | — | ( | ) | |||||||||||||||||||||||
Series G and Series I cumulative redeemable preferred shares issuance costs | ( | ) | — | — | — | ( | ) | — | — | ( | ) | |||||||||||||||||||||||
Common shares issued: | ||||||||||||||||||||||||||||||||||
Upon redemption of Class A units, at redemption value | — | — | — | — | — | |||||||||||||||||||||||||||||
Under employees' share option plan | — | — | ( | ) | — | — | ( | ) | ||||||||||||||||||||||||||
Under dividend reinvestment plan | — | — | — | — | — | |||||||||||||||||||||||||||||
Contributions: | ||||||||||||||||||||||||||||||||||
Real estate fund investments | — | — | — | — | — | — | — | |||||||||||||||||||||||||||
Other | — | — | — | — | — | — | — | |||||||||||||||||||||||||||
Distributions: | ||||||||||||||||||||||||||||||||||
Real estate fund investments | — | — | — | — | — | — | — | ( | ) | ( | ) | |||||||||||||||||||||||
Other | — | — | — | — | — | — | — | ( | ) | ( | ) | |||||||||||||||||||||||
Conversion of Series A preferred shares to common shares | ( | ) | — | — | — | ( | ) | |||||||||||||||||||||||||||
Deferred compensation shares and options | — | — | ( | ) | — | — | ||||||||||||||||||||||||||||
Other comprehensive income of nonconsolidated subsidiaries | — | — | — | — | — | — | — | |||||||||||||||||||||||||||
Reduction in value of interest rate swaps | — | — | — | — | — | — | ( | ) | — | ( | ) | |||||||||||||||||||||||
Unearned 2015 Out-Performance Plan awards acceleration | — | — | — | — | — | — | — | |||||||||||||||||||||||||||
Adjustments to carry redeemable Class A units at redemption value | — | — | — | — | — | — | — | |||||||||||||||||||||||||||
Redeemable noncontrolling interests' share of above adjustments | — | — | — | — | — | — | — | |||||||||||||||||||||||||||
Consolidation of the Farley joint venture | — | — | — | — | — | — | — | |||||||||||||||||||||||||||
Other | — | — | — | — | ( | ) | ( | ) | ||||||||||||||||||||||||||
Balance, December 31, 2018 | $ | $ | $ | $ | ( | ) | $ | $ | $ | |||||||||||||||||||||||||
See notes to consolidated financial statements.
85
VORNADO REALTY TRUST
CONSOLIDATED STATEMENTS OF CHANGES IN EQUITY - CONTINUED
(Amounts in thousands, except per share amount) | Common Shares | Additional Capital | Earnings Less Than Distributions | Accumulated Other Comprehensive Income (Loss) | Non- controlling Interests in Consolidated Subsidiaries | Total Equity | ||||||||||||||||||||||||||||
Preferred Shares | ||||||||||||||||||||||||||||||||||
Shares | Amount | Shares | Amount | |||||||||||||||||||||||||||||||
Balance, December 31, 2016 | $ | $ | $ | $ | ( | ) | $ | $ | $ | |||||||||||||||||||||||||
Net income attributable to Vornado | — | — | — | — | — | — | — | |||||||||||||||||||||||||||
Net income attributable to noncontrolling interests in consolidated subsidiaries | — | — | — | — | — | — | — | |||||||||||||||||||||||||||
Dividends on common shares ($2.62 per share) | — | — | — | — | — | ( | ) | — | — | ( | ) | |||||||||||||||||||||||
Dividends on preferred shares | — | — | — | — | — | ( | ) | — | — | ( | ) | |||||||||||||||||||||||
Series M cumulative redeemable preferred shares issuance | — | — | — | — | — | — | ||||||||||||||||||||||||||||
Series G and Series I cumulative redeemable preferred shares called for redemption | ( | ) | ( | ) | — | — | — | — | — | — | ( | ) | ||||||||||||||||||||||
Common shares issued: | ||||||||||||||||||||||||||||||||||
Upon redemption of Class A units, at redemption value | — | — | — | — | — | |||||||||||||||||||||||||||||
Under employees' share option plan | — | — | — | — | — | |||||||||||||||||||||||||||||
Under dividend reinvestment plan | — | — | — | — | — | |||||||||||||||||||||||||||||
Contributions | — | — | — | — | — | — | — | |||||||||||||||||||||||||||
Distributions: | ||||||||||||||||||||||||||||||||||
JBG SMITH Properties | — | — | — | — | — | ( | ) | — | ( | ) | ||||||||||||||||||||||||
Real estate fund investments | — | — | — | — | — | — | — | ( | ) | ( | ) | |||||||||||||||||||||||
Other | — | — | — | — | — | — | — | ( | ) | ( | ) | |||||||||||||||||||||||
Conversion of Series A preferred shares to common shares | ( | ) | ( | ) | — | — | — | |||||||||||||||||||||||||||
Deferred compensation shares and options | — | — | — | — | ( | ) | — | — | ||||||||||||||||||||||||||
Reduction in unrealized net gain on available-for-sale securities | — | — | — | — | — | — | ( | ) | — | ( | ) | |||||||||||||||||||||||
Amounts reclassified related to a nonconsolidated subsidiary | — | — | — | — | — | — | — | |||||||||||||||||||||||||||
Other comprehensive income of nonconsolidated subsidiaries | — | — | — | — | — | — | — | |||||||||||||||||||||||||||
Increase in value of interest rate swaps | — | — | — | — | — | — | — | |||||||||||||||||||||||||||
Adjustments to carry redeemable Class A units at redemption value | — | — | — | — | — | — | — | |||||||||||||||||||||||||||
Redeemable noncontrolling interests' share of above adjustments | — | — | — | — | — | — | ( | ) | — | ( | ) | |||||||||||||||||||||||
Other | — | — | — | ( | ) | ( | ) | ( | ) | ( | ) | |||||||||||||||||||||||
Balance, December 31, 2017 | $ | $ | $ | $ | ( | ) | $ | $ | $ | |||||||||||||||||||||||||
See notes to consolidated financial statements.
86
VORNADO REALTY TRUST
CONSOLIDATED STATEMENTS OF CASH FLOWS
(Amounts in thousands) | For the Year Ended December 31, | ||||||||||
2019 | 2018 | 2017 | |||||||||
Cash Flows from Operating Activities: | |||||||||||
Net income | $ | $ | $ | ||||||||
Adjustments to reconcile net income to net cash provided by operating activities: | |||||||||||
Net gain on transfer to Fifth Avenue and Times Square JV | ( | ) | |||||||||
Net gains on disposition of wholly owned and partially owned assets | ( | ) | ( | ) | ( | ) | |||||
Depreciation and amortization (including amortization of deferred financing costs) | |||||||||||
Distributions of income from partially owned entities | |||||||||||
Net realized and unrealized loss on real estate fund investments | |||||||||||
Equity in net income of partially owned entities | ( | ) | ( | ) | ( | ) | |||||
Non-cash impairment loss on 608 Fifth Avenue right-of-use asset | |||||||||||
Stock-based compensation expense | |||||||||||
Real estate impairment losses and related write-offs | |||||||||||
Prepayment penalty on redemption of senior unsecured notes due 2022 | |||||||||||
Amortization of below-market leases, net | ( | ) | ( | ) | ( | ) | |||||
Straight-lining of rents | ( | ) | ( | ) | |||||||
Decrease in fair value of marketable securities | |||||||||||
Purchase price fair value adjustment | ( | ) | |||||||||
Return of capital from real estate fund investments | |||||||||||
Change in valuation of deferred tax assets and liabilities | |||||||||||
Net gains on real estate and other | ( | ) | |||||||||
Other non-cash adjustments | |||||||||||
Changes in operating assets and liabilities: | |||||||||||
Real estate fund investments | ( | ) | ( | ) | |||||||
Tenant and other receivables, net | ( | ) | ( | ) | |||||||
Prepaid assets | ( | ) | |||||||||
Other assets | ( | ) | ( | ) | ( | ) | |||||
Accounts payable and accrued expenses | |||||||||||
Other liabilities | ( | ) | ( | ) | |||||||
Net cash provided by operating activities | |||||||||||
Cash Flows from Investing Activities: | |||||||||||
Proceeds from sale of condominium units at 220 Central Park South | |||||||||||
Proceeds from transfer of interest in Fifth Avenue and Times Square JV (net of $35,562 of transaction costs and $10,899 of deconsolidated cash and restricted cash) | |||||||||||
Development costs and construction in progress | ( | ) | ( | ) | ( | ) | |||||
Proceeds from redemption of 640 Fifth Avenue preferred equity | |||||||||||
Moynihan Train Hall expenditures | ( | ) | ( | ) | |||||||
Proceeds from sale of real estate and related investments | |||||||||||
Additions to real estate | ( | ) | ( | ) | ( | ) | |||||
Proceeds from sales of marketable securities | |||||||||||
Acquisitions of real estate and other | ( | ) | ( | ) | ( | ) | |||||
Distributions of capital from partially owned entities | |||||||||||
Investments in partially owned entities | ( | ) | ( | ) | ( | ) | |||||
Proceeds from repayments of loans receivable | |||||||||||
Investments in loans receivable | ( | ) | |||||||||
Net consolidation of Farley Office and Retail Building | |||||||||||
Proceeds from the repayment of JBG SMITH Properties loan receivable | |||||||||||
Net cash provided by (used in) investing activities | ( | ) | ( | ) | |||||||
See notes to consolidated financial statements.
87
VORNADO REALTY TRUST
CONSOLIDATED STATEMENTS OF CASH FLOWS – CONTINUED
(Amounts in thousands) | Year Ended December 31, | ||||||||||
2019 | 2018 | 2017 | |||||||||
Cash Flows from Financing Activities: | |||||||||||
Repayments of borrowings | $ | ( | ) | $ | ( | ) | $ | ( | ) | ||
Proceeds from borrowings | |||||||||||
Dividends paid on common shares | ( | ) | ( | ) | ( | ) | |||||
Moynihan Train Hall reimbursement from Empire State Development | |||||||||||
Purchase of marketable securities in connection with defeasance of mortgage payable | ( | ) | |||||||||
Distributions to noncontrolling interests | ( | ) | ( | ) | ( | ) | |||||
Dividends paid on preferred shares | ( | ) | ( | ) | ( | ) | |||||
Contributions from noncontrolling interests | |||||||||||
Prepayment penalty on redemption of senior unsecured notes due 2022 | ( | ) | |||||||||
Debt issuance costs | ( | ) | ( | ) | ( | ) | |||||
Repurchase of shares related to stock compensation agreements and related tax withholdings and other | ( | ) | ( | ) | ( | ) | |||||
Proceeds received from exercise of employee share options and other | |||||||||||
Redemption of preferred shares | ( | ) | ( | ) | |||||||
Debt prepayment and extinguishment costs | ( | ) | ( | ) | |||||||
Cash and cash equivalents and restricted cash included in the spin-off of JBG SMITH Properties ($275,000 plus The Bartlett financing proceeds less transaction costs and other mortgage items) | ( | ) | |||||||||
Proceeds from issuance of preferred units | |||||||||||
Net cash used in financing activities | ( | ) | ( | ) | ( | ) | |||||
Net increase (decrease) in cash and cash equivalents and restricted cash | ( | ) | |||||||||
Cash and cash equivalents and restricted cash at beginning of period | |||||||||||
Cash and cash equivalents and restricted cash at end of period | $ | $ | $ | ||||||||
Reconciliation of Cash and Cash Equivalents and Restricted Cash: | |||||||||||
Cash and cash equivalents at beginning of period | $ | $ | $ | ||||||||
Restricted cash at beginning of period | |||||||||||
Restricted cash included in discontinued operations at beginning of period | |||||||||||
Cash and cash equivalents and restricted cash at beginning of period | $ | $ | $ | ||||||||
Cash and cash equivalents at end of period | $ | $ | $ | ||||||||
Restricted cash at end of period | |||||||||||
Cash and cash equivalents and restricted cash at end of period | $ | $ | $ | ||||||||
See notes to consolidated financial statements.
88
VORNADO REALTY TRUST
CONSOLIDATED STATEMENTS OF CASH FLOWS – CONTINUED
(Amounts in thousands) | Year Ended December 31, | ||||||||||
2019 | 2018 | 2017 | |||||||||
Supplemental Disclosure of Cash Flow Information: | |||||||||||
Cash payments for interest, excluding capitalized interest of $67,980, $67,402 and $43,071 | $ | $ | $ | ||||||||
Cash payments for income taxes | $ | $ | $ | ||||||||
Non-Cash Investing and Financing Activities: | |||||||||||
Investments received in exchange for transfer to Fifth Avenue and Times Square JV: | |||||||||||
Preferred equity | $ | $ | $ | ||||||||
Common equity | |||||||||||
Reclassification of condominium units from "development costs and construction in progress" to "220 Central Park South condominium units ready for sale" | |||||||||||
Lease liabilities arising from the recognition of right-of-use assets | |||||||||||
Marketable securities transferred in connection with the defeasance of mortgage payable | ( | ) | |||||||||
Special dividend/distribution declared and payable on January 15, 2020 | |||||||||||
Defeased mortgage payable | |||||||||||
Write-off of fully depreciated assets | ( | ) | ( | ) | ( | ) | |||||
Accrued capital expenditures included in accounts payable and accrued expenses | |||||||||||
Adjustments to carry redeemable Class A units at redemption value | |||||||||||
Recognition of negative basis related to the sale of our investment in 330 Madison Avenue | |||||||||||
Amounts related to our investment in Pennsylvania Real Estate Investment Trust reclassified from "investments in partially owned entities" and "accumulated other comprehensive (loss) income" to "marketable securities" upon conversion of operating partnership units to common shares | |||||||||||
Increase in assets and liabilities resulting from the consolidation of Farley Office and Retail Building: | |||||||||||
Real estate, net | |||||||||||
Mortgage payable, net | |||||||||||
Increase in assets and liabilities resulting from the consolidation of Moynihan Train Hall: | |||||||||||
Real estate, net | |||||||||||
Moynihan Train Hall obligation | |||||||||||
Non-cash distribution to JBG SMITH Properties: | |||||||||||
Assets | |||||||||||
Liabilities | ( | ) | |||||||||
Equity | ( | ) | |||||||||
Reclassification of Series G and Series I cumulative redeemable preferred shares to liabilities upon call for redemption | |||||||||||
Loan receivable established upon the spin-off of JBG SMITH Properties | |||||||||||
Reduction in unrealized net gain on available-for-sale securities | ( | ) | |||||||||
See notes to consolidated financial statements.
89
REPORT OF INDEPENDENT REGISTERED PUBLIC ACCOUNTING FIRM
Partners
Vornado Realty L.P.
New York, New York
Opinion on the Financial Statements
We have audited the accompanying consolidated balance sheets of Vornado Realty L.P. and subsidiaries (the "Partnership") as of December 31, 2019 and 2018, the related consolidated statements of income, comprehensive income, changes in equity, and cash flows for each of the three years in the period ended December 31, 2019, and the related notes and the schedule listed in the Index at Item 15 (collectively referred to as the "financial statements"). In our opinion, the financial statements present fairly, in all material respects, the financial position of the Partnership as of December 31, 2019 and 2018, and the results of its operations and its cash flows for each of the three years in the period ended December 31, 2019, in conformity with the accounting principles generally accepted in the United States of America.
We have also audited, in accordance with the standards of the Public Company Accounting Oversight Board (United States) (PCAOB), the Partnership's internal control over financial reporting as of December 31, 2019, based on criteria established in Internal Control - Integrated Framework (2013) issued by the Committee of Sponsoring Organizations of the Treadway Commission and our report dated February 18, 2020, expressed an unqualified opinion on the Partnership's internal control over financial reporting.
Basis for Opinion
These financial statements are the responsibility of the Partnership's management. Our responsibility is to express an opinion on the Partnership's financial statements based on our audits. We are a public accounting firm registered with the PCAOB and are required to be independent with respect to the Partnership in accordance with the US federal securities laws and the applicable rules and regulations of the Securities and Exchange Commission and the PCAOB.
We conducted our audits in accordance with the standards of the PCAOB. Those standards require that we plan and perform the audit to obtain reasonable assurance about whether the financial statements are free of material misstatement, whether due to error or fraud. Our audits included performing procedures to assess the risks of material misstatement of the financial statements, whether due to error or fraud, and performing procedures that respond to those risks. Such procedures included examining, on a test basis, evidence regarding the amounts and disclosures in the financial statements. Our audits also included evaluating the accounting principles used and significant estimates made by management, as well as evaluating the overall presentation of the financial statements. We believe that our audits provide a reasonable basis for our opinion.
Critical Audit Matters
The critical audit matters communicated below are matters arising from the current-period audit of the financial statements that were communicated or required to be communicated to the audit committee and that (1) relate to accounts or disclosures that are material to the financial statements and (2) involved our especially challenging, subjective, or complex judgments. The communication of critical audit matters does not alter in any way our opinion on the financial statements, taken as a whole, and we are not, by communicating the critical audit matters below, providing separate opinions on the critical audit matters or on the accounts or disclosures to which they relate.
Investments in Partially Owned Entities - Fifth Avenue and Times Square JV - Refer to Notes 2 and 6 to the financial statements
Critical Audit Matter Description
Prior to April 18, 2019, the Partnership contributed its interests in properties located at 640 Fifth Avenue, 655 Fifth Avenue, 666 Fifth Avenue, 689 Fifth Avenue, 697-703 Fifth Avenue, 1535 Broadway, and 1540 Broadway (collectively, the “Properties”) to subsidiaries of a newly formed joint venture (“Fifth Avenue and Times Square JV”). On April 18, 2019, the Partnership transferred a 48.5% common interest in the joint venture to a group of institutional investors (the “Investors”) and retained the remaining 51.5% common interest in the joint venture and an aggregate $1.828 billion of preferred equity interests in certain of the Properties. Net cash proceeds from the transaction were $1.179 billion. The Partnership continues to manage and lease the Properties. The Partnership shares control with the Investors over major decisions of the joint venture, including decisions regarding leasing, operating and capital budgets, and refinancings.
90
The Partnership performed a Variable Interest Entity (“VIE”) and a Voting Interest Entity (“VOE”) analysis for the entities in the organizational structure of the transaction and concluded Fifth Avenue and Times Square JV is a VOE. The Partnership also determined that the entities in the organizational structure did not meet the criteria to qualify as a VIE. Through its detailed analysis of the various decision-making rights and powers that each party possesses, management concluded that the Partnership and the Investors both have the ability to block or participate in the activities that most significantly impact the entity’s economic performance. The Partnership no longer held a controlling financial interest in the joint venture and as a result deconsolidated the joint venture and began accounting for the investment under the equity method of accounting from the date of transfer. The transaction valued the Properties at $5.556 billion. As a result, there was a step-up in basis of the Partnership’s retained portion of the Properties to fair value. The gain on transfer consisted of both the gain on the partial sale of the Partnership’s interest and the gain resulting from the step-up in basis of the retained interest to fair value, less transaction costs, to arrive at an overall net gain of $2.571 billion.
We identified the consolidation analysis as a critical audit matter because the consolidation analysis, specifically the determination of control, and the propriety of gain recognition, involved an interpretation of especially complex accounting principles generally accepted in the United States of America. The evaluation of management’s determination of control required an increased extent of effort.
How the Critical Audit Matter Was Addressed in the Audit
Our audit procedures related to the accounting treatment of the partial sale included, among other things, the following:
• | We tested the effectiveness of controls over management’s determination of control over the joint venture, the resulting deconsolidation of the Properties, and whether a gain or loss should be recognized. |
• | We read transaction agreements, traced and agreed the facts included in the Partnership’s accounting treatment memo to the agreements, and evaluated the assumptions used to arrive at the determined conclusion. |
• | We consulted with our consolidation subject matter experts to assess the reasonableness of the Partnership’s accounting conclusions. |
• | We evaluated whether the assumptions were consistent with evidence obtained in other areas of the audit. |
Critical Audit Matter Description
The Fifth Avenue and Times Square JV transaction valued the Properties at $5.556 billion resulting in a financial statement net gain of $2.571 billion. The value was allocated to the assets and liabilities of each property based on their relative fair values. The Partnership utilized the market approach and the income approach to determine relative fair values. The income approach utilizes the present value of future cash flows that are based on a number of factors, including significant management estimates related to discount rates and capitalization rates, to determine the value of each asset and liability by property.
We identified the valuation of the Properties as a critical audit matter because performing audit procedures to evaluate the reasonableness of the discount rates and capitalization rates used to determine the value of each asset and liability by property required a high degree of auditor judgment and an increased extent of effort, including the need to involve our fair value specialists.
How the Critical Audit Matter Was Addressed in the Audit
Our audit procedures related to the relative fair value of assets acquired and liabilities assumed for the Fifth Avenue and Times Square JV transaction included, among other things, the following:
• | We tested the effectiveness of controls over the Partnership’s review of the compilation of inputs related to the valuation and the determination of fair value of assets acquired and liabilities assumed, including management’s valuation methodology. |
• | With the assistance of our fair value specialists, we assessed the reasonableness of management’s significant assumptions, such as discount and capitalization rates, using comparable market data. |
• | With the assistance of our fair value specialists, we evaluated the reasonableness of the significant assumptions, including testing the source information underlying the determination of these assumptions, testing the mathematical accuracy of the calculation, and developing a range of independent estimates and comparing those to the assumptions selected by management. |
• | We evaluated whether the assumptions were consistent with evidence obtained in other areas of the audit. |
91
Impairment Losses - Refer to Notes 2, 14, and 16 to the financial statements
Critical Audit Matter Description
The Partnership’s properties, including any related right-of-use assets and intangible assets, are individually reviewed for impairment whenever events or changes in circumstances indicate that the carrying amount may not be recoverable. An impairment exists when the carrying amount of an asset exceeds the aggregate projected future cash flows over the anticipated holding period on an undiscounted basis. An impairment loss is measured based on the excess of the property’s carrying amount over its fair value. The Partnership’s undiscounted cash flows is subjective and is based, in part, on estimates and assumptions such as market rental rates and capitalization rates. In the event a property is not recoverable, the Partnership’s evaluation of anticipated discounted cash flows is subjective and is based, in part, on estimates and assumptions such as market rental rates, capitalization rates, and discount rates that could differ materially from actual results. The Partnership recognizes impairment losses within “Transaction related costs, impairment losses and other” within the consolidated statements of income. Total non-cash impairment losses for the year ended December 31, 2019 were $107,221,000.
We identified the impairment of long-lived assets as a critical audit matter because of the significant estimates and assumptions management makes to evaluate the recoverability and fair value of the assets, specifically the estimates of market rental rates, capitalization rates, and discount rates for each real estate asset. Performing audit procedures to evaluate the reasonableness of these estimates and assumptions required a high degree of auditor judgment and an increased extent of effort, including the need to involve our fair value specialists.
How the Critical Audit Matter Was Addressed in the Audit
Our audit procedures related to the undiscounted and discounted cash flow analyses included, among other things, the following:
• | We tested the effectiveness of controls over management’s evaluation of the recoverability of long-lived assets based on undiscounted cash flows and the measurement of impairment based on discounted cash flows, including those over the market rental rates, capitalization rates, and discount rates used in the assessment. |
• | With the assistance of our fair value specialists, we evaluated the reasonableness of significant assumptions in the undiscounted and discounted cash flow analyses, including estimates of market rental rates, capitalization rates, and discount rates, for properties with impairment indicators. We developed independent estimates of the market rental rates, capitalization rates, and discount rates, focusing on geographical location and property type and compared our independent estimates to the estimates and assumptions used by the Partnership. In addition, we tested the mathematical accuracy of the undiscounted and discounted cash flow analyses. |
• | We evaluated the reasonableness of management’s undiscounted and discounted cash flow analyses by comparing management’s projections to the Partnership’s historical results and external market sources. |
• | We evaluated whether the assumptions were consistent with evidence obtained in other areas of the audit. |
/s/ DELOITTE & TOUCHE LLP
New York, New York
February 18, 2020
We have served as the Partnership’s auditor since 1997.
92
VORNADO REALTY L.P.
CONSOLIDATED BALANCE SHEETS
(Amounts in thousands, except unit amounts) | As of December 31, | ||||||
2019 | 2018 | ||||||
ASSETS | |||||||
Real estate, at cost: | |||||||
Land | $ | $ | |||||
Buildings and improvements | |||||||
Development costs and construction in progress | |||||||
Moynihan Train Hall development expenditures | |||||||
Leasehold improvements and equipment | |||||||
Total | |||||||
Less accumulated depreciation and amortization | ( | ) | ( | ) | |||
Real estate, net | |||||||
Right-of-use assets | |||||||
Cash and cash equivalents | |||||||
Restricted cash | |||||||
Marketable securities | |||||||
Tenant and other receivables | |||||||
Investments in partially owned entities | |||||||
Real estate fund investments | |||||||
220 Central Park South condominium units ready for sale | |||||||
Receivable arising from the straight-lining of rents | |||||||
Deferred leasing costs, net of accumulated amortization of $196,229 and $207,529 | |||||||
Identified intangible assets, net of accumulated amortization of $98,587 and $172,114 | |||||||
Other assets | |||||||
$ | $ | ||||||
LIABILITIES, REDEEMABLE PARTNERSHIP UNITS AND EQUITY | |||||||
Mortgages payable, net | $ | $ | |||||
Senior unsecured notes, net | |||||||
Unsecured term loan, net | |||||||
Unsecured revolving credit facilities | |||||||
Lease liabilities | |||||||
Moynihan Train Hall obligation | |||||||
Special distribution payable on January 15, 2020 | |||||||
Accounts payable and accrued expenses | |||||||
Deferred revenue | |||||||
Deferred compensation plan | |||||||
Other liabilities | |||||||
Total liabilities | |||||||
Commitments and contingencies | |||||||
Redeemable partnership units: | |||||||
Class A units - 13,298,956 and 12,544,477 units outstanding | |||||||
Series D cumulative redeemable preferred units - 141,401 and 177,101 units outstanding | |||||||
Total redeemable partnership units | |||||||
Partners' equity: | |||||||
Partners' capital | |||||||
Earnings less than distributions | ( | ) | ( | ) | |||
Accumulated other comprehensive (loss) income | ( | ) | |||||
Total partners' equity | |||||||
Noncontrolling interests in consolidated subsidiaries | |||||||
Total equity | |||||||
$ | $ | ||||||
See notes to the consolidated financial statements.
93
VORNADO REALTY L.P.
CONSOLIDATED STATEMENTS OF INCOME
(Amounts in thousands, except per unit amounts) | For the Year Ended December 31, | ||||||||||
2019 | 2018 | 2017 | |||||||||
REVENUES: | |||||||||||
Rental revenues | $ | $ | $ | ||||||||
Fee and other income | |||||||||||
Total revenues | |||||||||||
EXPENSES: | |||||||||||
Operating | ( | ) | ( | ) | ( | ) | |||||
Depreciation and amortization | ( | ) | ( | ) | ( | ) | |||||
General and administrative | ( | ) | ( | ) | ( | ) | |||||
(Expense) benefit from deferred compensation plan liability | ( | ) | ( | ) | |||||||
Transaction related costs, impairment losses and other | ( | ) | ( | ) | ( | ) | |||||
Total expenses | ( | ) | ( | ) | ( | ) | |||||
Income from partially owned entities | |||||||||||
(Loss) income from real estate fund investments | ( | ) | ( | ) | |||||||
Interest and other investment income, net | |||||||||||
Income (loss) from deferred compensation plan assets | ( | ) | |||||||||
Interest and debt expense | ( | ) | ( | ) | ( | ) | |||||
Net gain on transfer to Fifth Avenue and Times Square JV | |||||||||||
Purchase price fair value adjustment | |||||||||||
Net gains on disposition of wholly owned and partially owned assets | |||||||||||
Income before income taxes | |||||||||||
Income tax expense | ( | ) | ( | ) | ( | ) | |||||
Income from continuing operations | |||||||||||
(Loss) income from discontinued operations | ( | ) | ( | ) | |||||||
Net income | |||||||||||
Less net loss (income) attributable to noncontrolling interests in consolidated subsidiaries | ( | ) | |||||||||
Net income attributable to Vornado Realty L.P. | |||||||||||
Preferred unit distributions | ( | ) | ( | ) | ( | ) | |||||
Preferred unit issuance costs | ( | ) | |||||||||
NET INCOME attributable to Class A unitholders | $ | $ | $ | ||||||||
INCOME PER CLASS A UNIT - BASIC: | |||||||||||
Income from continuing operations, net | $ | $ | $ | ||||||||
Income (loss) from discontinued operations, net | ( | ) | |||||||||
Net income per Class A unit | $ | $ | $ | ||||||||
Weighted average units outstanding | |||||||||||
INCOME PER CLASS A UNIT - DILUTED: | |||||||||||
Income from continuing operations, net | $ | $ | $ | ||||||||
Loss from discontinued operations, net | ( | ) | |||||||||
Net income per Class A unit | $ | $ | $ | ||||||||
Weighted average units outstanding | |||||||||||
See notes to consolidated financial statements.
94
VORNADO REALTY L.P.
CONSOLIDATED STATEMENTS OF COMPREHENSIVE INCOME
(Amounts in thousands) | For the Year Ended December 31, | ||||||||||
2019 | 2018 | 2017 | |||||||||
Net income | $ | $ | $ | ||||||||
Other comprehensive (loss) income: | |||||||||||
(Reduction) increase in value of interest rate swaps and other | ( | ) | ( | ) | |||||||
Amounts reclassified from accumulated other comprehensive (loss) income relating to nonconsolidated subsidiaries | ( | ) | |||||||||
Other comprehensive (loss) income of nonconsolidated subsidiaries | ( | ) | |||||||||
Reduction in unrealized net gain on available-for-sale securities | ( | ) | |||||||||
Comprehensive income | |||||||||||
Less comprehensive loss (income) attributable to noncontrolling interests in consolidated subsidiaries | ( | ) | |||||||||
Comprehensive income attributable to Vornado Realty L.P. | $ | $ | $ | ||||||||
See notes to consolidated financial statements.
95
VORNADO REALTY L.P.
CONSOLIDATED STATEMENTS OF CHANGES IN EQUITY
(Amounts in thousands, except per unit amounts) | Preferred Units | Class A Units Owned by Vornado | Earnings Less Than Distributions | Accumulated Other Comprehensive Income (Loss) | Non- controlling Interests in Consolidated Subsidiaries | Total Equity | ||||||||||||||||||||||||
Units | Amount | Units | Amount | |||||||||||||||||||||||||||
Balance, December 31, 2018 | $ | $ | $ | ( | ) | $ | $ | $ | ||||||||||||||||||||||
Net income attributable to Vornado Realty L.P. | — | — | — | — | — | — | ||||||||||||||||||||||||
Net income attributable to redeemable partnership units | — | — | — | — | ( | ) | — | — | ( | ) | ||||||||||||||||||||
Net loss attributable to noncontrolling interests in consolidated subsidiaries | — | — | — | — | — | — | ( | ) | ( | ) | ||||||||||||||||||||
Distributions to Vornado: | ||||||||||||||||||||||||||||||
Special distribution ($1.95 per Class A unit) | — | — | — | — | ( | ) | — | — | ( | ) | ||||||||||||||||||||
Aggregate quarterly distributions to Vornado (see Note 12 for distributions per unit amounts) | — | — | — | — | ( | ) | — | — | ( | ) | ||||||||||||||||||||
Distributions to preferred unitholders (see Note 12 for distributions per unit amounts) | — | — | — | — | ( | ) | — | — | ( | ) | ||||||||||||||||||||
Class A Units issued to Vornado: | ||||||||||||||||||||||||||||||
Upon redemption of redeemable Class A units, at redemption value | — | — | — | — | — | |||||||||||||||||||||||||
Under Vornado's employees' share option plan | — | — | ( | ) | — | — | ( | ) | ||||||||||||||||||||||
Under Vornado's dividend reinvestment plan | — | — | — | — | — | |||||||||||||||||||||||||
Contributions: | ||||||||||||||||||||||||||||||
Real estate fund investments | — | — | — | — | — | — | ||||||||||||||||||||||||
Other | — | — | — | — | — | — | ||||||||||||||||||||||||
Distributions | — | — | — | — | — | — | ( | ) | ( | ) | ||||||||||||||||||||
Conversion of Series A preferred units to Class A units | ( | ) | ( | ) | — | — | — | |||||||||||||||||||||||
Deferred compensation units and options | — | — | ( | ) | — | — | ||||||||||||||||||||||||
Amounts reclassified related to a nonconsolidated subsidiary | — | — | — | — | — | ( | ) | — | ( | ) | ||||||||||||||||||||
Other comprehensive loss of nonconsolidated subsidiaries | — | — | — | — | — | ( | ) | — | ( | ) | ||||||||||||||||||||
Reduction in value of interest rate swaps | — | — | — | — | — | ( | ) | — | ( | ) | ||||||||||||||||||||
Unearned 2016 Out-Performance Plan awards acceleration | — | — | — | — | — | — | ||||||||||||||||||||||||
Adjustments to carry redeemable Class A units at redemption value | — | — | — | — | — | — | ||||||||||||||||||||||||
Redeemable partnership units' share of above adjustments | — | — | — | — | — | — | ||||||||||||||||||||||||
Deconsolidation of partially owned entity | — | — | — | — | — | — | ( | ) | ( | ) | ||||||||||||||||||||
Other | ( | ) | — | — | ( | ) | — | ( | ) | |||||||||||||||||||||
Balance, December 31, 2019 | $ | $ | $ | ( | ) | $ | ( | ) | $ | $ | ||||||||||||||||||||
See notes to consolidated financial statements.
96
VORNADO REALTY L.P.
CONSOLIDATED STATEMENTS OF CHANGES IN EQUITY – CONTINUED
(Amounts in thousands, except per unit amount) | Preferred Units | Class A Units Owned by Vornado | Earnings Less Than Distributions | Accumulated Other Comprehensive Income (Loss) | Non- controlling Interests in Consolidated Subsidiaries | Total Equity | ||||||||||||||||||||||||
Units | Amount | Units | Amount | |||||||||||||||||||||||||||
Balance, December 31, 2017 | $ | $ | $ | ( | ) | $ | $ | $ | ||||||||||||||||||||||
Cumulative effect of accounting change | — | — | — | — | ( | ) | — | |||||||||||||||||||||||
Net income attributable to Vornado Realty L.P. | — | — | — | — | — | — | ||||||||||||||||||||||||
Net income attributable to redeemable partnership units | — | — | — | — | ( | ) | — | — | ( | ) | ||||||||||||||||||||
Net loss attributable to noncontrolling interests in consolidated subsidiaries | — | — | — | — | — | — | ( | ) | ( | ) | ||||||||||||||||||||
Distributions to Vornado ($2.52 per Class A unit) | — | — | — | — | ( | ) | — | — | ( | ) | ||||||||||||||||||||
Distributions to preferred unitholders | — | — | — | — | ( | ) | — | — | ( | ) | ||||||||||||||||||||
Series G and Series I cumulative redeemable preferred units issuance costs | ( | ) | — | — | ( | ) | — | — | ( | ) | ||||||||||||||||||||
Class A Units issued to Vornado: | ||||||||||||||||||||||||||||||
Upon redemption of redeemable Class A units, at redemption value | — | — | — | — | — | |||||||||||||||||||||||||
Under Vornado's employees' share option plan | — | — | ( | ) | — | — | ( | ) | ||||||||||||||||||||||
Under Vornado's dividend reinvestment plan | — | — | — | — | — | |||||||||||||||||||||||||
Contributions: | ||||||||||||||||||||||||||||||
Real estate fund investments | — | — | — | — | — | — | ||||||||||||||||||||||||
Other | — | — | — | — | — | — | ||||||||||||||||||||||||
Distributions: | ||||||||||||||||||||||||||||||
Real estate fund investments | — | — | — | — | — | — | ( | ) | ( | ) | ||||||||||||||||||||
Other | — | — | — | — | — | — | ( | ) | ( | ) | ||||||||||||||||||||
Conversion of Series A preferred units to Class A units | ( | ) | — | — | — | ( | ) | |||||||||||||||||||||||
Deferred compensation units and options | — | — | ( | ) | — | — | ||||||||||||||||||||||||
Other comprehensive income of nonconsolidated subsidiaries | — | — | — | — | — | — | ||||||||||||||||||||||||
Reduction in value of interest rate swaps | — | — | — | — | — | ( | ) | — | ( | ) | ||||||||||||||||||||
Unearned 2015 Out-Performance Plan awards acceleration | — | — | — | — | — | — | ||||||||||||||||||||||||
Adjustments to carry redeemable Class A units at redemption value | — | — | — | — | — | — | ||||||||||||||||||||||||
Redeemable partnership units' share of above adjustments | — | — | — | — | — | — | ||||||||||||||||||||||||
Consolidation of the Farley joint venture | — | — | — | — | — | — | ||||||||||||||||||||||||
Other | — | — | — | ( | ) | ( | ) | |||||||||||||||||||||||
Balance, December 31, 2018 | $ | $ | $ | ( | ) | $ | $ | $ | ||||||||||||||||||||||
See notes to consolidated financial statements.
97
VORNADO REALTY L.P.
CONSOLIDATED STATEMENTS OF CHANGES IN EQUITY – CONTINUED
(Amounts in thousands, except per unit amount) | Preferred Units | Class A Units Owned by Vornado | Earnings Less Than Distributions | Accumulated Other Comprehensive Income (Loss) | Non- controlling Interests in Consolidated Subsidiaries | Total Equity | ||||||||||||||||||||||||
Units | Amount | Units | Amount | |||||||||||||||||||||||||||
Balance, December 31, 2016 | $ | $ | $ | ( | ) | $ | $ | $ | ||||||||||||||||||||||
Net income attributable to Vornado Realty L.P. | — | — | — | — | — | — | ||||||||||||||||||||||||
Net income attributable to redeemable partnership units | — | — | — | — | ( | ) | — | — | ( | ) | ||||||||||||||||||||
Net income attributable to noncontrolling interests in consolidated subsidiaries | — | — | — | — | — | — | ||||||||||||||||||||||||
Distributions to Vornado ($2.62 per Class A unit) | — | — | — | — | ( | ) | — | — | ( | ) | ||||||||||||||||||||
Distributions to preferred unitholders | — | — | — | — | ( | ) | — | — | ( | ) | ||||||||||||||||||||
Series M cumulative redeemable preferred units issuance | — | — | — | — | — | |||||||||||||||||||||||||
Series G and Series I cumulative redeemable preferred units called for redemption | ( | ) | ( | ) | — | — | — | — | — | ( | ) | |||||||||||||||||||
Class A Units issued to Vornado: | ||||||||||||||||||||||||||||||
Upon redemption of redeemable Class A units, at redemption value | — | — | — | — | — | |||||||||||||||||||||||||
Under Vornado's employees' share option plan | — | — | — | — | — | |||||||||||||||||||||||||
Under Vornado's dividend reinvestment plan | — | — | — | — | — | |||||||||||||||||||||||||
Contributions | — | — | — | — | — | — | ||||||||||||||||||||||||
Distributions: | ||||||||||||||||||||||||||||||
JBG SMITH Properties | — | — | — | — | ( | ) | — | — | ( | ) | ||||||||||||||||||||
Real estate fund investments | — | — | — | — | — | — | ( | ) | ( | ) | ||||||||||||||||||||
Other | — | — | — | — | — | — | ( | ) | ( | ) | ||||||||||||||||||||
Conversion of Series A preferred units to Class A units | ( | ) | ( | ) | — | — | — | |||||||||||||||||||||||
Deferred compensation units and options | — | — | ( | ) | — | — | ||||||||||||||||||||||||
Reduction in unrealized net gain on available-for-sale securities | — | — | — | — | — | ( | ) | — | ( | ) | ||||||||||||||||||||
Amounts reclassified related to a nonconsolidated subsidiary | — | — | — | — | — | — | ||||||||||||||||||||||||
Other comprehensive income of nonconsolidated subsidiaries | — | — | — | — | — | — | ||||||||||||||||||||||||
Increase in value of interest rate swaps | — | — | — | — | — | — | ||||||||||||||||||||||||
Adjustments to carry redeemable Class A units at redemption value | — | — | — | — | — | |||||||||||||||||||||||||
Redeemable partnership units' share of above adjustments | — | — | — | — | — | ( | ) | — | ( | ) | ||||||||||||||||||||
Other | — | — | ( | ) | ( | ) | ( | ) | ( | ) | ||||||||||||||||||||
Balance, December 31, 2017 | $ | $ | $ | ( | ) | $ | $ | $ | ||||||||||||||||||||||
See notes to consolidated financial statements.
98
VORNADO REALTY L.P.
CONSOLIDATED STATEMENTS OF CASH FLOWS
(Amounts in thousands) | For the Year Ended December 31, | ||||||||||
2019 | 2018 | 2017 | |||||||||
Cash Flows from Operating Activities: | |||||||||||
Net income | $ | $ | $ | ||||||||
Adjustments to reconcile net income to net cash provided by operating activities: | |||||||||||
Net gain on transfer to Fifth Avenue and Times Square JV | ( | ) | |||||||||
Net gains on disposition of wholly owned and partially owned assets | ( | ) | ( | ) | ( | ) | |||||
Depreciation and amortization (including amortization of deferred financing costs) | |||||||||||
Distributions of income from partially owned entities | |||||||||||
Net realized and unrealized loss on real estate fund investments | |||||||||||
Equity in net income of partially owned entities | ( | ) | ( | ) | ( | ) | |||||
Non-cash impairment loss on 608 Fifth Avenue right-of-use asset | |||||||||||
Stock-based compensation expense | |||||||||||
Real estate impairment losses and related write-offs | |||||||||||
Prepayment penalty on redemption of senior unsecured notes due 2022 | |||||||||||
Amortization of below-market leases, net | ( | ) | ( | ) | ( | ) | |||||
Straight-lining of rents | ( | ) | ( | ) | |||||||
Decrease in fair value of marketable securities | |||||||||||
Purchase price fair value adjustment | ( | ) | |||||||||
Return of capital from real estate fund investments | |||||||||||
Change in valuation of deferred tax assets and liabilities | |||||||||||
Net gains on real estate and other | ( | ) | |||||||||
Other non-cash adjustments | |||||||||||
Changes in operating assets and liabilities: | |||||||||||
Real estate fund investments | ( | ) | ( | ) | |||||||
Tenant and other receivables, net | ( | ) | ( | ) | |||||||
Prepaid assets | ( | ) | |||||||||
Other assets | ( | ) | ( | ) | ( | ) | |||||
Accounts payable and accrued expenses | |||||||||||
Other liabilities | ( | ) | ( | ) | |||||||
Net cash provided by operating activities | |||||||||||
Cash Flows from Investing Activities: | |||||||||||
Proceeds from sale of condominium units at 220 Central Park South | |||||||||||
Proceeds from transfer of interest in Fifth Avenue and Times Square JV (net of $35,562 of transaction costs and $10,899 of deconsolidated cash and restricted cash) | |||||||||||
Development costs and construction in progress | ( | ) | ( | ) | ( | ) | |||||
Proceeds from redemption of 640 Fifth Avenue preferred equity | |||||||||||
Moynihan Train Hall expenditures | ( | ) | ( | ) | |||||||
Proceeds from sale of real estate and related investments | |||||||||||
Additions to real estate | ( | ) | ( | ) | ( | ) | |||||
Proceeds from sales of marketable securities | |||||||||||
Acquisitions of real estate and other | ( | ) | ( | ) | ( | ) | |||||
Distributions of capital from partially owned entities | |||||||||||
Investments in partially owned entities | ( | ) | ( | ) | ( | ) | |||||
Proceeds from repayments of loans receivable | |||||||||||
Investments in loans receivable | ( | ) | |||||||||
Net consolidation of Farley Office and Retail Building | |||||||||||
Proceeds from the repayment of JBG SMITH Properties loan receivable | |||||||||||
Net cash provided by (used in) investing activities | ( | ) | ( | ) | |||||||
See notes to consolidated financial statements.
99
VORNADO REALTY L.P.
CONSOLIDATED STATEMENTS OF CASH FLOWS – CONTINUED
(Amounts in thousands) | Year Ended December 31, | ||||||||||
2019 | 2018 | 2017 | |||||||||
Cash Flows from Financing Activities: | |||||||||||
Repayments of borrowings | $ | ( | ) | $ | ( | ) | $ | ( | ) | ||
Proceeds from borrowings | |||||||||||
Distributions to Vornado | ( | ) | ( | ) | ( | ) | |||||
Moynihan Train Hall reimbursement from Empire State Development | |||||||||||
Purchase of marketable securities in connection with defeasance of mortgage payable | ( | ) | |||||||||
Distributions to redeemable security holders and noncontrolling interests in consolidated subsidiaries | ( | ) | ( | ) | ( | ) | |||||
Distributions to preferred unitholders | ( | ) | ( | ) | ( | ) | |||||
Contributions from noncontrolling interests in consolidated subsidiaries | |||||||||||
Prepayment penalty on redemption of senior unsecured notes due 2022 | ( | ) | |||||||||
Debt issuance costs | ( | ) | ( | ) | ( | ) | |||||
Repurchase of Class A units related to stock compensation agreements and related tax withholdings and other | ( | ) | ( | ) | ( | ) | |||||
Proceeds received from exercise of Vornado stock options and other | |||||||||||
Redemption of preferred units | ( | ) | ( | ) | |||||||
Debt prepayment and extinguishment costs | ( | ) | ( | ) | |||||||
Cash and cash equivalents and restricted cash included in the spin-off of JBG SMITH Properties ($275,000 plus The Bartlett financing proceeds less transaction costs and other mortgage items) | ( | ) | |||||||||
Proceeds from issuance of preferred units | |||||||||||
Net cash used in financing activities | ( | ) | ( | ) | ( | ) | |||||
Net increase (decrease) in cash and cash equivalents and restricted cash | ( | ) | |||||||||
Cash and cash equivalents and restricted cash at beginning of period | |||||||||||
Cash and cash equivalents and restricted cash at end of period | $ | $ | $ | ||||||||
Reconciliation of Cash and Cash Equivalents and Restricted Cash: | |||||||||||
Cash and cash equivalents at beginning of period | $ | $ | $ | ||||||||
Restricted cash at beginning of period | |||||||||||
Restricted cash included in discontinued operations at beginning of period | |||||||||||
Cash and cash equivalents and restricted cash at beginning of period | $ | $ | $ | ||||||||
Cash and cash equivalents at end of period | $ | $ | $ | ||||||||
Restricted cash at end of period | |||||||||||
Cash and cash equivalents and restricted cash at end of period | $ | $ | $ | ||||||||
See notes to consolidated financial statements.
100
VORNADO REALTY L.P.
CONSOLIDATED STATEMENTS OF CASH FLOWS – CONTINUED
(Amounts in thousands) | Year Ended December 31, | ||||||||||
2019 | 2018 | 2017 | |||||||||
Supplemental Disclosure of Cash Flow Information: | |||||||||||
Cash payments for interest, excluding capitalized interest of $67,980, $67,402 and $43,071 | $ | $ | $ | ||||||||
Cash payments for income taxes | $ | $ | $ | ||||||||
Non-Cash Investing and Financing Activities: | |||||||||||
Investments received in exchange for transfer to Fifth Avenue and Times Square JV: | |||||||||||
Preferred equity | $ | $ | $ | ||||||||
Common equity | |||||||||||
Reclassification of condominium units from "development costs and construction in progress" to "220 Central Park South condominium units ready for sale" | |||||||||||
Lease liabilities arising from the recognition of right-of-use assets | |||||||||||
Marketable securities transferred in connection with the defeasance of mortgage payable | ( | ) | |||||||||
Special distribution declared and payable on January 15, 2020 | |||||||||||
Defeased mortgage payable | |||||||||||
Write-off of fully depreciated assets | ( | ) | ( | ) | ( | ) | |||||
Accrued capital expenditures included in accounts payable and accrued expenses | |||||||||||
Adjustments to carry redeemable Class A units at redemption value | |||||||||||
Recognition of negative basis related to the sale of our investment in 330 Madison Avenue | |||||||||||
Amounts related to our investment in Pennsylvania Real Estate Investment Trust reclassified from "investments in partially owned entities" and "accumulated other comprehensive (loss) income" to "marketable securities" upon conversion of operating partnership units to common shares | |||||||||||
Increase in assets and liabilities resulting from the consolidation of Farley Office and Retail Building: | |||||||||||
Real estate, net | |||||||||||
Mortgage payable, net | |||||||||||
Increase in assets and liabilities resulting from the consolidation of Moynihan Train Hall: | |||||||||||
Real estate, net | |||||||||||
Moynihan Train Hall obligation | |||||||||||
Non-cash distribution to JBG SMITH Properties: | |||||||||||
Assets | |||||||||||
Liabilities | ( | ) | |||||||||
Equity | ( | ) | |||||||||
Reclassification of Series G and Series I cumulative redeemable preferred shares to liabilities upon call for redemption | |||||||||||
Loan receivable established upon the spin-off of JBG SMITH Properties | |||||||||||
Reduction in unrealized net gain on available-for-sale securities | ( | ) | |||||||||
See notes to consolidated financial statements.
101
VORNADO REALTY TRUST AND VORNADO REALTY L.P.
NOTES TO CONSOLIDATED FINANCIAL STATEMENTS
1. | Organization and Business |
Vornado Realty Trust (“Vornado”) is a fully‑integrated real estate investment trust (“REIT”) and conducts its business through, and substantially all of its interests in properties are held by, Vornado Realty L.P., a Delaware limited partnership (the “Operating Partnership”). Accordingly, Vornado’s cash flow and ability to pay dividends to its shareholders are dependent upon the cash flow of the Operating Partnership and the ability of its direct and indirect subsidiaries to first satisfy their obligations to creditors. Vornado is the sole general partner of, and owned approximately 93.1 % of the common limited partnership interest in the Operating Partnership as of December 31, 2019. All references to the “Company,” “we,” “us” and “our” mean collectively Vornado, the Operating Partnership and those subsidiaries consolidated by Vornado.
We currently own all or portions of:
New York:
• |
• |
• |
• | The |
• | A |
Other Real Estate and Investments:
• | The |
• | A |
• | A |
• | Other real estate and investments. |
2. | Basis of Presentation and Significant Accounting Policies |
Basis of Presentation
The accompanying consolidated financial statements include the accounts of Vornado and the Operating Partnership and their consolidated subsidiaries. All inter-company amounts have been eliminated. Our consolidated financial statements are prepared in accordance with accounting principles generally accepted in the United States of America (“GAAP”), which require us to make estimates and assumptions that affect the reported amounts of assets and liabilities, disclosure of contingent assets and liabilities at the date of the financial statements and the reported amounts of revenues and expenses during the reporting periods. Actual results could differ from those estimates.
Certain prior year balances have been reclassified in order to conform to the current period presentation. For the years ended December 31, 2018 and 2017, "property rentals" of $1,760,205,000 and $1,714,952,000 , respectively, and "tenant expense reimbursements" of $247,128,000 and $233,424,000 , respectively, were grouped into "rental revenues" on our consolidated statements of income in accordance with Accounting Standards Codification ("ASC") Topic 205, Presentation of Financial Statements.
Recently Issued Accounting Literature
In February 2016, the Financial Accounting Standards Board ("FASB") issued an update (“ASU 2016-02”) establishing ASC Topic 842, Leases ("ASC 842"), as amended by subsequent ASUs on the topic, which sets out the principles for the recognition, measurement, presentation and disclosure of leases for both lessees and lessors. ASU 2016-02 requires lessees to apply a two-method approach, classifying leases as either finance or operating leases based on the principle of whether or not the lease is effectively a financed purchase. Lessees are required to record a right-of-use ("ROU") asset and a lease liability for all leases with a term of greater than 12 months. Lease liabilities equal the present value of future lease payments. Right-of-use assets equal the lease liabilities adjusted for accrued rent expense, initial direct costs, lease incentives and prepaid lease payments. Leases with a term of 12 months or less will be accounted for similar to the previously existing lease guidance under ASC Topic 840, Leases ("ASC 840"). Lease expense is recognized based on the effective interest method for finance leases or on a straight-line basis for operating leases. The accounting applied by the lessor is largely unchanged from that applied under ASC 840. We adopted this standard effective January 1, 2019. In transitioning to ASC 842, we elected to use the practical expedient package available to us and did not elect to use hindsight. As of January 1, 2019, we had 12 ground leases classified as operating leases, for which we were required to record a right-of-use asset and a lease liability equal to the present value of the future lease payments. We will continue to recognize expense on a straight-line basis for these leases. We recorded an aggregate of $526,866,000 of ROU assets and a corresponding $526,866,000 of lease liabilities as a result of the adoption of this standard (see Note 20 - Leases).
102
VORNADO REALTY TRUST AND VORNADO REALTY L.P.
NOTES TO CONSOLIDATED FINANCIAL STATEMENTS (CONTINUED)
2. | Basis of Presentation and Significant Accounting Policies - continued |
Recently Issued Accounting Literature - continued
Under ASU 2016-02, initial direct costs for both lessees and lessors would include only those costs that are incremental to the arrangement and would not have been incurred if the lease had not been obtained. As a result, beginning January 1, 2019, we no longer capitalize internal leasing costs and instead expense these costs as incurred, as a component of "general and administrative" expense on our consolidated statements of income. For the years ended December 31, 2018 and 2017, we capitalized $5,538,000 and $5,243,000 , respectively, of internal leasing costs.
In June 2016, the FASB issued an update (“ASU 2016-13”) Measurement of Credit Losses on Financial Instruments establishing ASC Topic 326, Financial Instruments - Credit Losses, as amended by subsequent ASUs on the topic. ASU 2016-13 changes how entities will account for credit losses for most financial assets and certain other instruments that are not measured at fair value through net income. The guidance replaces the current “incurred loss” model with an “expected loss” model that requires consideration of a broader range of information to estimate expected credit losses over the lifetime of the financial asset. ASU 2016-13 is effective for interim and annual reporting periods in fiscal years beginning after December 15, 2019. We are currently evaluating the impact of the adoption of ASU 2016-13 on our consolidated financial statements, but do not believe the adoption of this standard will have a material impact on our consolidated financial statements.
In August 2018, the FASB issued an update (“ASU 2018-13”) Disclosure Framework-Changes to the Disclosure Requirements for Fair Value Measurement to ASC Topic 820, Fair Value Measurement (“ASC 820”). ASU 2018-13 modifies the disclosure requirements for fair value measurements by removing, modifying, and/or adding certain disclosures. ASU 2018-13 is effective for interim and annual reporting periods in fiscal years beginning after December 15, 2019. We elected to early adopt ASU 2018-13 effective January 1, 2019. The adoption of this update did not have a material impact on our consolidated financial statements and disclosures.
In October 2018, the FASB issued an update ("ASU 2018-16") Inclusion of the Secured Overnight Financing Rate (SOFR) Overnight Index Swap (OIS) Rate as a Benchmark Interest Rate for Hedge Accounting Purposes to ASC Topic 815, Derivatives and Hedging. ASU 2018-16 expands the list of U.S. benchmark interest rates permitted in the application of hedge accounting by adding the OIS rate based on SOFR as an eligible benchmark interest rate. ASU 2018-16 is effective for interim and annual reporting periods in fiscal years beginning after December 15, 2018. We adopted this update effective January 1, 2019. The adoption of this update did not have any impact on our consolidated financial statements.
103
VORNADO REALTY TRUST AND VORNADO REALTY L.P.
NOTES TO CONSOLIDATED FINANCIAL STATEMENTS (CONTINUED)
2. | Basis of Presentation and Significant Accounting Policies - continued |
Significant Accounting Policies
Real Estate: Real estate is carried at cost, net of accumulated depreciation and amortization. Betterments, major renewals and certain costs directly related to the improvement and leasing of real estate are capitalized. Maintenance and repairs are expensed as incurred. For redevelopment of existing operating properties, the net book value of the existing property under redevelopment plus the cost for the construction and improvements incurred in connection with the redevelopment are capitalized to the extent the capitalized costs of the property do not exceed the estimated fair value of the redeveloped property when complete. If the cost of the redeveloped property, including the net book value of the existing property, exceeds the estimated fair value of the redeveloped property, the excess is charged to expense. Depreciation is recognized on a straight-line basis over the estimated useful lives which range from 7 to 40 years. Tenant allowances are amortized on a straight-line basis over the lives of the related leases, which approximate the useful lives of the assets. Additions to real estate include interest and debt expense capitalized during construction of $72,200,000 and $73,166,000 for the years ended December 31, 2019 and 2018, respectively.
Upon the acquisition of real estate, we assess the fair value of acquired assets (including land, buildings and improvements, identified intangibles, such as acquired above and below-market leases, acquired in-place leases and tenant relationships) and acquired liabilities and we allocate the purchase price based on these assessments which are on a relative fair value basis. We assess fair value based on estimated cash flow projections that utilize appropriate discount and capitalization rates and available market information. Estimates of future cash flows are based on a number of factors including historical operating results, known trends, and market/economic conditions. We amortize identified intangibles that have finite lives over the period they are expected to contribute directly or indirectly to the future cash flows of the property or business acquired.
Our properties, including any related right-of-use assets and intangible assets, are individually reviewed for impairment whenever events or changes in circumstances indicate that the carrying amount may not be recoverable. An impairment exists when the carrying amount of an asset exceeds the aggregate projected future cash flows over the anticipated holding period on an undiscounted basis. An impairment loss is measured based on the excess of the property’s carrying amount over its estimated fair value. Impairment analyses are based on our current plans, intended holding periods and available market information at the time the analyses are prepared. If our estimates of the projected future cash flows, or market conditions change, our evaluation of impairment losses may be different and such differences could be material to our consolidated financial statements. The evaluation of anticipated discounted cash flows is subjective and is based, in part, on estimates and assumptions regarding future occupancy, rental rates, capital requirements, capitalization rates and discount rates that could differ materially from actual results. Plans to hold properties over longer periods decrease the likelihood of recording impairment losses. We recognized impairment losses of $107,221,000 and $12,000,000 for the years ended December 31, 2019 and 2018, respectively. There were no impairment losses in the year ended December 31, 2017.
Our 95.0 % joint venture (the remaining 5.0 % is owned by the Related Companies ("Related")) which is developing the Farley Office and Retail Building has entered into a development agreement with Empire State Development (“ESD”), an entity of New York State, to build the adjacent Moynihan Train Hall, with Vornado and Related each guaranteeing the joint venture's obligations. The joint venture has entered into a design-build contract with Skanska Moynihan Train Hall Builders pursuant to which they will build the Moynihan Train Hall, thereby fulfilling all of the joint venture's obligations to ESD. The obligations of Skanska Moynihan Train Hall Builders have been bonded by Skanska USA and bear a full guaranty from Skanska AB. The development expenditures for the Moynihan Train Hall are estimated to be approximately $1.6 billion, which will be funded by governmental agencies. Pursuant to ASC 842-40-55, the joint venture, which we consolidate on our consolidated balance sheets, is required to recognize all development expenditures for the Moynihan Train Hall. Accordingly, the development expenditures paid for by governmental agencies through December 31, 2019 and 2018 of $914,960,000 and $445,693,000 , respectively, are shown as “Moynihan Train Hall development expenditures” with a corresponding obligation recorded in “Moynihan Train Hall obligation” on our consolidated balance sheets. Upon completion of the development, the "Moynihan Train Hall development expenditures" and the offsetting “Moynihan Train Hall obligation” will be removed from our consolidated balance sheets.
Partially Owned Entities: We consolidate entities in which we have a controlling financial interest. In determining whether we have a controlling financial interest in a partially owned entity and the requirement to consolidate the accounts of that entity, we consider (i) whether the entity is a variable interest entity (“VIE”) in which we are the primary beneficiary or (ii) whether the entity is a voting interest entity in which we have a majority of the voting interests of the entity. We are deemed to be the primary beneficiary of a VIE when we have (i) the power to direct the activities of the VIE that most significantly impact the VIE’s economic performance and (ii) the obligation to absorb losses or receive benefits that could potentially be significant to the VIE. We generally do not control a partially owned entity if the approval of all of the partners/members is contractually required with respect to decisions that most significantly impact the performance of the partially owned entity. This includes decisions regarding operating/capital budgets, and the placement of new or additional financing secured by the assets of the venture, among others. We account for investments under the equity method when the requirements for consolidation are not met, and we have significant influence over the operations of the investee. Equity method investments are initially recorded at cost and subsequently adjusted for our share of net income or loss and cash contributions and distributions each period. Investments that do not qualify for consolidation or equity method accounting are accounted for under the cost method.
104
VORNADO REALTY TRUST AND VORNADO REALTY L.P.
NOTES TO CONSOLIDATED FINANCIAL STATEMENTS (CONTINUED)
2. | Basis of Presentation and Significant Accounting Policies - continued |
Significant Accounting Policies - continued
220 Central Park South Condominium Units Ready For Sale: We are constructing a residential condominium tower at 220 Central Park South ("220 CPS"). Condominium units are reclassed from "development costs and construction in progress" to "220 Central Park South condominium units ready for sale" upon receipt of the unit's temporary certificate of occupancy. These units are substantially complete and ready for sale. Each unit is carried at the lower of its carrying amount or fair value less costs to sell. We have used the relative sales value method to allocate costs to individual condominium units. GAAP income is recognized when legal title transfers upon closing of the condominium unit sales and is included in "net gains on disposition of wholly owned and partially owned assets" on our consolidated statements of income. As of December 31, 2019 and 2018, none of the 220 CPS condominium units ready for sale had a carrying value that exceeded fair value.
Cash and Cash Equivalents: Cash and cash equivalents consist of highly liquid investments with original maturities of three months or less and are carried at cost, which approximates fair value due to their short-term maturities. The majority of our cash and cash equivalents consists of (i) deposits at major commercial banks, which may at times exceed the Federal Deposit Insurance Corporation limit, (ii) United States Treasury Bills, and (iii) Certificate of Deposits placed through an Account Registry Service.
Deferred Charges: Direct financing costs are deferred and amortized over the terms of the related agreements as a component of interest expense. Direct costs related to successful leasing activities are capitalized and amortized on a straight-line basis over the lives of the related leases. All other deferred charges are amortized on a straight-line basis, which approximates the effective interest rate method, in accordance with the terms of the agreements to which they relate.
On December 18, 2019, Vornado's Board of Trustees declared a special dividend of $1.95 per share which was paid on January 15, 2020 to common shareholders of record on December 30, 2019 (the "Record Date"). Class A unitholders of the Operating Partnership as of the Record Date received the same distribution amount per unit on January 15, 2020. Approximately $1.74 per share of the special dividend was a long-term capital gain. The dividend was the result of gains from the transfer of a 45.4 % common equity interest in the Fifth Avenue and Times Square JV(see Note 6 - Investments in Partially Owned Entities), the sale of our 25 % interest in 330 Madison Avenue (see Note 6 - Investments in Partially Owned Entities) and other previously disclosed asset sales, partially offset by a tax deduction resulting from our former investment in Toys "R" Us (see Note 6 - Investments in Partially Owned Entities).
We have elected to treat certain consolidated subsidiaries, and may in the future elect to treat newly formed subsidiaries, as taxable REIT subsidiaries pursuant to an amendment to the Internal Revenue Code that became effective January 1, 2001. Taxable REIT subsidiaries may participate in non-real estate related activities and/or perform non-customary services for tenants and are subject to Federal and State income tax at regular corporate tax rates. Our 220 Central Park South condominium project is held through a taxable REIT subsidiary.
105
VORNADO REALTY TRUST AND VORNADO REALTY L.P.
NOTES TO CONSOLIDATED FINANCIAL STATEMENTS (CONTINUED)
2. | Basis of Presentation and Significant Accounting Policies - continued |
Significant Accounting Policies - continued
At December 31, 2019 and 2018, our taxable REIT subsidiaries had deferred tax assets, net of valuation allowances, of $57,226,000 and $109,949,000 , respectively, and are included in “other assets” on our consolidated balance sheets. At December 31, 2019 and 2018, our taxable REIT subsidiaries had deferred tax liabilities of $29,444,000 and $28,676,000 , respectively, which are included in "other liabilities" on our consolidated balance sheets. The deferred tax assets and liabilities relate to net operating loss carry forwards and temporary differences between the book and tax basis of asset and liabilities. During 2019, we utilized $10,257,000 of deferred tax assets related to net operating loss carry forwards associated with our 220 CPS project.
For the years ended December 31, 2019, 2018 and 2017, we recognized $103,439,000 , $37,633,000 and $42,375,000 of income tax expense, respectively, based on effective tax rates of approximately 3.0 %, 8.2 % and 13.3 %, respectively. Income tax expense recorded in each of the years primarily relates to our consolidated taxable REIT subsidiaries, and certain state, local, and franchise taxes. The year ended December 31, 2019 included $101,828,000 of income tax expense recognized on the sale of 220 CPS condominium units. The year ended December 31, 2018 included $16,771,000 of income tax expense relating to the purchase price fair value adjustment recorded upon our acquisition of an additional 44.9 % ownership interest in Farley Office and Retail Building and $13,888,000 of income tax expense recognized on the sale of 220 CPS units. The Company has no uncertain tax positions recognized as of December 31, 2019 and 2018.
The Operating Partnership’s partners are required to report their respective share of taxable income on their individual tax returns.
The following table reconciles net income attributable to Vornado common shareholders to estimated taxable income for the years ended December 31, 2019, 2018 and 2017.
(Amounts in thousands) | For the Year Ended December 31, | ||||||||||
2019 | 2018 | 2017 | |||||||||
Net income attributable to Vornado common shareholders | $ | $ | $ | ||||||||
Book to tax differences (unaudited): | |||||||||||
Sale of real estate and other capital transactions | ( | ) | |||||||||
Depreciation and amortization | |||||||||||
Earnings of partially owned entities | ( | ) | |||||||||
Impairment losses | |||||||||||
Tangible property regulations | ( | ) | ( | ) | |||||||
Vornado stock options | ( | ) | ( | ) | ( | ) | |||||
Straight-line rent adjustments | ( | ) | ( | ) | |||||||
Tax expense related to the reduction of our taxable REIT subsidiaries' deferred tax assets | |||||||||||
Other, net | |||||||||||
Estimated taxable income (unaudited) | $ | $ | $ | ||||||||
106
VORNADO REALTY TRUST AND VORNADO REALTY L.P.
NOTES TO CONSOLIDATED FINANCIAL STATEMENTS (CONTINUED)
3. | Revenue Recognition |
Our revenues primarily consist of rental revenues and fee and other income. We operate in two reportable segments: New York and Other, with a significant portion of our revenues included in the New York segment. We have the following revenue sources and revenue recognition policies:
• | Rental revenues include revenues from the leasing of space at our properties to tenants, lease termination income, revenues from the Hotel Pennsylvania, trade shows and tenant services. |
◦ | Revenues from the leasing of space at our properties to tenants includes (i) lease components, including fixed and variable lease payments, and nonlease components which include reimbursement of common area maintenance expenses, and (ii) reimbursement of real estate taxes and insurance expenses. As lessor, we have elected to combine the lease and nonlease components of our operating lease agreements and account for the components as a single lease component in accordance with ASC 842. Lease revenues and reimbursement of common area maintenance, real estate taxes and insurance are presented in the following tables as "property rentals." Revenues derived from fixed lease payments are recognized on a straight-line basis over the non-cancelable period of the lease, together with renewal options that are reasonably certain of being exercised. We commence rental revenue recognition when the underlying asset is available for use by the lessee. Revenue derived from the reimbursement of real estate taxes, insurance expenses and common area maintenance expenses are generally recognized in the same period as the related expenses are incurred. |
◦ | Lease termination income is recognized immediately if a tenant vacates or is recognized on a straight-line basis over the shortened remaining lease term in accordance with ASC 842. |
◦ | Hotel revenue arising from the operation of Hotel Pennsylvania consists of room revenue, food and beverage revenue, and banquet revenue. Room revenue is recognized when the rooms are made available for the guest, in accordance with ASC 842. |
◦ | Trade shows revenue arising from the operation of trade shows is primarily booth rentals. This revenue is recognized upon the occurrence of the trade shows when the trade show booths are made available for use by the exhibitors, in accordance with ASC 842. |
◦ | Tenant services revenue arises from sub-metered electric, elevator, trash removal and other services provided to tenants at their request. This revenue is recognized as the services are transferred in accordance with ASC Topic 606, Revenue from Contracts with Customers ("ASC 606"). |
• | Fee and other income includes management, leasing and other revenue arising from contractual agreements with third parties or with partially owned entities and includes Building Maintenance Services LLC (“BMS”) cleaning, engineering and security services. This revenue is recognized as the services are transferred in accordance with ASC 606. |
Below is a summary of our revenues by segment. Additional financial information related to these reportable segments for the years ended December 31, 2019, 2018 and 2017 is set forth in Note 25 - Segment Information.
(Amounts in thousands) | For the Year Ended December 31, 2019 | |||||||||||
Total | New York | Other | ||||||||||
Property rentals | $ | $ | $ | |||||||||
Hotel Pennsylvania | ||||||||||||
Trade shows | ||||||||||||
Lease revenues | ||||||||||||
Tenant services | ||||||||||||
Rental revenues | ||||||||||||
BMS cleaning fees | ( | ) | (1) | |||||||||
Management and leasing fees | ( | ) | ||||||||||
Other income | ||||||||||||
Fee and other income | ||||||||||||
Total revenues | $ | $ | $ | |||||||||
See note on the following page.
107
VORNADO REALTY TRUST AND VORNADO REALTY L.P.
NOTES TO CONSOLIDATED FINANCIAL STATEMENTS (CONTINUED)
3. | Revenue Recognition - continued |
(Amounts in thousands) | For the Year Ended December 31, 2018 | |||||||||||
Total | New York | Other | ||||||||||
Property rentals | $ | $ | $ | |||||||||
Hotel Pennsylvania | ||||||||||||
Trade shows | ||||||||||||
Lease revenues | ||||||||||||
Tenant services | ||||||||||||
Rental revenues | ||||||||||||
BMS cleaning fees | ( | ) | (1) | |||||||||
Management and leasing fees | ||||||||||||
Other income | ||||||||||||
Fee and other income | ||||||||||||
Total revenues | $ | $ | $ | |||||||||
____________________
(1) | See note below. |
(Amounts in thousands) | For the Year Ended December 31, 2017 | |||||||||||
Total | New York | Other | ||||||||||
Property rentals | $ | $ | $ | |||||||||
Hotel Pennsylvania | ||||||||||||
Trade shows | ||||||||||||
Lease revenues | ||||||||||||
Tenant services | ||||||||||||
Rental revenues | ||||||||||||
BMS cleaning fees | ( | ) | (1) | |||||||||
Management and leasing fees | ||||||||||||
Other income | ||||||||||||
Fee and other income | ||||||||||||
Total revenues | $ | $ | $ | |||||||||
____________________
(1) | Represents the elimination of theMART and 555 California Street BMS cleanings fees which are included as income in the New York segment. |
108
VORNADO REALTY TRUST AND VORNADO REALTY L.P.
NOTES TO CONSOLIDATED FINANCIAL STATEMENTS (CONTINUED)
4. | Real Estate Fund Investments |
We are the general partner and investment manager of Vornado Capital Partners Real Estate Fund (the “Fund”) and own a 25.0 % interest in the Fund, which had an initial eight-year term ending February 2019. On January 29, 2018, the Fund's term was extended to February 2023. The Fund's three-year investment period ended in July 2013. The Fund is accounted for under ASC 946, Financial Services – Investment Companies (“ASC 946”) and its investments are reported on its balance sheet at fair value, with changes in value each period recognized in earnings. We consolidate the accounts of the Fund into our consolidated financial statements, retaining the fair value basis of accounting.
We are also the general partner and investment manager of the Crowne Plaza Times Square Hotel Joint Venture (the “Crowne Plaza Joint Venture”) and own a 57.1 % interest in the joint venture which owns the 24.7 % interest in the Crowne Plaza Times Square Hotel not owned by the Fund. The Crowne Plaza Joint Venture is also accounted for under ASC 946 and we consolidate the accounts of the joint venture into our consolidated financial statements, retaining the fair value basis of accounting.
On November 6, 2019, the Fund completed a $145,075,000 refinancing of Lucida, a 155,000 square foot Manhattan retail and residential property. The three-year interest-only loan carries a rate of LIBOR plus 1.85 % (3.54 % as of December 31, 2019) with two one-year extension options. The loan replaces the previous $146,000,000 loan that bore interest at LIBOR plus 1.55 % and was scheduled to mature in December 2019.
As of December 31, 2019, we had four real estate fund investments through the Fund and the Crowne Plaza Joint Venture with an aggregate fair value of $222,649,000 , or $112,915,000 below cost, and had remaining unfunded commitments of $35,194,000 , of which our share was $11,242,000 . At December 31, 2018, the Fund had four real estate fund investments with an aggregate fair value of $318,758,000 .
Below is a summary of (loss) income from the Fund and the Crowne Plaza Joint Venture for the years ended December 31, 2019, 2018 and 2017.
(Amounts in thousands) | For the Year Ended December 31, | ||||||||||
2019 | 2018 | 2017 | |||||||||
Net investment income | $ | $ | $ | ||||||||
Net unrealized loss on held investments | ( | ) | ( | ) | ( | ) | |||||
Net realized (loss) gain on exited investments | ( | ) | |||||||||
Previously recorded unrealized gain on exited investment | ( | ) | |||||||||
New York City real property transfer tax (the "Transfer Tax") | ( | ) | (1) | ||||||||
(Loss) income from real estate fund investments | ( | ) | ( | ) | |||||||
Less loss (income) attributable to noncontrolling interests in consolidated subsidiaries | ( | ) | |||||||||
Loss from real estate fund investments net of controlling interests in consolidated subsidiaries(2) | $ | ( | ) | $ | ( | ) | $ | ( | ) | ||
(1) | Due to the additional Transfer Tax related to the March 2011 acquisition of One Park Avenue which was recognized as a result of the New York City Tax Appeals Tribunal (the "Tax Tribunal") decision in the first quarter of 2018. We appealed the Tax Tribunal's decision to the New York State Supreme Court, Appellate Division, First Department ("Appellate Division"). Our appeal was heard on April 2, 2019. On April 25, 2019, the Appellate Division entered a unanimous decision and order that confirmed the decision of the Tax Tribunal and dismissed our appeal. On June 20, 2019, we filed a motion to reargue the Appellate Division's decision or for leave to appeal to the New York State Court of Appeals. That motion was denied on December 12, 2019 and can no longer be appealed. |
(2) | 2018 includes $ |
5. | Marketable Securities |
Our portfolio of marketable securities is comprised of equity securities that are presented on our consolidated balance sheets at fair value. Our marketable securities are accounted for in accordance with ASC Topic 321, Investments - Equity Securities ("ASC 321"), which requires changes in the fair value of our marketable securities to be recorded in current period earnings. Changes in the fair value are recorded to "interest and other investment income, net" on our consolidated statements of income (see Note 17 - Interest and Other Investment Income, Net).
Lexington Realty Trust ("Lexington") (NYSE: LXP)
On March 1, 2019, we sold all of our 18,468,969 common shares of Lexington, realizing net proceeds of $167,698,000 . We recorded a $16,068,000 gain (mark-to-market increase), which is included in "interest and other investment income, net" on our consolidated statements of income for the year ended December 31, 2019.
109
VORNADO REALTY TRUST AND VORNADO REALTY L.P.
NOTES TO CONSOLIDATED FINANCIAL STATEMENTS (CONTINUED)
5. | Marketable Securities - continued |
Pennsylvania Real Estate Investment Trust (“PREIT”) (NYSE: PEI)
On March 12, 2019 (the "Conversion Date"), we converted all of our 6,250,000 PREIT operating partnership units into common shares and began accounting for our investment as a marketable security in accordance with ASC 321. Prior to the Conversion Date, we accounted for our investment under the equity method. For the year ended December 31, 2019 we recorded a decrease of $21,649,000 in the value of our investment based on PREIT's year ended closing share price, which is included in "interest and other investment income, net" on our consolidated statements of income.
On January 23, 2020, we sold all of our 6,250,000 common shares of PREIT, realizing net proceeds of $28,375,000 . A $4,938,000 loss (mark-to-market decrease) will be recorded in the first quarter of 2020.
The table below summarizes the changes of our marketable securities portfolio for the years ended December 31, 2019 and 2018.
(Amounts in thousands) | |||||||||||||||
Total | Lexington | PREIT | Other | ||||||||||||
Balance as of December 31, 2017 | $ | $ | $ | $ | |||||||||||
(Decrease) increase in fair value of marketable securities | ( | ) | ( | ) | |||||||||||
Sale of marketable securities | ( | ) | ( | ) | |||||||||||
Balance as of December 31, 2018 | |||||||||||||||
Sale of marketable securities | ( | ) | ( | ) | ( | ) | |||||||||
Transfer of PREIT investment balance at Conversion Date | |||||||||||||||
(Decrease) increase in fair value of marketable securities | ( | ) | ( | ) | |||||||||||
Balance as of December 31, 2019 | $ | $ | $ | $ | |||||||||||
6. | Investments in Partially Owned Entities |
Fifth Avenue and Times Square JV
On April 18, 2019 (the “Closing Date”), we entered into a transaction agreement (the “Transaction Agreement”) with a group of institutional investors (the “Investors”). The Transaction Agreement provides for a series of transactions (collectively, the “Transaction”) pursuant to which (i) prior to the Closing Date, we contributed our interests in properties located at 640 Fifth Avenue, 655 Fifth Avenue, 666 Fifth Avenue, 689 Fifth Avenue, 697-703 Fifth Avenue, 1535 Broadway and 1540 Broadway (collectively, the “Properties”) to subsidiaries of a newly formed joint venture (“Fifth Avenue and Times Square JV”) and (ii) on the Closing Date, transferred a 48.5 % common interest in Fifth Avenue and Times Square JV to the Investors. The 48.5 % common interest in the joint venture represents an effective 47.2 % interest in the Properties (of which 45.4 % was transferred from Vornado). The Properties include approximately 489,000 square feet of retail space, 327,000 square feet of office space, signage associated with 1535 and 1540 Broadway, the parking garage at 1540 Broadway and the theater at 1535 Broadway.
We retained the remaining 51.5 % common interest in Fifth Avenue and Times Square JV which represents an effective 51.0 % interest in the Properties and an aggregate $1.828 billion of preferred equity interests in certain of the properties. We also provided $500,000,000 of temporary preferred equity on 640 Fifth Avenue until May 23, 2019 when mortgage financing was completed. All of the preferred equity has an annual coupon of 4.25 % for the first five years, increasing to 4.75 % for the next five years and thereafter at a formulaic rate. It can be redeemed under certain conditions on a tax deferred basis.
Net cash proceeds from the Transaction were $1.179 billion, after (i) deductions for the defeasance of a $390,000,000 mortgage loan on 666 Fifth Avenue and the repayment of a $140,000,000 mortgage loan on 655 Fifth Avenue, (ii) proceeds from a $500,000,000 mortgage loan on 640 Fifth Avenue, described below, (iii) approximately $23,000,000 used to purchase noncontrolling investors' interests and (iv) approximately $53,000,000 of transaction costs (including $17,000,000 of costs related to the defeasance of the 666 Fifth Avenue mortgage loan).
We continue to manage and lease the Properties. We share control with the Investors over major decisions of the joint venture, including decisions regarding leasing, operating and capital budgets, and refinancings. Accordingly, we no longer hold a controlling financial interest in the Properties which has been transferred to the joint venture. As a result, our investment in Fifth Avenue and Times Square JV is accounted for under the equity method from the date of transfer. The Transaction valued the Properties at $5.556 billion resulting in a financial statement net gain of $2.571 billion, before noncontrolling interest of $11,945,000 , including the related step up in our basis of the retained portion of the assets to fair value. The net gain is included in "net gain on transfer to Fifth Avenue and Times Square JV" on our consolidated statements of income for the year ended December 31, 2019. The gain for tax purposes was approximately $735,000,000 .
110
VORNADO REALTY TRUST AND VORNADO REALTY L.P.
NOTES TO CONSOLIDATED FINANCIAL STATEMENTS (CONTINUED)
6. | Investments in Partially Owned Entities - continued |
Fifth Avenue and Times Square JV - continued
On May 23, 2019, we received $500,000,000 from the redemption of our temporary preferred equity in 640 Fifth Avenue. The temporary preferred equity was redeemed from the proceeds of a $500,000,000 mortgage financing that was completed on the property. The five-year loan, which is guaranteed by us, is interest-only at LIBOR plus 1.01 %. The interest rate was swapped for four years to a fixed rate of 3.07 %.
Management, Development, Leasing and Other Agreements
We provide various services to Fifth Avenue and Times Square JV in accordance with management, development, leasing and other agreements, as described below.
We receive an annual fee for managing the Properties equal to 2 % of the gross revenues from the Properties. In addition, we are entitled to a development fee of 5 % of development costs, plus reimbursement of certain costs, for development projects performed by us. We are entitled to 1.5 % of development costs, plus reimbursement of certain costs, as a supervisory fee for development projects not performed by us. We provide leasing services for fees calculated based on a percentage of rents, less any commissions paid to third-party real estate brokers, if applicable. We jointly provide leasing services for the retail space with Crown Acquisitions Inc. ("Crown"), and exclusively provide leasing services for the office space. During the year ended December 31, 2019, we recognized $3,085,000 of property management fee income which is included in "fee and other income" on our consolidated statements of income.
BMS, our wholly-owned subsidiary, supervises cleaning, security and engineering services at certain of the Properties. During the year ended December 31, 2019, we recognized $3,087,000 of income for these services which is included in "fee and other income" on our consolidated statements of income.
We believe, based on comparable fees charged by other real estate companies, that the fees described above are at fair market value.
Alexander’s, Inc
As of December 31, 2019, we own 1,654,068 Alexander’s common shares, or approximately 32.4 % of Alexander’s common equity. We manage, develop and lease Alexander’s properties pursuant to agreements which expire in March of each year and are automatically renewable. As of December 31, 2019 and 2018, Alexander’s owed us an aggregate of $1,426,000 and $708,000 , respectively, pursuant to such agreements.
As of December 31, 2019 the market value (“fair value” pursuant to ASC 820) of our investment in Alexander’s, based on Alexander’s December 31, 2019 closing share price of $330.35 , was $546,421,000 , or $447,878,000 in excess of the carrying amount on our consolidated balance sheet. As of December 31, 2019, the carrying amount of our investment in Alexander’s, excluding amounts owed to us, exceeds our share of the equity in the net assets of Alexander’s by approximately $38,838,000 . The majority of this basis difference resulted from the excess of our purchase price for the Alexander’s common stock acquired over the book value of Alexander’s net assets. Substantially all of this basis difference was allocated, based on our estimates of the fair values of Alexander’s assets and liabilities, to real estate (land and buildings). We are amortizing the basis difference related to the buildings into earnings as additional depreciation expense over their estimated useful lives. This depreciation is not material to our share of equity in Alexander’s net income. The basis difference related to the land will be recognized upon disposition of our investment.
Management, Development, Leasing and Other Agreements
We receive an annual fee for managing Alexander’s and all of its properties equal to the sum of (i) $2,800,000 , (ii) 2 % of the gross revenue from the Rego Park II Shopping Center, (iii) $0.50 per square foot of the tenant-occupied office and retail space at 731 Lexington Avenue, and (iv) $324,000 , escalating at 3 % per annum, for managing the common area of 731 Lexington Avenue. In addition, we are entitled to a development fee of 6 % of development costs, as defined.
We provide Alexander’s with leasing services for a fee of 3 % of rent for the first ten years of a lease term, 2 % of rent for the eleventh through twentieth year of a lease term and 1 % of rent for the twenty-first through thirtieth year of a lease term, subject to the payment of rents by Alexander’s tenants. In the event third-party real estate brokers are used, our fee increases by 1 % and we are responsible for the fees to the third-parties. We are also entitled to a commission upon the sale of any of Alexander’s assets equal to 3 % of gross proceeds, as defined, for asset sales less than $50,000,000 , and 1 % of gross proceeds, as defined, for asset sales of $50,000,000 or more.
BMS, our wholly-owned subsidiary, supervises (i) cleaning, engineering and security services at Alexander’s 731 Lexington Avenue property and (ii) security services at Alexander’s Rego Park I, Rego Park II properties and The Alexander apartment tower. During the years ended December 31, 2019, 2018 and 2017, we recognized $3,613,000 , $2,705,000 and $2,678,000 of income, respectively, for these services.
111
VORNADO REALTY TRUST AND VORNADO REALTY L.P.
NOTES TO CONSOLIDATED FINANCIAL STATEMENTS (CONTINUED)
6. | Investments in Partially Owned Entities - continued |
61 Ninth Avenue
On January 28, 2019, a joint venture in which we have a 45.1 % interest, completed a $167,500,000 refinancing of 61 Ninth Avenue, a 166,000 square foot Manhattan office and retail property. The seven-year interest-only loan carries a rate of LIBOR plus 1.35 % (3.07 % as of December 31, 2019) and matures in January 2026. We realized net proceeds of approximately $31,000,000 . The loan replaces the previous $90,000,000 construction loan that bore interest at LIBOR plus 3.05 % and was scheduled to mature in December 2021.
Urban Edge Properties (“UE”) (NYSE: UE)
On March 4, 2019, we converted to common shares and sold all of our 5,717,184 partnership units of UE, realizing net proceeds of $108,512,000 . The sale resulted in a net gain of $62,395,000 which is included in "net gains on disposition of wholly owned and partially owned assets" on our consolidated statements of income for the year ended December 31, 2019.
512 West 22nd Street
On June 28, 2019, a joint venture in which we have a 55 % interest, completed a $145,700,000 refinancing of 512 West 22nd Street, a 173,000 square foot Manhattan office building, of which $109,565,000 was outstanding as of December 31, 2019. The four-year interest-only loan carries a rate of LIBOR plus 2.00 % (3.72 % as of December 31, 2019) and matures in June 2023 with a one-year extension option. The loan replaces the previous $126,000,000 construction loan that bore interest at LIBOR plus 2.65 % and was scheduled to mature in November 2019.
330 Madison Avenue
On July 11, 2019, we sold our 25 % interest in 330 Madison Avenue to our joint venture partner. We received net proceeds of approximately $100,000,000 after deducting our share of the existing $500,000,000 mortgage loan resulting in a financial statement net gain of $159,292,000 . The net gain is included in "net gains on disposition of wholly owned and partially owned assets" on our consolidated statements of income for the year ended December 31, 2019. The gain for tax purposes was approximately $139,000,000 .
825 Seventh Avenue
On July 25, 2019, a joint venture in which we have a 50 % interest, completed a $60,000,000 refinancing of 825 Seventh Avenue, a 165,000 square foot Manhattan office building, of which $31,889,000 was outstanding as of December 31, 2019. The interest-only loan carries a rate of LIBOR plus 1.65 % (3.40 % as of December 31, 2019) and matures in July 2022 with a one-year extension option. The loan replaces the previous $20,500,000 loan that bore interest at LIBOR plus 1.40 % and was scheduled to mature in September 2019.
Toys "R" Us, Inc. ("Toys")
On September 18, 2017, Toys filed a voluntary petition under Chapter 11 of the United States Bankruptcy Code. In the second quarter of 2018, Toys ceased U.S. operations. On February 1, 2019, the plan of reorganization for Toys, in which we owned a 32.5 % interest, was declared effective, and our stock in Toys was canceled. At December 31, 2018, we carried our Toys investment at zero . The canceling of our stock in Toys resulted in approximately a $420,000,000 capital loss deduction which was utilized in 2019 to partially offset taxable gains resulting from the transfer of our 45.4 % common equity interest in Fifth Avenue and Times Square JV, the sale of our 25 % interest in 330 Madison Avenue and sales of other assets.
650 Madison Avenue
On November 26, 2019, a joint venture in which we have a 20.1 % interest, completed a $800,000,000 refinancing of 650 Madison Avenue, a 601,000 square foot Manhattan office and retail property. The ten-year interest-only loan carries a fixed rate of 3.49 % and matures in December 2029. The loan replaces the previous $800,000,000 loan that bore interest at a fixed rate of 4.39 % and was scheduled to mature in October 2020.
50-70 West 93rd Street
On December 23, 2019, a joint venture in which we have a 49.9 % interest, completed a $85,500,000 refinancing, of which $82,500,000 was outstanding as of December 31, 2019, of 50-70 West 93rd Street, a 325 -unit Manhattan residential complex. The five-year interest-only loan carries an interest rate of LIBOR plus 1.53 %, which was swapped to a fixed rate of 3.14 %, and matures in December 2024. The loan replaces the previous $80,000,000 loan that bore interest at LIBOR plus 1.70 % and was scheduled to mature in August 2021, as extended.
112
VORNADO REALTY TRUST AND VORNADO REALTY L.P.
NOTES TO CONSOLIDATED FINANCIAL STATEMENTS (CONTINUED)
6. | Investments in Partially Owned Entities – continued |
Below is a schedule summarizing our investments in partially owned entities.
(Amounts in thousands) | Percentage Ownership at December 31, 2019 | As of December 31, | |||||||
2019 | 2018 | ||||||||
Investments: | |||||||||
Fifth Avenue and Times Square JV (see pages 110 and 111 for details) | $ | $ | |||||||
Partially owned office buildings/land(1) | Various | ||||||||
Alexander’s | |||||||||
PREIT(2) | N/A | ||||||||
UE(3) | N/A | ||||||||
Other investments(4) | Various | ||||||||
$ | $ | ||||||||
Investments in partially owned entities included in other liabilities(5): | |||||||||
7 West 34th Street | $ | ( | ) | $ | ( | ) | |||
85 Tenth Avenue | ( | ) | |||||||
330 Madison Avenue(6) | N/A | ( | ) | ||||||
$ | ( | ) | $ | ( | ) | ||||
____________________
(1) | Includes interests in 280 Park Avenue, 650 Madison Avenue, One Park Avenue, 512 West 22nd Street, 61 Ninth Avenue and others. |
(2) | On March 12, 2019, we converted all of our PREIT operating partnership units into common shares and began accounting for our investment as a marketable security in accordance with ASC 321 (see Note 5 - Marketable Securities). |
(3) | Sold on March 4, 2019 (see page 112 for details). |
(4) | Includes interests in Independence Plaza, Fashion Centre Mall/Washington Tower, Rosslyn Plaza, 50-70 West 93rd Street and others. |
(5) | Our negative basis results from distributions in excess of our investment. |
(6) | Sold on July 11, 2019 (see page 112 for details). |
Below is a schedule of net income (loss) from partially owned entities.
(Amounts in thousands) | Percentage Ownership at December 31, 2019 | For the Year Ended December 31, | |||||||||||
2019 | 2018 | 2017 | |||||||||||
Our share of net income (loss): | |||||||||||||
Fifth Avenue and Times Square JV (see pages 110 and 111 for details): | |||||||||||||
Equity in net income | $ | $ | $ | ||||||||||
Return on preferred equity, net of our share of the expense | |||||||||||||
Alexander's (see page 111 for details): | |||||||||||||
Equity in net income(1) | |||||||||||||
Management, leasing and development fees | |||||||||||||
Partially owned office buildings(2) | Various | ( | ) | ( | ) | ||||||||
Other investments(3) | Various | ( | ) | ( | ) | ( | ) | ||||||
$ | $ | $ | |||||||||||
____________________
(1) | 2018 includes our $ |
(2) | Includes interests in 280 Park Avenue, 650 Madison Avenue, One Park Avenue, 7 West 34th Street, 330 Madison Avenue (sold on July 11, 2019), 512 West 22nd Street, 61 Ninth Avenue, 85 Tenth Avenue and others. 2018 includes our $ |
(3) | Includes interests in Independence Plaza, Fashion Centre Mall/Washington Tower, Rosslyn Plaza, 50-70 West 93rd Street, 666 Fifth Avenue Office Condominium (sold on August 3, 2018), UE (sold on March 4, 2019), PREIT (accounted as a marketable security from March 12, 2019) and others. In 2018 and 2017, we recognized net losses of $ |
113
VORNADO REALTY TRUST AND VORNADO REALTY L.P.
NOTES TO CONSOLIDATED FINANCIAL STATEMENTS (CONTINUED)
6. | Investments in Partially Owned Entities – continued |
Below is a summary of the debt of our partially owned entities as of December 31, 2019 and 2018.
(Amounts in thousands) | Percentage Ownership at December 31, 2019 | Maturity | Interest Rate at December 31, 2019 | 100% Partially Owned Entities’ Debt at December 31,(1) | |||||||||
2019 | 2018 | ||||||||||||
Partially owned office buildings(2): | |||||||||||||
Mortgages payable | Various | 2021-2029 | $ | $ | |||||||||
Alexander's: | |||||||||||||
Mortgages payable | 2021-2025 | ||||||||||||
Fifth Avenue and Times Square JV: | |||||||||||||
Mortgages payable | 2022-2024 | ||||||||||||
Other(3): | |||||||||||||
Mortgages payable and other | Various | 2021-2025 | |||||||||||
________________________________________
(1) | All amounts are non-recourse to us except (i) the $ |
(2) | Includes 280 Park Avenue, 85 Tenth Avenue, One Park Avenue, 650 Madison Avenue, 7 West 34th Street, 61 Ninth Avenue, 512 West 22nd Street, 330 Madison Avenue (in 2018 only) and others. |
(3) | Includes Independence Plaza, Rosslyn Plaza, Fashion Centre Mall/Washington Tower, 50-70 West 93rd Street, UE (in 2018 only), PREIT (in 2018 only) and others. |
Based on our ownership interest in the partially owned entities above, our pro rata share of the debt of these partially owned entities was $2,802,859,000 and $2,682,865,000 as of December 31, 2019 and 2018, respectively.
Summary of Condensed Combined Financial Information
The following is a summary of condensed combined financial information for all of our partially owned entities as of December 31, 2019 and 2018 and for the years ended December 31, 2019, 2018 and 2017.
(Amounts in thousands) | As of December 31, | ||||||
2019 | 2018 | ||||||
Balance Sheet: | |||||||
Assets | $ | $ | |||||
Liabilities | |||||||
Noncontrolling interests | |||||||
Equity | |||||||
(Amounts in thousands) | For the Year Ended December 31, | ||||||||||
2019 | 2018 | 2017 | |||||||||
Income Statement: | |||||||||||
Total revenue | $ | $ | $ | ||||||||
Net income (loss) | ( | ) | |||||||||
114
VORNADO REALTY TRUST AND VORNADO REALTY L.P.
NOTES TO CONSOLIDATED FINANCIAL STATEMENTS (CONTINUED)
7. | 220 Central Park South ("220 CPS") |
We are constructing a residential condominium tower containing 397,000 salable square feet at 220 CPS. The development cost of this project (exclusive of land cost) is estimated to be approximately $1.450 billion, of which $1.373 billion has been expended as of December 31, 2019.
During the year ended December 31, 2019, we closed on the sale of 54 condominium units at 220 CPS for net proceeds of $1,605,356,000 resulting in a financial statement net gain of $604,393,000 which is included in "net gains on disposition of wholly owned and partially owned assets" on our consolidated statements of income. In connection with these sales, $101,828,000 of income tax expense was recognized on our consolidated statements of income. From inception to December 31, 2019, we closed on the sale of 65 units for aggregate net proceeds of $1,820,132,000 . During the year ended December 31, 2019, we repaid the remaining $737,000,000 of the $950,000,000 220 CPS loan.
8. | Dispositions |
3040 M Street
On September 18, 2019, we completed the $49,750,000 sale of 3040 M Street, a 44,000 square foot retail building in Washington, DC, which resulted in a net gain of $19,477,000 which is included in “net gains on disposition of wholly owned and partially owned assets” on our consolidated statements of income for year ended December 31, 2019. The gain for tax purposes was approximately $19,000,000 .
9. | Identified Intangible Assets and Liabilities |
The following summarizes our identified intangible assets (primarily above-market leases) and liabilities (primarily below-market leases) as of December 31, 2019 and 2018.
(Amounts in thousands) | As of December 31, | ||||||
2019 | 2018 | ||||||
Identified intangible assets: | |||||||
Gross amount | $ | $ | |||||
Accumulated amortization | ( | ) | ( | ) | |||
Total, net | $ | $ | |||||
Identified intangible liabilities (included in deferred revenue): | |||||||
Gross amount | $ | $ | |||||
Accumulated amortization | ( | ) | ( | ) | |||
Total, net | $ | $ | |||||
Amortization of acquired below-market leases, net of acquired above-market leases, resulted in an increase to rental revenues of $19,830,000 , $38,573,000 and $46,103,000 for the years ended December 31, 2019, 2018 and 2017, respectively. Estimated annual amortization of acquired below-market leases, net of acquired above-market leases, for each of the five succeeding years commencing January 1, 2020 is as follows:
(Amounts in thousands) | |||||
2020 | $ | ||||
2021 | |||||
2022 | |||||
2023 | |||||
2024 | |||||
115
VORNADO REALTY TRUST AND VORNADO REALTY L.P.
NOTES TO CONSOLIDATED FINANCIAL STATEMENTS (CONTINUED)
9. Identified Intangible Assets and Liabilities - continued
Amortization of all other identified intangible assets (a component of depreciation and amortization expense) was $8,666,000 , $18,018,000 and $25,057,000 for the years ended December 31, 2019, 2018 and 2017, respectively. Estimated annual amortization of all other identified intangible assets including acquired in-place leases for each of the five succeeding years commencing January 1, 2020 is as follows:
(Amounts in thousands) | |||||
2020 | $ | ||||
2021 | |||||
2022 | |||||
2023 | |||||
2024 | |||||
10. | Debt |
Secured Debt
On February 4, 2019, we completed a $95,700,000 refinancing of 435 Seventh Avenue, a 43,000 square foot Manhattan retail property. The interest-only loan carries a rate of LIBOR plus 1.30 % (3.00 % as of December 31, 2019) and matures in February 2024. The recourse loan replaces the previous $95,700,000 loan that bore interest at LIBOR plus 2.25 % and was scheduled to mature in August 2019.
On February 12, 2019, we completed a $580,000,000 refinancing of 100 West 33rd Street, a 1.1 million square foot Manhattan property comprised of 859,000 square feet of office space and the 256,000 square foot Manhattan Mall. The interest-only loan carries a rate of LIBOR plus 1.55 % (3.25 % as of December 31, 2019) and matures in April 2024, with two one-year extension options. The loan replaces the previous $580,000,000 loan that bore interest at LIBOR plus 1.65 % and was scheduled to mature in July 2020.
On May 24, 2019, we extended our $375,000,000 mortgage loan on 888 Seventh Avenue, a 885,000 square foot Manhattan office building, from December 2020 to December 2025. The interest rate on the new amortizing mortgage loan is LIBOR plus 1.70 % (3.44 % as of December 31, 2019). Pursuant to an existing swap agreement, the interest rate on the $375,000,000 mortgage loan has been swapped to 3.25 % through December 2020.
On September 5, 2019, a consolidated joint venture, in which we have a 50 % interest, completed a $75,000,000 refinancing of 606 Broadway, a 36,000 square foot Manhattan office and retail building, of which $67,804,000 was outstanding as of December 31, 2019. The interest-only loan carries a rate of LIBOR plus 1.80 % (3.52 % as of December 31, 2019) and matures in September 2024. In connection therewith, the joint venture purchased an interest rate cap that caps LIBOR at a rate of 4.00 %. The loan replaces the previous $65,000,000 construction loan. The construction loan bore interest at LIBOR plus 3.00 % and was scheduled to mature in May 2021.
On September 27, 2019, we repaid the $575,000,000 mortgage loan on PENN2 with proceeds from our unsecured revolving credit facilities. The mortgage loan was scheduled to mature in December 2019. PENN2 is a 1,795,000 square foot (as expanded) Manhattan office building currently under redevelopment.
Senior Unsecured Notes
On March 1, 2019, we called for redemption all of our $400,000,000 5.00 % senior unsecured notes. The notes, which were scheduled to mature in January 2022, were redeemed on April 1, 2019 at a redemption price of 105.51 % of the principal amount plus accrued interest. In connection therewith, we expensed $22,540,000 relating to debt prepayment costs which is included in "interest and debt expense" on our consolidated statements of income for the year ended December 31, 2019.
116
VORNADO REALTY TRUST AND VORNADO REALTY L.P.
NOTES TO CONSOLIDATED FINANCIAL STATEMENTS (CONTINUED)
10. | Debt - continued |
Unsecured Revolving Credit
On March 26, 2019, we increased to $1.5 billion (from $1.25 billion) and extended to March 2024 (as fully extended) from February 2022 one of our two unsecured revolving credit facilities. The interest rate on the extended facility was lowered from LIBOR plus 1.00 % to LIBOR plus 0.90 %. The facility fee remains unchanged at 20 basis points.
The following is a summary of our debt:
(Amounts in thousands) | Weighted Average Interest Rate at December 31, 2019 | Balance as of December 31, | |||||||
2019 | 2018 | ||||||||
Mortgages Payable: | |||||||||
Fixed rate | $ | $ | |||||||
Variable rate | |||||||||
Total | |||||||||
Deferred financing costs, net and other | ( | ) | ( | ) | |||||
Total, net | $ | $ | |||||||
Unsecured Debt: | |||||||||
Senior unsecured notes | $ | $ | |||||||
Deferred financing costs, net and other | ( | ) | ( | ) | |||||
Senior unsecured notes, net | |||||||||
Unsecured term loan | |||||||||
Deferred financing costs, net and other | ( | ) | ( | ) | |||||
Unsecured term loan, net | |||||||||
Unsecured revolving credit facilities | |||||||||
Total, net | $ | $ | |||||||
The net carrying amount of properties collateralizing the above indebtedness amounted to $5.6 billion as of December 31, 2019.
As of December 31, 2019, the principal repayments required for the next five years and thereafter are as follows:
(Amounts in thousands) | Mortgages Payable | Senior Unsecured Notes, Unsecured Term Loan and Unsecured Revolving Credit Facilities | |||||||
Year Ended December 31, | |||||||||
2020 | $ | $ | |||||||
2021 | |||||||||
2022 | |||||||||
2023 | |||||||||
2024 | |||||||||
Thereafter | |||||||||
117
VORNADO REALTY TRUST AND VORNADO REALTY L.P.
NOTES TO CONSOLIDATED FINANCIAL STATEMENTS (CONTINUED)
11. | Redeemable Noncontrolling Interests/Redeemable Partnership Units |
Below are the details of redeemable noncontrolling interests/redeemable partnership units as of December 31, 2019 and 2018.
(Amounts in thousands, except units and per unit amounts) | Balance as of December 31, | Units Outstanding as of December 31, | Per Unit Liquidation Preference | Preferred or Annual Distribution Rate | ||||||||||||||||||
Unit Series | 2019 | 2018 | 2019 | 2018 | ||||||||||||||||||
Common: | ||||||||||||||||||||||
Class A units held by third parties | $ | $ | n/a | $ | ||||||||||||||||||
Perpetual Preferred/Redeemable Preferred(1): | ||||||||||||||||||||||
5.00% D-16 Cumulative Redeemable | $ | $ | $ | $ | ||||||||||||||||||
3.25% D-17 Cumulative Redeemable | $ | $ | $ | $ | ||||||||||||||||||
________________________________________
(1) | Holders may tender units for redemption to the Operating Partnership for cash at their stated redemption amount; Vornado, at its option, may assume that obligation and pay the holders either cash or Vornado preferred shares on a one-for-one basis. These units are redeemable at Vornado's option at any time. |
Below is a table summarizing the activity of redeemable noncontrolling interests/redeemable partnership units.
(Amounts in thousands) | For the Year Ended December 31, | ||||||
2019 | 2018 | ||||||
Beginning balance | $ | $ | |||||
Net income | |||||||
Other comprehensive loss | ( | ) | ( | ) | |||
Distributions | ( | ) | ( | ) | |||
Special distribution declared on December 18, 2019 (see Note 12 - Shareholders' Equity/Partners' Capital) | ( | ) | |||||
Redemption of Class A units for Vornado common shares, at redemption value | ( | ) | ( | ) | |||
Adjustments to carry redeemable Class A units at redemption value | ( | ) | ( | ) | |||
Other, net | |||||||
Ending balance | $ | $ | |||||
Redeemable noncontrolling interests/redeemable partnership units exclude our Series G-1 through G-4 convertible preferred units and Series D-13 cumulative redeemable preferred units, as they are accounted for as liabilities in accordance with ASC Topic 480, Distinguishing Liabilities and Equity, because of their possible settlement by issuing a variable number of Vornado common shares. Accordingly, the fair value of these units is included as a component of “other liabilities” on our consolidated balance sheets and aggregated $50,561,000 as of December 31, 2019 and 2018. Changes in the value from period to period, if any, are charged to “interest and debt expense” on our consolidated statements of income.
118
VORNADO REALTY TRUST AND VORNADO REALTY L.P.
NOTES TO CONSOLIDATED FINANCIAL STATEMENTS (CONTINUED)
12. | Shareholders' Equity/Partners' Capital |
Common Shares (Vornado Realty Trust)
As of December 31, 2019, there were 190,985,677 common shares outstanding. During 2019, we paid an aggregate of $503,785,000 of common dividends comprised of quarterly common dividends of $0.66 per share.
On December 18, 2019 , Vornado's Board of Trustees declared a special dividend of $1.95 per share, or $372,380,000 in the aggregate, which was paid on January 15, 2020 to common shareholders as of the Record Date.
Class A Units (Vornado Realty L.P.)
As of December 31, 2019, there were 190,985,677 Class A units outstanding that were held by Vornado. These units are classified as “partners’ capital” on the consolidated balance sheets of the Operating Partnership. As of December 31, 2019, there were 13,298,956 Class A units outstanding, that were held by third parties. These units are classified outside of “partners’ capital” as “redeemable partnership units” on the consolidated balance sheets of the Operating Partnership (See Note 11 – Redeemable Noncontrolling Interests/Redeemable Partnership Units). During 2019, the Operating Partnership paid an aggregate of $503,785,000 of distributions to Vornado comprised of quarterly common distributions of $0.66 per unit.
On January 15, 2020, distributions of $1.95 per unit, or $398,292,000 in the aggregate, were paid to Class A unitholders of the Operating Partnership as of the Record Date, of which $372,380,000 was distributed to Vornado, in connection with the special dividend declared on December 18, 2019 by Vornado's Board of Trustees.
The following table sets forth the details of our preferred shares of beneficial interest and the preferred units of the Operating Partnership as of December 31, 2019 and 2018.
(Amounts in thousands, except share/unit and per share/per unit amounts) | ||||||||||||||||||||||
Per Share/Unit | ||||||||||||||||||||||
Balance as of December 31, | Shares/Units Outstanding as of December 31, | Liquidation Preference | Annual Dividend/ Distribution(1) | |||||||||||||||||||
Preferred Shares/Units | 2019 | 2018 | 2019 | 2018 | ||||||||||||||||||
Convertible Preferred: | ||||||||||||||||||||||
6.5% Series A: authorized 15,640 shares/units(2) | $ | $ | $ | $ | ||||||||||||||||||
Cumulative Redeemable Preferred: | ||||||||||||||||||||||
5.70% Series K: authorized 12,000,000 shares/units(3) | ||||||||||||||||||||||
5.40% Series L: authorized 13,800,000 shares/units(3) | ||||||||||||||||||||||
5.25% Series M: authorized 13,800,000 shares/units(3) | ||||||||||||||||||||||
$ | $ | |||||||||||||||||||||
________________________________________
(1) | Dividends on preferred shares and distributions on preferred units are cumulative and are payable quarterly in arrears. |
(2) | Redeemable at the option of Vornado under certain circumstances, at a redemption price of |
(3) | Redeemable at Vornado's option at a redemption price of $ |
During 2019, we paid an aggregate of $50,131,000 of preferred dividends.
Accumulated Other Comprehensive (Loss) Income
The following table sets forth the changes in accumulated other comprehensive (loss) income by component for the year ended December 31, 2019.
(Amounts in thousands) | |||||||||||||||
Total | Accumulated other comprehensive income of nonconsolidated subsidiaries | Interest rate swaps | Other | ||||||||||||
Accumulated other comprehensive income (loss) as of December 31, 2018 | $ | $ | $ | $ | ( | ) | |||||||||
Other comprehensive (loss) income | ( | ) | ( | ) | ( | ) | |||||||||
Amount reclassified from accumulated other comprehensive income(1) | ( | ) | ( | ) | |||||||||||
Accumulated other comprehensive (loss) income as of December 31, 2019 | $ | ( | ) | $ | $ | ( | ) | $ | ( | ) | |||||
________________________________________
(1) | Amount reclassified related to the conversion of our PREIT operating partnership units into common shares. |
119
VORNADO REALTY TRUST AND VORNADO REALTY L.P.
NOTES TO CONSOLIDATED FINANCIAL STATEMENTS (CONTINUED)
13. | Variable Interest Entities |
Unconsolidated VIEs
Consolidated VIEs
Our most significant consolidated VIEs are the Operating Partnership (for Vornado), the Fund and the Crowne Plaza Joint Venture, the Farley joint venture and certain properties that have non-controlling interests. These entities are VIEs because the non-controlling interests do not have substantive kick-out or participating rights. We consolidate these entities because we control all significant business activities.
As of December 31, 2019, the total assets and liabilities of our consolidated VIEs, excluding the Operating Partnership, were $4,923,656,000 and $2,646,623,000 respectively. As of December 31, 2018, the total assets and liabilities of our consolidated VIEs, excluding the Operating Partnership, were $4,445,436,000 and $2,533,753,000 , respectively.
14. | Fair Value Measurements |
120
VORNADO REALTY TRUST AND VORNADO REALTY L.P.
NOTES TO CONSOLIDATED FINANCIAL STATEMENTS (CONTINUED)
14. | Fair Value Measurements - continued |
Financial Assets and Liabilities Measured at Fair Value on a Recurring Basis
Financial assets and liabilities that are measured at fair value on our consolidated balance sheets consist of (i) marketable securities, (ii) real estate fund investments, (iii) the assets in our deferred compensation plan (for which there is a corresponding liability on our consolidated balance sheets), (iv) interest rate swaps and (v) mandatorily redeemable instruments (Series G-1 through G-4 convertible preferred units, Series D-13 cumulative redeemable preferred units). The tables below aggregate the fair values of these financial assets and liabilities by their levels in the fair value hierarchy as of December 31, 2019 and 2018, respectively.
(Amounts in thousands) | As of December 31, 2019 | ||||||||||||||
Total | Level 1 | Level 2 | Level 3 | ||||||||||||
Marketable securities | $ | $ | $ | $ | |||||||||||
Real estate fund investments | |||||||||||||||
Deferred compensation plan assets ($11,819 included in restricted cash and $91,954 in other assets) | |||||||||||||||
Interest rate swaps (included in other assets) | |||||||||||||||
Total assets | $ | $ | $ | $ | |||||||||||
Mandatorily redeemable instruments (included in other liabilities) | $ | $ | $ | $ | |||||||||||
Interest rate swaps (included in other liabilities) | |||||||||||||||
Total liabilities | $ | $ | $ | $ | |||||||||||
(Amounts in thousands) | As of December 31, 2018 | ||||||||||||||
Total | Level 1 | Level 2 | Level 3 | ||||||||||||
Marketable securities | $ | $ | $ | $ | |||||||||||
Real estate fund investments | |||||||||||||||
Deferred compensation plan assets ($8,402 included in restricted cash and $88,122 in other assets) | |||||||||||||||
Interest rate swaps (included in other assets) | |||||||||||||||
Total assets | $ | $ | $ | $ | |||||||||||
Mandatorily redeemable instruments (included in other liabilities) | $ | $ | $ | $ | |||||||||||
Interest rate swaps (included in other liabilities) | |||||||||||||||
Total liabilities | $ | $ | $ | $ | |||||||||||
Real Estate Fund Investments
As of December 31, 2019, we had four real estate fund investments with an aggregate fair value of $222,649,000 , or $112,915,000 below cost. These investments are classified as Level 3.
Significant unobservable quantitative inputs used in determining the fair value of each investment include capitalization rates and discount rates. These rates are based on the location, type and nature of each property, current and anticipated market conditions, industry publications and from the experience of our Acquisitions and Capital Markets departments. Significant unobservable quantitative inputs in the table below were utilized in determining the fair value of these real estate fund investments as of December 31, 2019 and 2018.
Range | Weighted Average (based on fair value of investments) | ||||||
Unobservable Quantitative Input | December 31, 2019 | December 31, 2018 | December 31, 2019 | December 31, 2018 | |||
Discount rates | 8.2% to 12.0% | 10.0% to 15.0% | |||||
Terminal capitalization rates | 4.6% to 8.2% | 5.4% to 7.7% | |||||
121
VORNADO REALTY TRUST AND VORNADO REALTY L.P.
NOTES TO CONSOLIDATED FINANCIAL STATEMENTS (CONTINUED)
14. | Fair Value Measurements - continued |
Financial Assets and Liabilities Measured at Fair Value on a Recurring Basis - continued
Real Estate Fund Investments - continued
The inputs on the previous page are subject to change based on changes in economic and market conditions and/or changes in use or timing of exit. Changes in discount rates and terminal capitalization rates result in increases or decreases in the fair values of these investments. The discount rates encompass, among other things, uncertainties in the valuation models with respect to terminal capitalization rates and the amount and timing of cash flows. Therefore, a change in the fair value of these investments resulting from a change in the terminal capitalization rate may be partially offset by a change in the discount rate. It is not possible for us to predict the effect of future economic or market conditions on our estimated fair values.
The table below summarizes the changes in the fair value of real estate fund investments that are classified as Level 3, for the years ended December 31, 2019 and 2018.
(Amounts in thousands) | For the Year Ended December 31, | ||||||
2019 | 2018 | ||||||
Beginning balance | $ | $ | |||||
Net unrealized loss on held investments | ( | ) | ( | ) | |||
Purchases/additional fundings | |||||||
Dispositions | ( | ) | |||||
Net realized loss on exited investments | ( | ) | |||||
Ending balance | $ | $ | |||||
Deferred Compensation Plan Assets
Deferred compensation plan assets that are classified as Level 3 consist of investments in limited partnerships and investment funds, which are managed by third parties. We receive quarterly financial reports from a third-party administrator, which are compiled from the quarterly reports provided to them from each limited partnership and investment fund. The quarterly reports provide net asset values on a fair value basis which are audited by independent public accounting firms on an annual basis. The period of time over which these underlying assets are expected to be liquidated is unknown. The third-party administrator does not adjust these values in determining our share of the net assets and we do not adjust these values when reported in our consolidated financial statements.
The table below summarizes the changes in the fair value of deferred compensation plan assets that are classified as Level 3, for the years ended December 31, 2019 and 2018.
(Amounts in thousands) | For the Year Ended December 31, | ||||||
2019 | 2018 | ||||||
Beginning balance | $ | $ | |||||
Sales | ( | ) | ( | ) | |||
Purchases | |||||||
Realized and unrealized gains (losses) | ( | ) | |||||
Other, net | |||||||
Ending balance | $ | $ | |||||
Fair Value Measurements on a Nonrecurring Basis
Assets measured at fair value on a nonrecurring basis on our consolidated balance sheets consist primarily of real estate assets required to be measured for impairment at December 31, 2018. The fair values of real estate assets required to be measured for impairment were determined using comparable sales activity. There were no assets measured at fair value on a nonrecurring basis on our consolidated balance sheets at December 31, 2019.
(Amounts in thousands) | As of December 31, 2018 | ||||||||||||||
Total | Level 1 | Level 2 | Level 3 | ||||||||||||
Real estate asset | $ | $ | $ | $ | |||||||||||
122
VORNADO REALTY TRUST AND VORNADO REALTY L.P.
NOTES TO CONSOLIDATED FINANCIAL STATEMENTS (CONTINUED)
14. | Fair Value Measurements – continued |
Financial Assets and Liabilities not Measured at Fair Value
Financial assets and liabilities that are not measured at fair value on our consolidated balance sheets include cash equivalents (primarily money market funds, which invest in obligations of the United States government), and our secured and unsecured debt. Estimates of the fair value of these instruments are determined by the standard practice of modeling the contractual cash flows required under the instrument and discounting them back to their present value at the appropriate current risk adjusted interest rate, which is provided by a third-party specialist. For floating rate debt, we use forward rates derived from observable market yield curves to project the expected cash flows we would be required to make under the instrument. The fair value of cash equivalents and borrowings under our unsecured revolving credit facilities and unsecured term loan are classified as Level 1. The fair value of our secured debt and unsecured debt are classified as Level 2. The table below summarizes the carrying amounts and fair value of these financial instruments as of December 31, 2019 and 2018.
(Amounts in thousands) | As of December 31, 2019 | As of December 31, 2018 | |||||||||||||
Carrying Amount | Fair Value | Carrying Amount | Fair Value | ||||||||||||
Cash equivalents | $ | $ | $ | $ | |||||||||||
Debt: | |||||||||||||||
Mortgages payable | $ | $ | $ | $ | |||||||||||
Senior unsecured notes | |||||||||||||||
Unsecured term loan | |||||||||||||||
Unsecured revolving credit facilities | |||||||||||||||
Total | $ | (1) | $ | $ | (1) | $ | |||||||||
____________________
(1) |
Derivatives and Hedging
We utilize various financial instruments to mitigate the impact of interest rate fluctuations on our cash flows and earnings, including hedging strategies, depending on our analysis of the interest rate environment and the costs and risks of such strategies. We recognize the fair values of all derivatives in "other assets" or "other liabilities" on our consolidated balance sheets. Derivatives that are not hedges are adjusted to fair value through earnings. If a derivative is a hedge, depending on the nature of the hedge, changes in the fair value of the derivative will either be offset against the change in fair value of the hedge asset, liability, or firm commitment through earnings, or recognized in other comprehensive income until the hedged item is recognized in earnings. Reported net income and equity may increase or decrease prospectively, depending on future levels of interest rates and other variables affecting the fair values of derivative instruments and hedged items, but will have no effect on cash flows.
The following table summarizes our consolidated derivative instruments, all of which hedge variable rate debt, as of December 31, 2019.
(Amounts in thousands) | As of December 31, 2019 | |||||||||||||||
Variable Rate | ||||||||||||||||
Hedged Item (Interest rate swaps) | Fair Value | Notional Amount | Spread over LIBOR | Interest Rate | Swapped Rate | Expiration Date | ||||||||||
Included in other assets: | ||||||||||||||||
770 Broadway mortgage loan | $ | $ | L+175 | 9/20 | ||||||||||||
888 Seventh Avenue mortgage loan | L+170 | 12/20 | ||||||||||||||
Other | ||||||||||||||||
$ | $ | |||||||||||||||
Included in other liabilities: | ||||||||||||||||
Unsecured term loan | $ | $ | L+100 | 10/23 | ||||||||||||
33-00 Northern Boulevard mortgage loan | L+180 | 1/25 | ||||||||||||||
$ | $ | |||||||||||||||
123
VORNADO REALTY TRUST AND VORNADO REALTY L.P.
NOTES TO CONSOLIDATED FINANCIAL STATEMENTS (CONTINUED)
15. | Stock-based Compensation |
On May 16, 2019, our shareholders approved the 2019 Omnibus Share Plan (the “Plan"), which replaces the 2010 Omnibus Share Plan. Under the Plan, the Compensation Committee of Vornado's Board of Trustees (the "Committee") may grant incentive and non-qualified Vornado stock options, restricted stock, restricted Operating Partnership units ("OP units"), out-performance plan awards ("OPPs"), appreciation-only long-term incentive plan units (“AO LTIP Units”) and Performance Conditioned AO LTIP Units to certain of our employees and officers. Awards may be granted up to a maximum 5,500,000 shares, if all awards granted are Full Value awards, as defined in the Plan, and up to 11,000,000 shares, if all of the awards granted are Not Full Value Awards, as defined in the Plan. Full Value Awards are awards of securities, such as restricted shares, that, if all vesting requirements are met, do not require the payment of an exercise price or strike price to acquire the securities. Not Full Value Awards are awards of securities, such as options, that do require the payment of an exercise price or strike price. As of December 31, 2019, Vornado has approximately 5,207,000 shares available for future grants under the Plan, if all awards granted are Full Value Awards, as defined.
We account for all equity-based compensation in accordance with ASC Topic 718, Compensation - Stock Compensation. Below is a summary of our stock-based compensation expense, a component of "general and administrative" expense on our consolidated statements of income.
(Amounts in thousands) | For the Year Ended December 31, | ||||||||||
2019 | 2018 | 2017 | |||||||||
OP Units | $ | $ | $ | ||||||||
Performance Conditioned AO LTIP Units | |||||||||||
AO LTIP Units | |||||||||||
OPPs | |||||||||||
Vornado restricted stock | |||||||||||
Vornado stock options | |||||||||||
$ | $ | $ | |||||||||
Stock-based compensation expense in the first quarter of 2019 included $16,211,000 from the accelerated vesting of previously issued OP units and Vornado restricted stock due to the removal of the time-based vesting requirement for participants who have reached 65 years of age. The right to sell such awards remains subject to original terms of grant. The increase in expense in the first quarter of 2019 was partially offset by lower stock-based compensation expense of $2,578,000 in each of the second, third and fourth quarter of 2019 and will be completely offset by lower stock-based compensation expense of $8,477,000 thereafter.
Stock-based compensation expense for the year ended December 31, 2019 also includes $8,143,000 for OP units granted outside of the Plan to an executive officer in connection with his employment in reliance on the employment inducement exception to shareholder approval provided under the New York Stock Exchange Listing Rule 303A.08; and $2,304,000 for the year ended December 31, 2019 for OP units granted under the Plan to certain executive officers as a result of promotions. The award granted outside of the Plan has a grant date fair value of $25,500,000 and vests 20 % on the grant date, 40 % on the three-year anniversary of the date of grant, and 40 % on the four-year anniversary of the date of grant. The awards granted under the Plan have an aggregate grant date fair value of $15,000,000 and cliff vest after four years. Compensation expense related to OP unit grants are recognized ratably over the vesting period. Additional non-cash expense associated with these awards will be $9,603,000 in each of 2020 and 2021, $7,718,000 in 2022 and $2,655,000 in 2023.
Below is a summary of unrecognized compensation expense for the year ended December 31, 2019.
(Amounts in thousands) | As of December 31, 2019 | Weighted-Average Remaining Contractual Term | |||
OP Units | $ | ||||
AO LTIP Units | |||||
OPPs | |||||
Vornado restricted stock | |||||
Vornado stock options | |||||
Performance Conditioned AO LTIP Units | |||||
$ | |||||
124
VORNADO REALTY TRUST AND VORNADO REALTY L.P.
NOTES TO CONSOLIDATED FINANCIAL STATEMENTS (CONTINUED)
15. | Stock-based Compensation - continued |
OPPs
OPPs are multi-year, performance-based equity compensation plans under which participants have the opportunity to earn a class of units (“OPP units”) of the Operating Partnership if, and only if, Vornado outperforms a predetermined total shareholder return (“TSR”) and/or outperform the market with respect to a relative TSR during the three-year performance period (the “Performance Period”) as described below. OPP units, if earned, become convertible into Class A units of the Operating Partnership (and ultimately into Vornado common shares) following vesting.
Awards under the 2018 OPP may be earned if Vornado (i) achieves a TSR level greater than 21 % over the Performance Period (the “Absolute Component”) and/or (ii) achieves a TSR above a benchmark weighted index comprised of 70 % of the SNL US Office REIT Index and 30 % of the SNL US Retail Index over the Performance Period (the “Relative Component”).
The value of awards under the Relative Component and Absolute Component will be calculated separately and will each be subject to an aggregate $35,000,000 maximum award cap for all participants. The two components will be added together to determine the aggregate award size, which shall also be subject to the aggregate $35,000,000 maximum award cap for all participants. In the event awards are earned under the Absolute Component, but Vornado underperforms the index by more than 200 basis points per annum over the Performance Period (600 basis points over the three years ), the amount earned under the Absolute Component will be reduced (and potentially fully negated) based on the degree by which the index exceeds Vornado’s TSR. In the event these awards are earned under the Relative Component, but Vornado fails to achieve a TSR of at least 3 % per annum, awards earned under the Relative Component will be reduced on a ratable sliding scale based on Vornado’s absolute TSR performance, with awards earned under the Relative Component being reduced by a maximum of 50 % in the event Vornado’s TSR during the applicable measurement period is 0 % or negative.
If the designated performance objectives are achieved, awards under the 2018 OPP will vest ratably in each of years three, four and five. In addition, all of Vornado’s Named Executive Officers (as defined in Vornado’s Proxy Statement filed on Schedule 14A with the Securities and Exchange Commission on April 5, 2019) are required to hold any earned and vested awards for one year following each such vesting date. Dividends on awards granted under the 2018 OPP accrue during the Performance Period and are paid to participants if awards are ultimately earned based on the achievement of the designated performance objectives.
Below is the summary of the OPP units granted during the years December 31, 2018, 2017 and 2016.
Plan Year | Total Plan Notional Amount | Percentage of Notional Amount Granted | Grant Date Fair Value(1) | OPP Units Earned | |||||||||
2018 | $ | % | $ | ||||||||||
2017 | % | ||||||||||||
2016 | % | ||||||||||||
________________________________________
(1) | During the years ended December 31, 2018 and 2017, $ |
125
VORNADO REALTY TRUST AND VORNADO REALTY L.P.
NOTES TO CONSOLIDATED FINANCIAL STATEMENTS (CONTINUED)
15. | Stock-based Compensation - continued |
Vornado Stock Options
Vornado stock options are granted at an exercise price equal to the average of the high and low market price of Vornado’s common shares on the NYSE on the date of grant, generally vest over 4 years and expire 10 years from the date of grant. Compensation expense related to Vornado stock option awards is recognized on a straight-line basis over the vesting period.
Below is a summary of Vornado’s stock option activity for the year ended December 31, 2019.
Shares | Weighted- Average Exercise Price | Weighted- Average Remaining Contractual Term | Aggregate Intrinsic Value | |||||||||
Outstanding as of December 31, 2018 | $ | |||||||||||
Granted | ||||||||||||
Exercised | ( | ) | ||||||||||
Cancelled or expired | ( | ) | ||||||||||
Outstanding as of December 31, 2019 | $ | $ | ||||||||||
Options vested and expected to vest as of December 31, 2019 | $ | $ | ||||||||||
Options exercisable as of December 31, 2019 | $ | $ | ||||||||||
As of December 31, | |||||
2019 | 2018 | 2017 | |||
Expected volatility | |||||
Expected life | |||||
Risk free interest rate | |||||
Expected dividend yield | |||||
The weighted average grant date fair value of options granted during the years ended December 31, 2019, 2018 and 2017 was $16.64 , $18.42 and $25.84 , respectively. Cash received from option exercises for the years ended December 31, 2019, 2018 and 2017 was $5,495,000 , $5,927,000 and $28,253,000 , respectively. The total intrinsic value of options exercised during the years ended December 31, 2019, 2018 and 2017 was $18,954,000 , $25,820,000 and $9,178,000 , respectively.
126
VORNADO REALTY TRUST AND VORNADO REALTY L.P.
NOTES TO CONSOLIDATED FINANCIAL STATEMENTS (CONTINUED)
15. | Stock-based Compensation - continued |
Performance Conditioned AOLTIP Units
On January 14, 2019, the Committee approved the issuance of performance conditioned appreciation-only long-term incentive plan units ("Performance Conditioned AO LTIP Units") pursuant to the 2010 Omnibus Share Plan to our named executive officers ("NEOs") in our 2019 proxy statement. Performance Conditioned AO LTIP Units are AO LTIP Units that require the achievement of certain performance conditions by a specified date or they are forfeited. The performance-based condition is met if Vornado common shares trade at or above 110 % of the $64.48 grant price per share for any 20 consecutive days on or before the fourth anniversary following the date of grant. If the performance conditions are not met, the awards are forfeited. If the performance conditions are met, once vested, the awards may be converted into Class A Operating Partnership units in the same manner as AO LTIP Units until ten years from the date of grant.
Units | Weighted-Average Grant-Date Fair Value | |||||
Granted | $ | |||||
Outstanding as of December 31, 2019 | ||||||
The fair value of the Performance Conditioned AO LTIP Units on the date of grant was $8,983,000 , of which $7,481,000 was immediately expensed due to the acceleration of vesting for employees who are retirement eligible. The remaining $1,502,000 is being amortized into expense over a four-year period from the date of grant using a graded vesting attribution model.
As of December 31, 2019 | |
Expected volatility | |
Expected life | |
Risk free interest rate | |
Expected dividend yield | |
AO LTIP Units
AO LTIP Units are a class of partnership interests in the Operating Partnership that are intended to qualify as “profits interests” for federal income tax purposes and generally only allow the recipient to realize value to the extent the fair market value of a Vornado common share exceeds the threshold level set at the time the AO LTIP Units are granted, subject to any vesting conditions applicable to the award. The threshold level is intended to be equal to 100 % of the then fair market value of a Vornado common share on the date of grant. The value of vested AO LTIP Units is realized through conversion of the AO LTIP Units into Class A Operating Partnership units. The number of Class A Units into which vested AO LTIP Units may be converted is determined based on the quotient of (i) the excess of the conversion value on the conversion date over the threshold value designated at the time the AO LTIP Unit was granted, divided by (ii) the conversion value on the conversion date. The “conversion value” is the value of a Vornado common share on the conversion date multiplied by the Conversion Factor as defined in the Partnership Agreement, which is currently one. AO LTIP Units have a term of 10 years from the grant date. Each holder will generally receive special income allocations in respect of an AO LTIP Unit equal to 10 % (or such other percentage specified in the applicable award agreement) of the income allocated in respect of a Class A Unit. Upon conversion of AO LTIP Units to Class A Units, holders will be entitled to receive in respect of each such AO LTIP Unit, on a per unit basis, a special distribution equal to 10 % (or such other percentage specified in the applicable award agreement) of the distributions received by a holder of an equivalent number of Class A Units during the period from the grant date of the AO LTIP Units through the date of conversion.
Below is a summary of AO LTIP Units activity for the year ended December 31, 2019.
Units | Weighted-Average Grant-Date Fair Value | ||||||
Outstanding as of December 31, 2018 | $ | ||||||
Granted | |||||||
Vested | ( | ) | |||||
Cancelled or expired | ( | ) | |||||
Outstanding as of December 31, 2019 | |||||||
127
VORNADO REALTY TRUST AND VORNADO REALTY L.P.
NOTES TO CONSOLIDATED FINANCIAL STATEMENTS (CONTINUED)
15. | Stock-based Compensation - continued |
AO LTIP Units - continued
AO LTIP Units granted during the years ended December 31, 2019 and 2018 had a fair value of $3,429,000 and $3,484,000 , respectively. The fair value of each AO LTIP Units granted is estimated on the date of grant using an option-pricing model with the following weighted-average assumptions for grants in the year ended December 31, 2019.
As of December 31, | |||
2019 | 2018 | ||
Expected volatility | |||
Expected life | |||
Risk free interest rate | |||
Expected dividend yield | |||
OP Units
OP Units are granted at the average of the high and low market price of Vornado’s common shares on the NYSE on the date of grant, vest ratably over four years and are subject to a taxable book-up event, as defined. Compensation expense related to OP Units is recognized ratably over the vesting period using a graded vesting attribution model. Distributions paid on unvested OP Units are charged to “net income attributable to noncontrolling interests in the Operating Partnership” on Vornado’s consolidated statements of income and to “preferred unit distributions” on the Operating Partnership’s consolidated statements of income and amounted to $4,070,000 , $2,559,000 and $2,310,000 in the years ended December 31, 2019, 2018 and 2017, respectively.
Below is a summary of restricted OP unit activity for the year ended December 31, 2019.
Unvested Units | Units | Weighted-Average Grant-Date Fair Value | |||||
Unvested as of December 31, 2018 | $ | ||||||
Granted | |||||||
Vested | ( | ) | |||||
Cancelled or expired | ( | ) | |||||
Unvested as of December 31, 2019 | |||||||
OP Units granted in 2019, 2018 and 2017 had a fair value of $58,732,000 , $17,463,000 and $24,927,000 , respectively. The fair value of OP Units that vested during the years ended December 31, 2019, 2018 and 2017 was $27,821,000 , $18,037,000 and $20,903,000 , respectively.
Vornado Restricted Stock
Vornado restricted stock awards are granted at the average of the high and low market price of Vornado’s common shares on the NYSE on the date of grant and generally vest over four years . Compensation expense related to Vornado’s restricted stock awards is recognized on a straight-line basis over the vesting period. Dividends paid on unvested Vornado restricted stock are charged directly to retained earnings and amounted to $51,000 , $44,000 and $46,000 for the years ended December 31, 2019, 2018 and 2017, respectively.
Below is a summary of Vornado’s restricted stock activity for the year ended December 31, 2019.
Unvested Shares | Shares | Weighted-Average Grant-Date Fair Value | |||||
Unvested as of December 31, 2018 | $ | ||||||
Granted | |||||||
Vested | ( | ) | |||||
Cancelled or expired | ( | ) | |||||
Unvested as of December 31, 2019 | |||||||
128
VORNADO REALTY TRUST AND VORNADO REALTY L.P.
NOTES TO CONSOLIDATED FINANCIAL STATEMENTS (CONTINUED)
16. | Transaction Related Costs, Impairment Losses and Other |
The following table sets forth the details of transaction related costs, impairment losses and other:
(Amounts in thousands) | For the Year Ended December 31, | ||||||||||
2019 | 2018 | 2017 | |||||||||
Non-cash impairment losses and related write-offs(1) | $ | $ | $ | ||||||||
Transaction related costs | |||||||||||
Transfer tax(2) | |||||||||||
$ | $ | $ | |||||||||
____________________
(1) | 2019 primarily from 608 Fifth Avenue (see below). |
(2) | Additional Transfer Tax recorded in the first quarter 2018 related to the acquisition of Independence Plaza. The joint venture, in which we have a |
608 Fifth Avenue
17. | Interest and Other Investment Income, Net |
The following table sets forth the details of our interest and other investment income, net:
________________________________________
(Amounts in thousands) | For the Year Ended December 31, | ||||||||||
2019 | 2018 | 2017 | |||||||||
(Decrease) increase in fair value of marketable securities: | |||||||||||
PREIT (see page 110 for details) | $ | ( | ) | $ | $ | ||||||
Lexington (see page 109 for details) | ( | ) | |||||||||
Other | |||||||||||
( | ) | ( | ) | ||||||||
Interest on cash and cash equivalents and restricted cash | |||||||||||
Interest on loans receivable | (1) | ||||||||||
Dividends on marketable securities | |||||||||||
Other, net | |||||||||||
$ | $ | $ | |||||||||
(1) |
18. | Interest and Debt Expense |
The following table sets forth the details of interest and debt expense:
(Amounts in thousands) | For the Year Ended December 31, | ||||||||||
2019 | 2018 | 2017 | |||||||||
Interest expense | $ | (1) | $ | $ | |||||||
Capitalized interest and debt expense | ( | ) | ( | ) | ( | ) | |||||
Amortization of deferred financing costs | |||||||||||
$ | $ | $ | |||||||||
(1) Includes $22,540 debt prepayment costs in connection with the redemption of $400,000 5.00 % senior unsecured noted which were scheduled to mature in January 2022.
129
VORNADO REALTY TRUST AND VORNADO REALTY L.P.
NOTES TO CONSOLIDATED FINANCIAL STATEMENTS (CONTINUED)
19. Income Per Share/Income Per Class A Unit
Vornado Realty Trust
The following table presents the calculations of (i) basic income per common share which includes the weighted average number of common shares outstanding without regard to dilutive potential common shares and (ii) diluted income per common share which includes the weighted average common shares and dilutive share equivalents. Unvested share-based payment awards that contain nonforfeitable rights to dividends, whether paid or unpaid, are accounted for as participating securities. Earnings are allocated to participating securities, which include restricted stock awards, based on the two-class method. Other potential dilutive share equivalents such as our employee stock options, OP Units, OPPs, AO LTIP Units and Performance Conditioned AO LTIP Units are included in the computation of diluted Earnings Per Share ("EPS") using the treasury stock method, while the dilutive effect of our Series A convertible preferred shares is reflected in diluted EPS by application of the if-converted method.
(Amounts in thousands, except per share amounts) | For the Year Ended December 31, | ||||||||||
2019 | 2018 | 2017 | |||||||||
Numerator: | |||||||||||
Income from continuing operations, net of income attributable to noncontrolling interests | $ | $ | $ | ||||||||
(Loss) income from discontinued operations, net of income attributable to noncontrolling interests | ( | ) | ( | ) | |||||||
Net income attributable to Vornado | |||||||||||
Preferred share dividends | ( | ) | ( | ) | ( | ) | |||||
Preferred share issuance costs | ( | ) | |||||||||
Net income attributable to common shareholders | |||||||||||
Earnings allocated to unvested participating securities | ( | ) | ( | ) | ( | ) | |||||
Numerator for basic income per share | |||||||||||
Impact of assumed conversions: | |||||||||||
Convertible preferred share dividends | |||||||||||
Earnings allocated to Out-Performance Plan units | |||||||||||
Numerator for diluted income per share | $ | $ | $ | ||||||||
Denominator: | |||||||||||
Denominator for basic income per share – weighted average shares | |||||||||||
Effect of dilutive securities (1): | |||||||||||
Employee stock options and restricted stock awards | |||||||||||
Convertible preferred shares | |||||||||||
Out-Performance Plan units | |||||||||||
Denominator for diluted income per share – weighted average shares and assumed conversions | |||||||||||
INCOME PER COMMON SHARE - BASIC: | |||||||||||
Income from continuing operations, net | $ | $ | $ | ||||||||
Loss from discontinued operations, net | ( | ) | |||||||||
Net income per common share | $ | $ | $ | ||||||||
INCOME PER COMMON SHARE - DILUTED: | |||||||||||
Income from continuing operations, net | $ | $ | $ | ||||||||
Loss from discontinued operations, net | ( | ) | |||||||||
Net income per common share | $ | $ | $ | ||||||||
________________________________________
(1) | The effect of dilutive securities in the years ended December 31, 2019, 2018 and 2017 excludes an aggregate of |
130
VORNADO REALTY TRUST AND VORNADO REALTY L.P.
NOTES TO CONSOLIDATED FINANCIAL STATEMENTS (CONTINUED)
19. | Income Per Share/Income Per Class A Unit – continued |
Vornado Realty L.P.
The following table presents the calculations of (i) basic income per Class A unit which includes the weighted average number of Class A units outstanding without regard to dilutive potential Class A units and (ii) diluted income per Class A unit which includes the weighted average Class A unit and dilutive Class A unit equivalents. Unvested share-based payment awards that contain non-forfeitable rights to dividends, whether paid or unpaid, are accounted for as participating securities. Earnings are allocated to participating securities, which include Vornado restricted stock awards, OP Units and OPPs, based on the two-class method. Other potential dilutive unit equivalents such as Vornado stock options, AO LTIP Units and Performance Conditioned AO LTIP Units are included in the computation of diluted income per unit ("EPU") using the treasury stock method, while the dilutive effect of our Series A convertible preferred units is reflected in diluted EPU by application of the if-converted method.
(Amounts in thousands, except per unit amounts) | For the Year Ended December 31, | ||||||||||
2019 | 2018 | 2017 | |||||||||
Numerator: | |||||||||||
Income from continuing operations, net of income attributable to noncontrolling interests in consolidated subsidiaries | $ | $ | $ | ||||||||
(Loss) income from discontinued operations | ( | ) | ( | ) | |||||||
Net income attributable to Vornado Realty L.P. | |||||||||||
Preferred unit distributions | ( | ) | ( | ) | ( | ) | |||||
Preferred unit issuance costs | ( | ) | |||||||||
Net income attributable to Class A unitholders | |||||||||||
Earnings allocated to unvested participating securities | ( | ) | ( | ) | ( | ) | |||||
Numerator for basic income per Class A unit | |||||||||||
Impact of assumed conversions: | |||||||||||
Convertible preferred unit distributions | |||||||||||
Numerator for diluted income per Class A unit | $ | $ | $ | ||||||||
Denominator: | |||||||||||
Denominator for basic income per Class A unit – weighted average units | |||||||||||
Effect of dilutive securities (1): | |||||||||||
Vornado stock options, Vornado restricted stock awards, OP Units and OPPs | |||||||||||
Convertible preferred units | |||||||||||
Denominator for diluted income per Class A unit – weighted average units and assumed conversions | |||||||||||
INCOME PER CLASS A UNIT - BASIC: | |||||||||||
Income from continuing operations, net | $ | $ | $ | ||||||||
Income (loss) from discontinued operations, net | ( | ) | |||||||||
Net income per Class A unit | $ | $ | $ | ||||||||
INCOME PER CLASS A UNIT - DILUTED: | |||||||||||
Income from continuing operations, net | $ | $ | $ | ||||||||
Loss from discontinued operations, net | ( | ) | |||||||||
Net income per Class A unit | $ | $ | $ | ||||||||
________________________________________
(1) | The effect of dilutive securities in the years ended December 31, 2019, 2018 and 2017 excludes an aggregate of |
131
VORNADO REALTY TRUST AND VORNADO REALTY L.P.
NOTES TO CONSOLIDATED FINANCIAL STATEMENTS (CONTINUED)
20. | Leases |
As lessor
We lease space to tenants under operating leases. Most of the leases provide for the payment of fixed base rent payable monthly in advance. Office building leases generally require tenants to reimburse us for operating costs and real estate taxes above their base year costs. Certain leases provide for pass-through to tenants for their share of real estate taxes, insurance and common area maintenance. Certain leases also require additional variable rent payments based on a percentage of the tenants’ sales. None of our tenants accounted for more than 10% of total revenues in any of the years ended December 31, 2019, 2018 and 2017. We have elected to account for lease revenues (including base and variable rent) and the reimbursement of common area maintenance expenses as a single lease component recorded as "rental revenues" on our consolidated statements of income.
Under ASC 842, we assess on an individual lease basis whether it is probable that we will collect the future lease payments. We consider the tenant's payment history and current credit status when assessing collectability. When collectability is not deemed probable we write-off the tenant's receivables, including straight-line rent receivables, and limit lease income to cash received. Changes to the collectability of our operating leases are recorded as adjustments to "rental revenues" on our consolidated statements of income, which resulted in a decrease in income of $17,237,000 for the year ended December 31, 2019. As a result, there is no allowance for doubtful accounts as of December 31, 2019. Prior to the adoption of ASC 842, we maintained an allowance for doubtful accounts for estimated losses on receivables under our lease agreements, including receivables arising from the straight-lining of rent. As of December 31, 2018 and 2017 our allowance for doubtful accounts were as follows:
(Amounts in thousands) | ||||||||||||||||
Description | Balance at Beginning of Year | Additions Charged Against Operations | Uncollectible Accounts Written-off | Balance at End of Year | ||||||||||||
Year Ended December 31, 2018 | ||||||||||||||||
Allowance for doubtful accounts | $ | $ | $ | ( | ) | $ | ||||||||||
Year Ended December 31, 2017 | ||||||||||||||||
Allowance for doubtful accounts | $ | $ | $ | ( | ) | $ | ||||||||||
As of December 31, 2019, under ASC 842, future undiscounted cash flows under non-cancelable operating leases were as follows:
(Amounts in thousands) | As of December 31, 2019 | ||
For the year ended December 31, | |||
2020 | $ | ||
2021 | |||
2022 | |||
2023 | |||
2024 | |||
Thereafter | |||
As of December 31, 2018, under ASC 840, future undiscounted cash flows under non-cancelable operating leases were as follows:
(Amounts in thousands) | As of December 31, 2018 | ||
For the year ended December 31: | |||
2019 | $ | ||
2020 | |||
2021 | |||
2022 | |||
2023 | |||
Thereafter | |||
The components of lease revenues for the year ended December 31, 2019 were as follows:
(Amounts in thousands) | For the Year Ended December 31, 2019 | ||
Fixed lease revenues | $ | ||
Variable lease revenues | |||
Lease revenues | $ | ||
132
VORNADO REALTY TRUST AND VORNADO REALTY L.P.
NOTES TO CONSOLIDATED FINANCIAL STATEMENTS (CONTINUED)
20. Leases - continued
As lessee
We have a number of ground leases which are classified as operating leases. On January 1, 2019, we recorded $526,866,000 of ROU assets and lease liabilities. Our ROU assets were reduced by $37,269,000 of accrued rent expense reclassified from “other liabilities” and $4,267,000 of acquired above-market lease liabilities, net, reclassified from “deferred revenue” and increased by $23,665,000 of acquired below-market lease assets, net, reclassified from “identified intangible assets, net of accumulated amortization” and $1,584,000 of prepaid lease payments reclassified from "other assets." During the second quarter of 2019, we recorded a $75,220,000 impairment loss on our 608 Fifth Avenue ROU Asset (See Note 16 – Transaction Related Costs, Impairment Losses and Other). As of December 31, 2019, our ROU assets and lease liabilities were $379,546,000 and $498,254,000 , respectively.
The discount rate applied to measure each ROU asset and lease liability is based on our incremental borrowing rate ("IBR"). We consider the general economic environment and our credit rating and factor in various financing and asset specific adjustments to ensure the IBR is appropriate to the intended use of the underlying lease. As we did not elect to apply hindsight, lease term assumptions determined under ASC 840 were carried forward and applied in calculating the lease liabilities recorded under ASC 842. Certain of our ground leases offer renewal options which we assess against relevant economic factors to determine whether we are reasonably certain of exercising or not exercising the option. Lease payments associated with renewal periods that we are reasonably certain will be exercised are included in the measurement of the corresponding lease liability and ROU asset.
The following table sets forth information related to the measurement of our lease liabilities as of December 31, 2019:
(Amounts in thousands) | As of December 31, 2019 | ||
Weighted average remaining lease term (in years) | |||
Weighted average discount rate | % | ||
Cash paid for operating leases | $ | ||
We recognize rent expense as a component of "operating" expenses on our consolidated statements of income. Rent expense is comprised of fixed and variable lease payments. Variable lease payments include percentage rent and rent resets based on an index or rate. The following table sets forth the details of rent expense for the year ended December 31, 2019:
(Amounts in thousands) | For the Year Ended December 31, 2019 | ||
Fixed rent expense | $ | ||
Variable rent expense | |||
Rent expense | $ | ||
As of December 31, 2019, future lease payments under operating ground leases were as follows:
(Amounts in thousands) | As of December 31, 2019 | ||
For the year ended December 31, | |||
2020 | $ | ||
2021 | |||
2022 | |||
2023 | |||
2024 | |||
Thereafter | |||
Total undiscounted cash flows | |||
Present value discount | ( | ) | |
Lease liabilities | $ | ||
133
VORNADO REALTY TRUST AND VORNADO REALTY L.P.
NOTES TO CONSOLIDATED FINANCIAL STATEMENTS (CONTINUED)
20. Leases - continued
As lessee - continued
As of December 31, 2018, under ASC 840, future lease payments under operating ground leases were as follows:
(Amounts in thousands) | As of December 31, 2018 | ||
For the year ended December 31, | |||
2019 | $ | ||
2020 | |||
2021 | |||
2022 | |||
2023 | |||
Thereafter | |||
Certain of our ground leases are subject to fair market rent resets based on a percentage of the appraised value of the underlying assets at specified future dates. Fair market rent resets do not give rise to remeasurement of the related right-of-use assets and lease liabilities. Fair market rent resets, which may be material, will be recognized in the periods in which they are incurred.
Farley Office and Retail Building
The future lease payments detailed previously exclude the ground and building lease at the Farley Office and Retail Building (the "Project"). We have a 95.0 % ownership interest in a joint venture with Related which was designated by ESD, an entity of New York State, to develop the Project. The Project will include a new Moynihan Train Hall and approximately 844,000 rentable square feet of commercial space, comprised of approximately 730,000 square feet of office space and approximately 114,000 square feet of retail space. The joint venture has a 99 -year triple-net lease with ESD for the commercial space at the Project. For GAAP purposes the lease has not yet commenced since construction of the Project is ongoing. The lease calls for annual rent payments of $5,000,000 plus fixed payments in lieu of real estate taxes ("PILOT") through June 2030. Following the fixed PILOT payment period, the PILOT is calculated in a manner consistent with buildings subject to New York City real estate taxes and assessments. As of December 31, 2019, future rent and fixed PILOT payments are $556,852,000 .
The joint venture has entered into a development agreement with ESD to build the adjacent Moynihan Train Hall, with Vornado and Related each guaranteeing the joint venture's obligations. The joint venture has entered into a design-build contract with Skanska Moynihan Train Hall Builders pursuant to which they will build the Moynihan Train Hall, thereby fulfilling all of the joint venture's obligations to ESD. The obligations of Skanska Moynihan Train Hall Builders have been bonded by Skanska USA and bear a full guaranty from Skanska AB. As a result of our involvement in the construction of the asset, we have been deemed the accounting owner of the property in accordance with ASC 842-40-55.
21. Multiemployer Benefit Plans
Our subsidiaries make contributions to certain multiemployer defined benefit plans (“Multiemployer Pension Plans”) and health plans (“Multiemployer Health Plans”) for our union represented employees, pursuant to the respective collective bargaining agreements.
Multiemployer Pension Plans
Multiemployer Pension Plans differ from single-employer pension plans in that (i) contributions to multiemployer plans may be used to provide benefits to employees of other participating employers and (ii) if other participating employers fail to make their contributions, each of our participating subsidiaries may be required to bear its then pro rata share of unfunded obligations. If a participating subsidiary withdraws from a plan in which it participates, it may be subject to a withdrawal liability. As of December 31, 2019, our subsidiaries’ participation in these plans was not significant to our consolidated financial statements.
In the years ended December 31, 2019, 2018 and 2017, we contributed $10,793,000 , $10,377,000 and $10,113,000 , respectively, towards Multiemployer Pension Plans, which is included as a component of “operating” expenses on our consolidated statements of income. Our subsidiaries’ contributions did not represent more than 5% of total employer contributions in any of these plans for the years ended December 31, 2019, 2018 and 2017.
Multiemployer Health Plans
Multiemployer Health Plans in which our subsidiaries participate provide health benefits to eligible active and retired employees. In the years ended December 31, 2019, 2018 and 2017, our subsidiaries contributed $32,407,000 , $30,354,000 and $29,549,000 , respectively, towards these plans, which is included as a component of “operating” expenses on our consolidated statements of income.
134
VORNADO REALTY TRUST AND VORNADO REALTY L.P.
NOTES TO CONSOLIDATED FINANCIAL STATEMENTS (CONTINUED)
22. | Commitments and Contingencies |
Insurance
For our properties except the Farley Office and Retail Building, we maintain general liability insurance with limits of $300,000,000 per occurrence and per property, and all risk property and rental value insurance with limits of $2.0 billion per occurrence, with sub-limits for certain perils such as flood and earthquake. Our California properties have earthquake insurance with coverage of $350,000,000 per occurrence and in the aggregate, subject to a deductible in the amount of 5 % of the value of the affected property. We maintain coverage for certified terrorism acts with limits of $6.0 billion per occurrence and in the aggregate (as listed below), $1.2 billion for non-certified acts of terrorism, and $5.0 billion per occurrence and in the aggregate for terrorism involving nuclear, biological, chemical and radiological (“NBCR”) terrorism events, as defined by the Terrorism Risk Insurance Act of 2002, as amended to date and which has been extended through December 2027.
Penn Plaza Insurance Company, LLC (“PPIC”), our wholly owned consolidated subsidiary, acts as a re-insurer with respect to a portion of all risk property and rental value insurance and a portion of our earthquake insurance coverage, and as a direct insurer for coverage for acts of terrorism including NBCR acts. Coverage for acts of terrorism (excluding NBCR acts) is fully reinsured by third party insurance companies and the Federal government with no exposure to PPIC. For NBCR acts, PPIC is responsible for a deductible of $1,430,413 and 20 % of the balance of a covered loss and the Federal government is responsible for the remaining portion of a covered loss. We are ultimately responsible for any loss incurred by PPIC.
For the Farley Office and Retail Building, we maintain general liability insurance with limits of $100,000,000 per occurrence, and builder’s risk insurance including coverage for existing property and development activities of $2.8 billion per occurrence and in the aggregate. We maintain coverage for certified and non-certified terrorism acts with limits of $1.0 billion per occurrence and in the aggregate.
We continue to monitor the state of the insurance market and the scope and costs of coverage for acts of terrorism and other events. However, we cannot anticipate what coverage will be available on commercially reasonable terms in the future. We are responsible for uninsured losses and for deductibles and losses in excess of our insurance coverage, which could be material.
Our debt instruments, consisting of mortgage loans secured by our properties, senior unsecured notes and revolving credit agreements contain customary covenants requiring us to maintain insurance. Although we believe that we have adequate insurance coverage for purposes of these agreements, we may not be able to obtain an equivalent amount of coverage at reasonable costs in the future. Further, if lenders insist on greater coverage than we are able to obtain it could adversely affect our ability to finance or refinance our properties and expand our portfolio.
Other Commitments and Contingencies
We are from time to time involved in legal actions arising in the ordinary course of business. In our opinion, after consultation with legal counsel, the outcome of such matters is not currently expected to have a material adverse effect on our financial position, results of operations or cash flows.
Each of our properties has been subjected to varying degrees of environmental assessment at various times. The environmental assessments did not reveal any material environmental contamination. However, there can be no assurance that the identification of new areas of contamination, changes in the extent or known scope of contamination, the discovery of additional sites, or changes in cleanup requirements would not result in significant costs to us.
In July 2018, we leased 78,000 square feet at 345 Montgomery Street in San Francisco, CA, to a subsidiary of Regus PLC, for an initial term of 15 years. The obligations under the lease were guaranteed by Regus PLC in an amount of up to $90,000,000 . The tenant purported to terminate the lease prior to space delivery. We commenced a suit on October 23, 2019 seeking to enforce the lease and the guarantee.
Our mortgage loans are non-recourse to us, except for the mortgage loans secured by 640 Fifth Avenue, 7 West 34th Street and 435 Seventh Avenue, which we guaranteed and therefore are part of our tax basis. In certain cases we have provided guarantees or master leased tenant space. These guarantees and master leases terminate either upon the satisfaction of specified circumstances or repayment of the underlying loans. In addition, we have guaranteed the rent and payments in lieu of real estate taxes due to ESD, an entity of New York State, for the Farley Office and Retail Building. As of December 31, 2019, the aggregate dollar amount of these guarantees and master leases is approximately $1,524,000,000 .
As of December 31, 2019, $15,880,000 of letters of credit were outstanding under one of our unsecured revolving credit facilities. Our unsecured revolving credit facilities contain financial covenants that require us to maintain minimum interest coverage and maximum debt to market capitalization ratios, and provide for higher interest rates in the event of a decline in our ratings below Baa3/BBB. Our unsecured revolving credit facilities also contain customary conditions precedent to borrowing, including representations and warranties, and also contain customary events of default that could give rise to accelerated repayment, including such items as failure to pay interest or principal.
135
VORNADO REALTY TRUST AND VORNADO REALTY L.P.
NOTES TO CONSOLIDATED FINANCIAL STATEMENTS (CONTINUED)
22. | Commitments and Contingencies – continued |
Other Commitments and Contingencies - continued
The joint venture in which we own a 95.0 % ownership interest was designated by ESD to develop the Farley Office and Retail Building. The joint venture entered into a development agreement with ESD and a design-build contract with Skanska Moynihan Train Hall Builders. Under the development agreement with ESD, the joint venture is obligated to build the Moynihan Train Hall, with Vornado and Related each guaranteeing the joint venture’s obligations. Under the design-build agreement, Skanska Moynihan Train Hall Builders is obligated to fulfill all of the joint venture’s obligations. The obligations of Skanska Moynihan Train Hall Builders have been bonded by Skanska USA and bear a full guaranty from Skanska AB.
As of December 31, 2019, we expect to fund additional capital to certain of our partially owned entities aggregating approximately $12,700,000 .
As of December 31, 2019, we have construction commitments aggregating approximately $627,000,000 .
23. | Related Party Transactions |
Alexander’s, Inc.
We own 32.4 % of Alexander’s. Steven Roth, the Chairman of Vornado’s Board of Trustee’s and its Chief Executive Officer, is also the Chairman of the Board of Directors and Chief Executive Officer of Alexander’s. We provide various services to Alexander’s in accordance with management, development and leasing agreements. These agreements are described in Note 6 - Investments in Partially Owned Entities.
Interstate Properties (“Interstate”)
Interstate is a general partnership in which Mr. Roth is the managing general partner. David Mandelbaum and Russell B. Wight, Jr., Trustees of Vornado and Directors of Alexander’s, respectively, are Interstate’s two other general partners. As of December 31, 2019, Interstate and its partners beneficially owned an aggregate of approximately 7.1 % of the common shares of beneficial interest of Vornado and 26.1 % of Alexander’s common stock.
We manage and lease the real estate assets of Interstate pursuant to a management agreement for which we receive an annual fee equal to 4 % of annual base rent and percentage rent. The management agreement has a term of one year and is automatically renewable unless terminated by either of the parties on 60 days’ notice at the end of the term. We believe, based upon comparable fees charged by other real estate companies, that the management agreement terms are fair to us. We earned $300,000 , $453,000 , and $501,000 of management fees under the agreement for the years ended December 31, 2019, 2018 and 2017, respectively.
Urban Edge Properties
On March 4, 2019, we converted to common shares and sold all of our 5,717,184 partnership units of UE. In prior years, we provided UE with information technology support. UE is providing us with leasing and property management services for (i) certain small retail properties and (ii) our affiliate, Alexander's, Rego retail assets. Fees paid to UE for servicing the retail assets of Alexander’s are similar to the fees that we are receiving from Alexander’s.
220 Central Park South
We are constructing a residential condominium tower at 220 CPS. Of the condominium units closed during the year ended December 31, 2019, one was sold to a limited liability company owned by the spouse of a related party, David Mandelbaum, a Trustee and a Director of Alexander’s, and another was sold to Mr. Mandelbaum’s brother. The net proceeds were $23,357,000 and $16,099,000 , respectively.
Fifth Avenue and Times Square JV
We provide various services to Fifth Avenue and Times Square JV in accordance with management, development, leasing and other agreements. These agreements are described in Note 6 - Investments in Partially Owned Entities. Haim Chera, Executive Vice President - Head of Retail, has an investment in Crown, a company controlled by Mr. Chera's family. Crown has a nominal minority interest in Fifth Avenue and Times Square JV. Additionally, we have other investments with Crown.
136
VORNADO REALTY TRUST AND VORNADO REALTY L.P.
NOTES TO CONSOLIDATED FINANCIAL STATEMENTS (CONTINUED)
24. | Summary of Quarterly Results (Unaudited) |
Vornado Realty Trust
The following summary represents the results of operations for each quarter in 2019 and 2018:
(Amounts in thousands, except per share amounts) | For the Three Months Ended | ||||||||||||||
March 31, 2019 | June 30, 2019 | September 30, 2019 | December 31, 2019 | ||||||||||||
Revenues | $ | $ | $ | $ | |||||||||||
Net income attributable to common shareholders(1) | |||||||||||||||
Per share - basic(2) | |||||||||||||||
Per share - diluted(2) | |||||||||||||||
(Amounts in thousands, except per share amounts) | For the Three Months Ended | ||||||||||||||
March 31, 2018 | June 30, 2018 | September 30, 2018 | December 31, 2018 | ||||||||||||
Revenues | $ | $ | $ | $ | |||||||||||
Net (loss) income attributable to common shareholders(1) | ( | ) | |||||||||||||
Per share - basic(2) | ( | ) | |||||||||||||
Per share - diluted(2) | ( | ) | |||||||||||||
____________________
(1) | Fluctuations among quarters resulted primarily from non-cash impairment losses, net gain on transfer to Fifth Avenue and Times Square JV, net gains on sale of real estate and other items and from seasonality of business operations. |
(2) | The total for the year may differ from the sum of the quarters as a result of weighting. |
Vornado Realty L.P.
The following summary represents the results of operations for each quarter in 2019 and 2018:
(Amounts in thousands, except per share amounts) | For the Three Months Ended | ||||||||||||||
March 31, 2019 | June 30, 2019 | September 30, 2019 | December 31, 2019 | ||||||||||||
Revenues | $ | $ | $ | $ | |||||||||||
Net income attributable to Class A unitholders(1) | |||||||||||||||
Per unit - basic(2) | |||||||||||||||
Per unit - diluted(2) | |||||||||||||||
(Amounts in thousands, except per share amounts) | For the Three Months Ended | ||||||||||||||
March 31, 2018 | June 30, 2018 | September 30, 2018 | December 31, 2018 | ||||||||||||
Revenues | $ | $ | $ | $ | |||||||||||
Net (loss) income attributable to Class A unitholders(1) | ( | ) | |||||||||||||
Per unit - basic(2) | ( | ) | |||||||||||||
Per unit - diluted(2) | ( | ) | |||||||||||||
____________________
(1) | Fluctuations among quarters resulted primarily from non-cash impairment losses, net gain on transfer to Fifth Avenue and Times Square JV, net gains on sale of real estate and other items and from seasonality of business operations. |
(2) | The total for the year may differ from the sum of the quarters as a result of weighting. |
137
VORNADO REALTY TRUST AND VORNADO REALTY L.P.
NOTES TO CONSOLIDATED FINANCIAL STATEMENTS (CONTINUED)
25. Segment Information
We operate in two reportable segments, New York and Other, which is based on how we manage our business.
Net operating income ("NOI") at share represents total revenues less operating expenses including our share of partially owned entities. NOI at share - cash basis represents NOI at share adjusted to exclude straight-line rental income and expense, amortization of acquired below and above market leases, net and other non-cash adjustments. We consider NOI at share - cash basis to be the primary non-GAAP financial measure for making decisions and assessing the unlevered performance of our segments as it relates to the total return on assets as opposed to the levered return on equity. As properties are bought and sold based on NOI at share - cash basis, we utilize this measure to make investment decisions as well as to compare the performance of our assets to that of our peers. NOI at share and NOI at share - cash basis should not be considered alternatives to net income or cash flow from operations and may not be comparable to similarly titled measures employed by other companies.
Below is a reconciliation of net income to NOI at share and NOI at share - cash basis for the years ended December 31, 2019, 2018 and 2017.
(Amounts in thousands) | For the Year Ended December 31, | ||||||||||
2019 | 2018 | 2017 | |||||||||
Net income | $ | $ | $ | ||||||||
Depreciation and amortization expense | |||||||||||
General and administrative expense | |||||||||||
Transaction related costs, impairment losses and other | |||||||||||
Income from partially owned entities | ( | ) | ( | ) | ( | ) | |||||
Loss (income) from real estate fund investments | ( | ) | |||||||||
Interest and other investment income, net | ( | ) | ( | ) | ( | ) | |||||
Interest and debt expense | |||||||||||
Net gain on transfer to Fifth Avenue and Times Square JV | ( | ) | |||||||||
Purchase price fair value adjustment | ( | ) | |||||||||
Net gains on disposition of wholly owned and partially owned assets | ( | ) | ( | ) | ( | ) | |||||
Income tax expense | |||||||||||
Loss (income) from discontinued operations | ( | ) | |||||||||
NOI from partially owned entities | |||||||||||
NOI attributable to noncontrolling interests in consolidated subsidiaries | ( | ) | ( | ) | ( | ) | |||||
NOI at share | |||||||||||
Non cash adjustments for straight-line rents, amortization of acquired below-market leases, net and other | ( | ) | ( | ) | ( | ) | |||||
NOI at share - cash basis | $ | $ | $ | ||||||||
138
VORNADO REALTY TRUST AND VORNADO REALTY L.P.
NOTES TO CONSOLIDATED FINANCIAL STATEMENTS (CONTINUED)
25. Segment Information - continued
Below is a summary of NOI at share, NOI at share - cash basis and selected balance sheet data by segment for the years ended December 31, 2019, 2018 and 2017.
(Amounts in thousands) | For the Year Ended December 31, 2019 | ||||||||||
Total | New York | Other | |||||||||
Total revenues | $ | $ | $ | ||||||||
Operating expenses | ( | ) | ( | ) | ( | ) | |||||
NOI - consolidated | |||||||||||
Deduct: NOI attributable to noncontrolling interests in consolidated subsidiaries | ( | ) | ( | ) | ( | ) | |||||
Add: NOI from partially owned entities | |||||||||||
NOI at share | |||||||||||
Non-cash adjustments for straight-line rents, amortization of acquired below-market leases, net and other | ( | ) | ( | ) | |||||||
NOI at share - cash basis | $ | $ | $ | ||||||||
Balance Sheet Data: | |||||||||||
Real estate, at cost | $ | $ | $ | ||||||||
Investments in partially owned entities | |||||||||||
Total assets | |||||||||||
(Amounts in thousands) | For the Year Ended December 31, 2018 | ||||||||||
Total | New York | Other | |||||||||
Total revenues | $ | $ | $ | ||||||||
Operating expenses | ( | ) | ( | ) | ( | ) | |||||
NOI - consolidated | |||||||||||
Deduct: NOI attributable to noncontrolling interests in consolidated subsidiaries | ( | ) | ( | ) | ( | ) | |||||
Add: NOI from partially owned entities | |||||||||||
NOI at share | |||||||||||
Non-cash adjustments for straight-line rents, amortization of acquired below-market leases, net and other | ( | ) | ( | ) | |||||||
NOI at share - cash basis | $ | $ | $ | ||||||||
Balance Sheet Data: | |||||||||||
Real estate, at cost | $ | $ | $ | ||||||||
Investments in partially owned entities | |||||||||||
Total assets | |||||||||||
(Amounts in thousands) | For the Year Ended December 31, 2017 | ||||||||||
Total | New York | Other | |||||||||
Total revenues | $ | $ | $ | ||||||||
Operating expenses | ( | ) | ( | ) | ( | ) | |||||
NOI - consolidated | |||||||||||
Deduct: NOI attributable to noncontrolling interests in consolidated subsidiaries | ( | ) | ( | ) | ( | ) | |||||
Add: Our share of NOI from partially owned entities | |||||||||||
NOI at share | |||||||||||
Non-cash adjustments for straight-line rents, amortization of acquired below-market leases, net and other | ( | ) | ( | ) | ( | ) | |||||
NOI at share - cash basis | $ | $ | $ | ||||||||
139
ITEM 9. | CHANGES IN AND DISAGREEMENTS WITH ACCOUNTANTS ON ACCOUNTING AND FINANCIAL DISCLOSURE |
None.
ITEM 9A. | CONTROLS AND PROCEDURES |
Vornado Realty Trust
Disclosure Controls and Procedures: Our management, with the participation of Vornado’s Chief Executive Officer and Chief Financial Officer, has evaluated the effectiveness of our disclosure controls and procedures (as such term is defined in Rule 13a‑15 (e) under the Securities Exchange Act of 1934, as amended) as of the end of the period covered by this Annual Report on Form 10-K. Based on such evaluation, Vornado’s Chief Executive Officer and Chief Financial Officer have concluded that, as of the end of such period, our disclosure controls and procedures are effective.
Internal Control Over Financial Reporting: There have not been any changes in our internal control over financial reporting (as defined in Rule 13a-15(f) under the Securities Exchange Act of 1934, as amended) during the fourth quarter of the fiscal year to which this report relates that have materially affected, or are reasonably likely to materially affect, our internal control over financial reporting.
Management’s Report on Internal Control over Financial Reporting
Management of Vornado Realty Trust, together with its consolidated subsidiaries (the “Company”), is responsible for establishing and maintaining adequate internal control over financial reporting. Our internal control over financial reporting is a process designed under the supervision of Vornado’s principal executive and principal financial officers to provide reasonable assurance regarding the reliability of financial reporting and the preparation of our financial statements for external reporting purposes in accordance with accounting principles generally accepted in the United States of America.
As of December 31, 2019, management conducted an assessment of the effectiveness of our internal control over financial reporting based on the framework established in Internal Control – Integrated Framework (2013) issued by the Committee of Sponsoring Organizations of the Treadway Commission. Based on this assessment, management has determined that our internal control over financial reporting as of December 31, 2019 was effective.
Our internal control over financial reporting includes policies and procedures that pertain to the maintenance of records that, in reasonable detail, accurately and fairly reflect transactions and dispositions of assets; provide reasonable assurances that transactions are recorded as necessary to permit preparation of financial statements in accordance with accounting principles generally accepted in the United States, and that receipts and expenditures are being made only in accordance with authorizations of management and our trustees; and provide reasonable assurance regarding prevention or timely detection of unauthorized acquisition, use, or disposition of our assets that could have a material effect on our financial statements.
The effectiveness of our internal control over financial reporting as of December 31, 2019 has been audited by Deloitte & Touche LLP, an independent registered public accounting firm, as stated in their report appearing on the following page, which expresses an unqualified opinion on the effectiveness of our internal control over financial reporting as of December 31, 2019.
140
REPORT OF INDEPENDENT REGISTERED PUBLIC ACCOUNTING FIRM
Shareholders and Board of Trustees
Vornado Realty Trust
New York, New York
Opinion on Internal Control over Financial Reporting
We have audited the internal control over financial reporting of Vornado Realty Trust and subsidiaries (the “Company”) as of December 31, 2019, based on criteria established in Internal Control - Integrated Framework (2013) issued by the Committee of Sponsoring Organizations of the Treadway Commission (COSO). In our opinion, the Company maintained, in all material respects, effective internal control over financial reporting as of December 31, 2019, based on criteria established in Internal Control - Integrated Framework (2013) issued by COSO.
We have also audited, in accordance with the standards of the Public Company Accounting Oversight Board (United States) (PCAOB), the consolidated financial statements as of and for the year ended December 31, 2019, of the Company and our report dated February 18, 2020, expressed an unqualified opinion on those financial statements.
Basis for Opinion
The Company’s management is responsible for maintaining effective internal control over financial reporting and for its assessment of the effectiveness of internal control over financial reporting, included in the accompanying Management’s Report on Internal Control over Financial Reporting. Our responsibility is to express an opinion on the Company’s internal control over financial reporting based on our audit. We are a public accounting firm registered with the PCAOB and are required to be independent with respect to the Company in accordance with the U.S. federal securities laws and the applicable rules and regulations of the Securities and Exchange Commission and the PCAOB.
We conducted our audit in accordance with the standards of the PCAOB. Those standards require that we plan and perform the audit to obtain reasonable assurance about whether effective internal control over financial reporting was maintained in all material respects. Our audit included obtaining an understanding of internal control over financial reporting, assessing the risk that a material weakness exists, testing and evaluating the design and operating effectiveness of internal control based on the assessed risk, and performing such other procedures as we considered necessary in the circumstances. We believe that our audit provides a reasonable basis for our opinion.
Definition and Limitations of Internal Control over Financial Reporting
A company’s internal control over financial reporting is a process designed to provide reasonable assurance regarding the reliability of financial reporting and the preparation of financial statements for external purposes in accordance with generally accepted accounting principles. A company’s internal control over financial reporting includes those policies and procedures that (1) pertain to the maintenance of records that, in reasonable detail, accurately and fairly reflect the transactions and dispositions of the assets of the company; (2) provide reasonable assurance that transactions are recorded as necessary to permit preparation of financial statements in accordance with generally accepted accounting principles, and that receipts and expenditures of the company are being made only in accordance with authorizations of management and directors of the company; and (3) provide reasonable assurance regarding prevention or timely detection of unauthorized acquisition, use, or disposition of the company’s assets that could have a material effect on the financial statements.
Because of its inherent limitations, internal control over financial reporting may not prevent or detect misstatements. Also, projections of any evaluation of effectiveness to future periods are subject to the risk that controls may become inadequate because of changes in conditions, or that the degree of compliance with the policies or procedures may deteriorate.
/s/ DELOITTE & TOUCHE LLP
New York, New York
February 18, 2020
141
ITEM 9A. - CONTINUED
Vornado Realty L.P.
Disclosure Controls and Procedures: Vornado Realty L.P.’s management, with the participation of Vornado’s Chief Executive Officer and Chief Financial Officer, has evaluated the effectiveness of our disclosure controls and procedures (as such term is defined in Rule 13a‑15 (e) under the Securities Exchange Act of 1934, as amended) as of the end of the period covered by this Annual Report on Form 10-K. Based on such evaluation, Vornado’s Chief Executive Officer and Chief Financial Officer have concluded that, as of the end of such period, our disclosure controls and procedures are effective.
Internal Control Over Financial Reporting: There have not been any changes in our internal control over financial reporting (as defined in Rule 13a-15(f) under the Securities Exchange Act of 1934, as amended) during the fourth quarter of the fiscal year to which this report relates that have materially affected, or are reasonably likely to materially affect, our internal control over financial reporting.
Management’s Report on Internal Control over Financial Reporting
Management of Vornado Realty Trust, sole general partner of Vornado Realty L.P., together with Vornado Realty L.P.’s consolidated subsidiaries (the “Company”), is responsible for establishing and maintaining adequate internal control over financial reporting. Our internal control over financial reporting is a process designed under the supervision of Vornado’s principal executive and principal financial officers to provide reasonable assurance regarding the reliability of financial reporting and the preparation of our financial statements for external reporting purposes in accordance with accounting principles generally accepted in the United States of America.
As of December 31, 2019, management conducted an assessment of the effectiveness of our internal control over financial reporting based on the framework established in Internal Control – Integrated Framework (2013) issued by the Committee of Sponsoring Organizations of the Treadway Commission. Based on this assessment, management has determined that our internal control over financial reporting as of December 31, 2019 was effective.
Our internal control over financial reporting includes policies and procedures that pertain to the maintenance of records that, in reasonable detail, accurately and fairly reflect transactions and dispositions of assets; provide reasonable assurances that transactions are recorded as necessary to permit preparation of financial statements in accordance with accounting principles generally accepted in the United States, and that receipts and expenditures are being made only in accordance with authorizations of management and Vornado’s trustees; and provide reasonable assurance regarding prevention or timely detection of unauthorized acquisition, use, or disposition of our assets that could have a material effect on our financial statements.
The effectiveness of our internal control over financial reporting as of December 31, 2019 has been audited by Deloitte & Touche LLP, an independent registered public accounting firm, as stated in their report appearing on the following page, which expresses an unqualified opinion on the effectiveness of our internal control over financial reporting as of December 31, 2019.
142
REPORT OF INDEPENDENT REGISTERED PUBLIC ACCOUNTING FIRM
Partners
Vornado Realty L.P.
New York, New York
Opinion on Internal Control over Financial Reporting
We have audited the internal control over financial reporting of Vornado Realty L.P. and subsidiaries (the “Partnership”) as of December 31, 2019, based on criteria established in Internal Control - Integrated Framework (2013) issued by the Committee of Sponsoring Organizations of the Treadway Commission (COSO). In our opinion, the Partnership maintained, in all material respects, effective internal control over financial reporting as of December 31, 2019, based on criteria established in Internal Control - Integrated Framework (2013) issued by COSO.
We have also audited, in accordance with the standards of the Public Company Accounting Oversight Board (United States) (PCAOB), the consolidated financial statements as of and for the year ended December 31, 2019, of the Partnership and our report dated February 18, 2020, expressed an unqualified opinion on those financial statements.
Basis for Opinion
The Partnership’s management is responsible for maintaining effective internal control over financial reporting and for its assessment of the effectiveness of internal control over financial reporting, included in the accompanying Management’s Report on Internal Control over Financial Reporting. Our responsibility is to express an opinion on the Partnership’s internal control over financial reporting based on our audit. We are a public accounting firm registered with the PCAOB and are required to be independent with respect to the Partnership in accordance with the U.S. federal securities laws and the applicable rules and regulations of the Securities and Exchange Commission and the PCAOB.
We conducted our audit in accordance with the standards of the PCAOB. Those standards require that we plan and perform the audit to obtain reasonable assurance about whether effective internal control over financial reporting was maintained in all material respects. Our audit included obtaining an understanding of internal control over financial reporting, assessing the risk that a material weakness exists, testing and evaluating the design and operating effectiveness of internal control based on the assessed risk, and performing such other procedures as we considered necessary in the circumstances. We believe that our audit provides a reasonable basis for our opinion.
Definition and Limitations of Internal Control over Financial Reporting
A company’s internal control over financial reporting is a process designed to provide reasonable assurance regarding the reliability of financial reporting and the preparation of financial statements for external purposes in accordance with generally accepted accounting principles. A company’s internal control over financial reporting includes those policies and procedures that (1) pertain to the maintenance of records that, in reasonable detail, accurately and fairly reflect the transactions and dispositions of the assets of the company; (2) provide reasonable assurance that transactions are recorded as necessary to permit preparation of financial statements in accordance with generally accepted accounting principles, and that receipts and expenditures of the company are being made only in accordance with authorizations of management and directors of the company; and (3) provide reasonable assurance regarding prevention or timely detection of unauthorized acquisition, use, or disposition of the company’s assets that could have a material effect on the financial statements.
Because of its inherent limitations, internal control over financial reporting may not prevent or detect misstatements. Also, projections of any evaluation of effectiveness to future periods are subject to the risk that controls may become inadequate because of changes in conditions, or that the degree of compliance with the policies or procedures may deteriorate.
/s/ DELOITTE & TOUCHE LLP
New York, New York
February 18, 2020
143
ITEM 9B. | OTHER INFORMATION |
None.
PART III
ITEM 10. | DIRECTORS, EXECUTIVE OFFICERS AND CORPORATE GOVERNANCE |
Information relating to trustees of Vornado, the Operating Partnership’s sole general partner, including its audit committee and audit committee financial expert, will be contained in Vornado’s definitive Proxy Statement involving the election of Vornado’s trustees which Vornado will file with the Securities and Exchange Commission pursuant to Regulation 14A under the Securities Exchange Act of 1934 not later than 120 days after December 31, 2019, and such information is incorporated herein by reference. Also incorporated herein by reference is the information under the caption “16(a) Beneficial Ownership Reporting Compliance” of the Proxy Statement.
Executive Officers of the Registrant
The following is a list of the names, ages, principal occupations and positions with Vornado of the executive officers of Vornado and the positions held by such officers during the past five years. All executive officers of Vornado have terms of office that run until the next succeeding meeting of the Board of Trustees of Vornado following the Annual Meeting of Vornado’s Shareholders unless they are removed sooner by Vornado’s Board.
Name | Age | PRINCIPAL OCCUPATION, POSITION AND OFFICE (Current and during past five years with Vornado unless otherwise stated) | ||
Steven Roth | 78 | Chairman of the Board; Chief Executive Officer since April 2013 and from May 1989 to May 2009; Managing General Partner of Interstate Properties, an owner of shopping centers and an investor in securities and partnerships; Chief Executive Officer of Alexander’s, Inc. since March 1995, a Director since 1989, and Chairman of the Board since May 2004. | ||
David R. Greenbaum | 68 | Vice Chairman since April 2019; President of the New York Division from April 1997 to April 2019. | ||
Michael J. Franco | 51 | President since April 2019; Executive Vice President - Chief Investment Officer from April 2015 to April 2019; Executive Vice President - Head of Acquisitions and Capital Markets from November 2010 to April 2015. | ||
Joseph Macnow | 74 | Executive Vice President - Chief Financial Officer and Chief Administrative Officer since February 2017; Executive Vice President - Finance and Chief Administrative Officer from June 2013 to February 2017; Executive Vice President - Finance and Administration from January 1998 to June 2013, and Chief Financial Officer from March 2001 to June 2013; Treasurer since May 2017, and Executive Vice President and Chief Financial Officer from August 1995 to April 2017 of Alexander's Inc. | ||
Haim Chera | 50 | Executive Vice President - Head of Retail since April 2019; Principal at Crown Acquisitions from January 2000 - April 2019. | ||
Barry S. Langer | 41 | Executive Vice President - Development - Co-Head of Real Estate since April 2019; Executive Vice President - Head of Development from May 2015 to April 2019. | ||
Glen J. Weiss | 50 | Executive Vice President - Office Leasing - Co-Head of Real Estate since April 2019; Executive Vice President - Office Leasing from May 2013 to April 2019. | ||
Vornado, the Operating Partnership’s sole general partner, has adopted a Code of Business Conduct and Ethics that applies to, among others, the above executive officers, and its principal accounting officer, Matthew Iocco, Vornado's Executive Vice President - Chief Accounting Officer. Mr. Iocco, 49 years of age, has been the Executive Vice President - Chief Accounting Officer of Vornado since May 2015 and Chief Financial Officer of Alexander's, Inc. since April 2017. From May 2012 to May 2015, Mr. Iocco was the Senior Vice President - Chief Accounting Officer of Vornado. This Code is available on Vornado’s website at www.vno.com.
ITEM 11. | EXECUTIVE COMPENSATION |
Information relating to Vornado’s executive officer and trustee compensation will be contained in Vornado’s Proxy Statement referred to above in Item 10, “Directors, Executive Officers and Corporate Governance,” and such information is incorporated herein by reference.
144
ITEM 12. | SECURITY OWNERSHIP OF CERTAIN BENEFICIAL OWNERS AND MANAGEMENT AND RELATED STOCKHOLDER MATTERS |
Information relating to security ownership of certain beneficial owners and management and related stockholder matters will be contained in Vornado’s Proxy Statement referred to in Item 10, “Directors, Executive Officers and Corporate Governance,” and such information is incorporated herein by reference.
Equity compensation plan information
The following table provides information as of December 31, 2019 regarding Vornado’s equity compensation plans.
Plan Category | Number of securities to be issued upon exercise of outstanding options, warrants and rights | Weighted-average exercise price of outstanding options, warrants and rights | Number of securities remaining available for future issuance under equity compensation plans (excluding securities reflected in the second column) | ||||||||
Equity compensation plans approved by security holders | 4,663,964 | (1) | $ | 57.39 | 5,207,363 | (2) | |||||
Equity compensation awards not approved by security holders | — | — | — | ||||||||
Total | 4,663,964 | $ | 57.39 | 5,207,363 | |||||||
________________________________________
(1) | Includes an aggregate of 2,895,087 shares/units, comprised of (i) 18,927 restricted Vornado common shares, (ii) 1,148,313 restricted Operating Partnership units, (iii) 337,698 Appreciation-Only Long-Term Incentive Plan units (iv) 496,762 Performance Conditioned AO LTIP Units and (v) 893,387 Out-Performance Plan units, which do not have an exercise price. |
(2) | Based on awards being granted as "Full Value Awards," as defined. If we were to grant "Not Full Value Awards," as defined, the number of securities available for future grants would be 10,414,725. |
ITEM 13. | CERTAIN RELATIONSHIPS AND RELATED TRANSACTIONS, AND DIRECTOR INDEPENDENCE |
Information relating to certain relationships and related transactions, and director independence will be contained in Vornado’s Proxy Statement referred to in Item 10, “Directors, Executive Officers and Corporate Governance,” and such information is incorporated herein by reference.
ITEM 14. | PRINCIPAL ACCOUNTING FEES AND SERVICES |
Information relating to principal accounting fees and services will be contained in Vornado’s Proxy Statement referred to in Item 10, “Directors, Executive Officers and Corporate Governance,” under the caption “Ratification of The Appointment of Independent Accounting Firm” and such information is incorporated herein by reference.
PART IV
ITEM 15. | EXHIBITS, FINANCIAL STATEMENT SCHEDULES |
(a) | The following documents are filed as part of this report: |
1. | The consolidated financial statements are set forth in Item 8 of this Annual Report on Form 10-K. |
The following financial statement schedules should be read in conjunction with the financial statements included in Item 8 of this Annual Report on Form 10-K.
Page in this Annual Report on Form 10-K | |
III--Real Estate and Accumulated Depreciation as of December 31, 2019, 2018 and 2017 | |
Schedules other than those listed above are omitted because they are not applicable or the information required is included in the consolidated financial statements or the notes thereto.
145
VORNADO REALTY TRUST AND VORNADO REALTY L.P.
SCHEDULE III
REAL ESTATE AND ACCUMULATED DEPRECIATION
(Amounts in thousands)
COLUMN A | COLUMN B | COLUMN C | COLUMN D | COLUMN E | COLUMN F | COLUMN G | COLUMN H | COLUMN I | ||||||||||||||||||||||||||
Encumbrances (1) | Initial cost to company | Costs capitalized subsequent to acquisition | Gross amount at which carried at close of period | Accumulated depreciation and amortization | Date of construction (3) | Date acquired | Life on which depreciation in latest income statement is computed | |||||||||||||||||||||||||||
Land | Buildings and improvements | Land | Buildings and improvements | Total (2) | ||||||||||||||||||||||||||||||
New York | ||||||||||||||||||||||||||||||||||
Manhattan | ||||||||||||||||||||||||||||||||||
1290 Avenue of the Americas | $ | $ | $ | $ | $ | $ | $ | $ | (4) | |||||||||||||||||||||||||
350 Park Avenue | (4) | |||||||||||||||||||||||||||||||||
PENN1 | (4) | |||||||||||||||||||||||||||||||||
100 West 33rd Street | (4) | |||||||||||||||||||||||||||||||||
150 West 34th Street | (4) | |||||||||||||||||||||||||||||||||
PENN2 | (5) | (4) | ||||||||||||||||||||||||||||||||
90 Park Avenue | (4) | |||||||||||||||||||||||||||||||||
Manhattan Mall | (4) | |||||||||||||||||||||||||||||||||
770 Broadway | (4) | |||||||||||||||||||||||||||||||||
888 Seventh Avenue | (4) | |||||||||||||||||||||||||||||||||
PENN11 | (4) | |||||||||||||||||||||||||||||||||
909 Third Avenue | (4) | |||||||||||||||||||||||||||||||||
150 East 58th Street | (4) | |||||||||||||||||||||||||||||||||
595 Madison Avenue | (4) | |||||||||||||||||||||||||||||||||
330 West 34th Street | (4) | |||||||||||||||||||||||||||||||||
828-850 Madison Avenue | (4) | |||||||||||||||||||||||||||||||||
715 Lexington Avenue | (4) | |||||||||||||||||||||||||||||||||
478-486 Broadway | (4) | |||||||||||||||||||||||||||||||||
4 Union Square South | (4) | |||||||||||||||||||||||||||||||||
Farley Office and Retail Building | (4) | |||||||||||||||||||||||||||||||||
Moynihan Train Hall | (4) | |||||||||||||||||||||||||||||||||
260 Eleventh Avenue | (4) | |||||||||||||||||||||||||||||||||
510 Fifth Avenue | (4) | |||||||||||||||||||||||||||||||||
606 Broadway | (4) | |||||||||||||||||||||||||||||||||
40 Fulton Street | (4) | |||||||||||||||||||||||||||||||||
443 Broadway | (4) | |||||||||||||||||||||||||||||||||
40 East 66th Street | (4) | |||||||||||||||||||||||||||||||||
155 Spring Street | (4) | |||||||||||||||||||||||||||||||||
435 Seventh Avenue | (4) | |||||||||||||||||||||||||||||||||
608 Fifth Avenue (6) | (4) | |||||||||||||||||||||||||||||||||
692 Broadway | (4) | |||||||||||||||||||||||||||||||||
131-135 West 33rd Street | (4) | |||||||||||||||||||||||||||||||||
146
VORNADO REALTY TRUST AND VORNADO REALTY L.P.
SCHEDULE III
REAL ESTATE AND ACCUMULATED DEPRECIATION - CONTINUED
(Amounts in thousands)
COLUMN A | COLUMN B | COLUMN C | COLUMN D | COLUMN E | COLUMN F | COLUMN G | COLUMN H | COLUMN I | ||||||||||||||||||||||||||
Encumbrances (1) | Initial cost to company | Costs capitalized subsequent to acquisition | Gross amount at which carried at close of period | Accumulated depreciation and amortization | Date of construction (3) | Date acquired | Life on which depreciation in latest income statement is computed | |||||||||||||||||||||||||||
Land | Buildings and improvements | Land | Buildings and improvements | Total (2) | ||||||||||||||||||||||||||||||
New York - continued | ||||||||||||||||||||||||||||||||||
Manhattan - continued | ||||||||||||||||||||||||||||||||||
265 West 34th Street | $ | $ | $ | $ | $ | $ | $ | $ | (4) | |||||||||||||||||||||||||
304 Canal Street | ( | ) | (4) | |||||||||||||||||||||||||||||||
677-679 Madison Avenue | (4) | |||||||||||||||||||||||||||||||||
1131 Third Avenue | (4) | |||||||||||||||||||||||||||||||||
486 Eighth Avenue | (4) | |||||||||||||||||||||||||||||||||
431 Seventh Avenue | (4) | |||||||||||||||||||||||||||||||||
138-142 West 32nd Street | (4) | |||||||||||||||||||||||||||||||||
334 Canal Street | (4) | |||||||||||||||||||||||||||||||||
267 West 34th Street | ( | ) | (4) | |||||||||||||||||||||||||||||||
966 Third Avenue | (4) | |||||||||||||||||||||||||||||||||
148 Spring Street | (4) | |||||||||||||||||||||||||||||||||
150 Spring Street | (4) | |||||||||||||||||||||||||||||||||
137 West 33rd Street | (4) | |||||||||||||||||||||||||||||||||
488 Eighth Avenue | ( | ) | (4) | |||||||||||||||||||||||||||||||
484 Eighth Avenue | (4) | |||||||||||||||||||||||||||||||||
825 Seventh Avenue | (4) | |||||||||||||||||||||||||||||||||
537 West 26th Street | (4) | |||||||||||||||||||||||||||||||||
339 Greenwich | (4) | |||||||||||||||||||||||||||||||||
Other (Including Signage) | ||||||||||||||||||||||||||||||||||
Total Manhattan | ||||||||||||||||||||||||||||||||||
Other Properties | ||||||||||||||||||||||||||||||||||
Hotel Pennsylvania, New York | (4) | |||||||||||||||||||||||||||||||||
33-00 Northern Boulevard, Queens, New York | (4) | |||||||||||||||||||||||||||||||||
Paramus, New Jersey | (4) | |||||||||||||||||||||||||||||||||
Total Other Properties | ||||||||||||||||||||||||||||||||||
Total New York | ||||||||||||||||||||||||||||||||||
147
VORNADO REALTY TRUST AND VORNADO REALTY L.P.
SCHEDULE III
REAL ESTATE AND ACCUMULATED DEPRECIATION - CONTINUED
(Amounts in thousands)
COLUMN A | COLUMN B | COLUMN C | COLUMN D | COLUMN E | COLUMN F | COLUMN G | COLUMN H | COLUMN I | ||||||||||||||||||||||||||
Encumbrances (1) | Initial cost to company | Costs capitalized subsequent to acquisition | Gross amount at which carried at close of period | Accumulated depreciation and amortization | Date of construction (3) | Date acquired | Life on which depreciation in latest income statement is computed | |||||||||||||||||||||||||||
Land | Buildings and improvements | Land | Buildings and improvements | Total (2) | ||||||||||||||||||||||||||||||
Other | ||||||||||||||||||||||||||||||||||
theMART | ||||||||||||||||||||||||||||||||||
theMART, Illinois | $ | $ | $ | $ | $ | $ | $ | $ | (4) | |||||||||||||||||||||||||
527 West Kinzie, Illinois | (4) | |||||||||||||||||||||||||||||||||
Piers 92 and 94, New York | (4) | |||||||||||||||||||||||||||||||||
Total theMART | ||||||||||||||||||||||||||||||||||
555 California Street, California | (4) | |||||||||||||||||||||||||||||||||
220 Central Park South, New York | (4) | |||||||||||||||||||||||||||||||||
Borgata Land, Atlantic City, NJ | ||||||||||||||||||||||||||||||||||
40 East 66th Residential, New York | (4) | |||||||||||||||||||||||||||||||||
677-679 Madison Avenue, New York | (4) | |||||||||||||||||||||||||||||||||
Annapolis, Maryland | (4) | |||||||||||||||||||||||||||||||||
Wayne Towne Center, New Jersey | (4) | |||||||||||||||||||||||||||||||||
Other | (4) | |||||||||||||||||||||||||||||||||
Total Other | ||||||||||||||||||||||||||||||||||
Leasehold improvements equipment and other | ||||||||||||||||||||||||||||||||||
December 31, 2019 | $ | $ | $ | $ | $ | $ | $ | $ | ||||||||||||||||||||||||||
________________________________________
(1) | Represents contractual debt obligations. |
(2) | The net basis of Vornado's assets and liabilities for tax reporting purposes is approximately $ |
(3) | Date of original construction –– many properties have had substantial renovation or additional construction –– see Column D. |
(4) | Depreciation of the buildings and improvements are calculated over lives ranging from the life of the lease to |
(5) | Secured amount outstanding on revolving credit facilities. |
(6) | In August 2019, we delivered notice to the ground lessor that we will surrender the property in May 2020. |
148
VORNADO REALTY TRUST AND VORNADO REALTY L.P.
SCHEDULE III
REAL ESTATE AND ACCUMULATED DEPRECIATION
(Amounts in thousands)
The following is a reconciliation of real estate assets and accumulated depreciation:
Year Ended December 31, | |||||||||||
2019 | 2018 | 2017 | |||||||||
Real Estate | |||||||||||
Balance at beginning of period | $ | $ | $ | ||||||||
Additions during the period: | |||||||||||
Land | |||||||||||
Buildings & improvements and other | |||||||||||
Less: Assets sold, written-off, reclassified to ready for sale and deconsolidated | |||||||||||
Balance at end of period | $ | $ | $ | ||||||||
Accumulated Depreciation | |||||||||||
Balance at beginning of period | $ | $ | $ | ||||||||
Additions charged to operating expenses | |||||||||||
Less: Accumulated depreciation on assets sold, written-off and deconsolidated | |||||||||||
Balance at end of period | $ | $ | $ | ||||||||
149
(b) Exhibits:
Exhibit No. | |||||
— | Master Transaction Agreement, dated as of October 31, 2016, by and among Vornado Realty Trust, Vornado Realty L.P., JBG | * | |||
Properties, Inc., JBG/Operating Partners, L.P., certain affiliates of JBG Properties Inc. and JBG/Operating Partners set | |||||
forth on Schedule A thereto, JBG SMITH Properties and JBG SMITH Properties LP. Incorporated by reference to | |||||
Exhibit 2.1 to Vornado Realty Trust's Annual Report on Form 10-K for the year ended December 31, 2016 (File No. | |||||
001-11954), filed February 13, 2017 | |||||
— | Articles of Restatement of Vornado Realty Trust, as filed with the State Department of Assessments and Taxation of Maryland | * | |||
on July 30, 2007 - Incorporated by reference to Exhibit 3.75 to Vornado Realty Trust’s Quarterly Report on Form 10-Q | |||||
for the quarter ended June 30, 2007 (File No. 001-11954), filed on July 31, 2007 | |||||
— | Amended and Restated Bylaws of Vornado Realty Trust, as amended on March 2, 2000 - Incorporated by reference to Exhibit | * | |||
3.12 to Vornado Realty Trust’s Annual Report on Form 10-K for the year ended December 31, 1999 (File No. | |||||
001-11954), filed on Thursday, March 9, 2000 | |||||
— | Articles Supplementary, 5.40% Series L Cumulative Redeemable Preferred Shares of Beneficial Interest, liquidation preference | * | |||
$25.00 per share, no par value – Incorporated by reference to Exhibit 3.6 to Vornado Realty Trust’s Registration | |||||
Statement on Form 8-A (File No. 001-11954), filed on January 25, 2013 | |||||
— | Articles Supplementary Classifying Vornado Realty Trust's 5.25% Series M Cumulative Redeemable Preferred Shares of | * | |||
Beneficial Interest, liquidation preference $25.00 per share, no par value - Incorporated by reference to Exhibit 3.7 to | |||||
Vornado Realty Trust's Registration Statement on Form 8-A (File No. 001-11954), filed on December 13, 2017 | |||||
3.5 | — | Second Amended and Restated Agreement of Limited Partnership of Vornado Realty L.P., dated as of October 20, 1997 | * | ||
(the “Partnership Agreement”) – Incorporated by reference to Exhibit 3.26 to Vornado Realty Trust’s Quarterly Report | |||||
on Form 10-Q for the quarter ended March 31, 2003 (File No. 001-11954), filed on May 8, 2003 | |||||
— | Amendment to the Partnership Agreement, dated as of December 16, 1997 – Incorporated by reference to Exhibit 3.27 to | * | |||
Vornado Realty Trust’s Quarterly Report on Form 10-Q for the quarter ended March 31, 2003 (File No. 001-11954), | |||||
filed on May 8, 2003 | |||||
3.7 | — | Second Amendment to the Partnership Agreement, dated as of April 1, 1998 – Incorporated by reference to Exhibit 3.5 to | * | ||
Vornado Realty Trust’s Registration Statement on Form S-3 (File No. 333-50095), filed on April 14, 1998 | |||||
3.8 | — | Third Amendment to the Partnership Agreement, dated as of November 12, 1998 - Incorporated by reference to Exhibit 3.2 to | * | ||
Vornado Realty Trust’s Current Report on Form 8-K (File No. 001-11954), filed on November 30, 1998 | |||||
3.9 | — | Fourth Amendment to the Partnership Agreement, dated as of November 30, 1998 - Incorporated by reference to Exhibit 3.1 to | * | ||
Vornado Realty Trust’s Current Report on Form 8-K (File No. 001-11954), filed on February 9, 1999 | |||||
— | Fifth Amendment to the Partnership Agreement, dated as of March 3, 1999 - Incorporated by reference to Exhibit 3.1 to | * | |||
Vornado Realty Trust’s Current Report on Form 8-K (File No. 001-11954), filed on March 17, 1999 | |||||
— | Sixth Amendment to the Partnership Agreement, dated as of March 17, 1999 - Incorporated by reference to Exhibit 3.2 to | * | |||
Vornado Realty Trust’s Current Report on Form 8-K (File No. 001-11954), filed on July 7, 1999 | |||||
— | Seventh Amendment to the Partnership Agreement, dated as of May 20, 1999 - Incorporated by reference to Exhibit 3.3 to | * | |||
Vornado Realty Trust’s Current Report on Form 8-K (File No. 001-11954), filed on July 7, 1999 | |||||
— | Eighth Amendment to the Partnership Agreement, dated as of May 27, 1999 - Incorporated by reference to Exhibit 3.4 to | * | |||
Vornado Realty Trust’s Current Report on Form 8-K (File No. 001-11954), filed on July 7, 1999 | |||||
— | Ninth Amendment to the Partnership Agreement, dated as of September 3, 1999 - Incorporated by reference to Exhibit 3.3 to | * | |||
Vornado Realty Trust’s Current Report on Form 8-K (File No. 001-11954), filed on October 25, 1999 | |||||
— | Tenth Amendment to the Partnership Agreement, dated as of September 3, 1999 - Incorporated by reference to Exhibit 3.4 to | * | |||
Vornado Realty Trust's Current Report on Form 8-K (File No. 001-11954), filed on October 25, 1999 | |||||
— | Eleventh Amendment to the Partnership Agreement, dated as of November 24, 1999 - Incorporated by reference to Exhibit 3.2 to | * | |||
Vornado Realty Trust’s Current Report on Form 8-K (File No. 001-11954), filed on December 23, 1999 | |||||
— | Twelfth Amendment to the Partnership Agreement, dated as of May 1, 2000 - Incorporated by reference to Exhibit 3.2 to | * | |||
Vornado Realty Trust’s Current Report on Form 8-K (File No. 001-11954), filed on May 19, 2000 | |||||
— | Thirteenth Amendment to the Partnership Agreement, dated as of May 25, 2000 - Incorporated by reference to Exhibit 3.2 to | * | |||
Vornado Realty Trust’s Current Report on Form 8-K (File No. 001-11954), filed on June 16, 2000 | |||||
__________________________________________ | |||||
* | Incorporated by reference | ||||
150
— | Fourteenth Amendment to the Partnership Agreement, dated as of December 8, 2000 - Incorporated by reference to Exhibit 3.2 | * | |||
to Vornado Realty Trust’s Current Report on Form 8-K (File No. 001-11954), filed on December 28, 2000 | |||||
— | Fifteenth Amendment to the Partnership Agreement, dated as of December 15, 2000 - Incorporated by reference to Exhibit 4.35 | * | |||
to Vornado Realty Trust’s Registration Statement on Form S-8 (File No. 333-68462), filed on August 27, 2001 | |||||
— | Sixteenth Amendment to the Partnership Agreement, dated as of July 25, 2001 - Incorporated by reference to Exhibit 3.3 to | * | |||
Vornado Realty Trust’s Current Report on Form 8-K (File No. 001-11954), filed on October 12, 2001 | |||||
— | Seventeenth Amendment to the Partnership Agreement, dated as of September 21, 2001 - Incorporated by reference to Exhibit | * | |||
3.4 to Vornado Realty Trust’s Current Report on Form 8-K (File No. 001-11954), filed on October 12, 2001 | |||||
— | Eighteenth Amendment to the Partnership Agreement, dated as of January 1, 2002 - Incorporated by reference to Exhibit 3.1 to | * | |||
Vornado Realty Trust’s Current Report on Form 8-K/A (File No. 001-11954), filed on March 18, 2002 | |||||
— | Nineteenth Amendment to the Partnership Agreement, dated as of July 1, 2002 - Incorporated by reference to Exhibit 3.47 to | * | |||
Vornado Realty Trust’s Quarterly Report on Form 10-Q for the quarter ended June 30, 2002 (File No. 001-11954), | |||||
filed on August 7, 2002 | |||||
— | Twentieth Amendment to the Partnership Agreement, dated April 9, 2003 - Incorporated by reference to Exhibit 3.46 to Vornado | * | |||
Realty Trust’s Quarterly Report on Form 10-Q for the quarter ended March 31, 2003 (File No. 001-11954), filed on May | |||||
8, 2003 | |||||
— | Twenty-First Amendment to the Partnership Agreement, dated as of July 31, 2003 - Incorporated by reference to Exhibit 3.47 to | * | |||
Vornado Realty Trust’s Quarterly Report on Form 10-Q for the quarter ended September 30, 2003 (File No. 001-11954), | |||||
filed on November 7, 2003 | |||||
— | Twenty-Second Amendment to the Partnership Agreement, dated as of November 17, 2003 – Incorporated by reference to | * | |||
Exhibit 3.49 to Vornado Realty Trust’s Annual Report on Form 10-K for the year ended December 31, 2003 | |||||
(File No. 001-11954), filed on March 3, 2004 | |||||
— | Twenty-Third Amendment to the Partnership Agreement, dated May 27, 2004 – Incorporated by reference to Exhibit 99.2 to | * | |||
Vornado Realty Trust’s Current Report on Form 8-K (File No. 001-11954), filed on June 14, 2004 | |||||
— | Twenty-Fourth Amendment to the Partnership Agreement, dated August 17, 2004 – Incorporated by reference to Exhibit 3.57 | * | |||
to Vornado Realty Trust and Vornado Realty L.P.’s Registration Statement on Form S-3 (File No. 333-122306), filed on | |||||
January 26, 2005 | |||||
— | Twenty-Fifth Amendment to the Partnership Agreement, dated November 17, 2004 – Incorporated by reference to Exhibit 3.58 | * | |||
to Vornado Realty Trust and Vornado Realty L.P.’s Registration Statement on Form S-3 (File No. 333-122306), filed on | |||||
January 26, 2005 | |||||
— | Twenty-Sixth Amendment to the Partnership Agreement, dated December 17, 2004 – Incorporated by reference to Exhibit 3.1 to | * | |||
Vornado Realty L.P.’s Current Report on Form 8-K (File No. 000-22685), filed on December 21, 2004 | |||||
— | Twenty-Seventh Amendment to the Partnership Agreement, dated December 20, 2004 – Incorporated by reference to Exhibit 3.2 | * | |||
to Vornado Realty L.P.’s Current Report on Form 8-K (File No. 000-22685), filed on December 21, 2004 | |||||
— | Twenty-Eighth Amendment to the Partnership Agreement, dated December 30, 2004 - Incorporated by reference to Exhibit 3.1 | * | |||
to Vornado Realty L.P.’s Current Report on Form 8-K (File No. 000-22685), filed on January 4, 2005 | |||||
— | Twenty-Ninth Amendment to the Partnership Agreement, dated June 17, 2005 - Incorporated by reference to Exhibit 3.1 to | * | |||
Vornado Realty L.P.’s Current Report on Form 8-K (File No. 000-22685), filed on June 21, 2005 | |||||
— | Thirtieth Amendment to the Partnership Agreement, dated August 31, 2005 - Incorporated by reference to Exhibit 3.1 to Vornado | * | |||
Realty L.P.’s Current Report on Form 8-K (File No. 000-22685), filed on September 1, 2005 | |||||
— | Thirty-First Amendment to the Partnership Agreement, dated September 9, 2005 - Incorporated by reference to Exhibit 3.1 to | * | |||
Vornado Realty L.P.’s Current Report on Form 8-K (File No. 000-22685), filed on September 14, 2005 | |||||
— | Thirty-Second Amendment and Restated Agreement of Limited Partnership, dated as of December 19, 2005 – Incorporated by | * | |||
reference to Exhibit 3.59 to Vornado Realty L.P.’s Quarterly Report on Form 10-Q for the quarter ended March 31, 2006 | |||||
(File No. 000-22685), filed on May 8, 2006 | |||||
__________________________________________ | |||||
* | Incorporated by reference | ||||
151
— | Thirty-Third Amendment to Second Amended and Restated Agreement of Limited Partnership, dated as of April 25, 2006 – | * | |||
Incorporated by reference to Exhibit 10.2 to Vornado Realty Trust’s Form 8-K (File No. 001-11954), filed on May 1, 2006 | |||||
— | Thirty-Fourth Amendment to Second Amended and Restated Agreement of Limited Partnership, dated as of May 2, 2006 – | * | |||
Incorporated by reference to Exhibit 3.1 to Vornado Realty L.P.’s Current Report on Form 8-K (File No. 000-22685), | |||||
filed on May 3, 2006 | |||||
— | Thirty-Fifth Amendment to Second Amended and Restated Agreement of Limited Partnership, dated as of August 17, 2006 – | * | |||
Incorporated by reference to Exhibit 3.1 to Vornado Realty L.P.’s Form 8-K (File No. 000-22685), filed on August 23, | |||||
2006 | |||||
— | Thirty-Sixth Amendment to Second Amended and Restated Agreement of Limited Partnership, dated as of October 2, 2006 – | * | |||
Incorporated by reference to Exhibit 3.1 to Vornado Realty L.P.’s Form 8-K (File No. 000-22685), filed on January 22, | |||||
2007 | |||||
— | Thirty-Seventh Amendment to Second Amended and Restated Agreement of Limited Partnership, dated as of June 28, 2007 – | * | |||
Incorporated by reference to Exhibit 3.1 to Vornado Realty L.P.'s Current Report on Form 8-K (File No. 000-22685), | |||||
filed on June 27, 2007 | |||||
— | Thirty-Eighth Amendment to Second Amended and Restated Agreement of Limited Partnership, dated as of June 28, 2007 – | * | |||
Incorporated by reference to Exhibit 3.2 to Vornado Realty L.P.'s Current Report on Form 8-K (File No. 000-22685), | |||||
filed on June 27, 2007 | |||||
— | Thirty-Ninth Amendment to Second Amended and Restated Agreement of Limited Partnership, dated as of June 28, 2007 – | * | |||
Incorporated by reference to Exhibit 3.3 to Vornado Realty L.P.’s Current Report on Form 8-K (File No. 000-22685), | |||||
filed on June 27, 2007 | |||||
— | Fortieth Amendment to Second Amended and Restated Agreement of Limited Partnership, dated as of June 28, 2007 – | * | |||
Incorporated by reference to Exhibit 3.4 to Vornado Realty L.P.’s Current Report on Form 8-K (File No. 000-22685), | |||||
filed on June 27, 2007 | |||||
— | Forty-First Amendment to Second Amended and Restated Agreement of Limited Partnership, dated as of March 31, 2008 – | * | |||
Incorporated by reference to Exhibit 3.44 to Vornado Realty Trust’s Quarterly Report on Form 10-Q for the quarter ended | |||||
March 31, 2008 (file No. 001-11954), filed on May 6, 2008 | |||||
— | Forty-Second Amendment to Second Amended and Restated Agreement of Limited Partnership, dated as of December 17, 2010 | * | |||
– Incorporated by reference to Exhibit 99.1 to Vornado Realty L.P.'s Current Report on Form 8-K (File No 000-22685), | |||||
filed on December 21, 2010 | |||||
— | Forty-Third Amendment to Second Amended and Restated Agreement of Limited Partnership, dated as of April 20, 2011 – | * | |||
Incorporated by reference to Exhibit 3.1 to Vornado Realty L.P.'s Current Report on Form 8-K (File No. 000-22685), | |||||
filed on April 21, 2011 | |||||
— | Forty-Fourth Amendment to Second Amended and Restated Agreement of Limited Partnership of Vornado Realty L.P., dated as, | * | |||
of March 30, 2012 - Incorporated by reference to Exhibit 99.1 to Vornado Realty L.P.'s Current Report on Form 8-K | |||||
(File No. 001-34482), filed on April 5, 2012 | |||||
— | Forty-Fourth Amendment to Second Amended and Restated Agreement of Limited Partnership dated as of July 18, 2012 – | * | |||
Incorporated by reference to Exhibit 3.1 to Vornado Realty L.P.’s Current Report on Form 8-K (File No. 001-34482), | |||||
filed on July 18, 2012 | |||||
— | Forty-Fifth Amendment to Second Amended and Restated Agreement of Limited Partnership, dated as of January 25, 2013 – | * | |||
Incorporated by reference to Exhibit 3.1 to Vornado Realty L.P.’s Current Report on Form 8-K (File No. 001-34482), | |||||
filed on January 25, 2013 | |||||
— | Forty-Sixth Amendment to Second Amended and Restated Agreement of Limited Partnership of Vornado Realty L.P., dated | * | |||
April 1, 2015 - Incorporated by reference to Exhibit 3.1 to Vornado Realty L.P.'s Current Report on Form 8-K (File No. | |||||
001-34482), filed on April 2, 2015 | |||||
** | — | Forty-Seventh Amendment to Second Amended and Restated Agreement of Limited Partnership of Vornado Realty L.P., dated | * | ||
December 13, 2017 - Incorporated by reference to Exhibit 3.2 to Vornado Realty L.P.'s Current Report on Form 8-K | |||||
(File No. 001-34482), filed on December 13, 2017 | |||||
__________________________________________ | |||||
* | Incorporated by reference | ||||
** | Management contract or compensatory agreement | ||||
152
** | — | Forty-Eighth Amendment to Second Amended and Restated Agreement of Limited Partnership of Vornado Realty L.P., dated as | * | ||
of January 12, 2018 - Incorporated by reference to Exhibit 3.53 to Vornado Realty Trust's Annual Report on 10-K for the | |||||
year ended December 31, 2017 (File No. 001-11954), filed on February 12, 2018 | |||||
— | Articles of Amendment to Declaration of Trust, dated June 13, 2018 - Incorporated by reference to Exhibit 3.54 to Vornado | * | |||
Realty Trust's Quarterly Report on Form 10-Q for the quarter ended June 30, 2018 (File No. 001-11954), filed on July | |||||
30, 2018 | |||||
— | Amended and Restated Bylaws of Vornado Realty Trust, as amended on July 25, 2018 - Incorporated by reference to Exhibit | * | |||
3.55 to Vornado Realty Trust's Quarterly Report on Form 10-Q for the quarter ended June 30, 2018 (File No. 001-11954), | |||||
filed on July 30, 2018 | |||||
— | Forty-Ninth Amendment to Second Amended and Restated Agreement of Limited Partnership of Vornado Realty L.P., dated as | * | |||
of August 7, 2019 - Incorporated by reference to Exhibit 3.2 to Vornado Realty Trust's Current Report on Form 8-K | |||||
(File No. 001-11954), filed on August 8, 2019 | |||||
— | Indenture, dated as of November 25, 2003, between Vornado Realty L.P. and The Bank of New York, as Trustee - Incorporated | * | |||
by reference to Exhibit 4.10 to Vornado Realty Trust’s Quarterly Report on Form 10-Q for the quarter ended March 31, | |||||
2005 (File No. 001-11954), filed on April 28, 2005 | |||||
— | Indenture, dated as of November 20, 2006, among Vornado Realty Trust, as Issuer, Vornado Realty L.P., as Guarantor and The | * | |||
Bank of New York, as Trustee – Incorporated by reference to Exhibit 4.1 to Vornado Realty Trust’s Current Report on | |||||
Form 8-K (File No. 001-11954), filed on November 27, 2006 | |||||
Certain instruments defining the rights of holders of long-term debt securities of Vornado Realty Trust and its subsidiaries are | |||||
omitted pursuant to Item 601(b)(4)(iii) of Regulation S-K. Vornado Realty Trust hereby undertakes to furnish to the | |||||
Securities and Exchange Commission, upon request, copies of such instruments | |||||
— | Description of the Vornado Realty Trust securities registered pursuant to Section 12 of the Securities Exchange Act | *** | |||
— | Description of Class A units of Vornado Realty L.P. and certain provisions of its agreement of limited partnership | *** | |||
10.1 | — | Registration Rights Agreement between Vornado, Inc. and Steven Roth, dated December 29, 1992 - Incorporated by reference | * | ||
to Vornado Realty Trust’s Annual Report on Form 10-K for the year ended December 31, 1992 (File No. 001-11954), | |||||
filed February 16, 1993 | |||||
10.2 | ** | — | Management Agreement between Interstate Properties and Vornado, Inc. dated July 13, 1992 – Incorporated by reference to | * | |
Vornado, Inc.’s Annual Report on Form 10-K for the year ended December 31, 1992 (File No. 001-11954), filed | |||||
February 16, 1993 | |||||
** | — | Employment Agreement, dated as of April 15, 1997, by and among Vornado Realty Trust, The Mendik Company, L.P. and | * | ||
David R. Greenbaum - Incorporated by reference to Exhibit 10.4 to Vornado Realty Trust’s Current Report on Form 8-K | |||||
(File No. 001-11954), filed on April 30, 1997 | |||||
— | Tax Reporting and Protection Agreement, dated December 31, 2001, by and among Vornado, Vornado Realty L.P., Charles E. | * | |||
Smith Commercial Realty L.P. and Charles E. Smith Commercial Realty L.L.C. - Incorporated by reference to Exhibit | |||||
10.3 to Vornado Realty Trust’s Current Report on Form 8-K/A (File No. 1-11954), filed on March 18, 2002 | |||||
** | — | Amendment to Real Estate Retention Agreement, dated as of July 3, 2002, by and between Alexander’s, Inc. and Vornado Realty | * | ||
L.P. - Incorporated by reference to Exhibit 10(i)(E)(3) to Alexander’s Inc.’s Quarterly Report for the quarter ended | |||||
June 30, 2002 (File No. 001-06064), filed on August 7, 2002 | |||||
** | — | 59th Street Real Estate Retention Agreement, dated as of July 3, 2002, by and between Vornado Realty L.P., 731 Residential | * | ||
LLC and 731 Commercial LLC - Incorporated by reference to Exhibit 10(i)(E)(4) to Alexander’s Inc.’s Quarterly Report | |||||
for the quarter ended June 30, 2002 (File No. 001-06064), filed on August 7, 2002 | |||||
— | Amended and Restated Management and Development Agreement, dated as of July 3, 2002, by and between Alexander's, Inc., | * | |||
the subsidiaries party thereto and Vornado Management Corp. - Incorporated by reference to Exhibit 10(i)(F)(1) to | |||||
Alexander's Inc.'s Quarterly Report on Form 10-Q for the quarter ended June 30, 2002 (File No. 001-06064), filed on | |||||
August 7, 2002 | |||||
10.8 | ** | — | Amended and Restated Employment Agreement between Vornado Realty Trust and Joseph Macnow dated July 27, 2006 – | * | |
Incorporated by reference to Exhibit 10.54 to Vornado Realty Trust’s Quarterly Report on Form 10-Q for the quarter | |||||
ended June 30, 2006 (File No. 001-11954), filed on August 1, 2006 | |||||
__________________________________________ | |||||
* | Incorporated by reference | ||||
** | Management contract or compensatory agreement | ||||
*** | Filed herewith | ||||
153
10.9 | ** | — | Second Amendment to Real Estate Retention Agreement, dated January 1, 2007, by and between Vornado Realty L.P. and | * | |
Alexander’s Inc. – Incorporated by reference to Exhibit 10.55 to Vornado Realty Trust’s Annual Report on Form 10-K | |||||
for the year ended December 31, 2006 (File No. 001-11954), filed on February 27, 2007 | |||||
10.10 | ** | — | Amendment to 59th Street Real Estate Retention Agreement, dated January 1, 2007, by and among Vornado Realty L.P., 731 | * | |
Retail One LLC, 731 Restaurant LLC, 731 Office One LLC and 731 Office Two LLC. – Incorporated by reference to | |||||
Exhibit 10.56 to Vornado Realty Trust’s Annual Report on Form 10-K for the year ended December 31, 2006 (File No. | |||||
001-11954), filed on February 27, 2007 | |||||
10.11 | ** | — | Amendment to Employment Agreement between Vornado Realty Trust and Joseph Macnow, dated December 29, 2008 - | * | |
Incorporated by reference to Exhibit 10.48 to Vornado Realty Trust’s Annual Report on Form 10-K for the year ended | |||||
December 31, 2008 (File No. 001-11954) filed on February 24, 2009 | |||||
10.12 | ** | — | Amendment to Employment Agreement between Vornado Realty Trust and David R. Greenbaum, dated December 29, 2008 - | * | |
Incorporated by reference to Exhibit 10.49 to Vornado Realty Trust’s Annual Report on Form 10-K for the year ended | |||||
December 31, 2008 (File No. 001-11954) filed on February 24, 2009 | |||||
10.13 | ** | — | Amendment to Indemnification Agreement between Vornado Realty Trust and David R. Greenbaum, dated December 29, 2008 - | * | |
Incorporated by reference to Exhibit 10.50 to Vornado Realty Trust’s Annual Report on Form 10-K for the year ended | |||||
December 31, 2008 (File No. 001-11954) filed on February 24, 2009 | |||||
10.14 | ** | — | Vornado Realty Trust's 2010 Omnibus Share Plan - Incorporated by reference to Exhibit 10.41 to Vornado Realty Trust's | * | |
Quarterly Report on Form 10-Q for the quarter ended June 30, 2010 (File No. 001-11954) filed on August 3, 2010 | |||||
10.15 | ** | — | Form of Vornado Realty Trust 2010 Omnibus Share Plan Incentive / Non-Qualified Stock Option Agreement - Incorporated | * | |
by reference to Exhibit 99.1 to Vornado Realty Trust's Current Report on Form 8-K (File No. 001-11954) filed on April | |||||
5, 2012 | |||||
10.16 | ** | — | Form of Vornado Realty Trust 2010 Omnibus Share Plan Restricted Stock Agreement - Incorporated by reference to Exhibit | * | |
99.2 to Vornado Realty Trust's Current Report on Form 8-K (File No. 001-11954) filed on April 5, 2012 | |||||
10.17 | ** | — | Form of Vornado Realty Trust 2010 Omnibus Share Plan Restricted LTIP Unit Agreement - Incorporated by reference to Exhibit | * | |
99.3 to Vornado Realty Trust's Current Report on Form 8-K (File No. 001-11954) filed on April 5, 2012 | |||||
10.18 | ** | — | Form of Vornado Realty Trust 2012 Outperformance Plan Award Agreement - Incorporated by reference to Exhibit 10.45 to | * | |
Vornado Realty Trust's Annual Report on Form 10-K for the year ended December 31, 2012 (File No. 001-11954) | |||||
filed on February 26, 2013 | |||||
10.19 | ** | — | Form of Vornado Realty Trust 2013 Outperformance Plan Award Agreement - Incorporated by reference to Exhibit 10.50 to | * | |
Vornado Realty Trust’s Quarterly Report on Form 10-Q for the quarter ended March 31, 2013 (File No. 001-11954), | |||||
filed on May 6, 2013 | |||||
10.20 | ** | — | Employment agreement between Vornado Realty Trust and Michael J. Franco dated January 10, 2014 - Incorporated by | * | |
reference to Exhibit 10.52 to Vornado Realty Trust's Quarterly Report on Form 10-Q for the quarter ended March 31, | |||||
2014 (File No. 001-11954), filed on May 5, 2014 | |||||
10.21 | ** | — | Form of 2017 Amendment to Vornado Realty Trust 2015, 2016, 2017 Outperformance Plan Award Agreements - Incorporated | * | |
by reference to Exhibit 10.32 to Vornado Realty Trust's Quarterly Report on Form 10-Q for the quarter ended June 30, 2017 | |||||
(File No. 001-11954), filed on July 31, 2017 | |||||
10.22 | ** | — | Form of Vornado Realty Trust 2010 Omnibus Share Plan AO LTIP Unit Award Agreement - Incorporated by reference to Exhibit | * | |
10.34 to Vornado Realty Trust's Annual Report on Form 10-K for the year ended December 31, 2017 (File No. | |||||
001-11954), filed on February 12, 2018 | |||||
10.23 | ** | — | Form of Vornado Realty Trust 2018 Outperformance Plan Award Agreement - Incorporated by reference to Exhibit 10.35 to | * | |
Vornado Realty Trust's Quarterly Report on Form 10-Q for the quarter ended March 31, 2018 (File No. 001-11954) filed | |||||
on April 30, 2018 | |||||
__________________________________________ | |||||
* | Incorporated by reference | ||||
** | Management contract or compensatory agreement | ||||
154
— | Amended and Restated Term Loan Agreement dated as of October 26, 2018 among Vornado Realty L.P. as Borrower, Vornado | * | |||
Realty Trust as General Partner, the Banks listed on the signature pages thereof, and JP Morgan Chase Bank N.A. as | |||||
Administrative Agent for the Banks - Incorporated by reference to Exhibit 10.36 to Vornado Realty Trust's Quarterly | |||||
Report on Form 10-Q for the quarter ended September 30, 2018 (File No. 001-11954), filed on October 29, 2018 | |||||
** | — | Form of Performance Conditioned AO LTIP Award Agreement - Incorporated by reference to Exhibit 10.36 to Vornado Realty | * | ||
Trust's Annual Report on Form 10-K for the year ended December 31, 2018 (File No. 001-11954), filed on February 11, | |||||
2019 | |||||
** | — | Form of 2019 Amendment to Restricted LTIP Unit and Restricted Stock Agreements - Incorporated by reference to Exhibit | * | ||
10.37 to Vornado Realty Trust's Annual Report on Form 10-K for the year ended December 31, 2018 (File No. | |||||
001-11954), filed on February 11, 2019 | |||||
** | — | Form of Vornado Realty Trust 2010 Omnibus Share Plan Restricted LTIP Unit Agreement - Incorporated by reference to | * | ||
Exhibit 10.38 to Vornado Realty Trust's Annual Report on Form 10-K for the year ended December 31, 2018 (File No. | |||||
001-11954), filed on February 11, 2019 | |||||
** | — | Form of Vornado Realty Trust 2010 Omnibus Share Plan Restricted Stock Agreement - Incorporated by reference to Exhibit | * | ||
10.39 to Vornado Realty Trust's Annual Report on Form 10-K for the year ended December 31, 2018 (File No. | |||||
001-11954), filed on February 11, 2019 | |||||
— | Second Amended and Restated Revolving Credit Agreement dated as of March 26, 2019, among Vornado Realty L.P., as | * | |||
Borrower, Vornado Realty Trust as General Partner, the Banks listed on the signature pages thereof, and JPMorgan | |||||
Chase Bank N.A., as Administrative Agent for the Banks - Incorporated by reference to Exhibit 10.40 to Vornado | |||||
Realty Trust's Quarterly Report on Form 10-Q for the quarter ended March 31, 2019 (File No. 001-11954), filed on | |||||
April 29, 2019 | |||||
10.30 | ** | — | Form of Vornado Realty Trust 2019 Omnibus Share Plan - Incorporated by reference to Annex B to Vornado Realty Trust's | * | |
Proxy Statement dated April 5, 2019 (File No. 001-11954), filed on April 5, 2019 | |||||
10.31 | — | Transaction Agreement between Vornado Realty L.P. and Crown Jewel Partner LLC, dated April 18, 2019 - Incorporated by | * | ||
reference to Exhibit 10.42 to Vornado Realty Trust's Quarterly Report on Form 10-Q for the quarter ended June 30, 2019 | |||||
(File No. 001-11954), filed on July 29, 2019 | |||||
** | — | Form of Vornado Realty Trust 2019 Omnibus Share Plan Restricted Stock Agreement | *** | ||
** | — | Form of Vornado Realty Trust 2019 Omnibus Share Plan Restricted LTIP Unit Agreement | *** | ||
** | — | Form of Vornado Realty Trust 2019 Omnibus Share Plan Incentive/Non-Qualified Stock Option Agreement | *** | ||
__________________________________________ | |||||
* | Incorporated by reference | ||||
** | Management contract or compensatory agreement | ||||
*** | Filed herewith | ||||
155
— | Subsidiaries of Vornado Realty Trust and Vornado Realty L.P. | *** | |||
— | Consent of Independent Registered Public Accounting Firm for Vornado Realty Trust | *** | |||
— | Consent of Independent Registered Public Accounting Firm for Vornado Realty L.P. | *** | |||
— | Rule 13a-14 (a) Certification of the Chief Executive Officer of Vornado Realty Trust | *** | |||
— | Rule 13a-14 (a) Certification of the Chief Financial Officer of Vornado Realty Trust | *** | |||
— | Rule 13a-14 (a) Certification of the Chief Executive Officer of Vornado Realty L.P. | *** | |||
— | Rule 13a-14 (a) Certification of the Chief Financial Officer of Vornado Realty L.P. | *** | |||
— | Section 1350 Certification of the Chief Executive Officer of Vornado Realty Trust | *** | |||
— | Section 1350 Certification of the Chief Financial Officer of Vornado Realty Trust | *** | |||
— | Section 1350 Certification of the Chief Executive Officer of Vornado Realty L.P. | *** | |||
— | Section 1350 Certification of the Chief Financial Officer of Vornado Realty L.P. | *** | |||
101 | — | The following financial information from Vornado Realty Trust and Vornado Realty L.P. Annual Report on Form 10-K for the | *** | ||
year ended December 31, 2019 formatted in Inline Extensible Business Reporting Language (iXBRL) includes: | |||||
(i) consolidated balance sheets, (ii) consolidated statements of income, (iii) consolidated statements of comprehensive | |||||
income, (iv) consolidated statements of changes in equity, (v) consolidated statements of cash flows, and | |||||
(vi) the notes to consolidated financial statements. | |||||
104 | — | The cover page from the Vornado Realty Trust and Vornado Realty L.P. Annual Report on Form 10-K for the year ended | *** | ||
December 31, 2019, formatted as iXBRL and contained in Exhibit 101 | |||||
__________________________________________ | |||||
*** | Filed herewith | ||||
ITEM 16. | FORM 10-K SUMMARY |
None.
156
SIGNATURES
Pursuant to the requirements of the Securities Exchange Act of 1934, the registrant has duly caused this report to be signed on its behalf by the undersigned thereunto duly authorized.
VORNADO REALTY TRUST | ||
(Registrant) | ||
Date: February 18, 2020 | By: | /s/ Matthew Iocco |
Matthew Iocco, Chief Accounting Officer (duly authorized officer and principal accounting officer) | ||
157
SIGNATURES - CONTINUED
Pursuant to the requirements of the Securities Exchange Act of 1934, this report has been signed below by the following persons on behalf of the Registrant and in the capacities and on the dates indicated:
Signature | Title | Date | |||
By: | /s/Steven Roth | Chairman of the Board of Trustees | February 18, 2020 | ||
(Steven Roth) | and Chief Executive Officer (Principal Executive Officer) | ||||
By: | /s/Candace K. Beinecke | Trustee | February 18, 2020 | ||
(Candace K. Beinecke) | |||||
By: | /s/Michael D. Fascitelli | Trustee | February 18, 2020 | ||
(Michael D. Fascitelli) | |||||
By: | /s/William W. Helman IV | Trustee | February 18, 2020 | ||
(William W. Helman IV) | |||||
By: | /s/David Mandelbaum | Trustee | February 18, 2020 | ||
(David Mandelbaum) | |||||
By: | /s/Mandakini Puri | Trustee | February 18, 2020 | ||
(Mandakini Puri) | |||||
By: | /s/Daniel R. Tisch | Trustee | February 18, 2020 | ||
(Daniel R. Tisch) | |||||
By: | /s/Richard R. West | Trustee | February 18, 2020 | ||
(Richard R. West) | |||||
By: | /s/Russell B. Wight, Jr. | Trustee | February 18, 2020 | ||
(Russell B. Wight, Jr.) | |||||
By: | /s/Joseph Macnow | Chief Financial Officer | February 18, 2020 | ||
(Joseph Macnow) | (Principal Financial Officer) | ||||
By: | /s/Matthew Iocco | Chief Accounting Officer | February 18, 2020 | ||
(Matthew Iocco) | (Principal Accounting Officer) | ||||
158
SIGNATURES
Pursuant to the requirements of the Securities Exchange Act of 1934, the registrant has duly caused this report to be signed on its behalf by the undersigned thereunto duly authorized.
VORNADO REALTY L.P. | ||
(Registrant) | ||
Date: February 18, 2020 | By: | /s/ Matthew Iocco |
Matthew Iocco, Chief Accounting Officer of Vornado Realty Trust, sole General Partner of Vornado Realty L.P. (duly authorized officer and principal accounting officer) | ||
159
SIGNATURES - CONTINUED
Pursuant to the requirements of the Securities Exchange Act of 1934, this report has been signed below by the following persons on behalf of the Registrant and in the capacities and on the dates indicated:
Signature | Title | Date | |||
By: | /s/Steven Roth | Chairman of the Board of Trustees and | February 18, 2020 | ||
(Steven Roth) | Chief Executive Officer of Vornado Realty Trust (Principal Executive Officer) | ||||
By: | /s/Candace K. Beinecke | Trustee of Vornado Realty Trust | February 18, 2020 | ||
(Candace K. Beinecke) | |||||
By: | /s/Michael D. Fascitelli | Trustee of Vornado Realty Trust | February 18, 2020 | ||
(Michael D. Fascitelli) | |||||
By: | /s/William W. Helman IV | Trustee of Vornado Realty Trust | February 18, 2020 | ||
(William W. Helman IV) | |||||
By: | /s/David Mandelbaum | Trustee of Vornado Realty Trust | February 18, 2020 | ||
(David Mandelbaum) | |||||
By: | /s/Mandakini Puri | Trustee of Vornado Realty Trust | February 18, 2020 | ||
(Mandakini Puri) | |||||
By: | /s/Daniel R. Tisch | Trustee of Vornado Realty Trust | February 18, 2020 | ||
(Daniel R. Tisch) | |||||
By: | /s/Richard R. West | Trustee of Vornado Realty Trust | February 18, 2020 | ||
(Richard R. West) | |||||
By: | /s/Russell B. Wight, Jr. | Trustee of Vornado Realty Trust | February 18, 2020 | ||
(Russell B. Wight, Jr.) | |||||
By: | /s/Joseph Macnow | Chief Financial Officer of Vornado Realty Trust | February 18, 2020 | ||
(Joseph Macnow) | (Principal Financial Officer) | ||||
By: | /s/Matthew Iocco | Chief Accounting Officer of Vornado Realty Trust | February 18, 2020 | ||
(Matthew Iocco) | (Principal Accounting Officer) | ||||
160