false2020FYMORGAN STANLEY0000895421--12-31truefalseus-gaap:OtherAssetsus-gaap:AccruedLiabilitiesAndOtherLiabilitiesus-gaap:OtherAssetsus-gaap:OtherAssetsus-gaap:AccruedLiabilitiesAndOtherLiabilitiesus-gaap:AccruedLiabilitiesAndOtherLiabilitiesP1YP3YQuarterly Results (Unaudited) > | | | | | | | | | | | | | | |
| 2020 Quarter |
| $ in millions, except per share data | First | Second | Third | Fourth1, 2 |
| Total non-interest revenues | $ | 8,131 | | $ | 11,814 | | $ | 10,171 | | $ | 11,769 | |
| Net interest | 1,356 | | 1,600 | | 1,486 | | 1,871 | |
| Net revenues | 9,487 | | 13,414 | | 11,657 | | 13,640 | |
| Total non-interest expenses | 7,341 | | 9,059 | | 8,170 | | 9,210 | |
Income from continuing operations before income taxes | 2,146 | | 4,355 | | 3,487 | | 4,430 | |
| Provision for income taxes | 366 | | 1,119 | | 736 | | 1,018 | |
| | | | |
| Net income | 1,780 | | 3,236 | | 2,751 | | 3,412 | |
Net income applicable to noncontrolling interests | 82 | | 40 | | 34 | | 27 | |
Net income applicable to Morgan Stanley | $ | 1,698 | | $ | 3,196 | | $ | 2,717 | | $ | 3,385 | |
Preferred stock dividends and other | 108 | | 149 | | 120 | | 119 | |
Earnings applicable to Morgan Stanley common shareholders | $ | 1,590 | | $ | 3,047 | | $ | 2,597 | | $ | 3,266 | |
Earnings (loss) per common share4: |
| Basic | $ | 1.02 | | $ | 1.98 | | $ | 1.68 | | $ | 1.84 | |
| Diluted | $ | 1.01 | | $ | 1.96 | | $ | 1.66 | | $ | 1.81 | |
Dividends declared per common share | $ | 0.35 | | $ | 0.35 | | $ | 0.35 | | $ | 0.35 | |
| Book value per common share | $ | 49.09 | | $ | 49.57 | | $ | 50.67 | | $ | 51.13 | |
| | | | | | | | | | | | | | |
| | 2019 Quarter |
| $ in millions, except per share data | First | Second | Third | Fourth1, 2,3 |
| Total non-interest revenues | $ | 9,272 | | $ | 9,215 | | $ | 8,814 | | $ | 9,424 | |
| Net interest | 1,014 | | 1,029 | | 1,218 | | 1,433 | |
| Net revenues | 10,286 | | 10,244 | | 10,032 | | 10,857 | |
| Total non-interest expenses | 7,331 | | 7,341 | | 7,322 | | 8,124 | |
Income from continuing operations before income taxes | 2,955 | | 2,903 | | 2,710 | | 2,733 | |
| Provision for income taxes | 487 | | 657 | | 492 | | 428 | |
| | | | |
| Net income | 2,468 | | 2,246 | | 2,218 | | 2,305 | |
Net income applicable to noncontrolling interests | 39 | | 45 | | 45 | | 66 | |
Net income applicable to Morgan Stanley | $ | 2,429 | | $ | 2,201 | | $ | 2,173 | | $ | 2,239 | |
| Preferred stock dividends and other | 93 | | 170 | | 113 | | 154 | |
Earnings applicable to Morgan Stanley common shareholders | $ | 2,336 | | $ | 2,031 | | $ | 2,060 | | $ | 2,085 | |
Earnings (loss) per common share4: |
| Basic | $ | 1.41 | | $ | 1.24 | | $ | 1.28 | | $ | 1.33 | |
| Diluted | $ | 1.39 | | $ | 1.23 | | $ | 1.27 | | $ | 1.30 | |
Dividends declared per common share | $ | 0.30 | | $ | 0.30 | | $ | 0.35 | | $ | 0.35 | |
| Book value per common share | $ | 42.83 | | $ | 44.13 | | $ | 45.49 | | $ | 45.82 | |
1.The fourth quarters of 2020 and 2019 included intermittent net discrete tax benefits of [$18 million] and $158 million, respectively, [primarily associated with remeasurement of reserves and related interest as a result of new information pertaining to the resolution of multi-jurisdiction tax examinations.]
2.Total non-interest revenues includes impairments of the Investment Management business segment’s interests in two distinct equity method investments in third-party asset managers of [$0 million] in 2020 and $41 million in 2019.
3.The fourth quarter of 2019 included specific severance-related costs of approximately $172 million, which are included in Compensation and benefits expenses in the Income statement. These costs were recorded in the business segments approximately as follows: Institutional Securities $124 million, Wealth Management $37 million and Investment Management $11 million.
4.The sum of the quarters’ earnings per common share may not equal the annual amounts due to the averaging effect of the number of shares and share equivalents throughout the year.
| | | | | | | | | | | | | | |
| 2020 Quarter |
| $ in millions, except per share data | First | Second | Third | Fourth1, 2 |
| Total non-interest revenues | $ | 8,131 | | $ | 11,814 | | $ | 10,171 | | $ | 11,769 | |
| Net interest | 1,356 | | 1,600 | | 1,486 | | 1,871 | |
| Net revenues | 9,487 | | 13,414 | | 11,657 | | 13,640 | |
| Total non-interest expenses | 7,341 | | 9,059 | | 8,170 | | 9,210 | |
Income from continuing operations before income taxes | 2,146 | | 4,355 | | 3,487 | | 4,430 | |
| Provision for income taxes | 366 | | 1,119 | | 736 | | 1,018 | |
| | | | |
| Net income | 1,780 | | 3,236 | | 2,751 | | 3,412 | |
Net income applicable to noncontrolling interests | 82 | | 40 | | 34 | | 27 | |
Net income applicable to Morgan Stanley | $ | 1,698 | | $ | 3,196 | | $ | 2,717 | | $ | 3,385 | |
Preferred stock dividends and other | 108 | | 149 | | 120 | | 119 | |
Earnings applicable to Morgan Stanley common shareholders | $ | 1,590 | | $ | 3,047 | | $ | 2,597 | | $ | 3,266 | |
Earnings (loss) per common share4: |
| Basic | $ | 1.02 | | $ | 1.98 | | $ | 1.68 | | $ | 1.84 | |
| Diluted | $ | 1.01 | | $ | 1.96 | | $ | 1.66 | | $ | 1.81 | |
Dividends declared per common share | $ | 0.35 | | $ | 0.35 | | $ | 0.35 | | $ | 0.35 | |
| Book value per common share | $ | 49.09 | | $ | 49.57 | | $ | 50.67 | | $ | 51.13 | |
| | | | | | | | | | | | | | |
| | 2019 Quarter |
| $ in millions, except per share data | First | Second | Third | Fourth1, 2,3 |
| Total non-interest revenues | $ | 9,272 | | $ | 9,215 | | $ | 8,814 | | $ | 9,424 | |
| Net interest | 1,014 | | 1,029 | | 1,218 | | 1,433 | |
| Net revenues | 10,286 | | 10,244 | | 10,032 | | 10,857 | |
| Total non-interest expenses | 7,331 | | 7,341 | | 7,322 | | 8,124 | |
Income from continuing operations before income taxes | 2,955 | | 2,903 | | 2,710 | | 2,733 | |
| Provision for income taxes | 487 | | 657 | | 492 | | 428 | |
| | | | |
| Net income | 2,468 | | 2,246 | | 2,218 | | 2,305 | |
Net income applicable to noncontrolling interests | 39 | | 45 | | 45 | | 66 | |
Net income applicable to Morgan Stanley | $ | 2,429 | | $ | 2,201 | | $ | 2,173 | | $ | 2,239 | |
| Preferred stock dividends and other | 93 | | 170 | | 113 | | 154 | |
Earnings applicable to Morgan Stanley common shareholders | $ | 2,336 | | $ | 2,031 | | $ | 2,060 | | $ | 2,085 | |
Earnings (loss) per common share4: |
| Basic | $ | 1.41 | | $ | 1.24 | | $ | 1.28 | | $ | 1.33 | |
| Diluted | $ | 1.39 | | $ | 1.23 | | $ | 1.27 | | $ | 1.30 | |
Dividends declared per common share | $ | 0.30 | | $ | 0.30 | | $ | 0.35 | | $ | 0.35 | |
| Book value per common share | $ | 42.83 | | $ | 44.13 | | $ | 45.49 | | $ | 45.82 | |
1.The fourth quarters of 2020 and 2019 included intermittent net discrete tax benefits of [$18 million] and $158 million, respectively, [primarily associated with remeasurement of reserves and related interest as a result of new information pertaining to the resolution of multi-jurisdiction tax examinations.]
2.Total non-interest revenues includes impairments of the Investment Management business segment’s interests in two distinct equity method investments in third-party asset managers of [$0 million] in 2020 and $41 million in 2019.
3.The fourth quarter of 2019 included specific severance-related costs of approximately $172 million, which are included in Compensation and benefits expenses in the Income statement. These costs were recorded in the business segments approximately as follows: Institutional Securities $124 million, Wealth Management $37 million and Investment Management $11 million.
4.The sum of the quarters’ earnings per common share may not equal the annual amounts due to the averaging effect of the number of shares and share equivalents throughout the year.
8,13111,81410,17111,7691,3561,6001,4861,8719,48713,41411,65713,6407,3419,0598,1709,2102,1464,3553,4874,4303661,1197361,0181,7803,2362,7513,412824034271,6983,1962,7173,3851081491201191,5903,0472,5973,2661.021.981.681.841.011.961.661.810.350.350.350.3549.0949.5750.6751.139,2729,2158,8149,4241,0141,0291,2181,43310,28610,24410,03210,8577,3317,3417,3228,1242,9552,9032,7102,7334876574924282,4682,2462,2182,305394545662,4292,2012,1732,239931701131542,3362,0312,0602,0851.411.241.281.331.391.231.271.300.300.300.350.3542.8344.1345.4945.8218158041172124371100008954212020-01-012020-12-310000895421us-gaap:CommonClassAMember2020-01-012020-12-310000895421us-gaap:SeriesAPreferredStockMember2020-01-012020-12-310000895421us-gaap:SeriesEPreferredStockMember2020-01-012020-12-310000895421us-gaap:SeriesFPreferredStockMember2020-01-012020-12-310000895421ms:SeriesIPreferredStockMember2020-01-012020-12-310000895421ms:SeriesKPreferredStockMember2020-01-012020-12-310000895421ms:SeriesLPreferredStockMember2020-01-012020-12-310000895421ms:GlobalMediumTermNotesSeriesAFixedRateStepUpSeniorNotesDue2026ofMorganStanleyFinanceLLCMember2020-01-012020-12-310000895421ms:MorganStanleyCushingMLPHighIncomeIndexETNsdueMarch212031Member2020-01-012020-12-31iso4217:USD00008954212020-06-30xbrli:shares00008954212021-01-2900008954212019-01-012019-12-3100008954212018-01-012018-12-31iso4217:USDxbrli:shares00008954212020-12-3100008954212019-12-310000895421us-gaap:PreferredStockMember2019-12-310000895421us-gaap:PreferredStockMember2018-12-310000895421us-gaap:PreferredStockMember2017-12-310000895421us-gaap:PreferredStockMember2020-01-012020-12-310000895421us-gaap:PreferredStockMember2019-01-012019-12-310000895421us-gaap:PreferredStockMember2018-01-012018-12-310000895421us-gaap:PreferredStockMember2020-12-310000895421us-gaap:CommonStockMember2020-12-310000895421us-gaap:CommonStockMember2019-12-310000895421us-gaap:CommonStockMember2018-12-310000895421us-gaap:AdditionalPaidInCapitalMember2019-12-310000895421us-gaap:AdditionalPaidInCapitalMember2018-12-310000895421us-gaap:AdditionalPaidInCapitalMember2017-12-310000895421us-gaap:AdditionalPaidInCapitalMember2020-01-012020-12-310000895421us-gaap:AdditionalPaidInCapitalMember2019-01-012019-12-310000895421us-gaap:AdditionalPaidInCapitalMember2018-01-012018-12-310000895421us-gaap:AdditionalPaidInCapitalMember2020-12-310000895421us-gaap:RetainedEarningsMember2019-12-310000895421us-gaap:RetainedEarningsMember2018-12-310000895421us-gaap:RetainedEarningsMember2017-12-310000895421us-gaap:RetainedEarningsMembersrt:CumulativeEffectPeriodOfAdoptionAdjustmentMember2019-12-310000895421us-gaap:RetainedEarningsMembersrt:CumulativeEffectPeriodOfAdoptionAdjustmentMember2018-12-310000895421us-gaap:RetainedEarningsMembersrt:CumulativeEffectPeriodOfAdoptionAdjustmentMember2017-12-310000895421us-gaap:RetainedEarningsMember2020-01-012020-12-310000895421us-gaap:RetainedEarningsMember2019-01-012019-12-310000895421us-gaap:RetainedEarningsMember2018-01-012018-12-310000895421us-gaap:RetainedEarningsMember2020-12-310000895421us-gaap:TrustForBenefitOfEmployeesMember2019-12-310000895421us-gaap:TrustForBenefitOfEmployeesMember2018-12-310000895421us-gaap:TrustForBenefitOfEmployeesMember2017-12-310000895421us-gaap:TrustForBenefitOfEmployeesMember2020-01-012020-12-310000895421us-gaap:TrustForBenefitOfEmployeesMember2019-01-012019-12-310000895421us-gaap:TrustForBenefitOfEmployeesMember2018-01-012018-12-310000895421us-gaap:TrustForBenefitOfEmployeesMember2020-12-310000895421us-gaap:AccumulatedOtherComprehensiveIncomeMember2019-12-310000895421us-gaap:AccumulatedOtherComprehensiveIncomeMember2018-12-310000895421us-gaap:AccumulatedOtherComprehensiveIncomeMember2017-12-310000895421srt:CumulativeEffectPeriodOfAdoptionAdjustmentMemberus-gaap:AccumulatedOtherComprehensiveIncomeMember2019-12-310000895421srt:CumulativeEffectPeriodOfAdoptionAdjustmentMemberus-gaap:AccumulatedOtherComprehensiveIncomeMember2018-12-310000895421srt:CumulativeEffectPeriodOfAdoptionAdjustmentMemberus-gaap:AccumulatedOtherComprehensiveIncomeMember2017-12-310000895421us-gaap:AccumulatedOtherComprehensiveIncomeMember2020-01-012020-12-310000895421us-gaap:AccumulatedOtherComprehensiveIncomeMember2019-01-012019-12-310000895421us-gaap:AccumulatedOtherComprehensiveIncomeMember2018-01-012018-12-310000895421us-gaap:AccumulatedOtherComprehensiveIncomeMember2020-12-310000895421us-gaap:TreasuryStockMember2019-12-310000895421us-gaap:TreasuryStockMember2018-12-310000895421us-gaap:TreasuryStockMember2017-12-310000895421us-gaap:TreasuryStockMember2020-01-012020-12-310000895421us-gaap:TreasuryStockMember2019-01-012019-12-310000895421us-gaap:TreasuryStockMember2018-01-012018-12-310000895421us-gaap:TreasuryStockMember2020-12-310000895421ms:CommonStockIssuedToEmployeeTrustMember2019-12-310000895421ms:CommonStockIssuedToEmployeeTrustMember2018-12-310000895421ms:CommonStockIssuedToEmployeeTrustMember2017-12-310000895421ms:CommonStockIssuedToEmployeeTrustMember2020-01-012020-12-310000895421ms:CommonStockIssuedToEmployeeTrustMember2019-01-012019-12-310000895421ms:CommonStockIssuedToEmployeeTrustMember2018-01-012018-12-310000895421ms:CommonStockIssuedToEmployeeTrustMember2020-12-310000895421us-gaap:NoncontrollingInterestMember2019-12-310000895421us-gaap:NoncontrollingInterestMember2018-12-310000895421us-gaap:NoncontrollingInterestMember2017-12-310000895421us-gaap:NoncontrollingInterestMember2020-01-012020-12-310000895421us-gaap:NoncontrollingInterestMember2019-01-012019-12-310000895421us-gaap:NoncontrollingInterestMember2018-01-012018-12-310000895421us-gaap:NoncontrollingInterestMember2020-12-3100008954212018-12-3100008954212017-12-31xbrli:pure0000895421srt:MinimumMember2020-01-012020-12-310000895421srt:MaximumMember2020-01-012020-12-310000895421us-gaap:BuildingMember2020-01-012020-12-310000895421ms:LeaseholdImprovementsBuildingMembersrt:MaximumMember2020-01-012020-12-310000895421srt:MaximumMemberms:LeaseholdImprovementsOtherAssetsMember2020-01-012020-12-310000895421us-gaap:FurnitureAndFixturesMember2020-01-012020-12-310000895421us-gaap:EquipmentMembersrt:MinimumMember2020-01-012020-12-310000895421srt:MaximumMemberus-gaap:EquipmentMember2020-01-012020-12-310000895421us-gaap:ElectricityGenerationPlantNonNuclearMembersrt:MinimumMember2020-01-012020-12-310000895421srt:MaximumMemberus-gaap:ElectricityGenerationPlantNonNuclearMember2020-01-012020-12-310000895421us-gaap:ComputerSoftwareIntangibleAssetMembersrt:MinimumMember2020-01-012020-12-310000895421srt:MaximumMemberus-gaap:ComputerSoftwareIntangibleAssetMember2020-01-012020-12-310000895421ms:AllowanceforCreditLossesMembersrt:CumulativeEffectPeriodOfAdoptionAdjustmentMemberus-gaap:AccountingStandardsUpdate201613Member2019-12-310000895421us-gaap:RetainedEarningsMembersrt:CumulativeEffectPeriodOfAdoptionAdjustmentMemberus-gaap:AccountingStandardsUpdate201613Member2019-12-310000895421srt:CumulativeEffectPeriodOfAdoptionAdjustmentMemberms:AllowanceforCreditLossesonEmployeeLoansMemberus-gaap:AccountingStandardsUpdate201613Member2019-12-310000895421us-gaap:RetainedEarningsMembersrt:CumulativeEffectPeriodOfAdoptionAdjustmentMemberus-gaap:AccountingStandardsUpdate201811Member2018-12-310000895421srt:CumulativeEffectPeriodOfAdoptionAdjustmentMember2019-01-0100008954212019-01-010000895421ms:ETRADEFinancialCorporationMember2020-10-020000895421ms:ETRADEFinancialCorporationMember2020-10-022020-10-020000895421us-gaap:CommonClassAMemberms:ETRADEFinancialCorporationMember2020-10-022020-10-020000895421ms:SeriesMPreferredStockandSeriesNPreferredStockMemberms:ETRADEFinancialCorporationMember2020-10-022020-10-020000895421ms:ETRADEFinancialCorporationMemberus-gaap:CustomerRelationshipsMember2020-10-020000895421ms:ETRADEFinancialCorporationMemberus-gaap:CustomerRelationshipsMember2020-10-022020-10-020000895421ms:ETRADEFinancialCorporationMember2020-10-022020-12-310000895421ms:ETRADEFinancialCorporationMember2020-01-012020-12-310000895421ms:ETRADEFinancialCorporationMember2019-01-012019-12-310000895421us-gaap:FairValueMeasurementsRecurringMemberus-gaap:USTreasuryAndGovernmentMemberus-gaap:FairValueInputsLevel1Member2020-12-310000895421us-gaap:FairValueInputsLevel2Memberus-gaap:FairValueMeasurementsRecurringMemberus-gaap:USTreasuryAndGovernmentMember2020-12-310000895421us-gaap:FairValueInputsLevel3Memberus-gaap:FairValueMeasurementsRecurringMemberus-gaap:USTreasuryAndGovernmentMember2020-12-310000895421us-gaap:FairValueMeasurementsRecurringMemberus-gaap:FairValueInputsLevel12And3Memberus-gaap:USTreasuryAndGovernmentMember2020-12-310000895421us-gaap:FairValueMeasurementsRecurringMemberus-gaap:FairValueInputsLevel1Memberus-gaap:ForeignGovernmentDebtSecuritiesMember2020-12-310000895421us-gaap:FairValueInputsLevel2Memberus-gaap:FairValueMeasurementsRecurringMemberus-gaap:ForeignGovernmentDebtSecuritiesMember2020-12-310000895421us-gaap:FairValueInputsLevel3Memberus-gaap:FairValueMeasurementsRecurringMemberus-gaap:ForeignGovernmentDebtSecuritiesMember2020-12-310000895421us-gaap:FairValueMeasurementsRecurringMemberus-gaap:FairValueInputsLevel12And3Memberus-gaap:ForeignGovernmentDebtSecuritiesMember2020-12-310000895421us-gaap:USStatesAndPoliticalSubdivisionsMemberus-gaap:FairValueMeasurementsRecurringMemberus-gaap:FairValueInputsLevel1Member2020-12-310000895421us-gaap:FairValueInputsLevel2Memberus-gaap:USStatesAndPoliticalSubdivisionsMemberus-gaap:FairValueMeasurementsRecurringMember2020-12-310000895421us-gaap:FairValueInputsLevel3Memberus-gaap:USStatesAndPoliticalSubdivisionsMemberus-gaap:FairValueMeasurementsRecurringMember2020-12-310000895421us-gaap:USStatesAndPoliticalSubdivisionsMemberus-gaap:FairValueMeasurementsRecurringMemberus-gaap:FairValueInputsLevel12And3Member2020-12-310000895421ms:MortgageAndAssetBackedSecuritiesMemberus-gaap:FairValueMeasurementsRecurringMemberus-gaap:FairValueInputsLevel1Member2020-12-310000895421ms:MortgageAndAssetBackedSecuritiesMemberus-gaap:FairValueInputsLevel2Memberus-gaap:FairValueMeasurementsRecurringMember2020-12-310000895421us-gaap:FairValueInputsLevel3Memberms:MortgageAndAssetBackedSecuritiesMemberus-gaap:FairValueMeasurementsRecurringMember2020-12-310000895421ms:MortgageAndAssetBackedSecuritiesMemberus-gaap:FairValueMeasurementsRecurringMemberus-gaap:FairValueInputsLevel12And3Member2020-12-310000895421us-gaap:SeniorDebtObligationsMemberus-gaap:FairValueMeasurementsRecurringMemberus-gaap:FairValueInputsLevel1Member2020-12-310000895421us-gaap:SeniorDebtObligationsMemberus-gaap:FairValueInputsLevel2Memberus-gaap:FairValueMeasurementsRecurringMember2020-12-310000895421us-gaap:SeniorDebtObligationsMemberus-gaap:FairValueInputsLevel3Memberus-gaap:FairValueMeasurementsRecurringMember2020-12-310000895421us-gaap:SeniorDebtObligationsMemberus-gaap:FairValueMeasurementsRecurringMemberus-gaap:FairValueInputsLevel12And3Member2020-12-310000895421ms:CorporateandOtherDebtSecuritiesMemberus-gaap:FairValueMeasurementsRecurringMemberus-gaap:FairValueInputsLevel1Member2020-12-310000895421us-gaap:FairValueInputsLevel2Memberms:CorporateandOtherDebtSecuritiesMemberus-gaap:FairValueMeasurementsRecurringMember2020-12-310000895421us-gaap:FairValueInputsLevel3Memberms:CorporateandOtherDebtSecuritiesMemberus-gaap:FairValueMeasurementsRecurringMember2020-12-310000895421ms:CorporateandOtherDebtSecuritiesMemberus-gaap:FairValueMeasurementsRecurringMemberus-gaap:FairValueInputsLevel12And3Member2020-12-310000895421us-gaap:FairValueMeasurementsRecurringMemberms:CorporateEquitiesMemberus-gaap:FairValueInputsLevel1Member2020-12-310000895421us-gaap:FairValueInputsLevel2Memberus-gaap:FairValueMeasurementsRecurringMemberms:CorporateEquitiesMember2020-12-310000895421us-gaap:FairValueInputsLevel3Memberus-gaap:FairValueMeasurementsRecurringMemberms:CorporateEquitiesMember2020-12-310000895421us-gaap:FairValueMeasurementsRecurringMemberms:CorporateEquitiesMemberus-gaap:FairValueInputsLevel12And3Member2020-12-310000895421us-gaap:FairValueMeasurementsRecurringMemberus-gaap:FairValueInputsLevel1Memberus-gaap:InterestRateContractMember2020-12-310000895421us-gaap:FairValueInputsLevel2Memberus-gaap:FairValueMeasurementsRecurringMemberus-gaap:InterestRateContractMember2020-12-310000895421us-gaap:FairValueInputsLevel3Memberus-gaap:FairValueMeasurementsRecurringMemberus-gaap:InterestRateContractMember2020-12-310000895421us-gaap:FairValueMeasurementsRecurringMemberus-gaap:FairValueInputsLevel12And3Memberus-gaap:InterestRateContractMember2020-12-310000895421us-gaap:CreditRiskContractMemberus-gaap:FairValueMeasurementsRecurringMemberus-gaap:FairValueInputsLevel1Member2020-12-310000895421us-gaap:FairValueInputsLevel2Memberus-gaap:CreditRiskContractMemberus-gaap:FairValueMeasurementsRecurringMember2020-12-310000895421us-gaap:FairValueInputsLevel3Memberus-gaap:CreditRiskContractMemberus-gaap:FairValueMeasurementsRecurringMember2020-12-310000895421us-gaap:CreditRiskContractMemberus-gaap:FairValueMeasurementsRecurringMemberus-gaap:FairValueInputsLevel12And3Member2020-12-310000895421us-gaap:FairValueMeasurementsRecurringMemberus-gaap:FairValueInputsLevel1Memberus-gaap:ForeignExchangeContractMember2020-12-310000895421us-gaap:FairValueInputsLevel2Memberus-gaap:FairValueMeasurementsRecurringMemberus-gaap:ForeignExchangeContractMember2020-12-310000895421us-gaap:FairValueInputsLevel3Memberus-gaap:FairValueMeasurementsRecurringMemberus-gaap:ForeignExchangeContractMember2020-12-310000895421us-gaap:FairValueMeasurementsRecurringMemberus-gaap:FairValueInputsLevel12And3Memberus-gaap:ForeignExchangeContractMember2020-12-310000895421us-gaap:FairValueMeasurementsRecurringMemberus-gaap:FairValueInputsLevel1Memberus-gaap:EquityContractMember2020-12-310000895421us-gaap:FairValueInputsLevel2Memberus-gaap:FairValueMeasurementsRecurringMemberus-gaap:EquityContractMember2020-12-310000895421us-gaap:FairValueInputsLevel3Memberus-gaap:FairValueMeasurementsRecurringMemberus-gaap:EquityContractMember2020-12-310000895421us-gaap:FairValueMeasurementsRecurringMemberus-gaap:FairValueInputsLevel12And3Memberus-gaap:EquityContractMember2020-12-310000895421ms:CommodityAndOtherContractsMemberus-gaap:FairValueMeasurementsRecurringMemberus-gaap:FairValueInputsLevel1Member2020-12-310000895421ms:CommodityAndOtherContractsMemberus-gaap:FairValueInputsLevel2Memberus-gaap:FairValueMeasurementsRecurringMember2020-12-310000895421ms:CommodityAndOtherContractsMemberus-gaap:FairValueInputsLevel3Memberus-gaap:FairValueMeasurementsRecurringMember2020-12-310000895421ms:CommodityAndOtherContractsMemberus-gaap:FairValueMeasurementsRecurringMemberus-gaap:FairValueInputsLevel12And3Member2020-12-310000895421us-gaap:FairValueMeasurementsRecurringMemberus-gaap:FairValueInputsLevel1Member2020-12-310000895421us-gaap:FairValueInputsLevel2Memberus-gaap:FairValueMeasurementsRecurringMember2020-12-310000895421us-gaap:FairValueInputsLevel3Memberus-gaap:FairValueMeasurementsRecurringMember2020-12-310000895421us-gaap:FairValueMeasurementsRecurringMember2020-12-310000895421us-gaap:FairValueMeasurementsRecurringMemberus-gaap:FairValueInputsLevel12And3Member2020-12-310000895421us-gaap:USTreasuryAndGovernmentMemberus-gaap:FairValueMeasurementsRecurringMemberus-gaap:FairValueInputsLevel1Member2020-12-310000895421us-gaap:USTreasuryAndGovernmentMemberus-gaap:FairValueInputsLevel2Memberus-gaap:FairValueMeasurementsRecurringMember2020-12-310000895421us-gaap:FairValueInputsLevel3Memberus-gaap:USTreasuryAndGovernmentMemberus-gaap:FairValueMeasurementsRecurringMember2020-12-310000895421us-gaap:USTreasuryAndGovernmentMemberus-gaap:FairValueMeasurementsRecurringMemberus-gaap:FairValueInputsLevel12And3Member2020-12-310000895421us-gaap:ForeignGovernmentDebtSecuritiesMemberus-gaap:FairValueMeasurementsRecurringMemberus-gaap:FairValueInputsLevel1Member2020-12-310000895421us-gaap:ForeignGovernmentDebtSecuritiesMemberus-gaap:FairValueInputsLevel2Memberus-gaap:FairValueMeasurementsRecurringMember2020-12-310000895421us-gaap:ForeignGovernmentDebtSecuritiesMemberus-gaap:FairValueInputsLevel3Memberus-gaap:FairValueMeasurementsRecurringMember2020-12-310000895421us-gaap:ForeignGovernmentDebtSecuritiesMemberus-gaap:FairValueMeasurementsRecurringMemberus-gaap:FairValueInputsLevel12And3Member2020-12-310000895421ms:CorporateandOtherDebtSecuritiesMemberus-gaap:FairValueMeasurementsRecurringMemberus-gaap:FairValueInputsLevel1Member2020-12-310000895421ms:CorporateandOtherDebtSecuritiesMemberus-gaap:FairValueInputsLevel2Memberus-gaap:FairValueMeasurementsRecurringMember2020-12-310000895421ms:CorporateandOtherDebtSecuritiesMemberus-gaap:FairValueInputsLevel3Memberus-gaap:FairValueMeasurementsRecurringMember2020-12-310000895421ms:CorporateandOtherDebtSecuritiesMemberus-gaap:FairValueMeasurementsRecurringMemberus-gaap:FairValueInputsLevel12And3Member2020-12-310000895421ms:CorporateEquitiesMemberus-gaap:FairValueMeasurementsRecurringMemberus-gaap:FairValueInputsLevel1Member2020-12-310000895421ms:CorporateEquitiesMemberus-gaap:FairValueInputsLevel2Memberus-gaap:FairValueMeasurementsRecurringMember2020-12-310000895421us-gaap:FairValueInputsLevel3Memberms:CorporateEquitiesMemberus-gaap:FairValueMeasurementsRecurringMember2020-12-310000895421ms:CorporateEquitiesMemberus-gaap:FairValueMeasurementsRecurringMemberus-gaap:FairValueInputsLevel12And3Member2020-12-310000895421us-gaap:FairValueMeasurementsRecurringMemberus-gaap:USTreasuryAndGovernmentMemberus-gaap:FairValueInputsLevel1Member2019-12-310000895421us-gaap:FairValueInputsLevel2Memberus-gaap:FairValueMeasurementsRecurringMemberus-gaap:USTreasuryAndGovernmentMember2019-12-310000895421us-gaap:FairValueInputsLevel3Memberus-gaap:FairValueMeasurementsRecurringMemberus-gaap:USTreasuryAndGovernmentMember2019-12-310000895421us-gaap:FairValueMeasurementsRecurringMemberus-gaap:FairValueInputsLevel12And3Memberus-gaap:USTreasuryAndGovernmentMember2019-12-310000895421us-gaap:FairValueMeasurementsRecurringMemberus-gaap:FairValueInputsLevel1Memberus-gaap:ForeignGovernmentDebtSecuritiesMember2019-12-310000895421us-gaap:FairValueInputsLevel2Memberus-gaap:FairValueMeasurementsRecurringMemberus-gaap:ForeignGovernmentDebtSecuritiesMember2019-12-310000895421us-gaap:FairValueInputsLevel3Memberus-gaap:FairValueMeasurementsRecurringMemberus-gaap:ForeignGovernmentDebtSecuritiesMember2019-12-310000895421us-gaap:FairValueMeasurementsRecurringMemberus-gaap:FairValueInputsLevel12And3Memberus-gaap:ForeignGovernmentDebtSecuritiesMember2019-12-310000895421us-gaap:USStatesAndPoliticalSubdivisionsMemberus-gaap:FairValueMeasurementsRecurringMemberus-gaap:FairValueInputsLevel1Member2019-12-310000895421us-gaap:FairValueInputsLevel2Memberus-gaap:USStatesAndPoliticalSubdivisionsMemberus-gaap:FairValueMeasurementsRecurringMember2019-12-310000895421us-gaap:FairValueInputsLevel3Memberus-gaap:USStatesAndPoliticalSubdivisionsMemberus-gaap:FairValueMeasurementsRecurringMember2019-12-310000895421us-gaap:USStatesAndPoliticalSubdivisionsMemberus-gaap:FairValueMeasurementsRecurringMemberus-gaap:FairValueInputsLevel12And3Member2019-12-310000895421ms:MortgageAndAssetBackedSecuritiesMemberus-gaap:FairValueMeasurementsRecurringMemberus-gaap:FairValueInputsLevel1Member2019-12-310000895421ms:MortgageAndAssetBackedSecuritiesMemberus-gaap:FairValueInputsLevel2Memberus-gaap:FairValueMeasurementsRecurringMember2019-12-310000895421us-gaap:FairValueInputsLevel3Memberms:MortgageAndAssetBackedSecuritiesMemberus-gaap:FairValueMeasurementsRecurringMember2019-12-310000895421ms:MortgageAndAssetBackedSecuritiesMemberus-gaap:FairValueMeasurementsRecurringMemberus-gaap:FairValueInputsLevel12And3Member2019-12-310000895421us-gaap:SeniorDebtObligationsMemberus-gaap:FairValueMeasurementsRecurringMemberus-gaap:FairValueInputsLevel1Member2019-12-310000895421us-gaap:SeniorDebtObligationsMemberus-gaap:FairValueInputsLevel2Memberus-gaap:FairValueMeasurementsRecurringMember2019-12-310000895421us-gaap:SeniorDebtObligationsMemberus-gaap:FairValueInputsLevel3Memberus-gaap:FairValueMeasurementsRecurringMember2019-12-310000895421us-gaap:SeniorDebtObligationsMemberus-gaap:FairValueMeasurementsRecurringMemberus-gaap:FairValueInputsLevel12And3Member2019-12-310000895421ms:CorporateandOtherDebtSecuritiesMemberus-gaap:FairValueMeasurementsRecurringMemberus-gaap:FairValueInputsLevel1Member2019-12-310000895421us-gaap:FairValueInputsLevel2Memberms:CorporateandOtherDebtSecuritiesMemberus-gaap:FairValueMeasurementsRecurringMember2019-12-310000895421us-gaap:FairValueInputsLevel3Memberms:CorporateandOtherDebtSecuritiesMemberus-gaap:FairValueMeasurementsRecurringMember2019-12-310000895421ms:CorporateandOtherDebtSecuritiesMemberus-gaap:FairValueMeasurementsRecurringMemberus-gaap:FairValueInputsLevel12And3Member2019-12-310000895421us-gaap:FairValueMeasurementsRecurringMemberms:CorporateEquitiesMemberus-gaap:FairValueInputsLevel1Member2019-12-310000895421us-gaap:FairValueInputsLevel2Memberus-gaap:FairValueMeasurementsRecurringMemberms:CorporateEquitiesMember2019-12-310000895421us-gaap:FairValueInputsLevel3Memberus-gaap:FairValueMeasurementsRecurringMemberms:CorporateEquitiesMember2019-12-310000895421us-gaap:FairValueMeasurementsRecurringMemberms:CorporateEquitiesMemberus-gaap:FairValueInputsLevel12And3Member2019-12-310000895421us-gaap:FairValueMeasurementsRecurringMemberus-gaap:FairValueInputsLevel1Memberus-gaap:InterestRateContractMember2019-12-310000895421us-gaap:FairValueInputsLevel2Memberus-gaap:FairValueMeasurementsRecurringMemberus-gaap:InterestRateContractMember2019-12-310000895421us-gaap:FairValueInputsLevel3Memberus-gaap:FairValueMeasurementsRecurringMemberus-gaap:InterestRateContractMember2019-12-310000895421us-gaap:FairValueMeasurementsRecurringMemberus-gaap:FairValueInputsLevel12And3Memberus-gaap:InterestRateContractMember2019-12-310000895421us-gaap:CreditRiskContractMemberus-gaap:FairValueMeasurementsRecurringMemberus-gaap:FairValueInputsLevel1Member2019-12-310000895421us-gaap:FairValueInputsLevel2Memberus-gaap:CreditRiskContractMemberus-gaap:FairValueMeasurementsRecurringMember2019-12-310000895421us-gaap:FairValueInputsLevel3Memberus-gaap:CreditRiskContractMemberus-gaap:FairValueMeasurementsRecurringMember2019-12-310000895421us-gaap:CreditRiskContractMemberus-gaap:FairValueMeasurementsRecurringMemberus-gaap:FairValueInputsLevel12And3Member2019-12-310000895421us-gaap:FairValueMeasurementsRecurringMemberus-gaap:FairValueInputsLevel1Memberus-gaap:ForeignExchangeContractMember2019-12-310000895421us-gaap:FairValueInputsLevel2Memberus-gaap:FairValueMeasurementsRecurringMemberus-gaap:ForeignExchangeContractMember2019-12-310000895421us-gaap:FairValueInputsLevel3Memberus-gaap:FairValueMeasurementsRecurringMemberus-gaap:ForeignExchangeContractMember2019-12-310000895421us-gaap:FairValueMeasurementsRecurringMemberus-gaap:FairValueInputsLevel12And3Memberus-gaap:ForeignExchangeContractMember2019-12-310000895421us-gaap:FairValueMeasurementsRecurringMemberus-gaap:FairValueInputsLevel1Memberus-gaap:EquityContractMember2019-12-310000895421us-gaap:FairValueInputsLevel2Memberus-gaap:FairValueMeasurementsRecurringMemberus-gaap:EquityContractMember2019-12-310000895421us-gaap:FairValueInputsLevel3Memberus-gaap:FairValueMeasurementsRecurringMemberus-gaap:EquityContractMember2019-12-310000895421us-gaap:FairValueMeasurementsRecurringMemberus-gaap:FairValueInputsLevel12And3Memberus-gaap:EquityContractMember2019-12-310000895421ms:CommodityAndOtherContractsMemberus-gaap:FairValueMeasurementsRecurringMemberus-gaap:FairValueInputsLevel1Member2019-12-310000895421ms:CommodityAndOtherContractsMemberus-gaap:FairValueInputsLevel2Memberus-gaap:FairValueMeasurementsRecurringMember2019-12-310000895421ms:CommodityAndOtherContractsMemberus-gaap:FairValueInputsLevel3Memberus-gaap:FairValueMeasurementsRecurringMember2019-12-310000895421ms:CommodityAndOtherContractsMemberus-gaap:FairValueMeasurementsRecurringMemberus-gaap:FairValueInputsLevel12And3Member2019-12-310000895421us-gaap:FairValueMeasurementsRecurringMemberus-gaap:FairValueInputsLevel1Member2019-12-310000895421us-gaap:FairValueInputsLevel2Memberus-gaap:FairValueMeasurementsRecurringMember2019-12-310000895421us-gaap:FairValueInputsLevel3Memberus-gaap:FairValueMeasurementsRecurringMember2019-12-310000895421us-gaap:FairValueMeasurementsRecurringMember2019-12-310000895421us-gaap:FairValueMeasurementsRecurringMemberus-gaap:FairValueInputsLevel12And3Member2019-12-310000895421us-gaap:USTreasuryAndGovernmentMemberus-gaap:FairValueMeasurementsRecurringMemberus-gaap:FairValueInputsLevel1Member2019-12-310000895421us-gaap:USTreasuryAndGovernmentMemberus-gaap:FairValueInputsLevel2Memberus-gaap:FairValueMeasurementsRecurringMember2019-12-310000895421us-gaap:FairValueInputsLevel3Memberus-gaap:USTreasuryAndGovernmentMemberus-gaap:FairValueMeasurementsRecurringMember2019-12-310000895421us-gaap:USTreasuryAndGovernmentMemberus-gaap:FairValueMeasurementsRecurringMemberus-gaap:FairValueInputsLevel12And3Member2019-12-310000895421us-gaap:ForeignGovernmentDebtSecuritiesMemberus-gaap:FairValueMeasurementsRecurringMemberus-gaap:FairValueInputsLevel1Member2019-12-310000895421us-gaap:ForeignGovernmentDebtSecuritiesMemberus-gaap:FairValueInputsLevel2Memberus-gaap:FairValueMeasurementsRecurringMember2019-12-310000895421us-gaap:ForeignGovernmentDebtSecuritiesMemberus-gaap:FairValueInputsLevel3Memberus-gaap:FairValueMeasurementsRecurringMember2019-12-310000895421us-gaap:ForeignGovernmentDebtSecuritiesMemberus-gaap:FairValueMeasurementsRecurringMemberus-gaap:FairValueInputsLevel12And3Member2019-12-310000895421ms:CorporateandOtherDebtSecuritiesMemberus-gaap:FairValueMeasurementsRecurringMemberus-gaap:FairValueInputsLevel1Member2019-12-310000895421ms:CorporateandOtherDebtSecuritiesMemberus-gaap:FairValueInputsLevel2Memberus-gaap:FairValueMeasurementsRecurringMember2019-12-310000895421ms:CorporateandOtherDebtSecuritiesMemberus-gaap:FairValueInputsLevel3Memberus-gaap:FairValueMeasurementsRecurringMember2019-12-310000895421ms:CorporateandOtherDebtSecuritiesMemberus-gaap:FairValueMeasurementsRecurringMemberus-gaap:FairValueInputsLevel12And3Member2019-12-310000895421ms:CorporateEquitiesMemberus-gaap:FairValueMeasurementsRecurringMemberus-gaap:FairValueInputsLevel1Member2019-12-310000895421ms:CorporateEquitiesMemberus-gaap:FairValueInputsLevel2Memberus-gaap:FairValueMeasurementsRecurringMember2019-12-310000895421us-gaap:FairValueInputsLevel3Memberms:CorporateEquitiesMemberus-gaap:FairValueMeasurementsRecurringMember2019-12-310000895421ms:CorporateEquitiesMemberus-gaap:FairValueMeasurementsRecurringMemberus-gaap:FairValueInputsLevel12And3Member2019-12-310000895421us-gaap:SeniorDebtObligationsMemberus-gaap:FairValueMeasurementsRecurringMemberus-gaap:CommercialPortfolioSegmentMember2020-12-310000895421us-gaap:SeniorDebtObligationsMemberus-gaap:FairValueMeasurementsRecurringMemberus-gaap:CommercialPortfolioSegmentMember2019-12-310000895421us-gaap:SeniorDebtObligationsMemberus-gaap:FairValueMeasurementsRecurringMemberms:SecuredLendingFacilitiesMember2020-12-310000895421us-gaap:SeniorDebtObligationsMemberus-gaap:FairValueMeasurementsRecurringMemberms:SecuredLendingFacilitiesMember2019-12-310000895421us-gaap:SeniorDebtObligationsMemberus-gaap:FairValueMeasurementsRecurringMemberus-gaap:CommercialRealEstatePortfolioSegmentMember2020-12-310000895421us-gaap:SeniorDebtObligationsMemberus-gaap:FairValueMeasurementsRecurringMemberus-gaap:CommercialRealEstatePortfolioSegmentMember2019-12-310000895421us-gaap:SeniorDebtObligationsMemberus-gaap:ResidentialPortfolioSegmentMemberus-gaap:FairValueMeasurementsRecurringMember2020-12-310000895421us-gaap:SeniorDebtObligationsMemberus-gaap:ResidentialPortfolioSegmentMemberus-gaap:FairValueMeasurementsRecurringMember2019-12-310000895421ms:SecuritiesBasedLendingandOtherLoansMemberus-gaap:SeniorDebtObligationsMemberus-gaap:FairValueMeasurementsRecurringMember2020-12-310000895421ms:SecuritiesBasedLendingandOtherLoansMemberus-gaap:SeniorDebtObligationsMemberus-gaap:FairValueMeasurementsRecurringMember2019-12-310000895421us-gaap:SeniorDebtObligationsMemberus-gaap:FairValueMeasurementsRecurringMember2020-12-310000895421us-gaap:SeniorDebtObligationsMemberus-gaap:FairValueMeasurementsRecurringMember2019-12-310000895421ms:AccountsReceivableAndOtherReceivablesNetMemberus-gaap:FutureMemberus-gaap:FairValueMeasurementsRecurringMember2020-12-310000895421ms:AccountsReceivableAndOtherReceivablesNetMemberus-gaap:FutureMemberus-gaap:FairValueMeasurementsRecurringMember2019-12-310000895421us-gaap:FairValueInputsLevel3Memberus-gaap:FairValueMeasurementsRecurringMemberus-gaap:USTreasuryAndGovernmentMember2018-12-310000895421us-gaap:FairValueInputsLevel3Memberus-gaap:FairValueMeasurementsRecurringMemberus-gaap:USTreasuryAndGovernmentMember2017-12-310000895421us-gaap:FairValueInputsLevel3Memberus-gaap:FairValueMeasurementsRecurringMemberus-gaap:USTreasuryAndGovernmentMember2020-01-012020-12-310000895421us-gaap:FairValueInputsLevel3Memberus-gaap:FairValueMeasurementsRecurringMemberus-gaap:USTreasuryAndGovernmentMember2019-01-012019-12-310000895421us-gaap:FairValueInputsLevel3Memberus-gaap:FairValueMeasurementsRecurringMemberus-gaap:USTreasuryAndGovernmentMember2018-01-012018-12-310000895421us-gaap:FairValueInputsLevel3Memberus-gaap:FairValueMeasurementsRecurringMemberus-gaap:ForeignGovernmentDebtSecuritiesMember2018-12-310000895421us-gaap:FairValueInputsLevel3Memberus-gaap:FairValueMeasurementsRecurringMemberus-gaap:ForeignGovernmentDebtSecuritiesMember2017-12-310000895421us-gaap:FairValueInputsLevel3Memberus-gaap:FairValueMeasurementsRecurringMemberus-gaap:ForeignGovernmentDebtSecuritiesMember2020-01-012020-12-310000895421us-gaap:FairValueInputsLevel3Memberus-gaap:FairValueMeasurementsRecurringMemberus-gaap:ForeignGovernmentDebtSecuritiesMember2019-01-012019-12-310000895421us-gaap:FairValueInputsLevel3Memberus-gaap:FairValueMeasurementsRecurringMemberus-gaap:ForeignGovernmentDebtSecuritiesMember2018-01-012018-12-310000895421us-gaap:FairValueInputsLevel3Memberus-gaap:USStatesAndPoliticalSubdivisionsMemberus-gaap:FairValueMeasurementsRecurringMember2018-12-310000895421us-gaap:FairValueInputsLevel3Memberus-gaap:USStatesAndPoliticalSubdivisionsMemberus-gaap:FairValueMeasurementsRecurringMember2017-12-310000895421us-gaap:FairValueInputsLevel3Memberus-gaap:USStatesAndPoliticalSubdivisionsMemberus-gaap:FairValueMeasurementsRecurringMember2020-01-012020-12-310000895421us-gaap:FairValueInputsLevel3Memberus-gaap:USStatesAndPoliticalSubdivisionsMemberus-gaap:FairValueMeasurementsRecurringMember2019-01-012019-12-310000895421us-gaap:FairValueInputsLevel3Memberus-gaap:USStatesAndPoliticalSubdivisionsMemberus-gaap:FairValueMeasurementsRecurringMember2018-01-012018-12-310000895421us-gaap:FairValueInputsLevel3Memberms:MortgageAndAssetBackedSecuritiesMemberus-gaap:FairValueMeasurementsRecurringMember2018-12-310000895421us-gaap:FairValueInputsLevel3Memberms:MortgageAndAssetBackedSecuritiesMemberus-gaap:FairValueMeasurementsRecurringMember2017-12-310000895421us-gaap:FairValueInputsLevel3Memberms:MortgageAndAssetBackedSecuritiesMemberus-gaap:FairValueMeasurementsRecurringMember2020-01-012020-12-310000895421us-gaap:FairValueInputsLevel3Memberms:MortgageAndAssetBackedSecuritiesMemberus-gaap:FairValueMeasurementsRecurringMember2019-01-012019-12-310000895421us-gaap:FairValueInputsLevel3Memberms:MortgageAndAssetBackedSecuritiesMemberus-gaap:FairValueMeasurementsRecurringMember2018-01-012018-12-310000895421us-gaap:SeniorDebtObligationsMemberus-gaap:FairValueInputsLevel3Memberus-gaap:FairValueMeasurementsRecurringMember2018-12-310000895421us-gaap:SeniorDebtObligationsMemberus-gaap:FairValueInputsLevel3Memberus-gaap:FairValueMeasurementsRecurringMember2017-12-310000895421us-gaap:SeniorDebtObligationsMemberus-gaap:FairValueInputsLevel3Memberus-gaap:FairValueMeasurementsRecurringMember2020-01-012020-12-310000895421us-gaap:SeniorDebtObligationsMemberus-gaap:FairValueInputsLevel3Memberus-gaap:FairValueMeasurementsRecurringMember2019-01-012019-12-310000895421us-gaap:SeniorDebtObligationsMemberus-gaap:FairValueInputsLevel3Memberus-gaap:FairValueMeasurementsRecurringMember2018-01-012018-12-310000895421us-gaap:FairValueInputsLevel3Memberms:CorporateandOtherDebtSecuritiesMemberus-gaap:FairValueMeasurementsRecurringMember2018-12-310000895421us-gaap:FairValueInputsLevel3Memberms:CorporateandOtherDebtSecuritiesMemberus-gaap:FairValueMeasurementsRecurringMember2017-12-310000895421us-gaap:FairValueInputsLevel3Memberms:CorporateandOtherDebtSecuritiesMemberus-gaap:FairValueMeasurementsRecurringMember2020-01-012020-12-310000895421us-gaap:FairValueInputsLevel3Memberms:CorporateandOtherDebtSecuritiesMemberus-gaap:FairValueMeasurementsRecurringMember2019-01-012019-12-310000895421us-gaap:FairValueInputsLevel3Memberms:CorporateandOtherDebtSecuritiesMemberus-gaap:FairValueMeasurementsRecurringMember2018-01-012018-12-310000895421us-gaap:FairValueInputsLevel3Memberus-gaap:FairValueMeasurementsRecurringMemberms:CorporateEquitiesMember2018-12-310000895421us-gaap:FairValueInputsLevel3Memberus-gaap:FairValueMeasurementsRecurringMemberms:CorporateEquitiesMember2017-12-310000895421us-gaap:FairValueInputsLevel3Memberus-gaap:FairValueMeasurementsRecurringMemberms:CorporateEquitiesMember2020-01-012020-12-310000895421us-gaap:FairValueInputsLevel3Memberus-gaap:FairValueMeasurementsRecurringMemberms:CorporateEquitiesMember2019-01-012019-12-310000895421us-gaap:FairValueInputsLevel3Memberus-gaap:FairValueMeasurementsRecurringMemberms:CorporateEquitiesMember2018-01-012018-12-310000895421us-gaap:InvestmentsMemberus-gaap:FairValueInputsLevel3Memberus-gaap:FairValueMeasurementsRecurringMember2019-12-310000895421us-gaap:InvestmentsMemberus-gaap:FairValueInputsLevel3Memberus-gaap:FairValueMeasurementsRecurringMember2018-12-310000895421us-gaap:InvestmentsMemberus-gaap:FairValueInputsLevel3Memberus-gaap:FairValueMeasurementsRecurringMember2017-12-310000895421us-gaap:InvestmentsMemberus-gaap:FairValueInputsLevel3Memberus-gaap:FairValueMeasurementsRecurringMember2020-01-012020-12-310000895421us-gaap:InvestmentsMemberus-gaap:FairValueInputsLevel3Memberus-gaap:FairValueMeasurementsRecurringMember2019-01-012019-12-310000895421us-gaap:InvestmentsMemberus-gaap:FairValueInputsLevel3Memberus-gaap:FairValueMeasurementsRecurringMember2018-01-012018-12-310000895421us-gaap:InvestmentsMemberus-gaap:FairValueInputsLevel3Memberus-gaap:FairValueMeasurementsRecurringMember2020-12-310000895421us-gaap:AvailableforsaleSecuritiesMemberus-gaap:FairValueInputsLevel3Memberus-gaap:FairValueMeasurementsRecurringMember2019-12-310000895421us-gaap:AvailableforsaleSecuritiesMemberus-gaap:FairValueInputsLevel3Memberus-gaap:FairValueMeasurementsRecurringMember2018-12-310000895421us-gaap:AvailableforsaleSecuritiesMemberus-gaap:FairValueInputsLevel3Memberus-gaap:FairValueMeasurementsRecurringMember2017-12-310000895421us-gaap:AvailableforsaleSecuritiesMemberus-gaap:FairValueInputsLevel3Memberus-gaap:FairValueMeasurementsRecurringMember2020-01-012020-12-310000895421us-gaap:AvailableforsaleSecuritiesMemberus-gaap:FairValueInputsLevel3Memberus-gaap:FairValueMeasurementsRecurringMember2019-01-012019-12-310000895421us-gaap:AvailableforsaleSecuritiesMemberus-gaap:FairValueInputsLevel3Memberus-gaap:FairValueMeasurementsRecurringMember2018-01-012018-12-310000895421us-gaap:AvailableforsaleSecuritiesMemberus-gaap:FairValueInputsLevel3Memberus-gaap:FairValueMeasurementsRecurringMember2020-12-310000895421us-gaap:FairValueInputsLevel3Memberus-gaap:FairValueMeasurementsRecurringMemberus-gaap:FederalFundsSoldAndSecuritiesBorrowedOrPurchasedUnderAgreementsToResellMember2019-12-310000895421us-gaap:FairValueInputsLevel3Memberus-gaap:FairValueMeasurementsRecurringMemberus-gaap:FederalFundsSoldAndSecuritiesBorrowedOrPurchasedUnderAgreementsToResellMember2018-12-310000895421us-gaap:FairValueInputsLevel3Memberus-gaap:FairValueMeasurementsRecurringMemberus-gaap:FederalFundsSoldAndSecuritiesBorrowedOrPurchasedUnderAgreementsToResellMember2017-12-310000895421us-gaap:FairValueInputsLevel3Memberus-gaap:FairValueMeasurementsRecurringMemberus-gaap:FederalFundsSoldAndSecuritiesBorrowedOrPurchasedUnderAgreementsToResellMember2020-01-012020-12-310000895421us-gaap:FairValueInputsLevel3Memberus-gaap:FairValueMeasurementsRecurringMemberus-gaap:FederalFundsSoldAndSecuritiesBorrowedOrPurchasedUnderAgreementsToResellMember2019-01-012019-12-310000895421us-gaap:FairValueInputsLevel3Memberus-gaap:FairValueMeasurementsRecurringMemberus-gaap:FederalFundsSoldAndSecuritiesBorrowedOrPurchasedUnderAgreementsToResellMember2018-01-012018-12-310000895421us-gaap:FairValueInputsLevel3Memberus-gaap:FairValueMeasurementsRecurringMemberus-gaap:FederalFundsSoldAndSecuritiesBorrowedOrPurchasedUnderAgreementsToResellMember2020-12-310000895421us-gaap:FairValueInputsLevel3Memberus-gaap:FairValueMeasurementsRecurringMemberus-gaap:InterestRateContractMember2018-12-310000895421us-gaap:FairValueInputsLevel3Memberus-gaap:FairValueMeasurementsRecurringMemberus-gaap:InterestRateContractMember2017-12-310000895421us-gaap:FairValueInputsLevel3Memberus-gaap:FairValueMeasurementsRecurringMemberus-gaap:InterestRateContractMember2020-01-012020-12-310000895421us-gaap:FairValueInputsLevel3Memberus-gaap:FairValueMeasurementsRecurringMemberus-gaap:InterestRateContractMember2019-01-012019-12-310000895421us-gaap:FairValueInputsLevel3Memberus-gaap:FairValueMeasurementsRecurringMemberus-gaap:InterestRateContractMember2018-01-012018-12-310000895421us-gaap:FairValueInputsLevel3Memberus-gaap:CreditRiskContractMemberus-gaap:FairValueMeasurementsRecurringMember2018-12-310000895421us-gaap:FairValueInputsLevel3Memberus-gaap:CreditRiskContractMemberus-gaap:FairValueMeasurementsRecurringMember2017-12-310000895421us-gaap:FairValueInputsLevel3Memberus-gaap:CreditRiskContractMemberus-gaap:FairValueMeasurementsRecurringMember2020-01-012020-12-310000895421us-gaap:FairValueInputsLevel3Memberus-gaap:CreditRiskContractMemberus-gaap:FairValueMeasurementsRecurringMember2019-01-012019-12-310000895421us-gaap:FairValueInputsLevel3Memberus-gaap:CreditRiskContractMemberus-gaap:FairValueMeasurementsRecurringMember2018-01-012018-12-310000895421us-gaap:FairValueInputsLevel3Memberus-gaap:FairValueMeasurementsRecurringMemberus-gaap:ForeignExchangeContractMember2018-12-310000895421us-gaap:FairValueInputsLevel3Memberus-gaap:FairValueMeasurementsRecurringMemberus-gaap:ForeignExchangeContractMember2017-12-310000895421us-gaap:FairValueInputsLevel3Memberus-gaap:FairValueMeasurementsRecurringMemberus-gaap:ForeignExchangeContractMember2020-01-012020-12-310000895421us-gaap:FairValueInputsLevel3Memberus-gaap:FairValueMeasurementsRecurringMemberus-gaap:ForeignExchangeContractMember2019-01-012019-12-310000895421us-gaap:FairValueInputsLevel3Memberus-gaap:FairValueMeasurementsRecurringMemberus-gaap:ForeignExchangeContractMember2018-01-012018-12-310000895421us-gaap:FairValueInputsLevel3Memberus-gaap:FairValueMeasurementsRecurringMemberus-gaap:EquityContractMember2018-12-310000895421us-gaap:FairValueInputsLevel3Memberus-gaap:FairValueMeasurementsRecurringMemberus-gaap:EquityContractMember2017-12-310000895421us-gaap:FairValueInputsLevel3Memberus-gaap:FairValueMeasurementsRecurringMemberus-gaap:EquityContractMember2020-01-012020-12-310000895421us-gaap:FairValueInputsLevel3Memberus-gaap:FairValueMeasurementsRecurringMemberus-gaap:EquityContractMember2019-01-012019-12-310000895421us-gaap:FairValueInputsLevel3Memberus-gaap:FairValueMeasurementsRecurringMemberus-gaap:EquityContractMember2018-01-012018-12-310000895421ms:CommodityAndOtherContractsMemberus-gaap:FairValueInputsLevel3Memberus-gaap:FairValueMeasurementsRecurringMember2018-12-310000895421ms:CommodityAndOtherContractsMemberus-gaap:FairValueInputsLevel3Memberus-gaap:FairValueMeasurementsRecurringMember2017-12-310000895421ms:CommodityAndOtherContractsMemberus-gaap:FairValueInputsLevel3Memberus-gaap:FairValueMeasurementsRecurringMember2020-01-012020-12-310000895421ms:CommodityAndOtherContractsMemberus-gaap:FairValueInputsLevel3Memberus-gaap:FairValueMeasurementsRecurringMember2019-01-012019-12-310000895421ms:CommodityAndOtherContractsMemberus-gaap:FairValueInputsLevel3Memberus-gaap:FairValueMeasurementsRecurringMember2018-01-012018-12-310000895421us-gaap:DepositsMemberus-gaap:FairValueInputsLevel3Memberus-gaap:FairValueMeasurementsRecurringMember2019-12-310000895421us-gaap:DepositsMemberus-gaap:FairValueInputsLevel3Memberus-gaap:FairValueMeasurementsRecurringMember2018-12-310000895421us-gaap:DepositsMemberus-gaap:FairValueInputsLevel3Memberus-gaap:FairValueMeasurementsRecurringMember2017-12-310000895421us-gaap:DepositsMemberus-gaap:FairValueInputsLevel3Memberus-gaap:FairValueMeasurementsRecurringMember2020-01-012020-12-310000895421us-gaap:DepositsMemberus-gaap:FairValueInputsLevel3Memberus-gaap:FairValueMeasurementsRecurringMember2019-01-012019-12-310000895421us-gaap:DepositsMemberus-gaap:FairValueInputsLevel3Memberus-gaap:FairValueMeasurementsRecurringMember2018-01-012018-12-310000895421us-gaap:DepositsMemberus-gaap:FairValueInputsLevel3Memberus-gaap:FairValueMeasurementsRecurringMember2020-12-310000895421ms:NonderivativeTradingLiabilitiesMemberus-gaap:FairValueInputsLevel3Memberus-gaap:FairValueMeasurementsRecurringMember2019-12-310000895421ms:NonderivativeTradingLiabilitiesMemberus-gaap:FairValueInputsLevel3Memberus-gaap:FairValueMeasurementsRecurringMember2018-12-310000895421ms:NonderivativeTradingLiabilitiesMemberus-gaap:FairValueInputsLevel3Memberus-gaap:FairValueMeasurementsRecurringMember2017-12-310000895421ms:NonderivativeTradingLiabilitiesMemberus-gaap:FairValueInputsLevel3Memberus-gaap:FairValueMeasurementsRecurringMember2020-01-012020-12-310000895421ms:NonderivativeTradingLiabilitiesMemberus-gaap:FairValueInputsLevel3Memberus-gaap:FairValueMeasurementsRecurringMember2019-01-012019-12-310000895421ms:NonderivativeTradingLiabilitiesMemberus-gaap:FairValueInputsLevel3Memberus-gaap:FairValueMeasurementsRecurringMember2018-01-012018-12-310000895421ms:NonderivativeTradingLiabilitiesMemberus-gaap:FairValueInputsLevel3Memberus-gaap:FairValueMeasurementsRecurringMember2020-12-310000895421us-gaap:FairValueInputsLevel3Memberus-gaap:SecuritiesLoanedOrSoldUnderAgreementsToRepurchaseMemberus-gaap:FairValueMeasurementsRecurringMember2019-12-310000895421us-gaap:FairValueInputsLevel3Memberus-gaap:SecuritiesLoanedOrSoldUnderAgreementsToRepurchaseMemberus-gaap:FairValueMeasurementsRecurringMember2018-12-310000895421us-gaap:FairValueInputsLevel3Memberus-gaap:SecuritiesLoanedOrSoldUnderAgreementsToRepurchaseMemberus-gaap:FairValueMeasurementsRecurringMember2017-12-310000895421us-gaap:FairValueInputsLevel3Memberus-gaap:SecuritiesLoanedOrSoldUnderAgreementsToRepurchaseMemberus-gaap:FairValueMeasurementsRecurringMember2020-01-012020-12-310000895421us-gaap:FairValueInputsLevel3Memberus-gaap:SecuritiesLoanedOrSoldUnderAgreementsToRepurchaseMemberus-gaap:FairValueMeasurementsRecurringMember2019-01-012019-12-310000895421us-gaap:FairValueInputsLevel3Memberus-gaap:SecuritiesLoanedOrSoldUnderAgreementsToRepurchaseMemberus-gaap:FairValueMeasurementsRecurringMember2018-01-012018-12-310000895421us-gaap:FairValueInputsLevel3Memberus-gaap:SecuritiesLoanedOrSoldUnderAgreementsToRepurchaseMemberus-gaap:FairValueMeasurementsRecurringMember2020-12-310000895421ms:OtherSecuredFinancingsMemberus-gaap:FairValueInputsLevel3Memberus-gaap:FairValueMeasurementsRecurringMember2019-12-310000895421ms:OtherSecuredFinancingsMemberus-gaap:FairValueInputsLevel3Memberus-gaap:FairValueMeasurementsRecurringMember2018-12-310000895421ms:OtherSecuredFinancingsMemberus-gaap:FairValueInputsLevel3Memberus-gaap:FairValueMeasurementsRecurringMember2017-12-310000895421ms:OtherSecuredFinancingsMemberus-gaap:FairValueInputsLevel3Memberus-gaap:FairValueMeasurementsRecurringMember2020-01-012020-12-310000895421ms:OtherSecuredFinancingsMemberus-gaap:FairValueInputsLevel3Memberus-gaap:FairValueMeasurementsRecurringMember2019-01-012019-12-310000895421ms:OtherSecuredFinancingsMemberus-gaap:FairValueInputsLevel3Memberus-gaap:FairValueMeasurementsRecurringMember2018-01-012018-12-310000895421ms:OtherSecuredFinancingsMemberus-gaap:FairValueInputsLevel3Memberus-gaap:FairValueMeasurementsRecurringMember2020-12-310000895421us-gaap:FairValueInputsLevel3Memberus-gaap:FairValueMeasurementsRecurringMemberus-gaap:BorrowingsMember2019-12-310000895421us-gaap:FairValueInputsLevel3Memberus-gaap:FairValueMeasurementsRecurringMemberus-gaap:BorrowingsMember2018-12-310000895421us-gaap:FairValueInputsLevel3Memberus-gaap:FairValueMeasurementsRecurringMemberus-gaap:BorrowingsMember2017-12-310000895421us-gaap:FairValueInputsLevel3Memberus-gaap:FairValueMeasurementsRecurringMemberus-gaap:BorrowingsMember2020-01-012020-12-310000895421us-gaap:FairValueInputsLevel3Memberus-gaap:FairValueMeasurementsRecurringMemberus-gaap:BorrowingsMember2019-01-012019-12-310000895421us-gaap:FairValueInputsLevel3Memberus-gaap:FairValueMeasurementsRecurringMemberus-gaap:BorrowingsMember2018-01-012018-12-310000895421us-gaap:FairValueInputsLevel3Memberus-gaap:FairValueMeasurementsRecurringMemberus-gaap:BorrowingsMember2020-12-310000895421us-gaap:FairValueInputsLevel3Memberus-gaap:FairValueMeasurementsRecurringMember2020-01-012020-12-310000895421us-gaap:FairValueInputsLevel3Memberus-gaap:FairValueMeasurementsRecurringMember2019-01-012019-12-310000895421us-gaap:FairValueInputsLevel3Memberus-gaap:FairValueMeasurementsRecurringMember2018-01-012018-12-310000895421us-gaap:FairValueMeasurementsRecurringMemberus-gaap:EquityContractMember2018-01-012018-12-310000895421us-gaap:FairValueInputsLevel3Memberus-gaap:FairValueMeasurementsRecurringMemberms:ValuationTechniqueComparablePricingMemberms:MeasurementInputBondPriceMemberus-gaap:ForeignGovernmentDebtSecuritiesMember2020-12-310000895421us-gaap:FairValueInputsLevel3Memberms:MortgageAndAssetBackedSecuritiesMemberus-gaap:FairValueMeasurementsRecurringMemberms:ValuationTechniqueComparablePricingMembersrt:MinimumMemberms:MeasurementInputBondPriceMember2020-12-310000895421us-gaap:FairValueInputsLevel3Memberms:MortgageAndAssetBackedSecuritiesMembersrt:MaximumMemberus-gaap:FairValueMeasurementsRecurringMemberms:ValuationTechniqueComparablePricingMemberms:MeasurementInputBondPriceMember2020-12-310000895421us-gaap:FairValueInputsLevel3Membersrt:WeightedAverageMemberms:MortgageAndAssetBackedSecuritiesMemberus-gaap:FairValueMeasurementsRecurringMemberms:ValuationTechniqueComparablePricingMemberms:MeasurementInputBondPriceMember2020-12-310000895421us-gaap:FairValueInputsLevel3Memberms:MortgageAndAssetBackedSecuritiesMemberus-gaap:FairValueMeasurementsRecurringMemberms:ValuationTechniqueComparablePricingMembersrt:MinimumMemberms:MeasurementInputBondPriceMember2019-12-310000895421us-gaap:FairValueInputsLevel3Memberms:MortgageAndAssetBackedSecuritiesMembersrt:MaximumMemberus-gaap:FairValueMeasurementsRecurringMemberms:ValuationTechniqueComparablePricingMemberms:MeasurementInputBondPriceMember2019-12-310000895421us-gaap:FairValueInputsLevel3Membersrt:WeightedAverageMemberms:MortgageAndAssetBackedSecuritiesMemberus-gaap:FairValueMeasurementsRecurringMemberms:ValuationTechniqueComparablePricingMemberms:MeasurementInputBondPriceMember2019-12-310000895421us-gaap:SeniorDebtObligationsMemberus-gaap:MeasurementInputDiscountRateMemberus-gaap:FairValueInputsLevel3Memberus-gaap:FairValueMeasurementsRecurringMembersrt:MinimumMemberms:ValuationTechniqueMarginLoanMember2019-12-310000895421us-gaap:SeniorDebtObligationsMemberus-gaap:MeasurementInputDiscountRateMemberus-gaap:FairValueInputsLevel3Membersrt:MaximumMemberus-gaap:FairValueMeasurementsRecurringMemberms:ValuationTechniqueMarginLoanMember2019-12-310000895421us-gaap:SeniorDebtObligationsMemberus-gaap:MeasurementInputDiscountRateMemberus-gaap:FairValueInputsLevel3Membersrt:WeightedAverageMemberus-gaap:FairValueMeasurementsRecurringMemberms:ValuationTechniqueMarginLoanMember2019-12-310000895421us-gaap:SeniorDebtObligationsMemberus-gaap:FairValueInputsLevel3Memberms:MeasurementInputVolatilitySkewMemberus-gaap:FairValueMeasurementsRecurringMembersrt:MinimumMemberms:ValuationTechniqueMarginLoanMember2019-12-310000895421us-gaap:SeniorDebtObligationsMemberus-gaap:FairValueInputsLevel3Membersrt:MaximumMemberms:MeasurementInputVolatilitySkewMemberus-gaap:FairValueMeasurementsRecurringMemberms:ValuationTechniqueMarginLoanMember2019-12-310000895421us-gaap:SeniorDebtObligationsMemberus-gaap:FairValueInputsLevel3Membersrt:WeightedAverageMemberms:MeasurementInputVolatilitySkewMemberus-gaap:FairValueMeasurementsRecurringMemberms:ValuationTechniqueMarginLoanMember2019-12-310000895421us-gaap:SeniorDebtObligationsMemberus-gaap:FairValueInputsLevel3Memberus-gaap:FairValueMeasurementsRecurringMemberus-gaap:MeasurementInputCreditSpreadMembersrt:MinimumMemberms:ValuationTechniqueMarginLoanMember2019-12-310000895421us-gaap:SeniorDebtObligationsMemberus-gaap:FairValueInputsLevel3Membersrt:MaximumMemberus-gaap:FairValueMeasurementsRecurringMemberus-gaap:MeasurementInputCreditSpreadMemberms:ValuationTechniqueMarginLoanMember2019-12-310000895421us-gaap:SeniorDebtObligationsMemberus-gaap:FairValueInputsLevel3Membersrt:WeightedAverageMemberus-gaap:FairValueMeasurementsRecurringMemberus-gaap:MeasurementInputCreditSpreadMemberms:ValuationTechniqueMarginLoanMember2019-12-310000895421us-gaap:SeniorDebtObligationsMemberus-gaap:FairValueInputsLevel3Memberus-gaap:FairValueMeasurementsRecurringMemberms:MeasurementInputMarginLoanMembersrt:MinimumMemberms:ValuationTechniqueMarginLoanMember2020-12-310000895421us-gaap:SeniorDebtObligationsMemberus-gaap:FairValueInputsLevel3Membersrt:MaximumMemberus-gaap:FairValueMeasurementsRecurringMemberms:MeasurementInputMarginLoanMemberms:ValuationTechniqueMarginLoanMember2020-12-310000895421us-gaap:SeniorDebtObligationsMemberus-gaap:FairValueInputsLevel3Membersrt:WeightedAverageMemberus-gaap:FairValueMeasurementsRecurringMemberms:MeasurementInputMarginLoanMemberms:ValuationTechniqueMarginLoanMember2020-12-310000895421ms:MeasurementInputLoanPriceMemberus-gaap:SeniorDebtObligationsMemberus-gaap:FairValueInputsLevel3Memberus-gaap:FairValueMeasurementsRecurringMemberms:ValuationTechniqueComparablePricingMembersrt:MinimumMember2020-12-310000895421ms:MeasurementInputLoanPriceMemberus-gaap:SeniorDebtObligationsMemberus-gaap:FairValueInputsLevel3Membersrt:MaximumMemberus-gaap:FairValueMeasurementsRecurringMemberms:ValuationTechniqueComparablePricingMember2020-12-310000895421ms:MeasurementInputLoanPriceMemberus-gaap:SeniorDebtObligationsMemberus-gaap:FairValueInputsLevel3Membersrt:WeightedAverageMemberus-gaap:FairValueMeasurementsRecurringMemberms:ValuationTechniqueComparablePricingMember2020-12-310000895421ms:MeasurementInputLoanPriceMemberus-gaap:SeniorDebtObligationsMemberus-gaap:FairValueInputsLevel3Memberus-gaap:FairValueMeasurementsRecurringMemberms:ValuationTechniqueComparablePricingMembersrt:MinimumMember2019-12-310000895421ms:MeasurementInputLoanPriceMemberus-gaap:SeniorDebtObligationsMemberus-gaap:FairValueInputsLevel3Membersrt:MaximumMemberus-gaap:FairValueMeasurementsRecurringMemberms:ValuationTechniqueComparablePricingMember2019-12-310000895421ms:MeasurementInputLoanPriceMemberus-gaap:SeniorDebtObligationsMemberus-gaap:FairValueInputsLevel3Membersrt:WeightedAverageMemberus-gaap:FairValueMeasurementsRecurringMemberms:ValuationTechniqueComparablePricingMember2019-12-310000895421us-gaap:FairValueInputsLevel3Memberms:CorporateandOtherDebtSecuritiesMemberus-gaap:FairValueMeasurementsRecurringMemberms:ValuationTechniqueComparablePricingMembersrt:MinimumMemberms:MeasurementInputBondPriceMember2020-12-310000895421us-gaap:FairValueInputsLevel3Membersrt:MaximumMemberms:CorporateandOtherDebtSecuritiesMemberus-gaap:FairValueMeasurementsRecurringMemberms:ValuationTechniqueComparablePricingMemberms:MeasurementInputBondPriceMember2020-12-310000895421us-gaap:FairValueInputsLevel3Membersrt:WeightedAverageMemberms:CorporateandOtherDebtSecuritiesMemberus-gaap:FairValueMeasurementsRecurringMemberms:ValuationTechniqueComparablePricingMemberms:MeasurementInputBondPriceMember2020-12-310000895421us-gaap:FairValueInputsLevel3Memberms:CorporateandOtherDebtSecuritiesMemberus-gaap:FairValueMeasurementsRecurringMemberms:ValuationTechniqueComparablePricingMembersrt:MinimumMemberms:MeasurementInputBondPriceMember2019-12-310000895421us-gaap:FairValueInputsLevel3Membersrt:MaximumMemberms:CorporateandOtherDebtSecuritiesMemberus-gaap:FairValueMeasurementsRecurringMemberms:ValuationTechniqueComparablePricingMemberms:MeasurementInputBondPriceMember2019-12-310000895421us-gaap:FairValueInputsLevel3Membersrt:WeightedAverageMemberms:CorporateandOtherDebtSecuritiesMemberus-gaap:FairValueMeasurementsRecurringMemberms:ValuationTechniqueComparablePricingMemberms:MeasurementInputBondPriceMember2019-12-310000895421us-gaap:FairValueInputsLevel3Memberms:CorporateandOtherDebtSecuritiesMemberus-gaap:FairValueMeasurementsRecurringMemberus-gaap:ValuationTechniqueDiscountedCashFlowMembersrt:MinimumMemberms:MeasurementInputRecoveryRateMember2020-12-310000895421us-gaap:FairValueInputsLevel3Membersrt:MaximumMemberms:CorporateandOtherDebtSecuritiesMemberus-gaap:FairValueMeasurementsRecurringMemberus-gaap:ValuationTechniqueDiscountedCashFlowMemberms:MeasurementInputRecoveryRateMember2020-12-310000895421srt:ArithmeticAverageMemberus-gaap:FairValueInputsLevel3Memberms:CorporateandOtherDebtSecuritiesMemberus-gaap:FairValueMeasurementsRecurringMemberus-gaap:ValuationTechniqueDiscountedCashFlowMemberms:MeasurementInputRecoveryRateMember2020-12-310000895421us-gaap:FairValueInputsLevel3Membersrt:MedianMemberms:CorporateandOtherDebtSecuritiesMemberus-gaap:FairValueMeasurementsRecurringMemberus-gaap:ValuationTechniqueDiscountedCashFlowMemberms:MeasurementInputRecoveryRateMember2020-12-310000895421us-gaap:FairValueInputsLevel3Memberms:CorporateandOtherDebtSecuritiesMemberus-gaap:FairValueMeasurementsRecurringMemberus-gaap:ValuationTechniqueDiscountedCashFlowMemberms:MeasurementInputRecoveryRateMember2019-12-310000895421ms:MeasurementInputEquityVolatilityMemberus-gaap:FairValueInputsLevel3Memberms:CorporateandOtherDebtSecuritiesMemberus-gaap:FairValueMeasurementsRecurringMemberus-gaap:ValuationTechniqueOptionPricingModelMembersrt:MinimumMember2020-12-310000895421ms:MeasurementInputEquityVolatilityMemberus-gaap:FairValueInputsLevel3Membersrt:MaximumMemberms:CorporateandOtherDebtSecuritiesMemberus-gaap:FairValueMeasurementsRecurringMemberus-gaap:ValuationTechniqueOptionPricingModelMember2020-12-310000895421ms:MeasurementInputEquityVolatilityMemberus-gaap:FairValueInputsLevel3Membersrt:WeightedAverageMemberms:CorporateandOtherDebtSecuritiesMemberus-gaap:FairValueMeasurementsRecurringMemberus-gaap:ValuationTechniqueOptionPricingModelMember2020-12-310000895421ms:MeasurementInputEquityVolatilityMemberus-gaap:FairValueInputsLevel3Memberms:CorporateandOtherDebtSecuritiesMemberus-gaap:FairValueMeasurementsRecurringMemberus-gaap:ValuationTechniqueOptionPricingModelMember2019-12-310000895421us-gaap:FairValueInputsLevel3Memberus-gaap:MeasurementInputSharePriceMemberus-gaap:FairValueMeasurementsRecurringMemberms:ValuationTechniqueComparablePricingMember2020-12-310000895421us-gaap:FairValueInputsLevel3Memberus-gaap:MeasurementInputSharePriceMemberus-gaap:FairValueMeasurementsRecurringMemberms:ValuationTechniqueComparablePricingMember2019-12-310000895421us-gaap:FairValueInputsLevel3Memberms:MeasurementInputWeightedAverageCostOfCapitalMemberus-gaap:FairValueMeasurementsRecurringMemberus-gaap:ValuationTechniqueDiscountedCashFlowMembersrt:MinimumMember2020-12-310000895421us-gaap:FairValueInputsLevel3Memberms:MeasurementInputWeightedAverageCostOfCapitalMembersrt:MaximumMemberus-gaap:FairValueMeasurementsRecurringMemberus-gaap:ValuationTechniqueDiscountedCashFlowMember2020-12-310000895421us-gaap:FairValueInputsLevel3Memberms:MeasurementInputWeightedAverageCostOfCapitalMembersrt:WeightedAverageMemberus-gaap:FairValueMeasurementsRecurringMemberus-gaap:ValuationTechniqueDiscountedCashFlowMember2020-12-310000895421us-gaap:FairValueInputsLevel3Memberms:MeasurementInputWeightedAverageCostOfCapitalMemberus-gaap:FairValueMeasurementsRecurringMemberus-gaap:ValuationTechniqueDiscountedCashFlowMembersrt:MinimumMember2019-12-310000895421us-gaap:FairValueInputsLevel3Memberms:MeasurementInputWeightedAverageCostOfCapitalMembersrt:MaximumMemberus-gaap:FairValueMeasurementsRecurringMemberus-gaap:ValuationTechniqueDiscountedCashFlowMember2019-12-310000895421us-gaap:FairValueInputsLevel3Memberms:MeasurementInputWeightedAverageCostOfCapitalMembersrt:WeightedAverageMemberus-gaap:FairValueMeasurementsRecurringMemberus-gaap:ValuationTechniqueDiscountedCashFlowMember2019-12-310000895421ms:MeasurementInputExitMultipleMemberus-gaap:FairValueInputsLevel3Memberus-gaap:FairValueMeasurementsRecurringMemberus-gaap:ValuationTechniqueDiscountedCashFlowMembersrt:MinimumMember2020-12-310000895421ms:MeasurementInputExitMultipleMemberus-gaap:FairValueInputsLevel3Membersrt:MaximumMemberus-gaap:FairValueMeasurementsRecurringMemberus-gaap:ValuationTechniqueDiscountedCashFlowMember2020-12-310000895421ms:MeasurementInputExitMultipleMemberus-gaap:FairValueInputsLevel3Membersrt:WeightedAverageMemberus-gaap:FairValueMeasurementsRecurringMemberus-gaap:ValuationTechniqueDiscountedCashFlowMember2020-12-310000895421ms:MeasurementInputExitMultipleMemberus-gaap:FairValueInputsLevel3Memberus-gaap:FairValueMeasurementsRecurringMemberus-gaap:ValuationTechniqueDiscountedCashFlowMembersrt:MinimumMember2019-12-310000895421ms:MeasurementInputExitMultipleMemberus-gaap:FairValueInputsLevel3Membersrt:MaximumMemberus-gaap:FairValueMeasurementsRecurringMemberus-gaap:ValuationTechniqueDiscountedCashFlowMember2019-12-310000895421ms:MeasurementInputExitMultipleMemberus-gaap:FairValueInputsLevel3Membersrt:WeightedAverageMemberus-gaap:FairValueMeasurementsRecurringMemberus-gaap:ValuationTechniqueDiscountedCashFlowMember2019-12-310000895421us-gaap:FairValueInputsLevel3Memberus-gaap:MarketApproachValuationTechniqueMemberus-gaap:FairValueMeasurementsRecurringMembersrt:MinimumMemberus-gaap:MeasurementInputEbitdaMultipleMember2020-12-310000895421us-gaap:FairValueInputsLevel3Membersrt:MaximumMemberus-gaap:MarketApproachValuationTechniqueMemberus-gaap:FairValueMeasurementsRecurringMemberus-gaap:MeasurementInputEbitdaMultipleMember2020-12-310000895421us-gaap:FairValueInputsLevel3Membersrt:WeightedAverageMemberus-gaap:MarketApproachValuationTechniqueMemberus-gaap:FairValueMeasurementsRecurringMemberus-gaap:MeasurementInputEbitdaMultipleMember2020-12-310000895421us-gaap:FairValueInputsLevel3Memberus-gaap:MarketApproachValuationTechniqueMemberus-gaap:FairValueMeasurementsRecurringMembersrt:MinimumMemberus-gaap:MeasurementInputEbitdaMultipleMember2019-12-310000895421us-gaap:FairValueInputsLevel3Membersrt:MaximumMemberus-gaap:MarketApproachValuationTechniqueMemberus-gaap:FairValueMeasurementsRecurringMemberus-gaap:MeasurementInputEbitdaMultipleMember2019-12-310000895421us-gaap:FairValueInputsLevel3Membersrt:WeightedAverageMemberus-gaap:MarketApproachValuationTechniqueMemberus-gaap:FairValueMeasurementsRecurringMemberus-gaap:MeasurementInputEbitdaMultipleMember2019-12-310000895421us-gaap:FairValueInputsLevel3Memberus-gaap:MeasurementInputSharePriceMemberus-gaap:FairValueMeasurementsRecurringMemberms:ValuationTechniqueComparablePricingMembersrt:MinimumMember2020-12-310000895421us-gaap:FairValueInputsLevel3Memberus-gaap:MeasurementInputSharePriceMembersrt:MaximumMemberus-gaap:FairValueMeasurementsRecurringMemberms:ValuationTechniqueComparablePricingMember2020-12-310000895421us-gaap:FairValueInputsLevel3Membersrt:WeightedAverageMemberus-gaap:MeasurementInputSharePriceMemberus-gaap:FairValueMeasurementsRecurringMemberms:ValuationTechniqueComparablePricingMember2020-12-310000895421us-gaap:FairValueInputsLevel3Memberus-gaap:MeasurementInputSharePriceMemberus-gaap:FairValueMeasurementsRecurringMemberms:ValuationTechniqueComparablePricingMembersrt:MinimumMember2019-12-310000895421us-gaap:FairValueInputsLevel3Memberus-gaap:MeasurementInputSharePriceMembersrt:MaximumMemberus-gaap:FairValueMeasurementsRecurringMemberms:ValuationTechniqueComparablePricingMember2019-12-310000895421us-gaap:FairValueInputsLevel3Membersrt:WeightedAverageMemberus-gaap:MeasurementInputSharePriceMemberus-gaap:FairValueMeasurementsRecurringMemberms:ValuationTechniqueComparablePricingMember2019-12-310000895421us-gaap:FairValueInputsLevel3Memberus-gaap:FairValueMeasurementsRecurringMemberus-gaap:InterestRateContractMember2020-12-310000895421us-gaap:FairValueInputsLevel3Memberus-gaap:FairValueMeasurementsRecurringMemberus-gaap:InterestRateContractMember2019-12-310000895421ms:MeasurementInputInterestRateVolatilitySkewMemberus-gaap:FairValueInputsLevel3Memberus-gaap:FairValueMeasurementsRecurringMemberus-gaap:ValuationTechniqueOptionPricingModelMemberus-gaap:InterestRateContractMembersrt:MinimumMember2020-12-310000895421ms:MeasurementInputInterestRateVolatilitySkewMemberus-gaap:FairValueInputsLevel3Membersrt:MaximumMemberus-gaap:FairValueMeasurementsRecurringMemberus-gaap:ValuationTechniqueOptionPricingModelMemberus-gaap:InterestRateContractMember2020-12-310000895421ms:MeasurementInputInterestRateVolatilitySkewMembersrt:ArithmeticAverageMemberus-gaap:FairValueInputsLevel3Memberus-gaap:FairValueMeasurementsRecurringMemberus-gaap:ValuationTechniqueOptionPricingModelMemberus-gaap:InterestRateContractMember2020-12-310000895421ms:MeasurementInputInterestRateVolatilitySkewMemberus-gaap:FairValueInputsLevel3Membersrt:MedianMemberus-gaap:FairValueMeasurementsRecurringMemberus-gaap:ValuationTechniqueOptionPricingModelMemberus-gaap:InterestRateContractMember2020-12-310000895421ms:MeasurementInputInterestRateVolatilitySkewMemberus-gaap:FairValueInputsLevel3Memberus-gaap:FairValueMeasurementsRecurringMemberus-gaap:ValuationTechniqueOptionPricingModelMemberus-gaap:InterestRateContractMembersrt:MinimumMember2019-12-310000895421ms:MeasurementInputInterestRateVolatilitySkewMemberus-gaap:FairValueInputsLevel3Membersrt:MaximumMemberus-gaap:FairValueMeasurementsRecurringMemberus-gaap:ValuationTechniqueOptionPricingModelMemberus-gaap:InterestRateContractMember2019-12-310000895421ms:MeasurementInputInterestRateVolatilitySkewMembersrt:ArithmeticAverageMemberus-gaap:FairValueInputsLevel3Memberus-gaap:FairValueMeasurementsRecurringMemberus-gaap:ValuationTechniqueOptionPricingModelMemberus-gaap:InterestRateContractMember2019-12-310000895421ms:MeasurementInputInterestRateVolatilitySkewMemberus-gaap:FairValueInputsLevel3Membersrt:MedianMemberus-gaap:FairValueMeasurementsRecurringMemberus-gaap:ValuationTechniqueOptionPricingModelMemberus-gaap:InterestRateContractMember2019-12-310000895421us-gaap:FairValueInputsLevel3Memberus-gaap:FairValueMeasurementsRecurringMemberus-gaap:ValuationTechniqueOptionPricingModelMemberus-gaap:InterestRateContractMembersrt:MinimumMemberms:MeasurementInputInterestRateCurveCorrelationMember2020-12-310000895421us-gaap:FairValueInputsLevel3Membersrt:MaximumMemberus-gaap:FairValueMeasurementsRecurringMemberus-gaap:ValuationTechniqueOptionPricingModelMemberus-gaap:InterestRateContractMemberms:MeasurementInputInterestRateCurveCorrelationMember2020-12-310000895421srt:ArithmeticAverageMemberus-gaap:FairValueInputsLevel3Memberus-gaap:FairValueMeasurementsRecurringMemberus-gaap:ValuationTechniqueOptionPricingModelMemberus-gaap:InterestRateContractMemberms:MeasurementInputInterestRateCurveCorrelationMember2020-12-310000895421us-gaap:FairValueInputsLevel3Membersrt:MedianMemberus-gaap:FairValueMeasurementsRecurringMemberus-gaap:ValuationTechniqueOptionPricingModelMemberus-gaap:InterestRateContractMemberms:MeasurementInputInterestRateCurveCorrelationMember2020-12-310000895421us-gaap:FairValueInputsLevel3Memberus-gaap:FairValueMeasurementsRecurringMemberus-gaap:ValuationTechniqueOptionPricingModelMemberus-gaap:InterestRateContractMembersrt:MinimumMemberms:MeasurementInputInterestRateCurveCorrelationMember2019-12-310000895421us-gaap:FairValueInputsLevel3Membersrt:MaximumMemberus-gaap:FairValueMeasurementsRecurringMemberus-gaap:ValuationTechniqueOptionPricingModelMemberus-gaap:InterestRateContractMemberms:MeasurementInputInterestRateCurveCorrelationMember2019-12-310000895421srt:ArithmeticAverageMemberus-gaap:FairValueInputsLevel3Memberus-gaap:FairValueMeasurementsRecurringMemberus-gaap:ValuationTechniqueOptionPricingModelMemberus-gaap:InterestRateContractMemberms:MeasurementInputInterestRateCurveCorrelationMember2019-12-310000895421us-gaap:FairValueInputsLevel3Membersrt:MedianMemberus-gaap:FairValueMeasurementsRecurringMemberus-gaap:ValuationTechniqueOptionPricingModelMemberus-gaap:InterestRateContractMemberms:MeasurementInputInterestRateCurveCorrelationMember2019-12-310000895421us-gaap:FairValueInputsLevel3Memberms:MeasurementInputBondVolatilityMemberus-gaap:FairValueMeasurementsRecurringMemberus-gaap:ValuationTechniqueOptionPricingModelMemberus-gaap:InterestRateContractMembersrt:MinimumMember2020-12-310000895421us-gaap:FairValueInputsLevel3Memberms:MeasurementInputBondVolatilityMembersrt:MaximumMemberus-gaap:FairValueMeasurementsRecurringMemberus-gaap:ValuationTechniqueOptionPricingModelMemberus-gaap:InterestRateContractMember2020-12-310000895421srt:ArithmeticAverageMemberus-gaap:FairValueInputsLevel3Memberms:MeasurementInputBondVolatilityMemberus-gaap:FairValueMeasurementsRecurringMemberus-gaap:ValuationTechniqueOptionPricingModelMemberus-gaap:InterestRateContractMember2020-12-310000895421us-gaap:FairValueInputsLevel3Memberms:MeasurementInputBondVolatilityMembersrt:MedianMemberus-gaap:FairValueMeasurementsRecurringMemberus-gaap:ValuationTechniqueOptionPricingModelMemberus-gaap:InterestRateContractMember2020-12-310000895421us-gaap:FairValueInputsLevel3Memberms:MeasurementInputBondVolatilityMemberus-gaap:FairValueMeasurementsRecurringMemberus-gaap:ValuationTechniqueOptionPricingModelMemberus-gaap:InterestRateContractMembersrt:MinimumMember2019-12-310000895421us-gaap:FairValueInputsLevel3Memberms:MeasurementInputBondVolatilityMembersrt:MaximumMemberus-gaap:FairValueMeasurementsRecurringMemberus-gaap:ValuationTechniqueOptionPricingModelMemberus-gaap:InterestRateContractMember2019-12-310000895421srt:ArithmeticAverageMemberus-gaap:FairValueInputsLevel3Memberms:MeasurementInputBondVolatilityMemberus-gaap:FairValueMeasurementsRecurringMemberus-gaap:ValuationTechniqueOptionPricingModelMemberus-gaap:InterestRateContractMember2019-12-310000895421us-gaap:FairValueInputsLevel3Memberms:MeasurementInputBondVolatilityMembersrt:MedianMemberus-gaap:FairValueMeasurementsRecurringMemberus-gaap:ValuationTechniqueOptionPricingModelMemberus-gaap:InterestRateContractMember2019-12-310000895421us-gaap:FairValueInputsLevel3Memberms:MeasurementInputInflationVolatilityMemberus-gaap:FairValueMeasurementsRecurringMemberus-gaap:ValuationTechniqueOptionPricingModelMemberus-gaap:InterestRateContractMembersrt:MinimumMember2020-12-310000895421us-gaap:FairValueInputsLevel3Memberms:MeasurementInputInflationVolatilityMembersrt:MaximumMemberus-gaap:FairValueMeasurementsRecurringMemberus-gaap:ValuationTechniqueOptionPricingModelMemberus-gaap:InterestRateContractMember2020-12-310000895421srt:ArithmeticAverageMemberus-gaap:FairValueInputsLevel3Memberms:MeasurementInputInflationVolatilityMemberus-gaap:FairValueMeasurementsRecurringMemberus-gaap:ValuationTechniqueOptionPricingModelMemberus-gaap:InterestRateContractMember2020-12-310000895421us-gaap:FairValueInputsLevel3Memberms:MeasurementInputInflationVolatilityMembersrt:MedianMemberus-gaap:FairValueMeasurementsRecurringMemberus-gaap:ValuationTechniqueOptionPricingModelMemberus-gaap:InterestRateContractMember2020-12-310000895421us-gaap:FairValueInputsLevel3Memberms:MeasurementInputInflationVolatilityMemberus-gaap:FairValueMeasurementsRecurringMemberus-gaap:ValuationTechniqueOptionPricingModelMemberus-gaap:InterestRateContractMembersrt:MinimumMember2019-12-310000895421us-gaap:FairValueInputsLevel3Memberms:MeasurementInputInflationVolatilityMembersrt:MaximumMemberus-gaap:FairValueMeasurementsRecurringMemberus-gaap:ValuationTechniqueOptionPricingModelMemberus-gaap:InterestRateContractMember2019-12-310000895421srt:ArithmeticAverageMemberus-gaap:FairValueInputsLevel3Memberms:MeasurementInputInflationVolatilityMemberus-gaap:FairValueMeasurementsRecurringMemberus-gaap:ValuationTechniqueOptionPricingModelMemberus-gaap:InterestRateContractMember2019-12-310000895421us-gaap:FairValueInputsLevel3Memberms:MeasurementInputInflationVolatilityMembersrt:MedianMemberus-gaap:FairValueMeasurementsRecurringMemberus-gaap:ValuationTechniqueOptionPricingModelMemberus-gaap:InterestRateContractMember2019-12-310000895421ms:MeasurementInputInterestRateCurveMemberus-gaap:FairValueInputsLevel3Memberus-gaap:FairValueMeasurementsRecurringMemberus-gaap:ValuationTechniqueOptionPricingModelMemberus-gaap:InterestRateContractMember2020-12-310000895421ms:MeasurementInputInterestRateCurveMemberus-gaap:FairValueInputsLevel3Memberus-gaap:FairValueMeasurementsRecurringMemberus-gaap:ValuationTechniqueOptionPricingModelMemberus-gaap:InterestRateContractMember2019-12-310000895421us-gaap:FairValueInputsLevel3Memberus-gaap:FairValueMeasurementsRecurringMemberus-gaap:CreditRiskContractMember2020-12-310000895421us-gaap:FairValueInputsLevel3Memberus-gaap:FairValueMeasurementsRecurringMemberus-gaap:CreditRiskContractMember2019-12-310000895421us-gaap:FairValueInputsLevel3Memberms:MeasurementInputCashSyntheticBasisMemberus-gaap:FairValueMeasurementsRecurringMemberms:CreditDefaultSwapModelMemberus-gaap:CreditRiskContractMember2020-12-310000895421us-gaap:FairValueInputsLevel3Memberms:MeasurementInputCashSyntheticBasisMemberus-gaap:FairValueMeasurementsRecurringMemberms:CreditDefaultSwapModelMemberus-gaap:CreditRiskContractMember2019-12-310000895421us-gaap:FairValueInputsLevel3Memberus-gaap:FairValueMeasurementsRecurringMemberms:CreditDefaultSwapModelMembersrt:MinimumMemberus-gaap:CreditRiskContractMemberms:MeasurementInputBondPriceMember2020-12-310000895421us-gaap:FairValueInputsLevel3Membersrt:MaximumMemberus-gaap:FairValueMeasurementsRecurringMemberms:CreditDefaultSwapModelMemberus-gaap:CreditRiskContractMemberms:MeasurementInputBondPriceMember2020-12-310000895421us-gaap:FairValueInputsLevel3Membersrt:WeightedAverageMemberus-gaap:FairValueMeasurementsRecurringMemberms:CreditDefaultSwapModelMemberus-gaap:CreditRiskContractMemberms:MeasurementInputBondPriceMember2020-12-310000895421us-gaap:FairValueInputsLevel3Memberus-gaap:FairValueMeasurementsRecurringMemberms:CreditDefaultSwapModelMembersrt:MinimumMemberus-gaap:CreditRiskContractMemberms:MeasurementInputBondPriceMember2019-12-310000895421us-gaap:FairValueInputsLevel3Membersrt:MaximumMemberus-gaap:FairValueMeasurementsRecurringMemberms:CreditDefaultSwapModelMemberus-gaap:CreditRiskContractMemberms:MeasurementInputBondPriceMember2019-12-310000895421us-gaap:FairValueInputsLevel3Membersrt:WeightedAverageMemberus-gaap:FairValueMeasurementsRecurringMemberms:CreditDefaultSwapModelMemberus-gaap:CreditRiskContractMemberms:MeasurementInputBondPriceMember2019-12-310000895421us-gaap:FairValueInputsLevel3Memberus-gaap:FairValueMeasurementsRecurringMemberms:CreditDefaultSwapModelMemberus-gaap:MeasurementInputCreditSpreadMembersrt:MinimumMemberus-gaap:CreditRiskContractMember2020-12-310000895421us-gaap:FairValueInputsLevel3Membersrt:MaximumMemberus-gaap:FairValueMeasurementsRecurringMemberms:CreditDefaultSwapModelMemberus-gaap:MeasurementInputCreditSpreadMemberus-gaap:CreditRiskContractMember2020-12-310000895421us-gaap:FairValueInputsLevel3Membersrt:WeightedAverageMemberus-gaap:FairValueMeasurementsRecurringMemberms:CreditDefaultSwapModelMemberus-gaap:MeasurementInputCreditSpreadMemberus-gaap:CreditRiskContractMember2020-12-310000895421us-gaap:FairValueInputsLevel3Memberus-gaap:FairValueMeasurementsRecurringMemberms:CreditDefaultSwapModelMemberus-gaap:MeasurementInputCreditSpreadMembersrt:MinimumMemberus-gaap:CreditRiskContractMember2019-12-310000895421us-gaap:FairValueInputsLevel3Membersrt:MaximumMemberus-gaap:FairValueMeasurementsRecurringMemberms:CreditDefaultSwapModelMemberus-gaap:MeasurementInputCreditSpreadMemberus-gaap:CreditRiskContractMember2019-12-310000895421us-gaap:FairValueInputsLevel3Membersrt:WeightedAverageMemberus-gaap:FairValueMeasurementsRecurringMemberms:CreditDefaultSwapModelMemberus-gaap:MeasurementInputCreditSpreadMemberus-gaap:CreditRiskContractMember2019-12-310000895421ms:MeasurementInputFundingSpreadMemberus-gaap:FairValueInputsLevel3Memberus-gaap:FairValueMeasurementsRecurringMemberms:CreditDefaultSwapModelMembersrt:MinimumMemberus-gaap:CreditRiskContractMember2020-12-310000895421ms:MeasurementInputFundingSpreadMemberus-gaap:FairValueInputsLevel3Membersrt:MaximumMemberus-gaap:FairValueMeasurementsRecurringMemberms:CreditDefaultSwapModelMemberus-gaap:CreditRiskContractMember2020-12-310000895421ms:MeasurementInputFundingSpreadMemberus-gaap:FairValueInputsLevel3Membersrt:WeightedAverageMemberus-gaap:FairValueMeasurementsRecurringMemberms:CreditDefaultSwapModelMemberus-gaap:CreditRiskContractMember2020-12-310000895421ms:MeasurementInputFundingSpreadMemberus-gaap:FairValueInputsLevel3Memberus-gaap:FairValueMeasurementsRecurringMemberms:CreditDefaultSwapModelMembersrt:MinimumMemberus-gaap:CreditRiskContractMember2019-12-310000895421ms:MeasurementInputFundingSpreadMemberus-gaap:FairValueInputsLevel3Membersrt:MaximumMemberus-gaap:FairValueMeasurementsRecurringMemberms:CreditDefaultSwapModelMemberus-gaap:CreditRiskContractMember2019-12-310000895421ms:MeasurementInputFundingSpreadMemberus-gaap:FairValueInputsLevel3Membersrt:WeightedAverageMemberus-gaap:FairValueMeasurementsRecurringMemberms:CreditDefaultSwapModelMemberus-gaap:CreditRiskContractMember2019-12-310000895421us-gaap:FairValueInputsLevel3Memberus-gaap:FairValueMeasurementsRecurringMemberms:MeasurementInputCreditCorrelationMembersrt:MinimumMemberus-gaap:CreditRiskContractMemberms:ValuationTechniqueCorrelationModelMember2020-12-310000895421us-gaap:FairValueInputsLevel3Membersrt:MaximumMemberus-gaap:FairValueMeasurementsRecurringMemberms:MeasurementInputCreditCorrelationMemberus-gaap:CreditRiskContractMemberms:ValuationTechniqueCorrelationModelMember2020-12-310000895421us-gaap:FairValueInputsLevel3Membersrt:WeightedAverageMemberus-gaap:FairValueMeasurementsRecurringMemberms:MeasurementInputCreditCorrelationMemberus-gaap:CreditRiskContractMemberms:ValuationTechniqueCorrelationModelMember2020-12-310000895421us-gaap:FairValueInputsLevel3Memberus-gaap:FairValueMeasurementsRecurringMemberms:MeasurementInputCreditCorrelationMembersrt:MinimumMemberus-gaap:CreditRiskContractMemberms:ValuationTechniqueCorrelationModelMember2019-12-310000895421us-gaap:FairValueInputsLevel3Membersrt:MaximumMemberus-gaap:FairValueMeasurementsRecurringMemberms:MeasurementInputCreditCorrelationMemberus-gaap:CreditRiskContractMemberms:ValuationTechniqueCorrelationModelMember2019-12-310000895421us-gaap:FairValueInputsLevel3Membersrt:WeightedAverageMemberus-gaap:FairValueMeasurementsRecurringMemberms:MeasurementInputCreditCorrelationMemberus-gaap:CreditRiskContractMemberms:ValuationTechniqueCorrelationModelMember2019-12-310000895421us-gaap:FairValueInputsLevel3Memberus-gaap:FairValueMeasurementsRecurringMemberus-gaap:ForeignExchangeContractMember2020-12-310000895421us-gaap:FairValueInputsLevel3Memberus-gaap:FairValueMeasurementsRecurringMemberus-gaap:ForeignExchangeContractMember2019-12-310000895421us-gaap:FairValueInputsLevel3Memberus-gaap:FairValueMeasurementsRecurringMemberus-gaap:ValuationTechniqueOptionPricingModelMembersrt:MinimumMemberms:MeasurementInputInterestRateForeignExchangeCorrelationMemberus-gaap:ForeignExchangeContractMember2020-12-310000895421us-gaap:FairValueInputsLevel3Membersrt:MaximumMemberus-gaap:FairValueMeasurementsRecurringMemberus-gaap:ValuationTechniqueOptionPricingModelMemberms:MeasurementInputInterestRateForeignExchangeCorrelationMemberus-gaap:ForeignExchangeContractMember2020-12-310000895421srt:ArithmeticAverageMemberus-gaap:FairValueInputsLevel3Memberus-gaap:FairValueMeasurementsRecurringMemberus-gaap:ValuationTechniqueOptionPricingModelMemberms:MeasurementInputInterestRateForeignExchangeCorrelationMemberus-gaap:ForeignExchangeContractMember2020-12-310000895421us-gaap:FairValueInputsLevel3Membersrt:MedianMemberus-gaap:FairValueMeasurementsRecurringMemberus-gaap:ValuationTechniqueOptionPricingModelMemberms:MeasurementInputInterestRateForeignExchangeCorrelationMemberus-gaap:ForeignExchangeContractMember2020-12-310000895421us-gaap:FairValueInputsLevel3Memberus-gaap:FairValueMeasurementsRecurringMemberus-gaap:ValuationTechniqueOptionPricingModelMembersrt:MinimumMemberms:MeasurementInputInterestRateForeignExchangeCorrelationMemberus-gaap:ForeignExchangeContractMember2019-12-310000895421us-gaap:FairValueInputsLevel3Membersrt:MaximumMemberus-gaap:FairValueMeasurementsRecurringMemberus-gaap:ValuationTechniqueOptionPricingModelMemberms:MeasurementInputInterestRateForeignExchangeCorrelationMemberus-gaap:ForeignExchangeContractMember2019-12-310000895421srt:ArithmeticAverageMemberus-gaap:FairValueInputsLevel3Memberus-gaap:FairValueMeasurementsRecurringMemberus-gaap:ValuationTechniqueOptionPricingModelMemberms:MeasurementInputInterestRateForeignExchangeCorrelationMemberus-gaap:ForeignExchangeContractMember2019-12-310000895421us-gaap:FairValueInputsLevel3Membersrt:MedianMemberus-gaap:FairValueMeasurementsRecurringMemberus-gaap:ValuationTechniqueOptionPricingModelMemberms:MeasurementInputInterestRateForeignExchangeCorrelationMemberus-gaap:ForeignExchangeContractMember2019-12-310000895421ms:MeasurementInputInterestRateVolatilitySkewMemberus-gaap:FairValueInputsLevel3Memberus-gaap:FairValueMeasurementsRecurringMemberus-gaap:ValuationTechniqueOptionPricingModelMembersrt:MinimumMemberus-gaap:ForeignExchangeContractMember2020-12-310000895421ms:MeasurementInputInterestRateVolatilitySkewMemberus-gaap:FairValueInputsLevel3Membersrt:MaximumMemberus-gaap:FairValueMeasurementsRecurringMemberus-gaap:ValuationTechniqueOptionPricingModelMemberus-gaap:ForeignExchangeContractMember2020-12-310000895421ms:MeasurementInputInterestRateVolatilitySkewMembersrt:ArithmeticAverageMemberus-gaap:FairValueInputsLevel3Memberus-gaap:FairValueMeasurementsRecurringMemberus-gaap:ValuationTechniqueOptionPricingModelMemberus-gaap:ForeignExchangeContractMember2020-12-310000895421ms:MeasurementInputInterestRateVolatilitySkewMemberus-gaap:FairValueInputsLevel3Membersrt:MedianMemberus-gaap:FairValueMeasurementsRecurringMemberus-gaap:ValuationTechniqueOptionPricingModelMemberus-gaap:ForeignExchangeContractMember2020-12-310000895421ms:MeasurementInputInterestRateVolatilitySkewMemberus-gaap:FairValueInputsLevel3Memberus-gaap:FairValueMeasurementsRecurringMemberus-gaap:ValuationTechniqueOptionPricingModelMembersrt:MinimumMemberus-gaap:ForeignExchangeContractMember2019-12-310000895421ms:MeasurementInputInterestRateVolatilitySkewMemberus-gaap:FairValueInputsLevel3Membersrt:MaximumMemberus-gaap:FairValueMeasurementsRecurringMemberus-gaap:ValuationTechniqueOptionPricingModelMemberus-gaap:ForeignExchangeContractMember2019-12-310000895421ms:MeasurementInputInterestRateVolatilitySkewMembersrt:ArithmeticAverageMemberus-gaap:FairValueInputsLevel3Memberus-gaap:FairValueMeasurementsRecurringMemberus-gaap:ValuationTechniqueOptionPricingModelMemberus-gaap:ForeignExchangeContractMember2019-12-310000895421ms:MeasurementInputInterestRateVolatilitySkewMemberus-gaap:FairValueInputsLevel3Membersrt:MedianMemberus-gaap:FairValueMeasurementsRecurringMemberus-gaap:ValuationTechniqueOptionPricingModelMemberus-gaap:ForeignExchangeContractMember2019-12-310000895421ms:MeasurementInputInterestRateCurveMemberus-gaap:FairValueInputsLevel3Memberus-gaap:FairValueMeasurementsRecurringMemberus-gaap:ValuationTechniqueOptionPricingModelMembersrt:MinimumMemberus-gaap:ForeignExchangeContractMember2020-12-310000895421ms:MeasurementInputInterestRateCurveMemberus-gaap:FairValueInputsLevel3Membersrt:MaximumMemberus-gaap:FairValueMeasurementsRecurringMemberus-gaap:ValuationTechniqueOptionPricingModelMemberus-gaap:ForeignExchangeContractMember2020-12-310000895421srt:ArithmeticAverageMemberms:MeasurementInputInterestRateCurveMemberus-gaap:FairValueInputsLevel3Memberus-gaap:FairValueMeasurementsRecurringMemberus-gaap:ValuationTechniqueOptionPricingModelMemberus-gaap:ForeignExchangeContractMember2020-12-310000895421ms:MeasurementInputInterestRateCurveMemberus-gaap:FairValueInputsLevel3Membersrt:MedianMemberus-gaap:FairValueMeasurementsRecurringMemberus-gaap:ValuationTechniqueOptionPricingModelMemberus-gaap:ForeignExchangeContractMember2020-12-310000895421ms:MeasurementInputInterestRateCurveMemberus-gaap:FairValueInputsLevel3Memberus-gaap:FairValueMeasurementsRecurringMemberus-gaap:ValuationTechniqueOptionPricingModelMembersrt:MinimumMemberus-gaap:ForeignExchangeContractMember2019-12-310000895421ms:MeasurementInputInterestRateCurveMemberus-gaap:FairValueInputsLevel3Membersrt:MaximumMemberus-gaap:FairValueMeasurementsRecurringMemberus-gaap:ValuationTechniqueOptionPricingModelMemberus-gaap:ForeignExchangeContractMember2019-12-310000895421srt:ArithmeticAverageMemberms:MeasurementInputInterestRateCurveMemberus-gaap:FairValueInputsLevel3Memberus-gaap:FairValueMeasurementsRecurringMemberus-gaap:ValuationTechniqueOptionPricingModelMemberus-gaap:ForeignExchangeContractMember2019-12-310000895421ms:MeasurementInputInterestRateCurveMemberus-gaap:FairValueInputsLevel3Membersrt:MedianMemberus-gaap:FairValueMeasurementsRecurringMemberus-gaap:ValuationTechniqueOptionPricingModelMemberus-gaap:ForeignExchangeContractMember2019-12-310000895421ms:MeasurementInputForeignExchangeVolatilitySkewMemberus-gaap:FairValueInputsLevel3Memberus-gaap:FairValueMeasurementsRecurringMemberus-gaap:ValuationTechniqueOptionPricingModelMembersrt:MinimumMemberus-gaap:ForeignExchangeContractMember2020-12-310000895421ms:MeasurementInputForeignExchangeVolatilitySkewMemberus-gaap:FairValueInputsLevel3Membersrt:MaximumMemberus-gaap:FairValueMeasurementsRecurringMemberus-gaap:ValuationTechniqueOptionPricingModelMemberus-gaap:ForeignExchangeContractMember2020-12-310000895421ms:MeasurementInputForeignExchangeVolatilitySkewMembersrt:ArithmeticAverageMemberus-gaap:FairValueInputsLevel3Memberus-gaap:FairValueMeasurementsRecurringMemberus-gaap:ValuationTechniqueOptionPricingModelMemberus-gaap:ForeignExchangeContractMember2020-12-310000895421ms:MeasurementInputForeignExchangeVolatilitySkewMemberus-gaap:FairValueInputsLevel3Membersrt:MedianMemberus-gaap:FairValueMeasurementsRecurringMemberus-gaap:ValuationTechniqueOptionPricingModelMemberus-gaap:ForeignExchangeContractMember2020-12-310000895421ms:MeasurementInputContingencyProbabilityMemberus-gaap:FairValueInputsLevel3Memberus-gaap:FairValueMeasurementsRecurringMemberus-gaap:ValuationTechniqueOptionPricingModelMembersrt:MinimumMemberus-gaap:ForeignExchangeContractMember2020-12-310000895421ms:MeasurementInputContingencyProbabilityMemberus-gaap:FairValueInputsLevel3Membersrt:MaximumMemberus-gaap:FairValueMeasurementsRecurringMemberus-gaap:ValuationTechniqueOptionPricingModelMemberus-gaap:ForeignExchangeContractMember2020-12-310000895421ms:MeasurementInputContingencyProbabilityMembersrt:ArithmeticAverageMemberus-gaap:FairValueInputsLevel3Memberus-gaap:FairValueMeasurementsRecurringMemberus-gaap:ValuationTechniqueOptionPricingModelMemberus-gaap:ForeignExchangeContractMember2020-12-310000895421ms:MeasurementInputContingencyProbabilityMemberus-gaap:FairValueInputsLevel3Membersrt:MedianMemberus-gaap:FairValueMeasurementsRecurringMemberus-gaap:ValuationTechniqueOptionPricingModelMemberus-gaap:ForeignExchangeContractMember2020-12-310000895421ms:MeasurementInputContingencyProbabilityMemberus-gaap:FairValueInputsLevel3Memberus-gaap:FairValueMeasurementsRecurringMemberus-gaap:ValuationTechniqueOptionPricingModelMembersrt:MinimumMemberus-gaap:ForeignExchangeContractMember2019-12-310000895421ms:MeasurementInputContingencyProbabilityMemberus-gaap:FairValueInputsLevel3Membersrt:MaximumMemberus-gaap:FairValueMeasurementsRecurringMemberus-gaap:ValuationTechniqueOptionPricingModelMemberus-gaap:ForeignExchangeContractMember2019-12-310000895421ms:MeasurementInputContingencyProbabilityMembersrt:ArithmeticAverageMemberus-gaap:FairValueInputsLevel3Memberus-gaap:FairValueMeasurementsRecurringMemberus-gaap:ValuationTechniqueOptionPricingModelMemberus-gaap:ForeignExchangeContractMember2019-12-310000895421ms:MeasurementInputContingencyProbabilityMemberus-gaap:FairValueInputsLevel3Membersrt:MedianMemberus-gaap:FairValueMeasurementsRecurringMemberus-gaap:ValuationTechniqueOptionPricingModelMemberus-gaap:ForeignExchangeContractMember2019-12-310000895421us-gaap:FairValueInputsLevel3Memberus-gaap:FairValueMeasurementsRecurringMemberus-gaap:EquityContractMember2020-12-310000895421us-gaap:FairValueInputsLevel3Memberus-gaap:FairValueMeasurementsRecurringMemberus-gaap:EquityContractMember2019-12-310000895421ms:MeasurementInputEquityVolatilityMemberus-gaap:FairValueInputsLevel3Memberus-gaap:FairValueMeasurementsRecurringMemberus-gaap:ValuationTechniqueOptionPricingModelMembersrt:MinimumMemberus-gaap:EquityContractMember2020-12-310000895421ms:MeasurementInputEquityVolatilityMemberus-gaap:FairValueInputsLevel3Membersrt:MaximumMemberus-gaap:FairValueMeasurementsRecurringMemberus-gaap:ValuationTechniqueOptionPricingModelMemberus-gaap:EquityContractMember2020-12-310000895421ms:MeasurementInputEquityVolatilityMemberus-gaap:FairValueInputsLevel3Membersrt:WeightedAverageMemberus-gaap:FairValueMeasurementsRecurringMemberus-gaap:ValuationTechniqueOptionPricingModelMemberus-gaap:EquityContractMember2020-12-310000895421ms:MeasurementInputEquityVolatilityMemberus-gaap:FairValueInputsLevel3Memberus-gaap:FairValueMeasurementsRecurringMemberus-gaap:ValuationTechniqueOptionPricingModelMembersrt:MinimumMemberus-gaap:EquityContractMember2019-12-310000895421ms:MeasurementInputEquityVolatilityMemberus-gaap:FairValueInputsLevel3Membersrt:MaximumMemberus-gaap:FairValueMeasurementsRecurringMemberus-gaap:ValuationTechniqueOptionPricingModelMemberus-gaap:EquityContractMember2019-12-310000895421ms:MeasurementInputEquityVolatilityMemberus-gaap:FairValueInputsLevel3Membersrt:WeightedAverageMemberus-gaap:FairValueMeasurementsRecurringMemberus-gaap:ValuationTechniqueOptionPricingModelMemberus-gaap:EquityContractMember2019-12-310000895421ms:MeasurementInputEquityVolatilitySkewMemberus-gaap:FairValueInputsLevel3Memberus-gaap:FairValueMeasurementsRecurringMemberus-gaap:ValuationTechniqueOptionPricingModelMembersrt:MinimumMemberus-gaap:EquityContractMember2020-12-310000895421ms:MeasurementInputEquityVolatilitySkewMemberus-gaap:FairValueInputsLevel3Membersrt:MaximumMemberus-gaap:FairValueMeasurementsRecurringMemberus-gaap:ValuationTechniqueOptionPricingModelMemberus-gaap:EquityContractMember2020-12-310000895421ms:MeasurementInputEquityVolatilitySkewMemberus-gaap:FairValueInputsLevel3Membersrt:WeightedAverageMemberus-gaap:FairValueMeasurementsRecurringMemberus-gaap:ValuationTechniqueOptionPricingModelMemberus-gaap:EquityContractMember2020-12-310000895421ms:MeasurementInputEquityVolatilitySkewMemberus-gaap:FairValueInputsLevel3Memberus-gaap:FairValueMeasurementsRecurringMemberus-gaap:ValuationTechniqueOptionPricingModelMembersrt:MinimumMemberus-gaap:EquityContractMember2019-12-310000895421ms:MeasurementInputEquityVolatilitySkewMemberus-gaap:FairValueInputsLevel3Membersrt:MaximumMemberus-gaap:FairValueMeasurementsRecurringMemberus-gaap:ValuationTechniqueOptionPricingModelMemberus-gaap:EquityContractMember2019-12-310000895421ms:MeasurementInputEquityVolatilitySkewMemberus-gaap:FairValueInputsLevel3Membersrt:WeightedAverageMemberus-gaap:FairValueMeasurementsRecurringMemberus-gaap:ValuationTechniqueOptionPricingModelMemberus-gaap:EquityContractMember2019-12-310000895421ms:MeasurementInputEquityCorrelationMemberus-gaap:FairValueInputsLevel3Memberus-gaap:FairValueMeasurementsRecurringMemberus-gaap:ValuationTechniqueOptionPricingModelMembersrt:MinimumMemberus-gaap:EquityContractMember2020-12-310000895421ms:MeasurementInputEquityCorrelationMemberus-gaap:FairValueInputsLevel3Membersrt:MaximumMemberus-gaap:FairValueMeasurementsRecurringMemberus-gaap:ValuationTechniqueOptionPricingModelMemberus-gaap:EquityContractMember2020-12-310000895421ms:MeasurementInputEquityCorrelationMemberus-gaap:FairValueInputsLevel3Membersrt:WeightedAverageMemberus-gaap:FairValueMeasurementsRecurringMemberus-gaap:ValuationTechniqueOptionPricingModelMemberus-gaap:EquityContractMember2020-12-310000895421ms:MeasurementInputEquityCorrelationMemberus-gaap:FairValueInputsLevel3Memberus-gaap:FairValueMeasurementsRecurringMemberus-gaap:ValuationTechniqueOptionPricingModelMembersrt:MinimumMemberus-gaap:EquityContractMember2019-12-310000895421ms:MeasurementInputEquityCorrelationMemberus-gaap:FairValueInputsLevel3Membersrt:MaximumMemberus-gaap:FairValueMeasurementsRecurringMemberus-gaap:ValuationTechniqueOptionPricingModelMemberus-gaap:EquityContractMember2019-12-310000895421ms:MeasurementInputEquityCorrelationMemberus-gaap:FairValueInputsLevel3Membersrt:WeightedAverageMemberus-gaap:FairValueMeasurementsRecurringMemberus-gaap:ValuationTechniqueOptionPricingModelMemberus-gaap:EquityContractMember2019-12-310000895421us-gaap:FairValueInputsLevel3Memberus-gaap:FairValueMeasurementsRecurringMemberus-gaap:ValuationTechniqueOptionPricingModelMemberms:MeasurementInputForeignExchangeCorrelationMembersrt:MinimumMemberus-gaap:EquityContractMember2020-12-310000895421us-gaap:FairValueInputsLevel3Membersrt:MaximumMemberus-gaap:FairValueMeasurementsRecurringMemberus-gaap:ValuationTechniqueOptionPricingModelMemberms:MeasurementInputForeignExchangeCorrelationMemberus-gaap:EquityContractMember2020-12-310000895421us-gaap:FairValueInputsLevel3Membersrt:WeightedAverageMemberus-gaap:FairValueMeasurementsRecurringMemberus-gaap:ValuationTechniqueOptionPricingModelMemberms:MeasurementInputForeignExchangeCorrelationMemberus-gaap:EquityContractMember2020-12-310000895421us-gaap:FairValueInputsLevel3Memberus-gaap:FairValueMeasurementsRecurringMemberus-gaap:ValuationTechniqueOptionPricingModelMemberms:MeasurementInputForeignExchangeCorrelationMembersrt:MinimumMemberus-gaap:EquityContractMember2019-12-310000895421us-gaap:FairValueInputsLevel3Membersrt:MaximumMemberus-gaap:FairValueMeasurementsRecurringMemberus-gaap:ValuationTechniqueOptionPricingModelMemberms:MeasurementInputForeignExchangeCorrelationMemberus-gaap:EquityContractMember2019-12-310000895421us-gaap:FairValueInputsLevel3Membersrt:WeightedAverageMemberus-gaap:FairValueMeasurementsRecurringMemberus-gaap:ValuationTechniqueOptionPricingModelMemberms:MeasurementInputForeignExchangeCorrelationMemberus-gaap:EquityContractMember2019-12-310000895421us-gaap:FairValueInputsLevel3Memberus-gaap:FairValueMeasurementsRecurringMemberus-gaap:ValuationTechniqueOptionPricingModelMemberms:MeasurementInputInterestRateCorrelationMembersrt:MinimumMemberus-gaap:EquityContractMember2020-12-310000895421us-gaap:FairValueInputsLevel3Membersrt:MaximumMemberus-gaap:FairValueMeasurementsRecurringMemberus-gaap:ValuationTechniqueOptionPricingModelMemberms:MeasurementInputInterestRateCorrelationMemberus-gaap:EquityContractMember2020-12-310000895421srt:ArithmeticAverageMemberus-gaap:FairValueInputsLevel3Memberus-gaap:FairValueMeasurementsRecurringMemberus-gaap:ValuationTechniqueOptionPricingModelMemberms:MeasurementInputInterestRateCorrelationMemberus-gaap:EquityContractMember2020-12-310000895421us-gaap:FairValueInputsLevel3Membersrt:MedianMemberus-gaap:FairValueMeasurementsRecurringMemberus-gaap:ValuationTechniqueOptionPricingModelMemberms:MeasurementInputInterestRateCorrelationMemberus-gaap:EquityContractMember2020-12-310000895421us-gaap:FairValueInputsLevel3Memberus-gaap:FairValueMeasurementsRecurringMemberus-gaap:ValuationTechniqueOptionPricingModelMemberms:MeasurementInputInterestRateCorrelationMembersrt:MinimumMemberus-gaap:EquityContractMember2019-12-310000895421us-gaap:FairValueInputsLevel3Membersrt:MaximumMemberus-gaap:FairValueMeasurementsRecurringMemberus-gaap:ValuationTechniqueOptionPricingModelMemberms:MeasurementInputInterestRateCorrelationMemberus-gaap:EquityContractMember2019-12-310000895421srt:ArithmeticAverageMemberus-gaap:FairValueInputsLevel3Memberus-gaap:FairValueMeasurementsRecurringMemberus-gaap:ValuationTechniqueOptionPricingModelMemberms:MeasurementInputInterestRateCorrelationMemberus-gaap:EquityContractMember2019-12-310000895421us-gaap:FairValueInputsLevel3Membersrt:MedianMemberus-gaap:FairValueMeasurementsRecurringMemberus-gaap:ValuationTechniqueOptionPricingModelMemberms:MeasurementInputInterestRateCorrelationMemberus-gaap:EquityContractMember2019-12-310000895421us-gaap:FairValueInputsLevel3Memberms:CommodityAndOtherContractsMemberus-gaap:FairValueMeasurementsRecurringMember2020-12-310000895421us-gaap:FairValueInputsLevel3Memberms:CommodityAndOtherContractsMemberus-gaap:FairValueMeasurementsRecurringMember2019-12-310000895421ms:MeasurementInputForwardPowerPriceMemberus-gaap:FairValueInputsLevel3Memberms:CommodityAndOtherContractsMemberus-gaap:FairValueMeasurementsRecurringMemberus-gaap:ValuationTechniqueOptionPricingModelMembersrt:MinimumMember2020-12-310000895421ms:MeasurementInputForwardPowerPriceMemberus-gaap:FairValueInputsLevel3Memberms:CommodityAndOtherContractsMembersrt:MaximumMemberus-gaap:FairValueMeasurementsRecurringMemberus-gaap:ValuationTechniqueOptionPricingModelMember2020-12-310000895421ms:MeasurementInputForwardPowerPriceMemberus-gaap:FairValueInputsLevel3Membersrt:WeightedAverageMemberms:CommodityAndOtherContractsMemberus-gaap:FairValueMeasurementsRecurringMemberus-gaap:ValuationTechniqueOptionPricingModelMember2020-12-310000895421ms:MeasurementInputForwardPowerPriceMemberus-gaap:FairValueInputsLevel3Memberms:CommodityAndOtherContractsMemberus-gaap:FairValueMeasurementsRecurringMemberus-gaap:ValuationTechniqueOptionPricingModelMembersrt:MinimumMember2019-12-310000895421ms:MeasurementInputForwardPowerPriceMemberus-gaap:FairValueInputsLevel3Memberms:CommodityAndOtherContractsMembersrt:MaximumMemberus-gaap:FairValueMeasurementsRecurringMemberus-gaap:ValuationTechniqueOptionPricingModelMember2019-12-310000895421ms:MeasurementInputForwardPowerPriceMemberus-gaap:FairValueInputsLevel3Membersrt:WeightedAverageMemberms:CommodityAndOtherContractsMemberus-gaap:FairValueMeasurementsRecurringMemberus-gaap:ValuationTechniqueOptionPricingModelMember2019-12-310000895421us-gaap:FairValueInputsLevel3Memberms:CommodityAndOtherContractsMemberus-gaap:FairValueMeasurementsRecurringMemberus-gaap:ValuationTechniqueOptionPricingModelMemberms:MeasurementInputCommodityVolatilityMembersrt:MinimumMember2020-12-310000895421us-gaap:FairValueInputsLevel3Memberms:CommodityAndOtherContractsMembersrt:MaximumMemberus-gaap:FairValueMeasurementsRecurringMemberus-gaap:ValuationTechniqueOptionPricingModelMemberms:MeasurementInputCommodityVolatilityMember2020-12-310000895421us-gaap:FairValueInputsLevel3Membersrt:WeightedAverageMemberms:CommodityAndOtherContractsMemberus-gaap:FairValueMeasurementsRecurringMemberus-gaap:ValuationTechniqueOptionPricingModelMemberms:MeasurementInputCommodityVolatilityMember2020-12-310000895421us-gaap:FairValueInputsLevel3Memberms:CommodityAndOtherContractsMemberus-gaap:FairValueMeasurementsRecurringMemberus-gaap:ValuationTechniqueOptionPricingModelMemberms:MeasurementInputCommodityVolatilityMembersrt:MinimumMember2019-12-310000895421us-gaap:FairValueInputsLevel3Memberms:CommodityAndOtherContractsMembersrt:MaximumMemberus-gaap:FairValueMeasurementsRecurringMemberus-gaap:ValuationTechniqueOptionPricingModelMemberms:MeasurementInputCommodityVolatilityMember2019-12-310000895421us-gaap:FairValueInputsLevel3Membersrt:WeightedAverageMemberms:CommodityAndOtherContractsMemberus-gaap:FairValueMeasurementsRecurringMemberus-gaap:ValuationTechniqueOptionPricingModelMemberms:MeasurementInputCommodityVolatilityMember2019-12-310000895421ms:MeasurementInputCrossCommodityCorrelationMemberus-gaap:FairValueInputsLevel3Memberms:CommodityAndOtherContractsMemberus-gaap:FairValueMeasurementsRecurringMemberus-gaap:ValuationTechniqueOptionPricingModelMembersrt:MinimumMember2020-12-310000895421ms:MeasurementInputCrossCommodityCorrelationMemberus-gaap:FairValueInputsLevel3Memberms:CommodityAndOtherContractsMembersrt:MaximumMemberus-gaap:FairValueMeasurementsRecurringMemberus-gaap:ValuationTechniqueOptionPricingModelMember2020-12-310000895421ms:MeasurementInputCrossCommodityCorrelationMemberus-gaap:FairValueInputsLevel3Membersrt:WeightedAverageMemberms:CommodityAndOtherContractsMemberus-gaap:FairValueMeasurementsRecurringMemberus-gaap:ValuationTechniqueOptionPricingModelMember2020-12-310000895421ms:MeasurementInputCrossCommodityCorrelationMemberus-gaap:FairValueInputsLevel3Memberms:CommodityAndOtherContractsMemberus-gaap:FairValueMeasurementsRecurringMemberus-gaap:ValuationTechniqueOptionPricingModelMembersrt:MinimumMember2019-12-310000895421ms:MeasurementInputCrossCommodityCorrelationMemberus-gaap:FairValueInputsLevel3Memberms:CommodityAndOtherContractsMembersrt:MaximumMemberus-gaap:FairValueMeasurementsRecurringMemberus-gaap:ValuationTechniqueOptionPricingModelMember2019-12-310000895421ms:MeasurementInputCrossCommodityCorrelationMemberus-gaap:FairValueInputsLevel3Membersrt:WeightedAverageMemberms:CommodityAndOtherContractsMemberus-gaap:FairValueMeasurementsRecurringMemberus-gaap:ValuationTechniqueOptionPricingModelMember2019-12-310000895421ms:MeasurementInputEquityVolatilityMemberus-gaap:FairValueInputsLevel3Memberus-gaap:FairValueMeasurementsRecurringMemberus-gaap:ValuationTechniqueOptionPricingModelMembersrt:MinimumMember2020-12-310000895421ms:MeasurementInputEquityVolatilityMemberus-gaap:FairValueInputsLevel3Membersrt:MaximumMemberus-gaap:FairValueMeasurementsRecurringMemberus-gaap:ValuationTechniqueOptionPricingModelMember2020-12-310000895421ms:MeasurementInputEquityVolatilityMemberus-gaap:FairValueInputsLevel3Membersrt:WeightedAverageMemberus-gaap:FairValueMeasurementsRecurringMemberus-gaap:ValuationTechniqueOptionPricingModelMember2020-12-310000895421ms:MeasurementInputEquityVolatilityMemberus-gaap:FairValueInputsLevel3Memberus-gaap:FairValueMeasurementsRecurringMemberus-gaap:ValuationTechniqueOptionPricingModelMembersrt:MinimumMember2019-12-310000895421ms:MeasurementInputEquityVolatilityMemberus-gaap:FairValueInputsLevel3Membersrt:MaximumMemberus-gaap:FairValueMeasurementsRecurringMemberus-gaap:ValuationTechniqueOptionPricingModelMember2019-12-310000895421ms:MeasurementInputEquityVolatilityMemberus-gaap:FairValueInputsLevel3Membersrt:WeightedAverageMemberus-gaap:FairValueMeasurementsRecurringMemberus-gaap:ValuationTechniqueOptionPricingModelMember2019-12-310000895421us-gaap:FairValueInputsLevel3Memberus-gaap:MeasurementInputSharePriceMemberms:CorporateEquitiesMembersrt:MaximumMemberus-gaap:FairValueMeasurementsRecurringMemberms:ValuationTechniqueComparablePricingMember2020-12-310000895421us-gaap:FairValueInputsLevel3Memberus-gaap:MeasurementInputSharePriceMemberms:CorporateEquitiesMemberus-gaap:FairValueMeasurementsRecurringMemberms:ValuationTechniqueComparablePricingMembersrt:MinimumMember2020-12-310000895421ms:MeasurementInputFundingSpreadMemberus-gaap:FairValueInputsLevel3Memberus-gaap:FairValueMeasurementsRecurringMemberus-gaap:ValuationTechniqueDiscountedCashFlowMembersrt:MinimumMember2020-12-310000895421ms:MeasurementInputFundingSpreadMemberus-gaap:FairValueInputsLevel3Membersrt:MaximumMemberus-gaap:FairValueMeasurementsRecurringMemberus-gaap:ValuationTechniqueDiscountedCashFlowMember2020-12-310000895421ms:MeasurementInputFundingSpreadMemberus-gaap:FairValueInputsLevel3Membersrt:WeightedAverageMemberus-gaap:FairValueMeasurementsRecurringMemberus-gaap:ValuationTechniqueDiscountedCashFlowMember2020-12-310000895421ms:MeasurementInputFundingSpreadMemberus-gaap:FairValueInputsLevel3Memberus-gaap:FairValueMeasurementsRecurringMemberus-gaap:ValuationTechniqueDiscountedCashFlowMembersrt:MinimumMember2019-12-310000895421ms:MeasurementInputFundingSpreadMemberus-gaap:FairValueInputsLevel3Membersrt:MaximumMemberus-gaap:FairValueMeasurementsRecurringMemberus-gaap:ValuationTechniqueDiscountedCashFlowMember2019-12-310000895421ms:MeasurementInputFundingSpreadMemberus-gaap:FairValueInputsLevel3Membersrt:WeightedAverageMemberus-gaap:FairValueMeasurementsRecurringMemberus-gaap:ValuationTechniqueDiscountedCashFlowMember2019-12-310000895421ms:MeasurementInputLoanPriceMemberus-gaap:FairValueInputsLevel3Memberus-gaap:FairValueMeasurementsRecurringMemberms:ValuationTechniqueComparablePricingMembersrt:MinimumMember2020-12-310000895421ms:MeasurementInputLoanPriceMemberus-gaap:FairValueInputsLevel3Membersrt:MaximumMemberus-gaap:FairValueMeasurementsRecurringMemberms:ValuationTechniqueComparablePricingMember2020-12-310000895421ms:MeasurementInputLoanPriceMemberus-gaap:FairValueInputsLevel3Membersrt:WeightedAverageMemberus-gaap:FairValueMeasurementsRecurringMemberms:ValuationTechniqueComparablePricingMember2020-12-310000895421ms:MeasurementInputEquityVolatilitySkewMemberus-gaap:FairValueInputsLevel3Memberus-gaap:FairValueMeasurementsRecurringMemberus-gaap:ValuationTechniqueOptionPricingModelMembersrt:MinimumMember2020-12-310000895421ms:MeasurementInputEquityVolatilitySkewMemberus-gaap:FairValueInputsLevel3Membersrt:MaximumMemberus-gaap:FairValueMeasurementsRecurringMemberus-gaap:ValuationTechniqueOptionPricingModelMember2020-12-310000895421ms:MeasurementInputEquityVolatilitySkewMemberus-gaap:FairValueInputsLevel3Membersrt:WeightedAverageMemberus-gaap:FairValueMeasurementsRecurringMemberus-gaap:ValuationTechniqueOptionPricingModelMember2020-12-310000895421ms:MeasurementInputEquityVolatilitySkewMemberus-gaap:FairValueInputsLevel3Memberus-gaap:FairValueMeasurementsRecurringMemberus-gaap:ValuationTechniqueOptionPricingModelMembersrt:MinimumMember2019-12-310000895421ms:MeasurementInputEquityVolatilitySkewMemberus-gaap:FairValueInputsLevel3Membersrt:MaximumMemberus-gaap:FairValueMeasurementsRecurringMemberus-gaap:ValuationTechniqueOptionPricingModelMember2019-12-310000895421ms:MeasurementInputEquityVolatilitySkewMemberus-gaap:FairValueInputsLevel3Membersrt:WeightedAverageMemberus-gaap:FairValueMeasurementsRecurringMemberus-gaap:ValuationTechniqueOptionPricingModelMember2019-12-310000895421ms:MeasurementInputEquityCorrelationMemberus-gaap:FairValueInputsLevel3Memberus-gaap:FairValueMeasurementsRecurringMemberus-gaap:ValuationTechniqueOptionPricingModelMembersrt:MinimumMember2020-12-310000895421ms:MeasurementInputEquityCorrelationMemberus-gaap:FairValueInputsLevel3Membersrt:MaximumMemberus-gaap:FairValueMeasurementsRecurringMemberus-gaap:ValuationTechniqueOptionPricingModelMember2020-12-310000895421ms:MeasurementInputEquityCorrelationMemberus-gaap:FairValueInputsLevel3Membersrt:WeightedAverageMemberus-gaap:FairValueMeasurementsRecurringMemberus-gaap:ValuationTechniqueOptionPricingModelMember2020-12-310000895421ms:MeasurementInputEquityCorrelationMemberus-gaap:FairValueInputsLevel3Memberus-gaap:FairValueMeasurementsRecurringMemberus-gaap:ValuationTechniqueOptionPricingModelMembersrt:MinimumMember2019-12-310000895421ms:MeasurementInputEquityCorrelationMemberus-gaap:FairValueInputsLevel3Membersrt:MaximumMemberus-gaap:FairValueMeasurementsRecurringMemberus-gaap:ValuationTechniqueOptionPricingModelMember2019-12-310000895421ms:MeasurementInputEquityCorrelationMemberus-gaap:FairValueInputsLevel3Membersrt:WeightedAverageMemberus-gaap:FairValueMeasurementsRecurringMemberus-gaap:ValuationTechniqueOptionPricingModelMember2019-12-310000895421us-gaap:FairValueInputsLevel3Memberus-gaap:FairValueMeasurementsRecurringMemberus-gaap:ValuationTechniqueOptionPricingModelMembersrt:MinimumMemberms:MeasurementInputEquityForeignExchangeCorrelationMember2020-12-310000895421us-gaap:FairValueInputsLevel3Membersrt:MaximumMemberus-gaap:FairValueMeasurementsRecurringMemberus-gaap:ValuationTechniqueOptionPricingModelMemberms:MeasurementInputEquityForeignExchangeCorrelationMember2020-12-310000895421us-gaap:FairValueInputsLevel3Membersrt:WeightedAverageMemberus-gaap:FairValueMeasurementsRecurringMemberus-gaap:ValuationTechniqueOptionPricingModelMemberms:MeasurementInputEquityForeignExchangeCorrelationMember2020-12-310000895421us-gaap:FairValueInputsLevel3Memberus-gaap:FairValueMeasurementsRecurringMemberus-gaap:ValuationTechniqueOptionPricingModelMembersrt:MinimumMemberms:MeasurementInputEquityForeignExchangeCorrelationMember2019-12-310000895421us-gaap:FairValueInputsLevel3Membersrt:MaximumMemberus-gaap:FairValueMeasurementsRecurringMemberus-gaap:ValuationTechniqueOptionPricingModelMemberms:MeasurementInputEquityForeignExchangeCorrelationMember2019-12-310000895421us-gaap:FairValueInputsLevel3Membersrt:WeightedAverageMemberus-gaap:FairValueMeasurementsRecurringMemberus-gaap:ValuationTechniqueOptionPricingModelMemberms:MeasurementInputEquityForeignExchangeCorrelationMember2019-12-310000895421us-gaap:FairValueInputsLevel3Memberus-gaap:FairValueMeasurementsRecurringMemberus-gaap:ValuationTechniqueOptionPricingModelMembersrt:MinimumMemberms:MeasurementInputInterestRateForeignExchangeCorrelationMember2020-12-310000895421us-gaap:FairValueInputsLevel3Membersrt:MaximumMemberus-gaap:FairValueMeasurementsRecurringMemberus-gaap:ValuationTechniqueOptionPricingModelMemberms:MeasurementInputInterestRateForeignExchangeCorrelationMember2020-12-310000895421srt:ArithmeticAverageMemberus-gaap:FairValueInputsLevel3Memberus-gaap:FairValueMeasurementsRecurringMemberus-gaap:ValuationTechniqueOptionPricingModelMemberms:MeasurementInputInterestRateForeignExchangeCorrelationMember2020-12-310000895421us-gaap:FairValueInputsLevel3Membersrt:MedianMemberus-gaap:FairValueMeasurementsRecurringMemberus-gaap:ValuationTechniqueOptionPricingModelMemberms:MeasurementInputInterestRateForeignExchangeCorrelationMember2020-12-310000895421us-gaap:FairValueInputsLevel3Memberus-gaap:FairValueMeasurementsRecurringMemberus-gaap:ValuationTechniqueOptionPricingModelMembersrt:MinimumMemberms:MeasurementInputInterestRateForeignExchangeCorrelationMember2019-12-310000895421us-gaap:FairValueInputsLevel3Membersrt:MaximumMemberus-gaap:FairValueMeasurementsRecurringMemberus-gaap:ValuationTechniqueOptionPricingModelMemberms:MeasurementInputInterestRateForeignExchangeCorrelationMember2019-12-310000895421srt:ArithmeticAverageMemberus-gaap:FairValueInputsLevel3Memberus-gaap:FairValueMeasurementsRecurringMemberus-gaap:ValuationTechniqueOptionPricingModelMemberms:MeasurementInputInterestRateForeignExchangeCorrelationMember2019-12-310000895421us-gaap:FairValueInputsLevel3Membersrt:MedianMemberus-gaap:FairValueMeasurementsRecurringMemberus-gaap:ValuationTechniqueOptionPricingModelMemberms:MeasurementInputInterestRateForeignExchangeCorrelationMember2019-12-310000895421us-gaap:FairValueInputsLevel3Memberus-gaap:FairValueMeasurementsNonrecurringMember2020-12-310000895421us-gaap:FairValueInputsLevel3Memberus-gaap:FairValueMeasurementsNonrecurringMember2019-12-310000895421us-gaap:FairValueInputsLevel3Memberms:ValuationTechniqueCorporateLoanModelMemberus-gaap:FairValueMeasurementsNonrecurringMemberus-gaap:MeasurementInputCreditSpreadMembersrt:MinimumMember2020-12-310000895421us-gaap:FairValueInputsLevel3Membersrt:MaximumMemberms:ValuationTechniqueCorporateLoanModelMemberus-gaap:FairValueMeasurementsNonrecurringMemberus-gaap:MeasurementInputCreditSpreadMember2020-12-310000895421us-gaap:FairValueInputsLevel3Membersrt:WeightedAverageMemberms:ValuationTechniqueCorporateLoanModelMemberus-gaap:FairValueMeasurementsNonrecurringMemberus-gaap:MeasurementInputCreditSpreadMember2020-12-310000895421us-gaap:FairValueInputsLevel3Memberms:ValuationTechniqueCorporateLoanModelMemberus-gaap:FairValueMeasurementsNonrecurringMemberus-gaap:MeasurementInputCreditSpreadMembersrt:MinimumMember2019-12-310000895421us-gaap:FairValueInputsLevel3Membersrt:MaximumMemberms:ValuationTechniqueCorporateLoanModelMemberus-gaap:FairValueMeasurementsNonrecurringMemberus-gaap:MeasurementInputCreditSpreadMember2019-12-310000895421us-gaap:FairValueInputsLevel3Membersrt:WeightedAverageMemberms:ValuationTechniqueCorporateLoanModelMemberus-gaap:FairValueMeasurementsNonrecurringMemberus-gaap:MeasurementInputCreditSpreadMember2019-12-310000895421ms:ValuationTechniqueWarehouseModelMemberus-gaap:FairValueInputsLevel3Memberus-gaap:FairValueMeasurementsNonrecurringMemberus-gaap:MeasurementInputCreditSpreadMembersrt:MinimumMember2020-12-310000895421ms:ValuationTechniqueWarehouseModelMemberus-gaap:FairValueInputsLevel3Membersrt:MaximumMemberus-gaap:FairValueMeasurementsNonrecurringMemberus-gaap:MeasurementInputCreditSpreadMember2020-12-310000895421ms:ValuationTechniqueWarehouseModelMemberus-gaap:FairValueInputsLevel3Membersrt:WeightedAverageMemberus-gaap:FairValueMeasurementsNonrecurringMemberus-gaap:MeasurementInputCreditSpreadMember2020-12-310000895421ms:ValuationTechniqueWarehouseModelMemberus-gaap:FairValueInputsLevel3Memberus-gaap:FairValueMeasurementsNonrecurringMemberus-gaap:MeasurementInputCreditSpreadMembersrt:MinimumMember2019-12-310000895421ms:ValuationTechniqueWarehouseModelMemberus-gaap:FairValueInputsLevel3Membersrt:MaximumMemberus-gaap:FairValueMeasurementsNonrecurringMemberus-gaap:MeasurementInputCreditSpreadMember2019-12-310000895421ms:ValuationTechniqueWarehouseModelMemberus-gaap:FairValueInputsLevel3Membersrt:WeightedAverageMemberus-gaap:FairValueMeasurementsNonrecurringMemberus-gaap:MeasurementInputCreditSpreadMember2019-12-310000895421us-gaap:FairValueInputsLevel3Memberms:ValuationTechniqueComparablePricingMemberus-gaap:FairValueMeasurementsNonrecurringMembersrt:MinimumMemberms:MeasurementInputBondPriceMember2020-12-310000895421us-gaap:FairValueInputsLevel3Membersrt:MaximumMemberms:ValuationTechniqueComparablePricingMemberus-gaap:FairValueMeasurementsNonrecurringMemberms:MeasurementInputBondPriceMember2020-12-310000895421us-gaap:FairValueInputsLevel3Membersrt:WeightedAverageMemberms:ValuationTechniqueComparablePricingMemberus-gaap:FairValueMeasurementsNonrecurringMemberms:MeasurementInputBondPriceMember2020-12-310000895421us-gaap:PrivateEquityFundsMember2020-12-310000895421us-gaap:PrivateEquityFundsMember2019-12-310000895421us-gaap:RealEstateFundsMember2020-12-310000895421us-gaap:RealEstateFundsMember2019-12-310000895421us-gaap:HedgeFundsMember2020-12-310000895421us-gaap:HedgeFundsMember2019-12-310000895421us-gaap:FairValueInputsLevel2Memberus-gaap:FairValueMeasurementsNonrecurringMember2020-12-310000895421us-gaap:FairValueMeasurementsNonrecurringMember2020-12-310000895421us-gaap:FairValueInputsLevel2Memberus-gaap:FairValueMeasurementsNonrecurringMember2019-12-310000895421us-gaap:FairValueMeasurementsNonrecurringMember2019-12-310000895421ms:LendingCommitmentMemberus-gaap:FairValueMeasurementsNonrecurringMember2020-01-012020-12-310000895421ms:LendingCommitmentMemberus-gaap:FairValueMeasurementsNonrecurringMember2019-01-012019-12-310000895421ms:LendingCommitmentMemberus-gaap:FairValueMeasurementsNonrecurringMember2018-01-012018-12-310000895421ms:IntangibleAssetsMemberus-gaap:FairValueMeasurementsNonrecurringMember2020-01-012020-12-310000895421ms:IntangibleAssetsMemberus-gaap:FairValueMeasurementsNonrecurringMember2019-01-012019-12-310000895421ms:IntangibleAssetsMemberus-gaap:FairValueMeasurementsNonrecurringMember2018-01-012018-12-310000895421us-gaap:OtherInvestmentsMemberus-gaap:FairValueMeasurementsNonrecurringMember2020-01-012020-12-310000895421us-gaap:OtherInvestmentsMemberus-gaap:FairValueMeasurementsNonrecurringMember2019-01-012019-12-310000895421us-gaap:OtherInvestmentsMemberus-gaap:FairValueMeasurementsNonrecurringMember2018-01-012018-12-310000895421ms:PropertyPlantAndEquipmentAndCapitalizedSoftwareCostsMemberus-gaap:FairValueMeasurementsNonrecurringMember2020-01-012020-12-310000895421ms:PropertyPlantAndEquipmentAndCapitalizedSoftwareCostsMemberus-gaap:FairValueMeasurementsNonrecurringMember2019-01-012019-12-310000895421ms:PropertyPlantAndEquipmentAndCapitalizedSoftwareCostsMemberus-gaap:FairValueMeasurementsNonrecurringMember2018-01-012018-12-310000895421ms:RightOfUseAssetsMemberus-gaap:FairValueMeasurementsNonrecurringMember2020-01-012020-12-310000895421ms:RightOfUseAssetsMemberus-gaap:FairValueMeasurementsNonrecurringMember2019-01-012019-12-310000895421ms:RightOfUseAssetsMemberus-gaap:FairValueMeasurementsNonrecurringMember2018-01-012018-12-310000895421us-gaap:AssetsMemberus-gaap:FairValueMeasurementsNonrecurringMember2020-01-012020-12-310000895421us-gaap:AssetsMemberus-gaap:FairValueMeasurementsNonrecurringMember2019-01-012019-12-310000895421us-gaap:AssetsMemberus-gaap:FairValueMeasurementsNonrecurringMember2018-01-012018-12-310000895421us-gaap:OtherLiabilitiesMemberus-gaap:FairValueMeasurementsNonrecurringMember2020-01-012020-12-310000895421us-gaap:OtherLiabilitiesMemberus-gaap:FairValueMeasurementsNonrecurringMember2019-01-012019-12-310000895421us-gaap:OtherLiabilitiesMemberus-gaap:FairValueMeasurementsNonrecurringMember2018-01-012018-12-310000895421us-gaap:FairValueMeasurementsNonrecurringMemberus-gaap:LiabilityMember2020-01-012020-12-310000895421us-gaap:FairValueMeasurementsNonrecurringMemberus-gaap:LiabilityMember2019-01-012019-12-310000895421us-gaap:FairValueMeasurementsNonrecurringMemberus-gaap:LiabilityMember2018-01-012018-12-310000895421us-gaap:PortionAtOtherThanFairValueFairValueDisclosureMember2020-12-310000895421us-gaap:EstimateOfFairValueFairValueDisclosureMemberus-gaap:FairValueInputsLevel1Member2020-12-310000895421us-gaap:EstimateOfFairValueFairValueDisclosureMemberus-gaap:FairValueInputsLevel2Member2020-12-310000895421us-gaap:EstimateOfFairValueFairValueDisclosureMemberus-gaap:FairValueInputsLevel3Member2020-12-310000895421us-gaap:EstimateOfFairValueFairValueDisclosureMember2020-12-310000895421us-gaap:PortionAtOtherThanFairValueFairValueDisclosureMember2019-12-310000895421us-gaap:EstimateOfFairValueFairValueDisclosureMemberus-gaap:FairValueInputsLevel1Member2019-12-310000895421us-gaap:EstimateOfFairValueFairValueDisclosureMemberus-gaap:FairValueInputsLevel2Member2019-12-310000895421us-gaap:EstimateOfFairValueFairValueDisclosureMemberus-gaap:FairValueInputsLevel3Member2019-12-310000895421us-gaap:EstimateOfFairValueFairValueDisclosureMember2019-12-310000895421us-gaap:FairValueMeasurementsRecurringMemberus-gaap:EquityContractMember2020-12-310000895421us-gaap:FairValueMeasurementsRecurringMemberus-gaap:EquityContractMember2019-12-310000895421us-gaap:FairValueMeasurementsRecurringMemberus-gaap:InterestRateContractMember2020-12-310000895421us-gaap:FairValueMeasurementsRecurringMemberus-gaap:InterestRateContractMember2019-12-310000895421ms:CommodityAndOtherContractsMemberus-gaap:FairValueMeasurementsRecurringMember2020-12-310000895421ms:CommodityAndOtherContractsMemberus-gaap:FairValueMeasurementsRecurringMember2019-12-310000895421us-gaap:CreditRiskContractMemberus-gaap:FairValueMeasurementsRecurringMember2020-12-310000895421us-gaap:CreditRiskContractMemberus-gaap:FairValueMeasurementsRecurringMember2019-12-310000895421us-gaap:FairValueMeasurementsRecurringMemberus-gaap:ForeignExchangeContractMember2020-12-310000895421us-gaap:FairValueMeasurementsRecurringMemberus-gaap:ForeignExchangeContractMember2019-12-310000895421us-gaap:DebtMemberus-gaap:TradingRevenueMember2020-01-012020-12-310000895421us-gaap:DebtMemberus-gaap:TradingRevenueMember2019-01-012019-12-310000895421us-gaap:DebtMemberus-gaap:TradingRevenueMember2018-01-012018-12-310000895421us-gaap:InterestExpenseMemberus-gaap:DebtMember2020-01-012020-12-310000895421us-gaap:InterestExpenseMemberus-gaap:DebtMember2019-01-012019-12-310000895421us-gaap:InterestExpenseMemberus-gaap:DebtMember2018-01-012018-12-310000895421us-gaap:DebtMember2020-01-012020-12-310000895421us-gaap:DebtMember2019-01-012019-12-310000895421us-gaap:DebtMember2018-01-012018-12-310000895421ms:LoansAndOtherDebtMemberus-gaap:TradingRevenueMember2020-01-012020-12-310000895421ms:LoansAndOtherDebtMemberus-gaap:OtherComprehensiveIncomeMember2020-01-012020-12-310000895421us-gaap:WrittenLoanCommitmentFairValueOptionMemberus-gaap:TradingRevenueMember2020-01-012020-12-310000895421us-gaap:WrittenLoanCommitmentFairValueOptionMemberus-gaap:OtherComprehensiveIncomeMember2020-01-012020-12-310000895421us-gaap:DepositsMemberus-gaap:TradingRevenueMember2020-01-012020-12-310000895421us-gaap:OtherComprehensiveIncomeMemberus-gaap:DepositsMember2020-01-012020-12-310000895421us-gaap:OtherComprehensiveIncomeMemberus-gaap:DebtMember2020-01-012020-12-310000895421ms:LoansAndOtherDebtMemberus-gaap:TradingRevenueMember2019-01-012019-12-310000895421ms:LoansAndOtherDebtMemberus-gaap:OtherComprehensiveIncomeMember2019-01-012019-12-310000895421us-gaap:WrittenLoanCommitmentFairValueOptionMemberus-gaap:TradingRevenueMember2019-01-012019-12-310000895421us-gaap:WrittenLoanCommitmentFairValueOptionMemberus-gaap:OtherComprehensiveIncomeMember2019-01-012019-12-310000895421us-gaap:DepositsMemberus-gaap:TradingRevenueMember2019-01-012019-12-310000895421us-gaap:OtherComprehensiveIncomeMemberus-gaap:DepositsMember2019-01-012019-12-310000895421us-gaap:OtherComprehensiveIncomeMemberus-gaap:DebtMember2019-01-012019-12-310000895421ms:LoansAndOtherDebtMemberus-gaap:TradingRevenueMember2018-01-012018-12-310000895421ms:LoansAndOtherDebtMemberus-gaap:OtherComprehensiveIncomeMember2018-01-012018-12-310000895421us-gaap:WrittenLoanCommitmentFairValueOptionMemberus-gaap:TradingRevenueMember2018-01-012018-12-310000895421us-gaap:WrittenLoanCommitmentFairValueOptionMemberus-gaap:OtherComprehensiveIncomeMember2018-01-012018-12-310000895421us-gaap:DepositsMemberus-gaap:TradingRevenueMember2018-01-012018-12-310000895421us-gaap:OtherComprehensiveIncomeMemberus-gaap:DepositsMember2018-01-012018-12-310000895421us-gaap:OtherComprehensiveIncomeMemberus-gaap:DebtMember2018-01-012018-12-310000895421us-gaap:OtherDebtSecuritiesMemberus-gaap:TradingRevenueMember2018-01-012018-12-310000895421us-gaap:OtherDebtSecuritiesMemberus-gaap:OtherComprehensiveIncomeMember2018-01-012018-12-310000895421us-gaap:DesignatedAsHedgingInstrumentMemberus-gaap:OverTheCounterMemberus-gaap:InterestRateContractMember2020-12-310000895421us-gaap:ExchangeClearedMemberus-gaap:DesignatedAsHedgingInstrumentMemberus-gaap:InterestRateContractMember2020-12-310000895421us-gaap:DesignatedAsHedgingInstrumentMemberus-gaap:InterestRateContractMemberus-gaap:ExchangeTradedMember2020-12-310000895421us-gaap:DesignatedAsHedgingInstrumentMemberus-gaap:InterestRateContractMember2020-12-310000895421us-gaap:DesignatedAsHedgingInstrumentMemberus-gaap:OverTheCounterMemberus-gaap:ForeignExchangeContractMember2020-12-310000895421us-gaap:ExchangeClearedMemberus-gaap:DesignatedAsHedgingInstrumentMemberus-gaap:ForeignExchangeContractMember2020-12-310000895421us-gaap:DesignatedAsHedgingInstrumentMemberus-gaap:ForeignExchangeContractMemberus-gaap:ExchangeTradedMember2020-12-310000895421us-gaap:DesignatedAsHedgingInstrumentMemberus-gaap:ForeignExchangeContractMember2020-12-310000895421us-gaap:DesignatedAsHedgingInstrumentMemberus-gaap:OverTheCounterMember2020-12-310000895421us-gaap:ExchangeClearedMemberus-gaap:DesignatedAsHedgingInstrumentMember2020-12-310000895421us-gaap:DesignatedAsHedgingInstrumentMemberus-gaap:ExchangeTradedMember2020-12-310000895421us-gaap:DesignatedAsHedgingInstrumentMember2020-12-310000895421us-gaap:OverTheCounterMemberus-gaap:NondesignatedMemberus-gaap:InterestRateContractMember2020-12-310000895421us-gaap:ExchangeClearedMemberus-gaap:NondesignatedMemberus-gaap:InterestRateContractMember2020-12-310000895421us-gaap:NondesignatedMemberus-gaap:InterestRateContractMemberus-gaap:ExchangeTradedMember2020-12-310000895421us-gaap:NondesignatedMemberus-gaap:InterestRateContractMember2020-12-310000895421us-gaap:CreditRiskContractMemberus-gaap:OverTheCounterMemberus-gaap:NondesignatedMember2020-12-310000895421us-gaap:ExchangeClearedMemberus-gaap:CreditRiskContractMemberus-gaap:NondesignatedMember2020-12-310000895421us-gaap:CreditRiskContractMemberus-gaap:NondesignatedMemberus-gaap:ExchangeTradedMember2020-12-310000895421us-gaap:CreditRiskContractMemberus-gaap:NondesignatedMember2020-12-310000895421us-gaap:OverTheCounterMemberus-gaap:ForeignExchangeContractMemberus-gaap:NondesignatedMember2020-12-310000895421us-gaap:ExchangeClearedMemberus-gaap:ForeignExchangeContractMemberus-gaap:NondesignatedMember2020-12-310000895421us-gaap:ForeignExchangeContractMemberus-gaap:NondesignatedMemberus-gaap:ExchangeTradedMember2020-12-310000895421us-gaap:ForeignExchangeContractMemberus-gaap:NondesignatedMember2020-12-310000895421us-gaap:OverTheCounterMemberus-gaap:NondesignatedMemberus-gaap:EquityContractMember2020-12-310000895421us-gaap:ExchangeClearedMemberus-gaap:NondesignatedMemberus-gaap:EquityContractMember2020-12-310000895421us-gaap:NondesignatedMemberus-gaap:EquityContractMemberus-gaap:ExchangeTradedMember2020-12-310000895421us-gaap:NondesignatedMemberus-gaap:EquityContractMember2020-12-310000895421ms:CommodityAndOtherContractsMemberus-gaap:OverTheCounterMemberus-gaap:NondesignatedMember2020-12-310000895421ms:CommodityAndOtherContractsMemberus-gaap:ExchangeClearedMemberus-gaap:NondesignatedMember2020-12-310000895421ms:CommodityAndOtherContractsMemberus-gaap:NondesignatedMemberus-gaap:ExchangeTradedMember2020-12-310000895421ms:CommodityAndOtherContractsMemberus-gaap:NondesignatedMember2020-12-310000895421us-gaap:OverTheCounterMemberus-gaap:NondesignatedMember2020-12-310000895421us-gaap:ExchangeClearedMemberus-gaap:NondesignatedMember2020-12-310000895421us-gaap:NondesignatedMemberus-gaap:ExchangeTradedMember2020-12-310000895421us-gaap:NondesignatedMember2020-12-310000895421us-gaap:OverTheCounterMember2020-12-310000895421us-gaap:ExchangeClearedMember2020-12-310000895421us-gaap:ExchangeTradedMember2020-12-310000895421us-gaap:DesignatedAsHedgingInstrumentMemberus-gaap:OverTheCounterMemberus-gaap:InterestRateContractMember2019-12-310000895421us-gaap:ExchangeClearedMemberus-gaap:DesignatedAsHedgingInstrumentMemberus-gaap:InterestRateContractMember2019-12-310000895421us-gaap:DesignatedAsHedgingInstrumentMemberus-gaap:InterestRateContractMemberus-gaap:ExchangeTradedMember2019-12-310000895421us-gaap:DesignatedAsHedgingInstrumentMemberus-gaap:InterestRateContractMember2019-12-310000895421us-gaap:DesignatedAsHedgingInstrumentMemberus-gaap:OverTheCounterMemberus-gaap:ForeignExchangeContractMember2019-12-310000895421us-gaap:ExchangeClearedMemberus-gaap:DesignatedAsHedgingInstrumentMemberus-gaap:ForeignExchangeContractMember2019-12-310000895421us-gaap:DesignatedAsHedgingInstrumentMemberus-gaap:ForeignExchangeContractMemberus-gaap:ExchangeTradedMember2019-12-310000895421us-gaap:DesignatedAsHedgingInstrumentMemberus-gaap:ForeignExchangeContractMember2019-12-310000895421us-gaap:DesignatedAsHedgingInstrumentMemberus-gaap:OverTheCounterMember2019-12-310000895421us-gaap:ExchangeClearedMemberus-gaap:DesignatedAsHedgingInstrumentMember2019-12-310000895421us-gaap:DesignatedAsHedgingInstrumentMemberus-gaap:ExchangeTradedMember2019-12-310000895421us-gaap:DesignatedAsHedgingInstrumentMember2019-12-310000895421us-gaap:OverTheCounterMemberus-gaap:NondesignatedMemberus-gaap:InterestRateContractMember2019-12-310000895421us-gaap:ExchangeClearedMemberus-gaap:NondesignatedMemberus-gaap:InterestRateContractMember2019-12-310000895421us-gaap:NondesignatedMemberus-gaap:InterestRateContractMemberus-gaap:ExchangeTradedMember2019-12-310000895421us-gaap:NondesignatedMemberus-gaap:InterestRateContractMember2019-12-310000895421us-gaap:CreditRiskContractMemberus-gaap:OverTheCounterMemberus-gaap:NondesignatedMember2019-12-310000895421us-gaap:ExchangeClearedMemberus-gaap:CreditRiskContractMemberus-gaap:NondesignatedMember2019-12-310000895421us-gaap:CreditRiskContractMemberus-gaap:NondesignatedMemberus-gaap:ExchangeTradedMember2019-12-310000895421us-gaap:CreditRiskContractMemberus-gaap:NondesignatedMember2019-12-310000895421us-gaap:OverTheCounterMemberus-gaap:ForeignExchangeContractMemberus-gaap:NondesignatedMember2019-12-310000895421us-gaap:ExchangeClearedMemberus-gaap:ForeignExchangeContractMemberus-gaap:NondesignatedMember2019-12-310000895421us-gaap:ForeignExchangeContractMemberus-gaap:NondesignatedMemberus-gaap:ExchangeTradedMember2019-12-310000895421us-gaap:ForeignExchangeContractMemberus-gaap:NondesignatedMember2019-12-310000895421us-gaap:OverTheCounterMemberus-gaap:NondesignatedMemberus-gaap:EquityContractMember2019-12-310000895421us-gaap:ExchangeClearedMemberus-gaap:NondesignatedMemberus-gaap:EquityContractMember2019-12-310000895421us-gaap:NondesignatedMemberus-gaap:EquityContractMemberus-gaap:ExchangeTradedMember2019-12-310000895421us-gaap:NondesignatedMemberus-gaap:EquityContractMember2019-12-310000895421ms:CommodityAndOtherContractsMemberus-gaap:OverTheCounterMemberus-gaap:NondesignatedMember2019-12-310000895421ms:CommodityAndOtherContractsMemberus-gaap:ExchangeClearedMemberus-gaap:NondesignatedMember2019-12-310000895421ms:CommodityAndOtherContractsMemberus-gaap:NondesignatedMemberus-gaap:ExchangeTradedMember2019-12-310000895421ms:CommodityAndOtherContractsMemberus-gaap:NondesignatedMember2019-12-310000895421us-gaap:OverTheCounterMemberus-gaap:NondesignatedMember2019-12-310000895421us-gaap:ExchangeClearedMemberus-gaap:NondesignatedMember2019-12-310000895421us-gaap:NondesignatedMemberus-gaap:ExchangeTradedMember2019-12-310000895421us-gaap:NondesignatedMember2019-12-310000895421us-gaap:OverTheCounterMember2019-12-310000895421us-gaap:ExchangeClearedMember2019-12-310000895421us-gaap:ExchangeTradedMember2019-12-310000895421us-gaap:InterestIncomeMemberus-gaap:FairValueHedgingMemberus-gaap:InterestRateContractMember2020-01-012020-12-310000895421us-gaap:InterestIncomeMemberus-gaap:FairValueHedgingMemberus-gaap:InterestRateContractMember2019-01-012019-12-310000895421us-gaap:InterestIncomeMemberus-gaap:FairValueHedgingMemberus-gaap:InterestRateContractMember2018-01-012018-12-310000895421us-gaap:InterestIncomeMemberus-gaap:FairValueHedgingMemberus-gaap:AvailableforsaleSecuritiesMember2020-01-012020-12-310000895421us-gaap:InterestIncomeMemberus-gaap:FairValueHedgingMemberus-gaap:AvailableforsaleSecuritiesMember2019-01-012019-12-310000895421us-gaap:InterestIncomeMemberus-gaap:FairValueHedgingMemberus-gaap:AvailableforsaleSecuritiesMember2018-01-012018-12-310000895421us-gaap:InterestExpenseMemberus-gaap:FairValueHedgingMemberus-gaap:InterestRateContractMember2020-01-012020-12-310000895421us-gaap:InterestExpenseMemberus-gaap:FairValueHedgingMemberus-gaap:InterestRateContractMember2019-01-012019-12-310000895421us-gaap:InterestExpenseMemberus-gaap:FairValueHedgingMemberus-gaap:InterestRateContractMember2018-01-012018-12-310000895421us-gaap:InterestExpenseMemberus-gaap:FairValueHedgingMemberus-gaap:DepositsMember2020-01-012020-12-310000895421us-gaap:InterestExpenseMemberus-gaap:FairValueHedgingMemberus-gaap:DepositsMember2019-01-012019-12-310000895421us-gaap:InterestExpenseMemberus-gaap:FairValueHedgingMemberus-gaap:DepositsMember2018-01-012018-12-310000895421us-gaap:InterestExpenseMemberus-gaap:BorrowingsMemberus-gaap:FairValueHedgingMember2020-01-012020-12-310000895421us-gaap:InterestExpenseMemberus-gaap:BorrowingsMemberus-gaap:FairValueHedgingMember2019-01-012019-12-310000895421us-gaap:InterestExpenseMemberus-gaap:BorrowingsMemberus-gaap:FairValueHedgingMember2018-01-012018-12-310000895421us-gaap:NetInvestmentHedgingMemberus-gaap:ForeignExchangeContractMember2020-01-012020-12-310000895421us-gaap:NetInvestmentHedgingMemberus-gaap:ForeignExchangeContractMember2019-01-012019-12-310000895421us-gaap:NetInvestmentHedgingMemberus-gaap:ForeignExchangeContractMember2018-01-012018-12-310000895421us-gaap:AvailableforsaleSecuritiesMember2020-12-310000895421us-gaap:AvailableforsaleSecuritiesMember2019-12-310000895421us-gaap:DepositsMember2020-12-310000895421us-gaap:DepositsMember2019-12-310000895421us-gaap:BorrowingsMember2020-12-310000895421us-gaap:BorrowingsMember2019-12-310000895421ms:DerivativeCreditRiskRelatedContingentFeaturesTriggeringCircumstancesOneNotchCreditRatingDowngradeMember2020-12-310000895421ms:DerivativeCreditRiskRelatedContingentFeaturestriggeringCircumstancesTwoNotchCreditRatingDowngradeMember2020-12-310000895421us-gaap:CollaborativeArrangementMember2020-12-310000895421ms:CreditDerivativesSellingProtectionMemberms:LessThanTwelveMonthsFromBalanceSheetDateMemberus-gaap:InternalInvestmentGradeMemberms:SingleNameCreditDefaultSwapMember2020-12-310000895421ms:CreditDerivativesSellingProtectionMemberus-gaap:InternalInvestmentGradeMemberms:SingleNameCreditDefaultSwapMemberms:MoreThanOneAndWithinThreeYearsFromBalanceSheetDateMember2020-12-310000895421ms:CreditDerivativesSellingProtectionMemberus-gaap:InternalInvestmentGradeMemberms:MoreThanThreeAndWithinFiveYearsFromBalanceSheetDateMemberms:SingleNameCreditDefaultSwapMember2020-12-310000895421ms:CreditDerivativesSellingProtectionMemberms:MoreThanFiveYearsFromBalanceSheetDateMemberus-gaap:InternalInvestmentGradeMemberms:SingleNameCreditDefaultSwapMember2020-12-310000895421ms:CreditDerivativesSellingProtectionMemberus-gaap:InternalInvestmentGradeMemberms:SingleNameCreditDefaultSwapMember2020-12-310000895421ms:CreditDerivativesSellingProtectionMemberms:LessThanTwelveMonthsFromBalanceSheetDateMemberus-gaap:InternalNoninvestmentGradeMemberms:SingleNameCreditDefaultSwapMember2020-12-310000895421ms:CreditDerivativesSellingProtectionMemberus-gaap:InternalNoninvestmentGradeMemberms:SingleNameCreditDefaultSwapMemberms:MoreThanOneAndWithinThreeYearsFromBalanceSheetDateMember2020-12-310000895421ms:CreditDerivativesSellingProtectionMemberms:MoreThanThreeAndWithinFiveYearsFromBalanceSheetDateMemberus-gaap:InternalNoninvestmentGradeMemberms:SingleNameCreditDefaultSwapMember2020-12-310000895421ms:CreditDerivativesSellingProtectionMemberms:MoreThanFiveYearsFromBalanceSheetDateMemberus-gaap:InternalNoninvestmentGradeMemberms:SingleNameCreditDefaultSwapMember2020-12-310000895421ms:CreditDerivativesSellingProtectionMemberus-gaap:InternalNoninvestmentGradeMemberms:SingleNameCreditDefaultSwapMember2020-12-310000895421ms:CreditDerivativesSellingProtectionMemberms:LessThanTwelveMonthsFromBalanceSheetDateMemberms:SingleNameCreditDefaultSwapMember2020-12-310000895421ms:CreditDerivativesSellingProtectionMemberms:SingleNameCreditDefaultSwapMemberms:MoreThanOneAndWithinThreeYearsFromBalanceSheetDateMember2020-12-310000895421ms:CreditDerivativesSellingProtectionMemberms:MoreThanThreeAndWithinFiveYearsFromBalanceSheetDateMemberms:SingleNameCreditDefaultSwapMember2020-12-310000895421ms:CreditDerivativesSellingProtectionMemberms:MoreThanFiveYearsFromBalanceSheetDateMemberms:SingleNameCreditDefaultSwapMember2020-12-310000895421ms:CreditDerivativesSellingProtectionMemberms:SingleNameCreditDefaultSwapMember2020-12-310000895421ms:TotalIndexAndBasketCreditDefaultSwapsMemberms:CreditDerivativesSellingProtectionMemberms:LessThanTwelveMonthsFromBalanceSheetDateMemberus-gaap:InternalInvestmentGradeMember2020-12-310000895421ms:TotalIndexAndBasketCreditDefaultSwapsMemberms:CreditDerivativesSellingProtectionMemberus-gaap:InternalInvestmentGradeMemberms:MoreThanOneAndWithinThreeYearsFromBalanceSheetDateMember2020-12-310000895421ms:TotalIndexAndBasketCreditDefaultSwapsMemberms:CreditDerivativesSellingProtectionMemberus-gaap:InternalInvestmentGradeMemberms:MoreThanThreeAndWithinFiveYearsFromBalanceSheetDateMember2020-12-310000895421ms:TotalIndexAndBasketCreditDefaultSwapsMemberms:CreditDerivativesSellingProtectionMemberms:MoreThanFiveYearsFromBalanceSheetDateMemberus-gaap:InternalInvestmentGradeMember2020-12-310000895421ms:TotalIndexAndBasketCreditDefaultSwapsMemberms:CreditDerivativesSellingProtectionMemberus-gaap:InternalInvestmentGradeMember2020-12-310000895421ms:TotalIndexAndBasketCreditDefaultSwapsMemberms:CreditDerivativesSellingProtectionMemberms:LessThanTwelveMonthsFromBalanceSheetDateMemberus-gaap:InternalNoninvestmentGradeMember2020-12-310000895421ms:TotalIndexAndBasketCreditDefaultSwapsMemberms:CreditDerivativesSellingProtectionMemberus-gaap:InternalNoninvestmentGradeMemberms:MoreThanOneAndWithinThreeYearsFromBalanceSheetDateMember2020-12-310000895421ms:TotalIndexAndBasketCreditDefaultSwapsMemberms:CreditDerivativesSellingProtectionMemberms:MoreThanThreeAndWithinFiveYearsFromBalanceSheetDateMemberus-gaap:InternalNoninvestmentGradeMember2020-12-310000895421ms:TotalIndexAndBasketCreditDefaultSwapsMemberms:CreditDerivativesSellingProtectionMemberms:MoreThanFiveYearsFromBalanceSheetDateMemberus-gaap:InternalNoninvestmentGradeMember2020-12-310000895421ms:TotalIndexAndBasketCreditDefaultSwapsMemberms:CreditDerivativesSellingProtectionMemberus-gaap:InternalNoninvestmentGradeMember2020-12-310000895421ms:TotalIndexAndBasketCreditDefaultSwapsMemberms:CreditDerivativesSellingProtectionMemberms:LessThanTwelveMonthsFromBalanceSheetDateMember2020-12-310000895421ms:TotalIndexAndBasketCreditDefaultSwapsMemberms:CreditDerivativesSellingProtectionMemberms:MoreThanOneAndWithinThreeYearsFromBalanceSheetDateMember2020-12-310000895421ms:TotalIndexAndBasketCreditDefaultSwapsMemberms:CreditDerivativesSellingProtectionMemberms:MoreThanThreeAndWithinFiveYearsFromBalanceSheetDateMember2020-12-310000895421ms:TotalIndexAndBasketCreditDefaultSwapsMemberms:CreditDerivativesSellingProtectionMemberms:MoreThanFiveYearsFromBalanceSheetDateMember2020-12-310000895421ms:TotalIndexAndBasketCreditDefaultSwapsMemberms:CreditDerivativesSellingProtectionMember2020-12-310000895421ms:CreditDerivativesSellingProtectionMemberms:LessThanTwelveMonthsFromBalanceSheetDateMemberus-gaap:CreditDefaultSwapMember2020-12-310000895421ms:CreditDerivativesSellingProtectionMemberus-gaap:CreditDefaultSwapMemberms:MoreThanOneAndWithinThreeYearsFromBalanceSheetDateMember2020-12-310000895421ms:CreditDerivativesSellingProtectionMemberms:MoreThanThreeAndWithinFiveYearsFromBalanceSheetDateMemberus-gaap:CreditDefaultSwapMember2020-12-310000895421ms:CreditDerivativesSellingProtectionMemberms:MoreThanFiveYearsFromBalanceSheetDateMemberus-gaap:CreditDefaultSwapMember2020-12-310000895421ms:CreditDerivativesSellingProtectionMemberus-gaap:CreditDefaultSwapMember2020-12-310000895421us-gaap:OtherCreditDerivativesMemberms:CreditDerivativesSellingProtectionMemberms:LessThanTwelveMonthsFromBalanceSheetDateMember2020-12-310000895421us-gaap:OtherCreditDerivativesMemberms:CreditDerivativesSellingProtectionMemberms:MoreThanOneAndWithinThreeYearsFromBalanceSheetDateMember2020-12-310000895421us-gaap:OtherCreditDerivativesMemberms:CreditDerivativesSellingProtectionMemberms:MoreThanThreeAndWithinFiveYearsFromBalanceSheetDateMember2020-12-310000895421us-gaap:OtherCreditDerivativesMemberms:CreditDerivativesSellingProtectionMemberms:MoreThanFiveYearsFromBalanceSheetDateMember2020-12-310000895421us-gaap:OtherCreditDerivativesMemberms:CreditDerivativesSellingProtectionMember2020-12-310000895421ms:LessThanTwelveMonthsFromBalanceSheetDateMemberms:CreditDerivativesSellingProtectionMember2020-12-310000895421ms:CreditDerivativesSellingProtectionMemberms:MoreThanOneAndWithinThreeYearsFromBalanceSheetDateMember2020-12-310000895421ms:CreditDerivativesSellingProtectionMemberms:MoreThanThreeAndWithinFiveYearsFromBalanceSheetDateMember2020-12-310000895421ms:CreditDerivativesSellingProtectionMemberms:MoreThanFiveYearsFromBalanceSheetDateMember2020-12-310000895421ms:CreditDerivativesSellingProtectionMember2020-12-310000895421ms:CreditDerivativesSellingProtectionMemberms:LessThanTwelveMonthsFromBalanceSheetDateMemberus-gaap:InternalInvestmentGradeMemberms:SingleNameCreditDefaultSwapMember2019-12-310000895421ms:CreditDerivativesSellingProtectionMemberus-gaap:InternalInvestmentGradeMemberms:SingleNameCreditDefaultSwapMemberms:MoreThanOneAndWithinThreeYearsFromBalanceSheetDateMember2019-12-310000895421ms:CreditDerivativesSellingProtectionMemberus-gaap:InternalInvestmentGradeMemberms:MoreThanThreeAndWithinFiveYearsFromBalanceSheetDateMemberms:SingleNameCreditDefaultSwapMember2019-12-310000895421ms:CreditDerivativesSellingProtectionMemberms:MoreThanFiveYearsFromBalanceSheetDateMemberus-gaap:InternalInvestmentGradeMemberms:SingleNameCreditDefaultSwapMember2019-12-310000895421ms:CreditDerivativesSellingProtectionMemberus-gaap:InternalInvestmentGradeMemberms:SingleNameCreditDefaultSwapMember2019-12-310000895421ms:CreditDerivativesSellingProtectionMemberms:LessThanTwelveMonthsFromBalanceSheetDateMemberus-gaap:InternalNoninvestmentGradeMemberms:SingleNameCreditDefaultSwapMember2019-12-310000895421ms:CreditDerivativesSellingProtectionMemberus-gaap:InternalNoninvestmentGradeMemberms:SingleNameCreditDefaultSwapMemberms:MoreThanOneAndWithinThreeYearsFromBalanceSheetDateMember2019-12-310000895421ms:CreditDerivativesSellingProtectionMemberms:MoreThanThreeAndWithinFiveYearsFromBalanceSheetDateMemberus-gaap:InternalNoninvestmentGradeMemberms:SingleNameCreditDefaultSwapMember2019-12-310000895421ms:CreditDerivativesSellingProtectionMemberms:MoreThanFiveYearsFromBalanceSheetDateMemberus-gaap:InternalNoninvestmentGradeMemberms:SingleNameCreditDefaultSwapMember2019-12-310000895421ms:CreditDerivativesSellingProtectionMemberus-gaap:InternalNoninvestmentGradeMemberms:SingleNameCreditDefaultSwapMember2019-12-310000895421ms:CreditDerivativesSellingProtectionMemberms:LessThanTwelveMonthsFromBalanceSheetDateMemberms:SingleNameCreditDefaultSwapMember2019-12-310000895421ms:CreditDerivativesSellingProtectionMemberms:SingleNameCreditDefaultSwapMemberms:MoreThanOneAndWithinThreeYearsFromBalanceSheetDateMember2019-12-310000895421ms:CreditDerivativesSellingProtectionMemberms:MoreThanThreeAndWithinFiveYearsFromBalanceSheetDateMemberms:SingleNameCreditDefaultSwapMember2019-12-310000895421ms:CreditDerivativesSellingProtectionMemberms:MoreThanFiveYearsFromBalanceSheetDateMemberms:SingleNameCreditDefaultSwapMember2019-12-310000895421ms:CreditDerivativesSellingProtectionMemberms:SingleNameCreditDefaultSwapMember2019-12-310000895421ms:TotalIndexAndBasketCreditDefaultSwapsMemberms:CreditDerivativesSellingProtectionMemberms:LessThanTwelveMonthsFromBalanceSheetDateMemberus-gaap:InternalInvestmentGradeMember2019-12-310000895421ms:TotalIndexAndBasketCreditDefaultSwapsMemberms:CreditDerivativesSellingProtectionMemberus-gaap:InternalInvestmentGradeMemberms:MoreThanOneAndWithinThreeYearsFromBalanceSheetDateMember2019-12-310000895421ms:TotalIndexAndBasketCreditDefaultSwapsMemberms:CreditDerivativesSellingProtectionMemberus-gaap:InternalInvestmentGradeMemberms:MoreThanThreeAndWithinFiveYearsFromBalanceSheetDateMember2019-12-310000895421ms:TotalIndexAndBasketCreditDefaultSwapsMemberms:CreditDerivativesSellingProtectionMemberms:MoreThanFiveYearsFromBalanceSheetDateMemberus-gaap:InternalInvestmentGradeMember2019-12-310000895421ms:TotalIndexAndBasketCreditDefaultSwapsMemberms:CreditDerivativesSellingProtectionMemberus-gaap:InternalInvestmentGradeMember2019-12-310000895421ms:TotalIndexAndBasketCreditDefaultSwapsMemberms:CreditDerivativesSellingProtectionMemberms:LessThanTwelveMonthsFromBalanceSheetDateMemberus-gaap:InternalNoninvestmentGradeMember2019-12-310000895421ms:TotalIndexAndBasketCreditDefaultSwapsMemberms:CreditDerivativesSellingProtectionMemberus-gaap:InternalNoninvestmentGradeMemberms:MoreThanOneAndWithinThreeYearsFromBalanceSheetDateMember2019-12-310000895421ms:TotalIndexAndBasketCreditDefaultSwapsMemberms:CreditDerivativesSellingProtectionMemberms:MoreThanThreeAndWithinFiveYearsFromBalanceSheetDateMemberus-gaap:InternalNoninvestmentGradeMember2019-12-310000895421ms:TotalIndexAndBasketCreditDefaultSwapsMemberms:CreditDerivativesSellingProtectionMemberms:MoreThanFiveYearsFromBalanceSheetDateMemberus-gaap:InternalNoninvestmentGradeMember2019-12-310000895421ms:TotalIndexAndBasketCreditDefaultSwapsMemberms:CreditDerivativesSellingProtectionMemberus-gaap:InternalNoninvestmentGradeMember2019-12-310000895421ms:TotalIndexAndBasketCreditDefaultSwapsMemberms:CreditDerivativesSellingProtectionMemberms:LessThanTwelveMonthsFromBalanceSheetDateMember2019-12-310000895421ms:TotalIndexAndBasketCreditDefaultSwapsMemberms:CreditDerivativesSellingProtectionMemberms:MoreThanOneAndWithinThreeYearsFromBalanceSheetDateMember2019-12-310000895421ms:TotalIndexAndBasketCreditDefaultSwapsMemberms:CreditDerivativesSellingProtectionMemberms:MoreThanThreeAndWithinFiveYearsFromBalanceSheetDateMember2019-12-310000895421ms:TotalIndexAndBasketCreditDefaultSwapsMemberms:CreditDerivativesSellingProtectionMemberms:MoreThanFiveYearsFromBalanceSheetDateMember2019-12-310000895421ms:TotalIndexAndBasketCreditDefaultSwapsMemberms:CreditDerivativesSellingProtectionMember2019-12-310000895421ms:CreditDerivativesSellingProtectionMemberms:LessThanTwelveMonthsFromBalanceSheetDateMemberus-gaap:CreditDefaultSwapMember2019-12-310000895421ms:CreditDerivativesSellingProtectionMemberus-gaap:CreditDefaultSwapMemberms:MoreThanOneAndWithinThreeYearsFromBalanceSheetDateMember2019-12-310000895421ms:CreditDerivativesSellingProtectionMemberms:MoreThanThreeAndWithinFiveYearsFromBalanceSheetDateMemberus-gaap:CreditDefaultSwapMember2019-12-310000895421ms:CreditDerivativesSellingProtectionMemberms:MoreThanFiveYearsFromBalanceSheetDateMemberus-gaap:CreditDefaultSwapMember2019-12-310000895421ms:CreditDerivativesSellingProtectionMemberus-gaap:CreditDefaultSwapMember2019-12-310000895421us-gaap:OtherCreditDerivativesMemberms:CreditDerivativesSellingProtectionMemberms:LessThanTwelveMonthsFromBalanceSheetDateMember2019-12-310000895421us-gaap:OtherCreditDerivativesMemberms:CreditDerivativesSellingProtectionMemberms:MoreThanOneAndWithinThreeYearsFromBalanceSheetDateMember2019-12-310000895421us-gaap:OtherCreditDerivativesMemberms:CreditDerivativesSellingProtectionMemberms:MoreThanThreeAndWithinFiveYearsFromBalanceSheetDateMember2019-12-310000895421us-gaap:OtherCreditDerivativesMemberms:CreditDerivativesSellingProtectionMemberms:MoreThanFiveYearsFromBalanceSheetDateMember2019-12-310000895421us-gaap:OtherCreditDerivativesMemberms:CreditDerivativesSellingProtectionMember2019-12-310000895421ms:LessThanTwelveMonthsFromBalanceSheetDateMemberms:CreditDerivativesSellingProtectionMember2019-12-310000895421ms:CreditDerivativesSellingProtectionMemberms:MoreThanOneAndWithinThreeYearsFromBalanceSheetDateMember2019-12-310000895421ms:CreditDerivativesSellingProtectionMemberms:MoreThanThreeAndWithinFiveYearsFromBalanceSheetDateMember2019-12-310000895421ms:CreditDerivativesSellingProtectionMemberms:MoreThanFiveYearsFromBalanceSheetDateMember2019-12-310000895421ms:CreditDerivativesSellingProtectionMember2019-12-310000895421us-gaap:CreditDefaultSwapBuyingProtectionMemberms:SingleNameCreditDefaultSwapMember2020-12-310000895421us-gaap:CreditDefaultSwapBuyingProtectionMemberms:SingleNameCreditDefaultSwapMember2019-12-310000895421ms:IndexAndBasketCreditDefaultSwapMemberus-gaap:CreditDefaultSwapBuyingProtectionMember2020-12-310000895421ms:IndexAndBasketCreditDefaultSwapMemberus-gaap:CreditDefaultSwapBuyingProtectionMember2019-12-310000895421us-gaap:CreditDefaultSwapBuyingProtectionMemberms:TranchedIndexAndBasketCreditDefaultSwapMember2020-12-310000895421us-gaap:CreditDefaultSwapBuyingProtectionMemberms:TranchedIndexAndBasketCreditDefaultSwapMember2019-12-310000895421us-gaap:CreditDefaultSwapBuyingProtectionMemberus-gaap:CreditDefaultSwapMember2020-12-310000895421us-gaap:CreditDefaultSwapBuyingProtectionMemberus-gaap:CreditDefaultSwapMember2019-12-310000895421us-gaap:USTreasurySecuritiesMember2020-12-310000895421us-gaap:USGovernmentAgenciesDebtSecuritiesMember2020-12-310000895421us-gaap:USTreasuryAndGovernmentMember2020-12-310000895421us-gaap:MortgageBackedSecuritiesIssuedByUSGovernmentSponsoredEnterprisesMember2020-12-310000895421us-gaap:CorporateBondSecuritiesMember2020-12-310000895421us-gaap:USStatesAndPoliticalSubdivisionsMember2020-12-310000895421ms:AssetBackedSecuritiesFederalFamilyEducationLoanProgramMember2020-12-310000895421ms:AssetBackedSecuritiesOtherMember2020-12-310000895421ms:CorporateandOtherDebtSecuritiesMember2020-12-310000895421us-gaap:MortgageBackedSecuritiesIssuedByPrivateEnterprisesMember2020-12-310000895421us-gaap:USTreasurySecuritiesMember2019-12-310000895421us-gaap:USGovernmentAgenciesDebtSecuritiesMember2019-12-310000895421us-gaap:USTreasuryAndGovernmentMember2019-12-310000895421us-gaap:MortgageBackedSecuritiesIssuedByUSGovernmentSponsoredEnterprisesMember2019-12-310000895421us-gaap:CorporateBondSecuritiesMember2019-12-310000895421us-gaap:USStatesAndPoliticalSubdivisionsMember2019-12-310000895421ms:AssetBackedSecuritiesFederalFamilyEducationLoanProgramMember2019-12-310000895421ms:CorporateandOtherDebtSecuritiesMember2019-12-310000895421us-gaap:MortgageBackedSecuritiesIssuedByPrivateEnterprisesMember2019-12-3100008954212020-01-012020-03-31ms:security0000895421us-gaap:USTreasurySecuritiesMember2020-01-012020-12-310000895421us-gaap:USGovernmentAgenciesDebtSecuritiesMember2020-01-012020-12-310000895421us-gaap:USTreasuryAndGovernmentMember2020-01-012020-12-310000895421us-gaap:MortgageBackedSecuritiesIssuedByUSGovernmentSponsoredEnterprisesMember2020-01-012020-12-310000895421us-gaap:CorporateBondSecuritiesMember2020-01-012020-12-310000895421us-gaap:USStatesAndPoliticalSubdivisionsMember2020-01-012020-12-310000895421ms:AssetBackedSecuritiesFederalFamilyEducationLoanProgramMember2020-01-012020-12-310000895421ms:AssetBackedSecuritiesOtherMember2020-01-012020-12-310000895421ms:CorporateandOtherDebtSecuritiesMember2020-01-012020-12-310000895421us-gaap:MortgageBackedSecuritiesIssuedByPrivateEnterprisesMember2020-01-012020-12-310000895421us-gaap:MaturityOvernightMember2020-12-310000895421us-gaap:MaturityUpTo30DaysMember2020-12-310000895421us-gaap:Maturity30To90DaysMember2020-12-310000895421us-gaap:MaturityOver90DaysMember2020-12-310000895421us-gaap:MaturityOvernightMember2019-12-310000895421us-gaap:MaturityUpTo30DaysMember2019-12-310000895421us-gaap:Maturity30To90DaysMember2019-12-310000895421us-gaap:MaturityOver90DaysMember2019-12-310000895421us-gaap:USTreasuryAndGovernmentMember2020-12-310000895421us-gaap:USTreasuryAndGovernmentMember2019-12-310000895421us-gaap:USStatesAndPoliticalSubdivisionsMember2020-12-310000895421us-gaap:USStatesAndPoliticalSubdivisionsMember2019-12-310000895421us-gaap:ForeignGovernmentDebtSecuritiesMember2020-12-310000895421us-gaap:ForeignGovernmentDebtSecuritiesMember2019-12-310000895421us-gaap:AssetBackedSecuritiesMember2020-12-310000895421us-gaap:AssetBackedSecuritiesMember2019-12-310000895421ms:CorporateandOtherDebtSecuritiesMember2020-12-310000895421ms:CorporateandOtherDebtSecuritiesMember2019-12-310000895421ms:CorporateEquitiesMember2020-12-310000895421ms:CorporateEquitiesMember2019-12-310000895421us-gaap:CollateralizedSecuritiesOtherMember2020-12-310000895421us-gaap:CollateralizedSecuritiesOtherMember2019-12-310000895421ms:UsTreasuryAndGovernmentAndForeignGovernmentDebtSecuritiesMemberms:TradingAssetsToTotalAssetsRatioMember2020-01-012020-12-310000895421ms:UsTreasuryAndGovernmentAndForeignGovernmentDebtSecuritiesMemberms:TradingAssetsToTotalAssetsRatioMember2019-01-012019-12-310000895421ms:UsTreasuryAndGovernmentAndForeignGovernmentDebtSecuritiesMemberms:CollateralReceivedToTotalAssetsRatioMember2020-01-012020-12-310000895421ms:UsTreasuryAndGovernmentAndForeignGovernmentDebtSecuritiesMemberms:CollateralReceivedToTotalAssetsRatioMember2019-01-012019-12-310000895421us-gaap:CommercialPortfolioSegmentMember2020-12-310000895421ms:SecuredLendingFacilitiesMember2020-12-310000895421us-gaap:CommercialRealEstatePortfolioSegmentMember2020-12-310000895421us-gaap:ResidentialPortfolioSegmentMember2020-12-310000895421ms:SecuritiesBasedLendingandOtherLoansMember2020-12-310000895421us-gaap:CommercialPortfolioSegmentMember2019-12-310000895421ms:SecuredLendingFacilitiesMember2019-12-310000895421us-gaap:CommercialRealEstatePortfolioSegmentMember2019-12-310000895421us-gaap:ResidentialPortfolioSegmentMember2019-12-310000895421ms:SecuritiesBasedLendingandOtherLoansMember2019-12-310000895421ms:InvestmentGradeMemberus-gaap:CommercialPortfolioSegmentMember2020-12-310000895421ms:NoninvestmentGradeMemberus-gaap:CommercialPortfolioSegmentMember2020-12-310000895421ms:InvestmentGradeMemberms:SecuredLendingFacilitiesMember2020-12-310000895421ms:NoninvestmentGradeMemberms:SecuredLendingFacilitiesMember2020-12-310000895421ms:InvestmentGradeMemberus-gaap:CommercialRealEstatePortfolioSegmentMember2020-12-310000895421ms:NoninvestmentGradeMemberus-gaap:CommercialRealEstatePortfolioSegmentMember2020-12-310000895421us-gaap:ResidentialPortfolioSegmentMemberms:FICOScoreGreaterthanorEqualto740Member2020-12-310000895421ms:FICOScoreBetween680and739Memberus-gaap:ResidentialPortfolioSegmentMember2020-12-310000895421ms:FICOScoreLessthan680Memberus-gaap:ResidentialPortfolioSegmentMember2020-12-310000895421us-gaap:ResidentialPortfolioSegmentMemberms:DebttoValueRatioLessthanorEqualto80PercentMember2020-12-310000895421us-gaap:ResidentialPortfolioSegmentMemberms:DebttoValueRatioGreaterthan80PercentMember2020-12-310000895421ms:SecuritiesBasedLendingMember2020-12-310000895421ms:OtherLoansMemberms:InvestmentGradeMember2020-12-310000895421ms:OtherLoansMemberms:NoninvestmentGradeMember2020-12-310000895421us-gaap:CommercialPortfolioSegmentMemberus-gaap:FinancingReceivables1To29DaysPastDueMember2020-12-310000895421ms:FinancialAssetPastDueMinusCurrentMemberus-gaap:CommercialPortfolioSegmentMember2020-12-310000895421us-gaap:CommercialPortfolioSegmentMemberms:FinancialAssetPastDueMember2020-12-310000895421ms:SecuredLendingFacilitiesMemberus-gaap:FinancingReceivables1To29DaysPastDueMember2020-12-310000895421ms:FinancialAssetPastDueMinusCurrentMemberms:SecuredLendingFacilitiesMember2020-12-310000895421ms:SecuredLendingFacilitiesMemberms:FinancialAssetPastDueMember2020-12-310000895421us-gaap:CommercialRealEstatePortfolioSegmentMemberus-gaap:FinancingReceivables1To29DaysPastDueMember2020-12-310000895421ms:FinancialAssetPastDueMinusCurrentMemberus-gaap:CommercialRealEstatePortfolioSegmentMember2020-12-310000895421ms:FinancialAssetPastDueMemberus-gaap:CommercialRealEstatePortfolioSegmentMember2020-12-310000895421us-gaap:ResidentialPortfolioSegmentMemberus-gaap:FinancingReceivables1To29DaysPastDueMember2020-12-310000895421us-gaap:ResidentialPortfolioSegmentMemberms:FinancialAssetPastDueMinusCurrentMember2020-12-310000895421us-gaap:ResidentialPortfolioSegmentMemberms:FinancialAssetPastDueMember2020-12-310000895421ms:SecuritiesBasedLendingandOtherLoansMemberus-gaap:FinancingReceivables1To29DaysPastDueMember2020-12-310000895421ms:SecuritiesBasedLendingandOtherLoansMemberms:FinancialAssetPastDueMinusCurrentMember2020-12-310000895421ms:SecuritiesBasedLendingandOtherLoansMemberms:FinancialAssetPastDueMember2020-12-310000895421us-gaap:FinancingReceivables1To29DaysPastDueMember2020-12-310000895421ms:FinancialAssetPastDueMinusCurrentMember2020-12-310000895421ms:FinancialAssetPastDueMember2020-12-310000895421us-gaap:CommercialPortfolioSegmentMember2020-01-012020-12-310000895421ms:SecuredLendingFacilitiesMember2020-01-012020-12-310000895421us-gaap:CommercialRealEstatePortfolioSegmentMember2020-01-012020-12-310000895421us-gaap:ResidentialPortfolioSegmentMember2020-01-012020-12-310000895421ms:SecuritiesBasedLendingandOtherLoansMember2020-01-012020-12-310000895421us-gaap:CommercialPortfolioSegmentMember2018-12-310000895421ms:SecuredLendingFacilitiesMember2018-12-310000895421us-gaap:CommercialRealEstatePortfolioSegmentMember2018-12-310000895421us-gaap:ResidentialPortfolioSegmentMember2018-12-310000895421ms:SecuritiesBasedLendingandOtherLoansMember2018-12-310000895421us-gaap:CommercialPortfolioSegmentMember2019-01-012019-12-310000895421ms:SecuredLendingFacilitiesMember2019-01-012019-12-310000895421us-gaap:CommercialRealEstatePortfolioSegmentMember2019-01-012019-12-310000895421us-gaap:ResidentialPortfolioSegmentMember2019-01-012019-12-310000895421ms:SecuritiesBasedLendingandOtherLoansMember2019-01-012019-12-310000895421us-gaap:CommercialPortfolioSegmentMember2017-12-310000895421ms:SecuredLendingFacilitiesMember2017-12-310000895421us-gaap:CommercialRealEstatePortfolioSegmentMember2017-12-310000895421us-gaap:ResidentialPortfolioSegmentMember2017-12-310000895421ms:SecuritiesBasedLendingandOtherLoansMember2017-12-310000895421us-gaap:CommercialPortfolioSegmentMember2018-01-012018-12-310000895421ms:SecuredLendingFacilitiesMember2018-01-012018-12-310000895421us-gaap:CommercialRealEstatePortfolioSegmentMember2018-01-012018-12-310000895421us-gaap:ResidentialPortfolioSegmentMember2018-01-012018-12-310000895421ms:SecuritiesBasedLendingandOtherLoansMember2018-01-012018-12-310000895421ms:CurrentlyEmployedbytheFirmMember2020-12-310000895421ms:NoLongerEmployedbytheFirmMember2020-12-310000895421ms:InstitutionalSecuritiesSegmentMember2018-12-310000895421ms:GlobalWealthManagementGroupMember2018-12-310000895421ms:AssetManagementSegmentMember2018-12-310000895421ms:InstitutionalSecuritiesSegmentMember2019-01-012019-12-310000895421ms:GlobalWealthManagementGroupMember2019-01-012019-12-310000895421ms:AssetManagementSegmentMember2019-01-012019-12-310000895421ms:InstitutionalSecuritiesSegmentMember2019-12-310000895421ms:GlobalWealthManagementGroupMember2019-12-310000895421ms:AssetManagementSegmentMember2019-12-310000895421ms:InstitutionalSecuritiesSegmentMember2020-01-012020-12-310000895421ms:GlobalWealthManagementGroupMember2020-01-012020-12-310000895421ms:AssetManagementSegmentMember2020-01-012020-12-310000895421ms:InstitutionalSecuritiesSegmentMember2020-12-310000895421ms:GlobalWealthManagementGroupMember2020-12-310000895421ms:AssetManagementSegmentMember2020-12-310000895421us-gaap:TradeNamesMember2020-12-310000895421us-gaap:TradeNamesMember2019-12-310000895421us-gaap:CustomerRelationshipsMember2020-12-310000895421us-gaap:CustomerRelationshipsMember2019-12-310000895421us-gaap:EmploymentContractsMember2020-12-310000895421us-gaap:EmploymentContractsMember2019-12-310000895421us-gaap:OtherIntangibleAssetsMember2020-12-310000895421us-gaap:OtherIntangibleAssetsMember2019-12-310000895421ms:InvestmentManagementSegmentMember2020-12-310000895421ms:InvestmentManagementSegmentMember2019-12-310000895421ms:InvestmentManagementSegmentMember2020-01-012020-12-310000895421ms:InvestmentManagementSegmentMember2019-01-012019-12-310000895421ms:InvestmentManagementSegmentMember2018-01-012018-12-310000895421ms:InvestmentManagementSegmentMember2019-10-012019-12-310000895421ms:InvestmentManagementSegmentMember2018-10-012018-12-310000895421ms:MitsubishiUfjMorganStanleySecuritiesCoLtdMember2020-01-012020-12-310000895421ms:MitsubishiUfjMorganStanleySecuritiesCoLtdMember2019-01-012019-12-310000895421ms:MitsubishiUfjMorganStanleySecuritiesCoLtdMember2018-01-012018-12-310000895421ms:MorganStanleyMufgSecuritiesCoLtdMember2020-12-310000895421ms:MorganStanleyMufgSecuritiesCoLtdMemberms:MitsubishiUfjFinancialGroupIncMember2020-12-310000895421ms:MitsubishiUfjMorganStanleySecuritiesCoLtdMember2020-12-310000895421ms:MorganStanleyMufgSecuritiesCoLtdMemberms:InstitutionalSecuritiesSegmentMember2020-12-310000895421ms:LongTermDebtFixedRateMembersrt:ParentCompanyMember2020-12-310000895421ms:LongTermDebtVariableRateMembersrt:ParentCompanyMember2020-12-310000895421srt:SubsidiariesMemberms:LongTermDebtFixedRateMember2020-12-310000895421srt:SubsidiariesMemberms:LongTermDebtVariableRateMember2020-12-310000895421us-gaap:SeniorNotesMember2020-12-310000895421us-gaap:SeniorNotesMember2019-12-310000895421us-gaap:SubordinatedDebtMember2020-01-012020-12-310000895421us-gaap:SubordinatedDebtMember2019-01-012019-12-310000895421ms:FixedRateDebtMemberus-gaap:SecuredDebtMember2020-12-310000895421ms:VariableRateMemberus-gaap:SecuredDebtMember2020-12-310000895421us-gaap:SecuredDebtMember2020-12-310000895421us-gaap:SecuredDebtMember2019-12-310000895421us-gaap:CommercialLoanMember2020-12-310000895421ms:SecuredLendingFacilitiesMember2020-12-310000895421us-gaap:RealEstateMember2020-12-310000895421ms:SecuritiesBasedLendingandOtherLoansMember2020-12-310000895421ms:CommitmentsForwardStartingReverseRepurchaseAgreementsMember2020-12-310000895421ms:CentralCounterpartyCommitmentMember2020-12-310000895421ms:FirmCommitmentContractMember2020-12-310000895421ms:CommitmentsInvestmentActivitiesMember2020-12-310000895421ms:CommitmentsLettersOfCreditAndOtherFinancialGuaranteesObtainedToSatisfyCollateralRequirementsMember2020-12-310000895421ms:LessThanTwelveMonthsFromBalanceSheetDateMemberus-gaap:CreditRiskContractMember2020-12-310000895421us-gaap:CreditRiskContractMemberms:MoreThanOneAndWithinThreeYearsFromBalanceSheetDateMember2020-12-310000895421ms:MoreThanThreeAndWithinFiveYearsFromBalanceSheetDateMemberus-gaap:CreditRiskContractMember2020-12-310000895421ms:MoreThanFiveYearsFromBalanceSheetDateMemberus-gaap:CreditRiskContractMember2020-12-310000895421us-gaap:CreditRiskContractMember2020-12-310000895421us-gaap:OtherCreditDerivativesMemberms:LessThanTwelveMonthsFromBalanceSheetDateMember2020-12-310000895421us-gaap:OtherCreditDerivativesMemberms:MoreThanOneAndWithinThreeYearsFromBalanceSheetDateMember2020-12-310000895421us-gaap:OtherCreditDerivativesMemberms:MoreThanThreeAndWithinFiveYearsFromBalanceSheetDateMember2020-12-310000895421us-gaap:OtherCreditDerivativesMemberms:MoreThanFiveYearsFromBalanceSheetDateMember2020-12-310000895421us-gaap:OtherCreditDerivativesMember2020-12-310000895421ms:LessThanTwelveMonthsFromBalanceSheetDateMemberus-gaap:DerivativeMember2020-12-310000895421us-gaap:DerivativeMemberms:MoreThanOneAndWithinThreeYearsFromBalanceSheetDateMember2020-12-310000895421us-gaap:DerivativeMemberms:MoreThanThreeAndWithinFiveYearsFromBalanceSheetDateMember2020-12-310000895421us-gaap:DerivativeMemberms:MoreThanFiveYearsFromBalanceSheetDateMember2020-12-310000895421us-gaap:DerivativeMember2020-12-310000895421us-gaap:StandbyLettersOfCreditMemberms:LessThanTwelveMonthsFromBalanceSheetDateMember2020-12-310000895421us-gaap:StandbyLettersOfCreditMemberms:MoreThanOneAndWithinThreeYearsFromBalanceSheetDateMember2020-12-310000895421us-gaap:StandbyLettersOfCreditMemberms:MoreThanThreeAndWithinFiveYearsFromBalanceSheetDateMember2020-12-310000895421us-gaap:StandbyLettersOfCreditMemberms:MoreThanFiveYearsFromBalanceSheetDateMember2020-12-310000895421us-gaap:StandbyLettersOfCreditMember2020-12-310000895421ms:LessThanTwelveMonthsFromBalanceSheetDateMemberus-gaap:MarketValueGuaranteeMember2020-12-310000895421us-gaap:MarketValueGuaranteeMemberms:MoreThanOneAndWithinThreeYearsFromBalanceSheetDateMember2020-12-310000895421ms:MoreThanThreeAndWithinFiveYearsFromBalanceSheetDateMemberus-gaap:MarketValueGuaranteeMember2020-12-310000895421ms:MoreThanFiveYearsFromBalanceSheetDateMemberus-gaap:MarketValueGuaranteeMember2020-12-310000895421us-gaap:MarketValueGuaranteeMember2020-12-310000895421ms:LiquidityFacilitiesGuaranteeMemberms:LessThanTwelveMonthsFromBalanceSheetDateMember2020-12-310000895421ms:LiquidityFacilitiesGuaranteeMemberms:MoreThanOneAndWithinThreeYearsFromBalanceSheetDateMember2020-12-310000895421ms:LiquidityFacilitiesGuaranteeMemberms:MoreThanThreeAndWithinFiveYearsFromBalanceSheetDateMember2020-12-310000895421ms:LiquidityFacilitiesGuaranteeMemberms:MoreThanFiveYearsFromBalanceSheetDateMember2020-12-310000895421ms:LiquidityFacilitiesGuaranteeMember2020-12-310000895421ms:LessThanTwelveMonthsFromBalanceSheetDateMemberms:WholeLoanSalesRepresentationsAndWarrantiesMember2020-12-310000895421ms:WholeLoanSalesRepresentationsAndWarrantiesMemberms:MoreThanOneAndWithinThreeYearsFromBalanceSheetDateMember2020-12-310000895421ms:MoreThanThreeAndWithinFiveYearsFromBalanceSheetDateMemberms:WholeLoanSalesRepresentationsAndWarrantiesMember2020-12-310000895421ms:MoreThanFiveYearsFromBalanceSheetDateMemberms:WholeLoanSalesRepresentationsAndWarrantiesMember2020-12-310000895421ms:WholeLoanSalesRepresentationsAndWarrantiesMember2020-12-310000895421ms:SecuritizationsRepresentationsAndGuaranteesMemberms:LessThanTwelveMonthsFromBalanceSheetDateMember2020-12-310000895421ms:SecuritizationsRepresentationsAndGuaranteesMemberms:MoreThanOneAndWithinThreeYearsFromBalanceSheetDateMember2020-12-310000895421ms:SecuritizationsRepresentationsAndGuaranteesMemberms:MoreThanThreeAndWithinFiveYearsFromBalanceSheetDateMember2020-12-310000895421ms:SecuritizationsRepresentationsAndGuaranteesMemberms:MoreThanFiveYearsFromBalanceSheetDateMember2020-12-310000895421ms:SecuritizationsRepresentationsAndGuaranteesMember2020-12-310000895421ms:LessThanTwelveMonthsFromBalanceSheetDateMemberms:GeneralPartnerGuaranteeMember2020-12-310000895421ms:GeneralPartnerGuaranteeMemberms:MoreThanOneAndWithinThreeYearsFromBalanceSheetDateMember2020-12-310000895421ms:MoreThanThreeAndWithinFiveYearsFromBalanceSheetDateMemberms:GeneralPartnerGuaranteeMember2020-12-310000895421ms:MoreThanFiveYearsFromBalanceSheetDateMemberms:GeneralPartnerGuaranteeMember2020-12-310000895421ms:GeneralPartnerGuaranteeMember2020-12-310000895421ms:LessThanTwelveMonthsFromBalanceSheetDateMemberms:ClearingMemberGuaranteeMember2020-12-310000895421ms:ClearingMemberGuaranteeMemberms:MoreThanOneAndWithinThreeYearsFromBalanceSheetDateMember2020-12-310000895421ms:ClearingMemberGuaranteeMemberms:MoreThanThreeAndWithinFiveYearsFromBalanceSheetDateMember2020-12-310000895421ms:MoreThanFiveYearsFromBalanceSheetDateMemberms:ClearingMemberGuaranteeMember2020-12-310000895421ms:ClearingMemberGuaranteeMember2020-12-310000895421us-gaap:PendingLitigationMemberms:ChinaDevelopmentIndustrialBankVersusMorganStanleyCoIncorporatedEtAliiMember2020-12-310000895421us-gaap:PendingLitigationMemberms:ChinaDevelopmentIndustrialBankVersusMorganStanleyCoIncorporatedEtAliiMember2020-01-012020-12-310000895421us-gaap:PendingLitigationMembersrt:MaximumMemberms:ChinaDevelopmentIndustrialBankVersusMorganStanleyCoIncorporatedEtAliiMember2020-12-310000895421ms:FinancialGuarantyInsuranceCompanyVMorganStanleyAbsCapitalIIncEtAlTrust2007Nc4Memberus-gaap:PendingLitigationMember2020-12-310000895421ms:DeutscheBankNationalTrustCompany2007Nc4VMorganStanleyMortgageCapitalHoldingsLlcMemberus-gaap:PendingLitigationMembersrt:MaximumMember2020-12-310000895421ms:UsBankNationalAssociation20072axVMorganStanleyMortgageCapitalHoldingsLlcMemberus-gaap:PendingLitigationMember2020-12-31iso4217:EUR0000895421us-gaap:PendingLitigationMemberms:CaseNumber153637AndCaseNumber154353Member2020-12-310000895421us-gaap:VariableInterestEntityPrimaryBeneficiaryMemberus-gaap:StructuredFinanceMember2020-12-310000895421us-gaap:VariableInterestEntityPrimaryBeneficiaryMemberus-gaap:StructuredFinanceMember2019-12-310000895421us-gaap:VariableInterestEntityPrimaryBeneficiaryMemberms:MortgageAndAssetBackedSecuritiesMember2020-12-310000895421us-gaap:VariableInterestEntityPrimaryBeneficiaryMemberms:MortgageAndAssetBackedSecuritiesMember2019-12-310000895421ms:OtherVariableInterestsMemberus-gaap:VariableInterestEntityPrimaryBeneficiaryMember2020-12-310000895421ms:OtherVariableInterestsMemberus-gaap:VariableInterestEntityPrimaryBeneficiaryMember2019-12-310000895421us-gaap:VariableInterestEntityPrimaryBeneficiaryMember2020-12-310000895421us-gaap:VariableInterestEntityPrimaryBeneficiaryMember2019-12-310000895421ms:MortgageAndAssetBackedSecuritiesMember2020-12-310000895421us-gaap:CollateralizedDebtObligationsMember2020-12-310000895421ms:MunicipalTenderOptionBondsMember2020-12-310000895421us-gaap:StructuredFinanceMember2020-12-310000895421ms:OtherVariableInterestsMember2020-12-310000895421ms:DebtandEquityInterestsMemberms:MortgageAndAssetBackedSecuritiesMember2020-12-310000895421ms:DebtandEquityInterestsMemberus-gaap:CollateralizedDebtObligationsMember2020-12-310000895421ms:DebtandEquityInterestsMemberms:MunicipalTenderOptionBondsMember2020-12-310000895421ms:DebtandEquityInterestsMemberus-gaap:StructuredFinanceMember2020-12-310000895421ms:DebtandEquityInterestsMemberms:OtherVariableInterestsMember2020-12-310000895421us-gaap:DerivativeFinancialInstrumentsAssetsMemberms:MortgageAndAssetBackedSecuritiesMember2020-12-310000895421us-gaap:CollateralizedDebtObligationsMemberus-gaap:DerivativeFinancialInstrumentsAssetsMember2020-12-310000895421ms:MunicipalTenderOptionBondsMemberus-gaap:DerivativeFinancialInstrumentsAssetsMember2020-12-310000895421us-gaap:DerivativeFinancialInstrumentsAssetsMemberus-gaap:StructuredFinanceMember2020-12-310000895421ms:OtherVariableInterestsMemberus-gaap:DerivativeFinancialInstrumentsAssetsMember2020-12-310000895421ms:CommitmentsGuaranteesAndOtherMemberms:MortgageAndAssetBackedSecuritiesMember2020-12-310000895421us-gaap:CollateralizedDebtObligationsMemberms:CommitmentsGuaranteesAndOtherMember2020-12-310000895421ms:MunicipalTenderOptionBondsMemberms:CommitmentsGuaranteesAndOtherMember2020-12-310000895421ms:CommitmentsGuaranteesAndOtherMemberus-gaap:StructuredFinanceMember2020-12-310000895421ms:OtherVariableInterestsMemberms:CommitmentsGuaranteesAndOtherMember2020-12-310000895421ms:DebtandEquityInterestsMemberus-gaap:VariableInterestEntityNotPrimaryBeneficiaryMemberms:MortgageAndAssetBackedSecuritiesMember2020-12-310000895421ms:DebtandEquityInterestsMemberus-gaap:CollateralizedDebtObligationsMemberus-gaap:VariableInterestEntityNotPrimaryBeneficiaryMember2020-12-310000895421ms:DebtandEquityInterestsMemberms:MunicipalTenderOptionBondsMemberus-gaap:VariableInterestEntityNotPrimaryBeneficiaryMember2020-12-310000895421ms:DebtandEquityInterestsMemberus-gaap:VariableInterestEntityNotPrimaryBeneficiaryMemberus-gaap:StructuredFinanceMember2020-12-310000895421ms:DebtandEquityInterestsMemberms:OtherVariableInterestsMemberus-gaap:VariableInterestEntityNotPrimaryBeneficiaryMember2020-12-310000895421us-gaap:VariableInterestEntityNotPrimaryBeneficiaryMemberus-gaap:DerivativeFinancialInstrumentsAssetsMemberms:MortgageAndAssetBackedSecuritiesMember2020-12-310000895421us-gaap:CollateralizedDebtObligationsMemberus-gaap:VariableInterestEntityNotPrimaryBeneficiaryMemberus-gaap:DerivativeFinancialInstrumentsAssetsMember2020-12-310000895421ms:MunicipalTenderOptionBondsMemberus-gaap:VariableInterestEntityNotPrimaryBeneficiaryMemberus-gaap:DerivativeFinancialInstrumentsAssetsMember2020-12-310000895421us-gaap:VariableInterestEntityNotPrimaryBeneficiaryMemberus-gaap:DerivativeFinancialInstrumentsAssetsMemberus-gaap:StructuredFinanceMember2020-12-310000895421ms:OtherVariableInterestsMemberus-gaap:VariableInterestEntityNotPrimaryBeneficiaryMemberus-gaap:DerivativeFinancialInstrumentsAssetsMember2020-12-310000895421us-gaap:VariableInterestEntityNotPrimaryBeneficiaryMemberus-gaap:AssetsMemberms:MortgageAndAssetBackedSecuritiesMember2020-12-310000895421us-gaap:CollateralizedDebtObligationsMemberus-gaap:VariableInterestEntityNotPrimaryBeneficiaryMemberus-gaap:AssetsMember2020-12-310000895421ms:MunicipalTenderOptionBondsMemberus-gaap:VariableInterestEntityNotPrimaryBeneficiaryMemberus-gaap:AssetsMember2020-12-310000895421us-gaap:VariableInterestEntityNotPrimaryBeneficiaryMemberus-gaap:StructuredFinanceMemberus-gaap:AssetsMember2020-12-310000895421ms:OtherVariableInterestsMemberus-gaap:VariableInterestEntityNotPrimaryBeneficiaryMemberus-gaap:AssetsMember2020-12-310000895421us-gaap:VariableInterestEntityNotPrimaryBeneficiaryMemberms:MortgageAndAssetBackedSecuritiesMemberus-gaap:DerivativeFinancialInstrumentsLiabilitiesMember2020-12-310000895421us-gaap:CollateralizedDebtObligationsMemberus-gaap:VariableInterestEntityNotPrimaryBeneficiaryMemberus-gaap:DerivativeFinancialInstrumentsLiabilitiesMember2020-12-310000895421ms:MunicipalTenderOptionBondsMemberus-gaap:VariableInterestEntityNotPrimaryBeneficiaryMemberus-gaap:DerivativeFinancialInstrumentsLiabilitiesMember2020-12-310000895421us-gaap:VariableInterestEntityNotPrimaryBeneficiaryMemberus-gaap:StructuredFinanceMemberus-gaap:DerivativeFinancialInstrumentsLiabilitiesMember2020-12-310000895421ms:OtherVariableInterestsMemberus-gaap:VariableInterestEntityNotPrimaryBeneficiaryMemberus-gaap:DerivativeFinancialInstrumentsLiabilitiesMember2020-12-310000895421ms:MortgageAndAssetBackedSecuritiesMember2019-12-310000895421us-gaap:CollateralizedDebtObligationsMember2019-12-310000895421ms:MunicipalTenderOptionBondsMember2019-12-310000895421us-gaap:StructuredFinanceMember2019-12-310000895421ms:OtherVariableInterestsMember2019-12-310000895421ms:DebtandEquityInterestsMemberms:MortgageAndAssetBackedSecuritiesMember2019-12-310000895421ms:DebtandEquityInterestsMemberus-gaap:CollateralizedDebtObligationsMember2019-12-310000895421ms:DebtandEquityInterestsMemberms:MunicipalTenderOptionBondsMember2019-12-310000895421ms:DebtandEquityInterestsMemberus-gaap:StructuredFinanceMember2019-12-310000895421ms:DebtandEquityInterestsMemberms:OtherVariableInterestsMember2019-12-310000895421us-gaap:DerivativeFinancialInstrumentsAssetsMemberms:MortgageAndAssetBackedSecuritiesMember2019-12-310000895421us-gaap:CollateralizedDebtObligationsMemberus-gaap:DerivativeFinancialInstrumentsAssetsMember2019-12-310000895421ms:MunicipalTenderOptionBondsMemberus-gaap:DerivativeFinancialInstrumentsAssetsMember2019-12-310000895421us-gaap:DerivativeFinancialInstrumentsAssetsMemberus-gaap:StructuredFinanceMember2019-12-310000895421ms:OtherVariableInterestsMemberus-gaap:DerivativeFinancialInstrumentsAssetsMember2019-12-310000895421ms:CommitmentsGuaranteesAndOtherMemberms:MortgageAndAssetBackedSecuritiesMember2019-12-310000895421us-gaap:CollateralizedDebtObligationsMemberms:CommitmentsGuaranteesAndOtherMember2019-12-310000895421ms:MunicipalTenderOptionBondsMemberms:CommitmentsGuaranteesAndOtherMember2019-12-310000895421ms:CommitmentsGuaranteesAndOtherMemberus-gaap:StructuredFinanceMember2019-12-310000895421ms:OtherVariableInterestsMemberms:CommitmentsGuaranteesAndOtherMember2019-12-310000895421ms:DebtandEquityInterestsMemberus-gaap:VariableInterestEntityNotPrimaryBeneficiaryMemberms:MortgageAndAssetBackedSecuritiesMember2019-12-310000895421ms:DebtandEquityInterestsMemberus-gaap:CollateralizedDebtObligationsMemberus-gaap:VariableInterestEntityNotPrimaryBeneficiaryMember2019-12-310000895421ms:DebtandEquityInterestsMemberms:MunicipalTenderOptionBondsMemberus-gaap:VariableInterestEntityNotPrimaryBeneficiaryMember2019-12-310000895421ms:DebtandEquityInterestsMemberus-gaap:VariableInterestEntityNotPrimaryBeneficiaryMemberus-gaap:StructuredFinanceMember2019-12-310000895421ms:DebtandEquityInterestsMemberms:OtherVariableInterestsMemberus-gaap:VariableInterestEntityNotPrimaryBeneficiaryMember2019-12-310000895421us-gaap:VariableInterestEntityNotPrimaryBeneficiaryMemberus-gaap:DerivativeFinancialInstrumentsAssetsMemberms:MortgageAndAssetBackedSecuritiesMember2019-12-310000895421us-gaap:CollateralizedDebtObligationsMemberus-gaap:VariableInterestEntityNotPrimaryBeneficiaryMemberus-gaap:DerivativeFinancialInstrumentsAssetsMember2019-12-310000895421ms:MunicipalTenderOptionBondsMemberus-gaap:VariableInterestEntityNotPrimaryBeneficiaryMemberus-gaap:DerivativeFinancialInstrumentsAssetsMember2019-12-310000895421us-gaap:VariableInterestEntityNotPrimaryBeneficiaryMemberus-gaap:DerivativeFinancialInstrumentsAssetsMemberus-gaap:StructuredFinanceMember2019-12-310000895421ms:OtherVariableInterestsMemberus-gaap:VariableInterestEntityNotPrimaryBeneficiaryMemberus-gaap:DerivativeFinancialInstrumentsAssetsMember2019-12-310000895421us-gaap:VariableInterestEntityNotPrimaryBeneficiaryMemberus-gaap:AssetsMemberms:MortgageAndAssetBackedSecuritiesMember2019-12-310000895421us-gaap:CollateralizedDebtObligationsMemberus-gaap:VariableInterestEntityNotPrimaryBeneficiaryMemberus-gaap:AssetsMember2019-12-310000895421ms:MunicipalTenderOptionBondsMemberus-gaap:VariableInterestEntityNotPrimaryBeneficiaryMemberus-gaap:AssetsMember2019-12-310000895421us-gaap:VariableInterestEntityNotPrimaryBeneficiaryMemberus-gaap:StructuredFinanceMemberus-gaap:AssetsMember2019-12-310000895421ms:OtherVariableInterestsMemberus-gaap:VariableInterestEntityNotPrimaryBeneficiaryMemberus-gaap:AssetsMember2019-12-310000895421us-gaap:VariableInterestEntityNotPrimaryBeneficiaryMemberms:MortgageAndAssetBackedSecuritiesMemberus-gaap:DerivativeFinancialInstrumentsLiabilitiesMember2019-12-310000895421us-gaap:CollateralizedDebtObligationsMemberus-gaap:VariableInterestEntityNotPrimaryBeneficiaryMemberus-gaap:DerivativeFinancialInstrumentsLiabilitiesMember2019-12-310000895421ms:MunicipalTenderOptionBondsMemberus-gaap:VariableInterestEntityNotPrimaryBeneficiaryMemberus-gaap:DerivativeFinancialInstrumentsLiabilitiesMember2019-12-310000895421us-gaap:VariableInterestEntityNotPrimaryBeneficiaryMemberus-gaap:StructuredFinanceMemberus-gaap:DerivativeFinancialInstrumentsLiabilitiesMember2019-12-310000895421ms:OtherVariableInterestsMemberus-gaap:VariableInterestEntityNotPrimaryBeneficiaryMemberus-gaap:DerivativeFinancialInstrumentsLiabilitiesMember2019-12-310000895421us-gaap:VariableInterestEntityNotPrimaryBeneficiaryMemberus-gaap:ResidentialMortgageBackedSecuritiesMember2020-12-310000895421us-gaap:SecuritiesAssetsMemberus-gaap:VariableInterestEntityNotPrimaryBeneficiaryMemberus-gaap:ResidentialMortgageBackedSecuritiesMember2020-12-310000895421us-gaap:VariableInterestEntityNotPrimaryBeneficiaryMemberus-gaap:ResidentialMortgageBackedSecuritiesMember2019-12-310000895421us-gaap:SecuritiesAssetsMemberus-gaap:VariableInterestEntityNotPrimaryBeneficiaryMemberus-gaap:ResidentialMortgageBackedSecuritiesMember2019-12-310000895421us-gaap:CommercialMortgageBackedSecuritiesMemberus-gaap:VariableInterestEntityNotPrimaryBeneficiaryMember2020-12-310000895421us-gaap:SecuritiesAssetsMemberus-gaap:VariableInterestEntityNotPrimaryBeneficiaryMemberus-gaap:CommercialMortgageBackedSecuritiesMember2020-12-310000895421us-gaap:CommercialMortgageBackedSecuritiesMemberus-gaap:VariableInterestEntityNotPrimaryBeneficiaryMember2019-12-310000895421us-gaap:SecuritiesAssetsMemberus-gaap:VariableInterestEntityNotPrimaryBeneficiaryMemberus-gaap:CommercialMortgageBackedSecuritiesMember2019-12-310000895421us-gaap:VariableInterestEntityNotPrimaryBeneficiaryMemberus-gaap:MortgageBackedSecuritiesIssuedByUSGovernmentSponsoredEnterprisesMember2020-12-310000895421us-gaap:SecuritiesAssetsMemberus-gaap:VariableInterestEntityNotPrimaryBeneficiaryMemberus-gaap:MortgageBackedSecuritiesIssuedByUSGovernmentSponsoredEnterprisesMember2020-12-310000895421us-gaap:VariableInterestEntityNotPrimaryBeneficiaryMemberus-gaap:MortgageBackedSecuritiesIssuedByUSGovernmentSponsoredEnterprisesMember2019-12-310000895421us-gaap:SecuritiesAssetsMemberus-gaap:VariableInterestEntityNotPrimaryBeneficiaryMemberus-gaap:MortgageBackedSecuritiesIssuedByUSGovernmentSponsoredEnterprisesMember2019-12-310000895421us-gaap:VariableInterestEntityNotPrimaryBeneficiaryMemberms:OtherConsumerAndCommercialLoansMember2020-12-310000895421us-gaap:SecuritiesAssetsMemberus-gaap:VariableInterestEntityNotPrimaryBeneficiaryMemberms:OtherConsumerAndCommercialLoansMember2020-12-310000895421us-gaap:VariableInterestEntityNotPrimaryBeneficiaryMemberms:OtherConsumerAndCommercialLoansMember2019-12-310000895421us-gaap:SecuritiesAssetsMemberus-gaap:VariableInterestEntityNotPrimaryBeneficiaryMemberms:OtherConsumerAndCommercialLoansMember2019-12-310000895421us-gaap:VariableInterestEntityNotPrimaryBeneficiaryMember2020-12-310000895421us-gaap:SecuritiesAssetsMemberus-gaap:VariableInterestEntityNotPrimaryBeneficiaryMember2020-12-310000895421us-gaap:VariableInterestEntityNotPrimaryBeneficiaryMember2019-12-310000895421us-gaap:SecuritiesAssetsMemberus-gaap:VariableInterestEntityNotPrimaryBeneficiaryMember2019-12-310000895421ms:SpecialPurposeEntitiesMemberus-gaap:ResidentialMortgageMember2020-12-310000895421ms:SpecialPurposeEntitiesMemberus-gaap:CommercialMortgageBackedSecuritiesMember2020-12-310000895421ms:SpecialPurposeEntitiesMemberus-gaap:MortgageBackedSecuritiesIssuedByUSGovernmentSponsoredEnterprisesMember2020-12-310000895421ms:SpecialPurposeEntitiesMemberms:CreditLinkedNotesAndOtherMember2020-12-310000895421ms:SpecialPurposeEntitiesMemberms:InvestmentGradeMemberus-gaap:ResidentialMortgageMember2020-12-310000895421ms:SpecialPurposeEntitiesMemberms:InvestmentGradeMemberus-gaap:CommercialMortgageBackedSecuritiesMember2020-12-310000895421ms:SpecialPurposeEntitiesMemberms:InvestmentGradeMemberus-gaap:MortgageBackedSecuritiesIssuedByUSGovernmentSponsoredEnterprisesMember2020-12-310000895421ms:SpecialPurposeEntitiesMemberms:InvestmentGradeMemberms:CreditLinkedNotesAndOtherMember2020-12-310000895421ms:SpecialPurposeEntitiesMemberms:NoninvestmentGradeMemberus-gaap:ResidentialMortgageMember2020-12-310000895421ms:SpecialPurposeEntitiesMemberms:NoninvestmentGradeMemberus-gaap:CommercialMortgageBackedSecuritiesMember2020-12-310000895421ms:SpecialPurposeEntitiesMemberms:NoninvestmentGradeMemberus-gaap:MortgageBackedSecuritiesIssuedByUSGovernmentSponsoredEnterprisesMember2020-12-310000895421ms:SpecialPurposeEntitiesMemberms:NoninvestmentGradeMemberms:CreditLinkedNotesAndOtherMember2020-12-310000895421ms:SpecialPurposeEntitiesMemberus-gaap:ResidentialMortgageMember2019-12-310000895421ms:SpecialPurposeEntitiesMemberus-gaap:CommercialMortgageBackedSecuritiesMember2019-12-310000895421ms:SpecialPurposeEntitiesMemberus-gaap:MortgageBackedSecuritiesIssuedByUSGovernmentSponsoredEnterprisesMember2019-12-310000895421ms:SpecialPurposeEntitiesMemberms:CreditLinkedNotesAndOtherMember2019-12-310000895421ms:SpecialPurposeEntitiesMemberms:InvestmentGradeMemberus-gaap:ResidentialMortgageMember2019-12-310000895421ms:SpecialPurposeEntitiesMemberms:InvestmentGradeMemberus-gaap:CommercialMortgageBackedSecuritiesMember2019-12-310000895421ms:SpecialPurposeEntitiesMemberms:InvestmentGradeMemberus-gaap:MortgageBackedSecuritiesIssuedByUSGovernmentSponsoredEnterprisesMember2019-12-310000895421ms:SpecialPurposeEntitiesMemberms:InvestmentGradeMemberms:CreditLinkedNotesAndOtherMember2019-12-310000895421ms:SpecialPurposeEntitiesMemberms:NoninvestmentGradeMemberus-gaap:ResidentialMortgageMember2019-12-310000895421ms:SpecialPurposeEntitiesMemberms:NoninvestmentGradeMemberus-gaap:CommercialMortgageBackedSecuritiesMember2019-12-310000895421ms:SpecialPurposeEntitiesMemberms:NoninvestmentGradeMemberus-gaap:MortgageBackedSecuritiesIssuedByUSGovernmentSponsoredEnterprisesMember2019-12-310000895421ms:SpecialPurposeEntitiesMemberms:NoninvestmentGradeMemberms:CreditLinkedNotesAndOtherMember2019-12-310000895421ms:SpecialPurposeEntitiesMemberms:InvestmentGradeMemberus-gaap:FairValueInputsLevel2Member2020-12-310000895421ms:SpecialPurposeEntitiesMemberms:InvestmentGradeMemberus-gaap:FairValueInputsLevel3Member2020-12-310000895421ms:SpecialPurposeEntitiesMemberms:InvestmentGradeMember2020-12-310000895421ms:SpecialPurposeEntitiesMemberms:NoninvestmentGradeMemberus-gaap:FairValueInputsLevel2Member2020-12-310000895421ms:SpecialPurposeEntitiesMemberms:NoninvestmentGradeMemberus-gaap:FairValueInputsLevel3Member2020-12-310000895421ms:SpecialPurposeEntitiesMemberms:NoninvestmentGradeMember2020-12-310000895421ms:SpecialPurposeEntitiesMemberus-gaap:FairValueInputsLevel2Member2020-12-310000895421ms:SpecialPurposeEntitiesMemberus-gaap:FairValueInputsLevel3Member2020-12-310000895421ms:SpecialPurposeEntitiesMember2020-12-310000895421ms:SpecialPurposeEntitiesMemberms:InvestmentGradeMemberus-gaap:FairValueInputsLevel2Member2019-12-310000895421ms:SpecialPurposeEntitiesMemberms:InvestmentGradeMemberus-gaap:FairValueInputsLevel3Member2019-12-310000895421ms:SpecialPurposeEntitiesMemberms:InvestmentGradeMember2019-12-310000895421ms:SpecialPurposeEntitiesMemberms:NoninvestmentGradeMemberus-gaap:FairValueInputsLevel2Member2019-12-310000895421ms:SpecialPurposeEntitiesMemberms:NoninvestmentGradeMemberus-gaap:FairValueInputsLevel3Member2019-12-310000895421ms:SpecialPurposeEntitiesMemberms:NoninvestmentGradeMember2019-12-310000895421ms:SpecialPurposeEntitiesMemberus-gaap:FairValueInputsLevel2Member2019-12-310000895421ms:SpecialPurposeEntitiesMemberus-gaap:FairValueInputsLevel3Member2019-12-310000895421ms:SpecialPurposeEntitiesMember2019-12-310000895421us-gaap:CommercialLoanMemberms:CollateralizedLoanObligationsEntitiesSponsoredByNonAffiliatesMember2020-01-012020-12-310000895421us-gaap:CommercialLoanMemberms:CollateralizedLoanObligationsEntitiesSponsoredByNonAffiliatesMember2019-01-012019-12-310000895421us-gaap:CommercialLoanMemberms:CollateralizedLoanObligationsEntitiesSponsoredByNonAffiliatesMember2018-01-012018-12-310000895421us-gaap:OverTheCounterMemberus-gaap:EquityContractMember2020-12-310000895421us-gaap:OverTheCounterMemberus-gaap:EquityContractMember2019-12-310000895421srt:MaximumMember2020-12-310000895421ms:MorganStanleyBankNationalAssociationMember2020-01-012020-12-310000895421ms:MorganStanleyBankNationalAssociationMember2020-12-310000895421ms:MorganStanleyBankNationalAssociationMember2019-12-310000895421ms:MorganStanleyPrivateBankNationalAssociationMember2020-01-012020-12-310000895421ms:MorganStanleyPrivateBankNationalAssociationMember2020-12-310000895421ms:MorganStanleyPrivateBankNationalAssociationMember2019-12-310000895421ms:MSAndCoMember2020-01-012020-12-310000895421ms:MSAndCoMember2020-12-310000895421ms:MSAndCoMember2019-12-310000895421us-gaap:SeriesAPreferredStockMember2020-12-310000895421us-gaap:SeriesAPreferredStockMember2019-12-310000895421us-gaap:SeriesCPreferredStockMember2020-12-310000895421us-gaap:SeriesCPreferredStockMember2019-12-310000895421us-gaap:SeriesEPreferredStockMember2020-12-310000895421us-gaap:SeriesEPreferredStockMember2019-12-310000895421us-gaap:SeriesFPreferredStockMember2020-12-310000895421us-gaap:SeriesFPreferredStockMember2019-12-310000895421us-gaap:SeriesHPreferredStockMember2020-12-310000895421us-gaap:SeriesHPreferredStockMember2019-12-310000895421ms:SeriesIPreferredStockMember2020-12-310000895421ms:SeriesIPreferredStockMember2019-12-310000895421ms:SeriesJPreferredStockMember2020-12-310000895421ms:SeriesJPreferredStockMember2019-12-310000895421ms:SeriesKPreferredStockMember2020-12-310000895421ms:SeriesKPreferredStockMember2019-12-310000895421ms:SeriesLPreferredStockMember2020-12-310000895421ms:SeriesLPreferredStockMember2019-12-310000895421ms:SeriesMPreferredStockMember2020-12-310000895421ms:SeriesMPreferredStockMember2019-12-310000895421ms:SeriesNPreferredStockMember2020-12-310000895421ms:SeriesNPreferredStockMember2019-12-310000895421us-gaap:SeriesGPreferredStockMember2020-01-150000895421ms:CapitalPlan2019Member2020-12-310000895421ms:CapitalPlan2019Member2020-01-012020-12-310000895421ms:MitsubishiUfjFinancialGroupIncMember2020-01-012020-12-310000895421us-gaap:SeriesAPreferredStockMember2019-01-012019-12-310000895421us-gaap:SeriesAPreferredStockMember2018-01-012018-12-310000895421us-gaap:SeriesCPreferredStockMember2020-01-012020-12-310000895421us-gaap:SeriesCPreferredStockMember2019-01-012019-12-310000895421us-gaap:SeriesCPreferredStockMember2018-01-012018-12-310000895421us-gaap:SeriesEPreferredStockMember2019-01-012019-12-310000895421us-gaap:SeriesEPreferredStockMember2018-01-012018-12-310000895421us-gaap:SeriesFPreferredStockMember2019-01-012019-12-310000895421us-gaap:SeriesFPreferredStockMember2018-01-012018-12-310000895421us-gaap:SeriesGPreferredStockMember2020-01-012020-12-310000895421us-gaap:SeriesGPreferredStockMember2019-01-012019-12-310000895421us-gaap:SeriesGPreferredStockMember2018-01-012018-12-310000895421us-gaap:SeriesHPreferredStockMember2020-01-012020-12-310000895421us-gaap:SeriesHPreferredStockMember2019-01-012019-12-310000895421us-gaap:SeriesHPreferredStockMember2018-01-012018-12-310000895421ms:SeriesIPreferredStockMember2019-01-012019-12-310000895421ms:SeriesIPreferredStockMember2018-01-012018-12-310000895421ms:SeriesJPreferredStockMember2020-01-012020-12-310000895421ms:SeriesJPreferredStockMember2019-01-012019-12-310000895421ms:SeriesJPreferredStockMember2018-01-012018-12-310000895421ms:SeriesKPreferredStockMember2019-01-012019-12-310000895421ms:SeriesKPreferredStockMember2018-01-012018-12-310000895421ms:SeriesLPreferredStockMember2019-01-012019-12-310000895421ms:SeriesLPreferredStockMember2018-01-012018-12-310000895421ms:SeriesMPreferredStockMember2020-01-012020-12-310000895421ms:SeriesMPreferredStockMember2019-01-012019-12-310000895421ms:SeriesMPreferredStockMember2018-01-012018-12-310000895421ms:SeriesNPreferredStockMember2020-01-012020-12-310000895421ms:SeriesNPreferredStockMember2019-01-012019-12-310000895421ms:SeriesNPreferredStockMember2018-01-012018-12-310000895421us-gaap:RetainedEarningsMemberus-gaap:AccountingStandardsUpdate201602Membersrt:CumulativeEffectPeriodOfAdoptionAdjustmentMember2018-12-310000895421us-gaap:RetainedEarningsMembersrt:CumulativeEffectPeriodOfAdoptionAdjustmentMemberus-gaap:AccountingStandardsUpdate201409Member2017-12-310000895421us-gaap:RetainedEarningsMembersrt:CumulativeEffectPeriodOfAdoptionAdjustmentMemberus-gaap:AccountingStandardsUpdate201712Member2017-12-310000895421us-gaap:AccountingStandardsUpdate201802Memberus-gaap:RetainedEarningsMembersrt:CumulativeEffectPeriodOfAdoptionAdjustmentMember2017-12-310000895421us-gaap:RetainedEarningsMembersrt:CumulativeEffectPeriodOfAdoptionAdjustmentMemberms:AccountingStandardsUpdateOthersMember2017-12-310000895421us-gaap:AccumulatedTranslationAdjustmentMember2017-12-310000895421us-gaap:AccumulatedNetUnrealizedInvestmentGainLossMember2017-12-310000895421us-gaap:AccumulatedDefinedBenefitPlansAdjustmentMember2017-12-310000895421ms:AOCIDebtValuationAdjustmentParentMember2017-12-310000895421us-gaap:AccumulatedTranslationAdjustmentMembersrt:CumulativeEffectPeriodOfAdoptionAdjustmentMember2017-12-310000895421us-gaap:AccumulatedNetUnrealizedInvestmentGainLossMembersrt:CumulativeEffectPeriodOfAdoptionAdjustmentMember2017-12-310000895421srt:CumulativeEffectPeriodOfAdoptionAdjustmentMemberus-gaap:AccumulatedDefinedBenefitPlansAdjustmentMember2017-12-310000895421ms:AOCIDebtValuationAdjustmentParentMembersrt:CumulativeEffectPeriodOfAdoptionAdjustmentMember2017-12-310000895421srt:CumulativeEffectPeriodOfAdoptionAdjustmentMember2017-12-310000895421us-gaap:AccumulatedTranslationAdjustmentMember2018-01-012018-12-310000895421us-gaap:AccumulatedNetUnrealizedInvestmentGainLossMember2018-01-012018-12-310000895421us-gaap:AccumulatedDefinedBenefitPlansAdjustmentMember2018-01-012018-12-310000895421ms:AOCIDebtValuationAdjustmentParentMember2018-01-012018-12-310000895421us-gaap:AccumulatedTranslationAdjustmentMember2018-12-310000895421us-gaap:AccumulatedNetUnrealizedInvestmentGainLossMember2018-12-310000895421us-gaap:AccumulatedDefinedBenefitPlansAdjustmentMember2018-12-310000895421ms:AOCIDebtValuationAdjustmentParentMember2018-12-310000895421us-gaap:AccumulatedTranslationAdjustmentMember2019-01-012019-12-310000895421us-gaap:AccumulatedNetUnrealizedInvestmentGainLossMember2019-01-012019-12-310000895421us-gaap:AccumulatedDefinedBenefitPlansAdjustmentMember2019-01-012019-12-310000895421ms:AOCIDebtValuationAdjustmentParentMember2019-01-012019-12-310000895421us-gaap:AccumulatedTranslationAdjustmentMember2019-12-310000895421us-gaap:AccumulatedNetUnrealizedInvestmentGainLossMember2019-12-310000895421us-gaap:AccumulatedDefinedBenefitPlansAdjustmentMember2019-12-310000895421ms:AOCIDebtValuationAdjustmentParentMember2019-12-310000895421us-gaap:AccumulatedTranslationAdjustmentMember2020-01-012020-12-310000895421us-gaap:AccumulatedNetUnrealizedInvestmentGainLossMember2020-01-012020-12-310000895421us-gaap:AccumulatedDefinedBenefitPlansAdjustmentMember2020-01-012020-12-310000895421ms:AOCIDebtValuationAdjustmentParentMember2020-01-012020-12-310000895421us-gaap:AccumulatedTranslationAdjustmentMember2020-12-310000895421us-gaap:AccumulatedNetUnrealizedInvestmentGainLossMember2020-12-310000895421us-gaap:AccumulatedDefinedBenefitPlansAdjustmentMember2020-12-310000895421ms:AOCIDebtValuationAdjustmentParentMember2020-12-310000895421us-gaap:AccumulatedForeignCurrencyAdjustmentIncludingPortionAttributableToNoncontrollingInterestMember2020-01-012020-12-310000895421us-gaap:AccumulatedForeignCurrencyAdjustmentAttributableToNoncontrollingInterestMember2020-01-012020-12-310000895421us-gaap:AccumulatedNetInvestmentGainLossIncludingPortionAttributableToNoncontrollingInterestMember2020-01-012020-12-310000895421us-gaap:AccumulatedNetInvestmentGainLossAttributableToNoncontrollingInterestMember2020-01-012020-12-310000895421us-gaap:AccumulatedDefinedBenefitPlansAdjustmentIncludingPortionAttributableToNoncontrollingInterestMember2020-01-012020-12-310000895421us-gaap:AccumulatedDefinedBenefitPlansAdjustmentAttributableToNoncontrollingInterestMember2020-01-012020-12-310000895421ms:AOCIDebtValuationAdjustmentIncludingNoncontrollingInterestMember2020-01-012020-12-310000895421ms:AOCIDebtValuationAdjustmentNoncontrollingInterestMember2020-01-012020-12-310000895421us-gaap:AccumulatedForeignCurrencyAdjustmentIncludingPortionAttributableToNoncontrollingInterestMember2019-01-012019-12-310000895421us-gaap:AccumulatedForeignCurrencyAdjustmentAttributableToNoncontrollingInterestMember2019-01-012019-12-310000895421us-gaap:AccumulatedNetInvestmentGainLossIncludingPortionAttributableToNoncontrollingInterestMember2019-01-012019-12-310000895421us-gaap:AccumulatedNetInvestmentGainLossAttributableToNoncontrollingInterestMember2019-01-012019-12-310000895421us-gaap:AccumulatedDefinedBenefitPlansAdjustmentIncludingPortionAttributableToNoncontrollingInterestMember2019-01-012019-12-310000895421us-gaap:AccumulatedDefinedBenefitPlansAdjustmentAttributableToNoncontrollingInterestMember2019-01-012019-12-310000895421ms:AOCIDebtValuationAdjustmentIncludingNoncontrollingInterestMember2019-01-012019-12-310000895421ms:AOCIDebtValuationAdjustmentNoncontrollingInterestMember2019-01-012019-12-310000895421us-gaap:AccumulatedForeignCurrencyAdjustmentIncludingPortionAttributableToNoncontrollingInterestMember2018-01-012018-12-310000895421us-gaap:AccumulatedForeignCurrencyAdjustmentAttributableToNoncontrollingInterestMember2018-01-012018-12-310000895421us-gaap:AccumulatedNetInvestmentGainLossIncludingPortionAttributableToNoncontrollingInterestMember2018-01-012018-12-310000895421us-gaap:AccumulatedNetInvestmentGainLossAttributableToNoncontrollingInterestMember2018-01-012018-12-310000895421us-gaap:AccumulatedDefinedBenefitPlansAdjustmentIncludingPortionAttributableToNoncontrollingInterestMember2018-01-012018-12-310000895421us-gaap:AccumulatedDefinedBenefitPlansAdjustmentAttributableToNoncontrollingInterestMember2018-01-012018-12-310000895421ms:AOCIDebtValuationAdjustmentIncludingNoncontrollingInterestMember2018-01-012018-12-310000895421ms:AOCIDebtValuationAdjustmentNoncontrollingInterestMember2018-01-012018-12-310000895421us-gaap:RestrictedStockUnitsRSUMember2020-01-012020-12-310000895421us-gaap:RestrictedStockUnitsRSUMember2019-01-012019-12-310000895421us-gaap:RestrictedStockUnitsRSUMember2018-01-012018-12-310000895421us-gaap:PerformanceSharesMember2020-01-012020-12-310000895421us-gaap:PerformanceSharesMember2019-01-012019-12-310000895421us-gaap:PerformanceSharesMember2018-01-012018-12-310000895421us-gaap:RestrictedStockUnitsRSUMembersrt:MinimumMember2020-01-012020-12-310000895421srt:MaximumMemberus-gaap:RestrictedStockUnitsRSUMember2020-01-012020-12-310000895421us-gaap:RestrictedStockUnitsRSUMember2019-12-310000895421us-gaap:RestrictedStockUnitsRSUMember2020-12-310000895421us-gaap:PerformanceSharesMembersrt:MinimumMember2020-01-012020-12-310000895421us-gaap:PerformanceSharesMembersrt:MaximumMember2020-01-012020-12-310000895421us-gaap:PerformanceSharesMember2020-12-310000895421us-gaap:PerformanceSharesMemberms:MorganStanleyAverageReturnOnEquityExcludingCertainAdjustmentsMember2020-01-012020-12-310000895421us-gaap:PerformanceSharesMemberms:MorganStanleyAverageReturnOnEquityExcludingCertainAdjustmentsMember2019-01-012019-12-310000895421us-gaap:PerformanceSharesMemberms:MorganStanleyAverageReturnOnEquityExcludingCertainAdjustmentsMember2018-01-012018-12-310000895421ms:MorganStanleyTotalShareholderReturnRelativeToTotalShareholderReturnOfStandardPoors500FinancialsSectorIndexMemberus-gaap:PerformanceSharesMember2020-01-012020-12-310000895421ms:MorganStanleyTotalShareholderReturnRelativeToTotalShareholderReturnOfStandardPoors500FinancialsSectorIndexMemberus-gaap:PerformanceSharesMember2019-01-012019-12-310000895421ms:MorganStanleyTotalShareholderReturnRelativeToTotalShareholderReturnOfStandardPoors500FinancialsSectorIndexMemberus-gaap:PerformanceSharesMember2018-01-012018-12-310000895421ms:CurrentPerformanceYearDeferredCompensationAwardsMember2020-01-012020-12-310000895421ms:PriorPerformanceYearDeferredCompensationAwardsMember2020-01-012020-12-310000895421ms:PriorPriorPerformanceYearDeferredCompensationAwardsMember2020-01-012020-12-310000895421us-gaap:PensionPlansDefinedBenefitMember2020-01-012020-12-310000895421us-gaap:PensionPlansDefinedBenefitMember2019-01-012019-12-310000895421us-gaap:PensionPlansDefinedBenefitMember2018-01-012018-12-310000895421us-gaap:PensionPlansDefinedBenefitMember2019-12-310000895421us-gaap:PensionPlansDefinedBenefitMember2018-12-310000895421us-gaap:PensionPlansDefinedBenefitMember2017-12-310000895421us-gaap:PensionPlansDefinedBenefitMember2020-12-310000895421us-gaap:CashAndCashEquivalentsMemberus-gaap:PensionPlansDefinedBenefitMemberus-gaap:FairValueInputsLevel1Member2020-12-310000895421us-gaap:FairValueInputsLevel2Memberus-gaap:CashAndCashEquivalentsMemberus-gaap:PensionPlansDefinedBenefitMember2020-12-310000895421us-gaap:FairValueInputsLevel3Memberus-gaap:CashAndCashEquivalentsMemberus-gaap:PensionPlansDefinedBenefitMember2020-12-310000895421us-gaap:PensionPlansDefinedBenefitMemberus-gaap:CashAndCashEquivalentsMember2020-12-310000895421us-gaap:USTreasuryAndGovernmentMemberus-gaap:PensionPlansDefinedBenefitMemberus-gaap:FairValueInputsLevel1Member2020-12-310000895421us-gaap:USTreasuryAndGovernmentMemberus-gaap:FairValueInputsLevel2Memberus-gaap:PensionPlansDefinedBenefitMember2020-12-310000895421us-gaap:FairValueInputsLevel3Memberus-gaap:USTreasuryAndGovernmentMemberus-gaap:PensionPlansDefinedBenefitMember2020-12-310000895421us-gaap:USTreasuryAndGovernmentMemberus-gaap:PensionPlansDefinedBenefitMember2020-12-310000895421us-gaap:CollateralizedDebtObligationsMemberus-gaap:PensionPlansDefinedBenefitMemberus-gaap:FairValueInputsLevel1Member2020-12-310000895421us-gaap:CollateralizedDebtObligationsMemberus-gaap:FairValueInputsLevel2Memberus-gaap:PensionPlansDefinedBenefitMember2020-12-310000895421us-gaap:FairValueInputsLevel3Memberus-gaap:CollateralizedDebtObligationsMemberus-gaap:PensionPlansDefinedBenefitMember2020-12-310000895421us-gaap:CollateralizedDebtObligationsMemberus-gaap:PensionPlansDefinedBenefitMember2020-12-310000895421us-gaap:PensionPlansDefinedBenefitMemberus-gaap:FairValueInputsLevel1Memberus-gaap:DerivativeMember2020-12-310000895421us-gaap:FairValueInputsLevel2Memberus-gaap:PensionPlansDefinedBenefitMemberus-gaap:DerivativeMember2020-12-310000895421us-gaap:FairValueInputsLevel3Memberus-gaap:PensionPlansDefinedBenefitMemberus-gaap:DerivativeMember2020-12-310000895421us-gaap:PensionPlansDefinedBenefitMemberus-gaap:DerivativeMember2020-12-310000895421us-gaap:PensionPlansDefinedBenefitMemberus-gaap:FairValueInputsLevel1Memberus-gaap:OtherInvestmentsMember2020-12-310000895421us-gaap:FairValueInputsLevel2Memberus-gaap:PensionPlansDefinedBenefitMemberus-gaap:OtherInvestmentsMember2020-12-310000895421us-gaap:FairValueInputsLevel3Memberus-gaap:PensionPlansDefinedBenefitMemberus-gaap:OtherInvestmentsMember2020-12-310000895421us-gaap:PensionPlansDefinedBenefitMemberus-gaap:OtherInvestmentsMember2020-12-310000895421us-gaap:PensionPlansDefinedBenefitMemberus-gaap:FairValueInputsLevel1Memberms:OtherReceivablesMember2020-12-310000895421us-gaap:FairValueInputsLevel2Memberus-gaap:PensionPlansDefinedBenefitMemberms:OtherReceivablesMember2020-12-310000895421us-gaap:FairValueInputsLevel3Memberus-gaap:PensionPlansDefinedBenefitMemberms:OtherReceivablesMember2020-12-310000895421us-gaap:PensionPlansDefinedBenefitMemberms:OtherReceivablesMember2020-12-310000895421us-gaap:AssetsMemberus-gaap:PensionPlansDefinedBenefitMemberus-gaap:FairValueInputsLevel1Member2020-12-310000895421us-gaap:FairValueInputsLevel2Memberus-gaap:AssetsMemberus-gaap:PensionPlansDefinedBenefitMember2020-12-310000895421us-gaap:FairValueInputsLevel3Memberus-gaap:AssetsMemberus-gaap:PensionPlansDefinedBenefitMember2020-12-310000895421us-gaap:PensionPlansDefinedBenefitMemberus-gaap:AssetsMember2020-12-310000895421us-gaap:FairValueMeasuredAtNetAssetValuePerShareMemberus-gaap:MoneyMarketFundsMemberus-gaap:PensionPlansDefinedBenefitMember2020-12-310000895421us-gaap:FairValueMeasuredAtNetAssetValuePerShareMemberms:ForeignFixedIncomeFundsMemberus-gaap:PensionPlansDefinedBenefitMember2020-12-310000895421us-gaap:FairValueMeasuredAtNetAssetValuePerShareMemberms:ForeignMoneyMarketFundsMemberus-gaap:PensionPlansDefinedBenefitMember2020-12-310000895421us-gaap:FairValueMeasuredAtNetAssetValuePerShareMemberms:ForeignTargetedCashFlowFundsMemberus-gaap:PensionPlansDefinedBenefitMember2020-12-310000895421us-gaap:FairValueMeasuredAtNetAssetValuePerShareMemberus-gaap:PensionPlansDefinedBenefitMember2020-12-310000895421ms:OtherPayablesMemberus-gaap:FairValueInputsLevel1Member2020-12-310000895421us-gaap:FairValueInputsLevel2Memberms:OtherPayablesMember2020-12-310000895421us-gaap:FairValueInputsLevel3Memberms:OtherPayablesMember2020-12-310000895421ms:OtherPayablesMember2020-12-310000895421us-gaap:FairValueInputsLevel1Member2020-12-310000895421us-gaap:FairValueInputsLevel2Member2020-12-310000895421us-gaap:FairValueInputsLevel3Member2020-12-310000895421us-gaap:CashAndCashEquivalentsMemberus-gaap:PensionPlansDefinedBenefitMemberus-gaap:FairValueInputsLevel1Member2019-12-310000895421us-gaap:FairValueInputsLevel2Memberus-gaap:CashAndCashEquivalentsMemberus-gaap:PensionPlansDefinedBenefitMember2019-12-310000895421us-gaap:FairValueInputsLevel3Memberus-gaap:CashAndCashEquivalentsMemberus-gaap:PensionPlansDefinedBenefitMember2019-12-310000895421us-gaap:PensionPlansDefinedBenefitMemberus-gaap:CashAndCashEquivalentsMember2019-12-310000895421us-gaap:USTreasuryAndGovernmentMemberus-gaap:PensionPlansDefinedBenefitMemberus-gaap:FairValueInputsLevel1Member2019-12-310000895421us-gaap:USTreasuryAndGovernmentMemberus-gaap:FairValueInputsLevel2Memberus-gaap:PensionPlansDefinedBenefitMember2019-12-310000895421us-gaap:FairValueInputsLevel3Memberus-gaap:USTreasuryAndGovernmentMemberus-gaap:PensionPlansDefinedBenefitMember2019-12-310000895421us-gaap:USTreasuryAndGovernmentMemberus-gaap:PensionPlansDefinedBenefitMember2019-12-310000895421us-gaap:CollateralizedDebtObligationsMemberus-gaap:PensionPlansDefinedBenefitMemberus-gaap:FairValueInputsLevel1Member2019-12-310000895421us-gaap:CollateralizedDebtObligationsMemberus-gaap:FairValueInputsLevel2Memberus-gaap:PensionPlansDefinedBenefitMember2019-12-310000895421us-gaap:FairValueInputsLevel3Memberus-gaap:CollateralizedDebtObligationsMemberus-gaap:PensionPlansDefinedBenefitMember2019-12-310000895421us-gaap:CollateralizedDebtObligationsMemberus-gaap:PensionPlansDefinedBenefitMember2019-12-310000895421us-gaap:PensionPlansDefinedBenefitMemberus-gaap:FairValueInputsLevel1Memberus-gaap:OtherInvestmentsMember2019-12-310000895421us-gaap:FairValueInputsLevel2Memberus-gaap:PensionPlansDefinedBenefitMemberus-gaap:OtherInvestmentsMember2019-12-310000895421us-gaap:FairValueInputsLevel3Memberus-gaap:PensionPlansDefinedBenefitMemberus-gaap:OtherInvestmentsMember2019-12-310000895421us-gaap:PensionPlansDefinedBenefitMemberus-gaap:OtherInvestmentsMember2019-12-310000895421us-gaap:PensionPlansDefinedBenefitMemberus-gaap:FairValueInputsLevel1Memberms:OtherReceivablesMember2019-12-310000895421us-gaap:FairValueInputsLevel2Memberus-gaap:PensionPlansDefinedBenefitMemberms:OtherReceivablesMember2019-12-310000895421us-gaap:FairValueInputsLevel3Memberus-gaap:PensionPlansDefinedBenefitMemberms:OtherReceivablesMember2019-12-310000895421us-gaap:PensionPlansDefinedBenefitMemberms:OtherReceivablesMember2019-12-310000895421us-gaap:AssetsMemberus-gaap:PensionPlansDefinedBenefitMemberus-gaap:FairValueInputsLevel1Member2019-12-310000895421us-gaap:FairValueInputsLevel2Memberus-gaap:AssetsMemberus-gaap:PensionPlansDefinedBenefitMember2019-12-310000895421us-gaap:FairValueInputsLevel3Memberus-gaap:AssetsMemberus-gaap:PensionPlansDefinedBenefitMember2019-12-310000895421us-gaap:PensionPlansDefinedBenefitMemberus-gaap:AssetsMember2019-12-310000895421us-gaap:FairValueMeasuredAtNetAssetValuePerShareMemberus-gaap:MoneyMarketFundsMemberus-gaap:PensionPlansDefinedBenefitMember2019-12-310000895421us-gaap:FairValueMeasuredAtNetAssetValuePerShareMemberms:ForeignFixedIncomeFundsMemberus-gaap:PensionPlansDefinedBenefitMember2019-12-310000895421us-gaap:FairValueMeasuredAtNetAssetValuePerShareMemberms:ForeignMoneyMarketFundsMemberus-gaap:PensionPlansDefinedBenefitMember2019-12-310000895421us-gaap:FairValueMeasuredAtNetAssetValuePerShareMemberms:ForeignTargetedCashFlowFundsMemberus-gaap:PensionPlansDefinedBenefitMember2019-12-310000895421us-gaap:FairValueMeasuredAtNetAssetValuePerShareMemberus-gaap:PensionPlansDefinedBenefitMember2019-12-310000895421us-gaap:DerivativeFinancialInstrumentsLiabilitiesMemberus-gaap:FairValueInputsLevel1Member2019-12-310000895421us-gaap:DerivativeFinancialInstrumentsLiabilitiesMemberus-gaap:FairValueInputsLevel2Member2019-12-310000895421us-gaap:FairValueInputsLevel3Memberus-gaap:DerivativeFinancialInstrumentsLiabilitiesMember2019-12-310000895421us-gaap:DerivativeFinancialInstrumentsLiabilitiesMember2019-12-310000895421ms:OtherPayablesMemberus-gaap:FairValueInputsLevel1Member2019-12-310000895421us-gaap:FairValueInputsLevel2Memberms:OtherPayablesMember2019-12-310000895421us-gaap:FairValueInputsLevel3Memberms:OtherPayablesMember2019-12-310000895421ms:OtherPayablesMember2019-12-310000895421us-gaap:FairValueInputsLevel1Member2019-12-310000895421us-gaap:FairValueInputsLevel2Member2019-12-310000895421us-gaap:FairValueInputsLevel3Member2019-12-310000895421us-gaap:FairValueInputsLevel3Memberus-gaap:PensionPlansDefinedBenefitMember2019-12-310000895421us-gaap:FairValueInputsLevel3Memberus-gaap:PensionPlansDefinedBenefitMember2018-12-310000895421us-gaap:FairValueInputsLevel3Memberus-gaap:PensionPlansDefinedBenefitMember2020-01-012020-12-310000895421us-gaap:FairValueInputsLevel3Memberus-gaap:PensionPlansDefinedBenefitMember2019-01-012019-12-310000895421us-gaap:FairValueInputsLevel3Memberus-gaap:PensionPlansDefinedBenefitMember2020-12-310000895421us-gaap:QualifiedPlanMember2020-12-310000895421ms:MorganStanley401kPlanMember2020-01-012020-12-310000895421ms:MorganStanley401kPlanMember2019-01-012019-12-310000895421ms:MorganStanley401kPlanMember2018-01-012018-12-310000895421ms:EligibleUsEmployeesWithEligiblePayLessThanOrEqualToOneHundredThousandsDollarsMemberms:MorganStanley401kPlanMember2020-01-012020-12-310000895421us-gaap:ForeignPlanMember2020-01-012020-12-310000895421us-gaap:ForeignPlanMember2019-01-012019-12-310000895421us-gaap:ForeignPlanMember2018-01-012018-12-310000895421country:GB2020-01-012020-12-310000895421country:GB2019-01-012019-12-310000895421country:GB2018-01-012018-12-310000895421country:JP2020-01-012020-12-310000895421country:JP2019-01-012019-12-310000895421country:JP2018-01-012018-12-310000895421country:HK2020-01-012020-12-310000895421country:HK2019-01-012019-12-310000895421country:HK2018-01-012018-12-310000895421ms:OtherCountriesMember2020-01-012020-12-310000895421ms:OtherCountriesMember2019-01-012019-12-310000895421ms:OtherCountriesMember2018-01-012018-12-3100008954212019-10-012019-12-3100008954212018-10-012018-12-310000895421ms:InstitutionalSecuritiesSegmentMemberus-gaap:OperatingSegmentsMember2020-01-012020-12-310000895421ms:WealthManagementSegmentMemberus-gaap:OperatingSegmentsMember2020-01-012020-12-310000895421ms:InvestmentManagementSegmentMemberus-gaap:OperatingSegmentsMember2020-01-012020-12-310000895421us-gaap:IntersegmentEliminationMember2020-01-012020-12-310000895421ms:InstitutionalSecuritiesSegmentMemberus-gaap:OperatingSegmentsMember2019-01-012019-12-310000895421ms:WealthManagementSegmentMemberus-gaap:OperatingSegmentsMember2019-01-012019-12-310000895421ms:InvestmentManagementSegmentMemberus-gaap:OperatingSegmentsMember2019-01-012019-12-310000895421us-gaap:IntersegmentEliminationMember2019-01-012019-12-310000895421ms:InstitutionalSecuritiesSegmentMemberus-gaap:OperatingSegmentsMember2018-01-012018-12-310000895421ms:WealthManagementSegmentMemberus-gaap:OperatingSegmentsMember2018-01-012018-12-310000895421ms:InvestmentManagementSegmentMemberus-gaap:OperatingSegmentsMember2018-01-012018-12-310000895421us-gaap:IntersegmentEliminationMember2018-01-012018-12-310000895421ms:InstitutionalSecuritiesSegmentMember2019-10-012019-12-310000895421ms:WealthManagementSegmentMember2019-10-012019-12-310000895421ms:InstitutionalSecuritiesSegmentMemberus-gaap:InvestmentAdviceMemberus-gaap:OperatingSegmentsMember2020-01-012020-12-310000895421ms:InstitutionalSecuritiesSegmentMemberus-gaap:InvestmentAdviceMemberus-gaap:OperatingSegmentsMember2019-01-012019-12-310000895421ms:InstitutionalSecuritiesSegmentMemberus-gaap:InvestmentAdviceMemberus-gaap:OperatingSegmentsMember2018-01-012018-12-310000895421ms:InstitutionalSecuritiesSegmentMemberms:UnderwritingMemberus-gaap:OperatingSegmentsMember2020-01-012020-12-310000895421ms:InstitutionalSecuritiesSegmentMemberms:UnderwritingMemberus-gaap:OperatingSegmentsMember2019-01-012019-12-310000895421ms:InstitutionalSecuritiesSegmentMemberms:UnderwritingMemberus-gaap:OperatingSegmentsMember2018-01-012018-12-310000895421us-gaap:AccountingStandardsUpdate201409Member2020-01-012020-12-310000895421us-gaap:AccountingStandardsUpdate201409Member2019-01-012019-12-310000895421us-gaap:AccountingStandardsUpdate201409Member2018-01-012018-12-310000895421us-gaap:InterestRateContractMember2020-01-012020-12-310000895421us-gaap:InterestRateContractMember2019-01-012019-12-310000895421us-gaap:InterestRateContractMember2018-01-012018-12-310000895421us-gaap:ForeignExchangeContractMember2020-01-012020-12-310000895421us-gaap:ForeignExchangeContractMember2019-01-012019-12-310000895421us-gaap:ForeignExchangeContractMember2018-01-012018-12-310000895421ms:EquityAndIndexContractMember2020-01-012020-12-310000895421ms:EquityAndIndexContractMember2019-01-012019-12-310000895421ms:EquityAndIndexContractMember2018-01-012018-12-310000895421ms:CommodityAndOtherContractsMember2020-01-012020-12-310000895421ms:CommodityAndOtherContractsMember2019-01-012019-12-310000895421ms:CommodityAndOtherContractsMember2018-01-012018-12-310000895421us-gaap:CreditRiskContractMember2020-01-012020-12-310000895421us-gaap:CreditRiskContractMember2019-01-012019-12-310000895421us-gaap:CreditRiskContractMember2018-01-012018-12-310000895421srt:AmericasMember2020-01-012020-12-310000895421srt:AmericasMember2019-01-012019-12-310000895421srt:AmericasMember2018-01-012018-12-310000895421us-gaap:EMEAMember2020-01-012020-12-310000895421us-gaap:EMEAMember2019-01-012019-12-310000895421us-gaap:EMEAMember2018-01-012018-12-310000895421srt:AsiaMember2020-01-012020-12-310000895421srt:AsiaMember2019-01-012019-12-310000895421srt:AsiaMember2018-01-012018-12-310000895421country:US2020-01-012020-12-310000895421country:US2019-01-012019-12-310000895421country:US2018-01-012018-12-310000895421us-gaap:NonUsMember2020-01-012020-12-310000895421us-gaap:NonUsMember2019-01-012019-12-310000895421us-gaap:NonUsMember2018-01-012018-12-310000895421us-gaap:OperatingSegmentsMember2020-01-012020-12-310000895421us-gaap:OperatingSegmentsMember2019-01-012019-12-310000895421us-gaap:OperatingSegmentsMember2018-01-012018-12-310000895421ms:WealthManagementSegmentMember2020-12-310000895421ms:WealthManagementSegmentMember2019-12-310000895421srt:AmericasMember2020-12-310000895421srt:AmericasMember2019-12-310000895421us-gaap:EMEAMember2020-12-310000895421us-gaap:EMEAMember2019-12-310000895421srt:AsiaMember2020-12-310000895421srt:AsiaMember2019-12-310000895421srt:ParentCompanyMember2020-01-012020-12-310000895421srt:ParentCompanyMember2019-01-012019-12-310000895421srt:ParentCompanyMember2018-01-012018-12-310000895421srt:ParentCompanyMember2020-12-310000895421srt:ParentCompanyMember2019-12-310000895421srt:ParentCompanyMember2018-12-310000895421srt:ParentCompanyMember2017-12-310000895421ms:SeriesLPreferredStockMember2019-11-250000895421us-gaap:WarrantMembersrt:ParentCompanyMember2020-12-310000895421us-gaap:WarrantMembersrt:ParentCompanyMember2019-12-310000895421us-gaap:CapitalLeaseObligationsMembersrt:ParentCompanyMember2020-12-310000895421us-gaap:CapitalLeaseObligationsMembersrt:ParentCompanyMember2019-12-3100008954212020-04-012020-06-3000008954212020-07-012020-09-3000008954212020-10-012020-12-3100008954212019-01-012019-03-3100008954212019-04-012019-06-3000008954212019-07-012019-09-30 UNITED STATES SECURITIES AND EXCHANGE COMMISSION
Washington, D.C. 20549
FORM 10-K
ANNUAL REPORT PURSUANT TO SECTION 13 OR 15(d) OF THE SECURITIES EXCHANGE ACT OF 1934
For the year ended December 31, 2020
Commission File Number 1-11758
(Exact name of Registrant as specified in its charter)
| | | | | | | | | | | | | | | | | | | | | | | |
| Delaware | 1585 Broadway | 36-3145972 | (212) | 761-4000 | |
| (State or other jurisdiction of incorporation or organization) | New York, | NY | 10036 | (I.R.S. Employer Identification No.)
| (Registrant’s telephone number, including area code)
|
| (Address of principal executive offices, including zip code) |
| | | | | | | | |
Securities registered pursuant to Section 12(b) of the Act: | | |
| Title of each class | Trading
Symbol(s) | Name of exchange on
which registered |
| Common Stock, $0.01 par value | MS | New York Stock Exchange |
| Depositary Shares, each representing 1/1,000th interest in a share of Floating Rate | MS/PA | New York Stock Exchange |
| Non-Cumulative Preferred Stock, Series A, $0.01 par value |
Depositary Shares, each representing 1/1,000th interest in a share of Fixed-to-Floating Rate | MS/PE | New York Stock Exchange |
| Non-Cumulative Preferred Stock, Series E, $0.01 par value |
Depositary Shares, each representing 1/1,000th interest in a share of Fixed-to-Floating Rate | MS/PF | New York Stock Exchange |
Non-Cumulative Preferred Stock, Series F, $0.01 par value |
Depositary Shares, each representing 1/1,000th interest in a share of Fixed-to-Floating Rate | MS/PI | New York Stock Exchange |
| Non-Cumulative Preferred Stock, Series I, $0.01 par value |
Depositary Shares, each representing 1/1,000th interest in a share of Fixed-to-Floating Rate | MS/PK | New York Stock Exchange |
| Non-Cumulative Preferred Stock, Series K, $0.01 par value |
| Depositary Shares, each representing 1/1,000th interest in a share of 4.875% | MS/PL | New York Stock Exchange |
| Non-Cumulative Preferred Stock, Series L, $0.01 par value |
| Global Medium-Term Notes, Series A, Fixed Rate Step-Up Senior Notes Due 2026 | MS/26C | New York Stock Exchange |
| of Morgan Stanley Finance LLC (and Registrant’s guarantee with respect thereto) |
| Morgan Stanley Cushing® MLP High Income Index ETNs due March 21, 2031 | MLPY | NYSE Arca, Inc. |
Indicate by check mark if Registrant is a well-known seasoned issuer, as defined in Rule 405 of the Securities Act. Yes ☒ No ☐
Indicate by check mark if Registrant is not required to file reports pursuant to Section 13 or 15(d) of the Act. Yes ☐ No ☒
Indicate by check mark whether Registrant (1) has filed all reports required to be filed by Section 13 or 15(d) of the Securities Exchange Act of 1934 during the preceding 12 months (or for such shorter period that Registrant was required to file such reports), and (2) has been subject to such filing requirements for the past 90 days. Yes ☒ No ☐
Indicate by check mark whether the Registrant has submitted electronically every Interactive Data File required to be submitted pursuant to Rule 405 of Regulation S-T during the preceding 12 months (or for such shorter period that the Registrant was required to submit such files). Yes ☒ No ☐
Indicate by check mark whether the Registrant is a large accelerated filer, an accelerated filer, a non-accelerated filer, a smaller reporting company or an emerging growth company. See the definitions of “large accelerated filer,” “accelerated filer,” “smaller reporting company” and “emerging growth company” in Rule 12b-2 of the Exchange Act. (Check one):
| | | | | | | | | | | | | | | | | | | | | | | | | | | | | |
| Large accelerated filer | ☒ | Accelerated filer | ☐ | Non-accelerated filer | ☐ | Smaller reporting company | ☐ | Emerging growth company | ☐ |
If an emerging growth company, indicate by check mark if the Registrant has elected not to use the extended transition period for complying with any new or revised financial accounting standards provided pursuant to Section 13(a) of the Exchange Act. ☐
Indicate by check mark whether the Registrant has filed a report on and attestation to its management's assessment of the effectiveness of its internal control over financial reporting under Section 404(b) of the Sarbanes-Oxley Act (15 U.S.C. 7262(b)) by the registered public accounting firm that prepared or issued its audit report. ☒
Indicate by check mark whether Registrant is a shell company (as defined in Exchange Act Rule 12b-2). Yes ☐ No ☒
As of June 30, 2020, the aggregate market value of the common stock of Registrant held by non-affiliates of Registrant was approximately $73,070,017,178. This calculation does not reflect a determination that persons are affiliates for any other purposes.
As of January 29, 2021, there were 1,813,552,280 shares of Registrant’s common stock, $0.01 par value, outstanding.
Documents Incorporated by Reference: Portions of Registrant’s definitive proxy statement for its 2021 annual meeting of shareholders are incorporated by reference in Part III of this Form 10-K.
| | | | | |
| |
| ANNUAL REPORT ON FORM 10-K | |
| For the year ended December 31, 2020 | |
| | | | | | | | | | | |
| Table of Contents | Part | Item | Page |
| I | 1 | |
| | | |
| | | |
| | | |
| | | |
| | | |
| | | |
| | 1A | |
| II | 7 | |
| | | |
| | | |
| | | |
| | | |
| | | |
| | | |
| | | |
| | | |
| | | |
| | | |
| | | |
| | | |
| | | |
| | 7A | |
| | | |
| | | |
| | | |
| | | |
| | 8 | |
| | | |
| | | |
| | | |
| | | |
| | | |
| | | |
| | | |
| | | |
| | | |
| | | |
| | | |
| | | |
| | | |
| | | | | | | | | | | |
| Table of Contents | Part | Item | Page |
| | | |
| | | |
| | | |
| | | |
| | | |
| | | |
| | | |
| | | |
| | | |
| | | |
| | | |
| | | |
| | | |
| | | |
| | | |
| | | |
| | | |
| | | |
| | | |
| | | |
| | 9 | |
| | 9A | |
| | 9B | |
| I | 1B | |
| | 2 | |
| | 3 | |
| | 4 | |
| II | 5 | |
| III | 10 | |
| | 11 | |
| | 12 | |
| | 13 | |
| | 14 | |
| IV | 15 | |
| | 16 | |
| | | |
Forward-Looking Statements
We have included in or incorporated by reference into this report, and from time to time may make in our public filings, press releases or other public statements, certain statements, including (without limitation) those under “Management’s Discussion and Analysis of Financial Condition and Results of Operations”, “Quantitative and Qualitative Disclosures about Risk” and “Legal Proceedings” that may constitute “forward-looking statements” within the meaning of the safe harbor provisions of the Private Securities Litigation Reform Act of 1995. In addition, our management may make forward-looking statements to analysts, investors, representatives of the media and others. These forward-looking statements are not historical facts and represent only our beliefs regarding future events, many of which, by their nature, are inherently uncertain and beyond our control.
The nature of our business makes predicting the future trends of our revenues, expenses, and net income difficult. The risks and uncertainties involved in our businesses could affect the matters referred to in such statements, and it is possible that our actual results may differ, possibly materially, from the anticipated results indicated in these forward-looking statements. Important factors that could cause actual results to differ from those in the forward-looking statements include (without limitation):
•the effect of market conditions, particularly in the global equity, fixed income, currency, credit and commodities markets, including corporate and mortgage (commercial and residential) lending and commercial real estate and energy markets;
•the level of individual investor participation in the global markets as well as the level of client assets;
•the flow of investment capital into or from assets under management or supervision;
•the level and volatility of equity, fixed income and commodity prices, interest rates, inflation and currency values, other market indices or other market factors, such as market liquidity;
•the availability and cost of both credit and capital as well as the credit ratings assigned to our unsecured short-term and long-term debt;
•technological changes instituted by us, our competitors or counterparties and technological risks, business continuity and related operational risks, including breaches or other disruptions of our or a third party’s (or third parties thereof) operations or systems;
•risk associated with cybersecurity threats, including data protection and cybersecurity risk management;
•our ability to manage effectively our capital and liquidity, including under stress tests designed by our banking regulators;
•the impact of current, pending and future legislation or changes thereto, regulation (including capital, leverage, funding, liquidity and recovery and resolution requirements) and our ability to address such requirements;
•uncertainty concerning fiscal or monetary policies established by central banks and financial regulators, government shutdowns, debt ceilings or funding;
•changes to global trade policies, tariffs, interest rates, reforms of LIBOR and other interest rate benchmarks;
•legal and regulatory actions, including litigation and enforcement, in the U.S. and worldwide;
•changes in tax laws and regulations globally;
•the effectiveness of our risk management processes and related controls;
•our ability to effectively respond to an economic downturn, or other market disruptions;
•the effect of social, economic and political conditions and geopolitical events, including as a result of changes in U.S. presidential administrations or Congress and the U.K.’s withdrawal from the E.U. (“Brexit”), and sovereign risk;
•the actions and initiatives of current and potential competitors as well as governments, central banks, regulators and self-regulatory organizations;
•our ability to provide innovative products and services and execute our strategic initiatives, and costs related thereto, including with respect to the operational or technological integration related to such innovative and strategic initiatives;
•the performance and results of our acquisitions, divestitures, joint ventures, strategic alliances, or other strategic arrangements and related integrations;
•investor, consumer and business sentiment and confidence in the financial markets;
•our reputation and the general perception of the financial services industry;
•our ability to retain and attract qualified employees;
•the duration of the coronavirus disease (“COVID-19”) pandemic and any recovery period, including the effectiveness of any vaccines, future actions taken by governmental authorities, and the effects on our employees, customers and counterparties;
•climate-related incidents, other pandemics and acts of war or terrorism; and
•other risks and uncertainties detailed under “Business—Competition”, “Business—Supervision and Regulation”, “Risk Factors” and elsewhere throughout this report.
Accordingly, you are cautioned not to place undue reliance on forward-looking statements, which speak only as of the date on which they are made. We undertake no obligation to update publicly or revise any forward-looking statements to reflect the impact of circumstances or events that arise after the dates they are made, whether as a result of new information, future events or otherwise except as required by applicable law. You should, however, consult further disclosures we may make in future filings of our annual reports on Form 10-K, quarterly reports on Form 10-Q and current reports on Form 8-K and any amendments thereto or in future press releases or other public statements.
Available Information
We file annual, quarterly and current reports, proxy statements and other information with the SEC. The SEC maintains a website, www.sec.gov, that contains annual, quarterly and current reports, proxy and information statements and other information that issuers file electronically with the SEC. Our electronic SEC filings are available to the public at the SEC’s website.
Our website is www.morganstanley.com. You can access our Investor Relations webpage at www.morganstanley.com/about-us-ir. We make available free of charge, on or through our Investor Relations webpage, our proxy statements, annual reports on Form 10-K, quarterly reports on Form 10-Q, current reports on Form 8-K and any amendments to those reports filed or furnished pursuant to the Securities Exchange Act of 1934, as amended (“Exchange Act”), as soon as reasonably practicable after such material is electronically filed with, or furnished to, the SEC. We also make available, through our Investor Relations webpage, via a link to the SEC’s website, statements of beneficial ownership of our equity securities filed by our directors, officers, 10% or greater shareholders and others under Section 16 of the Exchange Act.
You can access information about our corporate governance at www.morganstanley.com/about-us-governance, our sustainability initiatives at www.morganstanley.com/about-us/sustainability-at-morgan-stanley and our commitment to diversity and inclusion at www.morganstanley.com/about-us/diversity. Our webpages include:
•Amended and Restated Certificate of Incorporation;
•Amended and Restated Bylaws;
•Charters for our Audit Committee, Compensation, Management Development and Succession Committee, Nominating and Governance Committee, Operations and Technology Committee, and Risk Committee;
•Corporate Governance Policies;
•Policy Regarding Corporate Political Activities;
•Policy Regarding Shareholder Rights Plan;
•Equity Ownership Commitment;
•Code of Ethics and Business Conduct;
•Code of Conduct;
•Integrity Hotline Information;
•Environmental and Social Policies;
•Sustainability Report;
•Task Force on Climate-related Financial Disclosures Report; and
•Diversity and Inclusion Report.
Our Code of Ethics and Business Conduct applies to all directors, officers and employees, including our Chief Executive Officer, Chief Financial Officer and Deputy Chief Financial Officer. We will post any amendments to the Code of Ethics and Business Conduct and any waivers that are required to be disclosed by the rules of either the SEC or the New York Stock Exchange LLC (“NYSE”) on our website. You can request a copy of these documents, excluding exhibits, at no cost, by contacting Investor Relations, 1585 Broadway, New York, NY 10036 (212-761-4000). The information on our website is not incorporated by reference into this report.
Business
Overview
We are a global financial services firm that, through our subsidiaries and affiliates, advises, and originates, trades, manages and distributes capital for, governments, institutions and individuals. We were originally incorporated under the laws of the State of Delaware in 1981, and our predecessor companies date back to 1924. We are an FHC regulated by the Board of Governors of the Federal Reserve System (“Federal Reserve”) under the Bank Holding Company Act of 1956, as amended (“BHC Act”). We conduct our business from our headquarters in and around New York City, our regional offices and branches throughout the U.S. and our principal offices in London, Tokyo, Hong Kong and other world financial centers. Unless the context otherwise requires, the terms “Morgan Stanley,” the “Firm,” “us,” “we” and “our” mean Morgan Stanley (the “Parent Company”) together with its consolidated subsidiaries. See the “Glossary of Common Terms and Acronyms” for the definition of certain terms and acronyms used throughout the 2020 Form 10-K.
Financial information concerning us, our business segments and geographic regions for each of the years ended December 31, 2020, December 31, 2019 and December 31, 2018 is included in “Financial Statements and Supplementary Data.”
On October 2, 2020, we completed the acquisition of E*TRADE Financial Corporation (“E*TRADE”). For further information, see “Management’s Discussion and Analysis of Financial Condition and Results of Operations—Business Segments—Wealth Management” and Note 3 to the financial statements.
Business Segments
We are a global financial services firm that maintains significant market positions in each of our business segments: Institutional Securities, Wealth Management and Investment Management. Through our subsidiaries and affiliates, we provide a wide variety of products and services to a large and diversified group of clients and customers, including corporations, governments, financial institutions and individuals. Additional information related to our business segments, respective clients, and products and services provided is included under “Management’s Discussion and Analysis of Financial Condition and Results of Operations.”
Competition
All aspects of our businesses are highly competitive, and we expect them to remain so. We compete in the U.S. and globally for clients, market share and human talent. Operating within the financial services industry on a global basis presents, among other things, technological, risk management, regulatory and other infrastructure challenges that require effective resource allocation in order for us to remain competitive. Our competitive position depends on a number
of factors, including our reputation, the quality and consistency of our long-term investment performance, innovation, execution, relative pricing or other factors including entering into new, or expanding current, businesses as a result of acquisitions and other strategic initiatives. Our ability to sustain or improve our competitive position also depends substantially on our ability to continue to attract and retain highly qualified employees while managing compensation and other costs. We compete with commercial banks, brokerage firms, insurance companies, exchanges, electronic trading and clearing platforms, financial data repositories, sponsors of mutual funds, hedge funds and private equity funds, energy companies, financial technology firms and other companies offering financial or ancillary services in the U.S., globally and digitally, including through the internet. In addition, restrictive laws and regulations applicable to certain financial services institutions, which may prohibit us from engaging in certain transactions and impose more stringent capital and liquidity requirements, can put us at a competitive disadvantage to competitors in certain businesses not subject to these same requirements. See also “Supervision and Regulation” herein and “Risk Factors.”
We compete directly in the U.S. and globally with other securities and financial services firms and broker-dealers and with others on a regional or product basis. Additionally, there is increased competition driven by established firms as well as the emergence of new firms and business models (including innovative uses of technology) competing for the same clients and assets or offering similar products and services to retail and institutional customers. We also compete with companies that provide online trading and banking services, investment advisor services, robo-advice capabilities, and other financial products and services.
Our ability to access capital at competitive rates (which is generally impacted by our credit ratings), to commit and to deploy capital efficiently, particularly in our capital-intensive underwriting and sales, trading, financing and market-making activities, also affects our competitive position. We expect corporate clients to continue to request that we provide loans or lending commitments in connection with certain investment banking activities.
It is possible that competition may become even more intense as we continue to compete with financial or other institutions that may be larger, or better capitalized, or may have a stronger local presence and longer operating history in certain geographies or products. Many of these firms have the ability to offer a wide range of products and services, and on different platforms, that may enhance their competitive position and could result in pricing pressure on our businesses.
We continue to experience intense price competition in some of our businesses. In particular, the ability to execute securities trades electronically on exchanges and through other automated trading markets has increased the pressure on trading commissions and fees. The trend toward direct access
to automated, electronic markets will likely increase as additional trading moves to more automated platforms. It is also possible that we will experience competitive pressures in these and other areas in the future as some of our competitors seek to obtain market share by reducing or eliminating bid-offer spreads, commissions, markups or fees.
Our ability to compete successfully in the investment management industry is affected by several factors, including our reputation, investment objectives, quality of investment professionals, performance of investment strategies or product offerings relative to peers and appropriate benchmark indices, advertising and sales promotion efforts, fee levels, the effectiveness of and access to distribution channels and investment pipelines, and the types and quality of products offered. Our investment products, including alternative investment products, may compete with investments offered by other investment managers with passive investment products or who may be subject to less stringent legal and regulatory regimes than us.
Supervision and Regulation
As a major financial services firm, we are subject to extensive regulation by U.S. federal and state regulatory agencies and securities exchanges and by regulators and exchanges in each of the major markets where we conduct our business. These include legislative and regulatory responses to the 2008 financial crisis and its aftermath, both in the U.S. and worldwide, including: the Dodd-Frank Wall Street Reform and Consumer Protection Act (“Dodd-Frank Act”); risk-based capital, leverage and liquidity standards adopted or being developed by the Basel Committee on Banking Supervision (“Basel Committee”), including Basel III, and the national implementation of those standards; capital planning and stress testing requirements; and recovery and resolution regimes in the U.S. and other jurisdictions. In some areas, regulatory standards are still subject to further rulemaking or transition periods or may otherwise be revised in whole or in part.
We continue to monitor the changing political, tax and regulatory environment; it is likely that there will be further changes in the way major financial institutions are regulated in both the U.S. and other markets in which we operate, although it remains difficult to predict the exact impact these changes will have on our business, financial condition, results of operations and cash flows for a particular future period. We expect to remain subject to extensive supervision and regulation.
Financial Holding Company
Consolidated Supervision. We have operated as a BHC and FHC under the BHC Act since September 2008. As a BHC, we are subject to comprehensive consolidated supervision, regulation and examination by the Federal Reserve. The Federal Reserve has authority to examine, prescribe regulations and take action with respect to all of our subsidiaries. In particular, we are subject to (among other
things): significantly revised and expanded regulation and supervision; intensive scrutiny of our businesses and plans for expansion of those businesses; limitations on activities; a systemic risk regime that imposes heightened capital and liquidity requirements; restrictions on activities and investments imposed by a section of the BHC Act added by the Dodd-Frank Act referred to as the “Volcker Rule”; and comprehensive derivatives regulation. In addition, the Consumer Financial Protection Bureau has primary rulemaking, enforcement and examination authority over us and our subsidiaries with respect to federal consumer protection laws, to the extent applicable.
Scope of Permitted Activities. The BHC Act limits the activities of BHCs and FHCs and grants the Federal Reserve authority to limit our ability to conduct activities. We must obtain the Federal Reserve’s approval before engaging in certain banking and other financial activities both in the U.S. and internationally.
The BHC Act grandfathers “activities related to the trading, sale or investment in commodities and underlying physical properties,” provided that we were engaged in “any of such activities as of September 30, 1997 in the U.S.” and provided that certain other conditions that are within our reasonable control are satisfied. We currently engage in our commodities activities pursuant to the BHC Act grandfather exemption as well as other authorities under the BHC Act.
Activities Restrictions under the Volcker Rule. The Volcker Rule prohibits banking entities, including us and our affiliates, from engaging in certain proprietary trading activities, as defined in the Volcker Rule, subject to exemptions for underwriting, market-making-related activities, risk-mitigating hedging and certain other activities. The Volcker Rule also prohibits certain investments and relationships by banking entities with covered funds, as defined in the Volcker Rule, with a number of exemptions and exclusions. The Volcker Rule also requires that deductions be made from a BHC’s Tier 1 capital for permissible investments in certain covered funds. In addition, the Volcker Rule requires banking entities to have comprehensive compliance programs reasonably designed to ensure and monitor compliance with the Volcker Rule. We have brought all of our activities and investments into conformance, subject to a June 2017 approval by the Federal Reserve for a five-year extension of the transition period to conform investments in certain legacy covered funds that are also illiquid funds. The approval covers essentially all of our non-conforming investments in, and relationships with, legacy covered funds subject to the Volcker Rule.
Since the initial adoption of the Volcker Rule’s implementing regulations, revisions to both the proprietary trading and covered fund provisions have been made, which have generally simplified the application of the Volcker Rule. The covered funds final rule became effective on October 1, 2020, and full compliance with the changes to the proprietary trading final rule was required by January 1, 2021. We do not
expect either the proprietary trading or covered funds revisions to have a material impact on the way we conduct business under the current rule.
Capital Standards. The Federal Reserve establishes capital requirements, including well-capitalized standards, for large BHCs and evaluates our compliance with such requirements. The OCC establishes similar capital requirements and standards for Morgan Stanley Bank, N.A. (“MSBNA”), Morgan Stanley Private Bank, National Association (“MSPBNA”), E*TRADE Bank (“ETB”) and E*TRADE Savings Bank (“ETSB”), a wholly-owned subsidiary of ETB, (collectively, our “U.S. Bank Subsidiaries”).
Regulatory Capital Framework: The regulatory capital requirements for us and our U.S. Bank Subsidiaries are largely based on the Basel III capital standards established by the Basel Committee, as supplemented by certain provisions of the Dodd-Frank Act. We are subject to various risk-based capital requirements with various transition provisions, measured against our Common Equity Tier 1 capital, Tier 1 capital and Total capital bases, leverage-based capital requirements, including the SLR, and additional capital buffers above generally applicable minimum standards for BHCs.
The Basel Committee has published a comprehensive set of revisions to its Basel III Framework. The revised requirements are expected to take effect starting January 2023, subject to U.S. banking agencies issuing implementation proposals. The impact on us of any revisions to the Basel Committee’s capital standards is uncertain and depends on future rulemakings by the U.S. banking agencies.
Regulated Subsidiaries: In addition, many of our regulated subsidiaries are, or are expected to be in the future, subject to regulatory capital requirements, including regulated subsidiaries registered as swap dealers with the CFTC or security-based swap dealers with the SEC (collectively, “Swaps Entities”) or registered as broker-dealers or futures commission merchants. Specific regulatory capital requirements vary by regulated subsidiary, and in many cases these standards are still in proposed form, not yet effective or are subject to ongoing rulemakings that could substantially modify requirements.
For more information about the specific capital requirements applicable to us and our U.S. Bank Subsidiaries, see “Management’s Discussion and Analysis of Financial Condition and Results of Operations—Liquidity and Capital Resources—Regulatory Requirements.”
Capital Planning, Stress Tests and Capital Distributions: Pursuant to the Dodd-Frank Act, the Federal Reserve has adopted capital planning and stress test requirements for large BHCs, including Morgan Stanley. For more information about the capital planning and stress test requirements, see “Management’s Discussion and Analysis of
Financial Condition and Results of Operations—Liquidity and Capital Resources—Regulatory Requirements.”
In addition to capital planning requirements, the Federal Reserve, the OCC and the FDIC have the authority to prohibit or to limit the payment of dividends by the banking organizations they supervise, including us and our U.S. Bank Subsidiaries, if, in the banking regulator’s opinion, payment of a dividend would constitute an unsafe or unsound practice in light of the financial condition of the banking organization. For information about the Federal Reserve’s restrictions on capital distributions for large BHCs, see “Management’s Discussion and Analysis of Financial Condition and Results of Operations—Liquidity and Capital Resources—Regulatory Requirements—Capital Action Supervisory Restrictions.” All of these policies and other requirements could affect our ability to pay dividends and/or repurchase stock, or require us to provide capital assistance to our U.S. Bank Subsidiaries under circumstances which we would not otherwise decide to do so.
Liquidity Standards. In addition to capital regulations, the U.S. banking agencies and the Basel Committee have adopted liquidity and funding standards. We, MSBNA and MSPBNA are, and following a transition period ETB will be, subject to the U.S. banking agencies’ LCR requirements, which generally follow Basel Committee standards. Similarly, when the final NSFR requirements issued by the U.S. banking agencies become effective July 1, 2021, we, MSBNA, MSPBNA and ETB will become subject to NSFR requirements, which generally follow Basel Committee standards.
In addition to the LCR and NSFR, we and many of our regulated subsidiaries are subject to other liquidity standards, including liquidity stress testing and associated liquidity reserve requirements.
For more information, see “Management’s Discussion and Analysis of Financial Condition and Results of Operations—Liquidity and Capital Resources—Regulatory Liquidity Framework.”
Systemic Risk Regime. The Dodd-Frank Act, as amended by the Economic Growth, Regulatory Relief and Consumer Protection Act (“EGRRCPA”), establishes a systemic risk regime to which certain large BHCs, including Morgan Stanley, are subject. Under rules issued by the Federal Reserve to implement certain requirements of the Dodd-Frank Act’s enhanced prudential standards, such large BHCs must conduct internal liquidity stress tests, maintain unencumbered highly liquid assets to meet projected net cash outflows for 30 days over the range of liquidity stress scenarios used in internal stress tests, and comply with various liquidity risk management requirements. These large BHCs also must comply with a range of risk management and corporate governance requirements.
The Federal Reserve also imposes single-counterparty credit limits (“SCCL”) for large banking organizations. U.S. G-SIBs, including us, are subject to a limit of 15% of Tier 1 capital for aggregate net credit exposures to any “major counterparty” (defined to include other U.S. G-SIBs, foreign G-SIBs, and nonbank systemically important financial institutions supervised by the Federal Reserve). In addition, we are subject to a limit of 25% of Tier 1 capital for aggregate net credit exposures to any other unaffiliated counterparty.
The Federal Reserve has proposed rules that would create a new early remediation framework to address financial distress or material management weaknesses. The Federal Reserve also has the ability to establish additional prudential standards, including those regarding contingent capital, enhanced public disclosures and limits on short-term debt, including off-balance sheet exposures. See “Management’s Discussion and Analysis of Financial Condition and Results of Operations—Liquidity and Capital Resources—Regulatory Requirements—Total Loss-Absorbing Capacity, Long-Term Debt and Clean Holding Company Requirements.”
If the Federal Reserve or the Financial Stability Oversight Council determines that a BHC with $250 billion or more in consolidated assets poses a “grave threat” to U.S. financial stability, the institution may be, among other things, restricted in its ability to merge or offer financial products and/or required to terminate activities and dispose of assets.
See also “Capital Standards” and “Liquidity Standards” herein and “Resolution and Recovery Planning” below.
Resolution and Recovery Planning. Pursuant to the Dodd-Frank Act, we are required to periodically submit to the Federal Reserve and the FDIC a resolution plan that describes our strategy for a rapid and orderly resolution under the U.S. Bankruptcy Code in the event of our material financial distress or failure. Our preferred resolution strategy, which is set out in our 2019 resolution plan, is an SPOE strategy, which generally contemplates the provision of adequate capital and liquidity by the Parent Company to certain of its subsidiaries so that such subsidiaries have the resources necessary to implement the resolution strategy after the Parent Company has filed for bankruptcy.
Under a final rule issued by the Federal Reserve and the FDIC, we are now required to file resolution plans once every two years, with interim updates required in certain limited circumstances, including material mergers or acquisitions or fundamental changes to our resolution strategy. The rule also allows us to alternate between submitting a full, detailed resolution plan and a streamlined, targeted resolution plan. The rule also clarifies the information required to be included in our resolution plan. Our next resolution plan, due July 1, 2021, will be a targeted resolution plan and will reflect our acquisition of E*TRADE.
Further, we submit an annual recovery plan to the Federal Reserve that outlines the steps that management could take
over time to generate or conserve financial resources in times of prolonged financial stress.
Certain of our domestic and foreign subsidiaries are also subject to resolution and recovery planning requirements in the jurisdictions in which they operate. For example the FDIC requires certain insured depository institutions (“IDI”), including MSBNA and MSPBNA, to submit an annual resolution plan that describes the IDI’s strategy for a rapid and orderly resolution in the event of material financial distress or failure of the IDI.
In addition, certain financial companies, including BHCs such as the Firm and certain of its subsidiaries, can be subjected to a resolution proceeding under the orderly liquidation authority in Title II of the Dodd-Frank Act with the FDIC being appointed as receiver, provided that certain procedures are met, including certain extraordinary financial distress and systemic risk determinations by the U.S. Treasury Secretary in consultation with the U.S. President. Regulators have adopted certain orderly liquidation authority implementing regulations and may expand or clarify these regulations in the future. If we were subject to the orderly liquidation authority, the FDIC would have considerable powers, including: the power to remove directors and officers responsible for our failure and to appoint new directors and officers; the power to assign our assets and liabilities to a third party or bridge financial company without the need for creditor consent or prior court review; the ability to differentiate among our creditors, including by treating certain creditors within the same class better than others, subject to a minimum recovery right on the part of disfavored creditors to receive at least what they would have received in bankruptcy liquidation; and broad powers to administer the claims process to determine distributions from the assets of the receivership. The FDIC has been developing an SPOE strategy that could be used to implement the orderly liquidation authority.
Regulators have also taken and proposed various actions to facilitate an SPOE strategy under the U.S. Bankruptcy Code, the orderly liquidation authority or other resolution regimes. For example, the Federal Reserve and the OCC have established rules that impose contractual requirements on certain qualified financial contracts (“covered QFCs”) to which U.S. G-SIBs, including us, and their subsidiaries including our U.S. Bank Subsidiaries, are parties (together, the “covered entities”). Under these rules, covered QFCs must expressly provide that transfer restrictions and default rights against covered entities are limited to the same extent as they would be under the Federal Deposit Insurance Act and Title II of the Dodd-Frank Act and their implementing regulations, and they may not, among other things, permit the exercise of any cross-default right against covered entities based on an affiliate’s entry into insolvency, resolution or similar proceedings, subject to certain creditor protections.
For more information about our resolution plan-related submissions and associated regulatory actions, see “Risk Factors—Legal, Regulatory and Compliance Risk,"
“Management’s Discussion and Analysis of Financial Condition and Results of Operations—Liquidity and Capital Resources—Regulatory Requirements—Total Loss-Absorbing Capacity, Long-Term Debt and Clean Holding Company Requirements” and “Management’s Discussion and Analysis of Financial Condition and Results of Operations—Liquidity and Capital Resources—Regulatory Requirements—Resolution and Recovery Planning.”
Cyber and Information Security Risk Management and Protection of Client Information
The financial services industry faces increased global regulatory focus regarding cyber and information security risk management practices. Many aspects of our businesses are subject to cybersecurity legal and regulatory requirements enacted by U.S. federal and state governments and other non-U.S. jurisdictions in the Americas, Europe, the Middle East, Africa and Asia. These laws are generally aimed at codifying basic cybersecurity protections and mandating data breach notification requirements.
Our businesses are also subject to increasing privacy and data protection information security legal requirements concerning the use and protection of certain personal information. These include the General Data Protection Regulation (“GDPR”), the California Consumer Privacy Act (“CCPA”) and a broad range of laws across rest of the Americas and in Asia (including the Japanese Personal Information Protection Law, the Hong Kong Personal Data (Protection) Ordinance, the Cybersecurity Law of the People’s Republic of China and the Australian Privacy Act). These laws impose mandatory privacy and data protection obligations, including providing for individual rights, enhanced governance and accountability requirements and significant fines and litigation risk for noncompliance. Many other jurisdictions have adopted or are proposing to adopt standards similar to the GDPR, including Australia, Singapore, Japan, Argentina, India, Brazil, Switzerland and the Cayman Islands. In addition, several jurisdictions have enacted or proposed personal data localization requirements and restrictions on cross-border transfer of personal data that may restrict our ability to conduct business in those jurisdictions or create additional financial and regulatory burdens to do so.
Many aspects of our businesses are subject to legal requirements concerning the use and protection of certain customer information. These include those adopted pursuant to the Gramm-Leach-Bliley Act and the Fair and Accurate Credit Transactions Act of 2003 in the U.S., as well as the privacy and cybersecurity laws referenced above. We have adopted measures designed to comply with these and related applicable requirements in all relevant jurisdictions.
U.S. Bank Subsidiaries
U.S. Bank Subsidiaries. MSBNA, primarily a wholesale commercial bank, offers commercial lending and certain retail
securities-based lending services in addition to deposit products.
MSPBNA offers certain mortgage and other secured lending products, including retail securities-based lending products, primarily for customers of our affiliate retail broker-dealer, Morgan Stanley Smith Barney LLC (“MSSB”). MSPBNA also offers certain deposit products and prime brokerage custody services.
ETB and ETSB are federal savings banks whose primary deposit-taking activities include affiliate arrangements whereby E*TRADE Securities LLC sweeps cash balances in customers’ brokerage accounts to insured deposit accounts at ETB and ETSB.
The U.S. Bank Subsidiaries are FDIC-insured depository institutions subject to supervision, regulation and examination by the OCC and are subject to the OCC’s risk governance guidelines, which establish heightened standards for a large IDI’s risk governance framework and the oversight of that framework by the IDI’s board of directors.
Prompt Corrective Action. The Federal Deposit Insurance Corporation Improvement Act of 1991 provides a framework for regulation of depository institutions and their affiliates, including parent holding companies, by their federal banking regulators. Among other things, it requires the relevant federal banking regulator to take prompt corrective action with respect to a depository institution if that institution does not meet certain capital adequacy standards. These regulations generally apply only to insured banks and thrifts such as the U.S. Bank Subsidiaries and not to their parent holding companies. The Federal Reserve is, however, separately authorized to take appropriate action at the holding company level, subject to certain limitations. Under the systemic risk regime, as described above, we also would become subject to an early remediation protocol in the event of financial distress. In addition, BHCs, such as Morgan Stanley, are required to serve as a source of strength to their U.S. bank subsidiaries and commit resources to support these subsidiaries in the event such subsidiaries are in financial distress.
Transactions with Affiliates. Our U.S. Bank Subsidiaries are subject to Sections 23A and 23B of the Federal Reserve Act, which impose restrictions on covered transactions, as defined in the Federal Reserve Act, with any affiliates. Covered transactions include any extension of credit to, purchase of assets from, and certain other transactions by insured depository institutions with an affiliate. These restrictions limit the total amount of credit exposure that our U.S. Bank Subsidiaries may have to any one affiliate and to all affiliates, and require collateral for those exposures. Section 23B requires affiliate transactions to be on market terms. Derivative, securities borrowing and securities lending transactions between our U.S. Bank Subsidiaries and their affiliates are subject to these restrictions.
In addition, the Volcker Rule generally prohibits covered transactions between (i) us or any of our affiliates and (ii) covered funds for which we or any of our affiliates serve as the investment manager, investment adviser, commodity trading advisor or sponsor, or other covered funds organized and offered by us or any of our affiliates pursuant to specific exemptions. See also “Financial Holding Company—Activities Restriction under the Volcker Rule” above.
FDIC Regulation. An FDIC-insured depository institution is generally liable for any loss incurred or expected to be incurred by the FDIC in connection with the failure of an insured depository institution under common control by the same BHC. As commonly controlled FDIC-insured depository institutions, each of the U.S. Bank Subsidiaries could be responsible for any loss to the FDIC from the failure of another U.S. Bank Subsidiary. In addition, the four institutions are exposed to changes in the cost of FDIC insurance.
Institutional Securities and Wealth Management
Broker-Dealer and Investment Adviser Regulation. Our primary U.S. broker-dealer subsidiaries, Morgan Stanley & Co. LLC (“MS&Co.”), MSSB and E*TRADE Securities LLC, are registered broker-dealers with the SEC and in all 50 states, the District of Columbia, Puerto Rico and the U.S. Virgin Islands, and are members of various self-regulatory organizations, including FINRA, and various securities exchanges and clearing organizations. Broker-dealers are subject to laws and regulations covering all aspects of the securities business, including sales and trading practices, securities offerings, publication of research reports, use of customers’ funds and securities, capital structure, risk management controls in connection with market access, recordkeeping and retention, and the conduct of their directors, officers, representatives and other associated persons. Broker-dealers are also regulated by securities administrators in those states where they do business. Violations of the laws and regulations governing a broker-dealer’s actions could result in censures, fines, the issuance of cease-and-desist orders, revocation of licenses or registrations, the suspension or expulsion from the securities industry of such broker-dealer or its officers or employees, or other similar consequences by both federal and state securities administrators. Our broker-dealer subsidiaries are also members of the Securities Investor Protection Corporation, which provides certain protections for customers of broker-dealers against losses in the event of the insolvency of a broker-dealer.
MSSB is also a registered investment adviser with the SEC. MSSB’s relationship with its investment advisory clients is subject to the fiduciary and other obligations imposed on investment advisers under the Investment Advisers Act of 1940, and the rules and regulations promulgated thereunder as well as various state securities laws. These laws and regulations generally grant the SEC and other supervisory bodies broad administrative powers to address non-
compliance, including the power to restrict or limit MSSB from carrying on its investment advisory and other asset management activities. Other sanctions that may be imposed include the suspension of individual employees, limitations on engaging in certain activities for specified periods of time or for specified types of clients, the revocation of registrations, other censures and significant fines.
The Firm is subject to various regulations that affect broker-dealer sales practices and customer relationships. For example, the SEC's “Regulation Best Interest,” requires broker-dealers to act in the “best interest” of retail customers at the time a recommendation is made without placing the financial or other interests of the broker-dealer ahead of the interest of the retail customer. Certain states have enacted laws or rules, or are considering laws or rules, subjecting broker-dealers to a fiduciary duty when dealing with retail customers under a variety of circumstances.
Margin lending by broker-dealers is regulated by the Federal Reserve’s restrictions on lending in connection with customer and proprietary purchases and short sales of securities, as well as securities borrowing and lending activities. Broker-dealers are also subject to maintenance and other margin requirements imposed under FINRA and other self-regulatory organization rules. In many cases, our broker-dealer subsidiaries’ margin policies are more stringent than these rules.
As registered U.S. broker-dealers, certain of our subsidiaries are subject to the SEC’s net capital rule and the net capital requirements of various exchanges, other regulatory authorities and self-regulatory organizations. These rules are generally designed to measure the broker-dealer subsidiary’s general financial integrity and/or liquidity and require that at least a minimum amount of net and/or liquid assets be maintained by the subsidiary. See also “Financial Holding Company—Consolidated Supervision” and “Financial Holding Company—Liquidity Standards” above. Rules of FINRA and other self-regulatory organizations also impose limitations and requirements on the transfer of member organizations’ assets.
Research. Research-related regulations have been implemented in many jurisdictions, including in the U.S., where FINRA has adopted rules that cover research relating to both equity and debt securities. Regulators continue to focus on research conflicts of interest and may impose additional regulations. See also “Business—Supervision and Regulation—Non-U.S. Regulation” herein.
Regulation of Futures Activities and Certain Commodities Activities. MS&Co. and E*TRADE Futures LLC, as futures commission merchants, and MSSB, as an introducing broker, are subject to net capital requirements of, and certain of their activities are regulated by, the CFTC, the NFA, the Joint Audit Committee (including the Chicago Mercantile Exchange & Chicago Board of Trade (“CME Group”) in its capacity as MS&Co.'s designated self-regulatory
organization), and various commodity futures exchanges. MS&Co., E*TRADE Futures LLC and MSSB and certain of their affiliates are registered with the CFTC and are members of the NFA in various capacities. Rules and regulations of the CFTC, NFA, the Joint Audit Committee (including the CME Group) and commodity futures exchanges address obligations related to, among other things, customer protections, the segregation of customer funds and the holding of secured amounts, the use by futures commission merchants of customer funds, the margining of customer accounts and documentation entered into by futures commission merchants with their customers, recordkeeping and reporting obligations of futures commission merchants and introducing brokers, risk disclosure, risk management and discretionary trading.
Our commodities activities are subject to extensive and evolving energy, commodities, environmental, health and safety, and other governmental laws and regulations in the U.S. and abroad. Intense scrutiny of certain commodities markets by U.S. federal, state and local authorities in the U.S. and abroad and by the public has resulted in increased regulatory and legal enforcement and remedial proceedings involving companies conducting the activities in which we are engaged.
Derivatives Regulation. The commodity futures, commodity options and swaps industry in the U.S. is subject to regulation under the U.S. Commodity Exchange Act (“CEA”). The CFTC is the U.S. federal agency charged with the administration of the CEA. In addition, the SEC is the U.S. federal agency charged with the regulation of security-based swaps. The rules and regulations of various self-regulatory organizations also govern derivatives.
Under the U.S. regulatory regime for swaps and security-based swaps (collectively, “Swaps”) implemented pursuant to the Dodd-Frank Act, we are subject to comprehensive regulation of our derivatives businesses, including regulations that impose margin requirements, public and regulatory reporting, central clearing and mandatory trading on regulated exchanges or execution facilities for certain types of Swaps.
CFTC rules require registration of swap dealers, mandatory clearing and execution of interest rate and certain credit default swaps and real-time public reporting and adherence to business conduct standards for all in-scope Swaps. We have registered a number of U.S. and non U.S. CFTC swap dealers. In 2020, the CFTC finalized rules establishing capital requirements for CFTC-registered swap dealers not subject to regulation by a prudential regulator. Compliance with these rules is required by October 6, 2021.
SEC rules govern the registration and regulation of security- based swap dealers. The SEC's rules impose numerous obligations for entities that register as security-based swap dealers. Registration as a security-based swap dealer will be required starting in the fourth quarter of 2021, and compliance with a number of these rules will also be required on a similar
timeline. We anticipate registering several entities as a security-based swap dealer.
The specific parameters of some of these requirements for Swaps have been and continue to be developed through CFTC, SEC and bank regulator rulemakings. For example, the rules for variation margin are presently effective, and those for initial margin will continue to phase in based on activity levels of the swap dealer and the relevant counterparty with the final phase currently expected to begin in September 2022. Margin rules with the same or similar compliance dates have been adopted or are in the process of being finalized by regulators outside the U.S., and certain of our subsidiaries may be subject to such rules.
Although a significant number of areas within the global derivatives regulatory framework have been finalized, additional changes are expected. As the derivatives regulatory framework continues to evolve, we expect to continue to face increased costs and regulatory oversight. Complying with registration and other regulatory requirements has required, and is expected to require in the future, systems and other changes to our derivatives businesses. Compliance with Swaps-related regulatory capital requirements may also require us to devote more capital to our businesses that engage in swaps. Our Institutional Securities and Wealth Management business segments activities are also regulated in jurisdictions outside the U.S. See “Non-U.S. Regulation” herein.
Investment Management
Many of the subsidiaries engaged in our investment management activities are registered as investment advisers with the SEC. Many aspects of our investment management activities are also subject to federal and state laws and regulations primarily intended to benefit the investor or client. These laws and regulations generally grant supervisory agencies and bodies broad administrative powers, including the power to limit or restrict us from carrying on our investment management activities in the event that we fail to comply with such laws and regulations. Sanctions that may be imposed for such failure include the suspension of individual employees, limitations on our engaging in various investment management activities for specified periods of time or specified types of clients, the revocation of registrations, other censures and significant fines. Morgan Stanley Distribution, Inc., a U.S. broker-dealer subsidiary, acts as distributor to the Morgan Stanley mutual funds and as placement agent to certain private investment funds managed by our Investment Management business segment.
Our investment management activities are subject to certain additional laws and regulations, including, but not limited to, additional reporting and recordkeeping requirements (including with respect to clients that are private funds) and restrictions on sponsoring or investing in, or maintaining certain other relationships with, covered funds, as defined in the Volcker Rule, subject to certain limited exemptions. See
also “Financial Holding Company—Activities Restrictions under the Volcker Rule.”
In addition, certain of our affiliates are registered as commodity trading advisors and/or commodity pool operators, or are operating under certain exemptions from such registration pursuant to CFTC rules and other guidance, and have certain responsibilities with respect to each pool they advise. Violations of the rules of the CFTC, the NFA or the commodity exchanges could result in remedial actions, including fines, registration restrictions or terminations, trading prohibitions or revocations of commodity exchange memberships. See also “Institutional Securities and Wealth Management—Broker-Dealer and Investment Adviser Regulation,” “Institutional Securities and Wealth Management—Regulation of Futures Activities and Certain Commodities Activities,” and “Institutional Securities and Wealth Management—Derivatives Regulation” above and “Non-U.S. Regulation,” below for a discussion of other regulations that impact our Investment Management business activities.
Non-U.S. Regulation
All of our businesses are regulated extensively by non-U.S. regulators, including governments, securities exchanges, commodity exchanges, self-regulatory organizations, central banks and regulatory bodies, especially in those jurisdictions in which we maintain an office. Certain regulators have prudential, business conduct and other authority over us or our subsidiaries, as well as powers to limit or restrict us from engaging in certain businesses or to conduct administrative proceedings that can result in censures, fines, the issuance of cease-and-desist orders, or the suspension or expulsion of a regulated entity or its affiliates.
Some of our subsidiaries are regulated as broker-dealers, investment advisers or other types of regulated entities under the laws of the jurisdictions in which they operate. Subsidiaries engaged in banking and trust activities and advisory activities outside the U.S. are regulated by various government agencies in the particular jurisdiction where they are chartered, incorporated and/or conduct their business activity. For instance, the PRA, the U.K. Financial Conduct Authority (“FCA”) and several securities and futures exchanges in the U.K., including the London Stock Exchange and ICE Futures Europe, regulate our activities in the U.K.; the BaFin and the Deutsche Börse AG regulate certain of our activities in the Federal Republic of Germany; the European Central Bank supervises certain subsidiaries in our post-Brexit structure; the Central Bank of Ireland regulates our activities in Ireland, the Financial Services Agency, the Securities and Exchange Surveillance Commission, the Bank of Japan, the Japan Securities Dealers Association and several Japanese securities and futures exchanges and ministries regulate our activities in Japan; the Securities and Futures Commission of Hong Kong, the Hong Kong Monetary Authority and the Hong Kong Exchanges and Clearing Limited regulate our business in Hong Kong; the Monetary
Authority of Singapore and the Singapore Exchange Limited regulate our business in Singapore; the China Securities Regulatory Commission and the China Banking and Insurance Regulatory Commission regulate our activities in China and other similar bodies regulate our activities in Korea, Australia, India and other countries.
Our largest non-U.S. entity, MSIP, is subject to extensive regulation and supervision by the PRA, which has broad legal authority to establish prudential and other standards applicable to MSIP that seek to ensure its safety and soundness and to minimize adverse effects on the stability of the U.K. financial system. MSIP is also regulated and supervised by the FCA with respect to business conduct matters.
Non-U.S. policymakers and regulators, including the PRA, the FCA, the European Commission and European Supervisory Authorities (among others, the European Banking Authority and the European Securities and Markets Authority), continue to propose and adopt numerous reforms, including those that may further impact the structure of banks or subject us to new prudential requirements, and to formulate regulatory standards and measures that will be of relevance and importance to our European operations.
The European Commission has enacted a package of reforms including various risk reduction measures that impact subsidiaries that operate in the E.U. These include amendments to the Capital Requirements Regulation, which will come into effect in June 2021. These reforms provide updates to risk-based capital, liquidity (including introducing a net stable funding ratio), leverage and other prudential standards on a consolidated basis that are consistent with final Basel standards. The PRA has confirmed that similar amendments will be made to U.K. regulations that, post-Brexit, now apply directly to U.K. subsidiaries, but these will not take effect until January 2022. Further details are due to be published in 2021. Details of further reforms to be implemented from 2023 onwards, covering the remaining revisions to the Basel III Framework that have not already been applied, are expected during 2021.
Financial Crimes Program
Our Financial Crimes program is coordinated on an enterprise-wide basis and supports our financial crime prevention efforts across all regions and business units with responsibility for governance, oversight and execution of our AML, economic sanctions (“Sanctions”) and anti-corruption programs.
In the U.S., the Bank Secrecy Act, as amended by the USA PATRIOT Act of 2001, imposes significant obligations on financial institutions to detect and deter money laundering and terrorist financing activity, including requiring banks, BHCs and their subsidiaries, broker-dealers, futures commission merchants, introducing brokers and mutual funds to implement AML programs, verify the identity of customers
that maintain accounts, and monitor and report suspicious activity to appropriate law enforcement or regulatory authorities. Outside the U.S., applicable laws, rules and regulations similarly require designated types of financial institutions to implement AML programs.
In addition, the Anti-Money Laundering Act of 2020, which was enacted as part of the National Defense Authorization Act for Fiscal Year 2021, includes substantial changes to U.S. AML laws. These include, among other changes, the proposed creation of a national registry of beneficial ownership information, the addition of new penalties and the enhancement of certain existing penalties for Bank Secrecy Act and AML violations, and requirements that the U.S. Treasury Secretary establish public priorities for AML and countering the financing of terrorism policy and review and update requirements for currency transaction reports and suspicious activity reports, including by making updates to reduce any unnecessarily burdensome regulatory requirements.
We have implemented policies, procedures and internal controls that are designed to comply with all applicable AML laws and regulations. Regarding Sanctions, we have implemented policies, procedures and internal controls that are designed to comply with the regulations and economic sanctions programs administered by the U.S. Treasury’s Office of Foreign Assets Control (“OFAC”), which target foreign countries, entities and individuals based on external threats to U.S. foreign policy, national security or economic interests, and to comply, as applicable, with similar sanctions programs imposed by foreign governments or global or regional multilateral organizations such as the United Nations Security Council and the E.U. Council.
We are also subject to applicable anti-corruption laws, such as the U.S. Foreign Corrupt Practices Act and the U.K. Bribery Act, in the jurisdictions in which we operate. Anti-corruption laws generally prohibit offering, promising, giving or authorizing others to give anything of value, either directly or indirectly, to a government official or private party in order to influence official action or otherwise gain an unfair business advantage, such as to obtain or retain business. We have implemented policies, procedures and internal controls that are designed to comply with such laws, rules and regulations.
Human Capital
Employees
Our employees are our most important asset. Our ability to build value for our clients and shareholders depends on our approximately 68 thousand employees in 39 countries around the world as of December 31, 2020. To facilitate talent attraction and retention, we strive to make Morgan Stanley a diverse and inclusive workplace, with a strong culture and opportunities for our employees to grow and develop in their careers and be supported by competitive compensation, benefits, and health and wellness programs.
Culture
Our core values are designed to guide decision making aligned to the expectations of our employees, clients, shareholders, regulators, directors and the communities in which we operate. These guiding values—Put Clients First, Do the Right Thing, Lead with Exceptional Ideas, Commit to Diversity and Inclusion, and Give Back—are at the heart of our workplace culture and underpin our success. Our Code of Conduct is central to our expectation that employees embody our values and, as such, every new hire and every employee annually is required to certify to their understanding of and adherence to the Code of Conduct. We also invite employee feedback on our culture and workplace through our biennial employee engagement survey. For a further discussion of the culture, values, and conduct of employees, see “Quantitative and Qualitative Disclosures about Risk—Risk Management.”
Diversity and Inclusion
We believe that a diverse workforce is important to Morgan Stanley’s continued success and our ability to serve our clients. To this end, we pursue a comprehensive diversity and inclusion strategy based on four pillars: accountability, representation, advancement and culture. To build a diverse talent pipeline, we use global, targeted recruitment and development programs to hire, retain and promote female and ethnically diverse talent. Further evidencing this commitment, in 2020, we launched the Morgan Stanley Institute for Inclusion, which will help lead an integrated and transparent diversity, equity and inclusion strategy to deliver our full potential to achieve meaningful change within our Firm and beyond, including our communities.
Talent Development and Retention
We are committed to identifying and developing the talents of our workforce, as well as succession planning. Our talent development programs provide employees with the resources they need to help achieve their career goals, build management skills and lead their organizations. We also focus on the retention of our talented and skilled employees as one key component of a successful business and culture.
Compensation and Financial Wellness
We pursue responsible and effective compensation programs that reinforce our values and culture through four key objectives: delivering pay for sustainable performance, attracting and retaining top talent, aligning with shareholder interests and mitigating excessive risk taking. In addition to salaries, these programs (which vary by location) include annual bonuses, retirement savings plans with matching contributions, student loan refinancing, free will preparation through our legal plan and supplemental life insurance program, discounted group insurance options, and a financial wellness program in the U.S. and the U.K. To promote equitable rewards for all employees, including female and ethnically diverse employees, we have enhanced our practices
to support fair and consistent compensation and reward decisions based on merit, perform ongoing reviews of compensation decisions, including at the point of hire and promotion, and conduct regular assessments of our rewards structure.
Health and Wellness
The well-being of our employees is also key to the success of the Firm. To that end, we provide programs (which vary by location), including healthcare and insurance benefits, health savings and flexible spending accounts, paid time off, family leave, family care resources, flexible work schedules, adoption and surrogacy assistance, employee assistance programs, tuition assistance and on-site services, such as health centers and fitness centers, among many others. Morgan Stanley sponsors free and confidential mental health counseling for all employees and their dependents (which vary by location). In 2020, the Firm introduced a new mental health benefit in the U.S. that provides access to therapists, mental health coaches and other resources. Further, in response to the COVID-19 pandemic, we implemented changes that we determined were in the best interest of our employees. These changes include having the vast majority of our employees work from home and providing productivity resources when necessary, while implementing additional safety measures for employees continuing critical on-site work, committing to no reductions in force through 2020, COVID-19-specific medical benefits, extended childcare benefits and modified work schedules.
For more detailed information regarding our Human Capital programs and initiatives, see “Our People” in our 2019 Sustainability Report and our 2020 Diversity and Inclusion Report (both located on our website). The Reports and information elsewhere on our website are not incorporated by reference into, and do not form any part of, this Annual Report.
Human Capital Metrics1
| | | | | | | | | | | |
| Category | Metric | At
December 31,
2020 |
| Employees | Employees by geography (thousands) | Americas | 48 | |
| Asia Pacific | 12 | |
| EMEA | 8 | |
| Culture | Employee engagement2 | % Proud to work at Morgan Stanley | 88 | % |
| Diversity and Inclusion | Global gender representation | % Female | 39 | % |
% Female officer3 | 26 | % |
| U.S. ethnic diversity representation | % Ethnically diverse4 | 30 | % |
% Ethnically diverse officer3 | 24 | % |
| Retention | Voluntary attrition in 2020 | % Global | 7 | % |
| Tenure | Management Committee average length of service (years) | 19 | |
| All employees average length of service (years) | 7 | |
| Compensation | Compensation and benefits | Total compensation and benefits expense in 2020 (millions) | $ | 20,854 | |
1.Legacy E*TRADE employees are included in all metrics other than “employee engagement.” For “voluntary attrition in 2020,” E*TRADE attrition is relative to January 1, 2020 staffing levels. For “tenure,” E*TRADE tenure is based on length of service since joining E*TRADE.
2.In 2019, 91% of employees responded to the biennial employee engagement survey. The percentage shown is based on 2019 survey results.
3.Officer includes Managing Directors, Executive Directors and Vice Presidents, and the equivalent positions for legacy E*TRADE employees.
4.U.S. ethnically diverse designations align with the Equal Employment Opportunity Commission’s ethnicity and race categories and includes American Indian or Native Alaskan, Asian, Black or African American, Hispanic or Latino, Native Hawaiian or Pacific Islander, and two or more races.
Information about our Executive Officers
The executive officers of Morgan Stanley and their age and titles as of February 26, 2021 are set forth below. Business experience is provided in accordance with SEC rules.
Mandell L. Crawley (45). Chief Human Resources Officer (since February 2021). Head of Private Wealth Management (June 2017 to January 2021). Chief Marketing Officer (September 2014 to June 2017). Head of National Business Development and Talent Management for Wealth Management (June 2011 to September 2014). Divisional Business Development Officer (May 2010 to June 2011). Regional Business Development Officer (May 2009 to May 2010). Head of Field Sales and Marketing (February 2008 to May 2009). Head of Fixed Income Capital Markets Sales and Distribution for Wealth Management (April 2004 to February 2008).
James P. Gorman (62). Chairman of the Board of Directors and Chief Executive Officer of Morgan Stanley (since January 2012). President and Chief Executive Officer (January 2010 to December 2011) and member of the Board of Directors (since January 2010). Co-President (December 2007 to December 2009) and Co-Head of Strategic Planning (October 2007 to December 2009). President and Chief
| | | | | | | | |
| December 2020 Form 10-K | 10 | |
Operating Officer of Wealth Management (February 2006 to April 2008).
Eric F. Grossman (54). Executive Vice President and Chief Legal Officer of Morgan Stanley (since January 2012). Global Head of Legal (September 2010 to January 2012). Global Head of Litigation (January 2006 to September 2010) and General Counsel of the Americas (May 2009 to September 2010). General Counsel of Wealth Management (November 2008 to September 2010). Partner at the law firm of Davis Polk & Wardwell LLP (June 2001 to December 2005).
Keishi Hotsuki (58). Executive Vice President (since May 2014) and Chief Risk Officer of Morgan Stanley (since May 2011). Interim Chief Risk Officer (January 2011 to May 2011) and Head of Market Risk Department (March 2008 to April 2014). Global Head of Market Risk Management at Merrill Lynch (June 2005 to September 2007).
Edward N. Pick (52). Head of Institutional Securities (since July 2018). Global Head of Sales and Trading (October 2015 to July 2018). Head of Global Equities (March 2011 to October 2015). Co-Head of Global Equities (April 2009 to March 2011). Co-Head of Global Capital Markets (July 2008 to April 2009). Co-Head of Global Equity Capital Markets (December 2005 to July 2008).
Jonathan M. Pruzan (52). Executive Vice President and Chief Financial Officer of Morgan Stanley (since May 2015) and Head of Corporate Strategy (since December 2016). Co-Head of Global Financial Institutions Group (January 2010 to April 2015). Co-Head of North American Financial Institutions Group M&A (September 2007 to December 2009). Head of the U.S. Bank Group (April 2005 to August 2007).
Robert P. Rooney (53). Head of Technology, Operations and Firm Resilience (since April 2019). Head of Technology (January 2017 to April 2019). Chief Executive Officer of Morgan Stanley International and Head of Europe, the Middle East and Africa (January 2016 to May 2018). Global Co-Head of Fixed Income Sales and Trading (May 2013 to January 2016). Head of Fixed Income for Europe, the Middle East and Africa and Global Head of Fixed Income Sales (September 2009 to May 2013).
Andrew M. Saperstein (54). Head of Wealth Management (since April 2019). Co-Head of Wealth Management (January 2016 to April 2019). Co-Chief Operating Officer of Institutional Securities (March 2015 to January 2016). Head of Wealth Management Investment Products and Services (June 2012 to March 2015).
Daniel A. Simkowitz (55). Head of Investment Management (since October 2015). Co-Head of Global Capital Markets (March 2013 to September 2015). Chairman of Global Capital Markets (November 2009 to March 2013). Managing Director in Global Capital Markets (December 2000 to November 2009).
| | | | | | | | |
| 11 | December 2020 Form 10-K |
Risk Factors
For a discussion of the risks and uncertainties that may affect our future results and strategic objectives, see “Forward-Looking Statements” preceding “Business” and “Return on Tangible Common Equity Targets” under “Management’s Discussion and Analysis of Financial Condition and Results of Operations.”
Our results of operations may be adversely affected by the COVID-19 pandemic.
The COVID-19 pandemic and related voluntary and government-imposed social and business restrictions has impacted global economic conditions, resulting in volatility in the global financial markets, increased unemployment, and operational challenges such as the temporary and permanent closures of businesses, sheltering-in-place directives and increased remote work protocols.
Governments around the world have been working to develop, manufacture, and distribute COVID-19 vaccines and the United States has authorized the targeted distribution of certain COVID-19 vaccines, though it is unclear what the scope and timing of a more comprehensive distribution will be. Moreover, governments and central banks around the world have reacted to the economic crisis caused by the pandemic by implementing stimulus and liquidity programs and cutting interest rates, though it is unclear whether these or future actions will be successful in countering the economic disruption. If the pandemic continues to be prolonged or the actions of governments and central banks are unsuccessful, including actions to facilitate the comprehensive distribution of effective vaccines, the adverse impact on the global economy will deepen, and our results of operations and financial condition in future quarters may be adversely affected.
Should global market conditions worsen, or the pandemic lead to additional market disruptions, we could experience reduced client activity and demand for our products and services, higher credit and valuation losses in our loan and commitment and investment portfolios, impairments of other financial assets and other negative impacts on our financial position, including possible constraints on capital and liquidity, as well as a higher cost of capital, and possible changes or downgrades to our credit ratings. In addition, continued low interest rates will limit interest margins in our lending businesses across Wealth Management and Institutional Securities. A slowdown of commercial activity could cause overall sales and trading and investment banking revenues to decline and a decline in assets under management and client balances could also reduce fee and financing revenues across all of our business segments.
Operationally, we have initiated a work remotely protocol and restricted business travel of our workforce, with a return-to-workplace program, which is based on role, location and employee willingness and ability to return. While we have not
experienced a decrease in productivity as a result of the remote work environment, there can be no assurance that the transition will not have an adverse effect in the long term. If significant portions of our workforce, including key personnel, are unable to work effectively because of illness, government actions, or other restrictions in connection with the pandemic, the impact of the pandemic on our businesses could be exacerbated.
The extent to which the COVID-19 pandemic, and the related global economic crisis, affects our businesses, results of operations and financial condition, as well as our regulatory capital and liquidity ratios and our ability to take capital actions, will depend on future developments that are highly uncertain and cannot be predicted, including the scope and duration of the pandemic and any recovery period, the development, distribution, and acceptance of effective vaccines, future actions taken by governmental authorities, central banks and other third parties in response to the pandemic, and the effects on our customers, counterparties, employees and third-party service providers. Moreover, the effects of the COVID-19 pandemic will heighten many of the other risks described throughout this section. See also "Management’s Discussion and Analysis of Financial Condition and Results of Operations—Liquidity and Capital Resources—Regulatory Requirements—Capital Action Supervisory Restrictions.”
Market Risk
Market risk refers to the risk that a change in the level of one or more market prices, rates, indices, volatilities, correlations or other market factors, such as market liquidity, will result in losses for a position or portfolio owned by us. For more information on how we monitor and manage market risk, see “Quantitative and Qualitative Disclosures about Risk—Market Risk.”
Our results of operations may be materially affected by market fluctuations and by global and economic conditions and other factors, including changes in asset values.
Our results of operations have been in the past and may, in the future, be materially affected by market fluctuations due to global financial markets, economic conditions, the effects of the COVID-19 pandemic or other widespread events such as natural disasters, climate-related incidents or acts of war, changes to global trade policies and tariffs and other factors, including the level and volatility of equity, fixed income and commodity prices, the level and term structure of interest rates, inflation and currency values, and the level of other market indices.
The results of our Institutional Securities business segment, particularly results relating to our involvement in primary and secondary markets for all types of financial products, are subject to substantial market fluctuations due to a variety of factors that we cannot control or predict with great certainty. These fluctuations impact results by causing variations in
| | | | | | | | |
| December 2020 Form 10-K | 12 | |
business flows and activity and in the fair value of securities and other financial products. Fluctuations also occur due to the level of global market activity, which, among other things, affects the size, number and timing of investment banking client assignments and transactions and the realization of returns from our principal investments.
Periods of unfavorable market or economic conditions may have adverse impacts on the level of individual investor participation in the global markets and/or the level of client assets, and, in very low interest rate environments, the level of net interest income, which would negatively impact the results of our Wealth Management business segment.
Substantial market fluctuations could also cause variations in the value of our investments in our funds, the flow of investment capital into or from AUM, and the way customers allocate capital among money market, equity, fixed income or other investment alternatives, which could negatively impact our Investment Management business segment.
The value of our financial instruments may be materially affected by market fluctuations. Market volatility, illiquid market conditions and disruptions in the credit markets may make it extremely difficult to value and monetize certain of our financial instruments, particularly during periods of market displacement. Subsequent valuations in future periods, in light of factors then prevailing, may result in significant changes in the values of these instruments and may adversely impact historical or prospective fees and performance-based fees (also known as incentive fees, which include carried interest) in respect of certain businesses. In addition, at the time of any sales and settlements of these financial instruments, the price we ultimately realize will depend on the demand and liquidity in the market at that time and may be materially lower than their current fair value. Any of these factors could cause a decline in the value of our financial instruments, which may have an adverse effect on our results of operations in future periods.
In addition, financial markets are susceptible to severe events evidenced by rapid depreciation in asset values accompanied by a reduction in asset liquidity. Under these extreme conditions, hedging and other risk management strategies may not be as effective at mitigating trading losses as they would be under more normal market conditions. Moreover, under these conditions, market participants are particularly exposed to trading strategies employed by many market participants simultaneously and on a large scale. Our risk management and monitoring processes seek to quantify and mitigate risk to more extreme market moves. However, severe market events have historically been difficult to predict, and we could realize significant losses if extreme market events were to occur.
Holding large and concentrated positions may expose us to losses.
Concentration of risk may reduce revenues or result in losses in our market-making, investing, underwriting, including block trading, and lending businesses in the event of unfavorable market movements, or when market conditions are more favorable for our competitors. We commit substantial amounts of capital to these businesses, which often results in our taking large positions in the securities of, or making large loans to, a particular issuer or issuers in a particular industry, country or region. For further information regarding our country risk exposure, see also “Quantitative and Qualitative Disclosures about Risk—Country and Other Risks.”
Credit Risk
Credit risk refers to the risk of loss arising when a borrower, counterparty or issuer does not meet its financial obligations to us. For more information on how we monitor and manage credit risk, see “Quantitative and Qualitative Disclosures about Risk—Credit Risk.”
We are exposed to the risk that third parties that are indebted to us will not perform their obligations.
We incur significant credit risk exposure through our Institutional Securities business segment. This risk may arise from a variety of business activities, including, but not limited to: extending credit to clients through various lending commitments; entering into swap or other derivative contracts under which counterparties have obligations to make payments to us; providing short- or long-term funding that is secured by physical or financial collateral whose value may at times be insufficient to fully cover the loan repayment amount; posting margin and/or collateral and other commitments to clearing houses, clearing agencies, exchanges, banks, securities firms and other financial counterparties; and investing and trading in securities and loan pools, whereby the value of these assets may fluctuate based on realized or expected defaults on the underlying obligations or loans.
We also incur credit risk in our Wealth Management business segment lending to mainly individual investors, including, but not limited to, margin- and securities-based loans collateralized by securities, residential mortgage loans and HELOCs.
Our valuations related to, and reserves for losses on, credit exposures rely on complex models, estimates, and subjective judgments about the future. While we believe current valuations and reserves adequately address our perceived levels of risk, future economic conditions that differ from or are more severe than forecast, inaccurate models or assumptions, or external factors such as natural disasters or the ongoing COVID-19 pandemic, could lead to inaccurate measurement of or deterioration of credit quality of our
| | | | | | | | |
| 13 | December 2020 Form 10-K |
borrowers and counterparties or the value of collateral and result in unexpected losses. We may also incur higher than anticipated credit losses in periods of market illiquidity or as a result of disputes with counterparties over the valuation of collateral during periods of economic stress. In addition, in the longer term, climate change may also have a negative impact on the financial condition of our clients, which may decrease revenues from those clients and increase the credit risk associated with loans and other credit exposures to those clients.
Certain of our credit exposures are concentrated by product, industry or country. Although our models and estimates account for correlations among related types of exposures, a change in the market environment for a concentrated product or an external factor impacting a concentrated industry or country may result in credit losses in excess of amounts forecast. Concentrations of credit risk are managed through the Firm’s comprehensive and global Credit Limits Framework.
In addition, as a clearing member of several central counterparties, we are responsible for the defaults or misconduct of our customers and could incur financial losses in the event of default by other clearing members. Although we regularly review our credit exposures, default risk may arise from events or circumstances that are difficult to detect or foresee.
A default by a large financial institution could adversely affect financial markets.
The commercial soundness of many financial institutions may be closely interrelated as a result of credit, trading, clearing or other relationships among the institutions. Increased centralization of trading activities through particular clearing houses, central agents or exchanges as required by provisions of the Dodd-Frank Act may increase our concentration of risk with respect to these entities. As a result, concerns about, or a default or threatened default by, one institution could lead to significant market-wide liquidity and credit problems, losses or defaults by other institutions. This is sometimes referred to as systemic risk and may adversely affect financial intermediaries, such as clearing houses, clearing agencies, exchanges, banks and securities firms, with which we interact on a daily basis and, therefore, could adversely affect us. See also “Systemic Risk Regime” under “Business—Supervision and Regulation—Financial Holding Company.”
Operational Risk
Operational risk refers to the risk of loss, or of damage to our reputation, resulting from inadequate or failed processes or systems, from human factors or from external events (e.g., fraud, theft, legal and compliance risks, cyber attacks, damage to physical assets or the ongoing COVID-19 pandemic). We may incur operational risk across the full scope of our business activities, including revenue-generating activities (e.g., sales and trading) and support and control groups (e.g.,
information technology and trade processing). Legal, regulatory and compliance risk is included in the scope of operational risk and is discussed below under “Legal, Regulatory and Compliance Risk.” For more information on how we monitor and manage operational risk, see “Quantitative and Qualitative Disclosures about Risk—Operational Risk.”
We are subject to operational risks, including a failure, breach or other disruption of our operations or security systems or those of our third parties (or third parties thereof), as well as human error or malfeasance, which could adversely affect our businesses or reputation.
Our businesses are highly dependent on our ability to process and report, on a daily basis, a large number of transactions across numerous and diverse markets in many currencies. We may introduce new products or services or change processes or reporting, including in connection with new regulatory requirements, resulting in new operational risk that we may not fully appreciate or identify.
The trend toward direct access to automated, electronic markets and the move to more automated trading platforms has resulted in the use of increasingly complex technology that relies on the continued effectiveness of the programming code and integrity of the data to process the trades. We rely on the ability of our employees, consultants, our internal systems and systems at technology centers maintained by unaffiliated third parties to operate our different businesses and process a high volume of transactions. Unusually high trading volumes or site usage could cause our systems to operate at an unacceptably slow speed or even fail. Disruptions to, destruction of, instability of or other failure to effectively maintain our information technology systems or external technology that allows our clients and customers to use our products and services (including our self-directed brokerage platform) could harm our business and our reputation. Additionally, we are subject to complex and evolving laws and regulations governing cybersecurity, privacy and data protection, which may differ and potentially conflict, in various jurisdictions.
As a major participant in the global capital markets, we face the risk of incorrect valuation or risk management of our trading positions due to flaws in data, models, electronic trading systems or processes or due to fraud or cyber attack.
We also face the risk of operational failure or disruption of any of the clearing agents, exchanges, clearing houses or other financial intermediaries we use to facilitate our lending, securities and derivatives transactions. In addition, in the event of a breakdown or improper operation or disposal of our or a direct or indirect third party’s systems (or third parties thereof), processes or information assets, or improper or unauthorized action by third parties, including consultants and subcontractors or our employees, we could suffer financial loss, an impairment to our liquidity position, a disruption of
| | | | | | | | |
| December 2020 Form 10-K | 14 | |
our businesses, regulatory sanctions or damage to our reputation.
In addition, the interconnectivity of multiple financial institutions with central agents, exchanges and clearing houses, and the increased importance of these entities, increases the risk that an operational failure at one institution or entity may cause an industry-wide operational failure that could materially impact our ability to conduct business. Furthermore, the concentration of company and personal information held by a handful of third parties increases the risk that a breach at a key third party may cause an industry-wide data breach that could significantly increase the cost and risk of conducting business.
There can be no assurance that our business contingency and security response plans fully mitigate all potential risks to us. Our ability to conduct business may be adversely affected by a disruption in the infrastructure that supports our businesses and the communities where we are located, which are concentrated in the New York and Atlanta metropolitan areas, London, Hong Kong and Tokyo, as well as Baltimore, Glasgow, Frankfurt, Bangalore, Budapest and Mumbai. This may include a disruption involving physical site access; software flaws and vulnerabilities; cybersecurity incidents; terrorist activities; political unrest; other disease pandemics; catastrophic events; climate-related incidents and natural disasters (such as earthquakes, tornadoes, hurricanes and wildfires); electrical outage; environmental hazard; computer servers; communications or other services we use; our employees or third parties with whom we conduct business.
Although we employ backup systems for our data, those backup systems may be unavailable following a disruption, the affected data may not have been backed up or may not be recoverable from the backup, or the backup data may be costly to recover, which could adversely affect our business.
Notwithstanding evolving technology and technology-based risk and control systems, our businesses ultimately rely on people, including our employees and those of third parties with which we conduct business. As a result of human error or engagement in violations of applicable policies, laws, rules or procedures, certain errors or violations are not always discovered immediately by our technological processes or by our controls and other procedures, which are intended to prevent and detect such errors or violations. These can include calculation errors, mistakes in addressing emails or other communications, errors in software or model development or implementation, or errors in judgment, as well as intentional efforts to disregard or circumvent applicable policies, laws, rules or procedures. Human errors and malfeasance, even if promptly discovered and remediated, can result in material losses and liabilities for us.
We conduct business in various jurisdictions outside the U.S., including jurisdictions that may not have comparable levels of protection for their corporate assets such as intellectual property, trademarks, trade secrets, know-how and customer
information and records. The protection afforded in those jurisdictions may be less established and/or predictable than in the U.S. or other jurisdictions in which we operate. As a result, there may also be heightened risks associated with the potential theft of their data, technology and intellectual property in those jurisdictions by domestic or foreign actors, including private parties and those affiliated with or controlled by state actors. Any theft of data, technology or intellectual property may negatively impact our operations and reputation, including disrupting the business activities of our subsidiaries, affiliates, joint ventures or clients conducting business in those jurisdictions.
A cyber attack, information or security breach or a technology failure could adversely affect our ability to conduct our business, manage our exposure to risk or result in disclosure or misuse of confidential or proprietary information and otherwise adversely impact our results of operations, liquidity and financial condition, as well as cause reputational harm.
We maintain a significant amount of personal information on our customers, clients, employees and certain counterparties that we are required to protect under various state, federal and international data protection and privacy laws. These laws may be in conflict with one another, or courts and regulators may interpret them in ways that we had not anticipated or that adversely affect our business.
Cybersecurity risks for financial institutions have significantly increased in recent years in part because of the proliferation of new technologies, the use of the internet, mobile telecommunications and cloud technologies to conduct financial transactions, and the increased sophistication and activities of organized crime, hackers, terrorists and other external extremist parties, including foreign state actors, in some circumstances as a means to promote political ends. In addition to the growing sophistication of certain parties, the commoditization of cyber tools which are able to be weaponized by less sophisticated actors has led to an increase in the exploitation of technological vulnerabilities. Global events and geopolitical instability may lead to increased nation state targeting of financial institutions in the U.S. and abroad. Foreign state actors have become more sophisticated over time, increasing the risk of such an attack. Any of these parties may also attempt to fraudulently induce employees, customers, clients, vendors or other third parties or users of our systems to disclose sensitive information in order to gain access to our data or that of our employees or clients.
Cybersecurity risks may also derive from human error, fraud or malice on the part of our employees or third parties, including third party providers, or may result from accidental technological failure. These risks may be heightened by several factors including, for example, the COVID-19 pandemic, which has caused the majority of our employees to work remotely and access our secure networks through their home networks, or as a result of the integration of acquisitions and other strategic initiatives that may subject us to new
| | | | | | | | |
| 15 | December 2020 Form 10-K |
technology, customers or third party providers. In addition, third parties with whom we do business, the regulators with whom we share information, and each of their service providers, as well as the third parties with whom our customers and clients share information used for authentication, may also be sources of cybersecurity risks, particularly where activities of customers are beyond our security and control systems. There is no guarantee that the measures we take will provide absolute security or recoverability given the techniques used in cyber attacks are complex and frequently change, and may not be able to be anticipated.
Like other financial services firms, the Firm, its third party providers, and its clients continue to be the subject of unauthorized access attacks, mishandling or misuse of information, computer viruses or malware, cyber attacks designed to obtain confidential information, destroy data, disrupt or degrade service, sabotage systems or cause other damage, denial of service attacks, data breaches, social engineering attacks and other events. There can be no assurance that such unauthorized access, mishandling or misuse of information, or cyber incidents will not occur in the future, and they could occur more frequently and on a more significant scale.
A cyber attack, information or security breach or a technology failure of ours or of a third party could jeopardize our or our clients’, employees’, partners’, vendors’ or counterparties’ personal, confidential, proprietary or other information processed and stored in, and transmitted through, our and our third parties’ computer systems. Furthermore, such events could cause interruptions or malfunctions in our, our clients’, employees’, partners’, vendors’, counterparties’ or third parties’ operations, as well as the unauthorized release, gathering, monitoring, misuse, loss or destruction of confidential, proprietary and other information of ours, our employees, our customers or of other third parties. Any of these events could result in reputational damage with our clients and the market, client dissatisfaction, additional costs to us to maintain and update our operational and security systems and infrastructure, regulatory investigations, litigation or enforcement, or regulatory fines or penalties, any of which could adversely affect our business, financial condition or results of operations.
Given our global footprint and the high volume of transactions we process, the large number of clients, partners, vendors and counterparties with which we do business, and the increasing sophistication of cyber attacks, a cyber attack, information or security breach could occur and persist for an extended period of time without detection. We expect that any investigation of a cyber attack would be inherently unpredictable and that it would take time before the completion of any investigation and before there is availability of full and reliable information. During such time we would not necessarily know the extent of the harm or how best to remediate it, and certain errors or actions could be repeated or compounded before they are discovered and
remediated, all or any of which would further increase the costs and consequences of a cyber attack.
While many of our agreements with partners and third party vendors include indemnification provisions, we may not be able to recover sufficiently, or at all, under such provisions to adequately offset any losses we may incur. In addition, although we maintain insurance coverage that may, subject to policy terms and conditions, cover certain aspects of cyber and information security risks, such insurance coverage may be insufficient to cover all losses.
We continue to make investments with a view toward maintaining and enhancing our cybersecurity posture. The cost of managing cyber and information security risks and attacks along with complying with new, increasingly expansive, and evolving regulatory requirements could adversely affect our results of operations and business.
Liquidity Risk
Liquidity risk refers to the risk that we will be unable to finance our operations due to a loss of access to the capital markets or difficulty in liquidating our assets. Liquidity risk also encompasses our ability (or perceived ability) to meet our financial obligations without experiencing significant business disruption or reputational damage that may threaten our viability as a going concern as well as the associated funding risks triggered by the market or idiosyncratic stress events that may negatively affect our liquidity and may impact our ability to raise new funding. For more information on how we monitor and manage liquidity risk, see “Management’s Discussion and Analysis of Financial Condition and Results of Operations—Liquidity and Capital Resources” and “Quantitative and Qualitative Disclosures about Risk—Liquidity Risk.”
Liquidity is essential to our businesses and we rely on external sources to finance a significant portion of our operations.
Liquidity is essential to our businesses. Our liquidity could be negatively affected by our inability to raise funding in the long-term or short-term debt capital markets, our inability to access the secured lending markets, or unanticipated outflows of cash or collateral by customers or clients. Factors that we cannot control, such as disruption of the financial markets or negative views about the financial services industry generally, including concerns regarding fiscal matters in the U.S. and other geographic areas, could impair our ability to raise funding.
In addition, our ability to raise funding could be impaired if investors or lenders develop a negative perception of our long-term or short-term financial prospects due to factors such as an incurrence of large trading losses, a downgrade by the rating agencies, a decline in the level of our business activity, if regulatory authorities take significant action against us or
| | | | | | | | |
| December 2020 Form 10-K | 16 | |
our industry, or we discover significant employee misconduct or illegal activity.
If we are unable to raise funding using the methods described above, we would likely need to finance or liquidate unencumbered assets, such as our investment portfolios or trading assets, to meet maturing liabilities or other obligations. We may be unable to sell some of our assets or we may have to sell assets at a discount to market value, either of which could adversely affect our results of operations, cash flows and financial condition.
Our borrowing costs and access to the debt capital markets depend on our credit ratings.
The cost and availability of unsecured financing generally are impacted by our long-term and short-term credit ratings. The rating agencies continue to monitor certain company-specific and industry-wide factors that are important to the determination of our credit ratings. These include governance, the level and quality of earnings, capital adequacy, liquidity and funding, risk appetite and management, asset quality, strategic direction, business mix, regulatory or legislative changes, macro-economic environment, and perceived levels of support, and it is possible that they could downgrade our ratings and those of similar institutions.
Our credit ratings also can have an adverse impact on certain trading revenues, particularly in those businesses where longer term counterparty performance is a key consideration, such as OTC and other derivative transactions, including credit derivatives and interest rate swaps. In connection with certain OTC trading agreements and certain other agreements associated with our Institutional Securities business segment, we may be required to provide additional collateral to, or immediately settle any outstanding liability balance with, certain counterparties in the event of a credit ratings downgrade.
Termination of our trading and other agreements could cause us to sustain losses and impair our liquidity by requiring us to find other sources of financing or to make significant cash payments or securities movements. The additional collateral or termination payments which may occur in the event of a future credit rating downgrade vary by contract and can be based on ratings by either or both of Moody’s Investors Service, Inc. and S&P Global Ratings. See also “Management’s Discussion and Analysis of Financial Condition and Results of Operations—Liquidity and Capital Resources—Credit Ratings—Incremental Collateral or Terminating Payments.”
We are a holding company and depend on payments from our subsidiaries.
The Parent Company has no operations and depends on dividends, distributions and other payments from its subsidiaries to fund dividend payments and to fund all payments on its obligations, including debt obligations.
Regulatory restrictions, tax restrictions or elections and other legal restrictions may limit our ability to transfer funds freely, either to or from our subsidiaries. In particular, many of our subsidiaries, including our bank and broker-dealer subsidiaries, are subject to laws, regulations and self-regulatory organization rules that limit, as well as authorize regulatory bodies to block or reduce, the flow of funds to the Parent Company, or that prohibit such transfers or dividends altogether in certain circumstances, including steps to “ring fence” entities by regulators outside of the U.S. to protect clients and creditors of such entities in the event of financial difficulties involving such entities.
These laws, regulations and rules may hinder our ability to access funds that we may need to make payments on our obligations. Furthermore, as a BHC, we may become subject to a prohibition or to limitations on our ability to pay dividends. The Federal Reserve, the OCC, and the FDIC have the authority, and under certain circumstances the duty, to prohibit or to limit the payment of dividends by the banking organizations they supervise, including us and our U.S. Bank Subsidiaries.
Our liquidity and financial condition have in the past been, and in the future could be, adversely affected by U.S. and international markets and economic conditions.
Our ability to raise funding in the long-term or short-term debt capital markets or the equity markets, or to access secured lending markets, has in the past been, and could in the future be, adversely affected by conditions in the U.S. and international markets and economies.
In particular, our cost and availability of funding in the past have been, and may in the future be, adversely affected by illiquid credit markets and wider credit spreads. Significant turbulence in the U.S., the E.U. and other international markets and economies could adversely affect our liquidity and financial condition and the willingness of certain counterparties and customers to do business with us.
Legal, Regulatory and Compliance Risk
Legal, regulatory and compliance risk includes the risk of legal or regulatory sanctions, material financial loss, including fines, penalties, judgments, damages and/or settlements, or loss to reputation we may suffer as a result of our failure to comply with laws, regulations, rules, related self-regulatory organization standards and codes of conduct applicable to our business activities. This risk also includes contractual and commercial risk, such as the risk that a counterparty’s performance obligations will be unenforceable. It also includes compliance with AML, anti-corruption and terrorist financing rules and regulations. For more information on how we monitor and manage legal, regulatory and compliance risk, see “Quantitative and Qualitative Disclosures about Risk—Legal and Compliance Risk.”
| | | | | | | | |
| 17 | December 2020 Form 10-K |
The financial services industry is subject to extensive regulation, and changes in regulation will impact our business.
Like other major financial services firms, we are subject to extensive regulation by U.S. federal and state regulatory agencies and securities exchanges and by regulators and exchanges in each of the major markets where we conduct our business. These laws and regulations significantly affect the way we do business and can restrict the scope of our existing businesses and limit our ability to expand our product offerings and pursue certain investments.
The Firm and its employees are subject to (among other things) wide-ranging regulation and supervision, intensive scrutiny of our businesses and any plans for expansion of those businesses, limitations on new activities, a systemic risk regime that imposes heightened capital and liquidity and funding requirements and other enhanced prudential standards, resolution regimes and resolution planning requirements, requirements for maintaining minimum amounts of TLAC and external long-term debt, restrictions on activities and investments imposed by the Volcker Rule, comprehensive derivatives regulation, commodities regulation, market structure regulation, tax regulations, antitrust laws, trade and transaction reporting obligations, and broadened fiduciary obligations.
In some areas, regulatory standards are subject to further rulemaking or transition periods or may otherwise be revised in whole or in part. Ongoing implementation of, or changes in, including changes in interpretation or enforcement of, laws and regulations could materially impact the profitability of our businesses and the value of assets we hold, expose us to additional costs, require changes to business practices or force us to discontinue businesses, adversely affect our ability to pay dividends and repurchase our stock or require us to raise capital, including in ways that may adversely impact our shareholders or creditors.
In addition, regulatory requirements that are being imposed by foreign policymakers and regulators may be inconsistent or conflict with regulations that we are subject to in the U.S. and may adversely affect us. Legal and regulatory requirements continue to be subject to ongoing change, which may result in significant new costs to comply with new or revised requirements as well as to monitor for compliance on an ongoing basis.
The application of regulatory requirements and strategies in the U.S. or other jurisdictions to facilitate the orderly resolution of large financial institutions may pose a greater risk of loss for our security holders, and subject us to other restrictions.
Pursuant to the Dodd-Frank Act, we are required to periodically submit to the Federal Reserve and the FDIC a resolution plan that describes our strategy for a rapid and orderly resolution under the U.S. Bankruptcy Code in the
event of material financial distress or failure. If the Federal Reserve and the FDIC were to jointly determine that our resolution plan submission was not credible or would not facilitate an orderly resolution, and if we were unable to address any deficiencies identified by the regulators, we or any of our subsidiaries may be subject to more stringent capital, leverage, or liquidity requirements or restrictions on our growth, activities, or operations, or after a two-year period, we may be required to divest assets or operations.
In addition, provided that certain procedures are met, we can be subject to a resolution proceeding under the orderly liquidation authority under Title II of the Dodd-Frank Act with the FDIC being appointed as receiver. The FDIC’s power under the orderly liquidation authority to disregard the priority of creditor claims and treat similarly situated creditors differently in certain circumstances, subject to certain limitations, could adversely impact holders of our unsecured debt. See “Business—Supervision and Regulation” and “Management’s Discussion and Analysis of Financial Condition and Results of Operations—Liquidity and Capital Resources— Regulatory Requirements.”
Further, because both our resolution plan contemplates an SPOE strategy under the U.S. Bankruptcy Code and the FDIC has proposed an SPOE strategy through which it may apply its orderly liquidation authority powers, we believe that the application of an SPOE strategy is the reasonably likely outcome if either our resolution plan were implemented or a resolution proceeding were commenced under the orderly liquidation authority. An SPOE strategy generally contemplates the provision of adequate capital and liquidity by the Parent Company to certain of its subsidiaries so that such subsidiaries have the resources necessary to implement the resolution strategy, and the Parent Company has entered into a secured amended and restated support agreement with its material entities, as defined in our resolution plan, pursuant to which it would provide such capital and liquidity to such entities.
In further development of our SPOE strategy, we have created a wholly owned, direct subsidiary of the Parent Company, Morgan Stanley Holdings LLC (“Funding IHC”), to serve as a resolution funding vehicle. The Parent Company has transferred, and has agreed to transfer on an ongoing basis, certain assets to the Funding IHC. In the event of a resolution scenario, the Parent Company would be obligated to contribute all of its material assets that can be contributed under the terms of the amended and restated support agreement (other than shares in subsidiaries of the Parent Company and certain other assets) (“Contributable Assets”), to the Funding IHC. The Funding IHC would be obligated to provide capital and liquidity, as applicable, to our material entities.
The obligations of the Parent Company and the Funding IHC under the amended and restated support agreement are in most cases secured on a senior basis by the assets of the Parent Company (other than shares in subsidiaries of the
| | | | | | | | |
| December 2020 Form 10-K | 18 | |
Parent Company and certain other assets), and the assets of the Funding IHC. As a result, claims of our material entities, including the Funding IHC, against the assets of the Parent Company with respect to such secured assets are effectively senior to unsecured obligations of the Parent Company.
Although an SPOE strategy, whether applied pursuant to our resolution plan or in a resolution proceeding under the orderly liquidation authority, is intended to result in better outcomes for creditors overall, there is no guarantee that the application of an SPOE strategy, including the provision of support to the Parent Company’s material entities pursuant to the secured amended and restated support agreement, will not result in greater losses for holders of our securities compared to a different resolution strategy for us.
Regulators have taken and proposed various actions to facilitate an SPOE strategy under the U.S. Bankruptcy Code, the orderly liquidation authority and other resolution regimes. For example, the Federal Reserve requires top-tier BHCs of U.S. G-SIBs, including the Firm, to maintain minimum amounts of equity and eligible long-term debt TLAC in order to ensure that such institutions have enough loss-absorbing resources at the point of failure to be recapitalized through the conversion of debt to equity or otherwise by imposing losses on eligible TLAC where the SPOE strategy is used. The combined implication of the SPOE resolution strategy and the TLAC requirement is that our losses will be imposed on the holders of eligible long-term debt and other forms of eligible TLAC issued by the Parent Company before any losses are imposed on the creditors of our material entities or before putting U.S. taxpayers at risk.
In addition, certain jurisdictions, including the U.K. and other E.U. jurisdictions, have implemented, or are in the process of implementing, changes to resolution regimes to provide resolution authorities with the ability to recapitalize a failing entity organized in such jurisdiction by writing down certain unsecured liabilities or converting certain unsecured liabilities into equity. Such “bail-in” powers are intended to enable the recapitalization of a failing institution by allocating losses to its shareholders and unsecured creditors. Non-U.S. regulators are also considering requirements that certain subsidiaries of large financial institutions maintain minimum amounts of TLAC that would pass losses up from the subsidiaries to the Parent Company and, ultimately, to security holders of the Parent Company in the event of failure.
We may be prevented from paying dividends or taking other capital actions because of regulatory constraints or revised regulatory capital standards.
We are subject to comprehensive consolidated supervision, regulation and examination by the Federal Reserve, including with respect to regulatory capital standards, stress testing and capital planning. We submit, on at least an annual basis, a capital plan to the Federal Reserve describing proposed dividend payments to shareholders, proposed repurchases of our outstanding securities and other proposed capital actions
that we intend to take. Our ability to take capital actions described in the capital plan is dependent on, among other factors, the results of supervisory stress tests conducted by the Federal Reserve and our compliance with regulatory capital standards imposed by the Federal Reserve.
In addition, the Federal Reserve may change regulatory capital standards to impose higher requirements that restrict our ability to take capital actions or may modify or impose other regulatory standards or restrictions that increase our operating expenses or constrain our ability to take capital actions. For example, on June 25, 2020, the Federal Reserve announced that it would bar share repurchases and limit common stock dividend payments in the third quarter of 2020 for all large BHCs, and on September 30, 2020, the restrictions were extended through the fourth quarter of 2020. On December 18, 2020, the Federal Reserve announced that it was extending capital action supervisory restrictions applicable to all large BHCs into the first quarter of 2021 with modifications to permit resumptions of share repurchases. The Federal Reserve may extend or further modify these restrictions in future periods or impose new restrictions. For additional information, see “Management’s Discussion and Analysis of Financial Condition and Results of Operations— Liquidity and Capital Resources” herein.
The financial services industry faces substantial litigation and is subject to extensive regulatory and law enforcement investigations, and we may face damage to our reputation and legal liability.
As a global financial services firm, we face the risk of investigations and proceedings by governmental and self-regulatory organizations in all countries in which we conduct our business. Investigations and proceedings initiated by these authorities may result in adverse judgments, settlements, fines, penalties, injunctions or other relief. In addition to the monetary consequences, these measures could, for example, impact our ability to engage in, or impose limitations on, certain of our businesses.
These investigations and proceedings, as well as the amount of penalties and fines sought, continue to impact the financial services industry and certain U.S. and international governmental entities have brought criminal actions against, or have sought criminal convictions, pleas or deferred prosecution agreements from, financial institutions. Significant regulatory or law enforcement action against us could materially adversely affect our business, financial condition or results of operations or cause us significant reputational harm, which could seriously harm our business.
The Dodd-Frank Act also provides compensation to whistleblowers who present the SEC or CFTC with information related to securities or commodities law violations that leads to a successful enforcement action. As a result of this compensation, it is possible we could face an increased number of investigations by the SEC or CFTC.
| | | | | | | | |
| 19 | December 2020 Form 10-K |
We have been named, from time to time, as a defendant in various legal actions, including arbitrations, class actions and other litigation, as well as investigations or proceedings brought by regulatory agencies, arising in connection with our activities as a global diversified financial services institution. Certain of the actual or threatened legal or regulatory actions include claims for substantial compensatory and/or punitive damages, claims for indeterminate amounts of damages, or may result in penalties, fines, or other results adverse to us.
In some cases, the issuers that would otherwise be the primary defendants in such cases are bankrupt or are in financial distress. In other cases, including antitrust litigation, we may be subject to claims for joint and several liability with other defendants for treble damages or other relief related to alleged conspiracies involving other institutions. Like any large corporation, we are also subject to risk from potential employee misconduct, including non-compliance with policies and improper use or disclosure of confidential information, or improper sales practices or conduct.
We may be responsible for representations and warranties associated with residential and commercial real estate loans and may incur losses in excess of our reserves.
We originate loans secured by commercial and residential properties. Further, we securitize and trade in a wide range of commercial and residential real estate and real estate-related whole loans, mortgages and other real estate and commercial assets and products, including residential and CMBS. In connection with these activities, we have provided, or otherwise agreed to be responsible for, certain representations and warranties. Under certain circumstances, we may be required to repurchase such assets or make other payments related to such assets if such representations and warranties were breached. We have also made representations and warranties in connection with our role as an originator of certain commercial mortgage loans that we securitized in CMBS. For additional information, see also Note 15 to the financial statements.
We currently have several legal proceedings related to claims for alleged breaches of representations and warranties. If there are decisions adverse to us in those legal proceedings, we may incur losses substantially in excess of our reserves. In addition, our reserves are based, in part, on certain factual and legal assumptions. If those assumptions are incorrect and need to be revised, we may need to adjust our reserves substantially.
A failure to address conflicts of interest appropriately could adversely affect our businesses and reputation.
As a global financial services firm that provides products and services to a large and diversified group of clients, including corporations, governments, financial institutions and individuals, we face potential conflicts of interest in the normal course of business. For example, potential conflicts can occur when there is a divergence of interests between us
and a client, among clients, between an employee on the one hand and us or a client on the other, or situations in which we may be a creditor of a client. Moreover, we also utilize multiple brands and business channels, including those resulting from our acquisitions, and continue to enhance the collaboration across business segments, which may heighten the potential conflicts of interests or the risk of improper sharing of information.
We have policies, procedures and controls that are designed to identify and address potential conflicts of interest, and we utilize various measures, such as the use of disclosure, to manage these potential conflicts. However, identifying and mitigating potential conflicts of interest can be complex and challenging and can become the focus of media and regulatory scrutiny. Indeed, actions that merely appear to create a conflict can put our reputation at risk even if the likelihood of an actual conflict has been mitigated. It is possible that potential conflicts could give rise to litigation or enforcement actions, which may lead to our clients being less willing to enter into transactions in which a conflict may occur and could adversely affect our businesses and reputation.
Our regulators have the ability to scrutinize our activities for potential conflicts of interest, including through detailed examinations of specific transactions. For example, our status as a BHC supervised by the Federal Reserve subjects us to direct Federal Reserve scrutiny with respect to transactions between our U.S. Bank Subsidiaries and their affiliates. Further, the Volcker Rule subjects us to regulatory scrutiny regarding certain transactions between us and our clients.
Risk Management
Our risk management strategies, models and processes may not be fully effective in mitigating our risk exposures in all market environments or against all types of risk, which could result in unexpected losses.
We have devoted significant resources to develop our risk management capabilities and expect to continue to do so in the future. Nonetheless, our risk management strategies, models and processes, including our use of various risk models for assessing market exposures and hedging strategies, stress testing and other analysis, may not be fully effective in mitigating our risk exposure in all market environments or against all types of risk, including risks that are unidentified or unanticipated.
As our businesses change and grow, and the markets in which we operate evolve, our risk management strategies, models and processes may not always adapt with those changes. Some of our methods of managing risk are based upon our use of observed historical market behavior and management’s judgment. As a result, these methods may not predict future risk exposures, which could be significantly greater than the historical measures indicate.
| | | | | | | | |
| December 2020 Form 10-K | 20 | |
In addition, many models we use are based on assumptions or inputs regarding correlations among prices of various asset classes or other market indicators and therefore cannot anticipate sudden, unanticipated or unidentified market or economic movements, such as the impact of the COVID-19 pandemic, which could cause us to incur losses.
Management of market, credit, liquidity, operational, model, legal, regulatory and compliance risks requires, among other things, policies and procedures to record properly and verify a large number of transactions and events, and these policies and procedures may not be fully effective. Our trading risk management strategies and techniques also seek to balance our ability to profit from trading positions with our exposure to potential losses.
While we employ a broad and diversified set of risk monitoring and risk mitigation techniques, those techniques and the judgments that accompany their application cannot anticipate every economic and financial outcome or the timing of such outcomes. For example, to the extent that our trading or investing activities involve less liquid trading markets or are otherwise subject to restrictions on sales or hedging, we may not be able to reduce our positions and therefore reduce our risk associated with such positions. We may, therefore, incur losses in the course of our trading or investing activities. For more information on how we monitor and manage market and certain other risks and related strategies, models and processes, see “Quantitative and Qualitative Disclosures about Risk—Market Risk.”
Planned replacement of London Interbank Offered Rate and replacement or reform of other interest rate benchmarks could adversely affect our business, financial condition and results of operations.
Central banks around the world, including the Federal Reserve, have commissioned working groups of market participants and official sector representatives to replace LIBOR and replace or reform other interest rate benchmarks (collectively, the “IBORs”). A transition away from the widespread use of such rates to alternative rates and other potential interest rate benchmark reforms has begun and will continue over the course of the next few years. There remains a likelihood that most IBORs will not be available beyond 2021, and regulators globally have continued to emphasize the need for the industry to plan accordingly.
The Federal Reserve Bank of New York now publishes the Secured Overnight Financing Rate based on overnight U.S. Treasury repurchase agreement transactions, which has been recommended as the alternative to U.S. dollar LIBOR by the Alternative Reference Rates Committee convened by the Federal Reserve and the Federal Reserve Bank of New York. Further, the Bank of England publishes a reformed Sterling Overnight Index Average, comprised of a broader set of overnight Sterling money market transactions, which has been selected by the Working Group on Sterling Risk-Free Reference Rates as the alternative rate to Sterling LIBOR.
Central bank-sponsored committees in other jurisdictions, including Europe, Japan and Switzerland, have selected alternative reference rates denominated in other currencies.
The market transition away from IBORs to alternative reference rates is complex and could have a range of adverse impacts on our business, financial condition and results of operations. In particular, such transition or reform could:
•Adversely impact the pricing, liquidity, value of, return on and trading for a broad array of financial products, including any IBOR-linked securities, loans and derivatives that are included in our financial assets and liabilities;
•Require extensive changes to documentation that governs or references IBOR or IBOR-based products, including, for example, pursuant to time-consuming renegotiations of existing documentation to modify the terms of outstanding securities and related hedging transactions;
•Result in a population of products with documentation that governs or references IBOR or IBOR-based products but that cannot be amended due to an inability to obtain sufficient consent from counterparties or product owners;
•Result in inquiries or other actions from regulators in respect of our (or the market’s) preparation and readiness for the replacement of an IBOR with one or more alternative reference rates;
•Result in disputes, litigation or other actions with clients, counterparties and investors, in various scenarios, such as regarding the interpretation and enforceability of provisions in IBOR-based products such as fallback language or other related provisions, including in the case of fallbacks to the alternative reference rates, any economic, legal, operational or other impact resulting from the fundamental differences between the IBORs and the various alternative reference rates;
•Require the transition and/or development of appropriate systems and analytics to effectively transition our risk management processes from IBORs to those based on one or more alternative reference rates in a timely manner, including by quantifying value and risk for various alternative reference rates, which may prove challenging given the limited history of the proposed alternative reference rates; and
•Cause us to incur additional costs in relation to any of the above factors.
Other factors include the pace of the transition to the alternative reference rates, timing mismatches between cash and derivative markets, the specific terms and parameters for and market acceptance of any alternative reference rate, market conventions for the use of any alternative reference rate in connection with a particular product (including the timing and market adoption of any conventions proposed or recommended by any industry or other group), prices of and the liquidity of trading markets for products based on alternative reference rates, and our ability to transition and develop appropriate systems and analytics for one or more alternative reference rates.
| | | | | | | | |
| 21 | December 2020 Form 10-K |
See also "Management's Discussion and Analysis of Financial Condition and Results of Operations—Regulatory Requirements" herein.
Competitive Environment
We face strong competition from financial services firms and others, which could lead to pricing pressures that could materially adversely affect our revenue and profitability.
The financial services industry and all aspects of our businesses are intensely competitive, and we expect them to remain so. We compete with commercial banks, brokerage firms, insurance companies, exchanges, electronic trading and clearing platforms, financial data repositories, sponsors of mutual funds, hedge funds, fund managers, energy companies, financial technology firms and other companies offering financial or ancillary services in the U.S., globally and digitally or through the internet. We compete on the basis of several factors, including transaction execution, capital or access to capital, products and services, innovation, technology, reputation, risk appetite and price.
Over time, certain sectors of the financial services industry have become more concentrated, as institutions involved in a broad range of financial services have left businesses, been acquired by or merged into other firms, or have declared bankruptcy. Such changes could result in our remaining competitors gaining greater capital and other resources, such as the ability to offer a broader range of products and services and geographic diversity, or new competitors may emerge.
We have experienced and may continue to experience pricing pressures as a result of these factors and as some of our competitors seek to obtain market share by reducing prices, eliminating commissions or other fees, or providing more favorable terms of business. In addition, certain of our competitors may be subject to different, and, in some cases, less stringent, legal and regulatory regimes, than we are, thereby putting us at a competitive disadvantage. Some new competitors in the financial technology sector have sought to target existing segments of our businesses that could be susceptible to disruption by innovative or less regulated business models. For more information regarding the competitive environment in which we operate, see “Business—Competition” and “Business—Supervision and Regulation.”
Automated trading markets and the introduction and application of new technologies may adversely affect our business and may increase competition.
We have experienced intense price competition in some of our businesses in recent years. In particular, the ability to execute securities, derivatives and other financial instrument trades electronically on exchanges, swap execution facilities, other automated trading platforms and the introduction and application of new technologies has increased the pressure on bid-offer spreads, commissions, markups or comparable fees.
The trend toward direct access to automated, electronic markets will likely continue and will likely increase as additional markets move to more automated trading platforms. We have experienced and it is likely that we will continue to experience competitive pressures in these and other areas in the future as some of our competitors may seek to obtain market share by reducing or eliminating bid-offer spreads, commissions, markups or fees.
Our ability to retain and attract qualified employees is critical to the success of our business and the failure to do so may materially adversely affect our performance.
Our people are our most important asset and competition for qualified employees is intense. If we are unable to continue to attract and retain highly qualified employees, or do so at levels or in forms necessary to maintain our competitive position, or if compensation costs required to attract and retain employees become more expensive, our performance, including our competitive position and results of operations, could be materially adversely affected.
The financial industry has experienced and may continue to experience more stringent regulation of employee compensation, including limitations relating to incentive-based compensation, clawback requirements and special taxation, which could have an adverse effect on our ability to hire or retain the most qualified employees.
International Risk
We are subject to numerous political, economic, legal, tax, operational, franchise and other risks as a result of our international operations which could adversely impact our businesses in many ways.
We are subject to numerous political, economic, legal, tax, operational, franchise and other risks that are inherent in operating in many countries, including risks of possible nationalization, expropriation, price controls, capital controls, exchange controls, increased taxes and levies, and other restrictive governmental actions, as well as the outbreak of hostilities or political and governmental instability. In many countries, the laws and regulations applicable to the securities and financial services industries are uncertain and evolving, and it may be difficult for us to determine the exact requirements of local laws in every market.
Our inability to remain in compliance with local laws in a particular market could have a significant and negative effect not only on our business in that market but also on our reputation generally. We are also subject to the risk that transactions we structure might not be legally enforceable in all cases.
Various emerging market countries have experienced severe political, economic or financial disruptions, including significant devaluations of their currencies, defaults or potential defaults on sovereign debt, capital and currency exchange controls, high rates of inflation and low or negative
| | | | | | | | |
| December 2020 Form 10-K | 22 | |
growth rates in their economies. Crime and corruption, as well as issues of security and personal safety, also exist in certain of these countries. These conditions could adversely impact our businesses and increase volatility in financial markets generally.
A disease pandemic, such as COVID-19, or other widespread health emergencies, natural disasters, climate-related incidents, terrorist activities or military actions, or social or political tensions, could create economic and financial disruptions in emerging markets or in other areas of the global economy that could adversely affect our businesses, or could lead to operational difficulties (including travel limitations) that could impair our ability to manage or conduct our businesses around the world.
As a U.S. company, we are required to comply with the economic sanctions and embargo programs administered by OFAC and similar multi-national bodies and governmental agencies worldwide, as well as applicable anti-corruption laws in the jurisdictions in which we operate, such as the U.S. Foreign Corrupt Practices Act and the U.K. Bribery Act. A violation of a sanction, embargo program, or anti-corruption law could subject us, and individual employees, to a regulatory enforcement action as well as significant civil and criminal penalties.
The U.K.’s withdrawal from the E.U. and the resulting uncertainty regarding the future regulatory landscape could adversely affect us.
It is difficult to predict the future of the U.K.’s relationship with the E.U., the uncertainty of which may increase the volatility in the global financial markets in the short- and medium-term and may negatively disrupt regional and global financial markets. Additionally, depending on the outcome, such uncertainty may adversely affect the manner in which we operate certain of our businesses in Europe.
On January 31, 2020, the U.K. withdrew from the E.U. under the terms of a withdrawal agreement between the U.K. and the E.U. The withdrawal agreement provided for a transition period to the end of December 2020, during which time the U.K. would continue to apply E.U. law as if it were a member state, and U.K. firms' passporting rights to provide financial services in E.U. jurisdictions continued.
On December 24, 2020 the U.K. and the E.U. announced they had reached agreement on the terms of a trade and co-operation agreement to govern the future relationship between the parties. The agreement consists of three main pillars including trade, citizens’ security and governance, covering a variety of arrangements in several areas. The agreement is provisionally applicable with effect from January 1, 2021 pending formal ratification by the E.U.
With respect to financial services, although the U.K. chose to grant the E.U. equivalence in a number of key areas under European financial regulations, the E.U. only made certain
more limited equivalence decisions, leaving decisions on equivalence and adequacy to be determined by each of the U.K. and E.U. unilaterally in due course. As a result, U.K. licensed entities are unable to provide regulated services in a number of E.U. jurisdictions from the end of December 2020, absent regulatory relief or other measures implemented by individual countries.
While we have restructured our European operations to ensure that we can continue to provide cross-border banking and investment and other services in E.U. member states, there continues to be uncertainty regarding the future regulatory landscape which could impact our European operations beyond those implemented or planned, as a result of which our results of operations and business prospects could be negatively affected. See also “Management’s Discussion and Analysis of Financial Condition and Results of Operations—Liquidity and Capital Resources—Regulatory Requirements—Regulatory Developments.”
Acquisition, Divestiture and Joint Venture Risk
We may be unable to fully capture the expected value from acquisitions, divestitures, joint ventures, minority stakes or strategic alliances, and certain acquisitions may subject our business to new or increased risk.
In connection with past or future acquisitions, divestitures, joint ventures, minority stakes or strategic alliances (including with MUFG), we face numerous risks and uncertainties in combining, transferring, separating or integrating the relevant businesses and systems, including the need to combine or separate accounting and data processing systems and management controls and to integrate relationships with clients, trading counterparties and business partners. Certain of these strategic initiatives, and integration thereof, may cause us to incur incremental expenses and may also require incremental financial, management and other resources.
For example, our acquisition and integration of E*TRADE involves a number of risks, including failure to realize anticipated cost savings and funding synergies of the acquisition and difficulty integrating the two businesses. It is possible that the integration process could also result in unanticipated disruption to the E*TRADE self-directed brokerage platform, the loss of key Morgan Stanley or legacy E*TRADE employees, the loss of clients, or an overall integration process that takes longer than originally anticipated.
In the case of joint ventures and minority stakes, we are subject to additional risks and uncertainties because we may be dependent upon, and subject to liability, losses or reputational damage relating to systems, controls and personnel that are not under our control.
In addition, conflicts or disagreements between us and any of our joint venture partners may negatively impact the benefits to be achieved by the relevant joint venture.
| | | | | | | | |
| 23 | December 2020 Form 10-K |
There is no assurance that any of our acquisitions, divestitures or investments will be successfully integrated or disaggregated or yield all of the positive benefits and synergies anticipated. If we are not able to integrate or disaggregate successfully our past and future acquisitions or dispositions, there is a risk that our results of operations, financial condition and cash flows may be materially and adversely affected.
Certain of our business initiatives, including expansions of existing businesses, may bring us into contact, directly or indirectly, with individuals and entities that are not within our traditional client and counterparty base and may expose us to new asset classes, services, competitors, and new markets. These business activities expose us to new and enhanced risks, greater regulatory scrutiny of these activities, increased credit-related, sovereign and operational risks, as well as franchise and reputational concerns regarding the manner in which these assets are being operated or held, or services are being delivered.
For more information regarding the regulatory environment in which we operate, see also “Business—Supervision and Regulation.”
| | | | | | | | |
| December 2020 Form 10-K | 24 | |
Management’s Discussion and Analysis of Financial Condition and Results of Operations
Introduction
Morgan Stanley is a global financial services firm that maintains significant market positions in each of its business segments—Institutional Securities, Wealth Management and Investment Management. Morgan Stanley, through its subsidiaries and affiliates, provides a wide variety of products and services to a large and diversified group of clients and customers, including corporations, governments, financial institutions and individuals. Unless the context otherwise requires, the terms “Morgan Stanley,” “Firm,” “us,” “we” or “our” mean Morgan Stanley (the “Parent Company”) together with its consolidated subsidiaries. Disclosures reflect the effects of the acquisition of E*TRADE Financial Corporation (“E*TRADE”) prospectively from the acquisition date, October 2, 2020. See the “Glossary of Common Terms and Acronyms” for the definition of certain terms and acronyms used throughout this Form 10-K. For an analysis of 2019 results compared with 2018 results, see Part II, Item 7, “Management's Discussion and Analysis of Financial Condition and Results of Operations” in the annual report on Form 10-K for the year-ended December 31, 2019 filed with the SEC.
A description of the clients and principal products and services of each of our business segments is as follows:
Institutional Securities provides investment banking, sales and trading, lending and other services to corporations, governments, financial institutions and high to ultra-high net worth clients. Investment banking services consist of capital raising and financial advisory services, including services relating to the underwriting of debt, equity and other securities, as well as advice on mergers and acquisitions, restructurings, real estate and project finance. Sales and trading services include sales, financing, prime brokerage and market-making activities in the equity and fixed income businesses. Lending activities include originating corporate loans and commercial real estate loans, providing secured lending facilities, and extending financing to sales and trading customers. Other activities include Asia wealth management services, investments and research.
Wealth Management provides a comprehensive array of financial services and solutions to individual investors and small to medium-sized businesses and institutions covering: financial advisor-led brokerage and investment advisory services; self-directed brokerage services, including through the E*TRADE platform; financial and wealth planning services; workplace services including stock plan administration; annuity and insurance products; securities-based lending, residential real estate loans and other lending products; banking; and retirement plan services.
Investment Management provides a broad range of investment strategies and products that span geographies, asset classes, and public and private markets to a diverse group of clients across institutional and intermediary channels. Strategies and products, which are offered through a variety of investment vehicles, include equity, fixed income, liquidity and alternative/other products. Institutional clients include defined benefit/defined contribution plans, foundations, endowments, government entities, sovereign wealth funds, insurance companies, third-party fund sponsors and corporations. Individual clients are generally served through intermediaries, including affiliated and non-affiliated distributors.
Management’s Discussion and Analysis includes certain metrics that we believe to be useful to us, investors, analysts and other stakeholders by providing further transparency about, or an additional means of assessing, our financial condition and operating results. Such metrics, when used, are defined and may be different from or inconsistent with metrics used by other companies.
The results of operations in the past have been, and in the future may continue to be, materially affected by: competition; risk factors; legislative, legal and regulatory developments; and other factors. These factors also may have an adverse impact on our ability to achieve our strategic objectives. Additionally, the discussion of our results of operations herein may contain forward-looking statements. These statements, which reflect management’s beliefs and expectations, are subject to risks and uncertainties that may cause actual results to differ materially. For a discussion of the risks and uncertainties that may affect our future results, see “Forward-Looking Statements,” “Business—Competition,” “Business—Supervision and Regulation,” “Risk Factors” and “Liquidity and Capital Resources—Regulatory Requirements” herein.
| | | | | | | | |
| 25 | December 2020 Form 10-K |
| | | | | |
| |
| Management's Discussion and Analysis | |
Executive Summary
Overview of Financial Results
Consolidated Results—Year ended December 31, 2020
•Firm Net revenues were up 16% and Net income applicable to Morgan Stanley was up 22%, reflecting strength across all business segments, and resulting in an ROTCE of 15.2%, or 15.4% excluding the impact of E*TRADE integration-related expenses (see “Selected Non-GAAP Financial Information” herein).
•Institutional Securities Net revenues of $26 billion increased 27% from the prior year and segment Net income applicable to Morgan Stanley increased 52% from the prior year. These increases were the result of higher sales and trading revenues on strong client engagement and market volatility, combined with an increase in underwriting revenues on elevated volumes, supported by a constructive market environment.
•Wealth Management delivered a pre-tax profit margin of 23.0%, or 24.2% excluding integration-related expenses (see “Selected Non-GAAP Financial Information” herein). Results reflect higher Asset management revenues, driven by growth in client assets, higher Transactional revenues, and incremental revenues as a result of the E*TRADE acquisition.
•Investment Management reported long-term net flows of $41 billion in 2020 and AUM of $781 billion as of December 31, 2020, resulting in an increase in Asset management revenues of 15% compared with the prior year.
•The Firm expense efficiency ratio was 70% for the year, both including and excluding the impact of integration-related expenses (See “Selected Non-GAAP Financial Information” herein).
•Our provision for credit losses on loans and lending commitments was $762 million.
•At December 31, 2020, our standardized Common Equity Tier 1 capital ratio was 17.4%.
Strategic Transactions
•On October 2, 2020, we completed the acquisition of E*TRADE. For further information, see “Business Segments—Wealth Management” herein and Note 3 to the financial statements.
•On October 8, 2020, we entered into a definitive agreement under which we will acquire Eaton Vance Corp. (“Eaton Vance”), subject to customary closing conditions. For further information, see “Business Segments—Investment Management” herein.
Net Revenues
($ in millions)
Net Income Applicable to Morgan Stanley
($ in millions)
Earnings per Diluted Common Share
2020 Compared with 2019
•We reported net revenues of $48,198 million in 2020 compared with $41,419 million in 2019. For 2020, net income applicable to Morgan Stanley was $10,996 million, or $6.46 per diluted common share, compared with $9,042 million, or $5.19 per diluted common share, in 2019.
| | | | | | | | |
| December 2020 Form 10-K | 26 | |
| | | | | |
| |
| Management's Discussion and Analysis | |
Non-interest Expenses1
($ in millions)
1.The percentages on the bars in the chart represent the contribution of compensation and benefits expenses and non-compensation expenses to the total.
•Compensation and benefits expenses of $20,854 million in 2020 increased 11% from the prior year, primarily as a result of increases in discretionary incentive compensation and the formulaic payout to Wealth Management representatives driven by higher revenues, higher expenses related to certain deferred compensation plans linked to investment performance, and incremental compensation as a result of the E*TRADE acquisition. These increases were partially offset by lower compensation associated with carried interest.
•Non-compensation expenses of $12,926 million in 2020 increased 15% from the prior year, primarily as a result of higher volume-related expenses, incremental operating and other expenses as a result of the E*TRADE acquisition, integration-related expenses, increased information processing and communications expenses, and an increase in the provision for credit losses for lending commitments, partially offset by a decrease in marketing and business development expenses.
Income Taxes
•The increase in the Firm’s effective tax rate in 2020 compared with the prior year is primarily due to the higher level of earnings and lower net discrete tax benefits. In 2020, net discrete tax benefits were $122 million, primarily related to the conversion of employee share-based awards.
•The provision for income taxes in 2019 includes net discrete tax benefits of $475 million, primarily associated with remeasurement of reserves and related interest as a result of new information pertaining to the resolution of multi-jurisdiction tax examinations, as well as benefits related to conversion of employee share-based awards.
Business Segment Results
Net Revenues by Segment1
($ in millions)
Net Income Applicable to Morgan Stanley by Segment1
($ in millions)
1.The percentages on the bars in the charts represent the contribution of each business segment to the total of the applicable financial category and may not total to 100% due to intersegment eliminations. See Note 23 to the financial statements for details of intersegment eliminations.
| | | | | | | | |
| 27 | December 2020 Form 10-K |
| | | | | |
| |
| Management's Discussion and Analysis | |
•Institutional Securities net revenues of $25,948 million in 2020 increased 27% from the prior year, primarily reflecting higher revenues from sales and trading and underwriting, partially offset by losses on loans and lending commitments held for sale and an increase in the provision for credit losses on loans held for investment.
•Wealth Management net revenues of $19,055 million in 2020, including the incremental impact of the E*TRADE acquisition, increased 7% from the prior year, primarily reflecting higher Asset management revenues, driven by growth in client assets, and higher Transactional revenues, largely driven by higher Commissions and fees, partially offset by lower Net interest.
•Investment Management net revenues of $3,734 million in 2020 were relatively unchanged from the prior year, primarily reflecting lower accrued carried interest, offset by higher Asset management revenues resulting from higher average AUM.
Net Revenues by Region1, 2
($ in millions)
1.The percentages on the bars in the charts represent the contribution of each region to the total.
2.For a discussion of how the geographic breakdown for net revenues is determined, see Note 23 to the financial statements.
Revenues in Asia increased 32% in 2020, primarily driven by sales and trading within the Institutional Securities business segment. Revenues in the Americas increased 16% in 2020, primarily driven by the Institutional Securities and Wealth Management business segments. Revenues in EMEA increased 6% in 2020, primarily driven by fixed income sales and trading within the Institutional Securities business segment.
Selected Financial Information and Other Statistical Data
| | | | | | | | | | | |
| $ in millions, except per share data | 2020 | 2019 | 2018 |
| Consolidated results | | | |
| Net revenues | $ | 48,198 | | $ | 41,419 | | $ | 40,107 | |
| | | |
| | | |
| Earnings applicable to Morgan Stanley common shareholders | $ | 10,500 | | $ | 8,512 | | $ | 8,222 | |
Earnings per diluted common share1 | $ | 6.46 | | $ | 5.19 | | $ | 4.73 | |
| | | | | | | | | | | |
| Consolidated financial measures |
Expense efficiency ratio2 | 70.1 | % | 72.7 | % | 72.0 | % |
Adjusted expense efficiency ratio2, 4 | 69.6 | % | 72.7 | % | 72.0 | % |
ROE3 | 13.1 | % | 11.7 | % | 11.8 | % |
Adjusted ROE3, 4 | 13.3 | % | 11.7 | % | 11.8 | % |
ROTCE3, 4 | 15.2 | % | 13.4 | % | 13.5 | % |
Adjusted ROTCE3, 4 | 15.4 | % | 13.4 | % | 13.5 | % |
Pre-tax margin5 | 29.9 | % | 27.3 | % | 28.0 | % |
Pre-tax margin by segment5 |
| Institutional Securities | 35.3 | % | 26.9 | % | 30.4 | % |
| Wealth Management | 23.0 | % | 27.2 | % | 26.2 | % |
Wealth Management, adjusted4 | 24.2 | % | 27.2 | % | 26.2 | % |
| Investment Management | 23.3 | % | 26.2 | % | 16.9 | % |
| | | | | | | | |
| in millions, except per share data and as noted | At
December 31,
2020 | At
December 31,
2019 |
Liquidity resources6 | $ | 338,623 | | $ | 215,868 | |
Loans7 | $ | 150,597 | | $ | 130,637 | |
| Total assets | $ | 1,115,862 | | $ | 895,429 | |
| Deposits | $ | 310,782 | | $ | 190,356 | |
| Borrowings | $ | 217,079 | | $ | 192,627 | |
| Common shares outstanding | 1,810 | | 1,594 | |
| Common shareholders' equity | $ | 92,531 | | $ | 73,029 | |
Tangible common shareholders’ equity4 | $ | 75,916 | | $ | 63,780 | |
Book value per common share8 | $ | 51.13 | | $ | 45.82 | |
Tangible book value per common share4, 8 | $ | 41.95 | | $ | 40.01 | |
Worldwide employees9 (in thousands) | 68 | | 60 | |
| | | | | | | | |
| | |
Capital ratios10 | | |
| Common Equity Tier 1 capital—Standardized | 17.4 | % | 16.4 | % |
| Common Equity Tier 1 capital—Advanced | 17.7 | % | 16.9 | % |
| Tier 1 capital—Standardized | 19.4 | % | 18.6 | % |
| Tier 1 capital—Advanced | 19.8 | % | 19.2 | % |
SLR11 | 7.4 | % | 6.4 | % |
| Tier 1 leverage | 8.4 | % | 8.3 | % |
1.For further information on diluted earnings (loss) per common share, see Note 18 to the financial statements.
2.The expense efficiency ratio represents total non-interest expenses as a percentage of net revenues.
3.ROE and ROTCE represent earnings applicable to Morgan Stanley common shareholders as a percentage of average common equity and average tangible common equity, respectively.
4.Represents a non-GAAP financial measure. See “Selected Non-GAAP Financial Information” herein.
5.Pre-tax margin represents income before income taxes as a percentage of net revenues.
6.For a discussion of Liquidity Resources, see “Liquidity and Capital Resources—Liquidity Risk Management Framework—Liquidity Resources” herein.
7.Amounts include loans held for investment (net of allowance) and loans held for sale but exclude loans at fair value, which are included in Trading assets in the balance sheets. See Note 10 to the financial statements.
8.Book value per common share and tangible book value per common share equal common shareholders’ equity and tangible common shareholders’ equity, respectively, divided by common shares outstanding.
9.As of December 31, 2020, the number of employees includes legacy E*TRADE.
10.For a discussion of our capital ratios, see “Liquidity and Capital Resources—Regulatory Requirements” herein.
11.At December 31, 2020, our SLR reflects the impact of a Federal Reserve interim final rule in effect until March 31, 2021. For further information, see “Liquidity and Capital Resources—Regulatory Requirements” herein.
| | | | | | | | |
| December 2020 Form 10-K | 28 | |
| | | | | |
| |
| Management's Discussion and Analysis | |
Coronavirus Disease (“COVID-19”) Pandemic
The COVID-19 pandemic and related voluntary and government-imposed social and business restrictions have had, and will likely continue to have, a severe impact on global economic conditions and the environment in which we operate our businesses. We have a return-to-workplace program, which is based on role, location and employee willingness and ability to return and focused on the health and safety of all staff. At this time, however, we do not expect significant numbers of staff to return to offices before the third quarter of 2021. The Firm continues to be fully operational, with approximately 90% of employees in the Americas and globally working from home as of December 31, 2020.
Though we are unable to estimate the extent of the impact, the ongoing COVID-19 pandemic and related global economic crisis may have adverse impacts on our future operating results. To date, given our business model, economic conditions have affected our businesses in different ways. We have increased our allowance for credit losses on loans and lending commitments, and the persistence of low interest rates has continued to negatively affect our net interest margin in the Wealth Management business segment. Overall for the Firm, increased client trading and capital markets activity has benefited Institutional Securities business segment results in Sales and trading and Investment banking underwriting revenues. However, the high levels of client trading and capital markets activity experienced in the current year may not be repeated and certain other client-driven activity could become subdued. Refer to “Risk Factors” and “Forward-Looking Statements.”
Selected Non-GAAP Financial Information
We prepare our financial statements using U.S. GAAP. From time to time, we may disclose certain “non-GAAP financial measures” in this document or in the course of our earnings releases, earnings and other conference calls, financial presentations, definitive proxy statement and otherwise. A “non-GAAP financial measure” excludes, or includes, amounts from the most directly comparable measure calculated and presented in accordance with U.S. GAAP. We consider the non-GAAP financial measures we disclose to be useful to us, investors, analysts and other stakeholders by providing further transparency about, or an alternate means of assessing or comparing our financial condition, operating results and capital adequacy.
These measures are not in accordance with, or a substitute for, U.S. GAAP and may be different from or inconsistent with non-GAAP financial measures used by other companies. Whenever we refer to a non-GAAP financial measure, we will also generally define it or present the most directly comparable financial measure calculated and presented in accordance with U.S. GAAP, along with a reconciliation of the differences between the U.S. GAAP financial measure and the non-GAAP financial measure.
The principal non-GAAP financial measures presented in this document are set forth in the following tables.
Reconciliations from U.S. GAAP to Non-GAAP Consolidated Financial Measures
| | | | | | | | | | | |
| $ in millions, except per share data | 2020 | 2019 | 2018 |
Earnings applicable to Morgan Stanley common shareholders | $ | 10,500 | $ | 8,512 | | $ | 8,222 | |
| Impact of adjustments: | | | |
| Integration-related expenses | 231 | — | | — | |
| Related tax benefit | (42) | | — | | — | |
Adjusted earnings applicable to Morgan Stanley common shareholders—non-GAAP1 | $ | 10,689 | $ | 8,512 | $ | 8,222 |
| Earnings per diluted common share | $ | 6.46 | $ | 5.19 | $ | 4.73 |
| Impact of adjustments | 0.12 | — | | — | |
Adjusted earnings per diluted common share—non-GAAP1 | $ | 6.58 | $ | 5.19 | | $ | 4.73 | |
| Expense efficiency ratio | 70.1 | % | 72.7 | % | 72.0 | % |
| Impact of adjustments | (0.5) | % | — | % | — | % |
Adjusted expense efficiency ratio—non-GAAP1 | 69.6 | % | 72.7 | % | 72.0 | % |
| Wealth Management Pre-tax margin | 23.0 | % | 27.2 | % | 26.2 | % |
| Impact of adjustments | 1.2 | % | — | % | — | % |
Adjusted Wealth Management pre-tax margin—non-GAAP1 | 24.2 | % | 27.2 | % | 26.2 | % |
| | | | | | | | | | | |
| At December 31, |
| $ in millions | 2020 | 2019 | 2018 |
| Tangible equity | | | |
| Common shareholders' equity | $ | 92,531 | | $ | 73,029 | | $ | 71,726 | |
| Less: Goodwill and net intangible assets | (16,615) | | (9,249) | | (8,847) | |
| Tangible common shareholders' equity—non-GAAP | $ | 75,916 | | $ | 63,780 | | $ | 62,879 | |
| | | | | | | | | | | |
| | Average Monthly Balance |
| $ in millions | 2020 | 2019 | 2018 |
| Tangible equity | | | |
| | | |
| | | |
| | | |
| Common shareholders' equity | $ | 80,246 | | $ | 72,720 | | $ | 69,977 | |
| Less: Goodwill and net intangible assets | (10,951) | | (9,140) | | (8,985) | |
| Tangible common shareholders' equity—non-GAAP | $ | 69,295 | | $ | 63,580 | | $ | 60,992 | |
| | | | | | | | | | | |
| $ in billions | 2020 | 2019 | 2018 |
| Average common equity | | | |
| Unadjusted—GAAP | $ | 80.2 | | $ | 72.7 | | $ | 70.0 | |
Adjusted1—Non-GAAP | 80.3 | | 72.7 | | 70.0 | |
ROE2 | | | |
| Unadjusted—GAAP | 13.1 | % | 11.7 | % | 11.8 | % |
Adjusted1—Non-GAAP | 13.3 | % | 11.7 | % | 11.8 | % |
| Average tangible common equity—Non-GAAP | | |
| Unadjusted | $ | 69.3 | | $ | 63.6 | | $ | 61.0 | |
Adjusted1 | 69.3 | | 63.6 | | 61.0 | |
ROTCE2—Non-GAAP | | | |
| Unadjusted | 15.2 | % | 13.4 | % | 13.5 | % |
Adjusted1 | 15.4 | % | 13.4 | % | 13.5 | % |
| | | | | | | | |
| 29 | December 2020 Form 10-K |
| | | | | |
| |
| Management's Discussion and Analysis | |
Non-GAAP Financial Measures by Business Segment
| | | | | | | | | | | |
| $ in billions | 2020 | 2019 | 2018 |
Average common equity3, 4 | | | |
| Institutional Securities | $ | 42.8 | | $ | 40.4 | | $ | 40.8 | |
| Wealth Management | 20.8 | | 18.2 | | 16.8 | |
| Investment Management | 2.6 | | 2.5 | | 2.6 | |
ROE5 | | | |
| Institutional Securities | 15.5 | % | 10.4 | % | 11.0 | % |
| Wealth Management | 15.6 | % | 19.8 | % | 20.0 | % |
| Investment Management | 23.3 | % | 28.9 | % | 14.2 | % |
Average tangible common equity3, 4 | | | |
| Institutional Securities | $ | 42.3 | | $ | 39.9 | | $ | 40.1 | |
| Wealth Management | 11.3 | | 10.2 | | 9.2 | |
| Investment Management | 1.7 | | 1.5 | | 1.7 | |
ROTCE5 | | | |
| Institutional Securities | 15.7 | % | 10.5 | % | 11.2 | % |
| Wealth Management | 28.9 | % | 35.6 | % | 36.6 | % |
| Investment Management | 36.0 | % | 46.6 | % | 22.2 | % |
1.Adjusted amounts exclude the effect of costs related to the integration of E*TRADE, net of tax as appropriate. Total integration-related expenses on a pre-tax basis include $151 million in Compensation expenses and $80 million in Non-compensation expenses. For more information, see Note 3 to the financial statements.
2.ROE and ROTCE represent earnings applicable to Morgan Stanley common shareholders as a percentage of average common equity and average tangible common equity, respectively. When excluding integration-related costs, both the numerator and average denominator are adjusted.
3.Average common equity and average tangible common equity for each business segment is determined using our Required Capital framework (see "Liquidity and Capital Resources—Regulatory Requirements—Attribution of Average Common Equity According to the Required Capital Framework” herein).
4.The sums of the segments' Average common equity and Average tangible common equity do not equal the Consolidated measures due to Parent equity.
5.The calculation of ROE and ROTCE by segment uses net income applicable to Morgan Stanley by segment less preferred dividends allocated to each segment as a percentage of average common equity and average tangible common equity, respectively, allocated to each segment.
Return on Tangible Common Equity Target
In January 2021, we established a 2-year ROTCE Target of 14% to 16%, excluding integration-related expenses.
Our ROTCE Target is a forward-looking statement that was based on a normal market environment and may be materially affected by many factors, including, among other things: mergers and acquisitions; macroeconomic and market conditions; legislative, accounting, tax and regulatory developments; industry trading and investment banking volumes; equity market levels; interest rate environment; outsized legal expenses or penalties; the ability to control expenses; and capital levels. See “Forward-Looking Statements” and “Risk Factors” for additional information.
Given the economic impact of the COVID-19 pandemic, it is uncertain if the ROTCE Target will be met within the originally stated time frame. See “Coronavirus Disease (COVID-19) Pandemic” herein and “Risk Factors” for further information on market and economic conditions and their effects on our financial results.
For further information on non-GAAP measures (ROTCE excluding integration-related expenses), see “Selected Non-GAAP Financial Information” herein.
Business Segments
Substantially all of our operating revenues and operating expenses are directly attributable to our business segments. Certain revenues and expenses have been allocated to each business segment, generally in proportion to its respective net revenues, non-interest expenses or other relevant measures. See Note 23 to the financial statements for information on intersegment transactions.
Net Revenues
Investment Banking
Investment banking revenues are derived from client engagements in which we act as an adviser, underwriter or distributor of capital.
Within the Institutional Securities business segment, these revenues are primarily composed of fees earned from underwriting equity and fixed income securities, syndicating loans and advisory services in relation to mergers and acquisitions, divestitures and corporate restructurings.
Within the Wealth Management business segment, these revenues are derived from the distribution of newly issued securities.
Trading
Trading revenues include the realized gains and losses from transactions in financial instruments, unrealized gains and losses from ongoing changes in the fair value of our positions, and gains and losses from financial instruments used to economically hedge compensation expense related to certain employee deferred compensation plans.
Within the Institutional Securities business segment, Trading revenues arise from transactions in cash instruments and derivatives in which we act as a market maker for our clients. In this role, we stand ready to buy, sell or otherwise transact with customers under a variety of market conditions and to provide firm or indicative prices in response to customer requests. Our liquidity obligations can be explicit in some cases, and in others, customers expect us to be willing to transact with them. In order to most effectively fulfill our market-making function, we engage in activities across all of our trading businesses that include, but are not limited to:
•taking positions in anticipation of, and in response to, customer demand to buy or sell and—depending on the liquidity of the relevant market and the size of the position—to hold those positions for a period of time;
•building, maintaining and rebalancing inventory held to facilitate client activity through trades with other market participants;
•managing and assuming basis risk (risk associated with imperfect hedging) between risks incurred from the facilitation of client transactions and the standardized products available in the market to hedge those risks;
| | | | | | | | |
| December 2020 Form 10-K | 30 | |
| | | | | |
| |
| Management's Discussion and Analysis | |
•trading in the market to remain current on pricing and trends; and
•engaging in other activities to provide efficiency and liquidity for markets.
In many markets, the realized and unrealized gains and losses from purchase and sale transactions will include any spreads between bids and offers. Certain fees received on loans carried at fair value and dividends from equity securities are also recorded in Trading revenues since they relate to positions carried at fair value.
Within the Wealth Management business segment, Trading revenues primarily include revenues from customers’ purchases and sales of fixed income instruments in which we act as principal, and gains and losses related to investments associated with certain employee deferred compensation plans.
Investments
Investments revenues are composed of realized and unrealized gains and losses derived from investments, including those associated with employee deferred compensation and co-investment plans. Estimates of the fair value of the investments that produce these revenues may involve significant judgment and may fluctuate significantly over time in light of business, market, economic and financial conditions, generally or in relation to specific transactions.
Within the Institutional Securities segment, gains and losses are primarily from business-related investments. Certain investments are subject to sale restrictions. Typically, there are no fee revenues from these investments.
Within the Investment Management business segment, Investments revenues, in addition to gains and losses from investments, include performance-based fees in the form of carried interest, a portion of which is subject to reversal. The business is entitled to receive carried interest when the return in certain funds exceeds specified performance targets. Additionally, there are certain sponsored Investment Management funds consolidated by us where revenues are primarily attributable to holders of noncontrolling interests.
Commissions and Fees
Commissions and fees result from arrangements in which the client is charged a fee for executing transactions related to securities, services related to sales and trading activities, and sales of other products.
Within the Institutional Securities business segment, commissions and fees include fees earned from market-making activities, such as executing and clearing client transactions on major stock and derivative exchanges, as well as from OTC derivatives.
Within the Wealth Management business segment, commissions and fees primarily arise from client transactions
in equity securities, insurance products, mutual funds, futures and options, and also include revenues from order flow payments for directing customer orders to broker-dealers, exchanges, and market centers for execution.
Asset Management
Asset management revenues include fees associated with the management and supervision of assets and the distribution of funds and similar products.
Within the Wealth Management business segment, Asset management revenues are associated with advisory services and management of assets, account service and administration, as well as distribution of products. These revenues are generally based on the net asset value of the account in which a client is invested.
Within the Investment Management business segment, Asset management revenues are primarily composed of fees received from mutual fund daily average net assets or based on monthly or quarterly invested equity for other vehicles. Performance-based fees, not in the form of carried interest, are earned on certain products and separately managed accounts as a percentage of appreciation generally earned by those products and, in certain cases, are based upon the achievement of performance criteria. These performance fees are generally recognized annually.
Net Interest
Interest income and Interest expense are functions of the level and mix of total assets and liabilities, including Trading assets and Trading liabilities, Investment securities, Securities borrowed or purchased under agreements to resell, Securities loaned or sold under agreements to repurchase, Loans, Deposits and Borrowings.
Within the Institutional Securities business segment, Net interest is a function of market-making strategies, client activity, and the prevailing level, term structure and volatility of interest rates. Net interest is impacted by market-making activities as securities held by the Firm generally earn interest, as do securities borrowed and securities purchased under agreements to resell, while securities loaned and securities sold under agreements to repurchase generally incur interest expense.
Within the Wealth Management business segment, Interest income is driven by Investment securities, Loans and margin loans. Interest expense is driven by Deposits and other funding. Upon acquisition, E*TRADE’s Investment securities were recorded at fair value, and the resulting premium will be amortized over the life of the portfolio against interest income.
Other
Other revenues for Institutional Securities include revenues and losses from equity method investments, lending
| | | | | | | | |
| 31 | December 2020 Form 10-K |
| | | | | |
| |
| Management's Discussion and Analysis | |
commitments, fees earned in association with lending activities and the provision for loan losses.
Other revenues for Wealth Management are derived from realized gains and losses on AFS securities, the provision for loan losses, account handling fees, referral fees and other miscellaneous revenues.
Institutional Securities—Sales and Trading Revenues
Sales and trading net revenues are composed of Trading revenues, Commissions and fees, Asset management revenues and Net interest. These revenues, which can be affected by a variety of interrelated factors, including market volumes, bid-offer spreads and the impact of market conditions on inventory held to facilitate client activity, as well as the effect of hedging activity, are viewed in the aggregate when assessing the performance and profitability of our sales and trading activities. We make transaction-related decisions based on, among other things, an assessment of the aggregate expected profit or loss associated with a transaction, including any associated commissions and fees, dividends, or net interest income, any costs associated with financing or hedging our positions and other related expenses.
Following is a description of the sales and trading activities within our equity and fixed income businesses, as well as how their results impact the income statement line items.
Equity—Financing. We provide financing, prime brokerage and fund administration services to our clients active in the equity markets through a variety of products, including margin lending, securities lending and swaps. Results from this business are largely driven by the difference between financing income earned and financing costs incurred, which are reflected in Net interest for securities lending products, and in Trading revenues for derivative products. Fees for providing fund administration services are reflected in Asset management revenues.
Equity—Execution services. A significant portion of the results for this business is generated by commissions and fees from executing and clearing client transactions on major stock and derivative exchanges, as well as from OTC transactions. We make markets for our clients principally in equity-related securities and derivative products, including those that provide liquidity and are utilized for hedging. Market-making also generates gains and losses on inventory held to facilitate client activity, which are reflected in Trading revenues.
Fixed income—Within fixed income, we make markets in various flow and structured products in order to facilitate client activity as part of the following products and services:
•Global macro products. We make markets for our clients in interest rate, foreign exchange and emerging market products, including exchange-traded and OTC securities and derivative instruments. The results of this market-making activity are primarily driven by gains and losses
from buying and selling positions to stand ready for and satisfy client demand and are recorded in Trading revenues.
•Credit products. We make markets in credit-sensitive products, such as corporate bonds and mortgage securities and other securitized products, and related derivative instruments. The values of positions in this business are sensitive to changes in credit spreads and interest rates, which result in gains and losses reflected in Trading revenues. We undertake lending activities, which include commercial mortgage lending, secured lending facilities and financing extended to sales and trading customers. Due to the amount and type of the interest-bearing securities and loans making up this business, a significant portion of the results is also reflected in Net interest revenues.
•Commodities products and Other. We make markets in various commodity products related primarily to electricity, natural gas, oil and metals. Other activities primarily include results from the centralized management of our fixed income derivative counterparty exposures and managing derivative counterparty risk on behalf of clients. These activities are primarily recorded in Trading revenues.
Other sales and trading revenues include impacts from certain treasury functions, such as liquidity costs and gains and losses on economic hedges related to certain borrowings, certain activities associated with corporate lending, as well as gains and losses from financial instruments used to economically hedge compensation expense related to certain employee deferred compensation plans.
Compensation Expense
Compensation and benefits expenses include base salaries and fixed allowances, formulaic programs, discretionary incentive compensation, amortization of deferred cash and equity awards, changes in the fair value of investments to which certain deferred compensation plans are referenced, carried interest allocated to employees, severance costs, and other items such as health and welfare benefits.
The factors that drive compensation for our employees vary from period to period, from segment to segment and within a segment. For certain revenue-producing employees in the Wealth Management and Investment Management business segments, compensation is largely paid on the basis of formulaic payouts that link employee compensation to revenues. Compensation for other employees, including revenue-producing employees in the Institutional Securities business segment, include base salary and benefits, and may also include incentive compensation that is determined following the assessment of the Firm’s, business unit’s and individual’s performance.
Compensation expense for deferred cash-based compensation plans is recognized over the relevant vesting period and is adjusted based on the notional earnings of the referenced investments until distribution. Although changes in
| | | | | | | | |
| December 2020 Form 10-K | 32 | |
| | | | | |
| |
| Management's Discussion and Analysis | |
compensation expense resulting from changes in the fair value of the referenced investments will generally be offset by changes in the fair value of investments made by the Firm, there is typically a timing difference between the immediate recognition of gains and losses on the Firm's investments and the compensation expense recognized over the vesting period.
Income Taxes
The income tax provision for our business segments is generally determined based on the revenues, expenses and activities directly attributable to each business segment. Certain items have been allocated to each business segment, generally in proportion to its respective net revenues or other relevant measures.
| | | | | | | | |
| 33 | December 2020 Form 10-K |
| | | | | |
| |
| Management's Discussion and Analysis | |
Institutional Securities
Income Statement Information
| | | | | | | | | | | | | | | | | |
| | | | | % Change |
| $ in millions | 2020 | 2019 | 2018 | 2020 | 2019 |
| Revenues | | | | | |
| Investment banking | $ | 7,204 | | $ | 5,734 | | $ | 6,088 | | 26 | % | (6) | % |
| Trading | 13,106 | | 10,318 | | 11,191 | | 27 | % | (8) | % |
| Investments | 166 | | 325 | | 182 | | (49) | % | 79 | % |
| Commissions and fees | 2,935 | | 2,484 | | 2,671 | | 18 | % | (7) | % |
| Asset management | 461 | | 413 | | 421 | | 12 | % | (2) | % |
| Other | (214) | | 632 | | 535 | | (134) | % | 18 | % |
Total non-interest revenues | 23,658 | | 19,906 | | 21,088 | | 19 | % | (6) | % |
| Interest income | 5,809 | | 12,193 | | 9,271 | | (52) | % | 32 | % |
| Interest expense | 3,519 | | 11,713 | | 9,777 | | (70) | % | 20 | % |
| Net interest | 2,290 | | 480 | | (506) | | N/M | 195 | % |
| Net revenues | 25,948 | | 20,386 | | 20,582 | | 27 | % | (1) | % |
Compensation and benefits | 8,342 | | 7,433 | | 6,958 | | 12 | % | 7 | % |
Non-compensation expenses | 8,455 | | 7,463 | | 7,364 | | 13 | % | 1 | % |
Total non-interest expenses | 16,797 | | 14,896 | | 14,322 | | 13 | % | 4 | % |
Income from continuing operations before income taxes | 9,151 | | 5,490 | | 6,260 | | 67 | % | (12) | % |
Provision for income taxes | 2,040 | | 769 | | 1,230 | | 165 | % | (37) | % |
Income from continuing operations | 7,111 | | 4,721 | | 5,030 | | 51 | % | (6) | % |
Income (loss) from discontinued operations, net of income taxes | — | | — | | (6) | | N/M | 100 | % |
| Net income | 7,111 | | 4,721 | | 5,024 | | 51 | % | (6) | % |
Net income applicable to noncontrolling interests | 99 | | 122 | | 118 | | (19) | % | 3 | % |
Net income applicable to Morgan Stanley | $ | 7,012 | | $ | 4,599 | | $ | 4,906 | | 52 | % | (6) | % |
Investment Banking
Investment Banking Revenues
| | | | | | | | | | | | | | | | | |
| | | | | % Change |
| $ in millions | 2020 | 2019 | 2018 | 2020 | 2019 |
| Advisory | $ | 2,008 | | $ | 2,116 | | $ | 2,436 | | (5) | % | (13) | % |
| Underwriting: | | | | | |
Equity | 3,092 | | 1,708 | | 1,726 | | 81 | % | (1) | % |
Fixed Income | 2,104 | | 1,910 | | 1,926 | | 10 | % | (1) | % |
| Total Underwriting | 5,196 | | 3,618 | | 3,652 | | 44 | % | (1) | % |
| Total Investment banking | $ | 7,204 | | $ | 5,734 | | $ | 6,088 | | 26 | % | (6) | % |
Investment Banking Volumes
| | | | | | | | | | | |
| $ in billions | 2020 | 2019 | 2018 |
Completed mergers and acquisitions1 | $ | 867 | | $ | 826 | | $ | 1,114 | |
Equity and equity-related offerings2, 3 | 100 | | 61 | | 64 | |
Fixed income offerings2, 4 | 374 | | 287 | | 241 | |
Source: Refinitiv data as of January 4, 2021. Transaction volumes may not be indicative of net revenues in a given period. In addition, transaction volumes for prior periods may vary from amounts previously reported due to the subsequent withdrawal, change in value or change in timing of certain transactions.
1.Includes transactions of $100 million or more. Based on full credit to each of the advisors in a transaction.
2.Based on full credit for single book managers and equal credit for joint book managers.
3.Includes Rule 144A issuances and registered public offerings of common stock, convertible securities and rights offerings.
4.Includes Rule 144A and publicly registered issuances, non-convertible preferred stock, mortgage-backed and asset-backed securities, and taxable municipal debt. Excludes leveraged loans and self-led issuances.
Investment Banking Revenues
Investment banking revenues of $7,204 million in 2020 increased 26% compared with the prior year, reflecting strength in our underwriting businesses.
•Advisory revenues decreased primarily due to fewer large completed transactions.
•Equity underwriting revenues increased on higher volumes, primarily in secondary block share trades, initial public offerings and follow-on offerings.
•Fixed income underwriting revenues increased on higher volumes, primarily in investment grade and non-investment grade bond issuances, partially offset by lower event-driven investment grade loan activity.
See “Investment Banking Volumes” herein.
Sales and Trading Net Revenues
By Income Statement Line Item
| | | | | | | | | | | | | | | | | |
| | | | | % Change |
| $ in millions | 2020 | 2019 | 2018 | 2020 | 2019 |
| Trading | $ | 13,106 | | $ | 10,318 | | $ | 11,191 | | 27 | % | (8) | % |
| Commissions and fees | 2,935 | | 2,484 | | 2,671 | | 18 | % | (7) | % |
| Asset management | 461 | | 413 | | 421 | | 12 | % | (2) | % |
| Net interest | 2,290 | | 480 | | (506) | | N/M | 195 | % |
| Total | $ | 18,792 | | $ | 13,695 | | $ | 13,777 | | 37 | % | (1) | % |
| | | | | | | | |
| December 2020 Form 10-K | 34 | |
| | | | | |
| |
| Management's Discussion and Analysis | |
By Business
| | | | | | | | | | | | | | | | | |
| | | | | % Change |
| $ in millions | 2020 | 2019 | 2018 | 2020 | 2019 |
| Equity | $ | 9,801 | | $ | 8,056 | | $ | 8,976 | | 22 | % | (10) | % |
| Fixed income | 8,824 | | 5,546 | | 5,005 | | 59 | % | 11 | % |
| Other | 167 | | 93 | | (204) | | 80 | % | 146 | % |
| Total | $ | 18,792 | | $ | 13,695 | | $ | 13,777 | | 37 | % | (1) | % |
Sales and Trading Revenues—Equity and Fixed Income
| | | | | | | | | | | | | | |
| | 2020 |
| $ in millions | Trading | Fees1 | Net Interest2 | Total |
| Financing | $ | 3,736 | | $ | 439 | | $ | 342 | | $ | 4,517 | |
| Execution services | 2,882 | | 2,658 | | (256) | | 5,284 | |
| Total Equity | $ | 6,618 | | $ | 3,097 | | $ | 86 | | $ | 9,801 | |
| Total Fixed income | $ | 6,840 | | $ | 299 | | $ | 1,685 | | $ | 8,824 | |
| | | | | | | | | | | | | | |
| | 2019 |
| $ in millions | Trading | Fees1 | Net Interest2 | Total |
| Financing | $ | 4,225 | | $ | 372 | | $ | (514) | | $ | 4,083 | |
| Execution services | 1,986 | | 2,202 | | (215) | | 3,973 | |
| Total Equity | $ | 6,211 | | $ | 2,574 | | $ | (729) | | $ | 8,056 | |
| Total Fixed income | $ | 5,171 | | $ | 324 | | $ | 51 | | $ | 5,546 | |
| | | | | | | | | | | | | | |
| | 2018 |
| $ in millions | Trading | Fees1 | Net Interest2 | Total |
| Financing | $ | 4,841 | | $ | 394 | | $ | (661) | | $ | 4,574 | |
| Execution services | 2,362 | | 2,376 | | (336) | | 4,402 | |
| Total Equity | $ | 7,203 | | $ | 2,770 | | $ | (997) | | $ | 8,976 | |
| Total Fixed income | $ | 4,793 | | $ | 322 | | $ | (110) | | $ | 5,005 | |
1.Includes Commissions and fees and Asset management revenues.
2.Includes funding costs, which are allocated to the businesses based on funding usage.
Equity
Equity sales and trading net revenues of $9,801 million in 2020 increased 22% compared with the prior year, reflecting strong performance in both our execution services and financing businesses.
•Financing revenues increased overall, primarily driven by client activity. In addition, changes in market rates and financing mix contributed to higher Net interest revenues and an offsetting reduction in Trading revenues.
•Execution services revenues increased, primarily reflecting higher client activity and the impact of market conditions on inventory held to facilitate client activity in derivatives and cash equities.
Fixed Income
Fixed income net revenues of $8,824 million in 2020 increased 59% compared with the prior year, reflecting strong performance across all products.
•Global macro products revenues increased, primarily due to higher client activity in both rates and foreign exchange
products and the impact of market conditions on inventory held to facilitate client activity.
•Credit products revenues increased, primarily due to higher client activity in corporate credit and securitized products from higher volumes and wider bid-offer spreads, partially offset by the impact of market conditions on inventory held to facilitate client activity. Lower funding costs and higher average secured lending facilities balances contributed to higher Net interest revenues.
•Commodities products and Other revenues increased, primarily reflecting the impact of market conditions on inventory held to facilitate client activity and higher client activity in Commodities, partially offset by lower client structuring activity within derivative counterparty credit risk management.
Other
•Other sales and trading revenues of $167 million in 2020 increased 80% compared with the prior year, primarily reflecting gains on hedges associated with corporate lending activity compared with losses in the prior year, partially offset by lower rates on liquidity investments.
Investments, Other Revenues, Non-interest Expenses and Income Tax Items
Investments
•Net investment gains of $166 million in 2020 decreased 49% compared with the prior year primarily due to the absence of a gain associated with an investment’s initial public offering.
Other Revenues
•Other net losses were $214 million in 2020 compared with Other revenues of $632 million in the prior year. This change was primarily as a result of mark-to-market losses on loans and lending commitments held for sale in the current year, as credit spreads widened, compared with gains in the prior year, as well as an increase in the provision for credit losses on loans held for investment in the current year.
Non-interest Expenses
Non-interest expenses of $16,797 million in 2020 increased 13% compared with the prior year, reflecting a 12% increase in Compensation and benefits expenses and a 13% increase in Non-compensation expenses compared with the prior year.
•Compensation and benefits expenses increased, primarily due to increases in discretionary incentive compensation, driven by higher revenues.
•Non-compensation expenses increased, primarily reflecting higher volume-related expenses and an increase in the provision for credit losses for lending commitments.
| | | | | | | | |
| 35 | December 2020 Form 10-K |
| | | | | |
| |
| Management's Discussion and Analysis | |
Income Tax Items
Net discrete tax benefits of $68 million and $400 million were recognized in Provision for income taxes in 2020 and 2019, respectively. The provision for income taxes in 2020 compared with the prior year was also impacted by the higher level of earnings. For further information, see “Supplemental Financial Information—Income Tax Matters” herein.
| | | | | | | | |
| December 2020 Form 10-K | 36 | |
| | | | | |
| |
| Management's Discussion and Analysis | |
Wealth Management
Income Statement Information
| | | | | | | | | | | | | | | | | |
| | | | | % Change |
| $ in millions | 2020 | 2019 | 2018 | 2020 | 2019 |
| Revenues | | | | | |
| Investment banking | $ | 559 | | $ | 509 | | $ | 475 | | 10 | % | 7 | % |
| Trading | 844 | | 734 | | 279 | | 15 | % | 163 | % |
| Investments | 12 | | 2 | | 1 | | N/M | 100 | % |
| Commissions and fees | 2,291 | | 1,726 | | 1,804 | | 33 | % | (4) | % |
| Asset management | 10,955 | | 10,199 | | 10,158 | | 7 | % | — | % |
| Other | 372 | | 345 | | 248 | | 8 | % | 39 | % |
| Total non-interest revenues | 15,033 | | 13,515 | | 12,965 | | 11 | % | 4 | % |
| Interest income | 4,771 | | 5,467 | | 5,498 | | (13) | % | (1) | % |
| Interest expense | 749 | | 1,245 | | 1,221 | | (40) | % | 2 | % |
| Net interest | 4,022 | | 4,222 | | 4,277 | | (5) | % | (1) | % |
| Net revenues | 19,055 | | 17,737 | | 17,242 | | 7 | % | 3 | % |
| Compensation and benefits | 10,970 | | 9,774 | | 9,507 | | 12 | % | 3 | % |
| Non-compensation expenses | 3,698 | | 3,131 | | 3,214 | | 18 | % | (3) | % |
Total non-interest expenses | 14,668 | | 12,905 | | 12,721 | | 14 | % | 1 | % |
Income from continuing operations before income taxes | 4,387 | | 4,832 | | 4,521 | | (9) | % | 7 | % |
| Provision for income taxes | 1,026 | | 1,104 | | 1,049 | | (7) | % | 5 | % |
Net income applicable to Morgan Stanley | $ | 3,361 | | $ | 3,728 | | $ | 3,472 | | (10) | % | 7 | % |
Acquisition of E*TRADE
On October 2, 2020, we completed the acquisition of E*TRADE principally via the issuance of approximately $11 billion of common shares. In addition, we issued $0.7 billion of preferred shares in exchange for E*TRADE’s existing preferred stock. The combination increases the scale and breadth of Morgan Stanley’s Wealth Management franchise, and positions us to be an industry leader in Wealth Management across all channels and wealth segments. From the acquisition date onward, the business activities of E*TRADE have been reported within the Wealth Management business segment. For additional information on the acquisition of E*TRADE, see Note 3 to the financial statements.
Wealth Management Metrics
| | | | | | | | |
| At or for the Year Ended |
| December 31, |
| $ in billions | 2020 | 2019 |
| Total client assets | $ | 3,999 | $ | 2,700 |
Net new assets1 | $ | 175.4 | $ | 97.8 |
| U.S. Bank Subsidiary loans | $ | 98.1 | $ | 80.1 |
Margin and other lending2 | $ | 23.1 | $ | 9.7 |
Deposits3 | $ | 306 | $ | 187 |
Weighted average cost of deposits4 | 0.24% | 0.91% |
1.Net new assets represents client inflows (including dividends and interest) less client outflows (excluding activity from business combinations/divestitures and the impact of fees and commissions).
2.Margin and other lending represents Wealth Management margin lending arrangements, which allow customers to borrow against the value of qualifying securities and Wealth Management other lending which includes non‐purpose securities-based lending on non‐bank entities.
3.Deposits reflect liabilities sourced from Wealth Management clients and other sources of funding on the U.S. Bank Subsidiaries. Deposits include sweep deposit programs, savings and other, and time deposits. Excludes approximately $25 billion of off-balance sheet deposits as of December 31, 2020.
4.Weighted average cost of deposits represents the annualized weighted average cost of deposits as of December 31, 2020 and December 31, 2019.
| | | | | | | | | | | |
| At or for the Year Ended |
| $ in billions, except employee data and as otherwise noted | December 31, |
| 2020 | 2019 | 2018 |
| Advisor-led channel: | | | |
Advisor-led client assets1 | $ | 3,167 | $ | 2,623 | $ | 2,254 |
Fee-based client assets2 | $ | 1,472 | $ | 1,267 | $ | 1,046 |
Fee-based asset flows3 | $ | 77.4 | $ | 64.9 | $ | 65.9 |
Fee-based client assets as a percentage of advisor-led client assets | 46% | 48% | 46% |
Wealth Management representatives (in thousands) | 16 | 15 | 16 |
| | | |
| Self-directed channel: | | | |
Self-directed assets4 | $ | 832 | $ | 77 | $ | 49 |
Daily average revenue trades (“DARTs”) (in thousands)5 | 280 | 3 | 3 |
Self-directed households (in millions)6 | 6.7 | 1.6 | 1.1 |
| | | |
| Workplace channel: | | | |
Workplace unvested assets7 | $ | 435 | $ | 133 | $ | 13 |
Number of participants (in millions)8 | 4.9 | 2.7 | 1.0 |
1.Advisor-led client assets represents client assets in accounts that have a Wealth Management representative assigned.
2.Fee‐based client assets represents the amount of assets in client accounts where the basis of payment for services is a fee calculated on those assets.
3.Fee-based asset flows includes net new fee-based assets, net account transfers, dividends, interest and client fees, and excludes institutional cash management related activity. For a description of the Inflows and Outflows included in Fee-based asset flows, see Fee-based client assets herein.
4.Self-directed assets represents active accounts which are not advisor led. Active accounts are defined as having $25 or more in assets.
5.DARTs represent the total self-directed trades in a period divided by the number of trading days during that period. DARTs for the fourth quarter of 2020 were 1,106 thousand, which includes the impact of the E*TRADE acquisition.
6.Self-directed households represents the total number of households that include at least one account with self-directed assets. Individual households or participants that are engaged in one or more of our Wealth Management channels will be included in each of the respective channel counts.
7.Workplace unvested assets represents the market value of public company securities at the end of the period.
8.Workplace participants represents total accounts with vested or unvested assets >$0 in the workplace channel. Individuals with accounts in multiple plans are counted as participants in each plan.
| | | | | | | | |
| 37 | December 2020 Form 10-K |
| | | | | |
| |
| Management's Discussion and Analysis | |
Net Revenues
Transactional Revenues
| | | | | | | | | | | | | | | | | |
| | | | | % Change |
| $ in millions | 2020 | 2019 | 2018 | 2020 | 2019 |
| Investment banking | $ | 559 | $ | 509 | $ | 475 | 10% | 7% |
| Trading | 844 | 734 | 279 | 15% | 163% |
| Commissions and fees | 2,291 | 1,726 | 1,804 | 33% | (4)% |
| Total | $ | 3,694 | $ | 2,969 | $ | 2,558 | 24% | 16% |
| | | | | |
Transactional revenues of $3,694 million in 2020 increased 24% compared with the prior year, primarily as a result of higher Commissions and fees and higher Trading revenues.
•Trading revenues increased in 2020, primarily due to gains from investments associated with certain employee deferred compensation plans, partially offset by lower fixed income revenues.
•Commissions and fees increased in 2020, primarily due to increased client activity in equities, as well as order flow payments as a result of the E*TRADE acquisition.
Asset Management
Asset management revenues of $10,955 million in 2020 increased 7% compared with the prior year, due to higher fee-based asset levels in 2020 as a result of market appreciation and positive fee-based net flows, partially offset by lower average fee rates.
See “Fee-Based Client Assets Rollforwards” herein.
Net Interest
Net interest revenues of $4,022 million in 2020 decreased 5% compared with the prior year, primarily due to the net effect of lower interest rates, partially offset by growth in bank lending and increases in investment portfolio balances driven by higher brokerage sweep deposits, as well as incremental Net interest as a result of the E*TRADE acquisition.
Non-interest Expenses
Non-interest expenses of $14,668 million in 2020 increased 14% compared with the prior year, due to higher Compensation and benefits expenses and Non-compensation expenses.
•Compensation and benefits expenses increased, primarily due to an increase in the formulaic payout to Wealth Management representatives, driven by higher compensable revenues, incremental compensation as a result of the E*TRADE acquisition and integration-related expenses of $151 million, as well as higher expenses related to certain deferred compensation plans linked to investment performance.
•Non-compensation expenses increased, primarily due to incremental operating and other expenses as a result of the E*TRADE acquisition, integration-related expenses of $80 million, a regulatory charge in the third quarter of 2020 and
$52 million of E*TRADE-related intangible assets amortization. Partially offsetting these increases was lower marketing and business development expenses.
Fee-Based Client Assets Rollforwards
| | | | | | | | | | | | | | | | | |
| $ in billions | At
December 31,
2019 | Inflows | Outflows | Market
Impact | At
December 31,
2020 |
Separately managed1 | $ | 322 | | $ | 48 | | $ | (25) | | $ | 14 | | $ | 359 | |
| Unified managed | 313 | | 63 | | (43) | | 46 | | 379 | |
| Advisor | 155 | | 33 | | (28) | | 17 | | 177 | |
Portfolio manager | 435 | | 86 | | (57) | | 45 | | 509 | |
| Subtotal | $ | 1,225 | | $ | 230 | | $ | (153) | | $ | 122 | | $ | 1,424 | |
Cash management | 42 | | 28 | | (22) | | — | | 48 | |
Total fee-based client assets | $ | 1,267 | | $ | 258 | | $ | (175) | | $ | 122 | | $ | 1,472 | |
| | | | | | | | | | | | | | | | | |
| $ in billions | At
December 31,
2018 | Inflows | Outflows | Market
Impact | At
December 31,
2019 |
Separately managed1 | $ | 279 | | $ | 53 | | $ | (19) | | $ | 9 | | $ | 322 | |
| Unified managed | 257 | | 48 | | (39) | | 47 | | 313 | |
| Advisor | 137 | | 27 | | (32) | | 23 | | 155 | |
Portfolio manager | 353 | | 75 | | (48) | | 55 | | 435 | |
| Subtotal | $ | 1,026 | | $ | 203 | | $ | (138) | | $ | 134 | | $ | 1,225 | |
Cash management | 20 | | 36 | | (14) | | — | | 42 | |
Total fee-based client assets | $ | 1,046 | | $ | 239 | | $ | (152) | | $ | 134 | | $ | 1,267 | |
| | | | | | | | | | | | | | | | | |
| $ in billions | At
December 31,
2017 | Inflows | Outflows | Market
Impact | At
December 31,
2018 |
Separately managed1 | $ | 252 | | $ | 40 | | $ | (18) | | $ | 5 | | $ | 279 | |
| Unified managed | 271 | | 48 | | (34) | | (28) | | 257 | |
| Advisor | 149 | | 29 | | (28) | | (13) | | 137 | |
Portfolio manager | 353 | | 71 | | (42) | | (29) | | 353 | |
| Subtotal | $ | 1,025 | | $ | 188 | | $ | (122) | | $ | (65) | | $ | 1,026 | |
Cash management | 20 | | 16 | | (16) | | — | | 20 | |
Total fee-based client assets | $ | 1,045 | | $ | 204 | | $ | (138) | | $ | (65) | | $ | 1,046 | |
1.Includes non-custody account values reflecting prior quarter-end balances due to a lag in the reporting of asset values by third-party custodians.
Average Fee Rates
| | | | | | | | | | | |
| Fee rate in bps | 2020 | 2019 | 2018 |
| Separately managed | 14 | | 15 | | 16 | |
| Unified managed | 99 | | 100 | | 99 | |
| Advisor | 85 | | 86 | | 84 | |
| Portfolio manager | 94 | | 95 | | 95 | |
| Subtotal | 73 | | 74 | | 76 | |
| Cash management | 5 | | 6 | | 6 | |
| Total fee-based client assets | 70 | | 73 | | 74 | |
| | | |
•Inflows—include new accounts, account transfers, deposits, dividends and interest.
•Outflows—include closed or terminated accounts, account transfers, withdrawals and client fees.
•Market impact—includes realized and unrealized gains and losses on portfolio investments.
•Separately managed—accounts by which third-party and affiliated asset managers are engaged to manage clients’
| | | | | | | | |
| December 2020 Form 10-K | 38 | |
| | | | | |
| |
| Management's Discussion and Analysis | |
assets with investment decisions made by the asset manager. Only one third-party asset manager strategy can be held per account.
•Unified managed—accounts that provide the client with the ability to combine separately managed accounts, mutual funds and exchange-traded funds all in one aggregate account. Investment decisions and discretionary authority may be exercised by the client, financial advisor or portfolio manager. Also includes accounts that give the client the ability to systematically allocate assets across a wide range of mutual funds, for which the investment decisions are made by the client.
•Advisor—accounts where the investment decisions must be approved by the client and the financial advisor must obtain approval each time a change is made to the account or its investments.
•Portfolio manager—accounts where a financial advisor has discretion (contractually approved by the client) to make ongoing investment decisions without the client’s approval for each individual change.
•Cash management—accounts where the financial advisor provides discretionary cash management services to institutional clients, whereby securities or proceeds are invested and reinvested in accordance with the client’s investment criteria. Generally, the portfolio will be invested in short-term fixed income and cash equivalent investments.
| | | | | | | | |
| 39 | December 2020 Form 10-K |
| | | | | |
| |
| Management's Discussion and Analysis | |
Investment Management
Income Statement Information
| | | | | | | | | | | | | | | | | |
| | | | | % Change |
| $ in millions | 2020 | 2019 | 2018 | 2020 | 2019 |
| Revenues | | | | | |
| | | | | |
| Trading | $ | (34) | | $ | (8) | | $ | 25 | | N/M | (132) | % |
| Investments | 808 | | 1,213 | | 254 | | (33) | % | N/M |
| Commissions and fees | 1 | | 1 | | — | | — | % | N/M |
| Asset management | 3,013 | | 2,629 | | 2,468 | | 15 | % | 7 | % |
| Other | (39) | | (46) | | (30) | | 15 | % | (53) | % |
| Total non-interest revenues | 3,749 | | 3,789 | | 2,717 | | (1) | % | 39 | % |
| Interest income | 14 | | 20 | | 57 | | (30) | % | (65) | % |
| Interest expense | 29 | | 46 | | 28 | | (37) | % | 64 | % |
| Net interest | (15) | | (26) | | 29 | | 42 | % | (190) | % |
| Net revenues | 3,734 | | 3,763 | | 2,746 | | (1) | % | 37 | % |
| Compensation and benefits | 1,542 | | 1,630 | | 1,167 | | (5) | % | 40 | % |
| Non-compensation expenses | 1,322 | | 1,148 | | 1,115 | | 15 | % | 3 | % |
| Total non-interest expenses | 2,864 | | 2,778 | | 2,282 | | 3 | % | 22 | % |
Income from continuing operations before income taxes | 870 | | 985 | | 464 | | (12) | % | 112 | % |
| Provision for income taxes | 171 | | 193 | | 73 | | (11) | % | 164 | % |
Income from continuing operations | 699 | | 792 | | 391 | | (12) | % | 103 | % |
Income from discontinued operations, net of income taxes | — | | — | | 2 | | N/M | (100)% |
| Net income | 699 | | 792 | | 393 | | (12) | % | 102 | % |
Net income applicable to noncontrolling interests | 84 | | 73 | | 17 | | 15 | % | N/M |
Net income applicable to Morgan Stanley | $ | 615 | | $ | 719 | | $ | 376 | | (14) | % | 91 | % |
Net Revenues
Investments
Investments revenues of $808 million in 2020 decreased 33% compared with the prior year, primarily reflecting lower accrued carried interest in Asia private equity, real estate and infrastructure funds.
Asset Management
Asset management revenues of $3,013 million in 2020 increased 15% compared with the prior year primarily as a result of higher average AUM, driven by strong investment performance and positive net flows.
See “Assets Under Management or Supervision” herein.
Non-interest Expenses
Non-interest expenses of $2,864 million in 2020 increased 3% compared with the prior year as a result of higher Non-compensation expenses, partially offset by lower Compensation and benefits expenses.
•Compensation and benefits expenses decreased primarily as a result of lower compensation associated with carried interest, partially offset by increases in discretionary incentive compensation driven by higher Asset management revenues and higher expenses related to certain deferred compensation plans linked to investment performance.
•Non-compensation expenses increased primarily as a result of higher fee sharing paid to intermediaries on higher average AUM.
| | | | | | | | |
| December 2020 Form 10-K | 40 | |
| | | | | |
| |
| Management's Discussion and Analysis | |
Assets Under Management or Supervision
Rollforwards
| | | | | | | | | | | | | | | | | | | | |
| $ in billions | At
December 31,
2019 | Inflows | Outflows | Market
Impact | Other | At
December 31,
2020 |
| Equity | $ | 138 | | $ | 87 | | $ | (51) | | $ | 69 | | $ | (1) | | $ | 242 | |
Fixed income | 79 | | 37 | | (29) | | 4 | | 7 | | 98 | |
Alternative/ Other | 139 | | 26 | | (24) | | 5 | | 7 | | 153 | |
Long-term AUM subtotal | 356 | | 150 | | (104) | | 78 | | 13 | | 493 | |
| Liquidity | 196 | | 1,584 | | (1,493) | | 1 | | — | | 288 | |
| Total AUM | $ | 552 | | $ | 1,734 | | $ | (1,597) | | $ | 79 | | $ | 13 | | $ | 781 | |
| | | | | | | | | | | | | | | | | | | | |
| $ in billions | At
December 31,
2018 | Inflows | Outflows | Market
Impact | Other | At
December 31,
2019 |
| Equity | $ | 103 | | $ | 39 | | $ | (31) | | $ | 28 | | $ | (1) | | $ | 138 | |
Fixed income | 68 | | 25 | | (20) | | 5 | | 1 | | 79 | |
Alternative/
Other | 128 | | 22 | | (17) | | 10 | | (4) | | 139 | |
Long-term AUM subtotal | 299 | | 86 | | (68) | | 43 | | (4) | | 356 | |
| Liquidity | 164 | | 1,315 | | (1,283) | | 2 | | (2) | | 196 | |
| Total AUM | $ | 463 | | $ | 1,401 | | $ | (1,351) | | $ | 45 | | $ | (6) | | $ | 552 | |
| | | | | | | | | | | | | | | | | | | | |
| $ in billions | At
December 31,
2017 | Inflows | Outflows | Market
Impact | Other | At
December 31,
2018 |
| Equity | $ | 105 | | $ | 38 | | $ | (32) | | $ | (8) | | $ | — | | $ | 103 | |
Fixed income | 73 | | 25 | | (27) | | (2) | | (1) | | 68 | |
Alternative/
Other | 128 | | 22 | | (19) | | (1) | | (2) | | 128 | |
Long-term AUM subtotal | 306 | | 85 | | (78) | | (11) | | (3) | | 299 | |
Liquidity1 | 176 | | 1,351 | | (1,362) | | 2 | | (3) | | 164 | |
| Total AUM | $ | 482 | | $ | 1,436 | | $ | (1,440) | | $ | (9) | | $ | (6) | | $ | 463 | |
1.Included in Liquidity products outflows in 2018 is $18 billion related to the redesign of our brokerage sweep deposits program.
Average AUM
| | | | | | | | | | | |
| $ in billions | 2020 | 2019 | 2018 |
| Equity | $ | 174 | | $ | 124 | | $ | 111 | |
| Fixed income | 86 | | 71 | | 71 | |
| Alternative/Other | 145 | | 134 | | 131 | |
| Long-term AUM subtotal | 405 | | 329 | | 313 | |
| Liquidity | 252 | | 171 | | 158 | |
| Total AUM | $ | 657 | | $ | 500 | | $ | 471 | |
Average Fee Rates
| | | | | | | | | | | |
| Fee rate in bps | 2020 | 2019 | 2018 |
| Equity | 76 | | 76 | | 76 | |
| Fixed income | 29 | | 32 | | 33 | |
| Alternative/Other | 58 | | 64 | | 66 | |
| Long-term AUM | 60 | | 61 | | 62 | |
| Liquidity | 15 | | 17 | | 17 | |
| Total AUM | 42 | | 46 | | 47 | |
•Inflows—represent investments or commitments from new and existing clients in new or existing investment products, including reinvestments of client dividends and increases in invested capital. Inflows exclude the impact of exchanges, whereby a client changes positions within the same asset class.
•Outflows—represent redemptions from clients’ funds, transition of funds from the committed capital period to the invested capital period and decreases in invested capital. Outflows exclude the impact of exchanges, whereby a client changes positions within the same asset class.
•Market impact—includes realized and unrealized gains and losses on portfolio investments. This excludes any funds where market impact does not impact management fees.
•Other—contains both distributions and foreign currency impact for all periods and the impact of the Mesa West Capital, LLC acquisition in 2018. Distributions represent decreases in invested capital due to returns of capital after the investment period of a fund. It also includes fund dividends that the client has not reinvested. Foreign currency impact reflects foreign currency changes for non-U.S. dollar dominated funds.
•Alternative/Other—includes products in fund of funds, real estate, infrastructure, private equity and credit strategies, as well as multi-asset portfolios.
•Average fee rate—based on Asset management revenues, net of waivers, excluding performance-based fees and other non-management fees. For certain non-U.S. funds, it includes the portion of advisory fees that the advisor collects on behalf of third-party distributors. The payment of those fees to the distributor is included in Non-compensation expenses in the income statements.
Planned Acquisition of Eaton Vance
On October 8, 2020, we entered into a definitive agreement under which we will acquire Eaton Vance, a leading provider of advanced investment management strategies and wealth management solutions, in a cash and stock transaction valued, as of the announcement, at approximately $7 billion, based on the 3-day volume-weighted average price of our common stock prior to October 7, 2020 and the number of Eaton Vance’s fully diluted shares outstanding on October 7, 2020. Under the terms of the agreement, Eaton Vance common stockholders will receive $28.25 in cash and 0.5833 shares of our common shares for each Eaton Vance common share. In addition, Eaton Vance common shareholders as of December 4, 2020 received a one-time special cash dividend of $4.25 per share on December 18, 2020, which was paid by Eaton Vance. We currently expect to complete the acquisition on March 1, 2021. Completion of the transaction remains subject to customary closing conditions.
| | | | | | | | |
| 41 | December 2020 Form 10-K |
| | | | | |
| |
| Management's Discussion and Analysis | |
Supplemental Financial Information
Income Tax Matters
| | | | | | | | | | | |
| $ in millions | 2020 | 2019 | 2018 |
| Effective tax rate | 22.5 | % | 18.3 | % | 20.9 | % |
| Net discrete tax provisions (benefits) | $ | (122) | | $ | (475) | | $ | (368) | |
| | | |
| | | |
The increase in the Firm’s effective tax rate in 2020 compared with the prior year is primarily due to the higher level of earnings and lower net discrete tax benefits. In 2020, net discrete tax benefits were primarily related to the conversion of employee share-based awards.
The Firm’s effective tax rate for 2019 includes net discrete tax benefits primarily associated with remeasurement of reserves and related interest as a result of new information pertaining to the resolution of multi-jurisdiction tax examinations, as well as benefits related to conversion of employee share-based awards.
U.S. Bank Subsidiaries
Our U.S. bank subsidiaries, Morgan Stanley Bank N.A. (“MSBNA”), Morgan Stanley Private Bank, National Association (“MSPBNA”), E*TRADE Bank (“ETB”), and E*TRADE Savings Bank (“ETSB”) (collectively, “U.S. Bank Subsidiaries”) accept deposits, provide loans to a variety of customers, including large corporate and institutional clients as well as high net worth individuals, and invest in securities. Lending activity recorded in the U.S. Bank Subsidiaries from the Institutional Securities business segment primarily includes secured lending facilities, commercial and residential real estate loans, and corporate loans. Lending activity recorded in the U.S. Bank Subsidiaries from the Wealth Management business segment primarily includes securities-based lending, which allows clients to borrow money against the value of qualifying securities, and residential real estate loans.
For a further discussion of our credit risks, see “Quantitative and Qualitative Disclosures about Risk—Credit Risk.” For a further discussion about loans and lending commitments, see Notes 10 and 15 to the financial statements.
U.S. Bank Subsidiaries’ Supplemental Financial Information1
| | | | | | | | |
| $ in billions | At
December 31,
2020 | At
December 31,
2019 |
| | |
| Investment securities portfolio: | | |
Investment securities—AFS | $ | 90.3 | | $ | 42.4 | |
Investment securities—HTM | 52.6 | | 26.1 | |
| Total investment securities | $ | 142.9 | | $ | 68.5 | |
| | |
| Wealth Management Loans |
| Residential real estate | $ | 35.2 | | $ | 30.2 | |
Securities-based lending and other2 | 62.9 | | 49.9 | |
| Total | $ | 98.1 | | $ | 80.1 | |
Institutional Securities Loans3 |
Corporate4 | $ | 7.9 | | $ | 5.6 | |
| Secured lending facilities | 27.4 | | 26.8 | |
Commercial and Residential real estate | 10.1 | | 12.0 | |
| Securities-based lending and Other | 5.4 | | 5.4 | |
| Total | $ | 50.8 | | $ | 49.8 | |
| Total Assets | $ | 346.5 | | $ | 219.6 | |
Deposits5 | $ | 309.7 | | $ | 189.3 | |
1.Amounts exclude transactions between the bank subsidiaries, as well as deposits from the Parent Company and affiliates.
2.Other loans primarily include tailored lending.
3.Prior periods have been conformed to the current presentation.
4.For a further discussion of corporate loans in the Institutional Securities business segment, see “Credit Risk—Institutional Securities Corporate Loans” herein.
5.For further information on deposits, see “Liquidity and Capital Resources—Funding Management—Unsecured Financing” herein.
Other Matters
Deferred Cash-Based Compensation
The Firm sponsors a number of employee deferred cash-based compensation programs, which generally contain vesting, clawback and cancellation provisions. For the 2020 performance year, deferred cash-based compensation was awarded to a reduced group of eligible employees compared with the prior year. Additionally in 2020, certain changes to our compensation deferral formula resulted in less cash-based compensation being deferred.
Employees are permitted to allocate the value of their deferred awards among a menu of notional investments, whereby the value of their awards will track the performance of the referenced notional investments. The menu of investments, which is selected by the Firm, includes fixed income, equity, commodity and money market funds.
Compensation expense for deferred cash-based compensation awards is calculated based on the notional value of the award granted, adjusted for changes in the fair value of the referenced investments that employees select. Compensation expense is recognized over the vesting period relevant to each separately vesting portion of deferred awards.
The Firm invests directly, as a principal, in financial instruments and other investments to economically hedge certain of its obligations under these deferred cash-based compensation plans. Changes in the value of such investments
| | | | | | | | |
| December 2020 Form 10-K | 42 | |
| | | | | |
| |
| Management's Discussion and Analysis | |
are recorded in Trading and Investments revenues. Although changes in compensation expense resulting from changes in the fair value of the referenced investments will generally be offset by changes in the fair value of investments made by the Firm, there is typically a timing difference between the immediate recognition of gains and losses on the Firm’s investments and the deferred recognition of the related compensation expense over the vesting period. While this timing difference is generally not material to Income from continuing operations before income taxes in any individual period, it may impact Firm reported ratios (e.g., the Expense efficiency ratio) in certain periods. At December 31, 2020, substantially all employee notional investments that subjected the Firm to price risk were hedged.
Amounts Recognized in Compensation Expense
| | | | | | | | | | | |
| $ in millions | 2020 | 2019 | 2018 |
| Deferred cash-based awards | $ | 1,263 | | $ | 1,233 | | $ | 1,174 | |
| Return on referenced investments | 856 | | 645 | | (48) | |
| Total recognized in compensation expense | $ | 2,119 | | $ | 1,878 | | $ | 1,126 | |
Amounts Recognized in Compensation Expense by Segment
| | | | | | | | | | | |
| $ in millions | 2020 | 2019 | 2018 |
| Institutional Securities | $ | 851 | | $ | 916 | | $ | 611 | |
| Wealth Management | 1,000 | | 760 | | 346 | |
| Investment Management | 268 | | 202 | | 169 | |
| Total recognized in compensation expense | $ | 2,119 | | $ | 1,878 | | $ | 1,126 | |
Projected Future Compensation Obligation1
| | | | | |
| $ in millions | |
Award liabilities at December 31, 20202, 3 | $ | 6,247 | |
Fully vested amounts to be distributed by the end of February 20214 | (1,298) | |
Unrecognized portion of prior awards at December 31, 20203 | 1,311 | |
2020 performance year awards granted in 20213 | 290 | |
Total5 | $ | 6,550 | |
1.Amounts relate to performance years 2020 and prior.
2.Balance is reflected in Other liabilities and accrued expenses in the balance sheet as of December 31, 2020.
3.Amounts do not include assumptions regarding cancellations, accelerations or assumptions about future market conditions with respect to referenced investments.
4.Distributions after February of each year are generally immaterial.
5.Of the total projected future compensation obligation, approximately 30% relates to Institutional Securities, approximately 60% relates to Wealth Management and approximately 10% relates to Investment Management.
The previous table presents a rollforward of the Firm’s estimated projected future compensation obligation for existing deferred cash-based compensation awards, exclusive of any assumptions about future market conditions with respect to referenced investments.
Projected Future Compensation Expense1
| | | | | |
| $ in millions | |
| Estimated to be recognized in: | |
| 2021 | $ | 680 | |
| 2022 | 312 | |
| Thereafter | 609 | |
Total2 | $ | 1,601 | |
1.Amounts relate to performance years 2020 and prior.
2.Amounts do not include assumptions regarding cancellations, accelerations or assumptions about future market conditions with respect to referenced investments.
The previous table sets forth an estimate of compensation expense associated with the Projected Future Compensation Obligation. Our projected future compensation obligation and expense for deferred cash-based compensation for performance years 2020 and prior are forward-looking statements subject to uncertainty. Actual results may be materially affected by various factors, including, among other things: the performance of each participant’s referenced investments; changes in market conditions; participants’ allocation of their deferred awards; and participant cancellations or accelerations. See “Forward-Looking Statements” and “Risk Factors” for additional information.
For further information on the Firm’s deferred stock-based plans and carried interest compensation, which are excluded from the previous tables, see Notes 2 and 20 to the financial statements.
Accounting Development Updates
The Financial Accounting Standards Board has issued certain accounting updates, which we have either determined are not applicable or are not expected to have a significant impact on our financial statements.
Critical Accounting Policies
Our financial statements are prepared in accordance with U.S. GAAP, which requires us to make estimates and assumptions (see Note 1 to the financial statements). We believe that of our significant accounting policies (see Note 2 to the financial statements), the following policies involve a higher degree of judgment and complexity.
Fair Value
Financial Instruments Measured at Fair Value
A significant number of our financial instruments are carried at fair value. We make estimates regarding the valuation of assets and liabilities measured at fair value in preparing the financial statements. These assets and liabilities include, but are not limited to:
•Trading assets and Trading liabilities;
•Investment Securities—AFS;
•Certain Securities purchased under agreements to resell;
•Certain Deposits, primarily certificates of deposit;
•Certain Securities sold under agreements to repurchase;
| | | | | | | | |
| 43 | December 2020 Form 10-K |
| | | | | |
| |
| Management's Discussion and Analysis | |
•Certain Other secured financings; and
•Certain Borrowings.
Fair value is defined as the price that would be received to sell an asset or paid to transfer a liability (i.e., the exit price) in an orderly transaction between market participants at the measurement date.
In determining fair value, we use various valuation approaches. A hierarchy for inputs is used in measuring fair value that maximizes the use of observable prices and inputs and minimizes the use of unobservable prices and inputs by requiring that the relevant observable inputs be used when available. The hierarchy is broken down into three levels, wherein Level 1 represents quoted prices in active markets, Level 2 represents valuations based on quoted prices in markets that are not active or for which all significant inputs are observable, and Level 3 consists of valuation techniques that incorporate significant unobservable inputs and, therefore, require the greatest use of judgment.
In periods of market disruption, the observability of prices and inputs may be reduced for many instruments, which could cause an instrument to be recategorized from Level 1 to Level 2 or from Level 2 to Level 3. In addition, a downturn in market conditions could lead to declines in the valuation of many instruments. For further information on the definition of fair value, Level 1, Level 2, Level 3 and related valuation techniques, and quantitative information about and sensitivity of significant unobservable inputs used in Level 3 fair value measurements, see Notes 2 and 5 to the financial statements.
Where appropriate, valuation adjustments are made to account for various factors such as liquidity risk (bid-ask adjustments), credit quality, model uncertainty, concentration risk and funding in order to arrive at fair value. For a further discussion of valuation adjustments that we apply, see Note 2 to the financial statements.
Goodwill and Intangible Assets
Goodwill
We test goodwill for impairment on an annual basis as of July 1 and on an interim basis when certain events or circumstances exist. Evaluating goodwill for impairment requires management to make significant judgments. Goodwill impairment tests are performed at the reporting unit level, which is generally at the level of or one level below our business segments. Goodwill no longer retains its association with a particular acquisition once it has been assigned to a reporting unit. As such, all the activities of a reporting unit, whether acquired or organically developed, are available to support the value of the goodwill.
For both the annual and interim tests, we have the option to either (i) perform a quantitative impairment test or (ii) first perform a qualitative assessment to determine whether it is more likely than not that the fair value of a reporting unit is
less than its carrying amount, in which case the quantitative test would be performed.
When performing a quantitative impairment test, we compare the fair value of a reporting unit with its carrying amount, including goodwill. If the fair value of the reporting unit is less than its carrying amount, the goodwill impairment loss is equal to the excess of the carrying value over the fair value, limited by the carrying amount of goodwill allocated to that reporting unit.
The estimated fair value of the reporting units is derived based on valuation techniques we believe market participants would use for each of the reporting units. The estimated fair value is generally determined by utilizing a discounted cash flow methodology or methodologies that incorporate price-to-book and price-to-earnings multiples of certain comparable companies. At each annual goodwill impairment testing date, each of our reporting units with goodwill had a fair value that was substantially in excess of its carrying value.
Intangible Assets
Amortizable intangible assets are initially recorded at cost, or in the situation where acquired as part of a business combination, at the fair value determined as part of the acquisition method of accounting. Subsequently, they are carried in the balance sheets at amortized cost, where amortization is recognized over their estimated useful lives.
When certain events or circumstances exist, amortizable intangible assets are reviewed for impairment on an interim basis. An impairment exists when the carrying amount of the intangible asset exceeds its fair value. An impairment loss will be recognized if the carrying amount of the intangible asset is not recoverable and exceeds its fair value. The carrying amount of the intangible asset is not recoverable if it exceeds the sum of the expected undiscounted cash flows.
The initial valuation of an intangible asset as part of the acquisition method of accounting and the subsequent valuation of intangible assets as part of impairment assessments are subjective and based, in part, on inputs that are unobservable. These inputs include, but are not limited to, forecasted cash flows, revenue growth rates, customer attrition rates and discount rates.
For both goodwill and intangible assets, to the extent an impairment loss is recognized, the loss establishes the new cost basis of the asset. Subsequent reversal of impairment losses is not permitted. For amortizable intangible assets, the new cost basis is amortized over the remaining useful life of that asset. Adverse market or economic events could result in impairment charges in future periods.
See Notes 2, 3 and 11 to the financial statements for additional information about goodwill and intangible assets.
| | | | | | | | |
| December 2020 Form 10-K | 44 | |
| | | | | |
| |
| Management's Discussion and Analysis | |
Legal and Regulatory Contingencies
In the normal course of business, we have been named, from time to time, as a defendant in various legal actions, including arbitrations, class actions and other litigation, arising in connection with our activities as a global diversified financial services institution.
Certain of the actual or threatened legal actions include claims for substantial compensatory and/or punitive damages or claims for indeterminate amounts of damages. In some cases, the entities that would otherwise be the primary defendants in such cases are bankrupt or are in financial distress.
We are also involved, from time to time, in other reviews, investigations and proceedings (both formal and informal) by governmental and self-regulatory agencies regarding our business and involving, among other matters, sales and trading activities, wealth and investment management services, financial products or offerings sponsored, underwritten or sold by us, and accounting and operational matters, certain of which may result in adverse judgments, settlements, fines, penalties, injunctions or other relief.
Accruals for litigation and regulatory proceedings are generally determined on a case-by-case basis. Where available information indicates that it is probable a liability had been incurred at the date of the financial statements and we can reasonably estimate the amount of that loss, we accrue the estimated loss by a charge to income.
In many proceedings and investigations, however, it is inherently difficult to determine whether any loss is probable or even possible or to estimate the amount of any loss. In addition, even where a loss is possible or an exposure to loss exists in excess of the liability already accrued with respect to a previously recognized loss contingency, it is not always possible to reasonably estimate the size of the possible loss or range of loss, particularly for proceedings and investigations where the factual record is being developed or contested or where plaintiffs or government entities seek substantial or indeterminate damages, restitution, disgorgement or penalties. Numerous issues may need to be resolved before a loss or additional loss or range of loss or additional range of loss can be reasonably estimated for a proceeding or investigation, including through potentially lengthy discovery and determination of important factual matters, determination of issues related to class certification and the calculation of damages or other relief, and addressing novel or unsettled legal questions relevant to the proceedings or investigations in question.
Significant judgment is required in deciding when and if to make these accruals, and the actual cost of a legal claim or regulatory fine/penalty may ultimately be materially different from the recorded accruals.
See Note 15 to the financial statements for additional information on legal contingencies.
Income Taxes
We are subject to the income and indirect tax laws of the U.S., its states and municipalities and those of the foreign jurisdictions in which we have significant business operations. These tax laws are complex and subject to different interpretations by the taxpayer and the relevant governmental taxing authorities. We must make judgments and interpretations about the application of these inherently complex tax laws when determining the provision for income taxes and the expense for indirect taxes and must also make estimates about when certain items affect taxable income in the various tax jurisdictions.
Disputes over interpretations of the tax laws may be settled with the taxing authority upon examination or audit. We periodically evaluate the likelihood of assessments in each taxing jurisdiction resulting from current and subsequent years’ examinations, and unrecognized tax benefits related to potential losses that may arise from tax audits are established in accordance with the relevant accounting guidance. Once established, unrecognized tax benefits are adjusted when there is more information available or when an event occurs requiring a change.
Our provision for income taxes is composed of current and deferred taxes. Current income taxes approximate taxes to be paid or refunded for the current period. Deferred income taxes reflect the net tax effects of temporary differences between the financial reporting and tax bases of assets and liabilities and are measured using the applicable enacted tax rates and laws that will be in effect when such differences are expected to reverse.
Our deferred tax balances may also include deferred assets related to tax attribute carryforwards, such as net operating losses and tax credits that will be realized through reduction of future tax liabilities and, in some cases, are subject to expiration if not utilized within certain periods. We perform regular reviews to ascertain whether deferred tax assets are realizable. These reviews include management’s estimates and assumptions regarding future taxable income and incorporate various tax planning strategies, including strategies that may be available to tax attribute carryforwards before they expire.
Once the deferred tax asset balances have been determined, we may record a valuation allowance against the deferred tax asset balances to reflect the amount we estimate is more likely than not to be realized at a future date. Both current and deferred income taxes may reflect adjustments related to our unrecognized tax benefits.
Significant judgment is required in estimating the consolidated provision for (benefit from) income taxes, current and deferred tax balances (including valuation allowance, if any), accrued interest or penalties and uncertain tax positions. Revisions in estimates and/or the actual costs of
| | | | | | | | |
| 45 | December 2020 Form 10-K |
| | | | | |
| |
| Management's Discussion and Analysis | |
a tax assessment may ultimately be materially different from the recorded accruals and unrecognized tax benefits, if any.
See Note 2 to the financial statements for additional information on our significant assumptions, judgments and interpretations associated with the accounting for income taxes and Note 22 to the financial statements for additional information on our tax examinations.
Liquidity and Capital Resources
Senior management, with oversight by the Asset/Liability Management Committee and the Board of Directors (“Board”), establishes and maintains our liquidity and capital policies. Through various risk and control committees, senior management reviews business performance relative to these policies, monitors the availability of alternative sources of financing, and oversees the liquidity, interest rate and currency sensitivity of our asset and liability position. Our Treasury department, Firm Risk Committee, Asset/Liability Management Committee, and other committees and control groups assist in evaluating, monitoring and controlling the impact that our business activities have on our balance sheet, liquidity and capital structure. Liquidity and capital matters are reported regularly to the Board and the Risk Committee of the Board.
Balance Sheet
We monitor and evaluate the composition and size of our balance sheet on a regular basis. Our balance sheet management process includes quarterly planning, business-specific thresholds, monitoring of business-specific usage versus key performance metrics and new business impact assessments.
We establish balance sheet thresholds at the consolidated and business segment levels. We monitor balance sheet utilization and review variances resulting from business activity and market fluctuations. On a regular basis, we review current performance versus established thresholds and assess the need to re-allocate our balance sheet based on business unit needs. We also monitor key metrics, including asset and liability size and capital usage.
Total Assets by Business Segment
| | | | | | | | | | | | | | |
| At December 31, 2020 |
| $ in millions | IS | WM | IM | Total |
| Assets | | | | |
| Cash and cash equivalents | $ | 74,281 | | $ | 31,275 | | $ | 98 | | $ | 105,654 | |
| Trading assets at fair value | 308,413 | | 280 | | 4,045 | | 312,738 | |
| Investment securities | 41,630 | | 140,524 | | — | | 182,154 | |
| Securities purchased under agreements to resell | 84,998 | | 31,236 | | — | | 116,234 | |
| Securities borrowed | 110,480 | | 1,911 | | — | | 112,391 | |
| Customer and other receivables | 67,085 | | 29,781 | | 871 | | 97,737 | |
Loans1 | 52,449 | | 98,130 | | 18 | | 150,597 | |
Other assets2 | 13,986 | | 22,458 | | 1,913 | | 38,357 | |
| Total assets | $ | 753,322 | | $ | 355,595 | | $ | 6,945 | | $ | 1,115,862 | |
| | | | | | | | | | | | | | |
| | At December 31, 2019 |
| $ in millions | IS | WM | IM | Total |
| Assets | | | | |
| Cash and cash equivalents | $ | 67,657 | | $ | 14,247 | | $ | 267 | | $ | 82,171 | |
| Trading assets at fair value | 293,477 | | 47 | | 3,586 | | 297,110 | |
| Investment securities | 38,524 | | 67,201 | | — | | 105,725 | |
| Securities purchased under agreements to resell | 80,744 | | 7,480 | | — | | 88,224 | |
| Securities borrowed | 106,199 | | 350 | | — | | 106,549 | |
| Customer and other receivables | 39,743 | | 15,190 | | 713 | | 55,646 | |
Loans1 | 50,557 | | 80,075 | | 5 | | 130,637 | |
Other assets2 | 14,300 | | 13,092 | | 1,975 | | 29,367 | |
| Total assets | $ | 691,201 | | $ | 197,682 | | $ | 6,546 | | $ | 895,429 | |
IS—Institutional Securities
WM—Wealth Management
IM—Investment Management
1.Amounts include loans held for investment, net of allowance, and loans held for sale but exclude loans at fair value, which are included in Trading assets in the balance sheets (see Note 10 to the financial statements).
2.Other assets primarily includes Goodwill and Intangible assets, premises, equipment and software, ROU assets related to leases, other investments, and deferred tax assets.
A substantial portion of total assets consists of liquid marketable securities and short-term receivables. In the Institutional Securities business segment, these arise from sales and trading activities, and in the Wealth Management business segment, these arise from banking activities, including management of the investment portfolio, comprising Investment securities, Cash and cash equivalents and Securities purchased under agreements to resell. Total assets increased to $1,116 billion at December 31, 2020 compared with $895 billion at December 31, 2019.
Wealth Management’s assets increased primarily from the acquisition of E*TRADE, as well as growth in Loans and increases in the investment portfolio as a result of significantly higher deposits.
Institutional Securities’ assets were also higher, reflecting increases within Customer and other receivables, principally within Equity financing, and Trading assets, primarily U.S. Treasury and agency securities.
Liquidity Risk Management Framework
The primary goal of our Liquidity Risk Management Framework is to ensure that we have access to adequate funding across a wide range of market conditions and time horizons. The framework is designed to enable us to fulfill our financial obligations and support the execution of our business strategies.
The following principles guide our Liquidity Risk Management Framework:
•Sufficient Liquidity Resources should be maintained to cover maturing liabilities and other planned and contingent outflows;
•Maturity profile of assets and liabilities should be aligned, with limited reliance on short-term funding;
•Source, counterparty, currency, region and term of funding should be diversified; and
| | | | | | | | |
| December 2020 Form 10-K | 46 | |
| | | | | |
| |
| Management's Discussion and Analysis | |
•Liquidity Stress Tests should anticipate, and account for, periods of limited access to funding.
The core components of our Liquidity Risk Management Framework are the Required Liquidity Framework, Liquidity Stress Tests and Liquidity Resources, which support our target liquidity profile.
Required Liquidity Framework
Our Required Liquidity Framework establishes the amount of liquidity we must hold in both normal and stressed environments to ensure that our financial condition and overall soundness are not adversely affected by an inability (or perceived inability) to meet our financial obligations in a timely manner. The Required Liquidity Framework considers the most constraining liquidity requirement to satisfy all regulatory and internal limits at a consolidated and legal entity level.
Liquidity Stress Tests
We use Liquidity Stress Tests to model external and intercompany liquidity flows across multiple scenarios and a range of time horizons. These scenarios contain various combinations of idiosyncratic and systemic stress events of different severity and duration. The methodology, implementation, production and analysis of our Liquidity Stress Tests are important components of the Required Liquidity Framework.
The assumptions used by us in our various Liquidity Stress Test scenarios include, but are not limited to, the following:
•No government support;
•No access to equity and unsecured debt markets;
•Repayment of all unsecured debt maturing within the stress horizon;
•Higher haircuts for and significantly lower availability of secured funding;
•Additional collateral that would be required by trading counterparties, certain exchanges and clearing organizations related to credit rating downgrades;
•Additional collateral that would be required due to collateral substitutions, collateral disputes and uncalled collateral;
•Discretionary unsecured debt buybacks;
•Drawdowns on lending commitments provided to third parties; and
•Client cash withdrawals and reduction in customer short positions that fund long positions.
Liquidity Stress Tests are produced and results are reported at different levels, including major operating subsidiaries and major currencies, to capture specific cash requirements and cash availability across the Firm, including a limited number of asset sales in a stressed environment. The Liquidity Stress Tests assume that subsidiaries will use their own liquidity first to fund their obligations before drawing liquidity from the Parent Company and that the Parent Company will support its
subsidiaries and will not have access to subsidiaries’ liquidity reserves. In addition to the assumptions underpinning the Liquidity Stress Tests, we take into consideration settlement risk related to intraday settlement and clearing of securities and financing activities.
At December 31, 2020 and December 31, 2019, we maintained sufficient Liquidity Resources to meet current and contingent funding obligations as modeled in our Liquidity Stress Tests.
Liquidity Resources
We maintain sufficient liquidity resources, which consist of HQLA and cash deposits with banks (“Liquidity Resources”) to cover daily funding needs and to meet strategic liquidity targets sized by the Required Liquidity Framework and Liquidity Stress Tests. The total amount of Liquidity Resources is actively managed by us considering the following components: unsecured debt maturity profile; balance sheet size and composition; funding needs in a stressed environment, inclusive of contingent cash outflows; legal entity, regional and segment liquidity requirements; regulatory requirements; and collateral requirements.
The amount of Liquidity Resources we hold is based on our risk tolerance and is subject to change depending on market and Firm-specific events. The Liquidity Resources are primarily held within the Parent Company and its major operating subsidiaries. The Total HQLA values in the tables immediately following are different from Eligible HQLA, which, in accordance with the LCR rule, also takes into account certain regulatory weightings and other operational considerations.
Liquidity Resources by Type of Investment1
| | | | | | | | |
| $ in millions | At
December 31,
2020 | At
December 31,
2019 |
| Cash deposits with central banks | $ | 49,669 | | $ | 35,025 | |
Unencumbered HQLA securities2: | | |
| U.S. government obligations | 136,555 | | 88,754 | |
| U.S. agency and agency mortgage-backed securities | 99,659 | | 50,732 | |
Non-U.S. sovereign obligations3 | 39,745 | | 29,909 | |
| Other investment grade securities | 2,053 | | 1,591 | |
Total HQLA2 | $ | 327,681 | | $ | 206,011 | |
| Cash deposits with banks (non-HQLA) | 10,942 | | 9,857 | |
| Total Liquidity Resources | $ | 338,623 | | $ | 215,868 | |
1.In the first quarter of 2020, we changed our internal measure of liquidity from the Global Liquidity Reserve to Liquidity Resources, which is more closely aligned with the regulatory definition of HQLA. Prior periods have been recast to conform to the current presentation.
2.HQLA is presented prior to applying weightings and includes all HQLA held in subsidiaries.
3.Primarily composed of unencumbered U.K., Japanese, French, German and Dutch government obligations.
| | | | | | | | |
| 47 | December 2020 Form 10-K |
| | | | | |
| |
| Management's Discussion and Analysis | |
Liquidity Resources by Bank and Non-Bank Legal Entities1
| | | | | | | | | | | |
| At
December 31,
2020 | At
December 31,
2019 | Average Daily Balance
Three Months Ended |
| $ in millions | December 31, 2020 |
Bank legal entities | | |
| Domestic | $ | 178,033 | | $ | 75,894 | | $ | 166,516 | |
| Foreign | 7,670 | | 4,049 | | 7,423 | |
Total Bank legal entities | 185,703 | | 79,943 | | 173,939 | |
| Non-Bank legal entities | | |
| Domestic: | | | |
| Parent Company | 59,468 | | 53,128 | | 59,803 | |
| Non-Parent Company | 33,368 | | 28,905 | | 34,712 | |
| Total Domestic | 92,836 | | 82,033 | | 94,515 | |
| Foreign | 60,084 | | 53,892 | | 57,364 | |
Total Non-Bank legal entities | 152,920 | | 135,925 | | 151,879 | |
| Total Liquidity Resources | $ | 338,623 | | $ | 215,868 | | $ | 325,818 | |
1. In the first quarter of 2020, we changed our internal measure of liquidity from the Global Liquidity Reserve to Liquidity Resources, which is more closely aligned with the regulatory definition of HQLA. Prior periods have been recast to conform to the current presentation.
Liquidity Resources may fluctuate from period to period based on the overall size and composition of our balance sheet, the maturity profile of our unsecured debt and estimates of funding needs in a stressed environment, among other factors. Liquidity Resources increased in 2020 primarily due to an increase in deposits, including incremental deposits as a result of the E*TRADE acquisition.
Regulatory Liquidity Framework
Liquidity Coverage Ratio
The Firm, MSBNA and MSPBNA are required to comply with, and subject to a transition period, ETB will be required to comply with, LCR requirements, including a requirement to calculate each entity’s LCR on each business day. The requirements are designed to ensure that banking organizations have sufficient Eligible HQLA to cover net cash outflows arising from significant stress over 30 calendar days, thus promoting the short-term resilience of the liquidity risk profile of banking organizations. In determining Eligible HQLA for LCR purposes, weightings (or asset haircuts) are applied to HQLA, and certain HQLA held in subsidiaries is excluded.
As of December 31, 2020, the Firm, MSBNA and MSPBNA are compliant with the minimum required LCR of 100%.
Liquidity Coverage Ratio
| | | | | | | | |
| | Average Daily Balance
Three Months Ended |
| $ in millions | December 31, 2020 | September 30, 2020 |
Eligible HQLA1 | | |
| Cash deposits with central banks | $ | 43,596 | | $ | 36,481 | |
Securities2 | 162,509 | | 170,817 | |
Total Eligible HQLA1 | $ | 206,105 | | $ | 207,298 | |
| LCR | 129 | % | 136 | % |
1.Under the LCR rule, Eligible HQLA is calculated using weightings and excluding certain HQLA held in subsidiaries.
2.Primarily includes U.S. Treasuries, U.S. agency mortgage-backed securities, sovereign bonds and investment grade corporate bonds.
Net Stable Funding Ratio
The U.S. banking agencies have finalized a rule to implement the NSFR, which requires large banking organizations to maintain sufficiently stable sources of funding over a one-year time horizon, and will apply to us, MSBNA, MSPBNA and ETB. These requirements become effective on July 1, 2021 and we will be in compliance with the final rule by the effective date.
Funding Management
We manage our funding in a manner that reduces the risk of disruption to our operations. We pursue a strategy of diversification of secured and unsecured funding sources (by product, investor and region) and attempt to ensure that the tenor of our liabilities equals or exceeds the expected holding period of the assets being financed.
We fund our balance sheet on a global basis through diverse sources. These sources include our equity capital, borrowings, securities sold under agreements to repurchase, securities lending, deposits, letters of credit and lines of credit. We have active financing programs for both standard and structured products targeting global investors and currencies.
Secured Financing
The liquid nature of the marketable securities and short-term receivables arising principally from sales and trading activities in the Institutional Securities business segment provides us with flexibility in managing the composition and size of our balance sheet. Our goal is to achieve an optimal mix of durable secured and unsecured financing. Secured financing investors principally focus on the quality of the eligible collateral posted. Accordingly, we actively manage our secured financings based on the quality of the assets being funded.
We have established longer tenor secured funding requirements for less liquid asset classes, for which funding may be at risk in the event of a market disruption. We define highly liquid assets as government-issued or government-guaranteed securities with a high degree of fundability and less liquid assets as those that do not meet these criteria.
| | | | | | | | |
| December 2020 Form 10-K | 48 | |
| | | | | |
| |
| Management's Discussion and Analysis | |
To further minimize the refinancing risk of secured financing for less liquid assets, we have established concentration limits to diversify our investor base and reduce the amount of monthly maturities for secured financing of less liquid assets. Furthermore, we obtain term secured funding liabilities in excess of less liquid inventory as an additional risk mitigant to replace maturing trades in the event that secured financing markets, or our ability to access them, become limited. As a component of the Liquidity Risk Management Framework, we hold a portion of our Liquidity Resources against the potential disruption to our secured financing capabilities.
We generally maintain a pool of liquid and easily fundable securities, which takes into account HQLA classifications consistent with LCR definitions, and other regulatory requirements, and provides a valuable future source of liquidity.
Collateralized Financing Transactions
| | | | | | | | |
| $ in millions | At
December 31,
2020 | At
December 31,
2019 |
Securities purchased under agreements to resell and Securities borrowed | $ | 228,625 | | $ | 194,773 | |
Securities sold under agreements to repurchase and Securities loaned | $ | 58,318 | | $ | 62,706 | |
Securities received as collateral1 | $ | 4,277 | | $ | 13,022 | |
| | | | | | | | |
| | Average Daily Balance
Three Months Ended |
| $ in millions | December 31, 2020 | December 31, 2019 |
Securities purchased under agreements to resell and Securities borrowed | $ | 195,376 | | $ | 210,257 | |
Securities sold under agreements to repurchase and Securities loaned | $ | 54,528 | | $ | 64,870 | |
1.Included within Trading assets in the balance sheets.
See “Total Assets by Business Segment” herein for more details on the assets shown in the previous table and Notes 2 and 9 to the financial statements for more details on collateralized financing transactions.
In addition to the collateralized financing transactions shown in the previous table, we engage in financing transactions collateralized by customer-owned securities, which are segregated in accordance with regulatory requirements. Receivables under these financing transactions, primarily margin loans, are included in Customer and other receivables in the balance sheets, and payables under these financing transactions, primarily to prime brokerage customers, are included in Customer and other payables in the balance sheets. Our risk exposure on these transactions is mitigated by collateral maintenance policies and the elements of our Liquidity Risk Management Framework.
Unsecured Financing
We view deposits and borrowings as stable sources of funding for unencumbered securities and non-security assets. Our unsecured financings include borrowings and certificates of deposit carried at fair value, which are primarily composed of:
instruments whose payments and redemption values are linked to the performance of a specific index, a basket of stocks, a specific equity security, a commodity, a credit exposure or basket of credit exposures; and instruments with various interest-rate-related features, including step-ups, step-downs and zero coupons. As part of our asset/liability management strategy, when appropriate, we use derivatives to make adjustments to the interest rate risk profile of our borrowings (see Notes 7 and 14 to the financial statements).
Deposits
| | | | | | | | |
| $ in millions | At
December 31,
2020 | At
December 31,
2019 |
| Savings and demand deposits: | | |
Brokerage sweep deposits1 | $ | 232,071 | | $ | 121,077 | |
Savings and other | 47,150 | | 28,388 | |
| Total Savings and demand deposits | 279,221 | | 149,465 | |
| Time deposits | 31,561 | | 40,891 | |
Total2 | $ | 310,782 | | $ | 190,356 | |
1.Amounts represent balances swept from client brokerage accounts.
2.Excludes approximately $25 billion of off-balance sheet deposits at unaffiliated financial institutions as of December 31, 2020. Client cash held by third parties is not reflected in our balance sheets and is not immediately available for liquidity purposes.
Deposits are primarily sourced from our Wealth Management clients and are considered to have stable, low-cost funding characteristics. Total deposits increased in 2020, primarily driven by increases in brokerage sweep and savings deposits, including incremental deposits as a result of the acquisition of E*TRADE.
Borrowings by Remaining Maturity at December 31, 20201
| | | | | | | | | | | |
| $ in millions | Parent
Company | Subsidiaries | Total |
Original maturities of one year or less | $ | 1 | | $ | 3,690 | | $ | 3,691 | |
| Original maturities greater than one year |
| 2021 | $ | 17,670 | | $ | 6,571 | | $ | 24,241 | |
| 2022 | 16,612 | | 5,597 | | 22,209 | |
| 2023 | 17,152 | | 5,738 | | 22,890 | |
| 2024 | 16,109 | | 5,618 | | 21,727 | |
| 2025 | 11,336 | | 7,300 | | 18,636 | |
| Thereafter | 80,943 | | 22,742 | | 103,685 | |
| Total | $ | 159,822 | | $ | 53,566 | | $ | 213,388 | |
| Total Borrowings | $ | 159,823 | | $ | 57,256 | | $ | 217,079 | |
1.Original maturity in the table is generally based on contractual final maturity. For borrowings with put options, remaining maturity represents the earliest put date.
Borrowings of $217 billion as of December 31, 2020 increased compared with $193 billion at December 31, 2019, primarily as a result of issuances net of maturities and redemptions, as well as fair value adjustments.
We believe that accessing debt investors through multiple distribution channels helps provide consistent access to the unsecured markets. In addition, the issuance of borrowings with original maturities greater than one year allows us to reduce reliance on short-term credit sensitive instruments. Borrowings with original maturities greater than one year are generally managed to achieve staggered maturities, thereby
| | | | | | | | |
| 49 | December 2020 Form 10-K |
| | | | | |
| |
| Management's Discussion and Analysis | |
mitigating refinancing risk, and to maximize investor diversification through sales to global institutional and retail clients across regions, currencies and product types.
The availability and cost of financing to us can vary depending on market conditions, the volume of certain trading and lending activities, our credit ratings and the overall availability of credit. We also engage in, and may continue to engage in, repurchases of our borrowings in the ordinary course of business.
For further information on Borrowings, see Note 14 to the financial statements.
Credit Ratings
We rely on external sources to finance a significant portion of our daily operations. The cost and availability of financing generally are impacted by our credit ratings, among other things. In addition, our credit ratings can have an impact on certain trading revenues, particularly in those businesses where longer-term counterparty performance is a key consideration, such as certain OTC derivative transactions. When determining credit ratings, rating agencies consider both company-specific and industry-wide factors. These include regulatory or legislative changes, the macroeconomic environment and perceived levels of support, among other things. See also “Risk Factors— Liquidity Risk.”
Parent Company, MSBNA and MSPBNA Issuer Ratings at February 19, 2021
| | | | | | | | | | | |
| Parent Company |
| Short-Term
Debt | Long-Term
Debt | Rating
Outlook |
| DBRS, Inc. | R-1 (middle) | A (high) | Stable |
| Fitch Ratings, Inc. | F1 | A | Stable |
| Moody’s Investors Service, Inc. | P-1 | A1 | Stable |
Rating and Investment Information, Inc. | a-1 | A | Stable |
| S&P Global Ratings | A-2 | BBB+ | Stable |
| | | | | | | | | | | |
| MSBNA |
| Short-Term
Debt | Long-Term
Debt | Rating
Outlook |
| Fitch Ratings, Inc. | F1 | A+ | Stable |
| Moody’s Investors Service, Inc. | P-1 | Aa3 | Stable |
| S&P Global Ratings | A-1 | A+ | Stable |
| | | | | | | | | | | |
| MSPBNA |
| Short-Term
Debt | Long-Term
Debt | Rating
Outlook |
| Moody’s Investors Service, Inc. | P-1 | Aa3 | Stable |
| S&P Global Ratings | A-1 | A+ | Stable |
On October 2, 2020, Moody’s Investors Service, Inc. (“Moody’s”) upgraded the issuer ratings of the Parent Company from A3 to A2, and MSBNA and MSPBNA from A1 to Aa3. On January 27, 2021, Moody's upgraded the issuer ratings of the Parent Company from A2 to A1.
On November 20, 2020, Fitch Ratings, Inc. revised the Parent Company and MSBNA outlooks from Negative to Stable.
Incremental Collateral or Terminating Payments
In connection with certain OTC derivatives and certain other agreements where we are a liquidity provider to certain financing vehicles associated with the Institutional Securities business segment, we may be required to provide additional collateral, immediately settle any outstanding liability balances with certain counterparties or pledge additional collateral to certain clearing organizations in the event of a future credit rating downgrade irrespective of whether we are in a net asset or net liability position. See Note 7 to the financial statements for additional information on OTC derivatives that contain such contingent features.
While certain aspects of a credit rating downgrade are quantifiable pursuant to contractual provisions, the impact it would have on our business and results of operations in future periods is inherently uncertain and would depend on a number of interrelated factors, including, among other things, the magnitude of the downgrade, the rating relative to peers, the rating assigned by the relevant agency pre-downgrade, individual client behavior and future mitigating actions we might take. The liquidity impact of additional collateral requirements is included in our Liquidity Stress Tests.
Capital Management
We view capital as an important source of financial strength and actively manage our consolidated capital position based upon, among other things, business opportunities, risks, capital availability and rates of return together with internal capital policies, regulatory requirements and rating agency guidelines. In the future, we may expand or contract our capital base to address the changing needs of our businesses.
Common Stock Repurchases
| | | | | | | | | | | |
| in millions, except for per share data | 2020 | 2019 | 2018 |
| Number of shares | 29 | | 121 | | 97 | |
| Average price per share | $ | 46.01 | | $ | 44.23 | | $ | 50.08 | |
| Total | $ | 1,347 | | $ | 5,360 | | $ | 4,860 | |
For additional information on our common stock repurchases, see “Liquidity and Capital Resources—Regulatory Requirements—Capital Action Supervisory Restrictions” herein.
For further information on our common stock repurchases, see Note 18 to the financial statements.
For a description of our capital plan, see “Liquidity and Capital Resources—Regulatory Requirements—Capital Plans, Stress Tests and the Stress Capital Buffer” herein.
Common Stock Dividend Announcement
| | | | | |
| Announcement date | January 20, 2021 |
| Amount per share | $0.35 |
| Date paid | February 12, 2021 |
| Shareholders of record as of | January 29, 2021 |
| | | | | | | | |
| December 2020 Form 10-K | 50 | |
| | | | | |
| |
| Management's Discussion and Analysis | |
For additional information on our common stock dividends, see “Liquidity and Capital Resources—Regulatory Requirements—Capital Action Supervisory Restrictions” herein.
Preferred Stock Dividend Announcement
| | | | | |
| Announcement date | December 15, 2020 |
| Date paid | January 15, 2021 |
| Shareholders of record as of | December 31, 2020 |
For additional information on common and preferred stock, see Note 18 to the financial statements.
Off-Balance Sheet Arrangements and Contractual Obligations
Off-Balance Sheet Arrangements
We enter into various off-balance sheet arrangements, including through unconsolidated SPEs and lending-related financial instruments (e.g., guarantees and commitments), primarily in connection with the Institutional Securities and Investment Management business segments.
We utilize SPEs primarily in connection with securitization activities. For information on our securitization activities, see Note 16 to the financial statements.
For information on our commitments, obligations under certain guarantee arrangements and indemnities, see Note 15 to the financial statements. For further information on our lending commitments, see “Quantitative and Qualitative Disclosures about Risk—Credit Risk—Loans and Lending Commitments” herein.
Contractual Obligations
| | | | | | | | | | | | | | | | | |
| | At December 31, 2020 |
| | Payments Due in: |
| $ in millions | 2021 | 2022-2023 | 2024-2025 | Thereafter | Total |
Borrowings1 | $ | 24,241 | | $ | 45,099 | | $ | 40,363 | | $ | 103,685 | | $ | 213,388 | |
Other secured financings1 | 1,655 | | 1,684 | | 134 | | 408 | | 3,881 | |
Contractual interest payments2 | 3,952 | | 6,714 | | 5,254 | | 15,886 | | 31,806 | |
| Time deposits—principal and interest payments | 18,681 | | 9,075 | | 3,496 | | 513 | | 31,765 | |
Operating leases— premises3 | 841 | | 1,533 | | 1,171 | | 2,685 | | 6,230 | |
Purchase obligations4 | 1,297 | | 1,037 | | 319 | | 175 | | 2,828 | |
Total5 | $ | 50,667 | | $ | 65,142 | | $ | 50,737 | | $ | 123,352 | | $ | 289,898 | |
1.Amounts presented for Borrowings and Other secured financings are financings with original maturities greater than one year. For further information on Borrowings and Other secured financings, see Note 14 to the financial statements.
2.Amounts represent estimated future contractual interest payments related to certain unsecured borrowings with original maturities greater than one year based on applicable interest rates at December 31, 2020. For additional information on borrowings carried at fair value, see Note 14 to the financial statements.
3.For further information on operating leases covering premises and equipment, see Note 12 to the financial statements.
4.Purchase obligations for goods and services include payments for, among other things, consulting, outsourcing, computer and telecommunications maintenance agreements, and certain transmission, transportation and storage contracts related to the commodities business.
5.Amounts exclude unrecognized tax benefits, as the timing and amount of future cash payments are not determinable at this time (see Note 22 to the financial statements for further information).
Regulatory Requirements
Regulatory Capital Framework
We are an FHC under the Bank Holding Company Act of 1956, as amended (“BHC Act”), and are subject to the regulation and oversight of the Federal Reserve. The Federal Reserve establishes capital requirements for us, including “well-capitalized” standards, and evaluates our compliance with such capital requirements. Regulatory capital requirements established by the Federal Reserve are largely based on the Basel III capital standards established by the Basel Committee and also implement certain provisions of the Dodd-Frank Wall Street Reform and Consumer Protection Act (“Dodd-Frank Act”). The OCC establishes similar capital requirements and standards for our U.S. Bank Subsidiaries. For us to remain an FHC, we must remain well-capitalized in accordance with standards established by the Federal Reserve, and our U.S. Bank Subsidiaries must remain well-capitalized in accordance with standards established by the OCC. For additional information on regulatory capital requirements for our U.S. Bank Subsidiaries, see Note 17 to the financial statements.
Regulatory Capital Requirements
We are required to maintain minimum risk-based and leverage-based capital and TLAC ratios. For additional information on TLAC, see “Total Loss-Absorbing Capacity, Long-Term Debt and Clean Holding Company Requirements” herein.
| | | | | | | | |
| 51 | December 2020 Form 10-K |
| | | | | |
| |
| Management's Discussion and Analysis | |
Risk-Based Regulatory Capital. Minimum risk-based capital ratio requirements apply to Common Equity Tier 1 capital, Tier 1 capital and Total capital (which includes Tier 2 capital). Capital standards require certain adjustments to, and deductions from, capital for purposes of determining these ratios.
Risk-Based Regulatory Capital Ratio Requirements
| | | | | | | | | | | | | | |
| | At
December 31,
2020 | At
December 31,
2019 |
| | Standardized | Advanced | Standardized and Advanced |
| Capital buffers | | | | |
| Capital conservation buffer | — | | 2.5 | % | 2.5 | % |
Stress capital buffer (“SCB”)1 | 5.7 | % | N/A | N/A |
G-SIB capital surcharge2 | 3.0 | % | 3.0 | % | 3.0 | % |
CCyB3 | 0% | 0% | 0% |
Capital buffer requirement4 | 8.7 | % | 5.5 | % | 5.5 | % |
| | | |
| | | | |
| | | | |
| | | | |
| | | | |
| | | | |
| | | | | | | | | | | | | | |
| | | |
| | | | |
| | | | |
| | | |
| | | |
| | | |
| | | |
| | | |
| | At
December 31,
2020 | At
December 31,
2019 |
| Regulatory Minimum | Standardized | Advanced | Standardized and Advanced |
Required ratios5 | | | | |
| Common Equity Tier 1 capital ratio | 4.5 | % | 13.2 | % | 10.0 | % | 10.0 | % |
| Tier 1 capital ratio | 6.0 | % | 14.7 | % | 11.5 | % | 11.5 | % |
| Total capital ratio | 8.0 | % | 16.7 | % | 13.5 | % | 13.5 | % |
1.For additional information on the SCB, see “Capital Plans, Stress Tests and the Stress Capital Buffer” herein.
2.For a further discussion of the G-SIB capital surcharge, see “Management’s Discussion and Analysis of Financial Condition and Results of Operations—Liquidity and Capital Resources—Regulatory Requirements—G-SIB Capital Surcharge” herein.
3.The CCyB can be set up to 2.5% but is currently set by the U.S. banking agencies at zero.
4.The capital buffer requirement represents the amount of Common Equity Tier 1 capital we must maintain above the minimum risk-based capital requirements in order to avoid restrictions on our ability to make capital distributions, including the payment of dividends and the repurchase of stock, and to pay discretionary bonuses to executive officers. Beginning October 1, 2020, our Standardized Approach capital buffer requirement is equal to the sum of our SCB, G-SIB capital surcharge and CCyB, and our Advanced Approach capital buffer requirement is equal to our 2.5% capital conservation buffer, G-SIB capital surcharge and CCyB.
5.Required ratios under the Standardized and Advanced Approaches represent the regulatory minimum plus the capital buffer requirement.
Risk-Weighted Assets. RWA reflects both our on- and off-balance sheet risk, as well as capital charges attributable to the risk of loss arising from the following:
•Credit risk: The failure of a borrower, counterparty or issuer to meet its financial obligations to us;
•Market risk: Adverse changes in the level of one or more market prices, rates, indices, volatilities, correlations or other market factors, such as market liquidity; and
•Operational risk: Inadequate or failed processes or systems, from human factors or from external events (e.g., fraud, theft, legal and compliance risks, cyber attacks or damage to physical assets).
Our risk-based capital ratios are computed under both (i) the standardized approaches for calculating credit risk and market risk RWA (“Standardized Approach”) and (ii) the applicable advanced approaches for calculating credit risk, market risk and operational risk RWA (“Advanced Approach”). The credit risk RWA calculations between the two approaches differ in that the Standardized Approach requires calculation of RWA using prescribed risk weights, whereas the Advanced Approach utilizes models to calculate exposure amounts and risk weights.
Leverage-Based Regulatory Capital. Minimum leverage-based capital requirements include a Tier 1 leverage ratio and an SLR. We are required to maintain an SLR of 5%, inclusive of an enhanced SLR capital buffer of at least 2%.
As of December 31, 2020, our risk-based and leverage-based capital amounts and ratios, as well as RWA, adjusted average assets and supplementary leverage exposure are calculated excluding the effect of the adoption of CECL based on our election to defer this effect over a five-year transition period. For further information, see “Liquidity and Capital Resources —Regulatory Requirements—Regulatory Developments” herein.
Regulatory Capital Ratios
| | | | | | | | | | | | | | |
| | Standardized | Advanced |
| | Required Ratio1 | At
December 31,
2020 | Required Ratio1 | At
December 31,
2020 |
| $ in millions |
| Risk-based capital | | | | |
| Common Equity Tier 1 capital | | $ | 78,650 | | | $ | 78,650 | |
| Tier 1 capital | | 88,079 | | | 88,079 | |
| Total capital | | 97,213 | | | 96,994 | |
| Total RWA | | 453,106 | | | 445,151 | |
| Common Equity Tier 1 capital ratio | 13.2 | % | 17.4 | % | 10.0 | % | 17.7 | % |
| Tier 1 capital ratio | 14.7 | % | 19.4 | % | 11.5 | % | 19.8 | % |
| Total capital ratio | 16.7 | % | 21.5 | % | 13.5 | % | 21.8 | % |
| | | | |
| $ in millions | | | Required
Ratio1 | At
December 31,
2020 |
| Leverage-based capital | | | |
Adjusted average assets2 | | | $ | 1,053,310 | |
| Tier 1 leverage ratio | | 4.0 | % | 8.4 | % |
Supplementary leverage exposure3, 4 | | $ | 1,192,506 | |
SLR4 | | | 5.0 | % | 7.4 | % |
| | | | | | | | |
| December 2020 Form 10-K | 52 | |
| | | | | |
| |
| Management's Discussion and Analysis | |
| | | | | | | | | | | |
| At December 31, 2019 |
| Required Ratio1 | |
| $ in millions | Standardized | Advanced |
| Risk-based capital | | | |
| Common Equity Tier 1 capital | | $ | 64,751 | | $ | 64,751 | |
| Tier 1 capital | | 73,443 | | 73,443 | |
| Total capital | | 82,708 | | 82,423 | |
| Total RWA | | 394,177 | | 382,496 | |
Common Equity Tier 1 capital ratio | 10.0 | % | 16.4 | % | 16.9 | % |
| Tier 1 capital ratio | 11.5 | % | 18.6 | % | 19.2 | % |
| Total capital ratio | 13.5 | % | 21.0 | % | 21.5 | % |
| | | |
| $ in millions | | Required Ratio1 | At
December 31,
2019 |
| Leverage-based capital | | | |
Adjusted average assets2 | | | $ | 889,195 | |
| Tier 1 leverage ratio | | 4.0 | % | 8.3 | % |
Supplementary leverage exposure3 | | $ | 1,155,177 | |
| SLR | | 5.0 | % | 6.4 | % |
1.Required ratios are inclusive of any buffers applicable as of the date presented. Failure to maintain the buffers would result in restrictions on our ability to make capital distributions, including the payment of dividends and the repurchase of stock, and to pay discretionary bonuses to executive officers.
2.Adjusted average assets represents the denominator of the Tier 1 leverage ratio and is composed of the average daily balance of consolidated on-balance sheet assets for the quarters ending on the respective balance sheet dates, reduced by disallowed goodwill, intangible assets, investments in covered funds, defined benefit pension plan assets, after-tax gain on sale from assets sold into securitizations, investments in our own capital instruments, certain deferred tax assets and other capital deductions.
3.Supplementary leverage exposure is the sum of Adjusted average assets used in the Tier 1 leverage ratio and other adjustments, primarily: (i) for derivatives, potential future exposure and the effective notional principal amount of sold credit protection offset by qualifying purchased credit protection; (ii) the counterparty credit risk for repo-style transactions; and (iii) the credit equivalent amount for off-balance sheet exposures.
4.Based on a Federal Reserve interim final rule in effect until March 31, 2021, our SLR and Supplementary leverage exposure as of December 31, 2020 reflect the exclusion of U.S. Treasury securities and deposits at Federal Reserve Banks. As of December 31, 2020, the impact of the interim final rule on our SLR was an increase of 80 bps. For further information, see “Liquidity and Capital Resources—Regulatory Requirements—Regulatory Developments” herein.
Regulatory Capital
| | | | | | | | | | | |
| $ in millions | At
December 31,
2020 | At
December 31,
2019 | Change |
| Common Equity Tier 1 capital | | |
| Common stock and surplus | $ | 15,799 | | $ | 5,228 | | $ | 10,571 | |
| Retained earnings | 78,978 | | 70,589 | | 8,389 | |
| AOCI | (1,962) | | (2,788) | | 826 | |
| Regulatory adjustments and deductions: | | |
| Net goodwill | (11,527) | | (7,081) | | (4,446) | |
| Net intangible assets | (4,165) | | (2,012) | | (2,153) | |
Other adjustments and deductions1 | 1,527 | | 815 | | 712 | |
| Total Common Equity Tier 1 capital | $ | 78,650 | | $ | 64,751 | | $ | 13,899 | |
| Additional Tier 1 capital | | | |
| Preferred stock | $ | 9,250 | | $ | 8,520 | | $ | 730 | |
| Noncontrolling interests | 619 | | 607 | | 12 | |
| Additional Tier 1 capital | $ | 9,869 | | $ | 9,127 | | $ | 742 | |
Deduction for investments in covered funds | (440) | | (435) | | (5) | |
| Total Tier 1 capital | $ | 88,079 | | $ | 73,443 | | $ | 14,636 | |
| Standardized Tier 2 capital | | |
| Subordinated debt | $ | 7,737 | | $ | 8,538 | | $ | (801) | |
| Noncontrolling interests | 146 | | 143 | | 3 | |
Eligible allowance for credit losses | 1,265 | | 590 | | 675 | |
Other adjustments and deductions | (14) | | (6) | | (8) | |
Total Standardized Tier 2 capital | $ | 9,134 | | $ | 9,265 | | $ | (131) | |
| Total Standardized capital | $ | 97,213 | | $ | 82,708 | | $ | 14,505 | |
| Advanced Tier 2 capital | | | |
| Subordinated debt | $ | 7,737 | | $ | 8,538 | | $ | (801) | |
| Noncontrolling interests | 146 | | 143 | | 3 | |
| Eligible credit reserves | 1,046 | | 305 | | 741 | |
Other adjustments and deductions | (14) | | (6) | | (8) | |
Total Advanced Tier 2 capital | $ | 8,915 | | $ | 8,980 | | $ | (65) | |
| Total Advanced capital | $ | 96,994 | | $ | 82,423 | | $ | 14,571 | |
1.Other adjustments and deductions used in the calculation of Common Equity Tier 1 capital primarily includes net after-tax DVA, the credit spread premium over risk-free rate for derivative liabilities, defined benefit pension plan assets, after-tax gain on sale from assets sold into securitizations, investments in our own capital instruments and certain deferred tax assets.
The increase in Common Equity Tier 1 capital compared with December 31, 2019 was primarily the result of a net increase in Retained earnings and the impact of the E*TRADE acquisition.
| | | | | | | | |
| 53 | December 2020 Form 10-K |
| | | | | |
| |
| Management's Discussion and Analysis | |
RWA Rollforward
| | | | | | | | |
| | 2020 |
| $ in millions | Standardized | Advanced |
| Credit risk RWA | | |
| Balance at December 31, 2019 | $ | 342,684 | | $ | 228,927 | |
| Change related to the following items: | | |
| Derivatives | 17,003 | | 35,426 | |
| Securities financing transactions | (486) | | 1,921 | |
| Securitizations | (1,683) | | (3,261) | |
| Investment securities | 10,950 | | 8,587 | |
Commitments, guarantees and loans | 9,892 | | 3,745 | |
| Cash | 2,416 | | 2,678 | |
| Equity investments | 3,796 | | 4,004 | |
Other credit risk1 | 2,494 | | 2,903 | |
| Total change in credit risk RWA | $ | 44,382 | | $ | 56,003 | |
| Balance at December 31, 2020 | $ | 387,066 | | $ | 284,930 | |
| Market risk RWA | | |
| Balance at December 31, 2019 | $ | 51,493 | | $ | 51,597 | |
| Change related to the following items: | | |
| Regulatory VaR | 8,578 | | 8,578 | |
| Regulatory stressed VaR | 975 | | 975 | |
| Incremental risk charge | 1,968 | | 1,968 | |
| Comprehensive risk measure | 145 | | 41 | |
| Specific risk: | | |
| Non-securitizations | 2,938 | | 2,938 | |
| Securitizations | (57) | | (57) | |
| Total change in market risk RWA | $ | 14,547 | | $ | 14,443 | |
| Balance at December 31, 2020 | $ | 66,040 | | $ | 66,040 | |
| Operational risk RWA | | |
| Balance at December 31, 2019 | N/A | $ | 101,972 | |
| Change in operational risk RWA | N/A | (7,791) | |
| Balance at December 31, 2020 | N/A | $ | 94,181 | |
| Total RWA | $ | 453,106 | | $ | 445,151 | |
Regulatory VaR—VaR for regulatory capital requirements
1.Amounts reflect assets not in a defined category, non-material portfolios of exposures and unsettled transactions, as applicable.
Credit risk RWA increased in 2020 under both the Standardized and Advanced Approaches, primarily from an increase in Derivatives exposures driven by market volatility and an increase in Investment securities mainly as a result of the E*TRADE acquisition. The increase was also driven by Lending commitments within the Wealth Management and Institutional Securities business segments and an increase in Equity investments due to higher exposure and market value gains. In addition, credit risk RWA under the Advanced Approach increased for CVA, mainly due to increased exposure in Derivatives and higher credit spread volatility.
Market risk RWA increased in 2020 under both the Standardized and Advanced Approaches primarily due to an increase in Regulatory VaR mainly as a result of higher market volatility.
The decrease in operational risk RWA under the Advanced Approach in 2020 reflects a decline in the frequency and severity of litigation-related losses.
G-SIB Capital Surcharge
We and other U.S. G-SIBs are subject to a risk-based capital surcharge. A G-SIB must calculate its G-SIB capital surcharge under two methods and use the higher of the two surcharges. The first method considers the G-SIB’s size, interconnectedness, cross-jurisdictional activity, complexity and substitutability, which is generally consistent with the methodology developed by the Basel Committee (“Method 1”). The second method uses similar inputs but replaces substitutability with the use of short-term wholesale funding (“Method 2”) and generally results in higher surcharges than the first method. The G-SIB capital surcharge must be satisfied using Common Equity Tier 1 capital and functions as an extension of the capital conservation buffer.
Total Loss-Absorbing Capacity, Long-Term Debt and Clean Holding Company Requirements
The Federal Reserve has established external TLAC, long-term debt (“LTD”) and clean holding company requirements for top-tier BHCs of U.S. G-SIBs (“covered BHCs”), including the Parent Company. These requirements are designed to ensure that covered BHCs will have enough loss-absorbing resources at the point of failure to be recapitalized through the conversion of eligible LTD to equity or otherwise by imposing losses on eligible LTD or other forms of TLAC where an SPOE resolution strategy is used (see “Business—Supervision and Regulation—Financial Holding Company—Resolution and Recovery Planning” and “Risk Factors—Legal, Regulatory and Compliance Risk”).
These TLAC and eligible LTD requirements include various restrictions, such as requiring eligible LTD to: be issued by the covered BHC and be unsecured; have a maturity of one year or more from the date of issuance; and not contain certain embedded features, such as a principal or redemption amount subject to reduction based on the performance of an asset, entity or index, or a similar feature. In addition, the requirements provide permanent grandfathering for debt instruments issued prior to December 31, 2016 that would be eligible LTD but for having impermissible acceleration clauses or being governed by foreign law.
A covered BHC is also required to maintain minimum external TLAC equal to the greater of (i) 18% of total RWA or (ii) 7.5% of its total leverage exposure (the denominator of its SLR). In addition, covered BHCs must meet a separate external LTD requirement equal to the greater of (i) total RWA multiplied by the sum of 6% plus the higher of the Method 1 or Method 2 G-SIB capital surcharge applicable to the Parent Company, or (ii) 4.5% of its total leverage exposure.
| | | | | | | | |
| December 2020 Form 10-K | 54 | |
| | | | | |
| |
| Management's Discussion and Analysis | |
Required and Actual TLAC and Eligible LTD Ratios
| | | | | | | | | | | | | | | |
| | | | Actual
Amount/Ratio |
| | | | | |
| $ in millions | Regulatory Minimum | Required Ratio1 | At
December 31,
2020 | | At
December 31,
2019 |
External TLAC2 | | | $ | 216,129 | | | $ | 196,888 | |
| External TLAC as a % of RWA | 18.0 | % | 21.5 | % | 47.7 | % | | 49.9 | % |
| External TLAC as a % of leverage exposure | 7.5 | % | 9.5 | % | 18.1 | % | | 17.0 | % |
Eligible LTD3 | | | $ | 120,561 | | | $ | 113,624 | |
| Eligible LTD as a % of RWA | 9.0 | % | 9.0 | % | 26.6 | % | | 28.8 | % |
| Eligible LTD as a % of leverage exposure | 4.5 | % | 4.5 | % | 10.1 | % | | 9.8 | % |
1.Required ratios are inclusive of applicable buffers. The final rule imposes TLAC buffer requirements on top of both the risk-based and leverage exposure-based external TLAC minimum requirements. The risk-based TLAC buffer is equal to the sum of 2.5%, our Method 1 G-SIB surcharge and the CCyB, if any, as a percentage of total RWA. The leverage exposure-based TLAC buffer is equal to 2% of our total leverage exposure. Failure to maintain the buffers would result in restrictions on our ability to make capital distributions, including the payment of dividends and the repurchase of stock, and to pay discretionary bonuses to executive officers.
2.External TLAC consists of Common Equity Tier 1 capital and Additional Tier 1 capital (each excluding any noncontrolling minority interests), as well as eligible LTD.
3.Consists of TLAC-eligible LTD reduced by 50% for amounts of unpaid principal due to be paid in more than one year but less than two years from each respective balance sheet date.
Furthermore, under the clean holding company requirements of the final rule, a covered BHC is prohibited from incurring any external debt with an original maturity of less than one year or certain other liabilities, regardless of whether the liabilities are fully secured or otherwise senior to eligible LTD, or entering into certain other prohibited transactions. Certain other external liabilities, including those with certain embedded features noted above, are subject to a cap equal to 5% of the covered BHC’s outstanding external TLAC amount. We are in compliance with all TLAC requirements as of December 31, 2020.
Additionally, the U.S. banking agencies have issued a final rule that, among other things, modifies the regulatory capital framework for large U.S. banking organizations, including us and our U.S. Bank Subsidiaries. Under the final rule, such organizations are required to make certain deductions from regulatory capital for their investments in certain unsecured debt instruments (including eligible LTD in the TLAC framework) issued by the Parent Company and other G-SIBs. These requirements become effective on April 1, 2021, and we expect to be in compliance with the final rule by the effective date.
Capital Plans, Stress Tests and the Stress Capital Buffer
Pursuant to the Dodd-Frank Act, the Federal Reserve has adopted capital planning and stress test requirements for large BHCs, which form part of the Federal Reserve’s annual CCAR framework.
We must submit, on at least an annual basis, a capital plan to the Federal Reserve, taking into account the results of separate annual stress tests designed by us and the Federal
Reserve, so that the Federal Reserve may assess our systems and processes that incorporate forward-looking projections of revenues and losses to monitor and maintain our internal capital adequacy. As banks with less than $250 billion of total assets, our U.S. Bank Subsidiaries are not subject to company-run stress test regulatory requirements.
The capital plan must include a description of all planned capital actions over a nine-quarter planning horizon, including any issuance or redemption of a debt or equity capital instrument, any capital distribution (i.e., payments of dividends or stock repurchases) and any similar action that the Federal Reserve determines could impact our consolidated capital. The capital plan must include a discussion of how we will maintain capital above the minimum regulatory capital ratios, and how we will serve as a source of strength to our U.S. Bank Subsidiaries under supervisory stress scenarios. In addition, the Federal Reserve has issued guidance setting out its heightened expectations for capital planning practices at certain large financial institutions, including us.
In 2020, the Federal Reserve adopted a final rule to integrate its annual capital planning and stress testing requirements with existing applicable regulatory capital requirements. The final rule, which applies to certain BHCs, including us, introduced an SCB and related changes to the capital planning and stress testing processes. The final rule does not change regulatory capital requirements under the Advanced Approach, the Tier 1 leverage ratio or the SLR. However, failure to meet Advanced Approach or SLR regulatory capital requirements, inclusive of applicable capital buffers, would also result in automatic capital distribution limitations.
The SCB applies only with respect to Standardized Approach risk-based capital requirements and replaces the existing Common Equity Tier 1 capital conservation buffer of 2.5%. The SCB is the greater of (i) the maximum decline in our Common Equity Tier 1 capital ratio under the severely adverse scenario over the supervisory stress test measurement period plus the sum of the four quarters of planned common stock dividends divided by the projected RWAs from the quarter in which the Firm’s projected Common Equity Tier 1 capital ratio reaches its minimum in the supervisory stress test and (ii) 2.5%.
Under the SCB final rule, the supervisory stress test now assumes that BHCs generally maintain a constant level of assets and RWAs throughout the projection period. In addition, it no longer assumes that BHCs make all planned capital distributions, although the SCB incorporates the amount of four quarters of planned common stock dividends. Similarly, the final rule eliminates the annual process in which the Federal Reserve provided its objection or non-objection to a firm’s capital plan, given the integration of stress test results into automatic distribution limitations resulting from failure to meet SCB requirements. Federal Reserve approval for capital actions is still required in some specific circumstances.
| | | | | | | | |
| 55 | December 2020 Form 10-K |
| | | | | |
| |
| Management's Discussion and Analysis | |
A firm’s SCB is subject to revision each year, with effect from October 1, to reflect the results of the Federal Reserve's annual supervisory stress test. The Federal Reserve has discretion to recalculate a firm's SCB outside of the October 1 annual cycle in certain circumstances.
We submitted our 2020 Capital Plan (“Capital Plan”) and company-run stress test results to the Federal Reserve on April 6, 2020. On June 25, 2020, the Federal Reserve published summary results of its supervisory stress tests of each large BHC. On June 29, 2020, we disclosed a summary of the results of our company-run stress tests on our Investor Relations website. On September 4, 2020, we announced we would be subject to an SCB of 5.7% beginning October 1, 2020, which reflects the Federal Reserve’s 2020 supervisory stress test results, inclusive of corrections from the original results announced in June 2020. Together with other features of the regulatory capital framework, this revised SCB results in an aggregate Standardized Approach Common Equity Tier 1 required ratio of 13.2%.
In 2020, the Federal Reserve required all large BHCs to update and resubmit their capital plans in response to changes in financial markets or the macroeconomic outlook associated with the COVID-19 pandemic. On November 2, 2020, we resubmitted our 2020 Capital Plan and company-run stress test results based on revised scenarios released by the Federal Reserve on September 17, 2020. On December 18, 2020, the Federal Reserve published summary results of the second round of supervisory stress tests for each large BHC, including us. While the Federal Reserve did not recalculate any BHC’s SCB in connection with the December 18, 2020 announcement, it extended the time period to notify firms whether their SCB requirements will be recalculated until March 31, 2021, and also extended capital action supervisory restrictions applicable to large BHCs into the first quarter of 2021 with modifications to permit resumptions of share repurchases. Consistent with these modifications, on December 18, 2020, our Board of Directors authorized the repurchases of outstanding common stock of up to $10 billion in 2021, subject to limitations on distributions from the Federal Reserve. See “Liquidity and Capital Resources—Regulatory Requirements—Capital Action Supervisory Restrictions” herein for additional information on capital action supervisory restrictions.
For the 2021 capital planning and stress test cycle, we are required to submit our capital plan and company-run stress test results to the Federal Reserve by April 5, 2021. The Federal Reserve is expected to publish summary results of the CCAR and Dodd-Frank Act supervisory stress tests of each large BHC, including us, by June 30, 2021. We are required to disclose a summary of the results of our company-run stress tests within 15 days of the date the Federal Reserve discloses the results of the supervisory stress tests.
Capital Action Supervisory Restrictions
The Federal Reserve announced, on June 25, 2020, that all large BHCs would be subject to capital action supervisory restrictions beginning in the third quarter of 2020, which the Federal Reserve subsequently extended into the fourth quarter of 2020. Except as noted below, these restrictions generally prohibited large BHCs from making any capital distribution (excluding any capital distribution arising from the issuance of a capital instrument eligible for inclusion in the numerator of a regulatory capital ratio), unless otherwise approved by the Federal Reserve, regardless of whether a firm met applicable capital buffers, including the SCB. Large BHCs were, however, authorized to make share repurchases relating to issuances of common stock related to employee stock ownership plans; provided that a BHC did not increase the amount of its common stock dividends, to pay common stock dividends that did not exceed an amount equal to the average of the BHC’s net income for the four preceding calendar quarters, unless otherwise specified by the Federal Reserve; and to make scheduled payments on additional Tier 1 and Tier 2 capital instruments.
Under the modified capital action restrictions announced on December 18, 2020, large BHCs are permitted, in the first quarter of 2021, to take certain capital actions. In particular, a firm may, provided that it does not increase the amount of its common stock dividends to be larger than the level paid in the second quarter of 2020, pay common stock dividends and make share repurchases that, in the aggregate, do not exceed an amount equal to the average of the firm’s net income for the four preceding calendar quarters; make share repurchases that equal the amount of share issuances related to expensed employee compensation; and redeem and make scheduled payments on additional Tier 1 and Tier 2 capital instruments.
Attribution of Average Common Equity According to the Required Capital Framework
Our required capital (“Required Capital”) estimation is based on the Required Capital framework, an internal capital adequacy measure. Common equity attribution to the business segments is based on capital usage calculated under the Required Capital framework, as well as each business segment’s relative contribution to our total Required Capital.
The Required Capital framework is a risk-based and leverage-based capital measure, which is compared with our regulatory capital to ensure that we maintain an amount of going concern capital after absorbing potential losses from stress events, where applicable, at a point in time. The amount of capital allocated to the business segments is generally set at the beginning of each year and remains fixed throughout the year until the next annual reset unless a significant business change occurs (e.g., acquisition or disposition). We define the difference between our total average common equity and the sum of the average common equity amounts allocated to our business segments as Parent common equity. We generally hold Parent common equity for prospective regulatory
| | | | | | | | |
| December 2020 Form 10-K | 56 | |
| | | | | |
| |
| Management's Discussion and Analysis | |
requirements, organic growth, acquisitions and other capital needs.
Average Common Equity Attribution under the Required Capital Framework1
| | | | | | | | | | | |
| $ in billions | 2020 | 2019 | 2018 |
| Institutional Securities | $ | 42.8 | | $ | 40.4 | | $ | 40.8 | |
Wealth Management2 | 20.8 | | 18.2 | | 16.8 | |
| Investment Management | 2.6 | | 2.5 | | 2.6 | |
| Parent | 14.0 | | 11.6 | | 9.8 | |
| Total | $ | 80.2 | | $ | 72.7 | | $ | 70.0 | |
1.The attribution of average common equity to the business segments is a non-GAAP financial measure. See "Selected Non-GAAP Financial Information" herein.
2.Total average common equity and the allocation to the Wealth Management business segment were revised in the fourth quarter of 2020 to reflect the impact of the E*TRADE acquisition on October 2, 2020.
Beginning in 2021, we have updated our Required Capital framework to take into account changes to our risk-based capital requirements resulting from the SCB. The stand-alone impact of the change to the Required Capital framework was not material to the business segments. As noted above, common equity attribution to the business segments is based upon usage. We will continue to evaluate the framework with respect to the impact of other future regulatory requirements as appropriate.
Resolution and Recovery Planning
Pursuant to the Dodd-Frank Act, we are required to periodically submit to the Federal Reserve and the FDIC a resolution plan that describes our strategy for a rapid and orderly resolution under the U.S. Bankruptcy Code in the event of our material financial distress or failure. Our next resolution plan submission will be a targeted resolution plan in July 2021.
As described in our most recent resolution plan, which was submitted on June 28, 2019, our preferred resolution strategy is an SPOE strategy. In line with our SPOE strategy, the Parent Company has transferred, and has agreed to transfer on an ongoing basis, certain assets to its wholly owned, direct subsidiary Morgan Stanley Holdings LLC (the “Funding IHC”). In addition, the Parent Company has entered into an amended and restated support agreement with its material entities (including the Funding IHC) and certain other subsidiaries. In the event of a resolution scenario, the Parent Company would be obligated to contribute all of its Contributable Assets to our material entities and/or the Funding IHC. The Funding IHC would be obligated to provide capital and liquidity, as applicable, to our material entities. The combined implication of the SPOE resolution strategy and the requirement to maintain certain levels of TLAC is that losses in resolution would be imposed on the holders of eligible long-term debt and other forms of eligible TLAC issued by the Parent Company before any losses are imposed on creditors of our material entities or before putting U.S. taxpayers at risk.
The obligations of the Parent Company and the Funding IHC under the amended and restated support agreement are in most cases secured on a senior basis by the assets of the Parent Company (other than shares in subsidiaries of the Parent Company and certain other assets) and the assets of the Funding IHC. As a result, claims of our material entities, including the Funding IHC, with respect to the secured assets, are effectively senior to unsecured obligations of the Parent Company.
In December 2019, we received joint feedback on our 2019 resolution plan from the Federal Reserve and the FDIC. The feedback confirmed that there are no deficiencies in our 2019 resolution plan and that we had successfully addressed a prior shortcoming identified by the agencies in the review of our 2017 resolution plan. The agencies noted one shortcoming in our 2019 resolution plan related to certain mechanisms intended to facilitate our SPOE strategy which must be addressed prior to our next resolution plan submission in 2021.
For more information about resolution and recovery planning requirements and our activities in these areas, including the implications of such activities in a resolution scenario, see “Business—Supervision and Regulation—Financial Holding Company—Resolution and Recovery Planning” and “Risk Factors—Legal, Regulatory and Compliance Risk.”
Regulatory Developments
Regulatory Developments in Response to COVID-19
In the United States, the Federal Reserve, the other U.S. state and federal financial regulatory agencies and Congress have taken actions to mitigate disruptions to economic activity and financial stability resulting from COVID-19.
Federal Reserve and other U.S. Banking Agency Actions
The Federal Reserve established a range of facilities and programs to support the U.S. economy and U.S. marketplace participants in response to economic disruptions associated with COVID-19. Through these facilities and programs, the Federal Reserve has taken steps to directly or indirectly purchase assets or debt instruments from, or make loans to, U.S. companies, financial institutions, municipalities and other market participants. In the current year, we have participated as principal, as well as on behalf of clients, in certain of these facilities and programs, and we may participate in other of these facilities and programs in the future.
In addition, the Federal Reserve has taken a range of other actions to support the flow of credit to households and businesses. For example, the Federal Reserve has set the target range for the federal funds rate at 0 to 0.25% and has increased its holdings of U.S. Treasury securities and agency mortgage-backed securities, purchased agency commercial mortgage-backed securities, and established a facility to purchase corporate debt securities and shares of exchange-
| | | | | | | | |
| 57 | December 2020 Form 10-K |
| | | | | |
| |
| Management's Discussion and Analysis | |
traded funds holding such securities. The Federal Reserve has also encouraged depository institutions to borrow from the discount window and has lowered the primary credit rate for such borrowings by 150 basis points to 0.25% while extending the term of such loans up to 90 days. In addition, reserve requirements have been reduced to zero.
Acting in concert with the other U.S. banking agencies, the Federal Reserve has also issued statements encouraging banking organizations to use their capital and liquidity buffers as they lend to households and businesses affected by COVID-19.
Further, the Federal Reserve, along with the other U.S. banking agencies, issued guidance stating that granting certain concessions to borrowers that are current on existing loans, either individually or as part of a program for creditworthy borrowers who are experiencing short-term financial or operational problems as a result of the COVID-19 pandemic, generally would not be considered TDRs under applicable U.S. GAAP. This guidance also clarifies that efforts to work with borrowers of one-to-four family residential mortgages impacted by the COVID-19 pandemic and meeting certain criteria will not result in such loans being deemed restructured or modified for purposes of regulatory capital requirements.
The Federal Reserve and other U.S. banking agencies have also issued a series of rulemakings in response to the COVID-19 pandemic, including to facilitate banking organizations’ use of their capital buffers:
•Supplementary Leverage Ratio Interim Final Rules. The Federal Reserve has adopted an interim final rule that excludes, on a temporary basis, U.S. Treasury securities and deposits at Federal Reserve Banks from our supplementary leverage exposure from April 1, 2020 to March 31, 2021.
A similar interim final rule issued by the OCC along with the other U.S. banking agencies provides national banks, including MSBNA and MSPBNA, an optional election, which is considered on a case-by-case basis by the OCC if received after June 30, 2020, to apply similar relief. If elected and approved, a national bank must receive prior approval from the OCC before making any capital distributions while the exclusion is in effect. As of December 31, 2020, neither MSBNA nor MSPBNA made this optional election.
•Revisions to Definition of Eligible Retained Income. The U.S. banking agencies have adopted as final an interim final rule, which was effective March 20, 2020, amending the definition of eligible retained income in their respective capital rules. As amended, eligible retained income is defined by the U.S. banking agencies as the greater of (i) net income for the four preceding calendar quarters, net of any distributions and associated tax effects not already reflected in net income, and (ii) the average of net income over the preceding four quarters. This definition applies
with respect to any payout restrictions applicable in the event of a breach of any regulatory capital buffers, including any applicable CCyB, G-SIB capital surcharge, capital conservation buffer, the enhanced SLR and the SCB, which replaced the capital conservation buffer under the Standardized Approach.
Separately, the Federal Reserve has adopted as final an interim final rule, which was effective March 26, 2020, amending the definition of eligible retained income under its TLAC rule to be consistent with the revised definition of eligible retained income in the regulatory capital framework, as summarized above.
•Regulatory Capital and Stress Testing Developments Related to Implementation of CECL. The U.S. banking agencies have adopted a final rule, consistent with an interim final rule that was effective March 31, 2020, altering, for purposes of the regulatory capital and TLAC requirements, the required adoption time period for CECL. We have elected to apply a transition method provided by the rule, under which the effects of CECL on our regulatory capital and TLAC requirements are deferred for two years, followed by a three-year phase-in of the aggregate capital effects of the two-year deferral.
The Coronavirus Aid, Relief, and Economic Security Act (the “CARES Act”) and the Consolidated Appropriations Act, 2021 (the “Consolidated Appropriations Act”)
The CARES Act was signed into law on March 27, 2020. Pursuant to the CARES Act, the U.S. Treasury had the authority to provide loans, guarantees and other investments in support of eligible businesses, states and municipalities affected by the economic effects of COVID-19. Some of these funds may also have been used to support the several Federal Reserve programs and facilities described in “Federal Reserve Actions” previously or additional programs or facilities that are established by the Federal Reserve under its Section 13(3) authority and meet certain criteria. Among other provisions, the CARES Act also included funding for the Small Business Administration to expand lending, relief from certain U.S. GAAP requirements to allow COVID-19-related loan modifications not to be categorized as TDRs and a range of incentives to encourage deferment, forbearance or modification of consumer credit and mortgage contracts.
The CARES Act also included several measures that temporarily adjusted existing laws or regulations. These included providing the FDIC with additional authority to guarantee the deposits of solvent insured depository institutions held in non-interest-bearing business transaction accounts to a maximum amount specified by the FDIC, reinstating the FDIC’s Temporary Liquidity Guarantee Authority to guarantee debt obligations of solvent insured depository institutions or depository institution holding companies, temporarily allowing the U.S. Treasury to fully guarantee money market mutual funds and granting additional
| | | | | | | | |
| December 2020 Form 10-K | 58 | |
| | | | | |
| |
| Management's Discussion and Analysis | |
authority to the OCC to provide certain exemptions to the lending limits imposed on national banks.
The Consolidated Appropriations Act, which was signed into law on December 27, 2020, extends certain relief provided by the CARES Act while also modifying or clarifying certain other provisions. Among other amendments to the CARES Act, the Consolidated Appropriations Act extends the relief related to TDRs until January 1, 2022. In addition, the Consolidated Appropriations Act rescinds certain funds that were appropriated to the U.S. Treasury to provide loans, loan guarantees, and make other investments in programs or facilities established by the Federal Reserve, and prohibits the Federal Reserve, after December 31, 2020, from making any new investments, loans or loan guarantees, or extensions of credit through those of its programs and facilities that were established using CARES Act funding. Federal Reserve programs and facilities that were not established using CARES Act funding are not affected by the Consolidated Appropriations Act.
Non-U.S. Central Bank Actions
In addition to actions taken by the Federal Reserve, many non-U.S. central banks have announced similar facilities and programs in response to the economic and market disruptions associated with COVID-19. Firm subsidiaries operating in non-U.S. markets may participate, or perform customer facilitation roles, in such non-U.S. facilities or programs.
Other Matters
U.K. Withdrawal from the E.U.
On January 31, 2020, the U.K. withdrew from the E.U. under the terms of a withdrawal agreement between the U.K. and the E.U. The withdrawal agreement provided for a transition period to the end of December 2020, during which time the U.K. continued to apply E.U. law as if it were a member state, and U.K. firms’ rights to provide financial services in E.U. member states continued.
On December 24, 2020 the U.K. and the E.U. announced they had reached agreement on the terms of a trade and co-operation agreement to govern the future relationship between the parties. The agreement consists of three main pillars including trade, citizens’ security and governance, covering a range of arrangements in several areas. The agreement is provisionally applicable with effect from January 1, 2021 pending formal ratification by the E.U. As anticipated, the agreement did not materially address provision of financial services.
We had prepared the structure of our European operations for a range of potential outcomes, including for the possibility that U.K. financial firms’ access to E.U. markets after the transition period would be limited, and have been able to continue to serve our clients and customers from January 1, 2021.
For more information on the U.K.’s withdrawal from the E.U., our related preparations and the potential impact on our operations, see “Risk Factors—International Risk.” For further information regarding our exposure to the U.K., see also “Quantitative and Qualitative Disclosures about Risk—Country and Other Risks” herein.
Planned Replacement of London Interbank Offered Rate and Replacement or Reform of Other Interest Rates
Central banks around the world, including the Federal Reserve, have commissioned committees and working groups of market participants and official sector representatives to replace LIBOR and replace or reform other interest rate benchmarks (collectively, the “IBORs”). There remains a likelihood that most IBORs will not be available beyond 2021. In 2020, ICE Benchmark Administration, which administers LIBOR publication, issued a consultation requesting feedback on its intention to cease the publication of most LIBOR rates as of the end of December 2021, except for the publication until June 30, 2023 of the most widely used U.S. dollar LIBOR tenors. At the same time, the U.S. banking agencies and the U.K. Financial Conduct Authority also encouraged banks to cease entering into new contracts referencing LIBOR as soon as practicable and no later than December 31, 2021, but have also indicated their support for the continuation of certain U.S. dollar LIBOR tenors through the end of June 2023 to allow for certain U.S. dollar LIBOR legacy contracts to mature.
Also in 2020, there have been several steps taken by the industry to encourage the transition to alternative reference rates. Key central clearinghouses, such as London Clearing House (“LCH”) and Chicago Mercantile Exchange (“CME”), have switched their price aligned interest and discounting to the alternative reference rates. For example, the LCH and CME transitioned the discounting rate for U.S. dollar denominated products to SOFR, the alternative rate to U.S. dollar LIBOR selected by the ARRC. The International Swaps and Derivatives Association (“ISDA”) also published its 2020 IBOR Fallbacks Protocol which will amend ISDA’s interest rate definitions among Protocol adherents to incorporate robust fallbacks for legacy non-cleared derivatives linked to LIBOR and certain other interest rates benchmarks. The ISDA 2020 IBOR Fallbacks Protocol became effective as of January 25, 2021 and applies to Protocol adherents who do not elect to voluntarily convert their derivatives contracts to reference alternative rates in advance of the applicable cessation date. Similarly, ISDA’s IBOR Fallbacks Supplement will also amend ISDA’s standard definitions to incorporate these new fallbacks in new derivatives entered into on or after that same effective date. In addition, certain central bank-sponsored committees have issued recommended best practices to assist market participants in transitioning away from the IBORs in various jurisdictions, including the United States. These documents include recommended timelines and intermediate steps market participants can take in order to achieve a successful transition.
| | | | | | | | |
| 59 | December 2020 Form 10-K |
| | | | | |
| |
| Management's Discussion and Analysis | |
We have established and are undertaking a Firm-wide IBOR transition plan to promote the transition to alternative reference rates, which is overseen by a global steering committee, with senior management oversight. Our transition plan is designed to identify, assess and monitor risks associated with the expected discontinuation or unavailability of one or more of the IBORs, and includes continued engagement with central bank and industry working groups and regulators (including participation and leadership on key committees), active client engagement, internal operational readiness and risk management, among other things. We are a party to a significant number of LIBOR-linked contracts, many of which extend beyond 2021 and, in the case of U.S. dollar LIBOR, June 30, 2023, composed of derivatives, securitizations, floating rate notes, loans and mortgages. Our review of these contracts includes assessing the impact of applicable fallbacks and any amendments that may be warranted or appropriate. We are also taking steps to update operational processes (including to support alternative reference rates), models, and associated infrastructure, as well as conducting certain client outreach to amend fallbacks, including by utilization of the ISDA 2020 IBOR Fallbacks Protocol or through bilaterally negotiated voluntary conversions of outstanding LIBOR products where practicable. Key Firm entities have also adhered to the ISDA 2020 IBOR Fallbacks Protocol.
In addition, as part of the transition to alternative reference rates, we are making markets in products linked to such rates, including SOFR, and have issued debt linked to SOFR.
For a further discussion of the expected replacement of the IBORs and/or reform of interest rate benchmarks, and the related risks and our transition plan, see “Risk Factors—Legal, Regulatory and Compliance Risk.”
| | | | | | | | |
| December 2020 Form 10-K | 60 | |
Quantitative and Qualitative Disclosures about Risk
Risk Management
Overview
Risk is an inherent part of our businesses and activities. We believe effective risk management is vital to the success of our business activities. Accordingly, we have an Enterprise Risk Management (“ERM”) framework to integrate the diverse roles of risk management into a holistic enterprise structure and to facilitate the incorporation of risk assessment into decision-making processes across the Firm.
We have policies and procedures in place to identify, measure, monitor, advise, challenge and control the principal risks involved in the activities of the Institutional Securities, Wealth Management and Investment Management business segments, as well as at the Parent Company level. The principal risks involved in our business activities include market (including non-trading risks), credit, operational, model, compliance, cybersecurity, liquidity, strategic, reputational and conduct risk. Strategic risk is integrated into our business planning, embedded in the evaluation of all principal risks and overseen by the Board.
The cornerstone of our risk management philosophy is the pursuit of risk-adjusted returns through prudent risk taking that protects our capital base and franchise. This philosophy is implemented through the ERM framework. Five key principles underlie this philosophy: integrity, comprehensiveness, independence, accountability and transparency. To help ensure the efficacy of risk management, which is an essential component of our reputation, senior
management requires thorough and frequent communication and the appropriate escalation of risk matters. The fast-paced, complex and constantly evolving nature of global financial markets requires us to maintain a risk management culture that is incisive, knowledgeable about specialized products and markets, and subject to ongoing review and enhancement.
Our risk appetite defines the types of risk that the Firm is willing to accept in pursuit of our strategic objectives and business plan, taking into account the interests of clients and fiduciary duties to shareholders, as well as capital and other regulatory requirements. This risk appetite is embedded in our risk culture and linked to our short-term and long-term strategic, capital and financial plans, as well as compensation programs. This risk appetite and the related Board-level risk limits and risk tolerance statements are reviewed and approved by the Risk Committee of the Board (“BRC”) and the Board on at least an annual basis.
Risk Governance Structure
Risk management at the Firm requires independent Firm-level oversight, accountability of our business divisions, and effective communication of risk matters across the Firm, to senior management and ultimately to the Board. Our risk governance structure is set forth in the following chart and also includes risk managers, committees, and groups within and across business segments and operating legal entities. The ERM framework, composed of independent but complementary entities, facilitates efficient and comprehensive supervision of our risk exposures and processes.
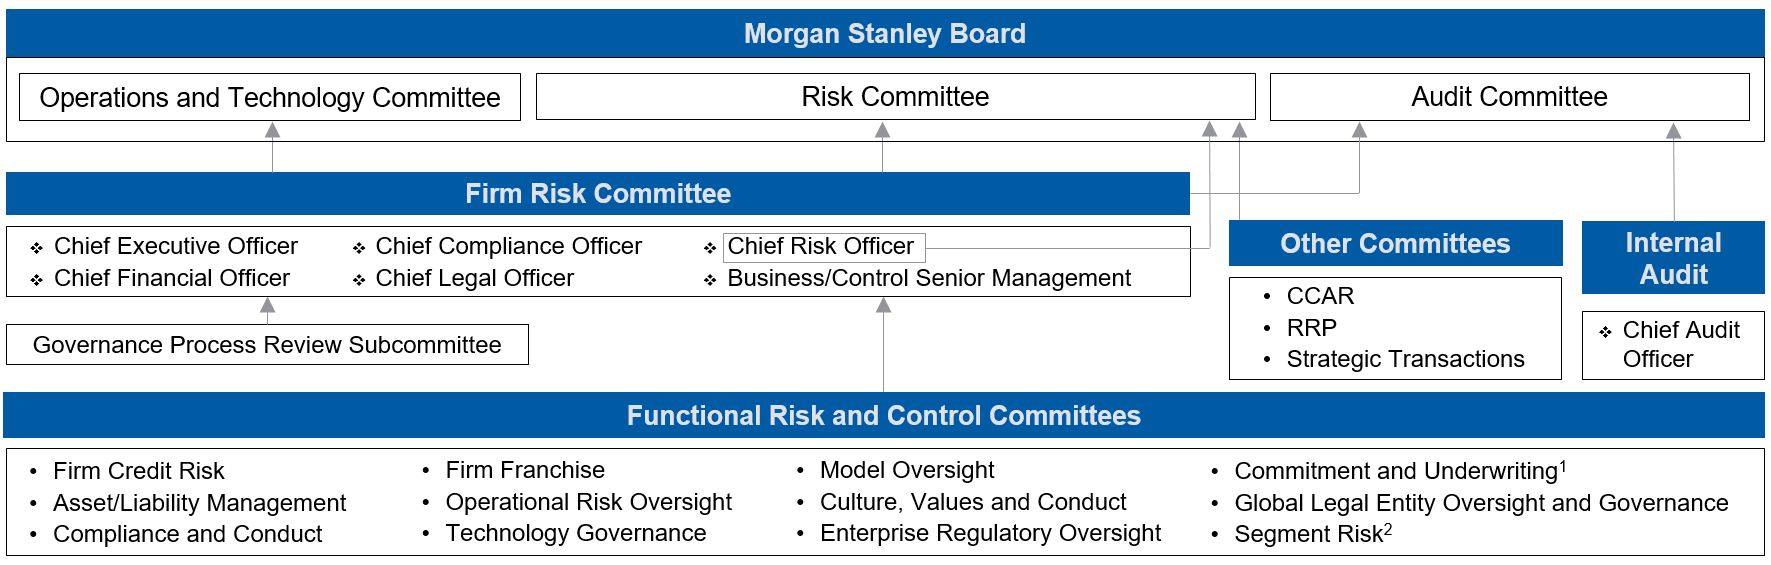
RRP—Resolution and Recovery Planning
1.Committees include the Capital Commitment Committee, Global Large Loan Committee, Equity Underwriting Committee, Leveraged Finance Underwriting Committee and Municipal Capital Commitment Committee.
2.Committees include the Securities Risk Committee, Wealth Management Risk Committee and Investment Management Risk Committee.
| | | | | | | | |
| 61 | December 2020 Form 10-K |
Morgan Stanley Board of Directors
The Board has oversight of the ERM framework and is responsible for helping to ensure that our risks are managed in a sound manner. The Board has authorized the committees within the ERM framework to help facilitate our risk oversight responsibilities. As set forth in our Corporate Governance Policies, the Board also oversees, and receives reports on, our financial performance, strategy and business plans, as well as our practices and procedures relating to reputational and franchise risk, and culture, values and conduct.
Risk Committee of the Board
The BRC assists the Board in its oversight of the ERM framework; oversees major risk exposures of the Firm, including market, credit, model and liquidity risk, against established risk measurement methodologies and the steps management has taken to monitor and control such exposures; oversees our risk appetite statement, including risk limits and tolerances; reviews capital, liquidity and funding strategy and related guidelines and policies; reviews the contingency funding plan and capital planning process; oversees our significant risk management and risk assessment guidelines and policies; oversees the performance of the Chief Risk Officer; reviews reports from our Strategic Transactions Committee, CCAR Committee and RRP Committee; reviews new product risk, emerging risks, climate risk and regulatory matters; and reviews the Internal Audit Department reports on the assessment of the risk management, liquidity and capital functions. The BRC reports to the Board on a regular basis and coordinates with other Board committees with respect to oversight of risk management and risk assessment guidelines.
Audit Committee of the Board
The Audit Committee of the Board (“BAC”) oversees the integrity of our financial statements, compliance with legal and regulatory requirements, and system of internal controls; oversees risk management and risk assessment guidelines in coordination with the Board, the BRC, and the Operations and Technology Committee of the Board (“BOTC”); reviews the major legal, compliance and conduct risk exposures of the Firm and the steps management has taken to monitor and control such exposures; selects, determines the fees, evaluates and, when appropriate, replaces the independent auditor; oversees the qualifications, independence and performance of our independent auditor and pre-approves audit and permitted non-audit services; oversees the performance of our Chief Audit Officer; and, after review, recommends to the Board the acceptance and inclusion of the annual audited financial statements in the Firm’s annual report on Form 10-K. The BAC reports to the Board on a regular basis.
Operations and Technology Committee of the Board
The BOTC oversees our operations and technology strategy and significant investments in support of such strategy;
operations, technology and operational risk, including information security, fraud, vendor, data protection, privacy, business continuity and resilience, cybersecurity risks and the steps management has taken to monitor and control such exposures; receives reports regarding business continuity and resilience; and reviews risk management and risk assessment guidelines in coordination with the Board, the BRC and the BAC, and policies regarding operations, technology and operational risk. The BOTC reports to the Board on a regular basis.
Firm Risk Committee
The Board has also authorized the Firm Risk Committee (“FRC”), a management committee appointed and co-chaired by the Chief Executive Officer and Chief Risk Officer, which includes the most senior officers of the Firm from the business, independent risk functions and control groups, to help oversee the ERM framework. The FRC’s responsibilities include: oversight of our risk management principles, procedures and limits; the monitoring of capital levels and material market, credit, operational, model, liquidity, legal, compliance and reputational risk matters, and other risks, as appropriate; and the steps management has taken to monitor and manage such risks. The FRC also establishes and communicates risk tolerance, including aggregate Firm limits and tolerances, as appropriate. The Governance Process Review Subcommittee of the FRC oversees governance and process issues on behalf of the FRC. The FRC reports to the Board, the BAC, the BOTC and the BRC through the Chief Risk Officer, Chief Financial Officer and Chief Legal Officer.
Functional Risk and Control Committees
Functional risk and control committees and other committees within the ERM framework facilitate efficient and comprehensive supervision of our risk exposures and processes.
Each business segment has a risk committee that is responsible for helping to ensure that the business segment, as applicable, adheres to established limits for market, credit, operational and other risks; implements risk measurement, monitoring, and management policies, procedures, controls and systems that are consistent with the risk framework established by the FRC; and reviews, on a periodic basis, our aggregate risk exposures, risk exception experience, and the efficacy of our risk identification, measurement, monitoring and management policies and procedures, and related controls.
Chief Risk Officer
The Chief Risk Officer, who is independent of business units, reports to the BRC and the Chief Executive Officer. The Chief Risk Officer oversees compliance with our risk limits; approves exceptions to our risk limits; independently reviews material market, credit, liquidity, model and operational risks; and reviews results of risk management processes with the
| | | | | | | | |
| December 2020 Form 10-K | 62 | |
Board, the BRC, the BOTC and the BAC, as appropriate. The Chief Risk Officer also coordinates with the Chief Financial Officer regarding capital and liquidity management and works with the Compensation, Management Development and Succession Committee of the Board to help ensure that the structure and design of incentive compensation arrangements do not encourage unnecessary and excessive risk taking.
Independent Risk Management Functions
The risk management functions (Market Risk, Credit Risk, Operational Risk, Model Risk and Liquidity Risk Management departments) are independent of our business units and report to the Chief Risk Officer. These functions assist senior management and the FRC in monitoring and controlling our risk through a number of control processes. Each function maintains its own risk governance structure with specified individuals and committees responsible for aspects of managing risk. Further discussion about the responsibilities of the risk management functions may be found under “Market Risk,” “Credit Risk,” “Operational Risk,” “Model Risk” and “Liquidity Risk” herein.
Support and Control Groups
Our support and control groups include the Legal and Compliance Division, the Finance Division, Technology Division, Operations Division, the Human Resources Department, Corporate Services and Firm Resilience. Our support and control groups coordinate with the business segment control groups to review the risk monitoring and risk management policies and procedures relating to, among other things, controls over financial reporting and disclosure; each business segment’s market, credit and operational risk profile; liquidity risks; model risks; sales practices; reputational, legal enforceability, compliance, conduct and regulatory risk; and technological risks. Participation by the senior officers of the Firm and business segment control groups helps ensure that risk policies and procedures, exceptions to risk limits, new products and business ventures, and transactions with risk elements undergo thorough review.
Internal Audit Department
The Internal Audit Department provides independent risk and control assessment. The Internal Audit Department provides an independent assessment of the design and effectiveness of our control environment and risk management processes using a risk-based audit coverage model and audit execution methodology developed from professional auditing standards. The Internal Audit Department also reviews and tests our compliance with internal guidelines set for risk management and risk monitoring, as well as external rules and regulations governing the industry. It undertakes these responsibilities through periodic reviews (with specified minimum frequency) of our processes, activities, products and information systems; targeted reviews of specific controls and activities; pre-implementation or initiative reviews of new or significantly changed processes, activities, products or information
systems; and special investigations and retrospective reviews required as a result of internal factors or regulatory requests. In addition to regular reports to the BAC, the Chief Audit Officer, who reports functionally to the BAC and administratively to the Chief Executive Officer, periodically reports to the BRC and BOTC on risk-related control issues.
Culture, Values and Conduct of Employees
Employees of the Firm are accountable for conducting themselves in accordance with our core values: Put Clients First, Do the Right Thing, Lead with Exceptional Ideas, Commit to Diversity and Inclusion and Give Back. We are committed to reinforcing and confirming adherence to our core values through our governance framework, tone from the top, management oversight, risk management and controls, and three lines of defense structure (business, control functions such as Risk Management and Compliance, and Internal Audit).
The Board is responsible for overseeing the Firm’s practices and procedures relating to culture, values and conduct, as set forth in the Firm’s Corporate Governance Policies. Our Culture, Values and Conduct Committee, along with the Compliance and Conduct Risk Committee, are the senior management committees that oversee the Firmwide culture, values and conduct program and report regularly to the Board. A fundamental building block of this program is the Firm’s Code of Conduct, which establishes standards for employee conduct that further reinforce the Firm’s commitment to integrity and ethical conduct. Every new hire and every employee annually is required to certify to their understanding of and adherence to the Code of Conduct. The Firm’s Global Conduct Risk Management Policy also sets out a consistent global framework for managing Conduct Risk (i.e., the risk arising from misconduct by employees or contingent workers) and Conduct Risk incidents at the Firm.
The employee annual performance review process includes evaluation of employee conduct related to risk management practices and the Firm’s expectations. We also have several mutually reinforcing processes to identify employee conduct that may have an impact on employment status, current year compensation and/or prior year compensation. For example, the Global Incentive Compensation Discretion Policy sets forth standards for managers when making annual compensation decisions and specifically provides that managers must consider whether their employees effectively managed and/or supervised risk control practices during the performance year. Management committees from control functions periodically meet to discuss employees whose conduct is not in line with our expectations. These results are incorporated into identified employees’ performance reviews and compensation and promotion decisions.
The Firm’s clawback and cancellation provisions apply to deferred incentive compensation and cover a broad scope of employee conduct, including any act or omission (including with respect to direct supervisory responsibilities) that
| | | | | | | | |
| 63 | December 2020 Form 10-K |
constitutes a breach of obligation to the Firm or causes a restatement of the Firm’s financial results, constitutes a violation of the Firm’s global risk management principles, policies and standards, or causes a loss of revenue associated with a position on which the employee was paid and the employee operated outside of internal control policies.
Risk Limits Framework
Risk limits and quantitative metrics provide the basis for monitoring risk taking activity and avoiding outsized risk taking. Our risk-taking capacity is sized through the Firm’s capital planning process where losses are estimated under the Firm’s BHC Severely Adverse stress testing scenario. We also maintain a comprehensive suite of risk limits and quantitative metrics to support and implement our risk appetite statement. Our risk limits support linkages between the overall risk appetite, which is reviewed by the Board, and more granular risk-taking decisions and activities.
Risk limits, once established, are reviewed and updated on at least an annual basis, with more frequent updates as necessary. Board-level risk limits address the most important Firmwide aggregations of risk, including, but not limited to, stressed market, credit and liquidity risks. Additional risk limits approved by the FRC address more specific types of risk and are bound by the higher-level Board risk limits.
Risk Management Process
In subsequent sections, we discuss our risk management policies and procedures for our primary risks. This discussion primarily focuses on our Institutional Securities business segment's trading activities and corporate lending and related activities. We believe that these activities generate a substantial portion of our primary risks. These sections and the estimated amounts of our risk exposure generated by our statistical analyses are forward-looking statements. However, the analyses used to assess such risks are not predictions of future events, and actual results may vary significantly from such analyses due to events in the markets in which we operate and certain other factors described in the following paragraphs.
Market Risk
Market risk refers to the risk that a change in the level of one or more market prices, rates, spreads, indices, volatilities, correlations or other market factors, such as market liquidity, will result in losses for a position or portfolio. Generally, we incur market risk as a result of trading, investing and client facilitation activities, principally within the Institutional Securities business segment where the substantial majority of our VaR for market risk exposures is generated. In addition, we incur non-trading market risk, principally within the Wealth Management and Investment Management business segments. The Wealth Management business segment primarily incurs non-trading market risk (including interest rate risk) from lending and deposit-taking activities. The
Investment Management business segment primarily incurs non-trading market risk from capital investments in alternative and other funds.
Market risk also includes non-trading interest rate risk. Non-trading interest rate risk in the banking book (amounts classified for regulatory capital purposes under the banking book regime) refers to the exposure that a change in interest rates will result in prospective earnings changes for assets and liabilities in the banking book.
Sound market risk management is an integral part of our culture. The various business units and trading desks are responsible for ensuring that market risk exposures are well-managed and prudent. The control groups help ensure that these risks are measured and closely monitored and are made transparent to senior management. The Market Risk Department is responsible for ensuring the transparency of material market risks, monitoring compliance with established limits and escalating risk concentrations to appropriate senior management.
To execute these responsibilities, the Market Risk Department monitors our risk against limits on aggregate risk exposures, performs a variety of risk analyses, routinely reports risk summaries, and maintains our VaR and scenario analysis systems. Market risk is also monitored through various measures: by use of statistics (including VaR and related analytical measures); by measures of position sensitivity; and through routine stress testing, which measures the impact on the value of existing portfolios of specified changes in market factors and scenarios designed by the Market Risk Department in collaboration with the business units. The material risks identified by these processes are summarized in reports produced by the Market Risk Department that are circulated to and discussed with senior management, the FRC, the BRC and the Board.
Trading Risks
Primary Market Risk Exposures and Market Risk Management
During 2020, we had exposures to a wide range of interest rates, equity prices, foreign exchange rates and commodity prices—and the associated implied volatilities and spreads—related to the global markets in which we conduct our trading activities.
We are exposed to interest rate and credit spread risk as a result of our market-making activities and other trading in interest rate-sensitive financial instruments (i.e., risk arising from changes in the level or implied volatility of interest rates, the timing of mortgage prepayments, the shape of the yield curve and/or credit spreads). The activities from which those exposures arise and the markets in which we are active include, but are not limited to, the following: derivatives, corporate and government debt across both developed and
| | | | | | | | |
| December 2020 Form 10-K | 64 | |
emerging markets and asset-backed debt, including mortgage-related securities.
We are exposed to equity price and implied volatility risk as a result of making markets in equity securities and derivatives and maintaining other positions, including positions in non-public entities. Positions in non-public entities may include, but are not limited to, exposures to private equity, venture capital, private partnerships, real estate funds and other funds. Such positions are less liquid, have longer investment horizons and are more difficult to hedge than listed equities.
We are exposed to foreign exchange rate and implied volatility risk as a result of making markets in foreign currencies and foreign currency derivatives, from maintaining foreign exchange positions and from holding non-U.S. dollar-denominated financial instruments.
We are exposed to commodity price and implied volatility risk as a result of market-making activities in commodity products related primarily to electricity, natural gas, oil and precious metals. Commodity exposures are subject to periods of high price volatility as a result of changes in supply and demand. These changes can be caused by weather conditions; physical production and transportation; or geopolitical and other events that affect the available supply and level of demand for these commodities.
We manage our trading positions by employing a variety of risk mitigation strategies. These strategies include diversification of risk exposures and hedging. Hedging activities consist of the purchase or sale of positions in related securities and financial instruments, including a variety of derivative products (e.g., futures, forwards, swaps and options). Hedging activities may not always provide effective mitigation against trading losses due to differences in the terms, specific characteristics or other basis risks that may exist between the hedge instrument and the risk exposure that is being hedged.
We manage the market risk associated with our trading activities on a Firmwide basis, on a worldwide trading division level and on an individual product basis. We manage and monitor our market risk exposures in such a way as to maintain a portfolio that we believe is well-diversified in the aggregate with respect to market risk factors and that reflects our aggregate risk tolerance as established by our senior management.
Aggregate market risk limits have been approved for the Firm across all divisions worldwide. Additional market risk limits are assigned to trading desks and, as appropriate, products and regions. Trading division risk managers, desk risk managers, traders and the Market Risk Department monitor market risk measures against limits in accordance with policies set by our senior management.
Value-at-Risk
The statistical technique known as VaR is one of the tools we use to measure, monitor and review the market risk exposures of our trading portfolios. The Market Risk Department calculates and distributes daily VaR-based risk measures to various levels of management.
We estimate VaR using a model based on a one-year equal weighted historical simulation for general market risk factors and name-specific risk in corporate shares and related derivatives, and Monte Carlo simulation for name-specific risk in bonds, loans and related derivatives. The model constructs a distribution of hypothetical daily changes in the value of trading portfolios based on historical observation of daily changes in key market indices or other market risk factors, and information on the sensitivity of the portfolio values to these market risk factor changes.
VaR for risk management purposes (“Management VaR”) is computed at a 95% level of confidence over a one-day time horizon, which is a useful indicator of possible trading losses resulting from adverse daily market moves. The 95%/one-day VaR corresponds to the unrealized loss in portfolio value that, based on historically observed market risk factor movements, would have been exceeded with a frequency of 5%, or five times in every 100 trading days, if the portfolio were held constant for one day.
Our VaR model generally takes into account linear and non-linear exposures to equity and commodity price risk, interest rate risk, credit spread risk and foreign exchange rates. The model also takes into account linear exposures to implied volatility risks for all asset classes and non-linear exposures to implied volatility risks for equity, commodity and foreign exchange referenced products. The VaR model also captures certain implied correlation risks associated with portfolio credit derivatives, as well as certain basis risks (e.g., corporate debt and related credit derivatives).
We use VaR as one of a range of risk management tools. Among their benefits, VaR models permit estimation of a portfolio’s aggregate market risk exposure, incorporating a range of varied market risks and portfolio assets. One key element of the VaR model is that it reflects risk reduction due to portfolio diversification or hedging activities. However, VaR has various limitations, which include, but are not limited to: use of historical changes in market risk factors, which may not be accurate predictors of future market conditions and may not fully incorporate the risk of extreme market events that are outsized relative to observed historical market behavior or reflect the historical distribution of results beyond the 95% confidence interval; and reporting of losses in a single day, which does not reflect the risk of positions that cannot be liquidated or hedged in one day. A small proportion of market risk generated by trading positions is not included in VaR.
| | | | | | | | |
| 65 | December 2020 Form 10-K |
The modeling of the risk characteristics of some positions relies on approximations that, under certain circumstances, could produce significantly different results from those produced using more precise measures. VaR is most appropriate as a risk measure for trading positions in liquid financial markets and will understate the risk associated with severe events, such as periods of extreme illiquidity. We are aware of these and other limitations and, therefore, use VaR as only one component in our risk management oversight process. This process also incorporates stress testing and scenario analyses and extensive risk monitoring, analysis and control at the trading desk, division and Firm levels.
Our VaR model evolves over time in response to changes in the composition of trading portfolios and to improvements in modeling techniques and systems capabilities. We are committed to continuous review and enhancement of VaR methodologies and assumptions in order to capture evolving risks associated with changes in market structure and dynamics. As part of our regular process improvements, additional systematic and name-specific risk factors may be added to improve the VaR model’s ability to more accurately estimate risks to specific asset classes or industry sectors.
Since the reported VaR statistics are estimates based on historical data, VaR should not be viewed as predictive of our future revenues or financial performance or of our ability to monitor and manage risk. There can be no assurance that our actual losses on a particular day will not exceed the VaR amounts indicated in the following tables or that such losses will not occur more than five times in 100 trading days for a 95%/one-day VaR. VaR does not predict the magnitude of losses that, should they occur, may be significantly greater than the VaR amount.
VaR statistics are not readily comparable across firms because of differences in the firms’ portfolios, modeling assumptions and methodologies. These differences can result in materially different VaR estimates across firms for similar portfolios. The impact of such differences varies depending on the factor history assumptions, the frequency with which the factor history is updated and the confidence level. As a result, VaR statistics are more useful when interpreted as indicators of trends in a firm’s risk profile rather than as an absolute measure of risk to be compared across firms.
Our regulators have approved the same VaR model we use for risk management purposes for use in regulatory calculations.
The portfolio of positions used for Management VaR differs from that used for Regulatory VaR. Management VaR contains certain positions that are excluded from Regulatory VaR.
95%/One-Day Management VaR
| | | | | | | | | | | | | | |
| | 2020 |
| $ in millions | Period
End | Average | High2 | Low2 |
| Interest rate and credit spread | $ | 35 | | $ | 37 | | $ | 62 | | $ | 24 | |
| Equity price | 23 | | 23 | | 39 | | 12 | |
| Foreign exchange rate | 14 | | 10 | | 19 | | 5 | |
| Commodity price | 15 | | 17 | | 29 | | 10 | |
Less: Diversification benefit1 | (32) | | (43) | | N/A | N/A |
| Primary Risk Categories | $ | 55 | | $ | 44 | | $ | 62 | | $ | 28 | |
| Credit Portfolio | 31 | | 22 | | 31 | | 12 | |
Less: Diversification benefit1 | (10) | | (12) | | N/A | N/A |
| Total Management VaR | $ | 76 | | $ | 54 | | $ | 78 | | $ | 32 | |
| | | | | | | | | | | | | | |
| | 2019 |
| $ in millions | Period
End | Average | High2 | Low2 |
| Interest rate and credit spread | $ | 26 | | $ | 29 | | $ | 43 | | $ | 24 | |
| Equity price | 11 | | 15 | | 22 | | 11 | |
| Foreign exchange rate | 10 | | 13 | | 20 | | 6 | |
| Commodity price | 10 | | 14 | | 22 | | 10 | |
Less: Diversification benefit1 | (27) | | (35) | | N/A | N/A |
| Primary Risk Categories | $ | 30 | | $ | 36 | | $ | 47 | | $ | 30 | |
| Credit Portfolio | 15 | | 16 | | 19 | | 13 | |
Less: Diversification benefit1 | (10) | | (11) | | N/A | N/A |
| Total Management VaR | $ | 35 | | $ | 41 | | $ | 51 | | $ | 33 | |
1.Diversification benefit equals the difference between the total Management VaR and the sum of the component VaRs. This benefit arises because the simulated one-day losses for each of the components occur on different days; similar diversification benefits also are taken into account within each component.
2.The high and low VaR values for the total Management VaR and each of the component VaRs might have occurred on different days during the quarter, and therefore, the diversification benefit is not an applicable measure.
Average total Management VaR and Management VaR for the Primary Risk Categories increased from 2019 driven by increased market volatility in 2020 due to the COVID-19 pandemic.
Distribution of VaR Statistics and Net Revenues
We evaluate the reasonableness of our VaR model by comparing the potential declines in portfolio values generated by the model with corresponding actual trading results for the Firm, as well as individual business units. For days where losses exceed the VaR statistic, we examine the drivers of trading losses to evaluate the VaR model’s accuracy relative to realized trading results. There were seven trading loss days in 2020, one of which exceeded 95% Total Management VaR.
| | | | | | | | |
| December 2020 Form 10-K | 66 | |
Daily 95%/One-Day Total Management VaR for 2020
($ in millions)
Daily Net Trading Revenues for 2020
($ in millions)
The previous histogram shows the distribution of daily net trading revenues for 2020. Daily net trading revenues include profits and losses from Interest rate and credit spread, Equity price, Foreign exchange rate, Commodity price, and Credit Portfolio positions and intraday trading activities for our trading businesses. Certain items such as fees, commissions and net interest income are excluded from daily net trading revenues and the VaR model. Revenues required for Regulatory VaR backtesting further exclude intraday trading.
Non-Trading Risks
We believe that sensitivity analysis is an appropriate representation of our non-trading risks. The following sensitivity analyses cover substantially all of the non-trading risk in our portfolio.
Credit Spread Risk Sensitivity1
| | | | | | | | |
| $ in millions | At
December 31,
2020 | At
December 31,
2019 |
| Derivatives | $ | 7 | | $ | 6 | |
Funding liabilities2 | 50 | | 42 | |
1.Amounts represent the potential gain for each 1 bps widening of our credit spread.
2.Relates to Borrowings carried at fair value.
Credit spread risk sensitivity for funding liabilities as of December 31, 2020 increased primarily due to new issuances and the effect of our credit spread tightening.
U.S. Bank Subsidiaries’ Net Interest Income Sensitivity Analysis
| | | | | | | | |
| $ in millions | At
December 31,
2020 | At
December 31,
2019 |
| Basis point change | | |
| +100 | $ | 1,540 | | $ | 151 | |
| -100 | (654) | | (642) | |
The previous table presents an analysis of selected instantaneous upward and downward parallel interest rate shocks (subject to a floor of zero percent in the downward scenario) on net interest income over the next 12 months for our U.S. Bank Subsidiaries. These shocks are applied to our 12-month forecast for our U.S. Bank Subsidiaries, which incorporates market expectations of interest rates and our forecasted business activity.
We do not manage to any single rate scenario but rather manage net interest income in our U.S. Bank Subsidiaries to optimize across a range of possible outcomes, including non-parallel rate change scenarios. The sensitivity analysis assumes that we take no action in response to these scenarios, assumes there are no changes in other macroeconomic variables normally correlated with changes in interest rates, and includes subjective assumptions regarding customer and market re-pricing behavior and other factors. The change in sensitivity to interest rates in the positive 100 basis point scenario between December 31, 2020 and December 31, 2019 is primarily driven by higher deposit balances, expectations for deposit pricing at current levels of rates and incremental assets and liabilities from E*TRADE.
Investments Sensitivity, Including Related Performance Fees
| | | | | | | | |
| | Loss from 10% Decline |
| $ in millions | At
December 31,
2020 | At
December 31,
2019 |
Investments related to Investment Management activities | $ | 386 | | $ | 367 | |
| Other investments: | | |
| MUMSS | 184 | | 169 | |
| Other Firm investments | 210 | | 195 | |
MUMSS—Mitsubishi UFJ Morgan Stanley Securities Co., Ltd.
We have exposure to public and private companies through direct investments, as well as through funds that invest in these assets. These investments are predominantly equity
| | | | | | | | |
| 67 | December 2020 Form 10-K |
positions with long investment horizons, a portion of which is for business facilitation purposes. The market risk related to these investments is measured by estimating the potential reduction in net income associated with a 10% decline in investment values and related impact on performance-based fees, as applicable.
Asset Management Revenue Sensitivity
Certain asset management revenues in the Wealth Management and Investment Management business segments are derived from management fees, which are based on fee-based client assets in Wealth Management or AUM in Investment Management (together, “client holdings”). The assets underlying client holdings are primarily composed of equity, fixed income and alternative investments, and are sensitive to changes in related markets. The overall level of these revenues depends on multiple factors that include, but are not limited to, the level and duration of a market increase or decline, price volatility, the geographic and industry mix of client assets, and client behavior such as the rate and magnitude of client investments and redemptions. Therefore, overall revenues do not correlate completely with changes in the related markets.
Credit Risk
Credit risk refers to the risk of loss arising when a borrower, counterparty or issuer does not meet its financial obligations to us. We are primarily exposed to credit risk from institutions and individuals through our Institutional Securities and Wealth Management business segments.
We incur credit risk in our Institutional Securities business segment through a variety of activities, including, but not limited to, the following:
•extending credit to clients through loans and lending commitments;
•entering into swap or other derivative contracts under which counterparties may have obligations to make payments to us;
•providing short- or long-term funding that is secured by physical or financial collateral whose value may at times be insufficient to fully cover the repayment amount;
•posting margin and/or collateral to clearinghouses, clearing agencies, exchanges, banks, securities firms and other financial counterparties;
•placing funds on deposit at other financial institutions to support our clearing and settlement obligations; and
•investing or trading in securities and loan pools, whereby the value of these assets may fluctuate based on realized or expected defaults on the underlying obligations or loans.
We incur credit risk in our Wealth Management business segment, primarily through lending to individuals and entities, including, but not limited to, the following:
•margin loans collateralized by securities;
•securities-based lending and other forms of secured loans, including tailored lending to high and ultra-high net worth clients;
•single-family residential mortgage loans in conforming, non-conforming or HELOC form primarily to existing Wealth Management clients; and
•employee loans granted primarily to recruit certain Wealth Management representatives.
Monitoring and Control
The Credit Risk Management Department (“CRM”) establishes Firmwide practices to evaluate, monitor and control credit risk at the transaction, obligor and portfolio levels. CRM approves extensions of credit, evaluates the creditworthiness of the counterparties and borrowers on a regular basis, and helps ensure that credit exposure is actively monitored and managed. The evaluation of counterparties and borrowers includes an assessment of the probability that an obligor will default on its financial obligations and any losses that may occur when an obligor defaults. In addition, credit risk exposure is actively managed by credit professionals and committees within CRM and through various risk committees, whose membership includes individuals from CRM. A comprehensive and global Credit Limits Framework is utilized to manage credit risk levels across the Firm. The Credit Limits Framework is calibrated within our risk tolerance and includes single-name limits and portfolio concentration limits by country, industry and product type.
CRM helps ensure timely and transparent communication of material credit risks, compliance with established limits and escalation of risk concentrations to appropriate senior management. CRM also works closely with the Market Risk Department and applicable business units to monitor risk exposures and to perform stress tests to identify, analyze and control credit risk concentrations arising from lending and trading activities. The stress tests shock market factors (e.g., interest rates, commodity prices, credit spreads), risk parameters (e.g., probability of default and loss given default), recovery rates and expected losses in order to assess the impact of stresses on exposures, profit and loss, and our capital position. Stress tests are conducted in accordance with our established policies and procedures.
Credit Evaluation
The evaluation of corporate and institutional counterparties and borrowers includes assigning credit ratings, which reflect an assessment of an obligor’s probability of default and loss given default. Credit evaluations typically involve the assessment of financial statements; leverage; liquidity; capital strength; asset composition and quality; market capitalization; access to capital markets; adequacy of collateral, if applicable; and, in the case of certain loans, cash flow projections and debt service requirements. CRM also evaluates strategy, market position, industry dynamics, management and other factors that could affect the obligor’s risk profile. Additionally, CRM evaluates the relative position
| | | | | | | | |
| December 2020 Form 10-K | 68 | |
of our exposure in the borrower’s capital structure and relative recovery prospects, as well as other structural elements of the particular transaction.
The evaluation of consumer borrowers is tailored to the specific type of lending. Securities-based loans are evaluated based on factors that include, but are not limited to, the amount of the loan and the amount, quality, diversification, price volatility and liquidity of the collateral. The underwriting of residential real estate loans includes, but is not limited to, review of the obligor’s debt-to-income ratio, net worth, liquidity, collateral, LTV ratio and industry standard credit scoring models (e.g., FICO scores). Subsequent credit monitoring for individual loans is performed at the portfolio level, and collateral values are monitored on an ongoing basis.
Credit risk metrics assigned to our borrowers during the evaluation process are incorporated into CRM maintenance of the allowance for loan losses for loans held for investment. Such allowance serves as a reserve for probable inherent losses, as well as probable losses related to loans identified as impaired. For more information on the allowance for loan losses, see Notes 2 and 10 to the financial statements.
Risk Mitigation
We may seek to mitigate credit risk from our lending and trading activities in multiple ways, including collateral provisions, guarantees and hedges. At the transaction level, we seek to mitigate risk through management of key risk elements such as size, tenor, financial covenants, seniority and collateral. We actively hedge our lending and derivatives exposures. Hedging activities consist of the purchase or sale of positions in related securities and financial instruments, including a variety of derivative products (e.g., futures, forwards, swaps and options). Additionally, we may sell, assign or syndicate loans and lending commitments to other financial institutions in the primary and secondary loan markets.
In connection with our derivatives trading activities, we generally enter into master netting agreements and collateral arrangements with counterparties. These agreements provide us with the ability to demand collateral, as well as to liquidate collateral and offset receivables and payables covered under the same master agreement in the event of a counterparty default. A collateral management group monitors collateral levels against requirements and oversees the administration of the collateral function. See Note 9 to the financial statements for additional information about our collateralized transactions.
Loans and Lending Commitments
| | | | | | | | | | | | | | |
| | At December 31, 2020 |
| $ in millions | HFI | HFS | FVO | Total |
| Institutional Securities: | | | | |
| Corporate | $ | 6,046 | | $ | 8,580 | | $ | 13 | | $ | 14,639 | |
| Secured lending facilities | 25,727 | | 3,296 | | 648 | | 29,671 | |
| Commercial and Residential real estate | 7,346 | | 859 | | 3,061 | | 11,266 | |
| Securities-based lending and Other | 1,279 | | 55 | | 7,001 | | 8,335 | |
| Total Institutional Securities | 40,398 | | 12,790 | | 10,723 | | 63,911 | |
| Wealth Management: | | | | |
| Residential real estate | 35,268 | | 11 | | — | | 35,279 | |
| Securities-based lending and Other | 62,947 | | — | | — | | 62,947 | |
| Total Wealth Management | 98,215 | | 11 | | — | | 98,226 | |
Total Investment Management1 | 6 | | 12 | | 425 | | 443 | |
Total loans2 | 138,619 | | 12,813 | | 11,148 | | 162,580 | |
| ACL | (835) | | | | (835) | |
| Total loans, net of ACL | $ | 137,784 | | $ | 12,813 | | $ | 11,148 | | $ | 161,745 | |
Lending commitments3 | | | | $ | 127,855 | |
| Total exposure |
|
|
| $ | 289,600 | |
| | | | | | | | | | | | | | |
| At December 31, 2019 |
| $ in millions | HFI | HFS | FVO | Total |
| Institutional Securities: | | | | |
| Corporate | $ | 5,426 | | $ | 6,192 | | $ | 20 | | $ | 11,638 | |
| Secured lending facilities | 24,502 | | 4,200 | | 951 | | 29,653 | |
| Commercial and Residential real estate | 7,859 | | 2,049 | | 3,290 | | 13,198 | |
| Securities-based lending and Other | 503 | | 123 | | 6,814 | | 7,440 | |
| Total Institutional Securities | 38,290 | | 12,564 | | 11,075 | | 61,929 | |
| Wealth Management: | | | | |
| Residential real estate | 30,184 | | 13 | | — | | 30,197 | |
| Securities-based lending and Other | 49,930 | | — | | — | | 49,930 | |
| Total Wealth Management | 80,114 | | 13 | | — | | 80,127 | |
Total Investment Management1 | 5 | | — | | 251 | | 256 | |
Total loans2 | 118,409 | | 12,577 | | 11,326 | | 142,312 | |
| ACL | (349) | | | | (349) | |
| Total loans, net of ACL | $ | 118,060 | | $ | 12,577 | | $ | 11,326 | | $ | 141,963 | |
Lending commitments3 | | | | $ | 120,068 | |
| Total exposure |
|
|
| $ | 262,031 | |
HFI—Held for investment; HFS—Held for sale; FVO—Fair value option
Total exposure—consists of Total loans, net of ACL, and Lending commitments
1.Investment Management business segment loans are related to certain of our activities as an investment advisor and manager. At December 31, 2020 and December 31, 2019, loans held at fair value are the result of the consolidation of CLO vehicles, managed by Investment Management, composed primarily of senior secured loans to corporations.
2.FVO also includes the fair value of certain unfunded lending commitments.
3.Lending commitments represent the notional amount of legally binding obligations to provide funding to clients for lending transactions. Since commitments associated with these business activities may expire unused or may not be utilized to full capacity, they do not necessarily reflect the actual future cash funding requirements.
We provide loans and lending commitments to a variety of customers, including large corporate and institutional clients, as well as high to ultra-high net worth individuals. In addition, we purchase loans in the secondary market. Loans and lending commitments are either held for investment, held for sale or carried at fair value. For more information on these loan classifications, see Note 2 to the financial statements.
| | | | | | | | |
| 69 | December 2020 Form 10-K |
In 2020, total loans and lending commitments increased by approximately $28 billion, primarily due to growth in securities-based loans and Residential real estate loans within the Wealth Management business segment and an increase in Relationship lending commitments within the Institutional Securities business segment.
See Notes 5, 6, 10 and 15 to the financial statements for further information.
Beginning late in the first quarter of 2020 and following in part from the U.S. government’s enactment of the CARES Act, we have received requests from certain clients for modifications of their credit agreements with us, which in some cases include deferral of their loan payments. Initial borrower requests for loan payment deferrals related to Residential real estate loans are granted, while those related to Commercial real estate loans require careful consideration prior to approval. As of December 31, 2020, the outstanding principal balance of loans with approved deferrals of principal and interest payments currently in place which are not classified as troubled debt restructurings amounted to approximately $400 million for our Institutional Securities business segment, primarily Commercial real estate loans, and approximately $400 million for our Wealth Management business segment, primarily commercial real estate-related tailored loans within Securities-based lending and Other, and Residential real estate loans. Incremental to this population, throughout 2020, we have provided deferrals of principal and interest on approximately $2.7 billion of loans which have now exited such modification arrangements. The substantial majority of these loans are current as of December 31, 2020.
In addition to these principal and interest deferrals, we are working with clients regarding modifications of certain other terms under their original loan agreements that do not impact contractual loan payments. We have granted such relief to certain borrowers, primarily within Secured lending facilities and Corporate loans. Such modifications include agreements to modify margin calls for Secured lending facilities, typically in return for additional payments that improve LTV ratios. In some cases, we have agreed to temporarily not enforce certain covenants, for example debt or interest coverage ratios, typically in return for other structural enhancements.
Granting loan deferral or modification requests does not necessarily mean that we will incur credit losses, and we do not believe modifications have had a material impact on the risk profile of our loan portfolio. Modifications are considered in our evaluation of overall credit risk. Generally, loans with payment deferrals remain on accrual status, and loans with other modifications remain on current status.
Requests for deferrals and other modifications could continue in future periods given the ongoing uncertain global economic and market conditions. See “Executive Summary—Coronavirus Disease (COVID-19) Pandemic” and “Risk Factors” herein for further information. See also “Forward Looking Statements” herein. For additional information on
regulatory guidance which permits certain loan modifications for borrowers impacted by COVID-19 to not be accounted for and reported as TDRs and the Firm’s accounting policies for such modifications, see “Liquidity and Capital Resources—Regulatory Requirements—Regulatory Developments” herein and Note 2 to the financial statements, respectively. For information on HFI loans on nonaccrual status, see “Status of Loans Held for Investment” herein and Notes 2 and 10 to the financial statements. For HFI loans modified and reported as TDRs, see Notes 2 and 10 to the financial statements.
Allowance for Credit Losses—Loans and Lending Commitments
| | | | | |
| $ in millions | |
December 31, 20191 | $ | 590 | |
| Effect of CECL adoption | (41) | |
| Gross charge-offs | (105) | |
| Recoveries | 8 | |
| Net (charge-offs) recoveries | (97) | |
Provision2 | 762 | |
| Other | 17 | |
| December 31, 2020 | $ | 1,231 | |
| ACL—Loans | $ | 835 | |
| ACL—Lending commitments | 396 | |
1.At December 31, 2019, the ACL for Loans and Lending commitments was $349 million and $241 million, respectively.
2.In 2020, the provision for loan losses was $559 million, and the provision for losses on lending commitments was $203 million.
Credit exposure arising from our loans and lending commitments is measured in accordance with our internal risk management standards. Risk factors considered in determining the aggregate allowance for loan and commitment losses include the borrower’s financial strength, industry, facility structure, LTV ratio, debt service ratio, collateral and covenants. Qualitative and environmental factors such as economic and business conditions, nature and volume of the portfolio and lending terms, and volume and severity of past due loans may also be considered.
The aggregate allowance for loans and lending commitment losses increased in 2020, reflecting the provision for credit losses within the Institutional Securities business segment principally resulting from the continued economic impact of COVID-19, partially offset by charge-offs. The provision was primarily the result of actual and forecasted changes in asset quality trends, as well as risks related to uncertainty in the outlook for the sectors in focus due to COVID-19. Charge-offs in 2020 were primarily related to certain Commercial real estate and Corporate loans in the Institutional Securities business segment. The base scenario used in our ACL models as of December 31, 2020 was generated using a combination of industry consensus economic forecasts, forward rates, and internally developed and validated models. Given the nature of our lending portfolio, the most sensitive model input is U.S. gross domestic product. The base scenario, among other things, assumes a continued recovery through 2021, supported by fiscal stimulus and monetary policy measures. See Notes 10 and 15 to the financial statements for further information.
| | | | | | | | |
| December 2020 Form 10-K | 70 | |
See Note 2 to the financial statements for a discussion of the Firm’s ACL methodology under CECL.
Status of Loans Held for Investment
| | | | | | | | | | | | | | |
| At December 31, 2020 | At December 31, 2019 |
| IS | WM | IS | WM |
| Accrual | 99.2 | % | 99.7 | % | 99.0 | % | 99.9 | % |
Nonaccrual1 | 0.8 | % | 0.3 | % | 1.0 | % | 0.1 | % |
1.These loans are on nonaccrual status because the loans were past due for a period of 90 days or more or payment of principal or interest was in doubt.
Institutional Securities Loans and Lending Commitments1
| | | | | | | | | | | | | | | | | |
| | At December 31, 2020 |
| | Contractual Years to Maturity | |
| $ in millions | Less than 1 | 1-3 | 3-5 | Over 5 | Total |
| Loans | | | | | |
| AA | $ | 279 | | $ | 10 | | $ | — | | $ | — | | $ | 289 | |
| A | 759 | | 798 | | 36 | | 391 | | 1,984 | |
| BBB | 5,043 | | 5,726 | | 2,746 | | 469 | | 13,984 | |
| BB | 10,963 | | 7,749 | | 5,324 | | 503 | | 24,539 | |
| Other NIG | 5,214 | | 6,956 | | 4,002 | | 3,269 | | 19,441 | |
Unrated2 | 141 | | 142 | | 330 | | 2,322 | | 2,935 | |
| Total loans | 22,399 | | 21,381 | | 12,438 | | 6,954 | | 63,172 | |
| Lending commitments | | | | |
| AAA | — | | 50 | | — | | — | | 50 | |
| AA | 4,047 | | 1,038 | | 2,135 | | — | | 7,220 | |
| A | 6,025 | | 8,359 | | 9,808 | | 425 | | 24,617 | |
| BBB | 6,783 | | 17,782 | | 15,500 | | 460 | | 40,525 | |
| BB | 4,357 | | 8,958 | | 7,958 | | 3,103 | | 24,376 | |
| Other NIG | 664 | | 7,275 | | 6,077 | | 2,652 | | 16,668 | |
Unrated2 | 4 | | — | | — | | — | | 4 | |
Total lending commitments | 21,880 | | 43,462 | | 41,478 | | 6,640 | | 113,460 | |
| Total exposure | $ | 44,279 | | $ | 64,843 | | $ | 53,916 | | $ | 13,594 | | $ | 176,632 | |
| | | | | | | | | | | | | | | | | |
| | At December 31, 2019 |
| | Contractual Years to Maturity | |
| $ in millions | Less than 1 | 1-3 | 3-5 | Over 5 | Total |
| Loans | | | | | |
| AA | $ | 7 | | $ | 50 | | $ | — | | $ | 5 | | $ | 62 | |
| A | 955 | | 923 | | 516 | | 277 | | 2,671 | |
| BBB | 2,297 | | 5,589 | | 3,592 | | 949 | | 12,427 | |
| BB | 9,031 | | 11,189 | | 9,452 | | 1,449 | | 31,121 | |
| Other NIG | 4,020 | | 5,635 | | 2,595 | | 1,143 | | 13,393 | |
Unrated2 | 117 | | 82 | | 131 | | 1,628 | | 1,958 | |
| Total loans | 16,427 | | 23,468 | | 16,286 | | 5,451 | | 61,632 | |
| Lending commitments | | | | |
| AAA | — | | 50 | | — | | — | | 50 | |
| AA | 2,838 | | 908 | | 2,509 | | — | | 6,255 | |
| A | 6,461 | | 7,287 | | 9,371 | | 298 | | 23,417 | |
| BBB | 7,548 | | 13,780 | | 20,560 | | 753 | | 42,641 | |
| BB | 2,464 | | 5,610 | | 8,333 | | 1,526 | | 17,933 | |
| Other NIG | 2,193 | | 4,741 | | 7,062 | | 2,471 | | 16,467 | |
Unrated2 | — | | 9 | | 107 | | 7 | | 123 | |
Total lending commitments | 21,504 | | 32,385 | | 47,942 | | 5,055 | | 106,886 | |
| Total exposure | $ | 37,931 | | $ | 55,853 | | $ | 64,228 | | $ | 10,506 | | $ | 168,518 | |
NIG–Non-investment grade
1.Counterparty credit ratings are internally determined by the Credit Risk Management Department (“CRM”).
2.Unrated loans and lending commitments are primarily trading positions that are measured at fair value and risk-managed as a component of market risk. For a further discussion of our market risk, see “Quantitative and Qualitative Disclosures about Risk—Market Risk” herein.
Institutional Securities Loans and Lending Commitments by Industry
| | | | | | | | |
| $ in millions | At
December 31,
2020 | At
December 31,
2019 |
| Financials | $ | 44,358 | | $ | 40,992 | |
| Real estate | 25,484 | | 28,348 | |
| Industrials | 15,861 | | 13,136 | |
| Healthcare | 12,650 | | 14,113 | |
| Communications services | 12,600 | | 12,165 | |
| Information technology | 11,358 | | 9,201 | |
| Consumer discretionary | 11,177 | | 9,589 | |
| Energy | 10,064 | | 9,461 | |
| Utilities | 9,504 | | 9,905 | |
| Consumer staples | 9,088 | | 9,724 | |
| Materials | 6,084 | | 5,577 | |
| Insurance | 3,889 | | 3,755 | |
| Other | 4,515 | | 2,552 | |
| Total exposure | $ | 176,632 | | $ | 168,518 | |
Sectors Currently in Focus due to COVID-19
The continuing effect on economic activity of COVID-19 and related governmental actions have impacted borrowers in many sectors and industries. While we are carefully monitoring all of our Institutional Securities business segment exposures, certain sectors are more sensitive to the current economic environment and are continuing to receive heightened focus. The sectors currently in focus are: retail, air travel, upstream energy, lodging and leisure, and healthcare services and systems. As of December 31, 2020, exposures to these sectors are included across the Industrials, Financials, Real estate, Consumer discretionary, Energy and Healthcare industries in the previous table, and in aggregate represent less than 10% of total Institutional Securities business segment lending exposure. Further, as of December 31, 2020, approximately 90% of these exposures are either investment grade and/or secured by collateral. The future developments of COVID-19 and related government actions and their effect on the economic environment remain uncertain; therefore, the sectors impacted and the extent of the impacts may change over time. Refer to “Risk Factors” herein.
Institutional Securities Lending Activities
The Institutional Securities business segment lending activities include Corporate, Secured lending facilities, Commercial real estate and Securities-based lending and Other. Over 90% of our total lending exposure, which consists of loans and lending commitments, is investment grade and/or secured by collateral.
Corporate comprises relationship and event-driven loans and lending commitments, which typically consist of revolving lines of credit, term loans and bridge loans; may have varying terms; may be senior or subordinated; may be secured or unsecured; are generally contingent upon representations, warranties and contractual conditions applicable to the borrower; and may be syndicated, traded or hedged. For additional information on event-driven loans, see
| | | | | | | | |
| 71 | December 2020 Form 10-K |
“Institutional Securities Event-Driven Loans and Lending Commitments” herein.
Secured lending facilities include loans provided to clients, which are collateralized by various assets, including residential and commercial real estate mortgage loans, corporate loans and other assets. These facilities generally provide for overcollateralization. Credit risk with respect to these loans and lending commitments arises from the failure of a borrower to perform according to the terms of the loan agreement and/or a decline in the underlying collateral value. The Firm monitors collateral levels against the requirements of lending agreements. See Note 16 to the financial statements for information about our securitization activities.
Commercial real estate loans are primarily senior, secured by underlying real estate and typically in term loan form. In addition, as part of certain of its trading and securitization activities, Institutional Securities may also hold residential real estate loans.
Securities-based lending and Other includes financing extended to sales and trading customers and corporate loans purchased in the secondary market.
Institutional Securities Event-Driven Loans and Lending Commitments
| | | | | | | | | | | | | | | | | |
| | At December 31, 2020 |
| | Contractual Years to Maturity | |
| $ in millions | Less than 1 | 1-3 | 3-5 | Over 5 | Total |
| Loans, net of ACL | $ | 1,241 | | $ | 907 | | $ | 873 | | $ | 2,090 | | $ | 5,111 | |
| Lending commitments | 2,810 | | 4,649 | | 2,678 | | 4,650 | | 14,787 | |
| Total exposure | $ | 4,051 | | $ | 5,556 | | $ | 3,551 | | $ | 6,740 | | $ | 19,898 | |
| | | | | | | | | | | | | | | | | |
| | At December 31, 2019 |
| | Contractual Years to Maturity | |
| $ in millions | Less than 1 | 1-3 | 3-5 | Over 5 | Total |
| Loans, net of ACL | $ | 1,194 | | $ | 1,024 | | $ | 839 | | $ | 390 | | $ | 3,447 | |
| Lending commitments | 7,921 | | 5,012 | | 2,285 | | 3,090 | | 18,308 | |
| Total exposure | $ | 9,115 | | $ | 6,036 | | $ | 3,124 | | $ | 3,480 | | $ | 21,755 | |
Event-driven loans and lending commitments are associated with a particular event or transaction, such as to support client merger, acquisition, recapitalization or project finance activities. Balances may fluctuate as such lending is related to transactions that vary in timing and size from period to period.
Institutional Securities Loans and Lending Commitments Held for Investment
| | | | | | | | | | | | | |
| At December 31, 2020 | |
| $ in millions | Loans | Lending Commitments | Total | | |
| Corporate | $ | 6,046 | | $ | 69,488 | | $ | 75,534 | | | |
| Secured lending facilities | 25,727 | | 8,312 | | 34,039 | | | |
| Commercial real estate | 7,346 | | 334 | | 7,680 | | | |
| Other | 1,279 | | 1,135 | | 2,414 | | | |
| Total, before ACL | $ | 40,398 | | $ | 79,269 | | $ | 119,667 | | | |
| ACL | $ | (739) | | $ | (391) | | $ | (1,130) | | | |
| | | | | | | | | | | | | |
| | At December 31, 2019 |
| $ in millions | | | Loans | Lending Commitments | Total |
| Corporate | | | $ | 5,426 | | $ | 61,716 | | $ | 67,142 | |
| Secured lending facilities | | | 24,502 | | 6,105 | | 30,607 | |
| Commercial real estate | | | 7,859 | | 425 | | 8,284 | |
| Other | | | 503 | | 832 | | 1,335 | |
| Total, before ACL | | | $ | 38,290 | | $ | 69,078 | | $ | 107,368 | |
| ACL | | | $ | (297) | | $ | (236) | | $ | (533) | |
Institutional Securities Allowance for Credit Losses—Loans and Lending Commitments
| | | | | | | | | | | | | | | | | |
| $ in millions | Corporate | Secured lending facilities | Commercial real estate | Other | Total |
| At December 31, 2019 | | | | | |
| ACL—Loans | $ | 115 | | $ | 101 | | $ | 75 | | $ | 6 | | $ | 297 | |
| ACL—Lending commitments | $ | 201 | | $ | 27 | | $ | 7 | | $ | 1 | | $ | 236 | |
| Total | $ | 316 | | $ | 128 | | $ | 82 | | $ | 7 | | $ | 533 | |
| Effect of CECL adoption | (43) | | (53) | | 35 | | 3 | | (58) | |
| Gross charge-offs | (39) | | — | | (64) | | — | | (103) | |
| Recoveries | 4 | | — | | — | | 4 | | 8 | |
| Net (charge-offs) recoveries | (35) | | — | | (64) | | 4 | | (95) | |
Provision (release)1 | 386 | | 158 | | 204 | | (15) | | 733 | |
| Other | 8 | | 3 | | (35) | | 41 | | 17 | |
Total at December 31, 2020 | $ | 632 | | $ | 236 | | $ | 222 | | $ | 40 | | $ | 1,130 | |
| ACL—Loans | $ | 309 | | $ | 198 | | $ | 211 | | $ | 21 | | $ | 739 | |
| ACL—Lending commitments | 323 | | 38 | | 11 | | 19 | | 391 | |
| | | | | |
| | | | | |
1.In 2020, the provision for loan losses was $529 million and the provision for losses on lending commitments was $204 million.
Institutional Securities HFI Loans—Ratios of Allowance for Credit Losses to Balance before Allowance | | | | | | | | |
| At
December 31,
2020 | At
December 31,
2019 |
| Corporate | 5.1 | % | 2.1 | % |
| Secured lending facilities | 0.8 | % | 0.4 | % |
| Commercial real estate | 2.9 | % | 1.0 | % |
| Other | 1.7 | % | 1.2 | % |
| Total Institutional Securities loans | 1.8 | % | 0.8 | % |
Wealth Management Loans and Lending Commitments
| | | | | | | | | | | | | | | | | |
| | At December 31, 2020 |
| | Contractual Years to Maturity | |
| $ in millions | Less than 1 | 1-3 | 3-5 | Over 5 | Total |
| Securities-based lending and Other loans | $ | 54,483 | | $ | 4,587 | | $ | 2,167 | | $ | 1,672 | | $ | 62,909 | |
| Residential real estate loans | 9 | | 1 | | 1 | | 35,210 | | 35,221 | |
| Total loans, net of ACL | $ | 54,492 | | $ | 4,588 | | $ | 2,168 | | $ | 36,882 | | $ | 98,130 | |
| Lending commitments | 11,666 | | 2,356 | | 120 | | 253 | | 14,395 | |
| Total exposure | $ | 66,158 | | $ | 6,944 | | $ | 2,288 | | $ | 37,135 | | $ | 112,525 | |
| |
| | | | | | | | |
| December 2020 Form 10-K | 72 | |
| | | | | | | | | | | | | | | | | |
| | At December 31, 2019 |
| | Contractual Years to Maturity | |
| $ in millions | Less than 1 | 1-3 | 3-5 | Over 5 | Total |
| Securities-based lending and Other loans | $ | 41,863 | | $ | 3,972 | | $ | 2,783 | | $ | 1,284 | | $ | 49,902 | |
| Residential real estate loans | 13 | | 11 | | — | | 30,149 | | 30,173 | |
| Total loans, net of ACL | $ | 41,876 | | $ | 3,983 | | $ | 2,783 | | $ | 31,433 | | $ | 80,075 | |
| Lending commitments | 10,219 | | 2,564 | | 71 | | 307 | | 13,161 | |
| Total exposure | $ | 52,095 | | $ | 6,547 | | $ | 2,854 | | $ | 31,740 | | $ | 93,236 | |
| |
The principal Wealth Management business segment lending activities include securities-based lending and residential real estate loans.
Securities-based lending allows clients to borrow money against the value of qualifying securities, generally for any purpose other than purchasing, trading or carrying securities, or refinancing margin debt. We establish approved credit lines against qualifying securities and monitor limits daily and, pursuant to such guidelines, require customers to deposit additional collateral, or reduce debt positions, when necessary. These credit lines are primarily uncommitted loan facilities, as we reserve the right to not make any advances or may terminate these credit lines at any time. Factors considered in the review of these loans include, but are not limited to, the loan amount, the client’s credit profile, the degree of leverage, collateral diversification, price volatility and liquidity of the collateral.
Residential real estate loans consist of first and second lien mortgages, including HELOCs. Our underwriting policy is designed to ensure that all borrowers pass an assessment of capacity and willingness to pay, which includes an analysis utilizing industry standard credit scoring models (e.g., FICO scores), debt-to-income ratios and assets of the borrower. LTV ratios are determined based on independent third-party property appraisals and valuations, and security lien positions are established through title and ownership reports. The vast majority of mortgage loans, including HELOCs, are held for investment in the Wealth Management business segment’s loan portfolio.
In 2020, Loans and Lending commitments associated with the Wealth Management business segment increased, driven by securities-based loans and residential real estate loans.
Wealth Management Allowance for Credit Losses—Loans and Lending Commitments
| | | | | |
| $ in millions | |
December 31, 20191 | $ | 57 | |
| Effect of CECL adoption | 17 | |
| Gross charge-offs | (2) | |
Provision2 | 29 | |
| December 31, 2020 | $ | 101 | |
| ACL—Loans | $ | 96 | |
| ACL—Lending commitments | 5 | |
| |
| |
1.At December 31, 2019, the ACL for Loans and Lending commitments was $52 million and $5 million, respectively.
2.In 2020 the provision for loan losses was $30 million and the release for losses on lending commitments was $1 million.
At December 31, 2020, more than 75% of Wealth Management residential real estate loans were to borrowers with “Exceptional” or “Very Good” FICO scores (i.e., exceeding 740). Additionally, Wealth Management’s securities-based lending portfolio remains well-collateralized and subject to daily client margining, which includes requiring customers to deposit additional collateral or reduce debt positions, when necessary.
Customer and Other Receivables
Margin and Other Lending
| | | | | | | | |
| $ in millions | At
December 31,
2020 | At
December 31,
2019 |
| Institutional Securities | $ | 51,570 | | $ | 22,216 | |
| Wealth Management | 23,144 | | 9,700 | |
| Total | $ | 74,714 | | $ | 31,916 | |
The Institutional Securities and Wealth Management business segments provide margin lending arrangements that allow customers to borrow against the value of qualifying securities, primarily for the purpose of purchasing additional securities, as well as to collateralize short positions. Margin lending activities generally have lower credit risk due to the value of collateral held and their short-term nature. Also included in the amounts in the previous table is non-purpose securities-based lending on non-bank entities in the Wealth Management business segment. Amounts may fluctuate from period to period as overall client balances change as a result of market levels, client positioning and leverage. In addition, margin and other loans in the Wealth Management business segment increased due to the acquisition of E*TRADE.
| | | | | | | | |
| 73 | December 2020 Form 10-K |
Employee Loans
| | | | | | | | |
| $ in millions | At
December 31,
2020 | At
December 31,
2019 |
| Currently employed by the Firm | $ | 3,100 | | N/A |
| No longer employed by the Firm | 140 | | N/A |
| Employee loans | $ | 3,240 | | $ | 2,980 | |
ACL1 | (165) | | (61) | |
| Employee loans, net of ACL | $ | 3,075 | | $ | 2,919 | |
| Remaining repayment term, weighted average in years | 5.3 | 4.8 |
1.The change in ACL includes a $124 million increase due to the adoption of CECL on January 1, 2020.
Employee loans are granted in conjunction with a program established primarily to recruit certain Wealth Management representatives and are full recourse and generally require periodic repayments. The ACL as of December 31, 2020 was calculated under CECL, while the ACL at December 31, 2019 was calculated under the prior incurred loss model. The related provision is recorded in Compensation and benefits expenses in the income statements. See Note 2 to the financial statements for a description of the CECL allowance methodology, including credit quality indicators, for employee loans. For additional information on employee loans, see Note 10 to the financial statements.
Derivatives
Fair Value of OTC Derivative Assets
| | | | | | | | | | | | | | | | | | | | |
| | Counterparty Credit Rating1 | |
| $ in millions | AAA | AA | A | BBB | NIG | Total |
| At December 31, 2020 | | | | |
| <1 year | $ | 1,179 | | $ | 16,166 | | $ | 52,164 | | $ | 26,088 | | $ | 12,175 | | $ | 107,772 | |
| 1-3 years | 572 | | 5,225 | | 17,560 | | 13,750 | | 8,134 | | 45,241 | |
| 3-5 years | 359 | | 4,326 | | 11,328 | | 8,363 | | 4,488 | | 28,864 | |
| Over 5 years | 4,545 | | 32,049 | | 84,845 | | 63,084 | | 13,680 | | 198,203 | |
| Total, gross | $ | 6,655 | | $ | 57,766 | | $ | 165,897 | | $ | 111,285 | | $ | 38,477 | | $ | 380,080 | |
| Counterparty netting | (3,269) | | (44,306) | | (134,310) | | (84,171) | | (22,227) | | (288,283) | |
| Cash and securities collateral | (3,124) | | (10,973) | | (26,712) | | (20,708) | | (8,979) | | (70,496) | |
| Total, net | $ | 262 | | $ | 2,487 | | $ | 4,875 | | $ | 6,406 | | $ | 7,271 | | $ | 21,301 | |
| | | | | | | | | | | | | | | | | | | | |
| | Counterparty Credit Rating1 | |
| $ in millions | AAA | AA | A | BBB | NIG | Total |
| At December 31, 2019 | | | | |
| <1 year | $ | 371 | | $ | 9,195 | | $ | 31,789 | | $ | 22,757 | | $ | 6,328 | | $ | 70,440 | |
| 1-3 years | 378 | | 5,150 | | 17,707 | | 11,495 | | 9,016 | | 43,746 | |
| 3-5 years | 502 | | 4,448 | | 9,903 | | 6,881 | | 3,421 | | 25,155 | |
| Over 5 years | 3,689 | | 24,675 | | 70,765 | | 40,542 | | 14,587 | | 154,258 | |
| Total, gross | $ | 4,940 | | $ | 43,468 | | $ | 130,164 | | $ | 81,675 | | $ | 33,352 | | $ | 293,599 | |
| Counterparty netting | (2,172) | | (33,521) | | (103,452) | | (62,345) | | (19,514) | | (221,004) | |
| Cash and securities collateral | (2,641) | | (8,134) | | (22,319) | | (14,570) | | (10,475) | | (58,139) | |
| Total, net | $ | 127 | | $ | 1,813 | | $ | 4,393 | | $ | 4,760 | | $ | 3,363 | | $ | 14,456 | |
| | | | | | | | |
| $ in millions | At
December 31,
2020 | At
December 31,
2019 |
| Industry | |
| Financials | $ | 6,195 | | $ | 3,448 | |
| Utilities | 3,954 | | 4,275 | |
| Consumer discretionary | 1,866 | | 370 | |
| Healthcare | 1,494 | | 991 | |
| Industrials | 1,291 | | 914 | |
| Information technology | 1,104 | | 659 | |
| Energy | 965 | | 524 | |
| Regional governments | 806 | | 791 | |
| Not-for-profit organizations | 701 | | 657 | |
| Sovereign governments | 650 | | 403 | |
| Communications services | 529 | | 381 | |
| Insurance | 518 | | 214 | |
| Materials | 430 | | 325 | |
| Real estate | 378 | | 315 | |
| Consumer staples | 339 | | 129 | |
| Other | 81 | | 60 | |
| Total | $ | 21,301 | | $ | 14,456 | |
1.Counterparty credit ratings are determined internally by CRM.
We are exposed to credit risk as a dealer in OTC derivatives. Credit risk with respect to derivative instruments arises from the possibility that a counterparty may fail to perform according to the terms of the contract. For a description of our risk mitigation strategies, see “Credit Risk—Risk Mitigation” herein. In 2020, our exposure to credit risk arising from OTC derivatives has increased, primarily as a function of the effect of market factors and volatility on the valuation of our positions, although exposure has declined since peaking in March 2020.
Credit Derivatives
A credit derivative is a contract between a seller and buyer of protection against the risk of a credit event occurring on one or more debt obligations issued by a specified reference entity. The buyer typically pays a periodic premium over the life of the contract and is protected for the period. If a credit event occurs, the seller is required to make payment to the beneficiary based on the terms of the credit derivative contract. Credit events, as defined in the contract, may be one or more of the following defined events: bankruptcy, dissolution or insolvency of the referenced entity, failure to pay, obligation acceleration, repudiation, payment moratorium and restructuring.
We trade in a variety of credit derivatives and may either purchase or write protection on a single name or portfolio of referenced entities. In transactions referencing a portfolio of entities or securities, protection may be limited to a tranche of exposure or a single name within the portfolio. We are an active market maker in the credit derivatives markets. As a market maker, we work to earn a bid-offer spread on client flow business and manage any residual credit or correlation risk on a portfolio basis. Further, we use credit derivatives to manage our exposure to residential and commercial mortgage loans and corporate lending exposures. The effectiveness of
| | | | | | | | |
| December 2020 Form 10-K | 74 | |
our CDS protection as a hedge of our exposures may vary depending upon a number of factors, including the contractual terms of the CDS.
We actively monitor our counterparty credit risk related to credit derivatives. A majority of our counterparties are composed of banks, broker-dealers, insurance and other financial institutions. Contracts with these counterparties may include provisions related to counterparty rating downgrades, which may result in the counterparty posting additional collateral to us. As with all derivative contracts, we consider counterparty credit risk in the valuation of our positions and recognize CVAs as appropriate within Trading revenues in the income statements.
For additional credit exposure information on our credit derivative portfolio, see Note 7 to the financial statements.
Country Risk
Country risk exposure is the risk that events in, or that affect, a foreign country (any country other than the U.S.) might adversely affect us. We actively manage country risk exposure through a comprehensive risk management framework that combines credit and market fundamentals and allows us to effectively identify, monitor and limit country risk.
Our obligor credit evaluation process may also identify indirect exposures, whereby an obligor has vulnerability or exposure to another country or jurisdiction. Examples of indirect exposures include mutual funds that invest in a single country, offshore companies whose assets reside in another country to that of the offshore jurisdiction and finance company subsidiaries of corporations. Indirect exposures identified through the credit evaluation process may result in a reclassification of country risk.
We conduct periodic stress testing that seeks to measure the impact on our credit and market exposures of shocks stemming from negative economic or political scenarios. When deemed appropriate by our risk managers, the stress test scenarios include possible contagion effects and second order risks. This analysis, and results of the stress tests, may result in the amendment of limits or exposure mitigation.
Our sovereign exposures consist of financial contracts and obligations entered into with sovereign and local governments. Our non-sovereign exposures consist of financial contracts and obligations entered into primarily with corporations and financial institutions.
Index credit derivatives are included in the following country risk exposure table. Each reference entity within an index is allocated to that reference entity’s country of risk. Index exposures are allocated to the underlying reference entities in proportion to the notional weighting of each reference entity in the index, adjusted for any fair value receivable or payable
for that reference entity. Where credit risk crosses multiple jurisdictions, for example, a CDS purchased from an issuer in a specific country that references bonds issued by an entity in a different country, the fair value of the CDS is reflected in the Net Counterparty Exposure row based on the country of the CDS issuer. Further, the notional amount of the CDS adjusted for the fair value of the receivable or payable is reflected in the Net Inventory row based on the country of the underlying reference entity.
Top 10 Non-U.S. Country Exposures at December 31, 2020
| | | | | | | | | | | |
| United Kingdom | | | |
| $ in millions | Sovereigns | Non-sovereigns | Total |
Net inventory1 | $ | 565 | | $ | 1,334 | | $ | 1,899 | |
Net counterparty exposure2 | 45 | | 11,300 | | 11,345 | |
| Loans | — | | 2,929 | | 2,929 | |
| Lending commitments | — | | 7,298 | | 7,298 | |
| Exposure before hedges | 610 | | 22,861 | | 23,471 | |
Hedges3 | (312) | | (1,481) | | (1,793) | |
| Net exposure | $ | 298 | | $ | 21,380 | | $ | 21,678 | |
| | | | | | | | | | | |
| Japan | | | |
| $ in millions | Sovereigns | Non-sovereigns | Total |
Net inventory1 | $ | 4,142 | | $ | 715 | | $ | 4,857 | |
Net counterparty exposure2 | 42 | | 5,073 | | 5,115 | |
| Loans | — | | 409 | | 409 | |
| | | |
| Exposure before hedges | 4,184 | | 6,197 | | 10,381 | |
Hedges3 | (91) | | (180) | | (271) | |
| Net exposure | $ | 4,093 | | $ | 6,017 | | $ | 10,110 | |
| | | | | | | | | | | |
| Germany | | | |
| $ in millions | Sovereigns | Non-sovereigns | Total |
Net inventory1 | $ | 52 | | $ | 148 | | $ | 200 | |
Net counterparty exposure2 | 243 | | 2,785 | | 3,028 | |
| Loans | — | | 2,202 | | 2,202 | |
| Lending commitments | — | | 4,594 | | 4,594 | |
| Exposure before hedges | 295 | | 9,729 | | 10,024 | |
Hedges3 | (287) | | (893) | | (1,180) | |
| Net exposure | $ | 8 | | $ | 8,836 | | $ | 8,844 | |
| | | | | | | | | | | |
| France | | | |
| $ in millions | Sovereigns | Non-sovereigns | Total |
Net inventory1 | $ | (596) | | $ | (65) | | $ | (661) | |
Net counterparty exposure2 | 20 | | 2,907 | | 2,927 | |
| Loans | — | | 680 | | 680 | |
| Lending commitments | — | | 3,106 | | 3,106 | |
| Exposure before hedges | (576) | | 6,628 | | 6,052 | |
Hedges3 | (6) | | (627) | | (633) | |
| Net exposure | $ | (582) | | $ | 6,001 | | $ | 5,419 | |
| | | | | | | | | | | |
| Spain | | | |
| $ in millions | Sovereigns | Non-sovereigns | Total |
Net inventory1 | $ | (520) | | $ | (40) | | $ | (560) | |
Net counterparty exposure2 | 14 | | 281 | | 295 | |
| Loans | — | | 3,795 | | 3,795 | |
| Lending commitments | — | | 1,072 | | 1,072 | |
| Exposure before hedges | (506) | | 5,108 | | 4,602 | |
Hedges3 | — | | (109) | | (109) | |
| Net exposure | $ | (506) | | $ | 4,999 | | $ | 4,493 | |
| | | | | | | | |
| 75 | December 2020 Form 10-K |
| | | | | | | | | | | |
| China | | | |
| $ in millions | Sovereigns | Non-sovereigns | Total |
Net inventory1 | $ | (148) | | $ | 2,135 | | $ | 1,987 | |
Net counterparty exposure2 | 98 | | 697 | | 795 | |
| Loans | — | | 545 | | 545 | |
| Lending commitments | — | | 809 | | 809 | |
| Exposure before hedges | (50) | | 4,186 | | 4,136 | |
Hedges3 | (82) | | (118) | | (200) | |
| Net exposure | $ | (132) | | $ | 4,068 | | $ | 3,936 | |
| | | | | | | | | | | |
| Brazil | | | |
| $ in millions | Sovereigns | Non-sovereigns | Total |
Net inventory1 | $ | 3,101 | | $ | 101 | | $ | 3,202 | |
Net counterparty exposure2 | — | | 298 | | 298 | |
| Loans | — | | 199 | | 199 | |
| Lending commitments | — | | 179 | | 179 | |
| Exposure before hedges | 3,101 | | 777 | | 3,878 | |
Hedges3 | (12) | | (15) | | (27) | |
| Net exposure | $ | 3,089 | | $ | 762 | | $ | 3,851 | |
| | | | | | | | | | | |
| Ireland | | | |
| $ in millions | Sovereigns | Non-sovereigns | Total |
Net inventory1 | $ | 9 | | $ | 1,060 | | $ | 1,069 | |
Net counterparty exposure2 | — | | 571 | | 571 | |
| Loans | — | | 1,508 | | 1,508 | |
| Lending commitments | — | | 285 | | 285 | |
| Exposure before hedges | 9 | | 3,424 | | 3,433 | |
| | | |
| Net exposure | $ | 9 | | $ | 3,424 | | $ | 3,433 | |
| | | | | | | | | | | |
| India | | | |
| $ in millions | Sovereigns | Non-sovereigns | Total |
Net inventory1 | $ | 1,037 | | $ | 783 | | $ | 1,820 | |
Net counterparty exposure2 | — | | 863 | | 863 | |
| Loans | — | | 228 | | 228 | |
| | | |
| Exposure before hedges | 1,037 | | 1,874 | | 2,911 | |
| | | |
| Net exposure | $ | 1,037 | | $ | 1,874 | | $ | 2,911 | |
| | | | | | | | | | | |
| Australia | | | |
| $ in millions | Sovereigns | Non-sovereigns | Total |
Net inventory1 | $ | 597 | | $ | 377 | | $ | 974 | |
Net counterparty exposure2 | 17 | | 468 | | 485 | |
| Loans | — | | 345 | | 345 | |
| Lending commitments | — | | 1,222 | | 1,222 | |
| Exposure before hedges | 614 | | 2,412 | | 3,026 | |
Hedges3 | — | | (174) | | (174) | |
| Net exposure | $ | 614 | | $ | 2,238 | | $ | 2,852 | |
1.Net inventory represents exposure to both long and short single-name and index positions (i.e., bonds and equities at fair value and CDS based on a notional amount assuming zero recovery adjusted for the fair value of any receivable or payable).
2.Net counterparty exposure (e.g, repurchase transactions, securities lending and OTC derivatives) is net of the benefit of collateral received and also is net by counterparty when legally enforceable master netting agreements are in place. For more information, see “Additional Information—Top 10 Non-U.S. Country Exposures” herein.
3.Amounts represent net CDS hedges (purchased and sold) on net counterparty exposure and lending executed by trading desks responsible for hedging counterparty and lending credit risk exposures. Amounts are based on the CDS notional amount assuming zero recovery adjusted for any fair value receivable or payable. For further description of the contractual terms for purchased credit protection and whether they may limit the effectiveness of our hedges, see “Quantitative and Qualitative Disclosures about Risk—Credit Risk—Derivatives" herein.
Additional Information—Top 10 Non-U.S. Country Exposures
Collateral Held against Net Counterparty Exposure1
| | | | | | | | |
| $ in millions | | At
December 31,
2020 |
| Counterparty credit exposure | Collateral2 | |
| Germany | Japan and France | $ | 14,269 | |
| United Kingdom | U.K., U.S. and Spain | 11,125 | |
| Other | Japan, U.S. and France | 21,917 | |
1.The benefit of collateral received is reflected in the Top 10 Non-U.S. Country Exposures at December 31, 2020.
2.Primarily consists of cash, as well as government obligations of the countries listed.
Country Risk Exposures Related to the U.K.
At December 31, 2020, our country risk exposures in the U.K. included net exposures of $21,678 million (as shown in the Top 10 Non-U.S. Country Exposures table) and overnight deposits of $9,036 million. The $21,380 million of exposures to non-sovereigns were diversified across both names and sectors and include $12,031 million to U.K.-focused counterparties that generate more than one-third of their revenues in the U.K., $8,788 million to geographically diversified counterparties, and $8,591 million to exchanges and clearinghouses.
In addition to our country risk exposure, we disclose our cross-border risk exposure in “Financial Statements and Supplementary Data—Financial Data Supplement (Unaudited).”
Operational Risk
Operational risk refers to the risk of loss, or of damage to our reputation, resulting from inadequate or failed processes or systems, from human factors or from external events (e.g., fraud, theft, legal and compliance risks, cyber attacks or damage to physical assets). We may incur operational risk across the full scope of our business activities, including revenue-generating activities (e.g., sales and trading) and support and control groups (e.g., information technology and trade processing).
We have established an operational risk framework to identify, measure, monitor and control risk across the Firm. Effective operational risk management is essential to reducing the impact of operational risk incidents and mitigating legal, regulatory and reputational risks. The framework is continually evolving to account for changes in the Firm and to respond to the changing regulatory and business environment.
We have implemented operational risk data and assessment systems to monitor and analyze internal and external operational risk events, to assess business environment and internal control factors, and to perform scenario analysis. The collected data elements are incorporated in the operational risk capital model. The model encompasses both quantitative and qualitative elements. Internal loss data and scenario analysis results are direct inputs to the capital model, while
| | | | | | | | |
| December 2020 Form 10-K | 76 | |
external operational incidents, business environment and internal control factors are evaluated as part of the scenario analysis process.
In addition, we employ a variety of risk processes and mitigants to manage our operational risk exposures. These include a governance framework, a comprehensive risk management program and insurance. Operational risks and associated risk exposures are assessed relative to the risk tolerance reviewed and confirmed by the Board and are prioritized accordingly.
The breadth and range of operational risk are such that the types of mitigating activities are wide-ranging. Examples of activities include: continuous enhancement of defenses against cyber attacks; use of legal agreements and contracts to transfer and/or limit operational risk exposures; due diligence; implementation of enhanced policies and procedures; technology change management controls; exception management processing controls; and segregation of duties.
Primary responsibility for the management of operational risk is with the business segments, the control groups and the business managers therein. The business managers maintain processes and controls designed to identify, assess, manage, mitigate and report operational risk. Each of the business segments has a designated operational risk coordinator. The operational risk coordinator regularly reviews operational risk issues and reports to our senior management within each business. Each control group also has a designated operational risk coordinator and a forum for discussing operational risk matters with our senior management. Oversight of operational risk is provided by the Operational Risk Oversight Committee, legal entity risk committees, regional risk committees and senior management. In the event of a merger; joint venture; divestiture; reorganization; or creation of a new legal entity, a new product, or a business activity, operational risks are considered, and any necessary changes in processes or controls are implemented.
The Operational Risk Department provides independent oversight of operational risk and assesses, measures and monitors operational risk against tolerance. The Operational Risk Department works with the divisions and control groups to help ensure a transparent, consistent and comprehensive framework for managing operational risk within each area and across the Firm.
The Operational Risk Department scope includes oversight of technology risk, cybersecurity risk, information security risk, the fraud risk management and prevention program, and third-party risk management (supplier and affiliate risk oversight and assessment).
Cybersecurity
Our cybersecurity and information security policies, procedures, and technologies are designed to protect our own, our client and our employee data against unauthorized
disclosure, modification or misuse and are also designed to address regulatory requirements. These policies and procedures cover a broad range of areas, including: identification of internal and external threats, access control, data security, protective controls, detection of malicious or unauthorized activity, incident response and recovery planning.
Business Continuity Management and Disaster Recovery
The Fusion Resilience Center’s mission is to understand, prepare for, respond to, recover and learn from operational threats and incidents that impact the Firm, from cyber and fraud to technology incidents, weather events, terror attacks, geopolitical unrest and pandemics. Global programs for Business Continuity and Disaster Recovery are designed to mitigate risk and enable recovery from business continuity incidents impacting our people, technology, suppliers and/or facilities. Business units within the Firm maintain business continuity plans, including identifying processes and strategies to continue business-critical processes during a business continuity incident. Business units also test the documented preparation to provide a reasonable expectation that, during a business continuity incident, the business unit will be able to continue its critical business processes and limit the impact of the incident to the Firm and its clients. Technical recovery plans are maintained for critical technology assets and detail the steps to be implemented to recover from a disruption. Disaster Recovery testing is performed to validate the recovery capability of these critical technology assets.
Third-Party Risk Management
In connection with our ongoing operations, we utilize the services of third-party suppliers, which we anticipate will continue and may increase in the future. These services include, for example, outsourced processing and support functions and other professional services. Our risk-based approach to managing exposure to these services includes the performance of due diligence, implementation of service level and other contractual agreements, consideration of operational risks and ongoing monitoring of third-party suppliers’ performance. We maintain and continue to enhance our third-party risk management program which is designed to align with our risk tolerance and meet regulatory requirements. The program includes appropriate governance, policies, procedures and enabling technology. The third-party risk management program includes the adoption of appropriate risk management controls and practices throughout the third-party management life cycle to manage risk of service failure, risk of data loss and reputational risk, among others.
| | | | | | | | |
| 77 | December 2020 Form 10-K |
Model Risk
Model risk refers to the potential for adverse consequences from decisions based on incorrect or misused model outputs. Model risk can lead to financial loss, poor business and strategic decision making or damage to our reputation. The risk inherent in a model is a function of the materiality, complexity and uncertainty around inputs and assumptions.
Model risk is generated from the use of models impacting financial statements, regulatory filings, capital adequacy assessments and the formulation of strategy.
Sound model risk management is an integral part of our Risk Management Framework. The Model Risk Management Department (“MRM”) is a distinct department in Risk Management responsible for the oversight of model risk.
MRM establishes a model risk tolerance in line with our risk appetite. The tolerance is based on an assessment of the materiality of the risk of financial loss or reputational damage due to errors in design, implementation and/or inappropriate use of models. The tolerance is monitored through model-specific and aggregate business-level assessments, which are based upon qualitative and quantitative factors.
A guiding principle for managing model risk is the “effective challenge” of models. The effective challenge of models is defined as critical analysis by objective, informed parties who can identify model limitations and assumptions and drive appropriate changes. MRM provides effective challenge of models, independently validates and approves models for use, annually recertifies models, identifies and tracks remediation plans for model limitations and reports on model risk metrics. The department also oversees the development of controls to support a complete and accurate Firmwide model inventory.
Liquidity Risk
Liquidity risk refers to the risk that we will be unable to finance our operations due to a loss of access to the capital markets or difficulty in liquidating our assets. Liquidity risk also encompasses our ability (or perceived ability) to meet our financial obligations without experiencing significant business disruption or reputational damage that may threaten our viability as a going concern. Liquidity risk also encompasses the associated funding risks triggered by the market or idiosyncratic stress events that may negatively affect our liquidity and may impact our ability to raise new funding. Generally, we incur liquidity and funding risk as a result of our trading, lending, investing and client facilitation activities.
Our Liquidity Risk Management Framework is critical to helping ensure that we maintain sufficient liquidity reserves and durable funding sources to meet our daily obligations and to withstand unanticipated stress events. The Liquidity Risk Department is a distinct area in Risk Management responsible for the oversight and monitoring of liquidity risk. The
Liquidity Risk Department ensures transparency of material liquidity and funding risks, compliance with established risk limits and escalation of risk concentrations to appropriate senior management.
To execute these responsibilities, the Liquidity Risk Department establishes limits in line with our risk appetite, identifies and analyzes emerging liquidity and funding risks to ensure such risks are appropriately mitigated, monitors and reports risk exposures against metrics and limits, and reviews the methodologies and assumptions underpinning our Liquidity Stress Tests to ensure sufficient liquidity and funding under a range of adverse scenarios.
The Treasury Department and applicable business units have primary responsibility for evaluating, monitoring and controlling the liquidity and funding risks arising from our business activities and for maintaining processes and controls to manage the key risks inherent in their respective areas. The Liquidity Risk Department coordinates with the Treasury Department and these business units to help ensure a consistent and comprehensive framework for managing liquidity and funding risk across the Firm. See also “Management’s Discussion and Analysis of Financial Condition and Results of Operations—Liquidity and Capital Resources” herein.
Legal and Compliance Risk
Legal and compliance risk includes the risk of legal or regulatory sanctions, material financial loss, including fines, penalties, judgments, damages and/or settlements, or loss to reputation that we may suffer as a result of failure to comply with laws, regulations, rules, related self-regulatory organization standards and codes of conduct applicable to our business activities. This risk also includes contractual and commercial risk, such as the risk that a counterparty’s performance obligations will be unenforceable. It also includes compliance with AML, terrorist financing, and anti-corruption rules and regulations. We are generally subject to extensive regulation in the different jurisdictions in which we conduct our business (see also “Business—Supervision and Regulation” and “Risk Factors”).
We have established procedures based on legal and regulatory requirements on a worldwide basis that are designed to facilitate compliance with applicable statutory and regulatory requirements and to require that our policies relating to business conduct, ethics and practices are followed globally. In addition, we have established procedures to mitigate the risk that a counterparty’s performance obligations will be unenforceable, including consideration of counterparty legal authority and capacity, adequacy of legal documentation, the permissibility of a transaction under applicable law and whether applicable bankruptcy or insolvency laws limit or alter contractual remedies. The heightened legal and regulatory focus on the financial services and banking industries globally presents a continuing business challenge for us.
| | | | | | | | |
| December 2020 Form 10-K | 78 | |
Financial Statements and Supplementary Data
REPORT OF INDEPENDENT REGISTERED PUBLIC ACCOUNTING FIRM
To the Shareholders and the Board of Directors of Morgan Stanley:
Opinion on the Financial Statements
We have audited the accompanying consolidated balance sheets of Morgan Stanley and subsidiaries (the “Firm”) as of December 31, 2020 and 2019, the related consolidated income statements, comprehensive income statements, cash flow statements and statements of changes in total equity for each of the three years ended December 31, 2020, 2019, and 2018, and the related notes (collectively referred to as the “financial statements”). In our opinion, the financial statements present fairly, in all material respects, the financial position of the Firm as of December 31, 2020 and 2019, and the results of its operations and its cash flows for each of the three years ended December 31, 2020, 2019, and 2018, in conformity with accounting principles generally accepted in the United States of America.
We have also audited, in accordance with the standards of the Public Company Accounting Oversight Board (United States) (PCAOB), the Firm’s internal control over financial reporting as of December 31, 2020, based on criteria established in Internal Control — Integrated Framework (2013) issued by the Committee of Sponsoring Organizations of the Treadway Commission and our report dated February 26, 2021, expressed an unqualified opinion on the Firm’s internal control over financial reporting.
Basis for Opinion
These financial statements are the responsibility of the Firm’s management. Our responsibility is to express an opinion on the Firm’s financial statements based on our audits. We are a public accounting firm registered with the PCAOB and are required to be independent with respect to the Firm in accordance with the U.S. federal securities laws and the applicable rules and regulations of the Securities and Exchange Commission and the PCAOB.
We conducted our audits in accordance with the standards of the PCAOB. Those standards require that we plan and perform the audit to obtain reasonable assurance about whether the financial statements are free of material misstatement, whether due to error or fraud. Our audits included performing procedures to assess the risks of material misstatement of the financial statements, whether due to error or fraud, and performing procedures that respond to those risks. Such procedures included examining, on a test basis, evidence regarding the amounts and disclosures in the financial statements. Our audits also included evaluating the accounting principles used and significant estimates made by management, as well as evaluating the overall presentation of
the financial statements. We believe that our audits provide a reasonable basis for our opinion.
Critical Audit Matters
The critical audit matters communicated below are matters arising from the current-period audit of the financial statements that were communicated or required to be communicated to the audit committee and that (1) relate to accounts or disclosures that are material to the financial statements and (2) involved our especially challenging, subjective, or complex judgments. The communication of critical audit matters does not alter in any way our opinion on the financial statements, taken as a whole, and we are not, by communicating the critical audit matters below, providing a separate opinion on the critical audit matters or on the accounts or disclosures to which they relate.
Valuation of Level 3 Financial Assets and Liabilities Carried at Fair Value—Refer to Note 5 to the financial statements
Critical Audit Matter Description
The Firm’s trading and financing activities result in the Firm carrying material financial instruments having limited price transparency. These financial instruments can span a broad array of product types and generally include derivative, security, loan, and borrowing positions. As described in Note 5, these Level 3 financial instruments approximate $18.4 billion and $10.2 billion, respectively, of financial assets and liabilities accounted for at fair value on a recurring basis at December 31, 2020. Unlike financial instruments whose inputs are readily observable and, therefore, more easily independently corroborated, the valuation of financial instruments classified as Level 3 is inherently subjective and often involves the use of unobservable inputs, as well as proprietary valuation models whose underlying algorithms and valuation methodologies are complex.
We identified the valuation of Level 3 financial assets and liabilities carried at fair value as a critical audit matter given the Firm uses complex valuation models and/or model inputs that are not observable in the marketplace to determine the respective fair values. Performing our audit procedures to evaluate the appropriateness of these models and inputs involved a high degree of auditor judgment, professionals with specialized skills and knowledge, and an increased extent of testing.
| | | | | | | | |
| 79 | December 2020 Form 10-K |
How the Critical Audit Matter Was Addressed in the Audit
Our audit procedures related to the valuation estimate for financial instruments that are classified as Level 3 included the following, among others:
•We tested the design and operating effectiveness of the Firm’s valuation controls, including model review and price verification, which are designed to test the appropriateness of the Firm’s valuation methodologies as well as the relevant inputs, and assumptions used to determine the fair value estimates.
•We independently evaluated the appropriateness of management’s significant valuation methodologies, including the input assumptions, considering the expected assumptions of other market participants, and external data, when available.
•We developed independent valuation estimates for certain financial instrument selections, using externally sourced inputs and independent valuation models, and used such estimates to further evaluate management’s fair value estimate, including comparing the estimate with similar transactions and evaluating the Firm’s assumptions inclusive of the inputs, as applicable.
•We tested the revenues arising from the trade date valuation estimate for certain structured transactions classified as Level 3 financial instruments. For a selection of such transactions we developed independent valuation estimates to test the valuation inputs and assumptions used by the Firm and evaluated whether the methods were consistent with relevant Firm valuation policies.
•We assessed the consistency by which management has applied significant and unobservable valuation assumptions.
•We performed a retrospective assessment of management’s valuation estimates for a sample of financial instrument selections by comparing such estimates to relevant transactions.
Intangible Assets—Valuation of Customer Relationship Intangible Assets for the E*TRADE Financial Corporation (“E*TRADE”) Acquisition—Refer to Note 3 to the financial statements
Critical Audit Matter Description
On October 2, 2020, the Firm completed the acquisition of E*TRADE for approximately $11.9 billion. The Firm accounted for the acquisition under the acquisition method of accounting for business combinations. Accordingly, the purchase price was allocated to the assets acquired and liabilities assumed based on their respective fair values, including identified intangibles of approximately $3.3 billion. Of the identified intangible assets acquired, the most significant were the customer relationship intangible assets of $2.8 billion. Management, with the assistance of a valuation specialist, estimated the fair value of customer relationship intangible assets using the income approach, which determines the fair value as the present value of forecasted
future cash flows. The determination of fair value of the assets involves significant estimates and assumptions related to forecasted future cash flows and the selection of the respective discount rate.
We identified the valuation of customer relationship intangible assets as a critical audit matter because the fair value determination requires management to make significant estimates and assumptions in determining the forecasted future cash flows including revenue growth rates and attrition rates as well as the selection of the discount rate. Performing audit procedures to evaluate the reasonableness of these estimates and assumptions required a high degree of auditor judgment and an increased extent of effort, including the involvement of our valuation specialists.
How the Critical Audit Matter Was Addressed in the Audit
Our audit procedures related to the valuation of customer relationship intangible assets acquired as part of the E*TRADE acquisition included the following, among others:
•We tested the operating effectiveness of internal controls over the valuation methodology used, the determination of forecasted future cash flows, and the selection of the discount rate.
•We assessed the knowledge, skill, ability and objectivity of management’s valuation specialist and evaluated the work performed.
•We evaluated the appropriateness of the valuation methodology used and the reasonableness of the forecasted future cash flows for each selected customer relationship intangible asset, specifically the assumptions relating to revenue growth and attrition rates, as well as whether the assumptions used were reasonable considering external market and industry data as well as the past performance of E*TRADE. We also performed sensitivity analyses to evaluate the impact of changes in assumptions to the valuation of the customer relationship intangible assets.
•We tested the source information underlying the determination of the discount rates and attrition rates and also tested the mathematical accuracy of the calculations.
•We developed a range of independent estimates of discount rates for the selected customer relationship intangible assets and compared those to the respective discount rate utilized by management.
/s/ Deloitte & Touche LLP
New York, New York
February 26, 2021
We have served as the Firm’s auditor since 1997.
| | | | | | | | |
| December 2020 Form 10-K | 80 | |
| | | | | |
| |
| Consolidated Income Statements | |
| | | | | | | | | | | |
| in millions, except per share data | 2020 | 2019 | 2018 |
| Revenues | | | |
| Investment banking | $ | 7,674 | | $ | 6,163 | | $ | 6,482 | |
| Trading | 13,992 | | 11,095 | | 11,551 | |
| Investments | 986 | | 1,540 | | 437 | |
| Commissions and fees | 4,851 | | 3,919 | | 4,190 | |
| Asset management | 14,272 | | 13,083 | | 12,898 | |
| Other | 110 | | 925 | | 743 | |
| Total non-interest revenues | 41,885 | | 36,725 | | 36,301 | |
| Interest income | 10,162 | | 17,098 | | 13,892 | |
| Interest expense | 3,849 | | 12,404 | | 10,086 | |
| Net interest | 6,313 | | 4,694 | | 3,806 | |
| Net revenues | 48,198 | | 41,419 | | 40,107 | |
| Non-interest expenses | | | |
| Compensation and benefits | 20,854 | | 18,837 | | 17,632 | |
| Brokerage, clearing and exchange fees | 2,929 | | 2,493 | | 2,393 | |
| Information processing and communications | 2,465 | | 2,194 | | 2,016 | |
| Professional services | 2,205 | | 2,137 | | 2,265 | |
| Occupancy and equipment | 1,559 | | 1,428 | | 1,391 | |
| Marketing and business development | 434 | | 660 | | 691 | |
| Other | 3,334 | | 2,369 | | 2,482 | |
| Total non-interest expenses | 33,780 | | 30,118 | | 28,870 | |
| Income before provision for income taxes | 14,418 | | 11,301 | | 11,237 | |
| Provision for income taxes | 3,239 | | 2,064 | | 2,350 | |
| Income from continuing operations | 11,179 | | 9,237 | | 8,887 | |
| Income (loss) from discontinued operations, net of income taxes | — | | — | | (4) | |
| Net income | $ | 11,179 | | $ | 9,237 | | $ | 8,883 | |
| Net income applicable to noncontrolling interests | 183 | | 195 | | 135 | |
| Net income applicable to Morgan Stanley | $ | 10,996 | | $ | 9,042 | | $ | 8,748 | |
| Preferred stock dividends and other | 496 | | 530 | | 526 | |
| Earnings applicable to Morgan Stanley common shareholders | $ | 10,500 | | $ | 8,512 | | $ | 8,222 | |
| Earnings per common share | | | |
| Basic | $ | 6.55 | | $ | 5.26 | | $ | 4.81 | |
| Diluted | 6.46 | | 5.19 | | 4.73 | |
| Average common shares outstanding | | | |
| Basic | 1,603 | | 1,617 | | 1,708 | |
| Diluted | 1,624 | | 1,640 | | 1,738 | |
| | | | | | | | |
| See Notes to Consolidated Financial Statements | 81 | December 2020 Form 10-K |
| | | | | |
| |
| Consolidated Comprehensive Income Statements | |
| | | | | | | | | | | |
| $ in millions | 2020 | 2019 | 2018 |
| Net income | $ | 11,179 | | $ | 9,237 | | $ | 8,883 | |
| Other comprehensive income (loss), net of tax: | | | |
| Foreign currency translation adjustments | 170 | | 3 | | (90) | |
| Change in net unrealized gains (losses) on available-for-sale securities | 1,580 | | 1,137 | | (272) | |
| Pension and other | 146 | | (66) | | 137 | |
| Change in net debt valuation adjustment | (1,028) | | (1,639) | | 1,517 | |
| Total other comprehensive income (loss) | $ | 868 | | $ | (565) | | $ | 1,292 | |
| Comprehensive income | $ | 12,047 | | $ | 8,672 | | $ | 10,175 | |
| Net income applicable to noncontrolling interests | 183 | | 195 | | 135 | |
| Other comprehensive income (loss) applicable to noncontrolling interests | 42 | | (69) | | 87 | |
| Comprehensive income applicable to Morgan Stanley | $ | 11,822 | | $ | 8,546 | | $ | 9,953 | |
| | | | | | | | |
| December 2020 Form 10-K | 82 | See Notes to Consolidated Financial Statements |
| | | | | |
| |
| Consolidated Balance Sheets | |
| | | | | | | | |
| $ in millions, except share data | At December 31, 2020 | At December 31, 2019 |
| Assets | | |
| Cash and cash equivalents | $ | 105,654 | | $ | 82,171 | |
Trading assets at fair value ($132,578 and $128,386 were pledged to various parties) | 312,738 | | 297,110 | |
Investment securities (includes $110,383 and $62,223 at fair value) | 182,154 | | 105,725 | |
Securities purchased under agreements to resell (includes $15 and $4 at fair value) | 116,234 | | 88,224 | |
| Securities borrowed | 112,391 | | 106,549 | |
| Customer and other receivables | 97,737 | | 55,646 | |
| Loans: | | |
Held for investment (net of allowance of $835 and $349) | 137,784 | | 118,060 | |
| Held for sale | 12,813 | | 12,577 | |
| Goodwill | 11,635 | | 7,143 | |
Intangible assets (net of accumulated amortization of $3,265 and $3,204) | 4,980 | | 2,107 | |
| Other assets | 21,742 | | 20,117 | |
| Total assets | $ | 1,115,862 | | $ | 895,429 | |
| Liabilities | | |
Deposits (includes $3,521 and $2,099 at fair value) | $ | 310,782 | | $ | 190,356 | |
| Trading liabilities at fair value | 157,631 | | 133,356 | |
Securities sold under agreements to repurchase (includes $1,115 and $733 at fair value) | 50,587 | | 54,200 | |
| Securities loaned | 7,731 | | 8,506 | |
Other secured financings (includes $11,701 and $7,809 at fair value) | 15,863 | | 14,698 | |
| Customer and other payables | 227,437 | | 197,834 | |
| Other liabilities and accrued expenses | 25,603 | | 21,155 | |
Borrowings (includes $73,701 and $64,461 at fair value) | 217,079 | | 192,627 | |
| Total liabilities | 1,012,713 | | 812,732 | |
| Commitments and contingent liabilities (see Note 15) | | |
| Equity | | |
| Morgan Stanley shareholders’ equity: | | |
| Preferred stock | 9,250 | | 8,520 | |
Common stock, $0.01 par value: | | |
Shares authorized: 3,500,000,000; Shares issued: 2,038,893,979; Shares outstanding: 1,809,624,144 and 1,593,973,680 | 20 | | 20 | |
| Additional paid-in capital | 25,546 | | 23,935 | |
| Retained earnings | 78,694 | | 70,589 | |
| Employee stock trusts | 3,043 | | 2,918 | |
| Accumulated other comprehensive income (loss) | (1,962) | | (2,788) | |
Common stock held in treasury at cost, $0.01 par value (229,269,835 and 444,920,299 shares) | (9,767) | | (18,727) | |
| Common stock issued to employee stock trusts | (3,043) | | (2,918) | |
| Total Morgan Stanley shareholders’ equity | 101,781 | | 81,549 | |
| Noncontrolling interests | 1,368 | | 1,148 | |
| Total equity | 103,149 | | 82,697 | |
| Total liabilities and equity | $ | 1,115,862 | | $ | 895,429 | |
| | | | | | | | |
| See Notes to Consolidated Financial Statements | 83 | December 2020 Form 10-K |
| | | | | |
| |
| Consolidated Statements of Changes in Total Equity | |
| | | | | | | | | | | |
| $ in millions | 2020 | 2019 | 2018 |
| Preferred Stock | | | |
| Beginning balance | $ | 8,520 | | $ | 8,520 | | $ | 8,520 | |
Issuance of preferred stock1 | 730 | | 500 | | — | |
Redemption of preferred stock2 | — | | (500) | | — | |
| Ending balance | 9,250 | | 8,520 | | 8,520 | |
| Common Stock | | | |
| Beginning and ending balance | 20 | | 20 | | 20 | |
| Additional Paid-in Capital | | | |
| Beginning balance | 23,935 | | 23,794 | | 23,545 | |
| Share-based award activity | 518 | | 131 | | 249 | |
| Issuance of preferred stock | — | | (3) | | — | |
Issuance of common stock for the acquisition of E*TRADE1 | 1,093 | | — | | — | |
| Other net increases (decreases) | — | | 13 | | — | |
| Ending balance | 25,546 | | 23,935 | | 23,794 | |
| Retained Earnings | | | |
| Beginning balance | 70,589 | | 64,175 | | 57,577 | |
Cumulative adjustments for accounting changes3 | (100) | | 63 | | 306 | |
| Net income applicable to Morgan Stanley | 10,996 | | 9,042 | | 8,748 | |
Preferred stock dividends4 | (496) | | (524) | | (526) | |
Common stock dividends4 | (2,295) | | (2,161) | | (1,930) | |
| Other net increases (decreases) | — | | (6) | | — | |
| Ending balance | 78,694 | | 70,589 | | 64,175 | |
| Employee Stock Trusts | | | |
| Beginning balance | 2,918 | | 2,836 | | 2,907 | |
| Share-based award activity | 125 | | 82 | | (71) | |
| Ending balance | 3,043 | | 2,918 | | 2,836 | |
| Accumulated Other Comprehensive Income (Loss) | | | |
| Beginning balance | (2,788) | | (2,292) | | (3,060) | |
Cumulative adjustments for accounting changes3 | — | | — | | (437) | |
| Net change in Accumulated other comprehensive income (loss) | 826 | | (496) | | 1,205 | |
| Ending balance | (1,962) | | (2,788) | | (2,292) | |
| Common Stock Held in Treasury at Cost | | | |
| Beginning balance | (18,727) | | (13,971) | | (9,211) | |
| Share-based award activity | 932 | | 1,198 | | 806 | |
| Repurchases of common stock and employee tax withholdings | (1,890) | | (5,954) | | (5,566) | |
Issuance of common stock for the acquisition of E*TRADE1 | 9,918 | | — | | — | |
| Ending balance | (9,767) | | (18,727) | | (13,971) | |
| Common Stock Issued to Employee Stock Trusts | | | |
| Beginning balance | (2,918) | | (2,836) | | (2,907) | |
| Share-based award activity | (125) | | (82) | | 71 | |
| Ending balance | (3,043) | | (2,918) | | (2,836) | |
| Noncontrolling Interests | | | |
| Beginning balance | 1,148 | | 1,160 | | 1,075 | |
| Net income applicable to noncontrolling interests | 183 | | 195 | | 135 | |
| Net change in Accumulated other comprehensive income (loss) applicable to noncontrolling interests | 42 | | (69) | | 87 | |
| Other net increases (decreases) | (5) | | (138) | | (137) | |
| Ending balance | 1,368 | | 1,148 | | 1,160 | |
| Total Equity | $ | 103,149 | | $ | 82,697 | | $ | 81,406 | |
1.The 2020 issuances of Preferred and Common Stock were related to the acquisition of E*TRADE. See Notes 3 and 18 for further information.
2.See Note 18 for information regarding the notice of redemption and reclassification of Series G Preferred Stock.
3.See Notes 2 and 18 for further information regarding cumulative adjustments for accounting changes.
4.See Note 18 for information regarding dividends per share for each class of stock.
| | | | | | | | |
| December 2020 Form 10-K | 84 | See Notes to Consolidated Financial Statements |
| | | | | |
| |
| Consolidated Cash Flow Statements | |
| | | | | | | | | | | |
| $ in millions | 2020 | 2019 | 2018 |
| Cash flows from operating activities | | | |
| Net income | $ | 11,179 | | $ | 9,237 | | $ | 8,883 | |
| Adjustments to reconcile net income to net cash provided by (used for) operating activities: | | | |
| Deferred income taxes | (250) | | 165 | | 449 | |
| Stock-based compensation expense | 1,312 | | 1,153 | | 920 | |
| Depreciation and amortization | 3,769 | | 2,643 | | 1,844 | |
| Provision for (Release of) credit losses on lending activities | 762 | | 162 | | (15) | |
| Other operating adjustments | 274 | | (195) | | 199 | |
| Changes in assets and liabilities: | | | |
| Trading assets, net of Trading liabilities | 15,550 | | (13,668) | | 23,732 | |
| Securities borrowed | (5,076) | | 9,764 | | 7,697 | |
| Securities loaned | (1,541) | | (3,402) | | (1,684) | |
| Customer and other receivables and other assets | (29,774) | | 233 | | (728) | |
| Customer and other payables and other liabilities | 10,187 | | 19,942 | | (13,063) | |
| Securities purchased under agreements to resell | (28,010) | | 10,298 | | (14,264) | |
| Securities sold under agreements to repurchase | (3,613) | | 4,441 | | (6,665) | |
| Net cash provided by (used for) operating activities | (25,231) | | 40,773 | | 7,305 | |
| Cash flows from investing activities | | | |
| Proceeds from (payments for): | | | |
| Other assets—Premises, equipment and software, net | (1,444) | | (1,826) | | (1,865) | |
| Changes in loans, net | (17,949) | | (17,359) | | (8,794) | |
| Investment securities: | | | |
| Purchases | (59,777) | | (42,586) | | (27,800) | |
| Proceeds from sales | 13,750 | | 17,151 | | 3,208 | |
| Proceeds from paydowns and maturities | 24,517 | | 12,012 | | 12,668 | |
| Cash acquired as part of the E*TRADE acquisition | 3,807 | | — | | — | |
| Other investing activities | (802) | | (953) | | (298) | |
| Net cash provided by (used for) investing activities | (37,898) | | (33,561) | | (22,881) | |
| Cash flows from financing activities | | | |
| Net proceeds from (payments for): | | | |
| Other secured financings | 2,794 | | 3,695 | | (1,226) | |
| Deposits | 75,417 | | 2,513 | | 28,384 | |
| Issuance of preferred stock, net of issuance costs | — | | 497 | | — | |
| Proceeds from issuance of Borrowings | 60,726 | | 30,605 | | 40,059 | |
| Payments for: | | | |
| Borrowings | (50,484) | | (40,548) | | (34,781) | |
| Repurchases of common stock and employee tax withholdings | (1,890) | | (5,954) | | (5,566) | |
| Cash dividends | (2,739) | | (2,627) | | (2,375) | |
| Other financing activities | (40) | | (147) | | (290) | |
| Net cash provided by (used for) financing activities | 83,784 | | (11,966) | | 24,205 | |
| Effect of exchange rate changes on cash and cash equivalents | 2,828 | | (271) | | (1,828) | |
| Net increase (decrease) in cash and cash equivalents | 23,483 | | (5,025) | | 6,801 | |
| Cash and cash equivalents, at beginning of period | 82,171 | | 87,196 | | 80,395 | |
| Cash and cash equivalents, at end of period | $ | 105,654 | | $ | 82,171 | | $ | 87,196 | |
| Supplemental Disclosure of Cash Flow Information | | | |
| Cash payments for: | | | |
| Interest | $ | 4,120 | | $ | 12,511 | | $ | 9,977 | |
| Income taxes, net of refunds | 2,591 | | 1,908 | | 1,377 | |
| | | | | | | | |
| See Notes to Consolidated Financial Statements | 85 | December 2020 Form 10-K |
| | | | | |
| |
| Notes to Consolidated Financial Statements | |
1. Introduction and Basis of Presentation
The Firm
Morgan Stanley is a global financial services firm that maintains significant market positions in each of its business segments—Institutional Securities, Wealth Management and Investment Management. Morgan Stanley, through its subsidiaries and affiliates, provides a wide variety of products and services to a large and diversified group of clients and customers, including corporations, governments, financial institutions and individuals. Unless the context otherwise requires, the terms “Morgan Stanley” or the “Firm” mean Morgan Stanley (the “Parent Company”) together with its consolidated subsidiaries. See the “Glossary of Common Terms and Acronyms” for the definition of certain terms and acronyms used throughout this Form 10-K.
A description of the clients and principal products and services of each of the Firm’s business segments is as follows:
Institutional Securities provides investment banking, sales and trading, lending and other services to corporations, governments, financial institutions and high to ultra-high net worth clients. Investment banking services consist of capital raising and financial advisory services, including services relating to the underwriting of debt, equity and other securities, as well as advice on mergers and acquisitions, restructurings, real estate and project finance. Sales and trading services include sales, financing, prime brokerage and market-making activities in the equity and fixed income businesses. Lending activities include originating corporate loans and commercial real estate loans, providing secured lending facilities, and extending financing to sales and trading customers. Other activities include Asia wealth management services, investments and research.
Wealth Management provides a comprehensive array of financial services and solutions to individual investors and small to medium-sized businesses and institutions covering: financial advisor-led brokerage and investment advisory services; self-directed brokerage services, including through the E*TRADE platform; financial and wealth planning services; workplace services including stock plan administration; annuity and insurance products; securities-based lending, residential real estate loans and other lending products; banking; and retirement plan services.
Investment Management provides a broad range of investment strategies and products that span geographies, asset classes, and public and private markets to a diverse group of clients across institutional and intermediary channels. Strategies and products, which are offered through a variety of investment vehicles, include equity, fixed income, liquidity and alternative/other products. Institutional clients include defined benefit/defined contribution plans, foundations, endowments, government
entities, sovereign wealth funds, insurance companies, third-party fund sponsors and corporations. Individual clients are generally served through intermediaries, including affiliated and non-affiliated distributors.
Basis of Financial Information
The financial statements are prepared in accordance with U.S. GAAP, which requires the Firm to make estimates and assumptions regarding the valuations of certain financial instruments, the valuations of goodwill and intangible assets, the outcome of legal and tax matters, deferred tax assets, ACL, and other matters that affect its financial statements and related disclosures. The Firm believes that the estimates utilized in the preparation of its financial statements are prudent and reasonable. Actual results could differ materially from these estimates.
Certain reclassifications have been made to prior periods to conform to the current presentation. The Notes are an integral part of the Firm's financial statements. The Firm has evaluated subsequent events for adjustment to or disclosure in these financial statements through the date of this report and has not identified any recordable or disclosable events not otherwise reported in these financial statements or the notes thereto.
Consolidation
The financial statements include the accounts of the Firm, its wholly owned subsidiaries and other entities in which the Firm has a controlling financial interest, including certain VIEs (see Note 16). Intercompany balances and transactions have been eliminated. For consolidated subsidiaries that are not wholly owned, the third-party holdings of equity interests are referred to as Noncontrolling interests. The net income attributable to Noncontrolling interests for such subsidiaries is presented as Net income applicable to noncontrolling interests in the income statements. The portion of shareholders’ equity that is attributable to noncontrolling interests for such subsidiaries is presented as noncontrolling interests, a component of Total equity, in the balance sheets.
For entities where the total equity investment at risk is sufficient to enable the entity to finance its activities without additional subordinated financial support and the equity holders bear the residual economic risks and returns of the entity and have the power to direct the activities of the entity that most significantly affect its economic performance, the Firm consolidates those entities it controls either through a majority voting interest or otherwise. For VIEs (i.e., entities that do not meet the aforementioned criteria), the Firm consolidates those entities where it has the power to make the decisions that most significantly affect the economic performance of the VIE and has the obligation to absorb losses or the right to receive benefits that could potentially be significant to the VIE.
| | | | | | | | |
| December 2020 Form 10-K | 86 | |
| | | | | |
| |
| Notes to Consolidated Financial Statements | |
For investments in entities in which the Firm does not have a controlling financial interest but has significant influence over operating and financial decisions, it applies the equity method of accounting with net gains and losses recorded within Other revenues (see Note 12) unless the Firm has elected to measure the investment at fair value, in which case net gains and losses are recorded within Investments revenues (see Note 5).
Equity and partnership interests held by entities qualifying for accounting purposes as investment companies are carried at fair value.
The Firm’s significant regulated U.S. and international subsidiaries include:
•Morgan Stanley & Co. LLC (“MS&Co.”),
•Morgan Stanley Smith Barney LLC (“MSSB”),
•Morgan Stanley Europe SE (“MSESE”),
•Morgan Stanley & Co. International plc (“MSIP”),
•Morgan Stanley Bank, N.A. (“MSBNA”),
•Morgan Stanley Private Bank, National Association (“MSPBNA”),
•E*TRADE Bank (“ETB”),
•E*TRADE Savings Bank (“ETSB”) and
•E*TRADE Securities LLC
2. Significant Accounting Policies
Revenue Recognition
Revenues are recognized when the promised goods or services are delivered to our customers, in an amount that is based on the consideration the Firm expects to receive in exchange for those goods or services when such amounts are not probable of significant reversal.
Investment Banking
Revenues from investment banking activities consist of revenues earned from underwriting, primarily equity and fixed income securities and loan syndications, and advisory fees, primarily for mergers, acquisitions and restructurings.
Underwriting revenues are generally recognized on trade date if there is no uncertainty or contingency related to the amount to be paid. Underwriting costs are deferred and recognized in the relevant non-interest expenses line items when the related underwriting revenues are recorded.
Advisory fees are recognized as advice is provided to the client, based on the estimated progress of work and when revenues are not probable of a significant reversal. Advisory costs are recognized as incurred in the relevant non-interest expenses line items, including those reimbursed.
Commissions and Fees
Commission and fee revenues generally result from transaction-based arrangements in which the client is charged a fee for the execution of transactions. Such revenues
primarily arise from transactions in equity securities; services related to sales and trading activities; and sales of mutual funds, alternative funds, futures, insurance products and options, as well as revenues from order flow payments for directing customer orders to broker-dealers, exchanges, and market centers for execution. Commission and fee revenues are recognized on trade date when the performance obligation is satisfied.
Asset Management Revenues
Asset management, distribution and administration fees are generally based on related asset levels being managed, such as the AUM of a customer’s account or the net asset value of a fund. These fees are generally recognized when services are performed and the fees become known. Management fees are reduced by estimated fee waivers and expense caps, if any, provided to the customer.
Performance-based fees not in the form of carried interest are recorded when the annual performance target is met and the revenues are not probable of a significant reversal.
Sales commissions paid by the Firm in connection with the sale of certain classes of shares of its open-end mutual fund products are accounted for as deferred commission assets and amortized to expense over the expected life of the contract. The Firm periodically tests deferred commission assets for recoverability based on cash flows expected to be received in future periods. Other asset management and distribution costs are recognized as incurred in the relevant non-interest expenses line items.
Carried Interest
The Firm is entitled to receive performance-based fees in the form of carried interest when the return in certain funds exceeds specified performance targets. When the Firm earns carried interest from funds as specified performance thresholds are met, that carried interest and any related general or limited partner interest is accounted for under the equity method of accounting and measured based on the Firm’s claim on the NAV of the fund at the reporting date, taking into account the distribution terms applicable to the interest held.
See Note 23 for information regarding the net cumulative unrealized amount of performance-based fee revenues at risk of reversal. See Note 15 for information regarding general partner guarantees, which include potential obligations to return performance fee distributions previously received.
Other Items
Revenues from certain commodities-related contracts are recognized as the promised goods or services are delivered to the customer.
Receivables from contracts with customers are recognized in Customer and other receivables in the balance sheets when
| | | | | | | | |
| 87 | December 2020 Form 10-K |
| | | | | |
| |
| Notes to Consolidated Financial Statements | |
the underlying performance obligations have been satisfied and the Firm has the right per the contract to bill the customer. Contract assets are recognized in Other assets when the Firm has satisfied its performance obligations but customer payment is conditional. Contract liabilities are recognized in Other liabilities when the Firm has collected payment from a customer based on the terms of the contract, but the underlying performance obligations are not yet satisfied.
For contracts with a term of less than one year, incremental costs to obtain the contract are expensed as incurred. Revenues are not discounted when payment is expected within one year.
The Firm generally presents, net within revenues, taxes assessed by a governmental authority that are both imposed on and concurrent with a specific revenue-producing transaction and collected by the Firm from a customer.
Fair Value of Financial Instruments
Instruments within Trading assets and Trading liabilities are measured at fair value, either as required or allowed by accounting guidance. These financial instruments primarily represent the Firm’s trading and investment positions and include both cash and derivative products. In addition, securities classified as AFS are measured at fair value.
Gains and losses on instruments carried at fair value are reflected in Trading revenues, Investments revenues or Investment banking revenues in the income statements, except for AFS securities (see “Available-for-Sale (“AFS”) Investment Securities” section herein and Note 8) and derivatives accounted for as hedges (see “Hedge Accounting” herein and Note 7).
Interest income and interest expense are recorded within the income statements depending on the nature of the instrument and related market conventions. When interest is included as a component of the instruments’ fair value, interest is recorded within Trading revenues or Investments revenues. Otherwise, it is recorded within Interest income or Interest expense. Dividend income is recorded in Trading revenues or Investments revenues depending on the business activity.
The fair value of OTC financial instruments, including derivative contracts related to financial instruments and commodities, is presented in the accompanying balance sheets on a net-by-counterparty basis, when appropriate. Additionally, the Firm nets the fair value of cash collateral paid or received against the fair value amounts recognized for net derivative positions executed with the same counterparty under the same master netting agreement.
Fair Value Option
The Firm has elected to measure certain eligible instruments at fair value, including Securities purchased under agreements to resell, Loans and lending commitments, equity method
investments and certain other assets, Deposits, Securities sold under agreements to repurchase, Other secured financings and Borrowings.
Fair Value Measurement—Definition and Hierarchy
Fair value is defined as the price that would be received to sell an asset or paid to transfer a liability (i.e., the “exit price”) in an orderly transaction between market participants at the measurement date.
Fair value is a market-based measure considered from the perspective of a market participant rather than an entity-specific measure. Therefore, even when market assumptions are not readily available, assumptions are set to reflect those that the Firm believes market participants would use in pricing the asset or liability at the measurement date. Where the Firm manages a group of financial assets, financial liabilities, and nonfinancial items accounted for as derivatives on the basis of its net exposure to either market risks or credit risk, the Firm measures the fair value of that group of financial instruments consistently with how market participants would price the net risk exposure at the measurement date.
In determining fair value, the Firm uses various valuation approaches and establishes a hierarchy for inputs used in measuring fair value that requires the most observable inputs be used when available.
Observable inputs are inputs that market participants would use in pricing the asset or liability that were developed based on market data obtained from sources independent of the Firm. Unobservable inputs are inputs that reflect assumptions the Firm believes other market participants would use in pricing the asset or liability that are developed based on the best information available in the circumstances. The fair value hierarchy is broken down into three levels based on the observability of inputs as follows, with Level 1 being the highest and Level 3 being the lowest level:
Level 1. Valuations based on quoted prices in active markets that the Firm has the ability to access for identical assets or liabilities. Valuation adjustments, block discounts and discounts for entity-specific restrictions that would not transfer to market participants are not applied to Level 1 instruments. Since valuations are based on quoted prices that are readily and regularly available in an active market, valuation of these products does not entail a significant degree of judgment.
Level 2. Valuations based on one or more quoted prices in markets that are not active or for which all significant inputs are observable, either directly or indirectly.
Level 3. Valuations based on inputs that are unobservable and significant to the overall fair value measurement.
The availability of observable inputs can vary from product to product and is affected by a wide variety of factors, including
| | | | | | | | |
| December 2020 Form 10-K | 88 | |
| | | | | |
| |
| Notes to Consolidated Financial Statements | |
the type of product, whether the product is new and not yet established in the marketplace, the liquidity of markets and other characteristics particular to the product. To the extent that valuation is based on models or inputs that are less observable or unobservable in the market, the determination of fair value requires more judgment. Accordingly, the degree of judgment exercised by the Firm in determining fair value is greatest for instruments categorized in Level 3 of the fair value hierarchy.
The Firm considers prices and inputs that are current as of the measurement date, including during periods of market dislocation. In periods of market dislocation, the observability of prices and inputs may be reduced for many instruments. This condition could cause an instrument to be reclassified from Level 1 to Level 2 or from Level 2 to Level 3 of the fair value hierarchy.
In certain cases, the inputs used to measure fair value may fall into different levels of the fair value hierarchy. In such cases, the total fair value amount is disclosed in the level appropriate for the lowest level input that is significant to the total fair value of the asset or liability.
Valuation Techniques
Many cash instruments and OTC derivative contracts have bid and ask prices that can be observed in the marketplace. Bid prices reflect the highest price that a party is willing to pay for an asset. Ask prices represent the lowest price that a party is willing to accept for an asset. The Firm carries positions at the point within the bid-ask range that meets its best estimate of fair value. For offsetting positions in the same financial instrument, the same price within the bid-ask spread is used to measure both the long and short positions.
Fair value for many cash instruments and OTC derivative contracts is derived using pricing models. Pricing models take into account the contract terms, as well as multiple inputs, including, where applicable, commodity prices, equity prices, interest rate yield curves, credit curves, correlation, creditworthiness of the counterparty, creditworthiness of the Firm, option volatility and currency rates.
Where appropriate, valuation adjustments are made to account for various factors such as liquidity risk (bid-ask adjustments), credit quality, model uncertainty and concentration risk and funding. Adjustments for liquidity risk adjust model-derived mid-market amounts of Level 2 and Level 3 financial instruments for the bid-mid or mid-ask spread required to properly reflect the exit price of a risk position. Bid-mid and mid-ask spreads are marked to levels observed in trade activity, broker quotes or other external third-party data. Where these spreads are unobservable for the particular position in question, spreads are derived from observable levels of similar positions.
The Firm applies credit-related valuation adjustments to its Borrowings for which the fair value option was elected and to
OTC derivatives. The Firm considers the impact of changes in its own credit spreads based upon observations of the secondary bond market spreads when measuring the fair value for Borrowings.
For OTC derivatives, the impact of changes in both the Firm’s and the counterparty’s credit rating is considered when measuring fair value. In determining the expected exposure, the Firm simulates the distribution of the future exposure to a counterparty, then applies market-based default probabilities to the future exposure, leveraging external third-party CDS spread data. Where CDS spread data are unavailable for a specific counterparty, bond market spreads, CDS spread data based on the counterparty’s credit rating or CDS spread data that reference a comparable counterparty may be utilized. The Firm also considers collateral held and legally enforceable master netting agreements that mitigate its exposure to each counterparty.
Adjustments for model uncertainty are taken for positions whose underlying models are reliant on significant inputs that are neither directly nor indirectly observable, hence requiring reliance on established theoretical concepts in their derivation. These adjustments are derived by making assessments of the possible degree of variability using statistical approaches and market-based information where possible.
The Firm may apply concentration adjustments to certain of its OTC derivative portfolios to reflect the additional cost of closing out a particularly large risk exposure. Where possible, these adjustments are based on observable market information, but in many instances, significant judgment is required to estimate the costs of closing out concentrated risk exposures due to the lack of liquidity in the marketplace.
The Firm applies an FVA in the fair value measurements of OTC uncollateralized or partially collateralized derivatives and in collateralized derivatives where the terms of the agreement do not permit the reuse of the collateral received. In general, FVA reflects a market funding risk premium inherent in the noted derivative instruments. The methodology for measuring FVA leverages the Firm’s existing credit-related valuation adjustment calculation methodologies, which apply to both assets and liabilities.
See Note 5 for a description of valuation techniques applied to the major categories of financial instruments measured at fair value.
Assets and Liabilities Measured at Fair Value on a Non-recurring Basis
Certain of the Firm’s assets and liabilities are measured at fair value on a non-recurring basis. The Firm incurs losses or gains for any adjustments of these assets or liabilities to fair value.
For assets and liabilities measured at fair value on a non-recurring basis, fair value is determined by using various
| | | | | | | | |
| 89 | December 2020 Form 10-K |
| | | | | |
| |
| Notes to Consolidated Financial Statements | |
valuation approaches. The same hierarchy for inputs as described above, which requires that observable inputs be used when available, is used in measuring fair value for these items.
For further information on financial assets and liabilities that are measured at fair value on a recurring and non-recurring basis, see Note 5.
Offsetting of Derivative Instruments
In connection with its derivative activities, the Firm generally enters into master netting agreements and collateral agreements with its counterparties. These agreements provide the Firm with the right, in the event of a default by the counterparty, to net a counterparty’s rights and obligations under the agreement and to liquidate and set off cash collateral against any net amount owed by the counterparty. Derivatives with enforceable master netting agreements are reported net of cash collateral received and posted.
However, in certain circumstances, the Firm may not have such an agreement in place; the relevant insolvency regime may not support the enforceability of the master netting agreement or collateral agreement; or the Firm may not have sought legal advice to support the enforceability of the agreement. In cases where the Firm has not determined an agreement to be enforceable, the related amounts are not offset (see Note 7).
The Firm’s policy is generally to receive cash and/or securities posted as collateral (with rights of rehypothecation), irrespective of the enforceability determination regarding the master netting and collateral agreement. In certain cases, the Firm may agree for such collateral to be posted to a third-party custodian under a control agreement that enables it to take control of such collateral in the event of a counterparty default. The enforceability of the master netting agreement is taken into account in the Firm’s risk management practices and application of counterparty credit limits.
For information related to offsetting of derivatives, see Note 7.
Hedge Accounting
The Firm applies hedge accounting using various derivative financial instruments for the following types of hedges: hedges of changes in the fair value of assets and liabilities due to the risk being hedged (fair value hedges); and hedges of net investments in foreign operations whose functional currency is different from the reporting currency of the Parent Company (net investment hedges). These financial instruments are included within Trading assets—Derivative and other contracts or Trading liabilities—Derivative and other contracts in the balance sheets. For hedges where hedge accounting is being applied, the Firm performs effectiveness testing and other procedures.
Fair Value Hedges—Interest Rate Risk
The Firm’s designated fair value hedges consist of interest rate swaps designated as hedges of changes in the benchmark interest rate of certain fixed rate AFS securities and senior borrowings. In the fourth quarter of 2019, the Firm also began designating interest rate swaps as fair value hedges of changes in the benchmark interest rate of certain fixed rate deposits. The Firm is permitted to hedge the full, or part of the, contractual term of the hedged instrument. The Firm uses regression analysis to perform an ongoing prospective and retrospective assessment of the effectiveness of these hedging relationships. A hedging relationship is deemed effective if the change in fair value of the hedging instrument (derivative) and the change in fair value of the hedged item (AFS security, deposit liability or borrowing), due to changes in the benchmark interest rate, offset within a range of 80% to 125%. The Firm considers the impact of valuation adjustments related to counterparty credit spreads and its own credit spreads to determine whether they would cause the hedging relationship to be ineffective.
For qualifying fair value hedges of benchmark interest rates, the change in the fair value of the derivative, offset by the change in the fair value attributable to the change in the benchmark interest rate risk of the hedged asset (liability), is recognized in earnings each period as a component of Interest income (expense). For AFS securities, the change in fair value of the hedged item due to changes other than the risk being hedged will continue to be reported in OCI. When a derivative is de-designated as a hedge, any basis adjustment remaining on the hedged asset (liability) is amortized to Interest income (expense) over the remaining life of the asset (liability) using the effective interest method.
Net Investment Hedges
The Firm uses forward foreign exchange contracts to manage a portion of the currency exposure relating to its net investments in foreign operations. To the extent that the notional amounts of the hedging instruments equal the portion of the investments being hedged and the underlying exchange rate of the derivative hedging instrument is the same as the exchange rate between the functional currency of the investee and the intermediate parent entity’s functional currency, it is considered to be perfectly effective, with no income statement recognition. The gain or loss from revaluing hedges of net investments in foreign operations at the spot rate is reported within AOCI. The forward points on the hedging instruments are excluded from hedge effectiveness testing and changes in the fair value of this excluded component are recorded currently in Interest income.
For further information on derivative instruments and hedging activities, see Note 7.
AFS Investment Securities
AFS securities are reported at fair value in the balance sheets. Interest income, including amortization of premiums and
| | | | | | | | |
| December 2020 Form 10-K | 90 | |
| | | | | |
| |
| Notes to Consolidated Financial Statements | |
accretion of discounts, is included in Interest income in the Income statements. Unrealized gains are recorded in OCI and unrealized losses are recorded either in OCI or in Other revenues as described below.
AFS securities in an unrealized loss position are first evaluated to determine whether there is an intent to sell or it is more likely than not the Firm will be required to sell before recovery of the amortized cost basis. If so, the amortized cost basis is written down to the fair value of the security such that the entire unrealized loss is recognized in Other revenues and any previously established ACL is written off.
For all other AFS securities in an unrealized loss position, any portion of unrealized losses representing a credit loss is recognized in Other revenues and as an increase to the ACL for AFS securities, with the remainder of unrealized losses recognized in OCI. A credit loss exists if the Firm does not expect to recover the amortized cost basis of the security. When considering whether a credit loss exists, the Firm considers relevant information, including:
•guarantees (implicit or explicit) by the U.S. Government;
•the extent to which the fair value has been less than the amortized cost basis;
•adverse conditions specifically related to the security, its industry or geographic area;
•changes in the financial condition of the issuer of the security, or, in the case of an asset-backed debt security, changes in the financial condition of the underlying loan obligors;
•the payment structure of the debt security and the likelihood of the issuer being able to make payments that increase in the future;
•failure of the issuer of the security to make scheduled interest or principal payments;
•the current rating and any changes to the rating of the security by a rating agency.
If a credit loss exists, the Firm measures the credit loss as the difference between the present value of cash flows expected to be collected (discounted at the implicit interest rate at acquisition of the security or discounted at the effective yield for securities that incorporate changes in prepayment assumptions) and the amortized cost basis of the security. Changes in prepayment assumptions alone are not considered to result in a credit loss. When estimating the present value of expected cash flows, information utilized includes the remaining payment terms of the security, prepayment speeds, financial condition of the issuer, expected defaults and the value of any underlying collateral.
Presentation of ACL and Provision for Credit Losses
| | | | | | | | |
| ACL | Provision for
Credit Losses |
| AFS securities | Contra Investment securities | Other revenue |
Nonaccrual & ACL Charge-offs on AFS Securities
AFS securities follow the same nonaccrual and write-off guidance as discussed in “Allowance for Credit Losses” herein, except as set forth in “Modifications and Nonaccrual Status for Borrowers Impacted by COVID-19” herein.
HTM Securities
HTM securities are reported at amortized cost, net of any ACL, in the balance sheets. Refer to “Allowance for Credit Losses” herein for guidance on the ACL determination. Interest income, including amortization of premiums and accretion of discounts on HTM securities, is included in Interest income in the income statements.
Loans
The Firm accounts for loans based on the following categories: loans held for investment; loans held for sale; and loans at fair value.
Nonaccrual
All loan categories described below follow the same nonaccrual and write-off guidance as discussed in “Allowance for Credit Losses” herein.
Loans Held for Investment
Loans held for investment are reported at outstanding principal adjusted for any charge-offs, the allowance for loan losses, any unamortized deferred fees or costs for originated loans, and any unamortized premiums or discounts for purchased loans.
Interest Income. Interest income on performing loans held for investment is accrued and recognized as interest income at the contractual rate of interest. Purchase price discounts or premiums, as well as net deferred loan fees or costs, are amortized into interest income over the life of the loan to produce a level rate of return.
Lending Commitments. The Firm records the liability and related expense for the credit exposure related to commitments to fund loans. For more information regarding loan commitments, standby letters of credit and financial guarantees, see Note 15.
For more information regarding allowance for credit losses, refer to “Allowance for Credit Losses” herein.
Loans Held for Sale
Loans held for sale are measured at the lower of cost or fair value, with valuation changes recorded in Other revenues. The Firm determines the valuation allowance on an individual loan basis, except for residential mortgage loans for which the valuation allowance is determined at the loan product level. Any decreases in fair value below the initial carrying amount
| | | | | | | | |
| 91 | December 2020 Form 10-K |
| | | | | |
| |
| Notes to Consolidated Financial Statements | |
and any recoveries in fair value up to the initial carrying amount are recorded in Other revenues. Increases in fair value above initial carrying value are not recognized.
Interest income. Interest income on loans held for sale is accrued and recognized based on the contractual rate of interest. Loan origination fees or costs and purchase price discounts or premiums are deferred as an adjustment to the loan’s cost basis until the related loan is sold and, as such, are included in the periodic determination of the lower of cost or fair value adjustments and the gain or loss recognized at the time of sale.
Lending Commitments. Commitments to fund mortgage loans held for sale are derivatives and are reported in Trading assets or Trading liabilities in the balance sheets with an offset to Trading revenues in the income statements.
For commitments to fund non-mortgage loans, the Firm records the liability and related expense for the fair value exposure below cost of such commitments in Other liabilities and accrued expenses in the balance sheets with an offset to Other revenues in the income statements.
Because loans and lending commitments held for sale are recognized at the lower of cost or fair value, the allowance for loan losses and charge-off policies do not apply to these loans.
Loans at Fair Value
Loans for which the fair value option is elected are carried at fair value, with changes in fair value recognized in earnings. Loans carried at fair value are not evaluated for purposes of recording an allowance for loan losses. For further information on loans carried at fair value and classified as Trading assets and Trading liabilities, see Note 5.
Lending Commitments. The Firm records the liability and related expense for the fair value exposure related to commitments to fund loans that will be measured at fair value. The liability is recorded in Trading liabilities in the balance sheets, and the expense is recorded in Trading revenues in the income statements.
Because such loans and lending commitments are reported at fair value, the allowance for loan losses and charge-off policies do not apply to these loans.
For further information on loans, see Note 10.
Allowance for Credit Losses
The ACL for financial instruments measured at amortized cost and certain off-balance sheet exposures (e.g., HFI loans and lending commitments, HTM securities, customer and other receivables and certain guarantees) represents an estimate of expected credit losses over the entire life of the financial instrument.
Factors considered by management when determining the ACL include payment status, fair value of collateral and expected payments of principal and interest, as well as internal or external information relating to past events, current conditions and reasonable and supportable forecasts. The Firm uses three forecasts that include assumptions about certain macroeconomic variables including, but not limited to, U.S. gross domestic product (“GDP”), equity market indices and unemployment rates, as well as commercial real estate and home price indices. At the conclusion of the Firm’s reasonable and supportable forecast period of 13 quarters, there is a gradual reversion back to historical averages.
The ACL is measured on a collective basis when similar risk characteristics exist for multiple instruments considering all available information relevant to assessing the collectability of cash flows. Generally, the Firm applies a probability of default/loss given default model for instruments that are collectively assessed, under which the ACL is calculated as the product of probability of default, loss given default and exposure at default. These parameters are forecast for each collective group of assets using a scenario-based statistical model.
If the instrument does not share similar risk characteristics with other instruments, including when it is probable that the Firm will be unable to collect the full payment of principal and interest on the instrument when due, the ACL is measured on an individual basis. The Firm generally applies a discounted cash flow method for instruments that are individually assessed.
The Firm may also elect to use an approach that considers the fair value of the collateral when measuring the ACL if the loan is collateral dependent (i.e., repayment of the loan is expected to be provided substantially by the sale or operation of the underlying collateral and the borrower is experiencing financial difficulty).
Additionally, the Firm can elect to use an approach to measure the ACL using the fair value of collateral where the borrower is required to, and reasonably expected to, continually adjust and replenish the amount of collateral securing the instrument to reflect changes in the fair value of such collateral. The Firm has elected to use this approach for certain securities-based loans, margin loans, Securities purchased under agreements to resell and Securities borrowed.
Credit quality indicators considered in developing the ACL include:
•Corporate loans, Secured lending facilities, Commercial real estate loans and securities, and Other loans: Internal risk ratings developed by the Credit Risk Management Department that are refreshed at least annually, and more frequently as necessary. These ratings generally correspond to external ratings published by S&P. The Firm also
| | | | | | | | |
| December 2020 Form 10-K | 92 | |
| | | | | |
| |
| Notes to Consolidated Financial Statements | |
considers transaction structure, including type of collateral, collateral terms and position of the obligation within the capital structure. In addition, for Commercial real estate, the Firm considers property type and location, net operating income and LTV ratios, among other factors, as well as commercial real estate price and credit spread indices and capitalization rates.
•Residential real estate loans: Loan origination Fair Isaac Corporation (“FICO”) credit scores as determined by independent credit agencies in the United States and LTV ratios.
•Employee loans: Employment status, which includes those currently employed by the Firm and for which the Firm can deduct any unpaid amounts due to it through certain compensation arrangements; and those no longer employed by the Firm where such arrangements are no longer applicable.
For Securities-based loans, the Firm generally measures the ACL based on the fair value of collateral.
Qualitative and environmental factors such as economic and business conditions, the nature and volume of the portfolio, and lending terms and the volume and severity of past due loans are also considered in the ACL calculations.
Presentation of ACL and Provision for Credit Losses
| | | | | | | | |
| ACL | Provision for
Credit Losses |
Instruments measured at amortized cost (e.g., HFI loans, HTM securities and customer and other receivables) | Contra asset | Other revenue |
Employee loans | Contra asset | Compensation and benefits expense |
Off-balance sheet instruments (e.g., HFI lending commitments and certain guarantees) | Other liabilities and accrued expenses | Other expense |
Troubled Debt Restructurings “TDRs”
The Firm may modify the terms of certain loans for economic or legal reasons related to a borrower’s financial difficulties by granting one or more concessions that the Firm would not otherwise consider. Such modifications are accounted for and reported as a TDR, except for certain modifications related to the Coronavirus Disease (“COVID-19”) as noted in “Modifications and Nonaccrual Status for Borrowers Impacted by COVID-19” herein. A loan that has been modified in a TDR is generally considered to be impaired and is evaluated individually. TDRs are also generally classified as nonaccrual and may be returned to accrual status only after the Firm expects repayment of the remaining contractual principal and interest and there is sustained repayment performance for a reasonable period.
Nonaccrual
The Firm places financial instruments on nonaccrual status if principal or interest is not expected when contractually due or is past due for a period of 90 days or more unless the
obligation is well-secured and in the process of collection. For borrowers impacted by COVID-19, see “Modifications and Nonaccrual Status for Borrowers Impacted by COVID-19” herein for additional considerations.
For any instrument placed on nonaccrual status, the Firm reverses any unpaid interest accrued with an offsetting reduction to Interest income. Principal and interest payments received on nonaccrual instruments are applied to principal if there is doubt regarding the ultimate collectability of principal. If collection of the principal is not in doubt, interest income is realized on a cash basis. If the instrument is brought current and neither principal or interest collection is in doubt, instruments can generally return to accrual status and interest income can be recognized.
Modifications and Nonaccrual Status for Borrowers Impacted by COVID-19
In the first quarter of 2020, the Firm elected to apply the guidance issued by Congress in the Coronavirus Aid, Relief, and Economic Security Act (“CARES Act”) as well as by the U.S. banking agencies stating that certain concessions granted to borrowers that are current on existing loans, either individually or as part of a program for creditworthy borrowers who are experiencing short-term financial or operational problems as a result of COVID-19, generally would not be considered TDRs. Additionally, these loans generally would not be considered nonaccrual unless collectability concerns exist despite the modification provided. For loans remaining on accrual status, the Firm elected to continue recognizing interest income during the modification periods.
ACL Charge-offs
The principal balance of a financial instrument is charged off in the period it is deemed uncollectible resulting in a reduction in the ACL and the balance of the financial instrument in the balance sheet. Accrued interest receivable balances that are separately recorded from the related financial instruments are charged off against Interest income when the related financial instrument is placed on nonaccrual. Accordingly, the Firm elected not to measure an ACL for accrued interest receivables. However, in the case of loans that are modified as a result of COVID-19 and remain on accrual status due to the relief noted in “Modifications and Nonaccrual Status for Borrowers Impacted by COVID-19” herein, accrued interest receivable balances are assessed for any required ACL.
Transfers of Financial Assets
Transfers of financial assets are accounted for as sales when the Firm has relinquished control over the transferred assets. Any related gain or loss on sale is recorded in Net revenues. Transfers that are not accounted for as sales are treated as collateralized financings. Securities borrowed or purchased under agreements to resell and securities loaned or sold under
| | | | | | | | |
| 93 | December 2020 Form 10-K |
| | | | | |
| |
| Notes to Consolidated Financial Statements | |
agreements to repurchase are treated as collateralized financings (see Note 9).
Securities purchased under agreements to resell (“reverse repurchase agreements”) and Securities sold under agreements to repurchase (“repurchase agreements”) are carried in the balance sheets at the amount of cash paid or received, plus accrued interest, except for certain reverse repurchase and repurchase agreements for which the Firm has elected the fair value option (see Note 6). Where appropriate, repurchase agreements and reverse repurchase agreements with the same counterparty are reported on a net basis. Securities borrowed and securities loaned are recorded at the amount of cash collateral advanced or received.
In instances where the Firm is the lender in securities-for-securities transactions and is permitted to sell or repledge these securities, the fair value of the collateral received is reported in Trading assets, and the related obligation to return the collateral is reported in Trading liabilities in the balance sheets. Securities-for-securities transactions where the Firm is the borrower are not included in the balance sheets.
In order to manage credit exposure arising from these transactions, in appropriate circumstances, the Firm enters into master netting agreements and collateral agreements with its counterparties. These agreements provide the Firm with the right, in the event of a default by the counterparty, to net a counterparty’s rights and obligations under the agreement and to liquidate and set off collateral held by the Firm against the net amount owed by the counterparty.
The Firm’s policy is generally to take possession of securities purchased or borrowed in connection with reverse repurchase agreements and securities borrowed transactions, respectively, and to receive cash and/or securities delivered under repurchase agreements or securities loaned transactions (with rights of rehypothecation).
For information related to offsetting of certain collateralized transactions, see Note 9.
Premises, Equipment and Capitalized Software Costs
Premises, equipment and capitalized software costs consist of buildings, leasehold improvements, furniture, fixtures, computer and communications equipment, power generation assets and capitalized software (externally purchased and developed for internal use). Premises, equipment and capitalized software costs are stated at cost less accumulated depreciation and amortization and are included in Other assets in the balance sheets. Depreciation and amortization are provided by the straight-line method over the estimated useful life of the asset.
Estimated Useful Lives of Assets
| | | | | |
| in years | Estimated Useful Life |
| Buildings | 39 |
| Leasehold improvements—Building | term of lease to 25 |
| Leasehold improvements—Other | term of lease to 15 |
| Furniture and fixtures | 7 |
| Computer and communications equipment | 3 to 9 |
| Power generation assets | 15 to 29 |
| Capitalized software costs | 2 to 10 |
Premises, equipment and capitalized software costs are tested for impairment whenever events or changes in circumstances suggest that an asset’s carrying value may not be fully recoverable.
Goodwill and Intangible Assets
The Firm tests goodwill for impairment on an annual basis and on an interim basis when certain events or circumstances exist. The Firm tests goodwill for impairment at the reporting unit level, which is generally at the level of or one level below its business segments. For both the annual and interim tests, the Firm has the option to either (i) perform a quantitative impairment test or (ii) first perform a qualitative assessment to determine whether it is more likely than not that the fair value of a reporting unit is less than its carrying amount, in which case the quantitative test would be performed.
When performing a quantitative impairment test, the Firm compares the fair value of a reporting unit with its carrying amount, including goodwill. If the fair value of the reporting unit is less than its carrying amount, the goodwill impairment loss is equal to the excess of the carrying value over the fair value, limited to the carrying amount of goodwill allocated to that reporting unit.
The estimated fair values of the reporting units are derived based on valuation techniques the Firm believes market participants would use for each respective reporting unit. The estimated fair values are generally determined by utilizing a discounted cash flow methodology or methodologies that incorporate price-to-book and price-to-earnings multiples of certain comparable companies.
Intangible assets are amortized over their estimated useful lives and are reviewed for impairment on an interim basis when impairment indicators are present. Impairment losses are recorded within Other expenses in the income statements.
Earnings per Common Share
Basic EPS is computed by dividing earnings available to Morgan Stanley common shareholders by the weighted average number of common shares outstanding for the period. Earnings available to Morgan Stanley common shareholders represents net income applicable to Morgan Stanley reduced by preferred stock dividends. Common shares outstanding include common stock and vested RSUs where recipients
| | | | | | | | |
| December 2020 Form 10-K | 94 | |
| | | | | |
| |
| Notes to Consolidated Financial Statements | |
have satisfied the relevant vesting terms. Diluted EPS reflects the assumed conversion of all dilutive securities.
Share-based awards that pay dividend equivalents subject to vesting are included in diluted shares outstanding (if dilutive) under the treasury stock method.
The Firm has granted PSUs that vest and convert to shares of common stock only if predetermined performance and market goals are satisfied. Since the issuance of the shares is contingent upon the satisfaction of certain conditions, the PSUs are included in diluted EPS based on the number of shares (if any) that would be issuable if the reporting date was the end of the performance period.
For further information on diluted earnings (loss) per common share, see Note 18 to the financial statements.
Deferred Compensation
Stock-Based Compensation
The Firm measures compensation expense for stock-based awards at fair value. The Firm determines the fair value of RSUs (including PSUs with non-market performance conditions) based on the grant-date fair value of its common stock, measured as the volume-weighted average price on the date of grant (“VWAP”). The fair value of RSUs not entitled to dividends until conversion is measured at VWAP reduced by the present value of dividends expected to be paid on the underlying shares prior to scheduled conversion date. PSUs that contain market-based conditions are valued using a Monte Carlo valuation model.
Compensation expense is recognized over the vesting period relevant to each separately vesting portion of the award. Compensation expense for awards with performance conditions is recognized based on the probable outcome of the performance condition at each reporting date. Compensation expense for awards with market-based conditions is recognized irrespective of the probability of the market condition being achieved and is not reversed if the market condition is not met. The Firm accounts for forfeitures as they occur.
Stock-based awards generally contain clawback and cancellation provisions. Certain awards provide the Firm discretion to claw back or cancel all or a portion of the award under specified circumstances. Compensation expense for those awards is adjusted for changes in the fair value of the Firm’s common stock or the relevant model valuation, as appropriate, until conversion, exercise or expiration.
Employee Stock Trusts
In connection with certain stock-based compensation plans, the Firm has established employee stock trusts to provide, at its discretion, common stock voting rights to certain RSU holders. Following an RSU award, when a stock trust is utilized, the Firm contributes shares to be held in the stock
trust until the RSUs convert to common shares. The assets of the employee stock trusts are consolidated with those of the Firm and are generally accounted for in a manner similar to treasury stock, where the shares of common stock outstanding reported in Common stock issued to employee stock trusts are offset by an equal amount reported in Employee stock trusts in the balance sheets.
The Firm uses the grant-date fair value of stock-based compensation as the basis for recording the movement of the assets to or from the employee stock trusts. Changes in the fair value are not recognized as the Firm’s stock-based compensation must be settled by delivery of a fixed number of shares of the Firm’s common stock.
Deferred Cash-Based Compensation
Compensation expense for deferred cash-based compensation awards is calculated based on the notional value of the award granted, adjusted for changes in the fair value of the referenced investments that employees select. Compensation expense is recognized over the vesting period relevant to each separately vesting portion of the award. Compensation expense for these awards is adjusted based on notional earnings of the referenced investments until distribution.
The Firm invests directly, as a principal, in financial instruments and other investments to economically hedge certain of its obligations under its deferred cash-based compensation plans. Changes in the value of such investments are recorded in Trading revenues and Investments revenues. Although changes in compensation expense resulting from changes in the fair value of the referenced investments will generally be offset by changes in the fair value of investments made by the Firm, there is typically a timing difference between the immediate recognition of gains and losses on the Firm’s investments and the deferred recognition of the related compensation expense over the vesting period.
Retirement-Eligible Employee Compensation
For year-end stock-based awards and deferred cash-based compensation awards anticipated to be granted to retirement-eligible employees under award terms that do not contain a future service requirement, the Firm accrues the estimated cost of the awards over the course of the calendar year preceding the grant date, which reflects the period over which the compensation is earned.
Carried Interest Compensation
The Firm generally recognizes compensation expense for any portion of carried interest (both realized and unrealized) that is allocated to employees. For information on performance-based fees in the form of carried interest, which are directly related to carried interest compensation, see “Revenue Recognition—Carried Interest” herein.
| | | | | | | | |
| 95 | December 2020 Form 10-K |
| | | | | |
| |
| Notes to Consolidated Financial Statements | |
Income Taxes
Deferred tax assets and liabilities are recorded based upon the temporary differences between the financial statement and income tax bases of assets and liabilities using currently enacted tax rates in effect for the year in which the differences are expected to reverse. The effect of a change in tax rates on deferred tax assets and liabilities is recognized in income tax expense (benefit) in the period that includes the enactment date. Such effects are recorded in income tax expense (benefit) from continuing operations regardless of where deferred taxes were originally recorded.
The Firm recognizes net deferred tax assets to the extent that it believes these assets are more likely than not to be realized. In making such a determination, the Firm considers all available positive and negative evidence, including future reversals of existing taxable temporary differences, projected future taxable income, tax planning strategies and results of recent operations. When performing the assessment, the Firm considers all types of deferred tax assets in combination with each other, regardless of the origin of the underlying temporary difference. If a deferred tax asset is determined to be unrealizable, a valuation allowance is established. If the Firm subsequently determines that it would be able to realize deferred tax assets in excess of their net recorded amount, it would make an adjustment to the deferred tax asset valuation allowance, which would reduce the provision for income taxes.
The Firm recognizes tax expense associated with Global Intangible Low-Taxed Income as it is incurred as part of the current income taxes to be paid or refunded for the current period.
Uncertain tax positions are recorded on the basis of a two-step process, whereby (i) the Firm determines whether it is more likely than not that the tax positions will be sustained on the basis of the technical merits of the position and (ii) for those tax positions that meet this threshold, the Firm recognizes the largest amount of tax benefit that is more likely than not to be realized upon ultimate settlement with the related tax authority. Interest and penalties related to unrecognized tax benefits are recognized as a component of the provision for income taxes.
Foreign Currencies
Assets and liabilities of operations with non-U.S. dollar functional currencies are translated at year-end rates of exchange. Gains or losses resulting from translating foreign currency financial statements, net of hedge gains or losses and related tax effects, are reflected in AOCI in the balance sheets. Gains or losses resulting from remeasurement of foreign currency transactions are included in net income, and amounts recognized in the income statement are translated at the rate of exchange on the respective date of recognition for each amount.
Accounting Updates Adopted in 2020
Reference Rate Reform
The Firm has adopted the Reference Rate Reform accounting update. There was no impact to the Firm’s financial statements upon initial adoption.
This accounting update provides optional accounting relief to entities with contracts, hedge accounting relationships or other transactions that reference LIBOR or other interest rate benchmarks for which the referenced rate is expected to be discontinued or replaced. The Firm is applying the accounting relief as relevant contract and hedge accounting relationship modifications are made during the course of the reference rate reform transition period. The optional relief generally allows for contract modifications solely related to the replacement of the reference rate to be accounted for as a continuation of the existing contract instead of as an extinguishment of the contract and would therefore not trigger certain accounting impacts that would otherwise be required. It also allows entities to change certain critical terms of existing hedge accounting relationships that are affected by reference rate reform, and these changes would not require de-designating the hedge accounting relationship. The optional relief ends December 31, 2022.
Financial Instruments—Credit Losses
The Firm has adopted the Financial Instruments—Credit Losses.
This accounting update impacted the impairment model for certain financial assets measured at amortized cost by requiring a CECL methodology to estimate expected credit losses over the entire life of the financial asset, recorded at inception or purchase. CECL replaced the incurred loss model previously applicable to loans held for investment, HTM securities and other receivables carried at amortized cost, such as employee loans.
The update also eliminated the concept of other-than-temporary impairment for AFS securities and instead requires impairments on AFS securities to be recognized in earnings through an allowance when the fair value is less than amortized cost and a credit loss exists, and through a permanent reduction of the amortized cost basis when the securities are expected to be sold before recovery of amortized cost.
At transition on January 1, 2020, the adoption of this accounting standard resulted in an increase in the allowance for credit losses of $131 million with a corresponding reduction in Retained earnings of $100 million, net of tax. The adoption impact was primarily attributable to a $124 million increase in the allowance for credit losses on employee loans.
| | | | | | | | |
| December 2020 Form 10-K | 96 | |
| | | | | |
| |
| Notes to Consolidated Financial Statements | |
Accounting Updates Adopted in 2019
Leases
Upon the adoption of Leases, the Firm began recognizing in the balance sheet leases with terms exceeding one year as right-of-use (“ROU”) assets and corresponding liabilities. The adoption resulted in an increase to Retained earnings of approximately $63 million, net of tax, related to deferred revenue from previously recorded sale-leaseback transactions. At transition on January 1, 2019, the adoption also resulted in a balance sheet gross-up of approximately $4 billion reflected in Other assets and Other liabilities and accrued expenses. See Note 10 for lease disclosures, including amounts reflected in the December 31, 2019 balance sheet. Prior period amounts were not restated.
As allowed by the guidance, the Firm elected not to reassess the following at transition: whether existing contracts are or contain leases; and for existing leases, lease classification and initial direct costs. In addition, the Firm continues to account for existing land easements as service contracts.
Both at transition and for new leases thereafter, ROU assets and lease liabilities are initially recognized based on the present value of the future minimum lease payments over the lease term, including non-lease components such as fixed common area maintenance costs and other fixed costs such as real estate taxes and insurance.
The discount rates used in determining the present value of leases are the Firm’s incremental borrowing rates, developed based upon each lease’s term and currency of payment. The lease term includes options to extend or terminate the lease when it is reasonably certain that the Firm will exercise that option. For operating leases, the ROU assets also include any prepaid lease payments and initial direct costs incurred and are reduced by lease incentives. For these leases, lease expense is recognized on a straight-line basis over the lease term if the ROU asset has not been impaired or abandoned.
Derivatives and Hedging (ASU 2018-16)
The amendments in this update permit use of the OIS rate based on the Secured Overnight Financing Rate as a U.S. benchmark interest rate for hedge accounting purposes. The Firm adopted this update on a prospective basis for qualifying new or redesignated hedging relationships. This update did not impact the Firm’s pre-existing hedges.
3. Acquisitions
Acquisition of E*TRADE
On October 2, 2020, the Firm completed the acquisition of 100% of E*TRADE Financial Corporation (“E*TRADE”) in a stock-for-stock transaction, which increases the scale and breadth of the Wealth Management business segment. Total consideration for the transaction was approximately $11.9
billion, which principally consists of the $11 billion fair value of 233 million common shares issued from Common stock held in treasury, at an exchange ratio of 1.0432 per E*TRADE common share. In addition, the Firm issued Series M and Series N preferred shares with a fair value of approximately $0.7 billion in exchange for E*TRADE’s existing preferred stock.
Upon acquisition, the assets and liabilities of E*TRADE were adjusted to their respective fair values as of the closing date of the transaction, including the identifiable intangible assets acquired. In addition, the excess of the purchase price over the fair value of the net assets acquired has been recorded as goodwill. The fair value estimates used in valuing certain acquired assets and liabilities are based, in part, on inputs that are unobservable. For intangible assets, these include, but are not limited to, forecasted future cash flows, revenue growth rates, customer attrition rates and discount rates.
E*TRADE Purchase Price Allocation
| | | | | |
| $ in millions | At
October 2,
2020 |
| Assets | |
| Cash and cash equivalents | $ | 3,807 | |
| Trading assets at fair value: | |
| Loans and lending commitments | 1,124 | |
| Investments | 44 | |
| Investment securities | 48,855 | |
| Securities borrowed | 975 | |
| Customer and other receivables | 12,267 | |
| Loans: | |
| Held for investment | 462 | |
| Goodwill | 4,270 | |
Intangible assets1 | 3,282 | |
| Other assets | 1,351 | |
| Total assets | $ | 76,437 | |
| Liabilities | |
| Deposits | $ | 44,890 | |
| Securities loaned | 766 | |
| Customer and other payables | 15,488 | |
| Other liabilities and accrued expenses | 1,688 | |
| Borrowings | 1,665 | |
| Total liabilities | $ | 64,497 | |
1.Acquired intangible assets are primarily composed of $2.8 billion related to customer relationships with a weighted-average life of 17 years.
E*TRADE’s results are included in the Firm’s consolidated results for the period from October 2, 2020 to December 31, 2020. For this period, Net revenues were approximately $600 million and Net income (loss) was not material.
| | | | | | | | |
| 97 | December 2020 Form 10-K |
| | | | | |
| |
| Notes to Consolidated Financial Statements | |
Morgan Stanley and E*TRADE Proforma Combined Financial Information (Unaudited)
| | | | | | | | |
| $ in millions | 2020 | 2019 |
| Net revenues | $ | 50,203 | | $ | 44,192 | |
| Net income | 11,459 | | 9,839 | |
The proforma financial information presented in the previous table was computed by combining the historical financial information of the Firm and E*TRADE along with the effects of the acquisition method of accounting for business combinations as though the companies were combined on January 1, 2019. The proforma information does not reflect the potential benefits of cost and funding synergies, opportunities to earn additional revenues, or other factors, and therefore does not represent what the actual Net revenues and Net income would have been had the companies actually been combined as of this date.
4. Cash and Cash Equivalents
Cash and cash equivalents consist of Cash and due from banks and Interest bearing deposits with banks. Cash equivalents are highly liquid investments with remaining maturities of three months or less from the acquisition date that are readily convertible to cash and are not held for trading purposes.
| | | | | | | | |
| $ in millions | At
December 31,
2020 | At
December 31,
2019 |
| Cash and due from banks | $ | 9,792 | | $ | 6,763 | |
| Interest bearing deposits with banks | 95,862 | | 75,408 | |
| Total Cash and cash equivalents | $ | 105,654 | | $ | 82,171 | |
| Restricted cash | $ | 38,202 | | $ | 32,512 | |
Cash and cash equivalents also include Restricted cash such as cash segregated in compliance with federal or other regulations, including minimum reserve requirements set by the Federal Reserve Bank and other central banks, and the Firm's initial margin deposited with clearing organizations.
5. Fair Values
Recurring Fair Value Measurements
Assets and Liabilities Measured at Fair Value on a Recurring Basis
| | | | | | | | | | | | | | | | | |
| At December 31, 2020 |
| $ in millions | Level 1 | Level 2 | Level 3 | Netting1 | Total |
| Assets at fair value | | | | |
| Trading assets: | | | | | |
U.S. Treasury and agency securities | $ | 43,084 | | $ | 31,524 | | $ | 9 | | $ | — | | $ | 74,617 | |
Other sovereign government obligations | 26,174 | | 5,048 | | 268 | | — | | 31,490 | |
State and municipal securities | — | | 1,135 | | — | | — | | 1,135 | |
MABS | — | | 1,070 | | 322 | | — | | 1,392 | |
Loans and lending commitments2 | — | | 5,389 | | 5,759 | | — | | 11,148 | |
Corporate and other debt | — | | 30,093 | | 3,435 | | — | | 33,528 | |
Corporate equities3 | 111,575 | | 1,142 | | 86 | | — | | 112,803 | |
Derivative and other contracts: | | | | |
| Interest rate | 4,458 | | 227,818 | | 1,210 | | — | | 233,486 | |
| Credit | — | | 6,840 | | 701 | | — | | 7,541 | |
Foreign exchange | 29 | | 93,770 | | 260 | | — | | 94,059 | |
| Equity | 1,132 | | 65,943 | | 1,369 | | — | | 68,444 | |
Commodity and other | 1,818 | | 10,108 | | 2,723 | | — | | 14,649 | |
Netting1 | (5,488) | | (310,534) | | (1,351) | | (62,956) | | (380,329) | |
Total derivative and other contracts | 1,949 | | 93,945 | | 4,912 | | (62,956) | | 37,850 | |
Investments4 | 624 | | 234 | | 828 | | — | | 1,686 | |
Physical commodities | — | | 3,260 | | — | | — | | 3,260 | |
Total trading assets4 | 183,406 | | 172,840 | | 15,619 | | (62,956) | | 308,909 | |
Investment securities —AFS | 46,354 | | 61,225 | | 2,804 | | — | | 110,383 | |
Securities purchased under agreements to resell | — | | 12 | | 3 | | — | | 15 | |
Total assets at fair value | $ | 229,760 | | $ | 234,077 | | $ | 18,426 | | $ | (62,956) | | $ | 419,307 | |
| | | | | | | | |
| December 2020 Form 10-K | 98 | |
| | | | | |
| |
| Notes to Consolidated Financial Statements | |
| | | | | | | | | | | | | | | | | |
| At December 31, 2020 |
| $ in millions | Level 1 | Level 2 | Level 3 | Netting1 | Total |
| Liabilities at fair value | | | | |
| Deposits | $ | — | | $ | 3,395 | | $ | 126 | | $ | — | | $ | 3,521 | |
| Trading liabilities: | | | | | |
U.S. Treasury and agency securities | 10,204 | | 1 | | — | | — | | 10,205 | |
Other sovereign government obligations | 24,209 | | 1,738 | | 16 | | — | | 25,963 | |
Corporate and other debt | — | | 8,468 | | — | | — | | 8,468 | |
Corporate equities3 | 67,822 | | 172 | | 63 | | — | | 68,057 | |
Derivative and other contracts: | | | | |
| Interest rate | 4,789 | | 213,321 | | 528 | | — | | 218,638 | |
| Credit | — | | 7,500 | | 652 | | — | | 8,152 | |
Foreign exchange | 11 | | 94,698 | | 199 | | — | | 94,908 | |
| Equity | 1,245 | | 81,683 | | 3,600 | | — | | 86,528 | |
Commodity and other | 1,758 | | 9,418 | | 1,014 | | — | | 12,190 | |
Netting1 | (5,488) | | (310,534) | | (1,351) | | (58,105) | | (375,478) | |
Total derivative and other contracts | 2,315 | | 96,086 | | 4,642 | | (58,105) | | 44,938 | |
| Total trading liabilities | 104,550 | | 106,465 | | 4,721 | | (58,105) | | 157,631 | |
Securities sold under agreements to repurchase | — | | 671 | | 444 | | — | | 1,115 | |
Other secured financings | — | | 11,185 | | 516 | | — | | 11,701 | |
| Borrowings | — | | 69,327 | | 4,374 | | — | | 73,701 | |
Total liabilities at fair value | $ | 104,550 | | $ | 191,043 | | $ | 10,181 | | $ | (58,105) | | $ | 247,669 | |
| | | | | | | | | | | | | | | | | |
| At December 31, 2019 |
| $ in millions | Level 1 | Level 2 | Level 3 | Netting1 | Total |
| Assets at fair value | | | | |
| Trading assets: | | | | | |
U.S. Treasury and agency securities | $ | 36,866 | | $ | 28,992 | | $ | 22 | | $ | — | | $ | 65,880 | |
Other sovereign government obligations | 23,402 | | 4,347 | | 5 | | — | | 27,754 | |
State and municipal securities | — | | 2,790 | | 1 | | — | | 2,791 | |
MABS | — | | 1,690 | | 438 | | — | | 2,128 | |
Loans and lending commitments2 | — | | 6,253 | | 5,073 | | — | | 11,326 | |
Corporate and other debt | — | | 22,124 | | 1,396 | | — | | 23,520 | |
Corporate equities3 | 123,942 | | 652 | | 97 | | — | | 124,691 | |
Derivative and other contracts: | | | | |
| Interest rate | 1,265 | | 182,977 | | 1,239 | | — | | 185,481 | |
| Credit | — | | 6,658 | | 654 | | — | | 7,312 | |
Foreign exchange | 15 | | 64,260 | | 145 | | — | | 64,420 | |
| Equity | 1,219 | | 48,927 | | 922 | | — | | 51,068 | |
Commodity and other | 1,079 | | 7,255 | | 2,924 | | — | | 11,258 | |
Netting1 | (2,794) | | (235,947) | | (993) | | (47,804) | | (287,538) | |
Total derivative and other contracts | 784 | | 74,130 | | 4,891 | | (47,804) | | 32,001 | |
Investments4 | 481 | | 252 | | 858 | | — | | 1,591 | |
Physical commodities | — | | 1,907 | | — | | — | | 1,907 | |
Total trading assets4 | 185,475 | | 143,137 | | 12,781 | | (47,804) | | 293,589 | |
Investment securities —AFS | 32,902 | | 29,321 | | — | | — | | 62,223 | |
Securities purchased under agreements to resell | — | | 4 | | — | | — | | 4 | |
Total assets at fair value | $ | 218,377 | | $ | 172,462 | | $ | 12,781 | | $ | (47,804) | | $ | 355,816 | |
| | | | | | | | | | | | | | | | | |
| At December 31, 2019 |
| $ in millions | Level 1 | Level 2 | Level 3 | Netting1 | Total |
| Liabilities at fair value | | | | |
| Deposits | $ | — | | $ | 1,920 | | $ | 179 | | $ | — | | $ | 2,099 | |
| Trading liabilities: | | | | | |
U.S. Treasury and agency securities | 11,191 | | 34 | | — | | — | | 11,225 | |
Other sovereign government obligations | 21,837 | | 1,332 | | 1 | | — | | 23,170 | |
Corporate and other debt | — | | 7,410 | | — | | — | | 7,410 | |
Corporate equities3 | 63,002 | | 79 | | 36 | | — | | 63,117 | |
Derivative and other contracts: | | | | |
| Interest rate | 1,144 | | 171,025 | | 462 | | — | | 172,631 | |
| Credit | — | | 7,391 | | 530 | | — | | 7,921 | |
Foreign exchange | 6 | | 67,473 | | 176 | | — | | 67,655 | |
| Equity | 1,200 | | 49,062 | | 2,606 | | — | | 52,868 | |
Commodity and other | 1,194 | | 7,118 | | 1,312 | | — | | 9,624 | |
Netting1 | (2,794) | | (235,947) | | (993) | | (42,531) | | (282,265) | |
Total derivative and other contracts | 750 | | 66,122 | | 4,093 | | (42,531) | | 28,434 | |
| Total trading liabilities | 96,780 | | 74,977 | | 4,130 | | (42,531) | | 133,356 | |
Securities sold under agreements to repurchase | — | | 733 | | — | | — | | 733 | |
Other secured financings | — | | 7,700 | | 109 | | — | | 7,809 | |
| Borrowings | — | | 60,373 | | 4,088 | | — | | 64,461 | |
Total liabilities at fair value | $ | 96,780 | | $ | 145,703 | | $ | 8,506 | | $ | (42,531) | | $ | 208,458 | |
MABS—Mortgage- and asset-backed securities
1.For positions with the same counterparty that cross over the levels of the fair value hierarchy, both counterparty netting and cash collateral netting are included in the column titled “Netting.” Positions classified within the same level that are with the same counterparty are netted within that level. For further information on derivative instruments and hedging activities, see Note 7.
2.For a further breakdown by type, see the following Detail of Loans and Lending Commitments at Fair Value table.
3.For trading purposes, the Firm holds or sells short equity securities issued by entities in diverse industries and of varying sizes.
4.Amounts exclude certain investments that are measured based on NAV per share, which are not classified in the fair value hierarchy. For additional disclosure about such investments, see “Net Asset Value Measurements” herein.
Detail of Loans and Lending Commitments at Fair Value1
| | | | | | | | |
| $ in millions | At December 31, 2020 | At December 31, 2019 |
| Corporate | $ | 13 | | $ | 20 | |
| Secured lending facilities | 648 | | 951 | |
| Commercial real estate | 916 | | 2,098 | |
| Residential real estate | 2,145 | | 1,192 | |
| Securities-based lending and Other loans | 7,426 | | 7,065 | |
| Total | $ | 11,148 | | $ | 11,326 | |
1.Loans previously classified as corporate have been further disaggregated; prior period balances have been revised to conform with current period presentation.
Unsettled Fair Value of Futures Contracts1
| | | | | | | | |
| $ in millions | At December 31, 2020 | At December 31, 2019 |
| Customer and other receivables, net | $ | 434 | | $ | 365 | |
1.These contracts are primarily Level 1, actively traded, valued based on quoted prices from the exchange and are excluded from the previous recurring fair value tables.
| | | | | | | | |
| 99 | December 2020 Form 10-K |
| | | | | |
| |
| Notes to Consolidated Financial Statements | |
Valuation Techniques for Assets and Liabilities Measured at Fair Value on a Recurring Basis
U.S. Treasury and Agency Securities
U.S. Treasury Securities
Valuation Technique:
•Fair value is determined using quoted market prices.
Valuation Hierarchy Classification:
•Level 1—as inputs are observable and in an active market.
U.S. Agency Securities
Valuation Techniques:
•Non-callable agency-issued debt securities are generally valued using quoted market prices, and callable agency-issued debt securities are valued by benchmarking model-derived prices to quoted market prices and trade data for comparable instruments.
•The fair value of agency mortgage pass-through pool securities is model-driven based on spreads of comparable to-be-announced securities.
•CMOs are generally valued using quoted market prices and trade data adjusted by subsequent changes in related indices for comparable instruments.
Valuation Hierarchy Classification:
•Level 1—on-the-run agency issued debt securities if actively traded and inputs are observable
•Level 2—all other agency issued debt securities, agency mortgage pass-through pool securities and CMOs if actively traded and inputs are observable
•Level 3—in instances where the trading activity is limited or inputs are unobservable
Other Sovereign Government Obligations
Valuation Techniques:
•Fair value is determined using quoted prices in active markets when available. When not available, quoted prices in less-active markets are used. In the absence of position-specific quoted prices, fair value may be determined through benchmarking from comparable instruments.
Valuation Hierarchy Classification:
•Level 1—if actively traded and inputs are observable
•Level 2—if the market is less active or prices are dispersed
•Level 3—in instances where the prices are unobservable
State and Municipal Securities
Valuation Techniques:
•Fair value is determined using recently executed transactions, market price quotations or pricing models that factor in, where applicable, interest rates, bond or CDS spreads, adjusted for any basis difference between cash and derivative instruments.
Valuation Hierarchy Classification:
•Level 2—if value based on observable market data for comparable instruments
•Level 3—in instances where market data are not observable
MABS
Valuation Techniques:
•Mortgage- and asset-backed securities may be valued based on price or spread data obtained from observed transactions or independent external parties such as vendors or brokers.
•When position-specific external price data are not observable, the fair value determination may require benchmarking to comparable instruments, and/or analyzing expected credit losses, default and recovery rates, and/or applying discounted cash flow techniques. When evaluating the comparable instruments for use in the valuation of each security, security collateral-specific attributes, including payment priority, credit enhancement levels, type of collateral, delinquency rates and loss severity, are considered. In addition, for RMBS borrowers, FICO scores and the level of documentation for the loan are considered.
•Market standard cash flow models may be utilized to model the specific collateral composition and cash flow structure of each transaction. Key inputs to these models are market spreads, forecasted credit losses, and default and prepayment rates for each asset category.
•Valuation levels of RMBS and CMBS indices are used as an additional data point for benchmarking purposes or to price outright index positions.
Valuation Hierarchy Classification:
•Level 2—if value based on observable market data for comparable instruments
•Level 3—if external prices or significant spread inputs are unobservable, or if the comparability assessment involves significant subjectivity related to property type differences, cash flows, performance or other inputs
Loans and Lending Commitments
Valuation Techniques:
•Fair value of corporate loans is determined using recently executed transactions, market price quotations (where observable), implied yields from comparable debt, market observable CDS spread levels obtained from independent external parties adjusted for any basis difference between cash and derivative instruments, along with proprietary valuation models and default recovery analysis where such transactions and quotations are unobservable.
•Fair value of contingent corporate lending commitments is determined by using executed transactions on comparable loans and the anticipated market price based on pricing indications from syndicate banks and customers. The valuation of loans and lending commitments also takes into account fee income that is considered an attribute of the contract.
•Fair value of mortgage loans is determined using observable prices based on transactional data or third-party pricing for comparable instruments, when available.
•Where position-specific external prices are not observable, fair value is estimated based on benchmarking to prices and rates observed in the primary market for similar loan or borrower types or based on the present value of
| | | | | | | | |
| December 2020 Form 10-K | 100 | |
| | | | | |
| |
| Notes to Consolidated Financial Statements | |
expected future cash flows using the Firm’s best available estimates of the key assumptions, including forecasted credit losses, prepayment rates, forward yield curves and discount rates commensurate with the risks involved or a methodology that utilizes the capital structure and credit spreads of recent comparable securitization transactions.
•Fair value of equity margin loans is determined by discounting future interest cash flows, net of potential losses resulting from large downward price movements of the underlying margin loan collateral. The potential losses are modeled using the margin loan rate, which is calibrated from market observable CDS spreads, implied debt yields or volatility metrics of the loan collateral.
Valuation Hierarchy Classification:
•Level 2—if value based on observable market data for comparable instruments
•Level 3—in instances where prices or significant spread inputs are unobservable or if the comparability assessment involves significant subjectivity
Corporate and Other Debt
Corporate Bonds
Valuation Techniques:
•Fair value is determined using recently executed transactions, market price quotations, bond spreads and CDS spreads obtained from independent external parties, such as vendors and brokers, adjusted for any basis difference between cash and derivative instruments.
•The spread data used are for the same maturity as the bond. If the spread data do not reference the issuer, then data that reference comparable issuers are used. When position-specific external price data are not observable, fair value is determined based on either benchmarking to comparable instruments or cash flow models with yield curves, bond or single-name CDS spreads and recovery rates as significant inputs.
Valuation Hierarchy Classification:
•Level 2—if value based on observable market data for comparable instruments
•Level 3—in instances where prices or significant spread inputs are unobservable or if the comparability assessment involves significant subjectivity
CDO
Valuation Techniques:
•The Firm holds cash CDOs that typically reference a tranche of an underlying synthetic portfolio of single-name CDS spreads collateralized by corporate bonds (CLN) or cash portfolio of ABS/loans (“asset-backed CDOs”).
•Credit correlation, a primary input used to determine the fair value of CLNs, is usually unobservable and derived using a benchmarking technique. Other model inputs such as credit spreads, including collateral spreads, and interest rates, are typically observable.
•Asset-backed CDOs are valued based on an evaluation of the market and model input parameters sourced from comparable instruments as indicated by market activity. Each asset-backed CDO position is evaluated independently taking into consideration available
comparable market levels, underlying collateral performance and pricing, deal structures and liquidity.
Valuation Hierarchy Classification:
•Level 2—when either comparable market transactions are observable, or credit correlation input is insignificant
•Level 3—when either comparable market transactions are unobservable, or the credit correlation input is significant
Equity Contracts with Financing Features
Valuation Techniques:
•Fair value of certain equity contracts, which are not classified as OTC derivatives because they do not meet the net investment criteria, is determined by discounting future interest cash flows, inclusive of the estimated value of the embedded optionality. The valuation uses the same derivative pricing models and valuation techniques as described under “OTC Derivative Contracts” herein.
Valuation Hierarchy Classification:
•Level 2—when the contract is valued using observable inputs or where the unobservable input is not deemed significant
•Level 3—when the contract is valued using an unobservable input that is deemed significant
Corporate Equities
Valuation Techniques:
•Exchange-traded equity securities are generally valued based on quoted prices from the exchange. To the extent these securities are actively traded, valuation adjustments are not applied.
•Unlisted equity securities are generally valued based on an assessment of each security, considering rounds of financing and third-party transactions, discounted cash flow analyses and market-based information, including comparable transactions, trading multiples and changes in market outlook, among other factors.
•Listed fund units are generally marked to the exchange-traded price if actively traded, or NAV if not. Unlisted fund units are generally marked to NAV.
Valuation Hierarchy Classification:
•Level 1—actively traded exchange-traded securities and fund units
•Level 2—if not actively traded, inputs are observable or if undergoing a recent M&A event or corporate action
•Level 3—if not actively traded, inputs are unobservable, or if undergoing an aged M&A event or corporate action
Derivative and Other Contracts
Listed Derivative Contracts
Valuation Techniques:
•Listed derivatives that are actively traded are valued based on quoted prices from the exchange.
•Listed derivatives that are not actively traded are valued using the same techniques as those applied to OTC derivatives as noted below.
Valuation Hierarchy Classification:
•Level 1—listed derivatives that are actively traded
•Level 2—when not actively traded
| | | | | | | | |
| 101 | December 2020 Form 10-K |
| | | | | |
| |
| Notes to Consolidated Financial Statements | |
OTC Derivative Contracts
Valuation Techniques:
•OTC derivative contracts include forward, swap and option contracts related to interest rates, foreign currencies, credit standing of reference entities, equity prices or commodity prices.
•Depending on the product and the terms of the transaction, the fair value of OTC derivative products can be modeled using a series of techniques, including closed-form analytic formulas, such as the Black-Scholes option-pricing model, simulation models or a combination thereof. Many pricing models do not entail material subjectivity as the methodologies employed do not necessitate significant judgment since model inputs may be observed from actively quoted markets, as is the case for generic interest rate swaps, many equity, commodity and foreign currency option contracts, and certain CDS. In the case of more established derivative products, the pricing models used by the Firm are widely accepted by the financial services industry.
•More complex OTC derivative products are typically less liquid and require more judgment in the implementation of the valuation technique since direct trading activity or quotes are unobservable. This includes certain types of interest rate derivatives with both volatility and correlation exposure, equity, commodity or foreign currency derivatives that are either longer-dated or include exposure to multiple underlyings, and credit derivatives, including CDS on certain mortgage- or asset-backed securities and basket CDS. Where required inputs are unobservable, relationships to observable data points, based on historical and/or implied observations, may be employed as a technique to estimate the model input values. For further information on the valuation techniques for OTC derivative products, see Note 2.
Valuation Hierarchy Classification:
•Level 2—when valued using observable inputs or where the unobservable input is not deemed significant
•Level 3—if an unobservable input is deemed significant
Investments
Valuation Techniques:
•Investments include direct investments in equity securities, as well as various investment management funds, which include investments made in connection with certain employee deferred compensation plans.
•Exchange-traded direct equity investments are generally valued based on quoted prices from the exchange.
•For direct investments, initially, the transaction price is generally considered by the Firm as the exit price and is its best estimate of fair value.
•After initial recognition, in determining the fair value of non-exchange-traded internally and externally managed funds, the Firm generally considers the NAV of the fund provided by the fund manager to be the best estimate of fair value. These investments are included in the Fund Interests table in the "Net Asset Value Measurements" section herein.
•For non-exchange-traded investments either held directly or held within internally managed funds, fair value after initial recognition is based on an assessment of each underlying investment, considering rounds of financing and third-party transactions, discounted cash flow analyses and market-based information, including comparable Firm transactions, trading multiples and changes in market outlook, among other factors.
Valuation Hierarchy Classification:
•Level 1—if actively traded
•Level 2—when not actively traded and valued based on rounds of financing or third-party transactions
•Level 3—when not actively traded and rounds of financing or third-party transactions are not available
Physical Commodities
Valuation Techniques:
•The Firm trades various physical commodities, including natural gas and precious metals.
•Fair value is determined using observable inputs, including broker quotations and published indices.
Valuation Hierarchy Classification:
•Level 2—valued using observable inputs
Investment Securities—AFS Securities
Valuation Techniques:
•AFS securities are composed of U.S. government and agency securities (e.g., U.S. Treasury securities, agency-issued debt, agency mortgage pass-through securities and CMOs), CMBS, ABS, state and municipal securities, and corporate bonds. For further information on the determination of fair value, refer to the corresponding asset/liability Valuation Technique described herein for the same instruments.
Valuation Hierarchy Classification:
•For further information on the determination of valuation hierarchy classification, see the corresponding Valuation Hierarchy Classification described herein.
Deposits
Valuation Techniques:
•The Firm issues FDIC-insured certificates of deposit that pay either fixed coupons or that have repayment terms linked to the performance of debt or equity securities, indices or currencies. The fair value of these certificates of deposit is determined using valuation models that incorporate observable inputs referencing identical or comparable securities, including prices to which the deposits are linked, interest rate yield curves, option volatility and currency rates, equity prices, and the impact of the Firm’s own credit spreads, adjusted for the impact of the FDIC insurance, which is based on vanilla deposit issuance rates.
Valuation Hierarchy Classification:
•Level 2—when valuation inputs are observable
•Level 3—in instances where an unobservable input is deemed significant
| | | | | | | | |
| December 2020 Form 10-K | 102 | |
| | | | | |
| |
| Notes to Consolidated Financial Statements | |
Securities Purchased under Agreements to Resell and Securities Sold under Agreements to Repurchase
Valuation Techniques:
•Fair value is computed using a standard cash flow discounting methodology.
•The inputs to the valuation include contractual cash flows and collateral funding spreads, which are the incremental spread over the OIS rate for a specific collateral rate (which refers to the rate applicable to a specific type of security pledged as collateral).
Valuation Hierarchy Classification:
•Level 2—when the valuation inputs are observable
•Level 3—in instances where an unobservable input is deemed significant
Other Secured Financings
Valuation Techniques:
•Other secured financings are composed of short-dated notes secured by Corporate equities, agreements to repurchase Physical commodities, the liabilities related to sales of Loans and lending commitments accounted for as financings, and contracts which are not classified as OTC derivatives because they fail net investment criteria. For further information on the determination of fair value, refer to the Valuation Techniques described herein for the corresponding instruments which are the collateral referenced by the other secured financing liability.
Valuation Hierarchy Classification:
•For further information on the determination of valuation hierarchy classification, see the Valuation Hierarchy Classification described herein for the corresponding instruments which are the collateral referenced by the other secured financing liability.
Borrowings
Valuation Techniques:
•The Firm carries certain borrowings at fair value that are primarily composed of: instruments whose payments and redemption values are linked to the performance of a specific index, a basket of stocks, a specific equity security, a commodity, a credit exposure or basket of credit exposures; and instruments with various interest-rate-related features, including step-ups, step-downs and zero coupons.
•Fair value is determined using valuation models for the derivative and debt portions of the instruments. These models incorporate observable inputs referencing identical or comparable securities, including prices to which the instruments are linked, interest rate yield curves, option volatility and currency rates, and commodity or equity prices.
•Independent, external and traded prices are considered, as well as the impact of the Firm’s own credit spreads, which are based on observed secondary bond market spreads.
Valuation Hierarchy Classification:
•Level 2—when valued using observable inputs, or where the unobservable input is not deemed significant
•Level 3—in instances where an unobservable input is deemed significant
Rollforward of Level 3 Assets and Liabilities Measured at Fair Value on a Recurring Basis
| | | | | | | | | | | |
| $ in millions | 2020 | 2019 | 2018 |
| U.S. Treasury and agency securities | | | |
| Beginning balance | $ | 22 | | $ | 54 | | $ | — | |
| Realized and unrealized gains (losses) | 1 | | 4 | | 1 | |
| Purchases | — | | 17 | | 53 | |
| Sales | (22) | | (54) | | — | |
| | | |
| Net transfers | 8 | | 1 | | — | |
| Ending balance | $ | 9 | | $ | 22 | | $ | 54 | |
| Unrealized gains (losses) | $ | — | | $ | 4 | | $ | 1 | |
| Other sovereign government obligations | | |
| Beginning balance | $ | 5 | | $ | 17 | | $ | 1 | |
| Realized and unrealized gains (losses) | — | | (3) | | — | |
| Purchases | 265 | | 7 | | 41 | |
| Sales | (2) | | (6) | | (26) | |
| | | |
| Net transfers | — | | (10) | | 1 | |
| Ending balance | $ | 268 | | $ | 5 | | $ | 17 | |
| Unrealized gains (losses) | $ | — | | $ | (3) | | $ | — | |
| State and municipal securities | | | |
| Beginning balance | $ | 1 | | $ | 148 | | $ | 8 | |
| | | |
| Purchases | — | | — | | 147 | |
| Sales | — | | (147) | | (9) | |
| | | |
| Net transfers | (1) | | — | | 2 | |
| Ending balance | $ | — | | $ | 1 | | $ | 148 | |
| Unrealized gains (losses) | $ | — | | $ | — | | $ | — | |
| MABS | | | |
| Beginning balance | $ | 438 | | $ | 354 | | $ | 423 | |
| Realized and unrealized gains (losses) | (66) | | (16) | | 82 | |
| Purchases | 175 | | 132 | | 177 | |
| Sales | (244) | | (175) | | (338) | |
| Settlements | — | | (44) | | (17) | |
| Net transfers | 19 | | 187 | | 27 | |
| Ending balance | $ | 322 | | $ | 438 | | $ | 354 | |
| Unrealized gains (losses) | $ | (49) | | $ | (57) | | $ | (9) | |
| Loans and lending commitments | | | |
| Beginning balance | $ | 5,073 | | $ | 6,870 | | $ | 5,945 | |
| Realized and unrealized gains (losses) | (65) | | 38 | | (100) | |
| Purchases and originations | 3,479 | | 2,337 | | 5,746 | |
| Sales | (957) | | (1,268) | | (2,529) | |
| Settlements | (2,196) | | (2,291) | | (2,281) | |
Net transfers1 | 425 | | (613) | | 89 | |
| Ending balance | $ | 5,759 | | $ | 5,073 | | $ | 6,870 | |
| Unrealized gains (losses) | $ | 58 | | $ | (9) | | $ | (137) | |
| Corporate and other debt | | | |
| Beginning balance | $ | 1,396 | | $ | 1,076 | | $ | 701 | |
| Realized and unrealized gains (losses) | 318 | | 418 | | 106 | |
| Purchases and originations | 2,623 | | 650 | | 734 | |
| Sales | (617) | | (729) | | (251) | |
| Settlements | (311) | | (7) | | (11) | |
| Net transfers | 26 | | (12) | | (203) | |
| Ending balance | $ | 3,435 | | $ | 1,396 | | $ | 1,076 | |
| Unrealized gains (losses) | $ | 311 | | $ | 361 | | $ | 70 | |
| | | |
| | | |
| | | | | | | | |
| 103 | December 2020 Form 10-K |
| | | | | |
| |
| Notes to Consolidated Financial Statements | |
| | | | | | | | | | | |
| $ in millions | 2020 | 2019 | 2018 |
| Corporate equities | | | |
| Beginning balance | $ | 97 | | $ | 95 | | $ | 166 | |
| Realized and unrealized gains (losses) | (55) | | (8) | | 29 | |
| Purchases | 36 | | 32 | | 13 | |
| Sales | (17) | | (271) | | (161) | |
| | | |
| Net transfers | 25 | | 249 | | 48 | |
| Ending balance | $ | 86 | | $ | 97 | | $ | 95 | |
| Unrealized gains (losses) | $ | (39) | | $ | 1 | | $ | 17 | |
| Investments | | | |
| Beginning balance | $ | 858 | | $ | 757 | | $ | 1,020 | |
| Realized and unrealized gains (losses) | 32 | | 78 | | (25) | |
| Purchases | 61 | | 40 | | 149 | |
| Sales | (106) | | (41) | | (212) | |
| | | |
| Net transfers | (17) | | 24 | | (175) | |
| Ending balance | $ | 828 | | $ | 858 | | $ | 757 | |
| Unrealized gains (losses) | $ | (45) | | $ | 67 | | $ | (27) | |
| Investment securities —AFS | | | |
| Beginning balance | $ | — | | $ | — | | $ | — | |
| Realized and unrealized gains (losses) | 5 | | — | | — | |
Purchases2 | 2,799 | | — | | — | |
| | | |
| | | |
| | | |
| Ending balance | $ | 2,804 | | $ | — | | $ | — | |
| Unrealized gains (losses) | $ | 5 | | $ | — | | $ | — | |
| Securities purchased under agreements to resell | |
| Beginning balance | $ | — | | $ | — | | $ | — | |
| | | |
| | | |
| | | |
| | | |
| Net transfers | 3 | | — | | — | |
| Ending balance | $ | 3 | | $ | — | | $ | — | |
| Unrealized gains (losses) | $ | — | | $ | — | | $ | — | |
| Net derivatives: Interest rate | | | |
| Beginning balance | $ | 777 | | $ | 618 | | $ | 1,218 | |
| Realized and unrealized gains (losses) | (150) | | 17 | | 111 | |
| Purchases | 174 | | 98 | | 63 | |
| Issuances | (44) | | (16) | | (19) | |
| Settlements | 40 | | 1 | | (172) | |
| Net transfers | (115) | | 59 | | (583) | |
| Ending balance | $ | 682 | | $ | 777 | | $ | 618 | |
| Unrealized gains (losses) | $ | (34) | | $ | 87 | | $ | 140 | |
| Net derivatives: Credit | | | |
| Beginning balance | $ | 124 | | $ | 40 | | $ | 41 | |
| Realized and unrealized gains (losses) | (91) | | (24) | | 33 | |
| Purchases | 98 | | 144 | | 13 | |
| Issuances | (112) | | (190) | | (95) | |
| Settlements | 94 | | 111 | | 56 | |
| Net transfers | (64) | | 43 | | (8) | |
| Ending balance | $ | 49 | | $ | 124 | | $ | 40 | |
| Unrealized gains (losses) | $ | (111) | | $ | (17) | | $ | 23 | |
| Net derivatives: Foreign exchange | | |
| Beginning balance | $ | (31) | | $ | 75 | | $ | (112) | |
| Realized and unrealized gains (losses) | 156 | | (295) | | 179 | |
| Purchases | 4 | | 2 | | 3 | |
| Issuances | — | | — | | (1) | |
| Settlements | (17) | | 7 | | 2 | |
| Net transfers | (51) | | 180 | | 4 | |
| Ending balance | $ | 61 | | $ | (31) | | $ | 75 | |
| Unrealized gains (losses) | $ | 94 | | $ | (187) | | $ | 118 | |
| | | | | | | | | | | |
| $ in millions | 2020 | 2019 | 2018 |
| Net derivatives: Equity | | | |
| Beginning balance | $ | (1,684) | | $ | (1,485) | | $ | 1,208 | |
| Realized and unrealized gains (losses) | 72 | | (260) | | 305 | |
| Purchases | 179 | | 155 | | 122 | |
| Issuances | (713) | | (643) | | (1,179) | |
| Settlements | (354) | | 242 | | 314 | |
Net transfers3 | 269 | | 307 | | (2,255) | |
| Ending balance | $ | (2,231) | | $ | (1,684) | | $ | (1,485) | |
| Unrealized gains (losses) | $ | (210) | | $ | (194) | | $ | 211 | |
| Net derivatives: Commodity and other | | |
| Beginning balance | $ | 1,612 | | $ | 2,052 | | $ | 1,446 | |
| Realized and unrealized gains (losses) | 251 | | 73 | | 500 | |
| Purchases | 89 | | 152 | | 34 | |
| Issuances | (57) | | (92) | | (18) | |
| Settlements | (183) | | (611) | | (81) | |
| Net transfers | (3) | | 38 | | 171 | |
| Ending balance | $ | 1,709 | | $ | 1,612 | | $ | 2,052 | |
| Unrealized gains (losses) | $ | (309) | | $ | (113) | | $ | 272 | |
| Deposits | | | |
| Beginning balance | $ | 179 | | $ | 27 | | $ | 47 | |
| Realized and unrealized losses (gains) | 15 | | 20 | | (1) | |
| | | |
| Issuances | 21 | | 101 | | 9 | |
| Settlements | (17) | | (15) | | (2) | |
| Net transfers | (72) | | 46 | | (26) | |
| Ending balance | $ | 126 | | $ | 179 | | $ | 27 | |
| Unrealized losses (gains) | $ | 15 | | $ | 20 | | $ | (1) | |
| Nonderivative trading liabilities | | | |
| Beginning balance | $ | 37 | | $ | 16 | | $ | 25 | |
| Realized and unrealized losses (gains) | (18) | | (21) | | (6) | |
| Purchases | (35) | | (65) | | (18) | |
| Sales | 27 | | 38 | | 9 | |
| Settlements | 3 | | — | | — | |
| Net transfers | 65 | | 69 | | 6 | |
| Ending balance | $ | 79 | | $ | 37 | | $ | 16 | |
| Unrealized losses (gains) | $ | (18) | | $ | (21) | | $ | (7) | |
| Securities sold under agreements to repurchase | | |
| Beginning balance | $ | — | | $ | — | | $ | 150 | |
| Realized and unrealized losses (gains) | (27) | | — | | — | |
| | | |
| | | |
| Issuances | 470 | | — | | — | |
| | | |
| Net transfers | 1 | | — | | (150) | |
| Ending balance | $ | 444 | | $ | — | | $ | — | |
| Unrealized losses (gains) | $ | (27) | | $ | — | | $ | — | |
| Other secured financings | | |
| Beginning balance | $ | 109 | | $ | 208 | | $ | 239 | |
| Realized and unrealized losses (gains) | 21 | | 5 | | (39) | |
| | | |
| Issuances | 208 | | — | | 8 | |
| Settlements | (217) | | (8) | | (17) | |
| Net transfers | 395 | | (96) | | 17 | |
| Ending balance | $ | 516 | | $ | 109 | | $ | 208 | |
| Unrealized losses (gains) | $ | 21 | | $ | 5 | | $ | (39) | |
| | | | | | | | |
| December 2020 Form 10-K | 104 | |
| | | | | |
| |
| Notes to Consolidated Financial Statements | |
| | | | | | | | | | | |
| $ in millions | 2020 | 2019 | 2018 |
| Borrowings | | | |
| Beginning balance | $ | 4,088 | | $ | 3,806 | | $ | 2,984 | |
| Realized and unrealized losses (gains) | 204 | | 728 | | (385) | |
| | | |
| Issuances | 980 | | 1,181 | | 1,554 | |
| Settlements | (461) | | (950) | | (274) | |
| Net transfers | (437) | | (677) | | (73) | |
| Ending balance | $ | 4,374 | | $ | 4,088 | | $ | 3,806 | |
| Unrealized losses (gains) | $ | 201 | | $ | 600 | | $ | (379) | |
| Portion of Unrealized losses (gains) recorded in OCI—Change in net DVA | 63 | | 182 | | (184) | |
1.Net transfers in 2020 reflect the largely offsetting impacts of transfers in of $857 million of equity margin loans in the first quarter of 2020 and transfers out of $707 million of equity margin loans in the second quarter of 2020. The loans were transferred into Level 3 in the first quarter as the significance of the margin loan rate input increased as a result of reduced liquidity, and transferred out of Level 3 in the second quarter as liquidity conditions improved, reducing the significance of the input.
2.Purchases of AFS investment securities in 2020 relate to securities acquired as part of the E*TRADE transaction. For additional information on the acquisition of E*TRADE, see Note 3.
3.During 2018, the Firm transferred from Level 3 to Level 2 $2.4 billion of Equity Derivatives due to a reduction in the significance of the unobservable inputs relating to volatility.
Level 3 instruments may be hedged with instruments classified in Level 1 and Level 2. The realized and unrealized gains or losses for assets and liabilities within the Level 3 category presented in the previous tables do not reflect the related realized and unrealized gains or losses on hedging instruments that have been classified by the Firm within the Level 1 and/or Level 2 categories.
The unrealized gains (losses) during the period for assets and liabilities within the Level 3 category may include changes in fair value during the period that were attributable to both observable and unobservable inputs. Total realized and unrealized gains (losses) are primarily included in Trading revenues in the income statements.
Additionally, in the previous tables, consolidations of VIEs are included in Purchases, and deconsolidations of VIEs are included in Settlements.
Significant Unobservable Inputs Used in Recurring and Nonrecurring Level 3 Fair Value Measurements
Valuation Techniques and Unobservable Inputs
| | | | | | | | |
| Balance / Range (Average1) |
$ in millions, except inputs | At December 31, 2020 | At December 31, 2019 |
| Assets at Fair Value on a Recurring Basis |
| | |
| | |
| | |
| Other sovereign government obligations | $ | 268 | | $ | 5 | |
| Comparable pricing: | | |
| Bond price | 106 points | N/M |
| | |
| | |
| | |
| MABS | $ | 322 | | $ | 438 | |
| Comparable pricing: | | |
| Bond price | 0 to 80 points (50 points) | 0 to 96 points (47 points) |
| | | | | | | | |
| Balance / Range (Average1) |
$ in millions, except inputs | At December 31, 2020 | At December 31, 2019 |
Loans and lending commitments | $ | 5,759 | | $ | 5,073 | |
| Margin loan model: | | |
| Discount rate | N/A | 1% to 9% (2%) |
| Volatility skew | N/A | 15% to 80% (28%) |
| Credit spread | N/A | 9 to 39 bps (19 bps) |
| Margin loan rate | 1% to 5% (3%) | N/A |
| Comparable pricing: | | |
| Loan price | 75 to 102 points (93 points) | 69 to 100 points (93 points) |
Corporate and other debt | $ | 3,435 | | $ | 1,396 | |
| Comparable pricing: | |
| Bond price | 10 to 133 points (101 points) | 11 to 108 points (84 points) |
| Discounted cash flow: | |
| Recovery rate | 40% to 62% (46% / 40%) | 35 | % |
| | |
| Option model: | | |
| Equity volatility | 18% to 21% (19%) | 21 | % |
| Corporate equities | $ | 86 | | $ | 97 | |
| Comparable pricing: | | |
| Equity price | 100% | 100 | % |
| Investments | $ | 828 | | $ | 858 | |
Discounted cash flow: | |
| WACC | 8% to 18% (15%) | 8% to 17% (15%) |
| Exit multiple | 7 to 17 times (12 times) | 7 to 16 times (11 times) |
| Market approach: | | |
| EBITDA multiple | 8 to 32 times (11 times) | 7 to 24 times (11 times) |
| Comparable pricing: | | |
| Equity price | 45% to 100% (99%) | 75% to 100% (99%) |
| Investment securities —AFS | $ | 2,804 | | $ | — | |
| Comparable pricing: | | |
| Bond price | 97 to 107 points (101 points) | N/A |
| Net derivative and other contracts: | |
| Interest rate | $ | 682 | | $ | 777 | |
| Option model: | | |
| IR volatility skew | 0% to 349% (62% / 59%) | 24% to 156% (63% / 59%) |
IR curve correlation | 54% to 99% (87% / 89%) | 47% to 90% (72% / 72%) |
| Bond volatility | 6% to 24% (13% / 13%) | 4% to 15% (13% / 14%) |
| Inflation volatility | 25% to 66% (45% / 43%) | 24% to 63% (44% / 41%) |
| IR curve | 1% | 1 | % |
| Credit | $ | 49 | | $ | 124 | |
| Credit default swap model: | |
Cash-synthetic
basis | 7 points | 6 points |
| Bond price | 0 to 85 points (47 points) | 0 to 104 points (45 points) |
| Credit spread | 20 to 435 bps (74 bps) | 9 to 469 bps (81 bps) |
| Funding spread | 65 to 118 bps (86 bps) | 47 to 117 bps (84 bps) |
| Correlation model: | | |
| Credit correlation | 27% to 44% (32%) | 29% to 62% (36%) |
Foreign exchange2 | $ | 61 | | $ | (31) | |
| Option model: | | |
| IR - FX correlation | 55% to 59% (56% 56%) | 32% to 56% (46% / 46%) |
| IR volatility skew | 0% to 349% (62% / 59%) | 24% to 156% (63% / 59%) |
| IR curve | 6% to 8% (7% / 8%) | 10% to 11% (10% / 10%) |
| Foreign exchange volatility skew | -22% to 28% (3% / 1%) | N/A |
| Contingency probability | 50% to 95% (83% / 93%) | 85% to 95% (94% / 95%) |
| | | | | | | | |
| 105 | December 2020 Form 10-K |
| | | | | |
| |
| Notes to Consolidated Financial Statements | |
| | | | | | | | |
| Balance / Range (Average1) |
$ in millions, except inputs | At December 31, 2020 | At December 31, 2019 |
Equity2 | $ | (2,231) | | $ | (1,684) | |
| Option model: | | |
| Equity volatility | 16% to 97% (43%) | 9% to 90% (36%) |
| Equity volatility skew | -3% to 0% (-1%) | -2% to 0% (-1%) |
| Equity correlation | 24% to 96% (74%) | 5% to 98% (70%) |
| FX correlation | -79% to 60% (-16%) | -79% to 60% (-37%) |
| IR correlation | -13% to 47% (21% / 20%) | -11% to 44% (18% / 16%) |
Commodity and other | $ | 1,709 | | $ | 1,612 | |
| Option model: | | |
Forward power
price | $-1 to $157 ($28) per MWh | $3 to $182 ($28) per MWh |
Commodity volatility | 8% to 183% (19%) | 7% to 183% (18%) |
Cross-commodity
correlation | 43% to 99% (92%) | 43% to 99% (93%) |
| Liabilities Measured at Fair Value on a Recurring Basis |
Deposits | $ | 126 | | $ | 179 | |
| Option model: | | |
| Equity volatility | 7% to 22% (8%) | 16% to 37% (20%) |
Nonderivative trading liabilities
—Corporate equities | $ | 63 | | $ | 36 | |
| Comparable pricing: | | |
| Equity price | 100% | N/M |
| Securities sold under agreements to repurchase | $ | 444 | | $ | — | |
| Discounted cash flow: | | |
| Funding spread | 107 to 127 bps (115 bps) | N/A |
Other secured
financings | $ | 516 | | $ | 109 | |
Discounted cash flow: | |
| Funding spread | 111 bps (111 bps) | 111 to 124 bps (117 bps) |
| Comparable pricing: | | |
| Loan price | 30 to 101 points (56 points) | N/A |
| | |
| | |
| | |
| Borrowings | $ | 4,374 | | $ | 4,088 | |
| Option model: | | |
| Equity volatility | 6% to 66% (23%) | 5% to 44% (21%) |
| Equity volatility skew | -2% to 0% (0%) | -2% to 0% (0%) |
| Equity correlation | 37% to 95% (78%) | 38% to 94% (78%) |
Equity - FX
correlation | -72% to 13% (-24%) | -75% to 26% (-25%) |
| | |
| IR FX Correlation | -28% to 6% (-6% / -6%) | -26% to 10% (-7% / -7%) |
| Nonrecurring Fair Value Measurement | |
| Loans | $ | 3,134 | | $ | 1,500 | |
| Corporate loan model: | |
| Credit spread | 36 to 636 bps (336 bps) | 69 to 446 bps (225 bps) |
| Warehouse model: | | |
| Credit spread | 200 to 413 bps (368 bps) | 287 to 318 bps (297 bps) |
| Comparable pricing: | | |
| Bond Price | 88 to 99 bps (94 bps) | N/M (N/M) |
Points—Percentage of par
IR—Interest rate
FX—Foreign exchange
1.A single amount is disclosed for range and average when there is no significant difference between the minimum, maximum and average. Amounts represent weighted averages except where simple averages and the median of the inputs are more relevant.
2.Includes derivative contracts with multiple risks (i.e., hybrid products).
The previous tables provide information on the valuation techniques, significant unobservable inputs, and the ranges and averages for each major category of assets and liabilities measured at fair value on a recurring and nonrecurring basis with a significant Level 3 balance. The level of aggregation and breadth of products cause the range of inputs to be wide
and not evenly distributed across the inventory of financial instruments. Further, the range of unobservable inputs may differ across firms in the financial services industry because of diversity in the types of products included in each firm’s inventory. Generally, there are no predictable relationships between multiple significant unobservable inputs attributable to a given valuation technique.
Other than as follows, during 2020, there were no significant revisions made to the descriptions of the Firm’s significant unobservable inputs. For margin loans, the margin loan rate is the annualized rate that reflects the possibility of losses as a result of movements in the price of the underlying margin loan collateral. The rate is calibrated from the previously disclosed discount rate, credit spread and/or volatility measures.
An increase (decrease) to the following significant unobservable inputs would generally result in a higher (lower) fair value.
•Comparable bond or loan price: A pricing input used when prices for the identical instrument are not available. Significant subjectivity may be involved when fair value is determined using pricing data available for comparable instruments. Valuation using comparable instruments can be done by calculating an implied yield (or spread over a liquid benchmark) from the price of a comparable bond or loan, then adjusting that yield (or spread) to derive a value for the bond or loan. The adjustment to yield (or spread) should account for relevant differences in the bonds or loans such as maturity or credit quality. Alternatively, a price-to-price basis can be assumed between the comparable instrument and the bond or loan being valued in order to establish the value of the bond or loan.
•Comparable equity price: A price derived from equity raises, share buybacks and external bid levels, etc. A discount or premium may be included in the fair value estimate.
•Contingency probability: Probability associated with the realization of an underlying event upon which the value of an asset is contingent.
•EBITDA multiple / Exit multiple: The ratio of Enterprise Value to EBITDA, where Enterprise Value is the aggregate value of equity and debt minus cash and cash equivalents. The EBITDA multiple reflects the value of the company in terms of its full-year EBITDA, whereas the exit multiple reflects the value of the company in terms of its full-year expected EBITDA at exit. Either multiple allows comparison between companies from an operational perspective as the effect of capital structure, taxation and depreciation/amortization is excluded.
•Recovery rate: Amount expressed as a percentage of par that is expected to be received when a credit event occurs.
| | | | | | | | |
| December 2020 Form 10-K | 106 | |
| | | | | |
| |
| Notes to Consolidated Financial Statements | |
An increase (decrease) to the following significant unobservable inputs would generally result in a lower (higher) fair value.
•Cash-synthetic basis: The measure of the price differential between cash financial instruments and their synthetic derivative-based equivalents. The range disclosed in the previous table signifies the number of points by which the synthetic bond equivalent price is higher than the quoted price of the underlying cash bonds.
•Funding spread: The cost of borrowing defined as the incremental spread over the OIS rate for a specific collateral rate (which refers to the rate applicable to a specific type of security pledged as collateral).
•Margin loan rate: The annualized rate that reflects the possibility of losses as a result of movements in the price of the underlying margin loan collateral. The rate is calibrated from the discount rate, credit spreads and/or volatility measures.
•WACC: WACC represents the theoretical rate of return required to debt and equity investors. The WACC is used in a discounted cash flow model that calculates the value of the equity. The model assumes that the cash flow assumptions, including projections, are fully reflected in the current equity value, while the debt to equity ratio is held constant.
An increase (decrease) to the following significant unobservable inputs would generally result in an impact to the fair value, but the magnitude and direction of the impact would depend on whether the Firm is long or short the exposure.
•Correlation: A pricing input where the payoff is driven by more than one underlying risk. Correlation is a measure of the relationship between the movement of two variables (i.e., how the change in one variable influences a change in the other variable).
•Credit spread: The credit spread reflects the additional net yield an investor can earn from a security with more credit risk relative to one with less credit risk. The credit spread of a particular security is often quoted in relation to the yield on a credit risk-free benchmark security or reference rate, typically either U.S. Treasury or LIBOR.
•Interest rate curve: The term structure of interest rates (relationship between interest rates and the time to maturity) and a market’s measure of future interest rates at the time of observation. An interest rate curve is used to set interest rate and foreign exchange derivative cash flows and is a pricing input used in the discounting of any OTC derivative cash flow.
•Volatility: The measure of variability in possible returns for an instrument given how much that instrument changes in value over time. Volatility is a pricing input for options
and, generally, the lower the volatility, the less risky the option. The level of volatility used in the valuation of a particular option depends on a number of factors, including the nature of the risk underlying that option, the tenor and the strike price of the option.
•Volatility skew: The measure of the difference in implied volatility for options with identical underliers and expiry dates but with different strikes.
Net Asset Value Measurements
Fund Interests
| | | | | | | | | | | | | | |
| | At December 31, 2020 | At December 31, 2019 |
| $ in millions | Carrying
Value | Commitment | Carrying
Value | Commitment |
| Private equity | $ | 2,367 | | $ | 644 | | $ | 2,078 | | $ | 450 | |
| Real estate | 1,403 | | 136 | | 1,349 | | 150 | |
Hedge1 | 59 | | — | | 94 | | 4 | |
| Total | $ | 3,829 | | $ | 780 | | $ | 3,521 | | $ | 604 | |
1.Investments in hedge funds may be subject to initial period lock-up or gate provisions, which restrict an investor from withdrawing from the fund during a certain initial period or restrict the redemption amount on any redemption date, respectively.
Amounts in the previous table represent the Firm’s carrying value of general and limited partnership interests in fund investments, as well as any related performance-based fees in the form of carried interest. The carrying amounts are measured based on the NAV of the fund taking into account the distribution terms applicable to the interest held. This same measurement applies whether the fund investments are accounted for under the equity method or fair value.
Private Equity. Funds that pursue multiple strategies, including leveraged buyouts, venture capital, infrastructure growth capital, distressed investments and mezzanine capital. In addition, the funds may be structured with a focus on specific geographic regions.
Real Estate. Funds that invest in real estate assets such as commercial office buildings, retail properties, multi-family residential properties, developments or hotels. In addition, the funds may be structured with a focus on specific geographic regions.
Investments in private equity and real estate funds generally are not redeemable due to the closed-end nature of these funds. Instead, distributions from each fund will be received as the underlying investments of the funds are disposed and monetized.
Hedge. Funds that pursue various investment strategies, including long-short equity, fixed income/credit, event-driven and multi-strategy.
See Note 15 for information regarding general partner guarantees, which include potential obligations to return performance fee distributions previously received. See Note 23 for information regarding carried interest at risk of reversal.
| | | | | | | | |
| 107 | December 2020 Form 10-K |
| | | | | |
| |
| Notes to Consolidated Financial Statements | |
Nonredeemable Funds by Contractual Maturity
| | | | | | | | |
| | Carrying Value at December 31, 2020 |
| $ in millions | Private Equity | Real Estate |
| Less than 5 years | $ | 1,480 | | $ | 416 | |
| 5-10 years | 736 | | 374 | |
| Over 10 years | 151 | | 613 | |
| Total | $ | 2,367 | | $ | 1,403 | |
Nonrecurring Fair Value Measurements
Carrying and Fair Values
| | | | | | | | | | | |
| | At December 31, 2020 |
| $ in millions | Level 2 | Level 31 | Total |
| Assets | | | |
| Loans | $ | 2,566 | | $ | 3,134 | | $ | 5,700 | |
| Other assets—Other investments | — | | 16 | | 16 | |
| | | |
| Other assets—ROU assets | 21 | | — | | 21 | |
| Total | $ | 2,587 | | $ | 3,150 | | $ | 5,737 | |
| Liabilities | | | |
Other liabilities and accrued expenses—Lending commitments | $ | 193 | | $ | 72 | | $ | 265 | |
| Total | $ | 193 | | $ | 72 | | $ | 265 | |
| | | | | | | | | | | |
| | At December 31, 2019 |
| $ in millions | Level 2 | Level 31 | Total |
| Assets | | | |
| Loans | $ | 1,543 | | $ | 1,500 | | $ | 3,043 | |
| Other assets—Other investments | — | | 113 | | 113 | |
| | | |
| Total | $ | 1,543 | | $ | 1,613 | | $ | 3,156 | |
| Liabilities | | | |
Other liabilities and accrued expenses—Lending commitments | $ | 132 | | $ | 69 | | $ | 201 | |
| Total | $ | 132 | | $ | 69 | | $ | 201 | |
1.For significant Level 3 balances, refer to “Significant Unobservable Inputs Used in Recurring and Nonrecurring Level 3 Fair Value Measurements” section herein for details of the significant unobservable inputs used for nonrecurring fair value measurement.
Gains (Losses) from Fair Value Remeasurements1
| | | | | | | | | | | |
| $ in millions | 2020 | 2019 | 2018 |
| Assets | | | |
Loans2 | $ | (354) | | $ | 18 | | $ | (68) | |
| Intangibles | (2) | | — | | — | |
Other assets—Other investments3 | (56) | | (56) | | (56) | |
Other assets—Premises, equipment and software4 | (45) | | (22) | | (46) | |
Other assets—ROU assets5 | (23) | | — | | — | |
| Total | $ | (480) | | $ | (60) | | $ | (170) | |
| Liabilities | | | |
Other liabilities and accrued expenses—Lending commitments2 | $ | (5) | | $ | 87 | | $ | (48) | |
| Total | $ | (5) | | $ | 87 | | $ | (48) | |
1.Gains and losses for Loans and Other assets—Other investments are classified in Other revenues. For other items, gains and losses are recorded in Other revenues if the item is held for sale; otherwise, they are recorded in Other expenses.
2.Nonrecurring changes in the fair value of loans and lending commitments were calculated as follows: for the held-for-investment category, based on the value of the underlying collateral; and for the held-for-sale category, based on recently executed transactions, market price quotations, valuation models that incorporate market observable inputs where possible, such as comparable loan or debt prices and CDS spread levels adjusted for any basis difference between cash and derivative instruments, or default recovery analysis where such transactions and quotations are unobservable.
3.Losses related to Other assets—Other investments were determined using techniques that included discounted cash flow models, methodologies that incorporate multiples of certain comparable companies and recently executed transactions.
4.Losses related to Other assets—Premises, equipment and software generally include impairments as well as write-offs related to the disposal of certain assets.
5.Losses related to Other assets—ROU assets include impairments related to the discontinued use of certain leased properties.
Financial Instruments Not Measured at Fair Value
| | | | | | | | | | | | | | | | | |
| | At December 31, 2020 |
| | Carrying
Value | Fair Value |
| $ in millions | Level 1 | Level 2 | Level 3 | Total |
| Financial assets | | | | |
| Cash and cash equivalents | $ | 105,654 | | $ | 105,654 | | $ | — | | $ | — | | $ | 105,654 | |
Investment securities—HTM | 71,771 | | 31,239 | | 42,281 | | 900 | | 74,420 | |
Securities purchased under agreements to resell | 116,219 | | — | | 114,046 | | 2,173 | | 116,219 | |
| Securities borrowed | 112,391 | | — | | 112,392 | | — | | 112,392 | |
Customer and other receivables1 | 92,907 | | — | | 89,832 | | 3,041 | | 92,873 | |
Loans2 | 150,597 | | — | | 16,635 | | 135,277 | | 151,912 | |
| Other assets | 485 | | — | | 485 | | — | | 485 | |
| Financial liabilities |
| Deposits | $ | 307,261 | | $ | — | | $ | 307,807 | | $ | — | | $ | 307,807 | |
| Securities sold under agreements to repurchase | 49,472 | | — | | 49,315 | | 195 | | 49,510 | |
| Securities loaned | 7,731 | | — | | 7,731 | | — | | 7,731 | |
Other secured financings | 4,162 | | — | | 4,162 | | — | | 4,162 | |
Customer and other payables1 | 224,951 | | — | | 224,951 | | — | | 224,951 | |
| Borrowings | 143,378 | | — | | 150,824 | | 5 | | 150,829 | |
| Commitment
Amount | | | | |
Lending commitments3 | $ | 125,498 | | $ | — | | $ | 709 | | $ | 395 | | $ | 1,104 | |
| | | | | | | | |
| December 2020 Form 10-K | 108 | |
| | | | | |
| |
| Notes to Consolidated Financial Statements | |
| | | | | | | | | | | | | | | | | |
| | At December 31, 2019 |
| | Carrying
Value | Fair Value |
| $ in millions | Level 1 | Level 2 | Level 3 | Total |
| Financial assets | | | | |
| Cash and cash equivalents | $ | 82,171 | | $ | 82,171 | | $ | — | | $ | — | | $ | 82,171 | |
Investment securities—HTM | 43,502 | | 30,661 | | 12,683 | | 789 | | 44,133 | |
Securities purchased under agreements to resell | 88,220 | | — | | 86,794 | | 1,442 | | 88,236 | |
| Securities borrowed | 106,549 | | — | | 106,551 | | — | | 106,551 | |
Customer and other receivables1 | 51,134 | | — | | 48,215 | | 2,872 | | 51,087 | |
Loans2 | 130,637 | | — | | 22,293 | | 108,059 | | 130,352 | |
| Other assets | 495 | | — | | 495 | | — | | 495 | |
| Financial liabilities |
| Deposits | $ | 188,257 | | $ | — | | $ | 188,639 | | $ | — | | $ | 188,639 | |
Securities sold under agreements to repurchase | 53,467 | | — | | 53,486 | | — | | 53,486 | |
| Securities loaned | 8,506 | | — | | 8,506 | | — | | 8,506 | |
Other secured financings | 6,889 | | — | | 6,800 | | 92 | | 6,892 | |
Customer and other payables1 | 195,035 | | — | | 195,035 | | — | | 195,035 | |
| Borrowings | 128,166 | | — | | 133,563 | | 10 | | 133,573 | |
| Commitment
Amount | | | | |
Lending commitments3 | $ | 119,004 | | $ | — | | $ | 748 | | $ | 338 | | $ | 1,086 | |
1.Accrued interest and dividend receivables and payables have been excluded. Carrying value approximates fair value for these receivables and payables.
2.Amounts include loans measured at fair value on a nonrecurring basis.
3.Represents Lending commitments accounted for as Held for Investment and Held for Sale. For a further discussion on lending commitments, see Note 15.
The previous tables exclude certain financial instruments such as equity method investments and all non-financial assets and liabilities such as the value of the long-term relationships with the Firm’s deposit customers.
6. Fair Value Option
The Firm has elected the fair value option for certain eligible instruments that are risk managed on a fair value basis to mitigate income statement volatility caused by measurement basis differences between the elected instruments and their associated risk management transactions or to eliminate complexities of applying certain accounting models.
Borrowings Measured at Fair Value on a Recurring Basis
| | | | | | | | |
| $ in millions | At December 31, 2020 | At December 31, 2019 |
| Business Unit Responsible for Risk Management |
| Equity | $ | 33,952 | | $ | 30,214 | |
| Interest rates | 31,222 | | 27,298 | |
| Commodities | 5,078 | | 4,501 | |
| Credit | 1,344 | | 1,246 | |
| Foreign exchange | 2,105 | | 1,202 | |
| Total | $ | 73,701 | | $ | 64,461 | |
Net Revenues from Borrowings under the Fair Value Option
| | | | | | | | | | | |
| $ in millions | 2020 | 2019 | 2018 |
| Trading revenues | $ | (5,135) | | $ | (6,932) | | $ | 2,679 | |
| Interest expense | 341 | | 375 | | 321 | |
Net revenues1 | $ | (5,476) | | $ | (7,307) | | $ | 2,358 | |
1.Amounts do not reflect any gains or losses from related economic hedges.
Gains (losses) from changes in fair value are recorded in Trading revenues and are mainly attributable to movements in the reference price or index, interest rates or foreign exchange rates.
Gains (Losses) Due to Changes in Instrument-Specific Credit Risk
| | | | | | | | |
| $ in millions | Trading
Revenues | OCI |
| 2020 | | |
Loans and other debt1 | $ | (116) | | $ | — | |
| Lending commitments | (3) | | — | |
| Deposits | — | | (19) | |
| Borrowings | (26) | | (1,340) | |
| 2019 | | |
Loans and other debt1 | $ | 223 | | $ | — | |
| Lending commitments | (2) | | — | |
| Deposits | — | | (30) | |
| Borrowings | (11) | | (2,140) | |
| 2018 | | |
Loans and other debt1 | $ | 165 | | $ | — | |
| Lending commitments | (3) | | — | |
| Deposits | — | | 9 | |
| Borrowings | (24) | | 1,962 | |
| Other | (32) | | 32 | |
| | | | | | | | |
| $ in millions | At December 31, 2020 | At December 31, 2019 |
| Cumulative pre-tax DVA gain (loss) recognized in AOCI | $ | (3,357) | | $ | (1,998) | |
1.Loans and other debt instrument-specific credit gains (losses) were determined by excluding the non-credit components of gains and losses.
Difference between Contractual Principal and Fair Value1
| | | | | | | | |
| $ in millions | At December 31, 2020 | At December 31, 2019 |
Loans and other debt2 | $ | 14,042 | | $ | 13,037 | |
Nonaccrual loans2 | 11,551 | | 10,849 | |
Borrowings3 | (3,773) | | (1,665) | |
1.Amounts indicate contractual principal greater than or (less than) fair value.
2.The majority of the difference between principal and fair value amounts for loans and other debt relates to distressed debt positions purchased at amounts well below par.
3.Excludes borrowings where the repayment of the initial principal amount fluctuates based on changes in a reference price or index.
The previous tables exclude non-recourse debt from consolidated VIEs, liabilities related to transfers of financial assets treated as collateralized financings, pledged commodities and other liabilities that have specified assets attributable to them.
Fair Value Loans on Nonaccrual Status
| | | | | | | | |
| $ in millions | At December 31, 2020 | At December 31, 2019 |
| Nonaccrual loans | $ | 1,407 | | $ | 1,100 | |
Nonaccrual loans 90 or more days past due | $ | 239 | | $ | 330 | |
| | | | | | | | |
| 109 | December 2020 Form 10-K |
| | | | | |
| |
| Notes to Consolidated Financial Statements | |
7. Derivative Instruments and Hedging Activities
The Firm trades and makes markets globally in listed futures, OTC swaps, forwards, options and other derivatives referencing, among other things, interest rates, equities, currencies, investment grade and non-investment grade corporate credits, loans, bonds, U.S. and other sovereign securities, emerging market bonds and loans, credit indices, ABS indices, property indices, mortgage-related and other ABS, and real estate loan products. The Firm uses these instruments for market-making, foreign currency exposure management, and asset/liability management.
The Firm manages its market-making positions by employing a variety of risk mitigation strategies. These strategies include diversification of risk exposures and hedging. Hedging activities consist of the purchase or sale of positions in related securities and financial instruments, including a variety of derivative products (e.g., futures, forwards, swaps and options). The Firm manages the market risk associated with its market-making activities on a Firmwide basis, on a worldwide trading division level and on an individual product basis.
Fair Values of Derivative Contracts
At December 31, 2020
| | | | | | | | | | | | | | |
| | Assets |
| $ in millions | Bilateral
OTC | Cleared
OTC | Exchange-
Traded | Total |
| Designated as accounting hedges |
| Interest rate | $ | 946 | | $ | 2 | | $ | — | | $ | 948 | |
| Foreign exchange | 5 | | 2 | | — | | 7 | |
| Total | 951 | | 4 | | — | | 955 | |
| Not designated as accounting hedges |
| Interest rate | 221,895 | | 10,343 | | 300 | | 232,538 | |
| Credit | 5,343 | | 2,198 | | — | | 7,541 | |
| Foreign exchange | 92,334 | | 1,639 | | 79 | | 94,052 | |
| Equity | 34,278 | | — | | 34,166 | | 68,444 | |
| Commodity and other | 11,095 | | — | | 3,554 | | 14,649 | |
| Total | 364,945 | | 14,180 | | 38,099 | | 417,224 | |
| Total gross derivatives | $ | 365,896 | | $ | 14,184 | | $ | 38,099 | | $ | 418,179 | |
| Amounts offset | | | | |
| Counterparty netting | (276,682) | | (11,601) | | (35,260) | | (323,543) | |
| Cash collateral netting | (54,921) | | (1,865) | | — | | (56,786) | |
| Total in Trading assets | $ | 34,293 | | $ | 718 | | $ | 2,839 | | $ | 37,850 | |
Amounts not offset1 | | | | |
Financial instruments collateral | (13,319) | | — | | — | | (13,319) | |
| Other cash collateral | (391) | | — | | — | | (391) | |
| Net amounts | $ | 20,583 | | $ | 718 | | $ | 2,839 | | $ | 24,140 | |
Net amounts for which master netting or collateral agreements are not in place or may not be legally enforceable | $ | 3,743 | |
| | | | | | | | | | | | | | |
| | Liabilities |
| $ in millions | Bilateral
OTC | Cleared
OTC | Exchange-
Traded | Total |
| Designated as accounting hedges |
| Interest rate | $ | — | | $ | 19 | | $ | — | | $ | 19 | |
| Foreign exchange | 291 | | 99 | | — | | 390 | |
| Total | 291 | | 118 | | — | | 409 | |
| Not designated as accounting hedges |
| Interest rate | 210,015 | | 7,965 | | 639 | | 218,619 | |
| Credit | 5,293 | | 2,859 | | — | | 8,152 | |
| Foreign exchange | 92,975 | | 1,500 | | 43 | | 94,518 | |
| Equity | 49,943 | | — | | 36,585 | | 86,528 | |
| Commodity and other | 8,831 | | — | | 3,359 | | 12,190 | |
| Total | 367,057 | | 12,324 | | 40,626 | | 420,007 | |
| Total gross derivatives | $ | 367,348 | | $ | 12,442 | | $ | 40,626 | | $ | 420,416 | |
| Amounts offset | | | | |
| Counterparty netting | (276,682) | | (11,601) | | (35,260) | | (323,543) | |
| Cash collateral netting | (51,112) | | (823) | | — | | (51,935) | |
| Total in Trading liabilities | $ | 39,554 | | $ | 18 | | $ | 5,366 | | $ | 44,938 | |
Amounts not offset1 | | | | |
Financial instruments collateral | (10,598) | | — | | (1,520) | | (12,118) | |
| Other cash collateral | (62) | | (3) | | — | | (65) | |
| Net amounts | $ | 28,894 | | $ | 15 | | $ | 3,846 | | $ | 32,755 | |
Net amounts for which master netting or collateral agreements are not in place or may not be legally enforceable | $ | 6,746 | |
| | | | | | | | |
| December 2020 Form 10-K | 110 | |
| | | | | |
| |
| Notes to Consolidated Financial Statements | |
At December 31, 2019
| | | | | | | | | | | | | | |
| | Assets |
| $ in millions | Bilateral
OTC | Cleared
OTC | Exchange-
Traded | Total |
| Designated as accounting hedges |
| Interest rate | $ | 673 | | $ | — | | $ | — | | $ | 673 | |
| Foreign exchange | 41 | | 1 | | — | | 42 | |
| Total | 714 | | 1 | | — | | 715 | |
| Not designated as accounting hedges |
| Interest rate | 179,450 | | 4,839 | | 519 | | 184,808 | |
| Credit | 4,895 | | 2,417 | | — | | 7,312 | |
| Foreign exchange | 62,957 | | 1,399 | | 22 | | 64,378 | |
| Equity | 27,621 | | — | | 23,447 | | 51,068 | |
| Commodity and other | 9,306 | | — | | 1,952 | | 11,258 | |
| Total | 284,229 | | 8,655 | | 25,940 | | 318,824 | |
| Total gross derivatives | $ | 284,943 | | $ | 8,656 | | $ | 25,940 | | $ | 319,539 | |
| Amounts offset | | | | |
| Counterparty netting | (213,710) | | (7,294) | | (24,037) | | (245,041) | |
| Cash collateral netting | (41,222) | | (1,275) | | — | | (42,497) | |
| Total in Trading assets | $ | 30,011 | | $ | 87 | | $ | 1,903 | | $ | 32,001 | |
Amounts not offset1 | | | | |
Financial instruments collateral | (15,596) | | — | | — | | (15,596) | |
| Other cash collateral | (46) | | — | | — | | (46) | |
| Net amounts | $ | 14,369 | | $ | 87 | | $ | 1,903 | | $ | 16,359 | |
Net amounts for which master netting or collateral agreements are not in place or may not be legally enforceable | $ | 1,900 | |
| | | | | | | | | | | | | | |
| | Liabilities |
| $ in millions | Bilateral
OTC | Cleared
OTC | Exchange-
Traded | Total |
| Designated as accounting hedges |
| Interest rate | $ | 1 | | $ | — | | $ | — | | $ | 1 | |
| Foreign exchange | 121 | | 38 | | — | | 159 | |
| Total | 122 | | 38 | | — | | 160 | |
| Not designated as accounting hedges |
| Interest rate | 168,597 | | 3,597 | | 436 | | 172,630 | |
| Credit | 4,798 | | 3,123 | | — | | 7,921 | |
| Foreign exchange | 65,965 | | 1,492 | | 39 | | 67,496 | |
| Equity | 30,135 | | — | | 22,733 | | 52,868 | |
| Commodity and other | 7,713 | | — | | 1,911 | | 9,624 | |
| Total | 277,208 | | 8,212 | | 25,119 | | 310,539 | |
| Total gross derivatives | $ | 277,330 | | $ | 8,250 | | $ | 25,119 | | $ | 310,699 | |
| Amounts offset | | | | |
| Counterparty netting | (213,710) | | (7,294) | | (24,037) | | (245,041) | |
| Cash collateral netting | (36,392) | | (832) | | — | | (37,224) | |
| Total in Trading liabilities | $ | 27,228 | | $ | 124 | | $ | 1,082 | | $ | 28,434 | |
Amounts not offset1 | | | | |
Financial instruments collateral | (7,747) | | — | | (287) | | (8,034) | |
| Other cash collateral | (14) | | — | | — | | (14) | |
| Net amounts | $ | 19,467 | | $ | 124 | | $ | 795 | | $ | 20,386 | |
Net amounts for which master netting or collateral agreements are not in place or may not be legally enforceable | $ | 3,680 | |
1.Amounts relate to master netting agreements and collateral agreements that have been determined by the Firm to be legally enforceable in the event of default but where certain other criteria are not met in accordance with applicable offsetting accounting guidance.
See Note 5 for information related to the unsettled fair value of futures contracts not designated as accounting hedges, which are excluded from the previous tables.
Notionals of Derivative Contracts
At December 31, 2020
| | | | | | | | | | | | | | |
| | Assets |
| $ in billions | Bilateral
OTC | Cleared
OTC | Exchange-
Traded | Total |
| Designated as accounting hedges |
| Interest rate | $ | 6 | | $ | 123 | | $ | — | | $ | 129 | |
| Foreign exchange | 2 | | — | | — | | 2 | |
| Total | 8 | | 123 | | — | | 131 | |
| Not designated as accounting hedges |
| Interest rate | 3,847 | | 6,946 | | 409 | | 11,202 | |
| Credit | 140 | | 88 | | — | | 228 | |
| Foreign exchange | 3,046 | | 103 | | 10 | | 3,159 | |
| Equity | 444 | | — | | 367 | | 811 | |
| Commodity and other | 107 | | — | | 68 | | 175 | |
| Total | 7,584 | | 7,137 | | 854 | | 15,575 | |
| Total gross derivatives | $ | 7,592 | | $ | 7,260 | | $ | 854 | | $ | 15,706 | |
| | | | | | | | | | | | | | |
| | Liabilities |
| $ in billions | Bilateral
OTC | Cleared
OTC | Exchange-
Traded | Total |
| Designated as accounting hedges |
| Interest rate | $ | — | | $ | 80 | | $ | — | | $ | 80 | |
| Foreign exchange | 11 | | 3 | | — | | 14 | |
| Total | 11 | | 83 | | — | | 94 | |
| Not designated as accounting hedges |
| Interest rate | 4,000 | | 6,915 | | 511 | | 11,426 | |
| Credit | 143 | | 98 | | — | | 241 | |
| Foreign exchange | 3,180 | | 102 | | 11 | | 3,293 | |
| Equity | 474 | | — | | 591 | | 1,065 | |
| Commodity and other | 93 | | — | | 68 | | 161 | |
| Total | 7,890 | | 7,115 | | 1,181 | | 16,186 | |
| Total gross derivatives | $ | 7,901 | | $ | 7,198 | | $ | 1,181 | | $ | 16,280 | |
| | | | | | | | |
| 111 | December 2020 Form 10-K |
| | | | | |
| |
| Notes to Consolidated Financial Statements | |
At December 31, 2019
| | | | | | | | | | | | | | |
| | Assets |
| $ in billions | Bilateral
OTC | Cleared
OTC | Exchange-
Traded | Total |
| Designated as accounting hedges |
| Interest rate | $ | 14 | | $ | 94 | | $ | — | | $ | 108 | |
| Foreign exchange | 2 | | — | | — | | 2 | |
| Total | 16 | | 94 | | — | | 110 | |
| Not designated as accounting hedges |
| Interest rate | 4,230 | | 7,398 | | 732 | | 12,360 | |
| Credit | 136 | | 79 | | — | | 215 | |
| Foreign exchange | 2,667 | | 91 | | 10 | | 2,768 | |
| Equity | 429 | | — | | 419 | | 848 | |
| Commodity and other | 99 | | — | | 61 | | 160 | |
| Total | 7,561 | | 7,568 | | 1,222 | | 16,351 | |
| Total gross derivatives | $ | 7,577 | | $ | 7,662 | | $ | 1,222 | | $ | 16,461 | |
| | | | | | | | | | | | | | |
| | Liabilities |
| $ in billions | Bilateral
OTC | Cleared
OTC | Exchange-
Traded | Total |
| Designated as accounting hedges |
| Interest rate | $ | — | | $ | 71 | | $ | — | | $ | 71 | |
| Foreign exchange | 9 | | 2 | | — | | 11 | |
| Total | 9 | | 73 | | — | | 82 | |
| Not designated as accounting hedges |
| Interest rate | 4,185 | | 6,866 | | 666 | | 11,717 | |
| Credit | 153 | | 84 | | — | | 237 | |
| Foreign exchange | 2,841 | | 91 | | 14 | | 2,946 | |
| Equity | 455 | | — | | 515 | | 970 | |
| Commodity and other | 85 | | — | | 61 | | 146 | |
| Total | 7,719 | | 7,041 | | 1,256 | | 16,016 | |
| Total gross derivatives | $ | 7,728 | | $ | 7,114 | | $ | 1,256 | | $ | 16,098 | |
The Firm believes that the notional amounts of derivative contracts generally overstate its exposure. In most circumstances, notional amounts are used only as a reference point from which to calculate amounts owed between the parties to the contract. Furthermore, notional amounts do not reflect the benefit of legally enforceable netting arrangements or risk mitigating transactions.
Gains (Losses) on Accounting Hedges
| | | | | | | | | | | |
| $ in millions | 2020 | 2019 | 2018 |
| Fair value hedges—Recognized in Interest income |
| Interest rate contracts | $ | 75 | | $ | (10) | | $ | (4) | |
| Investment Securities—AFS | (33) | | 10 | | 4 | |
| Fair value hedges—Recognized in Interest expense |
| Interest rate contracts | $ | 4,678 | | $ | 4,212 | | $ | (1,529) | |
Deposits1 | (100) | | 7 | | — | |
| Borrowings | (4,692) | | (4,288) | | 1,511 | |
| Net investment hedges—Foreign exchange contracts |
| Recognized in OCI | $ | (366) | | $ | 14 | | $ | 295 | |
Forward points excluded from hedge effectiveness testing—Recognized in Interest income | 16 | | 136 | | 68 | |
1.The Firm began designating interest rate swaps as fair value hedges of certain Deposits in the fourth quarter of 2019.
Fair Value Hedges—Hedged Items
| | | | | | | | |
| $ in millions | At December 31, 2020 | At December 31, 2019 |
| Investment securities—AFS | | |
| Amortized cost basis currently or previously hedged | $ | 16,288 | | $ | 917 | |
Basis adjustments included in amortized cost1 | $ | (39) | | $ | 14 | |
| Deposits | | |
| Carrying amount currently or previously hedged | $ | 15,059 | | $ | 5,435 | |
Basis adjustments included in carrying amount1 | $ | 93 | | $ | (7) | |
| Borrowings | | |
| Carrying amount currently or previously hedged | $ | 114,349 | | $ | 102,456 | |
| Basis adjustments included in carrying amount—Outstanding hedges | $ | 6,575 | | $ | 2,593 | |
Basis adjustments included in carrying amount—Terminated hedges | $ | (756) | | $ | — | |
1.Hedge accounting basis adjustments are primarily related to outstanding hedges.
Derivatives with Credit Risk-Related Contingencies
Net Derivative Liabilities and Collateral Posted
| | | | | | | | |
| $ in millions |
At December 31, 2020 | At December 31, 2019 |
Net derivative liabilities with credit risk- related contingent features | $ | 30,421 | | $ | 21,620 | |
| Collateral posted | 23,842 | | 17,392 | |
The previous table presents the aggregate fair value of certain derivative contracts that contain credit risk-related contingent features that are in a net liability position for which the Firm has posted collateral in the normal course of business.
Incremental Collateral and Termination Payments upon Potential Future Ratings Downgrade
| | | | | |
| $ in millions | At December 31, 2020 |
| One-notch downgrade | $ | 316 | |
| Two-notch downgrade | 134 | |
Bilateral downgrade agreements included in the amounts above1 | $ | 352 | |
1.Amount represents arrangements between the Firm and other parties where upon the downgrade of one party, the downgraded party must deliver collateral to the other party. These bilateral downgrade arrangements are used by the Firm to manage the risk of counterparty downgrades.
The additional collateral or termination payments that may be called in the event of a future credit rating downgrade vary by contract and can be based on ratings by either or both of Moody’s Investors Service, Inc. and S&P Global Ratings. The previous table shows the future potential collateral amounts and termination payments that could be called or required by counterparties or exchange and clearing organizations in the event of one-notch or two-notch downgrade scenarios based on the relevant contractual downgrade triggers.
| | | | | | | | |
| December 2020 Form 10-K | 112 | |
| | | | | |
| |
| Notes to Consolidated Financial Statements | |
Maximum Potential Payout/Notional of Credit Protection Sold1
| | | | | | | | | | | | | | | | | |
| | Years to Maturity at December 31, 2020 |
| $ in billions | < 1 | 1-3 | 3-5 | Over 5 | Total |
| Single-name CDS |
| Investment grade | $ | 9 | | $ | 19 | | $ | 32 | | $ | 9 | | $ | 69 | |
| Non-investment grade | 7 | | 10 | | 17 | | 2 | | 36 | |
| Total | $ | 16 | | $ | 29 | | $ | 49 | | $ | 11 | | $ | 105 | |
| Index and basket CDS |
| Investment grade | $ | 2 | | $ | 5 | | $ | 39 | | $ | 14 | | $ | 60 | |
| Non-investment grade | 6 | | 9 | | 29 | | 14 | | 58 | |
| Total | $ | 8 | | $ | 14 | | $ | 68 | | $ | 28 | | $ | 118 | |
| Total CDS sold | $ | 24 | | $ | 43 | | $ | 117 | | $ | 39 | | $ | 223 | |
| Other credit contracts | — | | — | | — | | — | | — | |
| Total credit protection sold | $ | 24 | | $ | 43 | | $ | 117 | | $ | 39 | | $ | 223 | |
| CDS protection sold with identical protection purchased | $ | 196 | |
| | | | | | | | | | | | | | | | | |
| | Years to Maturity at December 31, 2019 |
| $ in billions | < 1 | 1-3 | 3-5 | Over 5 | Total |
| Single-name CDS |
| Investment grade | $ | 16 | | $ | 17 | | $ | 33 | | $ | 9 | | $ | 75 | |
| Non-investment grade | 9 | | 9 | | 16 | | 1 | | 35 | |
| Total | $ | 25 | | $ | 26 | | $ | 49 | | $ | 10 | | $ | 110 | |
| Index and basket CDS |
| Investment grade | $ | 4 | | $ | 7 | | $ | 46 | | $ | 11 | | $ | 68 | |
| Non-investment grade | 7 | | 4 | | 17 | | 10 | | 38 | |
| Total | $ | 11 | | $ | 11 | | $ | 63 | | $ | 21 | | $ | 106 | |
| Total CDS sold | $ | 36 | | $ | 37 | | $ | 112 | | $ | 31 | | $ | 216 | |
| Other credit contracts | — | | — | | — | | — | | — | |
| Total credit protection sold | $ | 36 | | $ | 37 | | $ | 112 | | $ | 31 | | $ | 216 | |
| CDS protection sold with identical protection purchased | $ | 187 | |
Fair Value Asset (Liability) of Credit Protection Sold1
| | | | | | | | |
| $ in millions | At December 31, 2020 | At December 31, 2019 |
| Single-name CDS | | |
| Investment grade | $ | 1,230 | | $ | 1,057 | |
| Non-investment grade | (22) | | (540) | |
| Total | $ | 1,208 | | $ | 517 | |
| Index and basket CDS | | |
| Investment grade | $ | 843 | | $ | 1,052 | |
| Non-investment grade | (824) | | 134 | |
| Total | $ | 19 | | $ | 1,186 | |
| Total CDS sold | $ | 1,227 | | $ | 1,703 | |
| Other credit contracts | (4) | | (17) | |
| Total credit protection sold | $ | 1,223 | | $ | 1,686 | |
1.Investment grade/non-investment grade determination is based on the internal credit rating of the reference obligation. Internal credit ratings serve as the Credit Risk Management Department’s assessment of credit risk and the basis for a comprehensive credit limits framework used to control credit risk. The Firm uses quantitative models and judgment to estimate the various risk parameters related to each obligor.
Protection Purchased with CDS
| | | | | | | | |
| Notional |
| $ in billions | At
December 31,
2020 | At
December 31,
2019 |
| Single name | $ | 116 | | $ | 118 | |
| Index and basket | 116 | | 103 | |
| Tranched index and basket | 14 | | 15 | |
| Total | $ | 246 | | $ | 236 | |
| | | | | | | | |
| Fair Value Asset (Liability) |
| $ in millions | At
December 31,
2020 | At
December 31,
2019 |
| Single name | $ | (1,452) | | $ | (723) | |
| Index and basket | (57) | | (1,139) | |
| Tranched index and basket | (329) | | (450) | |
| Total | $ | (1,838) | | $ | (2,312) | |
The Firm enters into credit derivatives, principally CDS, under which it receives or provides protection against the risk of default on a set of debt obligations issued by a specified reference entity or entities. A majority of the Firm’s counterparties for these derivatives are banks, broker-dealers, and insurance and other financial institutions.
The fair value amounts as shown in the previous tables are prior to cash collateral or counterparty netting.
The purchase of credit protection does not represent the sole manner in which the Firm risk manages its exposure to credit derivatives. The Firm manages its exposure to these derivative contracts through a variety of risk mitigation strategies, which include managing the credit and correlation risk across single-name, non-tranched indices and baskets, tranched indices and baskets, and cash positions. Aggregate market risk limits have been established for credit derivatives, and market risk measures are routinely monitored against these limits. The Firm may also recover amounts on the underlying reference obligation delivered to the Firm under CDS where credit protection was sold.
Single-Name CDS. A CDS protects the buyer against the loss of principal on a bond or loan in case of a default by the issuer. The protection buyer pays a periodic premium (generally quarterly) over the life of the contract and is protected for the period. The Firm, in turn, performs under a CDS if a credit event as defined under the contract occurs. Typical credit events include bankruptcy, dissolution or insolvency of the referenced entity, failure to pay and restructuring of the obligations of the referenced entity.
Index and Basket CDS. Index and basket CDS are products where credit protection is provided on a portfolio of single-name CDS. Generally, in the event of a default on one of the underlying names, the Firm pays a pro rata portion of the total notional amount of the CDS.
The Firm also enters into tranched index and basket CDS where credit protection is provided on a particular portion of the portfolio loss distribution. The most junior tranches cover
| | | | | | | | |
| 113 | December 2020 Form 10-K |
| | | | | |
| |
| Notes to Consolidated Financial Statements | |
initial defaults, and once losses exceed the notional of the tranche, they are passed on to the next most senior tranche in the capital structure.
Other Credit Contracts. The Firm has invested in CLNs and CDOs, which are hybrid instruments containing embedded derivatives, in which credit protection has been sold to the issuer of the note. If there is a credit event of a reference entity underlying the instrument, the principal balance of the note may not be repaid in full to the Firm.
8. Investment Securities
AFS and HTM Securities
| | | | | | | | | | | | | | |
| At December 31, 2020 |
| $ in millions | Amortized Cost1 | Gross
Unrealized
Gains | Gross
Unrealized
Losses | Fair
Value |
| AFS securities | | | | |
| U.S. government and agency securities: | | |
| U.S. Treasury securities | $ | 45,345 | | $ | 1,010 | | $ | — | | $ | 46,355 | |
U.S. agency securities2 | 37,389 | | 762 | | 25 | | 38,126 | |
Total U.S. government and agency securities | 82,734 | | 1,772 | | 25 | | 84,481 | |
| Corporate and other debt: | | | | |
| Agency CMBS | 19,982 | | 465 | | 9 | | 20,438 | |
| | | | |
| Corporate bonds | 1,694 | | 42 | | — | | 1,736 | |
State and municipal securities | 1,461 | | 103 | | 1 | | 1,563 | |
FFELP student loan ABS3 | 1,735 | | 7 | | 26 | | 1,716 | |
| Other ABS | 449 | | — | | — | | 449 | |
Total corporate and other debt | 25,321 | | 617 | | 36 | | 25,902 | |
| Total AFS securities | 108,055 | | 2,389 | | 61 | | 110,383 | |
| HTM securities | | | | |
| U.S. government and agency securities: | | |
| U.S. Treasury securities | 29,346 | | 1,893 | | — | | 31,239 | |
U.S. agency securities2 | 38,951 | | 704 | | 8 | | 39,647 | |
Total U.S. government and agency securities | 68,297 | | 2,597 | | 8 | | 70,886 | |
| Corporate and other debt: | | | | |
| Agency CMBS | 2,632 | | 4 | | 2 | | 2,634 | |
| Non-agency CMBS | 842 | | 58 | | — | | 900 | |
| Total Corporate and other debt | 3,474 | | 62 | | 2 | | 3,534 | |
| Total HTM securities | 71,771 | | 2,659 | | 10 | | 74,420 | |
Total investment securities | $ | 179,826 | | $ | 5,048 | | $ | 71 | | $ | 184,803 | |
| | | | | | | | | | | | | | |
| At December 31, 2019 |
| $ in millions | Amortized
Cost | Gross
Unrealized
Gains | Gross
Unrealized
Losses | Fair
Value |
| AFS securities | | | | |
| U.S. government and agency securities: | | | |
| U.S. Treasury securities | $ | 32,465 | | $ | 224 | | $ | 111 | | $ | 32,578 | |
U.S. agency securities2 | 20,725 | | 249 | | 100 | | 20,874 | |
Total U.S. government and agency securities | 53,190 | | 473 | | 211 | | 53,452 | |
| Corporate and other debt: | | | | |
| Agency CMBS | 4,810 | | 55 | | 57 | | 4,808 | |
| | | | |
| Corporate bonds | 1,891 | | 17 | | 1 | | 1,907 | |
State and municipal securities | 481 | | 22 | | — | | 503 | |
FFELP student loan ABS3 | 1,580 | | 1 | | 28 | | 1,553 | |
Total corporate and other debt | 8,762 | | 95 | | 86 | | 8,771 | |
| Total AFS securities | 61,952 | | 568 | | 297 | | 62,223 | |
| HTM securities | | | | |
| U.S. government and agency securities: | | | |
| U.S. Treasury securities | 30,145 | | 568 | | 52 | | 30,661 | |
U.S. agency securities2 | 12,589 | | 151 | | 57 | | 12,683 | |
Total U.S. government and agency securities | 42,734 | | 719 | | 109 | | 43,344 | |
| Corporate and other debt: | | | | |
Non-agency CMBS | 768 | | 22 | | 1 | | 789 | |
| Total HTM securities | 43,502 | | 741 | | 110 | | 44,133 | |
Total investment securities | $ | 105,454 | | $ | 1,309 | | $ | 407 | | $ | 106,356 | |
1.Amounts are net of any ACL.
2.U.S. agency securities consist mainly of agency-issued debt, agency mortgage pass-through pool securities and CMOs.
3.Underlying loans are backed by a guarantee, ultimately from the U.S. Department of Education, of at least 95% of the principal balance and interest outstanding.
In the first quarter of 2020, the Firm transferred certain municipal securities from Trading assets into AFS securities as a result of a change in intent due to the severe deterioration in liquidity for these instruments. These securities had a fair value of $441 million at the end of the first quarter of 2020.
| | | | | | | | |
| December 2020 Form 10-K | 114 | |
| | | | | |
| |
| Notes to Consolidated Financial Statements | |
Investment Securities in an Unrealized Loss Position
| | | | | | | | | | | | | | |
| At December 31,
2020 | At December 31,
2019 |
$ in millions | Fair Value | Gross Unrealized Losses | Fair Value | Gross Unrealized Losses |
| U.S. government and agency securities: | | |
| U.S. Treasury securities | | | | |
Less than12 months | $ | 151 | | $ | — | | $ | 4,793 | | $ | 28 | |
12 months or longer | — | | — | | 7,904 | | 83 | |
| Total | 151 | | — | | 12,697 | | 111 | |
| U.S. agency securities | | | | |
| Less than12 months | 5,808 | | 22 | | 2,641 | | 20 | |
| 12 months or longer | 1,168 | | 3 | | 7,697 | | 80 | |
| Total | 6,976 | | 25 | | 10,338 | | 100 | |
| Total U.S. government and agency securities: | | |
| Less than12 months | 5,959 | | 22 | | 7,434 | | 48 | |
| 12 months or longer | 1,168 | | 3 | | 15,601 | | 163 | |
Total | 7,127 | | 25 | | 23,035 | | 211 | |
Corporate and other debt: | | | | |
| Agency CMBS | | | | |
| Less than12 months | 2,779 | | 9 | | 2,294 | | 26 | |
| 12 months or longer | 46 | | — | | 681 | | 31 | |
| Total | 2,825 | | 9 | | 2,975 | | 57 | |
| | | | |
| | | | |
| | | | |
| | | | |
| Corporate bonds | | | | |
| Less than12 months | — | | — | | 194 | | 1 | |
| 12 months or longer | 31 | | — | | 44 | | — | |
| Total | 31 | | — | | 238 | | 1 | |
State and municipal securities | | | |
| Less than12 months | 86 | | — | | — | | — | |
| 12 months or longer | 36 | | 1 | | — | | — | |
| Total | 122 | | 1 | | — | | — | |
| FFELP student loan ABS | | | |
| Less than12 months | — | | — | | 91 | | — | |
| 12 months or longer | 1,077 | | 26 | | 1,165 | | 28 | |
| Total | 1,077 | | 26 | | 1,256 | | 28 | |
| | | |
| | | | |
| | | | |
| | | | |
Total Corporate and other debt: | | |
| Less than12 months | 2,865 | | 9 | | 2,579 | | 27 | |
| 12 months or longer | 1,190 | | 27 | | 1,890 | | 59 | |
Total | 4,055 | | 36 | | 4,469 | | 86 | |
Total AFS securities in an unrealized loss position | |
| Less than12 months | 8,824 | | 31 | | 10,013 | | 75 | |
| 12 months or longer | 2,358 | | 30 | | 17,491 | | 222 | |
Total | $ | 11,182 | | $ | 61 | | $ | 27,504 | | $ | 297 | |
For AFS securities, the Firm believes there are no securities in an unrealized loss position that have credit losses after performing the analysis described in Note 2. Additionally, the Firm does not intend to sell the securities and is not likely to be required to sell the securities prior to recovery of the amortized cost basis. Furthermore, the securities have not experienced credit losses as they are predominantly investment grade and the Firm expects to recover the amortized cost basis.
As of December 31, 2020, the HTM securities net carrying amount reflects an ACL of $26 million related to Non-agency CMBS. See Note 2 for a description of the ACL methodology used beginning in 2020 following the Firm’s adoption of CECL and prior period credit loss considerations. There were no HTM securities in an unrealized loss position as of December 31, 2019 that were other-than-temporarily
impaired. As of December 31, 2020 and December 31, 2019, Non-Agency CMBS HTM securities were predominantly on accrual status and investment grade.
See Note 16 for additional information on securities issued by VIEs, including U.S. agency mortgage-backed securities, non-agency CMBS, FFELP student loan ABS and other ABS.
Investment Securities by Contractual Maturity
| | | | | | | | | | | |
| | At December 31, 2020 |
| $ in millions | Amortized Cost1 | Fair
Value | Annualized
Average
Yield |
| AFS securities | | | |
| U.S. government and agency securities: | | | |
| U.S. Treasury securities: | | | |
| Due within 1 year | $ | 14,813 | | $ | 14,888 | | 1.1 | % |
| After 1 year through 5 years | 25,630 | | 26,401 | | 1.4 | % |
| After 5 years through 10 years | 4,902 | | 5,066 | | 1.2 | % |
| | | |
| Total | 45,345 | | 46,355 | | |
| U.S. agency securities: | | | |
| Due within 1 year | 6 | | 6 | | 1.4 | % |
| After 1 year through 5 years | 173 | | 177 | | 1.5 | % |
| After 5 years through 10 years | 1,247 | | 1,283 | | 1.7 | % |
| After 10 years | 35,963 | | 36,660 | | 1.5 | % |
| Total | 37,389 | | 38,126 | | |
| Total U.S. government and agency securities | 82,734 | | 84,481 | | 1.4 | % |
| Corporate and other debt: | | | |
| Agency CMBS: | | | |
| Due within 1 year | 95 | | 96 | | 1.2 | % |
| After 1 year through 5 years | 1,385 | | 1,400 | | 1.0 | % |
| After 5 years through 10 years | 14,123 | | 14,544 | | 1.4 | % |
| After 10 years | 4,379 | | 4,398 | | 1.3 | % |
| Total | 19,982 | | 20,438 | | |
| | | |
| | | |
| | | |
| | | |
| | | |
| | | |
| Corporate bonds: | | | |
| Due within 1 year | 286 | | 289 | | 2.4 | % |
| After 1 year through 5 years | 1,193 | | 1,224 | | 2.6 | % |
| After 5 years through 10 years | 204 | | 212 | | 2.6 | % |
| After 10 years | 11 | | 11 | | 1.7 | % |
| Total | 1,694 | | 1,736 | | |
| State and municipal securities: | | | |
| Due within 1 year | 3 | | 3 | | 1.8 | % |
| After 1 year through 5 years | 28 | | 29 | | 1.7 | % |
| After 5 years through 10 years | 87 | | 91 | | 2.4 | % |
| After 10 years | 1,343 | | 1,440 | | 2.7 | % |
| Total | 1,461 | | 1,563 | | |
| FFELP student loan ABS: | | | |
| | | |
| After 1 year through 5 years | 90 | | 86 | | 0.8 | % |
| After 5 years through 10 years | 239 | | 228 | | 0.9 | % |
| After 10 years | 1,406 | | 1,402 | | 1.2 | % |
| Total | 1,735 | | 1,716 | | |
| Other ABS: | | | |
| Due within 1 year | 3 | | 3 | | 0.3 | % |
| After 1 year through 5 years | 446 | | 446 | | 0.4 | % |
| | | |
| | | |
| Total | 449 | | 449 | | |
| Total corporate and other debt | 25,321 | | 25,902 | | 1.5 | % |
| Total AFS securities | 108,055 | | 110,383 | | 1.4 | % |
| | | | | | | | |
| 115 | December 2020 Form 10-K |
| | | | | |
| |
| Notes to Consolidated Financial Statements | |
| | | | | | | | | | | |
| | At December 31, 2020 |
| $ in millions | Amortized Cost1 | Fair
Value | Annualized
Average
Yield |
| HTM securities | | | |
| U.S. government and agency securities: | | |
| U.S. Treasury securities: | | | |
| Due within 1 year | $ | 3,146 | | $ | 3,174 | | 2.3 | % |
| After 1 year through 5 years | 17,302 | | 18,111 | | 1.9 | % |
| After 5 years through 10 years | 7,816 | | 8,655 | | 2.2 | % |
| After 10 years | 1,082 | | 1,299 | | 2.5 | % |
| Total | 29,346 | | 31,239 | | |
| U.S. agency securities: | | | |
| | | |
| | | |
| After 5 years through 10 years | 604 | | 623 | | 2.0 | % |
| After 10 years | 38,347 | | 39,024 | | 1.6 | % |
| Total | 38,951 | | 39,647 | | |
| Total U.S. government and agency securities | 68,297 | | 70,886 | | 1.8 | % |
| Corporate and other debt: | | | |
| Agency CMBS: | | | |
| Due within 1 year | 21 | | 21 | | 2.4 | % |
| After 1 year through 5 years | 1,215 | | 1,215 | | 1.4 | % |
| After 5 years through 10 years | 1,164 | | 1,167 | | 1.3 | % |
| After 10 years | 232 | | 231 | | 1.6 | % |
| Total | 2,632 | | 2,634 | | 1.3 | % |
| Non-agency CMBS: | | | |
| Due within 1 year | 153 | | 153 | | 4.5 | % |
| After 1 year through 5 years | 35 | | 35 | | 3.2 | % |
| After 5 years through 10 years | 618 | | 671 | | 3.8 | % |
| After 10 years | 36 | | 41 | | 4.4 | % |
| Total | 842 | | 900 | | 3.9 | % |
| Total corporate and other debt | 3,474 | | 3,534 | | 2.0 | % |
| Total HTM securities | 71,771 | | 74,420 | | 1.8 | % |
| Total investment securities | $ | 179,826 | | $ | 184,803 | | 1.6 | % |
1.Amounts are net of any ACL.
Gross Realized Gains (Losses) on Sales of AFS Securities
| | | | | | | | | | | |
| $ in millions | 2020 | 2019 | 2018 |
| Gross realized gains | $ | 168 | | $ | 113 | | $ | 12 | |
| Gross realized (losses) | (31) | | (10) | | (4) | |
Total1 | $ | 137 | | $ | 103 | | $ | 8 | |
1.Realized gains and losses are recognized in Other revenues in the income statements.
9. Collateralized Transactions
The Firm enters into securities purchased under agreements to resell, securities sold under agreements to repurchase, securities borrowed and securities loaned transactions to, among other things, acquire securities to cover short positions and settle other securities obligations, to accommodate customers’ needs and to finance its inventory positions.
The Firm monitors the fair value of the underlying securities as compared with the related receivable or payable, including accrued interest, and, as necessary, requests additional collateral, as provided under the applicable agreement to ensure such transactions are adequately collateralized, or the return of excess collateral.
The risk related to a decline in the market value of collateral pledged or received is managed by setting appropriate market-based margin requirements. Increases in collateral margin calls on secured financing due to market value declines may be mitigated by increases in collateral margin calls on securities purchased under agreements to resell and securities borrowed transactions with similar quality collateral. Additionally, the Firm may request lower quality collateral pledged be replaced with higher quality collateral through collateral substitution rights in the underlying agreements.
The Firm actively manages its secured financings in a manner that reduces the potential refinancing risk of secured financings of less liquid assets and also considers the quality of collateral when negotiating collateral eligibility with counterparties. The Firm utilizes shorter term secured financing for highly liquid assets and has established longer tenor limits for less liquid assets, for which funding may be at risk in the event of a market disruption.
Offsetting of Certain Collateralized Transactions
| | | | | | | | | | | | | | | | | |
| | At December 31, 2020 |
| $ in millions | Gross
Amounts | Amounts
Offset | Balance Sheet Net Amounts | Amounts Not Offset1 | Net
Amounts |
| Assets | | | | | |
Securities purchased under agreements to resell | $ | 264,140 | | $ | (147,906) | | $ | 116,234 | | $ | (114,108) | | $ | 2,126 | |
Securities borrowed | 124,921 | | (12,530) | | 112,391 | | (107,434) | | 4,957 | |
| Liabilities | | | | | |
Securities sold under agreements to repurchase | $ | 198,493 | | $ | (147,906) | | $ | 50,587 | | $ | (43,960) | | $ | 6,627 | |
| Securities loaned | 20,261 | | (12,530) | | 7,731 | | (7,430) | | 301 | |
Net amounts for which master netting agreements are not in place or may not be legally enforceable |
| Securities purchased under agreements to resell | $ | 1,870 | |
| Securities borrowed | 596 | |
| Securities sold under agreements to repurchase | 6,282 | |
| Securities loaned | 128 | |
| | | | | | | | |
| December 2020 Form 10-K | 116 | |
| | | | | |
| |
| Notes to Consolidated Financial Statements | |
| | | | | | | | | | | | | | | | | |
| | At December 31, 2019 |
| $ in millions | Gross
Amounts | Amounts
Offset | Balance Sheet Net Amounts | Amounts Not Offset1 | Net
Amounts |
| Assets | | | | | |
Securities purchased under agreements to resell | $ | 247,545 | | $ | (159,321) | | $ | 88,224 | | $ | (85,200) | | $ | 3,024 | |
Securities borrowed | 109,528 | | (2,979) | | 106,549 | | (101,850) | | 4,699 | |
| Liabilities | | | | | |
Securities sold under agreements to repurchase | $ | 213,519 | | $ | (159,319) | | $ | 54,200 | | $ | (44,549) | | $ | 9,651 | |
| Securities loaned | 11,487 | | (2,981) | | 8,506 | | (8,324) | | 182 | |
Net amounts for which master netting agreements are not in place or may not be legally enforceable |
| Securities purchased under agreements to resell | $ | 2,255 | |
| Securities borrowed | 1,181 | |
| Securities sold under agreements to repurchase | 8,033 | |
| Securities loaned | 101 | |
1.Amounts relate to master netting agreements that have been determined by the Firm to be legally enforceable in the event of default but where certain other criteria are not met in accordance with applicable offsetting accounting guidance.
For information related to offsetting of derivatives, see Note 7.
Gross Secured Financing Balances by Remaining Contractual Maturity
| | | | | | | | | | | | | | | | | |
| | At December 31, 2020 |
| $ in millions | Overnight
and Open | Less than
30 Days | 30-90
Days | Over
90 Days | Total |
Securities sold under agreements to repurchase | $ | 84,349 | | $ | 60,853 | | $ | 26,221 | | $ | 27,070 | | $ | 198,493 | |
| Securities loaned | 15,267 | | 247 | | — | | 4,747 | | 20,261 | |
Total included in the offsetting disclosure | $ | 99,616 | | $ | 61,100 | | $ | 26,221 | | $ | 31,817 | | $ | 218,754 | |
Trading liabilities—
Obligation to return securities received as collateral | 16,389 | | — | | — | | — | | 16,389 | |
| Total | $ | 116,005 | | $ | 61,100 | | $ | 26,221 | | $ | 31,817 | | $ | 235,143 | |
| | | | | |
| | At December 31, 2019 |
| $ in millions | Overnight
and Open | Less than
30 Days | 30-90
Days | Over
90 Days | Total |
Securities sold under agreements to repurchase | $ | 67,158 | | $ | 81,300 | | $ | 26,904 | | $ | 38,157 | | $ | 213,519 | |
| Securities loaned | 2,378 | | 3,286 | | 516 | | 5,307 | | 11,487 | |
Total included in the offsetting disclosure | $ | 69,536 | | $ | 84,586 | | $ | 27,420 | | $ | 43,464 | | $ | 225,006 | |
Trading liabilities— Obligation to return securities received as collateral | 23,877 | | — | | — | | — | | 23,877 | |
| Total | $ | 93,413 | | $ | 84,586 | | $ | 27,420 | | $ | 43,464 | | $ | 248,883 | |
Gross Secured Financing Balances by Class of Collateral Pledged
| | | | | | | | |
| $ in millions | At December 31, 2020 | At December 31, 2019 |
| Securities sold under agreements to repurchase |
| U.S. Treasury and agency securities | $ | 94,662 | | $ | 68,895 | |
| State and municipal securities | 505 | | 905 | |
| Other sovereign government obligations | 71,140 | | 109,414 | |
| ABS | 1,230 | | 2,218 | |
| Corporate and other debt | 5,287 | | 6,066 | |
| Corporate equities | 24,692 | | 25,563 | |
| Other | 977 | | 458 | |
| Total | $ | 198,493 | | $ | 213,519 | |
| Securities loaned | | |
| Other sovereign government obligations | $ | 3,430 | | $ | 3,026 | |
| Corporate equities | 16,536 | | 8,422 | |
| Other | 295 | | 39 | |
| Total | $ | 20,261 | | $ | 11,487 | |
| Total included in the offsetting disclosure | $ | 218,754 | | $ | 225,006 | |
| Trading liabilities—Obligation to return securities received as collateral |
| Corporate equities | $ | 16,365 | | $ | 23,873 | |
| Other | 24 | | 4 | |
| Total | $ | 16,389 | | $ | 23,877 | |
| Total | $ | 235,143 | | $ | 248,883 | |
Carrying Value of Assets Loaned or Pledged without Counterparty Right to Sell or Repledge
| | | | | | | | |
| $ in millions | At December 31, 2020 | At December 31, 2019 |
| Trading assets | $ | 30,954 | | $ | 41,201 | |
| Loans, before ACL | — | | 750 | |
| Total | $ | 30,954 | | $ | 41,951 | |
The Firm pledges certain of its trading assets and loans to collateralize securities sold under agreements to repurchase, securities loaned, other secured financings and derivatives and to cover customer short sales. Counterparties may or may not have the right to sell or repledge the collateral.
Pledged financial instruments that can be sold or repledged by the secured party are identified as Trading assets (pledged to various parties) in the balance sheets.
Fair Value of Collateral Received with Right to Sell or Repledge
| | | | | | | | |
| $ in millions | At December 31, 2020 | At December 31, 2019 |
Collateral received with right to sell
or repledge | $ | 724,818 | | $ | 679,280 | |
Collateral that was sold or repledged1 | 523,648 | | 539,412 | |
1.Does not include securities used to meet federal regulations for the Firm’s U.S. broker-dealers.
The Firm receives collateral in the form of securities in connection with securities purchased under agreements to resell, securities borrowed, securities-for-securities transactions, derivative transactions, customer margin loans and securities-based lending. In many cases, the Firm is
| | | | | | | | |
| 117 | December 2020 Form 10-K |
| | | | | |
| |
| Notes to Consolidated Financial Statements | |
permitted to sell or repledge this collateral to secure securities sold under agreements to repurchase, to enter into securities lending and derivative transactions or for delivery to counterparties to cover short positions.
Securities Segregated for Regulatory Purposes
| | | | | | | | |
| $ in millions | At December 31, 2020 | At December 31, 2019 |
Segregated securities1 | $ | 34,106 | | $ | 25,061 | |
1.Securities segregated under federal regulations for the Firm’s U.S. broker-dealers are sourced from Securities purchased under agreements to resell and Trading assets in the balance sheets.
Concentration Based on the Firm’s Total Assets
| | | | | | | | |
| At December 31, 2020 | At December 31, 2019 |
U.S. government and agency securities and other sovereign government obligations | | |
Trading assets1 | 10 | % | 10 | % |
Off balance sheet—Collateral received2 | 12 | % | 12 | % |
1.Other sovereign government obligations included in Trading assets primarily consist of obligations of the U.K., Japan and Brazil at December 31, 2020, and obligations of the U.K., Japan and Australia at December 31, 2019.
2.Collateral received is primarily related to Securities purchased under agreements to resell and Securities borrowed.
The Firm is subject to concentration risk by holding large positions in certain types of securities, loans or commitments to purchase securities of a single issuer, including sovereign governments and other entities, issuers located in a particular country or geographic area, public and private issuers involving developing countries or issuers engaged in a particular industry.
Positions taken and underwriting and financing commitments, including those made in connection with the Firm’s private equity, principal investment and lending activities, often involve substantial amounts and significant exposure to individual issuers and businesses, including investment grade and non-investment grade issuers.
Customer Margin and Other Lending
| | | | | | | | |
| $ in millions | At December 31, 2020 | At December 31, 2019 |
| Margin and other lending | $ | 74,714 | | $ | 31,916 | |
The Firm provides margin lending arrangements that allow customers to borrow against the value of qualifying securities. Receivables under margin lending arrangements are included within Customer and other receivables in the balance sheets. Under these agreements and transactions, the Firm receives collateral, which includes U.S. government and agency securities, other sovereign government obligations, corporate and other debt, and corporate equities. Margin loans are collateralized by customer-owned securities held by the Firm. The Firm monitors required margin levels and established credit terms daily and, pursuant to such guidelines, requires
customers to deposit additional collateral, or reduce positions, when necessary.
Margin loans are extended on a demand basis and generally are not committed facilities. Factors considered in the review of margin loans are the amount of the loan, the intended purpose, the degree of leverage being employed in the account and the amount of collateral, as well as an overall evaluation of the portfolio to ensure proper diversification or, in the case of concentrated positions, appropriate liquidity of the underlying collateral or potential hedging strategies to reduce risk. Underlying collateral for margin loans is reviewed with respect to the liquidity of the proposed collateral positions, valuation of securities, historic trading range, volatility analysis and an evaluation of industry concentrations. For these transactions, adherence to the Firm’s collateral policies significantly limits its credit exposure in the event of a customer default. The Firm may request additional margin collateral from customers, if appropriate, and, if necessary, may sell securities that have not been paid for or purchase securities sold but not delivered from customers.
Also included in the amounts in the previous table is non-purpose securities-based lending on non-bank entities in the Wealth Management business segment.
Other Secured Financings
Other secured financings include the liabilities related to transfers of financial assets that are accounted for as financings rather than sales, consolidated VIEs where the Firm is deemed to be the primary beneficiary, and certain ELNs and other secured borrowings. These liabilities are generally payable from the cash flows of the related assets, which are accounted for as Trading assets (see Notes 14 and 16).
10. Loans, Lending Commitments and Related Allowance for Credit Losses
The Firm’s held-for-investment and held-for-sale loan portfolios consist of the following types of loans:
•Corporate. Corporate includes revolving lines of credit, term loans and bridge loans made to corporate entities for a variety of purposes.
•Secured lending facilities. Secured lending facilities include loans provided to clients, which are collateralized by various assets, including residential and commercial real estate mortgage loans, corporate loans and other assets.
•Residential Real Estate. Residential real estate loans mainly include non-conforming loans and HELOC.
•Commercial Real Estate. Commercial real estate loans include owner-occupied loans and income-producing loans.
•Securities-based lending and Other. Securities-based lending includes loans which allow clients to borrow money against the value of qualifying securities for any suitable purpose other than purchasing, trading, or carrying
| | | | | | | | |
| December 2020 Form 10-K | 118 | |
| | | | | |
| |
| Notes to Consolidated Financial Statements | |
securities or refinancing margin debt. The majority of these loans are structured as revolving lines of credit. Other primarily includes certain loans originated in the tailored lending business within the Wealth Management business segment.
Loans by Type1
| | | | | | | | | | | |
| | At December 31, 2020 |
| $ in millions | Loans Held
for Investment | Loans Held
for Sale | Total Loans |
| Corporate | $ | 6,046 | | $ | 8,580 | | $ | 14,626 | |
| Secured lending facilities | 25,727 | | 3,296 | | 29,023 | |
| Commercial real estate | 7,346 | | 822 | | 8,168 | |
| Residential real estate | 35,268 | | 48 | | 35,316 | |
| Securities-based lending and Other loans | 64,232 | | 67 | | 64,299 | |
| Total loans, before ACL | 138,619 | | 12,813 | | 151,432 | |
| ACL | (835) | | | (835) | |
| Total loans, net | $ | 137,784 | | $ | 12,813 | | $ | 150,597 | |
| Fixed rate loans, net | $ | 32,796 | |
| Floating or adjustable rate loans, net | 117,801 | |
| Loans to non-U.S. borrowers, net | 21,081 | |
| | | | | | | | | | | |
| | At December 31, 2019 |
| $ in millions | Loans Held
for Investment | Loans Held
for Sale | Total Loans |
| Corporate | $ | 5,426 | | $ | 6,192 | | $ | 11,618 | |
| Secured lending facilities | 24,502 | | 4,200 | | 28,702 | |
| Commercial real estate | 7,859 | | 2,049 | | 9,908 | |
| Residential real estate | 30,184 | | 13 | | 30,197 | |
| Securities-based lending and Other loans | 50,438 | | 123 | | 50,561 | |
| Total loans, gross | 118,409 | | 12,577 | | 130,986 | |
| Allowance for credit losses | (349) | | — | | (349) | |
| Total loans, net | $ | 118,060 | | $ | 12,577 | | $ | 130,637 | |
| Fixed rate loans, net | $ | 22,716 | |
| Floating or adjustable rate loans, net | 107,921 | |
| Loans to non-U.S. borrowers, net | 21,617 | |
1.Loans previously classified as corporate have been further disaggregated; prior period balances have been revised to conform with current period presentation
See Note 5 for further information regarding Loans and lending commitments held at fair value. See Note 15 for details of current commitments to lend in the future.
Credit Quality
CRM evaluates new obligors before credit transactions are initially approved and at least annually thereafter for corporate and commercial real estate loans. For Corporate, Secured lending facilities and Other loans, credit evaluations typically involve the evaluation of financial statements, assessment of leverage, liquidity, capital strength, asset composition and quality, market capitalization and access to capital markets, cash flow projections and debt service requirements, and the adequacy of collateral, if applicable. CRM also evaluates strategy, market position, industry dynamics, obligor’s management and other factors that could affect an obligor’s risk profile.
For Commercial real estate loans, the credit evaluation is focused on property and transaction metrics, including property type, LTV ratio, occupancy levels, debt service ratio, prevailing capitalization rates and market dynamics.
For Residential real estate and Securities-based loans, the initial credit evaluation typically includes, but is not limited to, review of the obligor’s income, net worth, liquidity, collateral, LTV ratio and credit bureau information. Subsequent credit monitoring for residential real estate loans is performed at the portfolio level. Securities-based loan collateral values are monitored on an ongoing basis.
For information related to credit quality indicators considered in developing the ACL, see Note 2.
Loans Held for Investment before Allowance by Origination Year
| | | | | | | | | | | |
| At December 31, 2020 |
| Corporate |
$ in millions | Investment Grade | Non-Investment Grade | Total |
Revolving | $ | 1,138 | | $ | 3,231 | | $ | 4,369 | |
| 2020 | 585 | | 80 | | 665 | |
| 2019 | 204 | | 202 | | 406 | |
| 2018 | 195 | | — | | 195 | |
| 2017 | — | | 64 | | 64 | |
| 2016 | 115 | | — | | 115 | |
Prior | 132 | | 100 | | 232 | |
Total | $ | 2,369 | | $ | 3,677 | | $ | 6,046 | |
| | | | | | | | | | | |
| At December 31, 2020 |
| Secured lending facilities |
$ in millions | Investment Grade | Non-Investment Grade | Total |
Revolving | $ | 4,711 | | $ | 14,510 | | $ | 19,221 | |
| 2020 | 162 | | 253 | | 415 | |
| 2019 | 260 | | 1,904 | | 2,164 | |
| 2018 | 614 | | 1,432 | | 2,046 | |
| 2017 | 245 | | 581 | | 826 | |
| 2016 | — | | 654 | | 654 | |
Prior | — | | 401 | | 401 | |
Total | $ | 5,992 | | $ | 19,735 | | $ | 25,727 | |
| | | | | | | | | | | |
| At December 31, 2020 |
| Commercial real estate |
$ in millions | Investment Grade | Non-Investment Grade | Total |
| | | |
| 2020 | $ | 95 | | $ | 943 | | $ | 1,038 | |
| 2019 | 1,074 | | 1,848 | | 2,922 | |
| 2018 | 746 | | 774 | | 1,520 | |
| 2017 | 412 | | 387 | | 799 | |
| 2016 | 100 | | 594 | | 694 | |
Prior | — | | 373 | | 373 | |
Total | $ | 2,427 | | $ | 4,919 | | $ | 7,346 | |
| | | | | | | | |
| 119 | December 2020 Form 10-K |
| | | | | |
| |
| Notes to Consolidated Financial Statements | |
| | | | | | | | | | | | | | | | | | | | | | | | | | |
| At December 31, 2020 |
| Residential real estate |
| by FICO Scores | | by LTV Ratio | | Total |
$ in millions | ≥ 740 | 680-739 | ≤ 679 | | ≤ 80% | > 80% | |
| Revolving | $ | 85 | | $ | 32 | | $ | 5 | | | $ | 122 | | $ | — | | | $ | 122 | |
| 2020 | 8,948 | | 1,824 | | 149 | | | 10,338 | | 583 | | | 10,921 | |
| 2019 | 5,592 | | 1,265 | | 168 | | | 6,584 | | 441 | | | 7,025 | |
| 2018 | 2,320 | | 604 | | 75 | | | 2,756 | | 243 | | | 2,999 | |
| 2017 | 2,721 | | 690 | | 89 | | | 3,251 | | 249 | | | 3,500 | |
| 2016 | 3,324 | | 884 | | 118 | | | 4,035 | | 291 | | | 4,326 | |
Prior | 4,465 | | 1,626 | | 284 | | | 5,684 | | 691 | | | 6,375 | |
Total | $ | 27,455 | | $ | 6,925 | | $ | 888 | | | $ | 32,770 | | $ | 2,498 | | | $ | 35,268 | |
| | | | | | | | | | | | | | |
| At December 31, 2020 |
| Securities-based lending1 | Other2 | |
$ in millions | Investment Grade | Non-Investment Grade | Total |
Revolving | $ | 51,667 | | $ | 4,816 | | $ | 555 | | $ | 57,038 | |
| 2020 | — | | 1,073 | | 590 | | 1,663 | |
| 2019 | 18 | | 1,156 | | 623 | | 1,797 | |
| 2018 | 232 | | 407 | | 403 | | 1,042 | |
| 2017 | — | | 654 | | 122 | | 776 | |
| 2016 | — | | 566 | | 111 | | 677 | |
Prior | 16 | | 1,066 | | 157 | | 1,239 | |
Total | $ | 51,933 | | $ | 9,738 | | $ | 2,561 | | $ | 64,232 | |
1. Securities-based loans are subject to collateral maintenance provisions, and at December 31, 2020, these loans are predominantly over-collateralized. For more information on the ACL methodology related to securities-based loans, see Note 2.
2. Other loans primarily include certain loans originated in the tailored lending business within the Wealth Management business segment.
Past Due Status of Loans Held for Investment before Allowance
| | | | | | | | | | | |
| At December 31, 2020 |
| | | |
$ in millions | Current | Past Due1 | Total |
| Corporate | $ | 6,046 | | $ | — | | $ | 6,046 | |
| Secured lending facilities | 25,727 | | — | | 25,727 | |
| Commercial real estate | 7,346 | | — | | 7,346 | |
| Residential real estate | 34,936 | | 332 | | 35,268 | |
| Securities-based lending and Other loans | 64,201 | | 31 | | 64,232 | |
Total | $ | 138,256 | | $ | 363 | | $ | 138,619 | |
1.The majority of the amounts are past due for a period of less than 60 days.
Nonaccrual Loans Held for Investment before Allowance
| | | | | | | | |
$ in millions | At
December 31, 2020 | At
December 31, 2019 |
Corporate | $ | 164 | | $ | 299 | |
| | |
Commercial real estate | 152 | | 85 | |
Residential real estate | 97 | | 94 | |
| Securities-based lending and Other loans | 178 | | 5 | |
Total1 | $ | 591 | | $ | 483 | |
Nonaccrual loans without an ACL | $ | 90 | | $ | 120 | |
1.Includes all HFI loans that are 90 days or more past due.
Troubled Debt Restructurings
| | | | | | | | |
| $ in millions | At December 31, 2020 | At December 31, 2019 |
| Loans, before ACL | $ | 167 | | $ | 92 | |
| Lending commitments | 27 | | 32 | |
Allowance for loan losses and lending commitments | 36 | | 16 | |
Troubled debt restructurings typically include modifications of interest rates, collateral requirements, other loan covenants and payment extensions. See Note 2 for further information on TDR guidance issued by Congress in the CARES Act as well as by the U.S. banking agencies.
Allowance for Credit Losses Rollforward—Loans
| | | | | | | | | | | | | | | | | | | | |
$ in millions | Corporate | Secured lending facilities | CRE | Residential real estate | SBL and Other | Total |
| December 31, 2019 | $ | 115 | | $ | 101 | | $ | 75 | | $ | 25 | | $ | 33 | | $ | 349 | |
| Effect of CECL adoption | (2) | | (42) | | 34 | | 21 | | (2) | | 9 | |
| Gross charge-offs | (39) | | — | | (64) | | (1) | | (1) | | (105) | |
| Recoveries | 4 | | — | | — | | — | | 4 | | 8 | |
| Net (charge-offs) recoveries | (35) | | — | | (64) | | (1) | | 3 | | (97) | |
| Provision (release) | 225 | | 136 | | 197 | | 14 | | (13) | | 559 | |
| Other | 6 | | 3 | | (31) | | — | | 37 | | 15 | |
| December 31, 2020 | $ | 309 | | $ | 198 | | $ | 211 | | $ | 59 | | $ | 58 | | $ | 835 | |
| | | | | | | | | | | | | | | | | | | | |
$ in millions | Corporate | Secured lending facilities | CRE | Residential real estate | SBL and Other | Total |
| December 31, 2018 | $ | 62 | | $ | 60 | | $ | 67 | | $ | 20 | | $ | 29 | | $ | 238 | |
| Gross charge-offs | — | | — | | — | | (2) | | — | | (2) | |
| | | | | | |
| | | | | | |
| Provision (release) | 59 | | 42 | | 8 | | 7 | | 4 | | 120 | |
| Other | (6) | | (1) | | — | | — | | — | | (7) | |
| December 31, 2019 | $ | 115 | | $ | 101 | | $ | 75 | | $ | 25 | | $ | 33 | | $ | 349 | |
| | | | | | | | | | | | | | | | | | | | |
$ in millions | Corporate | Secured lending facilities | CRE | Residential real estate | SBL and Other | Total |
| December 31, 2017 | $ | 63 | | $ | 41 | | $ | 70 | | $ | 24 | | $ | 26 | | $ | 224 | |
| Gross charge-offs | (1) | | — | | — | | (1) | | (4) | | (6) | |
| Recoveries | 54 | | — | | — | | — | | — | | 54 | |
Net
(charge-offs) recoveries | 53 | | — | | — | | (1) | | (4) | | 48 | |
Provision (release)1 | (53) | | 20 | | 5 | | (3) | | 7 | | (24) | |
| Other | (1) | | (1) | | (8) | | — | | — | | (10) | |
| December 31, 2018 | $ | 62 | | $ | 60 | | $ | 67 | | $ | 20 | | $ | 29 | | $ | 238 | |
1.During 2018, the release was primarily due to the recovery of an energy industry related loan charged off in 2017.
| | | | | | | | |
| December 2020 Form 10-K | 120 | |
| | | | | |
| |
| Notes to Consolidated Financial Statements | |
Allowance for Credit Losses Rollforward—Lending Commitments | | | | | | | | | | | | | | | | | | | | |
$ in millions | Corporate | Secured lending facilities | CRE | Residential real estate | SBL and Other | Total |
| December 31, 2019 | $ | 201 | | $ | 27 | | $ | 7 | | $ | — | | $ | 6 | | $ | 241 | |
| Effect of CECL adoption | (41) | | (11) | | 1 | | 2 | | (1) | | (50) | |
| Provision (release) | 161 | | 22 | | 7 | | (1) | | 14 | | 203 | |
| Other | 2 | | — | | (4) | | — | | 4 | | 2 | |
| December 31, 2020 | $ | 323 | | $ | 38 | | $ | 11 | | $ | 1 | | $ | 23 | | $ | 396 | |
| | | | | | | | | | | | | | | | | | | | |
$ in millions | Corporate | Secured lending facilities | CRE | Residential real estate | SBL and Other | Total |
| December 31, 2018 | $ | 177 | | $ | 16 | | $ | 3 | | $ | — | | $ | 7 | | $ | 203 | |
| Provision (release) | 27 | | 11 | | 4 | | — | | — | | 42 | |
| Other | (3) | | — | | — | | — | | (1) | | (4) | |
| December 31, 2019 | $ | 201 | | $ | 27 | | $ | 7 | | $ | — | | $ | 6 | | $ | 241 | |
| | | | | | | | | | | | | | | | | | | | |
$ in millions | Corporate | Secured lending facilities | CRE | Residential real estate | SBL and Other | Total |
| December 31, 2017 | $ | 177 | | $ | 12 | | $ | 3 | | $ | — | | $ | 6 | | $ | 198 | |
| Provision (release) | 3 | | 4 | | 1 | | — | | 1 | | 9 | |
| Other | (3) | | — | | (1) | | — | | — | | (4) | |
| December 31, 2018 | $ | 177 | | $ | 16 | | $ | 3 | | $ | — | | $ | 7 | | $ | 203 | |
CRE—Commercial real estate
SBL—Securities-based lending
The aggregate allowance for loans and lending commitments increased in 2020, reflecting the provision for credit losses within the Institutional Securities business segment principally resulting from the continued economic impact of COVID-19, partially offset by charge-offs. The provision was primarily the result of actual and forecasted changes in asset quality trends, as well as risks related to uncertainty in the outlook for the sectors in focus due to COVID-19. Charge-offs in 2020 were primarily related to certain Commercial real estate and Corporate loans in the Institutional Securities business segment. The base scenario used in our ACL models as of December 31, 2020 was generated using a combination of industry consensus economic forecasts, forward rates, and internally developed and validated models. Given the nature of our lending portfolio, the most sensitive model input is U.S. GDP. The base scenario, among other things, assumes a continued recovery through 2021, supported by fiscal stimulus and monetary policy measures.
See Note 2 for a description of the ACL calculated under the CECL methodology, including credit quality indicators, used for HFI loans beginning in 2020 and for a summary of the differences compared with the Firm’s ACL methodology under the prior incurred loss model.
Employee Loans
| | | | | | | | |
| $ in millions | At December 31, 2020 | At December 31, 2019 |
Currently employed by the Firm1 | $ | 3,100 | | N/A |
No longer employed by the Firm2 | 140 | | N/A |
| Employee loans | $ | 3,240 | | $ | 2,980 | |
ACL3 | (165) | | (61) | |
| Employee loans, net of ACL | $ | 3,075 | | $ | 2,919 | |
| Remaining repayment term, weighted average in years | 5.3 | 4.8 |
1.These loans are predominantly current.
2.These loans are predominantly past due for a period of 90 days or more.
3.The change in ACL includes a $124 million increase due to the adoption of CECL in the first quarter of 2020.
Employee loans are granted in conjunction with a program established primarily to recruit certain Wealth Management representatives, are full recourse and generally require periodic repayments, and are due in full upon termination of employment with the Firm. These loans are recorded in Customer and other receivables in the balance sheets. The ACL as of December 31, 2020 was calculated under the CECL methodology, while the ACL at December 31, 2019 was calculated under the prior incurred loss model. The related provision is recorded in Compensation and benefits expense in the income statements. See Note 2 for a description of the CECL allowance methodology, including credit quality indicators, for employee loans.
11. Goodwill and Intangible Assets
Goodwill Rollforward
| | | | | | | | | | | | | | |
| $ in millions | IS | WM | IM | Total |
| At December 31, 2018¹ | $ | 274 | | $ | 5,533 | | $ | 881 | | $ | 6,688 | |
| Foreign currency and other | (13) | | (1) | | — | | (14) | |
Acquired2 | — | | 469 | | — | | 469 | |
| At December 31, 2019¹ | $ | 261 | | $ | 6,001 | | $ | 881 | | $ | 7,143 | |
| Foreign currency and other | 15 | | 7 | | — | | 22 | |
Acquired3 | 200 | | 4,270 | | — | | 4,470 | |
At December 31, 20201 | $ | 476 | | $ | 10,278 | | $ | 881 | | $ | 11,635 | |
Accumulated impairments4 | $ | 673 | | $ | — | | $ | 27 | | $ | 700 | |
IS—Institutional Securities
WM—Wealth Management
IM—Investment Management
1.Balances represent the amount of the Firm’s goodwill after accumulated impairments.
2.Amounts reflect the impact of the Firm's acquisition of Solium Capital Inc. in the second quarter of 2019.
3.The Wealth Management amount reflects the impact of the Firm's acquisition of E*TRADE in the fourth quarter of 2020.
4.Accumulated impairments were recorded prior to the periods shown. There were no impairments recorded in 2020, 2019 or 2018.
The Firm's annual goodwill impairment testing as of July 1, 2020 and 2019 did not indicate any goodwill impairment, as reporting units with goodwill had a fair value that was in excess of carrying value.
| | | | | | | | |
| 121 | December 2020 Form 10-K |
| | | | | |
| |
| Notes to Consolidated Financial Statements | |
Net Amortizable Intangible Assets Rollforward
| | | | | | | | | | | | | | |
| $ in millions | IS | WM | IM | Total |
| At December 31, 2018 | $ | 270 | | $ | 1,828 | | $ | 60 | | $ | 2,158 | |
Acquired1 | 3 | | 270 | | — | | 273 | |
| Disposals | (29) | | — | | — | | (29) | |
| Amortization expense | (35) | | (271) | | (8) | | (314) | |
| Other | 18 | | 1 | | — | | 19 | |
| At December 31, 2019 | $ | 227 | | $ | 1,828 | | $ | 52 | | $ | 2,107 | |
Acquired2 | 14 | | 3,309 | | — | | 3,323 | |
| Disposals | (79) | | — | | — | | (79) | |
| Amortization expense | (35) | | (330) | | (8) | | (373) | |
| Other | — | | 2 | | — | | 2 | |
| At December 31, 2020 | $ | 127 | | $ | 4,809 | | $ | 44 | | $ | 4,980 | |
1.Amounts principally reflect the impact of the Firm's acquisition of Solium Capital Inc. in the second quarter of 2019.
2.The Wealth Management amount principally reflects the impact of the Firm's acquisition of E*TRADE in the fourth quarter of 2020.
Gross Amortizable Intangible Assets by Type
| | | | | | | | | | | | | | |
| | At December 31, 2020 | At December 31, 2019 |
| $ in millions | Gross
Carrying
Amount | Accumulated
Amortization | Gross
Carrying
Amount | Accumulated
Amortization |
| Tradenames | $ | 460 | | $ | 82 | | $ | 291 | | $ | 71 | |
| Customer relationships | 7,420 | | 2,984 | | 4,321 | | 2,703 | |
| Management contracts | 178 | | 120 | | 482 | | 327 | |
| Other | 187 | | 79 | | 217 | | 103 | |
| Total | $ | 8,245 | | $ | 3,265 | | $ | 5,311 | | $ | 3,204 | |
| Estimated annual amortization expense for the next five years | $ | 470 | |
12. Other Assets—Equity Method Investments and Leases
Equity Method Investments
| | | | | | | | |
| $ in millions | At December 31, 2020 | At December 31, 2019 |
| Investments | $ | 2,410 | | $ | 2,363 | |
| | | | | | | | | | | |
| $ in millions | 2020 | 2019 | 2018 |
Income (loss)1 | $ | — | | $ | (81) | | $ | 20 | |
1.Includes impairments of the Investment Management business segment’s equity method investments as follows: $41 million in the fourth quarter of 2019 related to a third-party asset manager, and $46 million in the fourth quarter of 2018 related to a separate third-party asset manager.
Equity method investments, other than investments in certain fund interests, are summarized above and are included in Other assets in the balance sheets with related income or loss included in Other revenues in the income statements. See “Net Asset Value Measurements—Fund Interests” in Note 5 for the carrying value of certain of the Firm’s fund interests, which are comprised of general and limited partnership interests, as well as any related carried interest.
Japanese Securities Joint Venture
| | | | | | | | | | | |
| $ in millions | 2020 | 2019 | 2018 |
| Income from investment in MUMSS | $ | 80 | | $ | 17 | | $ | 105 | |
The Firm and Mitsubishi UFJ Financial Group, Inc. (“MUFG”) formed a joint venture in Japan comprising their respective investment banking and securities businesses by
forming two joint venture companies, Mitsubishi UFJ Morgan Stanley Securities Co., Ltd. (“MUMSS”) and Morgan Stanley MUFG Securities Co., Ltd. (“MSMS”) (the “Joint Venture”). The Firm owns a 40% economic interest in the Joint Venture, and MUFG owns the other 60%.
The Firm’s 40% voting interest in MUMSS is accounted for under the equity method within the Institutional Securities business segment and is included in the equity method investment balances above. The Firm consolidates MSMS into the Institutional Securities business segment, based on its 51% voting interest.
The Firm engages in transactions in the ordinary course of business with MUFG and its affiliates; for example, investment banking, financial advisory, sales and trading, derivatives, investment management, lending, securitization and other financial services transactions. Such transactions are on substantially the same terms as those that would be available to unrelated third parties for comparable transactions.
Leases
The Firm’s leases are principally non-cancelable operating real estate leases.
Balance Sheet Amounts Related to Leases
| | | | | | | | |
| $ in millions | At December 31, 2020 | At December 31, 2019 |
| Other assets—ROU assets | $ | 4,419 | | $ | 3,998 | |
| Other liabilities and accrued expenses—Lease liabilities | 5,327 | | 4,778 | |
| Weighted average: | | |
Remaining lease term, in years | 9.5 | 9.7 |
Discount rate | 3.2 | % | 3.6 | % |
Lease Liabilities
| | | | | | | | |
| $ in millions | At December 31, 2020 | At December 31, 2019 |
| 2020 | $ | — | | $ | 763 | |
| 2021 | 841 | | 703 | |
| 2022 | 793 | | 646 | |
| 2023 | 740 | | 593 | |
| 2024 | 639 | | 524 | |
| 2025 | 532 | | 439 | |
| Thereafter | 2,685 | | 2,406 | |
| Total undiscounted cash flows | 6,230 | | 6,074 | |
Imputed interest | (903) | | (1,296) | |
| Amount on balance sheet | $ | 5,327 | | $ | 4,778 | |
Committed leases not yet commenced | $ | 278 | | $ | 55 | |
| | | | | | | | |
| December 2020 Form 10-K | 122 | |
| | | | | |
| |
| Notes to Consolidated Financial Statements | |
Lease Costs
| | | | | | | | |
| $ in millions | 2020 | 2019 |
| Fixed costs | $ | 762 | | $ | 670 | |
Variable costs1 | 154 | | 152 | |
| Less: Sublease income | (5) | | (6) | |
| Total lease cost, net | $ | 911 | | $ | 816 | |
1.Includes common area maintenance charges and other variable costs not included in the measurement of ROU assets and lease liabilities.
Cash Flows Statement Supplemental Information
| | | | | | | | |
| $ in millions | 2020 | 2019 |
Cash outflows—Lease liabilities | $ | 765 | | $ | 685 | |
Non-cash—ROU assets recorded for new and modified leases | 991 | | 514 | |
Rent Expense
| | | | | |
| $ in millions | 2018 |
Rent expense | 753 | |
Occupancy lease agreements, in addition to base rentals, generally provide for rent and operating expense escalations resulting from increased assessments for real estate taxes and other charges.
13. Deposits
Deposits
| | | | | | | | |
| $ in millions | At December 31, 2020 | At December 31, 2019 |
| Savings and demand deposits | $ | 279,221 | | $ | 149,465 | |
| Time deposits | 31,561 | | 40,891 | |
| Total | $ | 310,782 | | $ | 190,356 | |
| Deposits subject to FDIC insurance | $ | 234,211 | | $ | 149,966 | |
Time deposits that equal or exceed the FDIC insurance limit | $ | 16 | | $ | 12 | |
Time Deposit Maturities
| | | | | |
| $ in millions | At December 31, 2020 |
| 2021 | $ | 18,477 | |
| 2022 | 4,982 | |
| 2023 | 4,094 | |
| 2024 | 2,718 | |
| 2025 | 778 | |
| Thereafter | 512 | |
| Total | $ | 31,561 | |
14. Borrowings and Other Secured Financings
Maturities and Terms of Borrowings
| | | | | | | | | | | | | | | | | | | | |
| Parent Company | Subsidiaries | At December 31, 2020 | At December 31, 2019 |
| $ in millions | Fixed Rate1 | Variable Rate2 | Fixed Rate1 | Variable Rate2 |
| Original maturities of one year or less: | | |
| Next 12 months | $ | — | | $ | 1 | | $ | — | | $ | 3,690 | | $ | 3,691 | | $ | 2,567 | |
| Original maturities greater than one year: | | |
| 2020 | $ | — | | $ | — | | $ | — | | $ | — | | $ | — | | $ | 20,402 | |
| 2021 | 14,341 | | 3,329 | | 616 | | 5,955 | | 24,241 | | 26,085 | |
| 2022 | 6,909 | | 9,703 | | 764 | | 4,833 | | 22,209 | | 19,888 | |
| 2023 | 10,853 | | 6,299 | | 123 | | 5,615 | | 22,890 | | 14,615 | |
| 2024 | 14,096 | | 2,013 | | 387 | | 5,231 | | 21,727 | | 21,106 | |
| 2025 | 10,719 | | 617 | | 1,547 | | 5,753 | | 18,636 | | 14,642 | |
| Thereafter | 76,499 | | 4,444 | | 8,301 | | 14,441 | | 103,685 | | 73,322 | |
| Total | $ | 133,417 | | $ | 26,405 | | $ | 11,738 | | $ | 41,828 | | $ | 213,388 | | $ | 190,060 | |
Total borrowings | $ | 133,417 | | $ | 26,406 | | $ | 11,738 | | $ | 45,518 | | $ | 217,079 | | $ | 192,627 | |
| | | | | | | | | | | | | | | | | | | | |
Weighted average coupon at period end3 | 3.3 | % | 1.0 | % | 0.9 | % | N/M | 2.9 | % | 3.4 | % |
1.Fixed rate borrowings include instruments with step-up, step-down and zero coupon features.
2.Variable rate borrowings include those that bear interest based on a variety of indices, including LIBOR, federal funds rates and SOFR, in addition to certain notes carried at fair value with various payment provisions, including notes linked to the performance of a specific index, a basket of stocks, a specific equity security, a commodity, a credit exposure or basket of credit exposures.
3.Only includes borrowings with original maturities greater than one year. Weighted average coupon is calculated utilizing U.S. and non-U.S. dollar interest rates and excludes financial instruments for which the fair value option was elected. Virtually all of the variable rate notes issued by subsidiaries are carried at fair value so a weighted average coupon is not meaningful.
Borrowings with Original Maturities Greater than One Year
| | | | | | | | |
| $ in millions | At December 31, 2020 | At December 31, 2019 |
| Senior | $ | 202,305 | | $ | 179,519 | |
| Subordinated | 11,083 | | 10,541 | |
| Total | $ | 213,388 | | $ | 190,060 | |
| Weighted average stated maturity, in years | 7.3 | 6.9 |
Certain senior debt securities are denominated in various non-U.S. dollar currencies and may be structured to provide a return that is linked to equity, credit, commodity or other indices (e.g., the consumer price index). Senior debt also may be structured to be callable by the Firm or extendible at the option of holders of the senior debt securities.
The Firm’s Borrowings include notes carried and managed on a fair value basis. These include instruments whose payments and redemption values are linked to the performance of a specific index, a basket of stocks, a specific equity security, a commodity, a credit exposure or basket of credit exposures; and instruments with various interest-rate-related features, including step-ups, step-downs and zero coupons. To minimize the exposure from such instruments, the Firm has entered into various swap contracts and purchased options that effectively convert the borrowing costs into floating rates. The swaps and purchased options used to economically hedge the embedded features are derivatives and also are carried at fair value. Changes in fair value related to the notes and economic hedges are reported in Trading revenues. See Notes
| | | | | | | | |
| 123 | December 2020 Form 10-K |
| | | | | |
| |
| Notes to Consolidated Financial Statements | |
2 and 6 for further information on borrowings carried at fair value.
Senior Debt Subject to Put Options or Liquidity Obligations
| | | | | | | | |
| $ in millions | At December 31, 2020 | At December 31, 2019 |
| Put options embedded in debt agreements | $ | 94 | | $ | 290 | |
Liquidity obligations1 | $ | 1,483 | | $ | 1,344 | |
1.Includes obligations to support secondary market trading.
Subordinated Debt
| | | | | | | | |
| 2020 | 2019 |
| Contractual weighted average coupon | 4.5 | % | 4.5 | % |
Subordinated debt generally is issued to meet the capital requirements of the Firm or its regulated subsidiaries and primarily is U.S. dollar denominated. Maturities of subordinated debt range from 2022 to 2027.
Rates for Borrowings with Original Maturities Greater than One Year
| | | | | | | | | | | |
| | At December 31, |
| 2020 | 2019 | 2018 |
Contractual weighted average coupon1 | 2.9 | % | 3.4 | % | 3.5 | % |
| Effective weighted average coupon after swaps | 1.7 | % | 2.9 | % | 3.6 | % |
1.Weighted average coupon was calculated utilizing U.S. and non-U.S. dollar interest rates and excludes financial instruments for which the fair value option was elected.
In general, other than securities inventories and customer balances financed by secured funding sources, the majority of the Firm’s assets are financed with a combination of deposits, short-term funding, floating rate long-term debt or fixed rate long-term debt swapped to a floating rate. The Firm uses interest rate swaps to more closely match these borrowings to the duration, holding period and interest rate characteristics of the assets being funded and to manage interest rate risk. These swaps effectively convert certain of the Firm’s fixed rate borrowings into floating rate obligations. In addition, for non-U.S. dollar currency borrowings that are not used to fund assets in the same currency, the Firm has entered into currency swaps that effectively convert the borrowings into U.S. dollar obligations.
The Firm’s use of swaps for asset and liability management affects its effective average borrowing rate.
Other Secured Financings
| | | | | | | | |
| $ in millions | At December 31, 2020 | At December 31, 2019 |
Original maturities: | | |
| One year or less | $ | 10,453 | | $ | 7,103 | |
| Greater than one year | 5,410 | | 7,595 | |
| Total | $ | 15,863 | | $ | 14,698 | |
Transfers of assets accounted for as secured financings | 1,529 | | 1,115 | |
Maturities and Terms of Other Secured Financings1
| | | | | | | | | | | | | | |
| | At December 31, 2020 | At
December 31,
2019 |
| $ in millions | Fixed
Rate | Variable Rate2 | Total |
| Original maturities of one year or less: | |
| Next 12 months | $ | 6,099 | | $ | 4,354 | | $ | 10,453 | | $ | 7,103 | |
| Original maturities greater than one year: | |
| 2020 | $ | — | | $ | — | | $ | — | | $ | 1,663 | |
| 2021 | 1,270 | | 385 | | 1,655 | | 1,110 | |
| 2022 | 605 | | 800 | | 1,405 | | 227 | |
| 2023 | 191 | | 88 | | 279 | | 2,655 | |
| 2024 | — | | 96 | | 96 | | 12 | |
| 2025 | 38 | | — | | 38 | | 36 | |
| Thereafter | 23 | | 385 | | 408 | | 777 | |
| Total | $ | 2,127 | | $ | 1,754 | | $ | 3,881 | | $ | 6,480 | |
Weighted average coupon at period-end3 | N/M | 0.5 | % | 0.6 | % | 2.4 | % |
1.Excludes transfers of assets accounted for as secured financings. See subsequent table.
2.Variable rate other secured financings bear interest based on a variety of indices, including LIBOR and federal funds rates. Amounts include notes carried at fair value with various payment provisions, including notes linked to equity, credit, commodity or other indices.
3.Includes only other secured financings with original maturities greater than one year. Weighted average coupon is calculated utilizing U.S. and non-U.S. dollar interest rates and excludes other secured financings that are linked to non-interest indices and for which the fair value option was elected.
Other secured financings include the liabilities related to certain ELNs, transfers of financial assets that are accounted for as financings rather than sales, pledged commodities, consolidated VIEs where the Firm is deemed to be the primary beneficiary and other secured borrowings. These liabilities are generally payable from the cash flows of the related assets accounted for as Trading assets. See Note 16 for further information on other secured financings related to VIEs and securitization activities.
Maturities of Transfers of Assets Accounted for as Secured Financings1
| | | | | | | | |
| $ in millions | At December 31, 2020 | At December 31, 2019 |
| 2020 | $ | — | | $ | 208 | |
| 2021 | 303 | | 225 | |
| 2022 | 159 | | 46 | |
| 2023 | 626 | | 334 | |
| 2024 | 14 | | — | |
| 2025 | — | | — | |
| Thereafter | 427 | | 302 | |
| Total | $ | 1,529 | | $ | 1,115 | |
1.Excludes Securities sold under agreements to repurchase and Securities loaned.
For transfers of assets that fail to meet accounting criteria for a sale, the Firm continues to record the assets and recognizes the associated liabilities in the balance sheets.
| | | | | | | | |
| December 2020 Form 10-K | 124 | |
| | | | | |
| |
| Notes to Consolidated Financial Statements | |
15. Commitments, Guarantees and Contingencies
Commitments
| | | | | | | | | | | | | | | | | |
| Years to Maturity at December 31, 2020 | |
| $ in millions | Less than 1 | 1-3 | 3-5 | Over 5 | Total |
| Lending: | | | | | |
| Corporate | $ | 15,362 | | $ | 37,720 | | $ | 39,886 | | $ | 5,896 | | $ | 98,864 | |
| Secured lending facilities | 5,574 | | 4,790 | | 1,399 | | 271 | | 12,034 | |
| Commercial and Residential real estate | 432 | | 244 | | 88 | | 244 | | 1,008 | |
| Securities-based lending and Other | 12,178 | | 3,063 | | 225 | | 483 | | 15,949 | |
| Forward-starting secured financing receivables | 57,164 | | — | | — | | — | | 57,164 | |
Central counterparty1 | 300 | | — | | — | | 9,286 | | 9,586 | |
| Underwriting | 3,037 | | — | | — | | — | | 3,037 | |
| Investment activities | 804 | | 215 | | 73 | | 316 | | 1,408 | |
| Letters of credit and other financial guarantees | 174 | | 1 | | — | | 3 | | 178 | |
| Total | $ | 95,025 | | $ | 46,033 | | $ | 41,671 | | $ | 16,499 | | $ | 199,228 | |
| Lending commitments participated to third parties | $ | 9,035 | |
| Forward-starting secured financing receivables settled within three business days | $ | 54,542 | |
1.Beginning in 2020, commitments to central counterparties are presented separately; these commitments were previously included in Corporate Lending commitments and Forward-starting secured financing receivables depending on the type of agreement.
Since commitments associated with these instruments may expire unused, the amounts shown do not necessarily reflect the actual future cash funding requirements.
Types of Commitments
Lending Commitments. Lending commitments primarily represent the notional amount of legally binding obligations to provide funding to clients for different types of loan transactions. For syndications that are led by the Firm, the lending commitments accepted by the borrower but not yet closed are net of the amounts agreed to by counterparties that will participate in the syndication. For syndications that the Firm participates in and does not lead, lending commitments accepted by the borrower but not yet closed include only the amount that the Firm expects it will be allocated from the lead syndicate bank. Due to the nature of the Firm’s obligations under the commitments, these amounts include certain commitments participated to third parties.
Forward-Starting Secured Financing Receivables. This amount includes securities purchased under agreements to resell and securities borrowed that the Firm has entered into prior to the balance sheet date that will settle after the balance sheet date. These transactions are primarily secured by collateral from U.S. government agency securities and other sovereign government obligations when they are funded.
Central Counterparty. These commitments relate to the Firm’s membership in certain clearinghouses and are contingent upon the default of a clearinghouse member or other stress events.
Underwriting Commitments. The Firm provides underwriting commitments in connection with its capital raising sources to a diverse group of corporate and other institutional clients.
Investment Activities. The Firm sponsors several non-consolidated investment management funds for third-party investors where it typically acts as general partner of, and investment advisor to, these funds and typically commits to invest a minority of the capital of such funds, with subscribing third-party investors contributing the majority. The Firm has contractual capital commitments, guarantees and counterparty arrangements with respect to these investment management funds.
Letters of Credit and Other Financial Guarantees. The Firm has outstanding letters of credit and other financial guarantees issued by third-party banks to certain of the Firm’s counterparties. The Firm is contingently liable for these letters of credit and other financial guarantees, which are primarily used to provide collateral for securities and commodities traded and to satisfy various margin requirements in lieu of depositing cash or securities with these counterparties.
| | | | | | | | |
| 125 | December 2020 Form 10-K |
| | | | | |
| |
| Notes to Consolidated Financial Statements | |
Guarantees
Obligations under Guarantee Arrangements at December 31, 2020
| | | | | | | | | | | | | | | | | |
| | Maximum Potential Payout/Notional |
| | Years to Maturity | |
| $ in millions | Less
than 1 | 1-3 | 3-5 | Over 5 | Total |
| Credit derivatives | $ | 24,428 | | $ | 43,350 | | $ | 116,780 | | $ | 38,830 | | $ | 223,388 | |
| Other credit contracts | — | | 194 | | — | | 91 | | 285 | |
| Non-credit derivatives | 1,308,747 | | 1,010,126 | | 337,949 | | 805,802 | | 3,462,624 | |
Standby letters of credit and other financial guarantees issued1 | 1,136 | | 1,395 | | 1,217 | | 3,676 | | 7,424 | |
| Market value guarantees | 87 | | 25 | | — | | — | | 112 | |
| Liquidity facilities | 4,425 | | — | | — | | — | | 4,425 | |
Whole loan sales guarantees | — | | — | | 24 | | 23,157 | | 23,181 | |
Securitization representations and warranties | — | | — | | — | | 66,556 | | 66,556 | |
General partner guarantees | 150 | | 120 | | 32 | | 118 | | 420 | |
Client clearing guarantees | 87 | | — | | — | | — | | 87 | |
| | | | | |
| $ in millions | Carrying
Amount
Asset
(Liability) |
Credit derivatives2 | $ | 1,227 | |
| Other credit contracts | (4) | |
Non-credit derivatives2 | (65,640) | |
Standby letters of credit and other financial guarantees issued1 | 111 | |
| Market value guarantees | — | |
| Liquidity facilities | 5 | |
| Whole loan sales guarantees | — | |
Securitization representations and warranties3 | (42) | |
| General partner guarantees | (70) | |
| Client clearing guarantees | — | |
1.These amounts include certain issued standby letters of credit participated to third parties, totaling $0.6 billion of notional and collateral/recourse, due to the nature of the Firm’s obligations under these arrangements. As of December 31, 2020, the carrying amount of standby letters of credit and other financial guarantees issued includes an allowance for credit losses of $81 million.
2.The carrying amounts of derivative contracts that meet the accounting definition of a guarantee are shown on a gross basis. For further information on derivatives contracts, see Note 7.
3.Primarily related to residential mortgage securitizations.
Types of Guarantees
Derivative Contracts. Certain derivative contracts meet the accounting definition of a guarantee, including certain written options, contingent forward contracts and CDS (see Note 7 regarding credit derivatives in which the Firm has sold credit protection to the counterparty). All derivative contracts that could meet this accounting definition of a guarantee are included in the previous table, with the notional amount used as the maximum potential payout for certain derivative contracts, such as written interest rate caps and written foreign currency options. The Firm evaluates collateral requirements for all derivatives, including derivatives that do not meet the accounting definition of a guarantee. For the effects of cash collateral and counterparty netting, see Note 7.
In certain situations, collateral may be held by the Firm for those contracts that meet the definition of a guarantee. Generally, the Firm sets collateral requirements by
counterparty so that the collateral covers various transactions and products and is not allocated specifically to individual contracts. Also, the Firm may recover amounts related to the underlying asset delivered to the Firm under the derivative contract.
Standby Letters of Credit and Other Financial Guarantees Issued. In connection with its corporate lending business and other corporate activities, the Firm provides standby letters of credit and other financial guarantees to counterparties. Such arrangements represent obligations to make payments to third parties if the counterparty fails to fulfill its obligation under a borrowing arrangement or other contractual obligation. A majority of the Firm’s standby letters of credit are provided on behalf of counterparties that are investment grade. If the counterparty fails to fulfill its contractual obligation, the Firm has access to collateral or recourse that would approximate its obligation.
Market Value Guarantees. Market value guarantees are issued to guarantee timely payment of a specified return to investors in certain affordable housing tax credit funds. These guarantees are designed to return an investor’s contribution to a fund and the investor’s share of tax losses and tax credits expected to be generated by a fund.
Liquidity Facilities. The Firm has entered into liquidity facilities with SPEs and other counterparties, whereby the Firm is required to make certain payments if losses or defaults occur. Primarily, the Firm acts as liquidity provider to municipal bond securitization SPEs and for standalone municipal bonds in which the holders of beneficial interests issued by these SPEs or the holders of the individual bonds, respectively, have the right to tender their interests for purchase by the Firm on specified dates at a specified price. The Firm often may have recourse to the underlying assets held by the SPEs in the event payments are required under such liquidity facilities, as well as make-whole or recourse provisions with the trust sponsors. The recourse amount often exceeds the maximum potential payout amount of the guarantee. Substantially all of the underlying assets in the SPEs are investment grade. Liquidity facilities provided to municipal tender option bond trusts are classified as derivatives.
Whole Loan Sales Guarantees. The Firm has provided, or otherwise agreed to be responsible for, representations and warranties regarding certain whole loan sales. Under certain circumstances, the Firm may be required to repurchase such assets or make other payments related to such assets if such representations and warranties are breached. The Firm’s maximum potential payout related to such representations and warranties is equal to the current UPB of such loans. Since the Firm no longer services these loans, it has no information on the current UPB of those loans, and accordingly, the amount included in the previous table represents the UPB at the time of the whole loan sale or at the time when the Firm last serviced any of those loans. The current UPB balances could be substantially lower than the maximum potential payout
| | | | | | | | |
| December 2020 Form 10-K | 126 | |
| | | | | |
| |
| Notes to Consolidated Financial Statements | |
amount included in the previous table. The related liability primarily relates to sales of loans to the federal mortgage agencies.
Securitization Representations and Warranties. As part of the Firm’s Institutional Securities business segment’s securitizations and related activities, the Firm has provided, or otherwise agreed to be responsible for, representations and warranties regarding certain assets transferred in securitization transactions sponsored by the Firm. The extent and nature of the representations and warranties, if any, vary among different securitizations. Under certain circumstances, the Firm may be required to repurchase certain assets or make other payments related to such assets if such representations and warranties are breached. The maximum potential amount of future payments the Firm could be required to make would be equal to the current outstanding balances of, or losses associated with, the assets subject to breaches of such representations and warranties. The amount included in the previous table for the maximum potential payout includes the current UPB or historical losses where known, and the UPB at the time of sale when the current UPB is not known.
General Partner Guarantees. As a general partner in certain investment management funds, the Firm receives certain distributions from the partnerships when the return exceeds specified performance targets according to the provisions of the partnership agreements. The Firm may be required to return all or a portion of such distributions to the limited partners in the event the limited partners do not achieve a certain return as specified in the various partnership agreements, subject to certain limitations.
Client Clearing Guarantees. In 2019, the Firm became a sponsoring member of the Government Securities Division of the FICC's Sponsored Clearing Model. Clients of the Firm, as sponsored members, can transact in overnight securities repurchase and resale agreements, which are cleared through the FICC. As sponsoring member, the Firm guarantees to the FICC the prompt and full payment and performance of its clients’ obligations. In 2020, the FICC’s sponsored clearing model was updated such that the Firm could be responsible for liquidation of a sponsored member’s account and guarantees any resulting loss to the FICC in the event the sponsored member fails to fully pay any net liquidation amount due from the sponsored member to the FICC. Accordingly, the Firm’s maximum potential payout amount reflects the total of the estimated net liquidation amounts for sponsored member accounts. The Firm minimizes credit exposure under this guarantee by obtaining a security interest in its sponsored member clients’ collateral and their contractual rights under sponsored member transactions. Therefore, the Firm's exposure is estimated to be an amount substantially lower than the maximum potential payout amount. The collateral amount in which the Firm has a security interest is approximately equal to the maximum potential payout amount of the guarantee.
Other Guarantees and Indemnities
In the normal course of business, the Firm provides guarantees and indemnifications in a variety of transactions. These provisions generally are standard contractual terms. Certain of these guarantees and indemnifications are described below:
•Indemnities. The Firm provides standard indemnities to counterparties for certain contingent exposures and taxes, including U.S. and foreign withholding taxes, on interest and other payments made on derivatives, securities and stock lending transactions, certain annuity products and other financial arrangements. These indemnity payments could be required based on a change in the tax laws, a change in interpretation of applicable tax rulings or a change in factual circumstances. Certain contracts contain provisions that enable the Firm to terminate the agreement upon the occurrence of such events. The maximum potential amount of future payments that the Firm could be required to make under these indemnifications cannot be estimated.
•Exchange/Clearinghouse Member Guarantees. The Firm is a member of various exchanges and clearinghouses that trade and clear securities and/or derivative contracts. Associated with its membership, the Firm may be required to pay a certain amount as determined by the exchange or the clearinghouse in case of a default of any of its members or pay a proportionate share of the financial obligations of another member that may default on its obligations to the exchange or the clearinghouse. While the rules governing different exchange or clearinghouse memberships and the forms of these guarantees may vary, in general the Firm’s obligations under these rules would arise only if the exchange or clearinghouse had previously exhausted its resources.
In addition, some clearinghouse rules require members to assume a proportionate share of losses resulting from the clearinghouse’s investment of guarantee fund contributions and initial margin, and of other losses unrelated to the default of a clearing member, if such losses exceed the specified resources allocated for such purpose by the clearinghouse.
The maximum potential payout under these rules cannot be estimated. The Firm has not recorded any contingent liability in its financial statements for these agreements and believes that any potential requirement to make payments under these agreements is remote.
•Merger and Acquisition Guarantees. The Firm may, from time to time, in its role as investment banking advisor be required to provide guarantees in connection with certain European merger and acquisition transactions. If required by the regulating authorities, the Firm provides a guarantee that the acquirer in the transaction has or will have sufficient funds to complete the transaction and would then be required to make the acquisition payments in the event
| | | | | | | | |
| 127 | December 2020 Form 10-K |
| | | | | |
| |
| Notes to Consolidated Financial Statements | |
the acquirer’s funds are insufficient at the completion date of the transaction. These arrangements generally cover the time frame from the transaction offer date to its closing date and, therefore, are generally short term in nature. The Firm believes the likelihood of any payment by the Firm under these arrangements is remote given the level of its due diligence in its role as investment banking advisor.
In addition, in the ordinary course of business, the Firm guarantees the debt and/or certain trading obligations (including obligations associated with derivatives, foreign exchange contracts and the settlement of physical commodities) of certain subsidiaries. These guarantees generally are entity or product specific and are required by investors or trading counterparties. The activities of the Firm’s subsidiaries covered by these guarantees (including any related debt or trading obligations) are included in the financial statements.
Contingencies
Legal
In addition to the matters described in the following paragraphs, in the normal course of business, the Firm has been named, from time to time, as a defendant in various legal actions, including arbitrations, class actions and other litigation, arising in connection with its activities as a global diversified financial services institution. Certain of the actual or threatened legal actions include claims for substantial compensatory and/or punitive damages or claims for indeterminate amounts of damages. In some cases, the entities that would otherwise be the primary defendants in such cases are bankrupt or are in financial distress. These actions have included, but are not limited to, residential mortgage and credit crisis-related matters.
While the Firm has identified below any individual proceedings where the Firm believes a material loss to be reasonably possible and reasonably estimable, there can be no assurance that material losses will not be incurred from claims that have not yet been asserted or those where potential losses have not yet been determined to be probable or possible, and reasonably estimable.
The Firm contests liability and/or the amount of damages as appropriate in each pending matter. Where available information indicates that it is probable a liability had been incurred at the date of the financial statements and the Firm can reasonably estimate the amount of that loss, the Firm accrues the estimated loss by a charge to income.
| | | | | | | | | | | |
| $ in millions | 2020 | 2019 | 2018 |
| Legal expenses | $ | 336 | | $ | 221 | | $ | 206 | |
The Firm’s legal expenses can, and may in the future, fluctuate from period to period, given the current environment regarding government investigations and private litigation affecting global financial services firms, including the Firm.
In many proceedings and investigations, however, it is inherently difficult to determine whether any loss is probable or even possible or to estimate the amount of any loss. In addition, even where a loss is possible or an exposure to loss exists in excess of the liability already accrued with respect to a previously recognized loss contingency, it is not always possible to reasonably estimate the size of the possible loss or range of loss, particularly for proceedings and investigations where the factual record is being developed or contested or where plaintiffs or government entities seek substantial or indeterminate damages, restitution, disgorgement or penalties. Numerous issues may need to be resolved before a loss or additional loss, or range of loss or additional range of loss, can be reasonably estimated for a proceeding or investigation, including through potentially lengthy discovery and determination of important factual matters, determination of issues related to class certification and the calculation of damages or other relief, and by addressing novel or unsettled legal questions relevant to the proceedings or investigations in question.
For certain other legal proceedings and investigations, the Firm can estimate reasonably possible losses, additional losses, ranges of loss or ranges of additional loss in excess of amounts accrued but does not believe, based on current knowledge and after consultation with counsel, that such losses could have a material adverse effect on the Firm’s financial statements as a whole, other than the matters referred to in the following paragraphs.
On July 15, 2010, China Development Industrial Bank (“CDIB”) filed a complaint against the Firm, styled China Development Industrial Bank v. Morgan Stanley & Co. Incorporated et al., which is pending in the Supreme Court of the State of New York, New York County (“Supreme Court of NY”). The complaint relates to a $275 million CDS referencing the super senior portion of the STACK 2006-1 CDO. The complaint asserts claims for common law fraud, fraudulent inducement and fraudulent concealment and alleges that the Firm misrepresented the risks of the STACK 2006-1 CDO to CDIB, and that the Firm knew that the assets backing the CDO were of poor quality when it entered into the CDS with CDIB. The complaint seeks compensatory damages related to the approximately $228 million that CDIB alleges it has already lost under the CDS, rescission of CDIB’s obligation to pay an additional $12 million, punitive damages, equitable relief, fees and costs. On February 28, 2011, the court denied the Firm’s motion to dismiss the complaint. On December 21, 2018, the court denied the Firm’s motion for summary judgment and granted in part the Firm’s motion for sanctions relating to spoliation of evidence. On January 18, 2019, CDIB filed a motion to clarify and resettle the portion of the court’s December 21, 2018 order granting spoliation sanctions. On January 24, 2019, CDIB filed a notice of appeal from the court’s December 21, 2018 order, and the Firm filed a notice of appeal from the same order. On March 7, 2019, the court denied the relief sought by CDIB in its January 18, 2019 motion. On May 21, 2020, the Appellate Division, First Department (“First Department”),
| | | | | | | | |
| December 2020 Form 10-K | 128 | |
| | | | | |
| |
| Notes to Consolidated Financial Statements | |
modified the Supreme Court of NY’s order to deny the Firm’s motion for sanctions relating to spoliation of evidence and otherwise affirmed the denial of the Firm’s motion for summary judgment. On June 19, 2020, the Firm moved for leave to appeal the First Department’s decision to the New York Court of Appeals (“Court of Appeals”), which the First Department denied on July 24, 2020. Based on currently available information, the Firm believes it could incur a loss in this action of up to approximately $240 million plus pre- and post-judgment interest, fees and costs.
On September 23, 2014, Financial Guaranty Insurance Company (“FGIC”) filed a complaint against the Firm in the Supreme Court of NY styled Financial Guaranty Insurance Company v. Morgan Stanley ABS Capital I Inc. et al. relating to the Morgan Stanley ABS Capital I Inc. Trust 2007-NC4. The complaint asserts claims for breach of contract and fraudulent inducement and alleges, among other things, that the loans in the trust breached various representations and warranties and defendants made untrue statements and material omissions to induce FGIC to issue a financial guaranty policy on certain classes of certificates that had an original balance of approximately $876 million. The complaint seeks, among other relief, specific performance of the loan breach remedy procedures in the transaction documents, compensatory, consequential and punitive damages, attorneys’ fees, interest and costs. On January 23, 2017, the court denied the Firm’s motion to dismiss the complaint. On February 24, 2017, the Firm filed a notice of appeal of the denial of its motion to dismiss the complaint and perfected its appeal on November 22, 2017. On September 13, 2018, the First Department affirmed in part and reversed in part the lower court’s order denying the Firm’s motion to dismiss the complaint. On December 20, 2018, the First Department denied plaintiff’s motion for leave to appeal to the Court of Appeals or, in the alternative, for re-argument. Based on currently available information, the Firm believes that it could incur a loss in this action of up to approximately $277 million, the total original unpaid balance of the mortgage loans for which the Firm received repurchase demands from a certificate holder and FGIC that the Firm did not repurchase, plus pre- and post- judgment interest, fees and costs, as well as claim payments that FGIC has made and will make in the future. In addition, plaintiff is seeking to expand the number of loans at issue and the possible range of loss could increase.
On January 23, 2015, Deutsche Bank National Trust Company, in its capacity as trustee, filed a complaint against the Firm styled Deutsche Bank National Trust Company solely in its capacity as Trustee of the Morgan Stanley ABS Capital I Inc. Trust 2007-NC4 v. Morgan Stanley Mortgage Capital Holdings LLC as Successor-by-Merger to Morgan Stanley Mortgage Capital Inc., and Morgan Stanley ABS Capital I Inc., pending in the Supreme Court of NY. The complaint asserts claims for breach of contract and alleges, among other things, that the loans in the trust, which had an original principal balance of approximately $1.05 billion,
breached various representations and warranties. The complaint seeks, among other relief, specific performance of the loan breach remedy procedures in the transaction documents, compensatory, consequential, rescissory, equitable and punitive damages, attorneys’ fees, costs and other related expenses, and interest. On December 11, 2015, the court granted in part and denied in part the Firm’s motion to dismiss the complaint. On October 19, 2018, the court granted the Firm’s motion for leave to amend its answer and to stay the case pending resolution of Deutsche Bank National Trust Company’s appeal to the Court of Appeals in another case, styled Deutsche Bank National Trust Company v. Barclays Bank PLC, regarding the applicable statute of limitations. On January 17, 2019, the First Department reversed the trial court’s order to the extent that it had granted in part the Firm’s motion to dismiss the complaint. On June 4, 2019, the First Department granted the Firm’s motion for leave to appeal its January 17, 2019 decision to the Court of Appeals. On March 19, 2020, the Firm filed a motion for partial summary judgment. Based on currently available information, the Firm believes that it could incur a loss in this action of up to approximately $277 million, the total original unpaid balance of the mortgage loans for which the Firm received repurchase demands from a certificate holder and a monoline insurer that the Firm did not repurchase, plus pre- and post-judgment interest, fees and costs, but plaintiff is seeking to expand the number of loans at issue and the possible range of loss could increase.
Tax
In matters styled Case number 15/3637 and Case number 15/4353, the Dutch Tax Authority (“Dutch Authority”) is challenging in the Dutch courts, the prior set-off by the Firm of approximately €124 million (approximately $152 million) plus accrued interest of withholding tax credits against the Firm’s corporation tax liabilities for the tax years 2007 to 2013. The Dutch Authority alleges that the Firm was not entitled to receive the withholding tax credits on the basis, inter alia, that a Firm subsidiary did not hold legal title to certain securities subject to withholding tax on the relevant dates. The Dutch Authority has also alleged that the Firm failed to provide certain information to the Dutch Authority and keep adequate books and records. On April 26, 2018, the District Court in Amsterdam issued a decision dismissing the Dutch Authority’s claims with respect to certain of the tax years in dispute. On May 12, 2020, the Court of Appeal in Amsterdam granted the Dutch Authority’s appeal in matters re-styled Case number 18/00318 and Case number 18/00319. On June 22, 2020, the Firm filed an appeal against the decision of the Court of Appeal in Amsterdam before the Dutch High Court.
| | | | | | | | |
| 129 | December 2020 Form 10-K |
| | | | | |
| |
| Notes to Consolidated Financial Statements | |
16. Variable Interest Entities and Securitization Activities
Overview
The Firm is involved with various SPEs in the normal course of business. In most cases, these entities are deemed to be VIEs.
The Firm’s variable interests in VIEs include debt and equity interests, commitments, guarantees, derivative instruments and certain fees. The Firm’s involvement with VIEs arises primarily from:
•Interests purchased in connection with market-making activities, securities held in its Investment securities portfolio and retained interests held as a result of securitization activities, including re-securitization transactions.
•Guarantees issued and residual interests retained in connection with municipal bond securitizations.
•Loans made to and investments in VIEs that hold debt, equity, real estate or other assets.
•Derivatives entered into with VIEs.
•Structuring of CLNs or other asset-repackaging notes designed to meet the investment objectives of clients.
•Other structured transactions designed to provide tax-efficient yields to the Firm or its clients.
The Firm determines whether it is the primary beneficiary of a VIE upon its initial involvement with the VIE and reassesses whether it is the primary beneficiary on an ongoing basis as long as it has any continuing involvement with the VIE. This determination is based upon an analysis of the design of the VIE, including the VIE’s structure and activities, the power to make significant economic decisions held by the Firm and by other parties, and the variable interests owned by the Firm and other parties.
The power to make the most significant economic decisions may take a number of different forms in different types of VIEs. The Firm considers servicing or collateral management decisions as representing the power to make the most significant economic decisions in transactions such as securitizations or CDOs. As a result, the Firm does not consolidate securitizations or CDOs for which it does not act as the servicer or collateral manager unless it holds certain other rights to replace the servicer or collateral manager or to require the liquidation of the entity. If the Firm serves as servicer or collateral manager, or has certain other rights described in the previous sentence, the Firm analyzes the interests in the VIE that it holds and consolidates only those VIEs for which it holds a potentially significant interest in the VIE.
For many transactions, such as re-securitization transactions, CLNs and other asset-repackaging notes, there are no significant economic decisions made on an ongoing basis. In these cases, the Firm focuses its analysis on decisions made
prior to the initial closing of the transaction and at the termination of the transaction. The Firm concluded in most of these transactions that decisions made prior to the initial closing were shared between the Firm and the initial investors based upon the nature of the assets, including whether the assets were issued in a transaction sponsored by the Firm and the extent of the information available to the Firm and to investors, the number, nature and involvement of investors, other rights held by the Firm and investors, the standardization of the legal documentation and the level of continuing involvement by the Firm, including the amount and type of interests owned by the Firm and by other investors. The Firm focused its control decision on any right held by the Firm or investors related to the termination of the VIE. Most re-securitization transactions, CLNs and other asset-repackaging notes have no such termination rights.
Consolidated VIE Assets and Liabilities by Type of Activity
| | | | | | | | | | | | | | |
| | At December 31, 2020 | At December 31, 2019 |
| $ in millions | VIE Assets | VIE Liabilities | VIE Assets | VIE Liabilities |
| OSF | $ | 551 | | $ | 350 | | $ | 696 | | $ | 391 | |
MABS1 | 590 | | 17 | | 265 | | 4 | |
Other2 | 977 | | 47 | | 987 | | 66 | |
| Total | $ | 2,118 | | $ | 414 | | $ | 1,948 | | $ | 461 | |
OSF—Other structured financings
1.Amounts include transactions backed by residential mortgage loans, commercial mortgage loans and other types of assets, including consumer or commercial assets and may be in loan or security form. The value of assets is determined based on the fair value of the liabilities and the interests owned by the Firm in such VIEs as the fair values for the liabilities and interests owned are more observable.
2.Other primarily includes operating entities, investment funds and structured transactions.
Consolidated VIE Assets and Liabilities by Balance Sheet Caption
| | | | | | | | |
| $ in millions | At December 31, 2020 | At December 31, 2019 |
| Assets | | |
| Cash and cash equivalents | $ | 269 | | $ | 488 | |
| | |
| | |
| Trading assets at fair value | 1,445 | | 943 | |
| Customer and other receivables | 23 | | 18 | |
| Intangible assets | 98 | | 111 | |
| Other assets | 283 | | 388 | |
| Total | $ | 2,118 | | $ | 1,948 | |
| Liabilities | | |
| Other secured financings | $ | 366 | | $ | 422 | |
| Other liabilities and accrued expenses | 48 | | 39 | |
| Total | $ | 414 | | $ | 461 | |
| Noncontrolling interests | $ | 196 | | $ | 192 | |
Consolidated VIE assets and liabilities are presented in the previous tables after intercompany eliminations. Generally, most assets owned by consolidated VIEs cannot be removed unilaterally by the Firm and are not available to the Firm while the related liabilities issued by consolidated VIEs are non-recourse to the Firm. However, in certain consolidated VIEs, the Firm either has the unilateral right to remove assets or provides additional recourse through derivatives such as total return swaps, guarantees or other forms of involvement.
| | | | | | | | |
| December 2020 Form 10-K | 130 | |
| | | | | |
| |
| Notes to Consolidated Financial Statements | |
In general, the Firm’s exposure to loss in consolidated VIEs is limited to losses that would be absorbed on the VIE net assets recognized in its financial statements, net of amounts absorbed by third-party variable interest holders.
Non-consolidated VIEs
| | | | | | | | | | | | | | | | | |
| | At December 31, 2020 |
| $ in millions | MABS1 | CDO | MTOB | OSF | Other2 |
| VIE assets (UPB) | $ | 184,153 | | $ | 3,527 | | $ | 6,524 | | $ | 2,161 | | $ | 48,241 | |
Maximum exposure to loss3 | | |
Debt and equity interests | $ | 26,247 | | $ | 257 | | $ | — | | $ | 1,187 | | $ | 11,008 | |
Derivative and other contracts | — | | — | | 4,425 | | — | | 5,639 | |
| Commitments, guarantees and other | 929 | | — | | — | | — | | 749 | |
| Total | $ | 27,176 | | $ | 257 | | $ | 4,425 | | $ | 1,187 | | $ | 17,396 | |
| Carrying value of variable interests—Assets | | |
Debt and equity interests | $ | 26,247 | | $ | 257 | | $ | — | | $ | 1,187 | | $ | 11,008 | |
Derivative and other contracts | — | | — | | 5 | | — | | 851 | |
| Total | $ | 26,247 | | $ | 257 | | $ | 5 | | $ | 1,187 | | $ | 11,859 | |
Additional VIE assets owned4 | $ | 20,019 | |
| Carrying value of variable interests—Liabilities | | |
Derivative and other contracts | $ | — | | $ | — | | $ | — | | $ | — | | $ | 222 | |
| | | | | |
| | | | | |
| | | | | | | | | | | | | | | | | |
| | At December 31, 2019 |
| $ in millions | MABS1 | CDO | MTOB | OSF | Other2 |
| VIE assets (UPB) | $ | 125,603 | | $ | 2,976 | | $ | 6,965 | | $ | 2,288 | | $ | 51,305 | |
Maximum exposure to loss3 | | |
Debt and equity interests | $ | 16,314 | | $ | 240 | | $ | — | | $ | 1,009 | | $ | 11,977 | |
Derivative and other contracts | — | | — | | 4,599 | | — | | 2,995 | |
Commitments, guarantees and other | 631 | | — | | — | | — | | 266 | |
| Total | $ | 16,945 | | $ | 240 | | $ | 4,599 | | $ | 1,009 | | $ | 15,238 | |
| Carrying value of variable interests—Assets | | |
Debt and equity interests | $ | 16,314 | | $ | 240 | | $ | — | | $ | 1,008 | | $ | 11,977 | |
Derivative and other contracts | — | | — | | 6 | | — | | 388 | |
| Total | $ | 16,314 | | $ | 240 | | $ | 6 | | $ | 1,008 | | $ | 12,365 | |
Additional VIE assets owned4 | $ | 11,453 | |
| Carrying value of variable interests—Liabilities | | |
Derivative and other contracts | $ | — | | $ | — | | $ | — | | $ | — | | $ | 444 | |
| | | | | |
MTOB—Municipal tender option bonds
1.Amounts include transactions backed by residential mortgage loans, commercial mortgage loans and other types of assets, including consumer or commercial assets. and may be in loan or security form.
2.Other primarily includes exposures to commercial real estate property and investment funds.
3.Where notional amounts are utilized in quantifying the maximum exposure related to derivatives, such amounts do not reflect changes in fair value recorded by the Firm.
4.Additional VIE assets owned represents the carrying value of total exposure to non-consolidated VIEs for which the maximum exposure to loss is less than specific thresholds, primarily interests issued by securitization SPEs. The Firm’s maximum exposure to loss generally equals the fair value of the assets owned. These assets are primarily included in Trading assets and Investment securities and are measured at fair value (see Note 5). The Firm does not provide additional support in these transactions through contractual facilities, guarantees or similar derivatives.
The majority of the VIEs included in the previous tables are sponsored by unrelated parties; examples of the Firm’s involvement with these VIEs include its secondary market-making activities and the securities held in its Investment securities portfolio (see Note 8).
The Firm’s maximum exposure to loss is dependent on the nature of the Firm’s variable interest in the VIE and is limited to the notional amounts of certain liquidity facilities and other credit support, total return swaps and written put options, as well as the fair value of certain other derivatives and investments the Firm has made in the VIE.
The Firm’s maximum exposure to loss in the previous tables does not include the offsetting benefit of hedges or any reductions associated with the amount of collateral held as part of a transaction with the VIE or any party to the VIE directly against a specific exposure to loss.
Liabilities issued by VIEs generally are non-recourse to the Firm.
Detail of Mortgage- and Asset-Backed Securitization Assets
| | | | | | | | | | | | | | |
| | At December 31, 2020 | At December 31, 2019 |
| $ in millions | UPB | Debt and
Equity
Interests | UPB | Debt and
Equity
Interests |
| Residential mortgages | $ | 17,775 | | $ | 3,175 | | $ | 30,353 | | $ | 3,993 | |
| Commercial mortgages | 62,093 | | 4,131 | | 53,892 | | 3,881 | |
U.S. agency collateralized
mortgage obligations | 99,182 | | 17,224 | | 36,366 | | 6,365 | |
Other consumer or commercial loans | 5,103 | | 1,717 | | 4,992 | | 2,075 | |
| Total | $ | 184,153 | | $ | 26,247 | | $ | 125,603 | | $ | 16,314 | |
Securitization Activities
In a securitization transaction, the Firm transfers assets (generally commercial or residential mortgage loans or securities) to an SPE, sells to investors most of the beneficial interests, such as notes or certificates, issued by the SPE, and, in many cases, retains other beneficial interests. The purchase of the transferred assets by the SPE is financed through the sale of these interests.
In many securitization transactions involving commercial mortgage loans, the Firm transfers a portion of the assets to the SPE with unrelated parties transferring the remaining assets. In addition, mainly in securitization transactions involving residential mortgage loans, the Firm may also enter into derivative transactions, primarily interest rate swaps or interest rate caps, with the SPE.
Although not obligated, the Firm generally makes a market in the securities issued by SPEs in securitization transactions. As a market maker, the Firm offers to buy these securities from, and sell these securities to, investors. Securities purchased through these market-making activities are not considered to be retained interests; these beneficial interests generally are included in Trading assets—Corporate and other debt and are measured at fair value.
The Firm enters into derivatives, generally interest rate swaps and interest rate caps, with a senior payment priority in many securitization transactions. The risks associated with these and similar derivatives with SPEs are essentially the same as similar derivatives with non-SPE counterparties and are
| | | | | | | | |
| 131 | December 2020 Form 10-K |
| | | | | |
| |
| Notes to Consolidated Financial Statements | |
managed as part of the Firm’s overall exposure. See Note 7 for further information on derivative instruments and hedging activities.
Investment Securities
The Firm holds securities issued by VIEs within the Investment securities portfolio. These securities are composed of those related to transactions sponsored by the federal mortgage agencies and predominantly the most senior securities issued by VIEs backed by student loans and commercial mortgage loans. Transactions sponsored by the federal mortgage agencies include an explicit or implicit guarantee provided by the U.S. government. Additionally, the Firm holds certain commercial mortgage-backed securities issued by VIEs retained as a result of the Firm's securitization activities. See Note 8 for further information on the Investment securities portfolio.
Municipal Tender Option Bond Trusts
In a municipal tender option bond trust transaction, the client transfers a municipal bond to a trust. The trust issues short-term securities that the Firm, as the remarketing agent, sells to investors. The client generally retains a residual interest. The short-term securities are supported by a liquidity facility pursuant to which the investors may put their short-term interests. In most programs, a third-party provider will provide such liquidity facility; in some programs, the Firm provides this liquidity facility.
The Firm may, in lieu of purchasing short-term securities for remarketing, decide to extend a temporary loan to the trust. The client can generally terminate the transaction at any time. The liquidity provider can generally terminate the transaction upon the occurrence of certain events. When the transaction is terminated, the municipal bond is generally sold or returned to the client. Any losses suffered by the liquidity provider upon the sale of the bond are the responsibility of the client. This obligation is generally collateralized. Liquidity facilities provided to municipal tender option bond trusts are classified as derivatives. The Firm consolidates any municipal tender option bond trusts in which it holds the residual interest.
Credit Protection Purchased through Credit-Linked Notes
CLN transactions are designed to provide investors with exposure to certain credit risk on referenced assets. In these transactions, the Firm transfers assets (generally high-quality securities or money market investments) to an SPE, enters into a derivative transaction in which the SPE sells protection on an unrelated referenced asset or group of assets, through a credit derivative, and sells the securities issued by the SPE to investors. In some transactions, the Firm may also enter into interest rate or currency swaps with the SPE. Depending on the structure, the assets and liabilities of the SPE may be consolidated and recognized in the Firm’s balance sheets or accounted for as a sale of assets.
Upon the occurrence of a credit event related to the referenced asset, the SPE will deliver securities collateral as payment to the Firm, which exposes the Firm to changes in the collateral’s value.
Derivative payments by the SPE are collateralized. The risks associated with these and similar derivatives with SPEs are essentially the same as those with non-SPE counterparties and are managed as part of the Firm’s overall exposure.
Other Structured Financings
The Firm invests in interests issued by entities that develop and own low-income communities (including low-income housing projects) and entities that construct and own facilities that will generate energy from renewable resources. The interests entitle the Firm to a share of tax credits and tax losses generated by these projects. In addition, the Firm has issued guarantees to investors in certain low-income housing funds. The guarantees are designed to return an investor’s contribution to a fund and the investor’s share of tax losses and tax credits expected to be generated by the fund. The Firm is also involved with entities designed to provide tax-efficient yields to the Firm or its clients.
Collateralized Loan and Debt Obligations
CLOs and CDOs are SPEs that purchase a pool of assets consisting of corporate loans, corporate bonds, ABS or synthetic exposures on similar assets through derivatives, and issue multiple tranches of debt and equity securities to investors. The Firm underwrites the securities issued in certain CLO transactions on behalf of unaffiliated sponsors and provides advisory services to these unaffiliated sponsors. The Firm sells corporate loans to many of these SPEs, in some cases representing a significant portion of the total assets purchased. Although not obligated, the Firm generally makes a market in the securities issued by SPEs in these transactions and may retain unsold securities. These beneficial interests are included in Trading assets and are measured at fair value.
Equity-Linked Notes
ELN transactions are designed to provide investors with exposure to certain risks related to the specific equity security, equity index or other index. In an ELN transaction, the Firm typically transfers to an SPE either a note issued by the Firm, the payments on which are linked to the performance of a specific equity security, equity index or other index, or debt securities issued by other companies and a derivative contract, the terms of which will relate to the performance of a specific equity security, equity index or other index. These ELN transactions with SPEs were not consolidated at December 31, 2020 or December 31, 2019.
| | | | | | | | |
| December 2020 Form 10-K | 132 | |
| | | | | |
| |
| Notes to Consolidated Financial Statements | |
Transferred Assets with Continuing Involvement
| | | | | | | | | | | | | | |
| | At December 31, 2020 |
| $ in millions | RML | CML | U.S. Agency
CMO | CLN and Other1 |
SPE assets (UPB)2 | $ | 7,515 | | $ | 84,674 | | $ | 21,061 | | $ | 12,978 | |
| Retained interests |
| Investment grade | $ | 49 | | $ | 822 | | $ | 615 | | $ | — | |
| Non-investment grade | 16 | | 195 | | — | | 114 | |
| Total | $ | 65 | | $ | 1,017 | | $ | 615 | | $ | 114 | |
| Interests purchased in the secondary market |
| Investment grade | $ | — | | $ | 96 | | $ | 116 | | $ | — | |
| Non-investment grade | 43 | | 80 | | — | | 21 | |
| Total | $ | 43 | | $ | 176 | | $ | 116 | | $ | 21 | |
| Derivative assets | $ | — | | $ | — | | $ | — | | $ | 400 | |
| Derivative liabilities | — | | — | | — | | 436 | |
| | | | | | | | | | | | | | |
| | December 31, 2019 |
| $ in millions | RML | CML | U.S. Agency
CMO | CLN and Other1 |
SPE assets (UPB)2 | $ | 9,850 | | $ | 86,203 | | $ | 19,132 | | $ | 8,410 | |
| Retained interests |
| Investment grade | $ | 29 | | $ | 720 | | $ | 2,376 | | $ | 1 | |
| Non-investment grade | 17 | | 254 | | — | | 92 | |
| Total | $ | 46 | | $ | 974 | | $ | 2,376 | | $ | 93 | |
| Interests purchased in the secondary market |
| Investment grade | $ | 6 | | $ | 197 | | $ | 77 | | $ | — | |
| Non-investment grade | 75 | | 51 | | — | | — | |
| Total | $ | 81 | | $ | 248 | | $ | 77 | | $ | — | |
| Derivative assets | $ | — | | $ | — | | $ | — | | $ | 339 | |
| Derivative liabilities | — | | — | | — | | 145 | |
| | | | | | | | | | | |
| | Fair Value at December 31, 2020 |
| $ in millions | Level 2 | Level 3 | Total |
| Retained interests | | | |
| Investment grade | $ | 663 | | $ | — | | $ | 663 | |
| Non-investment grade | 6 | | 63 | | 69 | |
| Total | $ | 669 | | $ | 63 | | $ | 732 | |
| Interests purchased in the secondary market |
| Investment grade | $ | 196 | | $ | 16 | | $ | 212 | |
| Non-investment grade | 62 | | 82 | | 144 | |
| Total | $ | 258 | | $ | 98 | | $ | 356 | |
| Derivative assets | $ | 388 | | $ | 12 | | $ | 400 | |
| Derivative liabilities | 435 | | 1 | | 436 | |
| | | | | | | | | | | |
| | Fair Value at December 31, 2019 |
| $ in millions | Level 2 | Level 3 | Total |
| Retained interests | | | |
| Investment grade | $ | 2,401 | | $ | 4 | | $ | 2,405 | |
| Non-investment grade | 6 | | 97 | | 103 | |
| Total | $ | 2,407 | | $ | 101 | | $ | 2,508 | |
| Interests purchased in the secondary market |
| Investment grade | $ | 278 | | $ | 2 | | $ | 280 | |
| Non-investment grade | 68 | | 58 | | 126 | |
| Total | $ | 346 | | $ | 60 | | $ | 406 | |
| Derivative assets | $ | 337 | | $ | 2 | | $ | 339 | |
| Derivative liabilities | 144 | | 1 | | 145 | |
RML—Residential mortgage loans
CML—Commercial mortgage loans
1.Amounts include CLO transactions managed by unrelated third parties.
2.Amounts include assets transferred by unrelated transferors.
The previous tables include transactions with SPEs in which the Firm, acting as principal, transferred financial assets with continuing involvement and received sales treatment. The
transferred assets are carried at fair value prior to securitization, and any changes in fair value are recognized in the income statements. The Firm may act as underwriter of the beneficial interests issued by these securitization vehicles, for which Investment banking revenues are recognized. The Firm may retain interests in the securitized financial assets as one or more tranches of the securitization. These retained interests are generally carried at fair value in the balance sheets with changes in fair value recognized in the income statements. Fair value for these interests is measured using techniques that are consistent with the valuation techniques applied to the Firm’s major categories of assets and liabilities as described in Notes 2 and 5. Further, as permitted by applicable guidance, certain transfers of assets where the Firm’s only continuing involvement is a derivative are only reported in the following Assets Sold with Retained Exposure table.
Proceeds from New Securitization Transactions and Sales of Loans
| | | | | | | | | | | |
| $ in millions | 2020 | 2019 | 2018 |
New transactions1 | $ | 51,814 | | $ | 34,464 | | $ | 23,821 | |
| Retained interests | 9,346 | | 7,403 | | 2,904 | |
Sales of corporate loans to CLO SPEs1, 2 | 763 | | 2 | | 317 | |
1.Net gains on new transactions and sales of corporate loans to CLO entities at the time of the sale were not material for all periods presented.
2.Sponsored by non-affiliates.
The Firm has provided, or otherwise agreed to be responsible for, representations and warranties regarding certain assets transferred in securitization transactions sponsored by the Firm (see Note 15).
Assets Sold with Retained Exposure
| | | | | | | | |
| $ in millions | At
December 31,
2020 | At
December 31,
2019 |
Gross cash proceeds from sale of assets1 | $ | 45,051 | | $ | 38,661 | |
| Fair value | | |
| Assets sold | $ | 46,609 | | $ | 39,137 | |
| Derivative assets recognized in the balance sheets | 1,592 | | 647 | |
| Derivative liabilities recognized in the balance sheets | 64 | | 152 | |
1.The carrying value of assets derecognized at the time of sale approximates gross cash proceeds.
The Firm enters into transactions in which it sells securities, primarily equities, and contemporaneously enters into bilateral OTC derivatives with the purchasers of the securities, through which it retains exposure to the sold securities.
17. Regulatory Requirements
Regulatory Capital Framework
The Firm is an FHC under the Bank Holding Company Act of 1956, as amended, and is subject to the regulation and oversight of the Board of Governors of the Federal Reserve System (“Federal Reserve”). The Federal Reserve establishes
| | | | | | | | |
| 133 | December 2020 Form 10-K |
| | | | | |
| |
| Notes to Consolidated Financial Statements | |
capital requirements for the Firm, including well-capitalized standards, and evaluates the Firm’s compliance with such capital requirements. The OCC establishes similar capital requirements and standards for the Firm’s U.S. bank subsidiaries including, among others, MSBNA and MSPBNA. The regulatory capital requirements are largely based on the Basel III capital standards established by the Basel Committee on Banking Supervision and also implement certain provisions of the Dodd-Frank Wall Street Reform and Consumer Protection Act.
Regulatory Capital Requirements
The Firm is required to maintain minimum risk-based and leverage-based capital ratios under regulatory capital requirements. A summary of the calculations of regulatory capital and RWA follows.
Minimum risk-based capital ratio requirements apply to Common Equity Tier 1 capital, Tier 1 capital and Total capital (which includes Tier 2 capital). Capital standards require certain adjustments to, and deductions from, capital for purposes of determining these ratios.
In 2020, the U.S. banking agencies adopted a final rule, consistent with an interim final rule that was effective March 31, 2020, altering, for purposes of the regulatory capital rules, the required adoption time period for CECL. As of December 31, 2020, the risk-based and leverage-based capital amounts and ratios, as well as RWA, adjusted average assets and supplementary leverage exposure are calculated excluding the effect of the adoption of CECL based on the Firm’s election to defer this effect over a five-year transition period in accordance with the interim final rule.
Risk-Based Regulatory Capital Ratio Requirements
| | | | | | | | | | | | | | |
| | At
December 31,
2020 | At
December 31,
2019 |
| | Standardized | Advanced | Standardized and Advanced |
| Capital buffers | | | | |
Capital conservation buffer | — | | 2.5 | % | 2.5 | % |
| Stress capital buffer (“SCB”) | 5.7 | % | N/A | N/A |
| G-SIB capital surcharge | 3.0 | % | 3.0 | % | 3.0 | % |
CCyB1 | 0% | 0% | 0% |
Capital buffer requirement2 | 8.7 | % | 5.5 | % | 5.5 | % |
| | | |
| | | | |
| | | | |
| | | | |
| | | | |
| | | | |
| | | | | | | | | | | | | | |
| | | |
| | | | |
| | | | |
| | | |
| | | |
| | | |
| | | |
| | | |
| | At
December 31,
2020 | At
December 31,
2019 |
| Regulatory Minimum | Standardized | Advanced | Standardized and Advanced |
Required ratios3 | | | | |
| Common Equity Tier 1 capital ratio | 4.5 | % | 13.2 | % | 10.0 | % | 10.0 | % |
| Tier 1 capital ratio | 6.0 | % | 14.7 | % | 11.5 | % | 11.5 | % |
| Total capital ratio | 8.0 | % | 16.7 | % | 13.5 | % | 13.5 | % |
1.The CCyB can be set up to 2.5%, but is currently set by the U.S. banking agencies at zero.
2.The capital buffer requirement represents the amount of Common Equity Tier 1 capital the Firm must maintain above the minimum risk-based capital requirements in order to avoid restrictions on the Firm’s ability to make capital distributions, including the payment of dividends and the repurchase of stock, and to pay discretionary bonuses to executive officers. Beginning October 1, 2020, the Firm’s Standardized Approach capital buffer requirement is equal to the sum of the SCB, G-SIB capital surcharge and CCyB, and the Advanced Approach capital buffer requirement is equal to the 2.5% capital conservation buffer, G-SIB capital surcharge and CCyB.
3.Required ratios represent the regulatory minimum plus the capital buffer requirement.
Risk-Weighted Assets
RWA reflects both the Firm’s on- and off-balance sheet risk, as well as capital charges attributable to the risk of loss arising from the following:
•Credit risk: The failure of a borrower, counterparty or issuer to meet its financial obligations to the Firm;
•Market risk: Adverse changes in the level of one or more market prices, rates, indices, volatilities, correlations or other market factors, such as market liquidity; and
•Operational risk: Inadequate or failed processes or systems, from human factors or from external events (e.g., fraud, theft, legal and compliance risks, cyber attacks or damage to physical assets).
The Firm’s risk-based capital ratios are computed under both (i) the standardized approaches for calculating credit risk and market risk RWA (“Standardized Approach”) and (ii) the applicable advanced approaches for calculating credit risk, market risk and operational risk RWA (“Advanced Approach”). The credit risk RWA calculations between the two approaches differ in that the Standardized Approach requires calculation of RWA using prescribed risk weights, whereas the Advanced Approach utilizes models to calculate exposure amounts and risk weights. At December 31, 2020 and December 31, 2019, the differences between the actual and required ratio were lower under the Standardized Approach.
Minimum leverage-based capital requirements include a Tier 1 leverage ratio and an SLR. The Firm is required to maintain a Tier 1 SLR of 5%, inclusive of an enhanced SLR capital buffer of at least 2%.
| | | | | | | | |
| December 2020 Form 10-K | 134 | |
| | | | | |
| |
| Notes to Consolidated Financial Statements | |
The Firm’s Regulatory Capital and Capital Ratios
| | | | | | | | | | | |
| | At December 31, 2020 |
| $ in millions | Required Ratio1 | Amount | Ratio |
| Risk-based capital | | | |
| Common Equity Tier 1 capital | 13.2 | % | $ | 78,650 | | 17.4 | % |
| Tier 1 capital | 14.7 | % | 88,079 | | 19.4 | % |
| Total capital | 16.7 | % | 97,213 | | 21.5 | % |
| Total RWA | | 453,106 | | |
| | | |
| | | |
| | | |
| | | |
| | | |
| | | | | | | | | | | |
| |
| $ in millions | | Required Ratio1 | At December 31, 2020 |
| | | |
| | | |
| | | |
| | | |
| | | |
| Leverage-based capital | | | |
Adjusted average assets2 | | | $ | 1,053,310 | |
| Tier 1 leverage ratio | | 4.0 | % | 8.4 | % |
Supplementary leverage exposure3, 4 | | | $ | 1,192,506 | |
SLR3 | | 5.0 | % | 7.4 | % |
| | | | | | | | | | | |
| | At December 31, 2019 |
| $ in millions | Required Ratio1 | Amount | Ratio |
| Risk-based capital | | | |
| Common Equity Tier 1 capital | 10.0 | % | $ | 64,751 | | 16.4 | % |
| Tier 1 capital | 11.5 | % | 73,443 | | 18.6 | % |
| Total capital | 13.5 | % | 82,708 | | 21.0 | % |
| Total RWA | | 394,177 | | |
| | | |
| | | |
| | | |
| | | |
| | | |
| | | | | | | | | | | |
| |
| $ in millions | | Required Ratio1 | At December 31, 2019 |
| | | |
| | | |
| | | |
| | | |
| | | |
| Leverage-based capital | | | |
Adjusted average assets2 | | | $ | 889,195 | |
| Tier 1 leverage ratio | | 4.0 | % | 8.3 | % |
Supplementary leverage exposure4 | | | $ | 1,155,177 | |
| SLR | | 5.0 | % | 6.4 | % |
1.Required ratios are inclusive of any buffers applicable as of the date presented. Failure to maintain the buffers would result in restrictions on the Firm’s ability to make capital distributions, including the payment of dividends and the repurchase of stock, and to pay discretionary bonuses to executive officers.
2.Adjusted average assets represents the denominator of the Tier 1 leverage ratio and is composed of the average daily balance of consolidated on-balance sheet assets for the quarters ending on the respective balance sheet dates, reduced by disallowed goodwill, intangible assets, investments in covered funds, defined benefit pension plan assets, after-tax gain on sale from assets sold into securitizations, investments in the Firm’s own capital instruments, certain defined tax assets and other capital deductions.
3.Based on a Federal Reserve interim final rule in effect until March 31, 2021, the Firm’s SLR and Supplementary leverage exposure as of December 31, 2020 reflect the exclusion of U.S. Treasury securities and deposits at Federal Reserve Banks.
4.Supplementary leverage exposure is the sum of Adjusted average assets used in the Tier 1 leverage ratio and other adjustments, primarily: (i) for derivatives, potential future exposure and the effective notional principal amount of sold credit protection offset by qualifying purchased credit protection; (ii) the counterparty credit risk for repo-style transactions; and (iii) the credit equivalent amount for off-balance sheet exposures.
Certain U.S. Bank Subsidiaries’ Regulatory Capital and Capital Ratios
The OCC establishes capital requirements for the Firm’s U.S. bank subsidiaries, which as of December 31, 2020 include, among others, MSBNA and MSPBNA, and evaluates their compliance with such capital requirements. Regulatory capital requirements for MSBNA and MSPBNA are calculated in a similar manner to the Firm’s regulatory capital requirements, although G-SIB capital surcharge and stress capital buffer requirements do not apply to the U.S. bank subsidiaries.
The OCC’s regulatory capital framework includes Prompt Corrective Action (“PCA”) standards, including “well-capitalized” PCA standards that are based on specified regulatory capital ratio minimums. For the Firm to remain an FHC, its U.S. bank subsidiaries must remain well-capitalized in accordance with the OCC’s PCA standards. In addition, failure by the U.S. bank subsidiaries to meet minimum capital requirements may result in certain mandatory and discretionary actions by regulators that, if undertaken, could have a direct material effect on the U.S. bank subsidiaries’ and the Firm’s financial statements.
At December 31, 2020 and December 31, 2019, MSBNA and MSPBNA risk-based capital ratios are based on the Standardized Approach rules. At December 31, 2020, the risk-based and leverage-based capital amounts and ratios are calculated excluding the effect of the adoption of CECL based on MSBNA’s and MSPBNA’s elections to defer this effect over a five-year transition period.
MSBNA’s Regulatory Capital
| | | | | | | | | | | | | | |
| At December 31, 2020 |
| $ in millions | Well-Capitalized Requirement | Required Ratio1 | Amount | Ratio |
| Risk-based capital | | | | |
| Common Equity Tier 1 capital | 6.5 | % | 7.0 | % | $ | 17,238 | | 18.7 | % |
| Tier 1 capital | 8.0 | % | 8.5 | % | 17,238 | | 18.7 | % |
| Total capital | 10.0 | % | 10.5 | % | 17,882 | | 19.4 | % |
| Leverage-based capital | | | | |
| Tier 1 leverage | 5.0 | % | 4.0 | % | $ | 17,238 | | 10.1 | % |
| SLR | 6.0 | % | 3.0 | % | 17,238 | | 8.0 | % |
| | | | | | | | | | | | | | |
| | At December 31, 2019 |
| $ in millions | Well-Capitalized Requirement | Required Ratio1 | Amount | Ratio |
| Risk-based capital | | | | |
| Common Equity Tier 1 capital | 6.5 | % | 7.0 | % | $ | 15,919 | | 18.5 | % |
| Tier 1 capital | 8.0 | % | 8.5 | % | 15,919 | | 18.5 | % |
| Total capital | 10.0 | % | 10.5 | % | 16,282 | | 18.9 | % |
| Leverage-based capital | | | | |
| Tier 1 leverage | 5.0 | % | 4.0 | % | $ | 15,919 | | 11.3 | % |
| SLR | 6.0 | % | 3.0 | % | 15,919 | | 8.7 | % |
MSPBNA’s Regulatory Capital
| | | | | | | | | | | | | | |
| | At December 31, 2020 |
| $ in millions | Well-Capitalized Requirement | Required Ratio1 | Amount | Ratio |
| Risk-based capital | | | | |
| Common Equity Tier 1 capital | 6.5 | % | 7.0 | % | $ | 8,213 | | 21.3 | % |
| Tier 1 capital | 8.0 | % | 8.5 | % | 8,213 | | 21.3 | % |
| Total capital | 10.0 | % | 10.5 | % | 8,287 | | 21.5 | % |
| Leverage-based capital | | | | |
| Tier 1 leverage | 5.0 | % | 4.0 | % | $ | 8,213 | | 7.2 | % |
| SLR | 6.0 | % | 3.0 | % | 8,213 | | 6.9 | % |
| | | | | | | | |
| 135 | December 2020 Form 10-K |
| | | | | |
| |
| Notes to Consolidated Financial Statements | |
| | | | | | | | | | | | | | |
| | At December 31, 2019 |
| $ in millions | Well-Capitalized Requirement | Required Ratio1 | Amount | Ratio |
| Risk-based capital | | | | |
| Common Equity Tier 1 capital | 6.5 | % | 7.0 | % | $ | 7,962 | | 24.8 | % |
| Tier 1 capital | 8.0 | % | 8.5 | % | 7,962 | | 24.8 | % |
| Total capital | 10.0 | % | 10.5 | % | 8,016 | | 25.0 | % |
| Leverage-based capital | | | | |
| Tier 1 leverage | 5.0 | % | 4.0 | % | $ | 7,962 | | 9.9 | % |
| SLR | 6.0 | % | 3.0 | % | 7,962 | | 9.4 | % |
1.Required ratios are inclusive of any buffers applicable as of the date presented. Failure to maintain the buffers would result in restrictions on the ability to make capital distributions, including the payment of dividends.
U.S. Broker-Dealer Regulatory Capital Requirements
MS&Co. Regulatory Capital
| | | | | | | | |
| $ in millions | At December 31, 2020 | At December 31, 2019 |
| Net capital | $ | 12,869 | | $ | 13,708 | |
| Excess net capital | 9,034 | | 10,686 | |
MS&Co. is a registered U.S. broker-dealer and registered futures commission merchant and, accordingly, is subject to the minimum net capital requirements of the SEC and the CFTC. MS&Co. has consistently operated with capital in excess of its regulatory capital requirements.
As an Alternative Net Capital broker-dealer, and in accordance with Securities Exchange Act of 1934 (“Exchange Act”) Rule 15c3-1, Appendix E, MS&Co. is subject to minimum net capital and tentative net capital requirements. In addition, MS&Co. must notify the SEC if its tentative net capital falls below certain levels. At December 31, 2020 and December 31, 2019, MS&Co. exceeded its net capital requirement and had tentative net capital in excess of the minimum and notification requirements.
Other Regulated Subsidiaries
MSSB, a registered U.S. broker-dealer and introducing broker for the futures business, is subject to the minimum net capital requirements of the SEC. MSIP, a London-based broker-dealer subsidiary, is subject to the capital requirements of the PRA, and the Morgan Stanley Europe Holdings SE Group (“MSEHSE Group”) is subject to the capital requirements of the European Central Bank, BaFin and the German Central Bank. MSSB, MSIP and the MSEHSE Group, including MSESE, a Germany-based broker dealer, have consistently operated with capital in excess of their respective regulatory capital requirements. Additionally, E*TRADE Bank and E*TRADE Savings Bank are subject to the capital requirements of the OCC, and E*TRADE Securities LLC is subject to the minimum net capital requirements of the SEC; each of these entities has consistently operated with capital in excess of their respective regulatory capital requirements.
Certain other U.S. and non-U.S. subsidiaries of the Firm are subject to various securities, commodities and banking
regulations, and capital adequacy requirements promulgated by the regulatory and exchange authorities of the countries in which they operate. These subsidiaries have also consistently operated with capital in excess of their local capital adequacy requirements.
Restrictions on Payments
The regulatory capital requirements referred to above, and certain covenants contained in various agreements governing indebtedness of the Firm, may restrict the Firm’s ability to withdraw capital from its subsidiaries. The following table represents net assets of consolidated subsidiaries that may be restricted as to the payment of cash dividends and advances to the Parent Company.
| | | | | | | | |
| $ in millions | At
December 31,
2020 | At
December 31,
2019 |
| Restricted net assets | $ | 40,502 | | $ | 33,213 | |
18. Total Equity
Morgan Stanley Shareholders’ Equity
Preferred Stock
| | | | | | | | | | | | | | |
| | Shares
Outstanding | | Carrying Value |
$ in millions, except per share data | At
December 31,
2020 | Liquidation
Preference
per Share | At
December 31,
2020 | At
December 31,
2019 |
| Series | | | | |
| A | 44,000 | | $ | 25,000 | | $ | 1,100 | | $ | 1,100 | |
C1 | 519,882 | | 1,000 | | 408 | | 408 | |
| E | 34,500 | | 25,000 | | 862 | | 862 | |
| F | 34,000 | | 25,000 | | 850 | | 850 | |
| H | 52,000 | | 25,000 | | 1,300 | | 1,300 | |
| I | 40,000 | | 25,000 | | 1,000 | | 1,000 | |
| J | 60,000 | | 25,000 | | 1,500 | | 1,500 | |
| K | 40,000 | | 25,000 | | 1,000 | | 1,000 | |
| L | 20,000 | | 25,000 | | 500 | | 500 | |
| M | 400,000 | | 1,000 | | 430 | | — | |
| N | 3,000 | | 100,000 | | 300 | | — | |
| Total | $ | 9,250 | | $ | 8,520 | |
1.Series C preferred stock is held by MUFG.
The Firm is authorized to issue 30 million shares of preferred stock. The preferred stock has a preference over the common stock upon liquidation. The Firm's preferred stock qualifies as and is included in Tier 1 capital in accordance with regulatory capital requirements (see Note 17).
On November 25, 2019, the Firm announced the redemption in whole of its outstanding Series G preferred stock. On notice of redemption, the amount due to holders of Series G Preferred Stock was reclassified to Borrowings, and on January 15, 2020, the redemption settled at the carrying value of $500 million.
| | | | | | | | |
| December 2020 Form 10-K | 136 | |
| | | | | |
| |
| Notes to Consolidated Financial Statements | |
Preferred Stock Issuance Description
| | | | | | | | | | | | | | | | | |
| | | Depositary
Shares
per Share | | Redemption |
Series1, 2 | Shares
Issued | | Price per Share3 | Date4 |
| A | 44,000 | | 1,000 | | | $ | 25,000 | | Currently redeemable |
C5 | 1,160,791 | | N/A | | 1,100 | | Currently redeemable |
| E | 34,500 | | 1,000 | | | 25,000 | | October 15, 2023 |
| F | 34,000 | | 1,000 | | | 25,000 | | January 15, 2024 |
| H | 52,000 | | 25 | | | 25,000 | | Currently redeemable |
| I | 40,000 | | 1,000 | | | 25,000 | | October 15, 2024 |
| J | 60,000 | | 25 | | | 25,000 | | Currently redeemable |
| K | 40,000 | | 1,000 | | | 25,000 | | April 15, 2027 |
L6 | 20,000 | | 1,000 | | | 25,000 | | January 15, 2025 |
M7 | 400,000 | | N/A | | 1,000 | | September 15, 2026 |
N7 | 3,000 | | 100 | | | 100,000 | | October 2, 2025 |
1.All shares issued are non-cumulative. Each share has a par value of $0.01, except Series C.
2.Dividends on Series A are based on a floating rate, and dividends on Series C and L are based on a fixed rate. Dividends on all other Series are based on a fixed-to-floating rate.
3.Series A and C are redeemable at the redemption price plus accrued and unpaid dividends, regardless of whether dividends are actually declared, up to but excluding the date of redemption. All other Series are redeemable at the redemption price plus any declared and unpaid dividends, up to but excluding the date fixed for redemption.
4.Series A and C are currently redeemable at the Firm’s option, in whole or in part, from time to time. Series H and J are currently redeemable, and all other Series are redeemable, at the Firm’s option (i) in whole or in part, from time to time, on any dividend payment date on or after the redemption date or (ii) in whole but not in part at any time within 90 days following a regulatory capital treatment event (as described in the terms of that series).
5.Series C is non-voting perpetual preferred stock. Dividends on the Series C preferred stock are payable, on a non-cumulative basis, as and if declared by the Board, in cash, at the rate of 10% per annum of the liquidation preference of $1,000 per share.
6.Series L Preferred Stock was issued on November 25, 2019.
7.Series M and N Preferred Stock were issued on October 2, 2020 as part of the acquisition of E*TRADE.
Common Stock
Rollforward of Common Stock Outstanding
| | | | | | | | |
| in millions | 2020 | 2019 |
| Shares outstanding at beginning of period | 1,594 | | 1,700 | |
Treasury stock purchases1 | (39) | | (135) | |
| Issuance for the acquisition of E*TRADE | 233 | | — | |
Other2 | 22 | | 29 | |
| Shares outstanding at end of period | 1,810 | | 1,594 | |
1.The Firm’s Board has authorized the repurchase of the Firm’s outstanding stock under a share repurchase program (“Share Repurchase Program”). In addition to the Firm’s Share Repurchase Program, Treasury stock purchases include repurchases of common stock for employee tax withholding.
2.Other includes net shares issued to and forfeited from Employee stock trusts and issued for RSU conversions.
Share Repurchases
| | | | | | | | |
| $ in millions | 2020 | 2019 |
Repurchases of common stock under the Firm’s Share Repurchase Program | $ | 1,347 | | $ | 5,360 | |
The Firm’s 2019 Capital Plan (“Capital Plan”) includes the share repurchase of up to $6.0 billion of outstanding common stock for the period beginning July 1, 2019 through June 30, 2020. Additionally, the Capital Plan includes quarterly common stock dividends of up to $0.35 per share, beginning with the common stock dividend announced on July 18, 2019.
On March 15, 2020, the Financial Services Forum announced that each of its eight member banks, including the Firm, had voluntarily suspended their share repurchase programs. On
June 25, 2020, the Federal Reserve published summary results of CCAR and announced that large BHCs, including the Firm, generally would be restricted in making share repurchases during the third quarter, and on September 30, 2020, the restrictions were extended through the fourth quarter of 2020. On December 18, 2020 the Federal Reserve published summary results of the second round of supervisory stress tests for each large BHC, including the Firm, and permitted the resumption of share repurchases in the first quarter of 2021.
A portion of common stock repurchases was conducted under a sales plan with MUFG, whereby MUFG sold shares of the Firm’s common stock to the Firm, as part of the Firm’s Share Repurchase Program. The sales plan, which was suspended on December 10, 2020, has no impact on the strategic alliance between MUFG and the Firm, including the joint ventures in Japan, and is only intended to maintain MUFG’s ownership percentage below 24.9% in order to comply with MUFG’s passivity commitments to the Board of Governors of the Federal Reserve System.
Pursuant to the Share Repurchase Program, the Firm considers, among other things, business segment capital needs, as well as stock-based compensation and benefit plan requirements. Share repurchases under the program will be exercised from time to time at prices the Firm deems appropriate subject to various factors, including the Firm’s capital position and market conditions. The share repurchases may be effected through open market purchases or privately negotiated transactions, including through Rule 10b5-1 plans, and may be suspended at any time. Share repurchases by the Firm are subject to regulatory non-objection.
Common Shares Outstanding for Basic and Diluted EPS
| | | | | | | | | | | |
| in millions | 2020 | 2019 | 2018 |
Weighted average common shares outstanding, basic | 1,603 | | 1,617 | | 1,708 | |
Effect of dilutive Stock options, RSUs and PSUs | 21 | | 23 | | 30 | |
Weighted average common shares outstanding and common stock equivalents, diluted | 1,624 | | 1,640 | | 1,738 | |
Weighted average antidilutive common stock equivalents (excluded from the computation of diluted EPS) | 5 | | 2 | | 1 | |
| | | | | | | | |
| 137 | December 2020 Form 10-K |
| | | | | |
| |
| Notes to Consolidated Financial Statements | |
Dividends
| | | | | | | | | | | | | | | | | | | | | | | | | | |
$ in millions, except per share data | 2020 | | 2019 | | 2018 |
Per Share1 | Total | | Per Share1 | Total | | Per Share1 | Total |
| Preferred Stock Series | | | | | | |
| A | $ | 1,017 | | $ | 44 | | | $ | 1,014 | | $ | 44 | | | $ | 1,011 | | $ | 45 | |
| C | 100 | | 52 | | | 100 | | 52 | | | 100 | | 52 | |
| E | 1,781 | | 60 | | | 1,781 | | 60 | | | 1,781 | | 61 | |
| F | 1,719 | | 60 | | | 1,719 | | 60 | | | 1,719 | | 58 | |
G2 | — | | — | | | 1,242 | | 24 | | | 1,656 | | 33 | |
| H | 1,143 | | 60 | | | 1,418 | | 74 | | | 1,363 | | 71 | |
| I | 1,594 | | 64 | | | 1,594 | | 64 | | | 1,594 | | 64 | |
J3 | 1,213 | | 74 | | | 1,388 | | 84 | | | 1,388 | | 83 | |
| K | 1,463 | | 59 | | | 1,463 | | 59 | | | 1,463 | | 59 | |
| L | 1,219 | | 23 | | | 169 | | 3 | | | — | | — | |
M4 | — | | — | | | — | | — | | | — | | — | |
N5 | — | | — | | | — | | — | | | — | | — | |
| Total Preferred stock | | $ | 496 | | | | $ | 524 | | | | $ | 526 | |
| Common stock | $ | 1.40 | | $ | 2,295 | | | $ | 1.30 | | $ | 2,161 | | | $ | 1.10 | | $ | 1,930 | |
1.Common and Preferred Stock dividends are payable quarterly, unless otherwise noted.
2.Series G preferred stock was redeemed during the first quarter of 2020. Dividends declared on Series G following the issuance of the notice of redemption were recognized as Interest expense and are excluded from 2019 amounts.
3.Series J was payable semiannually until July 15, 2020, and is now payable quarterly.
4.Series M will be payable semiannually beginning on March 15, 2021 until September 15, 2026, and thereafter will be payable quarterly.
5.Series N will be payable semiannually beginning on March 15, 2021 until March 15, 2023, and thereafter will be payable quarterly.
Cumulative Adjustments to Retained Earnings Related to Adoption of Accounting Updates
| | | | | |
| $ in millions | 2020 |
| Financial Instruments-Credit Losses | $ | (100) | |
| | | | | |
| $ in millions | 2019 |
| Leases | $ | 63 | |
| | | | | |
| $ in millions | 2018 |
| Revenues from contracts with customers | $ | (32) | |
| Derivatives and hedging—targeted improvements to accounting for hedging activities | (99) | |
| Reclassification of certain tax effects from AOCI | 443 | |
Other1 | (6) | |
| Total | $ | 306 | |
1.Other includes the adoption of accounting updates related to Recognition and Measurement of Financial Assets and Financial Liabilities (other than the provision around presenting unrealized DVA in OCI, which the Firm previously adopted) and Derecognition of Nonfinancial Assets. The impact of these adoptions on Retained earnings was not significant.
Comprehensive Income (Loss)
Accumulated Other Comprehensive Income (Loss)1
| | | | | | | | | | | | | | | | | |
| $ in millions | CTA | AFS
Securities | Pensions
and Other | DVA | Total |
| December 31, 2017 | $ | (767) | | $ | (547) | | $ | (591) | | $ | (1,155) | | $ | (3,060) | |
Cumulative adjustment for accounting change2 | (8) | | (111) | | (124) | | (194) | | (437) | |
| OCI during the period | (114) | | (272) | | 137 | | 1,454 | | 1,205 | |
| December 31, 2018 | (889) | | (930) | | (578) | | 105 | | (2,292) | |
| OCI during the period | (8) | | 1,137 | | (66) | | (1,559) | | (496) | |
| December 31, 2019 | (897) | | 207 | | (644) | | (1,454) | | (2,788) | |
| | | | | |
| OCI during the period | 102 | | 1,580 | | 146 | | (1,002) | | 826 | |
| December 31, 2020 | $ | (795) | | $ | 1,787 | | $ | (498) | | $ | (2,456) | | $ | (1,962) | |
CTA—Cumulative foreign currency translation adjustments
1.Amounts are net of tax and noncontrolling interests.
2.The cumulative adjustment for accounting changes is primarily the effect of the adoption of the accounting update Reclassification of Certain Tax Effects from Accumulated Other Comprehensive Income. This adjustment was recorded as of January 1, 2018 to reclassify certain income tax effects related to the enactment of the Tax Cuts and Jobs Act from AOCI to Retained earnings, primarily related to the remeasurement of deferred tax assets and liabilities resulting from the reduction in the corporate income tax rate to 21%.
Components of Period Changes in OCI
| | | | | | | | | | | | | | | | | |
| | 2020 |
| $ in millions | Pre-tax
Gain
(Loss) | Income Tax Benefit (Provision) | After-tax
Gain
(Loss) | Non-
controlling
Interests | Net |
| CTA |
| OCI activity | $ | 74 | | $ | 99 | | $ | 173 | | $ | 68 | | $ | 105 | |
| Reclassified to earnings | (3) | | — | | (3) | | — | | (3) | |
| Net OCI | $ | 71 | | $ | 99 | | $ | 170 | | $ | 68 | | $ | 102 | |
| Change in net unrealized gains (losses) on AFS securities | |
| OCI activity | $ | 2,194 | | $ | (508) | | $ | 1,686 | | $ | — | | $ | 1,686 | |
| Reclassified to earnings | (137) | | 31 | | (106) | | — | | (106) | |
| Net OCI | $ | 2,057 | | $ | (477) | | $ | 1,580 | | $ | — | | $ | 1,580 | |
| Pension and other |
| OCI activity | $ | 162 | | $ | (34) | | $ | 128 | | $ | — | | $ | 128 | |
| Reclassified to earnings | 23 | | (5) | | 18 | | — | | 18 | |
| Net OCI | $ | 185 | | $ | (39) | | $ | 146 | | $ | — | | $ | 146 | |
| Change in net DVA |
| OCI activity | $ | (1,385) | | $ | 337 | | $ | (1,048) | | $ | (26) | | $ | (1,022) | |
| Reclassified to earnings | 26 | | (6) | | 20 | | — | | 20 | |
| Net OCI | $ | (1,359) | | $ | 331 | | $ | (1,028) | | $ | (26) | | $ | (1,002) | |
| | | | | | | | | | | | | | | | | |
| | 2019 |
| $ in millions | Pre-tax
Gain
(Loss) | Income Tax Benefit (Provision) | After-tax
Gain
(Loss) | Non-
controlling
Interests | Net |
| CTA |
| OCI activity | $ | 6 | | $ | (3) | | $ | 3 | | $ | 11 | | $ | (8) | |
| Reclassified to earnings | — | | — | | — | | — | | — | |
| Net OCI | $ | 6 | | $ | (3) | | $ | 3 | | $ | 11 | | $ | (8) | |
| Change in net unrealized gains (losses) on AFS securities |
| OCI activity | $ | 1,588 | | $ | (373) | | $ | 1,215 | | $ | — | | $ | 1,215 | |
| Reclassified to earnings | (103) | | 25 | | (78) | | — | | (78) | |
| Net OCI | $ | 1,485 | | $ | (348) | | $ | 1,137 | | $ | — | | $ | 1,137 | |
| Pension and other |
| OCI activity | $ | (98) | | $ | 25 | | $ | (73) | | $ | — | | $ | (73) | |
| Reclassified to earnings | 12 | | (5) | | 7 | | — | | 7 | |
| Net OCI | $ | (86) | | $ | 20 | | $ | (66) | | $ | — | | $ | (66) | |
| Change in net DVA |
| OCI activity | $ | (2,181) | | $ | 533 | | $ | (1,648) | | $ | (80) | | $ | (1,568) | |
| Reclassified to earnings | 11 | | (2) | | 9 | | — | | 9 | |
| Net OCI | $ | (2,170) | | $ | 531 | | $ | (1,639) | | $ | (80) | | $ | (1,559) | |
| | | | | | | | |
| December 2020 Form 10-K | 138 | |
| | | | | |
| |
| Notes to Consolidated Financial Statements | |
| | | | | | | | | | | | | | | | | |
| | 20181 |
| $ in millions | Pre-tax
Gain
(Loss) | Income Tax Benefit (Provision) | After-tax
Gain
(Loss) | Non-
controlling
Interests | Net |
| CTA |
| OCI activity | $ | (11) | | $ | (79) | | $ | (90) | | $ | 24 | | $ | (114) | |
| Reclassified to earnings | — | | — | | — | | — | | — | |
| Net OCI | $ | (11) | | $ | (79) | | $ | (90) | | $ | 24 | | $ | (114) | |
| Change in net unrealized gains (losses) on AFS securities |
| OCI activity | $ | (346) | | $ | 80 | | $ | (266) | | $ | — | | $ | (266) | |
| Reclassified to earnings | (8) | | 2 | | (6) | | — | | (6) | |
| Net OCI | $ | (354) | | $ | 82 | | $ | (272) | | $ | — | | $ | (272) | |
| Pension and other |
| OCI activity | $ | 156 | | $ | (37) | | $ | 119 | | $ | — | | $ | 119 | |
| Reclassified to earnings | 26 | | (8) | | 18 | | — | | 18 | |
| Net OCI | $ | 182 | | $ | (45) | | $ | 137 | | $ | — | | $ | 137 | |
| Change in net DVA |
| OCI activity | $ | 1,947 | | $ | (472) | | $ | 1,475 | | $ | 63 | | $ | 1,412 | |
| Reclassified to earnings | 56 | | (14) | | 42 | | — | | 42 | |
| Net OCI | $ | 2,003 | | $ | (486) | | $ | 1,517 | | $ | 63 | | $ | 1,454 | |
1.Exclusive of cumulative adjustments related to the adoption of certain accounting updates in 2018. Refer to the previous Accumulated Other Comprehensive Income (Loss) table for further information.
Cumulative Foreign Currency Translation Adjustments
| | | | | | | | |
| $ in millions | At
December 31,
2020 | At
December 31,
2019 |
| Associated with net investments in subsidiaries with a non-U.S. dollar functional currency | $ | (1,406) | | $ | (1,874) | |
| Hedges, net of tax | 611 | | 977 | |
| Total | $ | (795) | | $ | (897) | |
Carrying value of net investments in non-U.S. dollar functional currency subsidiaries subject to hedges | $ | 15,746 | | $ | 13,440 | |
Cumulative foreign currency translation adjustments include gains or losses resulting from translating foreign currency financial statements from their respective functional currencies to U.S. dollars, net of hedge gains or losses and related tax effects. The Firm uses foreign currency contracts to manage the currency exposure relating to its net investments in non-U.S. dollar functional currency subsidiaries and determines the amount of exposure to hedge on a pre-tax basis. The Firm may also elect not to hedge its net investments in certain foreign operations due to market conditions or other reasons, including the availability of various currency contracts at acceptable costs. Information relating to the effects on cumulative foreign currency translation adjustments that resulted from the translation of foreign currency financial statements and from gains and losses from hedges of the Firm’s net investments in non-U.S. dollar functional currency subsidiaries is summarized in the previous table.
19. Interest Income and Interest Expense
| | | | | | | | | | | |
| $ in millions | 2020 | 2019 | 2018 |
| Interest income | | | |
| Investment securities | $ | 2,282 | | $ | 2,175 | | $ | 1,744 | |
| Loans | 4,142 | | 4,783 | | 4,249 | |
Securities purchased under agreements to resell and Securities borrowed1 | (194) | | 3,485 | | 1,976 | |
| Trading assets, net of Trading liabilities | 2,417 | | 2,899 | | 2,392 | |
Customer receivables and Other2 | 1,515 | | 3,756 | | 3,531 | |
| Total interest income | $ | 10,162 | | $ | 17,098 | | $ | 13,892 | |
| Interest expense | | | |
| Deposits | $ | 953 | | $ | 1,885 | | $ | 1,255 | |
| Borrowings | 3,250 | | 5,052 | | 5,031 | |
Securities sold under agreements to repurchase and Securities loaned3 | 983 | | 2,609 | | 1,898 | |
Customer payables and Other4 | (1,337) | | 2,858 | | 1,902 | |
| Total interest expense | $ | 3,849 | | $ | 12,404 | | $ | 10,086 | |
| Net interest | $ | 6,313 | | $ | 4,694 | | $ | 3,806 | |
1.Includes fees paid on Securities borrowed.
2.Includes interest from Cash and cash equivalents.
3.Includes fees received on Securities loaned.
4.Includes fees received from prime brokerage customers for stock loan transactions entered into to cover customers’ short positions.
Interest income and Interest expense are classified in the income statements based on the nature of the instrument and related market conventions. When included as a component of the instrument’s fair value, interest is included within Trading revenues or Investments revenues. Otherwise, it is included within Interest income or Interest expense.
Accrued Interest
| | | | | | | | |
| $ in millions | At
December 31,
2020 | At
December 31,
2019 |
| Customer and other receivables | $ | 1,652 | | $ | 1,661 | |
| Customer and other payables | 2,119 | | 2,223 | |
20. Deferred Compensation Plans and Carried Interest Compensation
Stock-Based Compensation Plans
Certain current and former employees of the Firm participate in the Firm's stock-based compensation plans. These plans include RSUs and PSUs, the details of which are further outlined below.
Stock-Based Compensation Expense
| | | | | | | | | | | |
| $ in millions | 2020 | 2019 | 2018 |
| RSUs | $ | 1,170 | | $ | 1,064 | | $ | 892 | |
| Stock options | — | | — | | — | |
| PSUs | 142 | | 89 | | 28 | |
| Total | $ | 1,312 | | $ | 1,153 | | $ | 920 | |
| | | |
Retirement-eligible awards1 | $ | 157 | | $ | 111 | | $ | 110 | |
1.Included in total expense is stock-based compensation anticipated to be awarded in January of the following year that does not contain a future service requirement.
| | | | | | | | |
| 139 | December 2020 Form 10-K |
| | | | | |
| |
| Notes to Consolidated Financial Statements | |
Tax Benefit Related to Stock-Based Compensation Expense
| | | | | | | | | | | |
| $ in millions | 2020 | 2019 | 2018 |
Tax benefit1 | $ | 270 | | $ | 243 | | $ | 193 | |
1.Excludes income tax consequences related to employee share-based award conversions.
Unrecognized Compensation Cost Related to Stock-Based Awards Granted
| | | | | |
| $ in millions | At December 31, 20201 |
| To be recognized in: | |
| 2021 | $ | 383 | |
| 2022 | 159 | |
| Thereafter | 28 | |
| Total | $ | 570 | |
1.Amounts do not include cancellations, accelerations, future adjustments to fair value for certain awards, or 2020 performance year compensation awarded in January 2021, which will begin to be amortized in 2021.
In connection with awards under its stock-based compensation plans, the Firm is authorized to issue shares of common stock held in treasury or newly issued shares.
The Firm generally uses treasury shares, if available, to deliver shares to employees or employee stock trusts and has an ongoing repurchase authorization that includes repurchases in connection with awards under its stock-based compensation plans. Share repurchases by the Firm are subject to regulatory non-objection.
Common Shares Available for Future Awards under Stock-Based Compensation Plans
| | | | | |
| in millions | At
December 31,
2020 |
| Shares | 110 | |
See Note 18 for additional information on the Firm’s Share Repurchase Program.
Restricted Stock Units
RSUs are subject to vesting over time, generally one to seven years from the date of award, contingent upon continued employment and subject to restrictions on sale, transfer or assignment until conversion to common stock. All or a portion of an award may be forfeited if employment is terminated before the end of the relevant vesting period or canceled after the relevant vesting period in certain situations. Recipients of RSUs may have voting rights, at the Firm’s discretion, and generally receive dividend equivalents if the awards vest.
Vested and Unvested RSU Activity
| | | | | | | | |
| | 2020 |
| shares in millions | Number of
Shares | Weighted
Average
Award Date
Fair Value |
| RSUs at beginning of period | 65 | | $ | 44.38 | |
| Awarded | 21 | | 55.01 | |
| Conversions to common stock | (25) | | 39.81 | |
| Forfeited | (1) | | 48.29 | |
RSUs at end of period1 | 60 | | $ | 49.82 | |
Aggregate intrinsic value of RSUs at end of period (dollars in millions) | $ | 4,087 | |
| Weighted average award date fair value |
| RSUs awarded in 2019 | | $ | 43.05 | |
| RSUs awarded in 2018 | | 55.40 | |
1.At December 31, 2020, the weighted average remaining term until delivery for the outstanding RSUs was approximately 1.2 years.
Unvested RSU Activity
| | | | | | | | |
| | 2020 |
| shares in millions | Number of
Shares | Weighted
Average
Award Date
Fair Value |
| Unvested RSUs at beginning of period | 37 | | $ | 44.58 | |
| Awarded | 21 | | 55.01 | |
| Vested | (24) | | 44.12 | |
| Forfeited | (1) | | 48.29 | |
Unvested RSUs at end of period1 | 33 | | $ | 51.27 | |
1.Unvested RSUs represent awards where recipients have yet to satisfy either the explicit vesting terms or retirement-eligible requirements.
Fair Value of RSU Activity
| | | | | | | | | | | |
| $ in millions | 2020 | 2019 | 2018 |
| Conversions to common stock | $ | 1,295 | | $ | 1,497 | | $ | 1,790 | |
| Vested | 1,289 | | 1,292 | | 1,504 | |
Performance-Based Stock Units
PSUs will vest and convert to shares of common stock only if the Firm satisfies predetermined performance and market-based conditions over a three-year performance period. The number of PSUs that will vest ranges from 0% to 150% of the target award, based on the extent to which the Firm achieves the specified performance goals. One-half of the award will be earned based on the Firm’s average return on equity, excluding certain adjustments specified in the plan terms (“MS Adjusted ROE”). The other half of the award will be earned based on the Firm’s total shareholder return, relative to the total shareholder return of the S&P 500 Financials Sector Index (“Relative MS TSR”). PSUs have vesting, restriction and cancellation provisions that are generally similar to those of RSUs. At December 31, 2020, approximately 3 million PSUs were outstanding.
PSU Fair Value on Award Date
| | | | | | | | | | | |
| 2020 | 2019 | 2018 |
| MS Adjusted ROE | $ | 57.05 | | $ | 43.29 | | $ | 56.84 | |
| Relative MS TSR | 65.31 | | 48.28 | | 65.81 | |
| | | | | | | | |
| December 2020 Form 10-K | 140 | |
| | | | | |
| |
| Notes to Consolidated Financial Statements | |
The Relative MS TSR fair values on the award date were estimated using a Monte Carlo simulation and the following assumptions.
Monte Carlo Simulation Assumptions
| | | | | | | | | | | |
| Risk-Free
Interest Rate | Expected
Stock Price
Volatility | Correlation
Coefficient |
| Award Year | | | |
| 2020 | 1.6 | % | 24.0 | % | 0.88 | |
| 2019 | 2.6 | % | 26.5 | % | 0.89 | |
| 2018 | 2.2 | % | 26.8 | % | 0.89 | |
The risk-free interest rate was determined based on the yields available on U.S. Treasury zero-coupon issues. The expected stock price volatility was determined using historical volatility. The correlation coefficient was developed based on historical price data of the Firm and the S&P 500 Financials Sector Index. The model uses an expected dividend yield equivalent to reinvesting dividends.
Deferred Cash-Based Compensation Plans
Deferred cash-based compensation plans generally provide a return to the plan participants based upon the performance of each participant’s referenced investments.
Deferred Cash-Based Compensation Expense
| | | | | | | | | | | |
| $ in millions | 2020 | 2019 | 2018 |
| Deferred cash-based awards | $ | 1,263 | | $ | 1,233 | | $ | 1,174 | |
| Return on referenced investments | 856 | | 645 | | (48) | |
| Total | $ | 2,119 | | $ | 1,878 | | $ | 1,126 | |
| | | |
Retirement-eligible awards1 | $ | 194 | | $ | 195 | | $ | 193 | |
1.Included in total expense is deferred cash-based compensation anticipated to be awarded in January of the following year that does not contain a future service requirement.
Carried Interest Compensation
The Firm generally recognizes compensation expense for any portion of carried interest (both realized and unrealized) that is allocated to employees.
Carried Interest Compensation Expense
| | | | | | | | | | | |
| $ in millions | 2020 | 2019 | 2018 |
| Expense | $ | 215 | | $ | 534 | | $ | 156 | |
21. Employee Benefit Plans
Pension Plans
Components of Net Periodic Benefit Expense (Income)
| | | | | | | | | | | |
| | Pension Plans |
| $ in millions | 2020 | 2019 | 2018 |
Service cost, benefits earned during the period | $ | 17 | | $ | 16 | | $ | 16 | |
| Interest cost on projected benefit obligation | 121 | | 139 | | 134 | |
| Expected return on plan assets | (77) | | (114) | | (112) | |
| Net amortization of prior service cost (credit) | 1 | | 1 | | (1) | |
| Net amortization of actuarial loss | 26 | | 13 | | 26 | |
| Net periodic benefit expense | $ | 88 | | $ | 55 | | $ | 63 | |
Certain current and former U.S. employees of the Firm and its U.S. affiliates who were hired before July 1, 2007 are covered by the U.S. pension plan, a non-contributory defined benefit pension plan that is qualified under Section 401(a) of the Internal Revenue Code (“U.S. Qualified Plan”). The U.S. Qualified Plan has ceased future benefit accruals.
Unfunded supplementary plans (“Supplemental Plans”) cover certain executives. Liabilities for benefits payable under the Supplemental Plans are accrued by the Firm and are funded when paid. The Morgan Stanley Supplemental Executive Retirement and Excess Plan (“SEREP”), a non-contributory defined benefit plan that is not qualified under Section 401(a) of the Internal Revenue Code, has ceased future benefit accruals.
Certain of the Firm’s non-U.S. subsidiaries also have defined benefit pension plans covering their eligible current and former employees.
The Firm’s pension plans generally provide pension benefits that are based on each employee’s years of credited service and on compensation levels specified in the plans.
Rollforward of Pre-tax AOCI
| | | | | | | | | | | |
| | Pension Plans |
| $ in millions | 2020 | 2019 | 2018 |
| Beginning balance | $ | (877) | | $ | (779) | | $ | (947) | |
| Net gain (loss) | 161 | | (112) | | 158 | |
| Prior service credit (cost) | (2) | | — | | (15) | |
| Amortization of prior service cost (credit) | 1 | | 1 | | (1) | |
| Amortization of net loss | 26 | | 13 | | 26 | |
| Changes recognized in OCI | 186 | | (98) | | 168 | |
| Ending balance | $ | (691) | | $ | (877) | | $ | (779) | |
The Firm generally amortizes into net periodic benefit expense (income) the unrecognized net gains and losses exceeding 10% of the greater of the projected benefit obligation or the market-related value of plan assets. The U.S. pension plans amortize the unrecognized net gains and losses over the average life expectancy of participants. The remaining plans generally amortize the unrecognized net
| | | | | | | | |
| 141 | December 2020 Form 10-K |
| | | | | |
| |
| Notes to Consolidated Financial Statements | |
gains and losses and prior service credit over the average remaining service period of active participants.
Weighted Average Assumptions Used to Determine Net Periodic Benefit Expense (Income)
| | | | | | | | | | | |
| | Pension Plans |
| 2020 | 2019 | 2018 |
| Discount rate | 3.08 | % | 4.01 | % | 3.46 | % |
Expected long-term rate of return on plan assets | 2.35 | % | 3.52 | % | 3.50 | % |
| Rate of future compensation increases | 3.28 | % | 3.34 | % | 3.38 | % |
The accounting for pension plans involves certain assumptions and estimates. The expected long-term rate of return for the U.S. Qualified Plan was estimated by computing a weighted average of the underlying long-term expected returns based on the investment managers’ target allocations.
Benefit Obligation and Funded Status
Rollforward of the Benefit Obligation and Fair Value of Plan Assets
| | | | | | | | |
| | Pension Plans |
| $ in millions | 2020 | 2019 |
| Rollforward of benefit obligation |
Benefit obligation at beginning of year | $ | 4,026 | | $ | 3,563 | |
| Service cost | 17 | | 16 | |
| Interest cost | 121 | | 139 | |
Actuarial loss (gain)1 | 362 | | 497 | |
| Plan amendments | 2 | | — | |
| Plan settlements | (2) | | (9) | |
| Benefits paid | (222) | | (191) | |
Other2 | 30 | | 11 | |
Benefit obligation at end of year | $ | 4,334 | | $ | 4,026 | |
| Rollforward of fair value of plan assets |
Fair value of plan assets at beginning of year | $ | 3,553 | | $ | 3,203 | |
| Actual return on plan assets | 600 | | 499 | |
| Employer contributions | 35 | | 36 | |
| Benefits paid | (222) | | (191) | |
| Plan settlements | (2) | | (9) | |
Other2 | 21 | | 15 | |
Fair value of plan assets at end of year | $ | 3,985 | | $ | 3,553 | |
| Funded (unfunded) status | $ | (349) | | $ | (473) | |
| Amounts recognized in the balance sheets |
Assets | $ | 283 | | $ | 98 | |
| Liabilities | (632) | | (571) | |
| Net amount recognized | $ | (349) | | $ | (473) | |
1.Primarily reflects the impact of year-over-year discount rate fluctuations.
2.Includes foreign currency exchange rate changes.
Accumulated Benefit Obligation
| | | | | | | | |
| $ in millions | At
December 31,
2020 | At
December 31,
2019 |
| Pension plans | $ | 4,318 | | $ | 4,013 | |
Pension Plans with Benefit Obligations in Excess of the Fair Value of Plan Assets
| | | | | | | | |
| $ in millions | At
December 31,
2020 | At
December 31,
2019 |
| Projected benefit obligation | $ | 708 | | $ | 637 | |
| Accumulated benefit obligation | 692 | | 624 | |
| Fair value of plan assets | 76 | | 66 | |
The pension plans included in the table above may differ based on their funding status as of December 31 of each year.
Weighted Average Assumptions Used to Determine Benefit Obligation
| | | | | | | | |
| | Pension Plans |
| At
December 31,
2020 | At
December 31,
2019 |
| Discount rate | 2.43 | % | 3.08 | % |
Rate of future compensation increase | 3.25 | % | 3.28 | % |
The discount rates used to determine the benefit obligation for the U.S. pension plans were selected by the Firm, in consultation with its independent actuary, using a pension discount yield curve based on the characteristics of the plans, each determined independently. The pension discount yield curve represents spot discount yields based on duration implicit in a representative broad-based Aa-rated corporate bond universe of high-quality fixed income investments. For all non-U.S. pension plans, the Firm set the assumed discount rates based on the nature of liabilities, local economic environments and available bond indices.
Plan Assets
Fair Value of Plan Assets
| | | | | | | | | | | | | | | | | |
| At December 31, 2020 | | | |
| $ in millions | Level 1 | Level 2 | Level 3 | Total | | | |
| Assets | | | | | | | |
Cash and cash equivalents1 | $ | 4 | | $ | — | | $ | — | | $ | 4 | | | | |
| | | | | | |
| | | | | | | |
| | | | | | | |
| U.S. government and agency securities | 3,038 | | 321 | | — | | 3,359 | | | | |
| Corporate and other debt—CDO | — | | 4 | | — | | 4 | | | | |
| Derivative contracts | — | | 2 | | — | | 2 | | | | |
| Other investments | — | | — | | 61 | | 61 | | | | |
Other receivables1 | — | | 53 | | — | | 53 | | | | |
| Total | $ | 3,042 | | $ | 380 | | $ | 61 | | $ | 3,483 | | | | |
| Assets Measured at NAV | | | | | | | |
| Commingled trust funds: | | | | | | | |
| Money market | | | | 48 | | | | |
| Foreign funds: | | | | | | | |
| Fixed income | | | | 169 | | | | |
| Liquidity | | | | 54 | | | | |
| Targeted cash flow | | | | 250 | | | | |
| Total | | | | $ | 521 | | | | |
| Liabilities | | | | | | | |
| | | | | | | |
Other payables1 | — | | (19) | | — | | (19) | | | | |
| Total liabilities | $ | — | | $ | (19) | | $ | — | | $ | (19) | | | | |
| Fair value of plan assets | | | | $ | 3,985 | | | | |
| | | | | | | | |
| December 2020 Form 10-K | 142 | |
| | | | | |
| |
| Notes to Consolidated Financial Statements | |
| | | | | | | | | | | | | | |
| At December 31, 2019 |
| $ in millions | Level 1 | Level 2 | Level 3 | Total |
| Assets | | | | |
Cash and cash equivalents1 | $ | 3 | | $ | — | | $ | — | | $ | 3 | |
| | | |
| | | | |
| | | | |
| U.S. government and agency securities | 2,658 | | 292 | | — | | 2,950 | |
| Corporate and other debt—CDO | — | | 9 | | — | | 9 | |
| | | | |
| Other investments | — | | — | | 53 | | 53 | |
Other receivables1 | — | | 48 | | — | | 48 | |
| | | | |
| Total | $ | 2,661 | | $ | 349 | | $ | 53 | | $ | 3,063 | |
| Assets Measured at NAV | | | | |
| Commingled trust funds: | | | | |
| Money market | | | | 137 | |
| Foreign funds: | | | | |
| Fixed income | | | | 136 | |
| Liquidity | | | | 30 | |
| Targeted cash flow | | | | 240 | |
| Total | | | | $ | 543 | |
| Liabilities | | | | |
| Derivative contracts | — | | (1) | | — | | (1) | |
Other payables1 | — | | (52) | | — | | (52) | |
| Total liabilities | $ | — | | $ | (53) | | $ | — | | $ | (53) | |
| Fair value of plan assets | | | | $ | 3,553 | |
1.Cash and cash equivalents, other receivables and other payables are valued at their carrying value, which approximates fair value.
Rollforward of Level 3 Plan Assets
| | | | | | | | |
| $ in millions | 2020 | 2019 |
| Balance at beginning of period | $ | 53 | | $ | 48 | |
| Realized and unrealized gains (losses) | 5 | | 3 | |
| Purchases, sales and settlements, net | 3 | | 2 | |
| Balance at end of period | $ | 61 | | $ | 53 | |
There were no transfers between levels during 2020 and 2019.
The U.S. Qualified Plan’s assets represent 87% of the Firm’s total pension plan assets. The U.S. Qualified Plan uses a combination of active and risk-controlled fixed income investment strategies. The fixed income asset allocation consists primarily of fixed income securities and related derivative instruments designed to approximate the expected cash flows of the plan’s liabilities in order to help reduce plan exposure to interest rate variation and to better align assets with the obligation. The longer-duration fixed income allocation is expected to help protect the plan’s funded status and maintain the stability of plan contributions over the long run. The investment portfolio performance is assessed by comparing actual investment performance with changes in the estimated present value of the U.S. Qualified Plan’s benefit obligation.
Derivative instruments are permitted in the U.S. Qualified Plan’s investment portfolio only to the extent that they comply with all of the plan’s investment policy guidelines and are consistent with the plan’s risk and return objectives.
As a fundamental operating principle, any restrictions on the underlying assets apply to the respective derivative product. This includes percentage allocations and credit quality. Derivatives are used solely for the purpose of enhancing
investment returns in the underlying assets and not to circumvent portfolio restrictions.
Plan assets are measured at fair value using valuation techniques that are consistent with the valuation techniques applied to the Firm’s major categories of assets and liabilities as described in Notes 2 and 5. OTC derivative contracts consist of investments in interest rate swaps and total return swaps. Other investments consist of pledged insurance annuity contracts held by non-U.S.-based plans. The pledged insurance annuity contracts are valued based on the premium reserve of the insurer for a guarantee that the insurer has given to the employee benefit plan that approximates fair value. The pledged insurance annuity contracts are categorized in Level 3 of the fair value hierarchy.
Commingled trust funds are privately offered funds regulated, supervised and subject to periodic examination by a U.S. federal or state agency and available to institutional clients. The trust must be maintained for the collective investment or reinvestment of assets contributed to it from U.S. tax-qualified employee benefit plans maintained by more than one employer or controlled group of corporations. The sponsor of the commingled trust funds values the funds based on the fair value of the underlying securities. Commingled trust funds are redeemable at NAV at the measurement date or in the near future.
Some non-U.S.-based plans hold foreign funds that consist of investments in fixed income funds, target cash flow funds and liquidity funds. Fixed income funds invest in individual securities quoted on a recognized stock exchange or traded in a regulated market. Certain fixed income funds aim to produce returns consistent with certain Financial Times Stock Exchange indexes. Target cash flow funds are designed to provide a series of fixed annual cash flows achieved by investing in government bonds and derivatives. Liquidity funds place a high priority on capital preservation, stable value and a high liquidity of assets. Foreign funds are readily redeemable at NAV.
The Firm generally considers the NAV of commingled trust funds and foreign funds provided by the fund manager to be the best estimate of fair value.
Expected Contributions
The Firm’s policy is to fund at least the amount sufficient to meet minimum funding requirements under applicable employee benefit and tax laws. At December 31, 2020, the Firm expected to contribute approximately $50 million to its pension plans in 2021 based upon the plans’ current funded status and expected asset return assumptions for 2021.
| | | | | | | | |
| 143 | December 2020 Form 10-K |
| | | | | |
| |
| Notes to Consolidated Financial Statements | |
Expected Future Benefit Payments
| | | | | |
| | At December 31, 2020 |
| $ in millions | Pension Plans |
| 2021 | $ | 153 | |
| 2022 | 155 | |
| 2023 | 161 | |
| 2024 | 163 | |
| 2025 | 171 | |
| 2026-2030 | 940 | |
401(k) Plans
| | | | | | | | | | | |
| $ in millions | 2020 | 2019 | 2018 |
| Expense | $ | 293 | | $ | 280 | | $ | 272 | |
U.S. employees meeting certain eligibility requirements may participate in the Firm’s 401(k) plans.
Morgan Stanley 401(k) Plan
Eligible employees receive discretionary 401(k) matching cash contributions as determined annually by the Firm. For 2020, 2019 and 2018, the Firm matched employee contributions up to 4% of eligible pay, up to the IRS limit. Matching contributions were invested among available funds according to each participant’s investment direction on file. Eligible employees with eligible pay less than or equal to $100,000 also received a fixed contribution under the 401(k) Plan equal to 2% of eligible pay. Transition contributions relating to acquired entities or frozen employee benefit plans are allocated to certain eligible employees. The Firm match, fixed contribution and transition contribution are included in the Firm’s 401(k) expense.
Non-U.S. Defined Contribution Pension Plans
| | | | | | | | | | | |
| $ in millions | 2020 | 2019 | 2018 |
| Expense | $ | 130 | | $ | 121 | | $ | 116 | |
The Firm maintains separate defined contribution pension plans that cover eligible employees of certain non-U.S. subsidiaries. Under such plans, benefits are generally determined based on a fixed rate of base salary with certain vesting requirements.
22. Income Taxes
Components of Provision for Income Taxes
| | | | | | | | | | | |
| $ in millions | 2020 | 2019 | 2018 |
| Current | | | |
| U.S.: | | | |
| Federal | $ | 1,641 | | $ | 873 | | $ | 686 | |
| State and local | 399 | | 260 | | 207 | |
| Non-U.S.: | | | |
| U.K. | 395 | | 166 | | 328 | |
| Japan | 185 | | 177 | | 268 | |
| Hong Kong | 185 | | 82 | | 94 | |
Other1 | 684 | | 341 | | 318 | |
| Total | $ | 3,489 | | $ | 1,899 | | $ | 1,901 | |
| | | |
| Deferred | | | |
| U.S.: | | | |
| Federal | $ | (249) | | $ | 185 | | $ | 330 | |
| State and local | (38) | | 46 | | 56 | |
| Non-U.S.: | | | |
| U.K. | (2) | | 5 | | 54 | |
| Japan | 12 | | 11 | | (10) | |
| Hong Kong | (3) | | — | | (3) | |
Other1 | 30 | | (82) | | 22 | |
| Total | $ | (250) | | $ | 165 | | $ | 449 | |
Provision for income taxes from continuing operations | $ | 3,239 | | $ | 2,064 | | $ | 2,350 | |
| Provision for income taxes from discontinued operations | $ | — | | $ | — | | $ | (1) | |
1.Other Non-U.S. tax provisions for 2020, 2019 and 2018 primarily include Brazil, the Netherlands, and India.
Reconciliation of the U.S. Federal Statutory Income Tax Rate to the Effective Income Tax Rate
| | | | | | | | | | | |
| 2020 | 2019 | 2018 |
| U.S. federal statutory income tax rate | 21.0 | | 21.0 | % | 21.0 | % |
U.S. state and local income taxes, net of U.S. federal income tax benefits | 2.0 | | 2.2 | | 2.0 | |
| Domestic tax credits and tax exempt income | (0.8) | | (1.6) | | (1.3) | |
| Non-U.S. earnings | 1.7 | | (0.8) | | 1.3 | |
| Employee share-based awards | (0.7) | | (1.1) | | (1.5) | |
| Other | (0.7) | | (1.4) | | (0.6) | |
| Effective income tax rate | 22.5 | % | 18.3 | % | 20.9 | % |
The increase in the Firm’s effective tax rate in 2020 compared with the prior year is primarily due to the higher level of earnings and lower net discrete tax benefits. In 2020, net discrete tax benefits were $122 million, primarily related to the conversion of employee share-based awards.
The Firm’s effective tax rates for 2019 and 2018 include net discrete tax benefits of $475 million and $368 million, respectively, primarily associated with remeasurement of reserves and related interest as a result of new information pertaining to the resolution of multi-jurisdiction tax examinations, as well as benefits related to conversion of employee share-based awards. The fourth quarters of 2019 and 2018 include net discrete tax benefits of $158 million and $111 million, respectively.
| | | | | | | | |
| December 2020 Form 10-K | 144 | |
| | | | | |
| |
| Notes to Consolidated Financial Statements | |
Deferred Tax Assets and Liabilities
| | | | | | | | |
| $ in millions | At
December 31,
2020 | At
December 31,
2019 |
| Gross deferred tax assets | | |
| Net operating loss and tax credit carryforwards | $ | 330 | | $ | 287 | |
| Employee compensation and benefit plans | 2,248 | | 2,075 | |
| Allowance for credit losses and other reserves | 669 | | 318 | |
| Valuation of inventory, investments and receivables | 19 | | 368 | |
| Other | 43 | | — | |
| Total deferred tax assets | 3,309 | | 3,048 | |
| Deferred tax assets valuation allowance | 236 | | 156 | |
Deferred tax assets after valuation allowance | $ | 3,073 | | $ | 2,892 | |
| Gross deferred tax liabilities | | |
| Fixed assets | 1,130 | | 983 | |
| Intangibles, goodwill and other | 1,156 | | 411 | |
| Total deferred tax liabilities | $ | 2,286 | | $ | 1,394 | |
| Net deferred tax assets | $ | 787 | | $ | 1,498 | |
Deferred income taxes reflect the net tax effects of temporary differences between the financial reporting and tax bases of assets and liabilities and are measured using the enacted tax rates and laws that will be in effect when such differences are expected to reverse.
The Firm believes the recognized net deferred tax assets (after valuation allowance) at December 31, 2020 are more likely than not to be realized based on expectations as to future taxable income in the jurisdictions in which it operates.
The earnings of certain foreign subsidiaries are indefinitely reinvested due to regulatory and other capital requirements in foreign jurisdictions. As of December 31, 2020, the unrecognized deferred tax liability attributable to indefinitely reinvested earnings is immaterial.
Rollforward of Unrecognized Tax Benefits
| | | | | | | | | | | |
| $ in millions | 2020 | 2019 | 2018 |
| Balance at beginning of period | $ | 755 | | $ | 1,080 | | $ | 1,594 | |
Increase based on tax positions related to the current period | 139 | | 57 | | 83 | |
Increase based on tax positions related to prior periods | 178 | | 61 | | 34 | |
| Increase based on the acquisition of E*TRADE | 26 | | — | | — | |
Decrease based on tax positions related to prior periods | (297) | | (419) | | (404) | |
Decreases related to settlements with taxing authorities | (36) | | (17) | | (139) | |
Decreases related to lapse of statute of limitations | (10) | | (7) | | (88) | |
| Balance at end of period | $ | 755 | | $ | 755 | | $ | 1,080 | |
Net unrecognized tax benefits1 | $ | 665 | | $ | 549 | | $ | 746 | |
1.Represent ending unrecognized tax benefits adjusted for the impact of the federal benefit of state issues, competent authority arrangements and foreign tax credit offsets. If recognized, these net benefits would favorably impact the effective tax rate in future periods.
It is reasonably possible that significant changes in the balance of unrecognized tax benefits may occur within the next 12 months. At this time, however, it is not possible to reasonably estimate the expected change to the total amount
of unrecognized tax benefits and the impact on the Firm’s effective tax rate over the next 12 months.
Interest Expense (Benefit) Associated with Unrecognized Tax Benefits, Net of Federal and State Income Tax Benefits
| | | | | | | | | | | |
| $ in millions | 2020 | 2019 | 2018 |
| Recognized in income statements | $ | 56 | | $ | 8 | | $ | (40) | |
| Accrued at end of period | 134 | | 92 | | 91 | |
Interest and penalties related to unrecognized tax benefits are recognized as a component of the provision for income taxes. Penalties related to unrecognized tax benefits for the years mentioned above were immaterial.
Earliest Tax Year Subject to Examination in Major Tax Jurisdictions
| | | | | |
| Jurisdiction | Tax Year |
| U.S. | 2017 |
| New York State and New York City | 2010 |
| Hong Kong | 2014 |
| U.K. | 2011 |
| Japan | 2015 |
The Firm is under continuous examination by the IRS and other tax authorities in certain countries, such as Japan and the U.K., and in states and localities in which it has significant business operations, such as New York.
The Firm believes that the resolution of these tax examinations will not have a material effect on the annual financial statements, although a resolution could have a material impact in the income statement and on the effective tax rate for any period in which such resolutions occur.
23. Segment, Geographic and Revenue Information
The Firm structures its segments primarily based upon the nature of the financial products and services provided to customers and its management organization. The Firm provides a wide range of financial products and services to its customers in each of its business segments: Institutional Securities, Wealth Management and Investment Management. For a further discussion of the business segments, see Note 1.
Revenues and expenses directly associated with each respective business segment are included in determining its operating results. Other revenues and expenses that are not directly attributable to a particular business segment are generally allocated based on each business segment’s respective net revenues, non-interest expenses or other relevant measures.
As a result of revenues and expenses from transactions with other operating segments being treated as transactions with external parties for purposes of segment disclosures, the Firm includes an Intersegment Eliminations category to reconcile the business segment results to the consolidated results.
| | | | | | | | |
| 145 | December 2020 Form 10-K |
| | | | | |
| |
| Notes to Consolidated Financial Statements | |
Selected Financial Information by Business Segment
| | | | | | | | | | | | | | | | | |
| | 2020 |
| $ in millions | IS | WM | IM | I/E | Total |
| Investment banking | $ | 7,204 | | $ | 559 | | $ | — | | $ | (89) | | $ | 7,674 | |
| Trading | 13,106 | | 844 | | (34) | | 76 | | 13,992 | |
| Investments | 166 | | 12 | | 808 | | — | | 986 | |
Commissions and fees1 | 2,935 | | 2,291 | | 1 | | (376) | | 4,851 | |
Asset management1 | 461 | | 10,955 | | 3,013 | | (157) | | 14,272 | |
| Other | (214) | | 372 | | (39) | | (9) | | 110 | |
| Total non-interest revenues | 23,658 | | 15,033 | | 3,749 | | (555) | | 41,885 | |
| Interest income | 5,809 | | 4,771 | | 14 | | (432) | | 10,162 | |
| Interest expense | 3,519 | | 749 | | 29 | | (448) | | 3,849 | |
| Net interest | 2,290 | | 4,022 | | (15) | | 16 | | 6,313 | |
| Net revenues | $ | 25,948 | | $ | 19,055 | | $ | 3,734 | | $ | (539) | | $ | 48,198 | |
Income from continuing operations before income taxes | $ | 9,151 | | $ | 4,387 | | $ | 870 | | $ | 10 | | $ | 14,418 | |
| Provision for income taxes | 2,040 | | 1,026 | | 171 | | 2 | | 3,239 | |
Income from continuing operations | 7,111 | | 3,361 | | 699 | | 8 | | 11,179 | |
Income (loss) from discontinued operations, net of income taxes | — | | — | | — | | — | | — | |
| Net income | 7,111 | | 3,361 | | 699 | | 8 | | 11,179 | |
Net income applicable to noncontrolling interests | 99 | | — | | 84 | | — | | 183 | |
Net income applicable to Morgan Stanley | $ | 7,012 | | $ | 3,361 | | $ | 615 | | $ | 8 | | $ | 10,996 | |
| | | | | | | | | | | | | | | | | |
| | 2019 |
| $ in millions | IS | WM | IM | I/E | Total |
| Investment banking | $ | 5,734 | | $ | 509 | | $ | — | | $ | (80) | | $ | 6,163 | |
| Trading | 10,318 | | 734 | | (8) | | 51 | | 11,095 | |
| Investments | 325 | | 2 | | 1,213 | | — | | 1,540 | |
Commissions and fees1 | 2,484 | | 1,726 | | 1 | | (292) | | 3,919 | |
Asset management1 | 413 | | 10,199 | | 2,629 | | (158) | | 13,083 | |
| Other | 632 | | 345 | | (46) | | (6) | | 925 | |
Total non-interest revenues | 19,906 | | 13,515 | | 3,789 | | (485) | | 36,725 | |
| Interest income | 12,193 | | 5,467 | | 20 | | (582) | | 17,098 | |
| Interest expense | 11,713 | | 1,245 | | 46 | | (600) | | 12,404 | |
| Net interest | 480 | | 4,222 | | (26) | | 18 | | 4,694 | |
| Net revenues | $ | 20,386 | | $ | 17,737 | | $ | 3,763 | | $ | (467) | | $ | 41,419 | |
Income from continuing operations before income taxes2 | $ | 5,490 | | $ | 4,832 | | $ | 985 | | $ | (6) | | $ | 11,301 | |
| Provision for income taxes | 769 | | 1,104 | | 193 | | (2) | | 2,064 | |
| Income from continuing operations | 4,721 | | 3,728 | | 792 | | (4) | | 9,237 | |
Income (loss) from discontinued operations, net of income taxes | — | | — | | — | | — | | — | |
| Net income | 4,721 | | 3,728 | | 792 | | (4) | | 9,237 | |
Net income applicable to noncontrolling interests | 122 | | — | | 73 | | — | | 195 | |
Net income applicable to Morgan Stanley | $ | 4,599 | | $ | 3,728 | | $ | 719 | | $ | (4) | | $ | 9,042 | |
| | | | | | | | | | | | | | | | | |
| | 2018 |
| $ in millions | IS | WM | IM | I/E | Total |
| Investment banking | $ | 6,088 | | $ | 475 | | $ | — | | $ | (81) | | $ | 6,482 | |
| Trading | 11,191 | | 279 | | 25 | | 56 | | 11,551 | |
| Investments | 182 | | 1 | | 254 | | — | | 437 | |
Commissions and fees1 | 2,671 | | 1,804 | | — | | (285) | | 4,190 | |
Asset management1 | 421 | | 10,158 | | 2,468 | | (149) | | 12,898 | |
| Other | 535 | | 248 | | (30) | | (10) | | 743 | |
Total non-interest revenues | 21,088 | | 12,965 | | 2,717 | | (469) | | 36,301 | |
| Interest income | 9,271 | | 5,498 | | 57 | | (934) | | 13,892 | |
| Interest expense | 9,777 | | 1,221 | | 28 | | (940) | | 10,086 | |
| Net interest | (506) | | 4,277 | | 29 | | 6 | | 3,806 | |
| Net revenues | $ | 20,582 | | $ | 17,242 | | $ | 2,746 | | $ | (463) | | $ | 40,107 | |
Income from continuing operations before income taxes | $ | 6,260 | | $ | 4,521 | | $ | 464 | | $ | (8) | | $ | 11,237 | |
| Provision for income taxes | 1,230 | | 1,049 | | 73 | | (2) | | 2,350 | |
Income from continuing operations | 5,030 | | 3,472 | | 391 | | (6) | | 8,887 | |
Income (loss) from discontinued operations, net of income taxes | (6) | | — | | 2 | | — | | (4) | |
| Net income | 5,024 | | 3,472 | | 393 | | (6) | | 8,883 | |
Net income applicable to noncontrolling interests | 118 | | — | | 17 | | — | | 135 | |
Net income applicable to Morgan Stanley | $ | 4,906 | | $ | 3,472 | | $ | 376 | | $ | (6) | | $ | 8,748 | |
I/E–Intersegment Eliminations
1.Substantially all revenues are from contracts with customers.
2.The fourth quarter of 2019 included specific severance-related costs of approximately $172 million, which are included in Compensation and benefits expenses in the Income statement. These costs were recorded in the business segments approximately as follows: Institutional Securities $124 million, Wealth Management $37 million and Investment Management $11 million.
Detail of Investment Banking Revenues
| | | | | | | | | | | |
| $ in millions | 2020 | 2019 | 2018 |
| Institutional Securities—Advisory | $ | 2,008 | | $ | 2,116 | | $ | 2,436 | |
| Institutional Securities—Underwriting | 5,196 | | 3,618 | | 3,652 | |
| Firm Investment banking revenues from contracts with customers | 92 | % | 90 | % | 86 | % |
Trading Revenues by Product Type
| | | | | | | | | | | |
| $ in millions | 2020 | 2019 | 2018 |
| Interest rate | $ | 2,978 | | $ | 2,773 | | $ | 2,696 | |
| Foreign exchange | 902 | | 395 | | 914 | |
Equity security and index1 | 6,200 | | 5,246 | | 6,157 | |
| Commodity and other | 1,771 | | 1,438 | | 1,174 | |
| Credit | 2,141 | | 1,243 | | 610 | |
| Total | $ | 13,992 | | $ | 11,095 | | $ | 11,551 | |
1.Dividend income is included within equity security and index contracts.
The previous table summarizes realized and unrealized gains and losses, from derivative and non-derivative financial instruments, included in Trading revenues in the income statements. The Firm generally utilizes financial instruments across a variety of product types in connection with its market-making and related risk management strategies. The trading revenues presented in the table are not representative of the manner in which the Firm manages its business activities and are prepared in a manner similar to the presentation of trading revenues for regulatory reporting purposes.
| | | | | | | | |
| December 2020 Form 10-K | 146 | |
| | | | | |
| |
| Notes to Consolidated Financial Statements | |
Investment Management Investments Revenues—Net Cumulative Unrealized Carried Interest
| | | | | | | | |
| $ in millions | At
December 31,
2020 | At
December 31,
2019 |
Net cumulative unrealized performance-based fees at risk of reversing | $ | 735 | | $ | 774 | |
The Firm’s portion of net cumulative performance-based fees in the form of unrealized carried interest, for which the Firm is not obligated to pay compensation, is at risk of reversing when the return in certain funds fall below specified performance targets. See Note 15 for information regarding general partner guarantees, which include potential obligations to return performance fee distributions previously received.
Investment Management Asset Management Revenues—Reduction of Fees Due to Fee Waivers
| | | | | | | | | | | |
| $ in millions | 2020 | 2019 | 2018 |
| Fee waivers | $ | 135 | | $ | 43 | | $ | 56 | |
The Firm waives a portion of its fees in the Investment Management business segment from certain registered money market funds that comply with the requirements of Rule 2a-7 of the Investment Company Act of 1940.
Certain Other Fee Waivers
Separately, the Firm’s employees, including its senior officers, may participate on the same terms and conditions as other investors in certain funds that the Firm sponsors, primarily for client investment, and the Firm may waive or lower applicable fees and charges for its employees.
Net Revenues by Region
| | | | | | | | | | | |
| $ in millions | 2020 | 2019 | 2018 |
| Americas | $ | 35,017 | | $ | 30,226 | | $ | 29,301 | |
| EMEA | 6,430 | | 6,061 | | 6,092 | |
| Asia | 6,751 | | 5,132 | | 4,714 | |
| Total | $ | 48,198 | | $ | 41,419 | | $ | 40,107 | |
Income from Continuing Operations before Income Tax Expense (Benefit)
| | | | | | | | | | | |
| $ in millions | 2020 | 2019 | 2018 |
| U.S. | $ | 10,027 | | $ | 9,464 | | $ | 7,804 | |
Non-U.S.1 | 4,391 | | 1,837 | | 3,433 | |
| Total | $ | 14,418 | | $ | 11,301 | | $ | 11,237 | |
1.Non-U.S. income is defined as income generated from operations located outside the U.S.
Net Discrete Tax Provisions (Benefits) by Segment
| | | | | | | | | | | |
| $ in millions | 2020 | 2019 | 2018 |
| IS | $ | (68) | | $ | (400) | | $ | (286) | |
| WM | (50) | | (50) | | (50) | |
| IM | (4) | | (25) | | (32) | |
| Total | $ | (122) | | $ | (475) | | $ | (368) | |
The Firm operates in both U.S. and non-U.S. markets. The Firm’s non-U.S. business activities are principally conducted and managed through EMEA and Asia locations. The net revenues disclosed in the previous table reflect the regional view of the Firm’s consolidated net revenues on a managed basis, based on the following methodology:
Institutional Securities: client location for advisory and equity underwriting, syndicate desk location for debt underwriting, trading desk location for sales and trading.
Wealth Management: representatives operate in the Americas.
Investment Management: client location, except certain closed-end funds, which are based on asset location.
Revenues Recognized from Prior Services
| | | | | | | | |
| $ in millions | 2020 | 2019 |
Non-interest revenues | $ | 2,298 | | $ | 2,705 | |
The previous table includes revenues from contracts with customers recognized where some or all services were performed in prior periods and are primarily composed of investment banking advisory fees and distribution fees.
Receivables from Contracts with Customers
| | | | | | | | |
| $ in millions | At
December 31,
2020 | At
December 31,
2019 |
| Customer and other receivables | $ | 3,200 | | $ | 2,916 | |
Receivables from contracts with customers, which are included within Customer and other receivables in the balance sheets, arise when the Firm has both recorded revenues and has the right per the contract to bill the customer.
Assets by Business Segment
| | | | | | | | |
| $ in millions | At
December 31,
2020 | At
December 31,
2019 |
| Institutional Securities | $ | 753,322 | | $ | 691,201 | |
| Wealth Management | 355,595 | | 197,682 | |
| Investment Management | 6,945 | | 6,546 | |
Total1 | $ | 1,115,862 | | $ | 895,429 | |
1. Parent assets have been fully allocated to the business segments.
Total Assets by Region
| | | | | | | | |
| $ in millions | At
December 31,
2020 | At
December 31,
2019 |
| Americas | $ | 815,048 | | $ | 622,979 | |
| EMEA | 194,598 | | 185,093 | |
| Asia | 106,216 | | 87,357 | |
| Total | $ | 1,115,862 | | $ | 895,429 | |
| | | | | | | | |
| 147 | December 2020 Form 10-K |
| | | | | |
| |
| Notes to Consolidated Financial Statements | |
24. Parent Company
Parent Company Only—Condensed Income Statements and Comprehensive Income Statements
| | | | | | | | | | | |
| $ in millions | 2020 | 2019 | 2018 |
| Revenues | | | |
| Dividends from bank subsidiaries | $ | 2,811 | | $ | 3,531 | | $ | 2,969 | |
Dividends from BHC and non-bank subsidiaries | 1,170 | | 1,998 | | 2,004 | |
| Total dividends from subsidiaries | 3,981 | | 5,529 | | 4,973 | |
| Trading | (244) | | (54) | | 54 | |
| Other | 51 | | 80 | | (5) | |
| Total non-interest revenues | 3,788 | | 5,555 | | 5,022 | |
| Interest income | 3,666 | | 5,121 | | 5,172 | |
| Interest expense | 3,087 | | 4,661 | | 4,816 | |
| Net interest | 579 | | 460 | | 356 | |
| Net revenues | 4,367 | | 6,015 | | 5,378 | |
| Non-interest expenses | 387 | | 300 | | 225 | |
| Income before income taxes | 3,980 | | 5,715 | | 5,153 | |
| Provision for (benefit from) income taxes | (109) | | (73) | | 22 | |
Net income before undistributed gain
of subsidiaries | 4,089 | | 5,788 | | 5,131 | |
| Undistributed gain of subsidiaries | 6,907 | | 3,254 | | 3,617 | |
| Net income | 10,996 | | 9,042 | | 8,748 | |
Other comprehensive income (loss), net of tax: | | | |
| Foreign currency translation adjustments | 102 | | (8) | | (114) | |
Change in net unrealized gains (losses) on available-for-sale securities | 1,580 | | 1,137 | | (272) | |
| Pensions and other | 146 | | (66) | | 137 | |
| Change in net debt valuation adjustment | (1,002) | | (1,559) | | 1,454 | |
| Comprehensive income | $ | 11,822 | | $ | 8,546 | | $ | 9,953 | |
| Net income | $ | 10,996 | | $ | 9,042 | | $ | 8,748 | |
| Preferred stock dividends and other | 496 | | 530 | | 526 | |
Earnings applicable to Morgan Stanley common shareholders | $ | 10,500 | | $ | 8,512 | | $ | 8,222 | |
Parent Company Only—Condensed Balance Sheets
| | | | | | | | |
| $ in millions, except share data | At
December 31,
2020 | At
December 31,
2019 |
| Assets | | |
| Cash and cash equivalents | $ | 7,102 | | $ | 8,010 | |
| Trading assets at fair value | 6,862 | | 5,747 | |
Investment securities (includes $20,037 and $19,824 at fair value; $24,248 and $4,606 were pledged to various parties) | 39,225 | | 37,253 | |
| Securities purchased under agreement to resell to affiliates | 34,698 | | 10,114 | |
| Advances to subsidiaries: | | |
| Bank and BHC | 22,692 | | 27,667 | |
| Non-bank | 121,731 | | 104,345 | |
| Equity investments in subsidiaries: | | |
| Bank and BHC | 52,951 | | 36,093 | |
| Non-bank | 47,450 | | 43,667 | |
| Other assets | 454 | | 244 | |
| Total assets | $ | 333,165 | | $ | 273,140 | |
| Liabilities | | |
| Trading liabilities at fair value | $ | 1,623 | | $ | 1,130 | |
| Securities sold under agreements to repurchase from affiliates | 24,349 | | 4,631 | |
Payables to and advances from subsidiaries | 43,252 | | 35,470 | |
| Other liabilities and accrued expenses | 2,181 | | 2,153 | |
Borrowings (includes $18,804 and $20,461 at fair value) | 159,979 | | 148,207 | |
| Total liabilities | 231,384 | | 191,591 | |
| Commitments and contingent liabilities (see Note 15) | |
| Equity | | |
| Preferred stock | 9,250 | | 8,520 | |
Common stock, $0.01 par value: | | |
Shares authorized: 3,500,000,000; Shares issued: 2,038,893,979; Shares outstanding: 1,809,624,144 and 1,593,973,680 | 20 | | 20 | |
| Additional paid-in capital | 25,546 | | 23,935 | |
| Retained earnings | 78,694 | | 70,589 | |
| Employee stock trusts | 3,043 | | 2,918 | |
Accumulated other comprehensive income (loss) | (1,962) | | (2,788) | |
Common stock held in treasury at cost, $0.01 par value (229,269,835 and 444,920,299 shares) | (9,767) | | (18,727) | |
Common stock issued to employee stock trusts | (3,043) | | (2,918) | |
| Total shareholders’ equity | 101,781 | | 81,549 | |
| Total liabilities and equity | $ | 333,165 | | $ | 273,140 | |
| | | | | | | | |
| December 2020 Form 10-K | 148 | |
| | | | | |
| |
| Notes to Consolidated Financial Statements | |
Parent Company Only—Condensed Cash Flow Statements
| | | | | | | | | | | |
| $ in millions | 2020 | 2019 | 2018 |
| | | |
| | | |
| | | |
| | | |
| | | |
| | | |
Net cash provided by (used for) operating activities | $ | 14,202 | | $ | 24,175 | | $ | (1,136) | |
| Cash flows from investing activities | | | |
| Proceeds from (payments for): | | | |
| Investment securities: | | | |
| Purchases | (9,310) | | (22,408) | | (8,155) | |
| Proceeds from sales | 2,013 | | 4,671 | | 1,252 | |
| Proceeds from paydowns and maturities | 5,651 | | 3,157 | | 3,729 | |
Securities purchased under agreements to resell with affiliates | (24,584) | | 15,422 | | 13,057 | |
Securities sold under agreements to repurchase with affiliates | 19,719 | | 4,631 | | (8,753) | |
| Advances to and investments in subsidiaries | (13,832) | | (9,210) | | 11,841 | |
Net cash provided by (used for) investing activities | (20,343) | | (3,737) | | 12,971 | |
| Cash flows from financing activities | | | |
| Proceeds from: | | | |
Issuance of preferred stock, net of issuance costs | — | | 497 | | — | |
| Issuance of Borrowings | 25,587 | | 8,337 | | 14,918 | |
| Payments for: | | | |
| Borrowings | (22,105) | | (24,282) | | (21,418) | |
Repurchases of common stock and employee tax withholdings | (1,890) | | (5,954) | | (5,566) | |
| Cash dividends | (2,739) | | (2,627) | | (2,375) | |
| Net change in advances from subsidiaries | 7,194 | | 4,378 | | 2,122 | |
| Other financing activities | (498) | | 12 | | — | |
Net cash provided by (used for) financing activities | 5,549 | | (19,639) | | (12,319) | |
Effect of exchange rate changes on cash and cash equivalents | (316) | | (271) | | (166) | |
Net increase (decrease) in cash and cash equivalents | (908) | | 528 | | (650) | |
Cash and cash equivalents, at beginning of period | 8,010 | | 7,482 | | 8,132 | |
| Cash and cash equivalents, at end of period | $ | 7,102 | | $ | 8,010 | | $ | 7,482 | |
| Cash and cash equivalents: | | | |
| Cash and due from banks | $ | 20 | | $ | 9 | | $ | 6 | |
| Deposits with bank subsidiaries | 7,082 | | 8,001 | | 7,476 | |
| Cash and cash equivalents, at end of period | $ | 7,102 | | $ | 8,010 | | $ | 7,482 | |
| Restricted cash | $ | 381 | | $ | — | | $ | — | |
| Supplemental Disclosure of Cash Flow Information |
| Cash payments for: | | | |
| Interest | $ | 3,472 | | $ | 4,677 | | $ | 4,798 | |
Income taxes, net of refunds1 | 1,364 | | 1,186 | | 437 | |
1.Represents total payments, net of refunds, made to various tax authorities and includes taxes paid on behalf of certain subsidiaries that are subsequently settled between the Parent Company and these subsidiaries. The settlements received from subsidiaries were $1.6 billion, $1.6 billion and $1.6 billion for 2020, 2019 and 2018, respectively.
On November 25, 2019, the Parent Company issued $500 million of Series L Preferred Stock, and on January 15, 2020, the Parent Company redeemed in whole its outstanding Series G Preferred Stock. For further information on preferred stock, see Note 18.
Parent Company’s Borrowings with Original Maturities Greater than One Year
| | | | | | | | |
| $ in millions | At
December 31,
2020 | At
December 31,
2019 |
| Senior | $ | 148,885 | | $ | 137,138 | |
| Subordinated | 11,094 | | 10,570 | |
| Total | $ | 159,979 | | $ | 147,708 | |
Transactions with Subsidiaries
The Parent Company has transactions with its consolidated subsidiaries determined on an agreed-upon basis and has guaranteed certain unsecured lines of credit and contractual obligations on certain of its consolidated subsidiaries.
Guarantees
In the normal course of its business, the Parent Company guarantees certain of its subsidiaries’ obligations on a transaction-by-transaction basis under various financial arrangements. The Parent Company has issued guarantees on behalf of its subsidiaries to various U.S. and non-U.S. exchanges and clearinghouses that trade and clear securities and/or futures contracts. Under these guarantee arrangements, the Parent Company may be required to pay the financial obligations of its subsidiaries related to business transacted on or with the exchanges and clearinghouses in the event of a subsidiary’s default on its obligations to the exchange or the clearinghouse. The Parent Company has not recorded any contingent liability in its condensed financial statements for these arrangements and believes that any potential requirements to make payments under these arrangements are remote.
The Parent Company also, in the normal course of business, provides standard indemnities to counterparties on behalf of its subsidiaries for taxes, including U.S. and foreign withholding taxes, on interest and other payments made on derivatives, securities and stock lending transactions, and certain annuity products, and may also provide indemnities to or on behalf of affiliates from time to time for other arrangements. These indemnity payments could be required, as applicable, based on a change in the tax laws, change in interpretation of applicable tax rulings or claims arising from contractual relationships between affiliates. Certain contracts contain provisions that enable the Parent Company to terminate the agreement upon the occurrence of such events. The maximum potential amount of future payments that the Parent Company could be required to make under these indemnifications cannot be estimated. The Parent Company has not recorded any contingent liability in its condensed financial statements for these indemnifications and believes that the occurrence of any events that would trigger payments under these contracts is remote.
| | | | | | | | |
| 149 | December 2020 Form 10-K |
| | | | | |
| |
| Notes to Consolidated Financial Statements | |
Guarantees of Debt Instruments and Warrants Issued by Subsidiaries
| | | | | | | | |
| $ in millions | At
December 31,
2020 | At
December 31,
2019 |
| Aggregate balance | $ | 39,745 | | $ | 32,996 | |
Guarantees under Subsidiary Lease Obligations
| | | | | | | | |
| $ in millions | At
December 31,
2020 | At
December 31,
2019 |
Aggregate balance1 | $ | 865 | | $ | 925 | |
1.Amounts primarily relate to the U.K.
Finance Subsidiary
The Parent Company fully and unconditionally guarantees the securities issued by Morgan Stanley Finance LLC, a wholly owned finance subsidiary. No other subsidiary of the Parent Company guarantees these securities.
Resolution and Recovery Planning
As indicated in the Firm’s 2019 resolution plan submitted to the Federal Reserve and the FDIC, the Parent Company has amended and restated its support agreement with its material entities (including its wholly owned, direct subsidiary Morgan Stanley Holdings LLC (the “Funding IHC”) and certain other subsidiaries), as defined in the Firm’s 2019 resolution plan. Under the secured, amended and restated support agreement, in the event of a resolution scenario, the Parent Company would be obligated to contribute all of its material assets that can be contributed under the terms of the amended and restated support agreement (other than shares in subsidiaries of the Parent Company and certain other assets) (“Contributable Assets”) to the material entities and/or the Funding IHC. The Funding IHC would be obligated to provide capital and liquidity, as applicable, to the material entities.
| | | | | | | | |
| December 2020 Form 10-K | 150 | |
| | | | | |
| |
| Financial Data Supplement (Unaudited) | |
Average Balances and Interest Rates and Net Interest Income | | | | | | | | | | | | | | | | | | | | |
| | 2020 | 2019 |
| $ in millions | Average
Daily
Balance | Interest | Average
Rate | Average
Daily
Balance | Interest | Average
Rate |
Interest earning assets | | | | |
Investment securities1 | $ | 136,502 | | $ | 2,282 | | 1.7 | % | $ | 101,696 | | $ | 2,175 | | 2.1 | % |
Loans1 | 143,350 | | 4,142 | | 2.9 | | 121,002 | | 4,783 | | 4.0 | |
Securities purchased under agreements to resell and Securities borrowed2: |
U.S. | 130,525 | | 55 | | — | | 142,089 | | 3,378 | | 2.4 | |
Non-U.S. | 59,099 | | (249) | | (0.4) | | 76,577 | | 107 | | 0.1 | |
Trading assets, net of Trading liabilities3: | | | |
U.S. | 76,273 | | 2,000 | | 2.6 | | 77,481 | | 2,531 | | 3.3 | |
Non-U.S. | 22,604 | | 417 | | 1.8 | | 14,654 | | 368 | | 2.5 | |
Customer receivables and Other4: | | | |
U.S. | 87,775 | | 1,188 | | 1.4 | | 61,501 | | 2,697 | | 4.4 | |
Non-U.S. | 63,301 | | 327 | | 0.5 | | 58,601 | | 1,059 | | 1.8 | |
| Total | $ | 719,429 | | $ | 10,162 | | 1.4 | % | $ | 653,601 | | $ | 17,098 | | 2.6 | % |
| Interest bearing liabilities | | | | |
Deposits1 | $ | 241,487 | | $ | 953 | | 0.4 | % | $ | 180,116 | | $ | 1,885 | | 1.0 | % |
Borrowings1, 5 | 202,498 | | 3,250 | | 1.6 | | 192,770 | | 5,052 | | 2.6 | |
Securities sold under agreements to repurchase and Securities loaned6: |
U.S. | 29,983 | | 532 | | 1.8 | | 32,437 | | 1,916 | | 5.9 | |
Non-U.S. | 28,363 | | 451 | | 1.6 | | 31,808 | | 693 | | 2.2 | |
Customer payables and Other7: | | | |
U.S. | 125,982 | | (1,176) | | (0.9) | | 118,775 | | 1,792 | | 1.5 | |
Non-U.S. | 64,958 | | (161) | | (0.2) | | 65,196 | | 1,066 | | 1.6 | |
| Total | $ | 693,271 | | $ | 3,849 | | 0.6 | % | $ | 621,102 | | $ | 12,404 | | 2.0 | % |
Net interest income and net interest rate spread | $ | 6,313 | | 0.8 | % | | $ | 4,694 | | 0.6 | % |
Effect of Volume and Rate Changes on Net Interest Income
| | | | | | | | | | | |
| | 2020 versus 2019 |
| | Increase (Decrease)
Due to Change in: | |
| $ in millions | Volume | Rate | Net Change |
| Interest earning assets | | |
Investment securities1 | $ | 744 | | $ | (637) | | $ | 107 | |
Loans1 | 883 | | (1,524) | | (641) | |
Securities purchased under agreements to resell and Securities borrowed2: |
U.S. | (275) | | (3,048) | | (3,323) | |
Non-U.S. | (24) | | (332) | | (356) | |
Trading assets, net of Trading liabilities3: |
U.S. | (39) | | (492) | | (531) | |
Non-U.S. | 200 | | (151) | | 49 | |
Customer receivables and Other4: | | |
U.S. | 1,152 | | (2,661) | | (1,509) | |
Non-U.S. | 85 | | (817) | | (732) | |
| Change in interest income | $ | 2,726 | | $ | (9,662) | | $ | (6,936) | |
| Interest bearing liabilities | | |
Deposits1 | $ | 642 | | $ | (1,574) | | $ | (932) | |
Borrowings1, 5 | 255 | | (2,057) | | (1,802) | |
Securities sold under agreements to repurchase and Securities loaned6: |
U.S. | (145) | | (1,239) | | (1,384) | |
Non-U.S. | (75) | | (167) | | (242) | |
Customer payables and Other7: | | |
U.S. | 109 | | (3,077) | | (2,968) | |
Non-U.S. | (4) | | (1,223) | | (1,227) | |
| Change in interest expense | $ | 782 | | $ | (9,337) | | $ | (8,555) | |
| Change in net interest income | $ | 1,944 | | $ | (325) | | $ | 1,619 | |
| | | | | | | | |
| 151 | December 2020 Form 10-K |
| | | | | |
| |
| Financial Data Supplement (Unaudited) | |
Average Balances and Interest Rates and Net Interest Income
| | | | | | | | | | | |
| | 2018 |
| $ in millions | Average
Daily
Balance | Interest | Average
Rate |
Interest earning assets | | | |
Investment securities1 | $ | 81,977 | | $ | 1,744 | | 2.1 | % |
Loans1 | 109,681 | | 4,249 | | 3.9 | |
Securities purchased under agreements to resell and Securities borrowed2: |
U.S. | 134,223 | | 2,262 | | 1.7 | |
Non-U.S. | 86,430 | | (286) | | (0.3) | |
Trading assets, net of Trading liabilities3: |
U.S. | 57,780 | | 2,144 | | 3.7 | |
Non-U.S. | 9,014 | | 248 | | 2.8 | |
Customer receivables and Other4: |
U.S. | 73,695 | | 2,592 | | 3.5 | |
Non-U.S. | 54,396 | | 939 | | 1.7 | |
| Total | $ | 607,196 | | $ | 13,892 | | 2.3 | % |
| Interest bearing liabilities | | | |
Deposits1 | $ | 169,226 | | $ | 1,255 | | 0.7 | % |
Borrowings1, 5 | 191,692 | | 5,031 | | 2.6 | |
Securities sold under agreements to repurchase and Securities loaned6: |
U.S. | 24,426 | | 1,408 | | 5.8 | |
Non-U.S. | 37,319 | | 490 | | 1.3 | |
Customer payables and Other7: |
U.S. | 120,228 | | 1,061 | | 0.9 | |
Non-U.S. | 70,855 | | 841 | | 1.2 | |
| Total | $ | 613,746 | | $ | 10,086 | | 1.6 | % |
Net interest income and net interest rate spread | $ | 3,806 | | 0.7 | % |
Effect of Volume and Rate Changes on Net Interest Income
| | | | | | | | | | | |
| | 2019 versus 2018 |
| | Increase (Decrease)
Due to Change in: | |
| $ in millions | Volume | Rate | Net Change |
| Interest earning assets | | |
Investment securities1 | $ | 420 | | $ | 11 | | $ | 431 | |
Loans1 | 439 | | 95 | | 534 | |
Securities purchased under agreements to resell and Securities borrowed2: |
U.S. | 133 | | 983 | | 1,116 | |
Non-U.S. | 33 | | 360 | | 393 | |
Trading assets, net of Trading liabilities3: | |
U.S. | 731 | | (344) | | 387 | |
Non-U.S. | 155 | | (35) | | 120 | |
Customer receivables and Other4: | | | |
U.S. | (429) | | 534 | | 105 | |
Non-U.S. | 73 | | 47 | | 120 | |
| Change in interest income | $ | 1,555 | | $ | 1,651 | | $ | 3,206 | |
| Interest bearing liabilities | | |
Deposits1 | $ | 81 | | $ | 549 | | $ | 630 | |
Borrowings1, 5 | 28 | | (7) | | 21 | |
Securities sold under agreements to repurchase and Securities loaned6: |
U.S. | 462 | | 46 | | 508 | |
Non-U.S. | (72) | | 275 | | 203 | |
Customer payables and Other7: | | | |
U.S. | (13) | | 744 | | 731 | |
Non-U.S. | (67) | | 292 | | 225 | |
| Change in interest expense | $ | 419 | | $ | 1,899 | | $ | 2,318 | |
| Change in net interest income | $ | 1,136 | | $ | (248) | | $ | 888 | |
1.Amounts include primarily U.S. balances.
2.Includes fees paid on Securities borrowed.
3.Excludes non-interest earning assets and non-interest bearing liabilities, such as equity securities.
4.Includes Cash and cash equivalents.
5.Includes borrowings carried at fair value, whose interest expense is considered part of fair value and therefore is recorded within Trading revenues.
6.Includes fees received on Securities loaned. The annualized average rate was calculated using (a) interest expense incurred on all securities sold under agreements to repurchase and securities loaned transactions, whether or not such transactions were reported in the balance sheets and (b) net average on-balance sheet balances, which exclude certain securities-for-securities transactions
7.Includes fees received from prime brokerage customers for stock loan transactions entered into to cover customers’ short positions.
Deposits
| | | | | | | | | | | | | | | | | | | | |
| | Average Daily Deposits |
| | 2020 | 2019 | 2018 |
| $ in millions | Average
Amount | Average
Rate | Average
Amount | Average
Rate | Average
Amount | Average
Rate |
Deposits1: |
| Savings | $ | 202,035 | | 0.1 | % | $ | 144,017 | | 0.6 | % | $ | 142,753 | | 0.4 | % |
| Time | 39,452 | | 1.8 | % | 36,099 | | 2.8 | % | 26,473 | | 2.4 | % |
| Total | $ | 241,487 | | 0.4 | % | $ | 180,116 | | 1.0 | % | $ | 169,226 | | 0.7 | % |
1.The Firm’s deposits were primarily held in U.S. offices.
| | | | | | | | |
| December 2020 Form 10-K | 152 | |
| | | | | |
| |
| Financial Data Supplement (Unaudited) | |
Ratios
| | | | | | | | | | | |
| 2020 | 2019 | 2018 |
| Net income to average total assets | 1.1 | % | 1.0 | % | 1.0 | % |
ROE1 | 13.1 | % | 11.7 | % | 11.8 | % |
Return on total equity2 | 12.4 | % | 11.1 | % | 11.1 | % |
Dividend payout ratio3 | 21.7 | % | 25.0 | % | 23.3 | % |
| Total average common equity to average total assets | 8.2 | % | 8.2 | % | 8.1 | % |
| Total average equity to average total assets | 9.1 | % | 9.2 | % | 9.1 | % |
Net charge-off ratio4 | 0.07 | % | — | % | (0.05) | % |
1.ROE represents Earnings applicable to Morgan Stanley common shareholders as a percentage of average common equity.
2.Return on total equity represents Net income applicable to Morgan Stanley as a percentage of average total equity.
3.Dividend payout ratio represents dividends declared per common share as a percentage of earnings per diluted common share.
4.Net charge-off ratio represents gross charge-offs net of recoveries divided by total average loans held for investment before ACL.
Securities Sold under Agreements to Repurchase and Securities Loaned
| | | | | | | | | | | |
| $ in millions | 2020 | 2019 | 2018 |
| Period-end balance | $ | 58,318 | | $ | 62,706 | | $ | 61,667 | |
Average balance1 | 58,346 | | 64,245 | | 61,745 | |
| Maximum balance at any month-end | 61,336 | | 78,327 | | 72,161 | |
Weighted average interest rate during the period2 | 1.7 | % | 4.1 | % | 3.1 | % |
Weighted average interest rate on period-end balance2 | 0.6 | % | 4.0 | % | 4.1 | % |
1.The Firm calculated its average balances based upon daily amounts.
2.The weighted average interest rate was calculated using (a) interest expense incurred on all securities sold under agreements to repurchase and securities loaned transactions, whether or not such transactions were reported in the balance sheets and (b) net average or period-end balances excluding certain securities-for-securities transactions.
Cross-Border Outstandings
| | | | | | | | | | | | | | | | | |
| | At December 31, 2020 |
| $ in millions | Banks | Governments | Non-banking
Financial
Institutions | Other | Total |
| Cayman Islands | $ | 20 | | $ | 2 | | $ | 40,347 | | $ | 12,477 | | $ | 52,846 | |
| Japan | 11,592 | | 8,659 | | 26,340 | | 6,013 | | 52,604 | |
| United Kingdom | 11,659 | | 12,079 | | 17,796 | | 8,561 | | 50,095 | |
| France | 3,569 | | 3,552 | | 27,078 | | 8,474 | | 42,673 | |
| Germany | 1,699 | | 3,715 | | 6,919 | | 5,457 | | 17,790 | |
| Ireland | 123 | | 65 | | 10,816 | | 4,232 | | 15,236 | |
| China | 1,122 | | 424 | | 678 | | 11,863 | | 14,087 | |
| Canada | 7,624 | | 507 | | 1,600 | | 3,299 | | 13,030 | |
| Brazil | 1,337 | | 3,587 | | 1,339 | | 6,656 | | 12,919 | |
| | | | | |
| | | | | |
| | | | | |
| | | | | |
| | | | | | | | | | | | | | | | | |
| At December 31, 2019 |
| $ in millions | Banks | Governments | Non-banking
Financial
Institutions | Other | Total |
| Japan | $ | 18,282 | | $ | 7,146 | | $ | 20,376 | | $ | 11,565 | | $ | 57,369 | |
| U.K. | 6,021 | | 11,515 | | 15,623 | | 10,431 | | 43,590 | |
| Cayman Islands | 12 | | — | | 24,693 | | 5,987 | | 30,692 | |
| France | 4,454 | | 1,927 | | 9,447 | | 6,363 | | 22,191 | |
| Canada | 6,794 | | 1,205 | | 2,606 | | 4,163 | | 14,768 | |
| Ireland | 274 | | 126 | | 9,161 | | 4,410 | | 13,971 | |
European Central Bank | — | | 11,464 | | — | | — | | 11,464 | |
| China | 1,451 | | 168 | | 1,320 | | 7,907 | | 10,846 | |
| Brazil | 2,765 | | 2,116 | | 1,287 | | 4,509 | | 10,677 | |
| Luxembourg | 82 | | 27 | | 7,596 | | 1,947 | | 9,652 | |
| Australia | 2,265 | | 2,366 | | 2,481 | | 2,486 | | 9,598 | |
| Netherlands | 2,149 | | 107 | | 2,163 | | 4,788 | | 9,207 | |
| Germany | 1,210 | | 838 | | 2,444 | | 4,471 | | 8,963 | |
| | | | | | | | | | | | | | | | | |
| | At December 31, 2018 |
| $ in millions | Banks | Governments | Non-banking
Financial
Institutions | Other | Total |
| Japan | $ | 16,130 | | $ | 14,974 | | $ | 30,301 | | $ | 9,951 | | $ | 71,356 | |
| U.K. | 3,978 | 7,683 | 20,168 | 11,083 | 42,912 | |
| Cayman Islands | 14 | — | 28,164 | 5,342 | 33,520 | |
| France | 3,750 | 1,420 | 17,343 | 6,584 | 29,097 | |
| Canada | 6,808 | 2,153 | 2,005 | 2,455 | 13,421 | |
| Ireland | 664 | 24 | 8,466 | 4,191 | 13,345 | |
European Central Bank | — | 12,008 | — | — | 12,008 | |
| Brazil | 2,464 | 5,074 | 579 | 2,133 | 10,250 | |
| Germany | 822 | 1,499 | 4,137 | 3,022 | 9,480 | |
| Luxembourg | 101 | 291 | 7,139 | 1,289 | 8,820 | |
Cross-border outstandings are based upon the FFIEC regulatory guidelines for reporting cross-border information and represent the amounts that we may not be able to obtain from a foreign country due to country-specific events, including unfavorable economic and political conditions, economic and social instability, and changes in government policies. Claims include cash, customer and other receivables, securities purchased under agreements to resell, securities borrowed and cash trading instruments, but exclude commitments. Securities purchased under agreements to resell and securities borrowed are presented based on the domicile of the counterparty, without reduction for related securities collateral held. For information on the Firm’s country risk exposure, see “Quantitative and Qualitative Disclosures about Risk—Country and Other Risks.”
There can be substantial differences between our cross-border risk exposure and our country risk exposure. For instance, unlike the country risk exposure, our cross-border risk exposure does not include the effect of certain risk mitigants. In addition, the basis for determining the domicile of the cross-border risk exposure is different from the basis for determining the country risk exposure. Cross-border risk exposure is reported based on the country of jurisdiction for the obligor or guarantor. For country risk exposure, we consider factors in addition to that of country of jurisdiction, including physical location of operations or assets, location
| | | | | | | | |
| 153 | December 2020 Form 10-K |
| | | | | |
| |
| Financial Data Supplement (Unaudited) | |
and source of cash flows or revenues, and location of collateral (if applicable), in order to determine the basis for country risk exposure. Furthermore, cross-border risk exposure incorporates CDS only where protection is purchased, while country risk exposure incorporates CDS where protection is purchased or sold.
The cross-border outstandings tables set forth cross-border outstandings for each country, excluding derivative exposure, in which cross-border outstandings exceed 1% of the Firm’s consolidated assets or 20% of the Firm’s total capital, whichever is less, in accordance with the FFIEC guidelines.
| | | | | |
| $ in millions | Cross-Border Exposure1 |
| At December 31, 2020 | |
European Central Bank, Australia, Luxembourg, Republic of Korea, and Netherlands | $ | 50,420 | |
| At December 31, 2019 | |
| Switzerland, Republic of Korea and Taiwan | $ | 21,947 | |
| At December 31, 2018 | |
| Netherlands | $ | 7,338 | |
1.Cross-border exposure, including derivative contracts, that exceeds 0.75% but does not exceed 1% of the Firm’s consolidated assets.
| | | | | | | | |
| December 2020 Form 10-K | 154 | |
| | | | | |
| |
| Glossary of Common Terms and Acronyms | |
| | | | | |
| |
| |
| ABS | Asset-backed securities |
| |
| ACL | Allowance for credit losses |
| |
| AFS | Available-for-sale |
| |
| AML | Anti-money laundering |
| |
| AOCI | Accumulated other comprehensive income (loss) |
| |
| AUM | Assets under management or supervision |
| |
| Balance sheets | Consolidated balance sheets |
| |
| BHC | Bank holding company |
| |
| bps | Basis points; one basis point equals 1/100th of 1% |
| |
| Cash flow statements | Consolidated cash flow statements |
| |
| CCAR | Comprehensive Capital Analysis and Review |
| |
| CCyB | Countercyclical capital buffer |
| |
| CDO | Collateralized debt obligation(s), including Collateralized loan obligation(s) |
| |
| CDS | Credit default swaps |
| |
| CECL | Current Expected Credit Losses, as calculated under the Financial Instruments—Credit Losses accounting update |
| |
| CFTC | U.S. Commodity Futures Trading Commission |
| |
| CLN | Credit-linked note(s) |
| |
| CLO | Collateralized loan obligation(s) |
| |
| CMBS | Commercial mortgage-backed securities |
| |
| CMO | Collateralized mortgage obligation(s) |
| |
| CVA | Credit valuation adjustment |
| |
| DVA | Debt valuation adjustment |
| |
| EBITDA | Earnings before interest, taxes, depreciation and amortization |
| |
| ELN | Equity-linked note(s) |
| |
| EMEA | Europe, Middle East and Africa |
| |
| EPS | Earnings per common share |
| |
| E.U. | European Union |
| |
| FDIC | Federal Deposit Insurance Corporation |
| |
| | | | | |
| FFELP | Federal Family Education Loan Program |
| |
| FFIEC | Federal Financial Institutions Examination Council |
| |
| FHC | Financial Holding Company |
| |
| FICC | Fixed Income Clearing Corporation |
| |
| FICO | Fair Isaac Corporation |
| |
| Financial statements | Consolidated financial statements |
| |
| FVA | Funding valuation adjustment |
| |
| |
| |
| G-SIB | Global systemically important banks |
| |
| HELOC | Home Equity Line of Credit |
| |
| HQLA | High-quality liquid assets |
| |
| HTM | Held-to-maturity |
| |
| I/E | Intersegment eliminations |
| |
| IHC | Intermediate holding company |
| |
| IM | Investment Management |
| |
Income
statements | Consolidated income statements |
| |
| IRS | Internal Revenue Service |
| |
| IS | Institutional Securities |
| |
| LCR | Liquidity coverage ratio, as adopted by the U.S. banking agencies |
| |
| LIBOR | London Interbank Offered Rate |
| |
| LTV | Loan-to-value |
| |
| M&A | Merger, acquisition and restructuring transaction |
| |
| MSBNA | Morgan Stanley Bank, N.A. |
| |
| MS&Co. | Morgan Stanley & Co. LLC |
| |
| MSIP | Morgan Stanley & Co. International plc |
| |
| MSMS | Morgan Stanley MUFG Securities Co., Ltd. |
| |
| MSPBNA | Morgan Stanley Private Bank, National Association |
| |
| MSSB | Morgan Stanley Smith Barney LLC |
| |
| MUFG | Mitsubishi UFJ Financial Group, Inc. |
| |
| MUMSS | Mitsubishi UFJ Morgan Stanley Securities Co., Ltd. |
| |
| | | | | | | | |
| 155 | December 2020 Form 10-K |
| | | | | |
| |
| Glossary of Common Terms and Acronyms | |
| | | | | |
| MWh | Megawatt hour |
| |
| N/A | Not Applicable |
| |
| N/M | Not Meaningful |
| |
| NAV | Net asset value |
| |
| Non-GAAP | Non-generally accepted accounting principles |
| |
| NSFR | Net stable funding ratio, as adopted by the U.S. banking agencies |
| |
| OCC | Office of the Comptroller of the Currency |
| |
| OCI | Other comprehensive income (loss) |
| |
| OIS | Overnight index swap |
| |
| OTC | Over-the-counter |
| |
| PRA | Prudential Regulation Authority |
| |
| PSU | Performance-based stock unit |
| |
| RMBS | Residential mortgage-backed securities |
| |
| ROE | Return on average common equity |
| |
| ROTCE | Return on average tangible common equity |
| |
| ROU | Right-of-use |
| |
| RSU | Restricted stock unit |
| |
| | | | | |
| RWA | Risk-weighted assets |
| |
| SEC | U.S. Securities and Exchange Commission |
| |
| SLR | Supplementary leverage ratio |
| |
| SOFR | Secured Overnight Financing Rate |
| |
| S&P | Standard & Poor’s |
| |
| SPE | Special purpose entity |
| |
| SPOE | Single point of entry |
| |
| TDR | Troubled debt restructuring |
| |
| TLAC | Total loss-absorbing capacity |
| |
| U.K. | United Kingdom |
| |
| UPB | Unpaid principal balance |
| |
| U.S. | United States of America |
| |
| U.S. GAAP | Accounting principles generally accepted in the United States of America |
| |
| VaR | Value-at-Risk |
| |
| VIE | Variable interest entity |
| |
| WACC | Implied weighted average cost of capital |
| |
| WM | Wealth Management |
| |
| |
| | | | | | | | |
| December 2020 Form 10-K | 156 | |
Changes in and Disagreements with Accountants on Accounting and Financial Disclosure
None.
Controls and Procedures
Conclusion Regarding the Effectiveness of Disclosure Controls and Procedures
Under the supervision and with the participation of the Firm’s management, including the Chief Executive Officer and Chief Financial Officer, the Firm conducted an evaluation of disclosure controls and procedures, as such term is defined under Exchange Act Rule 13a-15(e). Based on this evaluation, the Chief Executive Officer and Chief Financial Officer concluded that the Firm’s disclosure controls and procedures were effective as of the end of the period covered by this annual report.
Management’s Report on Internal Control Over Financial Reporting
The Firm’s management is responsible for establishing and maintaining adequate internal control over financial reporting. The Firm’s internal control over financial reporting is designed to provide reasonable assurance regarding the reliability of financial reporting and the preparation of financial statements for external purposes in accordance with generally accepted accounting principles in the United States of America (“U.S. GAAP”).
The internal control over financial reporting includes those policies and procedures that:
•Pertain to the maintenance of records that, in reasonable detail, accurately and fairly reflect the transactions and dispositions of the assets of the Firm;
•Provide reasonable assurance that transactions are recorded as necessary to permit preparation of financial statements in accordance with U.S. GAAP, and that receipts and expenditures are being made only in accordance with authorizations of the Firm’s management and directors; and
•Provide reasonable assurance regarding prevention or timely detection of unauthorized acquisition, use or disposition of Firm assets that could have a material effect on the Firm’s financial statements.
Because of its inherent limitations, internal control over financial reporting may not prevent or detect misstatements. Also, projections of any evaluation of effectiveness to future periods are subject to the risk that controls may become inadequate because of changes in conditions, or that the degree of compliance with the policies or procedures may deteriorate.
Management assessed the effectiveness of the Firm’s internal control over financial reporting as of December 31, 2020. In making this assessment, management used the criteria set forth by the Committee of Sponsoring Organizations of the Treadway Commission (“COSO”) in Internal Control—Integrated Framework (2013). Based on management’s assessment and those criteria, management believes that the Firm maintained effective internal control over financial reporting as of December 31, 2020.
The Firm’s independent registered public accounting firm has audited and issued a report on the Firm’s internal control over financial reporting, which appears below.
| | | | | | | | |
| 157 | December 2020 Form 10-K |
Report of Independent Registered Public Accounting Firm
To the Shareholders and the Board of Directors of Morgan Stanley:
Opinion on Internal Control over Financial Reporting
We have audited the internal control over financial reporting of Morgan Stanley and subsidiaries (the “Firm”) as of December 31, 2020, based on criteria established in Internal Control — Integrated Framework (2013) issued by the Committee of Sponsoring Organizations of the Treadway Commission (COSO). In our opinion, the Firm maintained, in all material respects, effective internal control over financial reporting as of December 31, 2020, based on criteria established in Internal Control — Integrated Framework (2013) issued by COSO.
We have also audited, in accordance with the standards of the Public Company Accounting Oversight Board (United States) (PCAOB), the financial statements of the Firm as of and for the year ended December 31, 2020 and our report dated February 26, 2021 expressed an unqualified opinion on those financial statements.
Basis for Opinion
The Firm’s management is responsible for maintaining effective internal control over financial reporting and for its assessment of the effectiveness of internal control over financial reporting, included in the accompanying Management’s Report on Internal Control Over Financial Reporting. Our responsibility is to express an opinion on the Firm’s internal control over financial reporting based on our audit. We are a public accounting firm registered with the PCAOB and are required to be independent with respect to the Firm in accordance with the U.S. federal securities laws and the applicable rules and regulations of the Securities and Exchange Commission and the PCAOB.
We conducted our audit in accordance with the standards of the PCAOB. Those standards require that we plan and perform the audit to obtain reasonable assurance about whether effective internal control over financial reporting was maintained in all material respects. Our audit included obtaining an understanding of internal control over financial reporting,
assessing the risk that a material weakness exists, testing and evaluating the design and operating effectiveness of internal control based on the assessed risk, and performing such other procedures as we considered necessary in the circumstances. We believe that our audit provides a reasonable basis for our opinion.
Definition and Limitations of Internal Control over Financial Reporting
A company’s internal control over financial reporting is a process designed to provide reasonable assurance regarding the reliability of financial reporting and the preparation of financial statements for external purposes in accordance with generally accepted accounting principles. A company’s internal control over financial reporting includes those policies and procedures that (1) pertain to the maintenance of records that, in reasonable detail, accurately and fairly reflect the transactions and dispositions of the assets of the company; (2) provide reasonable assurance that transactions are recorded as necessary to permit preparation of financial statements in accordance with generally accepted accounting principles, and that receipts and expenditures of the company are being made only in accordance with authorizations of management and directors of the company; and (3) provide reasonable assurance regarding prevention or timely detection of unauthorized acquisition, use, or disposition of the company’s assets that could have a material effect on the financial statements.
Because of its inherent limitations, internal control over financial reporting may not prevent or detect misstatements. Also, projections of any evaluation of effectiveness to future periods are subject to the risk that controls may become inadequate because of changes in conditions, or that the degree of compliance with the policies or procedures may deteriorate.
/s/ Deloitte & Touche LLP
New York, New York
February 26, 2021
| | | | | | | | |
| December 2020 Form 10-K | 158 | |
Changes in Internal Control Over Financial Reporting
No change in the Firm’s internal control over financial reporting (as such term is defined in Exchange Act Rule 13a-15(f)) occurred during the quarter ended December 31, 2020 that materially affected, or is reasonably likely to materially affect, the Firm’s internal control over financial reporting.
Other Information
None.
Unresolved Staff Comments
The Firm, like other well-known seasoned issuers, from time to time receives written comments from the staff of the SEC regarding its periodic or current reports under the Exchange Act. There are no comments that remain unresolved that the Firm received not less than 180 days before the end of the year to which this report relates that the Firm believes are material.
Properties
We have offices, operations and data centers located around the world. Our global headquarters and principal executive offices are located at 1585 Broadway, New York, New York. Our other principal offices include locations in Manhattan and the greater New York metropolitan area, London, Hong Kong and Tokyo. Our current facilities are adequate for our present and future operations for each of our business segments, although we may add regional offices, depending upon our future operations.
Legal Proceedings
In addition to the matters described below, in the normal course of business, the Firm has been named, from time to time, as a defendant in various legal actions, including arbitrations, class actions and other litigation, arising in connection with its activities as a global diversified financial services institution. Certain of the actual or threatened legal actions include claims for substantial compensatory and/or punitive damages or claims for indeterminate amounts of damages. In some cases, the entities that would otherwise be the primary defendants in such cases are bankrupt or are in financial distress.
The Firm is also involved, from time to time, in other reviews, investigations and proceedings (both formal and informal) by governmental and self-regulatory agencies regarding the Firm’s business, and involving, among other matters, sales and trading activities, financial products or offerings sponsored, underwritten or sold by the Firm, and accounting and operational matters, certain of which may result in adverse judgments, settlements, fines, penalties, injunctions or other relief.
The Firm contests liability and/or the amount of damages as appropriate in each pending matter. Where available information indicates that it is probable a liability had been incurred at the date of the financial statements and the Firm can reasonably estimate the amount of that loss, the Firm accrues the estimated loss by a charge to income. The Firm’s future legal expenses may fluctuate from period to period, given the current environment regarding government investigations and private litigation affecting global financial services firms, including the Firm.
In many proceedings and investigations, however, it is inherently difficult to determine whether any loss is probable or even possible, or to estimate the amount of any loss. The Firm cannot predict with certainty if, how or when such proceedings or investigations will be resolved or what the eventual settlement, fine, penalty or other relief, if any, may be, particularly for proceedings and investigations where the factual record is being developed or contested or where plaintiffs or government entities seek substantial or indeterminate damages, restitution, disgorgement or penalties. Numerous issues may need to be resolved before a loss or additional loss or range of loss or additional range of loss can be reasonably estimated for a proceeding or investigation, including through potentially lengthy discovery and determination of important factual matters, determination of issues related to class certification and the calculation of damages or other relief, and by addressing novel or unsettled legal questions relevant to the proceedings or investigations in question. Subject to the foregoing, the Firm believes, based on current knowledge and after consultation with counsel, that the outcome of such proceedings and investigations will not have a material adverse effect on the financial condition of the Firm, although the outcome of such proceedings or investigations could be material to the Firm’s operating results and cash flows for a particular period depending on, among other things, the level of the Firm’s revenues or income for such period.
While the Firm has identified below certain proceedings that the Firm believes to be material, individually or collectively, there can be no assurance that additional material losses will not be incurred from claims that have not yet been asserted or are not yet determined to be material.
Residential Mortgage and Credit Crisis Related Matters
On July 15, 2010, China Development Industrial Bank (“CDIB”) filed a complaint against the Firm, styled China Development Industrial Bank v. Morgan Stanley & Co. Incorporated et al., which is pending in the Supreme Court of the State of New York, New York County (“Supreme Court of NY”). The complaint relates to a $275 million CDS referencing the super senior portion of the STACK 2006-1 CDO. The complaint asserts claims for common law fraud, fraudulent inducement and fraudulent concealment and alleges that the Firm misrepresented the risks of the STACK 2006-1 CDO to CDIB, and that the Firm knew that the assets backing the CDO were of poor quality when it entered into
| | | | | | | | |
| 159 | December 2020 Form 10-K |
the CDS with CDIB. The complaint seeks compensatory damages related to the approximately $228 million that CDIB alleges it has already lost under the CDS, rescission of CDIB’s obligation to pay an additional $12 million, punitive damages, equitable relief, pre- and post-judgment interest, fees and costs. On February 28, 2011, the court denied the Firm’s motion to dismiss the complaint. On December 21, 2018, the court denied the Firm’s motion for summary judgment and granted in part the Firm’s motion for sanctions related to the spoliation of evidence. On January 18, 2019, CDIB filed a motion to clarify and resettle the portion of the court’s December 21, 2018 order granting spoliation sanctions. On January 24, 2019, CDIB filed a notice of appeal from the court’s December 21, 2018 order, and the Firm filed a notice of appeal from the same order. On March 7, 2019, the court denied the relief sought by CDIB in its January 18, 2019 motion. On May 21, 2020, the Appellate Division, First Department (“First Department”), modified the Supreme Court of NY’s order to deny the Firm’s motion for sanctions relating to spoliation of evidence and otherwise affirmed the denial of the Firm’s motion for summary judgment. On June 19, 2020, the Firm moved for leave to appeal the First Department’s decision to the New York Court of Appeals (“Court of Appeals”), which the First Department denied on July 24, 2020.
On May 17, 2013, the plaintiff in IKB International S.A. in Liquidation, et al. v. Morgan Stanley, et al. filed a complaint against the Firm and certain affiliates in the Supreme Court of NY. The complaint alleges that defendants made material misrepresentations and omissions in the sale to plaintiff of certain mortgage pass-through certificates backed by securitization trusts containing residential mortgage loans. The total amount of certificates allegedly sponsored, underwritten and/or sold by the Firm to plaintiff was approximately $133 million. The complaint alleges causes of action against the Firm for common law fraud, fraudulent concealment, aiding and abetting fraud, and negligent misrepresentation, and seeks, among other things, compensatory and punitive damages. On October 29, 2014, the court granted in part and denied in part the Firm’s motion to dismiss. All claims regarding four certificates were dismissed. After these dismissals, the remaining amount of certificates allegedly issued by the Firm or sold to plaintiff by the Firm was approximately $116 million. On August 11, 2016, the First Department affirmed the trial court’s order denying in part the Firm’s motion to dismiss the complaint.
On July 2, 2013, Deutsche Bank, in its capacity as trustee, became the named plaintiff in Federal Housing Finance Agency, as Conservator for the Federal Home Loan Mortgage Corporation, on behalf of the Trustee of the Morgan Stanley ABS Capital I Inc. Trust, Series 2007-NC1 (MSAC 2007-NC1) v. Morgan Stanley ABS Capital I Inc., and filed a complaint in the Supreme Court of NY styled Deutsche Bank National Trust Company, as Trustee for the Morgan Stanley ABS Capital I Inc. Trust, Series 2007-NC1 v. Morgan Stanley ABS Capital I, Inc. On February 3, 2014, the plaintiff filed an amended complaint, which asserts claims for breach
of contract and breach of the implied covenant of good faith and fair dealing and alleges, among other things, that the loans in the trust, which had an original principal balance of approximately $1.25 billion, breached various representations and warranties. The amended complaint seeks, among other relief, specific performance of the loan breach remedy procedures in the transaction documents, unspecified damages, rescission, interest and costs. On April 12, 2016, the court granted in part and denied in part the Firm’s motion to dismiss the amended complaint, dismissing all claims except a single claim alleging failure to notify, regarding which the motion was denied without prejudice. On December 9, 2016, the Firm renewed its motion to dismiss that notification claim. On January 17, 2017, the First Department affirmed the lower court’s April 12, 2016 order. On April 13, 2017, the First Department denied plaintiff’s motion for leave to appeal to the Court of Appeals. On March 8, 2018, the trial court denied the Firm’s renewed motion to dismiss the notification claims.
On July 8, 2013, U.S. Bank National Association, in its capacity as trustee, filed a complaint against the Firm styled U.S. Bank National Association, solely in its capacity as Trustee of the Morgan Stanley Mortgage Loan Trust 2007-2AX (MSM 2007-2AX) v. Morgan Stanley Mortgage Capital Holdings LLC, Successor-by-Merger to Morgan Stanley Mortgage Capital Inc. and GreenPoint Mortgage Funding, Inc., pending in the Supreme Court of NY. The complaint asserts claims for breach of contract and alleges, among other things, that the loans in the trust, which had an original principal balance of approximately $650 million, breached various representations and warranties. The complaint seeks, among other relief, specific performance of the loan breach remedy procedures in the transaction documents, unspecified damages, interest and costs. On November 24, 2014, the court granted in part and denied in part the Firm’s motion to dismiss the complaint. On August 13, 2018, the Firm filed a motion to renew its motion to dismiss. On April 4, 2019, the court denied the Firm’s motion to renew its motion to dismiss. On September 2, 2020, the parties entered into a settlement agreement, which was approved in a Trust Instructional Proceeding on October 20, 2020. Under the terms of that agreement, the Trustee has released its repurchase claims for a majority of the mortgage loans in the Trust after receiving the settlement payment.
On November 6, 2013, Deutsche Bank, in its capacity as trustee, became the named plaintiff in Federal Housing Finance Agency, as Conservator for the Federal Home Loan Mortgage Corporation, on behalf of the Trustee of the Morgan Stanley ABS Capital I Inc. Trust, Series 2007-NC3 (MSAC 2007-NC3) v. Morgan Stanley Mortgage Capital Holdings LLC, and filed a complaint in the Supreme Court of NY styled Deutsche Bank National Trust Company, solely in its capacity as Trustee for Morgan Stanley ABS Capital I Inc. Trust, Series 2007-NC3 v. Morgan Stanley Mortgage Capital Holdings LLC, as Successor-by-Merger to Morgan Stanley Mortgage Capital Inc. The complaint asserts claims for breach of contract and breach of the implied covenant of good
| | | | | | | | |
| December 2020 Form 10-K | 160 | |
faith and fair dealing and alleges, among other things, that the loans in the trust, which had an original principal balance of approximately $1.3 billion, breached various representations and warranties. The complaint seeks, among other relief, specific performance of the loan breach remedy procedures in the transaction documents, unspecified damages, rescission, interest and costs. On April 12, 2016, the court granted the Firm’s motion to dismiss the complaint, and granted the plaintiff the ability to seek to replead certain aspects of the complaint. On January 17, 2017, the First Department affirmed the lower court’s order granting the motion to dismiss the complaint. On January 9, 2017, plaintiff filed a motion to amend its complaint. On April 13, 2017, the First Department denied plaintiff’s motion for leave to appeal to the Court of Appeals. On March 8, 2018, the trial court granted plaintiff’s motion to amend its complaint to include failure to notify claims. On March 19, 2018, the Firm filed an answer to plaintiff’s amended complaint.
On September 23, 2014, FGIC filed a complaint against the Firm in the Supreme Court of NY styled Financial Guaranty Insurance Company v. Morgan Stanley ABS Capital I Inc. et al. relating to the Morgan Stanley ABS Capital I Inc. Trust 2007-NC4. The complaint asserts claims for breach of contract and fraudulent inducement and alleges, among other things, that the loans in the trust breached various representations and warranties and defendants made untrue statements and material omissions to induce FGIC to issue a financial guaranty policy on certain classes of certificates that had an original balance of approximately $876 million. The complaint seeks, among other relief, specific performance of the loan breach remedy procedures in the transaction documents, compensatory, consequential and punitive damages, attorneys’ fees, interest and costs. On January 23, 2017, the court denied the Firm’s motion to dismiss the complaint. On February 24, 2017, the Firm filed a notice of appeal of the denial of its motion to dismiss the complaint and perfected its appeal on November 22, 2017. On September 13, 2018, the First Department affirmed in part and reversed in part the lower court’s order denying the Firm’s motion to dismiss the complaint. On December 20, 2018, the First Department denied plaintiff’s motion for leave to appeal to the Court of Appeals or, in the alternative, for re-argument.
On January 23, 2015, Deutsche Bank National Trust Company, in its capacity as trustee, filed a complaint against the Firm styled Deutsche Bank National Trust Company solely in its capacity as Trustee of the Morgan Stanley ABS Capital I Inc. Trust 2007-NC4 v. Morgan Stanley Mortgage Capital Holdings LLC as Successor-by-Merger to Morgan Stanley Mortgage Capital Inc., and Morgan Stanley ABS Capital I Inc., pending in the Supreme Court of NY. The complaint asserts claims for breach of contract and alleges, among other things, that the loans in the trust, which had an original principal balance of approximately $1.05 billion, breached various representations and warranties. The complaint seeks, among other relief, specific performance of the loan breach remedy procedures in the transaction documents, compensatory, consequential, rescissory,
equitable and punitive damages, attorneys’ fees, costs and other related expenses, and interest. On December 11, 2015, the court granted in part and denied in part the Firm’s motion to dismiss the complaint. On October 19, 2018, the court granted the Firm’s motion for leave to amend its answer and to stay the case pending resolution of Deutsche Bank National Trust Company’s appeal to the Court of Appeals in another case, styled Deutsche Bank National Trust Company v. Barclays Bank PLC, regarding the applicable statute of limitations. On January 17, 2019, the First Department reversed the trial court’s order to the extent that it had granted in part the Firm’s motion to dismiss the complaint. On June 4, 2019, the First Department granted the Firm’s motion for leave to appeal its January 17, 2019 decision to the Court of Appeals. On March 19, 2020, the Firm filed a motion for partial summary judgment. On December 22, 2020, the Court of Appeals reversed the First Department and reinstated the trial court’s order to the extent it had granted in part the Firm’s motion to dismiss the complaint.
Antitrust Related Matters
The Firm and other financial institutions are responding to a number of governmental investigations and civil litigation matters related to allegations of anticompetitive conduct in various aspects of the financial services industry, including the matters described below.
Beginning in February of 2016, the Firm was named as a defendant in multiple purported antitrust class actions now consolidated into a single proceeding in the United States District Court for the Southern District of New York (“SDNY”) styled In Re: Interest Rate Swaps Antitrust Litigation. Plaintiffs allege, inter alia, that the Firm, together with a number of other financial institution defendants, violated U.S. and New York state antitrust laws from 2008 through December of 2016 in connection with their alleged efforts to prevent the development of electronic exchange-based platforms for interest rates swaps trading. Complaints were filed both on behalf of a purported class of investors who purchased interest rates swaps from defendants, as well as on behalf of two swap execution facilities that allegedly were thwarted by the defendants in their efforts to develop such platforms. The consolidated complaints seek, among other relief, certification of the investor class of plaintiffs and treble damages. On July 28, 2017, the court granted in part and denied in part the defendants’ motion to dismiss the complaints.
In August of 2017, the Firm was named as a defendant in a purported antitrust class action in the United States District Court for the SDNY styled Iowa Public Employees’ Retirement System et al. v. Bank of America Corporation et al. Plaintiffs allege, inter alia, that the Firm, together with a number of other financial institution defendants, violated U.S. antitrust laws and New York state law in connection with their alleged efforts to prevent the development of electronic exchange-based platforms for securities lending. The class action complaint was filed on behalf of a purported class of
| | | | | | | | |
| 161 | December 2020 Form 10-K |
borrowers and lenders who entered into stock loan transactions with the defendants. The class action complaint seeks, among other relief, certification of the class of plaintiffs and treble damages. On September 27, 2018, the court denied the defendants’ motion to dismiss the class action complaint.
European Matters
On October 11, 2011, an Italian financial institution, Banco Popolare Societá Cooperativa (“Banco Popolare”), filed a civil claim against the Firm in the Milan courts, styled Banco Popolare Societá Cooperativa v Morgan Stanley & Co. International plc & others, related to its purchase of €100 million of bonds issued by Parmalat. The claim asserted by Banco Popolare alleges, inter alia, that the Firm was aware of Parmalat’s impending insolvency and conspired with others to deceive Banco Popolare into buying bonds by concealing both Parmalat’s true financial condition and certain features of the bonds from the market and Banco Popolare. Banco Popolare seeks damages of €76 million (approximately $93 million) plus damages for loss of opportunity and moral damages. The Firm filed its answer on April 20, 2012. On September 11, 2018, the court dismissed in full the claim against the Firm. On March 11, 2019, the plaintiff filed an appeal in the Court of Appeal of Milan. On May 31, 2019, the Firm filed its response to the plaintiff’s appeal. The parties filed final submissions in the Court of Appeal of Milan in November 2020. On February 2, 2021, the Firm was served with the Court of Appeal's judgment, which partially upheld Banco Popolare's appeal on limited grounds and awarded Banco Popolare approximately €2.3 million (approximately $2.8 million) in damages plus interest and certain legal and other expenses.
In matters styled Case number 15/3637 and Case number 15/4353, the Dutch Tax Authority (“Dutch Authority”) is challenging in the Dutch courts the prior set-off by the Firm of approximately €124 million (approximately $152 million) plus accrued interest of withholding tax credits against the Firm’s corporation tax liabilities for the tax years 2007 to 2013. The Dutch Authority alleges that the Firm was not entitled to receive the withholding tax credits on the basis, inter alia, that a Firm subsidiary did not hold legal title to certain securities subject to withholding tax on the relevant dates. The Dutch Authority has also alleged that the Firm failed to provide certain information to the Dutch Authority and keep adequate books and records. On April 26, 2018, the District Court in Amsterdam issued a decision dismissing the Dutch Authority’s claims with respect to certain of the tax years in dispute. On May 12, 2020, the Court of Appeal in Amsterdam granted the Dutch Authority's appeal in matters re-styled Case number 18/00318 and Case number 18/00319. On June 22, 2020, the Firm filed an appeal against the decision of the Court of Appeal in Amsterdam before the Dutch High Court.
On October 5, 2017, various institutional investors filed a claim against the Firm and another bank in a matter now styled Case number B-803-18 (previously BS 99-6998/2017), in the City Court of Copenhagen, Denmark concerning their roles as underwriters of the initial public offering (“IPO”) in March 2014 of the Danish company OW Bunker A/S. The claim seeks damages of approximately DKK 529 million (approximately $87 million) plus interest in respect of alleged losses arising from investing in shares in OW Bunker, which entered into bankruptcy in November 2014. Separately, on November 29, 2017, another group of institutional investors joined the Firm and another bank as defendants to pending proceedings in the High Court of Eastern Denmark against various other parties involved in the IPO in a matter styled Case number B-2073-16. The claim brought against the Firm and the other bank has been given its own Case number B-2564-17. The investors claim damages of approximately DKK 767 million (approximately $126 million) plus interest, from the Firm and the other bank on a joint and several basis with the Defendants to these proceedings. Both claims are based on alleged prospectus liability; the second claim also alleges professional liability of banks acting as financial intermediaries. On June 8, 2018, the City Court of Copenhagen, Denmark ordered that the matters now styled Case number B-803-18, B-2073-16 and Case number B-2564-17 be heard together before the High Court of Eastern Denmark. On June 29, 2018, the Firm filed its defense to the matter now styled Case number B-2564-17. On February 4, 2019, the Firm filed its defense to the matter now styled Case number B-803-18.
The following matter was terminated during or following the quarter ended December 31, 2020:
On June 22, 2017, the public prosecutor for the Court of Accounts for the Republic of Italy filed a claim against the Firm styled Case No. 2012/00406/MNV, which is pending in the Regional Prosecutor’s Office at the Judicial Section of the Court of Auditors for Lazio, Italy. The claim related to certain derivative transactions between the Republic of Italy and the Firm. The transactions were originally entered into between 1999 and 2005, and were restructured (and certain of the transactions were terminated) in December 2011 and January 2012. The claim alleged, inter alia, that the Firm effectively acted as an agent of the state in connection with these transactions and asserts claims related to, among other things, whether the Ministry of Finance was authorized to enter into these transactions, whether the transactions were appropriate, and whether the Firm’s conduct related to the termination of certain transactions was proper. The prosecutor sought damages through an administrative process against the Firm for €2.76 billion (approximately $3.4 billion). On March 30, 2018, the Firm filed its defense to the claim. On June 15, 2018, the Court issued a decision declining jurisdiction and dismissing the claim against the Firm. A hearing of the public prosecutor’s appeal was held on January 10, 2019. On March 7, 2019, the Appellate Division of the Court of Accounts for the Republic of Italy issued a decision affirming the decision
| | | | | | | | |
| December 2020 Form 10-K | 162 | |
below declining jurisdiction and dismissing the claim against the Firm. On April 19, 2019, the public prosecutor filed an appeal with the Italian Supreme Court seeking to overturn this decision. On June 14, 2019, the Firm filed its response to the public prosecutor’s appeal. On November 17, 2020, an appeal hearing took place before the Italian Supreme Court. On February 1, 2021, the Italian Supreme Court affirmed the earlier decisions that the Court of Accounts lacked jurisdiction to hear the claim against the Firm, thereby dismissing the public prosecutor’s claim against the Firm.
Mine Safety Disclosures
Not applicable.
Market for Registrant’s Common Equity, Related Stockholder Matters and Issuer Purchases of Equity Securities
Morgan Stanley’s common stock trades under the symbol “MS” on the New York Stock Exchange. As of February 15, 2021, the Firm had 52,386 holders of record; however, the Firm believes the number of beneficial owners of the Firm’s common stock exceeds this number.
The table below sets forth the information with respect to purchases made by or on behalf of the Firm of its common stock during the fourth quarter of the year ended December 31, 2020.
Issuer Purchases of Equity Securities
Three Months Ended December 31, 2020
| | | | | | | | | | | | | | |
| $ in millions, except per share data | Total Number of Shares Purchased1 | Average Price Paid per Share | Total Shares Purchased as Part of Share Repurchase Program2, 3 | Dollar Value of Remaining Authorized Repurchase |
| October | 903,959 | | $ | 47.34 | | — | | $ | — | |
| November | 9,868 | | $ | 48.27 | | — | | $ | — | |
| December | 101,944 | | $ | 61.87 | | — | | $ | — | |
| Total | 1,015,771 | | $ | 48.81 | | — | | |
1.Refers to shares acquired by the Firm in satisfaction of the tax withholding obligations on stock-based awards granted under the Firm's stock-based compensation plans during the three months ended December 31, 2020.
2.Share purchases under publicly announced programs are made pursuant to open-market purchases, Rule 10b5-1 plans or privately negotiated transactions (including with employee benefit plans) as market conditions warrant and at prices the Firm deems appropriate and may be suspended at any time. On April 18, 2018, the Firm entered into a sales plan with Mitsubishi UFJ Financial Group, Inc. (“MUFG”). See Note 18 to the financial statements for further information on the sales plan.
3.The Firm’s Board of Directors has authorized the repurchase of the Firm’s outstanding stock under a share repurchase program (the “Share Repurchase Program”) from time to time as conditions warrant and subject to regulatory non-objection. The Share Repurchase Program is a program for capital management purposes that considers, among other things, business segment capital needs, as well as equity-based compensation and benefit plan requirements. The Share Repurchase Program has no set expiration or termination date.
Share repurchases by the Firm are subject to regulatory non-objection. On June 27, 2019, the Federal Reserve published summary results of CCAR and the Firm received a non-objection to its 2019 Capital Plan. The Firm’s 2019 Capital Plan included a share repurchase of up to $6.0 billion of its outstanding common stock during the period beginning July
1, 2019 through June 30, 2020. On March 15, 2020, the Financial Services Forum announced that each of its eight member banks, including the Firm, had voluntarily suspended their share repurchase programs. As a result, $1.7 billion of share repurchase authorization expired unused on June 30, 2020. On June 25, 2020, the Federal Reserve published summary results of CCAR and announced that large BHCs, including the Firm, generally would be restricted in making share repurchases during the third quarter, and on September 30, 2020, the restrictions were extended through the fourth quarter of 2020. On December 18, 2020 the Federal Reserve published summary results of the second round of supervisory stress tests for each large BHC, including the Firm, and permitted the resumption of share repurchases in the first quarter of 2021. Also on December 18, 2020, our Board of Directors authorized the repurchases of outstanding common stock of up to $10 billion in 2021, subject to limitations on distributions from the Federal Reserve. For further information, see “Liquidity and Capital Resources—Capital Plans, Stress Tests and the Stress Capital Buffer.”
Stock Performance Graph
The following graph compares the cumulative total shareholder return (rounded to the nearest whole dollar) of the Firm’s common stock, the S&P 500 Stock Index and the S&P 500 Financials Sector Index for the last five years. The graph assumes a $100 investment at the closing price on December 31, 2015 and reinvestment of dividends on the respective dividend payment dates without commissions. This graph does not forecast future performance of the Firm’s common stock.
Cumulative Total Return
December 31, 2015 – December 31, 2020
| | | | | | | | | | | | | | | | | | | | |
| | At December 31, |
| 2015 | 2016 | 2017 | 2018 | 2019 | 2020 |
| Morgan Stanley | $ | 100.00 | | $ | 136.06 | | $ | 172.28 | | $ | 133.06 | | $ | 176.51 | | $ | 243.68 | |
S&P 500 Stock Index | 100.00 | | 111.95 | | 136.38 | | 130.39 | | 171.09 | | 202.55 | |
S&P 500 Financials Sector Index | 100.00 | | 122.75 | | 148.70 | | 129.31 | | 170.80 | | 167.80 | |
| | | | | | | | |
| 163 | December 2020 Form 10-K |
Directors, Executive Officers and Corporate Governance
Information relating to the Firm’s directors and nominees in the Firm’s definitive proxy statement for its 2021 annual meeting of shareholders (“Morgan Stanley’s proxy statement”) is incorporated by reference herein.
Information relating to the Firm’s executive officers is contained in the “Business” section of this report under “Information about our Executive Officers.”
Morgan Stanley’s Code of Ethics and Business Conduct applies to all directors, officers and employees, including its Chief Executive Officer, Chief Financial Officer and Deputy Chief Financial Officer. You can find the Code of Ethics and Business Conduct on the webpage, www.morganstanley.com/about-us-governance/ethics.html. The Firm will post any amendments to the Code of Ethics and Business Conduct, and any waivers that are required to be disclosed by the rules of either the U.S. Securities and Exchange Commission or the New York Stock Exchange LLC, on the webpage.
Executive Compensation
Information relating to director and executive officer compensation in Morgan Stanley’s proxy statement is incorporated by reference herein.
Security Ownership of Certain Beneficial Owners and Management and Related Stockholder Matters
Information relating to equity compensation plans and security ownership of certain beneficial owners and management in Morgan Stanley’s proxy statement is incorporated by reference herein.
Certain Relationships and Related Transactions and Director Independence
Information regarding certain relationships and related transactions in Morgan Stanley’s proxy statement is incorporated by reference herein.
Information regarding director independence in Morgan Stanley’s proxy statement is incorporated by reference herein.
Principal Accountant Fees and Services
Information regarding principal accountant fees and services in Morgan Stanley’s proxy statement is incorporated by reference herein.
Exhibits and Financial Statement Schedules
Documents filed as part of this report
•The financial statements required to be filed in this annual report on Form 10-K are included in the section titled “Financial Statements and Supplementary Data.”
Exhibit Index1
Certain of the following exhibits, as indicated parenthetically, were previously filed as exhibits to registration statements filed by Morgan Stanley or its predecessor companies under the Securities Act or to reports or registration statements filed by Morgan Stanley or its predecessor companies under the Exchange Act and are hereby incorporated by reference to such statements or reports. Morgan Stanley’s Exchange Act file number is 1-11758. The Exchange Act file number of Morgan Stanley Group Inc., a predecessor company (“MSG”), was 1-9085.
| | | | | | |
| Exhibit No. | Description | |
| 3.1 | | |
| 3.2 | Amended and Restated Bylaws of Morgan Stanley, as amended to date (Exhibit 3.1 to Morgan Stanley’s current report on Form 8-K dated October 29, 2015). | |
| 4.1* | | |
| 4.2 | Amended and Restated Senior Indenture dated as of May 1, 1999 between Morgan Stanley and The Bank of New York, as trustee (Exhibit 4-e to Morgan Stanley’s Registration Statement on Form S-3/A (No. 333-75289) as amended by Fourth Supplemental Senior Indenture dated as of October 8, 2007 (Exhibit 4.3 to Morgan Stanley’s annual report on Form 10-K for the fiscal year ended November 30, 2007). | |
| | | | | | | | |
| December 2020 Form 10-K | 164 | |
| | | | | | |
| Exhibit No. | Description | |
| 4.3 | Senior Indenture dated as of November 1, 2004 between Morgan Stanley and The Bank of New York, as trustee (Exhibit 4-f to Morgan Stanley’s Registration Statement on Form S-3/A (No. 333-117752), as amended by First Supplemental Senior Indenture dated as of September 4, 2007 (Exhibit 4.5 to Morgan Stanley’s annual report on Form 10-K for the fiscal year ended November 30, 2007), Second Supplemental Senior Indenture dated as of January 4, 2008 (Exhibit 4.1 to Morgan Stanley’s current report on Form 8-K dated January 4, 2008), Third Supplemental Senior Indenture dated as of September 10, 2008 (Exhibit 4 to Morgan Stanley’s quarterly report on Form 10-Q for the quarter ended August 31, 2008), Fourth Supplemental Senior Indenture dated as of December 1, 2008 (Exhibit 4.1 to Morgan Stanley’s current report on Form 8-K dated December 1, 2008), Fifth Supplemental Senior Indenture dated as of April 1, 2009 (Exhibit 4 to Morgan Stanley’s quarterly report on Form 10-Q for the quarter ended March 31, 2009), Sixth Supplemental Senior Indenture dated as of September 16, 2011 (Exhibit 4.1 to Morgan Stanley’s quarterly report on Form 10-Q for the quarter ended September 30, 2011), Seventh Supplemental Senior Indenture dated as of November 21, 2011 (Exhibit 4.4 to Morgan Stanley’s annual report on Form 10-K for the year ended December 31, 2011), Eighth Supplemental Senior Indenture dated as of May 4, 2012 (Exhibit 4.1 to Morgan Stanley’s quarterly report on Form 10-Q for the quarter ended June 30, 2012), Ninth Supplemental Senior Indenture dated as of March 10, 2014 (Exhibit 4.1 to Morgan Stanley’s quarterly report on Form 10-Q for the quarter ended March 31, 2014) and Tenth Supplemental Senior Indenture dated as of January 11, 2017 (Exhibit 4.1 to Morgan Stanley’s current report on Form 8-K dated January 11, 2017). | |
| 4.4 | | |
| 4.5 | | |
| 4.6 | | |
| 4.7 | | |
| | | | | | |
| Exhibit No. | Description | |
| 4.8 | | |
| 4.9 | | |
| 4.10 | | |
| 4.11 | | |
| 4.12 | | |
| 4.13 | | |
| 4.14 | | |
| 4.15 | | |
| 4.16 | | |
| 4.17 | | |
| 4.18 | | |
| | | | | | | | |
| 165 | December 2020 Form 10-K |
| | | | | | |
| Exhibit No. | Description | |
| 4.19 | | |
| 4.20 | | |
| 4.21 | | |
| 4.22 | | |
| 4.23 | | |
| 4.24 | | |
| 4.25 | | |
| 10.1 | | |
| 10.2 | Amended and Restated Investor Agreement dated as of June 30, 2011 by and between Morgan Stanley and Mitsubishi UFJ Financial Group, Inc. (Exhibit 10.1 to Morgan Stanley’s current report on Form 8-K dated June 30, 2011), as amended by Third Amendment, dated October 3, 2013 (Exhibit 10.1 to Morgan Stanley’s quarterly report on Form 10-Q for the quarter ended September 30, 2013) and Fourth Amendment, dated April 6, 2016 (Exhibit 10.1 to Morgan Stanley’s quarterly report on Form 10-Q for the quarter ended March 31, 2016). | |
| 10.3* | | |
| 10.4 | Agreement and Plan of Merger, dated as of October 7, 2020, by and among Morgan Stanley, Mirror Merger Sub 1, Inc., Mirror Merger Sub 2, LLC and Eaton Vance Corp. (Exhibit 2.1 to Morgan Stanley’s current report on Form 8-K dated October 8, 2020). | |
| | | | | | |
| Exhibit No. | Description | |
| 10.5† | Morgan Stanley 401(k) Plan, amended and restated as of January 1, 2013 (Exhibit 10.6 to Morgan Stanley annual report on Form 10-K for the year ended December 31, 2012), as amended by Amendment (Exhibit 10.5 to Morgan Stanley’s annual report on Form 10-K for the year ended December 31, 2013), Amendment (Exhibit 10.6 to Morgan Stanley’s annual report on Form 10-K for the year ended December 31, 2013), Amendment (Exhibit 10.5 to Morgan Stanley’s annual report on Form 10-K for the year ended December 31, 2014), Amendment (Exhibit 10.5 to Morgan Stanley’s annual report on Form 10-K for the year ended December 31, 2015), Amendment (Exhibit 10.4 to Morgan Stanley’s annual report on Form 10-K for the year ended December 31, 2016), Amendment (Exhibit 10.4 to Morgan Stanley’s annual report on Form 10-K for the year ended December 31, 2017), Amendment (Exhibit 10.5 to Morgan Stanley’s annual report on Form 10-K for the year ended December 31, 2017), Amendment (Exhibit 10.4 to Morgan Stanley’s annual report on Form 10-K for the year ended December 31, 2018) and Amendment (Exhibit 10.4 to Morgan Stanley’s annual report on Form 10-K for the year ended December 31, 2019). | |
| 10.6†* | | |
| 10.7† | Tax Deferred Equity Participation Plan as amended and restated as of November 26, 2007 (Exhibit 10.9 to Morgan Stanley’s annual report on Form 10-K for the fiscal year ended November 30, 2007). | |
| 10.8† | Directors’ Equity Capital Accumulation Plan as amended and restated as of November 1, 2018 (Exhibit 10.6 to Morgan Stanley’s annual report on Form 10-K for the fiscal year ended December 31, 2018). | |
| 10.9† | Employees’ Equity Accumulation Plan as amended and restated as of November 26, 2007 (Exhibit 10.12 to Morgan Stanley’s annual report on Form 10-K for the fiscal year ended November 30, 2007). | |
| 10.10† | Employee Stock Purchase Plan as amended and restated as of February 1, 2009 (Exhibit 10.20 to Morgan Stanley’s annual report on Form 10-K for the fiscal year ended November 30, 2008). | |
| | | | | | | | |
| December 2020 Form 10-K | 166 | |
| | | | | | |
| Exhibit No. | Description | |
| 10.11† | Morgan Stanley Supplemental Executive Retirement and Excess Plan, amended and restated effective December 31, 2008 (Exhibit 10.2 to Morgan Stanley’s quarterly report on Form 10-Q for the quarter ended March 31, 2009) as amended by Amendment (Exhibit 10.5 to Morgan Stanley’s quarterly report on Form 10-Q for the quarter ended June 30, 2009), Amendment (Exhibit 10.19 to Morgan Stanley’s annual report on Form 10-K for the year ended December 31, 2010), Amendment (Exhibit 10.3 to Morgan Stanley’s quarterly report on Form 10-Q for the quarter ended June 30, 2011) and Amendment (Exhibit 10.1 to Morgan Stanley’s quarterly report on Form 10-Q for the quarter ended September 30, 2014). | |
| 10.12† | 1995 Equity Incentive Compensation Plan (Annex A to MSG’s proxy statement for its 1996 Annual Meeting of Stockholders) as amended by Amendment (Exhibit 10.39 to Morgan Stanley’s annual report on Form 10-K for the fiscal year ended November 30, 2000), Amendment (Exhibit 10.5 to Morgan Stanley’s quarterly report on Form 10-Q for the quarter ended August 31, 2005), Amendment (Exhibit 10.3 to Morgan Stanley’s quarterly report on Form 10-Q for the quarter ended February 28, 2006), Amendment (Exhibit 10.24 to Morgan Stanley’s annual report on Form 10-K for the fiscal year ended November 30, 2006) and Amendment (Exhibit 10.22 to Morgan Stanley’s annual report on Form 10-K for the fiscal year ended November 30, 2007). | |
| 10.13† | Form of Deferred Compensation Agreement under the Pre-Tax Incentive Program 2 (Exhibit 10.12 to MSG’s annual report for the fiscal year ended November 30, 1996). | |
| 10.14† | Morgan Stanley UK Share Ownership Plan (Exhibit 4.1 to Morgan Stanley’s Registration Statement on Form S-8 (No. 333-146954)). | |
| 10.15† | Supplementary Deed of Participation for the Morgan Stanley UK Share Ownership Plan, dated as of November 5, 2009 (Exhibit 10.36 to Morgan Stanley’s annual report on Form 10-K for the year ended December 31, 2009). | |
| 10.16† | Aircraft Time Sharing Agreement, dated as of January 1, 2010, by and between Corporate Services Support Corp. and James P. Gorman (Exhibit 10.1 to Morgan Stanley’s quarterly report on Form 10-Q for the quarter ended March 31, 2010). | |
| 10.17† | Agreement between Morgan Stanley and James P. Gorman, dated August 16, 2005, and amendment dated December 17, 2008 (Exhibit 10.2 to Morgan Stanley’s quarterly report on Form 10-Q for the quarter ended March 31, 2010), as amended by Amendment (Exhibit 10.25 to Morgan Stanley’s annual report on Form 10-K for the year ended December 31, 2013). | |
| 10.18† | Form of Restrictive Covenant Agreement (Exhibit 10 to Morgan Stanley’s current report on Form 8-K dated November 22, 2005). | |
| 10.19†* | | |
| | | | | | |
| Exhibit No. | Description | |
| 10.20† | Morgan Stanley 2006 Notional Leveraged Co-Investment Plan, as amended and restated as of November 28, 2008 (Exhibit 10.47 to Morgan Stanley’s annual report on Form 10-K for the fiscal year ended November 30, 2008). | |
| 10.21† | Form of Award Certificate under the 2006 Notional Leveraged Co-Investment Plan (Exhibit 10.7 to Morgan Stanley’s quarterly report on Form 10-Q for the quarter ended February 29, 2008). | |
| 10.22† | Morgan Stanley 2007 Notional Leveraged Co-Investment Plan, amended as of June 4, 2009 (Exhibit 10.6 to Morgan Stanley’s quarterly report on Form 10-Q for the quarter ended June 30, 2009). | |
| 10.23† | Form of Award Certificate under the 2007 Notional Leveraged Co-Investment Plan for Certain Management Committee Members (Exhibit 10.8 to Morgan Stanley’s quarterly report on Form 10-Q for the quarter ended February 29, 2008). | |
| 10.24†* | | |
| 10.25† | Morgan Stanley Schedule of Non-Employee Directors Annual Compensation, effective as of November 1, 2018 (Exhibit 10.24 to Morgan Stanley’s annual report on Form 10-K for the fiscal year ended December 31, 2018). | |
| 10.26† | Morgan Stanley UK Limited Alternative Retirement Plan, dated as of October 8, 2009 (Exhibit 10.2 to Morgan Stanley’s quarterly report on Form 10-Q for the quarter ended March 31, 2013). | |
| 10.27† | Agreement between Morgan Stanley and Colm Kelleher, dated January 5, 2015 (Exhibit 10.1 to Morgan Stanley’s quarterly report on Form 10-Q for the quarter ended March 31, 2015). | |
| 10.28† | Description of Operating Committee Medical Coverage (Exhibit 10.2 to Morgan Stanley’s quarterly report on Form 10-Q for the quarter ended March 31, 2015). | |
| 10.29† | Form of Award Certificate for Discretionary Retention Awards of Stock Units. (Exhibit 10.33 to Morgan Stanley’s annual report on Form 10-K for the year ended December 31, 2017). | |
| 10.30† | Form of Award Certificate for Discretionary Retention Awards under the Morgan Stanley Compensation Incentive Plan. (Exhibit 10.34 to Morgan Stanley’s annual report on Form 10-K for the year ended December 31, 2017). | |
| 10.31†* | | |
| 10.32† | Form of Aircraft Time-Sharing Agreement (Exhibit 10.1 to Morgan Stanley’s quarterly report on Form 10-Q for the quarter ended September 30, 2020). | |
| 21* | | |
| 22* | | |
| 23.1* | | |
| 24 | | |
| 31.1* | | |
| 31.2* | | |
| | | | | | | | |
| 167 | December 2020 Form 10-K |
| | | | | | |
| Exhibit No. | Description | |
| 32.1** | | |
| 32.2** | | |
| 101 | Interactive Data Files pursuant to Rule 405 of Regulation S-T formatted in Inline eXtensible Business Reporting Language (“Inline XBRL”). | |
| 104 | Cover Page Interactive Data File (formatted in Inline XBRL and contained in Exhibit 101). | |
1.For purposes of this Exhibit Index, references to “The Bank of New York” mean in some instances the entity successor to JPMorgan Chase Bank, N.A. or J.P. Morgan Trust Company, National Association; references to “JPMorgan Chase Bank, N.A.” mean the entity formerly known as The Chase Manhattan Bank, in some instances as the successor to Chemical Bank; references to “J.P. Morgan Trust Company, N.A.” mean the entity formerly known as Bank One Trust Company, N.A., as successor to The First National Bank of Chicago.
| | | | | |
| * | Filed herewith. |
| ** | Furnished herewith. |
| † | Management contract or compensatory plan or arrangement required to be filed as an exhibit to this Form 10-K pursuant to Item 15(b). |
Note: Other instruments defining the rights of holders of long-term debt securities of Morgan Stanley and its subsidiaries are omitted pursuant to Section (b)(4)(iii) of Item 601 of Regulation S-K. Morgan Stanley hereby agrees to furnish copies of these instruments to the U.S. Securities and Exchange Commission upon request.
Form 10-K Summary
None.
Signatures
Pursuant to the requirements of Section 13 or 15(d) of the Securities Exchange Act of 1934, the Registrant has duly caused this report to be signed on its behalf by the undersigned, thereunto duly authorized, on February 26, 2021.
| | | | | |
MORGAN STANLEY (REGISTRANT) |
| By: | /s/ JAMES P. GORMAN |
| (James P. Gorman) |
| Chairman of the Board and Chief Executive Officer |
POWER OF ATTORNEY
We, the undersigned, hereby severally constitute Jonathan Pruzan, Eric F. Grossman and Martin M. Cohen, and each of them singly, our true and lawful attorneys with full power to them and each of them to sign for us, and in our names in the capacities indicated below, any and all amendments to the annual report on Form 10-K filed with the Securities and Exchange Commission, hereby ratifying and confirming our
signatures as they may be signed by our said attorneys to any and all amendments to said annual report on Form 10-K.
Pursuant to the requirements of the Securities Exchange Act of 1934, this report has been signed below by the following persons on behalf of the Registrant and in the capacities indicated on the 26th day of February, 2021.
| | | | | |
| Signature | Title |
| |
| /s/ JAMES P. GORMAN | Chairman of the Board and Chief Executive Officer |
| (James P. Gorman) | (Principal Executive Officer) |
| |
| /s/ JONATHAN PRUZAN | Executive Vice President and Chief Financial Officer |
| (Jonathan Pruzan) | (Principal Financial Officer) |
| |
| /s/ RAJA J. AKRAM | Deputy Chief Financial Officer |
| (Raja J. Akram) | (Chief Accounting Officer and Controller) |
| |
| /s/ ELIZABETH CORLEY | Director |
| (Elizabeth Corley) | |
| |
| /s/ ALISTAIR DARLING | Director |
| (Alistair Darling) | |
| |
| /s/ THOMAS H. GLOCER | Director |
| (Thomas H. Glocer) | |
| |
| /s/ ROBERT H. HERZ | Director |
| (Robert H. Herz) | |
| |
| /s/ NOBUYUKI HIRANO | Director |
| (Nobuyuki Hirano) | |
| |
| /s/ SHELLEY B. LEIBOWITZ | Director |
| (Shelley B. Leibowitz) | |
| |
| /s/ STEPHEN J. LUCZO | Director |
| (Stephen J. Luczo) | |
| |
| /s/ JAMI MISCIK | Director |
| (Jami Miscik) | |
| |
| /s/ DENNIS M. NALLY | Director |
| (Dennis M. Nally) | |
| |
| /s/ TAKESHI OGASAWARA | Director |
| (Takeshi Ogasawara) | |
| |
| | | | | | | | |
| December 2020 Form 10-K | 168 | |
| | | | | |
| Signature | Title |
| /s/ HUTHAM S. OLAYAN | Director |
| (Hutham S. Olayan) | |
| |
| /s/ MARY L. SCHAPIRO | Director |
| (Mary L. Schapiro) | |
| |
| /s/ PERRY M. TRAQUINA | Director |
| (Perry M. Traquina) | |
| |
| /s/ RAYFORD WILKINS, JR. | Director |
| (Rayford Wilkins, Jr.) | |
| | | | | | | | |
| December 2020 Form 10-K | 169 | |