Exhibit 99.1
Investor Relations Contact: David Humphrey | Media Contact: Autumnn Mahar |
Title: Vice President – Investor Relations | Title: Senior Manager, PR and Social |
Phone: 479-785-6200 | Phone: 479-494-8221 |
Email: dhumphrey@arcb.com | Email: amahar@arcb.com |
ArcBest Announces First Quarter 2023 Results
Grew Shipments Despite a Softer Market Backdrop
Executing on Accelerated Return of Capital to Shareholders
Following Recent Sale of FleetNet America
| ● | First quarter 2023 net income, including discontinued operations, was $71.3 million, or $2.84 per diluted share, including an after-tax gain on the sale of FleetNet America® of $51.4 million, or $2.05 per diluted share, which is subject to post-closing adjustments. |
| ● | Generated first quarter 2023 net income from continuing operations of $18.8 million, or $0.75 per diluted share. On a non-GAAP basis, first quarter 2023 net income from continuing operations of $39.5 million, or $1.58 per diluted share. |
FORT SMITH, Ark., April 28, 2023 — ArcBest® (Nasdaq: ARCB), a leader in supply chain logistics, today reported first quarter 2023 revenue from continuing operations of $1.1 billion, compared to $1.3 billion in the first quarter of 2022.
ArcBest’s first quarter 2023 operating income from continuing operations was $21.2 million and net income from continuing operations was $18.8 million, or $0.75 per diluted share, compared to operating income of $92.9 million and net income of $69.6 million, or $2.68 per diluted share, in the first quarter of 2022.
Excluding certain items in both periods as identified in the attached reconciliation tables, first quarter 2023 non-GAAP operating income from continuing operations was $51.9 million, compared to $106.7 million in the prior-year period. On a non-GAAP basis, net income from continuing operations was $39.5 million, or $1.58 per diluted share, compared to $78.2 million, or $3.02 per diluted share, in first quarter 2022.
ArcBest’s first quarter 2023 net income was $71.3 million, or $2.84 per diluted share. As announced, in February 2023, ArcBest completed the sale of FleetNet America®, its fleet maintenance and repair services subsidiary. ArcBest’s discontinued operations include after-tax income of $1.0 million associated with FleetNet’s first quarter operating results through the closing date and an after-tax gain on the sale of $51.4 million, or $2.05 per diluted share, which is subject to post-closing adjustments.
Supply chain efficiency is critical to customers’ businesses and can be a competitive differentiator. They need a strategic partner that understands their business, offers full shipment visibility and has the ability to shift modes to get product where it needs to be when it needs to be there. ArcBest’s integrated logistics approach, combined with leading-edge technology and one hundred years of experience serves customers in this way. ArcBest’s ability to optimize, connect and deliver across various modes of transportation helps ensure customers have the solutions and capacity they need to meet their customers’ expectations, at a cost that makes sense. This integrated approach increases customer retention, improves profitability and produces cost savings for customers.
1
“By focusing on our customers and advancing our strategic initiatives, ArcBest achieved another profitable quarter with solid results,” said Judy R. McReynolds, ArcBest chairman, president and CEO. “In the first quarter, we launched our revolutionary freight movement technology, Vaux, as we continued to grow our customer base and better utilize available network capacity to increase tonnage. In addition, we completed the sale of FleetNet, which strengthened our balance sheet and positioned ArcBest to further accelerate the return of capital to shareholders. Our team is committed to our long-term financial and operational goals while we manage through short term market changes. As ArcBest celebrates its 100th anniversary this year, I’m proud of the ArcBest team for their adaptability and spirit of innovation, and I am grateful to our customers, who trust us each day to help them build and manage effective supply chains.”
First Quarter Results of Operations Comparisons
Asset-Based
First Quarter 2023 Versus First Quarter 2022
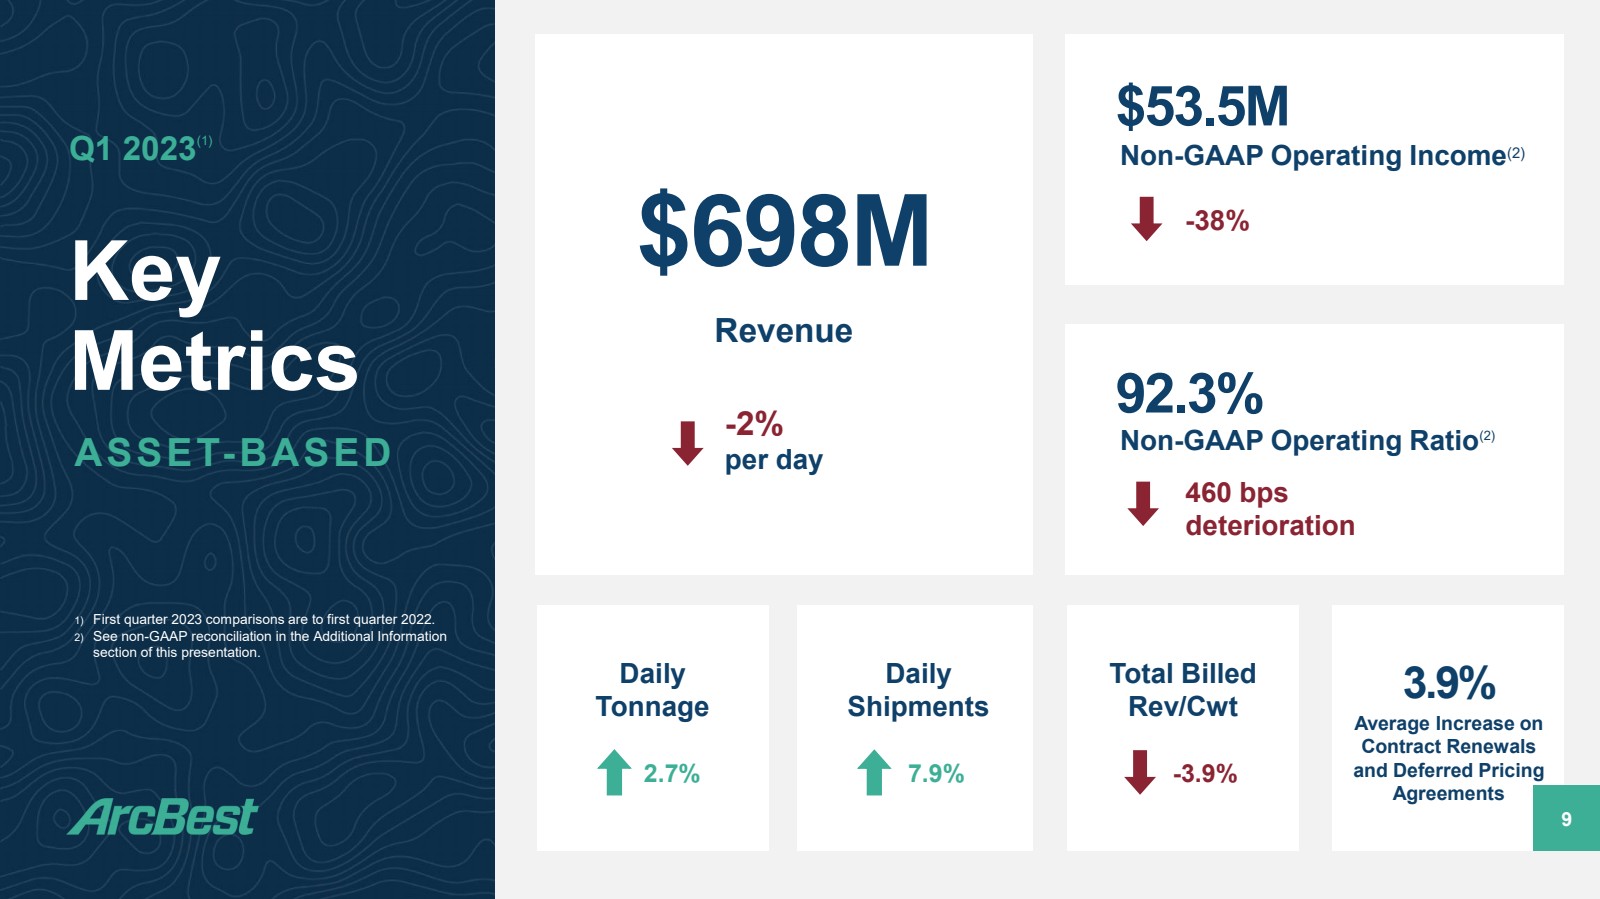
| ● | Revenue of $697.8 million compared to $705.3 million, a per-day decrease of 1.8 percent. |
| ● | Total tonnage per day increased 2.7 percent; LTL-rated weight per shipment decreased 2.5 percent |
| ● | Total shipments per day increased 7.9 percent. |
| ● | Total billed revenue per hundredweight decreased 3.9 percent. Revenue per hundredweight on LTL-rated business, excluding fuel surcharge, decreased by a percentage in the low single digits. |
| ● | Operating income of $47.5 million and an operating ratio of 93.2 percent compared to operating income of $80.0 million and an operating ratio of 88.7 percent. On a non-GAAP basis, operating income of $53.5 million and an operating ratio of 92.3 percent compared to operating income of $87.0 million and an operating ratio of 87.7 percent. |
First quarter total revenue in ArcBest’s Asset-Based business decreased compared to the prior-year period influenced by reduced customer order quantities related to softness in the general economy. ArcBest is focused on effectively managing personnel, equipment and other network resources to provide customer service, while controlling costs. Actions taken to further reduce cartage, purchased transportation, equipment rentals and other outside resources are expected to positively impact second quarter operating expenses. During the current freight environment, ArcBest optimized revenues and maintained more consistent business levels relative to available network capacity through the utilization of ArcBest’s market-based, tech-enabled dynamic LTL-rated pricing program. This innovative approach captures a larger opportunity of profitable shipments and positions ArcBest with the resources to serve customers amid a continuing tight labor market and benefit when core business strengthens. As a result, LTL-rated business experienced sequential as well as year-over-year shipment and tonnage growth in the first quarter. Heavier-weighted truckload-rated shipments moving in the Asset-Based network also increased sequentially and over the prior year despite a reduction in U-Pack household goods loads associated with a slower housing market.
The year-over-year total revenue per hundredweight decrease in first quarter 2023 followed a 21% increase in first quarter 2022 versus first quarter 2021. The 2023 revenue per hundredweight measure has been impacted by the heavier-weighted truckload-rated shipments and by dynamic market-priced LTL-rated shipments being a higher proportion of business versus core LTL-rated shipments. The pricing environment continues to be rational as pricing on core LTL-rated business, excluding fuel surcharges, increased by a percentage in the high single digits in first quarter 2023. On a sequential basis, compared to the fourth quarter, total revenue per hundredweight, excluding fuel surcharge, on core business increased by a percentage in the low single digits.
Asset-Light‡
First Quarter 2023 Versus First Quarter 2022
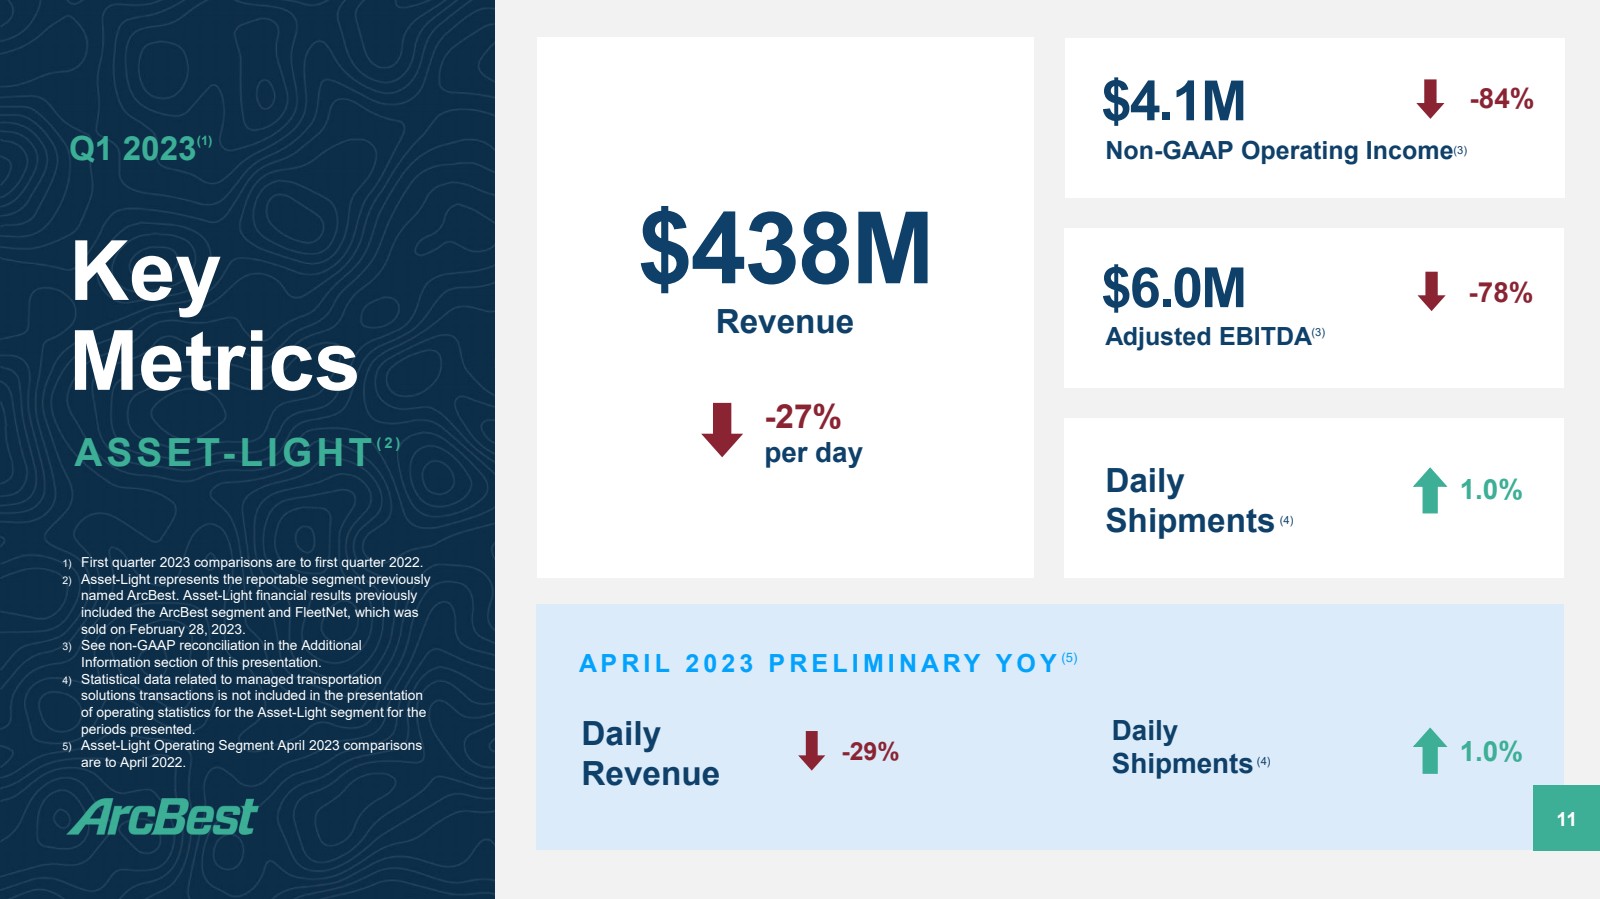
| ● | Revenue of $438.1 million compared to $595.3 million, a per-day decrease of 27.0 percent. |
| ● | Operating loss of $14.1 million compared to operating income of $21.1 million. On a non-GAAP basis, operating income of $4.1 million compared to $25.1 million. |
| ● | Adjusted earnings before interest, taxes, depreciation and amortization (“Adjusted EBITDA”) of $6.0 million compared to $27.1 million, as detailed in the attached non-GAAP reconciliation tables. |
2
In the Asset-Light segment, lower customer demand and reduced market rates combined with changes in business mix contributed to a decrease in total revenue compared to the previous year period. Total Asset-Light daily shipments during the recent quarter increased slightly versus prior year due to truckload shipment growth, despite decreases in expedite shipment counts. However, the decrease in total Asset-Light revenue per shipment contributed to reduced first quarter profitability. Compared to prior year, first quarter operating margins were further pressured by increases in operating expenses. However, excluding purchased transportation and the impact of the change in fair value of contingent consideration, operating expenses were managed lower by $3.3 million, or 5%, compared to fourth quarter 2022. During the current period of market softness and lower average shipment revenue, active management of operating expenses continues as ArcBest remains focused on efficiently delivering impactful logistics solutions to customers. Additional reductions will be implemented in employee-related and outside services costs to better align with business levels. When compared to first quarter 2023, these cost reductions are expected to be in a range of $2 million to $3 million for second quarter 2023, provided the measures are maintained throughout the quarter.
NOTE ‡ - Asset-Light represents the reportable segment previously named ArcBest. Asset-Light financial results previously included the ArcBest segment and FleetNet, which was sold on February 28, 2023.
Vaux™ Freight Movement Technology Launch
On March 1, 2023, ArcBest launched Vaux™, an innovative suite of hardware and software that modernizes and transforms how freight is loaded, unloaded and transferred. Vaux enables the entire contents of a trailer to be unloaded in minutes and offers complete visibility into freight movement within warehouse facilities, on the dock and over the road. It creates efficiencies and orchestrates seamless warehouse operations. Since launch, we’ve been pleased with the incredible interest from some of the largest companies in the world that immediately recognized ways to utilize Vaux in their businesses. We’re still early in the rollout, but we see meaningful upside opportunity to our business through this new solution.
Share Repurchase Program
The recent sale of FleetNet further supports the return of capital to ArcBest’s shareholders. In February 2023, ArcBest’s board increased the company’s share repurchase authorization to $125 million, and in March 2023, ArcBest entered into a 10b5-1 program for share repurchases during the current closed trading window. Through Thursday, April 27, 2023, ArcBest has settled repurchases of 314,765 shares of common stock under the company’s share repurchase plan for an aggregate cost of $29.0 million. With these repurchases, $96.0 million remains available under the current repurchase authorization for future common stock purchases.
Conference Call
ArcBest will host a conference call with company executives to discuss the first quarter 2023 results. The call will be today, Friday, April 28, at 9:30 a.m. EDT (8:30 a.m. CDT). Interested parties are invited to listen by calling (800) 734-8592 or by joining the webcast which can be found on ArcBest’s website at arcb.com. Slides to accompany this call are included in Exhibit 99.3 of the Form 8-K filed on April 28, 2023, will be posted and available to download on the company’s website prior to the scheduled conference time, and will be included in the webcast. Following the call, a recorded playback will be available through the end of the day on June 15, 2023. To listen to the playback, dial (800) 633-8284 or (402) 977-9140 (for international callers). The conference call ID for the playback is 22026574. The conference call and playback can also be accessed, through June 15, 2023, on ArcBest’s website at arcb.com.
About ArcBest
ArcBest® (Nasdaq: ARCB) is a multibillion-dollar integrated logistics company that helps keep the global supply chain moving. Founded in 1923 and now with over 15,000 employees across nearly 250 campuses and service centers, the company is a logistics powerhouse, fueled by the simple notion of finding a way to get the job done. Through innovative thinking, agility and trust, ArcBest leverages its full suite of shipping and logistics solutions to meet customers’ critical needs, each and every day. For more information, visit arcb.com.
3
The following is a “safe harbor” statement under the Private Securities Litigation Reform Act of 1995: Certain statements and information in this press release concerning results for the three months ended March 31, 2023 may constitute “forward-looking statements” within the meaning of the Private Securities Litigation Reform Act of 1995, including, among others, statements regarding (i) our expectations about our intrinsic value or our prospects for growth and value creation and (ii) our financial outlook, position, strategies, goals, and expectations. Terms such as “anticipate,” “believe,” “could,” “estimate,” “expect,” “forecast,” “foresee,” “intend,” “may,” “plan,” “predict,” “project,” “scheduled,” “should,” “would,” and similar expressions and the negatives of such terms are intended to identify forward-looking statements. These statements are based on management’s beliefs, assumptions, and expectations based on currently available information, are not guarantees of future performance, and involve certain risks and uncertainties (some of which are beyond our control). Although we believe that the expectations reflected in these forward-looking statements are reasonable as and when made, we cannot provide assurance that our expectations will prove to be correct. Actual outcomes and results could materially differ from what is expressed, implied, or forecasted in these statements due to a number of factors, including, but not limited to: unfavorable terms of, or the inability to reach agreement on, future collective bargaining agreements or a workforce stoppage by our employees covered under ABF Freight’s collective bargaining agreement; the effects of a widespread outbreak of an illness or disease, including the COVID-19 pandemic, or any other public health crisis, as well as regulatory measures implemented in response to such events; external events which may adversely affect us or the third parties who provide services for us, for which our business continuity plans may not adequately prepare us, including, but not limited to, acts of war or terrorism, or military conflicts; data privacy breaches, cybersecurity incidents, and/or failures of our information systems, including disruptions or failures of services essential to our operations or upon which our information technology platforms rely; interruption or failure of third-party software or information technology systems or licenses; untimely or ineffective development and implementation of, or failure to realize the potential benefits associated with, new or enhanced technology or processes, including the pilot test program at ABF Freight and our investments in human-centered remote operation software; the loss or reduction of business from large customers; the timing and performance of growth initiatives and the ability to manage our cost structure; the cost, integration, and performance of any recent or future acquisitions, including the acquisition of MoLo Solutions, LLC, and the inability to realize the anticipated benefits of the acquisition within the expected time period or at all; maintaining our corporate reputation and intellectual property rights; nationwide or global disruption in the supply chain resulting in increased volatility in freight volumes; competitive initiatives and pricing pressures; increased prices for and decreased availability of new revenue equipment, decreases in value of used revenue equipment, and higher costs of equipment-related operating expenses such as maintenance, fuel, and related taxes; availability of fuel, the effect of volatility in fuel prices and the associated changes in fuel surcharges on securing increases in base freight rates, and the inability to collect fuel surcharges; relationships with employees, including unions, and our ability to attract, retain, and upskill employees; union employee wages and benefits, including changes in required contributions to multiemployer plans; availability and cost of reliable third-party services; our ability to secure independent owner operators and/or operational or regulatory issues related to our use of their services; litigation or claims asserted against us; governmental regulations; environmental laws and regulations, including emissions-control regulations; default on covenants of financing arrangements and the availability and terms of future financing arrangements; our ability to generate sufficient cash from operations to support significant ongoing capital expenditure requirements and other business initiatives; self-insurance claims and insurance premium costs; potential impairment of goodwill and intangible assets; general economic conditions and related shifts in market demand that impact the performance and needs of industries we serve and/or limit our customers’ access to adequate financial resources; increasing costs due to inflation and rising interest rates; seasonal fluctuations, adverse weather conditions, natural disasters, and climate change; and other financial, operational, and legal risks and uncertainties detailed from time to time in ArcBest Corporation’s public filings with the Securities and Exchange Commission (“SEC”).
For additional information regarding known material factors that could cause our actual results to differ from those expressed in these forward-looking statements, please see our filings with the SEC, including our Annual Report on Form 10-K, Quarterly Reports on Form 10-Q, and Current Reports on Form 8-K.
Readers are cautioned not to place undue reliance on forward-looking statements, which speak only as of the date hereof. We undertake no obligation to publicly update or revise any forward-looking statements after the date they are made, whether as a result of new information, future events, or otherwise.
Financial Data and Operating Statistics
The following tables show financial data and operating statistics on ArcBest® and its reportable segments.
###
4
ARCBEST CORPORATION
CONSOLIDATED STATEMENTS OF OPERATIONS
| | Three Months Ended | | ||||
| | March 31 | | ||||
|
| 2023 |
| 2022 |
| ||
| | (Unaudited) | | ||||
| | ($ thousands, except share and per share data) | | ||||
REVENUES | | $ | 1,106,094 | | $ | 1,268,091 | |
| | | | | | | |
OPERATING EXPENSES | |
| 1,084,935 | | | 1,175,148 | |
| | | | | | | |
OPERATING INCOME | |
| 21,159 | |
| 92,943 | |
| | | | | | | |
OTHER INCOME (COSTS) | | | | | | | |
Interest and dividend income | |
| 2,933 | |
| 99 | |
Interest and other related financing costs | |
| (2,327) | |
| (1,940) | |
Other, net | |
| 1,780 | |
| (826) | |
| |
| 2,386 | |
| (2,667) | |
| | | | | | | |
INCOME FROM CONTINUING OPERATIONS BEFORE INCOME TAXES | |
| 23,545 | |
| 90,276 | |
| | | | | | | |
INCOME TAX PROVISION | |
| 4,698 | |
| 22,268 | |
| | | | | | | |
NET INCOME FROM CONTINUING OPERATIONS | | | 18,847 | | | 68,008 | |
| | | | | | | |
INCOME FROM DISCONTINUED OPERATIONS, NET OF TAX(1) | | | 52,436 | | | 1,561 | |
| | | | | | | |
NET INCOME | | $ | 71,283 | | $ | 69,569 | |
| | | | | | | |
BASIC EARNINGS PER COMMON SHARE(2) | | | | | | | |
Continuing operations | | $ | 0.78 | | $ | 2.75 | |
Discontinued operations(1) | | | 2.16 | | | 0.06 | |
| | $ | 2.93 | | $ | 2.82 | |
| | | | | | | |
DILUTED EARNINGS PER COMMON SHARE(2) | | | | | | | |
Continuing operations | | $ | 0.75 | | $ | 2.62 | |
Discontinued operations(1) | | | 2.09 | | | 0.06 | |
| | $ | 2.84 | | $ | 2.68 | |
| | | | | | | |
AVERAGE COMMON SHARES OUTSTANDING | | | | | | | |
Basic | |
| 24,288,138 | |
| 24,710,685 | |
Diluted | |
| 25,057,726 | |
| 25,911,200 | |
| 1) | Discontinued operations represents the FleetNet segment, which sold on February 28, 2023. Includes net gain on sale of FleetNet of $51.4 million after-tax, or $2.12 basic earnings per share and $2.05 diluted earnings per share. |
| 2) | Earnings per common share is calculated in total and may not equal the sum of earnings per common share from continuing operations and discontinued operations due to rounding. |
5
ARCBEST CORPORATION
| | March 31 | | December 31 | | ||
|
| 2023 |
| 2022 |
| ||
| | (Unaudited) | | ||||
| | ($ thousands, except share data) | | ||||
ASSETS | | | | | | | |
CURRENT ASSETS | | | | | | | |
Cash and cash equivalents | | $ | 203,319 | | $ | 158,264 | |
Short-term investments | |
| 162,487 | |
| 167,662 | |
Accounts receivable, less allowances (2023 - $11,585; 2022 - $13,892) | |
| 470,440 | |
| 517,494 | |
Other accounts receivable, less allowances (2023 - $721; 2022 - $713) | |
| 11,485 | |
| 11,016 | |
Prepaid expenses | |
| 41,061 | |
| 39,484 | |
Prepaid and refundable income taxes | |
| 16,351 | |
| 19,239 | |
Current assets of discontinued operations | | | — | | | 64,736 | |
Other | |
| 11,887 | |
| 11,888 | |
TOTAL CURRENT ASSETS | |
| 917,030 | |
| 989,783 | |
| | | | | | | |
PROPERTY, PLANT AND EQUIPMENT | | | | | | | |
Land and structures | |
| 418,011 | |
| 401,840 | |
Revenue equipment | |
| 1,039,771 | |
| 1,038,832 | |
Service, office, and other equipment | |
| 303,698 | |
| 298,234 | |
Software | |
| 170,523 | |
| 167,164 | |
Leasehold improvements | |
| 24,693 | |
| 23,466 | |
| | | 1,956,696 | | | 1,929,536 | |
Less allowances for depreciation and amortization | |
| 1,151,396 | |
| 1,129,366 | |
| |
| 805,300 | |
| 800,170 | |
| | | | | | | |
GOODWILL | |
| 304,753 | |
| 304,753 | |
INTANGIBLE ASSETS, NET | |
| 110,622 | |
| 113,733 | |
OPERATING RIGHT-OF-USE ASSETS | | | 189,610 | | | 166,515 | |
DEFERRED INCOME TAXES | |
| 7,287 | |
| 6,342 | |
LONG-TERM ASSETS OF DISCONTINUED OPERATIONS | | | — | | | 11,097 | |
OTHER LONG-TERM ASSETS | | | 96,991 | | | 101,893 | |
TOTAL ASSETS | | $ | 2,431,593 | | $ | 2,494,286 | |
| | | | | | | |
LIABILITIES AND STOCKHOLDERS’ EQUITY | | | | | | | |
| | | | | | | |
CURRENT LIABILITIES | | | | | | | |
Accounts payable | | $ | 253,578 | | $ | 269,854 | |
Income taxes payable | |
| 19,460 | |
| 16,017 | |
Accrued expenses | |
| 278,658 | |
| 338,457 | |
Current portion of contingent consideration | | | 43,390 | | | — | |
Current portion of long-term debt | |
| 64,491 | |
| 66,252 | |
Current portion of operating lease liabilities | | | 28,466 | | | 26,225 | |
Current liabilities of discontinued operations | | | — | | | 51,665 | |
TOTAL CURRENT LIABILITIES | |
| 688,043 | |
| 768,470 | |
| | | | | | | |
LONG-TERM DEBT, less current portion | |
| 185,961 | |
| 198,371 | |
OPERATING LEASE LIABILITIES, less current portion | | | 170,253 | | | 147,828 | |
POSTRETIREMENT LIABILITIES, less current portion | |
| 12,169 | |
| 12,196 | |
LONG-TERM LIABILITIES OF DISCONTINUED OPERATIONS | | | — | | | 781 | |
CONTINGENT CONSIDERATION, less current portion | | | 83,650 | | | 112,000 | |
OTHER LONG-TERM LIABILITIES | |
| 34,248 | |
| 42,745 | |
DEFERRED INCOME TAXES | |
| 51,410 | |
| 60,494 | |
| | | | | | | |
STOCKHOLDERS’ EQUITY | | | | | | | |
Common stock, $0.01 par value, authorized 70,000,000 shares; | |
| 298 | |
| 298 | |
Additional paid-in capital | |
| 340,481 | |
| 339,582 | |
Retained earnings | |
| 1,157,061 | |
| 1,088,693 | |
Treasury stock, at cost, 2023: 5,683,472 shares; 2022: 5,529,383 shares | |
| (298,367) | |
| (284,275) | |
Accumulated other comprehensive income | |
| 6,386 | |
| 7,103 | |
TOTAL STOCKHOLDERS’ EQUITY | |
| 1,205,859 | |
| 1,151,401 | |
TOTAL LIABILITIES AND STOCKHOLDERS' EQUITY | | $ | 2,431,593 | | $ | 2,494,286 | |
6
ARCBEST CORPORATION
CONSOLIDATED STATEMENTS OF CASH FLOWS
| | Three Months Ended | | ||||
| | March 31 | | ||||
|
| 2023 |
| 2022 |
| ||
| | (Unaudited) | | ||||
| | ($ thousands) | | ||||
OPERATING ACTIVITIES | | | | | | | |
Net income | | $ | 71,283 | | $ | 69,569 | |
Adjustments to reconcile net income to net cash provided by (used in) operating activities: | | | | | | | |
Depreciation and amortization | |
| 32,187 | |
| 31,591 | |
Amortization of intangibles | |
| 3,203 | |
| 3,232 | |
Share-based compensation expense | |
| 2,235 | |
| 2,763 | |
Provision for losses on accounts receivable | |
| 1,427 | |
| 1,628 | |
Change in deferred income taxes | |
| (9,814) | |
| (1,417) | |
Gain on sale of property and equipment | |
| (9) | |
| (3,002) | |
Pre-tax gain on sale of discontinued operations | | | (69,083) | | | — | |
Changes in operating assets and liabilities: | | | | | | | |
Receivables | |
| 43,977 | |
| (103,677) | |
Prepaid expenses | |
| (1,464) | |
| (2,858) | |
Other assets | |
| 3,874 | |
| (2,781) | |
Income taxes | |
| 6,221 | |
| (3,017) | |
Operating right-of-use assets and lease liabilities, net | |
| 1,570 | |
| 14 | |
Accounts payable, accrued expenses, and other liabilities | |
| (64,944) | |
| (3,298) | |
NET CASH PROVIDED BY (USED IN) OPERATING ACTIVITIES | |
| 20,663 | |
| (11,253) | |
| | | | | | | |
INVESTING ACTIVITIES | | | | | | | |
Purchases of property, plant and equipment, net of financings | |
| (34,657) | |
| (19,471) | |
Proceeds from sale of property and equipment | |
| 1,833 | |
| 5,334 | |
Proceeds from sale of discontinued operations | | | 101,138 | | | — | |
Purchases of short-term investments | |
| (35,588) | |
| (12,339) | |
Proceeds from sale of short-term investments | |
| 41,865 | |
| 23,590 | |
Capitalization of internally developed software | |
| (3,631) | |
| (4,510) | |
NET CASH PROVIDED BY (USED IN) INVESTING ACTIVITIES | |
| 70,960 | |
| (7,396) | |
| | | | | | | |
FINANCING ACTIVITIES | | | | | | | |
Borrowings under credit facilities | |
| — | |
| 58,000 | |
Payments on long-term debt | |
| (17,649) | |
| (32,967) | |
Net change in book overdrafts | |
| (10,493) | |
| 955 | |
Deferred financing costs | |
| 63 | | | — | |
Payment of common stock dividends | |
| (2,915) | |
| (1,978) | |
Purchases of treasury stock | | | (14,092) | | | (16,506) | |
Payments for tax withheld on share-based compensation | |
| (1,590) | |
| (1,367) | |
NET CASH PROVIDED BY (USED IN) FINANCING ACTIVITIES | |
| (46,676) | |
| 6,137 | |
| | | | | | | |
NET INCREASE (DECREASE) IN CASH AND CASH EQUIVALENTS | |
| 44,947 | |
| (12,512) | |
Cash and cash equivalents of continuing operations at beginning of period | |
| 158,264 | |
| 76,568 | |
Cash and cash equivalents of discontinued operations at beginning of period | | | 108 | |
| 52 | |
CASH AND CASH EQUIVALENTS AT END OF PERIOD | | $ | 203,319 | | $ | 64,108 | |
| | | | | | | |
NONCASH INVESTING ACTIVITIES | | | | | | | |
Equipment financed | | $ | 3,478 | | $ | 8,113 | |
Accruals for equipment received | | $ | 1,453 | | $ | 712 | |
Lease liabilities arising from obtaining right-of-use assets | | $ | 30,581 | | $ | 25,473 | |
Note: The statements of cash flows for the three months ended March 31, 2023 and 2022, includes cash flows from continuing operations and cash flows from the discontinued operations of FleetNet America®, which was sold on February 28, 2023.
7
ARCBEST CORPORATION
FINANCIAL STATEMENT OPERATING SEGMENT DATA AND OPERATING RATIOS
| | Three Months Ended | | |||||||||
| | March 31 | | |||||||||
|
| 2023 |
| | 2022 |
| ||||||
| | (Unaudited) | | |||||||||
| | ($ thousands, except percentages) | | |||||||||
REVENUES FROM CONTINUING OPERATIONS | | | | | | | | | | | | |
Asset-Based |
| $ | 697,817 |
| |
|
| $ | 705,311 |
| |
|
Asset-Light(1) | |
| 438,092 | | | | |
| 595,284 | | | |
Other and eliminations | |
| (29,815) | | | | |
| (32,504) | | | |
Total consolidated revenues from continuing operations |
| $ | 1,106,094 |
| |
|
| $ | 1,268,091 |
| |
|
| | | | | | | | | | | | |
OPERATING EXPENSES FROM CONTINUING OPERATIONS | | | | | | | | | | | | |
Asset-Based | | | | | | | | | | | | |
Salaries, wages, and benefits |
| $ | 335,605 |
| 48.1 | % |
| $ | 313,497 |
| 44.5 | % |
Fuel, supplies, and expenses | |
| 94,288 | | 13.5 | | |
| 84,831 | | 12.0 | |
Operating taxes and licenses | |
| 13,979 | | 2.0 | | |
| 12,493 | | 1.8 | |
Insurance | |
| 13,273 | | 1.9 | | |
| 10,431 | | 1.5 | |
Communications and utilities | |
| 5,304 | | 0.8 | | |
| 4,687 | | 0.7 | |
Depreciation and amortization | |
| 24,911 | | 3.6 | | |
| 24,305 | | 3.4 | |
Rents and purchased transportation | |
| 90,744 | | 13.0 | | |
| 102,985 | | 14.6 | |
Shared services | | | 64,613 | | 9.2 | | | | 67,150 | | 9.5 | |
Gain on sale of property and equipment | |
| (51) | | — | | |
| (2,695) | | (0.4) | |
Innovative technology costs(2) | | | 6,068 | | 0.9 | | |
| 6,960 | | 1.0 | |
Other | |
| 1,612 | | 0.2 | | |
| 633 | | 0.1 | |
Total Asset-Based | |
| 650,346 | | 93.2 | % | |
| 625,277 | | 88.7 | % |
| | | | | | | | | | | | |
Asset-Light(1) | | | | | | | | | | | | |
Purchased transportation | | $ | 370,163 | | 84.5 | % | | $ | 508,380 | | 85.4 | % |
Supplies and expenses | | | 4,072 | | 0.9 | | |
| 3,266 | | 0.6 | |
Depreciation and amortization(3) | |
| 5,068 | | 1.2 | | |
| 5,180 | | 0.9 | |
Shared services | | | 51,429 | | 11.7 | | | | 50,197 | | 8.4 | |
Contingent consideration(4) | | | 15,040 | | 3.4 | | | | 810 | | 0.1 | |
Other | |
| 6,411 | | 1.5 | | |
| 6,335 | | 1.1 | |
Total Asset-Light | |
| 452,183 | | 103.2 | % | |
| 574,168 | | 96.5 | % |
| | | | | | | | | | | | |
Other and eliminations | |
| (17,594) | | | | |
| (24,297) | | | |
Total consolidated operating expenses from continuing operations |
| $ | 1,084,935 |
| 98.1 | % |
| $ | 1,175,148 |
| 92.7 | % |
| | | | | | | | | | | | |
OPERATING INCOME FROM CONTINUING OPERATIONS | | | | | | | | | | | | |
Asset-Based | | $ | 47,471 | | | | | $ | 80,034 | | | |
Asset-Light(1) | |
| (14,091) | | | | |
| 21,116 | | | |
Other and eliminations(5) | |
| (12,221) | | | | |
| (8,207) | | | |
Total consolidated operating income from continuing operations | | $ | 21,159 | | | | | $ | 92,943 | | | |
| 1) | Asset-Light represents the reportable segment previously named ArcBest. Asset-Light financial results previously included the ArcBest segment and FleetNet, which sold on February 28, 2023. |
| 2) | Represents costs associated with the freight handling pilot test program at ABF Freight. |
| 3) | Depreciation and amortization includes amortization of intangibles associated with acquired businesses. |
| 4) | Represents the fair value of the contingent earnout consideration recorded for the MoLo acquisition. The liability for contingent consideration is remeasured at each quarterly reporting date, and any change in fair value as a result of the recurring assessments is recognized in operating income. The contingent consideration for the MoLo acquisition will be paid based on achievement of certain targets of adjusted earnings before interest, taxes, depreciation, and amortization, as adjusted for certain items pursuant to the merger agreement, for years 2023 through 2025. |
| 5) | “Other and eliminations” includes corporate costs for certain unallocated shared service costs which are not attributable to any segment, additional investments to offer comprehensive transportation and logistics services across multiple operating segments, and other investments in ArcBest technology and innovations. |
8
ARCBEST CORPORATION
RECONCILIATIONS OF GAAP TO NON-GAAP FINANCIAL MEASURES
Non-GAAP Financial Measures
We report our financial results in accordance with U.S. generally accepted accounting principles (“GAAP”). However, management believes that certain non-GAAP performance measures and ratios utilized for internal analysis provide analysts, investors, and others the same information that we use internally for purposes of assessing our core operating performance and provides meaningful comparisons between current and prior period results, as well as important information regarding performance trends. Accordingly, non-GAAP results are presented on a continuing operations basis, excluding the discontinued operations of FleetNet, which was sold on February 28, 2023. The use of certain non-GAAP measures improves comparability in analyzing our performance because it removes the impact of items from operating results that, in management's opinion, do not reflect our core operating performance. Other companies may calculate non-GAAP measures differently; therefore, our calculation may not be comparable to similarly titled measures of other companies. Certain information discussed in the scheduled conference call could be considered non-GAAP measures. Non-GAAP financial measures should be viewed in addition to, and not as an alternative for, our reported results. These financial measures should not be construed as better measurements than operating income, operating cash flow, net income or earnings per share, as determined under GAAP.
| | Three Months Ended | | ||||
| | March 31 | | ||||
|
| 2023 | | 2022 |
| ||
ArcBest Corporation - Consolidated | | (Unaudited) | | ||||
| | ($ thousands, except per share data) | | ||||
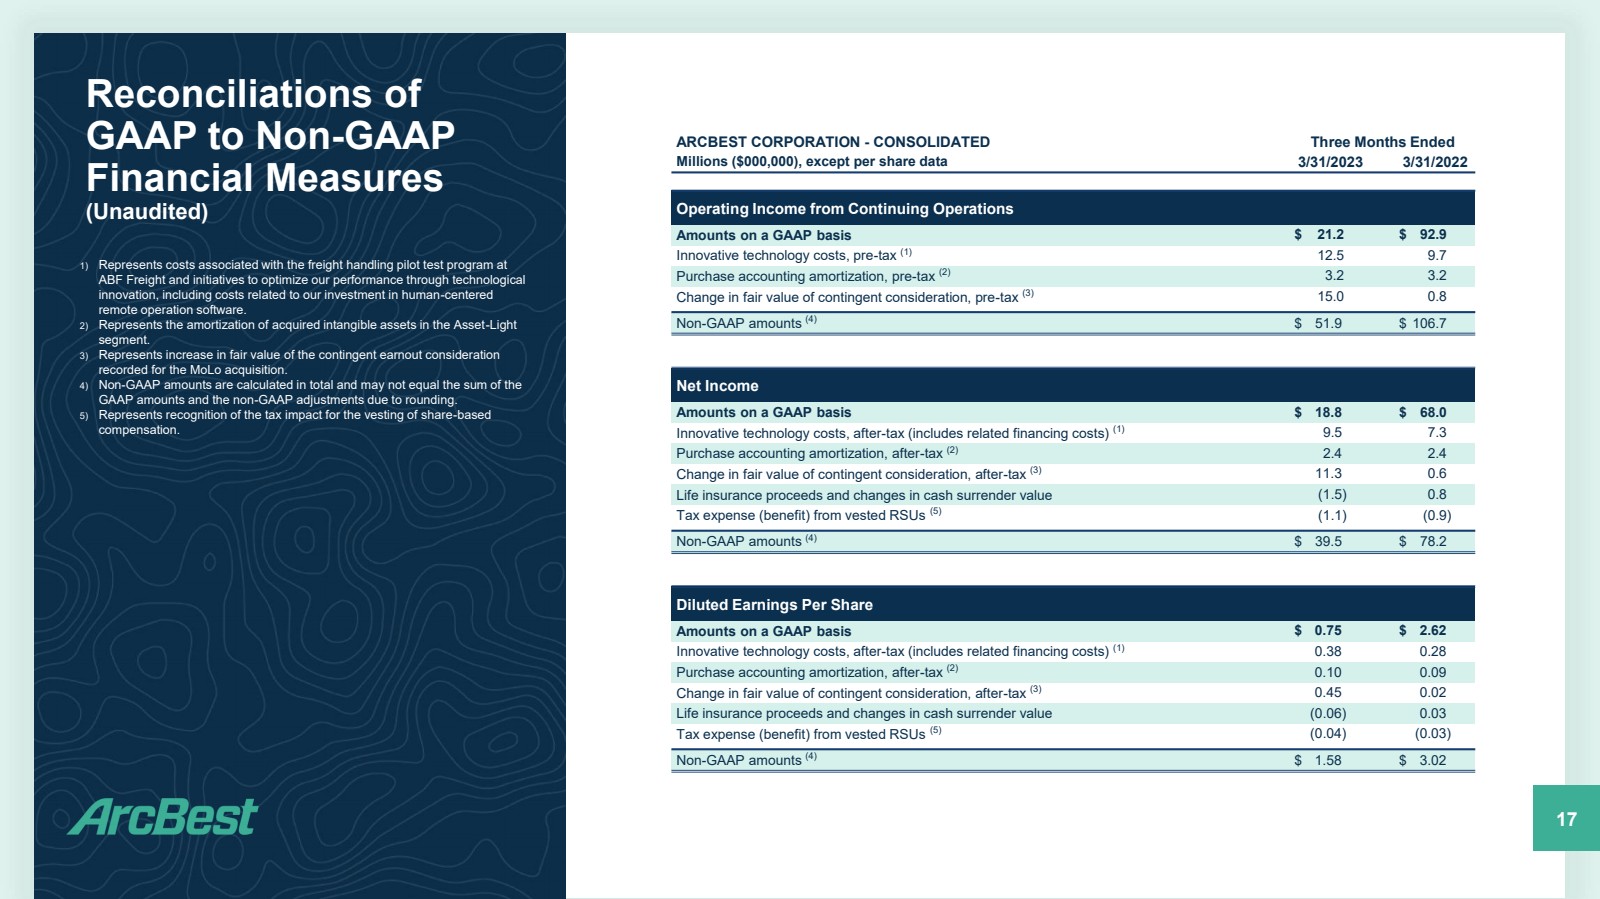
Operating Income from Continuing Operations | | | | | | | |
Amounts on GAAP basis | | $ | 21,159 | | $ | 92,943 | |
Innovative technology costs, pre-tax(1) | | | 12,478 | | | 9,686 | |
Purchase accounting amortization, pre-tax(2) | | | 3,192 | | | 3,213 | |
Change in fair value of contingent consideration, pre-tax(3) | | | 15,040 | | | 810 | |
Non-GAAP amounts | | $ | 51,869 | | $ | 106,652 | |
| | | | | | | |
Net Income from Continuing Operations | | | | | | | |
Amounts on GAAP basis | | $ | 18,847 | | $ | 68,008 | |
Innovative technology costs, after-tax (includes related financing costs)(1) | | | 9,480 | | | 7,289 | |
Purchase accounting amortization, after-tax(2) | | | 2,398 | | | 2,396 | |
Change in fair value of contingent consideration, after-tax(3) | | | 11,299 | | | 604 | |
Life insurance proceeds and changes in cash surrender value | | | (1,496) | | | 793 | |
Tax benefit from vested RSUs(4) | | | (1,051) | | | (870) | |
Non-GAAP amounts | | $ | 39,477 | | $ | 78,220 | |
| | | | | | | |
Diluted Earnings Per Share from Continuing Operations | | | | | | | |
Amounts on GAAP basis | | $ | 0.75 | | $ | 2.62 | |
Innovative technology costs, after-tax (includes related financing costs)(1) | | | 0.38 | | | 0.28 | |
Purchase accounting amortization, after-tax(2) | | | 0.10 | | | 0.09 | |
Change in fair value of contingent consideration, after-tax(3) | | | 0.45 | | | 0.02 | |
Life insurance proceeds and changes in cash surrender value | | | (0.06) | | | 0.03 | |
Tax benefit from vested RSUs(4) | | | (0.04) | | | (0.03) | |
Non-GAAP amounts(5) | | $ | 1.58 | | $ | 3.02 | |
| 1) | Represents costs associated with the freight handling pilot test program at ABF Freight and initiatives to optimize our performance through technological innovation, including costs related to our investment in human-centered remote operation software. |
| 2) | Represents the amortization of acquired intangible assets in the Asset-Light segment. |
| 3) | Represents increase in fair value of the contingent earnout consideration recorded for the MoLo acquisition, as previously described in the footnotes to the Financial Statement Operating Segment Data and Operating Ratios table. |
| 4) | Represents recognition of the tax impact for the vesting of share-based compensation. |
| 5) | Non-GAAP earnings per share is calculated in total and may not equal the sum of the GAAP amounts and the non-GAAP adjustments due to rounding. |
9
ARCBEST CORPORATION
RECONCILIATIONS OF GAAP TO NON-GAAP FINANCIAL MEASURES – Continued
| | Three Months Ended | | ||||||||||
| | March 31 | | ||||||||||
|
| 2023 | | 2022 | | ||||||||
Segment Operating Income Reconciliations | | (Unaudited) | | ||||||||||
| | ($ thousands, except percentages) | | ||||||||||
Asset-Based Segment | | | | ||||||||||
Operating Income ($) and Operating Ratio (% of revenues) | | | | ||||||||||
Amounts on GAAP basis | | $ | 47,471 | | 93.2 | % | | $ | 80,034 | | 88.7 | % | |
Innovative technology costs, pre-tax(1) | | | 6,068 | | (0.9) | | | | 6,960 | | (1.0) | | |
Non-GAAP amounts(2) | | $ | 53,539 | | 92.3 | % | | $ | 86,994 | | 87.7 | % | |
| | | | ||||||||||
Asset-Light Segment(3) | | | | ||||||||||
Operating Income (Loss) ($) and Operating Ratio (% of revenues) | | | | ||||||||||
Amounts on GAAP basis | | $ | (14,091) | | 103.2 | % | | $ | 21,116 | | 96.5 | % | |
Purchase accounting amortization, pre-tax(4) | | | 3,192 | | (0.7) | | | | 3,213 | | (0.5) | | |
Change in fair value of contingent consideration, pre-tax(5) | | | 15,040 | | (3.4) | | | | 810 | | (0.1) | | |
Non-GAAP amounts(2) | | $ | 4,141 | | 99.1 | % | | $ | 25,139 | | 95.8 | % | |
| | | | ||||||||||
Other and Eliminations | | | | ||||||||||
Operating Income (Loss) ($) | | | | ||||||||||
Amounts on GAAP basis | | $ | (12,221) | | | | | $ | (8,207) | | | | |
Innovative technology costs, pre-tax(6) | | | 6,410 | | | | | | 2,726 | | | | |
Non-GAAP amounts(2) | | $ | (5,811) | | | | | $ | (5,481) | | | | |
| 1) | Represents costs associated with the freight handling pilot test program at ABF Freight. |
| 2) | Non-GAAP amounts are calculated in total and may not equal the sum of the GAAP amounts and the non-GAAP adjustments due to rounding. |
| 3) | Asset-Light represents the reportable segment previously named ArcBest. Asset-Light financial results previously included the ArcBest segment and FleetNet, which sold on February 28, 2023. |
| 4) | Represents the amortization of acquired intangible assets in the Asset-Light segment. |
| 5) | Represents increase in fair value of the contingent earnout consideration recorded for the MoLo acquisition, as previously described in the footnotes to the Financial Statement Operating Segment Data and Operating Ratios table. |
| 6) | Represents costs associated with the freight handling pilot test program at ABF Freight and initiatives to optimize our performance through technological innovation, including costs related to our investment in human-centered remote operation software. |
10
ARCBEST CORPORATION
RECONCILIATIONS OF GAAP TO NON-GAAP FINANCIAL MEASURES – Continued
Effective Tax Rate Reconciliation | | | | | | | | | | | | | | | ||||
ArcBest Corporation - Consolidated | | | | | | | | | | | | | | | | | | |
| | | | | | | | | | | | | | | | | | |
(Unaudited) | | | | | | | | | | | | | | | | | | |
($ thousands, except percentages) | | Three Months Ended March 31, 2023 | ||||||||||||||||
| | | | | Other | | Income | | Income | | | | | | | |||
CONTINUING OPERATIONS | | Operating | | Income | | Before Income | | Tax | | Net | | | ||||||
| | Income | | (Costs) | | Taxes | | Provision | | Income | | Tax Rate(5) | ||||||
Amounts on GAAP basis | | $ | 21,159 | | $ | 2,386 | | $ | 23,545 | | $ | 4,698 | | $ | 18,847 | | 20.0 | % |
Innovative technology costs(1) | | | 12,478 | | | 259 | | | 12,737 | | | 3,257 | | | 9,480 | | 25.6 | |
Purchase accounting amortization(2) | | | 3,192 | | | — | | | 3,192 | | | 794 | | | 2,398 | | 24.9 | |
Change in fair value of contingent consideration(3) | | | 15,040 | | | — | | | 15,040 | | | 3,741 | | | 11,299 | | 24.9 | |
Life insurance proceeds and changes in cash surrender value | | | — | | | (1,496) | | | (1,496) | | | — | | | (1,496) | | — | |
Tax benefit from vested RSUs(4) | | | — | | | — | | | — | | | 1,051 | | | (1,051) | | — | |
Non-GAAP amounts | | $ | 51,869 | | $ | 1,149 | | $ | 53,018 | | $ | 13,541 | | $ | 39,477 | | 25.5 | % |
| | Three Months Ended March 31, 2022 | ||||||||||||||||
| | | | Other | | Income | | Income | | | | | | |||||
CONTINUING OPERATIONS | | Operating | | Income | | Before Income | | Tax | | Net | | | ||||||
| | Income | | (Costs) | | Taxes | | Provision | | Income | | Tax Rate(5) | ||||||
Amounts on GAAP basis | | $ | 92,943 | | $ | (2,667) | | $ | 90,276 | | $ | 22,268 | | $ | 68,008 | | 24.7 | % |
Innovative technology costs(1) | | | 9,686 | | | 129 | | | 9,815 | | | 2,526 | | | 7,289 | | 25.7 | |
Purchase accounting amortization(2) | | | 3,213 | | | — | | | 3,213 | | | 817 | | | 2,396 | | 25.4 | |
Change in fair value of contingent consideration(3) | | | 810 | | | — | | | 810 | | | 206 | | | 604 | | 25.4 | |
Life insurance proceeds and changes in cash surrender value | | | — | | | 793 | | | 793 | | | — | | | 793 | | — | |
Tax benefit from vested RSUs(4) | | | — | | | — | | | — | | | 870 | | | (870) | | — | |
Non-GAAP amounts | | $ | 106,652 | | $ | (1,745) | | $ | 104,907 | | $ | 26,687 | | $ | 78,220 | | 25.4 | % |
| 1) | Represents costs associated with the freight handling pilot test program at ABF Freight and initiatives to optimize our performance through technological innovation, including costs related to our investment in human-centered remote operation software. |
| 2) | Represents the amortization of acquired intangible assets in the Asset-Light segment. |
| 3) | Represents increase in fair value of the contingent earnout consideration recorded for the MoLo acquisition, as previously described in the footnotes to the Financial Statement Operating Segment Data and Operating Ratios table. |
| 4) | Represents recognition of the tax impact for the vesting of share-based compensation. |
| 5) | Tax rate for total “Amounts on GAAP basis” represents the effective tax rate. The tax effects of non-GAAP adjustments are calculated based on the statutory rate applicable to each item based on tax jurisdiction, unless the nature of the item requires the tax effect to be estimated by applying a specific tax treatment. |
11
ARCBEST CORPORATION
RECONCILIATIONS OF GAAP TO NON-GAAP FINANCIAL MEASURES – Continued
Adjusted Earnings Before Interest, Taxes, Depreciation, and Amortization (Adjusted EBITDA)
Management uses Adjusted EBITDA as a key measure of performance and for business planning. The measure is particularly meaningful for analysis of operating performance because it excludes amortization of acquired intangibles and software of the Asset-Light and changes in the fair value of contingent consideration, which are significant expenses resulting from strategic decisions rather than core daily operations. Additionally, Adjusted EBITDA is a primary component of the financial covenants contained in our credit agreement. The calculation of Consolidated Adjusted EBITDA as presented below begins with net income from continuing operations, which is the most directly comparable GAAP measure. The calculation of Asset-Light Adjusted EBITDA as presented below begins with operating income, as other income (costs), income taxes, and net income from continuing operations are reported at the consolidated level and not included in the operating segment financial information evaluated by management to make operating decisions.
| | Three Months Ended | | ||||
| | March 31 | | ||||
|
| 2023 |
| 2022 |
| ||
| | (Unaudited) | | ||||
ArcBest Corporation - Consolidated Adjusted EBITDA from Continuing Operations | | ($ thousands) | | ||||
| | | |||||
Net Income from Continuing Operations | | $ | 18,847 | | $ | 68,008 | |
Interest and other related financing costs | |
| 2,327 | |
| 1,940 | |
Income tax provision | |
| 4,698 | |
| 22,268 | |
Depreciation and amortization(1) | |
| 35,010 | |
| 34,396 | |
Amortization of share-based compensation | |
| 2,182 | |
| 2,701 | |
Change in fair value of contingent consideration(2) | |
| 15,040 | |
| 810 | |
Consolidated Adjusted EBITDA from Continuing Operations | | $ | 78,104 | | $ | 130,123 | |
| | Three Months Ended | | ||||
| | March 31 | | ||||
|
| 2023 | | 2022 | | ||
| | (Unaudited) | | ||||
| | ($ thousands) | | ||||
Asset-Light Adjusted EBITDA(3) | | | | | | | |
Operating Income | | $ | (14,091) | | $ | 21,116 | |
Depreciation and amortization(1) | | | 5,068 | | | 5,180 | |
Change in fair value of contingent consideration(2) | | | 15,040 | | | 810 | |
Asset-Light Adjusted EBITDA | | $ | 6,017 | | $ | 27,106 | |
1) | Includes amortization of intangibles associated with acquired businesses. |
2) | Represents increase in fair value of the contingent earnout consideration recorded for the MoLo acquisition, as previously described in the footnotes to the Financial Statement Operating Segment Data and Operating Ratios table |
3) | Asset-Light represents the reportable segment previously named ArcBest. Asset-Light financial results previously included the ArcBest segment and FleetNet, which sold on February 28, 2023. |
12
ARCBEST CORPORATION
OPERATING STATISTICS
| | Three Months Ended | | ||||||
| | March 31 | | ||||||
|
| 2023 |
| 2022 |
| % Change |
| ||
| | (Unaudited) | | ||||||
Asset-Based | | | | | | | | | |
| | | | | | | | | |
Workdays |
| | 64.0 |
| | 63.5 | | |
|
| | | | | | | | | |
Billed Revenue(1) / CWT | | $ | 41.99 | | $ | 43.70 |
| (3.9%) | |
| | | | | | | | | |
Billed Revenue(1) / Shipment | | $ | 529.43 | | $ | 578.80 |
| (8.5%) | |
| | | | | | | | | |
Shipments | |
| 1,334,754 | |
| 1,227,224 |
| 8.8% | |
| | | | | | | | | |
Shipments / Day | |
| 20,856 | |
| 19,326 |
| 7.9% | |
| | | | | | | | | |
Tonnage (Tons) | |
| 841,519 | |
| 812,730 |
| 3.5% | |
| | | | | | | | | |
Tons / Day | |
| 13,149 | |
| 12,799 |
| 2.7% | |
| | | | | | | | | |
Pounds / Shipment | |
| 1,261 | |
| 1,325 | | (4.8%) | |
| | | | | | | | | |
Average Length of Haul (Miles) | |
| 1,096 | |
| 1,079 |
| 1.6% | |
| | | | | | | | | |
| 1) | Revenue for undelivered freight is deferred for financial statement purposes in accordance with the Asset-Based segment revenue recognition policy. Billed revenue used for calculating revenue per hundredweight measurements has not been adjusted for the portion of revenue deferred for financial statement purposes. |
| | Year Over Year % Change | ||
| | Three Months Ended | ||
|
| March 31, 2023 | ||
| | (Unaudited) | ||
Asset-Light(2)(3) | | | | |
| | | | |
Revenue / Shipment | | | (30.5%) | |
| | | | |
Shipments / Day | | | 1.0% | |
| 2) | Asset-Light represents the reportable segment previously named ArcBest. |
| 3) | Statistical data related to managed transportation solutions transactions is not included in the presentation of operating statistics for the Asset-Light segment for the periods presented. |
###
13