00008936912023FYTRUE00008936912023-01-022023-12-3100008936912023-07-02iso4217:USD00008936912024-04-24xbrli:shares
UNITED STATES
SECURITIES AND EXCHANGE COMMISSION
Washington, D.C. 20549
____________________________
FORM 10-K/A
(Amendment No. 1)
____________________________
☒ ANNUAL REPORT PURSUANT TO SECTION 13 OR 15(d) OF THE SECURITIES EXCHANGE ACT OF 1934
For the fiscal year ended December 31, 2023
or
☐ TRANSITION REPORT PURSUANT TO SECTION 13 OR 15(d) OF THE SECURITIES EXCHANGE ACT OF 1934
For the transition period from _____ to _____
Commission File Number: 001-11796
____________________________
Masonite International Corporation
(Exact name of registrant as specified in its charter)
____________________________
| | | | | | | | |
British Columbia, Canada | | 98-0377314 |
(State or other jurisdiction of incorporation or organization) | | (I.R.S. Employer Identification No.) |
2771 Rutherford Road
Concord, Ontario L4K 2N6 Canada
(Address of principal executive offices, zip code)
(800) 895-2723
(Registrant’s telephone number, including area code)
____________________________
Securities Registered Pursuant to Section 12(b) of the Act:
| | | | | | | | |
Common Stock (no par value) | DOOR | New York Stock Exchange |
(Title of class) | (Trading symbol) | (Name of exchange on which registered) |
Securities Registered Pursuant to Section 12(g) of the Act: None
Indicate by check mark if the registrant is a well-known seasoned issuer, as defined in Rule 405 of the Securities Act. Yes ☒ No o
Indicate by check mark if the registrant is not required to file reports pursuant to Section 13 or Section 15(d) of the Act. Yes o No ☒
Indicate by check mark whether the registrant: (1) has filed all reports required to be filed by Section 13 or 15(d) of the Securities Exchange Act of 1934 during the preceding 12 months (or for such shorter period that the registrant was required to file such reports), and (2) has been subject to such filing requirements for the past 90 days. Yes ☒ No o
Indicate by check mark whether the registrant has submitted electronically every Interactive Data File required to be submitted pursuant to Rule 405 of Regulation S-T (§232.405 of this chapter) during the preceding 12 months (or for such shorter period that the registrant was required to submit such files). Yes ☒ No ¨
Indicate by check mark whether the registrant is a large accelerated filer, an accelerated filer, a non-accelerated filer, smaller reporting company, or an emerging growth company. See the definitions of “large accelerated filer,” “accelerated filer,” “smaller reporting company,” and “emerging growth company” in Rule 12b-2 of the Exchange Act.
| | | | | | | | | | | | | | | | | | | | |
| Large accelerated filer | | ☒ | | Accelerated filer | | ☐ |
| Non-accelerated filer | | ☐ | | Smaller reporting company | | ☐ |
| | | | Emerging growth company | | ☐ |
If an emerging growth company, indicate by check mark if the registrant has elected not to use the extended transition period for complying with any new or revised financial accounting standards provided pursuant to Section 13(a) of the Exchange Act. o
Indicate by check mark whether the registrant has filed a report on and attestation to management's assessment of the effectiveness of its internal control financial reporting under Section 404(b) of the Sarbanes-Oxley Act (15 U.S.C. 7262(b)) by the registered public accounting firm that prepared or issued its audit report. ☒
If securities are registered pursuant to Section 12(b) of the Act, indicate by check mark whether the financial statements of the registrant included in the filing reflect the correction of an error to previously issued financial statements. o
Indicate by check mark whether any of those error corrections are restatements that required a recovery analysis of incentive-based compensation received by any of the registrant's executive officers during the relevant recovery period pursuant to §240.10D-1(b). o
Indicate by check mark whether the registrant is a shell company (as defined in Rule 12b-2 of the Exchange Act). Yes ☐ No ☒
As of July 2, 2023, the last business day of the registrant’s most recently completed second fiscal quarter, the aggregate market value of the shares of voting common stock held by non-affiliates of the registrant, computed by reference to the closing sales price of such shares on the New York Stock Exchange on July 2, 2023, was $2.2 billion.
Indicate by check mark whether the registrant has filed all documents and reports required to be filed by Section 12, 13 or 15(d) of the Securities Exchange Act of 1934 subsequent to the distribution of the securities under a plan confirmed by a court. Yes ☒ No ☐
The registrant had outstanding 21,978,219 shares of Common Stock, no par value, as of April 24, 2024.
Auditor Name: Ernst & Young LLP Auditor Location: Tampa, FL Auditors Firm ID: 42
DOCUMENTS INCORPORATED BY REFERENCE
None
EXPLANATORY NOTE
Masonite International Corporation (the "Company"), a corporation incorporated under the laws of British Columbia, is filing this Amendment No. 1 on Form 10-K/A (this “Amendment”) to its Annual Report on Form 10-K for the year ended December 31, 2023, originally filed with the Securities and Exchange Commission (the “SEC”), on February 29, 2024 (the “Original Form 10-K”) solely to:
•amend Part III, Items 10, 11, 12 13 and 14 of the Original Form 10-K to include the information required by and not included in such Items;
•remove the reference on the cover of the Original Form 10-K to the incorporation by reference of certain information from either a proxy statement or an amendment on Form 10-K into Part III of the Original Form 10-K; and
•file new certifications of our principal executive officer and principal financial officer as exhibits to this Amendment under Item 15 of Part IV hereof pursuant to Rule 12b-15 under the Securities Exchange Act of 1934, as amended, and to Section 302 of the Sarbanes-Oxley Act of 2002.
Except as explicitly set forth herein, this Amendment does not otherwise change, modify or update the disclosures in, or exhibits to, the Original Form 10-K.
Unless we state otherwise or the context otherwise requires, in this Amendment, all references to "Masonite," "we," "us," "our" and the "Company" refer to Masonite International Corporation and its subsidiaries. Reference to "2023" refers to fiscal year 2023 ended December 31, 2023. "Common Shares" refer to Masonite International Corporation common shares.
MASONITE INTERNATIONAL CORPORATION
INDEX TO THE AMENDMENT
December 31, 2023
| | | | | | | | | | | |
| | | Page No. |
| | | |
| | | |
| | | |
| | | |
| | | |
| | | |
| | | |
| | | |
| | | |
| | | |
| | | |
| | | |
| | | |
| | | |
| | | |
| | | |
| | | |
| | | |
| PART III | | | |
| Item 10 | | | |
| Item 11 | | | |
| Item 12 | | | |
| Item 13 | | | |
| Item 14 | | | |
| | | |
| PART IV | | | |
| Item 15 | | | |
| | | |
PART III
Item 10. Directors, Executive Officers and Corporate Governance
Executive Officers
Information regarding the executive officers of the Company is set forth at the beginning of Part III - Item 10 of the Original Form 10-K.
Directors
The names of the members of the Company’s Board of Directors (the “Board”), their respective ages, their positions with the Company and other biographical information as of April 15, 2024, are set forth below. All directors serve for a term ending at the next annual general meeting of shareholders and until his or her successor has been duly elected and qualified or until his or her earlier resignation or removal.
| | | | | | | | | | | | | | |
| HOWARD C. HECKES | | ROBERT J. BYRNE |
| | | | |
| Director Since 2019 | | | Director Since 2009 |
Age 59 | | Age 62 |
| President and Chief Executive Officer | | Chairman of the Board of Masonite |
| |
| Other Current Public Directorships: | | Other Current Public Directorships: |
■The AZEK Company | | ■NextEra Energy Partners, L.P. |
| | |
| Mr. Heckes has served as President and Chief Executive Officer ("CEO") of Masonite and as a director of Masonite since June 2019. Mr. Heckes joined Masonite from Energy Management Collaborative where he served as Chief Executive Officer since 2017. From 2008 to 2017, Mr. Heckes served in a variety of operations roles at Valspar Corporation, now a subsidiary of The Sherwin-Williams Company, most recently overseeing Valspar's industrial coatings portfolio. Prior to joining Valspar, Mr. Heckes held various leadership roles at Newell Rubbermaid (NASDAQ: NWL), including President of Sanford Brands and President of Graco Children's Products. Mr. Heckes currently serves as a director of The AZEK Company (NYSE: AZEK). | | Mr. Byrne has served as a director of Masonite since June 2009 and has been Chairman of the Board of Masonite since July 2010. Mr. Byrne has served as the Executive Chairman of Source2, Inc., which specializes in assisting clients with high volume recruiting since January 2019. Mr. Byrne was the founder and served as the President of Power Pro-Tech Services, Inc., which specializes in the installation, maintenance, and repair of emergency power and solar photovoltaic power systems, from 2002 until it was sold in 2017. Power Pro-Tech was Mr. Byrne’s fourth start-up. His other entrepreneurial ventures have been in telecommunications, private equity and educational software. From 1999 to 2001, Mr. Byrne was Executive Vice President and Chief Financial Officer of EPIK Communications, a start-up telecommunications company which merged with Progress Telecom in 2001 and was subsequently acquired by Level3 Communications. Having begun his career in investment banking, Mr. Byrne served as Partner at Advent International, a global private equity firm, from 1997 to 1999 and immediately prior to that, from 1993 to 1997, served as a director of Orion Capital Partners. Mr. Byrne serves as a director of NextEra Energy Partners, L.P. (NYSE: NEP). He rejoined the NEP board in December 2018 after having previously served as a director from July 2014 through April 2017. |
|
|
|
|
|
|
|
| JODY L. BILNEY | |
| | |
| Director Since 2014 | |
Age 61 | |
| Masonite Board Committees: | |
■Sustainability and Governance (Chair) | |
| Other Current Public Directorships: | |
■Alignment Healthcare, Inc. ■Chuy’s Holdings, Inc., ■Cracker Barrel Old Country Store | |
|
| | | |
Ms. Bilney has served as a director of Masonite since January 2014. Ms. Bilney served as the Chief Consumer Officer of Humana, Inc. (NYSE: HUM), a health insurance provider specializing in care delivery and health plan administration, from April 2013 until her retirement in March 2020. Prior to Humana, Ms. Bilney served as executive vice president and chief brand officer for Bloomin’ Brands, Inc. (NASDAQ: BLMN), where she headed various departments including brand and business strategy, marketing, corporate communications and business development. Prior to Bloomin’ Brands, she held senior executive positions at Charles Schwab (NYSE: SCHW) and Verizon (NYSE: VZ), where she led consumer-focused brand-transformation initiatives. Ms. Bilney is currently a member of the board of directors of Chuy’s Holdings, Inc. (NASDAQ: CHUY), an operator of value-driven, full-service restaurants (since May 2021); Alignment Healthcare, Inc. (NASDAQ: ALHC), a provider of customized health care in the U.S. (since January 2022), Cracker Barrel Old Country Store (NASDAQ: CBRL) (since September 2022), and several private companies. | | | |
| | |
| |
| | |
| | |
| | |
| |
|
|
|
|
|
| | |
| | | | | | | | | | | | | | |
| PETER R. DACHOWSKI | | DAPHNE E. JONES |
| | | | |
| Director Since 2013 | | | Director Since 2018 |
Age 75 | | Age 67 |
| Masonite Board Committees: | | Masonite Board Committees: |
■Audit ■Human Resources and Compensation | | ■Sustainability and Governance |
| Other Current Public Directorships: ■AMN Healthcare Services Inc. ■Barnes Group Inc. |
| Other Current Public Directorships: | |
■N/A | |
| | | | |
| Mr. Dachowski has served as a director of Masonite since July 2013. Mr. Dachowski spent 35 years with both CertainTeed Corporation, a North American manufacturer of exterior and interior residential and commercial building envelope construction products, and its parent company Saint-Gobain, most recently serving as CertainTeed’s Chairman and CEO from 2004 to 2011. Prior to rejoining CertainTeed, he served as President of Saint-Gobain’s worldwide insulation business and as a member of Saint-Gobain’s Global Corporate Management Committee from 1996 to 2011. He was employed by The Boston Consulting Group as a Consultant and Engagement Manager from 1973 to 1976 after beginning his career as a Financial Analyst with the Treasury Department of Exxon Corporation in 1971. Mr. Dachowski is currently an advisor to various private equity firms on potential investments in the building materials industry. | | Ms. Jones has served as a director of Masonite since February 2018. Ms. Jones is the Founder of The Board Curators, LLC, established in July 2021, and is also the Founder of Destiny Transformations Group, LLC, established in April 2018. Ms. Jones served as the Senior Vice President - Digital/Future of Work for GE Healthcare, the healthcare business of GE, from May 2017 to October 2017. Prior to that, she served as the Senior Vice President - Chief Information Officer for GE Healthcare Diagnostic Imaging and Services since August 2014. Prior to joining GE Healthcare, Ms. Jones was the Senior Vice President, Chief Information Officer for Hospira, Inc., a provider of pharmaceuticals and infusion technologies, from October 2009 through June 2014. Previously she served as Chief Information Officer at Johnson & Johnson from 2006 to 2009 and served in various information technology roles with Johnson & Johnson from 1997 through 2006. Ms. Jones began her career in sales and systems engineering at IBM. Ms. Jones currently serves as a director of AMN Healthcare Services Inc. (NYSE: AMN) and Barnes Group Inc. (NYSE: B). Ms. Jones previously served on the board of the Thurgood Marshall College Fund, a not-for-profit organization and the nation’s largest organization exclusively representing the Black College community and is the author of Win When They Say You Won’t. |
|
|
|
|
|
|
|
|
| | |
| JONATHAN F. FOSTER | |
| | |
| Director Since 2009 | |
Age 63 | |
| Masonite Board Committees: | |
■Audit (Chair) | |
| Other Current Public Directorships: | |
■Lear Corporation ■Berry Global, Inc. ■Five Point Holdings, LLC | | |
| | |
| | | |
Mr. Foster has served as a director of Masonite since June 2009. Mr. Foster is the founder and a Managing Director of Current Capital Partners LLC, a mergers and acquisitions advisory, corporate management services and private equity investing firm. Previously, from 2007 until 2008, Mr. Foster served as a Managing Director and Co-Head of Diversified Industrials and Services at Wachovia Securities. From 2005 until 2007, he served as Executive Vice President Finance and Business Development of Revolution LLC. From 2002 until 2004, Mr. Foster was a Managing Director of The Cypress Group, a private equity investment firm and from 2001 until 2002 he served as a Senior Managing Director of Bear Stearns & Co. From 1999 until 2000, Mr. Foster served as the Executive Vice President, Chief Operating Officer and Chief Financial Officer of ToysRUs.com, Inc. Previously, Mr. Foster was with Lazard for over ten years in various positions, including as a Managing Director. Mr. Foster currently serves as a director of Lear Corporation (NYSE: LEA), Berry Global, Inc (NYSE: BERY), and Five Point Holdings, LLC (NYSE: FPH) and was formerly a director of Sabine Oil & Gas from 2015 to 2016 and Chemtura Corporation from 2009 to 2017 and several private companies. | | | |
| | |
| |
| | |
| | |
| | |
| |
|
|
|
|
|
|
| | | | | | | | | | | | | | |
| BARRY A. RUFFALO | | JAY I. STEINFELD |
| | | | |
| Director Since 2021 | | | Director Since 2020 |
Age 54 | | Age 70 |
| Masonite Board Committees: | | Masonite Board Committees: |
■Human Resources and Compensation | | ■Audit |
| Other Current Public Directorships: | | Other Current Public Directorships: |
■N/A | | ■N/A |
| | |
Mr. Ruffalo has served as a director of the Company since July 2021. Mr. Ruffalo previously served as President and Chief Executive Officer and as a director of Astec Industries, Inc. (NASDAQ: ASTE) from August 2019 through January 2023. Prior to joining Astec Industries, Inc. he was employed by Valmont Industries (NYSE: VMI), a publicly-traded global producer of highly-engineered fabricated metal products, where he had served from 2015 to 2016 as Executive Vice President, Operational Excellence, from 2016 to 2017 as Group President - Energy & Mining, during 2017 as Group President - North America Structures/Energy/Mining, and from 2018 to July 2019 as Group President of Global Engineered Support Structures. Preceding his career at Valmont Industries, from 2013 to 2015, Mr. Ruffalo served terms as President of the Irrigation and of the Infrastructure divisions of Lindsay Corporation (NYSE: LNN), a publicly-traded global leader in proprietary water management and road infrastructure products and services. | | Mr. Steinfeld has served as a director of Masonite since November 2020. Prior to joining our Board, Mr. Steinfeld served as CEO of Global Custom Commerce (Blinds.com) ("GCC") from the time he founded the company in 1996 until he left the company in 2020. Mr. Steinfeld transformed GCC into the world's number one online window coverings retailer which was acquired by The Home Depot (NYSE: HD) in 2014. After the acquisition, Mr. Steinfeld remained CEO of GCC and served on The Home Depot Online Leadership Team from 2015 until he left the company. Mr. Steinfeld serves as Entrepreneur-in-Residence at Rice University’s Jesse H. Jones Graduate School of Business, serves on the Advisory Council at the University of Texas’s Herb Kelleher Entrepreneurship Center, and is the author of the Wall Street Journal Best Seller, Lead from the Core. Mr. Steinfeld began his career as a certified public accountant. |
|
|
|
|
|
|
|
|
|
| | |
| FRANCIS M. SCRICCO | |
| | |
| Director Since 2009 | |
Age 73 | |
| Masonite Board Committees: | |
■Human Resources and Compensation (Chair) | |
| Other Current Public Directorships: | |
■Visteon Corporation | | |
| | | | |
Mr. Scricco has served as a director of Masonite since June 2009. Prior to joining our Board, Mr. Scricco was with Avaya, Inc., a global business communications provider, where he served as Senior Vice President, Global Services from March 2004 to February 2007 and subsequently as Senior Vice President, Manufacturing, Logistics and Procurement until his retirement in October 2008. Prior to joining Avaya, Inc., he was employed by Arrow Electronics (NYSE: ARW) as its COO from 1997 to 2000 and then as its President and CEO from 2000 to 2002. Mr. Scricco’s first operating role was as a General Manager for General Electric. He began his career with The Boston Consulting Group in 1973. Mr. Scricco is currently Chairman of the Board of Visteon Corporation (NASDAQ: VC), a global automotive supplier and was a director of Tembec, Inc., an integrated forest products company, from 2008 to 2017. | | | |
| | |
| |
| | |
| | |
| | |
| |
|
|
|
|
|
|
DIRECTOR QUALIFICATIONS
The Board seeks to ensure that it is composed of members whose particular experience, qualifications, attributes and skills, when taken together, will allow the Board to satisfy its oversight responsibilities effectively. Consistent with the Company’s Sustainability and Governance Committee charter, in identifying candidates for membership on the Board, the Sustainability and Governance Committee takes into account all factors it considers appropriate, which may include strength of character, mature judgment, career specialization, relevant technical skills, diversity and the extent to which the candidate would fill a present need on the Board. We believe that the backgrounds and qualifications of our directors, considered as a group, should provide a composite mix of experience, knowledge and abilities that will allow our Board to fulfill its responsibilities. Consistent with its charter, the Sustainability and Governance Committee considers diversity of experience as well as diversity in gender and whether an individual represents an underrepresented minority or class as factors it considers in conducting its assessment of director nominees, along with such other factors as it deems appropriate given the then current needs of the Board and the Company, to maintain a balance of knowledge, experience, and capability.
When determining whether our directors have the experience, qualifications, attributes and skills, taken as a whole, to enable our Board to satisfy its oversight responsibilities effectively in light of our business and structure, our Board considers primarily on our longer-tenured directors’ contributions to our success in recent years, the specific expertise that the more recently elected directors have and are expected to continue to contribute, and on the information discussed in the biographies set forth under Part III, Item 10., “Directors, Executive Officers and Corporate Governance—Directors” above. With respect to Ms. Bilney, the Board considered her extensive marketing and branding experience with highly successful companies such as Humana, Inc. With respect to Mr. Byrne, our Board considered in particular his financial, investment banking and transactional experience and his proven entrepreneurial and operational skills in the industrial services industry. With respect to Mr. Dachowski, our Board considered in particular his extensive financial and building products industry experience. With respect to Mr. Foster, our Board considered in particular his experience as a Chief Financial Officer and member of the audit committee and board of directors of public companies, as well as his financial, investment banking and transactional experience. With respect to Ms. Jones, our Board considered her extensive experience with information technology, digital and cyber-security matters. With respect to Mr. Heckes, our Board considered in particular his current role as our Chief Executive Officer and his extensive management expertise. With respect to Mr. Ruffalo, our Board considered his extensive experience with manufacturing companies and his experience as a Chief Executive Officer of a public company. With respect to Mr. Scricco, our Board considered in particular his extensive management experience, including as Chief Executive Officer of an electronics distribution business, his public-company board experience, his strategy consulting experience, and his familiarity with product marketing, distribution channels and branding. With respect to Mr. Steinfeld, the Board considered his entrepreneurial, e-commerce, and digital experience.
AUDIT COMMITTEE
The Audit Committee currently consists of Jonathan F. Foster (Chair), Peter R. Dachowski and Jay I. Steinfeld. The Audit Committee met nine times in 2023. Each member of our Audit Committee is independent under applicable NYSE listing standards and meets the heightened standards for independence required by U.S. securities law, including Rule 10A-3 of the Securities Exchange Act of 1934 (the “Exchange Act”). Each member is financially literate under applicable NYSE listing standards and our Board has determined that each of Mr. Foster and Mr. Dachowski is qualified as an audit committee financial expert within the meaning of applicable SEC regulations. The Audit Committee oversees and evaluates and, where necessary or advisable, makes recommendations as to the quality and integrity of the financial statements of the Company, the internal control and financial reporting systems of the Company, the compliance by the Company with legal and regulatory requirements in respect of financial disclosure, the qualification, independence and performance of the Company’s independent registered public accounting firm and the performance of the Company’s internal audit functions. In addition, the Audit Committee is directly responsible for the appointment, compensation, retention, termination and oversight of the work of the independent registered public accounting firm (including oversight of the resolution of any disagreements between management and the independent registered public accounting firm regarding financial reporting) for the purpose of preparing audit reports or performing other audit, review or attest services for the Company, subject to any applicable approvals required from our Board or our shareholders.
CORPORATE GOVERNANCE GUIDELINES AND CODE OF ETHICS
Our Board has adopted Corporate Governance Guidelines that reflect the principles by which we operate. From time to time, the Sustainability and Governance Committee and the Board review and revise our Corporate Governance Guidelines in response to evolving best practices as appropriate.
We have also adopted a Values Guide/Code of Conduct (the “Code of Conduct”), which applies to all of our directors, officers and employees. We have posted and intend to continue to post any amendments to or waivers from our Code of Conduct on the Corporate Governance documents page on our website to the extent applicable to our Chief Executive Officer, Chief Financial Officer, Corporate Controller, and any other officer who may function as a Chief Accounting Officer or a director.
Each standing committee of the Board is governed by a charter adopted by the Board.
Our Corporate Governance Guidelines, the Code of Conduct, and each of the Audit, Human Resources and Compensation and Sustainability and Governance Committees charters and other information are available at our website, www.masonite.com, and such information is available in print to any shareholder without charge, upon request to Masonite International Corporation, 1242 East 5th Avenue, Tampa, FL 33605, Attention: Corporate Secretary, or by calling (800) 895-2723.
PROCESS FOR SHAREHOLDERS TO RECOMMEND DIRECTOR NOMINEES
Pursuant to its charter, the Sustainability and Governance Committee will evaluate candidates for nomination to the Board, including those recommended by shareholders, on a substantially similar basis as it considers other nominees, as described above. Shareholders wishing to propose a candidate for consideration may do so by submitting the proposed candidate’s name, age, business address and residential address, principal occupation or employment, and certain other information required by our Articles, to the attention of our Corporate Secretary in accordance with our Articles and the Business Corporations Act (British Columbia) (“BCBCA”). Please note that our Articles require that timely notice be provided by any shareholder who proposes director nominations for consideration at a shareholders’ meeting, in addition to other requirements. All recommendations for
nomination received by the Corporate Secretary that satisfy the requirements of our Articles and the BCBCA relating to such director nominations will be presented to the Sustainability and Governance Committee for its consideration.
DELINQUENT SECTION 16(a) REPORTS
Section 16(a) of the Exchange Act, as amended, requires directors, executive officers and beneficial owners of more than ten percent (10%) of our Common Shares to file with the SEC initial reports of ownership and reports of changes in ownership of our Common Shares. Based solely on our review of electronic filings with the SEC of such reports and written representations from our executive officers and directors that no Form 5 is required. The Company did not timely file the following Statements of Changes in Beneficial Ownership: the Form 4, filed by Christopher O. Ball, with the filings of Masonite on October 13, 2023, and the Form 4, filed by Alexander A. Legall, with the filings of Masonite, on October 11, 2023. To Masonite’s knowledge, based solely on a review of the copies of such reports furnished to Masonite and written representations that no other reports were required, during the year ended December 31, 2023, all other Section 16(a) filing requirements applicable to its officers, directors, and greater than ten percent beneficial owners were complied with.
Item 11. Executive Compensation
Director Compensation
During 2023, the annual non-employee director compensation program was structured as follows:
• Annual cash retainer: $100,000 ($170,000 for the Non-Executive Chairman of the Board)
• Annual equity retainer: $110,000 ($160,000 for the Non-Executive Chairman of the Board)
• Additional annual cash retainer for Sustainability and Governance Committee Chair: $17,500
• Additional annual cash retainer for Audit Committee Chair: $20,000
• Additional annual cash retainer for the Human Resources and Compensation Committee Chair: $17,500
• No meeting fees (Board or Committee)
All cash retainers are payable in equal installments at the beginning of each fiscal quarter. As indicated above, our non-employee directors other than the Non-Executive Chairman of the Board also receive an annual equity retainer of restricted stock units where the number of restricted stock units granted is determined by dividing $110,000 by the fair market value of a Common Share on the grant date. The number of restricted stock units granted to the Non-Executive Chairman of the Board is determined by dividing $160,000 by the fair market value of a Common Share on the grant date. These grants are made annually immediately after a director is elected or re-elected as the case may be, to our Board and will vest on the first anniversary of the grant date, subject to the director’s continued service on the Board through the vesting date.
All directors are reimbursed for reasonable costs and expenses incurred in attending meetings of our Board and its committees.
DIRECTOR COMPENSATION FOR 2023
Consistent with the compensation programs discussed above, the table below summarizes the 2023 compensation of all of our directors other than Mr. Heckes, who is a NEO. The compensation for Mr. Heckes is discussed under the section titled “Compensation Discussion and Analysis” and related tables.
| | | | | | | | | | | |
| Name | Fees Earned or Paid in Cash ($)(1) | Stock Awards ($)(2) | Total ($) |
| Robert J. Byrne, Chairman | 170,000 | 160,000 | 330,000 |
| Jody L. Bilney | 117,500 | 110,000 | 227,500 |
| Peter R. Dachowski | 100,000 | 110,000 | 210,000 |
| Jonathan F. Foster | 120,000 | 110,000 | 230,000 |
| Daphne E. Jones | 100,000 | 110,000 | 210,000 |
William S. Oesterle(3) | 36,264 | — | 36,264 |
| Barry A. Ruffalo | 100,000 | 110,000 | 210,000 |
| Francis M. Scricco | 117,500 | 110,000 | 227,500 |
| Jay I. Steinfeld | 100,000 | 110,000 | 210,000 |
(1) This column includes the annual cash retainers described above. Mr. Byrne received an additional $70,000 for serving as non-executive Chairman of the Board. Mr. Foster received $20,000 for serving as chair of the Audit Committee. Ms. Bilney received $17,500 for serving as the chair of the Sustainability and Governance Committee. Mr. Scricco received $17,500 for serving as the chair of the Human Resources and Compensation Committee.
(2) On May 11, 2023, each non-employee director elected to the Board other than Mr. Byrne was awarded 1,121 restricted stock units and Mr. Byrne was awarded 1,655 restricted stock units under the Masonite International Corporation Amended and Restated 2012 Equity Incentive Plan (the “2012 Plan”). The amounts reported in this column reflect the aggregate grant date fair value of the restricted stock units computed in accordance with Accounting Standards Codification Topic 718 “Stock Compensation,” as issued by the Financial Accounting Standards Board. The assumptions made when calculating the amounts are found in Note 12 to our Consolidated Financial Statements in Part II, Item 8 of our Annual Report on Form 10-K for the fiscal year ended December 31, 2023. As of December 31, 2023, the non-employee directors held the following outstanding restricted stock units: Mr. Byrne –1,655; Ms. Bilney – 1,121; Mr. Dachowski – 1,121; Mr. Foster – 1,121; Ms. Jones – 1,121; Mr. Ruffalo – 1,121; Mr. Scricco – 1,121; and Mr. Steinfeld – 1,121.
(3) Mr. Oesterle did not stand for reelection at the 2023 annual meeting of shareholders.
Compensation Discussion and Analysis
INTRODUCTION
This Compensation Discussion and Analysis (“CD&A”) describes our compensation philosophy and objectives, summarizes our executive compensation program and practices and explains the Human Resources and Compensation Committee (hereafter referred to as the Compensation Committee) process for setting compensation with respect to our Named Executive Officers (“NEOs”) listed below for fiscal 2023.
2023 NAMED EXECUTIVE OFFICERS
| | | | | | | | | | | | | | |
| Name | Title |
| Howard C. Heckes | President and Chief Executive Officer |
| Russell T. Tiejema | Executive Vice President and Chief Financial Officer |
| Christopher O. Ball | President, Global Residential |
| Randal A. White | Senior Vice President, Global Operations and Supply Chain |
| Robert A. Paxton | Senior Vice President, Human Resources |
EXECUTIVE SUMMARY
Summary of Executive Compensation Program Attributes
Our executive compensation program is overseen by the Compensation Committee, which has primary oversight for the design and implementation of our executive compensation program. Our executive compensation program is based on a “pay for performance” philosophy with objectives that are designed to attract, engage and retain high-caliber talent, reward performance and align the interests of our executives, including our NEOs, with the interests of our shareholders. We execute on our philosophy and objectives by providing our NEOs with competitive base salaries, annual cash incentive bonus opportunities, and grants of a combination of performance-based and time-based equity awards, severance and change in control benefits, and other employee benefits. The Compensation Committee administers our annual cash incentive bonus plan (“MIP”) and our long-term incentive plan (“LTIP”).
Summary of Fixed and At-Risk Pay Elements
To focus our NEOs on delivering results, both in the short- and long-term, a significant amount of our NEO’s target total direct compensation mix is weighted towards at-risk compensation. Our executive compensation program is comprised of the following fixed and at-risk pay elements as illustrated below.
| | | | | | | | | | | | | | | | | | | | |
| Element * | | Purpose | | 2023 Summary |
| | | | | | |
| Base Salary | | FIXED | | Fixed cash compensation that recognizes the level of responsibilities, contributions towards Company financial and operational goals, individual performance and experience, internal pay equity, the economic and business environment, and other relevant considerations, including maintaining target direct compensation near the peer group median. | | 2023 average base salary increase was 6.2% for our NEOs. |
| | | | | | |
Annual Cash Incentive Bonus
(MIP) | | AT RISK | | Performance-based cash compensation that rewards the achievement of Company-wide and/or segment-specific financial and operational goals for our NEOs.
The MIP (both Corporate and Segment-specific) is subject to an individual performance multiplier.
A discretionary pool of up to 5% of the target MIP bonus pool is available to be used by the CEO for recognition of excellent performance by bonus plan participants, including our NEOs. | | 2023 MIP - Corporate performance metrics for Messrs. Heckes, Tiejema, White and Paxton were: •MIP Adjusted EBITDA (50%) •Global Core Working Capital (25%) •Balanced Scorecard (25%)
2023 MIP - Segment-specific performance metrics for Mr. Ball were: •Segment MIP Adjusted EBITDA (50%) •Global Core Working Capital (25%) •Balanced Scorecard (25%) |
| | | | | |
| Long-Term Incentive (LTIP) | | | Equity-based compensation that is tied to achievement of long-term financial and operational goals over a three-year performance period and aligns our NEOs with the interests of our shareholders. •30% - Time-Vesting Restricted Stock Units (“RSUs”) •60% - Performance-Vesting Restricted Stock Units (“PSUs”) •10% - Stock Appreciation Rights (“SARs”)
| | 2023-2025 LTIP - PSU performance metrics based on a three-year target were: •Net Sales (50%) •Relative Total Shareholder Return (50%)
|
* Additional elements of NEO compensation are described below. See - “Elements of Our Executive Compensation Program”.
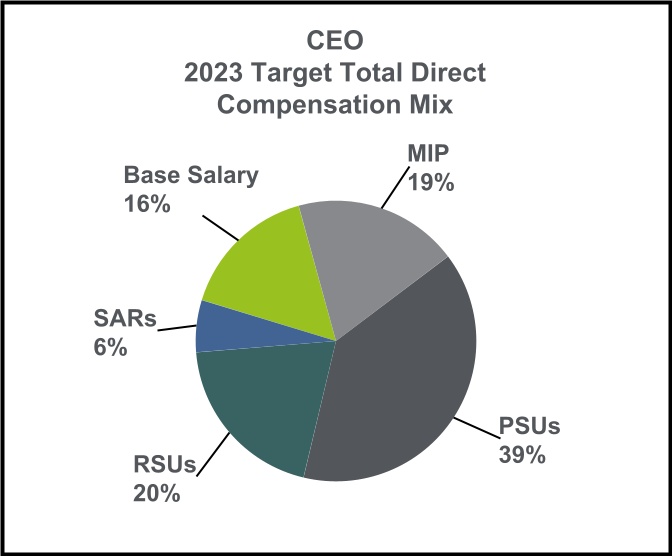
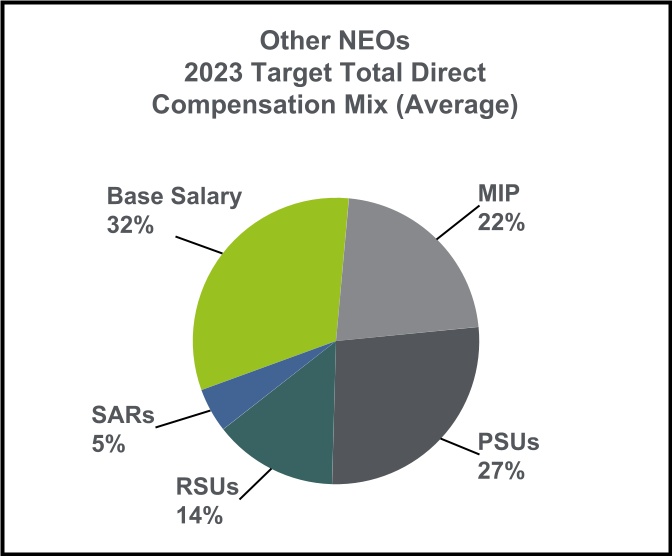
2023 Target Compensation Mix
Our executive compensation program provides for a mix of at-risk and fixed compensation elements and our Compensation Committee strives to achieve an appropriate balance between these two types of compensation, as well as an appropriate mix of cash and equity-based compensation. The Compensation Committee strives to provide pay opportunities that align within a competitive range, generally defined as +/- 15% of the median of the market for executive talent, as determined using both our peer group and general industry market survey data, and considers competitive compensation practices and other relevant factors such as experience, contribution, internal equity, and performance in setting each NEO’s target total direct compensation. The target mix of compensation elements is designed to reward individual and team performance and enterprise value growth. We place relatively greater emphasis towards at-risk compensation, through our performance-based MIP and through grants of PSUs and SARs under our LTIP plan, to align the interests of our executive officers with the interest of our shareholders and motivate them to drive shareholder value. The LTIP is also designed to provide retention incentives for our executive officers through the granting of RSUs near the commencement of each performance period that are subject to a vesting period. We look to the experience and judgment of the Compensation Committee to determine what it believes to be the appropriate target compensation mix for each NEO.
The charts below illustrate the target total direct compensation for 2023 for our CEO and the average of the other four NEOs.
Summary of Key Compensation and Governance Practices
As part of our compensation philosophy, we have adopted a number of compensation and governance practices to help ensure a balanced and transparent executive compensation structure, including:
| | | | | | | | | | | | | | |
| What We Do: | | | What We Don’t Do: |
| ☑ | Performance metrics align pay with Company financial performance | | ⊗ | No hedging, pledging or short sales of Common Shares |
| ☑ | Significant portion of executive compensation tied to financial metrics | | ⊗ | No guaranteed salary increases or bonuses |
| ☑ | Objective performance goals for short- and long-term incentives | | ⊗ | No cash component to our long-term incentive awards |
| ☑ | Significant stock ownership guidelines and holding requirements | | ⊗ | No tax gross-up payments |
| ☑ | All long-term compensation is equity based | | ⊗ | No “single trigger” equity award vesting upon change in control |
| ☑ | Caps on short- and long-term incentive awards | | ⊗ | No excessive or extraordinary perquisites |
| ☑ | Executive “clawback” policy for incentive compensation | | | |
| ☑ | Additional “clawback” provisions in our cash / equity incentive plans | | | |
| ☑ | Engagement of an independent compensation consultant | | | |
EXECUTIVE COMPENSATION PHILOSOPHY AND OBJECTIVES
The Compensation Committee has designed an executive compensation program that reflects a “pay for performance” philosophy with the objective to attract, engage and retain high-caliber talent, and reward performance tied to the achievement of financial and operational goals. The Compensation Committee has aligned our program with our business strategy which is focused on long-term revenue and earnings growth along with sustained long-term shareholder value by providing our NEOs with long-term incentives tied to growth and value creation to align the interests of our NEOs with the interests of our shareholders. Our program includes a balance of short- and long-term award opportunities, provided in cash or equity with portions of fixed and variable pay elements, to discourage excessive risk taking. In making NEO compensation decisions, the Compensation Committee considers a
variety of items, including but not limited to the nature and scope of all elements of the NEO’s total compensation, the NEO’s responsibilities and effectiveness in support of our key strategic, financial and operating goals, as well as market data and other information received from its independent compensation consultant (but does not assign any specific weighting to any of the items considered).
To guide our Compensation Committee in making executive compensation decisions and to achieve our “pay for performance” philosophy, our executive compensation program is designed to achieve the following key objectives:
| | | | | | | | | | | | | | |
| COMPETITIVE PAY | | PAY FOR PERFORMANCE | | ALIGNMENT WITH
SHAREHOLDER INTERESTS |
| We offer a total compensation program comprised of a fixed base salary and variable annual and long-term incentive compensation, severance and change in control benefits designed to attract, engage, retain and motivate talented executives. We offer competitive pay opportunities that align within a median range (generally, +/- 15%) of both our peer group and general industry and manufacturing industry survey data. | | We designed our MIP and our LTIP with a large portion of our pay mix in favor of at-risk compensation tied to financial and operating performance. Our NEO’s compensation is dependent upon the achievement of pre-established financial and operating goals. Pay outcomes are higher when performance exceeds target goals and pay outcomes are lower when target goals are not met, with the potential of a zero payout. | | To align the interests of our NEOs with those of our shareholders, we provide a significant portion of our NEOs total compensation in the form of equity-based compensation, including PSUs tied to three-year performance goals and SARs that only have value if the share price appreciates. |
Role of the Compensation Committee
The Compensation Committee consults with the Board in determining the compensation package of our CEO and has ultimate responsibility for determining the compensation for all our NEOs. The Compensation Committee makes compensation decisions for our NEOs after reviewing our performance for the preceding fiscal year, our short- and long-term strategies, and current economic and market conditions, and carefully evaluating each NEO’s performance during the preceding fiscal year against established organizational goals, leadership qualities, operational performance, business responsibilities, tenure, current compensation arrangements and long-term potential to enhance enterprise value. The Compensation Committee takes a holistic view in its assessment of executive compensation arrangements, taking into consideration the foregoing factors and shareholder considerations, not necessarily relying on any one factor exclusively in determining compensation for our NEOs. In making compensation decisions, the Compensation Committee receives advice from Frederic W. Cook & Co., Inc. (“FW Cook”) and input from our CEO and other executive officers, as further discussed below, as well as input from management that is informed by our shareholder engagement efforts.
Role of the Compensation Consultant
Our independent compensation consultant, FW Cook, is engaged by, and reports directly to, the Compensation Committee. FW Cook provides our Compensation Committee with input and guidance on all components of our executive compensation program. Except for services provided to the Compensation Committee related to executive compensation and non-employee director compensation, FW Cook did not provide any significant services to the Company during fiscal 2023, other than providing a market compensation report for vice president roles to management at the end of 2023, a summary of which was shared with the Compensation Committee. The Compensation Committee has evaluated whether any work performed by FW Cook raised any conflict of interest and determined there were no conflicts of interest during fiscal 2023.
Role of the CEO and Other Executive Officers
Our CEO reviews the base salaries of our NEOs (other than himself) on an annual basis and, if applicable, recommends base salary adjustments to the Compensation Committee, based on each NEO’s performance and responsibilities. The CEO confers with our Senior Vice President of Human Resources (“SVP of HR”) and together they consider applicable market data provided by FW Cook and provide input regarding the target percentage for the MIP and the dollar value target for the LTIP for each NEO. Additionally, our Executive Vice President and Chief Financial Officer (“CFO”) provides input to our CEO and the Compensation Committee with respect to the financial performance aspects of our MIP and LTIP to assist with designing an appropriate structure and financial goals. Although our CEO regularly attends meetings of the Compensation Committee, he recuses himself from those portions of the meetings related to his compensation. The Compensation Committee, in consultation with our Board, is exclusively responsible for determining any base salary changes and for making any other compensation decisions with respect to our CEO.
Compensation Benchmarking Study
In October 2022, upon request from the Compensation Committee, FW Cook conducted an updated benchmarking study of our executive compensation program based on our peer group, as well as other market information from third-party surveys. The Compensation Committee seeks, when setting executive compensation, to target total direct compensation within the competitive range of market median for our CEO and for all other NEO's as a group, with the intention that a significant portion of each NEO's total compensation package will continue to be focused on rewarding both short- and long-term performance through a combination of at-risk cash and equity incentive awards. When designing the 2023 compensation program, the Compensation Committee considered, among other factors, the results of the benchmarking study, in addition to individual performance levels, experience and responsibilities of our NEOs (none of these factors were individually weighted).
Peer Group Review
Consistent with the Compensation Committee’s objective of designing an executive compensation program that remains competitive and attracts, engages and retains high-caliber talent. The Compensation Committee, working with its independent compensation consultant, reviews annually, our peer group used to benchmark executive compensation. In selecting our peer group for 2023 executive compensation benchmarking, the Compensation Committee considered factors such as:
•operational fit reflecting companies in the building products industry and subject to similar economic opportunities and pressures as well as similar business and performance characteristics;
•financial scope reflecting companies of similar size and scale (with size for purposes of peer group development generally defined as 1/3 to 3 times Masonite’s revenue and market cap), in addition to relevant secondary measures such as total assets and net income;
•competitor companies with whom Masonite competes for executive talent and that operate in similar economic markets,
•public companies listed on major U.S. stock exchanges and subject to U.S. disclosure rules, and
•additional considerations such as cross-referenced peer groups.
The Compensation Committee approved the following list of companies as an appropriate peer group for benchmarking executive compensation, and making compensation decisions for 2023. There were no changes to the peer group from the prior year (other than the removal of Cornerstone Building Brands which was acquired in July 2022).
| | | | | | | | |
| Advanced Drainage Systems, Inc. | Gibraltar Industries, Inc. | PGT Innovations, Inc. |
| American Woodmark Corporation | Griffon Corp. | Quanex Building Products Corporation |
| Apogee Enterprises, Inc. | JELD-WEN Holdings, Inc. | Simpson Manufacturing Co., Inc. |
| Armstrong World Industries, Inc. | Lennox International Inc. | A.O. Smith Corporation |
| Fortune Brands Innovations, Inc. | Louisiana-Pacific Corp. | UFP Industries, Inc. |
SAY-ON-PAY VOTE
At the 2023 annual meeting of shareholders, we held our annual advisory vote on executive compensation. Approximately 83% of the votes cast for the “say on pay” proposal were in favor of the 2022 compensation for our NEOs. Each year, the Compensation Committee considers the outcome of the shareholder advisory vote on executive compensation when making future decisions relating to the compensation of our NEOs and our executive compensation program and policies.
SHAREHOLDER ENGAGEMENT AND FEEDBACK
As part of our on-going dialogue with our shareholders regarding governance, ESG, DEI and executive compensation topics, management offered shareholder engagement meetings with the stewardship offices of our top shareholders during our spring and fall engagement sessions. The Compensation Committee considers both the general and specific feedback received from our shareholders, and with the guidance of our independent compensation consultant and management, incorporates that feedback into our compensation program design. In 2023, the Compensation Committee made certain modifications to our compensation program design and related governance as a direct result of these engagement meetings, including to address investor feedback regarding (a) the use of a cash flow metric in our MIP program design, (b) expanded disclosure practices, specifically regarding our MIP and the related balanced scorecard metrics; (c) PSU performance goals for the 2023-2025 LTIP performance period by moving to a relative total shareholder return (“Relative TSR”) goal and (d) certain components of our stock ownership guidelines which were updated in July 2023.
ELEMENTS OF OUR EXECUTIVE COMPENSATION PROGRAM
For 2023, our executive compensation program consisted of the following elements:
•Base salary;
•Annual cash incentive bonus under our MIP;
•Long-term equity incentive awards under our LTIP;
•Severance and change in control benefits; and
•Other benefits and perquisites.
In making NEO compensation decisions, the Compensation Committee considers a variety of factors, including but not limited to the nature and scope of all elements of the NEO’s total compensation, the NEO’s responsibilities and effectiveness in support of the Company’s key strategic, financial and operational goals, as well as market data and other information received from its compensation consultant (but does not assign any specific weighting to any one factor). Additionally, the Compensation Committee reviews all the elements of compensation for our NEOs to assist the Compensation Committee in making compensation decisions including base salary, MIP cash bonus target, LTIP award value for the prior year and the anticipated award value for the current year, and the value of other compensation including perquisites. The Compensation Committee’s final compensation determination in relation to each element of compensation is independent of all other elements of compensation, other than to the extent that awards under the MIP are calculated by using a percentage of base salary as the target award value.
Base Salary
Base salary is primarily designed to provide our NEOs with a fixed amount of income that is competitive in relation to the responsibilities of each NEO’s position. When determining base salaries for each NEO, the Compensation Committee considers the NEO’s qualifications, experience, the scope of their responsibilities, individual performance and contributions towards overall Company success. Base salaries for NEOs are reviewed annually and are individually determined. In February 2023, the Compensation Committee approved base salary merit adjustments for each NEO after considering prevailing market practices for executive merit adjustments and the results of the 2022 benchmarking study. The merit adjustments, which were effective February 27, 2023, reflected the Compensation Committee’s desire to enhance our ability to retain and reward our NEOs for their performance.
The following table sets forth the 2022 year-end base salary, 2023 year-end base salary and the percentage increases for each NEO:
| | | | | | | | | | | |
| Name | 2022 Base Salary | 2023 Base Salary | % Increase |
| Howard C. Heckes | $915,000 | $985,000 | 7.7% |
| Russell T. Tiejema | $550,000 | $580,000 | 5.5% |
| Christopher O. Ball | $550,000 | $575,000 | 4.5% |
| Randal A. White | $470,000 | $500,000 | 6.4% |
| Robert A. Paxton | $445,000 | $475,000 | 6.7% |
Annual Cash Incentive Bonus
Our executive compensation program for our executive officers includes an annual cash incentive bonus under our MIP. The MIP is a short-term incentive plan that provides executive officers including our NEOs with a cash bonus award based on the achievement of predetermined annual performance goals. The Compensation Committee, in administering the MIP, establishes performance goals, target amounts and award opportunities near the beginning of the performance period for our NEOs. The target award is based on a percentage of the executive officer’s base salary (exclusive of any other compensation or benefits) and is payable in cash upon the achievement of a threshold performance level and capped by a maximum performance level.
After the end of the performance period, the Compensation Committee certifies the extent to which the performance goals have been achieved and determines the amount of the award that is payable. No annual cash incentive bonus is paid with respect to an applicable metric if the performance calculation for that metric is below the threshold established for that metric. No additional annual cash incentive bonus is paid beyond the established maximum performance level with respect to each applicable metric.
2023 MIP Design and Performance Goals
The Compensation Committee seeks recommendations from management on the design and structure of the MIP and performance goals (and the applicable targets for achievement of each such performance goal at threshold, target and maximum levels of performance) for our executive officers, including our NEOs, as well as any proposed revisions to the terms of the MIP for that fiscal year. The Compensation Committee, prior to determining the MIP design for the next fiscal year, considers the recommendations and input from FW Cook regarding current incentive plan design trends, our CEO’s recommendations, and feedback from our shareholder engagement discussions. Our CEO has no involvement in the determination of an NEO’s actual MIP payout each year, including his own, other than the assignment of an Individual Performance Multiplier for each of his direct reports, which includes the other NEOs.
For 2023, the Compensation Committee determined that the design of the 2023 MIP would include three performance goals based on the following financial and operating metrics, with an individual weighting assigned to each performance goal as a percentage of the applicable target bonus for both the Corporate and the North American Residential Segment (“NA Residential”) MIP participants.
| | | | | | | | |
| MIP Performance Goals | Weighting | Rationale for Use |
| 1) MIP Adjusted EBITDA | 50% | •Selected to focus our NEOs on growing Segment and total Company profitability and overall Company performance. |
| 2) Global Core Working Capital Improvement | 25% | •Selected to focus our NEOs on improving our liquidity and operational efficiency and performance. •Selected to align with feedback received from our shareholder engagement discussions to consider using a cash flow-based measure in our MIP design. |
3) Balanced Scorecard | 25% | •Selected to focus on improving financial, operational and ESG performance in selected focus areas, including: ◦Acquisition integration synergies ◦Mix improvement, shifting to higher value products ◦Improving safety at our manufacturing operations ◦Expanding workforce diversity
|
The Balanced Scorecard performance goal for our Corporate MIP participants (Messrs. Heckes, Tiejema, White and Paxton) was based on a metric related to the acquisition integration synergies and payout was determined based on synergies realized. The Balanced Scorecard performance goals for our NA Residential MIP participants (Mr. Ball) were based on metrics related to shifting the mix of product sales to higher value products and channel expansion and payout was determined based on improvements in mix as a percentage of revenue set forth in the table below.
In addition, the MIP includes an Individual Performance Multiplier (“IPM”) for participants, including our NEOs, to drive a performance culture. The IPM is a multiplier of 0.75x to 1.25x, tied to individual performance objectives and results. The IPM is calculated after the Company’s financial results and the corresponding baseline MIP payout levels have been calculated. The Compensation Committee will consider recommendations made by the CEO related to each NEOs individual performance and achievement, and will decide the appropriate IPM, if any, for the CEO. The CEO can recommend that the Compensation Committee reallocate funds away from any CEO direct report with an IPM under 1.0x to the remaining pool of CEO direct reports. In addition, the Compensation Committee makes available a CEO pool of up to 5% of all MIP participants' target amounts to be used by the CEO to make additional award payments to key performers throughout the Company.
Corporate MIP Structure and Payout
The table below describes the financial threshold, target, and maximum levels selected for the Corporate MIP financial measure performance goals.
| | | | | | | | | | | |
| Corporate MIP Performance Goals | Threshold | Target | Maximum |
| Corporate MIP Adjusted EBITDA | $400 million | $430 million | $460 million |
Global Core Working Capital Improvement (1) | 1.5% | 2.5% | 3.5% |
Based on actual performance against the applicable pre-established Corporate MIP performance goals and after the Compensation Committee’s careful review and consideration of the balanced scorecard achievement on the selected focus areas described above, the actual results for each Corporate MIP performance goal, the Compensation Committee’s determination of the level of achievement of the balanced scorecard achievement, and the plan payout percentages for each such performance goal are set forth below.
| | | | | | | | | | | | | | |
| Corporate MIP Actual Results and Payout | Weighting | Actual Results | Plan Payout (2) | Weighted Payout |
| Corporate MIP Adjusted EBITDA | 50% | $410.9 million | 68.2% | 34.1% |
Global Core Working Capital Improvement (1) | 25% | 4.35% | 200% | 50% |
Corporate Balanced Scorecard (3) | 25% | 300% | 300% | 75% |
Corporate MIP Total Earned Payout (4) | 159.1% |
(1) The Plan Payout Results of each MIP performance metric was interpolated (using a straight-line interpolation method) between the target and maximum payout levels.
(2) The 2023 baseline level of Global Core Working Capital was 24.5% as a percentage of Net Sales.
(3) The payout result was in recognition of extraordinary achievement by management of the pre-established goals.
(4) The actual earned payout row excludes the application of the IPM for each participant.
NA Residential MIP Structure and Payout
The table below describes the financial threshold, target, and maximum levels selected for the NA Residential MIP financial measure performance goals.
| | | | | | | | | | | |
| NA Residential MIP Performance Goals | Threshold | Target | Maximum |
| Segment MIP Adjusted EBITDA | $420 million | $450 million | $500 million |
Global Core Working Capital Improvement (2) | 1.5% | 2.5% | 3.5% |
Based on actual performance against the applicable pre-established NA Residential MIP performance goals and the Compensation Committee’s careful review and consideration of the balanced scorecard achievement of the selected focus areas described above, the actual results for each NA Residential MIP performance goal, the Compensation Committee’s determination of the level of achievement of the balanced scorecard achievement, and the plan payout percentages for each such performance goal are set forth below.
| | | | | | | | | | | | | | |
| NA Residential MIP Actual Results and Payout | Weighting | Actual Results | Plan Payout (1) | Weighted Payout |
| Segment MIP Adjusted EBITDA | 50% | $434.9 | 74.7% | 37.4% |
Global Core Working Capital Improvement (2) | 25% | 4.35% | 200% | 50% |
| Corporate Balanced Scorecard | 25% | 30% | 30% | 7.5% |
NA Residential MIP Total Earned Payout (3) | 94.9% |
(1) The Plan Payout Results of each MIP performance metric was interpolated (using a straight-line interpolation method) between the target and maximum payout levels.
(2) The 2023 baseline level of Global Core Working Capital was 24.5% as a percentage of Net Sales.
(3) The actual earned payout row excludes the application of the IPM for each participant.
When determining the actual 2023 annual incentive award payable to each NEO, the Compensation Committee considers both business and individual performance. The graphic below illustrates the calculation method of the 2023 MIP award for our NEOs.
| | | | | | | | | | | | | | | | | | | | | | | | | | | | | | | | |
| Base Salary | x | NEOs MIP Target Award (% of Base Salary) | x | Final MIP Payout % of Target (Separately for Corporate or NA Residential) | x | Individual Performance Multiplier | = | 2023 Actual MIP Bonus Award | |
Applying the above-described calculation, the annual cash incentive bonuses paid to each NEO eligible to participate in the 2023 MIP were as follows:
| | | | | | | | | | | | | | | | | | | | |
Name | 2022 MIP Target Award
(% of Base Salary) | 2023 MIP Target Award (% of Base Salary) | MIP Target Award Opportunity | Final MIP Payout % of Target (1) | Individual Performance Multiplier (2) | 2023 Actual MIP Bonus Award |
Howard C. Heckes | 120% | 120% | $1,182,000 | 159.1% | 1.0 | $1,880,562 |
Russell T. Tiejema | 75% | 75% | $435,000 | 159.1% | 1.0 | $692,085 |
| Christopher O. Ball | 75% | 75% | $431,250 | 94.9% | 1.10 | $450,182 |
Randal A. White | 60% | 65% | $325,000 | 159.1% | 1.0 | $517,075 |
Robert A. Paxton | 60% | 60% | $285,000 | 159.1% | 1.05 | $476,107 |
(1) The Overall Plan Payout percentage is inclusive of the IPM as set forth above.
(2) IPMs are determined based on a thorough review by the CEO of each NEO's quantitative and qualitative impact on Company business and strategic goals.
For purposes of the 2023 Annual Cash Incentive Bonus, “MIP Adjusted EBITDA” and “Global Core Working Capital Improvement” are defined in the “MIP and LTIP Definitions and Reconciliation” section below.
Long-Term Equity Incentive Awards
The Compensation Committee believes in the importance of providing a significant portion of compensation in the form of equity, the majority of which is earned based on the level of achievement of predetermined financial and operating goals over the long-term. These equity awards are designed to further align the interests of our executives with those of our shareholders, reward executives for value creation, maintain the competitiveness of our total compensation packages, foster stock ownership, and promote retention. The PSU component of the LTIP is designed to tie a significant portion of our NEOs’ total direct compensation to the achievement of our long-term financial and operating performance goals over a three-year period and serves as a balance to the MIP, which measures our performance over a one-year period.
Each year, our NEOs receive equity award opportunity delivered in three forms, as described below:
| | | | | | | | | | | | | | | | | | | | |
| Type of Award | | Percent of Award Value | | LTIP Principal Plan Design |
| | | | | | |
| RSUs | | TIME-BASED | | 30% | | RSUs are granted for each LTIP plan year and vest over three years, with 33% vesting on the first anniversary of the date of grant, 33% on the second anniversary and 34% on the third anniversary. The Compensation Committee believes that awarding RSUs aligns the interests of our NEOs with the interests of our shareholders and encourage NEO’s to build stock ownership in Common Shares and facilitates compliance with our stock ownership guidelines. |
| | | | | | |
| PSUs | | PERFORMANCE-BASED | | 60% | | PSUs are granted for each LTIP plan year and performance metrics are adopted by the Compensation Committee at the beginning of the three-year performance period. PSUs vest on the third anniversary of the date of grant and PSUs payout in Common Shares based achievement of the three-year performance metrics. The Compensation Committee believes that awarding PSUs aligns the interests of our NEOs with the interests of our shareholders by driving performance over the long-term and facilitates compliance with our stock ownership guidelines. |
| | | | | |
| SARs | | | 10% | | SARs are granted for each LTIP plan year and vest over three years, with 33% vesting on the first anniversary of the date of grant, 33% on the second anniversary and 34% on the third anniversary and expire 10 years after grant. Upon exercise, the SARs are settled in unrestricted Common Shares having an aggregate fair market value equal to the positive difference between the fair market value of a Common Share on the exercise date and the exercise price of the SAR multiplied by the number of Common Shares for which the SAR is exercised. The Compensation Committee believes that granting SARs encourages actions to increase our Common Share price and help build stock ownership in Common Shares. |
Summary of Our Concurrent LTIPs in Cycle for plan years 2021-2025
The following table summarizes the principal design elements of our annual LTIPs grants (with 3-year performance periods) that have either recently vested or are currently in cycle from plan years 2021-2025.
| | | | | | | | | | | | | | | | | | | | | | | | | | |
| Grant | | 2021-2023 LTIP | | 2022-2024 LTIP | | 2022-2024 (1) | | 2023-2025 LTIP |
| | | | | | | | |
| Award Opportunity | | 30% RSUs 60% PSUs 10% SARs | | 30% RSUs 60% PSUs 10% SARs | | 100% PSUs | | 30% RSUs 60% PSUs 10% SARs |
| | | | | | | | |
| PSU Performance Goals | | 50% LTIP Adjusted EBITDA Margin(2) 50% ROIC(2) | | 50% Net Sales(2) 50% ROIC(2) | | LTIP Adjusted EBITDA | | 50% Net Sales 50% Relative TSR |
| | | |
| | | | | | | | |
| Threshold - Maximum Payout | | 50% - 200% | | 50% - 200% | | 34% - 100% | | 50% - 200% |
| | | | | | | | |
Payout Date (3) | | February 2024 | | February 2025 | | August 2025 | | February 2026 |
| | | | | | | |
(1) These awards represent the special one-time 2022 Performance-Based Out Performance Award approved by the Compensation Committee on August 3, 2022.
(2) Performance goals were calculated based on a year-over-year improvement.
(3) If the NEO is not employed by the Company on the payout date, the awards are forfeited except in the case of death, disability or retirement in which case any outstanding RSUs, PSUs and SARs will be reduced on a pro rata basis as provided in the 2021 Plan.
2023-2025 LTIP Grants and Metrics
After taking into consideration the results of the October 2022 benchmarking study, in addition to individual performance levels and responsibilities and providing an appropriate long-term retention incentive for our NEOs (with no single factor considered more important than any other factor in the decision-making process), the Compensation Committee approved the following the LTIP award opportunity, and the target equity award values for the 2023 LTIP. Each of our NEOs were granted awards set forth below using the closing price of our Common Shares on February 27, 2023.
| | | | | | | | | | | | | | |
| Name | RSUs (1) | PSUs (1) (at Target) | SARs (2) | 2023 Target Equity Award Value (3) |
| Howard C. Heckes | $1,245,000 | $2,490,000 | $415,000 | $4,150,000 |
| Russell T. Tiejema | $300,000 | $600,000 | $100,000 | $1,000,000 |
| Christopher O. Ball | $270,000 | $540,000 | $90,000 | $900,000 |
| Randal A. White | $165,000 | $330,000 | $55,000 | $550,000 |
| Robert A. Paxton | $180,000 | $360,000 | $60,000 | $600,000 |
(1) The number of RSUs and PSUs granted were based on the closing price of our Common Shares on February 27, 2023.
(2) The number of SARs granted was determined using the Black-Scholes model which calculates the current economic value of a SAR using assumptions that include the exercise price, the term of the award, a risk-free rate of interest, dividend yield, and market volatility as of market close on February 27, 2023.
(3) Each of the awards described above are subject to accelerated vesting under certain circumstances as described below in the “Potential Payments on Termination or Change in Control” section.
The Compensation Committee selected Absolute Net Sales and Relative TSR compared to the companies in our compensation peer group for the PSU performance metrics for the 2023-2025 LTIP performance period. The Compensation Committee believes Absolute Net Sales and Relative TSR are the most appropriate metrics for measuring financial performance under the LTIP as they encourage management to focus on actions to improve the long-term financial health and performance of the Company, with a focus on value creation for our investors. With respect to Absolute Net Sales, weighted at 50% of the total PSUs granted, the Compensation Committee selected this performance metric to incentivize growth of the organization through expanded market share and introduction of new products. With respect to Relative TSR, weighted at 50% of the total PSUs granted, the Compensation Committee selected this metric to incentivize management and to align the interests of management with our shareholders through the incorporation of feedback received from our shareholder engagement discussions. The Compensation Committee believes that the targets related to performance metrics will be challenging and will require substantial effort to achieve.
| | | | | | | | | | | |
| 2023-2025 LTIP
PSU Performance Goals | Weighting | |
| Absolute Net Sales | 50% | |
| Relative TSR to Peer Group | 50% | |
The PSUs that are weighted 50% of the Absolute Net Sales performance metric for the 2023-2025 performance period will vest on the third anniversary of the date of grant based on the level of Absolute Net Sales achieved in 2025.
The PSUs that are weighted 50% of the TSR metric for the 2023-2025 performance period will vest on the third anniversary of the date of grant based on the level of Relative TSR achieved during the three-year performance period. The beginning and end of the Relative TSR measurement periods for both
the Company and our compensation peer group will be based on the 20 consecutive trading days’ average closing share price. The value basis of the granted PSUs at target was the closing price of the Common Shares on February 27, 2023. At the end of the three-year performance period, and after calculating the final Relative TSR results the following percent of PSUs will vest as set forth below.
| | | | | | | | | | | |
| Relative TSR to Peer Group | Percent of PSUs Vesting | |
| Below 25th percentile | 0% | |
| 25th to 49th percentile | 50% | |
| 50th to 74th percentile | 100% | |
| At or above 75th percentile | 200% | |
Straight-line interpolation will be used to determine the number of PSUs that will vest if the Net Sales level of achievement is between threshold and target or between target and maximum, or in the case of the number of PSUs that will vest based on Relative TSR, between the specified percentiles. Any outstanding PSUs that do not vest once the applicable level of performance has been determined will be automatically forfeited.
For purposes of the 2023-2025 PSU grant, “Net Sales” and “Relative Total Shareholder Return” are defined in the “MIP and LTIP Definitions and Reconciliation” section below.
2021-2023 LTIP Results and Payouts
For the 2021-2023 LTIP, our NEOs received an LTIP award opportunity consisting of RSUs, PSUs and SARs, with a payout of PSUs based on the performance goals set in February 2021 for the 2021-2023 performance period (hereafter referred to as the “2021 PSUs”). The Compensation Committee selected LTIP Adjusted EBITDA Margin year-over-year improvement and Return on Invested Capital (“ROIC”) year-over-year improvement, both weighted at 50% for the 2021 LTIP performance goals as set forth below.
| | | | | | | | | | | | | | |
2021-2023 LTIP
PSU Performance Goals | Weighting | Threshold
(50% Payout) | Target
(100% Payout) | Maximum
(200% Payout) |
LTIP Adjusted EBITDA Margin (1) | 50% | 40 bps | 70 bps | 100 bps |
Return on Invested Capital (1) | 50% | 50 bps | 100 bps | 150 bps |
LTIP Adjusted EBITDA Margin performance was calculated based on the annual improvement (expressed in basis points) in LTIP Adjusted EBITDA Margin achieved during each year of the 2021-2023 performance period, with a baseline number being set each year using the year-end results of the prior year. Return on Invested Capital performance was calculated based on the annual improvement (expressed in basis points) achieved during each year of the 2021-2023 performance period, with a baseline number being set each year using the year-end results of the prior year. For both metrics, at the end of the performance period, the final results were calculated using the arithmetic average of the three one-year performance periods. Straight-line interpolation was used to determine the number of 2021 PSUs that are eligible to vest if the level of achievement is between threshold and target or between target and maximum.
On February 26, 2024, the Compensation Committee determined a payout of 66.7% of the target number of 2021 PSUs awarded was earned by each NEO based on the achievement levels of the 2021 PSU performance goals set forth in the table below.
The table below sets forth the 2021 PSU performance achievement by year:
| | | | | | | | | | | |
| Performance Year | LTIP Adjusted EBITDA Margin Improvement (Percentage Attainment)(1) | ROIC Improvement (Percentage Attainment)(1) | Percentage Achievement |
| Fiscal Year 2021 | 33 basis points (0%) | 232 basis points (200%) | 100% |
| Fiscal Year 2022 | 44 basis points (0%) | 356 basis points (200%) | 100% |
| Fiscal Year 2023 | (90) basis points (0%) | (1420) basis points (0%) | 0% |
| Earned 2021-2023 LTIP Payout | 66.7% |
(1) Performance goals were calculated on a year-over-year improvement calculated in basis points. For further information related to the calculation of ROIC, refer to "MIP and LTIP Definitions and Reconciliation."
Severance and Change in Control Benefits
As part of our of executive compensation program we provide certain severance and change in control benefits to our NEOs. Each NEO is entitled to receive severance benefits under the terms of the NEOs employment agreement upon either termination by the Company without cause or a resignation by the NEO for good reason. We provide these severance benefits in order to provide an overall compensation package that is competitive with that offered by other companies with whom we compete for executive talent. Additionally, such severance benefits allow our executives to focus on our objectives and the interests of our shareholders without concern for their employment security in the event of a termination.
The severance benefits provided upon a qualifying termination of an NEO’s employment in connection with a change in control are higher than severance benefits provided under other qualifying termination events, which is consistent with market practice. The Compensation Committee approved these enhanced change in control severance benefits because it considers maintaining a stable and effective management team to be an important factor to protecting and enhancing the best interests of the Company and its shareholders. To that end, the Compensation Committee recognizes that the possibility of a change in control may exist from time to time, and that this possibility, and the uncertainty and questions it may raise among management, could result in the departure or distraction of management to the detriment of the Company and its shareholders. Accordingly, the enhanced severance benefits have been put in place to encourage the attention, dedication and continuity of members of our management team to their assigned duties without the distraction that may arise from the possibility or occurrence of a change in control and concern for their employment security in the event of a termination.
Other Benefits and Perquisites
As part of our executive compensation program we provide the following benefits to our NEOs, which are the same benefits available to all our full-time U.S.-based employees:
•medical, dental and vision insurance;
•401(k) retirement savings plan and employee stock purchase plan;
•short- and long-term disability, life insurance, accidental death and dismemberment insurance;
•health, limited purpose health and dependent care flexible spending accounts and/or a health care saving account; and
•various voluntary supplemental insurance products.
Additionally, we provide our executives with more comprehensive physical examinations. Also, upon the hiring of a new executive, we may provide such executive with certain relocation benefits. Each of our NEOs and certain other executives are eligible to participate in a non-qualified deferred compensation plan which permits the NEO to defer base salary and/or bonuses. Finally, each NEO is provided a reimbursement benefit of up to $10,000 per calendar year (without tax gross-up) for financial planning, tax planning, and tax preparation services. See Footnote (6) to the “Summary Compensation Table” for information related to this benefit.
We believe these benefits and perquisites are reasonable and consistent with those offered by companies with which we compete for employees, including our NEOs.
STOCK OWNERSHIP GUIDELINES
We have stock ownership guidelines that require each of our NEOs and all executive officers to own meaningful equity stakes in Common Shares to further align their long-term economic interests with those of our shareholders. Our stock ownership guidelines were modified in July 2023. In furtherance of our commitment to sound governance, our executive officers, including our NEOs are required to hold Common Shares valued at the following multiple:
| | | | | |
| Position | Ownership Requirement |
| CEO | 5x annual base salary |
| Executive Officers (other than CEO) | 3x annual base salary |
| Independent Directors | 5x annual base cash retainer |
Our directors and executive officers must meet our stock ownership requirements within five-years. Until the required level of ownership is achieved, each executive must retain at least 50% percent of the number of Common Shares acquired through RSUs, PSUs and SARs (net of shares withheld or sold to pay any applicable exercise price and to satisfy any applicable tax withholding). After the five-year compliance period has passed, executive officers who have not attained the stock ownership requirement are prohibited from selling Common Shares. Once an executive meets the required ownership level, the executive may sell and/or otherwise trade Common Shares in an amount equal to the excess of the stock ownership requirements. Compliance with these guidelines will generally be measured twice per fiscal year on the last trading day of January and June. All vested and unvested RSUs, earned PSUs and exercised SARs will count as shareholdings for purposes of these guidelines.
The Compensation Committee annually reviews the compliance of our executive officers with these stock ownership guidelines. The Compensation Committee has determined that all NEOs are in compliance with these guidelines and have either achieved the required level of stock ownership or are within the five-year compliance period associated with their start date as an executive officer, as of the January 31, 2024 measurement date.
CLAWBACK POLICIES
Executive Clawback
Effective October 2023, The Compensation Committee adopted a standalone clawback policy that is compliant with the requirements of the Dodd-Frank Act, Rule 10D-1 of the Exchange Act and NYSE Rule 303A.14. This policy provides that, upon the occurrence of an accounting restatement of the Company’s financial statements to correct an error, the Compensation Committee must recoup incentive-based compensation that was erroneously granted, earned or vested to our current and former “officers” (as defined under Rule 16a-1 of the Exchange Act) based wholly or in part upon the attainment of any financial reporting measure, subject to limited exceptions.
MIP and LTIP Clawback
Both the MIP and the LTIP award agreements under the 2021 Plan provide that if an employee engages in (i) certain conduct during a plan year which is injurious to the Company or its reputation, (ii) illegal acts, theft, fraud, intentional misconduct or gross negligence related to the employee’s position with the Company or (iii) fraud, gross negligence, or intentional or willful misconduct that contributes to the Company’s financial or operational results that are used to determine the extent to which any MIP award is payable and was misstated (regardless of whether the Company is required to prepare an accounting restatement) that is discovered during or within three years after the relevant plan year, the employee will forfeit his or her right to any MIP or LTIP award for that plan year and will be required to return to the Company any amounts relating to previously paid MIP or LTIP awards for such plan year. The plan administrator of the MIP and LTIP is responsible for determining whether a recoverable event has occurred based on relevant facts and circumstances. The compensation recovery will be in addition to any other remedies available to the Company for any such behavior.
Additionally, the LTIP award agreements under the 2021 Plan provide that if we determine that a participant has materially violated any of the participant’s covenants regarding confidentiality, non-disclosure of confidential information and, during the applicable period of time following such participant’s termination of employment as specified in such award agreement, non-competition and non-solicitation of employees, then the following will result:
•any outstanding awards, whether vested or unvested, will immediately be terminated and forfeited for no consideration;
•if Common Shares have already been distributed to the participant but the participant no longer holds some or all of such shares, the participant must repay us, in cash, an amount equal to the sum of (i) the total amount of any cash previously paid to the participant in respect of the award and (ii) the total amount of any value received by the participant upon any sale of the Common Shares; and
•if Common Shares have been distributed to the participant and the participant continues to hold some or all of the shares, the participant will transfer such shares to the Company for no consideration.
ACCOUNTING AND TAX IMPLICATIONS
As a general matter, the Compensation Committee takes into account the various tax and accounting implications of compensation. When determining amounts of equity grants to executives and employees, the Compensation Committee also takes into consideration the accounting treatment of such grants.
We account for stock-based compensation in accordance with Financial Accounting Standards Board (“FASB”) Accounting Standards Codification (“ASC”) Topic 718 Compensation—Stock Compensation, which requires us to recognize compensation expense for share-based payments. The Compensation Committee considers FASB ASC Topic 718 in determining the amounts of long-term incentive grants to executives and employees.
MIP AND LTIP DEFINITIONS AND RECONCILIATION
The definitions for each of the financial performance goals for purposes of the 2023 MIP and LTIP awards, as applicable, are as follows:
“Adjusted EBITDA” is defined as net income (loss) attributable to Masonite adjusted to exclude depreciation; amortization; share based compensation expense; loss (gain) on disposal of property, plant and equipment; registration and listing fees; restructuring costs; asset impairment; loss (gain) on disposal of subsidiaries; interest expense (income), net; loss on extinguishment of debt; other (income) expense, net; income tax expense (benefit); other items; loss (income) from discontinued operations, net of tax; and net income (loss) attributable to non-controlling interest. A reconciliation of Adjusted EBITDA to Net income (loss) attributable to Masonite is included on page 91 of our Annual Report on Form 10-K for the fiscal year ended December 31, 2023.
“Global Core Working Capital Improvement” is defined as the change in year-over-year Semiannual Average Core Working Capital as a percentage of Semiannual Average Net Sales. “Semiannual Average Core Working Capital” is defined as a semiannual average of our accounts receivable and inventory balances minus the semiannual average of our accounts payable balance. “Semiannual Average Net Sales” is defined as the semiannual closing average of our Net Sales.
“LTIP Adjusted EBITDA” is defined as net income (loss) attributable to Masonite adjusted to exclude the following items: depreciation; amortization; share based compensation expense; loss (gain) on disposal of property, plant and equipment; registration and listing fees; restructuring costs; asset impairment; loss (gain) on disposal of subsidiaries; interest expense (income), net; loss on extinguishment of debt; other expense (income), net; income tax expense (benefit); other items; loss (income) from discontinued operations, net of tax; and net income (loss) attributable to non-controlling interest.
“LTIP Adjusted EBITDA Margin” is defined as MIP Adjusted EBITDA divided by Net Sales.
“MIP Adjusted EBITDA” is defined as Adjusted EBITDA, as adjusted for any acquisitions or divestitures in the current year using the methodology established by the Compensation Committee, plus transaction costs (including fees and expenses) incurred related to acquisitions or divestitures, plus transaction costs (including fees and expenses) associated with debt or equity offerings, plus costs, expenses or adjustments related to non-budgeted Board initiatives undertaken in the current year, plus conversion costs for new retail business wins, plus or minus any changes to generally accepted accounting principles and other adjustments approved by the Compensation Committee or our Board, and plus or minus the impact of foreign exchange rate fluctuations versus plan.
“Net Sales” is defined as net sales (as determined in accordance with generally accepted accounting principles), including net sales from any acquisitions or divestitures in the current year using the methodology established by the Compensation Committee, plus or minus any changes to generally accepted accounting principles and other adjustments approved by the Compensation Committee, and plus or minus the impact of foreign exchange rate fluctuations versus plan.
“Return on Invested Capital” Return on Invested Capital" means Net Operating Profit after Tax (assuming a 25% tax rate), excluding restructuring charges, loss/gain on sale of subsidiaries and pension settlement charges, divided by Total Assets less Total Non-Debt Liabilities, as adjusted for any changes to generally accepted accounting practices, acquisition or divestitures using the methodology established by the Compensation Committee, FX adjustments to prior year rates and other adjustments as approved by the Compensation Committee.
“Relative Total Shareholder Return” is defined as the Total Shareholder Return for Masonite during the relevant performance period measured as a comparative percentile to the all companies in the peer group. “Total Shareholder Return” is the share price appreciation of any particular company’s publicly traded common stock plus dividends accrued, as measured during the applicable performance period. This is calculated by taking the average of the closing stock price of a specified company for the last 20 trading days of the end of the applicable performance period minus the average of the closing stock price for the first 20 trading days of the applicable performance period, plus any dividends paid during the performance period, divided by the average of the closing price for the first 20 trading days in the performance period.
Human Resources and Compensation Committee Report
The Human Resources and Compensation Committee of the Board has reviewed and discussed this CD&A with management. Based on this review and discussion, the Human Resources and Compensation Committee has recommended to the Board that this CD&A be included in the Company’s 2023 Annual Report on Form 10-K.
Submitted by the Human Resources and Compensation Committee of the Company’s Board.
Francis M. Scricco (Chair)
Peter R. Dachowski
Barry A. Ruffalo
Executive Compensation Tables
SUMMARY COMPENSATION TABLE
The following table summarizes the total compensation earned by each of our NEOs for services provided to us during the fiscal years ended 2023, 2022, and 2021.
| | | | | | | | | | | | | | | | | | | | | | | | | | |
| Name and Principal Position | Year | Salary ($)(1) | Bonus
($)(2) | Stock Awards ($)(3) | Option Awards ($)(4) | Non-Equity Incentive Plan Compensation ($)(5) | All Other Compensation ($)(6) | Total ($) |
| Howard C. Heckes | 2023 | 971,539 | 886,500 | 3,734,910 | 414,995 | 994,062 | 33,836 | 7,035,842 |
| President and Chief Executive Officer | 2022 | 910,192 | 263,520 | 5,559,937 | 339,987 | 791,658 | 32,120 | 7,897,414 |
| 2021 | 890,000 | 240,300 | 2,924,912 | 324,993 | 495,552 | 21,460 | 4,897,217 |
| Russell T. Tiejema | 2023 | 574,231 | 326,250 | 899,956 | 99,997 | 365,835 | 25,649 | 2,291,918 |
| Executive Vice President and Chief Financial Officer | 2022 | 545,192 | 99,000 | 2,309,930 | 89,976 | 297,413 | 21,156 | 3,362,667 |
| 2021 | 520,192 | 88,594 | 708,750 | 78,749 | 182,700 | 20,097 | 1,599,082 |
| Christopher O. Ball | 2023 | 570,192 | 73,485 | 809,987 | 89,981 | 376,697 | 23,452 | 1,943,794 |
| President, Global Residential | 2022 | 550,000 | 122,327 | 1,742,398 | 82,497 | 497,475 | 67,983 | 3,062,680 |
| 2021 | 158,634 | 50,000 | 245,754 | — | — | 3,200 | 457,588 |
| Randal A. White | 2023 | 494,231 | 243,750 | 494,962 | 54,974 | 273,325 | 25,222 | 1,586,464 |
| Senior Vice President, Global Operations and Supply Chain | 2022 | 466,154 | 67,680 | 1,494,910 | 54,998 | 203,322 | 17,215 | 2,304,279 |
| 2021 | 447,116 | 60,750 | 445,472 | 49,485 | 125,280 | 16,213 | 1,144,316 |
| Robert A. Paxton | 2023 | 469,231 | 236,422 | 539,903 | 59,998 | 239,685 | 25,356 | 1,570,595 |
| Senior Vice President, Human Resources | 2022 | 441,154 | 76,909 | 1,494,910 | 54,998 | 192,507 | 21,377 | 2,281,855 |
| 2021 | 421,154 | 57,375 | 420,598 | 46,732 | 118,320 | 15,548 | 1,079,727 |
(1) Amounts in this column represent the salary payments made to each NEO during the fiscal year. Salary increases were effective for our NEOs starting February 27, 2023. See section titled “Compensation Discussion and Analysis—Elements of Our Executive Compensation Program—Base Salary.”
(2) Amounts in this column reflect the Balanced Scorecard and Individual Performance Multiplier portions of each NEO's annual bonus with respect to fiscal 2023, which amounts are payable at the discretion of the Compensation Committee of the Board. Individual Performance Multipliers were calculated at 1.00 (i.e., 100%), except for Messrs. Ball and Paxton, who received an Individual Performance Multiplier of 1.10 (i.e., 110%) and 1.05 (i.e., 105%), respectively.
(3) Amounts in this column reflect the aggregate grant date fair market value of restricted stock units granted during the applicable fiscal year in accordance with FASB ASC Topic 718. For a discussion of the assumptions made in the valuation of the restricted stock units granted in 2023, please see Note 12 "Share Based Compensation Plans" in the Consolidated Financial Statements included in our Annual Report on Form 10-K for the fiscal year ended December 31, 2023. The amounts shown also include the grant date fair market value of performance-vested restricted stock units granted in 2023, based on the probable outcome of the related performance conditions at target levels, calculated in accordance with FASB ASC Topic 718. Each grant of performance-vesting restricted stock units is subject to achievement of the applicable performance conditions as described under the headings above entitled "Compensation Discussion and Analysis—Elements of Our Executive Compensation Program—Long-Term Equity Incentive Awards—2023-2025 LTIP Grants and Metrics." The grant date fair market value per unit of the time-based restricted stock units are as follows: $88.99 for the annual long-term incentive grants made on February 27, 2023 to each of Messrs. Heckes (13,990 units), Tiejema (3,371 units), Ball (3,034 units), White (1,854 units), and Paxton (2,022 units). The grant date fair market value of the performance-vesting restricted stock units granted on February 27, 2023, based on the maximum level of performance, is as follows: Mr. Heckes $2,489,940 (27,980 units); Mr. Tiejema $599,571 (6,742 units); Mr. Ball $539,991 (6,068 units); Mr. White $329,975 (3,708 units); and Mr. Paxton $359,965 (4,045 units).
(4) Amounts in this column reflect the aggregate grant date fair value of SARs granted during the applicable fiscal year in accordance with FASB ASC Topic 718. For discussion of the assumptions made in the valuation of SARs granted in 2023, please see Note 12 "Share Based Compensation Plans" in the Consolidated Financial Statements included in our Annual Report on Form 10-K for the fiscal year ended December 31, 2023. The grant date fair market value per SAR of the SARs granted on February 27, 2023 is $32.6254.
(5) Amounts shown in this column represent an amount equal to the annual performance-based cash bonuses that were earned under the MIP for 2023, less the portion of the bonus represented by the Balanced Scorecard and Individual Performance Multiplier, which portion are included in the Bonus column. See "Compensation Discussion and Analysis—Elements of Our Executive Compensation Program—Annual Cash Incentive Bonus" for a description of the bonuses for fiscal year 2023.
(6) The following table represents the amounts in the “All Other Compensation” column for 2023 for each NEO.
| | | | | | | | | | | | | | | | | | | | |
| Name | 401(k) Contribution ($) | Group Term Life Insurance ($) | Executive Physicals ($) | Tax Preparation/ Financial Planning ($) | Other Expenses ($) | Total All Other Compensation ($) |
| Howard C. Heckes | 16,500 | 3,612 | 3,425 | 10,000 | 299 | 33,836 |
| Russell T. Tiejema | 16,500 | 3,612 | 3,379 | — | 2,158 | 25,649 |
| Christopher O. Ball | 16,500 | 1,260 | 4,152 | 1,000 | 540 | 23,452 |
| Randal A. White | 16,500 | 1,908 | 6,783 | — | — | 25,222 |
| Robert A. Paxton | 16,500 | 1,806 | — | 7,050 | — | 25,356 |
GRANTS OF PLAN BASED AWARDS FOR 2023
| | | | | | | | | | | | | | | | | | | | | | | | | | | | | | | | | | | |
| | Estimated Future Payouts Under Non-Equity Incentive Plan Awards
(1) | Estimated Future Payouts Under Equity Incentive Plan Awards
(2) | All Other Stock Awards Number of Shares or Units
(#)(3) | All Other Option Awards Number of Securities Underlying Options (#)(4) | Exercise Price of Option Awards
($/Sh) | Grant Date Fair Value of Stock and Option Awards ($)(5) |
| Name | Grant Date | Threshold ($) | Target
($) | Maximum ($) | Threshold ($) | Target
($) | Maximum ($) |
| Howard C. Heckes | | | | | | | | | | | |
| MIP | | 591,000 | 1,182,000 | 2,659,500 | — | — | — | — | — | — | — |
| PSUs | 02/27/23 | — | — | — | 13,990 | 27,980 | 55,960 | — | — | — | 2,489,940 |
| RSUs | 02/27/23 | — | — | — | — | — | — | 13,990 | — | — | 1,244,970 |
| SARs | 02/27/23 | — | — | — | — | — | — | — | 12,720 | 88.99 | 414,995 |
| Russell T. Tiejema | | | | | | | | | | | |
| MIP | | 217,500 | 435,000 | 978,750 | — | — | — | — | — | — | — |
| PSUs | 02/27/23 | — | — | — | 3,371 | 6,742 | 13,484 | — | — | — | 599,971 |
| RSUs | 02/27/23 | — | — | — | — | — | — | 3,371 | — | — | 299,985 |
| SARs | 02/27/23 | — | — | — | — | — | — | — | 3,065 | 88.99 | 99,997 |
| Christopher O. Ball | | | | | | | | | | | |
| MIP | | 215,625 | 431,250 | 970,313 | — | — | — | — | — | — | — |
| PSUs | 02/27/23 | — | — | — | 3,034 | 6,068 | 12,136 | — | — | — | 539,991 |
| RSUs | 02/27/23 | — | — | — | — | — | — | 3,034 | — | — | 269,996 |
| SARs | 02/27/23 | — | — | — | — | — | — | — | 2,758 | 88.99 | 89,981 |
| Randal A. White | | | | | | | | | | | |
| MIP | | 162,500 | 325,000 | 731,250 | — | — | — | — | — | — | — |
| PSUs | 02/27/23 | — | — | — | 1,854 | 3,708 | 7,416 | — | — | — | 329,975 |
| RSUs | 02/27/23 | — | — | — | — | — | — | 1,854 | — | — | 164,987 |
| SARs | 02/27/23 | — | — | — | — | — | — | | 1,685 | 88.99 | 54,974 |
| Robert A. Paxton | | | | | | | | | | | |
| MIP | | 142,500 | 285,000 | 641,250 | — | — | — | — | — | — | — |
| PSUs | 02/27/23 | — | — | — | 2,023 | 4,045 | 8,090 | — | — | — | 359,965 |
| RSUs | 02/27/23 | — | — | — | — | — | — | 2,022 | — | — | 179,938 |
| SARs | 02/27/23 | — | — | — | — | — | — | — | 1,839 | 88.99 | 59,998 |
(1) The amounts set forth in the “Threshold,” “Target” and “Maximum” columns above indicate the respective amounts for each of the NEOs under our 2023 MIP (determined without regard to the Balanced Scorecard and Individual Performance Multiplier portions of the 2023 MIP, which are discretionary). The actual payouts were approved by the Compensation Committee on February 26, 2024, and the portions of the payout that are net of the Balanced Scorecard and Individual Performance Multiplier portions of the 2023 MIP are included in the “Non-Equity Incentive Plan Compensation" column on the Summary Compensation Table. The amounts shown in the “Target” column reflect a bonus target of 120% of base salary for Mr. Heckes, 75% of base salary for each of Messrs. Tiejema, and Ball, 65% of base salary for Mr. White, and 60% of base salary for Mr. Paxton. For a more complete description of the 2023 MIP, including discussion of the actual payouts thereunder, see the heading above entitled “Compensation Discussion and Analysis—Elements of Our Executive Compensation Program—Annual Cash Incentive Bonus.”
(2) With respect to the performance-vesting restricted stock units granted to each NEO on February 27, 2023 the amounts set forth in the “Threshold,” “Target” and “Maximum” columns above correspond to the number of Common Shares that would be earned by each such NEO upon achievement of the applicable Net Sales and Total Shareholder Return (TSR) performance goals based on performance over the three-year period as measured against defined levels of threshold, target and maximum performance. Subject to achievement of the applicable performance goals, the performance-vesting restricted stock units are scheduled to vest on the third anniversary of the date of grant. See “Compensation Discussion and Analysis—Elements of Our Executive Compensation Program—Long-Term Equity Incentive Awards—2023-2025 LTIP Grants and Metrics” for a description of these performance-vesting restricted stock units and the applicable performance measures.
(3) The time-vesting restricted stock units granted on February 27, 2023 to each NEO are scheduled to vest over three years, with 33% vesting on the first anniversary of the date of grant, 33% on the second anniversary and 34% on the third anniversary.
(4) The time-vesting SARs granted on February 27, 2023, to each NEO are scheduled to vest over three years, with 33% vesting on the first anniversary of the date of grant, 33% on the second anniversary and 34% on the third anniversary. The grants were issued with an exercise price of $88.99 per share. Proceeds upon the exercise of the SARs will equal the market value of our stock at the time of exercise less the exercise price times the number of shares exercised. Upon exercise, the SARs are settled in unrestricted Common Shares having an aggregate fair market value equal to the positive difference between the fair market value of a Common Share on the exercise date and the exercise price of the SAR multiplied by the number of Common Shares for which the SAR is exercised.
(5) Amounts in this column reflect the grant date fair value of the restricted stock units and SARs granted to each NEO in 2023 in accordance with FASB ASC Topic 718. For a discussion of the assumptions made in the valuation of such awards, please see Note 12 “Share Based Compensation Plans” in the consolidated financial statements included in our Annual Report on Form 10-K for the fiscal year ended December 31, 2023. The amounts shown include the grant date fair value of performance-vesting restricted stock units granted in 2023, based on the probable outcome of the related performance conditions at target levels, calculated in accordance with FASB ASC Topic 718.
2023 OUTSTANDING EQUITY AWARDS AT FISCAL YEAR-END
The following table provides information about outstanding equity-based incentive compensation awards for the NEOs as of the end of 2023. The vesting schedule for each award is described in the footnotes to this table. The market value of unvested RSUs and unearned PSUs is based on the closing price of our Common Shares of $84.66 on December 29, 2023, the last trading day of fiscal 2023.
| | | | | | | | | | | | | | | | | | | | | | | | | | | | | |
| SARs Awards | Stock Awards |
| Name | Number of Securities Underlying Unexercised SARs (# Exercisable) | Number of Securities Underlying Unexercised SARs (# Unexercisable) (1) | Equity Incentive Plan Awards: Number of Securities Underlying Unexercised Unearned SARs (#) | SAR Exercise Price ($) | SAR Expiration Date | Number of Shares or Units of Stock That Have Not Vested (#) | Market Value of Shares or Units of Stock That Have Not Vested ($) | Equity Incentive Plan Awards: Number of Unearned Shares, Units or Other Rights That Have Not Vested (#) | Equity Incentive Plan Awards: Market Value of Shares or Units of Stock That Have Not Vested ($) |
| Howard C. Heckes | | | | | | | | | |
| 56,645 | — | — | 57 | 6/3/2029 | 24,782 (2) | 2,098,044 | — | — |
| 11,857 | — | — | 87 | 2/25/2030 | — | — | 12,078 (3) | 1,022,523 |
| 7,637 | 3,935 | — | 108 | 2/22/2031 | — | — | 23,022 (4) | 1,949,043 |
| 4,230 | 8,591 | — | 89 | 2/23/2032 | — | — | 28,309 (5) | 2,396,640 |
| — | 12,720 | — | 89 | 2/27/2033 | — | — | 27,980 (6) | 2,368,787 |
| Russell T. Tiejema | | | | | | | | | |
| 4,855 | — | — | 77 | 2/27/2027 | 6,159 (7) | 521,421 | — | — |
| 6,595 | — | — | 65 | 2/27/2028 | — | — | — | — |
| 8,020 | — | — | 58 | 2/25/2029 | — | — | — | — |
| 3,487 | — | — | 87 | 2/25/2030 | — | — | 2,926 (3) | 247,715 |
| 1,850 | 954 | — | 108 | 2/22/2031 | — | — | 6,094 (4) | 515,918 |
| 1,119 | 2,274 | — | 89 | 2/23/2032 | — | — | 16,985 (5) | 1,437,950 |
| — | 3,065 | — | 89 | 2/27/2033 | — | — | 6,742 (6) | 570,778 |
| Christopher O. Ball | | | | | | | | | |
| 1,026 | 2,085 | — | 89 | 2/23/2032 | 5,611 (8) | 475,027 | — | — |
| — | 2,758 | — | 89 | 2/27/2033 | — | — | 5,586 (4) | 472,911 |
| — | — | — | — | — | — | — | 11,323 (5) | 958,605 |
| — | — | — | — | — | — | — | 6,068 (6) | 513,717 |
| Randal A. White | | | | | | | | | |
| 1,784 | — | — | 58 | 2/25/2029 | 3,571 (9) | 302,321 | — | — |
| 1,355 | — | — | 87 | 2/25/2030 | — | — | 1,839 (3) | 155,690 |
| 1,162 | 600 | — | 108 | 2/22/2031 | — | — | 3,724 (4) | 315,274 |
| 684 | 1,390 | — | 89 | 2/23/2032 | — | — | 11,323 (5) | 958,605 |
| — | 1,685 | — | 89 | 2/27/2033 | — | — | 3,708 (6) | 313,919 |
| Robert A. Paxton | | | | | | | | | |
| 1,668 | — | — | 58 | 2/25/2029 | 3,713 (10) | 314,343 | — | — |
| 1,883 | — | — | 87 | 2/25/2030 | — | — | 1,736 (3) | 146,970 |
| 1,098 | 566 | — | 108 | 2/22/2031 | — | — | 3,724 (4) | 315,274 |
| 684 | 1,390 | — | 89 | 2/23/2032 | — | — | 11,323 (5) | 958,605 |
| — | 1,839 | — | 89 | 2/27/2033 | — | — | 4,045 (6) | 342,450 |
(1) Represents the unvested portion of the number of SARs granted. SARs vest over a three-year period at 33% on year from grant date, 33% two years from grant date, and 34% three years from the grant date. For each grant of SARs, the grant date is the date that is 10 years prior to the SAR expiration date for such grant.
(2) Represents the unvested portion in the aggregate of (i) 9,054 restricted stock units granted to Mr. Heckes on February 22, 2021, which vests thirty-three percent (33%) on February 22, 2022, thirty-three percent (33%) on February 22, 2023 and thirty-four percent (34%) on February 22, 2024, (ii) 11,511 restricted stock units granted to Mr. Heckes on February 23, 2022, which vests thirty-three percent (33%) on February 23, 2023, thirty-three percent (33%) on February 23, 2024 and thirty-four percent (34%) on February 23, 2025, and (iii) 13,990 restricted stock units granted to Mr. Heckes on February 27, 2023, which vests thirty-three percent (33%) on February 27, 2024, thirty-three percent (33%) on February 27, 2025, and thirty-four (34%) on February 27, 2025.
(3) Represents the unvested performance-vesting restricted stock units granted in February 2021. Shares were earned based on the Company’s achievement of the applicable improvements in Adjusted EBITDA Margin and Return on Assets during the 3-year performance period ending with the 2023 fiscal year and vested on February 22, 2024. On February 26, 2024, the Compensation Committee approved the Company’s performance results at 66.7% achievement of target results (the units being shown in this table representing the final number of vesting shares). See “Compensation Discussion and Analysis – Elements of Our Executive Compensation Program – Long-Term Equity Incentive Awards – 2021 Performance Vesting Restricted Stock Awards” for additional detail.
(4) Represents the unvested performance-vesting restricted stock units granted to each NEO in February 2022 which are scheduled to vest on February 23, 2025, subject to achievement of the applicable Net Sales and Return on Invested Capital improvement metrics over the 3-year performance period ending with the 2023 fiscal year. Amounts shown represent the number of shares that would be earned by each of the NEOs at the target levels of performance. The maximum number of shares that may be earned by each NEO are as follows: Mr. Heckes, 46,044; Mr. Tiejema, 12,188; Mr. Ball, 11,172; Mr. White, 7,448; and Mr. Paxton, 7,448.
(5) Represents the unvested performance-vesting restricted stock units granted to each NEO in August 2022 which are scheduled to vest on August 3, 2025, subject to achievement of the applicable Adjusted EBITDA Margin metric at the end of the 2022 fiscal year and at the end of either the 2023 or 2024 fiscal years. Amounts shown
represent the number of shares that would be earned by each of the NEOs at the target level of performance. The maximum number of shares that may be earned by each NEO are as follows: Mr. Heckes, 28,309; Mr. Tiejema, 16,985; and 11,323 each for Messrs. Ball, White, and Paxton.
(6) Represents the unvested performance-vesting restricted stock units granted to each NEO in February 2023 which are scheduled to vest on February 27, 2026, subject to achievement of the applicable Net Sales and Total Shareholder Return metrics over the 3-year performance period ending with the 2025 fiscal year. Amounts shown represent the number of shares that would be earned by each of the NEOs at the target levels of performance. The maximum number of shares that may be earned by each NEO are as follows: Mr. Heckes, 55,960; Mr. Tiejema, 13,484; Mr. Ball, 12,136; Mr. White, 7,416; and Mr. Paxton, 8,090.
(7) Represents the unvested portion in the aggregate of (i) 2,194 restricted stock units granted to Mr. Tiejema on February 22, 2021, which vests thirty-three percent (33%) on February 22, 2022, thirty-three percent (33%) on February 22, 2023, and thirty-four percent (34%) on February 22, 2024, (ii) 3,047 restricted stock units granted to Mr. Tiejema on February 23, 2022, which vests thirty-three percent (33%) on February 23, 2023, thirty-three percent (33%) on February 23, 2024, and thirty-four percent (34%) on February 23, 2025, and (iii) 3,371 restricted stock units granted to Mr. Tiejema on February 27, 2023, which vests thirty-three percent (33%) on February 27, 2024, thirty-three percent (33%) on February 27, 2025, and thirty-four percent (34%) on February 27, 2026.
(8) Represents the unvested portion in the aggregate of (i) 2,073 restricted stock units granted to Mr. Ball September 6, 2021, which vests thirty-three percent (33%) on September 6, 2022, thirty-three percent (33%) on September 6, 2023, and thirty-four percent (34%) on September 6, 2024; (ii) 2,793 restricted stock units granted to Mr. Ball on February 23, 2022, which vests thirty-three percent (33%) on February 23, 2023, thirty-three percent (33%) on February 23, 2024, and thirty-four percent (34%) on February 23, 2025; and (iii) 3,034 restricted stock units granted to Mr. Ball on February 27, 2023, which vests thirty-three percent (33%) on February 27, 2024, thirty-three percent (33%) on February 27, 2025, and thirty-four percent (34%) which vests on February 27, 2026.
(9) Represents the unvested portion in the aggregate of (i) 1,379 restricted stock units granted to Mr. White on February 22, 2021, which vests thirty-three percent (33%) on February 22, 2022, thirty-three percent (33%) on February 22, 2023, and thirty-four percent (34%) on February 22, 2024; (ii) 1,862 restricted stock units granted to Mr. White on February 23, 2022, which vests thirty-three percent (33%) on February 23, 2023, thirty-three percent (33%) on February 23, 2024, and thirty-four percent (34%) on February 23, 2025; and (iii) 1,854 restricted stock units granted to Mr. White on February 27, 2023, which vests thirty-three percent (33%) on February 27, 2024, thirty-three percent (33%) on February 27, 2025, and thirty-four percent (34%) on February 27, 2026.
(10) Represents the unvested portion in the aggregate of (i) 1,302 restricted stock units granted to Mr. Paxton on February 22, 2021, which vests thirty-three percent (33%) on February 22, 2022, thirty-three percent (33%) on February 22, 2023, and thirty-four percent (34%) on February 22, 2024; (ii) 1,862 restricted stock units granted to Mr. Paxton on February 23, 2022, which vests thirty-three percent (33%) on February 23, 2023, thirty-three percent (33%) on February 23, 2024, and thirty-four percent (34%) on February 23, 2025; and 2,022 restricted stock units granted to Mr. Paxton on February 27, 2023, which vests thirty-three percent (33%) on February 27, 2024, thirty-three percent (33%) on February 27, 2025, and thirty-four percent (34%) on February 27, 2026.
SAR EXERCISES AND STOCK VESTED FOR 2023
The following table provides information regarding the amounts received by our NEOs upon the vesting of RSUs and the exercise of SARs during the year ended December 31, 2023.
| | | | | | | | | | | | | | | | | |
| SARs AWARDS | | STOCK AWARDS |
| Name | Number of Shares Acquired on Exercise (#) | Value Realized on Exercise ($)(1) | | Number of Shares Acquired on Vesting (#) | Value Realized on Vesting ($)(2) |
| Howard C. Heckes | — | — | | 33,162 | 2,889,981 |
| Russell T. Tiejema | — | — | | 9,486 | 827,135 |
| Christopher O. Ball | — | — | | 1,605 | 147,145 |
| Randal A. White | — | — | | 5,567 | 485,309 |
| Robert A. Paxton | — | — | | 5,233 | 456,167 |
(1) No NEOs exercised SARs during 2023.
(2) Value realized on vesting of restricted stock units is calculated by multiplying the number of restricted stock units that vested by the per share price of our Common Shares on the applicable vesting date.
NONQUALIFIED DEFERRED COMPENSATION FOR 2023
The Masonite International Corporation Deferred Compensation Plan (“Deferred Compensation Plan”) is an unfunded nonqualified deferred compensation plan that permits certain key employees to defer a portion of their compensation to a future time. Eligible employees may elect to defer a portion of their base salary, annual cash incentive bonus and/or RSUs and eligible directors may defer a portion of their director fees under the Deferred Compensation Plan. All contributions to the Deferred Compensation Plan on behalf of the participant are fully vested (other than RSU deferrals which remain subject to the vesting terms of the applicable equity incentive plan) and are placed into a grantor trust, commonly referred to as a “rabbi trust.” Although we are permitted to make matching contributions under the terms of the Deferred Compensation Plan, we have not elected to do so. The Deferred Compensation Plan invests the deferred base salary and annual cash incentive bonus contributions in diversified securities from a selection of investments chosen by the participants who may periodically reallocate the assets in their respective accounts. Participants are entitled to receive the benefits in their accounts upon separation of service or upon a specified date, with benefits payable as a single lump sum or in annual installments. In the event of a change in control, each participant’s account will be distributed in the form of a single lump-sum payment on the second anniversary of the change in control, unless such participant elects, during the 12-month period beginning on the change in control, to receive a single lump-sum payment or installments commencing on either (i) any specified date that is at least 5 years after the second anniversary of the change in control or (ii) the seventh anniversary of the change in control. In 2023, none of our NEOs other than Mr. Heckes elected to defer their compensation under the Deferred Compensation Plan. Additionally, none of our NEOs other than Mr. Heckes have earnings, withdrawals or an aggregate balance under the Deferred Compensation Plan.
The table below provides information of contributions, earnings and balances for our NEOs under our nonqualified deferred compensation plan.
| | | | | | | | | | | | | | |
| Name | Executive Contributions in 2023 ($)(1) | Aggregate Earnings in 2023 ($)(2) | Aggregate Withdrawals/Distributions
in 2023 ($) | Aggregate Balance at December 31, 2023 ($)(4) |
| Howard C. Heckes | 485,769 | 50,059 | — | 535,828 |
(1) Represents the amount Mr. Heckes elected to defer in 2023 under the Deferred Compensation Plan and is included in Mr. Heckes’ fiscal 2023 compensation in "the Summary Compensation Table” as described above.
(2) Represents the gross earnings during fiscal 2023.
(3) Represents the net amounts credited to Mr. Heckes under the Deferred Compensation Plan as a result of the performance of the securities in which the account was invested, as more fully described in the narrative disclosure below. These amounts do not represent above-market earnings/losses, and thus are not reported in the “Summary Compensation Table” as described above.
(4) Represents the amount of Mr. Heckes' account balance under the Deferred Compensation Plan at the end of 2023.
EMPLOYMENT AGREEMENTS; POTENTIAL PAYMENTS ON TERMINATION OR CHANGE IN CONTROL
Summary of Employment Agreements
On December 31, 2021, the Company entered into new employment agreements with each of Messrs. Heckes, Tiejema, Ball, White, and Paxton. These employment agreements superseded and replaced the employment agreements between the Company and with each of Messrs. Heckes, Tiejema, White, and Paxton, the terms of which expired on that date. The employment agreements provide for a term that commences on December 31, 2021, and expires on December 31, 2024, unless earlier terminated.
Howard C. Heckes
Pursuant to his employment agreement, Mr. Heckes continues to serve as our President and Chief Executive Officer. Mr. Heckes’ base salary was increased to $985,000 in 2023 and he is eligible to receive an annual bonus targeted at 120% of his base salary, subject to the achievement of applicable performance goals.
Russell T. Tiejema
Pursuant to his employment agreement, Mr. Tiejema continues to serve as our Executive Vice President and Chief Financial Officer. Mr. Tiejema’s base salary was $580,000 in 2023 and he is eligible to earn an annual bonus targeted at 75% of his base salary, subject to the achievement of applicable performance goals.
Christopher O. Ball
Pursuant to his employment agreement, Mr. Ball serves as our President, Global Residential. Mr. Ball’s base salary was $575,000 in 2023 and he is eligible to earn an annual bonus targeted at 75% of his base salary, subject to the achievement of applicable performance goals.
Randal A. White
Pursuant to his employment agreement, Mr. White continues to serve as our Senior Vice President, Global Operations and Supply Chain. Mr. White’s base salary was $500,000 in 2023 and he is eligible to earn an annual bonus targeted at 65% of his base salary, subject to the achievement of applicable performance goals.
Robert A. Paxton
Pursuant to his employment agreement, Mr. Paxton continues to serve as our Senior Vice President, Human Resources. Mr. Paxton’s base salary was $475,000 in 2023 and he is eligible to earn an annual bonus targeted at 60% of his base salary, subject to the achievement of applicable performance goals.
All of our NEOs are eligible to participate in our Deferred Compensation Plan and all of our employee benefit plans, including the 401(k) Retirement Savings Plan and are entitled to four weeks of vacation per year. In addition, all of our NEOs are subject to covenants, during the term of their employment and for a period of 24 months thereafter, not to (i) engage in any business that competes with us, (ii) solicit our customers, or (iii) solicit or hire our employees.
Termination and Change in Control Benefits
The employment agreements entered into with each of our NEOs entitle them to receive the payments and benefits upon each termination and change in control event described below.
Termination without cause or for good reason, other than in connection with a change in control
If the employment of an NEO is terminated by us other than for cause or disability (as defined below), or if an NEO resigns for good reason (as defined below), and such termination is not in connection with a change in control, the NEO will be entitled to receive:
•a lump sum payment of an amount equal to a pro-rata portion of the annual cash incentive bonus, based on actual performance, that the NEO would have been paid if he had remained employed by us; and
•continued payment of base salary for 24 months if the date of termination is more than two years after the NEO became employed by the Company, and for 12 months if the date of termination is less than two years after the NEO became an employee of the Company; and
•continued participation in our medical, dental and hospitalization coverage for 12 months on the same terms and conditions as immediately prior to such NEO’s date of termination (i.e., at active employee rates).
Termination without cause or for good reason in connection with a change in control
In the event the employment of an NEO is terminated by us other than for cause or disability, or by an NEO for good reason, either during the two year period following a change in control or if such NEO’s employment is terminated at the request of a third party or otherwise arises in anticipation of a change in control, the NEO will be entitled to receive:
•a lump sum payment of an amount equal to a pro-rata portion of the annual cash incentive bonus, based on actual performance, that the NEO would have been paid if the NEO had remained employed by us; and
•a lump sum payment equal to two times the sum of base salary and the average amount of such NEO’s annual cash incentive bonus earned during the two calendar years immediately preceding the date of termination; and
•continued participation in our medical, dental and hospitalization coverage for 24 months on the same terms and conditions as immediately prior to such NEO’s date of termination (i.e., at active employee rates).
If any payments or benefits provided to an NEO in connection with a change in control are subject to excise taxes as a result of the application of Sections 280G and 4999 of the Internal Revenue Code, such payments and benefits will be reduced so that no excise tax is payable, but only if this reduction results in a more favorable after-tax position for such NEO.
Termination upon expiration of the term
If the term of an NEO’s employment agreement expires without the Company offering to renew it on the same terms and conditions upon the expiration of the term, such NEO will be entitled to receive:
•continued payment of base salary for 24 months; and
•continued participation in our medical, dental and hospitalization coverage for 12 months on the same terms and conditions as immediately prior to the date of termination (i.e., at active employee rates).
Release and Restrictive Covenants
All severance payments to our NEOs are subject to the execution and non-revocation of an effective release in our favor and the NEO’s continued compliance with the restrictive covenants set forth in the employment agreement.
Definitions
For purposes of all of the employment agreements:
“cause” is generally defined as:
•conviction of, or plea of no contest to a felony (other than in connection with a traffic violation);
•the NEO’s continued failure to substantially perform his or her material duties under the employment agreement;
•an act of fraud or gross or willful material misconduct;
•any act of workplace harassment which exposes the Company to risk of material civil or criminal legal damages and materially adversely affects the Company’s business or reputation; or
•a material breach by the NEO of the restrictive covenants of the employment agreement.
“change in control” means:
•an acquisition of more than 50% of our voting securities (other than acquisitions from or by us);
•an acquisition of more than 30% of our voting securities in one or a series of related transactions during any 12-month period (other than acquisition from or by us);
•certain changes in a majority of the Board;
•a merger or consolidation of the Company other than a merger or consolidation in which the Company is the surviving entity (other than a recapitalization in which no person or entity acquires more than 50% of our voting securities); or
•a sale or disposition of at least 40% of the total gross fair market value of our assets, other than a sale or disposition of all or substantially all of our assets to a person or entity that owns more than 50% of our voting securities.
“disability” is generally defined as the NEO being unable to perform their material duties under the employment agreement due to illness, physical or mental disability or other similar incapacity that continues for 180 consecutive days or 240 days in any 24-month period.
“good reason” is generally defined as:
•any material diminution or material adverse change to the applicable NEO’s title, duties or authorities;
•a reduction in the NEO’s base salary or target annual cash incentive bonus, except for a base salary reduction of up to 10% as part of across-the-board reductions in base salary for all senior executives;
•a material adverse change in the applicable NEO’s reporting responsibilities or the assignment of duties substantially inconsistent with his or her position or status with the Company;
•a relocation of the NEO’s primary place of employment to a location more than 25 miles further from his or her primary residence than the current location of the Company’s offices;
•any material breach by the Company of the material provisions of the employment agreement or any other agreement with the Company or its affiliates;
•the failure of any successor of the Company to assume in writing the obligations under the employment agreement; or
•any material diminution in the aggregate value of employee benefits provided to the NEO on the effective date of the employment agreement; however, if such reduction occurs at any time other than within the two year period following a change in control, such NEO will not have good reason for across-the-board reductions in benefits applicable to all senior executives.
NEO EQUITY AWARD AGREEMENTS
The equity award agreements governing the outstanding RSUs and SARs rights held by the NEOs provide for certain accelerated vesting of the underlying award, as summarized below:
Change in Control
For purposes of the 2021 Plan and the 2012 Plan and the applicable equity award agreements, a “change in control” generally has the same meaning as set forth in the employment agreements with the NEOs as described above.
With respect to all unvested restricted stock units and stock appreciation rights, if within 30 days prior or 24 months following the completion of a change in control or at any time prior to a change in control at the request of a prospective purchaser whose proposed purchase would constitute a change in control upon its completion, the participant’s employment is terminated either without “cause” or by the participant for “good reason” (each as defined above for the NEOs), any such awards will become fully vested on the date of such termination of employment. With respect to performance-vesting restricted stock units, the vesting is determined as follows: if a “change in control” occurs (a) before the end of the applicable performance period, the value of accelerated performance-vesting restricted stock units is calculated assuming that the applicable performance goals are achieved at the target levels, or (b) after the end of the applicable performance period, the value of the accelerated performance-vesting restricted stock units is calculated based on the Company’s actual performance against the applicable performance goals.
Death or Disability
If a participant’s employment is terminated due to death or disability, all awards will become fully vested. With respect to any performance-based restricted stock units, the number of units subject to such accelerated vesting will be counted at target.
For purposes of the 2021 Plan and the 2012 Plan and the applicable equity award agreements, a “disability” generally means the inability of a participant to engage in any substantial gainful activity by reason of any medically determinable physical or mental impairment which can be expected to result in death or which has lasted or can be expected to last for a continuous period of not less than 12 months.
SUMMARY OF POTENTIAL PAYMENTS UPON TERMINATION AND/OR CHANGE OF CONTROL
The following table sets forth for each of our NEOs, the amount of the severance payments and benefits and the accelerated vesting of the restricted stock units and stock appreciation rights that the NEO would have been entitled to under the various termination and change in control events described above, assuming they had terminated employment on December 29, 2023.
| | | | | | | | | | | | | | | | | | | | | | | |
| | Cash Severance ($) | Pro-Rate Bonus ($)(1) | Health and Welfare Benefits ($)(2) | Accelerated Vesting of RSUs ($)(3) | Accelerated Vesting of SARs ($)(4) | Total ($) |
| Howard C. Heckes | Without Cause/For Good Reason Without a CIC | 1,970,000 (5) | 1,880,562 | | 326 | | — | | — | | 3,850,888 | |
| Without Cause/For Good Reason in connection with a CIC | 4,905,740 (6) | — | | 653 | | 10,606,289 | | — | | 15,512,682 | |
| Termination upon Expiration of the Employment Agreement | 1,970,000 (7) | — | | 326 | | — | | — | | 1,970,326 | |
| Death or Disability | — | | — | | — | | 10,606,289 | | — | | 10,606,289 | |
| Russell T. Tiejema | Without Cause/For Good Reason Without a CIC | 1,160,000 (5) | 692,085 | | 18,871 | | — | | — | | 1,870,956 | |
| Without Cause/For Good Reason in connection with a CIC | 2,248,498 (6) | — | | 37,741 | | 3,480,711 | | — | | 5,766,950 | |
| Termination upon Expiration of the Employment Agreement | 1,160,000 (7) | — | | 18,871 | | — | | — | | 1,178,871 | |
| Death or Disability | — | | — | | — | | 3,480,711 | | — | | 3,480,711 | |
| Christopher O. Ball | Without Cause/For Good Reason Without a CIC | 1,150,000 (5) | 450,182 | | 18,854 | | — | | — | | 1,619,036 | |
| Without Cause/For Good Reason in connection with a CIC | 2,219,985 (6) | — | | 37,708 | | 2,479,945 | | — | | 4,737,639 | |
| Termination upon Expiration of the Employment Agreement | 1,150,000 (7) | — | | 18,854 | | — | | — | | 1,168,854 | |
| Death or Disability | — | | — | | — | | 2,479,945 | | — | | 2,479,945 | |
| Randal A. White | Without Cause/For Good Reason Without a CIC | 1,000,000 (5) | 517,075 | | 18,854 | | — | | — | | 1,535,929 | |
| Without Cause/For Good Reason in connection with a CIC | 1,788,077 (6) | — | | 37,708 | | 2,163,317 | | — | | 3,989,102 | |
| Termination upon Expiration of the Employment Agreement | 1,000,000 (7) | — | | 18,854 | | — | | — | | 1,018,854 | |
| Death or Disability | — | | — | | — | | 2,163,317 | | — | | 2,163,317 | |
| Robert A. Paxton | Without Cause/For Good Reason Without a CIC | 950,000 (5) | 476,107 | | 18,854 | | — | | — | | 1,444,961 | |
| Without Cause/For Good Reason in connection with a CIC | 1,695,524 (6) | — | | 37,708 | | 2,188,630 | | — | | 3,921,862 | |
| Termination upon Expiration of the Employment Agreement | 950,000 (7) | — | | 18,854 | | — | | — | | 968,854 | |
| Death or Disability | — | | — | | — | | 2,188,630 | | — | | 2,188,630 | |
(1) Represents the full annual cash incentive bonus amount for 2023.
(2) Represents the value of benefits continuation for the Company sponsored portion of the health and welfare benefits at active employee rates, based upon the NEO’s benefit election as of January 1, 2024, for a period of 12 months upon a termination without cause or for good reason without a change in control or due to expiration of the employment agreement, or 24 months upon a termination without cause or for good reason with a change in control, as applicable.
(3) Amounts shown are calculated by aggregating the sums determined by multiplying, for each award, (x) the number of restricted stock units that receive accelerated vesting as a result of the applicable termination of employment, by (y) the closing share price on December 29, 2023 of $84.66. The value of accelerated performance-vesting restricted stock units is calculated assuming that the applicable performance goals are achieved at the target levels.
(4) Amounts shown are calculated by aggregating the sums determined by multiplying, for each award, (x) the number of shares subject to SARs that receive accelerated vesting as a result of the applicable termination of employment, by (y) the difference between the closing price per share of our common stock on December 29, 2023 of $84.66, less the applicable exercise price of the SAR, provided that if such sum is zero or a negative number, the overall calculation result defaults to zero.
(5) Represents a cash severance amount equal to 24 months of base salary if the date of termination is more than two years after the NEO became employed by the Company, or cash severance amount equal to 12 months of base salary if the date of termination is less than two years after the NEO became employed by the Company.
(6) Represents a cash severance amount equal two times (2x) the sum of base salary and the average amount of the NEO’s annual cash incentive bonuses, if any, earned during the two calendar years immediately preceding the calendar year in which the date of termination occurred (i.e., 2023 and 2022).
(7) Represents a cash severance amount equal to 24 months of base salary if the date of termination is more than two years after the NEO became employed by the Company, or cash severance amount equal to 12 months of base salary if the date of termination is less than two years after the NEO became employed by the Company.
CEO Pay Ratio
In accordance with the SEC rules, we are providing the ratio of the annual total compensation of our CEO, to the annual total compensation of our median employee.
To identify our median employee for our 2023 disclosure, we determined our global employee population of approximately 10,168 employees (excluding our CEO, contract, and leave of absence employees) as of December 31, 2023, which included 6,767 U.S. employees, and 3,401 non-U.S. employees. We excluded all employees in Malaysia (240) and China (3) under the de minimus exception, as an aggregate number of employees (243) represents less than 5% of our total global employee population. After taking into account this de minimis exception, 9,925 employees, including 3,158 non-U.S. employees, were considered in identifying the median employee.
After determining our global employee population, we used annual taxable compensation as derived from our tax and/or payroll records, converted to U.S. dollars, as our consistently applied compensation measure. We believe that using taxable compensation encompasses all the principal methods of gathering compensation of our employees and provides a reasonable estimate of annual compensation for our employees. Furthermore, in identifying our median employee, we annualized base wages for employees who were not employed for the full 2023 fiscal year.
After identifying our median employee, we then calculated the annual total compensation for our median employee using the same methodology used for our CEO as set forth in the Summary Compensation Table of this Proxy Statement. Below is the calculation of our 2023 CEO pay ratio:
| | | | | |
CEO Total Annual Compensation | $7,035,842 |
Median Employee Total Annual Compensation | $46,688 |
CEO to Median Employee Compensation Ratio | 151 : 1 |
Because the SEC rules for identifying the median compensated employee and calculating the pay ratio based on that employee's annual total compensation allow companies to adopt a variety of methodologies, to apply certain exclusions, and to make reasonable estimates and assumptions that reflect their compensation practices, the pay ratio reported by other companies may not be comparable to the pay ratio reported above, as other companies may have different employment and compensation practices and may utilize different methodologies, exclusions, estimates, and assumptions in calculating their own pay ratios.
Item 12. Security Ownership of Certain Beneficial Owners and Management and Related Stockholder Matters
The following table sets forth the number of Common Shares of Masonite securities beneficially owned as of the close of business on April 15, 2024, by (i) each of those known to the Company to be the beneficial owner of more than 5% of our Common Shares, (ii) each director, (iii) the named executive officers listed in the Summary Compensation Table (“NEO’s”), and (iv) all directors and all our executive officers as a group.
The percentage of Common Shares outstanding provided in the tables are based on 21,978,219 Common Shares outstanding as of the close of business on April 15, 2024. Beneficial ownership is determined in accordance with the rules of the SEC and generally includes voting or investment power with respect to securities.
SHARE OWNERSHIP OF CERTAIN BENEFICIAL OWNERS
Based solely on filings made under Sections 13(d) and 13(g) of the Exchange Act as of the close of business on April 15, 2024 the only shareholders known to us to beneficially own more than 5% of any class of our voting securities are:
| | | | | | | | | | | |
| Amount and Nature of Beneficial Ownership |
| Name and Address of Beneficial Owner | Total Common Shares Beneficially Owned | | Percentage of Common Shares Beneficially Owned |
The Vanguard Group (1) | 2,366,249 | | | 10.84 | % |
BlackRock, Inc. (2) | 1,684,651 | | | 7.70 | % |
FMR LLC (3) | 1,401,403 | | | 6.42 | % |
(1) Based on the most recently available Schedule 13G/A filed with the SEC on February 13, 2024, as of December 29, 2023, the number of shares reported includes (a) 2,302,240 Common Shares over which The Vanguard Group (“Vanguard”) has sole dispositive power, (b) 40,740 Common Shares over which Vanguard has shared voting power, and (c) 64,009 Common Shares over which Vanguard has shared dispositive power. The mailing address for the holder listed above is 100 Vanguard Blvd, Malvern, PA 19355.
(2) Based on the most recently available Schedule 13G/A filed with the SEC on February 6, 2024, as of December 31, 2023, the number of shares reported includes (a) 1,659,082 Common Shares over which Blackrock, Inc. (“Blackrock”) has sole voting power and (b) 1,684,651 Common Shares over which Blackrock has sole dispositive power. The mailing address for the holder listed above is 50 Hudson Yards, New York, NY 10001.
(3) Based on the most recently available Schedule 13G/A filed with the SEC on February 9, 2024, as of December 29, 2023, the number of shares reported includes (a) 1,400,353 Common Shares over which FMR, LLC (“FMR”) has sole voting power and (b) 1,401,403 Common Shares over which FMR has sole dispositive power. The mailing address for the holder listed above is 245 Summer Street, Boston, Massachusetts 02210.
SHARE OWNERSHIP OF DIRECTORS AND EXECUTIVE OFFICERS: o
f Shares Beneficially Owned as of March 14, 2022
| | | | | | | | | | | | | | |
Name of Beneficial Owner (1) | Number of Shares Beneficially Owned |
Common Shares Directly or Indirectly Owned (2) | SARs Exercisable Within 60 Days (3) | RSUs Vesting Within 60 Days (4) | Total Stock-Based Ownership (5) |
Howard C. Heckes | 46,212 | 37,652 | — | 83,864 | |
Robert J. Byrne | 27,856 | — | 1,655 | 29,511 | |
Jonathan F. Foster | 9,773 | — | 1,121 | 10,894 | |
Francis M. Scricco | 18,356 | — | 1,121 | 19,477 | |
Peter R. Dachowski | 11,927 | — | 1,121 | 13,048 | |
Jody L. Bilney | 12,411 | — | 1,121 | 13,532 | |
Daphne E. Jones | 6,940 | — | 1,121 | 8,061 | |
Jay I. Steinfeld | 5,096 | — | 1,121 | 6,217 | |
Barry A. Ruffalo | 1,191 | — | 1,121 | 2,312 | |
Russell T. Tiejema | 40,376 | 11,093 | — | 51,469 | |
Christopher O. Ball | 2,470 | 779 | — | 3,249 | |
Randal A. White | 20,908 | 2,931 | — | 23,839 | |
Robert A. Paxton | 19,751 | 2,086 | — | 21,837 | |
All directors and executive officers as a group (16 persons) | 231,136 | 55,539 | 9,502 | 296,177 | |
(1) As of the close of business on April 15, 2024 (i) no director or executive officer beneficially owned more than 1% of the outstanding Common Shares, and (ii) the directors and executive officers of Masonite as a group beneficially owned approximately 1% of the outstanding Common Shares (including Common Shares they have the right to acquire within 60 days through the exercise of any option, warrant, or right, through conversion of any security or pursuant to the automatic termination of a power of attorney or revocation of a trust, discretionary account or similar arrangement). The address of each of the Masonite directors and executive officers listed above is c/o Masonite International Corporation, 1242 East 5th Avenue, Tampa, Florida 33605.
(2) Represents Common Shares owned by the directors and executive officers. With respect to Mr. Byrne, 27,856 Common Shares that are held in trust.
(3) The number of Common Shares shown in this column are not currently outstanding but are deemed beneficially owned because of the right to acquire upon exercise of SARs that are currently exercisable or exercisable within 60 days of April 15, 2024. Since the SARs are settled in Common Shares, the table assumes that the SARs were converted to Common Shares using a price of $120.47 per Common Share, the 60 day average closing price of Common Shares on the NYSE, as of the 60 trading days prior to April 15, 2024.
(4) The number of Common Shares shown in this column are not currently outstanding but are deemed beneficially owned because of the right to acquire upon the vesting of time-vesting restricted stock units within 60 days of April 15, 2024.
(5) These amounts are the sum of the number of Common Shares shown in prior columns.
EQUITY COMPENSATION PLANS
The following table summarizes information about our Common Shares that may be issued under the Masonite International Corporation 2021 Omnibus Incentive Plan (the “2021 Plan”), the 2012 Plan, the Masonite International Corporation 2014 Employee Stock Purchase Plan. All outstanding awards relate to Common Shares. Information is as of December 31, 2023.
| | | | | | | | | | | |
| Plan Category | Number of securities to be issued upon exercise of outstanding options, warrants and rights (a) (#) | Weighted average exercise price of outstanding options, warrants and rights(3) (b) ($) | Number of securities remaining available for future issuance under equity compensation plans (excluding securities in column (a)) (c) (#) |
Equity compensation plans approved by security holders(1) | 1,007,975(2) | $77.00 | 1,377,858(4) |
| Equity compensation plans not approved by security holders | — | — | — |
| Total at December 31, 2023 | 1,007,975 | $77.00 | 1,377,858 |
(1) For additional information concerning our equity compensation plans, see the discussion in Note 12 to the Company’s consolidated financial statements in the Annual Report on Form 10-K for the fiscal year ended December 31, 2023.
(2) Consists of outstanding (i) stock appreciation rights under the 2012 Plan covering an aggregate of 27,979 Common Shares, calculated assuming the SARs were converted to Common Shares using a price of $84.66 per Common Share, the closing price of our Common Shares on NYSE on December 29, 2023, (ii) restricted stock unit awards under the 2012 Plan covering an aggregate of 115,052 Common Shares, some of which are subject to time-based vesting and some of which are subject to performance-based vesting, (iii) stock appreciation rights under the 2021 Plan covering an aggregate of zero Common Shares, calculated assuming the SARs were converted to Common Shares using a price of $84.66 per Common Share, and (iv) restricted stock unit awards under the 2021 Plan covering an aggregate of 864,994 Common Shares some of which are subject to time-based vesting and some of which are subject to performance-based vesting. The number of shares to be issued in respect of PSU awards has been calculated based on the assumption that the maximum levels of performance applicable to these awards will be achieved.
(3) Reflects the weighted average exercise price of stock appreciation rights only. As restricted stock unit awards have no exercise price, they are excluded from the weighted average exercise price calculation set forth in column (b).
(4) Includes 604,693 shares available for future issuance under the Masonite International Corporation 2014 Employee Stock Purchase Plan.
Item 13. Certain Relationships and Related Transactions, and Director Independence
CERTAIN RELATIONSHIPS AND RELATED PARTY TRANSACTIONS
The Company’s Related Person Transaction Policy defines a “Related Person Transaction” as any transaction that would be required to be disclosed pursuant to Item 404(a) of Regulation S-K in which the Company was or is to be a participant, the amount involved exceeds $120,000, and in which any Related Person had or will have a direct or indirect material interest, other than an employment relationship or transaction involving an executive officer and any related compensation. A “transaction” includes, but is not limited to, any financial transaction, arrangement or relationship (including any indebtedness or guarantee of indebtedness) or any series of similar transactions, arrangements or relationships. A “Related Person” is (i) any person who is, or at any time since the beginning of 2023, was an executive officer, a director or a director nominee of the Company; (ii) a security holder who is known to the Company to own of record or beneficially more than 5% of any class of the Company’s voting securities at the time of occurrence or existence of the Related Person Transaction; and (iii) a person who is an immediate family member of any of the foregoing persons (the term “immediate family” shall include any child, stepchild, parent, stepparent, spouse, sibling, mother-in-law, father-in-law, son-in-law, daughter-in-law, brother-in-law or sister-in-law and any person (other than a tenant or employee) sharing the household of any of the foregoing persons).
Under the Related Person Transaction Policy, each Related Person Transaction must be approved or ratified in accordance with the guidelines set forth in the policy by the Sustainability and Governance Committee or by the disinterested members of the Board. In considering whether to approve or ratify any Related Person Transaction, the Sustainability and Governance Committee or the disinterested members of the Board, as the case may be, shall consider all factors that in their discretion are relevant to the Related Person Transaction. Additionally, any employment relationship or transaction involving an executive officer and any related compensation must be approved by the Human Resources and Compensation Committee or recommended by the Human Resources and Compensation Committee for its approval. In considering whether to approve or ratify any Related Person Transaction, the Sustainability and Governance Committee or the disinterested members of the Board, as the case may be, shall consider all factors that in their discretion are relevant to the Related Person Transaction. There were no transactions, or currently proposed transactions, considered to be a Related Person Transaction since the beginning of 2023 and through the date of this Amendment.
DIRECTOR INDEPENDENCE
Our Board has determined, after considering all the relevant facts and circumstances, that all of the directors other than Mr. Heckes, our CEO are independent, as “independence” is defined by the listing standards of the NYSE, because they have no direct or indirect material relationship with the Company (either directly or as a partner, shareholder or officer of an organization that has a relationship with us) that would cause the independence requirements of the NYSE listing standards to not be satisfied, and otherwise meet the NYSE listing standards. Members of our Board are kept informed of our business through discussions with our CEO, Chief Financial Officer and other officers, by reviewing materials provided to them, by visiting our offices and facilities, and by participating in meetings of the Board and its committees. We currently separate the roles of CEO and Chairman of the Board. This structure properly reflects our belief that our shareholders’ interests are best served by the day-to-day management direction of the Company under Mr. Heckes, our CEO, together with the leadership of our Chairman of the Board, Mr. Byrne.
Item 14. Principal Accountant Fees and Services
SERVICE FEES PAID TO THE INDEPENDENT REGISTERED PUBLIC ACCOUNTING FIRM
Our consolidated financial statements for the fiscal year ended December 31, 2023 have been audited by Ernst & Young LLP (“EY”) our independent registered public accounting firm. EY began acting as our independent auditors with respect to the audit of our financial statements beginning with the 2017 fiscal year. The Audit Committee is directly responsible for the appointment, compensation, retention and oversight of the independent registered public accounting firm retained to audit our financial statements. The Audit Committee is responsible for the audit fee negotiations associated with the appointment of EY as our independent registered public accounting firm for the fiscal year ending December 31, 2023.
The fees charged by EY for professional services rendered in connection with all audit and non-audit related matters for fiscal years ended December 31, 2023 and January 1, 2023 were as follows:
| | | | | | | | |
| Type of Fees | 2023 ($) | 2022 ($) |
| Audit-Fees | 4,346,870 | | 3,261,298 | |
| Audit-Related Fees | 1,113,948 | | 580,366 | |
| Tax Fees | 604,624 | | 479,814 | |
| All Other Fees | — | | — | |
| Totals | 6,065,442 | | 4,321,478 | |
INDEPENDENT REGISTERED PUBLIC ACCOUNTANTS-FEE INFORMATION
Audit Fees
Fees for audit services in 2023 and in 2022 consisted of (a) audits of the Company’s annual consolidated financial statements, (b) reviews of the Company’s quarterly condensed consolidated financial statements included in our Quarterly Reports on Form 10-Q, and (c) annual stand-alone statutory audits. Fees for audit services also included services in connection with SEC registrations and other offering or filings.
Audit-Related Fees
Audit-related services principally include assurance and related services by the independent auditors that are reasonably related to the performance of the audit or review of our financial statements, or other filings that are not captured under “Audit Fees” above.
Tax Fees
Tax services in 2023 and 2022 consisted of professional services rendered by EY for tax return preparation, tax compliance, and tax advice.
All Other Fees
There were no other fees in 2023 or 2022.
The Audit Committee considered whether EY’s provision of the above non-audit services is compatible with maintaining such firm’s independence and satisfied itself as to EY’s independence.
POLICY ON AUDIT COMMITTEE PRE-APPROVAL OF AUDIT AND PERMISSIBLE NON-AUDIT SERVICES OF INDEPENDENT AUDITORS
Consistent with the SEC policies regarding auditor independence and the Audit Committee charter, the Audit Committee has responsibility for appointing, setting compensation and reviewing the performance of the independent auditors. In exercising this responsibility, the Audit Committee has established pre-approval policies with respect to audit and permissible non-audit services to be provided by the independent auditors and the related fees. Pre-approval is generally provided for up to one year and any pre-approval is detailed as to the particular service or category of services and is generally subject to a specific limit above which separate pre-approval is required. Management is required to periodically report to the Audit Committee regarding the extent of services provided by the independent auditors in accordance with this pre-approval, and the fees for the services performed to date. To ensure prompt handling of unexpected matters, the Audit Committee has delegated to the Chairman of the Audit Committee the authority to pre-approve permissible non-audit services and fees. Any action taken in this regard is reported to the Audit Committee at the next scheduled Audit Committee meeting.
PART IV
Item 15. Exhibit and Financial Statement Schedules
| | | | | | | | | | |
(a) | The following documents are filed as part of this Form Amendment: | | |
| | | | |
| | | | |
| | | | |
| | | | |
| | | | |
| | | | |
| | | | |
| | | | |
| | | | |
| 1. | No financial statements or supplemental data are filed with this report on Form 10-K/A. See Index to Financial Statements and Supplement Data of the Original Form 10-K. | | |
| (b) | The exhibits listed on the "Index to Exhibits" below are filed or furnished with this Amendment or incorporated by reference as set forth below. | | |
| (c) | Additional Financial Statement Schedules | | |
| None. | | |
INDEX TO EXHIBITS
The following is a list of all exhibits filed or furnished as part of this report:
| | | | | | | | |
| Exhibit No. | Description |
| |
| |
| 104* | Cover Page Interactive Data File (formatted as Inline XBRL and contained in Exhibit 101) |
| | |
| * | Filed herewith. |
SIGNATURES
Pursuant to the requirements of Section 13 or 15(d) of the Securities Exchange Act of 1934, the Registrant has duly caused this report to be signed on its behalf by the undersigned, thereunto duly authorized.
| | | | | | | | | | | | | | |
| | MASONITE INTERNATIONAL CORPORATION | |
| | (Registrant) | |
| | | | |
| Date: | April 26, 2024 | By | /s/ Russell T. Tiejema | |
| | Russell T. Tiejema | |
| | Executive Vice President and Chief Financial Officer | |
| | (Principal Financial Officer) | |
| | | | |
| | | | |
| | | |
| | | |
| | | |