As filed with the Securities and Exchange Commission on January 4, 2024
UNITED STATES
SECURITIES AND EXCHANGE COMMISSION
Washington, D.C. 20549
SECURITIES AND EXCHANGE COMMISSION
Washington, D.C. 20549
FORM N-CSR
CERTIFIED SHAREHOLDER REPORT OF REGISTERED
MANAGEMENT INVESTMENT COMPANIES
Investment Company Act file number (811-07168)
Hennessy Funds Trust
(Exact name of registrant as specified in charter)
(Exact name of registrant as specified in charter)
7250 Redwood Blvd., Suite 200
Novato, CA 94945
(Address of principal executive offices) (Zip code)
(Address of principal executive offices) (Zip code)
Teresa M. Nilsen
7250 Redwood Blvd., Suite 200
Novato, CA 94945
(Name and address of agent for service)
(Name and address of agent for service)
800-966-4354
(Registrant’s telephone number, including area code)
Date of fiscal year end: October 31, 2023
Date of reporting period: October 31, 2023
Item 1. Reports to Stockholders.
|
(a)
|
|
ANNUAL REPORT
OCTOBER 31, 2023

HENNESSY CORNERSTONE GROWTH FUND
Investor Class HFCGX
Institutional Class HICGX

www.hennessyfunds.com | 1-800-966-4354
(This Page Intentionally Left Blank.)
Contents
|
Letter to Shareholders
|
2
|
|
|
Performance Overview
|
6
|
|
|
Financial Statements
|
||
|
Schedule of Investments
|
9
|
|
|
Statement of Assets and Liabilities
|
13
|
|
|
Statement of Operations
|
14
|
|
|
Statements of Changes in Net Assets
|
15
|
|
|
Financial Highlights
|
16
|
|
|
Notes to the Financial Statements
|
20
|
|
|
Report of Independent Registered Public Accounting Firm
|
28
|
|
|
Trustees and Officers of the Fund
|
29
|
|
|
Expense Example
|
34
|
|
|
Proxy Voting Policy and Proxy Voting Records
|
36
|
|
|
Availability of Quarterly Portfolio Schedule
|
36
|
|
|
Federal Tax Distribution Information
|
36
|
|
|
Important Notice Regarding Delivery of Shareholder Documents
|
36
|
|
|
Electronic Delivery
|
36
|
|
|
Liquidity Risk Management Program
|
37
|
|
|
Privacy Policy
|
37
|
|
HENNESSY FUNDS
|
1-800-966-4354
|
November 2023
Dear Hennessy Funds Shareholder:
Market Myopia: Tough Beginnings & Fantastic Finishes
During an interview this summer, I was reminded how important it is to maintain a long-term view of the market and investing and how easy it is to focus on the very recent past. In mid-July, when the Nasdaq Composite Index
was soaring to new 2023 highs and large-cap tech was once again dominating both returns and news headlines, the interviewer seemed confused – and somewhat disappointed – when I mentioned that even with 2023’s stellar performance, the Nasdaq was
negative if you included the prior year (2022) and that during that same time, utilities had outperformed. As of the time of writing this letter, a similar story can be seen when considering eight technology giants: Microsoft,
Tesla, Facebook (Meta), Apple, Amazon, Netflix,
Nvidia, and Google, or “MT. FAANNG” as a much easier to say (and remember) acronym.(1)
MT. FAANNG is up on average a whopping 89.69% in 2023 on a total return basis as of November 7, 2023. However, this same group was down -46.71% in 2022, a dismal year for large-cap tech. Due to the unforgiving nature of percentages, from the end of
2021 until now, this group of highflyers, believe it or not, is still down -3.14% on average, despite an incredible 2023.
I like to call this phenomenon “market myopia.” Investors tend to be optimists, as am I. This makes it so much more comforting to forget the “tough beginnings” when you’d rather
remember the “fantastic finishes.” In continuing with the example above, unless you were an investor with prescient foresight, you likely didn’t sell all your MT. FAANNG stocks on January 4, 2022, as the market started its correction, and you
probably didn’t then buy them all back on September 30, 2022, when the market hit its low. An average investor’s experience would be much different than that. Which brings me to the point of all this: what are some elements of our investment
philosophy here at Hennessy Funds?
First, what about timing the market? Simply put, we don’t do it. As Neil Hennessy, our Chief Market Strategist and long-tenured Portfolio Manager, aptly put it, “It’s not about timing the market, but rather about time in the market.” The long-term annualized return of the market, as measured by the Dow Jones Industrial Average going back 104 years
to 1920, is about 9.6%, and that number would be closer to 7-8% on a real return basis when factoring in inflation. If an investor is poorly timing when to enter and when to exit the market, it would be very difficult to achieve similar, attractive
returns to what they would experience simply by staying invested through a complete market cycle.
We are optimistic investors. We understand that some years or months may be tougher than others, but we tend to think in longer timeframes. An investor solely invested in the Nasdaq
might have looked at their portfolio at the end of 2022 and been extremely disappointed with a -32.51% return. But as Josh Wein, one of our Portfolio Managers with over 25 years of experience, pointed out, “2022 was what 8% real returns look like.”
In other words, with the year prior (2021) providing a +22.21% return and the year after (2023) hitting a +31.21% return, 2022’s dismal performance of -32.51% created an annualized total return for the Nasdaq of 8.22% over the entire period (December
31, 2020, to November 7, 2023). Josh simply observed that while corrections happen over the course of a market cycle, it’s best not to panic by selling when stocks are hitting new lows.
_______________
|
(1)
|
The acronym, MT. FAANNG, refers to the following companies: Microsoft Corporation, Tesla, Inc., Meta Platforms, Inc., Amazon.com, Inc., Apple, Inc., Netflix, Inc., NVIDIA Corporation, and Alphabet, Inc.
|
|
WWW.HENNESSYFUNDS.COM
|
2
|
LETTER TO SHAREHOLDERS
|
Downside risk mitigation is relevant. While we normally remain fully invested within our individual funds, we seek to reduce risk through other means, including sector
diversification and investing in companies that exhibit strong fundamentals at compelling valuations. Dave Ellison, the long-tenured Portfolio Manager of our two financial funds, consistently reminds us, “Losing less money in difficult markets is
more important than making the most in rising ones.”
Finally, we are investors in companies, not traders of stocks. Many of our portfolios hold certain positions for long periods of time, a demonstration of the Portfolio Managers’
convictions. In fact, both the Hennessy Focus Fund and the Hennessy Large Cap Financial Fund have held some positions for 25 years or more. We recognize that much of the performance of the Hennessy Funds comes from the actual stocks we own (stock
selection) and not from our weightings within certain sectors (sector allocation). Moving in and out of sectors can enhance performance, but it can also hinder it in the same way as market timing, and it takes a significant number of correct “calls”
regarding the macro-environment. We’d rather invest long term than rely on lucky calls. Our highly experienced energy funds Portfolio Manager, Ben Cook, summed up our philosophy on the macro environment nicely: “While macro-economic trends help to
inform our investment process, ultimately it’s the individual stocks with solid fundamentals and attractive valuations that, over time, drive positive risk-adjusted returns for our funds.”
We are long term investors, staying ever mindful of downside risk while striving to participate in the upside, with each individual fund having its own objective, process, portfolio
construction, and investment criteria.
The stock market has once again seen dramatic differences in stock performance. For our fiscal year ended October 31, 2023, all three broad-based indexes were positive, although with
a large dispersion of total returns, with the Dow Jones Industrial Average up 3.17%, the S&P 500® Index up 10.14%, and the Nasdaq Composite Index up 17.99%. During
our fiscal year, large caps significantly outperformed mid caps and small caps, and growth substantially outperformed value. Large-cap tech once again pushed the overall broader market higher, as evidenced by the Nasdaq-100 Index posting a return of
27.45%. From a sector point of view, besides Technology, the only other sector with outsized (greater than 10%) returns was Communication Services, while six of the 11 GICS sectors of the S&P 500® Index were negative.
Similar to the overall market, our funds experienced mixed results. Many of our funds exhibit more value-oriented characteristics and, given that value underperformed growth this year
by a significant amount, that negatively affected our relative performance. In addition, three of our funds are sector-specific funds that were invested in underperforming sectors, while six more are focused on small- and mid-cap stocks in a time
period when large caps substantially outperformed. Ten of our 16 mutual funds and our exchange-traded-fund (ETF) posted positive returns for the fiscal year ended October 31, 2023.
Several factors caused this disparity of returns in the market: interest rates and inflation being two of the most important. With the Federal Reserve pausing interest rate hikes and
inflation numbers subsiding, the market reacted positively once it became more apparent that we were not heading into a recession. Consumer demand also remained strong, and unemployment numbers remained historically low.
We believe that the outlook for U.S. stocks remains positive, primarily as we believe that the Federal Reserve may be done, or close to done, raising interest rates. Inflation has
shown signs of easing, creating a better environment for consumers as well as businesses. The unemployment rate remains near record lows, there are elevated levels of cash on the
|
HENNESSY FUNDS
|
1-800-966-4354
|
3
balance sheets of U.S. companies and in the pockets of many consumers and investors, and there is the prospect of a more dovish Federal Reserve heading into 2024. However, we are cautiously watching certain parts of the
economy for any hints of weakness, including consumer spending and credit issues. While volatility and uncertainty may impact the markets, we encourage investors to stay the course, maintain a diversified portfolio, and keep a long-term perspective.
We thank you for your continued interest in our Funds and are grateful that you have chosen to invest with us. If you have any questions or would like to speak with us directly,
please call us at (800) 966-4354.
Best regards,
 |
|
 |
|
|
Ryan C. Kelley, CFA
|
|
|
Chief Investment Officer,
|
|
|
Senior Vice President, and Portfolio Manager
|
Past performance does not guarantee future results.
Mutual fund investing involves risk. Principal loss is possible.
Opinions expressed are those of Ryan C. Kelley and are subject to change, are not guaranteed, and should not be considered investment advice.
The Dow Jones Industrial Average and S&P 500® Index are commonly used to measure the performance of U.S. stocks. The Nasdaq Composite
Index comprises all common stocks listed on The Nasdaq Stock Market and is commonly used to measure the performance of technology-related stocks. The Nasdaq-100 Index includes 100 of the largest domestic and international non-financial companies
listed on The NASDAQ Stock Market based on market capitalization. The indices are used herein for comparative purposes in accordance with SEC regulations. One cannot invest directly in an index. All returns are shown on a total return basis.
|
WWW.HENNESSYFUNDS.COM
|
4
|
LETTER TO SHAREHOLDERS
|
(This Page Intentionally Left Blank.)
|
HENNESSY FUNDS
|
1-800-966-4354
|
5
Performance Overview (Unaudited)
CHANGE IN VALUE OF $10,000 INVESTMENT
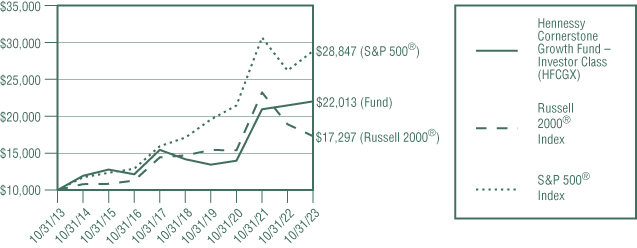
This graph illustrates the performance of an initial investment of $10,000 made in the Fund 10 years ago and assumes the reinvestment of dividends and capital gains.
AVERAGE ANNUAL TOTAL RETURN FOR PERIODS ENDED OCTOBER 31, 2023
|
One
|
Five
|
Ten
|
|
|
Year
|
Years
|
Years
|
|
|
Hennessy Cornerstone Growth Fund –
|
|||
|
Investor Class (HFCGX)
|
2.54%
|
9.19%
|
8.21%
|
|
Hennessy Cornerstone Growth Fund –
|
|||
|
Institutional Class (HICGX)
|
2.85%
|
9.55%
|
8.54%
|
|
Russell 2000® Index
|
-8.56%
|
3.31%
|
5.63%
|
|
S&P 500® Index
|
10.14%
|
11.01%
|
11.18%
|
Expense ratios: 1.33% (Investor Class); 1.01% (Institutional Class)
Performance data quoted represents past performance; past performance does not guarantee future results. The investment return and principal value of an investment will fluctuate so that an investor’s
shares, when redeemed, may be worth more or less than their original cost. The performance table does not reflect the deduction of taxes that a shareholder would pay on Fund distributions or the redemption of Fund shares. Current performance of the
Fund may be lower or higher than the performance quoted. Performance data current to the most recent month end may be obtained by visiting www.hennessyfunds.com.
The Russell 2000® Index is a subset of the Russell 3000®
Index that measures the performance of the small-cap segment of the U.S. equity market. The Russell 2000® Index comprises the smallest 2,000 companies in the Russell
3000® Index based on market capitalization and current index membership, representing approximately 7% of the total market capitalization of the Russell 3000® Index. The S&P 500® Index is a capitalization-weighted index that is designed to
represent the broad domestic economy through changes in the aggregate market value of 500 stocks across all major industries. One cannot invest directly in an index. These indices are used for comparative purposes in accordance with Securities and
Exchange Commission regulations.
Frank Russell Company (“Russell”) is the source and owner of the trademarks, service marks, and copyrights related to the Russell Indexes. Russell®
is a trademark of Frank Russell Company. Neither Russell nor its licensors accept any liability for any errors or omissions in the Russell Indexes or Russell ratings or underlying data and no party may rely on any Russell Indexes or Russell ratings
or underlying data contained in this communication. No
|
WWW.HENNESSYFUNDS.COM
|
6
|
PERFORMANCE OVERVIEW
|
further distribution of Russell data is permitted without Russell’s express written consent. Russell does not promote, sponsor, or endorse the content of this communication.
Standard & Poor’s Financial Services is the source and owner of the S&P® and S&P 500® trademarks.
The expense ratios presented are from the most recent prospectus. The expense ratios for the current reporting period are available in the Financial Highlights section of this report.
PERFORMANCE NARRATIVE
Portfolio Managers Neil J. Hennessy, Ryan C. Kelley, CFA, and L. Joshua Wein, CAIA
Performance:
For the one-year period ended October 31, 2023, the Investor Class of the Hennessy Cornerstone Growth Fund returned 2.54%, outperforming the Russell 2000® Index (the Fund’s primary benchmark), which returned -8.56%, and underperforming the S&P 500® Index, which returned 10.14%, for the same period.
The Fund’s outperformance relative to its primary benchmark resulted primarily from stock selection within the Information Technology, Industrials, and Consumer Discretionary sectors. The largest
contributors to performance within each of these sectors during the period were Super Micro Computer, Inc., Sterling Infrastructure, Inc., and Modine Manufacturing Co. Offsetting these gains were losses in holdings in the Energy, Health Care, and
Real Estate sectors. The largest detractors from performance within each of these sectors were Weatherford International PLC, Tenet Healthcare Corporation, and Service Properties Trust.
The Fund continues to own all the companies mentioned except for Tenet Healthcare.
Portfolio Strategy:
The Fund utilizes a formula-based approach designed to result in a portfolio of attractively valued, growing companies whose stock prices are exhibiting strong price momentum. In essence, the strategy seeks to combine
elements of both value and momentum investing by selecting 50 stocks that have relatively low price-to-sales ratios, have generated increased earnings over the past year, and have positive stock price appreciation over the past three-month,
six-month, and one-year periods.
Investment Commentary:
Notwithstanding a rebound in equity prices over the last twelve months, we believe that the outlook for U.S. stocks remains positive. We continue to believe that equities are attractive from a valuation standpoint, even in
the face of an expected slowdown in economic activity. While the Federal Reserve has raised interest rates several times throughout the last year, we believe that the prospect of slower economic growth and lower inflation numbers could prompt the
Federal Reserve to put any further rate hikes on hold. With the unemployment rate near record lows, high levels of cash on the balance sheets of U.S. companies, and the prospect of a more dovish Federal Reserve in 2024, we remain bullish on equities
long-term.
Sectors where the Fund currently maintains significant overweight positions include Energy, Industrials, and Materials. Representative holdings within the Energy sector include PBF Energy, Inc. (Class A),
Marathon Petroleum Corporation, and Oceaneering International Inc. Industrials sector exposure includes Sterling Infrastructure Inc., Emcor
|
HENNESSY FUNDS
|
1-800-966-4354
|
7
Group, Inc., and Clean Harbors, Inc. Materials sector exposure includes Alpha Metallurgical Resources, Inc., Carpenter Technology Corporation, Reliance Steel & Aluminum Company. Given the continued strength in
employment trends and average hourly earnings, we would expect consumer spending and the economy to hold steady. We believe that the Fund is well positioned given the potential for moderately slower economic growth.
_______________
Opinions expressed are those of the Portfolio Managers as of the date written and are subject to change, are not guaranteed, and should not be considered investment advice or an indication of trading intent.
The Fund invests in small-capitalization and medium-capitalization companies, which may have limited liquidity and greater price volatility than larger companies. Investments in foreign securities may
involve political, economic, and currency risks, greater volatility, and differences in accounting methods. Funds concentrated in one or more industry sectors may be subject to a higher degree of market risk. The Fund’s formula-based strategy may
cause the Fund to buy or sell securities at times when it may not be advantageous. Please see the Fund’s prospectus for a more complete discussion of these and other risks.
References to specific securities should not be considered a recommendation to buy or sell any security. Fund holdings and sector allocations are subject to change. Please refer to the Schedule of Investments included in
this report for additional portfolio information.
|
WWW.HENNESSYFUNDS.COM
|
8
|
PERFORMANCE OVERVIEW/SCHEDULE OF INVESTMENTS
|
Financial Statements
|
Schedule of Investments as of October 31, 2023
|
HENNESSY CORNERSTONE GROWTH FUND
(% of Net Assets)
|
TOP TEN HOLDINGS (EXCLUDING MONEY MARKET FUNDS)
|
% NET ASSETS
|
|
Super Micro Computer, Inc.
|
4.60%
|
|
Sterling Infrastructure, Inc.
|
3.42%
|
|
Modine Manufacturing Co.
|
3.01%
|
|
Jabil, Inc.
|
2.81%
|
|
Weatherford International PLC
|
2.72%
|
|
Carpenter Technology Corp.
|
2.54%
|
|
Alpha Metallurgical Resources, Inc.
|
2.42%
|
|
Comfort Systems USA, Inc.
|
2.40%
|
|
EMCOR Group, Inc.
|
2.39%
|
|
Green Brick Partners, Inc.
|
2.28%
|
Note: For presentation purposes, the Fund has grouped some of the industry categories. For purposes of categorizing securities for compliance with Section 8(b)(1) of the Investment Company Act of 1940, as amended, the Fund
uses more specific industry classifications.
The Global Industry Classification Standard (GICS®) was developed by and is the exclusive property and a service mark of MSCI, Inc. and
Standard & Poor’s Financial Services LLC. It has been licensed for use by the Hennessy Funds.
|
HENNESSY FUNDS
|
1-800-966-4354
|
9
|
COMMON STOCKS – 95.93%
|
Number
|
% of
|
||||||||||
|
|
of Shares
|
Value
|
Net Assets
|
|||||||||
|
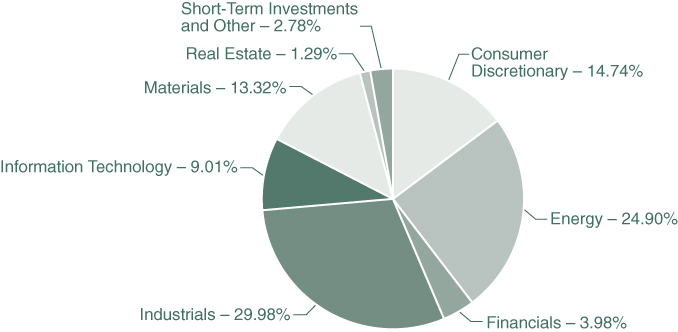
Consumer Discretionary – 14.74%
|
||||||||||||
|
Academy Sports & Outdoors, Inc.
|
51,300
|
$
|
2,300,292
|
1.41
|
%
|
|||||||
|
BorgWarner, Inc.
|
64,000
|
2,361,600
|
1.44
|
%
|
||||||||
|
Dillard’s, Inc., Class A
|
9,200
|
2,856,140
|
1.75
|
%
|
||||||||
|
Green Brick Partners, Inc. (a)
|
96,300
|
3,726,810
|
2.28
|
%
|
||||||||
|
Modine Manufacturing Co. (a)
|
125,300
|
4,949,350
|
3.01
|
%
|
||||||||
|
Oxford Industries, Inc.
|
27,800
|
2,346,320
|
1.43
|
%
|
||||||||
|
Penske Automotive Group, Inc.
|
21,700
|
3,104,836
|
1.90
|
%
|
||||||||
|
Phinia, Inc.
|
12,800
|
331,264
|
0.20
|
%
|
||||||||
|
Visteon Corp. (a)
|
18,700
|
2,152,931
|
1.32
|
%
|
||||||||
|
|
24,129,543
|
14.74
|
%
|
|||||||||
|
|
||||||||||||
|
Energy – 24.90%
|
||||||||||||
|
CVR Energy, Inc.
|
99,300
|
3,252,075
|
1.99
|
%
|
||||||||
|
Exxon Mobil Corp.
|
28,600
|
3,027,310
|
1.85
|
%
|
||||||||
|
Marathon Petroleum Corp.
|
24,200
|
3,660,250
|
2.23
|
%
|
||||||||
|
Oceaneering International, Inc. (a)
|
153,200
|
3,368,868
|
2.06
|
%
|
||||||||
|
Oil States International, Inc. (a)
|
337,300
|
2,448,798
|
1.50
|
%
|
||||||||
|
Par Pacific Holdings, Inc. (a)
|
111,300
|
3,652,866
|
2.22
|
%
|
||||||||
|
PBF Energy, Inc., Class A
|
69,800
|
3,317,594
|
2.03
|
%
|
||||||||
|
Teekay Corp. (a)
|
513,700
|
3,611,311
|
2.21
|
%
|
||||||||
|
Tsakos Energy Navigation Ltd.
|
132,400
|
2,916,772
|
1.78
|
%
|
||||||||
|
Valero Energy Corp.
|
23,400
|
2,971,800
|
1.82
|
%
|
||||||||
|
Vertex Energy, Inc. (a)
|
322,100
|
1,388,251
|
0.85
|
%
|
||||||||
|
Weatherford International PLC (a)
|
47,900
|
4,459,011
|
2.72
|
%
|
||||||||
|
YPF SA – ADR (a)
|
270,500
|
2,686,065
|
1.64
|
%
|
||||||||
|
|
40,760,971
|
24.90
|
%
|
|||||||||
|
|
||||||||||||
|
Financials – 3.98%
|
||||||||||||
|
StoneX Group, Inc. (a)
|
30,500
|
2,907,260
|
1.78
|
%
|
||||||||
|
Unum Group
|
73,600
|
3,599,040
|
2.20
|
%
|
||||||||
|
|
6,506,300
|
3.98
|
%
|
|||||||||
|
|
||||||||||||
|
Industrials – 29.98%
|
||||||||||||
|
Applied Industrial Technologies, Inc.
|
22,400
|
3,438,624
|
2.10
|
%
|
||||||||
|
CECO Environmental Corp. (a)
|
204,800
|
3,313,664
|
2.02
|
%
|
||||||||
|
Clean Harbors, Inc. (a)
|
22,700
|
3,488,309
|
2.13
|
%
|
||||||||
|
Comfort Systems USA, Inc.
|
21,500
|
3,909,775
|
2.40
|
%
|
||||||||
The accompanying notes are an integral part of these financial statements.
|
WWW.HENNESSYFUNDS.COM
|
10
|
SCHEDULE OF INVESTMENTS
|
|
COMMON STOCKS
|
Number
|
% of
|
||||||||||
|
|
of Shares
|
Value
|
Net Assets
|
|||||||||
|
Industrials (Continued)
|
||||||||||||
|
EMCOR Group, Inc.
|
18,900
|
$
|
3,905,685
|
2.39
|
%
|
|||||||
|
Encore Wire Corp.
|
16,400
|
2,932,812
|
1.79
|
%
|
||||||||
|
Fluor Corp. (a)
|
89,500
|
2,979,455
|
1.82
|
%
|
||||||||
|
Granite Construction, Inc.
|
75,000
|
3,036,000
|
1.85
|
%
|
||||||||
|
Insperity, Inc.
|
26,000
|
2,751,840
|
1.68
|
%
|
||||||||
|
Sterling Infrastructure, Inc. (a)
|
76,800
|
5,594,880
|
3.42
|
%
|
||||||||
|
Terex Corp.
|
54,000
|
2,473,200
|
1.51
|
%
|
||||||||
|
The Timken Co.
|
36,100
|
2,495,232
|
1.52
|
%
|
||||||||
|
Titan Machinery, Inc. (a)
|
75,100
|
1,865,484
|
1.14
|
%
|
||||||||
|
United Airlines Holdings, Inc. (a)
|
58,900
|
2,062,089
|
1.26
|
%
|
||||||||
|
Wabash National Corp.
|
117,500
|
2,431,075
|
1.49
|
%
|
||||||||
|
WESCO International, Inc.
|
18,700
|
2,397,340
|
1.46
|
%
|
||||||||
|
|
49,075,464
|
29.98
|
%
|
|||||||||
|
Information Technology – 9.01%
|
||||||||||||
|
Belden, Inc.
|
37,000
|
2,623,300
|
1.60
|
%
|
||||||||
|
Jabil, Inc.
|
37,500
|
4,605,000
|
2.81
|
%
|
||||||||
|
Super Micro Computer, Inc. (a)
|
31,400
|
7,519,358
|
4.60
|
%
|
||||||||
|
|
14,747,658
|
9.01
|
%
|
|||||||||
|
Materials – 13.32%
|
||||||||||||
|
Alpha Metallurgical Resources, Inc.
|
18,000
|
3,959,280
|
2.42
|
%
|
||||||||
|
ATI, Inc. (a)
|
77,200
|
2,915,844
|
1.78
|
%
|
||||||||
|
Carpenter Technology Corp.
|
66,300
|
4,158,336
|
2.54
|
%
|
||||||||
|
Materion Corp.
|
28,400
|
2,754,232
|
1.68
|
%
|
||||||||
|
O-I Glass, Inc. (a)
|
141,900
|
2,192,355
|
1.34
|
%
|
||||||||
|
Reliance Steel & Aluminum Co.
|
12,600
|
3,205,188
|
1.96
|
%
|
||||||||
|
Steel Dynamics, Inc.
|
24,500
|
2,609,495
|
1.60
|
%
|
||||||||
|
|
21,794,730
|
13.32
|
%
|
|||||||||
|
Total Common Stocks
|
||||||||||||
|
(Cost $138,088,146)
|
157,014,666
|
95.93
|
%
|
|||||||||
|
|
||||||||||||
|
REITS – 1.29%
|
||||||||||||
|
Real Estate – 1.29%
|
||||||||||||
|
Service Properties Trust
|
290,900
|
2,109,025
|
1.29
|
%
|
||||||||
|
|
||||||||||||
|
Total REITS
|
||||||||||||
|
(Cost $2,733,439)
|
2,109,025
|
1.29
|
%
|
|||||||||
The accompanying notes are an integral part of these financial statements.
|
HENNESSY FUNDS
|
1-800-966-4354
|
11
|
SHORT-TERM INVESTMENTS – 3.04%
|
Number
|
% of
|
||||||||||
|
|
of Shares
|
Value
|
Net Assets
|
|||||||||
|
Money Market Funds – 3.04%
|
||||||||||||
|
First American Treasury Obligations Fund – Class X, 5.275% (b)
|
4,978,236
|
$
|
4,978,236
|
3.04
|
%
|
|||||||
|
|
||||||||||||
|
Total Short-Term Investments
|
||||||||||||
|
(Cost $4,978,236)
|
4,978,236
|
3.04
|
%
|
|||||||||
|
|
||||||||||||
|
Total Investments
|
||||||||||||
|
(Cost $145,799,821) – 100.26%
|
164,101,927
|
100.26
|
%
|
|||||||||
|
Liabilities in Excess of Other Assets – (0.26)%
|
(426,419
|
)
|
(0.26
|
)%
|
||||||||
|
|
||||||||||||
|
TOTAL NET ASSETS – 100.00%
|
$
|
163,675,508
|
100.00
|
%
|
||||||||
Percentages are stated as a percent of net assets.
ADR — American Depositary Receipt
PLC — Public Limited Company
REIT — Real Estate Investment Trust
|
(a)
|
Non-income producing security.
|
|
(b)
|
The rate listed is the fund’s seven-day yield as of October 31, 2023.
|
Summary of Fair Value Exposure as of October 31, 2023
The following is a summary of the inputs used to value the Fund’s net assets as of October 31, 2023 (see Note 3 in the accompanying Notes to the Financial Statements):
|
Common Stocks
|
Level 1
|
Level 2
|
Level 3
|
Total
|
||||||||||||
|
Consumer Discretionary
|
$
|
24,129,543
|
$
|
—
|
$
|
—
|
$
|
24,129,543
|
||||||||
|
Energy
|
40,760,971
|
—
|
—
|
40,760,971
|
||||||||||||
|
Financials
|
6,506,300
|
—
|
—
|
6,506,300
|
||||||||||||
|
Industrials
|
49,075,464
|
—
|
—
|
49,075,464
|
||||||||||||
|
Information Technology
|
14,747,658
|
—
|
—
|
14,747,658
|
||||||||||||
|
Materials
|
21,794,730
|
—
|
—
|
21,794,730
|
||||||||||||
|
Total Common Stocks
|
$
|
157,014,666
|
$
|
—
|
$
|
—
|
$
|
157,014,666
|
||||||||
|
REITS
|
||||||||||||||||
|
Real Estate
|
$
|
2,109,025
|
$
|
—
|
$
|
—
|
$
|
2,109,025
|
||||||||
|
Total REITS
|
$
|
2,109,025
|
$
|
—
|
$
|
—
|
$
|
2,109,025
|
||||||||
|
Short-Term Investments
|
||||||||||||||||
|
Money Market Funds
|
$
|
4,978,236
|
$
|
—
|
$
|
—
|
$
|
4,978,236
|
||||||||
|
Total Short-Term Investments
|
$
|
4,978,236
|
$
|
—
|
$
|
—
|
$
|
4,978,236
|
||||||||
|
Total Investments
|
$
|
164,101,927
|
$
|
—
|
$
|
—
|
$
|
164,101,927
|
||||||||
The accompanying notes are an integral part of these financial statements.
|
WWW.HENNESSYFUNDS.COM
|
12
|
SCHEDULE OF INVESTMENTS/STATEMENT OF ASSETS AND LIABILITIES
|
Financial Statements
|
Statement of Assets and Liabilities as of October 31, 2023
|
|
ASSETS:
|
||||
|
Investments in securities, at value (cost $145,799,821)
|
$
|
164,101,927
|
||
|
Dividends and interest receivable
|
122,312
|
|||
|
Receivable for fund shares sold
|
30,497
|
|||
|
Prepaid expenses and other assets
|
25,934
|
|||
|
Total assets
|
164,280,670
|
|||
|
LIABILITIES:
|
||||
|
Payable for fund shares redeemed
|
392,133
|
|||
|
Payable to advisor
|
104,921
|
|||
|
Payable to administrator
|
27,909
|
|||
|
Payable to auditor
|
22,746
|
|||
|
Accrued distribution fees
|
20,884
|
|||
|
Accrued service fees
|
12,297
|
|||
|
Accrued trustees fees
|
6,841
|
|||
|
Accrued expenses and other payables
|
17,431
|
|||
|
Total liabilities
|
605,162
|
|||
|
NET ASSETS
|
$
|
163,675,508
|
||
|
NET ASSETS CONSISTS OF:
|
||||
|
Capital stock
|
$
|
150,311,735
|
||
|
Total distributable earnings
|
13,363,773
|
|||
|
Total net assets
|
$
|
163,675,508
|
||
|
NET ASSETS:
|
||||
|
Investor Class
|
||||
|
Shares authorized (no par value)
|
Unlimited
|
|||
|
Net assets applicable to outstanding shares
|
$
|
141,356,398
|
||
|
Shares issued and outstanding
|
5,935,203
|
|||
|
Net asset value, offering price, and redemption price per share
|
$
|
23.82
|
||
|
Institutional Class
|
||||
|
Shares authorized (no par value)
|
Unlimited
|
|||
|
Net assets applicable to outstanding shares
|
$
|
22,319,110
|
||
|
Shares issued and outstanding
|
896,126
|
|||
|
Net asset value, offering price, and redemption price per share
|
$
|
24.91
|
||
The accompanying notes are an integral part of these financial statements.
|
HENNESSY FUNDS
|
1-800-966-4354
|
13
Financial Statements
|
Statement of Operations for the year ended October 31, 2023
|
|
INVESTMENT INCOME:
|
||||
|
Dividend income(1)
|
$
|
3,662,204
|
||
|
Interest income
|
123,946
|
|||
|
Total investment income
|
3,786,150
|
|||
|
EXPENSES:
|
||||
|
Investment advisory fees (See Note 5)
|
1,232,434
|
|||
|
Sub-transfer agent expenses – Investor Class (See Note 5)
|
218,709
|
|||
|
Sub-transfer agent expenses – Institutional Class (See Note 5)
|
15,731
|
|||
|
Distribution fees – Investor Class (See Note 5)
|
221,184
|
|||
|
Administration, accounting, custody, and transfer agent fees (See Note 5)
|
163,019
|
|||
|
Service fees – Investor Class (See Note 5)
|
147,456
|
|||
|
Federal and state registration fees
|
37,492
|
|||
|
Audit fees
|
22,747
|
|||
|
Compliance expense (See Note 5)
|
22,676
|
|||
|
Trustees’ fees and expenses
|
22,448
|
|||
|
Reports to shareholders
|
17,862
|
|||
|
Legal fees
|
4,214
|
|||
|
Interest expense (See Note 7)
|
1,652
|
|||
|
Other expenses
|
31,693
|
|||
|
Total expenses
|
2,159,317
|
|||
|
NET INVESTMENT INCOME
|
$
|
1,626,833
|
||
|
REALIZED AND UNREALIZED GAINS (LOSSES):
|
||||
|
Net realized loss on investments
|
$
|
(4,138,289
|
)
|
|
|
Net change in unrealized appreciation/depreciation on investments
|
5,434,239
|
|||
|
Net gain on investments
|
1,295,950
|
|||
|
NET INCREASE IN NET ASSETS RESULTING FROM OPERATIONS
|
$
|
2,922,783
|
||
|
(1)
|
Net of foreign taxes withheld and issuance fees of $102,901.
|
The accompanying notes are an integral part of these financial statements.
|
WWW.HENNESSYFUNDS.COM
|
14
|
STATEMENT OF OPERATIONS/STATEMENTS OF CHANGES IN NET ASSETS
|
Financial Statements
|
Statements of Changes in Net Assets
|
|
Year Ended
|
Year Ended
|
|||||||
|
October 31, 2023
|
October 31, 2022
|
|||||||
|
OPERATIONS:
|
||||||||
|
Net investment income
|
$
|
1,626,833
|
$
|
1,821,004
|
||||
|
Net realized gain (loss) on investments
|
(4,138,289
|
)
|
4,008,127
|
|||||
|
Net change in unrealized
|
||||||||
|
appreciation/depreciation on investments
|
5,434,239
|
(4,443,482
|
)
|
|||||
|
Net increase in net assets resulting from operations
|
2,922,783
|
1,385,649
|
||||||
|
DISTRIBUTIONS TO SHAREHOLDERS:
|
||||||||
|
Distributable earnings – Investor Class
|
(5,391,788
|
)
|
(33,524,164
|
)
|
||||
|
Distributable earnings – Institutional Class
|
(694,551
|
)
|
(3,505,908
|
)
|
||||
|
Total distributions
|
(6,086,339
|
)
|
(37,030,072
|
)
|
||||
|
CAPITAL SHARE TRANSACTIONS:
|
||||||||
|
Proceeds from shares subscribed – Investor Class
|
11,362,449
|
21,825,715
|
||||||
|
Proceeds from shares subscribed – Institutional Class
|
9,926,784
|
21,704,478
|
||||||
|
Dividends reinvested – Investor Class
|
5,220,465
|
32,429,645
|
||||||
|
Dividends reinvested – Institutional Class
|
627,346
|
3,066,398
|
||||||
|
Cost of shares redeemed – Investor Class
|
(26,505,700
|
)
|
(21,756,715
|
)
|
||||
|
Cost of shares redeemed – Institutional Class
|
(6,562,918
|
)
|
(16,595,253
|
)
|
||||
|
Net increase (decrease) in net assets
|
||||||||
|
derived from capital share transactions
|
(5,931,574
|
)
|
40,674,268
|
|||||
|
TOTAL INCREASE (DECREASE) IN NET ASSETS
|
(9,095,130
|
)
|
5,029,845
|
|||||
|
NET ASSETS:
|
||||||||
|
Beginning of year
|
172,770,638
|
167,740,793
|
||||||
|
End of year
|
$
|
163,675,508
|
$
|
172,770,638
|
||||
|
CHANGES IN SHARES OUTSTANDING:
|
||||||||
|
Shares sold – Investor Class
|
465,038
|
919,385
|
||||||
|
Shares sold – Institutional Class
|
400,968
|
849,055
|
||||||
|
Shares issued to holders as reinvestment
|
||||||||
|
of dividends – Investor Class
|
227,645
|
1,319,351
|
||||||
|
Shares issued to holders as reinvestment
|
||||||||
|
of dividends – Institutional Class
|
26,210
|
119,641
|
||||||
|
Shares redeemed – Investor Class
|
(1,164,869
|
)
|
(925,080
|
)
|
||||
|
Shares redeemed – Institutional Class
|
(266,969
|
)
|
(740,429
|
)
|
||||
|
Net increase (decrease) in shares outstanding
|
(311,977
|
)
|
1,541,923
|
|||||
The accompanying notes are an integral part of these financial statements.
|
HENNESSY FUNDS
|
1-800-966-4354
|
15
Financial Statements
|
Financial Highlights
|
For an Investor Class share outstanding throughout each year
PER SHARE DATA:
Net asset value, beginning of year
Income from investment operations:
Net investment income (loss)(1)
Net realized and unrealized gains (losses) on investments
Total from investment operations
Less distributions:
Dividends from net investment income
Dividends from net realized gains
Total distributions
Net asset value, end of year
TOTAL RETURN
SUPPLEMENTAL DATA AND RATIOS:
Net assets, end of year (millions)
Ratio of expenses to average net assets
Ratio of net investment income (loss) to average net assets
Portfolio turnover rate(2)
|
(1)
|
Calculated using the average shares outstanding method.
|
|
(2)
|
Calculated on the basis of the Fund as a whole.
|
The accompanying notes are an integral part of these financial statements.
|
WWW.HENNESSYFUNDS.COM
|
16
|
FINANCIAL HIGHLIGHTS — INVESTOR CLASS
|
|
Year Ended October 31,
|
||||||||||||||||||
|
2023
|
2022
|
2021
|
2020
|
2019
|
||||||||||||||
|
$
|
24.07
|
$
|
29.83
|
$
|
19.91
|
$
|
19.15
|
$
|
22.17
|
|||||||||
|
0.22
|
0.26
|
(0.14
|
)
|
(0.08
|
)
|
(0.01
|
)
|
|||||||||||
|
0.35
|
0.62
|
10.06
|
0.84
|
(1.19
|
)
|
|||||||||||||
|
0.57
|
0.88
|
9.92
|
0.76
|
(1.20
|
)
|
|||||||||||||
|
(0.27
|
)
|
—
|
—
|
—
|
—
|
|||||||||||||
|
(0.55
|
)
|
(6.64
|
)
|
—
|
—
|
(1.82
|
)
|
|||||||||||
|
(0.82
|
)
|
(6.64
|
)
|
—
|
—
|
(1.82
|
)
|
|||||||||||
|
$
|
23.82
|
$
|
24.07
|
$
|
29.83
|
$
|
19.91
|
$
|
19.15
|
|||||||||
|
2.54
|
%
|
2.51
|
%
|
49.82
|
%
|
3.97
|
%
|
-5.19
|
%
|
|||||||||
|
$
|
141.36
|
$
|
154.25
|
$
|
151.96
|
$
|
110.96
|
$
|
125.10
|
|||||||||
|
1.33
|
%
|
1.33
|
%
|
1.34
|
%
|
1.36
|
%
|
1.34
|
%
|
|||||||||
|
0.95
|
%
|
1.10
|
%
|
(0.51
|
)%
|
(0.45
|
)%
|
(0.07
|
)%
|
|||||||||
|
90
|
%
|
102
|
%
|
98
|
%
|
98
|
%
|
95
|
%
|
|||||||||
The accompanying notes are an integral part of these financial statements.
|
HENNESSY FUNDS
|
1-800-966-4354
|
17
Financial Statements
|
Financial Highlights
|
For an Institutional Class share outstanding throughout each year
PER SHARE DATA:
Net asset value, beginning of year
Income from investment operations:
Net investment income (loss)(1)
Net realized and unrealized gains (losses) on investments
Total from investment operations
Less distributions:
Dividends from net investment income
Dividends from net realized gains
Total distributions
Net asset value, end of year
TOTAL RETURN
SUPPLEMENTAL DATA AND RATIOS:
Net assets, end of year (millions)
Ratio of expenses to average net assets
Ratio of net investment income (loss) to average net assets
Portfolio turnover rate(2)
|
(1)
|
Calculated using the average shares outstanding method.
|
|
(2)
|
Calculated on the basis of the Fund as a whole.
|
The accompanying notes are an integral part of these financial statements.
|
WWW.HENNESSYFUNDS.COM
|
18
|
FINANCIAL HIGHLIGHTS — INSTITUTIONAL CLASS
|
|
Year Ended October 31,
|
||||||||||||||||||
|
2023
|
2022
|
2021
|
2020
|
2019
|
||||||||||||||
|
$
|
25.17
|
$
|
31.09
|
$
|
20.68
|
$
|
19.83
|
$
|
22.88
|
|||||||||
|
0.29
|
0.34
|
(0.05
|
)
|
(0.03
|
)
|
0.05
|
||||||||||||
|
0.38
|
0.67
|
10.46
|
0.88
|
(1.22
|
)
|
|||||||||||||
|
0.67
|
1.01
|
10.41
|
0.85
|
(1.17
|
)
|
|||||||||||||
|
(0.35
|
)
|
—
|
—
|
—
|
—
|
|||||||||||||
|
(0.58
|
)
|
(6.93
|
)
|
—
|
—
|
(1.88
|
)
|
|||||||||||
|
(0.93
|
)
|
(6.93
|
)
|
—
|
—
|
(1.88
|
)
|
|||||||||||
|
$
|
24.91
|
$
|
25.17
|
$
|
31.09
|
$
|
20.68
|
$
|
19.83
|
|||||||||
|
2.85
|
%
|
2.84
|
%
|
50.34
|
%
|
4.29
|
%
|
-4.86
|
%
|
|||||||||
|
$
|
22.32
|
$
|
18.52
|
$
|
15.78
|
$
|
11.65
|
$
|
14.62
|
|||||||||
|
1.02
|
%
|
1.01
|
%
|
1.01
|
%
|
1.05
|
%
|
1.01
|
%
|
|||||||||
|
1.18
|
%
|
1.38
|
%
|
(0.17
|
)%
|
(0.14
|
)%
|
0.27
|
%
|
|||||||||
|
90
|
%
|
102
|
%
|
98
|
%
|
98
|
%
|
95
|
%
|
|||||||||
The accompanying notes are an integral part of these financial statements.
|
HENNESSY FUNDS
|
1-800-966-4354
|
19
Financial Statements
|
Notes to the Financial Statements October 31, 2023
|
1). ORGANIZATION
The Hennessy Cornerstone Growth Fund (the “Fund”) is a series of Hennessy Funds Trust (the “Trust”), which was organized as a Delaware statutory trust on September 17, 1992. The Fund is an open-end management investment
company registered under the Investment Company Act of 1940, as amended. The investment objective of the Fund is long-term growth of capital. The Fund is a diversified fund.
The Fund offers Investor Class and Institutional Class shares. Each class of shares differs principally in its respective 12b-1 distribution and service, shareholder servicing, and sub-transfer agent
expenses. There are no sales charges. Each class has identical rights to earnings, assets, and voting privileges, except for class-specific expenses and exclusive rights to vote on matters affecting only one class.
As an investment company, the Fund follows the investment company accounting and reporting guidance of the Financial Accounting Standards Board (the “FASB”) Accounting Standard Codification Topic 946
“Financial Services—Investment Companies.”
2). SIGNIFICANT ACCOUNTING POLICIES
The following is a summary of significant accounting policies consistently followed by the Fund in the preparation of the financial statements. These policies conform to U.S. generally accepted accounting principles
(“GAAP”).
|
a).
|
Securities Valuation – All investments in securities are valued in accordance with the Fund’s valuation policies and procedures, as described in Note 3.
|
|
b).
|
Federal Income Taxes – The Fund has elected to be taxed as a regulated investment company and intends to distribute substantially all of its taxable income to its shareholders and otherwise comply with the
provisions of the Internal Revenue Code of 1986, as amended, applicable to regulated investment companies. As a result, the Fund has made no provision for federal income taxes or excise taxes. Net investment income/loss and realized
gains/losses for federal income tax purposes may differ from those reported in the financial statements because of temporary book-basis and tax-basis differences. Temporary differences are primarily the result of the treatment of partnership
income and wash sales for tax reporting purposes. The Fund recognizes interest and penalties related to income tax benefits, if any, in the Statement of Operations as an income tax expense. Distributions from net realized gains for book
purposes may include short-term capital gains, which are included as ordinary income to shareholders for tax purposes. The Fund may utilize equalization accounting for tax purposes and designate earnings and profits, including net realized
gains distributed to shareholders on redemption of shares, as part of the dividends paid deduction for income tax purposes.
|
|
Due to inherent differences in the recognition of income, expenses, and realized gains/losses under GAAP and federal income tax regulations, permanent differences between book and tax basis
for reporting are identified and appropriately reclassified in the Statement of Assets and Liabilities, as needed. The adjustments for fiscal year 2023 are as follows:
|
|
Total
|
|||
|
Distributable
|
|||
|
Earnings
|
Capital Stock
|
||
|
$2,630
|
$(2,630)
|
|
WWW.HENNESSYFUNDS.COM
|
20
|
NOTES TO THE FINANCIAL STATEMENTS
|
|
c).
|
Accounting for Uncertainty in Income Taxes – The Fund has accounting policies regarding recognition and measurement of tax positions taken or expected to be taken on a tax return. The tax returns of the Fund for the
prior three fiscal years are open for examination. The Fund has reviewed all open tax years in major tax jurisdictions and concluded that there is no impact on the Fund’s net assets and no tax liability resulting from unrecognized tax
benefits relating to uncertain income tax positions taken or expected to be taken on a tax return. The Fund’s major tax jurisdictions are U.S. federal and Delaware.
|
|
d).
|
Income and Expenses – Dividend income is recognized on the ex-dividend date or as soon as information is available to the Fund. Interest income, which includes the amortization of premium and accretion of discount,
is recognized on an accrual basis. Market discounts, original issue discounts, and market premiums on debt securities are accreted or amortized to interest income over the life of a security with a corresponding increase or decrease, as
applicable, in the cost basis of such security using the yield-to-maturity method or, where applicable, the first call date of the security. Other non-cash dividends are recognized as investment income at the fair value of the property
received. The Fund is charged for those expenses that are directly attributable to its portfolio, such as advisory, administration, and certain shareholder service fees. Income, expenses (other than expenses attributable to a specific class),
and realized and unrealized gains/losses on investments are allocated to each class of shares based on such class’s net assets.
|
|
e).
|
Distributions to Shareholders – Dividends from net investment income for the Fund, if any, are declared and paid annually, usually in December. Distributions of net realized capital gains, if any, are declared and
paid annually, usually in December.
|
|
f).
|
Security Transactions – Investment and shareholder transactions are recorded on the trade date. The Fund determines the realized gain/loss from an investment transaction by comparing the original cost of the
security lot sold with the net sale proceeds. Discounts and premiums on securities purchased are accreted or amortized, respectively, over the life of each such security.
|
|
g).
|
Use of Estimates – Preparing financial statements in accordance with GAAP requires management to make estimates and assumptions that affect the reported amounts of assets and liabilities and disclosure of contingent
assets and liabilities at the date of the financial statements, as well as the reported change in net assets during the reporting period. Actual results could differ from those estimates.
|
|
h).
|
Share Valuation – The net asset value (“NAV”) per share of the Fund is calculated by dividing (i) the total value of the securities held by the Fund, plus cash and other assets, minus all liabilities (including
estimated accrued expenses) by (ii) the total number of Fund shares outstanding, rounded to the nearest $0.01. Fund shares are not priced on days the New York Stock Exchange is closed for trading. The offering and redemption price per share
for the Fund is equal to the Fund’s NAV per share.
|
|
i).
|
REIT Equity Securities – Distributions received from real estate investment trusts (“REITs”) may be classified as dividends, capital gains, or return of capital. Investments in REITs may require the Fund to accrue
and distribute income not yet received. To generate sufficient cash to make any required distributions, the Fund may be required to sell securities in its portfolio (including when it is not advantageous to do so) that it otherwise would have
continued to hold. At other times, investments in a REIT may result in the Fund’s receipt of cash in excess of the REIT’s earnings. If the Fund distributes these amounts, these distributions could constitute a return of capital to Fund
shareholders for U.S. federal income tax
|
|
HENNESSY FUNDS
|
1-800-966-4354
|
21
|
purposes. Dividends received by the Fund from a REIT generally do not constitute qualified dividend income and do not qualify for the dividends-received deduction.
|
|
|
j).
|
Illiquid Securities – Pursuant to Rule 22e-4 under the 1940 Act, the Fund has adopted a Liquidity Risk Management Program (the “Liquidity Program”). The Liquidity Program requires, among other things, that the Fund
limit its illiquid investments to no more than 15% of its net assets. An illiquid investment is any investment that the Fund reasonably expects cannot be sold or disposed of by the Fund in current market conditions in seven calendar days or
less without the sale or disposition significantly changing the market value of the investment.
|
|
k).
|
Recent Accounting Pronouncements and Regulatory Updates – In October 2022, the Securities and Exchange Commission (“SEC”) adopted a final rule relating to Tailored Shareholder Reports for Mutual Funds and
Exchange-Traded Funds (ETFs); Fee Information in Investment Company Advertisements. The rule and form amendments will require mutual funds and ETFs to transmit concise and visually engaging shareholder reports that highlight key information.
The amendments also will require that funds tag information in a structured data format. In addition, the rule amendments will require that certain more in-depth information be made available online and available for delivery free of charge
to investors on request. The amendments became effective January 24, 2023. There is an 18-month transition period after the effective date of the amendment.
|
|
In June 2022, the FASB issued Accounting Standards Update (“ASU”) 2022-03, Fair Value Measurement (Topic 820): Fair Value Measurement of Equity Securities Subject to Contractual Sale
Restrictions. The ASU clarifies that a contractual restriction on the sale of an equity security is not considered part of the unit of account of the equity security and, therefore, is not considered in measuring the fair value. The
amendments also require additional disclosures related to equity securities subject to contractual sale restrictions. The ASU is effective for fiscal years beginning after December 15, 2023, and interim periods within those fiscal years.
|
3). SECURITIES VALUATION
The Fund follows its valuation policies and procedures in determining its NAV and, in preparing these financial statements, the fair value accounting standards that establish an authoritative definition of fair value and
set out a hierarchy for measuring fair value. These standards require additional disclosures about the various inputs and valuation techniques used to develop the measurements of fair value and a discussion of changes in valuation techniques and
related inputs during the period. These inputs are summarized in the three broad levels listed below:
|
Level 1 –
|
Unadjusted, quoted prices in active markets for identical instruments that the Fund has the ability to access at the date of measurement.
|
|
|
Level 2 –
|
Other significant observable inputs other than quoted prices included in Level 1 (including, but not limited to, quoted prices in active markets for similar instruments, quoted prices in markets that are not active
for identical or similar instruments, and model-derived valuations in which all significant inputs and significant value drivers are observable in active markets, such as interest rates, prepayment speeds, credit risk curves, default rates,
and similar data).
|
|
|
Level 3 –
|
Significant unobservable inputs (including the Fund’s own assumptions about what market participants would use to price the asset or liability based on the best available information) when observable inputs are
unavailable.
|
|
WWW.HENNESSYFUNDS.COM
|
22
|
NOTES TO THE FINANCIAL STATEMENTS
|
The following is a description of the valuation techniques applied to the Fund’s major categories of assets and liabilities on a recurring basis:
|
Equity Securities – Equity securities, including common stocks, preferred stocks, foreign-issued common stocks, exchange-traded funds, closed-end mutual funds, partnerships,
rights, and real estate investment trusts, that are traded on a securities exchange for which a last-quoted sales price is readily available generally are valued at the last sales price as reported by the primary exchange on which the
securities are listed. Securities listed on The Nasdaq Stock Market (“Nasdaq”) generally are valued at the Nasdaq Official Closing Price, which may differ from the last sales price reported. Securities traded on a securities exchange for
which a last-quoted sales price is not readily available generally are valued at the mean between the bid and ask prices. To the extent these securities are actively traded and valuation adjustments are not applied, they are classified in
Level 1 of the fair value hierarchy. Securities traded on foreign exchanges generally are not valued at the same time the Fund calculates its NAV because most foreign markets close well before such time. The earlier close of most foreign
markets gives rise to the possibility that significant events, including broad market moves, may have occurred in the interim. In certain circumstances, it may be determined that a foreign security needs to be fair valued because it appears
that the value of the security might have been materially affected by events occurring after the close of the market in which the security is principally traded, but before the time the Fund calculates its NAV, such as by a development that
affects an entire market or region (e.g., a weather-related event) or a potentially global development (e.g., a terrorist attack that may be expected to have an effect on investor expectations worldwide).
|
|
|
Registered Investment Companies – Investments in open-end registered investment companies, commonly referred to as mutual funds, generally are priced at the ending NAV
provided by the applicable mutual fund’s service agent and are classified in Level 1 of the fair value hierarchy.
|
|
|
Debt Securities – Debt securities, including corporate bonds, asset-backed securities, mortgage-backed securities, municipal bonds, U.S. Treasuries, and U.S. government
agency issues, are generally valued at market on the basis of valuations furnished by an independent pricing service that utilizes both dealer-supplied valuations and formula-based techniques. The pricing service may consider recently
executed transactions in securities of the issuer or comparable issuers, market price quotations (where observable), bond spreads, and fundamental data relating to the issuer. In addition, the model may incorporate observable market data,
such as reported sales of similar securities, broker quotes, yields, bids, offers, and reference data. Certain securities are valued primarily using dealer quotations. These securities are generally classified in Level 2 of the fair value
hierarchy.
|
|
|
Short-Term Securities – Short-term equity investments, including money market funds, are valued in the manner specified above for equity securities. Short-term debt
investments with an original term to maturity of 60 days or less are valued at amortized cost, which approximates fair market value. If the original term to maturity of a short-term debt investment exceeds 60 days, then the values as of the
61st day prior to maturity are amortized. Amortized cost is not used if its use would be inappropriate due to credit or other impairments of the issuer, in which case the security’s fair value would be determined as described below.
Short-term securities are generally classified in Level 1 or Level 2 of the fair value hierarchy depending on the inputs used and market activity levels for specific securities.
|
|
HENNESSY FUNDS
|
1-800-966-4354
|
23
If market quotations are not readily available or if a significant event has occurred that indicates the closing price of a security no longer represents the true value of that security, any security or
other asset will be valued at its fair value in accordance with Rule 2a-5 under the 1940 Act. The Board of Trustees of the Fund (the “Board”) has designated Hennessy Advisors, Inc. (the “Advisor”) as the Fund’s valuation designee to make all fair
value determinations with respect to the Fund’s portfolio investments under the Fund’s fair value pricing procedures, subject to the Board’s oversight. There are numerous criteria considered in determining a fair value of a security, such as the
trading volume of a security and markets, the values of other similar securities, and news events with direct bearing on a security or markets. Fair value pricing results in an estimated price for a security that reflects the amount the Fund might
reasonably expect to receive in a current sale. Depending on the relative significance of the valuation inputs, these securities may be classified in either Level 2 or Level 3 of the fair value hierarchy. The Advisor will regularly evaluate whether
the Fund’s fair value pricing procedures continue to be appropriate in light of the specific circumstances of the Fund and the quality of prices obtained through their application of such procedures.
The fair value of foreign securities may be determined with the assistance of a pricing service using correlations between the movement of prices of such securities and indices of domestic securities and
other appropriate indicators, such as closing market prices of relevant American Depositary Receipts or futures contracts. Using fair value pricing means that the Fund’s NAV reflects the affected portfolio securities’ values as determined by Advisor,
the Board’s valuation designee, pursuant to the Fund’s fair value pricing procedures, instead of being determined by the market. Using a fair value pricing methodology to price a foreign security may result in a value that is different from such
foreign security’s most recent closing price and from the value used by other investment companies to calculate their NAVs. Such securities are generally classified in Level 2 of the fair value hierarchy. Because the Fund may invest in foreign
securities, the value of the Fund’s portfolio securities may change on days when a shareholder is unable to purchase or redeem Fund shares.
The Fund has performed an analysis of all existing investments to determine the significance and character of all inputs to their fair value determinations. Various inputs are used to determine the value
of the Fund’s investments. The inputs or methodology used for valuing securities are not necessarily an indication of the risk associated with investing in those securities. Details related to the fair value hierarchy of the Fund’s securities as of
October 31, 2023, are included in the Schedule of Investments.
4). INVESTMENT TRANSACTIONS
Purchases and sales of investment securities (excluding government and short-term investments) for the Fund during fiscal year 2023 were $148,409,326 and $158,816,327, respectively.
There were no purchases or sales/maturities of long-term U.S. government securities for the Fund during fiscal year 2023.
5). INVESTMENT ADVISORY FEE AND OTHER TRANSACTIONS WITH AFFILIATES
The Advisor provides the Fund with investment advisory services under an Investment Advisory Agreement. The Advisor furnishes all investment advice, office space, and facilities and most of the personnel needed by the Fund.
As compensation for its services, the Advisor is entitled to a monthly fee from the Fund. The fee is based on the average daily net assets of the Fund at an annual rate of 0.74%. The net investment advisory fees expensed by the Fund during fiscal
year 2023 are included in the Statement of Operations.
|
WWW.HENNESSYFUNDS.COM
|
24
|
NOTES TO THE FINANCIAL STATEMENTS
|
The Board has approved a Shareholder Servicing Agreement for Investor Class shares of the Fund, which compensates the Advisor for the non-investment advisory services it provides to the Fund. The
Shareholder Servicing Agreement provides for a monthly fee paid to the Advisor at an annual rate of 0.10% of the average daily net assets of the Fund attributable to Investor Class shares. The shareholder service fees expensed by the Fund during
fiscal year 2023 are included in the Statement of Operations.
The Fund has adopted a plan pursuant to Rule 12b-1 under the Investment Company Act of 1940, as amended, that authorizes payments in connection with the distribution of Fund shares at an annual rate of up
to 0.25% of the Fund’s average daily net assets attributable to Investor Class shares. Even though the authorized rate is up to 0.25%, the Fund is currently only using up to 0.15% of its average daily net assets attributable to Investor Class shares
for such purpose. Amounts paid under the plan may be spent on any activities or expenses primarily intended to result in the sale of shares, including, but not limited to, advertising, shareholder account servicing, printing and mailing of
prospectuses to other than current shareholders, printing and mailing of sales literature, and compensation for sales and marketing activities or to financial institutions and others, such as dealers and distributors. The distribution fees expensed
by the Fund during fiscal year 2023 are included in the Statement of Operations.
The Fund has entered into agreements with various brokers, dealers, and financial intermediaries in connection with the sale of Fund shares. The agreements provide for periodic payments of sub-transfer
agent expenses by the Fund to the brokers, dealers, and financial intermediaries for providing certain shareholder maintenance services. These shareholder services include the pre-processing and quality control of new accounts, shareholder
correspondence, answering customer inquiries regarding account status, and facilitating shareholder telephone transactions. The sub-transfer agent fees expensed by the Fund during fiscal year 2023 are included in the Statement of Operations.
U.S. Bancorp Fund Services, LLC, d/b/a U.S. Bank Global Fund Services (“Fund Services”) provides the Fund with administrative, accounting, and transfer agent services. As administrator, Fund Services is
responsible for activities such as (i) preparing various federal and state regulatory filings, reports, and returns for the Fund, (ii) preparing reports and materials to be supplied to the Board, (iii) monitoring the activities of the Fund’s
custodian, transfer agent, and accountants, and (iv) coordinating the preparation and payment of the Fund’s expenses and reviewing the Fund’s expense accruals. U.S. Bank N.A., an affiliate of Fund Services, serves as the Fund’s custodian. The
servicing agreements between the Trust, Fund Services, and U.S. Bank N.A. contain a fee schedule that is inclusive of administrative, accounting, custody, and transfer agent fees. The administrative, accounting, custody, and transfer agent fees
expensed by the Fund during fiscal year 2023 are included in the Statement of Operations.
Quasar Distributors, LLC, a wholly owned broker-dealer subsidiary of Foreside Financial Group, LLC, acts as the Fund’s principal underwriter in a continuous public offering of Fund shares.
The officers of the Fund are affiliated with the Advisor. With the exception of the Chief Compliance Officer, such officers receive no compensation from the Fund for serving in their respective roles. The
Fund, along with the other funds in the Hennessy Funds family (collectively, the “Hennessy Funds”), makes reimbursement payments on an equal basis to the Advisor for a portion of the salary and benefits associated with the office of the Chief
Compliance Officer. The compliance fees expensed by the Fund during fiscal year 2023 for reimbursement payments to the Advisor are included in the Statement of Operations.
|
HENNESSY FUNDS
|
1-800-966-4354
|
25
6). GUARANTEES AND INDEMNIFICATIONS
Under the Hennessy Funds’ organizational documents, their officers and trustees are indemnified by the Hennessy Funds against certain liabilities arising out of the performance of their duties to the Hennessy Funds.
Additionally, in the normal course of business, the Hennessy Funds enter into contracts with service providers that contain general indemnification clauses. The Fund’s maximum exposure under these arrangements is unknown as this would involve future
claims that may be made against the Fund that have not yet occurred. Currently, the Fund expects the risk of loss to be remote.
7). LINE OF CREDIT
The Fund has an uncommitted line of credit with the other Hennessy Funds in the amount of the lesser of (i) $100,000,000 or (ii) 33.33% of each Hennessy Fund’s net assets, or 30% for the Hennessy Gas Utility Fund, the
Hennessy Japan Fund, and the Hennessy Japan Small Cap Fund and 10% for the Hennessy Balanced Fund. The line of credit is intended to provide any necessary short-term financing in connection with shareholder redemptions, subject to certain
restrictions. The credit facility is with the Hennessy Funds’ custodian bank, U.S. Bank N.A. Borrowings under this arrangement bear interest at the bank’s prime rate and are secured by all of the Fund’s assets (as to its own borrowings only). During
fiscal year 2023, the Fund had an outstanding average daily balance and a weighted average interest rate of $20,367 and 8.00%, respectively. The interest expensed by the Fund during fiscal year end 2023 is included in the Statement of Operations. The
maximum amount outstanding for the Fund during fiscal year 2023 was $2,137,000. As of October 31, 2023, the Fund did not have any borrowings outstanding under the line of credit.
8). FEDERAL TAX INFORMATION
As of October 31, 2023, the components of accumulated earnings (losses) for income tax purposes were as follows:
|
Investments
|
|||||
|
Cost of investments for tax purposes
|
$
|
146,542,218
|
|||
|
Gross tax unrealized appreciation
|
$
|
28,373,689
|
|||
|
Gross tax unrealized depreciation
|
(10,813,980
|
)
|
|||
|
Net tax unrealized appreciation/(depreciation)
|
$
|
17,559,709
|
|||
|
Undistributed ordinary income
|
$
|
462,915
|
|||
|
Undistributed long-term capital gains
|
—
|
||||
|
Total distributable earnings
|
$
|
462,915
|
|||
|
Other accumulated gain/(loss)
|
$
|
(4,658,851
|
)
|
||
|
Total accumulated gain/(loss)
|
$
|
13,363,773
|
|||
The difference between book-basis unrealized appreciation/depreciation and tax-basis unrealized appreciation/depreciation (as shown above) is attributable primarily to wash sales and partnership
adjustments.
As of October 31, 2023, the Fund had $1,907,296 in unlimited long-term and $2,751,555 in unlimited short-term capital loss carryforwards.
Capital losses sustained in or after fiscal year 2012 can be carried forward indefinitely, but any such loss retains the character of the original loss and must be utilized prior to any loss incurred
before fiscal year 2012. As a result of this ordering rule, capital loss carryforwards incurred prior to fiscal year 2012 may be more likely to expire unused. Capital losses sustained prior to fiscal year 2012 can be carried forward for eight years
and can be carried forward as short-term capital losses regardless of the character of the original loss.
|
WWW.HENNESSYFUNDS.COM
|
26
|
NOTES TO THE FINANCIAL STATEMENTS
|
As of October 31,2023, the Fund did not defer, on a tax basis, any late-year ordinary losses. Late-year ordinary losses are net ordinary losses incurred after December 31, 2022, but within the taxable
year, that are deemed to arise on the first day of the Fund’s next taxable year.
During fiscal years 2023 and 2022, the tax character of distributions paid by the Fund was as follows:
|
Year Ended
|
Year Ended
|
||||||||
|
October 31, 2023
|
October 31, 2022
|
||||||||
|
Ordinary income(1)
|
$
|
2,073,376
|
$
|
—
|
|||||
|
Long-term capital gains
|
4,012,963
|
37,030,072
|
|||||||
|
Total distributions
|
$
|
6,086,339
|
$
|
37,030,072
|
|||||
|
(1) Ordinary income includes short-term capital gains.
|
|||||||||
9). GLOBAL EVENTS
A rise in protectionist trade policies, the possibility of a national or global recession, risks associated with pandemic and epidemic diseases, trade tensions, the possibility of changes to some international trade
agreements, political events, and continuing political tension and armed conflicts may adversely impact financial markets and the broader economy. For example, ongoing armed conflicts between Ukraine and Russia in Europe and among Israel, Hamas, and
other militant groups in the Middle East have caused and could continue to cause significant market disruptions and volatility with the markets in Europe and the Middle East, and have had negative impacts on markets in the United States. These events
could also have negative effects on the Fund’s investments that cannot be foreseen at the present time. As global systems, economies and financial markets are increasingly interconnected, events that once had only local impact are now more likely to
have regional or even global effects. Events that occur in one country, region or financial market will, more frequently, adversely impact issuers in other countries, regions, or markets. These impacts can be exacerbated by failures of governments
and societies to adequately respond to an emerging event or threat. Your investment would be negatively impacted if the value of your portfolio holdings decreases as a result of such events, if these events adversely impact the operations and
effectiveness of the Advisor or other key service providers or if these events disrupt systems and processes necessary or beneficial to the management of accounts. These events may negatively impact broad segments of businesses and populations and
could have a significant and rapid negative impact on the performance of the Fund’s investments, increase the Fund’s volatility, or exacerbate pre-existing risks to the Fund.
10). EVENTS SUBSEQUENT TO YEAR END
Management has evaluated the Fund’s related events and transactions that occurred subsequent to October 31, 2023, through the date of issuance of the Fund’s financial statements. Management has determined that there were no
subsequent events requiring recognition or disclosure in the financial statements.
|
HENNESSY FUNDS
|
1-800-966-4354
|
27
Report of Independent Registered Public
Accounting Firm
To the Board of Trustees of Hennessy Funds Trust
and the shareholders of the Hennessy Cornerstone Growth Fund
Novato, CA
Opinion on the Financial Statements
We have audited the accompanying statement of assets and liabilities of the Hennessy Cornerstone Growth Fund (the “Fund”), a series of Hennessy Funds Trust, including the schedule of investments, as of October 31, 2023, the
related statement of operations for the year then ended, the statements of changes in net assets for each of the two years in the period then ended, the financial highlights for each of the five years in the period then ended, and the related notes
(collectively referred to as the “financial statements”). In our opinion, the financial statements present fairly, in all material respects, the financial position of the Fund as of October 31, 2023, the results of its operations for the year then
ended, the changes in its net assets for each of the two years in the period then ended, and the financial highlights for each of the five years in the period then ended in conformity with accounting principles generally accepted in the United States
of America.
Basis for Opinion
These financial statements are the responsibility of the Fund’s management. Our responsibility is to express an opinion on the Fund’s financial statements based on our audits. We are a public accounting firm registered with
the Public Company Accounting Oversight Board (United States) (“PCAOB”) and are required to be independent with respect to the Fund in accordance with the U.S. federal securities laws and the applicable rules and regulations of the Securities and
Exchange Commission and the PCAOB. We have served as the auditor of one or more of the funds in the Trust since 2002.
We conducted our audits in accordance with the standards of the PCAOB. Those standards require that we plan and perform the audit to obtain reasonable assurance about whether the financial statements are free of material
misstatement, whether due to error or fraud. The Fund is not required to have, nor were we engaged to perform, an audit of its internal control over financial reporting. As part of our audits we are required to obtain an understanding of internal
control over financial reporting, but not for the purpose of expressing an opinion on the effectiveness of the Fund’s internal control over financial reporting. Accordingly, we express no such opinion.
Our audits included performing procedures to assess the risks of material misstatement of the financial statements, whether due to error or fraud, and performing procedures that respond to those risks. Such procedures
included examining, on a test basis, evidence regarding the amounts and disclosures in the financial statements. Our audits also included evaluating the accounting principles used and significant estimates made by management, as well as evaluating
the overall presentation of the financial statements. Our procedures included confirmation of securities owned as of October 31, 2023 by correspondence with the custodian. We believe that our audits provide a reasonable basis for our opinion.
 |
|
|
TAIT, WELLER & BAKER LLP
|
Philadelphia, Pennsylvania
December 22, 2023
|
WWW.HENNESSYFUNDS.COM
|
28
|
REPORT OF INDEPENDENT REGISTERED PUBLIC ACCOUNTING FIRM/TRUSTEES AND OFFICERS
|
Trustees and Officers of the Fund (Unaudited)
The business and affairs of the Funds are managed under the direction of the Board of Trustees of the Trust, and the Board of Trustees elects the officers of the Trust (“Officers”). From time to time, the Board of Trustees
also has appointed advisers to the Board of Trustees (“Advisers”) with the intention of having qualified individuals serve in an advisory capacity to garner experience in the mutual fund and asset management industry and be considered as potential
Trustees in the future. There are currently two Advisers, Brian Alexander and A.J. Hennessy. As Advisers, Mr. Alexander and Mr. A.J. Hennessy attend meetings of the Board of Trustees and act as non-voting participants. Information pertaining to the
Trustees, Advisers, and the Officers of the Trust is set forth below. The Trustees and Officers serve until their successors are duly elected and qualified or until their earlier death, resignation, or removal. Each Trustee oversees all 17 Hennessy
Funds. Unless otherwise indicated, the address of all persons listed below is 7250 Redwood Boulevard, Suite 200, Novato, CA 94945. The Fund’s Statement of Additional Information includes more information about the persons listed below and is
available without charge by calling 800-966-4354 or by visiting www.hennessyfunds.com.
|
Other
|
|||
|
Directorships
|
|||
|
Held Outside
|
|||
|
Name, Age,
|
of Fund
|
||
|
and Position Held
|
Start Date
|
Principal Occupation(s)
|
Complex During
|
|
with the Trust
|
of Service
|
During Past Five Years
|
Past Five Years
|
|
Disinterested Trustees(1) and Disinterested Advisers
|
|||
|
J. Dennis DeSousa
|
January 1996
|
Mr. DeSousa is a real estate investor.
|
None.
|
|
87
|
|||
|
Trustee
|
|||
|
Robert T. Doyle
|
January 1996
|
Mr. Doyle is retired. He served as the
|
None.
|
|
76
|
Sheriff of Marin County, California
|
||
|
Trustee
|
from 1996 to June 2022.
|
||
|
Doug Franklin
|
March 2016
|
Mr. Franklin is a retired insurance
|
None.
|
|
59
|
as an Adviser
|
industry executive. From 1987
|
|
|
Trustee
|
to the Board
|
through 2015, he was employed by
|
|
|
and June 2023
|
the Allianz-Fireman’s Fund Insurance
|
||
|
as a Trustee
|
Company in various positions,
|
||
|
including as its Chief Actuary and
|
|||
|
Chief Risk Officer.
|
|||
|
Claire Garvie
|
December 2015
|
Ms. Garvie is a founder of Kiosk and
|
None.
|
|
49
|
as an Adviser
|
has served as its Chief Operating
|
|
|
Trustee
|
to the Board and
|
Officer since 2004. Kiosk is a
|
|
|
December 2021
|
full-service marketing agency with
|
||
|
as a Trustee
|
offices in the San Francisco Bay Area
|
||
|
and Liverpool, UK and staff across
|
|||
|
nine states in the U.S.
|
|||
|
HENNESSY FUNDS
|
1-800-966-4354
|
29
|
Other
|
|||
|
Directorships
|
|||
|
Held Outside
|
|||
|
Name, Age,
|
of Fund
|
||
|
and Position Held
|
Start Date
|
Principal Occupation(s)
|
Complex During
|
|
with the Trust
|
of Service
|
During Past Five Years
|
Past Five Years
|
|
Gerald P. Richardson
|
May 2004
|
Mr. Richardson is an independent
|
None.
|
|
78
|
consultant in the securities industry.
|
||
|
Trustee
|
|||
|
Brian Alexander
|
March 2015
|
Mr. Alexander has served as the
|
None.
|
|
42
|
Chief Operating Officer of Solis
|
||
|
Adviser to the Board
|
Mammography since March 2023.
|
||
|
Prior to that, he worked for the
|
|||
|
Sutter Health organization from
|
|||
|
2011 to 2023 in various positions.
|
|||
|
He served as the Chief Executive
|
|||
|
Officer of the North Valley Hospital
|
|||
|
Area from 2021 to March 2023.
|
|||
|
From 2018 to 2021, he served as the
|
|||
|
Chief Executive Officer of Sutter
|
|||
|
Roseville Medical Center. From 2016
|
|||
|
through 2018, he served as the Vice
|
|||
|
President of Strategy for the Sutter
|
|||
|
Health Valley Area, which includes
|
|||
|
11 hospitals, 13 ambulatory surgery
|
|||
|
centers, 16,000 employees, and
|
|||
|
1,900 physicians.
|
|||
|
Interested Trustee and Interested Adviser(2)
|
|||
|
Neil J. Hennessy
|
January 1996 as
|
Mr. Neil Hennessy has been employed
|
Hennessy
|
|
67
|
a Trustee and
|
by Hennessy Advisors, Inc. since
|
Advisors, Inc.
|
|
Chairman of the Board,
|
June 2008 as
|
1989 and currently serves as its
|
|
|
Chief Market Strategist,
|
an Officer
|
Chairman and Chief Executive Officer.
|
|
|
Portfolio Manager,
|
|||
|
and President
|
|||
|
A.J. Hennessy
|
December 2022
|
Mr. A.J. Hennessy has been employed
|
None.
|
|
37
|
by Hennessy Advisors, Inc. since 2011.
|
||
|
Adviser to the Board
|
|||
|
and Vice President,
|
|||
|
Corporate Development
|
|||
|
and Operations
|
|||
|
WWW.HENNESSYFUNDS.COM
|
30
|
TRUSTEES AND OFFICERS OF THE FUND
|
|
Name, Age,
|
||
|
and Position Held
|
Start Date
|
Principal Occupation(s)
|
|
with the Trust
|
of Service
|
During Past Five Years
|
|
Officers
|
||
|
Teresa M. Nilsen
|
January 1996
|
Ms. Nilsen has been employed by Hennessy Advisors, Inc.
|
|
57
|
since 1989 and currently serves as its President, Chief
|
|
|
Executive Vice President
|
Operating Officer, and Secretary.
|
|
|
and Treasurer
|
||
|
Daniel B. Steadman
|
March 2000
|
Mr. Steadman has been employed by Hennessy Advisors, Inc.
|
|
67
|
since 2000 and currently serves as its Executive Vice President.
|
|
|
Executive Vice President
|
||
|
and Secretary
|
||
|
Brian Carlson
|
December 2013
|
Mr. Carlson has been employed by Hennessy Advisors, Inc.
|
|
51
|
since December 2013 and currently serves as its Chief
|
|
|
Senior Vice President
|
Compliance Officer and Senior Vice President.
|
|
|
and Head of Distribution
|
||
|
David Ellison(3)
|
October 2012
|
Mr. Ellison has been employed by Hennessy Advisors, Inc.
|
|
65
|
since October 2012. He has served as a Portfolio Manager of
|
|
|
Senior Vice President
|
the Hennessy Large Cap Financial Fund and the Hennessy
|
|
|
and Portfolio Manager
|
Small Cap Financial Fund since their inception. Mr. Ellison also
|
|
|
served as a Portfolio Manager of the Hennessy Technology
|
||
|
Fund from its inception until February 2017. Mr. Ellison served
|
||
|
as Director, CIO, and President of FBR Fund Advisers, Inc.
|
||
|
from December 1999 to October 2012.
|
||
|
Jennifer Emerson(4)
|
June 2013
|
Ms. Emerson has been employed by Hennessy Advisors, Inc.
|
|
46
|
as its General Counsel since June 2013.
|
|
|
Senior Vice President and
|
||
|
Chief Compliance Officer
|
||
|
Ryan Kelley(5)
|
March 2013
|
Mr. Kelley has been employed by Hennessy Advisors, Inc. since
|
|
51
|
October 2012. He has served as Chief Investment Officer of the
|
|
|
Senior Vice President,
|
Hennessy Funds since March 2021 and has served as a Portfolio
|
|
|
Chief Investment Officer,
|
Manager of the Hennessy Gas Utility Fund, the Hennessy Large
|
|
|
and Portfolio Manager
|
Cap Financial Fund, and the Hennessy Small Cap Financial Fund
|
|
|
since October 2014. Mr. Kelley served as Co-Portfolio Manager
|
||
|
of these same funds from March 2013 through September
|
||
|
2014 and as a Portfolio Analyst for the Hennessy Funds from
|
||
|
October 2012 through February 2013. He has also served as a
|
||
|
Portfolio Manager of the Hennessy Cornerstone Growth Fund,
|
||
|
the Hennessy Cornerstone Mid Cap 30 Fund, the Hennessy
|
||
|
Cornerstone Large Growth Fund, and the Hennessy
|
||
|
Cornerstone Value Fund since February 2017 and as a Portfolio
|
||
|
Manager of the Hennessy Total Return Fund, the Hennessy
|
||
|
Balanced Fund, and the Hennessy Technology Fund since May
|
||
|
2018. He previously served as Co-Portfolio Manager of the
|
||
|
Hennessy Technology Fund from February 2017 until May 2018.
|
||
|
Mr. Kelley served as Portfolio Manager of FBR Fund
|
||
|
Advisers, Inc. from January 2008 to October 2012.
|
|
HENNESSY FUNDS
|
1-800-966-4354
|
31
|
Name, Age,
|
||
|
and Position Held
|
Start Date
|
Principal Occupation(s)
|
|
with the Trust
|
of Service
|
During Past Five Years
|
|
L. Joshua Wein(5)
|
September 2018
|
Mr. Wein has been employed by Hennessy Advisors, Inc. since
|
|
50
|
2018. He has served as Portfolio Manager of the Hennessy
|
|
|
Vice President and
|
Cornerstone Growth Fund, the Hennessy Cornerstone Mid Cap
|
|
|
Portfolio Manager
|
30 Fund, the Hennessy Cornerstone Large Growth Fund, the
|
|
|
Hennessy Cornerstone Value Fund, Hennessy Total Return Fund,
|
||
|
the Hennessy Balanced Fund, the Hennessy Gas Utility Fund,
|
||
|
and the Hennessy Technology Fund since February 2021, and
|
||
|
as the Co-Portfolio Manager of these Funds since February
|
||
|
2019. He served as a Senior Analyst of those same Funds from
|
||
|
September 2018 through February 2019. He also has served as
|
||
|
a Portfolio Manager of the Hennessy Energy Transition Fund
|
||
|
and the Hennessy Midstream Fund since January 2022.
|
||
|
Mr. Wein served as Director of Alternative Investments and
|
||
|
Co-Portfolio Manager at Sterling Capital Management
|
||
|
from 2008 to 2018.
|
_______________
|
(1)
|
The Funds have determined that Mr. DeSousa, Mr. Doyle, Mr. Franklin, Ms. Garvie, and Mr. Richardson are not interested persons, as defined in the 1940 Act, of the Investment Manager or of any
predecessor investment adviser for purposes of Section 15(f) of the 1940 Act.
|
|
(2)
|
Each of Neil J. Hennessy and A.J. Hennessy is considered an interested person, as defined in the 1940 Act, because he is an officer of the Trust.
|
|
(3)
|
The address of this officer is 101 Federal Street, Suite 1615B, Boston, MA 02110.
|
|
(4)
|
The address of this officer is 4800 Bee Caves Road, Suite 100, Austin, TX 78746.
|
|
(5)
|
The address of this officer is 1340 Environ Way, Chapel Hill, NC 27517.
|
|
WWW.HENNESSYFUNDS.COM
|
32
|
TRUSTEES AND OFFICERS OF THE FUND
|
(This Page Intentionally Left Blank.)
|
HENNESSY FUNDS
|
1-800-966-4354
|
33
Expense Example (Unaudited)
October 31, 2023
As a shareholder of the Fund, you incur ongoing costs, including management fees, service fees, and other Fund expenses. This Example is intended to help you understand your ongoing costs (in dollars) of investing in the
Fund and to compare these costs with the ongoing costs of investing in other investment funds. The Example is based on an investment of $1,000 invested at the beginning of the period and held for the entire period from May 1, 2023, through October
31, 2023.
Actual Expenses
In the table below, the first line under each of the “Investor Class” and “Institutional Class” headings provides information about actual account values and actual expenses for each share class. You may use this
information, together with the amount you invested, to estimate the expenses that you paid over the period. Simply divide your account value by $1,000 (for example, an $8,600 account value divided by $1,000 = 8.6), then multiply the result by the
number in the first line under the heading “Expenses Paid During Period” to estimate the expenses you paid on your account during this period. Although the Fund charges no sales loads or transaction fees, you will be assessed fees for outgoing wire
transfers, returned checks, and stop payment orders at prevailing rates charged by U.S. Bank Global Fund Services, the Fund’s transfer agent. If you request that a redemption be made by wire transfer, the Fund’s transfer agent charges a $15 fee. IRAs
are charged a $15 annual maintenance fee (up to $30 maximum per shareholder for shareholders with multiple IRAs). The examples below include, but are not limited to, management, shareholder servicing, accounting, custody, and transfer agent fees.
However, the examples below do not include portfolio trading commissions and related expenses.
Hypothetical Example for Comparison Purposes
In the table below, the second line under each of the “Investor Class” and “Institutional Class” headings provides information about hypothetical account values and hypothetical expenses based on the Fund’s actual expense
ratio for each share class and an assumed rate of return of 5% per year before expenses, which is not the Fund’s actual return for such share class. The hypothetical account values and expenses may not be used to estimate the actual ending account
balance or expenses you paid for the period. You may use this information to compare the ongoing costs of investing in the Fund and other funds. To do so, compare these 5% hypothetical examples with the 5% hypothetical examples that appear in the
shareholder reports of the other funds. Please note that the expenses shown in the table are meant to highlight your ongoing costs only. Therefore, the second lines under “Investor Class” and “Institutional Class” are useful in comparing ongoing
costs only and will not help you determine the relative total costs of owning different funds.
|
WWW.HENNESSYFUNDS.COM
|
34
|
EXPENSE EXAMPLE
|
|
Expenses Paid
|
|||
|
Beginning
|
Ending
|
During Period(1)
|
|
|
Account Value
|
Account Value
|
May 1, 2023 –
|
|
|
May 1, 2023
|
October 31, 2023
|
October 31, 2023
|
|
|
Investor Class
|
|||
|
Actual
|
$1,000.00
|
$1,110.50
|
$7.08
|
|
Hypothetical (5% return before expenses)
|
$1,000.00
|
$1,018.50
|
$6.77
|
|
Institutional Class
|
|||
|
Actual
|
$1,000.00
|
$1,112.60
|
$5.43
|
|
Hypothetical (5% return before expenses)
|
$1,000.00
|
$1,020.06
|
$5.19
|
|
(1)
|
Expenses are equal to the Fund’s annualized expense ratio of 1.33% for Investor Class shares or 1.02% for Institutional Class shares, as applicable, multiplied by the average account value over the period,
multiplied by 184/365 days (to reflect the half-year period).
|
|
HENNESSY FUNDS
|
1-800-966-4354
|
35
How to Obtain a Copy of the Fund’s Proxy
Voting Policy and Proxy Voting Records
A description of the policies and procedures the Fund uses to determine how to vote proxies relating to portfolio securities is available without charge (1) by calling 800-966-4354, (2) on the Hennessy Funds’ website at
www.hennessyfunds.com/proxy-voting/voting-policy, or (3) on the U.S. Securities and Exchange Commission’s (the “SEC”) website at www.sec.gov. The Fund’s proxy voting record is available without charge on both the Hennessy Funds’ website at
www.hennessyfunds.com/proxy-voting/voting-record and the SEC’s website at www.sec.gov no later than August 31 for the prior 12 months ending June 30.
Availability of Quarterly Portfolio Schedule
The Fund files a complete schedule of portfolio holdings with the SEC for the first and third quarters of each fiscal year as an exhibit to its reports on Form N-PORT. The Fund’s Form N-PORT reports are available on the
SEC’s website at www.sec.gov or on request by calling 800-966-4354.
Federal Tax Distribution Information (Unaudited)
For fiscal year 2023, certain dividends paid by the Fund may be subject to a maximum tax rate of 23.8%, as provided for by the Jobs and Growth Tax Relief Reconciliation Act of 2003. The percentage of dividends declared from
ordinary income designated as qualified dividend income was 100.00%.
For corporate shareholders, the percent of ordinary income distributions that qualified for the corporate dividends received deduction for fiscal year 2023 was 100.00%.
The percentage of taxable ordinary income distributions that were designated as short-term capital gain distributions under Section 871(k)(2)(C) of the Internal Revenue Code of 1986, as amended, for the
Fund was 0.00%.
Important Notice Regarding Delivery
of Shareholder Documents
To help keep the Fund’s costs as low as possible, we generally deliver a single copy of shareholder reports, proxy statements, and prospectuses to shareholders who share an address and have the same last name. This process
does not apply to account statements. You may request an individual copy of a shareholder document at any time. If you would like to receive separate mailings of shareholder documents, please call U.S. Bank Global Fund Services at 800-261-6950 or
414-765-4124, and individual delivery will begin within 30 days of your request. If your account is held through a financial institution or other intermediary, please contact such intermediary directly to request individual delivery.
Electronic Delivery
As currently permitted by SEC regulations, the Fund’s shareholder reports are made available on a website, and unless you sign for eDelivery or elect to receive paper copies as detailed below, you will be notified by mail
each time a report is posted and provided with a website link to access the report.
To elect to receive paper copies of all future reports free of charge, please call U.S. Bank Global Fund Services at 800-261-6950 or 414-765-4124.
The Fund also offers shareholders the option to receive all notices, account statements, prospectuses, tax forms, and shareholder reports electronically. To sign up for eDelivery or change your delivery
preference, please visit www.hennessyfunds.com/account.
Shareholder reports transmitted after July 24, 2024, will comply with the new tailored shareholder reporting requirements, which require streamlined annual and semi-annual reports to shareholders that
highlight key information. These reports will be transmitted in paper unless a shareholder elects to receive reports electronically via eDelivery. To sign up for eDelivery, please visit http://www.hennessyfunds.com/account.
Subscribe to receive our team’s unique market and sector insights delivered to your inbox
www.hennessyfunds.com/subscribe
Follow us on social media
| |
|
|
|
|
WWW.HENNESSYFUNDS.COM
|
36
|
PROXY VOTING — PRIVACY POLICY
|
Liquidity Risk Management Program
In accordance with Rule 22e-4 under the Investment Company Act of 1940, as amended (the “Liquidity Rule”), we have adopted and implemented a liquidity risk management program (the “Liquidity Program”). The purpose of the
Liquidity Program is to assess and manage the Fund’s liquidity risk, which is the risk that the Fund would not be able to meet requests to redeem Fund shares without significant dilution of the remaining shareholders’ interests in the Fund. The Board
of Trustees of the Fund (the “Board”) designated a committee comprising representatives of Hennessy Advisors, Inc., the investment adviser to the Fund, as the administrator of the Liquidity Program (the “Program Administrator”).
The Program Administrator provided a written report regarding the Liquidity Program to the Board in advance of its meeting on June 7, 2023. The report covered the period from June 1, 2022, through May 31,
2023. The report addressed the operation of the Liquidity Program, assessed the adequacy and effectiveness of its implementation, and described any material changes to the Liquidity Program during the review period. The Trust’s chief compliance
officer presented the report to the Board at the meeting and provided additional information regarding the Liquidity Program. The Board reviewed the Liquidity Program and considered, among other items, the following:
|
1.
|
The Program Administrator reviewed daily historical net redemption activity during the review period and during prior periods with higher-than-average redemption activity and concluded that the Fund has historically
been able to meet requests to redeem Fund shares without significant dilution to the Fund’s remaining shareholders, and the Program Administrator expects the Fund to be able to continue to do so in the future during both normal and reasonably
foreseeable stressed conditions.
|
|
|
2.
|
The Fund primarily holds assets that are highly liquid investments and is not required to establish a highly liquid investment minimum for the Fund or adopt policies and procedures for responding to a highly liquid
investment minimum shortfall.
|
|
|
3.
|
The Program Administrator did not make or recommend any material changes to the Liquidity Program during the review period.
|
|
|
4.
|
The Program Administrator concluded that the Liquidity Program was reasonably designed to assess and manage the Fund’s liquidity risk, complies with the requirements of the Liquidity Rule, and was operating as
intended during the review period.
|
Privacy Policy
We collect the following personal information about you:
|
1.
|
Information we receive from you in applications or other forms, correspondence, or conversations, including, but not limited to, your name, address, phone number, social security number, assets, income, and date of
birth;
|
|
|
2.
|
Information about your transactions with us, our affiliates, or others, including, but not limited to, your account number and balance, payments history, parties to transactions, cost basis information, and other
financial information; and
|
|
HENNESSY FUNDS
|
1-800-966-4354
|
37
|
3.
|
Other personal information we collect from various sources, even if you have not entered into a prior transaction with us, including the following:
|
|
•
|
Name, alias, address, unique personal identifier, online identifier, IP address, email address, telephone number, account name, and other similar identifiers;
|
||
|
•
|
Age and marital status;
|
||
|
•
|
Commercial information, including records of products purchased;
|
||
|
•
|
Browsing history, search history, and information on interaction with our website;
|
||
|
•
|
Geolocation data;
|
||
|
•
|
Employment and employment history, educational history, financial information, and purchasing and consuming histories or tendencies; and
|
||
|
•
|
Inferences drawn from the above-listed information to create a profile about your preferences, characteristics, predispositions, and behavior.
|
We collect this information directly from you, indirectly in the course of providing services to you, directly and indirectly from your activity on our website, from broker dealers, marketing agencies,
and other third parties that interact with us in connection with the services we perform and products we offer, and from anonymized and aggregated consumer information.
We use this information to fulfill the reason you provided the information to us, to provide you with other relevant products that you request from us, to provide you with information about products that
may interest you, to improve our website or present our website’s contents to you, and as otherwise described to you when collecting your personal information.
We do not disclose any personal information to unaffiliated third parties, except as permitted by law. We may disclose your personal information to our affiliates, vendors, and service providers for a
business purpose. For example, we are permitted by law to disclose all of the information we collect, as described above, to our transfer agent to process your transactions. When disclosing your personal information to third parties, we enter into a
contract with each third party describing the purpose of such disclosure and requiring that such personal information be kept confidential and not used for any purpose except to perform the services contracted or respond to regulatory or law
enforcement requests.
Furthermore, we restrict access to your personal information to those persons who require such information to provide products or services to you. As a result, we do not provide a means for opting out of
our limited sharing of your information. We maintain physical, electronic, and procedural safeguards that comply with federal standards to guard your personal information.
If you hold shares of the Funds through a financial intermediary, including, but not limited to, a broker-dealer, bank, or trust company, the privacy policy of your financial intermediary governs how your
personal information is shared with unaffiliated third parties.
If you live in a state such as California where the laws provide further privacy rights, we will not share information unless the law allows, and we will comply with the other state-specific requirements.
|
WWW.HENNESSYFUNDS.COM
|
38
|
PRIVACY POLICY
|
Supplemental Privacy Notice for Residents of California
The California Consumer Privacy Act of 2018 (the “CCPA”) provides you, as a California resident, with certain additional rights relating to your personal information.
Under the CCPA, you have the right to request that we disclose to you the categories of personal information we have collected about you over the past 12 months, the categories of sources of such
information, our business purpose for collecting the information, the categories of third parties, if any, with whom we shared the information, and the specific information we have collected about you. You also have the right to request that we
delete any of your personal information, and, unless an exception applies, we will delete such information upon receiving and confirming your request. To make a request, call us at 1-800-966-4354, email us at privacy@hennessyfunds.com, or go to
www.hennessyfunds.com/contact. We will not discriminate against you for exercising your rights under the CCPA. Further, we will not collect additional categories of your personal information or use the personal information we collected for materially
different, unrelated, or incompatible purposes without providing you notice.
|
HENNESSY FUNDS
|
1-800-966-4354
|
39
(This Page Intentionally Left Blank.)
For information, questions, or assistance, please call
The Hennessy Funds
800-966-4354 or 415-899-1555
INVESTMENT ADVISOR
Hennessy Advisors, Inc.
7250 Redwood Boulevard, Suite 200
Novato, California 94945
ADMINISTRATOR,
TRANSFER AGENT,
DIVIDEND PAYING AGENT, &
SHAREHOLDER SERVICING AGENT
U.S. Bancorp Fund Services, LLC
d/b/a U.S. Bank Global Fund Services
P.O. Box 701
Milwaukee, Wisconsin 53201-0701
CUSTODIAN
U.S. Bank N.A.
Custody Operations
1555 North River Center Drive, Suite 302
Milwaukee, Wisconsin 53212
TRUSTEES
Neil J. Hennessy
Robert T. Doyle
J. Dennis DeSousa
Doug Franklin
Claire Garvie
Gerald P. Richardson
COUNSEL
Foley & Lardner LLP
777 East Wisconsin Avenue
Milwaukee, Wisconsin 53202-5306
INDEPENDENT REGISTERED
PUBLIC ACCOUNTING FIRM
Tait, Weller & Baker LLP
Two Liberty Place
50 South 16th Street, Suite 2900
Philadelphia, Pennsylvania 19102-2529
DISTRIBUTOR
Quasar Distributors, LLC
111 East Kilbourn Avenue, Suite 1250
Milwaukee, Wisconsin 53202
www.hennessyfunds.com | 800-966-4354
This report has been prepared for shareholders and may be distributed to
others only if preceded or accompanied by a current prospectus.
ANNUAL REPORT
OCTOBER 31, 2023

HENNESSY FOCUS FUND
Investor Class HFCSX
Institutional Class HFCIX
www.hennessyfunds.com | 1-800-966-4354
(This Page Intentionally Left Blank.)
Contents
|
Letter to Shareholders
|
2
|
|
|
Performance Overview
|
6
|
|
|
Financial Statements
|
||
|
Schedule of Investments
|
9
|
|
|
Statement of Assets and Liabilities
|
13
|
|
|
Statement of Operations
|
14
|
|
|
Statements of Changes in Net Assets
|
15
|
|
|
Financial Highlights
|
16
|
|
|
Notes to the Financial Statements
|
20
|
|
|
Report of Independent Registered Public Accounting Firm
|
29
|
|
|
Trustees and Officers of the Fund
|
30
|
|
|
Expense Example
|
34
|
|
|
Proxy Voting Policy and Proxy Voting Records
|
36
|
|
|
Availability of Quarterly Portfolio Schedule
|
36
|
|
|
Federal Tax Distribution Information
|
36
|
|
|
Important Notice Regarding Delivery of Shareholder Documents
|
36
|
|
|
Electronic Delivery
|
36
|
|
|
Liquidity Risk Management Program
|
37
|
|
|
Privacy Policy
|
37
|
|
HENNESSY FUNDS
|
1-800-966-4354
|
November 2023
Dear Hennessy Funds Shareholder:
Market Myopia: Tough Beginnings & Fantastic Finishes
During an interview this summer, I was reminded how important it is to maintain a long-term view of the market and investing and how easy it is to focus on the very recent past. In mid-July, when the Nasdaq Composite
Index was soaring to new 2023 highs and large-cap tech was once again dominating both returns and news headlines, the interviewer seemed confused – and somewhat disappointed – when I mentioned that even with 2023’s stellar performance, the Nasdaq
was negative if you included the prior year (2022) and that during that same time, utilities had outperformed. As of the time of writing this letter, a similar story can be seen when considering eight technology giants: Microsoft, Tesla, Facebook (Meta), Apple, Amazon, Netflix, Nvidia, and Google, or “MT. FAANNG” as a much easier to say (and remember) acronym.(1) MT. FAANNG is up on average a whopping 89.69% in 2023 on a total return basis as of November 7, 2023. However, this same group was down -46.71% in 2022, a dismal year for large-cap tech. Due to the
unforgiving nature of percentages, from the end of 2021 until now, this group of highflyers, believe it or not, is still down -3.14% on average, despite an incredible 2023.
I like to call this phenomenon “market myopia.” Investors tend to be optimists, as am I. This makes it so much more comforting to forget the “tough beginnings” when you’d rather
remember the “fantastic finishes.” In continuing with the example above, unless you were an investor with prescient foresight, you likely didn’t sell all your MT. FAANNG stocks on January 4, 2022, as the market started its correction, and you
probably didn’t then buy them all back on September 30, 2022, when the market hit its low. An average investor’s experience would be much different than that. Which brings me to the point of all this: what are some elements of our investment
philosophy here at Hennessy Funds?
First, what about timing the market? Simply put, we don’t do it. As Neil Hennessy, our Chief Market Strategist and long-tenured Portfolio Manager, aptly put it, “It’s not about timing the market, but rather about time in the market.” The long-term annualized return of the market, as measured by the Dow Jones Industrial Average going back 104
years to 1920, is about 9.6%, and that number would be closer to 7-8% on a real return basis when factoring in inflation. If an investor is poorly timing when to enter and when to exit the market, it would be very difficult to achieve similar,
attractive returns to what they would experience simply by staying invested through a complete market cycle.
We are optimistic investors. We understand that some years or months may be tougher than others, but we tend to think in longer timeframes. An investor solely invested in the Nasdaq
might have looked at their portfolio at the end of 2022 and been extremely disappointed with a -32.51% return. But as Josh Wein, one of our Portfolio Managers with over 25 years of experience, pointed out, “2022 was what 8% real returns look like.”
In other words, with the year prior (2021) providing a +22.21% return and the year after (2023) hitting a +31.21% return, 2022’s dismal performance of -32.51% created an annualized total return for the Nasdaq of 8.22% over the entire period
(December 31, 2020, to November 7, 2023). Josh simply observed that while corrections happen over the course of a market cycle, it’s best not to panic by selling when stocks are hitting new lows.
_______________
|
(1)
|
The acronym, MT. FAANNG, refers to the following companies: Microsoft Corporation, Tesla, Inc., Meta Platforms, Inc., Amazon.com, Inc., Apple, Inc., Netflix, Inc., NVIDIA Corporation, and Alphabet, Inc.
|
|
WWW.HENNESSYFUNDS.COM
|
2
|
LETTER TO SHAREHOLDERS
|
Downside risk mitigation is relevant. While we normally remain fully invested within our individual funds, we seek to reduce risk through other means, including sector
diversification and investing in companies that exhibit strong fundamentals at compelling valuations. Dave Ellison, the long-tenured Portfolio Manager of our two financial funds, consistently reminds us, “Losing less money in difficult markets is
more important than making the most in rising ones.”
Finally, we are investors in companies, not traders of stocks. Many of our portfolios hold certain positions for long periods of time, a demonstration of the Portfolio Managers’
convictions. In fact, both the Hennessy Focus Fund and the Hennessy Large Cap Financial Fund have held some positions for 25 years or more. We recognize that much of the performance of the Hennessy Funds comes from the actual stocks we own (stock
selection) and not from our weightings within certain sectors (sector allocation). Moving in and out of sectors can enhance performance, but it can also hinder it in the same way as market timing, and it takes a significant number of correct
“calls” regarding the macro-environment. We’d rather invest long term than rely on lucky calls. Our highly experienced energy funds Portfolio Manager, Ben Cook, summed up our philosophy on the macro environment nicely: “While macro-economic trends
help to inform our investment process, ultimately it’s the individual stocks with solid fundamentals and attractive valuations that, over time, drive positive risk-adjusted returns for our funds.”
We are long term investors, staying ever mindful of downside risk while striving to participate in the upside, with each individual fund having its own objective, process, portfolio
construction, and investment criteria.
The stock market has once again seen dramatic differences in stock performance. For our fiscal year ended October 31, 2023, all three broad-based indexes were positive, although
with a large dispersion of total returns, with the Dow Jones Industrial Average up 3.17%, the S&P 500® Index up 10.14%, and the Nasdaq Composite Index up 17.99%.
During our fiscal year, large caps significantly outperformed mid caps and small caps, and growth substantially outperformed value. Large-cap tech once again pushed the overall broader market higher, as evidenced by the Nasdaq-100 Index posting a
return of 27.45%. From a sector point of view, besides Technology, the only other sector with outsized (greater than 10%) returns was Communication Services, while six of the 11 GICS sectors of the S&P 500® Index were negative.
Similar to the overall market, our funds experienced mixed results. Many of our funds exhibit more value-oriented characteristics and, given that value underperformed growth this
year by a significant amount, that negatively affected our relative performance. In addition, three of our funds are sector-specific funds that were invested in underperforming sectors, while six more are focused on small- and mid-cap stocks in a
time period when large caps substantially outperformed. Ten of our 16 mutual funds and our exchange-traded-fund (ETF) posted positive returns for the fiscal year ended October 31, 2023.
Several factors caused this disparity of returns in the market: interest rates and inflation being two of the most important. With the Federal Reserve pausing interest rate hikes
and inflation numbers subsiding, the market reacted positively once it became more apparent that we were not heading into a recession. Consumer demand also remained strong, and unemployment numbers remained historically low.
We believe that the outlook for U.S. stocks remains positive, primarily as we believe that the Federal Reserve may be done, or close to done, raising interest rates. Inflation has
shown signs of easing, creating a better environment for consumers as well as businesses. The unemployment rate remains near record lows, there are elevated levels of cash on the
|
HENNESSY FUNDS
|
1-800-966-4354
|
3
balance sheets of U.S. companies and in the pockets of many consumers and investors, and there is the prospect of a more dovish Federal Reserve heading into 2024. However, we are cautiously watching certain parts of the
economy for any hints of weakness, including consumer spending and credit issues. While volatility and uncertainty may impact the markets, we encourage investors to stay the course, maintain a diversified portfolio, and keep a long-term
perspective.
We thank you for your continued interest in our Funds and are grateful that you have chosen to invest with us. If you have any questions or would like to speak with us directly,
please call us at (800) 966-4354.
Best regards,
| |
|
|
|
|
Ryan C. Kelley, CFA
|
|
|
Chief Investment Officer,
|
|
|
Senior Vice President, and Portfolio Manager
|
Past performance does not guarantee future results.
Mutual fund investing involves risk. Principal loss is possible.
Opinions expressed are those of Ryan C. Kelley and are subject to change, are not guaranteed, and should not be considered investment advice.
The Dow Jones Industrial Average and S&P 500® Index are commonly used to measure the performance of U.S. stocks. The Nasdaq Composite
Index comprises all common stocks listed on The Nasdaq Stock Market and is commonly used to measure the performance of technology-related stocks. The Nasdaq-100 Index includes 100 of the largest domestic and international non-financial companies
listed on The NASDAQ Stock Market based on market capitalization. The indices are used herein for comparative purposes in accordance with SEC regulations. One cannot invest directly in an index. All returns are shown on a total return basis.
|
WWW.HENNESSYFUNDS.COM
|
4
|
LETTER TO SHAREHOLDERS
|
(This Page Intentionally Left Blank.)
|
HENNESSY FUNDS
|
1-800-966-4354
|
5
Performance Overview (Unaudited)
CHANGE IN VALUE OF $10,000 INVESTMENT

This graph illustrates the performance of an initial investment of $10,000 made in the Fund 10 years ago and assumes the reinvestment of dividends and capital gains.
AVERAGE ANNUAL TOTAL RETURN FOR PERIODS ENDED OCTOBER 31, 2023
|
One
|
Five
|
Ten
|
|
|
Year
|
Years
|
Years
|
|
|
Hennessy Focus Fund –
|
|||
|
Investor Class (HFCSX)
|
3.52%
|
6.40%
|
6.97%
|
|
Hennessy Focus Fund –
|
|||
|
Institutional Class (HFCIX)
|
3.90%
|
6.78%
|
7.36%
|
|
Russell 3000® Index
|
8.38%
|
10.23%
|
10.52%
|
|
Russell Midcap® Growth Index
|
3.35%
|
8.09%
|
9.09%
|
Expense ratios: 1.52% (Investor Class); 1.13% (Institutional Class)
Performance data quoted represents past performance; past performance does not guarantee future results. The investment return and principal value of an investment will fluctuate so that an investor’s
shares, when redeemed, may be worth more or less than their original cost. The performance table does not reflect the deduction of taxes that a shareholder would pay on Fund distributions or the redemption of Fund shares. Current performance of the
Fund may be lower or higher than the performance quoted. Performance data current to the most recent month end may be obtained by visiting www.hennessyfunds.com.
The Russell 3000® Index comprises the 3,000 largest U.S. companies based on market capitalization, representing approximately 96% of the
investable U.S. equity market. The Russell Midcap® Growth Index is a subset of the Russell Midcap® Index that measures the performance of the mid-cap growth segment of the U.S. equity market. The Russell Midcap® Growth Index comprises those
companies in the Russell Midcap® Index with relatively higher price-to-book ratios, higher forecasted growth values, and higher sales per share historical growth. One
cannot invest directly in an index. These indices are used for comparative purposes in accordance with Securities and Exchange Commission regulations.
Frank Russell Company (“Russell”) is the source and owner of the trademarks, service marks, and copyrights related to the Russell Indexes. Russell®
is a trademark of Frank Russell Company. Neither Russell nor its licensors accept any liability for any errors or omissions in the Russell Indexes or Russell ratings or underlying data and no party may
|
WWW.HENNESSYFUNDS.COM
|
6
|
PERFORMANCE OVERVIEW
|
rely on any Russell Indexes or Russell ratings or underlying data contained in this communication. No further distribution of Russell data is permitted without Russell’s express written consent. Russell does not promote,
sponsor, or endorse the content of this communication.
The expense ratios presented are from the most recent prospectus. The expense ratios for the current reporting period are available in the Financial Highlights section of this report.
PERFORMANCE NARRATIVE
Portfolio Managers Brian E. Macauley, CFA, David S. Rainey, CFA, and Ira M. Rothberg, CFA
Broad Run Investment Management, LLC (sub-advisor)
Performance:
For the one-year period ended October 31, 2023, the Investor Class of the Hennessy Focus Fund returned 3.52%, underperforming the Russell 3000®
Index (the Fund’s primary benchmark), which returned 8.38%, and outperforming the Russell Midcap® Growth Index, which returned 3.35%, for the same period.
Leading contributors to the Fund’s performance were Markel Group, Inc., American Woodmark Corporation, and Aon plc. Leading detractors from the Fund’s performance were Encore Capital Group, Inc., AST
SpaceMobile, Inc., and American Tower Corporation. The Fund continues to hold of all the companies mentioned.
We invest with a long-term time horizon and encourage shareholders to do the same. Despite the discussion of one-year results referenced above, we encourage fellow shareholders to also evaluate the
Fund’s performance over five-year and ten-year periods, since shorter periods can be influenced by many transitory issues unrelated to the growth in the intrinsic value of the Fund’s holdings.
Investment Commentary:
Interest rates work like gravity on the value of financial assets. When the Federal Reserve cut the federal funds rate to near zero percent following the COVID-19 outbreak, it was as if capital markets went from Earth
gravity to Moon gravity. The value of most financial assets proceeded to skyrocket until it became apparent that the Federal Reserve would be forced to begin a rate hiking cycle that kicked off in March 2022. Since that time, the federal funds rate
target range has increased by 525 basis points and, in our opinion, financial gravity has normalized.
Within our portfolio, our cyclical and financially levered stocks underperformed over the last twelve months, reflecting higher interest rates and the macroeconomic climate. Near-term fundamentals at
these businesses remain mixed, but we believe their valuations are compelling and their long-term prospects are unchanged. In response to this uncertainty, we remain focused, as always, on owning a portfolio of durable compounders with a good
margin of safety.
While the increase in interest rates is having the desired impact of reducing inflation and slowing the labor market, headline inflation remains stubbornly high and above the Federal Reserve’s target.
That said, the Federal Reserve’s progress fighting inflation is understated by headline CPI as the backward-looking calculation of shelter costs overstates the true rate of inflation. In our view, the spike in the 10-year Treasury yield from 3.82%
at the end of June 2023 to 4.88% at the end of October 2023 has increased the odds that the July 2023 rate hike was the last or second to last one in this tightening cycle.
|
HENNESSY FUNDS
|
1-800-966-4354
|
7
When the Federal Reserve becomes confident that inflation is moving sustainably down toward its 2% goal, we believe the Federal Open Market Committee will begin to cut rates. We believe that
long-duration equities, i.e., stocks that are expected to generate the bulk of their cash flow in the more distant future, will benefit the most from lower inflation and lower interest rates.
For example, two of our holdings with significant real estate exposure, Brookfield Corporation and American Tower, hold long-duration assets and are able to employ meaningful financial leverage because
of the consistency of their cash flow. The market value of the assets they hold is highly sensitive to long-term interest rates and lower interest rates would allow their assets to be financed at a lower cost. We believe both companies are poised
to see significant outperformance if incoming data suggests inflation is on a path toward the Fed’s target.
_______________
Opinions expressed are those of the Portfolio Managers as of the date written and are subject to change, are not guaranteed, and should not be considered investment advice or an indication of trading intent.
The Fund is non-diversified, meaning it may concentrate its assets in fewer individual holdings than a diversified fund, making it more exposed to individual stock volatility than a diversified fund.
The Fund invests in small-capitalization and medium-capitalization companies, which involves additional risks such as more limited liquidity and greater price volatility than larger companies. Investments in foreign securities involve greater
volatility and political, economic, and currency risk, and differences in accounting methods. Funds concentrated in one or more industry sectors may be subject to a higher degree of market risk. Please see the Fund’s prospectus for a more complete
discussion of these and other risks.
References to specific securities should not be considered a recommendation to buy or sell any security. Fund holdings and sector allocations are subject to change. Please refer to the Schedule of Investments included in
this report for additional portfolio information.
Cash flow refers to the net amount of cash and cash equivalents transferred into and out of a company. Basis point refers to a common unit of measurement for interest rates and
other percentages in finance and is equal to 1/100th of 1%.
|
WWW.HENNESSYFUNDS.COM
|
8
|
PERFORMANCE OVERVIEW/SCHEDULE OF INVESTMENTS
|
Financial Statements
|
Schedule of Investments as of October 31, 2023
|
HENNESSY FOCUS FUND
(% of Net Assets)
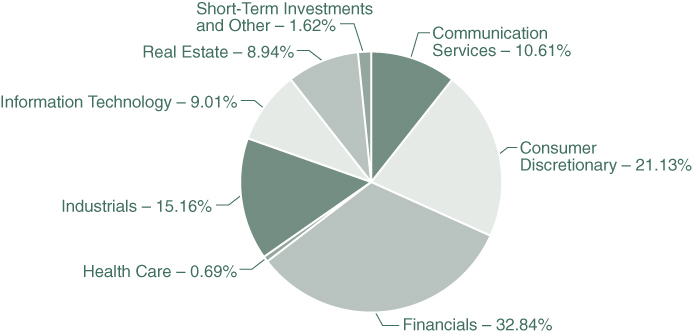
|
TOP TEN HOLDINGS (EXCLUDING MONEY MARKET FUNDS)
|
% NET ASSETS
|
|
Markel Group, Inc.
|
8.56%
|
|
Aon PLC
|
8.17%
|
|
American Tower Corp., Class A
|
7.96%
|
|
O'Reilly Automotive, Inc.
|
7.89%
|
|
Ashtead Group PLC
|
7.51%
|
|
Brookfield Corp.
|
7.42%
|
|
CarMax, Inc.
|
6.76%
|
|
Encore Capital Group, Inc.
|
6.72%
|
|
Cogent Communication Holdings, Inc.
|
5.24%
|
|
CDW Corp.
|
5.16%
|
Note: For presentation purposes, the Fund has grouped some of the industry categories. For purposes of categorizing securities for compliance with Section 8(b)(1) of the Investment Company Act of 1940, as amended, the
Fund uses more specific industry classifications.
The Global Industry Classification Standard (GICS®) was developed by and is the exclusive property and a service mark of MSCI, Inc. and
Standard & Poor's Financial Services LLC. It has been licensed for use by the Hennessy Funds.
|
HENNESSY FUNDS
|
1-800-966-4354
|
9
|
COMMON STOCKS – 90.42%
|
Number
|
% of
|
||||||||||
|
|
of Shares
|
Value
|
Net Assets
|
|||||||||
|
Communication Services – 10.61%
|
||||||||||||
|
AST SpaceMobile, Inc. (a)
|
1,997,902
|
$
|
6,613,056
|
1.16
|
%
|
|||||||
|
Cogent Communications Holdings, Inc.
|
461,996
|
30,020,500
|
5.24
|
%
|
||||||||
|
Shenandoah Telecommunications Co.
|
796,737
|
18,850,797
|
3.30
|
%
|
||||||||
|
Warner Music Group Corp.
|
165,601
|
5,183,311
|
0.91
|
%
|
||||||||
|
|
60,667,664
|
10.61
|
%
|
|||||||||
|
Consumer Discretionary – 21.13%
|
||||||||||||
|
CarMax, Inc. (a)
|
632,799
|
38,657,691
|
6.76
|
%
|
||||||||
|
Hilton Worldwide Holdings, Inc.
|
39,481
|
5,982,556
|
1.05
|
%
|
||||||||
|
NVR, Inc. (a)
|
2,261
|
12,237,934
|
2.14
|
%
|
||||||||
|
O'Reilly Automotive, Inc. (a)
|
48,439
|
45,069,582
|
7.89
|
%
|
||||||||
|
Restoration Hardware Holdings, Inc. (a)
|
86,384
|
18,828,257
|
3.29
|
%
|
||||||||
|
|
120,776,020
|
21.13
|
%
|
|||||||||
|
Financials – 32.84%
|
||||||||||||
|
Aon PLC
|
151,027
|
46,727,754
|
8.17
|
%
|
||||||||
|
Brookfield Asset Management Ltd.
|
376,240
|
10,786,801
|
1.89
|
%
|
||||||||
|
Brookfield Corp.
|
1,454,542
|
42,399,899
|
7.42
|
%
|
||||||||
|
Brookfield Reinsurance Ltd.
|
15,721
|
459,210
|
0.08
|
%
|
||||||||
|
Encore Capital Group, Inc. (a)(c)
|
1,020,143
|
38,438,988
|
6.72
|
%
|
||||||||
|
Markel Group, Inc. (a)
|
33,245
|
48,887,438
|
8.56
|
%
|
||||||||
|
|
187,700,090
|
32.84
|
%
|
|||||||||
|
Health Care – 0.69%
|
||||||||||||
|
Danaher Corp.
|
20,677
|
3,970,398
|
0.69
|
%
|
||||||||
|
Industrials – 15.16%
|
||||||||||||
|
American Woodmark Corp. (a)
|
405,322
|
27,249,797
|
4.77
|
%
|
||||||||
|
Ashtead Group PLC
|
751,544
|
42,969,382
|
7.51
|
%
|
||||||||
|
SS&C Technologies Holdings, Inc.
|
171,214
|
8,603,504
|
1.51
|
%
|
||||||||
|
TransDigm Group, Inc. (a)
|
8,873
|
7,347,643
|
1.29
|
%
|
||||||||
|
Veralto Corp. (a)
|
6,892
|
475,548
|
0.08
|
%
|
||||||||
|
|
86,645,874
|
15.16
|
%
|
|||||||||
|
Information Technology – 9.01%
|
||||||||||||
|
Applied Materials, Inc.
|
166,465
|
22,031,643
|
3.85
|
%
|
||||||||
|
CDW Corp.
|
147,147
|
29,488,259
|
5.16
|
%
|
||||||||
|
|
51,519,902
|
9.01
|
%
|
|||||||||
The accompanying notes are an integral part of these financial statements.
|
WWW.HENNESSYFUNDS.COM
|
10
|
SCHEDULE OF INVESTMENTS
|
|
COMMON STOCKS
|
Number
|
% of
|
||||||||||
|
|
of Shares
|
Value
|
Net Assets
|
|||||||||
|
Real Estate – 0.98%
|
||||||||||||
|
Altus Group Ltd.
|
164,995
|
$
|
5,603,941
|
0.98
|
%
|
|||||||
|
|
||||||||||||
|
Total Common Stocks
|
||||||||||||
|
(Cost $251,035,657)
|
516,883,889
|
90.42
|
%
|
|||||||||
|
|
||||||||||||
|
REITS – 7.96%
|
||||||||||||
|
Real Estate – 7.96%
|
||||||||||||
|
American Tower Corp., Class A
|
255,468
|
45,521,843
|
7.96
|
%
|
||||||||
|
|
||||||||||||
|
Total REITS
|
||||||||||||
|
(Cost $196,710)
|
45,521,843
|
7.96
|
%
|
|||||||||
|
|
||||||||||||
|
SHORT-TERM INVESTMENTS – 1.73%
|
||||||||||||
|
Money Market Funds – 1.73%
|
||||||||||||
|
First American Treasury Obligations Fund – Class X, 5.275% (b)
|
9,893,805
|
9,893,805
|
1.73
|
%
|
||||||||
|
|
||||||||||||
|
Total Short-Term Investments
|
||||||||||||
|
(Cost $9,893,805)
|
9,893,805
|
1.73
|
%
|
|||||||||
|
|
||||||||||||
|
Total Investments
|
||||||||||||
|
(Cost $261,126,172) – 100.11%
|
572,299,537
|
100.11
|
%
|
|||||||||
|
Liabilities in Excess of Other Assets – (0.11)%
|
(640,832
|
)
|
(0.11
|
)%
|
||||||||
|
TOTAL NET ASSETS – 100.00%
|
$
|
571,658,705
|
100.00
|
%
|
||||||||
Percentages are stated as a percent of net assets.
PLC – Public Limited Company
REIT – Real Estate Investment Trust
|
(a)
|
Non-income producing security.
|
|
(b)
|
The rate listed is the fund’s seven-day yield as of October 31, 2023.
|
|
(c)
|
Investment in affiliated security. Investment represents five percent or more of the outstanding voting securities of the issuer, making the issuer and affiliate of the Fund, as defined in the Investment Company
Act of 1940, as amended. Details of transactions with affiliated companies for the year ended October 31, 2023, are as follows:
|
|
Value at
|
Sales
|
Realized
|
|||||||||||||||
|
Common Stocks
|
November 1, 2022
|
Purchases
|
Proceeds
|
Gain/Loss
|
|||||||||||||
|
Encore Capital Group, Inc.(1)(2)
|
$
|
74,084,017
|
$
|
—
|
$
|
(22,153,191
|
)
|
$
|
5,831,829
|
||||||||
|
$
|
74,084,017
|
$
|
—
|
$
|
(22,153,191
|
)
|
$
|
5,831,829
|
|||||||||
|
Net Change
|
|||||||||||||||||
|
in Unrealized
|
Value at
|
||||||||||||||||
|
Appreciation /
|
October 31,
|
||||||||||||||||
|
Common Stocks
|
Depreciation
|
Dividends
|
2023
|
Shares
|
|||||||||||||
|
Encore Capital Group, Inc.(1)(2)
|
$
|
(19,323,667
|
)
|
$
|
—
|
$
|
38,438,988
|
1,020,143
|
|||||||||
|
$
|
(19,323,667
|
)
|
$
|
—
|
$
|
38,438,988
|
1,020,143
|
||||||||||
|
(1)
|
As of October 31, 2023, this security represented 6.72% of the Fund’s net assets.
|
|
(2)
|
At October 31, 2023, this security was no longer an affiliate of the Fund.
|
The accompanying notes are an integral part of these financial statements.
|
HENNESSY FUNDS
|
1-800-966-4354
|
11
Summary of Fair Value Exposure as of October 31, 2023
The following is a summary of the inputs used to value the Fund’s net assets as of October 31, 2023 (see Note 3 in the accompanying Notes to the Financial Statements):
|
Common Stocks
|
Level 1
|
Level 2
|
Level 3
|
Total
|
||||||||||||
|
Communication Services
|
$
|
60,667,664
|
$
|
—
|
$
|
—
|
$
|
60,667,664
|
||||||||
|
Consumer Discretionary
|
120,776,020
|
—
|
—
|
120,776,020
|
||||||||||||
|
Financials
|
187,700,090
|
—
|
—
|
187,700,090
|
||||||||||||
|
Health Care
|
3,970,398
|
—
|
—
|
3,970,398
|
||||||||||||
|
Industrials
|
86,645,874
|
—
|
—
|
86,645,874
|
||||||||||||
|
Information Technology
|
51,519,902
|
—
|
—
|
51,519,902
|
||||||||||||
|
Real Estate
|
5,603,941
|
—
|
—
|
5,603,941
|
||||||||||||
|
Total Common Stocks
|
$
|
516,883,889
|
$
|
—
|
$
|
—
|
$
|
516,883,889
|
||||||||
|
REITS
|
||||||||||||||||
|
Real Estate
|
$
|
45,521,843
|
$
|
—
|
$
|
—
|
$
|
45,521,843
|
||||||||
|
Total REITS
|
$
|
45,521,843
|
$
|
—
|
$
|
—
|
$
|
45,521,843
|
||||||||
|
Short-Term Investments
|
||||||||||||||||
|
Money Market Funds
|
$
|
9,893,805
|
$
|
—
|
$
|
—
|
$
|
9,893,805
|
||||||||
|
Total Short-Term Investments
|
$
|
9,893,805
|
$
|
—
|
$
|
—
|
$
|
9,893,805
|
||||||||
|
Total Investments
|
$
|
572,299,537
|
$
|
—
|
$
|
—
|
$
|
572,299,537
|
||||||||
The accompanying notes are an integral part of these financial statements.
|
WWW.HENNESSYFUNDS.COM
|
12
|
SCHEDULE OF INVESTMENTS/STATEMENT OF ASSETS AND LIABILITIES
|
Financial Statements
|
Statement of Assets and Liabilities as of October 31, 2023
|
|
ASSETS:
|
||||
|
Investments in securities, at value (cost $261,126,172)
|
$
|
572,299,537
|
||
|
Dividends and interest receivable
|
135,957
|
|||
|
Receivable for fund shares sold
|
259,619
|
|||
|
Receivable for securities sold
|
149,775
|
|||
|
Prepaid expenses and other assets
|
59,604
|
|||
|
Total assets
|
572,904,492
|
|||
|
LIABILITIES:
|
||||
|
Payable for fund shares redeemed
|
466,569
|
|||
|
Payable to advisor
|
454,305
|
|||
|
Payable to administrator
|
114,330
|
|||
|
Payable to auditor
|
22,749
|
|||
|
Accrued distribution fees
|
66,166
|
|||
|
Accrued service fees
|
31,508
|
|||
|
Accrued trustees fees
|
11,422
|
|||
|
Accrued expenses and other payables
|
78,738
|
|||
|
Total liabilities
|
1,245,787
|
|||
|
NET ASSETS
|
$
|
571,658,705
|
||
|
NET ASSETS CONSISTS OF:
|
||||
|
Capital stock
|
$
|
133,835,273
|
||
|
Total distributable earnings
|
437,823,432
|
|||
|
Total net assets
|
$
|
571,658,705
|
||
|
NET ASSETS:
|
||||
|
Investor Class
|
||||
|
Shares authorized (no par value)
|
Unlimited
|
|||
|
Net assets applicable to outstanding shares
|
$
|
357,132,729
|
||
|
Shares issued and outstanding
|
7,740,035
|
|||
|
Net asset value, offering price, and redemption price per share
|
$
|
46.14
|
||
|
Institutional Class
|
||||
|
Shares authorized (no par value)
|
Unlimited
|
|||
|
Net assets applicable to outstanding shares
|
$
|
214,525,976
|
||
|
Shares issued and outstanding
|
4,439,381
|
|||
|
Net asset value, offering price, and redemption price per share
|
$
|
48.32
|
||
The accompanying notes are an integral part of these financial statements.
|
HENNESSY FUNDS
|
1-800-966-4354
|
13
Financial Statements
|
Statement of Operations for the year ended October 31, 2023
|
|
INVESTMENT INCOME:
|
||||
|
Dividend income(1)
|
$
|
5,740,782
|
||
|
Interest income
|
468,014
|
|||
|
Total investment income
|
6,208,796
|
|||
|
EXPENSES:
|
||||
|
Investment advisory fees (See Note 5)
|
6,067,912
|
|||
|
Sub-transfer agent expenses – Investor Class (See Note 5)
|
877,658
|
|||
|
Sub-transfer agent expenses – Institutional Class (See Note 5)
|
237,606
|
|||
|
Administration, accounting, custody, and transfer agent fees (See Note 5)
|
638,712
|
|||
|
Distribution fees – Investor Class (See Note 5)
|
622,366
|
|||
|
Service fees – Investor Class (See Note 5)
|
414,910
|
|||
|
Federal and state registration fees
|
46,761
|
|||
|
Reports to shareholders
|
46,532
|
|||
|
Trustees' fees and expenses
|
26,941
|
|||
|
Audit fees
|
22,755
|
|||
|
Compliance expense (See Note 5)
|
22,668
|
|||
|
Legal fees
|
16,068
|
|||
|
Interest expense (See Note 7)
|
1,138
|
|||
|
Other expenses
|
134,486
|
|||
|
Total expenses
|
9,176,513
|
|||
|
NET INVESTMENT LOSS
|
$
|
(2,967,717
|
)
|
|
|
REALIZED AND UNREALIZED GAINS (LOSSES):
|
||||
|
Net realized gain on investments:
|
||||
|
Unaffiliated investments
|
$
|
149,534,219
|
||
|
Affiliated investments
|
5,831,829
|
|||
|
Net change in unrealized appreciation/depreciation on investments
|
||||
|
Unaffiliated investments
|
(99,246,808
|
)
|
||
|
Affiliated investments
|
(19,323,667
|
)
|
||
|
Net gain on investments
|
36,795,573
|
|||
|
NET INCREASE IN NET ASSETS RESULTING FROM OPERATIONS
|
$
|
33,827,856
|
||
|
(1)
|
Net of foreign taxes withheld of $135,044.
|
The accompanying notes are an integral part of these financial statements.
|
WWW.HENNESSYFUNDS.COM
|
14
|
STATEMENT OF OPERATIONS/STATEMENTS OF CHANGES IN NET ASSETS
|
Financial Statements
|
Statements of Changes in Net Assets
|
|
Year Ended
|
Year Ended
|
|||||||
|
October 31, 2023
|
October 31, 2022
|
|||||||
|
OPERATIONS:
|
||||||||
|
Net investment loss
|
$
|
(2,967,717
|
)
|
$
|
(7,213,114
|
)
|
||
|
Net realized gain on investments
|
155,366,048
|
107,121,107
|
||||||
|
Net change in unrealized
|
||||||||
|
appreciation/depreciation on investments
|
(118,570,475
|
)
|
(377,001,093
|
)
|
||||
|
Net increase (decrease) in net
|
||||||||
|
assets resulting from operations
|
33,827,856
|
(277,093,100
|
)
|
|||||
|
DISTRIBUTIONS TO SHAREHOLDERS:
|
||||||||
|
Distributable earnings – Investor Class
|
(55,979,529
|
)
|
(102,832,917
|
)
|
||||
|
Distributable earnings – Institutional Class
|
(38,238,761
|
)
|
(74,423,824
|
)
|
||||
|
Total distributions
|
(94,218,290
|
)
|
(177,256,741
|
)
|
||||
|
CAPITAL SHARE TRANSACTIONS:
|
||||||||
|
Proceeds from shares subscribed – Investor Class
|
5,238,833
|
13,194,104
|
||||||
|
Proceeds from shares subscribed – Institutional Class
|
33,286,516
|
64,242,530
|
||||||
|
Dividends reinvested – Investor Class
|
54,418,112
|
100,142,196
|
||||||
|
Dividends reinvested – Institutional Class
|
35,095,377
|
68,169,964
|
||||||
|
Cost of shares redeemed – Investor Class
|
(97,262,475
|
)
|
(125,473,751
|
)
|
||||
|
Cost of shares redeemed – Institutional Class
|
(139,348,625
|
)
|
(133,218,468
|
)
|
||||
|
Net decrease in net assets derived
|
||||||||
|
from capital share transactions
|
(108,572,262
|
)
|
(12,943,425
|
)
|
||||
|
TOTAL DECREASE IN NET ASSETS
|
(168,962,696
|
)
|
(467,293,266
|
)
|
||||
|
NET ASSETS:
|
||||||||
|
Beginning of year
|
740,621,401
|
1,207,914,667
|
||||||
|
End of year
|
$
|
571,658,705
|
$
|
740,621,401
|
||||
|
CHANGES IN SHARES OUTSTANDING:
|
||||||||
|
Shares sold – Investor Class
|
107,578
|
208,254
|
||||||
|
Shares sold – Institutional Class
|
655,626
|
993,681
|
||||||
|
Shares issued to holders as reinvestment
|
||||||||
|
of dividends – Investor Class
|
1,168,021
|
1,451,336
|
||||||
|
Shares issued to holders as reinvestment
|
||||||||
|
of dividends – Institutional Class
|
721,682
|
950,104
|
||||||
|
Shares redeemed – Investor Class
|
(1,980,392
|
)
|
(2,029,388
|
)
|
||||
|
Shares redeemed – Institutional Class
|
(2,730,525
|
)
|
(2,110,055
|
)
|
||||
|
Net decrease in shares outstanding
|
(2,058,010
|
)
|
(536,068
|
)
|
||||
The accompanying notes are an integral part of these financial statements.
|
HENNESSY FUNDS
|
1-800-966-4354
|
15
Financial Statements
|
Financial Highlights
|
For an Investor Class share outstanding throughout each year
PER SHARE DATA:
Net asset value, beginning of year
Income from investment operations:
Net investment loss(1)
Net realized and unrealized gains (losses) on investments
Total from investment operations
Less distributions:
Dividends from net realized gains
Total distributions
Net asset value, end of year
TOTAL RETURN
SUPPLEMENTAL DATA AND RATIOS:
Net assets, end of year (millions)
Ratio of expenses to average net assets
Ratio of net investment loss to average net assets
Portfolio turnover rate(2)
|
(1)
|
Calculated using the average shares outstanding method.
|
|
(2)
|
Calculated on the basis of the Fund as a whole.
|
The accompanying notes are an integral part of these financial statements.
|
WWW.HENNESSYFUNDS.COM
|
16
|
FINANCIAL HIGHLIGHTS — INVESTOR CLASS
|
|
Year Ended October 31,
|
||||||||||||||||||
|
2023
|
2022
|
2021
|
2020
|
2019
|
||||||||||||||
|
$
|
51.12
|
$
|
80.48
|
$
|
71.68
|
$
|
85.11
|
$
|
83.20
|
|||||||||
|
(0.29
|
)
|
(0.56
|
)
|
(0.63
|
)
|
(0.66
|
)
|
(0.52
|
)
|
|||||||||
|
2.15
|
(16.93
|
)
|
31.46
|
(4.21
|
)
|
16.90
|
||||||||||||
|
1.86
|
(17.49
|
)
|
30.83
|
(4.87
|
)
|
16.38
|
||||||||||||
|
(6.84
|
)
|
(11.87
|
)
|
(22.03
|
)
|
(8.56
|
)
|
(14.47
|
)
|
|||||||||
|
(6.84
|
)
|
(11.87
|
)
|
(22.03
|
)
|
(8.56
|
)
|
(14.47
|
)
|
|||||||||
|
$
|
46.14
|
$
|
51.12
|
$
|
80.48
|
$
|
71.68
|
$
|
85.11
|
|||||||||
|
3.52
|
%
|
-25.55
|
%
|
52.87
|
%
|
-6.79
|
%
|
24.16
|
%
|
|||||||||
|
$
|
357.13
|
$
|
431.67
|
$
|
709.40
|
$
|
678.72
|
$
|
1,213.20
|
|||||||||
|
1.50
|
%
|
1.52
|
%
|
1.49
|
%
|
1.51
|
%
|
1.47
|
%
|
|||||||||
|
(0.58
|
)%
|
(0.92
|
)%
|
(0.88
|
)%
|
(0.88
|
)%
|
(0.67
|
)%
|
|||||||||
|
12
|
%
|
5
|
%
|
4
|
%
|
5
|
%
|
2
|
%
|
|||||||||
The accompanying notes are an integral part of these financial statements.
|
HENNESSY FUNDS
|
1-800-966-4354
|
17
Financial Statements
|
Financial Highlights
|
For an Institutional Class share outstanding throughout each year
PER SHARE DATA:
Net asset value, beginning of year
Income from investment operations:
Net investment loss(1)
Net realized and unrealized gains (losses) on investments
Total from investment operations
Less distributions:
Dividends from net realized gains
Total distributions
Net asset value, end of year
TOTAL RETURN
SUPPLEMENTAL DATA AND RATIOS:
Net assets, end of year (millions)
Ratio of expenses to average net assets
Ratio of net investment loss to average net assets
Portfolio turnover rate(2)
|
(1)
|
Calculated using the average shares outstanding method.
|
|
(2)
|
Calculated on the basis of the Fund as a whole.
|
The accompanying notes are an integral part of these financial statements.
|
WWW.HENNESSYFUNDS.COM
|
18
|
FINANCIAL HIGHLIGHTS — INSTITUTIONAL CLASS
|
|
Year Ended October 31,
|
||||||||||||||||||
|
2023
|
2022
|
2021
|
2020
|
2019
|
||||||||||||||
|
$
|
53.34
|
$
|
83.66
|
$
|
74.24
|
$
|
87.83
|
$
|
85.66
|
|||||||||
|
(0.11
|
)
|
(0.34
|
)
|
(0.37
|
)
|
(0.39
|
)
|
(0.25
|
)
|
|||||||||
|
2.23
|
(17.63
|
)
|
32.62
|
(4.36
|
)
|
17.41
|
||||||||||||
|
2.12
|
(17.97
|
)
|
32.25
|
(4.75
|
)
|
17.16
|
||||||||||||
|
(7.14
|
)
|
(12.35
|
)
|
(22.83
|
)
|
(8.84
|
)
|
(14.99
|
)
|
|||||||||
|
(7.14
|
)
|
(12.35
|
)
|
(22.83
|
)
|
(8.84
|
)
|
(14.99
|
)
|
|||||||||
|
$
|
48.32
|
$
|
53.34
|
$
|
83.66
|
$
|
74.24
|
$
|
87.83
|
|||||||||
|
3.90
|
%
|
-25.27
|
%
|
53.43
|
%
|
-6.45
|
%
|
24.59
|
%
|
|||||||||
|
$
|
214.53
|
$
|
308.95
|
$
|
498.51
|
$
|
387.55
|
$
|
586.25
|
|||||||||
|
1.13
|
%
|
1.13
|
%
|
1.12
|
%
|
1.14
|
%
|
1.12
|
%
|
|||||||||
|
(0.22
|
)%
|
(0.53
|
)%
|
(0.50
|
)%
|
(0.51
|
)%
|
(0.32
|
)%
|
|||||||||
|
12
|
%
|
5
|
%
|
4
|
%
|
5
|
%
|
2
|
%
|
|||||||||
The accompanying notes are an integral part of these financial statements.
|
HENNESSY FUNDS
|
1-800-966-4354
|
19
Financial Statements
|
Notes to the Financial Statements October 31, 2023
|
1). ORGANIZATION
The Hennessy Focus Fund (the “Fund”) is a series of Hennessy Funds Trust (the “Trust”), which was organized as a Delaware statutory trust on September 17, 1992. The Fund is an open-end management investment company
registered under the Investment Company Act of 1940, as amended. The investment objective of the Fund is capital appreciation. The Fund is a non-diversified fund.
The Fund offers Investor Class and Institutional Class shares. Each class of shares differs principally in its respective 12b-1 distribution and service, shareholder servicing, and sub-transfer agent
expenses. There are no sales charges. Each class has identical rights to earnings, assets, and voting privileges, except for class-specific expenses and exclusive rights to vote on matters affecting only one class.
As an investment company, the Fund follows the investment company accounting and reporting guidance of the Financial Accounting Standards Board (the “FASB”) Accounting Standard Codification Topic 946
“Financial Services—Investment Companies.”
2). SIGNIFICANT ACCOUNTING POLICIES
The following is a summary of significant accounting policies consistently followed by the Fund in the preparation of the financial statements. These policies conform to U.S. generally accepted accounting principles
(“GAAP”).
|
a).
|
Securities Valuation – All investments in securities are valued in accordance with the Fund’s valuation policies and procedures, as described in Note 3.
|
|
b).
|
Federal Income Taxes – The Fund has elected to be taxed as a regulated investment company and intends to distribute substantially all of its taxable income to its shareholders and otherwise comply with the
provisions of the Internal Revenue Code of 1986, as amended, applicable to regulated investment companies. As a result, the Fund has made no provision for federal income taxes or excise taxes. Net investment income/loss and realized
gains/losses for federal income tax purposes may differ from those reported in the financial statements because of temporary book-basis and tax-basis differences. Temporary differences are primarily the result of the treatment of wash sales
for tax reporting purposes. The Fund recognizes interest and penalties related to income tax benefits, if any, in the Statement of Operations as an income tax expense. Distributions from net realized gains for book purposes may include
short-term capital gains, which are included as ordinary income to shareholders for tax purposes. The Fund may utilize equalization accounting for tax purposes and designate earnings and profits, including net realized gains distributed to
shareholders on redemption of shares, as part of the dividends paid deduction for income tax purposes.
|
|
Due to inherent differences in the recognition of income, expenses, and realized gains/losses under GAAP and federal income tax regulations, permanent differences between book and tax
basis for reporting are identified and appropriately reclassified in the Statement of Assets and Liabilities, as needed. The adjustments for fiscal year 2023 are as follows:
|
|
Total
|
|||
|
Distributable
|
|||
|
Earnings
|
Capital Stock
|
||
|
$(11,633,790)
|
$11,633,790
|
|
WWW.HENNESSYFUNDS.COM
|
20
|
NOTES TO THE FINANCIAL STATEMENTS
|
|
c).
|
Accounting for Uncertainty in Income Taxes – The Fund has accounting policies regarding recognition and measurement of tax positions taken or expected to be taken on a tax return. The tax returns of the Fund for
the prior three fiscal years are open for examination. The Fund has reviewed all open tax years in major tax jurisdictions and concluded that there is no impact on the Fund’s net assets and no tax liability resulting from unrecognized tax
benefits relating to uncertain income tax positions taken or expected to be taken on a tax return. The Fund’s major tax jurisdictions are U.S. federal and Delaware.
|
|
d).
|
Income and Expenses – Dividend income is recognized on the ex-dividend date or as soon as information is available to the Fund. Interest income, which includes the amortization of premium and accretion of
discount, is recognized on an accrual basis. Market discounts, original issue discounts, and market premiums on debt securities are accreted or amortized to interest income over the life of a security with a corresponding increase or
decrease, as applicable, in the cost basis of such security using the yield-to-maturity method or, where applicable, the first call date of the security. Other non-cash dividends are recognized as investment income at the fair value of the
property received. The Fund is charged for those expenses that are directly attributable to its portfolio, such as advisory, administration, and certain shareholder service fees. Income, expenses (other than expenses attributable to a
specific class), and realized and unrealized gains/losses on investments are allocated to each class of shares based on such class’s net assets.
|
|
e).
|
Distributions to Shareholders – Dividends from net investment income for the Fund, if any, are declared and paid annually, usually in December. Distributions of net realized capital gains, if any, are declared and
paid annually, usually in December.
|
|
f).
|
Security Transactions – Investment and shareholder transactions are recorded on the trade date. The Fund determines the realized gain/loss from an investment transaction by comparing the original cost of the
security lot sold with the net sale proceeds. Discounts and premiums on securities purchased are accreted or amortized, respectively, over the life of each such security.
|
|
g).
|
Use of Estimates – Preparing financial statements in accordance with GAAP requires management to make estimates and assumptions that affect the reported amounts of assets and liabilities and disclosure of
contingent assets and liabilities at the date of the financial statements, as well as the reported change in net assets during the reporting period. Actual results could differ from those estimates.
|
|
h).
|
Share Valuation – The net asset value (“NAV”) per share of the Fund is calculated by dividing (i) the total value of the securities held by the Fund, plus cash and other assets, minus all liabilities (including
estimated accrued expenses) by (ii) the total number of Fund shares outstanding, rounded to the nearest $0.01. Fund shares are not priced on days the New York Stock Exchange is closed for trading. The offering and redemption price per share
for the Fund is equal to the Fund’s NAV per share.
|
|
i).
|
Foreign Currency – Values of investments denominated in foreign currencies are converted into U.S. dollars using the spot market exchange rate at the time of valuation. Purchases and sales of investments and
income are translated into U.S. dollars using the spot market exchange rate prevailing on the respective dates of such transactions. The Fund does not isolate the portion of the results of operations resulting from fluctuations in foreign
exchange rates on investments from fluctuations resulting from changes in the market prices of securities held. Such fluctuations are included with the net realized and unrealized gain/loss on
|
|
HENNESSY FUNDS
|
1-800-966-4354
|
21
|
investments. Foreign investments present additional risks due to currency fluctuations, economic and political factors, lower liquidity, government regulations, differences in accounting standards, and other
factors.
|
|
|
j).
|
REIT Equity Securities – Distributions received from real estate investment trusts (“REITs”) may be classified as dividends, capital gains, or return of capital. Investments in REITs may require the Fund to accrue
and distribute income not yet received. To generate sufficient cash to make any required distributions, the Fund may be required to sell securities in its portfolio (including when it is not advantageous to do so) that it otherwise would
have continued to hold. At other times, investments in a REIT may result in the Fund’s receipt of cash in excess of the REIT’s earnings. If the Fund distributes these amounts, these distributions could constitute a return of capital to Fund
shareholders for U.S. federal income tax purposes. Dividends received by the Fund from a REIT generally do not constitute qualified dividend income and do not qualify for the dividends-received deduction.
|
|
k).
|
Illiquid Securities – Pursuant to Rule 22e-4 under the 1940 Act, the Fund has adopted a Liquidity Risk Management Program (the “Liquidity Program”). The Liquidity Program requires, among other things, that the
Fund limit its illiquid investments to no more than 15% of its net assets. An illiquid investment is any investment that the Fund reasonably expects cannot be sold or disposed of by the Fund in current market conditions in seven calendar
days or less without the sale or disposition significantly changing the market value of the investment.
|
|
l).
|
Recent Accounting Pronouncements and Regulatory Updates – In October 2022, the Securities and Exchange Commission (“SEC”) adopted a final rule relating to Tailored Shareholder Reports for Mutual Funds and
Exchange-Traded Funds (ETFs); Fee Information in Investment Company Advertisements. The rule and form amendments will require mutual funds and ETFs to transmit concise and visually engaging shareholder reports that highlight key
information. The amendments also will require that funds tag information in a structured data format. In addition, the rule amendments will require that certain more in-depth information be made available online and available for delivery
free of charge to investors on request. The amendments became effective January 24, 2023. There is an 18-month transition period after the effective date of the amendment.
|
|
In June 2022, the FASB issued Accounting Standards Update (“ASU”) 2022-03, Fair Value Measurement (Topic 820): Fair Value Measurement of Equity Securities Subject to Contractual Sale
Restrictions. The ASU clarifies that a contractual restriction on the sale of an equity security is not considered part of the unit of account of the equity security and, therefore, is not considered in measuring the fair value. The
amendments also require additional disclosures related to equity securities subject to contractual sale restrictions. The ASU is effective for fiscal years beginning after December 15, 2023, and interim periods within those fiscal years.
|
3). SECURITIES VALUATION
The Fund follows its valuation policies and procedures in determining its NAV and, in preparing these financial statements, the fair value accounting standards that establish an authoritative definition of fair value and
set out a hierarchy for measuring fair value. These standards require additional disclosures about the various inputs and valuation techniques used to develop the measurements of fair value and a discussion of changes in valuation techniques and
related inputs during the period. These inputs are summarized in the three broad levels listed below:
|
WWW.HENNESSYFUNDS.COM
|
22
|
NOTES TO THE FINANCIAL STATEMENTS
|
|
Level 1 –
|
Unadjusted, quoted prices in active markets for identical instruments that the Fund has the ability to access at the date of measurement.
|
|
|
Level 2 –
|
Other significant observable inputs other than quoted prices included in Level 1 (including, but not limited to, quoted prices in active markets for similar instruments, quoted prices in markets that are not
active for identical or similar instruments, and model-derived valuations in which all significant inputs and significant value drivers are observable in active markets, such as interest rates, prepayment speeds, credit risk curves, default
rates, and similar data).
|
|
|
Level 3 –
|
Significant unobservable inputs (including the Fund’s own assumptions about what market participants would use to price the asset or liability based on the best available information) when observable inputs are
unavailable.
|
The following is a description of the valuation techniques applied to the Fund’s major categories of assets and liabilities on a recurring basis:
|
Equity Securities – Equity securities, including common stocks, preferred stocks, foreign-issued common stocks, exchange-traded funds, closed-end mutual funds,
partnerships, rights, and real estate investment trusts, that are traded on a securities exchange for which a last-quoted sales price is readily available generally are valued at the last sales price as reported by the primary exchange on
which the securities are listed. Securities listed on The Nasdaq Stock Market (“Nasdaq”) generally are valued at the Nasdaq Official Closing Price, which may differ from the last sales price reported. Securities traded on a securities
exchange for which a last-quoted sales price is not readily available generally are valued at the mean between the bid and ask prices. To the extent these securities are actively traded and valuation adjustments are not applied, they are
classified in Level 1 of the fair value hierarchy. Securities traded on foreign exchanges generally are not valued at the same time the Fund calculates its NAV because most foreign markets close well before such time. The earlier close of
most foreign markets gives rise to the possibility that significant events, including broad market moves, may have occurred in the interim. In certain circumstances, it may be determined that a foreign security needs to be fair valued
because it appears that the value of the security might have been materially affected by events occurring after the close of the market in which the security is principally traded, but before the time the Fund calculates its NAV, such as by
a development that affects an entire market or region (e.g., a weather-related event) or a potentially global development (e.g., a terrorist attack that may be expected to have an effect on investor expectations worldwide).
|
|
|
Registered Investment Companies – Investments in open-end registered investment companies, commonly referred to as mutual funds, generally are priced at the ending NAV
provided by the applicable mutual fund’s service agent and are classified in Level 1 of the fair value hierarchy.
|
|
|
Debt Securities – Debt securities, including corporate bonds, asset-backed securities, mortgage-backed securities, municipal bonds, U.S. Treasuries, and U.S. government
agency issues, are generally valued at market on the basis of valuations furnished by an independent pricing service that utilizes both dealer-supplied valuations and formula-based techniques. The pricing service may consider recently
executed transactions in securities of the issuer or comparable issuers, market price quotations (where observable), bond spreads, and fundamental data relating to the issuer. In addition, the model may incorporate observable market data,
such as reported sales
|
|
HENNESSY FUNDS
|
1-800-966-4354
|
23
|
of similar securities, broker quotes, yields, bids, offers, and reference data. Certain securities are valued primarily using dealer quotations. These securities are generally classified in Level 2 of the fair
value hierarchy.
|
|
|
Short-Term Securities – Short-term equity investments, including money market funds, are valued in the manner specified above for equity securities. Short-term debt
investments with an original term to maturity of 60 days or less are valued at amortized cost, which approximates fair market value. If the original term to maturity of a short-term debt investment exceeds 60 days, then the values as of the
61st day prior to maturity are amortized. Amortized cost is not used if its use would be inappropriate due to credit or other impairments of the issuer, in which case the security’s fair value would be determined as described below.
Short-term securities are generally classified in Level 1 or Level 2 of the fair value hierarchy depending on the inputs used and market activity levels for specific securities.
|
If market quotations are not readily available or if a significant event has occurred that indicates the closing price of a security no longer represents the true value of that security, any security or
other asset will be valued at its fair value in accordance with Rule 2a-5 under the 1940 Act. The Board of Trustees of the Fund (the “Board”) has designated Hennessy Advisors, Inc. (the “Advisor”) as the Fund’s valuation designee to make all fair
value determinations with respect to the Fund’s portfolio investments under the Fund’s fair value pricing procedures, subject to the Board’s oversight. There are numerous criteria considered in determining a fair value of a security, such as the
trading volume of a security and markets, the values of other similar securities, and news events with direct bearing on a security or markets. Fair value pricing results in an estimated price for a security that reflects the amount the Fund might
reasonably expect to receive in a current sale. Depending on the relative significance of the valuation inputs, these securities may be classified in either Level 2 or Level 3 of the fair value hierarchy. The Advisor will regularly evaluate whether
the Fund’s fair value pricing procedures continue to be appropriate in light of the specific circumstances of the Fund and the quality of prices obtained through their application of such procedures.
The fair value of foreign securities may be determined with the assistance of a pricing service using correlations between the movement of prices of such securities and indices of domestic securities
and other appropriate indicators, such as closing market prices of relevant American Depositary Receipts or futures contracts. Using fair value pricing means that the Fund’s NAV reflects the affected portfolio securities’ values as determined by
the Advisor, the Board’s valuation designee, pursuant to the Fund’s fair value pricing procedures, instead of being determined by the market. Using a fair value pricing methodology to price a foreign security may result in a value that is different
from such foreign security’s most recent closing price and from the value used by other investment companies to calculate their NAVs. Such securities are generally classified in Level 2 of the fair value hierarchy. Because the Fund may invest in
foreign securities, the value of the Fund’s portfolio securities may change on days when a shareholder is unable to purchase or redeem Fund shares.
The Fund has performed an analysis of all existing investments to determine the significance and character of all inputs to their fair value determinations. Various inputs are used to determine the
value of the Fund’s investments. The inputs or methodology used for valuing securities are not necessarily an indication of the risk associated with investing in those securities. Details related to the fair value hierarchy of the Fund’s securities
as of October 31, 2023, are included in the Schedule of Investments.
|
WWW.HENNESSYFUNDS.COM
|
24
|
NOTES TO THE FINANCIAL STATEMENTS
|
4). INVESTMENT TRANSACTIONS
Purchases and sales of investment securities (excluding government and short-term investments) for the Fund during fiscal year 2023 were $81,297,029 and $280,517,998, respectively.
There were no purchases or sales/maturities of long-term U.S. government securities for the Fund during fiscal year 2023.
5). INVESTMENT ADVISORY FEE AND OTHER TRANSACTIONS WITH AFFILIATES
The Advisor provides the Fund with investment advisory services under an Investment Advisory Agreement. The Advisor oversees the provision of investment advice and furnishes office space, facilities, and most of the
personnel needed by the Fund. As compensation for its services, the Advisor is entitled to a monthly fee from the Fund. The fee is based on the average daily net assets of the Fund at an annual rate of 0.90%. The net investment advisory fees
expensed by the Fund during fiscal year 2023 are included in the Statement of Operations.
The Advisor has delegated the day-to-day management of the Fund to a sub-advisor, Broad Run Investment Management, LLC. The Advisor pays the sub-advisory fees from its own assets, and these fees are not
an additional expense of the Fund. During fiscal year 2023, the Advisor (not the Fund) paid a sub-advisory fee at the rate of 0.29% of the daily net assets of the Fund.
The Board has approved a Shareholder Servicing Agreement for Investor Class shares of the Fund, which compensates the Advisor for the non-investment advisory services it provides to the Fund. The
Shareholder Servicing Agreement provides for a monthly fee paid to the Advisor at an annual rate of 0.10% of the average daily net assets of the Fund attributable to Investor Class shares. The shareholder service fees expensed by the Fund during
fiscal year 2023 are included in the Statement of Operations.
The Fund has adopted a plan pursuant to Rule 12b-1 under the Investment Company Act of 1940, as amended, that authorizes payments in connection with the distribution of Fund shares at an annual rate of
up to 0.25% of the Fund’s average daily net assets attributable to Investor Class shares. Even though the authorized rate is up to 0.25%, the Fund is currently only using up to 0.15% of its average daily net assets attributable to Investor Class
shares for such purpose. Amounts paid under the plan may be spent on any activities or expenses primarily intended to result in the sale of shares, including, but not limited to, advertising, shareholder account servicing, printing and mailing of
prospectuses to other than current shareholders, printing and mailing of sales literature, and compensation for sales and marketing activities or to financial institutions and others, such as dealers and distributors. The distribution fees expensed
by the Fund during fiscal year 2023 are included in the Statement of Operations.
The Fund has entered into agreements with various brokers, dealers, and financial intermediaries in connection with the sale of Fund shares. The agreements provide for periodic payments of sub-transfer
agent expenses by the Fund to the brokers, dealers, and financial intermediaries for providing certain shareholder maintenance services. These shareholder services include the pre-processing and quality control of new accounts, shareholder
correspondence, answering customer inquiries regarding account status, and facilitating shareholder telephone transactions. The sub-transfer agent fees expensed by the Fund during fiscal year 2023 are included in the Statement of Operations.
U.S. Bancorp Fund Services, LLC, d/b/a U.S. Bank Global Fund Services (“Fund Services”) provides the Fund with administrative, accounting, and transfer agent services. As administrator, Fund Services is
responsible for activities such as (i) preparing various
|
HENNESSY FUNDS
|
1-800-966-4354
|
25
federal and state regulatory filings, reports, and returns for the Fund, (ii) preparing reports and materials to be supplied to the Board, (iii) monitoring the activities of the Fund’s custodian, transfer agent, and
accountants, and (iv) coordinating the preparation and payment of the Fund’s expenses and reviewing the Fund’s expense accruals. U.S. Bank N.A., an affiliate of Fund Services, serves as the Fund’s custodian. The servicing agreements between the
Trust, Fund Services, and U.S. Bank N.A. contain a fee schedule that is inclusive of administrative, accounting, custody, and transfer agent fees. The administrative, accounting, custody, and transfer agent fees expensed by the Fund during fiscal
year 2023 are included in the Statement of Operations.
Quasar Distributors, LLC, a wholly owned broker-dealer subsidiary of Foreside Financial Group, LLC, acts as the Fund’s principal underwriter in a continuous public offering of Fund shares.
The officers of the Fund are affiliated with the Advisor. With the exception of the Chief Compliance Officer, such officers receive no compensation from the Fund for serving in their respective roles.
The Fund, along with the other funds in the Hennessy Funds family (collectively, the “Hennessy Funds”), makes reimbursement payments on an equal basis to the Advisor for a portion of the salary and benefits associated with the office of the Chief
Compliance Officer. The compliance fees expensed by the Fund during fiscal year 2023 for reimbursement payments to the Advisor are included in the Statement of Operations.
6). GUARANTEES AND INDEMNIFICATIONS
Under the Hennessy Funds’ organizational documents, their officers and trustees are indemnified by the Hennessy Funds against certain liabilities arising out of the performance of their duties to the Hennessy Funds.
Additionally, in the normal course of business, the Hennessy Funds enter into contracts with service providers that contain general indemnification clauses. The Fund’s maximum exposure under these arrangements is unknown as this would involve
future claims that may be made against the Fund that have not yet occurred. Currently, the Fund expects the risk of loss to be remote.
7). LINE OF CREDIT
The Fund has an uncommitted line of credit with the other Hennessy Funds in the amount of the lesser of (i) $100,000,000 or (ii) 33.33% of each Hennessy Fund’s net assets, or 30% for the Hennessy Gas Utility Fund, the
Hennessy Japan Fund, and the Hennessy Japan Small Cap Fund and 10% for the Hennessy Balanced Fund. The line of credit is intended to provide any necessary short-term financing in connection with shareholder redemptions, subject to certain
restrictions. The credit facility is with the Hennessy Funds’ custodian bank, U.S. Bank N.A. Borrowings under this arrangement bear interest at the bank’s prime rate and are secured by all of the Fund’s assets (as to its own borrowings only).
During fiscal year 2023, the Fund had an outstanding average daily balance and a weighted average interest rate of $14,964 and 7.50%, respectively. The interest expensed by the Fund during fiscal year 2023 is included in the Statement of
Operations. The maximum amount outstanding for the Fund during fiscal year 2023 was $2,768,000. As of October 31, 2023, the Fund did not have any borrowings outstanding under the line of credit.
|
WWW.HENNESSYFUNDS.COM
|
26
|
NOTES TO THE FINANCIAL STATEMENTS
|
8). FEDERAL TAX INFORMATION
As of October 31, 2023, the components of accumulated earnings (losses) for income tax purposes were as follows:
|
Investments
|
|||||
|
Cost of investments for tax purposes
|
$
|
261,126,172
|
|||
|
Gross tax unrealized appreciation
|
$
|
324,894,701
|
|||
|
Gross tax unrealized depreciation
|
(13,721,336
|
)
|
|||
|
Net tax unrealized appreciation/(depreciation)
|
$
|
311,173,365
|
|||
|
Undistributed ordinary income
|
$
|
—
|
|||
|
Undistributed long-term capital gains
|
129,052,636
|
||||
|
Total distributable earnings
|
$
|
129,052,636
|
|||
|
Other accumulated gain/(loss)
|
$
|
(2,402,569
|
)
|
||
|
Total accumulated gain/(loss)
|
$
|
437,823,432
|
|||
As of October 31, 2023, the Fund had no tax-basis capital losses to offset future capital gains.
As of October 31, 2023, the Fund deferred, on a tax basis, a late-year ordinary loss of $2,402,569. Late-year ordinary losses are net ordinary losses incurred after December 31, 2022, but within the
taxable year, that are deemed to arise on the first day of the Fund’s next taxable year.
During fiscal years 2023 and 2022, the tax character of distributions paid by the Fund was as follows:
|
Year Ended
|
Year Ended
|
||||||||
|
October 31, 2023
|
October 31, 2022
|
||||||||
|
Ordinary income(1)
|
$
|
—
|
$
|
—
|
|||||
|
Long-term capital gains
|
94,218,290
|
177,256,741
|
|||||||
|
Total distributions
|
$
|
94,218,290
|
$
|
177,256,741
|
|||||
|
(1) Ordinary income includes short-term capital gains.
|
|||||||||
9). GLOBAL EVENTS
A rise in protectionist trade policies, the possibility of a national or global recession, risks associated with pandemic and epidemic diseases, trade tensions, the possibility of changes to some international trade
agreements, political events, and continuing political tension and armed conflicts may adversely impact financial markets and the broader economy. For example, ongoing armed conflicts between Ukraine and Russia in Europe and among Israel, Hamas,
and other militant groups in the Middle East have caused and could continue to cause significant market disruptions and volatility with the markets in Europe and the Middle East, and have had negative impacts on markets in the United States. These
events could also have negative effects on the Fund’s investments that cannot be foreseen at the present time. As global systems, economies and financial markets are increasingly interconnected, events that once had only local impact are now more
likely to have regional or even global effects. Events that occur in one country, region or financial market will, more frequently, adversely impact issuers in other countries, regions, or markets. These impacts can be exacerbated by failures of
governments and societies to adequately respond to an emerging event or threat. Your investment would be negatively impacted if the value of your portfolio holdings decreases as a result of such events, if these events adversely impact the
operations and effectiveness of the Advisor or other key service providers or if these events disrupt systems and processes necessary or beneficial
|
HENNESSY FUNDS
|
1-800-966-4354
|
27
to the management of accounts. These events may negatively impact broad segments of businesses and populations and could have a significant and rapid negative impact on the performance of the Fund’s investments, increase
the Fund’s volatility, or exacerbate pre-existing risks to the Fund.
10). EVENTS SUBSEQUENT TO YEAR END
Management has evaluated the Fund’s related events and transactions that occurred subsequent to October 31, 2023, through the date of issuance of the Fund’s financial statements. Other than as disclosed below, management
has determined that there were no subsequent events requiring recognition or disclosure in the financial statements.
On December 7, 2023, capital gains were declared and paid to shareholders of record on December 6, 2023, as follows:
|
Long-term
|
|||
|
Investor Class
|
10.60940
|
||
|
Institutional Class
|
11.11527
|
|
WWW.HENNESSYFUNDS.COM
|
28
|
NOTES/REPORT OF INDEPENDENT REGISTERED PUBLIC ACCOUNTING FIRM
|
Report of Independent Registered Public
Accounting Firm
To the Board of Trustees of Hennessy Funds Trust
and the shareholders of the Hennessy Focus Fund
Novato, CA
Opinion on the Financial Statements
We have audited the accompanying statement of assets and liabilities of the Hennessy Focus Fund (the “Fund”), a series of Hennessy Funds Trust, including the schedule of investments, as of October 31, 2023, the related
statement of operations for the year then ended, the statements of changes in net assets for each of the two years in the period then ended, financial highlights for each of the five years in the period then ended, and the related notes
(collectively referred to as the “financial statements”). In our opinion, the financial statements present fairly, in all material respects, the financial position of the Fund as of October 31, 2023, the results of its operations for the year then
ended, the changes in its net assets for each of the two years in the period then ended, and the financial highlights for each of the five years in the period then ended, in conformity with accounting principles generally accepted in the United
States of America.
Basis for Opinion
These financial statements are the responsibility of the Fund’s management. Our responsibility is to express an opinion on the Fund’s financial statements based on our audits. We are a public accounting firm registered
with the Public Company Accounting Oversight Board (United States) (“PCAOB”) and are required to be independent with respect to the Fund in accordance with the U.S. federal securities laws and the applicable rules and regulations of the Securities
and Exchange Commission and the PCAOB. We have served as the auditor of one or more of the funds in the Trust since 2002.
We conducted our audits in accordance with the standards of the PCAOB. Those standards require that we plan and perform the audit to obtain reasonable assurance about whether the financial statements are free of material
misstatement, whether due to error or fraud. The Fund is not required to have, nor were we engaged to perform, an audit of its internal control over financial reporting. As part of our audits we are required to obtain an understanding of internal
control over financial reporting, but not for the purpose of expressing an opinion on the effectiveness of the Fund’s internal control over financial reporting. Accordingly, we express no such opinion.
Our audits included performing procedures to assess the risks of material misstatement of the financial statements, whether due to error or fraud, and performing procedures that respond to those risks. Such procedures
included examining, on a test basis, evidence regarding the amounts and disclosures in the financial statements. Our audits also included evaluating the accounting principles used and significant estimates made by management, as well as evaluating
the overall presentation of the financial statements. Our procedures included confirmation of securities owned as of October 31, 2023 by correspondence with the custodian. We believe that our audits provide a reasonable basis for our opinion.
|
|
|
TAIT, WELLER & BAKER LLP
|
Philadelphia, Pennsylvania
December 22, 2023
|
HENNESSY FUNDS
|
1-800-966-4354
|
29
Trustees and Officers of the Fund (Unaudited)
The business and affairs of the Funds are managed under the direction of the Board of Trustees of the Trust, and the Board of Trustees elects the officers of the Trust (“Officers”). From time to time, the Board of
Trustees also has appointed advisers to the Board of Trustees (“Advisers”) with the intention of having qualified individuals serve in an advisory capacity to garner experience in the mutual fund and asset management industry and be considered as
potential Trustees in the future. There are currently two Advisers, Brian Alexander and A.J. Hennessy. As Advisers, Mr. Alexander and Mr. A.J. Hennessy attend meetings of the Board of Trustees and act as non-voting participants. Information
pertaining to the Trustees, Advisers, and the Officers of the Trust is set forth below. The Trustees and Officers serve until their successors are duly elected and qualified or until their earlier death, resignation, or removal. Each Trustee
oversees all 17 Hennessy Funds. Unless otherwise indicated, the address of all persons listed below is 7250 Redwood Boulevard, Suite 200, Novato, CA 94945. The Fund’s Statement of Additional Information includes more information about the persons
listed below and is available without charge by calling 800-966-4354 or by visiting www.hennessyfunds.com.
|
Other
|
|||
|
Directorships
|
|||
|
Held Outside
|
|||
|
Name, Age,
|
of Fund
|
||
|
and Position Held
|
Start Date
|
Principal Occupation(s)
|
Complex During
|
|
with the Trust
|
of Service
|
During Past Five Years
|
Past Five Years
|
|
Disinterested Trustees(1) and Disinterested Advisers
|
|||
|
J. Dennis DeSousa
|
January 1996
|
Mr. DeSousa is a real estate investor.
|
None.
|
|
87
|
|||
|
Trustee
|
|||
|
Robert T. Doyle
|
January 1996
|
Mr. Doyle is retired. He served as the
|
None.
|
|
76
|
Sheriff of Marin County, California
|
||
|
Trustee
|
from 1996 to June 2022.
|
||
|
Doug Franklin
|
March 2016
|
Mr. Franklin is a retired insurance
|
None.
|
|
59
|
as an Adviser
|
industry executive. From 1987
|
|
|
Trustee
|
to the Board
|
through 2015, he was employed by
|
|
|
and June 2023
|
the Allianz-Fireman’s Fund Insurance
|
||
|
as a Trustee
|
Company in various positions,
|
||
|
including as its Chief Actuary and
|
|||
|
Chief Risk Officer.
|
|||
|
Claire Garvie
|
December 2015
|
Ms. Garvie is a founder of Kiosk and
|
None.
|
|
49
|
as an Adviser
|
has served as its Chief Operating
|
|
|
Trustee
|
to the Board and
|
Officer since 2004. Kiosk is a
|
|
|
December 2021
|
full-service marketing agency with
|
||
|
as a Trustee
|
offices in the San Francisco Bay Area
|
||
|
and Liverpool, UK and staff across
|
|||
|
nine states in the U.S.
|
|||
|
WWW.HENNESSYFUNDS.COM
|
30
|
TRUSTEES AND OFFICERS OF THE FUND
|
|
Other
|
|||
|
Directorships
|
|||
|
Held Outside
|
|||
|
Name, Age,
|
of Fund
|
||
|
and Position Held
|
Start Date
|
Principal Occupation(s)
|
Complex During
|
|
with the Trust
|
of Service
|
During Past Five Years
|
Past Five Years
|
|
Gerald P. Richardson
|
May 2004
|
Mr. Richardson is an independent
|
None.
|
|
78
|
consultant in the securities industry.
|
||
|
Trustee
|
|||
|
Brian Alexander
|
March 2015
|
Mr. Alexander has served as the
|
None.
|
|
42
|
Chief Operating Officer of Solis
|
||
|
Adviser to the Board
|
Mammography since March 2023.
|
||
|
Prior to that, he worked for the
|
|||
|
Sutter Health organization from
|
|||
|
2011 to 2023 in various positions.
|
|||
|
He served as the Chief Executive
|
|||
|
Officer of the North Valley Hospital
|
|||
|
Area from 2021 to March 2023.
|
|||
|
From 2018 to 2021, he served as the
|
|||
|
Chief Executive Officer of Sutter
|
|||
|
Roseville Medical Center. From 2016
|
|||
|
through 2018, he served as the Vice
|
|||
|
President of Strategy for the Sutter
|
|||
|
Health Valley Area, which includes
|
|||
|
11 hospitals, 13 ambulatory surgery
|
|||
|
centers, 16,000 employees, and
|
|||
|
1,900 physicians.
|
|||
|
Interested Trustee and Interested Adviser(2)
|
|||
|
Neil J. Hennessy
|
January 1996 as
|
Mr. Neil Hennessy has been employed
|
Hennessy
|
|
67
|
a Trustee and
|
by Hennessy Advisors, Inc. since
|
Advisors, Inc.
|
|
Chairman of the Board,
|
June 2008 as
|
1989 and currently serves as its
|
|
|
Chief Market Strategist,
|
an Officer
|
Chairman and Chief Executive Officer.
|
|
|
Portfolio Manager,
|
|||
|
and President
|
|||
|
A.J. Hennessy
|
December 2022
|
Mr. A.J. Hennessy has been employed
|
None.
|
|
37
|
by Hennessy Advisors, Inc. since 2011.
|
||
|
Adviser to the Board
|
|||
|
and Vice President,
|
|||
|
Corporate Development
|
|||
|
and Operations
|
|||
|
HENNESSY FUNDS
|
1-800-966-4354
|
31
|
Name, Age,
|
||
|
and Position Held
|
Start Date
|
Principal Occupation(s)
|
|
with the Trust
|
of Service
|
During Past Five Years
|
|
Officers
|
||
|
Teresa M. Nilsen
|
January 1996
|
Ms. Nilsen has been employed by Hennessy Advisors, Inc.
|
|
57
|
since 1989 and currently serves as its President, Chief
|
|
|
Executive Vice President
|
Operating Officer, and Secretary.
|
|
|
and Treasurer
|
||
|
Daniel B. Steadman
|
March 2000
|
Mr. Steadman has been employed by Hennessy Advisors, Inc.
|
|
67
|
since 2000 and currently serves as its Executive Vice President.
|
|
|
Executive Vice President
|
||
|
and Secretary
|
||
|
Brian Carlson
|
December 2013
|
Mr. Carlson has been employed by Hennessy Advisors, Inc.
|
|
51
|
since December 2013 and currently serves as its Chief
|
|
|
Senior Vice President
|
Compliance Officer and Senior Vice President.
|
|
|
and Head of Distribution
|
||
|
David Ellison(3)
|
October 2012
|
Mr. Ellison has been employed by Hennessy Advisors, Inc.
|
|
65
|
since October 2012. He has served as a Portfolio Manager of
|
|
|
Senior Vice President
|
the Hennessy Large Cap Financial Fund and the Hennessy
|
|
|
and Portfolio Manager
|
Small Cap Financial Fund since their inception. Mr. Ellison also
|
|
|
served as a Portfolio Manager of the Hennessy Technology
|
||
|
Fund from its inception until February 2017. Mr. Ellison served
|
||
|
as Director, CIO, and President of FBR Fund Advisers, Inc.
|
||
|
from December 1999 to October 2012.
|
||
|
Jennifer Emerson(4)
|
June 2013
|
Ms. Emerson has been employed by Hennessy Advisors, Inc.
|
|
46
|
as its General Counsel since June 2013.
|
|
|
Senior Vice President and
|
||
|
Chief Compliance Officer
|
||
|
Ryan Kelley(5)
|
March 2013
|
Mr. Kelley has been employed by Hennessy Advisors, Inc. since
|
|
51
|
October 2012. He has served as Chief Investment Officer of the
|
|
|
Senior Vice President,
|
Hennessy Funds since March 2021 and has served as a Portfolio
|
|
|
Chief Investment Officer,
|
Manager of the Hennessy Gas Utility Fund, the Hennessy Large
|
|
|
and Portfolio Manager
|
Cap Financial Fund, and the Hennessy Small Cap Financial Fund
|
|
|
since October 2014. Mr. Kelley served as Co-Portfolio Manager
|
||
|
of these same funds from March 2013 through September
|
||
|
2014 and as a Portfolio Analyst for the Hennessy Funds from
|
||
|
October 2012 through February 2013. He has also served as a
|
||
|
Portfolio Manager of the Hennessy Cornerstone Growth Fund,
|
||
|
the Hennessy Cornerstone Mid Cap 30 Fund, the Hennessy
|
||
|
Cornerstone Large Growth Fund, and the Hennessy
|
||
|
Cornerstone Value Fund since February 2017 and as a Portfolio
|
||
|
Manager of the Hennessy Total Return Fund, the Hennessy
|
||
|
Balanced Fund, and the Hennessy Technology Fund since May
|
||
|
2018. He previously served as Co-Portfolio Manager of the
|
||
|
Hennessy Technology Fund from February 2017 until May 2018.
|
||
|
Mr. Kelley served as Portfolio Manager of FBR Fund
|
||
|
Advisers, Inc. from January 2008 to October 2012.
|
|
WWW.HENNESSYFUNDS.COM
|
32
|
TRUSTEES AND OFFICERS OF THE FUND
|
|
Name, Age,
|
||
|
and Position Held
|
Start Date
|
Principal Occupation(s)
|
|
with the Trust
|
of Service
|
During Past Five Years
|
|
L. Joshua Wein(5)
|
September 2018
|
Mr. Wein has been employed by Hennessy Advisors, Inc. since
|
|
50
|
2018. He has served as Portfolio Manager of the Hennessy
|
|
|
Vice President and
|
Cornerstone Growth Fund, the Hennessy Cornerstone Mid Cap
|
|
|
Portfolio Manager
|
30 Fund, the Hennessy Cornerstone Large Growth Fund, the
|
|
|
Hennessy Cornerstone Value Fund, Hennessy Total Return Fund,
|
||
|
the Hennessy Balanced Fund, the Hennessy Gas Utility Fund,
|
||
|
and the Hennessy Technology Fund since February 2021, and
|
||
|
as the Co-Portfolio Manager of these Funds since February
|
||
|
2019. He served as a Senior Analyst of those same Funds from
|
||
|
September 2018 through February 2019. He also has served as
|
||
|
a Portfolio Manager of the Hennessy Energy Transition Fund
|
||
|
and the Hennessy Midstream Fund since January 2022.
|
||
|
Mr. Wein served as Director of Alternative Investments and
|
||
|
Co-Portfolio Manager at Sterling Capital Management
|
||
|
from 2008 to 2018.
|
_______________
|
(1)
|
The Funds have determined that Mr. DeSousa, Mr. Doyle, Mr. Franklin, Ms. Garvie, and Mr. Richardson are not interested persons, as defined in the 1940 Act, of the Investment Manager or of any
predecessor investment adviser for purposes of Section 15(f) of the 1940 Act.
|
|
(2)
|
Each of Neil J. Hennessy and A.J. Hennessy is considered an interested person, as defined in the 1940 Act, because he is an officer of the Trust.
|
|
(3)
|
The address of this officer is 101 Federal Street, Suite 1615B, Boston, MA 02110.
|
|
(4)
|
The address of this officer is 4800 Bee Caves Road, Suite 100, Austin, TX 78746.
|
|
(5)
|
The address of this officer is 1340 Environ Way, Chapel Hill, NC 27517.
|
|
HENNESSY FUNDS
|
1-800-966-4354
|
33
Expense Example (Unaudited)
October 31, 2023
As a shareholder of the Fund, you incur ongoing costs, including management fees, service fees, and other Fund expenses. This Example is intended to help you understand your ongoing costs (in dollars) of investing in the
Fund and to compare these costs with the ongoing costs of investing in other investment funds. The Example is based on an investment of $1,000 invested at the beginning of the period and held for the entire period from May 1, 2023, through October
31, 2023.
Actual Expenses
In the table below, the first line under each of the “Investor Class” and “Institutional Class” headings provides information about actual account values and actual expenses for each share class. You may use this
information, together with the amount you invested, to estimate the expenses that you paid over the period. Simply divide your account value by $1,000 (for example, an $8,600 account value divided by $1,000 = 8.6), then multiply the result by the
number in the first line under the heading “Expenses Paid During Period” to estimate the expenses you paid on your account during this period. Although the Fund charges no sales loads or transaction fees, you will be assessed fees for outgoing wire
transfers, returned checks, and stop payment orders at prevailing rates charged by U.S. Bank Global Fund Services, the Fund’s transfer agent. If you request that a redemption be made by wire transfer, the Fund’s transfer agent charges a $15 fee.
IRAs are charged a $15 annual maintenance fee (up to $30 maximum per shareholder for shareholders with multiple IRAs). The examples below include, but are not limited to, management, shareholder servicing, accounting, custody, and transfer agent
fees. However, the examples below do not include portfolio trading commissions and related expenses.
Hypothetical Example for Comparison Purposes
In the table below, the second line under each of the “Investor Class” and “Institutional Class” headings provides information about hypothetical account values and hypothetical expenses based on the Fund’s actual expense
ratio for each share class and an assumed rate of return of 5% per year before expenses, which is not the Fund’s actual return for such share class. The hypothetical account values and expenses may not be used to estimate the actual ending account
balance or expenses you paid for the period. You may use this information to compare the ongoing costs of investing in the Fund and other funds. To do so, compare these 5% hypothetical examples with the 5% hypothetical examples that appear in the
shareholder reports of the other funds. Please note that the expenses shown in the table are meant to highlight your ongoing costs only. Therefore, the second lines under “Investor Class” and “Institutional Class” are useful in comparing ongoing
costs only and will not help you determine the relative total costs of owning different funds.
|
WWW.HENNESSYFUNDS.COM
|
34
|
EXPENSE EXAMPLE
|
|
Expenses Paid
|
|||
|
Beginning
|
Ending
|
During Period(1)
|
|
|
Account Value
|
Account Value
|
May 1, 2023 –
|
|
|
May 1, 2023
|
October 31, 2023
|
October 31, 2023
|
|
|
Investor Class
|
|||
|
Actual
|
$1,000.00
|
$ 961.50
|
$7.32
|
|
Hypothetical (5% return before expenses)
|
$1,000.00
|
$1,017.74
|
$7.53
|
|
Institutional Class
|
|||
|
Actual
|
$1,000.00
|
$ 963.30
|
$5.49
|
|
Hypothetical (5% return before expenses)
|
$1,000.00
|
$1,019.61
|
$5.65
|
|
(1)
|
Expenses are equal to the Fund’s annualized expense ratio of 1.48% for Investor Class shares or 1.11% for Institutional Class shares, as applicable, multiplied by the average account value over the period,
multiplied by 184/365 days (to reflect the half-year period).
|
|
HENNESSY FUNDS
|
1-800-966-4354
|
35
How to Obtain a Copy of the Fund’s Proxy
Voting Policy and Proxy Voting Records
A description of the policies and procedures the Fund uses to determine how to vote proxies relating to portfolio securities is available without charge (1) by calling 800-966-4354, (2) on the Hennessy Funds’ website at
www.hennessyfunds.com/proxy-voting/voting-policy, or (3) on the U.S. Securities and Exchange Commission’s (the “SEC”) website at www.sec.gov. The Fund’s proxy voting record is available without charge on both the Hennessy Funds’ website at
www.hennessyfunds.com/proxy-voting/voting-record and the SEC’s website at www.sec.gov no later than August 31 for the prior 12 months ending June 30.
Availability of Quarterly Portfolio Schedule
The Fund files a complete schedule of portfolio holdings with the SEC for the first and third quarters of each fiscal year as an exhibit to its reports on Form N-PORT. The Fund’s Form N-PORT reports are available on the
SEC’s website at www.sec.gov or on request by calling 800-966-4354.
Federal Tax Distribution Information (Unaudited)
For fiscal year 2023, certain dividends paid by the Fund may be subject to a maximum tax rate of 23.8%, as provided for by the Jobs and Growth Tax Relief Reconciliation Act of 2003. The percentage of dividends declared
from ordinary income designated as qualified dividend income was 0.00%.
For corporate shareholders, the percent of ordinary income distributions that qualified for the corporate dividends received deduction for fiscal year 2023 was 0.00%.
The percentage of taxable ordinary income distributions that were designated as short-term capital gain distributions under Section 871(k)(2)(C) of the Internal Revenue Code of 1986, as amended, for the
Fund was 0.00%.
Important Notice Regarding Delivery
of Shareholder Documents
To help keep the Fund’s costs as low as possible, we generally deliver a single copy of shareholder reports, proxy statements, and prospectuses to shareholders who share an address and have the same last name. This
process does not apply to account statements. You may request an individual copy of a shareholder document at any time. If you would like to receive separate mailings of shareholder documents, please call U.S. Bank Global Fund Services at
800-261-6950 or 414-765-4124, and individual delivery will begin within 30 days of your request. If your account is held through a financial institution or other intermediary, please contact such intermediary directly to request individual
delivery.
Electronic Delivery
As currently permitted by SEC regulations, the Fund’s shareholder reports are made available on a website, and unless you sign for eDelivery or elect to receive paper copies as detailed below, you will be notified by mail
each time a report is posted and provided with a website link to access the report.
To elect to receive paper copies of all future reports free of charge, please call U.S. Bank Global Fund Services at 800-261-6950 or 414-765-4124.
The Fund also offers shareholders the option to receive all notices, account statements, prospectuses, tax forms, and shareholder reports electronically. To sign up for eDelivery or change your delivery
preference, please visit www.hennessyfunds.com/account.
Shareholder reports transmitted after July 24, 2024, will comply with the new tailored shareholder reporting requirements, which require streamlined annual and semi-annual reports to shareholders that
highlight key information. These reports will be transmitted in paper unless a shareholder elects to receive reports electronically via eDelivery. To sign up for eDelivery, please visit http://www.hennessyfunds.com/account.
Subscribe to receive our team’s unique market and sector insights delivered to your inbox
www.hennessyfunds.com/subscribe
Follow us on social media
| |
|
|
|
|
WWW.HENNESSYFUNDS.COM
|
36
|
PROXY VOTING — PRIVACY POLICY
|
Liquidity Risk Management Program
In accordance with Rule 22e-4 under the Investment Company Act of 1940, as amended (the “Liquidity Rule”), we have adopted and implemented a liquidity risk management program (the “Liquidity Program”). The purpose of the
Liquidity Program is to assess and manage the Fund’s liquidity risk, which is the risk that the Fund would not be able to meet requests to redeem Fund shares without significant dilution of the remaining shareholders’ interests in the Fund. The
Board of Trustees of the Fund (the “Board”) designated a committee comprising representatives of Hennessy Advisors, Inc., the investment adviser to the Fund, as the administrator of the Liquidity Program (the “Program Administrator”).
The Program Administrator provided a written report regarding the Liquidity Program to the Board in advance of its meeting on June 7, 2023. The report covered the period from June 1, 2022, through May
31, 2023. The report addressed the operation of the Liquidity Program, assessed the adequacy and effectiveness of its implementation, and described any material changes to the Liquidity Program during the review period. The Trust’s chief compliance
officer presented the report to the Board at the meeting and provided additional information regarding the Liquidity Program. The Board reviewed the Liquidity Program and considered, among other items, the following:
|
1.
|
The Program Administrator reviewed daily historical net redemption activity during the review period and during prior periods with higher-than-average redemption activity and concluded that the Fund has
historically been able to meet requests to redeem Fund shares without significant dilution to the Fund’s remaining shareholders, and the Program Administrator expects the Fund to be able to continue to do so in the future during both normal
and reasonably foreseeable stressed conditions.
|
|
|
2.
|
The Fund primarily holds assets that are highly liquid investments and is not required to establish a highly liquid investment minimum for the Fund or adopt policies and procedures for responding to a highly
liquid investment minimum shortfall.
|
|
|
3.
|
The Program Administrator did not make or recommend any material changes to the Liquidity Program during the review period.
|
|
|
4.
|
The Program Administrator concluded that the Liquidity Program was reasonably designed to assess and manage the Fund’s liquidity risk, complies with the requirements of the Liquidity Rule, and was operating as
intended during the review period.
|
Privacy Policy
We collect the following personal information about you:
|
1.
|
Information we receive from you in applications or other forms, correspondence, or conversations, including, but not limited to, your name, address, phone number, social security number, assets, income, and date
of birth;
|
|
|
2.
|
Information about your transactions with us, our affiliates, or others, including, but not limited to, your account number and balance, payments history, parties to transactions, cost basis information, and other
financial information; and
|
|
HENNESSY FUNDS
|
1-800-966-4354
|
37
|
3.
|
Other personal information we collect from various sources, even if you have not entered into a prior transaction with us, including the following:
|
|
•
|
Name, alias, address, unique personal identifier, online identifier, IP address, email address, telephone number, account name, and other similar identifiers;
|
||
|
•
|
Age and marital status;
|
||
|
•
|
Commercial information, including records of products purchased;
|
||
|
•
|
Browsing history, search history, and information on interaction with our website;
|
||
|
•
|
Geolocation data;
|
||
|
•
|
Employment and employment history, educational history, financial information, and purchasing and consuming histories or tendencies; and
|
||
|
•
|
Inferences drawn from the above-listed information to create a profile about your preferences, characteristics, predispositions, and behavior.
|
We collect this information directly from you, indirectly in the course of providing services to you, directly and indirectly from your activity on our website, from broker dealers, marketing agencies,
and other third parties that interact with us in connection with the services we perform and products we offer, and from anonymized and aggregated consumer information.
We use this information to fulfill the reason you provided the information to us, to provide you with other relevant products that you request from us, to provide you with information about products
that may interest you, to improve our website or present our website’s contents to you, and as otherwise described to you when collecting your personal information.
We do not disclose any personal information to unaffiliated third parties, except as permitted by law. We may disclose your personal information to our affiliates, vendors, and service providers for a
business purpose. For example, we are permitted by law to disclose all of the information we collect, as described above, to our transfer agent to process your transactions. When disclosing your personal information to third parties, we enter into
a contract with each third party describing the purpose of such disclosure and requiring that such personal information be kept confidential and not used for any purpose except to perform the services contracted or respond to regulatory or law
enforcement requests.
Furthermore, we restrict access to your personal information to those persons who require such information to provide products or services to you. As a result, we do not provide a means for opting out
of our limited sharing of your information. We maintain physical, electronic, and procedural safeguards that comply with federal standards to guard your personal information.
If you hold shares of the Funds through a financial intermediary, including, but not limited to, a broker-dealer, bank, or trust company, the privacy policy of your financial intermediary governs how
your personal information is shared with unaffiliated third parties.
If you live in a state such as California where the laws provide further privacy rights, we will not share information unless the law allows, and we will comply with the other state-specific
requirements.
|
WWW.HENNESSYFUNDS.COM
|
38
|
PRIVACY POLICY
|
Supplemental Privacy Notice for Residents of California
The California Consumer Privacy Act of 2018 (the “CCPA”) provides you, as a California resident, with certain additional rights relating to your personal information.
Under the CCPA, you have the right to request that we disclose to you the categories of personal information we have collected about you over the past 12 months, the categories of sources of such
information, our business purpose for collecting the information, the categories of third parties, if any, with whom we shared the information, and the specific information we have collected about you. You also have the right to request that we
delete any of your personal information, and, unless an exception applies, we will delete such information upon receiving and confirming your request. To make a request, call us at 1-800-966-4354, email us at privacy@hennessyfunds.com, or go to
www.hennessyfunds.com/contact. We will not discriminate against you for exercising your rights under the CCPA. Further, we will not collect additional categories of your personal information or use the personal information we collected for
materially different, unrelated, or incompatible purposes without providing you notice.
|
HENNESSY FUNDS
|
1-800-966-4354
|
39
(This Page Intentionally Left Blank.)
For information, questions, or assistance, please call
The Hennessy Funds
800-966-4354 or 415-899-1555
INVESTMENT ADVISOR
Hennessy Advisors, Inc.
7250 Redwood Boulevard, Suite 200
Novato, California 94945
ADMINISTRATOR,
TRANSFER AGENT,
DIVIDEND PAYING AGENT, &
SHAREHOLDER SERVICING AGENT
U.S. Bancorp Fund Services, LLC
d/b/a U.S. Bank Global Fund Services
P.O. Box 701
Milwaukee, Wisconsin 53201-0701
CUSTODIAN
U.S. Bank N.A.
Custody Operations
1555 North River Center Drive, Suite 302
Milwaukee, Wisconsin 53212
TRUSTEES
Neil J. Hennessy
Robert T. Doyle
J. Dennis DeSousa
Doug Franklin
Claire Garvie
Gerald P. Richardson
COUNSEL
Foley & Lardner LLP
777 East Wisconsin Avenue
Milwaukee, Wisconsin 53202-5306
INDEPENDENT REGISTERED
PUBLIC ACCOUNTING FIRM
Tait, Weller & Baker LLP
Two Liberty Place
50 South 16th Street, Suite 2900
Philadelphia, Pennsylvania 19102-2529
DISTRIBUTOR
Quasar Distributors, LLC
111 East Kilbourn Avenue, Suite 1250
Milwaukee, Wisconsin 53202
www.hennessyfunds.com | 800-966-4354
This report has been prepared for shareholders and may be distributed to
others only if preceded or accompanied by a current prospectus.
ANNUAL REPORT
OCTOBER 31, 2023
HENNESSY CORNERSTONE MID CAP 30 FUND
Investor Class HFMDX
Institutional Class HIMDX
www.hennessyfunds.com | 1-800-966-4354
(This Page Intentionally Left Blank.)
Contents
|
Letter to Shareholders
|
2
|
|
|
Performance Overview
|
6
|
|
|
Financial Statements
|
||
|
Schedule of Investments
|
9
|
|
|
Statement of Assets and Liabilities
|
13
|
|
|
Statement of Operations
|
14
|
|
|
Statements of Changes in Net Assets
|
15
|
|
|
Financial Highlights
|
16
|
|
|
Notes to the Financial Statements
|
20
|
|
|
Report of Independent Registered Public Accounting Firm
|
28
|
|
|
Trustees and Officers of the Fund
|
29
|
|
|
Expense Example
|
34
|
|
|
Proxy Voting Policy and Proxy Voting Records
|
36
|
|
|
Availability of Quarterly Portfolio Schedule
|
36
|
|
|
Federal Tax Distribution Information
|
36
|
|
|
Important Notice Regarding Delivery of Shareholder Documents
|
36
|
|
|
Electronic Delivery
|
36
|
|
|
Liquidity Risk Management Program
|
37
|
|
|
Privacy Policy
|
37
|
|
HENNESSY FUNDS
|
1-800-966-4354
|
November 2023
Dear Hennessy Funds Shareholder:
Market Myopia: Tough Beginnings & Fantastic Finishes
During an interview this summer, I was reminded how important it is to maintain a long-term view of the market and investing and how easy it is to focus on the very recent past. In mid-July, when the Nasdaq Composite
Index was soaring to new 2023 highs and large-cap tech was once again dominating both returns and news headlines, the interviewer seemed confused – and somewhat disappointed – when I mentioned that even with 2023’s stellar performance, the Nasdaq
was negative if you included the prior year (2022) and that during that same time, utilities had outperformed. As of the time of writing this letter, a similar story can be seen when considering eight technology giants: Microsoft, Tesla, Facebook (Meta), Apple, Amazon, Netflix, Nvidia, and Google, or “MT. FAANNG” as a much easier to say (and remember) acronym.(1) MT. FAANNG is up on average a whopping 89.69% in 2023 on a total return basis as of November 7, 2023. However, this same group was down -46.71% in 2022, a dismal year for large-cap tech.
Due to the unforgiving nature of percentages, from the end of 2021 until now, this group of highflyers, believe it or not, is still down -3.14% on average, despite an incredible 2023.
I like to call this phenomenon “market myopia.” Investors tend to be optimists, as am I. This makes it so much more comforting to forget the “tough beginnings” when you’d rather
remember the “fantastic finishes.” In continuing with the example above, unless you were an investor with prescient foresight, you likely didn’t sell all your MT. FAANNG stocks on January 4, 2022, as the market started its correction, and you
probably didn’t then buy them all back on September 30, 2022, when the market hit its low. An average investor’s experience would be much different than that. Which brings me to the point of all this: what are some elements of our investment
philosophy here at Hennessy Funds?
First, what about timing the market? Simply put, we don’t do it. As Neil Hennessy, our Chief Market Strategist and long-tenured Portfolio Manager, aptly put it, “It’s not about timing the market, but rather about time in the market.” The long-term annualized return of the market, as measured by the Dow Jones Industrial Average going back 104
years to 1920, is about 9.6%, and that number would be closer to 7-8% on a real return basis when factoring in inflation. If an investor is poorly timing when to enter and when to exit the market, it would be very difficult to achieve similar,
attractive returns to what they would experience simply by staying invested through a complete market cycle.
We are optimistic investors. We understand that some years or months may be tougher than others, but we tend to think in longer timeframes. An investor solely invested in the
Nasdaq might have looked at their portfolio at the end of 2022 and been extremely disappointed with a -32.51% return. But as Josh Wein, one of our Portfolio Managers with over 25 years of experience, pointed out, “2022 was what 8% real returns
look like.” In other words, with the year prior (2021) providing a +22.21% return and the year after (2023) hitting a +31.21% return, 2022’s dismal performance of -32.51% created an annualized total return for the Nasdaq of 8.22% over the entire
period (December 31, 2020, to November 7, 2023). Josh simply observed that while corrections happen over the course of a market cycle, it’s best not to panic by selling when stocks are hitting new lows.
_______________
|
(1)
|
The acronym, MT. FAANNG, refers to the following companies: Microsoft Corporation, Tesla, Inc., Meta Platforms, Inc., Amazon.com, Inc., Apple, Inc., Netflix, Inc., NVIDIA Corporation, and Alphabet, Inc.
|
|
WWW.HENNESSYFUNDS.COM
|
2
|
LETTER TO SHAREHOLDERS
|
Downside risk mitigation is relevant. While we normally remain fully invested within our individual funds, we seek to reduce risk through other means, including sector
diversification and investing in companies that exhibit strong fundamentals at compelling valuations. Dave Ellison, the long-tenured Portfolio Manager of our two financial funds, consistently reminds us, “Losing less money in difficult markets is
more important than making the most in rising ones.”
Finally, we are investors in companies, not traders of stocks. Many of our portfolios hold certain positions for long periods of time, a demonstration of the Portfolio Managers’
convictions. In fact, both the Hennessy Focus Fund and the Hennessy Large Cap Financial Fund have held some positions for 25 years or more. We recognize that much of the performance of the Hennessy Funds comes from the actual stocks we own (stock
selection) and not from our weightings within certain sectors (sector allocation). Moving in and out of sectors can enhance performance, but it can also hinder it in the same way as market timing, and it takes a significant number of correct
“calls” regarding the macro-environment. We’d rather invest long term than rely on lucky calls. Our highly experienced energy funds Portfolio Manager, Ben Cook, summed up our philosophy on the macro environment nicely: “While macro-economic
trends help to inform our investment process, ultimately it’s the individual stocks with solid fundamentals and attractive valuations that, over time, drive positive risk-adjusted returns for our funds.”
We are long term investors, staying ever mindful of downside risk while striving to participate in the upside, with each individual fund having its own objective, process,
portfolio construction, and investment criteria.
The stock market has once again seen dramatic differences in stock performance. For our fiscal year ended October 31, 2023, all three broad-based indexes were positive, although
with a large dispersion of total returns, with the Dow Jones Industrial Average up 3.17%, the S&P 500® Index up 10.14%, and the Nasdaq Composite Index up 17.99%.
During our fiscal year, large caps significantly outperformed mid caps and small caps, and growth substantially outperformed value. Large-cap tech once again pushed the overall broader market higher, as evidenced by the Nasdaq-100 Index posting a
return of 27.45%. From a sector point of view, besides Technology, the only other sector with outsized (greater than 10%) returns was Communication Services, while six of the 11 GICS sectors of the S&P 500® Index were negative.
Similar to the overall market, our funds experienced mixed results. Many of our funds exhibit more value-oriented characteristics and, given that value underperformed growth this
year by a significant amount, that negatively affected our relative performance. In addition, three of our funds are sector-specific funds that were invested in underperforming sectors, while six more are focused on small- and mid-cap stocks in a
time period when large caps substantially outperformed. Ten of our 16 mutual funds and our exchange-traded-fund (ETF) posted positive returns for the fiscal year ended October 31, 2023.
Several factors caused this disparity of returns in the market: interest rates and inflation being two of the most important. With the Federal Reserve pausing interest rate hikes
and inflation numbers subsiding, the market reacted positively once it became more apparent that we were not heading into a recession. Consumer demand also remained strong, and unemployment numbers remained historically low.
We believe that the outlook for U.S. stocks remains positive, primarily as we believe that the Federal Reserve may be done, or close to done, raising interest rates. Inflation has
shown signs of easing, creating a better environment for consumers as well as businesses. The unemployment rate remains near record lows, there are elevated levels of cash on the
|
HENNESSY FUNDS
|
1-800-966-4354
|
3
balance sheets of U.S. companies and in the pockets of many consumers and investors, and there is the prospect of a more dovish Federal Reserve heading into 2024. However, we are cautiously watching certain parts of the
economy for any hints of weakness, including consumer spending and credit issues. While volatility and uncertainty may impact the markets, we encourage investors to stay the course, maintain a diversified portfolio, and keep a long-term
perspective.
We thank you for your continued interest in our Funds and are grateful that you have chosen to invest with us. If you have any questions or would like to speak with us directly,
please call us at (800) 966-4354.
Best regards,
|
|
|
|
|
Ryan C. Kelley, CFA
|
|
|
Chief Investment Officer,
|
|
|
Senior Vice President, and Portfolio Manager
|
Past performance does not guarantee future results.
Mutual fund investing involves risk. Principal loss is possible.
Opinions expressed are those of Ryan C. Kelley and are subject to change, are not guaranteed, and should not be considered investment advice.
The Dow Jones Industrial Average and S&P 500® Index are commonly used to measure the performance of U.S. stocks. The Nasdaq Composite
Index comprises all common stocks listed on The Nasdaq Stock Market and is commonly used to measure the performance of technology-related stocks. The Nasdaq-100 Index includes 100 of the largest domestic and international non-financial companies
listed on The NASDAQ Stock Market based on market capitalization. The indices are used herein for comparative purposes in accordance with SEC regulations. One cannot invest directly in an index. All returns are shown on a total return basis.
|
WWW.HENNESSYFUNDS.COM
|
4
|
LETTER TO SHAREHOLDERS
|
(This Page Intentionally Left Blank.)
|
HENNESSY FUNDS
|
1-800-966-4354
|
5
Performance Overview (Unaudited)
CHANGE IN VALUE OF $10,000 INVESTMENT
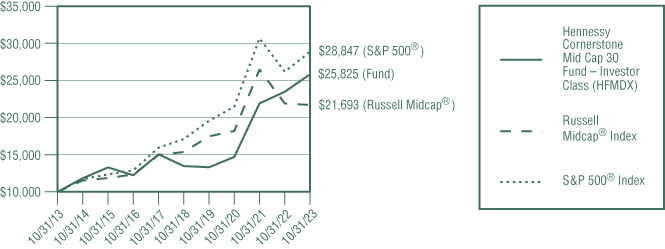
This graph illustrates the performance of an initial investment of $10,000 made in the Fund 10 years ago and assumes the reinvestment of dividends and capital gains.
AVERAGE ANNUAL TOTAL RETURN FOR PERIODS ENDED OCTOBER 31, 2023
|
One
|
Five
|
Ten
|
|
|
Year
|
Years
|
Years
|
|
|
Hennessy Cornerstone Mid Cap 30 Fund –
|
|||
|
Investor Class (HFMDX)
|
10.03%
|
13.91%
|
9.95%
|
|
Hennessy Cornerstone Mid Cap 30 Fund –
|
|||
|
Institutional Class (HIMDX)
|
10.43%
|
14.32%
|
10.33%
|
|
Russell Midcap® Index
|
-1.01%
|
7.14%
|
8.05%
|
|
S&P 500® Index
|
10.14%
|
11.01%
|
11.18%
|
Expense ratios: 1.35% (Investor Class); 1.00% (Institutional Class)
Performance data quoted represents past performance; past performance does not guarantee future results. The investment return and principal value of an investment will fluctuate so that an
investor’s shares, when redeemed, may be worth more or less than their original cost. The performance table does not reflect the deduction of taxes that a shareholder would pay on Fund distributions or the redemption of Fund shares. Current
performance of the Fund may be lower or higher than the performance quoted. Performance data current to the most recent month end may be obtained by visiting www.hennessyfunds.com.
The Russell Midcap® Index is a subset of the Russell 1000®
Index that measures the performance of the mid-cap segment of the U.S. equity market. The Russell Midcap® Index comprises approximately 800 of the smallest
securities in the Russell 1000® Index, representing approximately 27% of the total market capitalization of the Russell 1000® Index. The S&P 500® Index is a capitalization-weighted index that is designed to represent the broad domestic
economy through changes in the aggregate market value of 500 stocks across all major industries. One cannot invest directly in an index. These indices are used for comparative purposes in accordance with Securities and Exchange Commission
regulations.
Frank Russell Company (“Russell”) is the source and owner of the trademarks, service marks, and copyrights related to the Russell Indexes. Russell® is a trademark of Frank Russell Company. Neither Russell nor its licensors accept any liability for any errors or omissions in the Russell Indexes or Russell ratings or underlying data and no party may rely on any Russell
Indexes or Russell ratings or underlying data contained in this
|
WWW.HENNESSYFUNDS.COM
|
6
|
PERFORMANCE OVERVIEW
|
communication. No further distribution of Russell data is permitted without Russell’s express written consent. Russell does not promote, sponsor, or endorse the content of this communication.
Standard & Poor’s Financial Services is the source and owner of the S&P® and S&P 500® trademarks.
The expense ratios presented are from the most recent prospectus. The expense ratios for the current reporting period are available in the Financial Highlights section of this report.
PERFORMANCE NARRATIVE
Portfolio Managers Neil J. Hennessy, Ryan C. Kelley, CFA, and L. Joshua Wein, CAIA
Performance:
For the one-year period ended October 31, 2023, the Investor Class of the Hennessy Cornerstone Mid Cap 30 Fund returned 10.03%, outperforming the Russell Midcap® Index (the Fund’s primary benchmark), which returned -1.01%, and slightly underperforming the S&P 500® Index, which returned
10.14%, for the same period.
The Fund’s outperformance relative to its primary benchmark resulted primarily from stock selection within the Information Technology, Consumer Discretionary, and Financials sectors. The largest
contributors to performance within each of these sectors during the period were Super Micro Computer, Inc., Penske Automotive Group, Inc., and Unum Group. Offsetting these gains were losses in holdings in the Health Care, Energy, and Consumer
Staples sectors. The largest detractors from performance during the period within each of these sectors were AdaptHealth Corp., W&T Offshore, Inc., and BJ’s Wholesale Club Holdings, Inc.
After the Fund’s recent annual rebalance and through October 31, 2023, the Fund does not own any of the companies mentioned.
Portfolio Strategy:
The Fund utilizes a formula-based approach designed to construct a concentrated portfolio of attractively valued, growing mid-cap companies whose stock prices are exhibiting strong price momentum. In essence, the
strategy seeks to combine elements of both value and momentum investing by selecting 30 stocks that have relatively low price-to-sales ratios, have generated increased earnings over the past year, and have positive stock price appreciation over
the past three-month, six-month, and one-year periods.
Investment Commentary:
Notwithstanding a rebound in equity prices over the last twelve months, we believe that the outlook for U.S. stocks remains positive. We continue to believe that equities are attractive from a valuation standpoint, even
in the face of an expected slowdown in economic activity. While the Federal Reserve has raised rates several times throughout the last year, we believe that the prospect of slower economic growth and lower inflation numbers could prompt the
Federal Reserve to put any further rate hikes on hold. With the unemployment rate near record lows, high levels of cash on the balance sheets of U.S. companies, and the prospect of a more dovish Federal Reserve in 2024, we remain bullish on
equities long-term.
At the end of the fiscal year and after the Fund’s recent annual rebalance, sectors in which the Fund currently maintains significant overweight positions include Energy, Industrials, and Consumer
Discretionary. Representative holdings within the Energy
|
HENNESSY FUNDS
|
1-800-966-4354
|
7
sector include Liberty Energy, Inc., Enlink Midstream, LLC, and Plains GP Holdings, LP. Industrials holdings include Parsons Corporation, Comfort Systems USA, Inc., and XPO, Inc. Consumer Discretionary exposure includes
The Gap, Inc., Abercrombie & Fitch Company, and Guess?, Inc. Given the continued strength in employment trends and average hourly earnings, we would expect consumer spending and the economy to hold steady. We believe that the Fund is well
positioned given the potential for moderately slower economic growth.
_______________
Opinions expressed are those of the Portfolio Managers as of the date written and are subject to change, are not guaranteed, and should not be considered investment advice or an indication of trading intent.
The Fund invests in small-capitalization and medium-capitalization companies, which may have limited liquidity and greater price volatility than larger companies. Funds concentrated in one or more
industry sectors may be subject to a higher degree of market risk. The Fund’s formula-based strategy may cause the Fund to buy or sell securities at times when it may not be advantageous. Please see the Fund’s prospectus for a more complete
discussion of these and other risks.
References to specific securities should not be considered a recommendation to buy or sell any security. Fund holdings and sector allocations are subject to change. Please refer to the Schedule of Investments included
in this report for additional portfolio information.
|
WWW.HENNESSYFUNDS.COM
|
8
|
PERFORMANCE OVERVIEW/SCHEDULE OF INVESTMENTS
|
Financial Statements
|
Schedule of Investments as of October 31, 2023
|
HENNESSY CORNERSTONE MID CAP 30 FUND
(% of Net Assets)
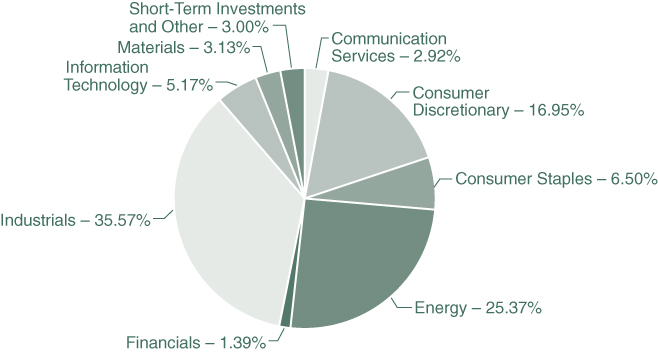
|
TOP TEN HOLDINGS (EXCLUDING MONEY MARKET FUNDS)
|
% NET ASSETS
|
|
Gap, Inc.
|
4.02%
|
|
Liberty Energy, Inc.
|
3.60%
|
|
Comfort Systems USA, Inc.
|
3.54%
|
|
Abercrombie & Fitch Co., Class A
|
3.53%
|
|
Parsons Corp.
|
3.39%
|
|
EnLink Midstream LLC
|
3.37%
|
|
Guess, Inc.
|
3.35%
|
|
XPO, Inc.
|
3.32%
|
|
Plains GP Holdings LP, Class A
|
3.30%
|
|
Sterling Infrastructure, Inc.
|
3.28%
|
Note: For presentation purposes, the Fund has grouped some of the industry categories. For purposes of categorizing securities for compliance with Section 8(b)(1) of the Investment Company Act of 1940, as amended, the
Fund uses more specific industry classifications.
The Global Industry Classification Standard (GICS®) was developed by and is the exclusive property and a service mark of MSCI, Inc. and
Standard & Poor’s Financial Services LLC. It has been licensed for use by the Hennessy Funds.
|
HENNESSY FUNDS
|
1-800-966-4354
|
9
|
COMMON STOCKS – 97.00%
|
Number
|
% of
|
||||||||||
|
|
of Shares
|
Value
|
Net Assets
|
|||||||||
|
Communication Services – 2.92%
|
||||||||||||
|
Cinemark Holdings, Inc. (a)
|
1,045,400
|
$
|
17,238,646
|
2.92
|
%
|
|||||||
|
|
||||||||||||
|
Consumer Discretionary – 16.95%
|
||||||||||||
|
Abercrombie & Fitch Co., Class A (a)
|
343,300
|
20,879,506
|
3.53
|
%
|
||||||||
|
Gap, Inc.
|
1,860,200
|
23,810,560
|
4.02
|
%
|
||||||||
|
Group 1 Automotive, Inc.
|
74,200
|
18,722,886
|
3.17
|
%
|
||||||||
|
Guess, Inc.
|
920,600
|
19,792,900
|
3.35
|
%
|
||||||||
|
Modine Manufacturing Co. (a)
|
430,800
|
17,016,600
|
2.88
|
%
|
||||||||
|
|
100,222,452
|
16.95
|
%
|
|||||||||
|
|
||||||||||||
|
Consumer Staples – 6.50%
|
||||||||||||
|
Coca-Cola Consolidated, Inc.
|
30,056
|
19,127,939
|
3.24
|
%
|
||||||||
|
Sprouts Farmers Market, Inc. (a)
|
459,100
|
19,291,382
|
3.26
|
%
|
||||||||
|
|
38,419,321
|
6.50
|
%
|
|||||||||
|
|
||||||||||||
|
Energy – 25.37%
|
||||||||||||
|
California Resources Corp.
|
348,700
|
18,338,133
|
3.10
|
%
|
||||||||
|
CONSOL Energy, Inc.
|
190,600
|
17,514,234
|
2.96
|
%
|
||||||||
|
EnLink Midstream LLC
|
1,619,700
|
19,906,113
|
3.37
|
%
|
||||||||
|
Liberty Energy, Inc.
|
1,079,800
|
21,272,060
|
3.60
|
%
|
||||||||
|
Oceaneering International, Inc. (a)
|
763,100
|
16,780,569
|
2.84
|
%
|
||||||||
|
Par Pacific Holdings, Inc. (a)
|
558,900
|
18,343,098
|
3.10
|
%
|
||||||||
|
PBF Energy, Inc., Class A
|
385,934
|
18,343,443
|
3.10
|
%
|
||||||||
|
Plains GP Holdings LP, Class A
|
1,245,000
|
19,521,600
|
3.30
|
%
|
||||||||
|
|
150,019,250
|
25.37
|
%
|
|||||||||
|
|
||||||||||||
|
Financials – 1.39%
|
||||||||||||
|
NCR Atleos Corp. (a)
|
371,450
|
8,194,187
|
1.39
|
%
|
||||||||
|
|
||||||||||||
|
Industrials – 35.57%
|
||||||||||||
|
Applied Industrial Technologies, Inc.
|
123,500
|
18,958,485
|
3.20
|
%
|
||||||||
|
Comfort Systems USA, Inc.
|
115,200
|
20,949,120
|
3.54
|
%
|
||||||||
|
EMCOR Group, Inc.
|
93,500
|
19,321,775
|
3.27
|
%
|
||||||||
|
Flowserve Corp.
|
498,500
|
18,304,920
|
3.10
|
%
|
||||||||
|
Fluor Corp. (a)
|
550,200
|
18,316,158
|
3.10
|
%
|
||||||||
|
MillerKnoll, Inc.
|
805,400
|
18,926,900
|
3.20
|
%
|
||||||||
|
MSC Industrial Direct Co., Inc.
|
196,900
|
18,656,275
|
3.16
|
%
|
||||||||
|
Oshkosh Corp.
|
203,100
|
17,817,963
|
3.01
|
%
|
||||||||
|
Parsons Corp. (a)
|
353,300
|
19,979,115
|
3.39
|
%
|
||||||||
The accompanying notes are an integral part of these financial statements.
|
WWW.HENNESSYFUNDS.COM
|
10
|
SCHEDULE OF INVESTMENTS
|
|
COMMON STOCKS
|
Number
|
% of
|
||||||||||
|
|
of Shares
|
Value
|
Net Assets
|
|||||||||
|
Industrials (Continued)
|
||||||||||||
|
Sterling Infrastructure, Inc. (a)
|
266,000
|
$
|
19,378,100
|
3.28
|
%
|
|||||||
|
XPO, Inc. (a)
|
259,200
|
19,649,952
|
3.32
|
%
|
||||||||
|
|
210,258,763
|
35.57
|
%
|
|||||||||
|
Information Technology – 5.17%
|
||||||||||||
|
Kyndryl Holdings, Inc. (a)
|
1,284,400
|
18,790,772
|
3.18
|
%
|
||||||||
|
NCR Voyix Corp. (a)
|
771,400
|
11,794,706
|
1.99
|
%
|
||||||||
|
|
30,585,478
|
5.17
|
%
|
|||||||||
|
Materials – 3.13%
|
||||||||||||
|
Carpenter Technology Corp.
|
295,400
|
18,527,488
|
3.13
|
%
|
||||||||
|
|
||||||||||||
|
Total Common Stocks
|
||||||||||||
|
(Cost $571,285,807)
|
573,465,585
|
97.00
|
%
|
|||||||||
|
|
||||||||||||
|
SHORT-TERM INVESTMENTS – 2.95%
|
||||||||||||
|
Money Market Funds – 2.95%
|
||||||||||||
|
First American Treasury Obligations Fund – Class X, 5.275% (b)
|
17,459,708
|
17,459,708
|
2.95
|
%
|
||||||||
|
|
||||||||||||
|
Total Short-Term Investments
|
||||||||||||
|
(Cost $17,459,708)
|
17,459,708
|
2.95
|
%
|
|||||||||
|
|
||||||||||||
|
Total Investments
|
||||||||||||
|
(Cost $588,745,515) – 99.95%
|
590,925,293
|
99.95
|
%
|
|||||||||
|
Other Assets in Excess of Liabilities – 0.05%
|
316,929
|
0.05
|
%
|
|||||||||
|
|
||||||||||||
|
TOTAL NET ASSETS – 100.00%
|
$
|
591,242,222
|
100.00
|
%
|
||||||||
Percentages are stated as a percent of net assets.
|
(a)
|
Non-income producing security.
|
|
(b)
|
The rate listed is the fund’s seven-day yield as of October 31, 2023.
|
The accompanying notes are an integral part of these financial statements.
|
HENNESSY FUNDS
|
1-800-966-4354
|
11
Summary of Fair Value Exposure as of October 31, 2023
The following is a summary of the inputs used to value the Fund’s net assets as of October 31, 2023 (see Note 3 in the accompanying Notes to the Financial Statements):
|
Common Stocks
|
Level 1
|
Level 2
|
Level 3
|
Total
|
||||||||||||
|
Communication Services
|
$
|
17,238,646
|
$
|
—
|
$
|
—
|
$
|
17,238,646
|
||||||||
|
Consumer Discretionary
|
100,222,452
|
—
|
—
|
100,222,452
|
||||||||||||
|
Consumer Staples
|
38,419,321
|
—
|
—
|
38,419,321
|
||||||||||||
|
Energy
|
150,019,250
|
—
|
—
|
150,019,250
|
||||||||||||
|
Financials
|
8,194,187
|
—
|
—
|
8,194,187
|
||||||||||||
|
Industrials
|
210,258,763
|
—
|
—
|
210,258,763
|
||||||||||||
|
Information Technology
|
30,585,478
|
—
|
—
|
30,585,478
|
||||||||||||
|
Materials
|
18,527,488
|
—
|
—
|
18,527,488
|
||||||||||||
|
Total Common Stocks
|
$
|
573,465,585
|
$
|
—
|
$
|
—
|
$
|
573,465,585
|
||||||||
|
Short-Term Investments
|
||||||||||||||||
|
Money Market Funds
|
$
|
17,459,708
|
$
|
—
|
$
|
—
|
$
|
17,459,708
|
||||||||
|
Total Short-Term Investments
|
$
|
17,459,708
|
$
|
—
|
$
|
—
|
$
|
17,459,708
|
||||||||
|
Total Investments
|
$
|
590,925,293
|
$
|
—
|
$
|
—
|
$
|
590,925,293
|
||||||||
The accompanying notes are an integral part of these financial statements.
|
WWW.HENNESSYFUNDS.COM
|
12
|
SCHEDULE OF INVESTMENTS/STATEMENT OF ASSETS AND LIABILITIES
|
Financial Statements
|
Statement of Assets and Liabilities as of October 31, 2023
|
|
ASSETS:
|
||||
|
Investments in securities, at value (cost $588,745,515)
|
$
|
590,925,293
|
||
|
Dividends and interest receivable
|
147,215
|
|||
|
Receivable for fund shares sold
|
1,015,462
|
|||
|
Return of capital receivable
|
535,500
|
|||
|
Prepaid expenses and other assets
|
63,536
|
|||
|
Total assets
|
592,687,006
|
|||
|
LIABILITIES:
|
||||
|
Payable for fund shares redeemed
|
855,170
|
|||
|
Payable to advisor
|
375,407
|
|||
|
Payable to administrator
|
98,864
|
|||
|
Payable to auditor
|
22,746
|
|||
|
Accrued distribution fees
|
42,563
|
|||
|
Accrued service fees
|
25,655
|
|||
|
Accrued trustees fees
|
9,078
|
|||
|
Accrued expenses and other payables
|
15,301
|
|||
|
Total liabilities
|
1,444,784
|
|||
|
NET ASSETS
|
$
|
591,242,222
|
||
|
NET ASSETS CONSISTS OF:
|
||||
|
Capital stock
|
$
|
527,846,078
|
||
|
Total distributable earnings
|
63,396,144
|
|||
|
Total net assets
|
$
|
591,242,222
|
||
|
NET ASSETS:
|
||||
|
Investor Class
|
||||
|
Shares authorized (no par value)
|
Unlimited
|
|||
|
Net assets applicable to outstanding shares
|
$
|
297,365,047
|
||
|
Shares issued and outstanding
|
15,717,108
|
|||
|
Net asset value, offering price, and redemption price per share
|
$
|
18.92
|
||
|
Institutional Class
|
||||
|
Shares authorized (no par value)
|
Unlimited
|
|||
|
Net assets applicable to outstanding shares
|
$
|
293,877,175
|
||
|
Shares issued and outstanding
|
14,762,286
|
|||
|
Net asset value, offering price, and redemption price per share
|
$
|
19.91
|
||
The accompanying notes are an integral part of these financial statements.
|
HENNESSY FUNDS
|
1-800-966-4354
|
13
Financial Statements
|
Statement of Operations for the year ended October 31, 2023
|
|
INVESTMENT INCOME:
|
||||
|
Distributions received from master limited partnerships
|
$
|
855,171
|
||
|
Return of capital on distributions received
|
(855,171
|
)
|
||
|
Dividend income from common stock
|
5,909,259
|
|||
|
Interest income
|
629,683
|
|||
|
Total investment income
|
6,538,942
|
|||
|
EXPENSES:
|
||||
|
Investment advisory fees (See Note 5)
|
3,415,249
|
|||
|
Sub-transfer agent expenses – Investor Class (See Note 5)
|
505,543
|
|||
|
Sub-transfer agent expenses – Institutional Class (See Note 5)
|
175,557
|
|||
|
Administration, accounting, custody, and transfer agent fees (See Note 5)
|
433,690
|
|||
|
Distribution fees – Investor Class (See Note 5)
|
371,567
|
|||
|
Service fees – Investor Class (See Note 5)
|
247,711
|
|||
|
Federal and state registration fees
|
41,004
|
|||
|
Reports to shareholders
|
34,534
|
|||
|
Trustees’ fees and expenses
|
26,241
|
|||
|
Audit fees
|
22,747
|
|||
|
Compliance expense (See Note 5)
|
22,676
|
|||
|
Legal fees
|
9,220
|
|||
|
Other expenses
|
70,335
|
|||
|
Total expenses
|
5,376,074
|
|||
|
NET INVESTMENT INCOME
|
$
|
1,162,868
|
||
|
REALIZED AND UNREALIZED GAINS (LOSSES):
|
||||
|
Net realized gain on investments
|
$
|
63,162,651
|
||
|
Net change in unrealized appreciation/depreciation on investments
|
(36,349,926
|
)
|
||
|
Net gain on investments
|
26,812,725
|
|||
|
NET INCREASE IN NET ASSETS RESULTING FROM OPERATIONS
|
$
|
27,975,593
|
||
The accompanying notes are an integral part of these financial statements.
|
WWW.HENNESSYFUNDS.COM
|
14
|
STATEMENT OF OPERATIONS/STATEMENTS OF CHANGES IN NET ASSETS
|
Financial Statements
|
Statements of Changes in Net Assets
|
|
Year Ended
|
Year Ended
|
|||||||
|
October 31, 2023
|
October 31, 2022
|
|||||||
|
OPERATIONS:
|
||||||||
|
Net investment income
|
$
|
1,162,868
|
$
|
3,718,695
|
||||
|
Net realized gain on investments
|
63,162,651
|
112,575,778
|
||||||
|
Net change in unrealized
|
||||||||
|
appreciation/depreciation on investments
|
(36,349,926
|
)
|
(90,874,972
|
)
|
||||
|
Net increase in net assets resulting from operations
|
27,975,593
|
25,419,501
|
||||||
|
DISTRIBUTIONS TO SHAREHOLDERS:
|
||||||||
|
Distributable earnings – Investor Class
|
(37,371,548
|
)
|
(3,694,691
|
)
|
||||
|
Distributable earnings – Institutional Class
|
(30,112,291
|
)
|
(2,816,027
|
)
|
||||
|
Total distributions
|
(67,483,839
|
)
|
(6,510,718
|
)
|
||||
|
CAPITAL SHARE TRANSACTIONS:
|
||||||||
|
Proceeds from shares subscribed – Investor Class
|
118,407,401
|
15,003,867
|
||||||
|
Proceeds from shares subscribed – Institutional Class
|
149,518,551
|
31,051,642
|
||||||
|
Dividends reinvested – Investor Class
|
36,888,250
|
3,639,869
|
||||||
|
Dividends reinvested – Institutional Class
|
29,290,877
|
2,742,901
|
||||||
|
Cost of shares redeemed – Investor Class
|
(52,168,702
|
)
|
(33,887,466
|
)
|
||||
|
Cost of shares redeemed – Institutional Class
|
(40,806,405
|
)
|
(36,606,351
|
)
|
||||
|
Net increase (decrease) in net assets derived
|
||||||||
|
from capital share transactions
|
241,129,972
|
(18,055,538
|
)
|
|||||
|
TOTAL INCREASE IN NET ASSETS
|
201,621,726
|
853,245
|
||||||
|
NET ASSETS:
|
||||||||
|
Beginning of year
|
389,620,496
|
388,767,251
|
||||||
|
End of year
|
$
|
591,242,222
|
$
|
389,620,496
|
||||
|
CHANGES IN SHARES OUTSTANDING:
|
||||||||
|
Shares sold – Investor Class
|
6,016,089
|
762,770
|
||||||
|
Shares sold – Institutional Class
|
7,194,865
|
1,496,059
|
||||||
|
Shares issued to holders as reinvestment
|
||||||||
|
of dividends – Investor Class
|
2,163,534
|
184,671
|
||||||
|
Shares issued to holders as reinvestment
|
||||||||
|
of dividends – Institutional Class
|
1,638,192
|
133,150
|
||||||
|
Shares redeemed – Investor Class
|
(2,782,892
|
)
|
(1,726,740
|
)
|
||||
|
Shares redeemed – Institutional Class
|
(2,066,940
|
)
|
(1,822,025
|
)
|
||||
|
Net increase (decrease) in shares outstanding
|
12,162,848
|
(972,115
|
)
|
|||||
The accompanying notes are an integral part of these financial statements.
|
HENNESSY FUNDS
|
1-800-966-4354
|
15
Financial Statements
|
Financial Highlights
|
For an Investor Class share outstanding throughout each year
PER SHARE DATA:
Net asset value, beginning of year
Income from investment operations:
Net investment income (loss)(1)
Net realized and unrealized gains (losses) on investments
Total from investment operations
Less distributions:
Dividends from net investment income
Dividends from net realized gains
Total distributions
Net asset value, end of year
TOTAL RETURN
SUPPLEMENTAL DATA AND RATIOS:
Net assets, end of year (millions)
Ratio of expenses to average net assets
Ratio of net investment income (loss) to average net assets
Portfolio turnover rate(2)
|
(1)
|
Calculated using the average shares outstanding method.
|
|
(2)
|
Calculated on the basis of the Fund as a whole.
|
The accompanying notes are an integral part of these financial statements.
|
WWW.HENNESSYFUNDS.COM
|
16
|
FINANCIAL HIGHLIGHTS — INVESTOR CLASS
|
|
Year Ended October 31,
|
||||||||||||||||||
|
2023
|
2022
|
2021
|
2020
|
2019
|
||||||||||||||
|
$
|
20.83
|
$
|
19.78
|
$
|
13.27
|
$
|
12.01
|
$
|
16.87
|
|||||||||
|
0.01
|
0.17
|
(0.14
|
)
|
(0.03
|
)
|
(0.02
|
)
|
|||||||||||
|
1.68
|
1.22
|
6.65
|
1.29
|
(0.34
|
)
|
|||||||||||||
|
1.69
|
1.39
|
6.51
|
1.26
|
(0.36
|
)
|
|||||||||||||
|
—
|
(0.34
|
)
|
—
|
—
|
—
|
|||||||||||||
|
(3.60
|
)
|
—
|
—
|
—
|
(4.50
|
)
|
||||||||||||
|
(3.60
|
)
|
(0.34
|
)
|
—
|
—
|
(4.50
|
)
|
|||||||||||
|
$
|
18.92
|
$
|
20.83
|
$
|
19.78
|
$
|
13.27
|
$
|
12.01
|
|||||||||
|
10.03
|
%
|
7.12
|
%
|
49.06
|
%
|
10.49
|
%
|
-1.22
|
%
|
|||||||||
|
$
|
297.37
|
$
|
215.00
|
$
|
219.58
|
$
|
188.71
|
$
|
206.11
|
|||||||||
|
1.34
|
%
|
1.35
|
%
|
1.36
|
%
|
1.37
|
%
|
1.36
|
%
|
|||||||||
|
0.09
|
%
|
0.84
|
%
|
(0.74
|
)%
|
(0.27
|
)%
|
(0.15
|
)%
|
|||||||||
|
120
|
%
|
176
|
%
|
0
|
%
|
94
|
%
|
70
|
%
|
|||||||||
The accompanying notes are an integral part of these financial statements.
|
HENNESSY FUNDS
|
1-800-966-4354
|
17
Financial Statements
|
Financial Highlights
|
For an Institutional Class share outstanding throughout each year
PER SHARE DATA:
Net asset value, beginning of year
Income from investment operations:
Net investment income (loss)(1)
Net realized and unrealized gains (losses) on investments
Total from investment operations
Less distributions:
Dividends from net investment income
Dividends from net realized gains
Total distributions
Net asset value, end of year
TOTAL RETURN
SUPPLEMENTAL DATA AND RATIOS:
Net assets, end of year (millions)
Ratio of expenses to average net assets
Ratio of net investment income (loss) to average net assets
Portfolio turnover rate(2)
|
(1)
|
Calculated using the average shares outstanding method.
|
|
(2)
|
Calculated on the basis of the Fund as a whole.
|
The accompanying notes are an integral part of these financial statements.
|
WWW.HENNESSYFUNDS.COM
|
18
|
FINANCIAL HIGHLIGHTS — INSTITUTIONAL CLASS
|
|
Year Ended October 31,
|
||||||||||||||||||
|
2023
|
2022
|
2021
|
2020
|
2019
|
||||||||||||||
|
$
|
21.84
|
$
|
20.66
|
$
|
13.81
|
$
|
12.46
|
$
|
17.38
|
|||||||||
|
0.09
|
0.24
|
(0.07
|
)
|
0.01
|
0.03
|
|||||||||||||
|
1.76
|
1.29
|
6.92
|
1.34
|
(0.36
|
)
|
|||||||||||||
|
1.85
|
1.53
|
6.85
|
1.35
|
(0.33
|
)
|
|||||||||||||
|
—
|
(0.35
|
)
|
—
|
—
|
—
|
|||||||||||||
|
(3.78
|
)
|
—
|
—
|
—
|
(4.59
|
)
|
||||||||||||
|
(3.78
|
)
|
(0.35
|
)
|
—
|
—
|
(4.59
|
)
|
|||||||||||
|
$
|
19.91
|
$
|
21.84
|
$
|
20.66
|
$
|
13.81
|
$
|
12.46
|
|||||||||
|
10.43
|
%
|
7.52
|
%
|
49.60
|
%
|
10.83
|
%
|
-0.84
|
%
|
|||||||||
|
$
|
293.88
|
$
|
174.62
|
$
|
169.19
|
$
|
136.09
|
$
|
168.79
|
|||||||||
|
0.97
|
%
|
1.00
|
%
|
0.99
|
%
|
1.01
|
%
|
1.00
|
%
|
|||||||||
|
0.44
|
%
|
1.18
|
%
|
(0.38
|
)%
|
0.09
|
%
|
0.20
|
%
|
|||||||||
|
120
|
%
|
176
|
%
|
0
|
%
|
94
|
%
|
70
|
%
|
|||||||||
The accompanying notes are an integral part of these financial statements.
|
HENNESSY FUNDS
|
1-800-966-4354
|
19
Financial Statements
|
Notes to the Financial Statements October 31, 2023
|
1). ORGANIZATION
The Hennessy Cornerstone Mid Cap 30 Fund (the “Fund”) is a series of Hennessy Funds Trust (the “Trust”), which was organized as a Delaware statutory trust on September 17, 1992. The Fund is an open-end management
investment company registered under the Investment Company Act of 1940, as amended. The investment objective of the Fund is long-term growth of capital. The Fund is a diversified fund.
The Fund offers Investor Class and Institutional Class shares. Each class of shares differs principally in its respective 12b-1 distribution and service, shareholder servicing, and sub-transfer agent
expenses. There are no sales charges. Each class has identical rights to earnings, assets, and voting privileges, except for class-specific expenses and exclusive rights to vote on matters affecting only one class.
As an investment company, the Fund follows the investment company accounting and reporting guidance of the Financial Accounting Standards Board (the “FASB”) Accounting Standard Codification Topic 946
“Financial Services—Investment Companies.”
2). SIGNIFICANT ACCOUNTING POLICIES
The following is a summary of significant accounting policies consistently followed by the Fund in the preparation of the financial statements. These policies conform to U.S. generally accepted accounting principles
(“GAAP”).
|
a).
|
Securities Valuation – All investments in securities are valued in accordance with the Fund’s valuation policies and procedures, as described in Note 3.
|
|
b).
|
Federal Income Taxes – The Fund has elected to be taxed as a regulated investment company and intends to distribute substantially all of its taxable income to its shareholders and otherwise comply with the
provisions of the Internal Revenue Code of 1986, as amended, applicable to regulated investment companies. As a result, the Fund has made no provision for federal income taxes or excise taxes. Net investment income/loss and realized
gains/losses for federal income tax purposes may differ from those reported in the financial statements because of temporary book-basis and tax-basis differences. Temporary differences are primarily the result of the treatment of wash
sales for tax reporting purposes. The Fund recognizes interest and penalties related to income tax benefits, if any, in the Statement of Operations as an income tax expense. Distributions from net realized gains for book purposes may
include short-term capital gains, which are included as ordinary income to shareholders for tax purposes. The Fund may utilize equalization accounting for tax purposes and designate earnings and profits, including net realized gains
distributed to shareholders on redemption of shares, as part of the dividends paid deduction for income tax purposes.
|
|
Due to inherent differences in the recognition of income, expenses, and realized gains/losses under GAAP and federal income tax regulations,
permanent differences between book and tax basis for reporting are identified and appropriately reclassified in the Statement of Assets and Liabilities, as needed. The adjustments for fiscal year 2023 are as follows:
|
|
Total
|
|||
|
Distributable
|
|||
|
Earnings
|
Capital Stock
|
||
|
$1,988,545
|
$(1,988,545)
|
|
WWW.HENNESSYFUNDS.COM
|
20
|
NOTES TO THE FINANCIAL STATEMENTS
|
|
c).
|
Accounting for Uncertainty in Income Taxes – The Fund has accounting policies regarding recognition and measurement of tax positions taken or expected to be taken on a tax return. The tax returns of the Fund for
the prior three fiscal years are open for examination. The Fund has reviewed all open tax years in major tax jurisdictions and concluded that there is no impact on the Fund’s net assets and no tax liability resulting from unrecognized tax
benefits relating to uncertain income tax positions taken or expected to be taken on a tax return. The Fund’s major tax jurisdictions are U.S. federal and Delaware.
|
|
d).
|
Income and Expenses – Dividend income is recognized on the ex-dividend date or as soon as information is available to the Fund. Interest income, which includes the amortization of premium and accretion of
discount, is recognized on an accrual basis. Market discounts, original issue discounts, and market premiums on debt securities are accreted or amortized to interest income over the life of a security with a corresponding increase or
decrease, as applicable, in the cost basis of such security using the yield-to-maturity method or, where applicable, the first call date of the security. Other non-cash dividends are recognized as investment income at the fair value of
the property received. The Fund is charged for those expenses that are directly attributable to its portfolio, such as advisory, administration, and certain shareholder service fees. Income, expenses (other than expenses attributable to a
specific class), and realized and unrealized gains/losses on investments are allocated to each class of shares based on such class’s net assets. Distributions received from the Fund’s investments in master limited partnerships (“MLPs”)
generally consist of ordinary income, capital gains, and return of capital. The Fund records investment income on the ex-date of the distributions. For financial statement purposes, the Fund uses return of capital and income estimates to
allocate the dividend income received. Such estimates are based on historical information available from the MLPs and other industry sources. These estimates may subsequently be revised based on information received from the MLPs after
their tax reporting periods are concluded, as the actual character of these distributions is not known until after the fiscal year end of the Fund.
|
|
e).
|
Distributions to Shareholders – Dividends from net investment income for the Fund, if any, are declared and paid annually, usually in December. Distributions of net realized capital gains, if any, are declared
and paid annually, usually in December.
|
|
f).
|
Security Transactions – Investment and shareholder transactions are recorded on the trade date. The Fund determines the realized gain/loss from an investment transaction by comparing the original cost of the
security lot sold with the net sale proceeds. Discounts and premiums on securities purchased are accreted or amortized, respectively, over the life of each such security.
|
|
g).
|
Use of Estimates – Preparing financial statements in accordance with GAAP requires management to make estimates and assumptions that affect the reported amounts of assets and liabilities and disclosure of
contingent assets and liabilities at the date of the financial statements, as well as the reported change in net assets during the reporting period. Actual results could differ from those estimates.
|
|
h).
|
Share Valuation – The net asset value (“NAV”) per share of the Fund is calculated by dividing (i) the total value of the securities held by the Fund, plus cash and other assets, minus all liabilities (including
estimated accrued expenses) by (ii) the total number of Fund shares outstanding, rounded to the nearest $0.01. Fund shares are not priced on days the New York Stock Exchange is closed for trading. The offering and redemption price per
share for the Fund is equal to the Fund’s NAV per share.
|
|
HENNESSY FUNDS
|
1-800-966-4354
|
21
|
i).
|
Partnership Accounting Policy – To the extent the Fund receives distributions from underlying partnerships in which it invests, the Fund records its pro rata share of income/loss and capital gains/losses and
accordingly adjusts the cost basis of the underlying partnerships for return of capital.
|
|
j).
|
Illiquid Securities – Pursuant to Rule 22e-4 under the 1940 Act, the Fund has adopted a Liquidity Risk Management Program (the “Liquidity Program”). The Liquidity Program requires, among other things, that the
Fund limit its illiquid investments to no more than 15% of its net assets. An illiquid investment is any investment that the Fund reasonably expects cannot be sold or disposed of by the Fund in current market conditions in seven calendar
days or less without the sale or disposition significantly changing the market value of the investment.
|
|
k).
|
Recent Accounting Pronouncements and Regulatory Updates – In October 2022, the Securities and Exchange Commission (“SEC”) adopted a final rule relating to Tailored Shareholder Reports for Mutual Funds and
Exchange-Traded Funds (ETFs); Fee Information in Investment Company Advertisements. The rule and form amendments will require mutual funds and ETFs to transmit concise and visually engaging shareholder reports that highlight key
information. The amendments also will require that funds tag information in a structured data format. In addition, the rule amendments will require that certain more in-depth information be made available online and available for delivery
free of charge to investors on request. The amendments became effective January 24, 2023. There is an 18-month transition period after the effective date of the amendment.
|
|
In June 2022, the FASB issued Accounting Standards Update (“ASU”) 2022-03, Fair Value Measurement (Topic 820): Fair Value Measurement of
Equity Securities Subject to Contractual Sale Restrictions. The ASU clarifies that a contractual restriction on the sale of an equity security is not considered part of the unit of account of the equity security and, therefore, is not
considered in measuring the fair value. The amendments also require additional disclosures related to equity securities subject to contractual sale restrictions. The ASU is effective for fiscal years beginning after December 15, 2023, and
interim periods within those fiscal years.
|
3). SECURITIES VALUATION
The Fund follows its valuation policies and procedures in determining its NAV and, in preparing these financial statements, the fair value accounting standards that establish an authoritative definition of fair value
and set out a hierarchy for measuring fair value. These standards require additional disclosures about the various inputs and valuation techniques used to develop the measurements of fair value and a discussion of changes in valuation techniques
and related inputs during the period. These inputs are summarized in the three broad levels listed below:
|
Level 1 –
|
Unadjusted, quoted prices in active markets for identical instruments that the Fund has the ability to access at the date of measurement.
|
|
|
Level 2 –
|
Other significant observable inputs other than quoted prices included in Level 1 (including, but not limited to, quoted prices in active markets for similar instruments, quoted prices in markets that are not
active for identical or similar instruments, and model-derived valuations in which all significant inputs and significant value drivers are observable in active markets, such as interest rates, prepayment speeds, credit risk curves,
default rates, and similar data).
|
|
WWW.HENNESSYFUNDS.COM
|
22
|
NOTES TO THE FINANCIAL STATEMENTS
|
|
Level 3 –
|
Significant unobservable inputs (including the Fund’s own assumptions about what market participants would use to price the asset or liability based on the best available information) when observable inputs are
unavailable.
|
The following is a description of the valuation techniques applied to the Fund’s major categories of assets and liabilities on a recurring basis:
|
Equity Securities – Equity securities, including common stocks, preferred stocks, exchange-traded funds, closed-end mutual funds, partnerships, rights, MLPs, and real
estate investment trusts, that are traded on a securities exchange for which a last-quoted sales price is readily available generally are valued at the last sales price as reported by the primary exchange on which the securities are
listed. Securities listed on The Nasdaq Stock Market (“Nasdaq”) generally are valued at the Nasdaq Official Closing Price, which may differ from the last sales price reported. Securities traded on a securities exchange for which a
last-quoted sales price is not readily available generally are valued at the mean between the bid and ask prices. To the extent these securities are actively traded and valuation adjustments are not applied, they are classified in Level 1
of the fair value hierarchy.
|
|
|
Registered Investment Companies – Investments in open-end registered investment companies, commonly referred to as mutual funds, generally are priced at the ending NAV
provided by the applicable mutual fund’s service agent and are classified in Level 1 of the fair value hierarchy.
|
|
|
Debt Securities – Debt securities, including corporate bonds, asset-backed securities, mortgage-backed securities, municipal bonds, U.S. Treasuries, and U.S. government
agency issues, are generally valued at market on the basis of valuations furnished by an independent pricing service that utilizes both dealer-supplied valuations and formula-based techniques. The pricing service may consider recently
executed transactions in securities of the issuer or comparable issuers, market price quotations (where observable), bond spreads, and fundamental data relating to the issuer. In addition, the model may incorporate observable market data,
such as reported sales of similar securities, broker quotes, yields, bids, offers, and reference data. Certain securities are valued primarily using dealer quotations. These securities are generally classified in Level 2 of the fair value
hierarchy.
|
|
|
Short-Term Securities – Short-term equity investments, including money market funds, are valued in the manner specified above for equity securities. Short-term debt
investments with an original term to maturity of 60 days or less are valued at amortized cost, which approximates fair market value. If the original term to maturity of a short-term debt investment exceeds 60 days, then the values as of
the 61st day prior to maturity are amortized. Amortized cost is not used if its use would be inappropriate due to credit or other impairments of the issuer, in which case the security’s fair value would be determined as described below.
Short-term securities are generally classified in Level 1 or Level 2 of the fair value hierarchy depending on the inputs used and market activity levels for specific securities.
|
If market quotations are not readily available or if a significant event has occurred that indicates the closing price of a security no longer represents the true value of that security, any security
or other asset will be valued at its fair value in accordance with Rule 2a-5 under the 1940 Act. The Board of Trustees of the Fund (the “Board”) has designated Hennessy Advisors, Inc. (the “Advisor”) as the Fund’s valuation designee to make all
fair value determinations with respect to the Fund’s portfolio investments under the Fund’s fair value pricing procedures, subject to the Board’s oversight. There are numerous criteria considered in determining a fair value of a security, such as
the trading volume of a
|
HENNESSY FUNDS
|
1-800-966-4354
|
23
security and markets, the values of other similar securities, and news events with direct bearing on a security or markets. Fair value pricing results in an estimated price for a security that reflects the amount the
Fund might reasonably expect to receive in a current sale. Depending on the relative significance of the valuation inputs, these securities may be classified in either Level 2 or Level 3 of the fair value hierarchy. The Advisor will regularly
evaluate whether the Fund’s fair value pricing procedures continue to be appropriate in light of the specific circumstances of the Fund and the quality of prices obtained through their application of such procedures.
The Fund has performed an analysis of all existing investments to determine the significance and character of all inputs to their fair value determinations. Various inputs are used to determine the
value of the Fund’s investments. The inputs or methodology used for valuing securities are not necessarily an indication of the risk associated with investing in those securities. Details related to the fair value hierarchy of the Fund’s
securities as of October 31, 2023, are included in the Schedule of Investments.
4). INVESTMENT TRANSACTIONS
Purchases and sales of investment securities (excluding government and short-term investments) for the Fund during fiscal year 2023 were $710,544,481 and $541,992,674, respectively.
There were no purchases or sales/maturities of long-term U.S. government securities for the Fund during fiscal year 2023.
5). INVESTMENT ADVISORY FEE AND OTHER TRANSACTIONS WITH AFFILIATES
The Advisor provides the Fund with investment advisory services under an Investment Advisory Agreement. The Advisor furnishes all investment advice, office space, and facilities and most of the personnel needed by the
Fund. As compensation for its services, the Advisor is entitled to a monthly fee from the Fund. The fee is based on the average daily net assets of the Fund at an annual rate of 0.74%. The net investment advisory fees expensed by the Fund during
fiscal year 2023 are included in the Statement of Operations.
The Board has approved a Shareholder Servicing Agreement for Investor Class shares of the Fund, which compensates the Advisor for the non-investment advisory services it provides to the Fund. The
Shareholder Servicing Agreement provides for a monthly fee paid to the Advisor at an annual rate of 0.10% of the average daily net assets of the Fund attributable to Investor Class shares. The shareholder service fees expensed by the Fund during
fiscal year 2023 are included in the Statement of Operations.
The Fund has adopted a plan pursuant to Rule 12b-1 under the Investment Company Act of 1940, as amended, that authorizes payments in connection with the distribution of Fund shares at an annual rate
of up to 0.25% of the Fund’s average daily net assets attributable to Investor Class shares. Even though the authorized rate is up to 0.25%, the Fund is currently only using up to 0.15% of its average daily net assets attributable to Investor
Class shares for such purpose. Amounts paid under the plan may be spent on any activities or expenses primarily intended to result in the sale of shares, including, but not limited to, advertising, shareholder account servicing, printing and
mailing of prospectuses to other than current shareholders, printing and mailing of sales literature, and compensation for sales and marketing activities or to financial institutions and others, such as dealers and distributors. The distribution
fees expensed by the Fund during fiscal year 2023 are included in the Statement of Operations.
The Fund has entered into agreements with various brokers, dealers, and financial intermediaries in connection with the sale of Fund shares. The agreements provide for periodic payments of
sub-transfer agent expenses by the Fund to the brokers, dealers, and
|
WWW.HENNESSYFUNDS.COM
|
24
|
NOTES TO THE FINANCIAL STATEMENTS
|
financial intermediaries for providing certain shareholder maintenance services. These shareholder services include the pre-processing and quality control of new accounts, shareholder correspondence, answering customer
inquiries regarding account status, and facilitating shareholder telephone transactions. The sub-transfer agent fees expensed by the Fund during fiscal year 2023 are included in the Statement of Operations.
U.S. Bancorp Fund Services, LLC, d/b/a U.S. Bank Global Fund Services (“Fund Services”) provides the Fund with administrative, accounting, and transfer agent services. As administrator, Fund Services
is responsible for activities such as (i) preparing various federal and state regulatory filings, reports, and returns for the Fund, (ii) preparing reports and materials to be supplied to the Board, (iii) monitoring the activities of the Fund’s
custodian, transfer agent, and accountants, and (iv) coordinating the preparation and payment of the Fund’s expenses and reviewing the Fund’s expense accruals. U.S. Bank N.A., an affiliate of Fund Services, serves as the Fund’s custodian. The
servicing agreements between the Trust, Fund Services, and U.S. Bank N.A. contain a fee schedule that is inclusive of administrative, accounting, custody, and transfer agent fees. The administrative, accounting, custody, and transfer agent fees
expensed by the Fund during fiscal year 2023 are included in the Statement of Operations.
Quasar Distributors, LLC, a wholly owned broker-dealer subsidiary of Foreside Financial Group, LLC, acts as the Fund’s principal underwriter in a continuous public offering of Fund shares.
The officers of the Fund are affiliated with the Advisor. With the exception of the Chief Compliance Officer, such officers receive no compensation from the Fund for serving in their respective roles.
The Fund, along with the other funds in the Hennessy Funds family (collectively, the “Hennessy Funds”), makes reimbursement payments on an equal basis to the Advisor for a portion of the salary and benefits associated with the office of the Chief
Compliance Officer. The compliance fees expensed by the Fund during fiscal year 2023 for reimbursement payments to the Advisor are included in the Statement of Operations.
6). GUARANTEES AND INDEMNIFICATIONS
Under the Hennessy Funds’ organizational documents, their officers and trustees are indemnified by the Hennessy Funds against certain liabilities arising out of the performance of their duties to the Hennessy Funds.
Additionally, in the normal course of business, the Hennessy Funds enter into contracts with service providers that contain general indemnification clauses. The Fund’s maximum exposure under these arrangements is unknown as this would involve
future claims that may be made against the Fund that have not yet occurred. Currently, the Fund expects the risk of loss to be remote.
7). LINE OF CREDIT
The Fund has an uncommitted line of credit with the other Hennessy Funds in the amount of the lesser of (i) $100,000,000 or (ii) 33.33% of each Hennessy Fund’s net assets, or 30% for the Hennessy Gas Utility Fund, the
Hennessy Japan Fund, and the Hennessy Japan Small Cap Fund and 10% for the Hennessy Balanced Fund. The line of credit is intended to provide any necessary short-term financing in connection with shareholder redemptions, subject to certain
restrictions. The credit facility is with the Hennessy Funds’ custodian bank, U.S. Bank N.A. Borrowings under this arrangement bear interest at the bank’s prime rate and are secured by all of the Fund’s assets (as to its own borrowings only).
During fiscal year 2023, the Fund did not have any borrowings outstanding under the line of credit.
|
HENNESSY FUNDS
|
1-800-966-4354
|
25
8). FEDERAL TAX INFORMATION
As of October 31, 2023, the components of accumulated earnings (losses) for income tax purposes were as follows:
|
Investments
|
|||||
|
Cost of investments for tax purposes
|
$
|
588,796,241
|
|||
|
Gross tax unrealized appreciation
|
$
|
26,472,783
|
|||
|
Gross tax unrealized depreciation
|
(24,343,731
|
)
|
|||
|
Net tax unrealized appreciation/(depreciation)
|
$
|
2,129,052
|
|||
|
Undistributed ordinary income
|
$
|
—
|
|||
|
Undistributed long-term capital gains
|
61,267,092
|
||||
|
Total distributable earnings
|
$
|
61,267,092
|
|||
|
Other accumulated gain/(loss)
|
$
|
—
|
|||
|
Total accumulated gain/(loss)
|
$
|
63,396,144
|
|||
The difference between book-basis unrealized appreciation/depreciation and tax-basis unrealized appreciation/depreciation (as shown above) is attributable primarily to wash sales and partnership
adjustments.
As of October 31, 2023, the Fund had no tax-basis capital losses to offset future capital gains.
As of October 31, 2023, the Fund did not defer, on a tax basis, any late-year ordinary losses. Late-year ordinary losses are net ordinary losses incurred after December 31, 2022, but within the
taxable year, that are deemed to arise on the first day of the Fund’s next taxable year.
During fiscal years 2023 and 2022, the tax character of distributions paid by the Fund was as follows:
|
Year Ended
|
Year Ended
|
||||||||
|
October 31, 2023
|
October 31, 2022
|
||||||||
|
Ordinary income(1)
|
$
|
—
|
$
|
6,510,718
|
|||||
|
Long-term capital gains
|
67,483,839
|
—
|
|||||||
|
Total distributions
|
$
|
67,483,839
|
$
|
6,510,718
|
|||||
|
(1) Ordinary income includes short-term capital gains.
|
|||||||||
9). GLOBAL EVENTS
A rise in protectionist trade policies, the possibility of a national or global recession, risks associated with pandemic and epidemic diseases, trade tensions, the possibility of changes to some international trade
agreements, political events, and continuing political tension and armed conflicts may adversely impact financial markets and the broader economy. For example, ongoing armed conflicts between Ukraine and Russia in Europe and among Israel, Hamas,
and other militant groups in the Middle East have caused and could continue to cause significant market disruptions and volatility with the markets in Europe and the Middle East, and have had negative impacts on markets in the United States.
These events could also have negative effects on the Fund’s investments that cannot be foreseen at the present time. As global systems, economies and financial markets are increasingly interconnected, events that once had only local impact are
now more likely to have regional or even global effects. Events that occur in one country, region or financial market will, more frequently, adversely impact issuers in other countries, regions, or markets. These impacts can be exacerbated by
failures of governments and societies to
|
WWW.HENNESSYFUNDS.COM
|
26
|
NOTES TO THE FINANCIAL STATEMENTS
|
adequately respond to an emerging event or threat. Your investment would be negatively impacted if the value of your portfolio holdings decreases as a result of such events, if these events adversely impact the
operations and effectiveness of the Advisor or other key service providers or if these events disrupt systems and processes necessary or beneficial to the management of accounts. These events may negatively impact broad segments of businesses and
populations and could have a significant and rapid negative impact on the performance of the Fund’s investments, increase the Fund’s volatility, or exacerbate pre-existing risks to the Fund.
10). EVENTS SUBSEQUENT TO YEAR END
Management has evaluated the Fund’s related events and transactions that occurred subsequent to October 31, 2023, through the date of issuance of the Fund’s financial statements. Management has determined that there
were no subsequent events requiring recognition or disclosure in the financial statements.
On December 7, 2023, capital gains were declared and paid to shareholders of record on December 6, 2023, as follows:
|
Long-term
|
|||
|
Investor Class
|
1.89834
|
||
|
Institutional Class
|
1.99820
|
|
HENNESSY FUNDS
|
1-800-966-4354
|
27
Report of Independent Registered Public
Accounting Firm
To the Board of Trustees of Hennessy Funds Trust
and the shareholders of the Hennessy Cornerstone Mid Cap 30 Fund
Novato, CA
Opinion on the Financial Statements
We have audited the accompanying statement of assets and liabilities of the Hennessy Cornerstone Mid Cap 30 Fund (the “Fund”), a series of Hennessy Funds Trust, including the schedule of investments, as of October 31,
2023, the related statement of operations for the year then ended, the statements of changes in net assets for each of the two years in the period then ended, the financial highlights for each of the five years in the period then ended, and the
related notes (collectively referred to as the “financial statements”). In our opinion, the financial statements present fairly, in all material respects, the financial position of the Fund as of October 31, 2023, the results of its operations
for the year then ended, the changes in its net assets for each of the two years in the period then ended, and the financial highlights for each of the five years in the period then ended in conformity with accounting principles generally
accepted in the United States of America.
Basis for Opinion
These financial statements are the responsibility of the Fund’s management. Our responsibility is to express an opinion on the Fund’s financial statements based on our audits. We are a public accounting firm registered
with the Public Company Accounting Oversight Board (United States) (“PCAOB”) and are required to be independent with respect to the Fund in accordance with the U.S. federal securities laws and the applicable rules and regulations of the
Securities and Exchange Commission and the PCAOB. We have served as the auditor of one or more of the funds in the Trust since 2002.
We conducted our audits in accordance with the standards of the PCAOB. Those standards require that we plan and perform the audit to obtain reasonable assurance about whether the financial statements are free of
material misstatement, whether due to error or fraud. The Fund is not required to have, nor were we engaged to perform, an audit of its internal control over financial reporting. As part of our audits we are required to obtain an understanding of
internal control over financial reporting, but not for the purpose of expressing an opinion on the effectiveness of the Fund’s internal control over financial reporting. Accordingly, we express no such opinion.
Our audits included performing procedures to assess the risks of material misstatement of the financial statements, whether due to error or fraud, and performing procedures that respond to those risks. Such procedures
included examining, on a test basis, evidence regarding the amounts and disclosures in the financial statements. Our audits also included evaluating the accounting principles used and significant estimates made by management, as well as
evaluating the overall presentation of the financial statements. Our procedures included confirmation of securities owned as of October 31, 2023 by correspondence with the custodian. We believe that our audits provide a reasonable basis for our
opinion.
|
|
|
TAIT, WELLER & BAKER LLP
|
Philadelphia, Pennsylvania
December 22, 2023
|
WWW.HENNESSYFUNDS.COM
|
28
|
REPORT OF INDEPENDENT REGISTERED PUBLIC ACCOUNTING FIRM/TRUSTEES AND OFFICERS
|
Trustees and Officers of the Fund (Unaudited)
The business and affairs of the Funds are managed under the direction of the Board of Trustees of the Trust, and the Board of Trustees elects the officers of the Trust (“Officers”). From time to time, the Board of
Trustees also has appointed advisers to the Board of Trustees (“Advisers”) with the intention of having qualified individuals serve in an advisory capacity to garner experience in the mutual fund and asset management industry and be considered as
potential Trustees in the future. There are currently two Advisers, Brian Alexander and A.J. Hennessy. As Advisers, Mr. Alexander and Mr. A.J. Hennessy attend meetings of the Board of Trustees and act as non-voting participants. Information
pertaining to the Trustees, Advisers, and the Officers of the Trust is set forth below. The Trustees and Officers serve until their successors are duly elected and qualified or until their earlier death, resignation, or removal. Each Trustee
oversees all 17 Hennessy Funds. Unless otherwise indicated, the address of all persons listed below is 7250 Redwood Boulevard, Suite 200, Novato, CA 94945. The Fund’s Statement of Additional Information includes more information about the persons
listed below and is available without charge by calling 800-966-4354 or by visiting www.hennessyfunds.com.
|
Other
|
|||
|
Directorships
|
|||
|
Held Outside
|
|||
|
Name, Age,
|
of Fund
|
||
|
and Position Held
|
Start Date
|
Principal Occupation(s)
|
Complex During
|
|
with the Trust
|
of Service
|
During Past Five Years
|
Past Five Years
|
|
Disinterested Trustees(1) and Disinterested Advisers
|
|||
|
J. Dennis DeSousa
|
January 1996
|
Mr. DeSousa is a real estate investor.
|
None.
|
|
87
|
|||
|
Trustee
|
|||
|
Robert T. Doyle
|
January 1996
|
Mr. Doyle is retired. He served as the
|
None.
|
|
76
|
Sheriff of Marin County, California
|
||
|
Trustee
|
from 1996 to June 2022.
|
||
|
Doug Franklin
|
March 2016
|
Mr. Franklin is a retired insurance
|
None.
|
|
59
|
as an Adviser
|
industry executive. From 1987
|
|
|
Trustee
|
to the Board
|
through 2015, he was employed by
|
|
|
and June 2023
|
the Allianz-Fireman’s Fund Insurance
|
||
|
as a Trustee
|
Company in various positions,
|
||
|
including as its Chief Actuary and
|
|||
|
Chief Risk Officer.
|
|||
|
Claire Garvie
|
December 2015
|
Ms. Garvie is a founder of Kiosk and
|
None.
|
|
49
|
as an Adviser
|
has served as its Chief Operating
|
|
|
Trustee
|
to the Board and
|
Officer since 2004. Kiosk is a
|
|
|
December 2021
|
full-service marketing agency with
|
||
|
as a Trustee
|
offices in the San Francisco Bay Area
|
||
|
and Liverpool, UK and staff across
|
|||
|
nine states in the U.S.
|
|||
|
HENNESSY FUNDS
|
1-800-966-4354
|
29
|
Other
|
|||
|
Directorships
|
|||
|
Held Outside
|
|||
|
Name, Age,
|
of Fund
|
||
|
and Position Held
|
Start Date
|
Principal Occupation(s)
|
Complex During
|
|
with the Trust
|
of Service
|
During Past Five Years
|
Past Five Years
|
|
Gerald P. Richardson
|
May 2004
|
Mr. Richardson is an independent
|
None.
|
|
78
|
consultant in the securities industry.
|
||
|
Trustee
|
|||
|
Brian Alexander
|
March 2015
|
Mr. Alexander has served as the
|
None.
|
|
42
|
Chief Operating Officer of Solis
|
||
|
Adviser to the Board
|
Mammography since March 2023.
|
||
|
Prior to that, he worked for the
|
|||
|
Sutter Health organization from
|
|||
|
2011 to 2023 in various positions.
|
|||
|
He served as the Chief Executive
|
|||
|
Officer of the North Valley Hospital
|
|||
|
Area from 2021 to March 2023.
|
|||
|
From 2018 to 2021, he served as the
|
|||
|
Chief Executive Officer of Sutter
|
|||
|
Roseville Medical Center. From 2016
|
|||
|
through 2018, he served as the Vice
|
|||
|
President of Strategy for the Sutter
|
|||
|
Health Valley Area, which includes
|
|||
|
11 hospitals, 13 ambulatory surgery
|
|||
|
centers, 16,000 employees, and
|
|||
|
1,900 physicians.
|
|||
|
Interested Trustee and Interested Adviser(2)
|
|||
|
Neil J. Hennessy
|
January 1996 as
|
Mr. Neil Hennessy has been employed
|
Hennessy
|
|
67
|
a Trustee and
|
by Hennessy Advisors, Inc. since
|
Advisors, Inc.
|
|
Chairman of the Board,
|
June 2008 as
|
1989 and currently serves as its
|
|
|
Chief Market Strategist,
|
an Officer
|
Chairman and Chief Executive Officer.
|
|
|
Portfolio Manager,
|
|||
|
and President
|
|||
|
A.J. Hennessy
|
December 2022
|
Mr. A.J. Hennessy has been employed
|
None.
|
|
37
|
by Hennessy Advisors, Inc. since 2011.
|
||
|
Adviser to the Board
|
|||
|
and Vice President,
|
|||
|
Corporate Development
|
|||
|
and Operations
|
|||
|
WWW.HENNESSYFUNDS.COM
|
30
|
TRUSTEES AND OFFICERS OF THE FUND
|
|
Name, Age,
|
||
|
and Position Held
|
Start Date
|
Principal Occupation(s)
|
|
with the Trust
|
of Service
|
During Past Five Years
|
|
Officers
|
||
|
Teresa M. Nilsen
|
January 1996
|
Ms. Nilsen has been employed by Hennessy Advisors, Inc.
|
|
57
|
since 1989 and currently serves as its President, Chief
|
|
|
Executive Vice President
|
Operating Officer, and Secretary.
|
|
|
and Treasurer
|
||
|
Daniel B. Steadman
|
March 2000
|
Mr. Steadman has been employed by Hennessy Advisors, Inc.
|
|
67
|
since 2000 and currently serves as its Executive Vice President.
|
|
|
Executive Vice President
|
||
|
and Secretary
|
||
|
Brian Carlson
|
December 2013
|
Mr. Carlson has been employed by Hennessy Advisors, Inc.
|
|
51
|
since December 2013 and currently serves as its Chief
|
|
|
Senior Vice President
|
Compliance Officer and Senior Vice President.
|
|
|
and Head of Distribution
|
||
|
David Ellison(3)
|
October 2012
|
Mr. Ellison has been employed by Hennessy Advisors, Inc.
|
|
65
|
since October 2012. He has served as a Portfolio Manager of
|
|
|
Senior Vice President
|
the Hennessy Large Cap Financial Fund and the Hennessy
|
|
|
and Portfolio Manager
|
Small Cap Financial Fund since their inception. Mr. Ellison also
|
|
|
served as a Portfolio Manager of the Hennessy Technology
|
||
|
Fund from its inception until February 2017. Mr. Ellison served
|
||
|
as Director, CIO, and President of FBR Fund Advisers, Inc.
|
||
|
from December 1999 to October 2012.
|
||
|
Jennifer Emerson(4)
|
June 2013
|
Ms. Emerson has been employed by Hennessy Advisors, Inc.
|
|
46
|
as its General Counsel since June 2013.
|
|
|
Senior Vice President and
|
||
|
Chief Compliance Officer
|
||
|
Ryan Kelley(5)
|
March 2013
|
Mr. Kelley has been employed by Hennessy Advisors, Inc. since
|
|
51
|
October 2012. He has served as Chief Investment Officer of the
|
|
|
Senior Vice President,
|
Hennessy Funds since March 2021 and has served as a Portfolio
|
|
|
Chief Investment Officer,
|
Manager of the Hennessy Gas Utility Fund, the Hennessy Large
|
|
|
and Portfolio Manager
|
Cap Financial Fund, and the Hennessy Small Cap Financial Fund
|
|
|
since October 2014. Mr. Kelley served as Co-Portfolio Manager
|
||
|
of these same funds from March 2013 through September
|
||
|
2014 and as a Portfolio Analyst for the Hennessy Funds from
|
||
|
October 2012 through February 2013. He has also served as a
|
||
|
Portfolio Manager of the Hennessy Cornerstone Growth Fund,
|
||
|
the Hennessy Cornerstone Mid Cap 30 Fund, the Hennessy
|
||
|
Cornerstone Large Growth Fund, and the Hennessy
|
||
|
Cornerstone Value Fund since February 2017 and as a Portfolio
|
||
|
Manager of the Hennessy Total Return Fund, the Hennessy
|
||
|
Balanced Fund, and the Hennessy Technology Fund since May
|
||
|
2018. He previously served as Co-Portfolio Manager of the
|
||
|
Hennessy Technology Fund from February 2017 until May 2018.
|
||
|
Mr. Kelley served as Portfolio Manager of FBR Fund
|
||
|
Advisers, Inc. from January 2008 to October 2012.
|
|
HENNESSY FUNDS
|
1-800-966-4354
|
31
|
Name, Age,
|
||
|
and Position Held
|
Start Date
|
Principal Occupation(s)
|
|
with the Trust
|
of Service
|
During Past Five Years
|
|
L. Joshua Wein(5)
|
September 2018
|
Mr. Wein has been employed by Hennessy Advisors, Inc. since
|
|
50
|
2018. He has served as Portfolio Manager of the Hennessy
|
|
|
Vice President and
|
Cornerstone Growth Fund, the Hennessy Cornerstone Mid Cap
|
|
|
Portfolio Manager
|
30 Fund, the Hennessy Cornerstone Large Growth Fund, the
|
|
|
Hennessy Cornerstone Value Fund, Hennessy Total Return Fund,
|
||
|
the Hennessy Balanced Fund, the Hennessy Gas Utility Fund,
|
||
|
and the Hennessy Technology Fund since February 2021, and
|
||
|
as the Co-Portfolio Manager of these Funds since February
|
||
|
2019. He served as a Senior Analyst of those same Funds from
|
||
|
September 2018 through February 2019. He also has served as
|
||
|
a Portfolio Manager of the Hennessy Energy Transition Fund
|
||
|
and the Hennessy Midstream Fund since January 2022.
|
||
|
Mr. Wein served as Director of Alternative Investments and
|
||
|
Co-Portfolio Manager at Sterling Capital Management
|
||
|
from 2008 to 2018.
|
_______________
|
(1)
|
The Funds have determined that Mr. DeSousa, Mr. Doyle, Mr. Franklin, Ms. Garvie, and Mr. Richardson are not interested persons, as defined in the 1940 Act, of the Investment Manager or of
any predecessor investment adviser for purposes of Section 15(f) of the 1940 Act.
|
|
(2)
|
Each of Neil J. Hennessy and A.J. Hennessy is considered an interested person, as defined in the 1940 Act, because he is an officer of the Trust.
|
|
(3)
|
The address of this officer is 101 Federal Street, Suite 1615B, Boston, MA 02110.
|
|
(4)
|
The address of this officer is 4800 Bee Caves Road, Suite 100, Austin, TX 78746.
|
|
(5)
|
The address of this officer is 1340 Environ Way, Chapel Hill, NC 27517.
|
|
WWW.HENNESSYFUNDS.COM
|
32
|
TRUSTEES AND OFFICERS OF THE FUND
|
(This Page Intentionally Left Blank.)
|
HENNESSY FUNDS
|
1-800-966-4354
|
33
Expense Example (Unaudited)
October 31, 2023
As a shareholder of the Fund, you incur ongoing costs, including management fees, service fees, and other Fund expenses. This Example is intended to help you understand your ongoing costs (in dollars) of investing in
the Fund and to compare these costs with the ongoing costs of investing in other investment funds. The Example is based on an investment of $1,000 invested at the beginning of the period and held for the entire period from May 1, 2023, through
October 31, 2023.
Actual Expenses
In the table below, the first line under each of the “Investor Class” and “Institutional Class” headings provides information about actual account values and actual expenses for each share class. You may use this
information, together with the amount you invested, to estimate the expenses that you paid over the period. Simply divide your account value by $1,000 (for example, an $8,600 account value divided by $1,000 = 8.6), then multiply the result by the
number in the first line under the heading “Expenses Paid During Period” to estimate the expenses you paid on your account during this period. Although the Fund charges no sales loads or transaction fees, you will be assessed fees for outgoing
wire transfers, returned checks, and stop payment orders at prevailing rates charged by U.S. Bank Global Fund Services, the Fund’s transfer agent. If you request that a redemption be made by wire transfer, the Fund’s transfer agent charges a $15
fee. IRAs are charged a $15 annual maintenance fee (up to $30 maximum per shareholder for shareholders with multiple IRAs). The examples below include, but are not limited to, management, shareholder servicing, accounting, custody, and transfer
agent fees. However, the examples below do not include portfolio trading commissions and related expenses.
Hypothetical Example for Comparison Purposes
In the table below, the second line under each of the “Investor Class” and “Institutional Class” headings provides information about hypothetical account values and hypothetical expenses based on the Fund’s actual
expense ratio for each share class and an assumed rate of return of 5% per year before expenses, which is not the Fund’s actual return for such share class. The hypothetical account values and expenses may not be used to estimate the actual
ending account balance or expenses you paid for the period. You may use this information to compare the ongoing costs of investing in the Fund and other funds. To do so, compare these 5% hypothetical examples with the 5% hypothetical examples
that appear in the shareholder reports of the other funds. Please note that the expenses shown in the table are meant to highlight your ongoing costs only. Therefore, the second lines under “Investor Class” and “Institutional Class” are useful in
comparing ongoing costs only and will not help you determine the relative total costs of owning different funds.
|
WWW.HENNESSYFUNDS.COM
|
34
|
EXPENSE EXAMPLE
|
|
Expenses Paid
|
|||
|
Beginning
|
Ending
|
During Period(1)
|
|
|
Account Value
|
Account Value
|
May 1, 2023 –
|
|
|
May 1, 2023
|
October 31, 2023
|
October 31, 2023
|
|
|
Investor Class
|
|||
|
Actual
|
$1,000.00
|
$1,081.80
|
$6.93
|
|
Hypothetical (5% return before expenses)
|
$1,000.00
|
$1,018.55
|
$6.72
|
|
Institutional Class
|
|||
|
Actual
|
$1,000.00
|
$1,083.80
|
$4.99
|
|
Hypothetical (5% return before expenses)
|
$1,000.00
|
$1,020.42
|
$4.84
|
|
(1)
|
Expenses are equal to the Fund’s annualized expense ratio of 1.32% for Investor Class shares or 0.95% for Institutional Class shares, as applicable, multiplied by the average account value over the period,
multiplied by 184/365 days (to reflect the half-year period).
|
|
HENNESSY FUNDS
|
1-800-966-4354
|
35
How to Obtain a Copy of the Fund’s Proxy
Voting Policy and Proxy Voting Records
A description of the policies and procedures the Fund uses to determine how to vote proxies relating to portfolio securities is available without charge (1) by calling 800-966-4354, (2) on the Hennessy Funds’ website at
www.hennessyfunds.com/proxy-voting/voting-policy, or (3) on the U.S. Securities and Exchange Commission’s (the “SEC”) website at www.sec.gov. The Fund’s proxy voting record is available without charge on both the Hennessy Funds’ website at
www.hennessyfunds.com/proxy-voting/voting-record and the SEC’s website at www.sec.gov no later than August 31 for the prior 12 months ending June 30.
Availability of Quarterly Portfolio Schedule
The Fund files a complete schedule of portfolio holdings with the SEC for the first and third quarters of each fiscal year as an exhibit to its reports on Form N-PORT. The Fund’s Form N-PORT reports are available on the
SEC’s website at www.sec.gov or on request by calling 800-966-4354.
Federal Tax Distribution Information (Unaudited)
For fiscal year 2023, certain dividends paid by the Fund may be subject to a maximum tax rate of 23.8%, as provided for by the Jobs and Growth Tax Relief Reconciliation Act of 2003. The percentage of dividends declared
from ordinary income designated as qualified dividend income was 0.00%.
For corporate shareholders, the percent of ordinary income distributions that qualified for the corporate dividends received deduction for fiscal year 2023 was 0.00%.
The percentage of taxable ordinary income distributions that were designated as short-term capital gain distributions under Section 871(k)(2)(C) of the Internal Revenue Code of 1986, as amended, for
the Fund was 0.00%.
Important Notice Regarding Delivery
of Shareholder Documents
To help keep the Fund’s costs as low as possible, we generally deliver a single copy of shareholder reports, proxy statements, and prospectuses to shareholders who share an address and have the same last name. This
process does not apply to account statements. You may request an individual copy of a shareholder document at any time. If you would like to receive separate mailings of shareholder documents, please call U.S. Bank Global Fund Services at
800-261-6950 or 414-765-4124, and individual delivery will begin within 30 days of your request. If your account is held through a financial institution or other intermediary, please contact such intermediary directly to request individual
delivery.
Electronic Delivery
As currently permitted by SEC regulations, the Fund’s shareholder reports are made available on a website, and unless you sign for eDelivery or elect to receive paper copies as detailed below, you will be notified by
mail each time a report is posted and provided with a website link to access the report.
To elect to receive paper copies of all future reports free of charge, please call U.S. Bank Global Fund Services at 800-261-6950 or 414-765-4124.
The Fund also offers shareholders the option to receive all notices, account statements, prospectuses, tax forms, and shareholder reports electronically. To sign up for eDelivery or change your
delivery preference, please visit www.hennessyfunds.com/account.
Shareholder reports transmitted after July 24, 2024, will comply with the new tailored shareholder reporting requirements, which require streamlined annual and semi-annual reports to shareholders that
highlight key information. These reports will be transmitted in paper unless a shareholder elects to receive reports electronically via eDelivery. To sign up for eDelivery, please visit http://www.hennessyfunds.com/account.
Subscribe to receive our team’s unique market and sector insights delivered to your inbox
www.hennessyfunds.com/subscribe
Follow us on social media
| |
|
|
|
|
WWW.HENNESSYFUNDS.COM
|
36
|
PROXY VOTING — PRIVACY POLICY
|
Liquidity Risk Management Program
In accordance with Rule 22e-4 under the Investment Company Act of 1940, as amended (the “Liquidity Rule”), we have adopted and implemented a liquidity risk management program (the “Liquidity Program”). The purpose of
the Liquidity Program is to assess and manage the Fund’s liquidity risk, which is the risk that the Fund would not be able to meet requests to redeem Fund shares without significant dilution of the remaining shareholders’ interests in the Fund.
The Board of Trustees of the Fund (the “Board”) designated a committee comprising representatives of Hennessy Advisors, Inc., the investment adviser to the Fund, as the administrator of the Liquidity Program (the “Program Administrator”).
The Program Administrator provided a written report regarding the Liquidity Program to the Board in advance of its meeting on June 7, 2023. The report covered the period from June 1, 2022, through May
31, 2023. The report addressed the operation of the Liquidity Program, assessed the adequacy and effectiveness of its implementation, and described any material changes to the Liquidity Program during the review period. The Trust’s chief
compliance officer presented the report to the Board at the meeting and provided additional information regarding the Liquidity Program. The Board reviewed the Liquidity Program and considered, among other items, the following:
|
1.
|
The Program Administrator reviewed daily historical net redemption activity during the review period and during prior periods with higher-than-average redemption activity and concluded that the Fund has
historically been able to meet requests to redeem Fund shares without significant dilution to the Fund’s remaining shareholders, and the Program Administrator expects the Fund to be able to continue to do so in the future during both
normal and reasonably foreseeable stressed conditions.
|
|
|
2.
|
The Fund primarily holds assets that are highly liquid investments and is not required to establish a highly liquid investment minimum for the Fund or adopt policies and procedures for responding to a highly
liquid investment minimum shortfall.
|
|
|
3.
|
The Program Administrator did not make or recommend any material changes to the Liquidity Program during the review period.
|
|
|
4.
|
The Program Administrator concluded that the Liquidity Program was reasonably designed to assess and manage the Fund’s liquidity risk, complies with the requirements of the Liquidity Rule, and was operating as
intended during the review period.
|
Privacy Policy
We collect the following personal information about you:
|
1.
|
Information we receive from you in applications or other forms, correspondence, or conversations, including, but not limited to, your name, address, phone number, social security number, assets, income, and date
of birth;
|
|
|
2.
|
Information about your transactions with us, our affiliates, or others, including, but not limited to, your account number and balance, payments history, parties to transactions, cost basis information, and
other financial information; and
|
|
HENNESSY FUNDS
|
1-800-966-4354
|
37
|
3.
|
Other personal information we collect from various sources, even if you have not entered into a prior transaction with us, including the following:
|
|
•
|
Name, alias, address, unique personal identifier, online identifier, IP address, email address, telephone number, account name, and other similar identifiers;
|
||
|
•
|
Age and marital status;
|
||
|
•
|
Commercial information, including records of products purchased;
|
||
|
•
|
Browsing history, search history, and information on interaction with our website;
|
||
|
•
|
Geolocation data;
|
||
|
•
|
Employment and employment history, educational history, financial information, and purchasing and consuming histories or tendencies; and
|
||
|
•
|
Inferences drawn from the above-listed information to create a profile about your preferences, characteristics, predispositions, and behavior.
|
We collect this information directly from you, indirectly in the course of providing services to you, directly and indirectly from your activity on our website, from broker dealers, marketing
agencies, and other third parties that interact with us in connection with the services we perform and products we offer, and from anonymized and aggregated consumer information.
We use this information to fulfill the reason you provided the information to us, to provide you with other relevant products that you request from us, to provide you with information about products
that may interest you, to improve our website or present our website’s contents to you, and as otherwise described to you when collecting your personal information.
We do not disclose any personal information to unaffiliated third parties, except as permitted by law. We may disclose your personal information to our affiliates, vendors, and service providers for a
business purpose. For example, we are permitted by law to disclose all of the information we collect, as described above, to our transfer agent to process your transactions. When disclosing your personal information to third parties, we enter
into a contract with each third party describing the purpose of such disclosure and requiring that such personal information be kept confidential and not used for any purpose except to perform the services contracted or respond to regulatory or
law enforcement requests.
Furthermore, we restrict access to your personal information to those persons who require such information to provide products or services to you. As a result, we do not provide a means for opting out
of our limited sharing of your information. We maintain physical, electronic, and procedural safeguards that comply with federal standards to guard your personal information.
If you hold shares of the Funds through a financial intermediary, including, but not limited to, a broker-dealer, bank, or trust company, the privacy policy of your financial intermediary governs how
your personal information is shared with unaffiliated third parties.
If you live in a state such as California where the laws provide further privacy rights, we will not share information unless the law allows, and we will comply with the other state-specific
requirements.
|
WWW.HENNESSYFUNDS.COM
|
38
|
PRIVACY POLICY
|
Supplemental Privacy Notice for Residents of California
The California Consumer Privacy Act of 2018 (the “CCPA”) provides you, as a California resident, with certain additional rights relating to your personal information.
Under the CCPA, you have the right to request that we disclose to you the categories of personal information we have collected about you over the past 12 months, the categories of sources of such
information, our business purpose for collecting the information, the categories of third parties, if any, with whom we shared the information, and the specific information we have collected about you. You also have the right to request that we
delete any of your personal information, and, unless an exception applies, we will delete such information upon receiving and confirming your request. To make a request, call us at 1-800-966-4354, email us at privacy@hennessyfunds.com, or go to
www.hennessyfunds.com/contact. We will not discriminate against you for exercising your rights under the CCPA. Further, we will not collect additional categories of your personal information or use the personal information we collected for
materially different, unrelated, or incompatible purposes without providing you notice.
|
HENNESSY FUNDS
|
1-800-966-4354
|
39
(This Page Intentionally Left Blank.)
For information, questions, or assistance, please call
The Hennessy Funds
800-966-4354 or 415-899-1555
INVESTMENT ADVISOR
Hennessy Advisors, Inc.
7250 Redwood Boulevard, Suite 200
Novato, California 94945
ADMINISTRATOR,
TRANSFER AGENT,
DIVIDEND PAYING AGENT, &
SHAREHOLDER SERVICING AGENT
U.S. Bancorp Fund Services, LLC
d/b/a U.S. Bank Global Fund Services
P.O. Box 701
Milwaukee, Wisconsin 53201-0701
CUSTODIAN
U.S. Bank N.A.
Custody Operations
1555 North River Center Drive, Suite 302
Milwaukee, Wisconsin 53212
TRUSTEES
Neil J. Hennessy
Robert T. Doyle
J. Dennis DeSousa
Doug Franklin
Claire Garvie
Gerald P. Richardson
COUNSEL
Foley & Lardner LLP
777 East Wisconsin Avenue
Milwaukee, Wisconsin 53202-5306
INDEPENDENT REGISTERED
PUBLIC ACCOUNTING FIRM
Tait, Weller & Baker LLP
Two Liberty Place
50 South 16th Street, Suite 2900
Philadelphia, Pennsylvania 19102-2529
DISTRIBUTOR
Quasar Distributors, LLC
111 East Kilbourn Avenue, Suite 1250
Milwaukee, Wisconsin 53202
www.hennessyfunds.com | 800-966-4354
This report has been prepared for shareholders and may be distributed to
others only if preceded or accompanied by a current prospectus.
ANNUAL REPORT
OCTOBER 31, 2023
HENNESSY CORNERSTONE LARGE GROWTH FUND
Investor Class HFLGX
Institutional Class HILGX
www.hennessyfunds.com | 1-800-966-4354
(This Page Intentionally Left Blank.)
Contents
|
Letter to Shareholders
|
2
|
|
|
Performance Overview
|
6
|
|
|
Financial Statements
|
||
|
Schedule of Investments
|
9
|
|
|
Statement of Assets and Liabilities
|
13
|
|
|
Statement of Operations
|
14
|
|
|
Statements of Changes in Net Assets
|
15
|
|
|
Financial Highlights
|
16
|
|
|
Notes to the Financial Statements
|
20
|
|
|
Report of Independent Registered Public Accounting Firm
|
27
|
|
|
Trustees and Officers of the Fund
|
28
|
|
|
Expense Example
|
32
|
|
|
Proxy Voting Policy and Proxy Voting Records
|
34
|
|
|
Availability of Quarterly Portfolio Schedule
|
34
|
|
|
Federal Tax Distribution Information
|
34
|
|
|
Important Notice Regarding Delivery of Shareholder Documents
|
34
|
|
|
Electronic Delivery
|
34
|
|
|
Liquidity Risk Management Program
|
35
|
|
|
Privacy Policy
|
35
|
|
HENNESSY FUNDS
|
1-800-966-4354
|
November 2023
Dear Hennessy Funds Shareholder:
Market Myopia: Tough Beginnings & Fantastic Finishes
During an interview this summer, I was reminded how important it is to maintain a long-term view of the market and investing and how easy it is to focus on the very recent past. In mid-July, when the Nasdaq Composite
Index was soaring to new 2023 highs and large-cap tech was once again dominating both returns and news headlines, the interviewer seemed confused – and somewhat disappointed – when I mentioned that even with 2023’s stellar performance, the
Nasdaq was negative if you included the prior year (2022) and that during that same time, utilities had outperformed. As of the time of writing this letter, a similar story can be seen when considering eight technology giants: Microsoft, Tesla, Facebook (Meta), Apple, Amazon,
Netflix, Nvidia, and Google, or “MT. FAANNG” as a much easier to say (and remember) acronym.(1) MT. FAANNG is up on average a whopping 89.69% in 2023 on a total return basis as of November 7, 2023. However, this same group was down -46.71% in 2022, a dismal year for large-cap
tech. Due to the unforgiving nature of percentages, from the end of 2021 until now, this group of highflyers, believe it or not, is still down -3.14% on average, despite an incredible 2023.
I like to call this phenomenon “market myopia.” Investors tend to be optimists, as am I. This makes it so much more comforting to forget the “tough beginnings” when you’d rather
remember the “fantastic finishes.” In continuing with the example above, unless you were an investor with prescient foresight, you likely didn’t sell all your MT. FAANNG stocks on January 4, 2022, as the market started its correction, and you
probably didn’t then buy them all back on September 30, 2022, when the market hit its low. An average investor’s experience would be much different than that. Which brings me to the point of all this: what are some elements of our investment
philosophy here at Hennessy Funds?
First, what about timing the market? Simply put, we don’t do it. As Neil Hennessy, our Chief Market Strategist and long-tenured Portfolio Manager, aptly put it, “It’s not about
timing the market, but rather about time in the market.” The long-term annualized return of the market, as measured by the Dow Jones Industrial Average going back
104 years to 1920, is about 9.6%, and that number would be closer to 7-8% on a real return basis when factoring in inflation. If an investor is poorly timing when to enter and when to exit the market, it would be very difficult to achieve
similar, attractive returns to what they would experience simply by staying invested through a complete market cycle.
We are optimistic investors. We understand that some years or months may be tougher than others, but we tend to think in longer timeframes. An investor solely invested in the
Nasdaq might have looked at their portfolio at the end of 2022 and been extremely disappointed with a -32.51% return. But as Josh Wein, one of our Portfolio Managers with over 25 years of experience, pointed out, “2022 was what 8% real returns
look like.” In other words, with the year prior (2021) providing a +22.21% return and the year after (2023) hitting a +31.21% return, 2022’s dismal performance of -32.51% created an annualized total return for the Nasdaq of 8.22% over the
entire period (December 31, 2020, to November 7, 2023). Josh simply observed that while corrections happen over the course of a market cycle, it’s best not to panic by selling when stocks are hitting new lows.
_______________
|
(1)
|
The acronym, MT. FAANNG, refers to the following companies: Microsoft Corporation, Tesla, Inc., Meta Platforms, Inc., Amazon.com, Inc., Apple, Inc., Netflix, Inc., NVIDIA Corporation, and Alphabet, Inc.
|
|
WWW.HENNESSYFUNDS.COM
|
2
|
LETTER TO SHAREHOLDERS
|
Downside risk mitigation is relevant. While we normally remain fully invested within our individual funds, we seek to reduce risk through other means, including sector
diversification and investing in companies that exhibit strong fundamentals at compelling valuations. Dave Ellison, the long-tenured Portfolio Manager of our two financial funds, consistently reminds us, “Losing less money in difficult markets
is more important than making the most in rising ones.”
Finally, we are investors in companies, not traders of stocks. Many of our portfolios hold certain positions for long periods of time, a demonstration of the Portfolio Managers’
convictions. In fact, both the Hennessy Focus Fund and the Hennessy Large Cap Financial Fund have held some positions for 25 years or more. We recognize that much of the performance of the Hennessy Funds comes from the actual stocks we own
(stock selection) and not from our weightings within certain sectors (sector allocation). Moving in and out of sectors can enhance performance, but it can also hinder it in the same way as market timing, and it takes a significant number of
correct “calls” regarding the macro-environment. We’d rather invest long term than rely on lucky calls. Our highly experienced energy funds Portfolio Manager, Ben Cook, summed up our philosophy on the macro environment nicely: “While
macro-economic trends help to inform our investment process, ultimately it’s the individual stocks with solid fundamentals and attractive valuations that, over time, drive positive risk-adjusted returns for our funds.”
We are long term investors, staying ever mindful of downside risk while striving to participate in the upside, with each individual fund having its own objective, process,
portfolio construction, and investment criteria.
The stock market has once again seen dramatic differences in stock performance. For our fiscal year ended October 31, 2023, all three broad-based indexes were positive, although
with a large dispersion of total returns, with the Dow Jones Industrial Average up 3.17%, the S&P 500® Index up 10.14%, and the Nasdaq Composite Index up
17.99%. During our fiscal year, large caps significantly outperformed mid caps and small caps, and growth substantially outperformed value. Large-cap tech once again pushed the overall broader market higher, as evidenced by the Nasdaq-100 Index
posting a return of 27.45%. From a sector point of view, besides Technology, the only other sector with outsized (greater than 10%) returns was Communication Services, while six of the 11 GICS sectors of the S&P 500® Index were negative.
Similar to the overall market, our funds experienced mixed results. Many of our funds exhibit more value-oriented characteristics and, given that value underperformed growth
this year by a significant amount, that negatively affected our relative performance. In addition, three of our funds are sector-specific funds that were invested in underperforming sectors, while six more are focused on small- and mid-cap
stocks in a time period when large caps substantially outperformed. Ten of our 16 mutual funds and our exchange-traded-fund (ETF) posted positive returns for the fiscal year ended October 31, 2023.
Several factors caused this disparity of returns in the market: interest rates and inflation being two of the most important. With the Federal Reserve pausing interest rate
hikes and inflation numbers subsiding, the market reacted positively once it became more apparent that we were not heading into a recession. Consumer demand also remained strong, and unemployment numbers remained historically low.
We believe that the outlook for U.S. stocks remains positive, primarily as we believe that the Federal Reserve may be done, or close to done, raising interest rates. Inflation
has shown signs of easing, creating a better environment for consumers as well as businesses. The unemployment rate remains near record lows, there are elevated levels of cash on the
|
HENNESSY FUNDS
|
1-800-966-4354
|
3
balance sheets of U.S. companies and in the pockets of many consumers and investors, and there is the prospect of a more dovish Federal Reserve heading into 2024. However, we are cautiously watching certain parts of
the economy for any hints of weakness, including consumer spending and credit issues. While volatility and uncertainty may impact the markets, we encourage investors to stay the course, maintain a diversified portfolio, and keep a long-term
perspective.
We thank you for your continued interest in our Funds and are grateful that you have chosen to invest with us. If you have any questions or would like to speak with us directly,
please call us at (800) 966-4354.
Best regards,
|
|
|
|
|
Ryan C. Kelley, CFA
|
|
|
Chief Investment Officer,
|
|
|
Senior Vice President, and Portfolio Manager
|
Past performance does not guarantee future results.
Mutual fund investing involves risk. Principal loss is possible.
Opinions expressed are those of Ryan C. Kelley and are subject to change, are not guaranteed, and should not be considered investment advice.
The Dow Jones Industrial Average and S&P 500® Index are commonly used to measure the performance of U.S. stocks. The Nasdaq
Composite Index comprises all common stocks listed on The Nasdaq Stock Market and is commonly used to measure the performance of technology-related stocks. The Nasdaq-100 Index includes 100 of the largest domestic and international
non-financial companies listed on The NASDAQ Stock Market based on market capitalization. The indices are used herein for comparative purposes in accordance with SEC regulations. One cannot invest directly in an index. All returns are shown on
a total return basis.
|
WWW.HENNESSYFUNDS.COM
|
4
|
LETTER TO SHAREHOLDERS
|
(This Page Intentionally Left Blank.)
|
HENNESSY FUNDS
|
1-800-966-4354
|
5
Performance Overview (Unaudited)
CHANGE IN VALUE OF $10,000 INVESTMENT
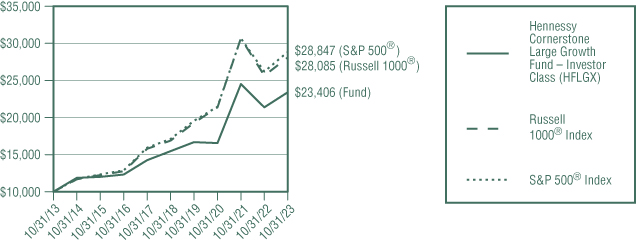
This graph illustrates the performance of an initial investment of $10,000 made in the Fund 10 years ago and assumes the reinvestment of dividends and capital gains.
AVERAGE ANNUAL TOTAL RETURN FOR PERIODS ENDED OCTOBER 31, 2023
|
One
|
Five
|
Ten
|
|
|
Year
|
Years
|
Years
|
|
|
Hennessy Cornerstone Large Growth Fund –
|
|||
|
Investor Class (HFLGX)
|
9.48%
|
8.63%
|
8.88%
|
|
Hennessy Cornerstone Large Growth Fund –
|
|||
|
Institutional Class (HILGX)
|
9.85%
|
8.95%
|
9.15%
|
|
Russell 1000® Index
|
9.48%
|
10.71%
|
10.88%
|
|
S&P 500® Index
|
10.14%
|
11.01%
|
11.18%
|
Expense ratios: 1.30% (Investor Class); 0.99% (Institutional Class)
Performance data quoted represents past performance; past performance does not guarantee future results. The investment return and principal value of an investment will fluctuate so that an
investor’s shares, when redeemed, may be worth more or less than their original cost. The performance table does not reflect the deduction of taxes that a shareholder would pay on Fund distributions or the redemption of Fund shares. Current
performance of the Fund may be lower or higher than the performance quoted. Performance data current to the most recent month end may be obtained by visiting www.hennessyfunds.com.
The Russell 1000® Index is a subset of the Russell 3000®
Index that measures the performance of the large-cap segment of the U.S. equity market. The Russell 1000® Index comprises the 1,000 largest companies in the
Russell 3000® Index based on market capitalization and current index membership, representing approximately 93% of the total market capitalization of the Russell
3000® Index. The S&P 500® Index is a capitalization-weighted index that is
designed to represent the broad domestic economy through changes in the aggregate market value of 500 stocks across all major industries. One cannot invest directly in an index. These indices are used for comparative purposes in accordance with
Securities and Exchange Commission regulations.
Frank Russell Company (“Russell”) is the source and owner of the trademarks, service marks, and copyrights related to the Russell Indexes. Russell® is a trademark of Frank Russell Company. Neither Russell nor its licensors accept any liability for any errors or omissions in the Russell Indexes or Russell ratings or underlying data and no party may rely on any
|
WWW.HENNESSYFUNDS.COM
|
6
|
PERFORMANCE OVERVIEW
|
Russell Indexes or Russell ratings or underlying data contained in this communication. No further distribution of Russell data is permitted without Russell’s express written consent. Russell does not promote, sponsor,
or endorse the content of this communication.
Standard & Poor’s Financial Services is the source and owner of the S&P® and S&P 500® trademarks.
The expense ratios presented are from the most recent prospectus. The expense ratios for the current reporting period are available in the Financial Highlights section of this report.
PERFORMANCE NARRATIVE
Portfolio Managers Neil J. Hennessy, Ryan C. Kelley, CFA, and L. Joshua Wein, CAIA
Performance:
For the one-year period ended October 31, 2023, the Investor Class of the Hennessy Cornerstone Large Growth Fund returned 9.48%, in line with the Russell 1000® Index (the Fund’s primary benchmark), which returned 9.48%, and underperforming the S&P 500® Index, which returned 10.14%, for
the same period.
The Fund’s performance was in line with its primary benchmark. The biggest contributors to performance resulted from stock selection in the Information Technology, Consumer Discretionary, and
Materials sectors. The largest contributors to performance within each of these sectors during the period were Dell Technologies, Inc., PulteGroup, Inc., and Reliance Steel & Aluminum Company. During the period there were no sectors that
detracted from performance.
The Fund continues to own all the companies mentioned.
Portfolio Strategy:
The Fund utilizes a formula-based approach designed to result in a portfolio of attractively valued, highly profitable, larger-cap companies. In essence, the strategy seeks high-quality, high-return companies that may
be overlooked by other investors by selecting 50 larger-cap stocks that have relatively low price-to-cash flow ratios and have generated high returns on capital over the past year.
Investment Commentary:
Notwithstanding a rebound in equity prices over the last twelve months, we believe that the outlook for U.S. stocks remains positive. We continue to believe that equities are attractive from a valuation standpoint,
even in the face of an expected slowdown in economic activity. While the Federal Reserve has raised interest rates several times throughout the last year, we believe that the prospect of slower economic growth and lower inflation numbers could
prompt the Federal Reserve to put any further rate hikes on hold. With the unemployment rate near record lows, high levels of cash on the balance sheets of U.S. companies, and the prospect of a more dovish Federal Reserve in 2024, we remain
bullish on equities long-term.
Sectors where the Fund currently maintains significant overweight positions include Energy, Materials, and Industrials. Representative holdings within the Energy sector include Coterra Energy, Inc.,
Diamondback Energy, Inc, and Pioneer Natural Resources, Inc. Materials holdings include Reliance Steel & Aluminum Company, CF Industries Holdings, Inc., and Steel Dynamics, Inc. Industrials exposure includes Builders FirstSource, Inc.,
Expeditors International of Washington, Inc., and Masco Corporation. Given the continued strength in employment trends and average hourly earnings, we
|
HENNESSY FUNDS
|
1-800-966-4354
|
7
would expect consumer spending and the economy to hold steady. We believe that the Fund is well positioned given the potential for moderately slower economic growth.
_______________
Opinions expressed are those of the Portfolio Managers as of the date written and are subject to change, are not guaranteed, and should not be considered investment advice or an indication of trading intent.
The Fund may invest in medium-capitalization companies, which may have more limited liquidity and greater price volatility than larger companies. Funds concentrated in one or more industry sectors
may be subject to a higher degree of market risk. The Fund’s formula-based strategy may cause the Fund to buy or sell securities at times when it may not be advantageous. Please see the Fund’s prospectus for a more complete discussion of these
and other risks.
References to specific securities should not be considered a recommendation to buy or sell any security. Fund holdings and sector allocations are subject to change. Please refer to the Schedule of Investments included
in this report for additional portfolio information.
Cash flow refers to the net amount of cash and cash equivalents transferred into and out of a company.
|
WWW.HENNESSYFUNDS.COM
|
8
|
PERFORMANCE OVERVIEW/SCHEDULE OF INVESTMENTS
|
Financial Statements
|
Schedule of Investments as of October 31, 2023
|
HENNESSY CORNERSTONE LARGE GROWTH FUND
(% of Net Assets)
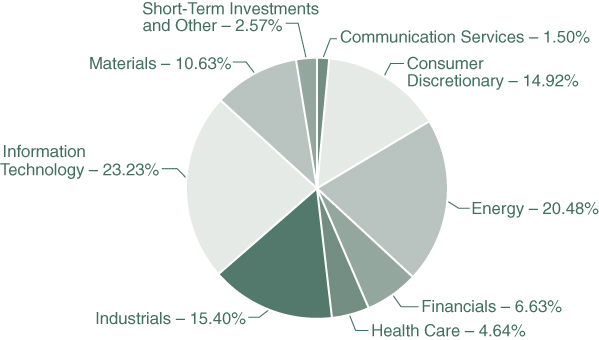
|
TOP TEN HOLDINGS (EXCLUDING MONEY MARKET FUNDS)
|
% NET ASSETS
|
|
Dell Technologies, Inc.
|
3.33%
|
|
Jabil, Inc.
|
3.17%
|
|
Builders FirstSource, Inc.
|
2.78%
|
|
PulteGroup, Inc.
|
2.64%
|
|
KLA Corp.
|
2.41%
|
|
Applied Materials, Inc.
|
2.35%
|
|
Lam Research Corp.
|
2.33%
|
|
Cencora, Inc.
|
2.31%
|
|
Coterra Energy, Inc
|
2.31%
|
|
Diamondback Energy, Inc.
|
2.29%
|
Note: For presentation purposes, the Fund has grouped some of the industry categories. For purposes of categorizing securities for compliance with Section 8(b)(1) of the Investment Company Act of 1940, as amended, the
Fund uses more specific industry classifications.
The Global Industry Classification Standard (GICS®) was developed by and is the exclusive property and a service mark of MSCI, Inc. and
Standard & Poor’s Financial Services LLC. It has been licensed for use by the Hennessy Funds.
|
HENNESSY FUNDS
|
1-800-966-4354
|
9
|
COMMON STOCKS – 97.43%
|
Number
|
% of
|
||||||||||
|
|
of Shares
|
Value
|
Net Assets
|
|||||||||
|
Communication Services – 1.50%
|
||||||||||||
|
Sirius XM Holdings, Inc.
|
450,200
|
$
|
1,926,856
|
1.50
|
%
|
|||||||
|
Consumer Discretionary – 14.92%
|
||||||||||||
|
Bath & Body Works, Inc.
|
56,200
|
1,666,330
|
1.30
|
%
|
||||||||
|
Best Buy Co., Inc.
|
29,900
|
1,997,918
|
1.55
|
%
|
||||||||
|
Darden Restaurants, Inc.
|
18,100
|
2,634,093
|
2.05
|
%
|
||||||||
|
DR Horton, Inc.
|
26,800
|
2,797,920
|
2.17
|
%
|
||||||||
|
Lowe’s Companies., Inc.
|
12,700
|
2,420,239
|
1.88
|
%
|
||||||||
|
NVR, Inc. (a)
|
500
|
2,706,310
|
2.10
|
%
|
||||||||
|
PulteGroup, Inc.
|
46,100
|
3,392,499
|
2.64
|
%
|
||||||||
|
Tapestry, Inc.
|
57,300
|
1,579,188
|
1.23
|
%
|
||||||||
|
|
19,194,497
|
14.92
|
%
|
|||||||||
|
Energy – 20.48%
|
||||||||||||
|
APA Corp.
|
62,300
|
2,474,556
|
1.92
|
%
|
||||||||
|
Chesapeake Energy Corp.
|
31,300
|
2,694,304
|
2.09
|
%
|
||||||||
|
ConocoPhillips
|
22,500
|
2,673,000
|
2.08
|
%
|
||||||||
|
Coterra Energy, Inc.
|
107,800
|
2,964,500
|
2.31
|
%
|
||||||||
|
Devon Energy Corp.
|
42,800
|
1,993,196
|
1.55
|
%
|
||||||||
|
Diamondback Energy, Inc.
|
18,400
|
2,949,888
|
2.29
|
%
|
||||||||
|
EOG Resources, Inc.
|
20,800
|
2,626,000
|
2.04
|
%
|
||||||||
|
Ovintiv, Inc.
|
56,400
|
2,707,200
|
2.10
|
%
|
||||||||
|
Pioneer Natural Resources Co.
|
11,800
|
2,820,200
|
2.19
|
%
|
||||||||
|
Valero Energy Corp.
|
19,300
|
2,451,100
|
1.91
|
%
|
||||||||
|
|
26,353,944
|
20.48
|
%
|
|||||||||
|
Financials – 6.63%
|
||||||||||||
|
Ameriprise Financial, Inc.
|
7,500
|
2,359,275
|
1.83
|
%
|
||||||||
|
Equitable Holdings, Inc.
|
82,400
|
2,189,368
|
1.70
|
%
|
||||||||
|
Principal Financial Group, Inc.
|
28,900
|
1,955,952
|
1.52
|
%
|
||||||||
|
T. Rowe Price Group, Inc.
|
22,400
|
2,027,200
|
1.58
|
%
|
||||||||
|
|
8,531,795
|
6.63
|
%
|
|||||||||
|
Health Care – 4.64%
|
||||||||||||
|
Cencora, Inc.
|
16,100
|
2,980,915
|
2.31
|
%
|
||||||||
|
Moderna, Inc. (a)
|
15,400
|
1,169,784
|
0.91
|
%
|
||||||||
|
Pfizer, Inc.
|
59,600
|
1,821,376
|
1.42
|
%
|
||||||||
|
|
5,972,075
|
4.64
|
%
|
|||||||||
The accompanying notes are an integral part of these financial statements.
|
WWW.HENNESSYFUNDS.COM
|
10
|
SCHEDULE OF INVESTMENTS
|
|
COMMON STOCKS
|
Number
|
% of
|
||||||||||
|
|
of Shares
|
Value
|
Net Assets
|
|||||||||
|
Industrials – 15.40%
|
||||||||||||
|
Builders FirstSource, Inc. (a)
|
32,900
|
$
|
3,570,308
|
2.78
|
%
|
|||||||
|
C.H. Robinson Worldwide, Inc.
|
26,000
|
2,127,580
|
1.65
|
%
|
||||||||
|
Caterpillar, Inc.
|
10,600
|
2,396,130
|
1.86
|
%
|
||||||||
|
Deere & Co.
|
6,200
|
2,265,232
|
1.76
|
%
|
||||||||
|
Expeditors International of Washington, Inc.
|
23,500
|
2,567,375
|
2.00
|
%
|
||||||||
|
J.B. Hunt Transport Services, Inc.
|
13,500
|
2,320,245
|
1.80
|
%
|
||||||||
|
Masco Corp.
|
48,600
|
2,531,574
|
1.97
|
%
|
||||||||
|
United Parcel Service, Inc., Class B
|
14,400
|
2,034,000
|
1.58
|
%
|
||||||||
|
|
19,812,444
|
15.40
|
%
|
|||||||||
|
Information Technology – 23.23%
|
||||||||||||
|
Applied Materials, Inc.
|
22,800
|
3,017,580
|
2.35
|
%
|
||||||||
|
Cisco Systems, Inc.
|
54,800
|
2,856,724
|
2.22
|
%
|
||||||||
|
Dell Technologies, Inc.
|
64,000
|
4,282,240
|
3.33
|
%
|
||||||||
|
HP, Inc.
|
89,500
|
2,356,535
|
1.83
|
%
|
||||||||
|
Jabil, Inc.
|
33,200
|
4,076,960
|
3.17
|
%
|
||||||||
|
KLA Corp.
|
6,600
|
3,100,020
|
2.41
|
%
|
||||||||
|
Lam Research Corp.
|
5,100
|
2,999,922
|
2.33
|
%
|
||||||||
|
NetApp, Inc.
|
39,700
|
2,889,366
|
2.25
|
%
|
||||||||
|
ON Semiconductor Corp. (a)
|
35,000
|
2,192,400
|
1.70
|
%
|
||||||||
|
QUALCOMM, Inc.
|
19,400
|
2,114,406
|
1.64
|
%
|
||||||||
|
|
29,886,153
|
23.23
|
%
|
|||||||||
|
Materials – 10.63%
|
||||||||||||
|
CF Industries Holdings, Inc.
|
30,600
|
2,441,268
|
1.90
|
%
|
||||||||
|
Cleveland-Cliffs, Inc. (a)
|
122,800
|
2,060,584
|
1.60
|
%
|
||||||||
|
Mosaic Co.
|
53,000
|
1,721,440
|
1.34
|
%
|
||||||||
|
Nucor Corp.
|
15,300
|
2,261,187
|
1.76
|
%
|
||||||||
|
Reliance Steel & Aluminum Co.
|
11,500
|
2,925,370
|
2.27
|
%
|
||||||||
|
Steel Dynamics, Inc.
|
21,300
|
2,268,663
|
1.76
|
%
|
||||||||
|
|
13,678,512
|
10.63
|
%
|
|||||||||
|
|
||||||||||||
|
Total Common Stocks
|
||||||||||||
|
(Cost $127,256,847)
|
125,356,276
|
97.43
|
%
|
|||||||||
The accompanying notes are an integral part of these financial statements.
|
HENNESSY FUNDS
|
1-800-966-4354
|
11
|
SHORT-TERM INVESTMENTS – 2.59%
|
Number
|
% of
|
||||||||||
|
|
of Shares
|
Value
|
Net Assets
|
|||||||||
|
Money Market Funds – 2.59%
|
||||||||||||
|
First American Treasury Obligations Fund – Class X, 5.275% (b)
|
3,327,934
|
$
|
3,327,934
|
2.59
|
%
|
|||||||
|
|
||||||||||||
|
Total Short-Term Investments
|
||||||||||||
|
(Cost $3,327,934)
|
3,327,934
|
2.59
|
%
|
|||||||||
|
|
||||||||||||
|
Total Investments
|
||||||||||||
|
(Cost $130,584,781) – 100.02%
|
128,684,210
|
100.02
|
%
|
|||||||||
|
Liabilities in Excess of Other Assets – (0.02)%
|
(22,932
|
)
|
(0.02
|
)%
|
||||||||
|
|
||||||||||||
|
TOTAL NET ASSETS – 100.00%
|
$
|
128,661,278
|
100.00
|
%
|
||||||||
Percentages are stated as a percent of net assets.
|
(a)
|
Non-income producing security.
|
|
(b)
|
The rate listed is the fund’s seven-day yield as of October 31, 2023.
|
Summary of Fair Value Exposure as of October 31, 2023
The following is a summary of the inputs used to value the Fund’s net assets as of October 31, 2023 (see Note 3 in the accompanying Notes to the Financial Statements):
|
Common Stocks
|
Level 1
|
Level 2
|
Level 3
|
Total
|
||||||||||||
|
Communication Services
|
$
|
1,926,856
|
$
|
—
|
$
|
—
|
$
|
1,926,856
|
||||||||
|
Consumer Discretionary
|
19,194,497
|
—
|
—
|
19,194,497
|
||||||||||||
|
Energy
|
26,353,944
|
—
|
—
|
26,353,944
|
||||||||||||
|
Financials
|
8,531,795
|
—
|
—
|
8,531,795
|
||||||||||||
|
Health Care
|
5,972,075
|
—
|
—
|
5,972,075
|
||||||||||||
|
Industrials
|
19,812,444
|
—
|
—
|
19,812,444
|
||||||||||||
|
Information Technology
|
29,886,153
|
—
|
—
|
29,886,153
|
||||||||||||
|
Materials
|
13,678,512
|
—
|
—
|
13,678,512
|
||||||||||||
|
Total Common Stocks
|
$
|
125,356,276
|
$
|
—
|
$
|
—
|
$
|
125,356,276
|
||||||||
|
Short-Term Investments
|
||||||||||||||||
|
Money Market Funds
|
$
|
3,327,934
|
$
|
—
|
$
|
—
|
$
|
3,327,934
|
||||||||
|
Total Short-Term Investments
|
$
|
3,327,934
|
$
|
—
|
$
|
—
|
$
|
3,327,934
|
||||||||
|
Total Investments
|
$
|
128,684,210
|
$
|
—
|
$
|
—
|
$
|
128,684,210
|
||||||||
The accompanying notes are an integral part of these financial statements.
|
WWW.HENNESSYFUNDS.COM
|
12
|
SCHEDULE OF INVESTMENTS/STATEMENT OF ASSETS AND LIABILITIES
|
Financial Statements
|
Statement of Assets and Liabilities as of October 31, 2023
|
|
ASSETS:
|
||||
|
Investments in securities, at value (cost $130,584,781)
|
$
|
128,684,210
|
||
|
Dividends and interest receivable
|
123,640
|
|||
|
Receivable for fund shares sold
|
2,144
|
|||
|
Prepaid expenses and other assets
|
22,748
|
|||
|
Total assets
|
128,832,742
|
|||
|
LIABILITIES:
|
||||
|
Payable for fund shares redeemed
|
999
|
|||
|
Payable to advisor
|
83,534
|
|||
|
Payable to administrator
|
22,734
|
|||
|
Payable to auditor
|
22,746
|
|||
|
Accrued distribution fees
|
17,285
|
|||
|
Accrued service fees
|
9,902
|
|||
|
Accrued trustees fees
|
6,531
|
|||
|
Accrued expenses and other payables
|
7,733
|
|||
|
Total liabilities
|
171,464
|
|||
|
NET ASSETS
|
$
|
128,661,278
|
||
|
NET ASSETS CONSISTS OF:
|
||||
|
Capital stock
|
$
|
125,206,274
|
||
|
Total distributable earnings
|
3,455,004
|
|||
|
Total net assets
|
$
|
128,661,278
|
||
|
NET ASSETS:
|
||||
|
Investor Class
|
||||
|
Shares authorized (no par value)
|
Unlimited
|
|||
|
Net assets applicable to outstanding shares
|
$
|
112,889,870
|
||
|
Shares issued and outstanding
|
11,221,550
|
|||
|
Net asset value, offering price, and redemption price per share
|
$
|
10.06
|
||
|
Institutional Class
|
||||
|
Shares authorized (no par value)
|
Unlimited
|
|||
|
Net assets applicable to outstanding shares
|
$
|
15,771,408
|
||
|
Shares issued and outstanding
|
1,549,484
|
|||
|
Net asset value, offering price, and redemption price per share
|
$
|
10.18
|
||
The accompanying notes are an integral part of these financial statements.
|
HENNESSY FUNDS
|
1-800-966-4354
|
13
Financial Statements
|
Statement of Operations for the year ended October 31, 2023
|
|
INVESTMENT INCOME:
|
||||
|
Dividend income
|
$
|
3,105,507
|
||
|
Interest income
|
99,598
|
|||
|
Total investment income
|
3,205,105
|
|||
|
EXPENSES:
|
||||
|
Investment advisory fees (See Note 5)
|
997,824
|
|||
|
Distribution fees – Investor Class (See Note 5)
|
178,273
|
|||
|
Administration, accounting, custody, and transfer agent fees (See Note 5)
|
134,324
|
|||
|
Service fees – Investor Class (See Note 5)
|
118,849
|
|||
|
Sub-transfer agent expenses – Investor Class (See Note 5)
|
96,251
|
|||
|
Sub-transfer agent expenses – Institutional Class (See Note 5)
|
8,165
|
|||
|
Federal and state registration fees
|
35,242
|
|||
|
Audit fees
|
22,747
|
|||
|
Compliance expense (See Note 5)
|
22,672
|
|||
|
Trustees’ fees and expenses
|
21,562
|
|||
|
Reports to shareholders
|
11,267
|
|||
|
Legal fees
|
3,466
|
|||
|
Interest expense (See Note 7)
|
2,215
|
|||
|
Other expenses
|
26,649
|
|||
|
Net expenses
|
1,679,506
|
|||
|
NET INVESTMENT INCOME
|
$
|
1,525,599
|
||
|
REALIZED AND UNREALIZED GAINS (LOSSES):
|
||||
|
Net realized gain on investments
|
$
|
4,429,506
|
||
|
Net change in unrealized appreciation/depreciation on investments
|
6,248,824
|
|||
|
Net gain on investments
|
10,678,330
|
|||
|
NET INCREASE IN NET ASSETS RESULTING FROM OPERATIONS
|
$
|
12,203,929
|
||
The accompanying notes are an integral part of these financial statements.
|
WWW.HENNESSYFUNDS.COM
|
14
|
STATEMENT OF OPERATIONS/STATEMENTS OF CHANGES IN NET ASSETS
|
Financial Statements
|
Statements of Changes in Net Assets
|
|
Year Ended
|
Year Ended
|
|||||||
|
October 31, 2023
|
October 31, 2022
|
|||||||
|
OPERATIONS:
|
||||||||
|
Net investment income
|
$
|
1,525,599
|
$
|
1,161,757
|
||||
|
Net realized gain on investments
|
4,429,506
|
22,369,171
|
||||||
|
Net change in unrealized
|
||||||||
|
appreciation/depreciation on investments
|
6,248,824
|
(43,346,819
|
)
|
|||||
|
Net increase (decrease) in net
|
||||||||
|
assets resulting from operations
|
12,203,929
|
(19,815,891
|
)
|
|||||
|
DISTRIBUTIONS TO SHAREHOLDERS:
|
||||||||
|
Distributable earnings – Investor Class
|
(19,315,909
|
)
|
(18,524,443
|
)
|
||||
|
Distributable earnings – Institutional Class
|
(2,556,836
|
)
|
(2,507,385
|
)
|
||||
|
Total distributions
|
(21,872,745
|
)
|
(21,031,828
|
)
|
||||
|
CAPITAL SHARE TRANSACTIONS:
|
||||||||
|
Proceeds from shares subscribed – Investor Class
|
1,360,431
|
3,741,686
|
||||||
|
Proceeds from shares subscribed – Institutional Class
|
1,393,373
|
1,400,184
|
||||||
|
Dividends reinvested – Investor Class
|
18,623,426
|
17,953,867
|
||||||
|
Dividends reinvested – Institutional Class
|
2,501,083
|
2,397,570
|
||||||
|
Cost of shares redeemed – Investor Class
|
(13,722,728
|
)
|
(13,588,755
|
)
|
||||
|
Cost of shares redeemed – Institutional Class
|
(1,777,358
|
)
|
(2,613,279
|
)
|
||||
|
Net increase in net assets derived
|
||||||||
|
from capital share transactions
|
8,378,227
|
9,291,273
|
||||||
|
TOTAL DECREASE IN NET ASSETS
|
(1,290,589
|
)
|
(31,556,446
|
)
|
||||
|
NET ASSETS:
|
||||||||
|
Beginning of year
|
129,951,867
|
161,508,313
|
||||||
|
End of year
|
$
|
128,661,278
|
$
|
129,951,867
|
||||
|
CHANGES IN SHARES OUTSTANDING:
|
||||||||
|
Shares sold – Investor Class
|
131,258
|
304,353
|
||||||
|
Shares sold – Institutional Class
|
131,707
|
105,369
|
||||||
|
Shares issued to holders as reinvestment
|
||||||||
|
of dividends – Investor Class
|
1,887,812
|
1,400,177
|
||||||
|
Shares issued to holders as reinvestment
|
||||||||
|
of dividends – Institutional Class
|
250,554
|
184,777
|
||||||
|
Shares redeemed – Investor Class
|
(1,344,112
|
)
|
(1,132,049
|
)
|
||||
|
Shares redeemed – Institutional Class
|
(171,833
|
)
|
(218,737
|
)
|
||||
|
Net increase in shares outstanding
|
885,386
|
643,890
|
||||||
The accompanying notes are an integral part of these financial statements.
|
HENNESSY FUNDS
|
1-800-966-4354
|
15
Financial Statements
|
Financial Highlights
|
For an Investor Class share outstanding throughout each year
PER SHARE DATA:
Net asset value, beginning of year
Income from investment operations:
Net investment income(1)
Net realized and unrealized gains (losses) on investments
Total from investment operations
Less distributions:
Dividends from net investment income
Dividends from net realized gains
Total distributions
Net asset value, end of year
TOTAL RETURN
SUPPLEMENTAL DATA AND RATIOS:
Net assets, end of year (millions)
Ratio of expenses to average net assets:
Before expense reimbursement/recoupment
After expense reimbursement/recoupment
Ratio of net investment income to average net assets:
Before expense reimbursement/recoupment
After expense reimbursement/recoupment
Portfolio turnover rate(3)
|
(1)
|
Calculated using the average shares outstanding method.
|
|
(2)
|
The Fund had an expense limitation agreement in place through November 30, 2019.
|
|
(3)
|
Calculated on the basis of the Fund as a whole.
|
The accompanying notes are an integral part of these financial statements.
|
WWW.HENNESSYFUNDS.COM
|
16
|
FINANCIAL HIGHLIGHTS — INVESTOR CLASS
|
|
Year Ended October 31,
|
||||||||||||||||||
|
2023
|
2022
|
2021
|
2020
|
2019
|
||||||||||||||
|
$
|
10.92
|
$
|
14.35
|
$
|
10.21
|
$
|
10.54
|
$
|
12.24
|
|||||||||
|
0.11
|
0.09
|
0.09
|
0.09
|
0.13
|
||||||||||||||
|
0.87
|
(1.66
|
)
|
4.64
|
(0.15
|
)
|
0.56
|
||||||||||||
|
0.98
|
(1.57
|
)
|
4.73
|
(0.06
|
)
|
0.69
|
||||||||||||
|
(0.08
|
)
|
(0.08
|
)
|
(0.10
|
)
|
(0.14
|
)
|
(0.09
|
)
|
|||||||||
|
(1.76
|
)
|
(1.78
|
)
|
(0.49
|
)
|
(0.13
|
)
|
(2.30
|
)
|
|||||||||
|
(1.84
|
)
|
(1.86
|
)
|
(0.59
|
)
|
(0.27
|
)
|
(2.39
|
)
|
|||||||||
|
$
|
10.06
|
$
|
10.92
|
$
|
14.35
|
$
|
10.21
|
$
|
10.54
|
|||||||||
|
9.48
|
%
|
-12.76
|
%
|
48.00
|
%
|
-0.75
|
%
|
7.84
|
%
|
|||||||||
|
$
|
112.89
|
$
|
115.15
|
$
|
143.11
|
$
|
103.11
|
$
|
117.62
|
|||||||||
|
1.28
|
%
|
1.30
|
%
|
1.29
|
%
|
1.31
|
%
|
1.31
|
%
|
|||||||||
|
1.28
|
%
|
1.30
|
%
|
1.29
|
%
|
1.31
|
%(2)
|
1.29
|
%
|
|||||||||
|
1.10
|
%
|
0.76
|
%
|
0.69
|
%
|
0.93
|
%
|
1.24
|
%
|
|||||||||
|
1.10
|
%
|
0.76
|
%
|
0.69
|
%
|
0.93
|
%
|
1.26
|
%
|
|||||||||
|
53
|
%
|
76
|
%
|
68
|
%
|
62
|
%
|
57
|
%
|
|||||||||
The accompanying notes are an integral part of these financial statements.
|
HENNESSY FUNDS
|
1-800-966-4354
|
17
Financial Statements
|
Financial Highlights
|
For an Institutional Class share outstanding throughout each year
PER SHARE DATA:
Net asset value, beginning of year
Income from investment operations:
Net investment income(1)
Net realized and unrealized gains (losses) on investments
Total from investment operations
Less distributions:
Dividends from net investment income
Dividends from net realized gains
Total distributions
Net asset value, end of year
TOTAL RETURN
SUPPLEMENTAL DATA AND RATIOS:
Net assets, end of year (millions)
Ratio of expenses to average net assets:
Before expense reimbursement/recoupment
After expense reimbursement/recoupment
Ratio of net investment income to average net assets:
Before expense reimbursement/recoupment
After expense reimbursement/recoupment
Portfolio turnover rate(3)
|
(1)
|
Calculated using the average shares outstanding method.
|
|
(2)
|
The Fund had an expense limitation agreement in place through November 30, 2019.
|
|
(3)
|
Calculated on the basis of the Fund as a whole.
|
The accompanying notes are an integral part of these financial statements.
|
WWW.HENNESSYFUNDS.COM
|
18
|
FINANCIAL HIGHLIGHTS — INSTITUTIONAL CLASS
|
|
Year Ended October 31,
|
||||||||||||||||||
|
2023
|
2022
|
2021
|
2020
|
2019
|
||||||||||||||
|
$
|
11.05
|
$
|
14.51
|
$
|
10.33
|
$
|
10.65
|
$
|
12.38
|
|||||||||
|
0.14
|
0.13
|
0.12
|
0.13
|
0.16
|
||||||||||||||
|
0.89
|
(1.68
|
)
|
4.68
|
(0.15
|
)
|
0.56
|
||||||||||||
|
1.03
|
(1.55
|
)
|
4.80
|
(0.02
|
)
|
0.72
|
||||||||||||
|
(0.12
|
)
|
(0.11
|
)
|
(0.13
|
)
|
(0.17
|
)
|
(0.12
|
)
|
|||||||||
|
(1.78
|
)
|
(1.80
|
)
|
(0.49
|
)
|
(0.13
|
)
|
(2.33
|
)
|
|||||||||
|
(1.90
|
)
|
(1.91
|
)
|
(0.62
|
)
|
(0.30
|
)
|
(2.45
|
)
|
|||||||||
|
$
|
10.18
|
$
|
11.05
|
$
|
14.51
|
$
|
10.33
|
$
|
10.65
|
|||||||||
|
9.85
|
%
|
-12.52
|
%
|
48.30
|
%
|
-0.40
|
%
|
8.12
|
%
|
|||||||||
|
$
|
15.77
|
$
|
14.80
|
$
|
18.39
|
$
|
12.60
|
$
|
18.42
|
|||||||||
|
1.00
|
%
|
0.99
|
%
|
1.04
|
%
|
1.01
|
%
|
1.00
|
%
|
|||||||||
|
1.00
|
%
|
0.99
|
%
|
1.04
|
%
|
1.01
|
%(2)
|
0.98
|
%
|
|||||||||
|
1.37
|
%
|
1.08
|
%
|
0.91
|
%
|
1.23
|
%
|
1.56
|
%
|
|||||||||
|
1.37
|
%
|
1.08
|
%
|
0.91
|
%
|
1.23
|
%
|
1.58
|
%
|
|||||||||
|
53
|
%
|
76
|
%
|
68
|
%
|
62
|
%
|
57
|
%
|
|||||||||
The accompanying notes are an integral part of these financial statements.
|
HENNESSY FUNDS
|
1-800-966-4354
|
19
Financial Statements
|
Notes to the Financial Statements October 31, 2023
|
1). ORGANIZATION
The Hennessy Cornerstone Large Growth Fund (the “Fund”) is a series of Hennessy Funds Trust (the “Trust”), which was organized as a Delaware statutory trust on September 17, 1992. The Fund is an open-end management
investment company registered under the Investment Company Act of 1940, as amended. The investment objective of the Fund is long-term growth of capital. The Fund is a diversified fund.
The Fund offers Investor Class and Institutional Class shares. Each class of shares differs principally in its respective 12b-1 distribution and service, shareholder servicing, and sub-transfer
agent expenses. There are no sales charges. Each class has identical rights to earnings, assets, and voting privileges, except for class-specific expenses and exclusive rights to vote on matters affecting only one class.
As an investment company, the Fund follows the investment company accounting and reporting guidance of the Financial Accounting Standards Board (the “FASB”) Accounting Standard Codification Topic
946 “Financial Services—Investment Companies.”
2). SIGNIFICANT ACCOUNTING POLICIES
The following is a summary of significant accounting policies consistently followed by the Fund in the preparation of the financial statements. These policies conform to U.S. generally accepted accounting principles
(“GAAP”).
|
a).
|
Securities Valuation – All investments in securities are valued in accordance with the Fund’s valuation policies and procedures, as described in Note 3.
|
|
b).
|
Federal Income Taxes – The Fund has elected to be taxed as a regulated investment company and intends to distribute substantially all of its taxable income to its shareholders and otherwise comply with the
provisions of the Internal Revenue Code of 1986, as amended, applicable to regulated investment companies. As a result, the Fund has made no provision for federal income taxes or excise taxes. Net investment income/loss and realized
gains/losses for federal income tax purposes may differ from those reported in the financial statements because of temporary book-basis and tax-basis differences. Temporary differences are primarily the result of the treatment of wash
sales for tax reporting purposes. The Fund recognizes interest and penalties related to income tax benefits, if any, in the Statement of Operations as an income tax expense. Distributions from net realized gains for book purposes may
include short-term capital gains, which are included as ordinary income to shareholders for tax purposes. The Fund may utilize equalization accounting for tax purposes and designate earnings and profits, including net realized gains
distributed to shareholders on redemption of shares, as part of the dividends paid deduction for income tax purposes.
|
|
Due to inherent differences in the recognition of income, expenses, and realized gains/losses under GAAP and federal income tax
regulations, permanent differences between book and tax basis for reporting are identified and appropriately reclassified in the Statement of Assets and Liabilities, as needed. The adjustments for fiscal year 2023 are as follows:
|
|
Total
|
|||
|
Distributable
|
|||
|
Earnings
|
Capital Stock
|
||
|
$(589,871)
|
$589,871
|
|
WWW.HENNESSYFUNDS.COM
|
20
|
NOTES TO THE FINANCIAL STATEMENTS
|
|
c).
|
Accounting for Uncertainty in Income Taxes – The Fund has accounting policies regarding recognition and measurement of tax positions taken or expected to be taken on a tax return. The tax returns of the Fund
for the prior three fiscal years are open for examination. The Fund has reviewed all open tax years in major tax jurisdictions and concluded that there is no impact on the Fund’s net assets and no tax liability resulting from
unrecognized tax benefits relating to uncertain income tax positions taken or expected to be taken on a tax return. The Fund’s major tax jurisdictions are U.S. federal and Delaware.
|
|
d).
|
Income and Expenses – Dividend income is recognized on the ex-dividend date or as soon as information is available to the Fund. Interest income, which includes the amortization of premium and accretion of
discount, is recognized on an accrual basis. Market discounts, original issue discounts, and market premiums on debt securities are accreted or amortized to interest income over the life of a security with a corresponding increase or
decrease, as applicable, in the cost basis of such security using the yield-to-maturity method or, where applicable, the first call date of the security. Other non-cash dividends are recognized as investment income at the fair value of
the property received. The Fund is charged for those expenses that are directly attributable to its portfolio, such as advisory, administration, and certain shareholder service fees. Income, expenses (other than expenses attributable to
a specific class), and realized and unrealized gains/losses on investments are allocated to each class of shares based on such class’s net assets.
|
|
e).
|
Distributions to Shareholders – Dividends from net investment income for the Fund, if any, are declared and paid annually, usually in December. Distributions of net realized capital gains, if any, are declared
and paid annually, usually in December.
|
|
f).
|
Security Transactions – Investment and shareholder transactions are recorded on the trade date. The Fund determines the realized gain/loss from an investment transaction by comparing the original cost of the
security lot sold with the net sale proceeds. Discounts and premiums on securities purchased are accreted or amortized, respectively, over the life of each such security.
|
|
g).
|
Use of Estimates – Preparing financial statements in accordance with GAAP requires management to make estimates and assumptions that affect the reported amounts of assets and liabilities and disclosure of
contingent assets and liabilities at the date of the financial statements, as well as the reported change in net assets during the reporting period. Actual results could differ from those estimates.
|
|
h).
|
Share Valuation – The net asset value (“NAV”) per share of the Fund is calculated by dividing (i) the total value of the securities held by the Fund, plus cash and other assets, minus all liabilities
(including estimated accrued expenses) by (ii) the total number of Fund shares outstanding, rounded to the nearest $0.01. Fund shares are not priced on days the New York Stock Exchange is closed for trading. The offering and redemption
price per share for the Fund is equal to the Fund’s NAV per share.
|
|
i).
|
Illiquid Securities – Pursuant to Rule 22e-4 under the 1940 Act, the Fund has adopted a Liquidity Risk Management Program (the “Liquidity Program”). The Liquidity Program requires, among other things, that the
Fund limit its illiquid investments to no more than 15% of its net assets. An illiquid investment is any investment that the Fund reasonably expects cannot be sold or disposed of by the Fund in current market conditions in seven
calendar days or less without the sale or disposition significantly changing the market value of the investment.
|
|
j).
|
Recent Accounting Pronouncements and Regulatory Updates – In October 2022, the Securities and Exchange Commission (“SEC”) adopted a final rule relating to
|
|
HENNESSY FUNDS
|
1-800-966-4354
|
21
|
Tailored Shareholder Reports for Mutual Funds and Exchange-Traded Funds (ETFs); Fee Information in Investment Company Advertisements. The rule and form amendments will require mutual funds and ETFs to transmit
concise and visually engaging shareholder reports that highlight key information. The amendments also will require that funds tag information in a structured data format. In addition, the rule amendments will require that certain more
in-depth information be made available online and available for delivery free of charge to investors on request. The amendments became effective January 24, 2023. There is an 18-month transition period after the effective date of the
amendment.
|
|
|
In June 2022, the FASB issued Accounting Standards Update (“ASU”) 2022-03, Fair Value Measurement (Topic 820): Fair Value Measurement of
Equity Securities Subject to Contractual Sale Restrictions. The ASU clarifies that a contractual restriction on the sale of an equity security is not considered part of the unit of account of the equity security and, therefore, is not
considered in measuring the fair value. The amendments also require additional disclosures related to equity securities subject to contractual sale restrictions. The ASU is effective for fiscal years beginning after December 15, 2023,
and interim periods within those fiscal years.
|
3). SECURITIES VALUATION
The Fund follows its valuation policies and procedures in determining its NAV and, in preparing these financial statements, the fair value accounting standards that establish an authoritative definition of fair value
and set out a hierarchy for measuring fair value. These standards require additional disclosures about the various inputs and valuation techniques used to develop the measurements of fair value and a discussion of changes in valuation
techniques and related inputs during the period. These inputs are summarized in the three broad levels listed below:
|
Level 1 –
|
Unadjusted, quoted prices in active markets for identical instruments that the Fund has the ability to access at the date of measurement.
|
|
|
Level 2 –
|
Other significant observable inputs other than quoted prices included in Level 1 (including, but not limited to, quoted prices in active markets for similar instruments, quoted prices in markets that are not
active for identical or similar instruments, and model-derived valuations in which all significant inputs and significant value drivers are observable in active markets, such as interest rates, prepayment speeds, credit risk curves,
default rates, and similar data).
|
|
|
Level 3 –
|
Significant unobservable inputs (including the Fund’s own assumptions about what market participants would use to price the asset or liability based on the best available information) when observable inputs
are unavailable.
|
The following is a description of the valuation techniques applied to the Fund’s major categories of assets and liabilities on a recurring basis:
|
Equity Securities – Equity securities, including common stocks, preferred stocks, exchange-traded funds, closed-end mutual funds, partnerships, rights, and real estate
investment trusts, that are traded on a securities exchange for which a last-quoted sales price is readily available generally are valued at the last sales price as reported by the primary exchange on which the securities are listed.
Securities listed on The Nasdaq Stock Market (“Nasdaq”) generally are valued at the Nasdaq Official Closing Price, which may differ from the last sales price reported. Securities traded on a securities exchange for which a last-quoted
sales price is not readily available generally are valued at the mean between the bid and ask prices. To the extent these
|
|
WWW.HENNESSYFUNDS.COM
|
22
|
NOTES TO THE FINANCIAL STATEMENTS
|
|
securities are actively traded and valuation adjustments are not applied, they are classified in Level 1 of the fair value hierarchy.
|
|
|
Registered Investment Companies – Investments in open-end registered investment companies, commonly referred to as mutual funds, generally are priced at the ending NAV
provided by the applicable mutual fund’s service agent and are classified in Level 1 of the fair value hierarchy.
|
|
|
Debt Securities – Debt securities, including corporate bonds, asset-backed securities, mortgage-backed securities, municipal bonds, U.S. Treasuries, and U.S. government
agency issues, are generally valued at market on the basis of valuations furnished by an independent pricing service that utilizes both dealer-supplied valuations and formula-based techniques. The pricing service may consider recently
executed transactions in securities of the issuer or comparable issuers, market price quotations (where observable), bond spreads, and fundamental data relating to the issuer. In addition, the model may incorporate observable market
data, such as reported sales of similar securities, broker quotes, yields, bids, offers, and reference data. Certain securities are valued primarily using dealer quotations. These securities are generally classified in Level 2 of the
fair value hierarchy.
|
|
|
Short-Term Securities – Short-term equity investments, including money market funds, are valued in the manner specified above for equity securities. Short-term debt
investments with an original term to maturity of 60 days or less are valued at amortized cost, which approximates fair market value. If the original term to maturity of a short-term debt investment exceeds 60 days, then the values as of
the 61st day prior to maturity are amortized. Amortized cost is not used if its use would be inappropriate due to credit or other impairments of the issuer, in which case the security’s fair value would be determined as described below.
Short-term securities are generally classified in Level 1 or Level 2 of the fair value hierarchy depending on the inputs used and market activity levels for specific securities.
|
If market quotations are not readily available or if a significant event has occurred that indicates the closing price of a security no longer represents the true value of that security, any
security or other asset will be valued at its fair value in accordance with Rule 2a-5 under the 1940 Act. The Board of Trustees of the Fund (the “Board”) has designated Hennessy Advisors, Inc. (the “Advisor”) as the Fund’s valuation designee to
make all fair value determinations with respect to the Fund’s portfolio investments under the Fund’s fair value pricing procedures, subject to the Board’s oversight. There are numerous criteria considered in determining a fair value of a
security, such as the trading volume of a security and markets, the values of other similar securities, and news events with direct bearing on a security or markets. Fair value pricing results in an estimated price for a security that reflects
the amount the Fund might reasonably expect to receive in a current sale. Depending on the relative significance of the valuation inputs, these securities may be classified in either Level 2 or Level 3 of the fair value hierarchy. The Advisor
will regularly evaluate whether the Fund’s fair value pricing procedures continue to be appropriate in light of the specific circumstances of the Fund and the quality of prices obtained through their application of such procedures.
The Fund has performed an analysis of all existing investments to determine the significance and character of all inputs to their fair value determinations. Various inputs are used to determine the
value of the Fund’s investments. The inputs or methodology used for valuing securities are not necessarily an indication of the risk associated with investing in those securities. Details related to the fair value hierarchy of the Fund’s
securities as of October 31, 2023, are included in the Schedule of Investments.
|
HENNESSY FUNDS
|
1-800-966-4354
|
23
4). INVESTMENT TRANSACTIONS
Purchases and sales of investment securities (excluding government and short-term investments) for the Fund during fiscal year 2023 were $70,582,605 and $83,859,558, respectively.
There were no purchases or sales/maturities of long-term U.S. government securities for the Fund during fiscal year 2023.
5). INVESTMENT ADVISORY FEE AND OTHER TRANSACTIONS WITH AFFILIATES
The Advisor provides the Fund with investment advisory services under an Investment Advisory Agreement. The Advisor furnishes all investment advice, office space, and facilities and most of the personnel needed by the
Fund. As compensation for its services, the Advisor is entitled to a monthly fee from the Fund. The fee is based on the average daily net assets of the Fund at an annual rate of 0.74%. The net investment advisory fees expensed by the Fund
during fiscal year 2023 are included in the Statement of Operations.
The Board has approved a Shareholder Servicing Agreement for Investor Class shares of the Fund, which compensates the Advisor for the non-investment advisory services it provides to the Fund. The
Shareholder Servicing Agreement provides for a monthly fee paid to the Advisor at an annual rate of 0.10% of the average daily net assets of the Fund attributable to Investor Class shares. The shareholder service fees expensed by the Fund
during fiscal year 2023 are included in the Statement of Operations.
The Fund has adopted a plan pursuant to Rule 12b-1 under the Investment Company Act of 1940, as amended, that authorizes payments in connection with the distribution of Fund shares at an annual rate
of up to 0.25% of the Fund’s average daily net assets attributable to Investor Class shares. Even though the authorized rate is up to 0.25%, the Fund is currently only using up to 0.15% of its average daily net assets attributable to Investor
Class shares for such purpose. Amounts paid under the plan may be spent on any activities or expenses primarily intended to result in the sale of shares, including, but not limited to, advertising, shareholder account servicing, printing and
mailing of prospectuses to other than current shareholders, printing and mailing of sales literature, and compensation for sales and marketing activities or to financial institutions and others, such as dealers and distributors. The
distribution fees expensed by the Fund during fiscal year 2023 are included in the Statement of Operations.
The Fund has entered into agreements with various brokers, dealers, and financial intermediaries in connection with the sale of Fund shares. The agreements provide for periodic payments of
sub-transfer agent expenses by the Fund to the brokers, dealers, and financial intermediaries for providing certain shareholder maintenance services. These shareholder services include the pre-processing and quality control of new accounts,
shareholder correspondence, answering customer inquiries regarding account status, and facilitating shareholder telephone transactions. The sub-transfer agent fees expensed by the Fund during fiscal year 2023 are included in the Statement of
Operations.
U.S. Bancorp Fund Services, LLC, d/b/a U.S. Bank Global Fund Services (“Fund Services”) provides the Fund with administrative, accounting, and transfer agent services. As administrator, Fund
Services is responsible for activities such as (i) preparing various federal and state regulatory filings, reports, and returns for the Fund, (ii) preparing reports and materials to be supplied to the Board, (iii) monitoring the activities of
the Fund’s custodian, transfer agent, and accountants, and (iv) coordinating the preparation and payment of the Fund’s expenses and reviewing the Fund’s expense accruals. U.S. Bank N.A., an affiliate of Fund Services, serves as the Fund’s
custodian. The servicing agreements between the Trust, Fund Services, and U.S. Bank N.A. contain a fee schedule that is inclusive of administrative, accounting, custody, and transfer agent fees. The
|
WWW.HENNESSYFUNDS.COM
|
24
|
NOTES TO THE FINANCIAL STATEMENTS
|
administrative, accounting, custody, and transfer agent fees expensed by the Fund during fiscal year 2023 are included in the Statement of Operations.
Quasar Distributors, LLC, a wholly owned broker-dealer subsidiary of Foreside Financial Group, LLC, acts as the Fund’s principal underwriter in a continuous public offering of Fund shares.
The officers of the Fund are affiliated with the Advisor. With the exception of the Chief Compliance Officer, such officers receive no compensation from the Fund for serving in their respective
roles. The Fund, along with the other funds in the Hennessy Funds family (collectively, the “Hennessy Funds”), makes reimbursement payments on an equal basis to the Advisor for a portion of the salary and benefits associated with the office of
the Chief Compliance Officer. The compliance fees expensed by the Fund during fiscal year 2023 for reimbursement payments to the Advisor are included in the Statement of Operations.
6). GUARANTEES AND INDEMNIFICATIONS
Under the Hennessy Funds’ organizational documents, their officers and trustees are indemnified by the Hennessy Funds against certain liabilities arising out of the performance of their duties to the Hennessy Funds.
Additionally, in the normal course of business, the Hennessy Funds enter into contracts with service providers that contain general indemnification clauses. The Fund’s maximum exposure under these arrangements is unknown as this would involve
future claims that may be made against the Fund that have not yet occurred. Currently, the Fund expects the risk of loss to be remote.
7). LINE OF CREDIT
The Fund has an uncommitted line of credit with the other Hennessy Funds in the amount of the lesser of (i) $100,000,000 or (ii) 33.33% of each Hennessy Fund’s net assets, or 30% for the Hennessy Gas Utility Fund, the
Hennessy Japan Fund, and the Hennessy Japan Small Cap Fund and 10% for the Hennessy Balanced Fund. The line of credit is intended to provide any necessary short-term financing in connection with shareholder redemptions, subject to certain
restrictions. The credit facility is with the Hennessy Funds’ custodian bank, U.S. Bank N.A. Borrowings under this arrangement bear interest at the bank’s prime rate and are secured by all of the Fund’s assets (as to its own borrowings only).
During the fiscal year 2023, the Fund had an outstanding average daily balance and a weighted average interest rate of $30,027 and 7.28%, respectively. The interest expensed by the Fund during fiscal year 2023 is included in the Statement of
Operations. The maximum amount outstanding for the Fund during fiscal year 2023 was $1,817,000. As of October 31, 2023, the Fund did not have any borrowings outstanding under the line of credit.
8). FEDERAL TAX INFORMATION
As of October 31, 2023, the components of accumulated earnings (losses) for income tax purposes were as follows:
|
Investments
|
|||||
|
Cost of investments for tax purposes
|
$
|
130,596,135
|
|||
|
Gross tax unrealized appreciation
|
$
|
13,428,574
|
|||
|
Gross tax unrealized depreciation
|
(15,340,499
|
)
|
|||
|
Net tax unrealized appreciation/(depreciation)
|
$
|
(1,911,925
|
)
|
||
|
Undistributed ordinary income
|
$
|
1,525,599
|
|||
|
Undistributed long-term capital gains
|
3,841,330
|
||||
|
Total distributable earnings
|
$
|
5,366,929
|
|||
|
Other accumulated gain/(loss)
|
$
|
—
|
|||
|
Total accumulated gain/(loss)
|
$
|
3,455,004
|
|||
|
HENNESSY FUNDS
|
1-800-966-4354
|
25
The difference between book-basis unrealized appreciation/depreciation and tax-basis unrealized appreciation/depreciation (as shown above) is attributable primarily to wash sales.
As of October 31, 2023, the Fund had no tax-basis capital losses to offset future capital gains.
As of October 31, 2023, the Fund did not defer, on a tax basis, any late-year ordinary losses. Late-year ordinary losses are net ordinary losses incurred after December 31, 2022, but within the
taxable year, that are deemed to arise on the first day of the Fund’s next taxable year.
During fiscal years 2023 and 2022, the tax character of distributions paid by the Fund was as follows:
|
Year Ended
|
Year Ended
|
||||||||
|
October 31, 2023
|
October 31, 2022
|
||||||||
|
Ordinary income(1)
|
$
|
1,161,564
|
$
|
1,496,384
|
|||||
|
Long-term capital gains
|
20,711,181
|
19,535,444
|
|||||||
|
Total distributions
|
$
|
21,872,745
|
$
|
21,031,828
|
|||||
|
(1) Ordinary income includes short-term capital gains.
|
|||||||||
9). GLOBAL EVENTS
A rise in protectionist trade policies, the possibility of a national or global recession, risks associated with pandemic and epidemic diseases, trade tensions, the possibility of changes to some international trade
agreements, political events, and continuing political tension and armed conflicts may adversely impact financial markets and the broader economy. For example, ongoing armed conflicts between Ukraine and Russia in Europe and among Israel,
Hamas, and other militant groups in the Middle East have caused and could continue to cause significant market disruptions and volatility with the markets in Europe and the Middle East, and have had negative impacts on markets in the United
States. These events could also have negative effects on the Fund’s investments that cannot be foreseen at the present time. As global systems, economies and financial markets are increasingly interconnected, events that once had only local
impact are now more likely to have regional or even global effects. Events that occur in one country, region or financial market will, more frequently, adversely impact issuers in other countries, regions, or markets. These impacts can be
exacerbated by failures of governments and societies to adequately respond to an emerging event or threat. Your investment would be negatively impacted if the value of your portfolio holdings decreases as a result of such events, if these
events adversely impact the operations and effectiveness of the Advisor or other key service providers or if these events disrupt systems and processes necessary or beneficial to the management of accounts. These events may negatively impact
broad segments of businesses and populations and could have a significant and rapid negative impact on the performance of the Fund’s investments, increase the Fund’s volatility, or exacerbate pre-existing risks to the Fund.
10). EVENTS SUBSEQUENT TO YEAR END
Management has evaluated the Fund’s related events and transactions that occurred subsequent to October 31, 2023, through the date of issuance of the Fund’s financial statements. Other than as disclosed below,
management has determined that there were no subsequent events requiring recognition or disclosure in the financial statements.
On December 7, 2023, capital gains were declared and paid to shareholders of record on December 6, 2023, as follows:
|
Long-term
|
|||
|
Investor Class
|
0.30276
|
||
|
Institutional Class
|
0.30642
|
|
WWW.HENNESSYFUNDS.COM
|
26
|
NOTES/REPORT OF INDEPENDENT REGISTERED PUBLIC ACCOUNTING FIRM
|
Report of Independent Registered Public
Accounting Firm
To the Board of Trustees of Hennessy Funds Trust
and the shareholders of the Hennessy Cornerstone Large Growth Fund
Novato, CA
Opinion on the Financial Statements
We have audited the accompanying statement of assets and liabilities of the Hennessy Cornerstone Large Growth Fund (the “Fund”), a series of Hennessy Funds Trust, including the schedule of investments, as of October
31, 2023, the related statement of operations for the year then ended, the statements of changes in net assets for each of the two years in the period then ended, the financial highlights for each of the five years in the period then ended, and
the related notes (collectively referred to as the “financial statements”). In our opinion, the financial statements present fairly, in all material respects, the financial position of the Fund as of October 31, 2023, the results of its
operations for the year then ended, the changes in its net assets for each of the two years in the period then ended, and the financial highlights for each of the five years in the period then ended in conformity with accounting principles
generally accepted in the United States of America.
Basis for Opinion
These financial statements are the responsibility of the Fund’s management. Our responsibility is to express an opinion on the Fund’s financial statements based on our audits. We are a public accounting firm
registered with the Public Company Accounting Oversight Board (United States) (“PCAOB”) and are required to be independent with respect to the Fund in accordance with the U.S. federal securities laws and the applicable rules and regulations of
the Securities and Exchange Commission and the PCAOB. We have served as the auditor of one or more of the funds in the Trust since 2002.
We conducted our audits in accordance with the standards of the PCAOB. Those standards require that we plan and perform the audit to obtain reasonable assurance about whether the financial statements are free of
material misstatement, whether due to error or fraud. The Fund is not required to have, nor were we engaged to perform, an audit of its internal control over financial reporting. As part of our audits we are required to obtain an understanding
of internal control over financial reporting, but not for the purpose of expressing an opinion on the effectiveness of the Fund’s internal control over financial reporting. Accordingly, we express no such opinion.
Our audits included performing procedures to assess the risks of material misstatement of the financial statements, whether due to error or fraud, and performing procedures that respond to those risks. Such procedures
included examining, on a test basis, evidence regarding the amounts and disclosures in the financial statements. Our audits also included evaluating the accounting principles used and significant estimates made by management, as well as
evaluating the overall presentation of the financial statements. Our procedures included confirmation of securities owned as of October 31, 2023 by correspondence with the custodian. We believe that our audits provide a reasonable basis for our
opinion.
|
|
|
TAIT, WELLER & BAKER LLP
|
Philadelphia, Pennsylvania
December 22, 2023
|
HENNESSY FUNDS
|
1-800-966-4354
|
27
Trustees and Officers of the Fund (Unaudited)
The business and affairs of the Funds are managed under the direction of the Board of Trustees of the Trust, and the Board of Trustees elects the officers of the Trust (“Officers”). From time to time, the Board of
Trustees also has appointed advisers to the Board of Trustees (“Advisers”) with the intention of having qualified individuals serve in an advisory capacity to garner experience in the mutual fund and asset management industry and be considered
as potential Trustees in the future. There are currently two Advisers, Brian Alexander and A.J. Hennessy. As Advisers, Mr. Alexander and Mr. A.J. Hennessy attend meetings of the Board of Trustees and act as non-voting participants. Information
pertaining to the Trustees, Advisers, and the Officers of the Trust is set forth below. The Trustees and Officers serve until their successors are duly elected and qualified or until their earlier death, resignation, or removal. Each Trustee
oversees all 17 Hennessy Funds. Unless otherwise indicated, the address of all persons listed below is 7250 Redwood Boulevard, Suite 200, Novato, CA 94945. The Fund’s Statement of Additional Information includes more information about the
persons listed below and is available without charge by calling 800-966-4354 or by visiting www.hennessyfunds.com.
|
Other
|
|||
|
Directorships
|
|||
|
Held Outside
|
|||
|
Name, Age,
|
of Fund
|
||
|
and Position Held
|
Start Date
|
Principal Occupation(s)
|
Complex During
|
|
with the Trust
|
of Service
|
During Past Five Years
|
Past Five Years
|
|
Disinterested Trustees(1) and Disinterested Advisers
|
|||
|
J. Dennis DeSousa
|
January 1996
|
Mr. DeSousa is a real estate investor.
|
None.
|
|
87
|
|||
|
Trustee
|
|||
|
Robert T. Doyle
|
January 1996
|
Mr. Doyle is retired. He served as the
|
None.
|
|
76
|
Sheriff of Marin County, California
|
||
|
Trustee
|
from 1996 to June 2022.
|
||
|
Doug Franklin
|
March 2016
|
Mr. Franklin is a retired insurance
|
None.
|
|
59
|
as an Adviser
|
industry executive. From 1987
|
|
|
Trustee
|
to the Board
|
through 2015, he was employed by
|
|
|
and June 2023
|
the Allianz-Fireman’s Fund Insurance
|
||
|
as a Trustee
|
Company in various positions,
|
||
|
including as its Chief Actuary and
|
|||
|
Chief Risk Officer.
|
|||
|
Claire Garvie
|
December 2015
|
Ms. Garvie is a founder of Kiosk and
|
None.
|
|
49
|
as an Adviser
|
has served as its Chief Operating
|
|
|
Trustee
|
to the Board and
|
Officer since 2004. Kiosk is a
|
|
|
December 2021
|
full-service marketing agency with
|
||
|
as a Trustee
|
offices in the San Francisco Bay Area
|
||
|
and Liverpool, UK and staff across
|
|||
|
nine states in the U.S.
|
|||
|
WWW.HENNESSYFUNDS.COM
|
28
|
TRUSTEES AND OFFICERS OF THE FUND
|
|
Other
|
|||
|
Directorships
|
|||
|
Held Outside
|
|||
|
Name, Age,
|
of Fund
|
||
|
and Position Held
|
Start Date
|
Principal Occupation(s)
|
Complex During
|
|
with the Trust
|
of Service
|
During Past Five Years
|
Past Five Years
|
|
Gerald P. Richardson
|
May 2004
|
Mr. Richardson is an independent
|
None.
|
|
78
|
consultant in the securities industry.
|
||
|
Trustee
|
|||
|
Brian Alexander
|
March 2015
|
Mr. Alexander has served as the
|
None.
|
|
42
|
Chief Operating Officer of Solis
|
||
|
Adviser to the Board
|
Mammography since March 2023.
|
||
|
Prior to that, he worked for the
|
|||
|
Sutter Health organization from
|
|||
|
2011 to 2023 in various positions.
|
|||
|
He served as the Chief Executive
|
|||
|
Officer of the North Valley Hospital
|
|||
|
Area from 2021 to March 2023.
|
|||
|
From 2018 to 2021, he served as the
|
|||
|
Chief Executive Officer of Sutter
|
|||
|
Roseville Medical Center. From 2016
|
|||
|
through 2018, he served as the Vice
|
|||
|
President of Strategy for the Sutter
|
|||
|
Health Valley Area, which includes
|
|||
|
11 hospitals, 13 ambulatory surgery
|
|||
|
centers, 16,000 employees, and
|
|||
|
1,900 physicians.
|
|||
|
Interested Trustee and Interested Adviser(2)
|
|||
|
Neil J. Hennessy
|
January 1996 as
|
Mr. Neil Hennessy has been employed
|
Hennessy
|
|
67
|
a Trustee and
|
by Hennessy Advisors, Inc. since
|
Advisors, Inc.
|
|
Chairman of the Board,
|
June 2008 as
|
1989 and currently serves as its
|
|
|
Chief Market Strategist,
|
an Officer
|
Chairman and Chief Executive Officer.
|
|
|
Portfolio Manager,
|
|||
|
and President
|
|||
|
A.J. Hennessy
|
December 2022
|
Mr. A.J. Hennessy has been employed
|
None.
|
|
37
|
by Hennessy Advisors, Inc. since 2011.
|
||
|
Adviser to the Board
|
|||
|
and Vice President,
|
|||
|
Corporate Development
|
|||
|
and Operations
|
|||
|
HENNESSY FUNDS
|
1-800-966-4354
|
29
|
Name, Age,
|
||
|
and Position Held
|
Start Date
|
Principal Occupation(s)
|
|
with the Trust
|
of Service
|
During Past Five Years
|
|
Officers
|
||
|
Teresa M. Nilsen
|
January 1996
|
Ms. Nilsen has been employed by Hennessy Advisors, Inc.
|
|
57
|
since 1989 and currently serves as its President, Chief
|
|
|
Executive Vice President
|
Operating Officer, and Secretary.
|
|
|
and Treasurer
|
||
|
Daniel B. Steadman
|
March 2000
|
Mr. Steadman has been employed by Hennessy Advisors, Inc.
|
|
67
|
since 2000 and currently serves as its Executive Vice President.
|
|
|
Executive Vice President
|
||
|
and Secretary
|
||
|
Brian Carlson
|
December 2013
|
Mr. Carlson has been employed by Hennessy Advisors, Inc.
|
|
51
|
since December 2013 and currently serves as its Chief
|
|
|
Senior Vice President
|
Compliance Officer and Senior Vice President.
|
|
|
and Head of Distribution
|
||
|
David Ellison(3)
|
October 2012
|
Mr. Ellison has been employed by Hennessy Advisors, Inc.
|
|
65
|
since October 2012. He has served as a Portfolio Manager of
|
|
|
Senior Vice President
|
the Hennessy Large Cap Financial Fund and the Hennessy
|
|
|
and Portfolio Manager
|
Small Cap Financial Fund since their inception. Mr. Ellison also
|
|
|
served as a Portfolio Manager of the Hennessy Technology
|
||
|
Fund from its inception until February 2017. Mr. Ellison served
|
||
|
as Director, CIO, and President of FBR Fund Advisers, Inc.
|
||
|
from December 1999 to October 2012.
|
||
|
Jennifer Emerson(4)
|
June 2013
|
Ms. Emerson has been employed by Hennessy Advisors, Inc.
|
|
46
|
as its General Counsel since June 2013.
|
|
|
Senior Vice President and
|
||
|
Chief Compliance Officer
|
||
|
Ryan Kelley(5)
|
March 2013
|
Mr. Kelley has been employed by Hennessy Advisors, Inc. since
|
|
51
|
October 2012. He has served as Chief Investment Officer of the
|
|
|
Senior Vice President,
|
Hennessy Funds since March 2021 and has served as a Portfolio
|
|
|
Chief Investment Officer,
|
Manager of the Hennessy Gas Utility Fund, the Hennessy Large
|
|
|
and Portfolio Manager
|
Cap Financial Fund, and the Hennessy Small Cap Financial Fund
|
|
|
since October 2014. Mr. Kelley served as Co-Portfolio Manager
|
||
|
of these same funds from March 2013 through September
|
||
|
2014 and as a Portfolio Analyst for the Hennessy Funds from
|
||
|
October 2012 through February 2013. He has also served as a
|
||
|
Portfolio Manager of the Hennessy Cornerstone Growth Fund,
|
||
|
the Hennessy Cornerstone Mid Cap 30 Fund, the Hennessy
|
||
|
Cornerstone Large Growth Fund, and the Hennessy
|
||
|
Cornerstone Value Fund since February 2017 and as a Portfolio
|
||
|
Manager of the Hennessy Total Return Fund, the Hennessy
|
||
|
Balanced Fund, and the Hennessy Technology Fund since May
|
||
|
2018. He previously served as Co-Portfolio Manager of the
|
||
|
Hennessy Technology Fund from February 2017 until May 2018.
|
||
|
Mr. Kelley served as Portfolio Manager of FBR Fund
|
||
|
Advisers, Inc. from January 2008 to October 2012.
|
|
WWW.HENNESSYFUNDS.COM
|
30
|
TRUSTEES AND OFFICERS OF THE FUND
|
|
Name, Age,
|
||
|
and Position Held
|
Start Date
|
Principal Occupation(s)
|
|
with the Trust
|
of Service
|
During Past Five Years
|
|
L. Joshua Wein(5)
|
September 2018
|
Mr. Wein has been employed by Hennessy Advisors, Inc. since
|
|
50
|
2018. He has served as Portfolio Manager of the Hennessy
|
|
|
Vice President and
|
Cornerstone Growth Fund, the Hennessy Cornerstone Mid Cap
|
|
|
Portfolio Manager
|
30 Fund, the Hennessy Cornerstone Large Growth Fund, the
|
|
|
Hennessy Cornerstone Value Fund, Hennessy Total Return Fund,
|
||
|
the Hennessy Balanced Fund, the Hennessy Gas Utility Fund,
|
||
|
and the Hennessy Technology Fund since February 2021, and
|
||
|
as the Co-Portfolio Manager of these Funds since February
|
||
|
2019. He served as a Senior Analyst of those same Funds from
|
||
|
September 2018 through February 2019. He also has served as
|
||
|
a Portfolio Manager of the Hennessy Energy Transition Fund
|
||
|
and the Hennessy Midstream Fund since January 2022.
|
||
|
Mr. Wein served as Director of Alternative Investments and
|
||
|
Co-Portfolio Manager at Sterling Capital Management
|
||
|
from 2008 to 2018.
|
_______________
|
(1)
|
The Funds have determined that Mr. DeSousa, Mr. Doyle, Mr. Franklin, Ms. Garvie, and Mr. Richardson are not interested persons, as defined in the 1940 Act, of the Investment Manager or of
any predecessor investment adviser for purposes of Section 15(f) of the 1940 Act.
|
|
(2)
|
Each of Neil J. Hennessy and A.J. Hennessy is considered an interested person, as defined in the 1940 Act, because he is an officer of the Trust.
|
|
(3)
|
The address of this officer is 101 Federal Street, Suite 1615B, Boston, MA 02110.
|
|
(4)
|
The address of this officer is 4800 Bee Caves Road, Suite 100, Austin, TX 78746.
|
|
(5)
|
The address of this officer is 1340 Environ Way, Chapel Hill, NC 27517.
|
|
HENNESSY FUNDS
|
1-800-966-4354
|
31
Expense Example (Unaudited)
October 31, 2023
As a shareholder of the Fund, you incur ongoing costs, including management fees, service fees, and other Fund expenses. This Example is intended to help you understand your ongoing costs (in dollars) of investing in
the Fund and to compare these costs with the ongoing costs of investing in other investment funds. The Example is based on an investment of $1,000 invested at the beginning of the period and held for the entire period from May 1, 2023, through
October 31, 2023.
Actual Expenses
In the table below, the first line under each of the “Investor Class” and “Institutional Class” headings provides information about actual account values and actual expenses for each share class. You may use this
information, together with the amount you invested, to estimate the expenses that you paid over the period. Simply divide your account value by $1,000 (for example, an $8,600 account value divided by $1,000 = 8.6), then multiply the result by
the number in the first line under the heading “Expenses Paid During Period” to estimate the expenses you paid on your account during this period. Although the Fund charges no sales loads or transaction fees, you will be assessed fees for
outgoing wire transfers, returned checks, and stop payment orders at prevailing rates charged by U.S. Bank Global Fund Services, the Fund’s transfer agent. If you request that a redemption be made by wire transfer, the Fund’s transfer agent
charges a $15 fee. IRAs are charged a $15 annual maintenance fee (up to $30 maximum per shareholder for shareholders with multiple IRAs). The examples below include, but are not limited to, management, shareholder servicing, accounting,
custody, and transfer agent fees. However, the examples below do not include portfolio trading commissions and related expenses.
Hypothetical Example for Comparison Purposes
In the table below, the second line under each of the “Investor Class” and “Institutional Class” headings provides information about hypothetical account values and hypothetical expenses based on the Fund’s actual
expense ratio for each share class and an assumed rate of return of 5% per year before expenses, which is not the Fund’s actual return for such share class. The hypothetical account values and expenses may not be used to estimate the actual
ending account balance or expenses you paid for the period. You may use this information to compare the ongoing costs of investing in the Fund and other funds. To do so, compare these 5% hypothetical examples with the 5% hypothetical examples
that appear in the shareholder reports of the other funds. Please note that the expenses shown in the table are meant to highlight your ongoing costs only. Therefore, the second lines under “Investor Class” and “Institutional Class” are useful
in comparing ongoing costs only and will not help you determine the relative total costs of owning different funds.
|
WWW.HENNESSYFUNDS.COM
|
32
|
EXPENSE EXAMPLE
|
|
Expenses Paid
|
|||
|
Beginning
|
Ending
|
During Period(1)
|
|
|
Account Value
|
Account Value
|
May 1, 2023 –
|
|
|
May 1, 2023
|
October 31, 2023
|
October 31, 2023
|
|
|
Investor Class
|
|||
|
Actual
|
$1,000.00
|
$1,025.50
|
$6.48
|
|
Hypothetical (5% return before expenses)
|
$1,000.00
|
$1,018.80
|
$6.46
|
|
Institutional Class
|
|||
|
Actual
|
$1,000.00
|
$1,027.20
|
$5.06
|
|
Hypothetical (5% return before expenses)
|
$1,000.00
|
$1,020.21
|
$5.04
|
|
(1)
|
Expenses are equal to the Fund’s annualized expense ratio of 1.27% for Investor Class shares or 0.99% for Institutional Class shares, as applicable, multiplied by the average account value over the period,
multiplied by 184/365 days (to reflect the half-year period).
|
|
HENNESSY FUNDS
|
1-800-966-4354
|
33
How to Obtain a Copy of the Fund’s Proxy
Voting Policy and Proxy Voting Records
A description of the policies and procedures the Fund uses to determine how to vote proxies relating to portfolio securities is available without charge (1) by calling 800-966-4354, (2) on the Hennessy Funds’ website
at www.hennessyfunds.com/proxy-voting/voting-policy, or (3) on the U.S. Securities and Exchange Commission’s (the “SEC”) website at www.sec.gov. The Fund’s proxy voting record is available without charge on both the Hennessy Funds’ website at
www.hennessyfunds.com/proxy-voting/voting-record and the SEC’s website at www.sec.gov no later than August 31 for the prior 12 months ending June 30.
Availability of Quarterly Portfolio Schedule
The Fund files a complete schedule of portfolio holdings with the SEC for the first and third quarters of each fiscal year as an exhibit to its reports on Form N-PORT. The Fund’s Form N-PORT reports are available on
the SEC’s website at www.sec.gov or on request by calling 800-966-4354.
Federal Tax Distribution Information (Unaudited)
For fiscal year 2023, certain dividends paid by the Fund may be subject to a maximum tax rate of 23.8%, as provided for by the Jobs and Growth Tax Relief Reconciliation Act of 2003. The percentage of dividends
declared from ordinary income designated as qualified dividend income was 100.00%.
For corporate shareholders, the percent of ordinary income distributions that qualified for the corporate dividends received deduction for fiscal year 2023 was 100.00%.
The percentage of taxable ordinary income distributions that were designated as short-term capital gain distributions under Section 871(k)(2)(C) of the Internal Revenue Code of 1986, as amended, for
the Fund was 0.00%.
Important Notice Regarding Delivery
of Shareholder Documents
To help keep the Fund’s costs as low as possible, we generally deliver a single copy of shareholder reports, proxy statements, and prospectuses to shareholders who share an address and have the same last name. This
process does not apply to account statements. You may request an individual copy of a shareholder document at any time. If you would like to receive separate mailings of shareholder documents, please call U.S. Bank Global Fund Services at
800-261-6950 or 414-765-4124, and individual delivery will begin within 30 days of your request. If your account is held through a financial institution or other intermediary, please contact such intermediary directly to request individual
delivery.
Electronic Delivery
As currently permitted by SEC regulations, the Fund’s shareholder reports are made available on a website, and unless you sign for eDelivery or elect to receive paper copies as detailed below, you will be notified by
mail each time a report is posted and provided with a website link to access the report.
To elect to receive paper copies of all future reports free of charge, please call U.S. Bank Global Fund Services at 800-261-6950 or 414-765-4124.
The Fund also offers shareholders the option to receive all notices, account statements, prospectuses, tax forms, and shareholder reports electronically. To sign up for eDelivery or change your
delivery preference, please visit www.hennessyfunds.com/account.
Shareholder reports transmitted after July 24, 2024, will comply with the new tailored shareholder reporting requirements, which require streamlined annual and semi-annual reports to shareholders
that highlight key information. These reports will be transmitted in paper unless a shareholder elects to receive reports electronically via eDelivery. To sign up for eDelivery, please visit http://www.hennessyfunds.com/account.
Subscribe to receive our team’s unique market and sector insights delivered to your inbox
www.hennessyfunds.com/subscribe
Follow us on social media
| |
|
|
WWW.HENNESSYFUNDS.COM
|
34
|
PROXY VOTING — PRIVACY POLICY
|
Liquidity Risk Management Program
In accordance with Rule 22e-4 under the Investment Company Act of 1940, as amended (the “Liquidity Rule”), we have adopted and implemented a liquidity risk management program (the “Liquidity Program”). The purpose of
the Liquidity Program is to assess and manage the Fund’s liquidity risk, which is the risk that the Fund would not be able to meet requests to redeem Fund shares without significant dilution of the remaining shareholders’ interests in the Fund.
The Board of Trustees of the Fund (the “Board”) designated a committee comprising representatives of Hennessy Advisors, Inc., the investment adviser to the Fund, as the administrator of the Liquidity Program (the “Program Administrator”).
The Program Administrator provided a written report regarding the Liquidity Program to the Board in advance of its meeting on June 7, 2023. The report covered the period from June 1, 2022, through
May 31, 2023. The report addressed the operation of the Liquidity Program, assessed the adequacy and effectiveness of its implementation, and described any material changes to the Liquidity Program during the review period. The Trust’s chief
compliance officer presented the report to the Board at the meeting and provided additional information regarding the Liquidity Program. The Board reviewed the Liquidity Program and considered, among other items, the following:
|
1.
|
The Program Administrator reviewed daily historical net redemption activity during the review period and during prior periods with higher-than-average redemption activity and concluded that the Fund has
historically been able to meet requests to redeem Fund shares without significant dilution to the Fund’s remaining shareholders, and the Program Administrator expects the Fund to be able to continue to do so in the future during both
normal and reasonably foreseeable stressed conditions.
|
|
|
2.
|
The Fund primarily holds assets that are highly liquid investments and is not required to establish a highly liquid investment minimum for the Fund or adopt policies and procedures for responding to a highly
liquid investment minimum shortfall.
|
|
|
3.
|
The Program Administrator did not make or recommend any material changes to the Liquidity Program during the review period.
|
|
|
4.
|
The Program Administrator concluded that the Liquidity Program was reasonably designed to assess and manage the Fund’s liquidity risk, complies with the requirements of the Liquidity Rule, and was operating as
intended during the review period.
|
Privacy Policy
We collect the following personal information about you:
|
1.
|
Information we receive from you in applications or other forms, correspondence, or conversations, including, but not limited to, your name, address, phone number, social security number, assets, income, and
date of birth;
|
|
|
2.
|
Information about your transactions with us, our affiliates, or others, including, but not limited to, your account number and balance, payments history, parties to transactions, cost basis information, and
other financial information; and
|
|
HENNESSY FUNDS
|
1-800-966-4354
|
35
|
3.
|
Other personal information we collect from various sources, even if you have not entered into a prior transaction with us, including the following:
|
|
•
|
Name, alias, address, unique personal identifier, online identifier, IP address, email address, telephone number, account name, and other similar identifiers;
|
||
|
•
|
Age and marital status;
|
||
|
•
|
Commercial information, including records of products purchased;
|
||
|
•
|
Browsing history, search history, and information on interaction with our website;
|
||
|
•
|
Geolocation data;
|
||
|
•
|
Employment and employment history, educational history, financial information, and purchasing and consuming histories or tendencies; and
|
||
|
•
|
Inferences drawn from the above-listed information to create a profile about your preferences, characteristics, predispositions, and behavior.
|
We collect this information directly from you, indirectly in the course of providing services to you, directly and indirectly from your activity on our website, from broker dealers, marketing
agencies, and other third parties that interact with us in connection with the services we perform and products we offer, and from anonymized and aggregated consumer information.
We use this information to fulfill the reason you provided the information to us, to provide you with other relevant products that you request from us, to provide you with information about products
that may interest you, to improve our website or present our website’s contents to you, and as otherwise described to you when collecting your personal information.
We do not disclose any personal information to unaffiliated third parties, except as permitted by law. We may disclose your personal information to our affiliates, vendors, and service providers for
a business purpose. For example, we are permitted by law to disclose all of the information we collect, as described above, to our transfer agent to process your transactions. When disclosing your personal information to third parties, we enter
into a contract with each third party describing the purpose of such disclosure and requiring that such personal information be kept confidential and not used for any purpose except to perform the services contracted or respond to regulatory or
law enforcement requests.
Furthermore, we restrict access to your personal information to those persons who require such information to provide products or services to you. As a result, we do not provide a means for opting
out of our limited sharing of your information. We maintain physical, electronic, and procedural safeguards that comply with federal standards to guard your personal information.
If you hold shares of the Funds through a financial intermediary, including, but not limited to, a broker-dealer, bank, or trust company, the privacy policy of your financial intermediary governs
how your personal information is shared with unaffiliated third parties.
If you live in a state such as California where the laws provide further privacy rights, we will not share information unless the law allows, and we will comply with the other state-specific
requirements.
|
WWW.HENNESSYFUNDS.COM
|
36
|
PRIVACY POLICY
|
Supplemental Privacy Notice for Residents of California
The California Consumer Privacy Act of 2018 (the “CCPA”) provides you, as a California resident, with certain additional rights relating to your personal information.
Under the CCPA, you have the right to request that we disclose to you the categories of personal information we have collected about you over the past 12 months, the categories of sources of such
information, our business purpose for collecting the information, the categories of third parties, if any, with whom we shared the information, and the specific information we have collected about you. You also have the right to request that we
delete any of your personal information, and, unless an exception applies, we will delete such information upon receiving and confirming your request. To make a request, call us at 1-800-966-4354, email us at privacy@hennessyfunds.com, or go to
www.hennessyfunds.com/contact. We will not discriminate against you for exercising your rights under the CCPA. Further, we will not collect additional categories of your personal information or use the personal information we collected for
materially different, unrelated, or incompatible purposes without providing you notice.
|
HENNESSY FUNDS
|
1-800-966-4354
|
37
For information, questions, or assistance, please call
The Hennessy Funds
800-966-4354 or 415-899-1555
INVESTMENT ADVISOR
Hennessy Advisors, Inc.
7250 Redwood Boulevard, Suite 200
Novato, California 94945
ADMINISTRATOR,
TRANSFER AGENT,
DIVIDEND PAYING AGENT, &
SHAREHOLDER SERVICING AGENT
U.S. Bancorp Fund Services, LLC
d/b/a U.S. Bank Global Fund Services
P.O. Box 701
Milwaukee, Wisconsin 53201-0701
CUSTODIAN
U.S. Bank N.A.
Custody Operations
1555 North River Center Drive, Suite 302
Milwaukee, Wisconsin 53212
TRUSTEES
Neil J. Hennessy
Robert T. Doyle
J. Dennis DeSousa
Doug Franklin
Claire Garvie
Gerald P. Richardson
COUNSEL
Foley & Lardner LLP
777 East Wisconsin Avenue
Milwaukee, Wisconsin 53202-5306
INDEPENDENT REGISTERED
PUBLIC ACCOUNTING FIRM
Tait, Weller & Baker LLP
Two Liberty Place
50 South 16th Street, Suite 2900
Philadelphia, Pennsylvania 19102-2529
DISTRIBUTOR
Quasar Distributors, LLC
111 East Kilbourn Avenue, Suite 1250
Milwaukee, Wisconsin 53202

www.hennessyfunds.com | 800-966-4354
This report has been prepared for shareholders and may be distributed to
others only if preceded or accompanied by a current prospectus.
ANNUAL REPORT
OCTOBER 31, 2023
HENNESSY CORNERSTONE VALUE FUND
Investor Class HFCVX
Institutional Class HICVX
www.hennessyfunds.com | 1-800-966-4354
(This Page Intentionally Left Blank.)
Contents
|
Letter to Shareholders
|
2
|
|
|
Performance Overview
|
6
|
|
|
Financial Statements
|
||
|
Schedule of Investments
|
9
|
|
|
Statement of Assets and Liabilities
|
13
|
|
|
Statement of Operations
|
14
|
|
|
Statements of Changes in Net Assets
|
15
|
|
|
Financial Highlights
|
16
|
|
|
Notes to the Financial Statements
|
20
|
|
|
Report of Independent Registered Public Accounting Firm
|
28
|
|
|
Trustees and Officers of the Fund
|
29
|
|
|
Expense Example
|
34
|
|
|
Proxy Voting Policy and Proxy Voting Records
|
36
|
|
|
Availability of Quarterly Portfolio Schedule
|
36
|
|
|
Federal Tax Distribution Information
|
36
|
|
|
Important Notice Regarding Delivery of Shareholder Documents
|
36
|
|
|
Electronic Delivery
|
36
|
|
|
Liquidity Risk Management Program
|
37
|
|
|
Privacy Policy
|
37
|
|
HENNESSY FUNDS
|
1-800-966-4354
|
November 2023
Dear Hennessy Funds Shareholder:
Market Myopia: Tough Beginnings & Fantastic Finishes
During an interview this summer, I was reminded how important it is to maintain a long-term view of the market and investing and how easy it is to focus on the very recent past. In mid-July, when the Nasdaq
Composite Index was soaring to new 2023 highs and large-cap tech was once again dominating both returns and news headlines, the interviewer seemed confused – and somewhat disappointed – when I mentioned that even with 2023’s stellar
performance, the Nasdaq was negative if you included the prior year (2022) and that during that same time, utilities had outperformed. As of the time of writing this letter, a similar story can be seen when considering eight technology
giants: Microsoft, Tesla, Facebook (Meta), Apple, Amazon, Netflix, Nvidia, and Google, or “MT. FAANNG” as a much easier to say (and remember) acronym.(1) MT. FAANNG is up on average a whopping 89.69% in 2023 on a total return basis as of November 7, 2023. However, this same group was down -46.71% in 2022, a
dismal year for large-cap tech. Due to the unforgiving nature of percentages, from the end of 2021 until now, this group of highflyers, believe it or not, is still down -3.14% on average, despite an incredible 2023.
I like to call this phenomenon “market myopia.” Investors tend to be optimists, as am I. This makes it so much more comforting to forget the “tough beginnings” when you’d
rather remember the “fantastic finishes.” In continuing with the example above, unless you were an investor with prescient foresight, you likely didn’t sell all your MT. FAANNG stocks on January 4, 2022, as the market started its correction,
and you probably didn’t then buy them all back on September 30, 2022, when the market hit its low. An average investor’s experience would be much different than that. Which brings me to the point of all this: what are some elements of our
investment philosophy here at Hennessy Funds?
First, what about timing the market? Simply put, we don’t do it. As Neil Hennessy, our Chief Market Strategist and long-tenured Portfolio Manager, aptly put it, “It’s not
about timing the market, but rather about time in the market.” The long-term annualized return of the market, as measured by the Dow Jones Industrial Average
going back 104 years to 1920, is about 9.6%, and that number would be closer to 7-8% on a real return basis when factoring in inflation. If an investor is poorly timing when to enter and when to exit the market, it would be very difficult to
achieve similar, attractive returns to what they would experience simply by staying invested through a complete market cycle.
We are optimistic investors. We understand that some years or months may be tougher than others, but we tend to think in longer timeframes. An investor solely invested in the
Nasdaq might have looked at their portfolio at the end of 2022 and been extremely disappointed with a -32.51% return. But as Josh Wein, one of our Portfolio Managers with over 25 years of experience, pointed out, “2022 was what 8% real
returns look like.” In other words, with the year prior (2021) providing a +22.21% return and the year after (2023) hitting a +31.21% return, 2022’s dismal performance of -32.51% created an annualized total return for the Nasdaq of 8.22% over
the entire period (December 31, 2020, to November 7, 2023). Josh simply observed that while corrections happen over the course of a market cycle, it’s best not to panic by selling when stocks are hitting new lows.
_______________
|
(1)
|
The acronym, MT. FAANNG, refers to the following companies: Microsoft Corporation, Tesla, Inc., Meta Platforms, Inc., Amazon.com, Inc., Apple, Inc., Netflix, Inc., NVIDIA Corporation, and Alphabet, Inc.
|
|
WWW.HENNESSYFUNDS.COM
|
2
|
LETTER TO SHAREHOLDERS
|
Downside risk mitigation is relevant. While we normally remain fully invested within our individual funds, we seek to reduce risk through other means, including sector
diversification and investing in companies that exhibit strong fundamentals at compelling valuations. Dave Ellison, the long-tenured Portfolio Manager of our two financial funds, consistently reminds us, “Losing less money in difficult
markets is more important than making the most in rising ones.”
Finally, we are investors in companies, not traders of stocks. Many of our portfolios hold certain positions for long periods of time, a demonstration of the Portfolio
Managers’ convictions. In fact, both the Hennessy Focus Fund and the Hennessy Large Cap Financial Fund have held some positions for 25 years or more. We recognize that much of the performance of the Hennessy Funds comes from the actual stocks
we own (stock selection) and not from our weightings within certain sectors (sector allocation). Moving in and out of sectors can enhance performance, but it can also hinder it in the same way as market timing, and it takes a significant
number of correct “calls” regarding the macro-environment. We’d rather invest long term than rely on lucky calls. Our highly experienced energy funds Portfolio Manager, Ben Cook, summed up our philosophy on the macro environment nicely:
“While macro-economic trends help to inform our investment process, ultimately it’s the individual stocks with solid fundamentals and attractive valuations that, over time, drive positive risk-adjusted returns for our funds.”
We are long term investors, staying ever mindful of downside risk while striving to participate in the upside, with each individual fund having its own objective, process,
portfolio construction, and investment criteria.
The stock market has once again seen dramatic differences in stock performance. For our fiscal year ended October 31, 2023, all three broad-based indexes were positive,
although with a large dispersion of total returns, with the Dow Jones Industrial Average up 3.17%, the S&P 500® Index up 10.14%, and the Nasdaq Composite
Index up 17.99%. During our fiscal year, large caps significantly outperformed mid caps and small caps, and growth substantially outperformed value. Large-cap tech once again pushed the overall broader market higher, as evidenced by the
Nasdaq-100 Index posting a return of 27.45%. From a sector point of view, besides Technology, the only other sector with outsized (greater than 10%) returns was Communication Services, while six of the 11 GICS sectors of the S&P 500® Index were negative.
Similar to the overall market, our funds experienced mixed results. Many of our funds exhibit more value-oriented characteristics and, given that value underperformed growth
this year by a significant amount, that negatively affected our relative performance. In addition, three of our funds are sector-specific funds that were invested in underperforming sectors, while six more are focused on small- and mid-cap
stocks in a time period when large caps substantially outperformed. Ten of our 16 mutual funds and our exchange-traded-fund (ETF) posted positive returns for the fiscal year ended October 31, 2023.
Several factors caused this disparity of returns in the market: interest rates and inflation being two of the most important. With the Federal Reserve pausing interest rate
hikes and inflation numbers subsiding, the market reacted positively once it became more apparent that we were not heading into a recession. Consumer demand also remained strong, and unemployment numbers remained historically low.
We believe that the outlook for U.S. stocks remains positive, primarily as we believe that the Federal Reserve may be done, or close to done, raising interest rates. Inflation
has shown signs of easing, creating a better environment for consumers as well as businesses. The unemployment rate remains near record lows, there are elevated levels of cash on the
|
HENNESSY FUNDS
|
1-800-966-4354
|
3
balance sheets of U.S. companies and in the pockets of many consumers and investors, and there is the prospect of a more dovish Federal Reserve heading into 2024. However, we are cautiously watching certain parts of
the economy for any hints of weakness, including consumer spending and credit issues. While volatility and uncertainty may impact the markets, we encourage investors to stay the course, maintain a diversified portfolio, and keep a long-term
perspective.
We thank you for your continued interest in our Funds and are grateful that you have chosen to invest with us. If you have any questions or would like to speak with us
directly, please call us at (800) 966-4354.
Best regards,
|
|
|
|
|
Ryan C. Kelley, CFA
|
|
|
Chief Investment Officer,
|
|
|
Senior Vice President, and Portfolio Manager
|
Past performance does not guarantee future results.
Mutual fund investing involves risk. Principal loss is possible.
Opinions expressed are those of Ryan C. Kelley and are subject to change, are not guaranteed, and should not be considered investment advice.
The Dow Jones Industrial Average and S&P 500® Index are commonly used to measure the performance of U.S. stocks. The Nasdaq
Composite Index comprises all common stocks listed on The Nasdaq Stock Market and is commonly used to measure the performance of technology-related stocks. The Nasdaq-100 Index includes 100 of the largest domestic and international
non-financial companies listed on The NASDAQ Stock Market based on market capitalization. The indices are used herein for comparative purposes in accordance with SEC regulations. One cannot invest directly in an index. All returns are shown
on a total return basis.
|
WWW.HENNESSYFUNDS.COM
|
4
|
LETTER TO SHAREHOLDERS
|
(This Page Intentionally Left Blank.)
|
HENNESSY FUNDS
|
1-800-966-4354
|
5
Performance Overview (Unaudited)
CHANGE IN VALUE OF $10,000 INVESTMENT
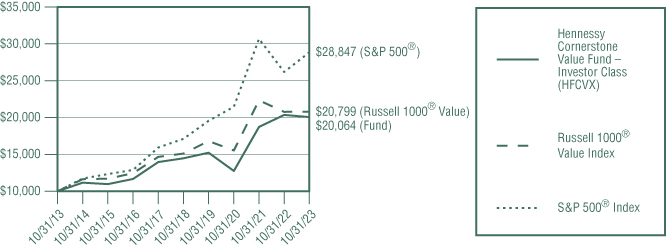
This graph illustrates the performance of an initial investment of $10,000 made in the Fund 10 years ago and assumes the reinvestment of dividends and capital gains.
AVERAGE ANNUAL TOTAL RETURN FOR PERIODS ENDED OCTOBER 31, 2023
|
One
|
Five
|
Ten
|
|
|
Year
|
Years
|
Years
|
|
|
Hennessy Cornerstone Value Fund –
|
|||
|
Investor Class (HFCVX)
|
-1.45%
|
6.75%
|
7.21%
|
|
Hennessy Cornerstone Value Fund –
|
|||
|
Institutional Class (HICVX)
|
-1.26%
|
6.96%
|
7.42%
|
|
Russell 1000® Value Index
|
0.13%
|
6.60%
|
7.60%
|
|
S&P 500® Index
|
10.14%
|
11.01%
|
11.18%
|
Expense ratios: 1.23% (Investor Class); 1.00% (Institutional Class)
Performance data quoted represents past performance; past performance does not guarantee future results. The investment return and principal value of an investment will fluctuate so that an
investor’s shares, when redeemed, may be worth more or less than their original cost. The performance table does not reflect the deduction of taxes that a shareholder would pay on Fund distributions or the redemption of Fund shares. Current
performance of the Fund may be lower or higher than the performance quoted. Performance data current to the most recent month end may be obtained by visiting www.hennessyfunds.com.
The Russell 1000® Value Index is a subset of the Russell 1000® Index that measures the performance of the large-cap value segment of the U.S. equity market. The Russell 1000® Value Index comprises those
companies in the Russell 1000® Index with relatively lower price-to-book ratios, lower forecasted growth value, and lower sales per share historical growth. The
S&P 500® Index is a capitalization-weighted index that is designed to represent the broad domestic economy through changes in the aggregate market value of
500 stocks across all major industries. One cannot invest directly in an index. These indices are used for comparative purposes in accordance with Securities and Exchange Commission regulations.
Frank Russell Company (“Russell”) is the source and owner of the trademarks, service marks, and copyrights related to the Russell Indexes. Russell® is a trademark of Frank Russell Company. Neither Russell nor its licensors accept any liability for any errors or omissions in the Russell Indexes or Russell ratings or underlying data and no party may
|
WWW.HENNESSYFUNDS.COM
|
6
|
PERFORMANCE OVERVIEW
|
rely on any Russell Indexes or Russell ratings or underlying data contained in this communication. No further distribution of Russell data is permitted without Russell’s express written consent. Russell does not
promote, sponsor, or endorse the content of this communication.
Standard & Poor’s Financial Services is the source and owner of the S&P® and S&P 500® trademarks.
The expense ratios presented are from the most recent prospectus. The expense ratios for the current reporting period are available in the Financial Highlights section of this report.
PERFORMANCE NARRATIVE
Portfolio Managers Neil J. Hennessy, Ryan C. Kelley, CFA, and L. Joshua Wein, CAIA
Performance:
For the one-year period ended October 31, 2023, the Investor Class of the Hennessy Cornerstone Value Fund returned -1.45%, underperforming both the Russell 1000® Value Index (the Fund’s primary benchmark) and the S&P 500® Index, which returned 0.13% and 10.14%, respectively, for the same
period.
The Fund’s underperformance relative to its primary benchmark resulted primarily from stock selection in the Health Care, Consumer Staples, and Industrials sectors. The largest detractors of
performance within each of these sectors during the period were Bristol-Myers Squibb Co., British American Tobacco PLC, and 3M Company. The largest contributors to performance during the period were investments in the Energy, Information
Technology, and Materials sectors. The largest contributors to performance within each of these sectors included Petroleo Brasileiro S.A., Cisco Systems, Inc., and Dow, Inc.
The Fund continues to own all the companies mentioned except 3M Company.
Portfolio Strategy:
The Fund utilizes a formula-based approach designed to result in a portfolio of potentially undervalued, profitable, large-cap companies with high dividend yields. In essence, the strategy seeks 50 established
companies that are generating sufficient cash flows to pay generous dividends but that may be overlooked by other investors.
Investment Commentary:
Notwithstanding a rebound in equity prices over the last twelve months, we believe that the outlook for U.S. stocks remains positive. We continue to believe that equities are attractive from a valuation standpoint,
even in the face of an expected slowdown in economic activity. While the Federal Reserve has raised interest rates several times throughout the last year, we believe that the prospect of slower economic growth and lower inflation numbers
could prompt the Federal Reserve to put any further rate hikes on hold. With the unemployment rate near record lows, high levels of cash on the balance sheets of U.S. companies, and the prospect of a more dovish Federal Reserve in 2024, we
remain bullish on equities long-term.
Sectors where the Fund currently maintains significant overweight positions include Energy, Financials, and Consumer Staples. Representative holdings within the Energy sector include Petroleo
Brasileiro, Canadian Natural Resources Ltd., and Equinor A.S.A. Financials exposure includes JP Morgan Chase & Co., Wells Fargo & Co., and HSBC Holdings PLC. Consumer Staples sector exposure includes Philip Morris International,
|
HENNESSY FUNDS
|
1-800-966-4354
|
7
Inc., Unilever, plc, and Colgate-Palmolive Co. Given the continued strength in employment trends and average hourly earnings, we would expect consumer spending and the economy to hold steady. We believe that the
Fund is well positioned given the potential for moderately slower economic growth.
_______________
Opinions expressed are those of the Portfolio Managers as of the date written and are subject to change, are not guaranteed, and should not be considered investment advice or an indication of trading intent.
The Fund may invest in medium-capitalization companies, which may have more limited liquidity and greater price volatility than larger companies. Investments in foreign securities may involve
political, economic, and currency risk, greater volatility, and differences in accounting methods. Funds concentrated in one or more industry sectors may be subject to a higher degree of market risk The Fund’s formula-based strategy may cause
the Fund to buy or sell securities at times when it may not be advantageous. Please see the Fund’s prospectus for a more complete discussion of these and other risks.
References to specific securities should not be considered a recommendation to buy or sell any security. Fund holdings and sector allocations are subject to change. Please refer to the Schedule of Investments
included in this report for additional portfolio information.
Cash flow refers to the net amount of cash and cash equivalents transferred into and out of a company.
|
WWW.HENNESSYFUNDS.COM
|
8
|
PERFORMANCE OVERVIEW/SCHEDULE OF INVESTMENTS
|
Financial Statements
|
Schedule of Investments as of October 31, 2023
|
HENNESSY CORNERSTONE VALUE FUND
(% of Net Assets)
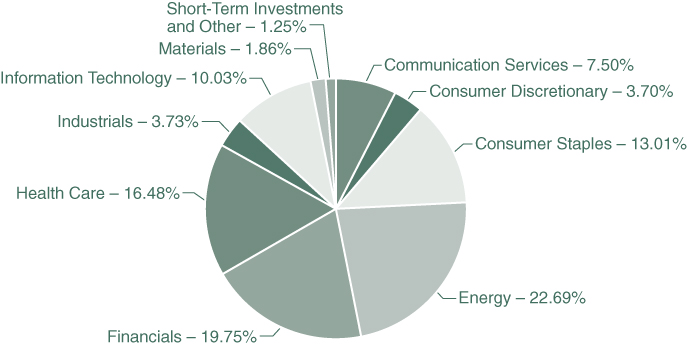
|
TOP TEN HOLDINGS (EXCLUDING MONEY MARKET FUNDS)
|
% NET ASSETS
|
|
Petroleo Brasileiro SA – ADR
|
3.09%
|
|
Canadian Natural Resources Ltd.
|
2.46%
|
|
Equinor ASA – ADR
|
2.42%
|
|
International Business Machines Corp.
|
2.33%
|
|
Shell PLC – ADR
|
2.32%
|
|
TotalEnergies SE – ADR
|
2.32%
|
|
Comcast Corp.
|
2.29%
|
|
Union Pacific Corp.
|
2.21%
|
|
MetLife, Inc.
|
2.20%
|
|
JPMorgan Chase & Co.
|
2.19%
|
Note: For presentation purposes, the Fund has grouped some of the industry categories. For purposes of categorizing securities for compliance with Section 8(b)(1) of the Investment Company Act of 1940, as amended,
the Fund uses more specific industry classifications.
The Global Industry Classification Standard (GICS®) was developed by and is the exclusive property and a service mark of MSCI, Inc.
and Standard & Poor’s Financial Services LLC. It has been licensed for use by the Hennessy Funds.
|
HENNESSY FUNDS
|
1-800-966-4354
|
9
|
COMMON STOCKS – 98.75%
|
Number
|
% of
|
||||||||||
|
|
of Shares
|
Value
|
Net Assets
|
|||||||||
|
Communication Services – 7.50%
|
||||||||||||
|
AT&T, Inc.
|
273,860
|
$
|
4,217,444
|
1.66
|
%
|
|||||||
|
BCE, Inc.
|
115,100
|
4,273,663
|
1.68
|
%
|
||||||||
|
Comcast Corp.
|
140,500
|
5,801,245
|
2.29
|
%
|
||||||||
|
Verizon Communications, Inc.
|
135,300
|
4,753,089
|
1.87
|
%
|
||||||||
|
|
19,045,441
|
7.50
|
%
|
|||||||||
|
Consumer Discretionary – 3.70%
|
||||||||||||
|
Ford Motor Co.
|
442,600
|
4,315,350
|
1.70
|
%
|
||||||||
|
The Home Depot, Inc.
|
17,800
|
5,067,482
|
2.00
|
%
|
||||||||
|
|
9,382,832
|
3.70
|
%
|
|||||||||
|
Consumer Staples – 13.01%
|
||||||||||||
|
Altria Group, Inc.
|
116,300
|
4,671,771
|
1.84
|
%
|
||||||||
|
British American Tobacco PLC – ADR
|
146,100
|
4,362,546
|
1.72
|
%
|
||||||||
|
Colgate-Palmolive Co.
|
70,400
|
5,288,448
|
2.08
|
%
|
||||||||
|
Philip Morris International, Inc.
|
56,000
|
4,992,960
|
1.97
|
%
|
||||||||
|
The Coca-Cola Co.
|
84,400
|
4,767,756
|
1.88
|
%
|
||||||||
|
The Kraft Heinz Co.
|
135,100
|
4,250,246
|
1.67
|
%
|
||||||||
|
Unilever PLC – ADR
|
99,200
|
4,697,120
|
1.85
|
%
|
||||||||
|
|
33,030,847
|
13.01
|
%
|
|||||||||
|
Energy – 22.69%
|
||||||||||||
|
BP PLC – ADR
|
138,600
|
5,069,988
|
2.00
|
%
|
||||||||
|
Canadian Natural Resources Ltd.
|
98,200
|
6,238,646
|
2.46
|
%
|
||||||||
|
Chevron Corp.
|
32,675
|
4,761,728
|
1.88
|
%
|
||||||||
|
Devon Energy Corp.
|
108,200
|
5,038,874
|
1.98
|
%
|
||||||||
|
Equinor ASA – ADR
|
184,100
|
6,143,417
|
2.42
|
%
|
||||||||
|
Exxon Mobil Corp.
|
48,910
|
5,177,123
|
2.04
|
%
|
||||||||
|
Petroleo Brasileiro SA – ADR
|
524,900
|
7,873,500
|
3.09
|
%
|
||||||||
|
Shell PLC – ADR
|
90,300
|
5,882,142
|
2.32
|
%
|
||||||||
|
Suncor Energy, Inc.
|
170,700
|
5,530,680
|
2.18
|
%
|
||||||||
|
TotalEnergies SE – ADR
|
88,600
|
5,900,760
|
2.32
|
%
|
||||||||
|
|
57,616,858
|
22.69
|
%
|
|||||||||
|
Financials – 19.75%
|
||||||||||||
|
Bank of America Corp.
|
187,400
|
4,936,116
|
1.94
|
%
|
||||||||
|
Citigroup, Inc.
|
116,300
|
4,592,687
|
1.81
|
%
|
||||||||
|
HSBC Holdings PLC – ADR
|
151,000
|
5,485,830
|
2.17
|
%
|
||||||||
The accompanying notes are an integral part of these financial statements.
|
WWW.HENNESSYFUNDS.COM
|
10
|
SCHEDULE OF INVESTMENTS
|
|
COMMON STOCKS
|
Number
|
% of
|
||||||||||
|
|
of Shares
|
Value
|
Net Assets
|
|||||||||
|
Financials (Continued)
|
||||||||||||
|
JPMorgan Chase & Co.
|
39,900
|
$
|
5,548,494
|
2.19
|
%
|
|||||||
|
Manulife Financial Corp.
|
284,800
|
4,961,216
|
1.95
|
%
|
||||||||
|
MetLife, Inc.
|
93,100
|
5,586,931
|
2.20
|
%
|
||||||||
|
Morgan Stanley
|
58,900
|
4,171,298
|
1.64
|
%
|
||||||||
|
Royal Bank of Canada
|
54,600
|
4,361,448
|
1.72
|
%
|
||||||||
|
Toronto-Dominion Bank
|
89,700
|
5,008,848
|
1.97
|
%
|
||||||||
|
Wells Fargo & Co.
|
138,100
|
5,492,237
|
2.16
|
%
|
||||||||
|
|
50,145,105
|
19.75
|
%
|
|||||||||
|
Health Care – 16.48%
|
||||||||||||
|
AbbVie, Inc.
|
32,500
|
4,588,350
|
1.81
|
%
|
||||||||
|
Bristol-Myers Squibb Co.
|
75,500
|
3,890,515
|
1.53
|
%
|
||||||||
|
CVS Health Corp.
|
69,800
|
4,816,898
|
1.90
|
%
|
||||||||
|
Gilead Sciences, Inc.
|
64,200
|
5,042,268
|
1.99
|
%
|
||||||||
|
GSK PLC – ADR
|
143,560
|
5,125,092
|
2.02
|
%
|
||||||||
|
Johnson & Johnson
|
33,400
|
4,954,556
|
1.95
|
%
|
||||||||
|
Medtronic PLC
|
65,200
|
4,600,512
|
1.81
|
%
|
||||||||
|
Merck & Co., Inc.
|
48,500
|
4,980,950
|
1.96
|
%
|
||||||||
|
Pfizer, Inc.
|
125,800
|
3,844,448
|
1.51
|
%
|
||||||||
|
|
41,843,589
|
16.48
|
%
|
|||||||||
|
Industrials – 3.73%
|
||||||||||||
|
Union Pacific Corp.
|
27,100
|
5,626,231
|
2.21
|
%
|
||||||||
|
United Parcel Service, Inc., Class B
|
27,300
|
3,856,125
|
1.52
|
%
|
||||||||
|
|
9,482,356
|
3.73
|
%
|
|||||||||
|
Information Technology – 10.03%
|
||||||||||||
|
Cisco Systems, Inc.
|
101,600
|
5,296,408
|
2.09
|
%
|
||||||||
|
Hewlett Packard Enterprise Co.
|
354,200
|
5,447,596
|
2.15
|
%
|
||||||||
|
HP, Inc.
|
182,300
|
4,799,959
|
1.89
|
%
|
||||||||
|
International Business Machines Corp.
|
41,000
|
5,930,240
|
2.33
|
%
|
||||||||
|
Texas Instruments, Inc.
|
28,000
|
3,976,280
|
1.57
|
%
|
||||||||
|
|
25,450,483
|
10.03
|
%
|
|||||||||
|
Materials – 1.86%
|
||||||||||||
|
Dow, Inc.
|
97,900
|
4,732,486
|
1.86
|
%
|
||||||||
|
|
||||||||||||
|
Total Common Stocks
|
||||||||||||
|
(Cost $233,921,521)
|
250,729,997
|
98.75
|
%
|
|||||||||
The accompanying notes are an integral part of these financial statements.
|
HENNESSY FUNDS
|
1-800-966-4354
|
11
|
SHORT-TERM INVESTMENTS – 0.94%
|
Number
|
% of
|
||||||||||
|
|
of Shares
|
Value
|
Net Assets
|
|||||||||
|
Money Market Funds – 0.94%
|
||||||||||||
|
First American Treasury Obligations Fund – Class X, 5.275% (a)
|
2,379,919
|
$
|
2,379,919
|
0.94
|
%
|
|||||||
|
|
||||||||||||
|
Total Short-Term Investments
|
||||||||||||
|
(Cost $2,379,919)
|
2,379,919
|
0.94
|
%
|
|||||||||
|
|
||||||||||||
|
Total Investments
|
||||||||||||
|
(Cost $236,301,440) – 99.69%
|
253,109,916
|
99.69
|
%
|
|||||||||
|
Other Assets in Excess of Liabilities - 0.31%
|
789,007
|
0.31
|
%
|
|||||||||
|
|
||||||||||||
|
TOTAL NET ASSETS — 100.00%
|
$
|
253,898,923
|
100.00
|
%
|
||||||||
Percentages are stated as a percent of net assets.
ADR — American Depositary Receipt
PLC — Public Limited Company
|
(a)
|
The rate listed is the fund’s seven-day yield as of October 31, 2023.
|
Summary of Fair Value Exposure as of October 31, 2023
The following is a summary of the inputs used to value the Fund’s net assets as of October 31, 2023 (see Note 3 in the accompanying Notes to the Financial Statements):
|
Common Stocks
|
Level 1
|
Level 2
|
Level 3
|
Total
|
||||||||||||
|
Communication Services
|
$
|
19,045,441
|
$
|
—
|
$
|
—
|
$
|
19,045,441
|
||||||||
|
Consumer Discretionary
|
9,382,832
|
—
|
—
|
9,382,832
|
||||||||||||
|
Consumer Staples
|
33,030,847
|
—
|
—
|
33,030,847
|
||||||||||||
|
Energy
|
57,616,858
|
—
|
—
|
57,616,858
|
||||||||||||
|
Financials
|
50,145,105
|
—
|
—
|
50,145,105
|
||||||||||||
|
Health Care
|
41,843,589
|
—
|
—
|
41,843,589
|
||||||||||||
|
Industrials
|
9,482,356
|
—
|
—
|
9,482,356
|
||||||||||||
|
Information Technology
|
25,450,483
|
—
|
—
|
25,450,483
|
||||||||||||
|
Materials
|
4,732,486
|
—
|
—
|
4,732,486
|
||||||||||||
|
Total Common Stocks
|
$
|
250,729,997
|
$
|
—
|
$
|
—
|
$
|
250,729,997
|
||||||||
|
Short-Term Investments
|
||||||||||||||||
|
Money Market Funds
|
$
|
2,379,919
|
$
|
—
|
$
|
—
|
$
|
2,379,919
|
||||||||
|
Total Short-Term Investments
|
$
|
2,379,919
|
$
|
—
|
$
|
—
|
$
|
2,379,919
|
||||||||
|
Total Investments
|
$
|
253,109,916
|
$
|
—
|
$
|
—
|
$
|
253,109,916
|
||||||||
The accompanying notes are an integral part of these financial statements.
|
WWW.HENNESSYFUNDS.COM
|
12
|
SCHEDULE OF INVESTMENTS/STATEMENT OF ASSETS AND LIABILITIES
|
Financial Statements
|
Statement of Assets and Liabilities as of October 31, 2023
|
|
ASSETS:
|
||||
|
Investments in securities, at value (cost $236,301,440)
|
$
|
253,109,916
|
||
|
Dividends and interest receivable
|
1,006,869
|
|||
|
Dividend tax reclaim receivable
|
94,933
|
|||
|
Receivable for fund shares sold
|
6,220
|
|||
|
Prepaid expenses and other assets
|
34,786
|
|||
|
Total assets
|
254,252,724
|
|||
|
LIABILITIES:
|
||||
|
Payable for fund shares redeemed
|
42,148
|
|||
|
Payable to advisor
|
163,522
|
|||
|
Payable to administrator
|
42,961
|
|||
|
Payable to auditor
|
22,746
|
|||
|
Accrued distribution fees
|
38,601
|
|||
|
Accrued service fees
|
21,439
|
|||
|
Accrued trustees fees
|
7,973
|
|||
|
Accrued expenses and other payables
|
14,411
|
|||
|
Total liabilities
|
353,801
|
|||
|
NET ASSETS
|
$
|
253,898,923
|
||
|
NET ASSETS CONSIST OF:
|
||||
|
Capital stock
|
$
|
234,402,207
|
||
|
Total distributable earnings
|
19,496,716
|
|||
|
Total net assets
|
$
|
253,898,923
|
||
|
NET ASSETS:
|
||||
|
Investor Class
|
||||
|
Shares authorized (no par value)
|
Unlimited
|
|||
|
Net assets applicable to outstanding shares
|
$
|
246,397,258
|
||
|
Shares issued and outstanding
|
13,579,698
|
|||
|
Net asset value, offering price, and redemption price per share
|
$
|
18.14
|
||
|
Institutional Class
|
||||
|
Shares authorized (no par value)
|
Unlimited
|
|||
|
Net assets applicable to outstanding shares
|
$
|
7,501,665
|
||
|
Shares issued and outstanding
|
412,807
|
|||
|
Net asset value, offering price, and redemption price per share
|
$
|
18.17
|
||
The accompanying notes are an integral part of these financial statements.
|
HENNESSY FUNDS
|
1-800-966-4354
|
13
Financial Statements
|
Statement of Operations for the year ended October 31, 2023
|
|
INVESTMENT INCOME:
|
||||
|
Dividend income(1)
|
$
|
12,744,731
|
||
|
Interest income
|
169,355
|
|||
|
Total investment income
|
12,914,086
|
|||
|
EXPENSES:
|
||||
|
Investment advisory fees (See Note 5)
|
2,108,250
|
|||
|
Distribution fees – Investor Class (See Note 5)
|
403,515
|
|||
|
Administration, accounting, custody, and transfer agent fees (See Note 5)
|
270,200
|
|||
|
Service fees – Investor Class (See Note 5)
|
269,010
|
|||
|
Sub-transfer agent expenses – Investor Class (See Note 5)
|
198,023
|
|||
|
Sub-transfer agent expenses – Institutional Class (See Note 5)
|
25,065
|
|||
|
Federal and state registration fees
|
36,312
|
|||
|
Trustees’ fees and expenses
|
24,818
|
|||
|
Audit fees
|
22,747
|
|||
|
Compliance expense (See Note 5)
|
22,678
|
|||
|
Reports to shareholders
|
19,207
|
|||
|
Legal fees
|
6,747
|
|||
|
Interest expense (See Note 7)
|
5,266
|
|||
|
Other expenses
|
54,078
|
|||
|
Total expenses
|
3,465,916
|
|||
|
NET INVESTMENT INCOME
|
$
|
9,448,170
|
||
|
REALIZED AND UNREALIZED GAINS (LOSSES):
|
||||
|
Net realized loss on investments
|
$
|
(3,834,975
|
)
|
|
|
Net change in unrealized appreciation/depreciation on investments
|
(8,473,514
|
)
|
||
|
Net loss on investments
|
(12,308,489
|
)
|
||
|
NET DECREASE IN NET ASSETS RESULTING FROM OPERATIONS
|
$
|
(2,860,319
|
)
|
|
|
(1)
|
Net of foreign taxes withheld and issuance fees of $458,525.
|
The accompanying notes are an integral part of these financial statements.
|
WWW.HENNESSYFUNDS.COM
|
14
|
STATEMENT OF OPERATIONS/STATEMENTS OF CHANGES IN NET ASSETS
|
Financial Statements
|
Statements of Changes in Net Assets
|
|
Year Ended
|
Year Ended
|
|||||||
|
October 31, 2023
|
October 31, 2022
|
|||||||
|
OPERATIONS:
|
||||||||
|
Net investment income
|
$
|
9,448,170
|
$
|
7,863,624
|
||||
|
Net realized gain (loss) on investments
|
(3,834,975
|
)
|
22,098,599
|
|||||
|
Net change in unrealized
|
||||||||
|
appreciation/depreciation on investments
|
(8,473,514
|
)
|
(8,218,181
|
)
|
||||
|
Net increase (decrease) in net assets
|
||||||||
|
resulting from operations
|
(2,860,319
|
)
|
21,744,042
|
|||||
|
DISTRIBUTIONS TO SHAREHOLDERS:
|
||||||||
|
Distributable earnings – Investor Class
|
(26,252,846
|
)
|
(12,280,194
|
)
|
||||
|
Distributable earnings – Institutional Class
|
(2,313,856
|
)
|
(284,427
|
)
|
||||
|
Total distributions
|
(28,566,702
|
)
|
(12,564,621
|
)
|
||||
|
CAPITAL SHARE TRANSACTIONS:
|
||||||||
|
Proceeds from shares subscribed – Investor Class
|
11,286,745
|
14,142,871
|
||||||
|
Proceeds from shares subscribed – Institutional Class
|
6,698,572
|
29,565,728
|
||||||
|
Dividends reinvested – Investor Class
|
24,939,854
|
11,605,966
|
||||||
|
Dividends reinvested – Institutional Class
|
2,247,245
|
250,047
|
||||||
|
Cost of shares redeemed – Investor Class
|
(29,291,239
|
)
|
(20,443,989
|
)
|
||||
|
Cost of shares redeemed – Institutional Class
|
(23,714,925
|
)
|
(10,861,538
|
)
|
||||
|
Net increase (decrease) in net assets derived
|
||||||||
|
from capital share transactions
|
(7,833,748
|
)
|
24,259,085
|
|||||
|
TOTAL INCREASE (DECREASE) IN NET ASSETS
|
(39,260,769
|
)
|
33,438,506
|
|||||
|
NET ASSETS:
|
||||||||
|
Beginning of year
|
293,159,692
|
259,721,186
|
||||||
|
End of year
|
$
|
253,898,923
|
$
|
293,159,692
|
||||
|
CHANGES IN SHARES OUTSTANDING:
|
||||||||
|
Shares sold – Investor Class
|
577,984
|
699,608
|
||||||
|
Shares sold – Institutional Class
|
332,692
|
1,444,370
|
||||||
|
Shares issued to holders as reinvestment
|
||||||||
|
of dividends – Investor Class
|
1,290,673
|
593,352
|
||||||
|
Shares issued to holders as reinvestment
|
||||||||
|
of dividends – Institutional Class
|
116,262
|
12,768
|
||||||
|
Shares redeemed – Investor Class
|
(1,532,736
|
)
|
(1,029,071
|
)
|
||||
|
Shares redeemed – Institutional Class
|
(1,233,563
|
)
|
(539,739
|
)
|
||||
|
Net increase (decrease) in shares outstanding
|
(448,688
|
)
|
1,181,288
|
|||||
The accompanying notes are an integral part of these financial statements.
|
HENNESSY FUNDS
|
1-800-966-4354
|
15
Financial Statements
|
Financial Highlights
|
For an Investor Class share outstanding throughout each year
PER SHARE DATA:
Net asset value, beginning of year
Income from investment operations:
Net investment income(1)
Net realized and unrealized gains (losses) on investments
Total from investment operations
Less distributions:
Dividends from net investment income
Dividends from net realized gains
Total distributions
Net asset value, end of year
TOTAL RETURN
SUPPLEMENTAL DATA AND RATIOS:
Net assets, end of year (millions)
Ratio of expenses to average net assets
Ratio of net investment income to average net assets
Portfolio turnover rate(2)
|
(1)
|
Calculated using the average shares outstanding method.
|
|
(2)
|
Calculated on the basis of the Fund as a whole.
|
The accompanying notes are an integral part of these financial statements.
|
WWW.HENNESSYFUNDS.COM
|
16
|
FINANCIAL HIGHLIGHTS — INVESTOR CLASS
|
|
Year Ended October 31,
|
||||||||||||||||||
|
2023
|
2022
|
2021
|
2020
|
2019
|
||||||||||||||
|
$
|
20.30
|
$
|
19.59
|
$
|
13.69
|
$
|
17.43
|
$
|
19.29
|
|||||||||
|
0.63
|
0.55
|
0.44
|
0.41
|
0.47
|
||||||||||||||
|
(0.84
|
)
|
1.10
|
5.87
|
(3.01
|
)
|
0.30
|
||||||||||||
|
(0.21
|
)
|
1.65
|
6.31
|
(2.60
|
)
|
0.77
|
||||||||||||
|
(0.50
|
)
|
(0.51
|
)
|
(0.41
|
)
|
(0.47
|
)
|
(0.41
|
)
|
|||||||||
|
(1.45
|
)
|
(0.43
|
)
|
—
|
(0.67
|
)
|
(2.22
|
)
|
||||||||||
|
(1.95
|
)
|
(0.94
|
)
|
(0.41
|
)
|
(1.14
|
)
|
(2.63
|
)
|
|||||||||
|
$
|
18.14
|
$
|
20.30
|
$
|
19.59
|
$
|
13.69
|
$
|
17.43
|
|||||||||
|
-1.45
|
%
|
8.68
|
%
|
46.82
|
%
|
-16.22
|
%
|
5.22
|
%
|
|||||||||
|
$
|
246.40
|
$
|
268.81
|
$
|
254.23
|
$
|
189.60
|
$
|
253.95
|
|||||||||
|
1.23
|
%
|
1.23
|
%
|
1.23
|
%
|
1.30
|
%
|
1.23
|
%
|
|||||||||
|
3.31
|
%
|
2.74
|
%
|
2.43
|
%
|
2.71
|
%
|
2.75
|
%
|
|||||||||
|
31
|
%
|
36
|
%
|
41
|
%
|
32
|
%
|
27
|
%
|
|||||||||
The accompanying notes are an integral part of these financial statements.
|
HENNESSY FUNDS
|
1-800-966-4354
|
17
Financial Statements
|
Financial Highlights
|
For an Institutional Class share outstanding throughout each year
PER SHARE DATA:
Net asset value, beginning of year
Income from investment operations:
Net investment income(1)
Net realized and unrealized gains (losses) on investments
Total from investment operations
Less distributions:
Dividends from net investment income
Dividends from net realized gains
Total distributions
Net asset value, end of year
TOTAL RETURN
SUPPLEMENTAL DATA AND RATIOS:
Net assets, end of year (millions)
Ratio of expenses to average net assets:
Ratio of net investment income to average net assets:
Portfolio turnover rate(2)
|
(1)
|
Calculated using the average shares outstanding method.
|
|
(2)
|
Calculated on the basis of the Fund as a whole.
|
The accompanying notes are an integral part of these financial statements.
|
WWW.HENNESSYFUNDS.COM
|
18
|
FINANCIAL HIGHLIGHTS — INSTITUTIONAL CLASS
|
|
Year Ended October 31,
|
||||||||||||||||||
|
2023
|
2022
|
2021
|
2020
|
2019
|
||||||||||||||
|
$
|
20.34
|
$
|
19.63
|
$
|
13.71
|
$
|
17.45
|
$
|
19.33
|
|||||||||
|
0.67
|
0.58
|
0.48
|
0.44
|
0.50
|
||||||||||||||
|
(0.84
|
)
|
1.12
|
5.88
|
(3.01
|
)
|
0.29
|
||||||||||||
|
(0.17
|
)
|
1.70
|
6.36
|
(2.57
|
)
|
0.79
|
||||||||||||
|
(0.55
|
)
|
(0.56
|
)
|
(0.44
|
)
|
(0.49
|
)
|
(0.45
|
)
|
|||||||||
|
(1.45
|
)
|
(0.43
|
)
|
—
|
(0.68
|
)
|
(2.22
|
)
|
||||||||||
|
(2.00
|
)
|
(0.99
|
)
|
(0.44
|
)
|
(1.17
|
)
|
(2.67
|
)
|
|||||||||
|
$
|
18.17
|
$
|
20.34
|
$
|
19.63
|
$
|
13.71
|
$
|
17.45
|
|||||||||
|
-1.26
|
%
|
8.92
|
%
|
47.19
|
%
|
-16.06
|
%
|
5.37
|
%
|
|||||||||
|
$
|
7.50
|
$
|
24.35
|
$
|
5.50
|
$
|
4.29
|
$
|
6.44
|
|||||||||
|
1.06
|
%
|
1.00
|
%
|
0.99
|
%
|
1.08
|
%
|
1.08
|
%
|
|||||||||
|
3.48
|
%
|
2.92
|
%
|
2.67
|
%
|
2.94
|
%
|
2.92
|
%
|
|||||||||
|
31
|
%
|
36
|
%
|
41
|
%
|
32
|
%
|
27
|
%
|
|||||||||
The accompanying notes are an integral part of these financial statements.
|
HENNESSY FUNDS
|
1-800-966-4354
|
19
Financial Statements
|
Notes to the Financial Statements October 31, 2023
|
1). ORGANIZATION
The Hennessy Cornerstone Value Fund (the “Fund”) is a series of Hennessy Funds Trust (the “Trust”), which was organized as a Delaware statutory trust on September 17, 1992. The Fund is an open-end management
investment company registered under the Investment Company Act of 1940, as amended. The investment objective of the Fund is total return, consisting of capital appreciation and current income. The Fund is a diversified fund.
The Fund offers Investor Class and Institutional Class shares. Each class of shares differs principally in its respective 12b-1 distribution and service, shareholder servicing, and sub-transfer
agent expenses. There are no sales charges. Each class has identical rights to earnings, assets, and voting privileges, except for class-specific expenses and exclusive rights to vote on matters affecting only one class.
As an investment company, the Fund follows the investment company accounting and reporting guidance of the Financial Accounting Standards Board (the “FASB”) Accounting Standard Codification Topic
946 “Financial Services—Investment Companies.”
2). SIGNIFICANT ACCOUNTING POLICIES
The following is a summary of significant accounting policies consistently followed by the Fund in the preparation of the financial statements. These policies conform to U.S. generally accepted accounting principles
(“GAAP”).
|
a).
|
Securities Valuation – All investments in securities are valued in accordance with the Fund’s valuation policies and procedures, as described in Note 3.
|
|
b).
|
Federal Income Taxes – The Fund has elected to be taxed as a regulated investment company and intends to distribute substantially all of its taxable income to its shareholders and otherwise comply with the
provisions of the Internal Revenue Code of 1986, as amended, applicable to regulated investment companies. As a result, the Fund has made no provision for federal income taxes or excise taxes. Net investment income/loss and realized
gains/losses for federal income tax purposes may differ from those reported in the financial statements because of temporary book-basis and tax-basis differences. Temporary differences are primarily the result of the treatment of wash
sales for tax reporting purposes. The Fund recognizes interest and penalties related to income tax benefits, if any, in the Statement of Operations as an income tax expense. Distributions from net realized gains for book purposes may
include short-term capital gains, which are included as ordinary income to shareholders for tax purposes. The Fund may utilize equalization accounting for tax purposes and designate earnings and profits, including net realized gains
distributed to shareholders on redemption of shares, as part of the dividends paid deduction for income tax purposes.
|
|
Due to inherent differences in the recognition of income, expenses, and realized gains/losses under GAAP and federal income tax
regulations, permanent differences between book and tax basis for reporting are identified and appropriately reclassified
|
|
WWW.HENNESSYFUNDS.COM
|
20
|
NOTES TO THE FINANCIAL STATEMENTS
|
|
in the Statement of Assets and Liabilities, as needed. As of October 31, 2023, no such reclassifications were required for fiscal year 2023.
|
|
|
c).
|
Accounting for Uncertainty in Income Taxes – The Fund has accounting policies regarding recognition and measurement of tax positions taken or expected to be taken on a tax return. The tax returns of the Fund
for the prior three fiscal years are open for examination. The Fund has reviewed all open tax years in major tax jurisdictions and concluded that there is no impact on the Fund’s net assets and no tax liability resulting from
unrecognized tax benefits relating to uncertain income tax positions taken or expected to be taken on a tax return. The Fund’s major tax jurisdictions are U.S. federal and Delaware.
|
|
d).
|
Income and Expenses – Dividend income is recognized on the ex-dividend date or as soon as information is available to the Fund. Interest income, which includes the amortization of premium and accretion of
discount, is recognized on an accrual basis. Market discounts, original issue discounts, and market premiums on debt securities are accreted or amortized to interest income over the life of a security with a corresponding increase or
decrease, as applicable, in the cost basis of such security using the yield-to-maturity method or, where applicable, the first call date of the security. Other non-cash dividends are recognized as investment income at the fair value
of the property received. The Fund is charged for those expenses that are directly attributable to its portfolio, such as advisory, administration, and certain shareholder service fees. Income, expenses (other than expenses
attributable to a specific class), and realized and unrealized gains/losses on investments are allocated to each class of shares based on such class’s net assets.
|
|
e).
|
Distributions to Shareholders – Dividends from net investment income for the Fund, if any, are declared and paid annually, usually in December. Distributions of net realized capital gains, if any, are
declared and paid annually, usually in December.
|
|
f).
|
Security Transactions – Investment and shareholder transactions are recorded on the trade date. The Fund determines the realized gain/loss from an investment transaction by comparing the original cost of the
security lot sold with the net sale proceeds. Discounts and premiums on securities purchased are accreted or amortized, respectively, over the life of each such security.
|
|
g).
|
Use of Estimates – Preparing financial statements in accordance with GAAP requires management to make estimates and assumptions that affect the reported amounts of assets and liabilities and disclosure of
contingent assets and liabilities at the date of the financial statements, as well as the reported change in net assets during the reporting period. Actual results could differ from those estimates.
|
|
h).
|
Share Valuation – The net asset value (“NAV”) per share of the Fund is calculated by dividing (i) the total value of the securities held by the Fund, plus cash and other assets, minus all liabilities
(including estimated accrued expenses) by (ii) the total number of Fund shares outstanding, rounded to the nearest $0.01. Fund shares are not priced on days the New York Stock Exchange is closed for trading. The offering and
redemption price per share for the Fund is equal to the Fund’s NAV per share.
|
|
i).
|
Illiquid Securities – Pursuant to Rule 22e-4 under the 1940 Act, the Fund has adopted a Liquidity Risk Management Program (the “Liquidity Program”). The Liquidity Program requires, among other things, that
the Fund limit its illiquid investments to no more than 15% of its net assets. An illiquid investment is any investment that the Fund reasonably expects cannot be sold or disposed of by the Fund in current market conditions in seven
calendar days or less without the sale or disposition significantly changing the market value of the investment.
|
|
HENNESSY FUNDS
|
1-800-966-4354
|
21
|
j).
|
Recent Accounting Pronouncements and Regulatory Updates – In October 2022, the Securities and Exchange Commission (“SEC”) adopted a final rule relating to Tailored Shareholder Reports for Mutual Funds and
Exchange-Traded Funds (ETFs); Fee Information in Investment Company Advertisements. The rule and form amendments will require mutual funds and ETFs to transmit concise and visually engaging shareholder reports that highlight key
information. The amendments also will require that funds tag information in a structured data format. In addition, the rule amendments will require that certain more in-depth information be made available online and available for
delivery free of charge to investors on request. The amendments became effective January 24, 2023. There is an 18-month transition period after the effective date of the amendment.
|
|
In June 2022, the FASB issued Accounting Standards Update (“ASU”) 2022-03, Fair Value Measurement (Topic 820): Fair Value Measurement of
Equity Securities Subject to Contractual Sale Restrictions. The ASU clarifies that a contractual restriction on the sale of an equity security is not considered part of the unit of account of the equity security and, therefore, is not
considered in measuring the fair value. The amendments also require additional disclosures related to equity securities subject to contractual sale restrictions. The ASU is effective for fiscal years beginning after December 15, 2023,
and interim periods within those fiscal years.
|
3). SECURITIES VALUATION
The Fund follows its valuation policies and procedures in determining its NAV and, in preparing these financial statements, the fair value accounting standards that establish an authoritative definition of fair
value and set out a hierarchy for measuring fair value. These standards require additional disclosures about the various inputs and valuation techniques used to develop the measurements of fair value and a discussion of changes in valuation
techniques and related inputs during the period. These inputs are summarized in the three broad levels listed below:
|
Level 1 –
|
Unadjusted, quoted prices in active markets for identical instruments that the Fund has the ability to access at the date of measurement.
|
|
|
Level 2 –
|
Other significant observable inputs other than quoted prices included in Level 1 (including, but not limited to, quoted prices in active markets for similar instruments, quoted prices in markets that are not
active for identical or similar instruments, and model-derived valuations in which all significant inputs and significant value drivers are observable in active markets, such as interest rates, prepayment speeds, credit risk curves,
default rates, and similar data).
|
|
|
Level 3 –
|
Significant unobservable inputs (including the Fund’s own assumptions about what market participants would use to price the asset or liability based on the best available information) when observable inputs
are unavailable.
|
The following is a description of the valuation techniques applied to the Fund’s major categories of assets and liabilities on a recurring basis:
|
Equity Securities – Equity securities, including common stocks, preferred stocks, foreign-issued common stocks,
exchange-traded funds, closed-end mutual funds, partnerships, rights, and real estate investment trusts, that are traded on a securities exchange for which a last-quoted sales price is readily available generally are valued
|
|
WWW.HENNESSYFUNDS.COM
|
22
|
NOTES TO THE FINANCIAL STATEMENTS
|
|
at the last sales price as reported by the primary exchange on which the securities are listed. Securities listed on The Nasdaq Stock Market (“Nasdaq”)
generally are valued at the Nasdaq Official Closing Price, which may differ from the last sales price reported. Securities traded on a securities exchange for which a last-quoted sales price is not readily available generally are
valued at the mean between the bid and ask prices. To the extent these securities are actively traded and valuation adjustments are not applied, they are classified in Level 1 of the fair value hierarchy. Securities traded on
foreign exchanges generally are not valued at the same time the Fund calculates its NAV because most foreign markets close well before such time. The earlier close of most foreign markets gives rise to the possibility that
significant events, including broad market moves, may have occurred in the interim. In certain circumstances, it may be determined that a foreign security needs to be fair valued because it appears that the value of the security
might have been materially affected by events occurring after the close of the market in which the security is principally traded, but before the time the Fund calculates its NAV, such as by a development that affects an entire
market or region (e.g., a weather-related event) or a potentially global development (e.g., a terrorist attack that may be expected to have an effect on investor expectations worldwide).
|
|
Registered Investment Companies – Investments in open-end registered investment companies, commonly referred to
as mutual funds, generally are priced at the ending NAV provided by the applicable mutual fund’s service agent and are classified in Level 1 of the fair value hierarchy.
|
|
Debt Securities – Debt securities, including corporate bonds, asset-backed securities, mortgage-backed
securities, municipal bonds, U.S. Treasuries, and U.S. government agency issues, are generally valued at market on the basis of valuations furnished by an independent pricing service that utilizes both dealer-supplied valuations and
formula-based techniques. The pricing service may consider recently executed transactions in securities of the issuer or comparable issuers, market price quotations (where observable), bond spreads, and fundamental data relating to
the issuer. In addition, the model may incorporate observable market data, such as reported sales of similar securities, broker quotes, yields, bids, offers, and reference data. Certain securities are valued primarily using dealer
quotations. These securities are generally classified in Level 2 of the fair value hierarchy.
|
|
Short-Term Securities – Short-term equity investments, including money market funds, are valued in the manner
specified above for equity securities. Short-term debt investments with an original term to maturity of 60 days or less are valued at amortized cost, which approximates fair market value. If the original term to maturity of a
short-term debt investment exceeds 60 days, then the values as of the 61st day prior to maturity are amortized. Amortized cost is not used if its use would be inappropriate due to credit or other impairments of the issuer, in which
case the security’s fair value would be determined as described below. Short-term securities are generally classified in Level 1 or Level 2 of the fair value hierarchy depending on the inputs used and market activity levels for
specific securities.
|
If market quotations are not readily available or if a significant event has occurred that indicates the closing price of a security no longer represents the true value of that security, any
security or other asset will be valued at its fair value in accordance with Rule 2a-5 under the 1940 Act. The Board of Trustees of the Fund (the “Board”) has designated Hennessy Advisor, Inc. (the “Advisor”) as the Fund’s valuation designee
to make all fair value determinations with respect to the Fund’s portfolio investments under the Fund’s fair value pricing procedures, subject to the Board’s oversight. There are numerous criteria considered in determining a fair value of a
security, such as the trading volume of a
|
HENNESSY FUNDS
|
1-800-966-4354
|
23
security and markets, the values of other similar securities, and news events with direct bearing on a security or markets. Fair value pricing results in an estimated price for a security that reflects the amount
the Fund might reasonably expect to receive in a current sale. Depending on the relative significance of the valuation inputs, these securities may be classified in either Level 2 or Level 3 of the fair value hierarchy. The Advisor will
regularly evaluate whether the Fund’s fair value pricing procedures continue to be appropriate in light of the specific circumstances of the Fund and the quality of prices obtained through their application of such procedures.
The fair value of foreign securities may be determined with the assistance of a pricing service using correlations between the movement of prices of such securities and indices of domestic
securities and other appropriate indicators, such as closing market prices of relevant American Depositary Receipts or futures contracts. Using fair value pricing means that the Fund’s NAV reflects the affected portfolio securities’ values as
determined by the Advisor, the Board’s valuation designee, pursuant to the Fund’s fair value pricing procedures, instead of being determined by the market. Using a fair value pricing methodology to price a foreign security may result in a
value that is different from such foreign security’s most recent closing price and from the value used by other investment companies to calculate their NAVs. Such securities are generally classified in Level 2 of the fair value hierarchy.
Because the Fund may invest in foreign securities, the value of the Fund’s portfolio securities may change on days when a shareholder is unable to purchase or redeem Fund shares.
The Fund has performed an analysis of all existing investments to determine the significance and character of all inputs to their fair value determinations. Various inputs are used to determine
the value of the Fund’s investments. The inputs or methodology used for valuing securities are not necessarily an indication of the risk associated with investing in those securities. Details related to the fair value hierarchy of the Fund’s
securities as of October 31, 2023, are included in the Schedule of Investments.
4). INVESTMENT TRANSACTIONS
Purchases and sales of investment securities (excluding government and short-term investments) for the Fund during fiscal year 2023 were $86,408,354 and $112,150,260, respectively.
There were no purchases or sales/maturities of long-term U.S. government securities for the Fund during fiscal year 2023.
5). INVESTMENT ADVISORY FEE AND OTHER TRANSACTIONS WITH AFFILIATES
The Advisor provides the Fund with investment advisory services under an Investment Advisory Agreement. The Advisor furnishes all investment advice, office space, and facilities and most of the personnel needed by
the Fund. As compensation for its services, the Advisor is entitled to a monthly fee from the Fund. The fee is based on the average daily net assets of the Fund at an annual rate of 0.74%. The net investment advisory fees expensed by the Fund
during fiscal year 2023 are included in the Statement of Operations.
The Board has approved a Shareholder Servicing Agreement for Investor Class shares of the Fund, which compensates the Advisor for the non-investment advisory services it provides to the Fund. The
Shareholder Servicing Agreement provides for a monthly fee paid to the Advisor at an annual rate of 0.10% of the average daily net assets of the Fund attributable to Investor Class shares. The shareholder service fees expensed by the Fund
during fiscal year 2023 are included in the Statement of Operations.
|
WWW.HENNESSYFUNDS.COM
|
24
|
NOTES TO THE FINANCIAL STATEMENTS
|
The Fund has adopted a plan pursuant to Rule 12b-1 under the Investment Company Act of 1940, as amended, that authorizes payments in connection with the distribution of Fund shares at an annual
rate of up to 0.25% of the Fund’s average daily net assets attributable to Investor Class shares. Even though the authorized rate is up to 0.25%, the Fund is currently only using up to 0.15% of its average daily net assets attributable to
Investor Class shares for such purpose. Amounts paid under the plan may be spent on any activities or expenses primarily intended to result in the sale of shares, including, but not limited to, advertising, shareholder account servicing,
printing and mailing of prospectuses to other than current shareholders, printing and mailing of sales literature, and compensation for sales and marketing activities or to financial institutions and others, such as dealers and distributors.
The distribution fees expensed by the Fund during fiscal year 2023 are included in the Statement of Operations.
The Fund has entered into agreements with various brokers, dealers, and financial intermediaries in connection with the sale of Fund shares. The agreements provide for periodic payments of
sub-transfer agent expenses by the Fund to the brokers, dealers, and financial intermediaries for providing certain shareholder maintenance services. These shareholder services include the pre-processing and quality control of new accounts,
shareholder correspondence, answering customer inquiries regarding account status, and facilitating shareholder telephone transactions. The sub-transfer agent fees expensed by the Fund during fiscal year 2023 are included in the Statement of
Operations.
U.S. Bancorp Fund Services, LLC, d/b/a U.S. Bank Global Fund Services (“Fund Services”) provides the Fund with administrative, accounting, and transfer agent services. As administrator, Fund
Services is responsible for activities such as (i) preparing various federal and state regulatory filings, reports, and returns for the Fund, (ii) preparing reports and materials to be supplied to the Board, (iii) monitoring the activities of
the Fund’s custodian, transfer agent, and accountants, and (iv) coordinating the preparation and payment of the Fund’s expenses and reviewing the Fund’s expense accruals. U.S. Bank N.A., an affiliate of Fund Services, serves as the Fund’s
custodian. The servicing agreements between the Trust, Fund Services, and U.S. Bank N.A. contain a fee schedule that is inclusive of administrative, accounting, custody, and transfer agent fees. The administrative, accounting, custody, and
transfer agent fees expensed by the Fund during fiscal year 2023 are included in the Statement of Operations.
Quasar Distributors, LLC, a wholly owned broker-dealer subsidiary of Foreside Financial Group, LLC, acts as the Fund’s principal underwriter in a continuous public offering of Fund shares.
The officers of the Fund are affiliated with the Advisor. With the exception of the Chief Compliance Officer, such officers receive no compensation from the Fund for serving in their respective
roles. The Fund, along with the other funds in the Hennessy Funds family (collectively, the “Hennessy Funds”), makes reimbursement payments on an equal basis to the Advisor for a portion of the salary and benefits associated with the office
of the Chief Compliance Officer. The compliance fees expensed by the Fund during fiscal year 2023 for reimbursement payments to the Advisor are included in the Statement of Operations.
|
HENNESSY FUNDS
|
1-800-966-4354
|
25
6). GUARANTEES AND INDEMNIFICATIONS
Under the Hennessy Funds’ organizational documents, their officers and trustees are indemnified by the Hennessy Funds against certain liabilities arising out of the performance of their duties to the Hennessy Funds.
Additionally, in the normal course of business, the Hennessy Funds enter into contracts with service providers that contain general indemnification clauses. The Fund’s maximum exposure under these arrangements is unknown as this would involve
future claims that may be made against the Fund that have not yet occurred. Currently, the Fund expects the risk of loss to be remote.
7). LINE OF CREDIT
The Fund has an uncommitted line of credit with the other Hennessy Funds in the amount of the lesser of (i) $100,000,000 or (ii) 33.33% of each Hennessy Fund’s net assets, or 30% for the Hennessy Gas Utility Fund,
the Hennessy Japan Fund, and the Hennessy Japan Small Cap Fund and 10% for the Hennessy Balanced Fund. The line of credit is intended to provide any necessary short-term financing in connection with shareholder redemptions, subject to certain
restrictions. The credit facility is with the Hennessy Funds’ custodian bank, U.S. Bank N.A. Borrowings under this arrangement bear interest at the bank’s prime rate and are secured by all of the Fund’s assets (as to its own borrowings only).
During fiscal year 2023, the Fund had an outstanding average daily balance and a weighted average interest rate of $62,871 and 8.26%, respectively. The interest expensed by the Fund during fiscal year end 2023 is included in the Statement of
Operations. The maximum amount outstanding for the Fund during fiscal year 2023 was $6,550,000. As of October 31, 2023, the Fund did not have any borrowings outstanding under the line of credit.
8). FEDERAL TAX INFORMATION
As of October 31, 2023, the components of accumulated earnings (losses) for income tax purposes were as follows:
|
Investments
|
|||||
|
Cost of investments for tax purposes
|
$
|
237,059,447
|
|||
|
Gross tax unrealized appreciation
|
$
|
35,165,236
|
|||
|
Gross tax unrealized depreciation
|
(19,114,767
|
)
|
|||
|
Net tax unrealized appreciation/(depreciation)
|
$
|
16,050,469
|
|||
|
Undistributed ordinary income
|
$
|
7,752,370
|
|||
|
Undistributed long-term capital gains
|
—
|
||||
|
Total distributable earnings
|
$
|
7,752,370
|
|||
|
Other accumulated gain/(loss)
|
$
|
(4,306,123
|
)
|
||
|
Total accumulated gain/(loss)
|
$
|
19,496,716
|
|||
The difference between book-basis unrealized appreciation/depreciation and tax-basis unrealized appreciation/depreciation (as shown above) is attributable primarily to wash sales.
As of October 31, 2023, the Fund had $4,062,377 in unlimited long-term and $243,746 in unlimited short-term capital loss carryforwards.
Capital losses sustained in or after fiscal year 2012 can be carried forward indefinitely, but any such loss retains the character of the original loss and must be utilized prior to any loss
incurred before fiscal year 2012. As a result of this ordering rule, capital loss carryforwards incurred prior to fiscal year 2012 may be more likely to expire unused. Capital losses sustained prior to fiscal year 2012 can be carried forward
for eight years and can be carried forward as short-term capital losses regardless of the character of the original loss.
|
WWW.HENNESSYFUNDS.COM
|
26
|
NOTES TO THE FINANCIAL STATEMENTS
|
As of October 31, 2023, the Fund did not defer, on a tax basis, any late-year ordinary losses. Late-year ordinary losses are net ordinary losses incurred after December 31, 2022, but within the
taxable year, that are deemed to arise on the first day of the Fund’s next taxable year.
During fiscal years 2023 and 2022, the tax character of distributions paid by the Fund was as follows:
|
Year Ended
|
Year Ended
|
||||||||
|
October 31, 2023
|
October 31, 2022
|
||||||||
|
Ordinary income(1)
|
$
|
7,801,294
|
$
|
6,908,914
|
|||||
|
Long-term capital gains
|
20,765,408
|
5,655,707
|
|||||||
|
Total distributions
|
$
|
28,566,702
|
$
|
12,654,621
|
|||||
|
(1) Ordinary income includes short-term capital gains.
|
|||||||||
9). GLOBAL EVENTS
A rise in protectionist trade policies, the possibility of a national or global recession, risks associated with pandemic and epidemic diseases, trade tensions, the possibility of changes to some international trade
agreements, political events, and continuing political tension and armed conflicts may adversely impact financial markets and the broader economy. For example, ongoing armed conflicts between Ukraine and Russia in Europe and among Israel,
Hamas, and other militant groups in the Middle East have caused and could continue to cause significant market disruptions and volatility with the markets in Europe and the Middle East, and have had negative impacts on markets in the United
States. These events could also have negative effects on the Fund’s investments that cannot be foreseen at the present time. As global systems, economies and financial markets are increasingly interconnected, events that once had only local
impact are now more likely to have regional or even global effects. Events that occur in one country, region or financial market will, more frequently, adversely impact issuers in other countries, regions, or markets. These impacts can be
exacerbated by failures of governments and societies to adequately respond to an emerging event or threat. Your investment would be negatively impacted if the value of your portfolio holdings decreases as a result of such events, if these
events adversely impact the operations and effectiveness of the Advisor or other key service providers or if these events disrupt systems and processes necessary or beneficial to the management of accounts. These events may negatively impact
broad segments of businesses and populations and could have a significant and rapid negative impact on the performance of the Fund’s investments, increase the Fund’s volatility, or exacerbate pre-existing risks to the Fund.
10). EVENTS SUBSEQUENT TO YEAR END
Management has evaluated the Fund’s related events and transactions that occurred subsequent to October 31, 2023, through the date of issuance of the Fund’s financial statements. Management has determined that there
were no subsequent events requiring recognition or disclosure in the financial statements.
|
HENNESSY FUNDS
|
1-800-966-4354
|
27
Report of Independent Registered Public
Accounting Firm
To the Board of Trustees of Hennessy Funds Trust
and the shareholders of the Hennessy Cornerstone Value Fund
Novato, CA
Opinion on the Financial Statements
We have audited the accompanying statement of assets and liabilities of the Hennessy Cornerstone Value Fund (the “Fund”), a series of Hennessy Funds Trust, including the schedule of investments, as of October 31,
2023, the related statement of operations for the year then ended, the statements of changes in net assets for each of the two years in the period then ended, the financial highlights for each of the five years in the period then ended, and
the related notes (collectively referred to as the “financial statements”). In our opinion, the financial statements present fairly, in all material respects, the financial position of the Fund as of October 31, 2023, the results of its
operations for the year then ended, the changes in its net assets for each of the two years in the period then ended, and the financial highlights for each of the five years in the period then ended in conformity with accounting principles
generally accepted in the United States of America.
Basis for Opinion
These financial statements are the responsibility of the Fund’s management. Our responsibility is to express an opinion on the Fund’s financial statements based on our audits. We are a public accounting firm
registered with the Public Company Accounting Oversight Board (United States) (“PCAOB”) and are required to be independent with respect to the Fund in accordance with the U.S. federal securities laws and the applicable rules and regulations
of the Securities and Exchange Commission and the PCAOB. We have served as the auditor of one or more of the funds in the Trust since 2002.
We conducted our audits in accordance with the standards of the PCAOB. Those standards require that we plan and perform the audit to obtain reasonable assurance about whether the financial statements are free of
material misstatement, whether due to error or fraud. The Fund is not required to have, nor were we engaged to perform, an audit of its internal control over financial reporting. As part of our audits we are required to obtain an
understanding of internal control over financial reporting, but not for the purpose of expressing an opinion on the effectiveness of the Fund’s internal control over financial reporting. Accordingly, we express no such opinion.
Our audits included performing procedures to assess the risks of material misstatement of the financial statements, whether due to error or fraud, and performing procedures that respond to those risks. Such
procedures included examining, on a test basis, evidence regarding the amounts and disclosures in the financial statements. Our audits also included evaluating the accounting principles used and significant estimates made by management, as
well as evaluating the overall presentation of the financial statements. Our procedures included confirmation of securities owned as of October 31, 2023 by correspondence with the custodian. We believe that our audits provide a reasonable
basis for our opinion.
|
|
|
TAIT, WELLER & BAKER LLP
|
Philadelphia, Pennsylvania
December 22, 2023
|
WWW.HENNESSYFUNDS.COM
|
28
|
REPORT OF INDEPENDENT REGISTERED PUBLIC ACCOUNTING FIRM/TRUSTEES AND OFFICERS
|
Trustees and Officers of the Fund (Unaudited)
The business and affairs of the Funds are managed under the direction of the Board of Trustees of the Trust, and the Board of Trustees elects the officers of the Trust (“Officers”). From time to time, the Board of
Trustees also has appointed advisers to the Board of Trustees (“Advisers”) with the intention of having qualified individuals serve in an advisory capacity to garner experience in the mutual fund and asset management industry and be
considered as potential Trustees in the future. There are currently two Advisers, Brian Alexander and A.J. Hennessy. As Advisers, Mr. Alexander and Mr. A.J. Hennessy attend meetings of the Board of Trustees and act as non-voting participants.
Information pertaining to the Trustees, Advisers, and the Officers of the Trust is set forth below. The Trustees and Officers serve until their successors are duly elected and qualified or until their earlier death, resignation, or removal.
Each Trustee oversees all 17 Hennessy Funds. Unless otherwise indicated, the address of all persons listed below is 7250 Redwood Boulevard, Suite 200, Novato, CA 94945. The Fund’s Statement of Additional Information includes more information
about the persons listed below and is available without charge by calling 800-966-4354 or by visiting www.hennessyfunds.com.
|
Other
|
|||
|
Directorships
|
|||
|
Held Outside
|
|||
|
Name, Age,
|
of Fund
|
||
|
and Position Held
|
Start Date
|
Principal Occupation(s)
|
Complex During
|
|
with the Trust
|
of Service
|
During Past Five Years
|
Past Five Years
|
|
Disinterested Trustees(1) and Disinterested Advisers
|
|||
|
J. Dennis DeSousa
|
January 1996
|
Mr. DeSousa is a real estate investor.
|
None.
|
|
87
|
|||
|
Trustee
|
|||
|
Robert T. Doyle
|
January 1996
|
Mr. Doyle is retired. He served as the
|
None.
|
|
76
|
Sheriff of Marin County, California
|
||
|
Trustee
|
from 1996 to June 2022.
|
||
|
Doug Franklin
|
March 2016
|
Mr. Franklin is a retired insurance
|
None.
|
|
59
|
as an Adviser
|
industry executive. From 1987
|
|
|
Trustee
|
to the Board
|
through 2015, he was employed by
|
|
|
and June 2023
|
the Allianz-Fireman’s Fund Insurance
|
||
|
as a Trustee
|
Company in various positions,
|
||
|
including as its Chief Actuary and
|
|||
|
Chief Risk Officer.
|
|||
|
Claire Garvie
|
December 2015
|
Ms. Garvie is a founder of Kiosk and
|
None.
|
|
49
|
as an Adviser
|
has served as its Chief Operating
|
|
|
Trustee
|
to the Board and
|
Officer since 2004. Kiosk is a
|
|
|
December 2021
|
full-service marketing agency with
|
||
|
as a Trustee
|
offices in the San Francisco Bay Area
|
||
|
and Liverpool, UK and staff across
|
|||
|
nine states in the U.S.
|
|||
|
HENNESSY FUNDS
|
1-800-966-4354
|
29
|
Other
|
|||
|
Directorships
|
|||
|
Held Outside
|
|||
|
Name, Age,
|
of Fund
|
||
|
and Position Held
|
Start Date
|
Principal Occupation(s)
|
Complex During
|
|
with the Trust
|
of Service
|
During Past Five Years
|
Past Five Years
|
|
Gerald P. Richardson
|
May 2004
|
Mr. Richardson is an independent
|
None.
|
|
78
|
consultant in the securities industry.
|
||
|
Trustee
|
|||
|
Brian Alexander
|
March 2015
|
Mr. Alexander has served as the
|
None.
|
|
42
|
Chief Operating Officer of Solis
|
||
|
Adviser to the Board
|
Mammography since March 2023.
|
||
|
Prior to that, he worked for the
|
|||
|
Sutter Health organization from
|
|||
|
2011 to 2023 in various positions.
|
|||
|
He served as the Chief Executive
|
|||
|
Officer of the North Valley Hospital
|
|||
|
Area from 2021 to March 2023.
|
|||
|
From 2018 to 2021, he served as the
|
|||
|
Chief Executive Officer of Sutter
|
|||
|
Roseville Medical Center. From 2016
|
|||
|
through 2018, he served as the Vice
|
|||
|
President of Strategy for the Sutter
|
|||
|
Health Valley Area, which includes
|
|||
|
11 hospitals, 13 ambulatory surgery
|
|||
|
centers, 16,000 employees, and
|
|||
|
1,900 physicians.
|
|||
|
Interested Trustee and Interested Adviser(2)
|
|||
|
Neil J. Hennessy
|
January 1996 as
|
Mr. Neil Hennessy has been employed
|
Hennessy
|
|
67
|
a Trustee and
|
by Hennessy Advisors, Inc. since
|
Advisors, Inc.
|
|
Chairman of the Board,
|
June 2008 as
|
1989 and currently serves as its
|
|
|
Chief Market Strategist,
|
an Officer
|
Chairman and Chief Executive Officer.
|
|
|
Portfolio Manager,
|
|||
|
and President
|
|||
|
A.J. Hennessy
|
December 2022
|
Mr. A.J. Hennessy has been employed
|
None.
|
|
37
|
by Hennessy Advisors, Inc. since 2011.
|
||
|
Adviser to the Board
|
|||
|
and Vice President,
|
|||
|
Corporate Development
|
|||
|
and Operations
|
|||
|
WWW.HENNESSYFUNDS.COM
|
30
|
TRUSTEES AND OFFICERS OF THE FUND
|
|
Name, Age,
|
||
|
and Position Held
|
Start Date
|
Principal Occupation(s)
|
|
with the Trust
|
of Service
|
During Past Five Years
|
|
Officers
|
||
|
Teresa M. Nilsen
|
January 1996
|
Ms. Nilsen has been employed by Hennessy Advisors, Inc.
|
|
57
|
since 1989 and currently serves as its President, Chief
|
|
|
Executive Vice President
|
Operating Officer, and Secretary.
|
|
|
and Treasurer
|
||
|
Daniel B. Steadman
|
March 2000
|
Mr. Steadman has been employed by Hennessy Advisors, Inc.
|
|
67
|
since 2000 and currently serves as its Executive Vice President.
|
|
|
Executive Vice President
|
||
|
and Secretary
|
||
|
Brian Carlson
|
December 2013
|
Mr. Carlson has been employed by Hennessy Advisors, Inc.
|
|
51
|
since December 2013 and currently serves as its Chief
|
|
|
Senior Vice President
|
Compliance Officer and Senior Vice President.
|
|
|
and Head of Distribution
|
||
|
David Ellison(3)
|
October 2012
|
Mr. Ellison has been employed by Hennessy Advisors, Inc.
|
|
65
|
since October 2012. He has served as a Portfolio Manager of
|
|
|
Senior Vice President
|
the Hennessy Large Cap Financial Fund and the Hennessy
|
|
|
and Portfolio Manager
|
Small Cap Financial Fund since their inception. Mr. Ellison also
|
|
|
served as a Portfolio Manager of the Hennessy Technology
|
||
|
Fund from its inception until February 2017. Mr. Ellison served
|
||
|
as Director, CIO, and President of FBR Fund Advisers, Inc.
|
||
|
from December 1999 to October 2012.
|
||
|
Jennifer Emerson(4)
|
June 2013
|
Ms. Emerson has been employed by Hennessy Advisors, Inc.
|
|
46
|
as its General Counsel since June 2013.
|
|
|
Senior Vice President and
|
||
|
Chief Compliance Officer
|
||
|
Ryan Kelley(5)
|
March 2013
|
Mr. Kelley has been employed by Hennessy Advisors, Inc. since
|
|
51
|
October 2012. He has served as Chief Investment Officer of the
|
|
|
Senior Vice President,
|
Hennessy Funds since March 2021 and has served as a Portfolio
|
|
|
Chief Investment Officer,
|
Manager of the Hennessy Gas Utility Fund, the Hennessy Large
|
|
|
and Portfolio Manager
|
Cap Financial Fund, and the Hennessy Small Cap Financial Fund
|
|
|
since October 2014. Mr. Kelley served as Co-Portfolio Manager
|
||
|
of these same funds from March 2013 through September
|
||
|
2014 and as a Portfolio Analyst for the Hennessy Funds from
|
||
|
October 2012 through February 2013. He has also served as a
|
||
|
Portfolio Manager of the Hennessy Cornerstone Growth Fund,
|
||
|
the Hennessy Cornerstone Mid Cap 30 Fund, the Hennessy
|
||
|
Cornerstone Large Growth Fund, and the Hennessy
|
||
|
Cornerstone Value Fund since February 2017 and as a Portfolio
|
||
|
Manager of the Hennessy Total Return Fund, the Hennessy
|
||
|
Balanced Fund, and the Hennessy Technology Fund since May
|
||
|
2018. He previously served as Co-Portfolio Manager of the
|
||
|
Hennessy Technology Fund from February 2017 until May 2018.
|
||
|
Mr. Kelley served as Portfolio Manager of FBR Fund
|
||
|
Advisers, Inc. from January 2008 to October 2012.
|
|
HENNESSY FUNDS
|
1-800-966-4354
|
31
|
Name, Age,
|
||
|
and Position Held
|
Start Date
|
Principal Occupation(s)
|
|
with the Trust
|
of Service
|
During Past Five Years
|
|
L. Joshua Wein(5)
|
September 2018
|
Mr. Wein has been employed by Hennessy Advisors, Inc. since
|
|
50
|
2018. He has served as Portfolio Manager of the Hennessy
|
|
|
Vice President and
|
Cornerstone Growth Fund, the Hennessy Cornerstone Mid Cap
|
|
|
Portfolio Manager
|
30 Fund, the Hennessy Cornerstone Large Growth Fund, the
|
|
|
Hennessy Cornerstone Value Fund, Hennessy Total Return Fund,
|
||
|
the Hennessy Balanced Fund, the Hennessy Gas Utility Fund,
|
||
|
and the Hennessy Technology Fund since February 2021, and
|
||
|
as the Co-Portfolio Manager of these Funds since February
|
||
|
2019. He served as a Senior Analyst of those same Funds from
|
||
|
September 2018 through February 2019. He also has served as
|
||
|
a Portfolio Manager of the Hennessy Energy Transition Fund
|
||
|
and the Hennessy Midstream Fund since January 2022.
|
||
|
Mr. Wein served as Director of Alternative Investments and
|
||
|
Co-Portfolio Manager at Sterling Capital Management
|
||
|
from 2008 to 2018.
|
_______________
|
(1)
|
The Funds have determined that Mr. DeSousa, Mr. Doyle, Mr. Franklin, Ms. Garvie, and Mr. Richardson are not interested persons, as defined in the 1940 Act, of the Investment Manager or
of any predecessor investment adviser for purposes of Section 15(f) of the 1940 Act.
|
|
(2)
|
Each of Neil J. Hennessy and A.J. Hennessy is considered an interested person, as defined in the 1940 Act, because he is an officer of the Trust.
|
|
(3)
|
The address of this officer is 101 Federal Street, Suite 1615B, Boston, MA 02110.
|
|
(4)
|
The address of this officer is 4800 Bee Caves Road, Suite 100, Austin, TX 78746.
|
|
(5)
|
The address of this officer is 1340 Environ Way, Chapel Hill, NC 27517.
|
|
WWW.HENNESSYFUNDS.COM
|
32
|
TRUSTEES AND OFFICERS OF THE FUND
|
(This Page Intentionally Left Blank.)
|
HENNESSY FUNDS
|
1-800-966-4354
|
33
Expense Example (Unaudited)
October 31, 2023
As a shareholder of the Fund, you incur ongoing costs, including management fees, service fees, and other Fund expenses. This Example is intended to help you understand your ongoing costs (in dollars) of investing
in the Fund and to compare these costs with the ongoing costs of investing in other investment funds. The Example is based on an investment of $1,000 invested at the beginning of the period and held for the entire period from May 1, 2023,
through October 31, 2023.
Actual Expenses
In the table below, the first line under each of the “Investor Class” and “Institutional Class” headings provides information about actual account values and actual expenses for each share class. You may use this
information, together with the amount you invested, to estimate the expenses that you paid over the period. Simply divide your account value by $1,000 (for example, an $8,600 account value divided by $1,000 = 8.6), then multiply the result by
the number in the first line under the heading “Expenses Paid During Period” to estimate the expenses you paid on your account during this period. Although the Fund charges no sales loads or transaction fees, you will be assessed fees for
outgoing wire transfers, returned checks, and stop payment orders at prevailing rates charged by U.S. Bank Global Fund Services, the Fund’s transfer agent. If you request that a redemption be made by wire transfer, the Fund’s transfer agent
charges a $15 fee. IRAs are charged a $15 annual maintenance fee (up to $30 maximum per shareholder for shareholders with multiple IRAs). The examples below include, but are not limited to, management, shareholder servicing, accounting,
custody, and transfer agent fees. However, the examples below do not include portfolio trading commissions and related expenses.
Hypothetical Example for Comparison Purposes
In the table below, the second line under each of the “Investor Class” and “Institutional Class” headings provides information about hypothetical account values and hypothetical expenses based on the Fund’s actual
expense ratio for each share class and an assumed rate of return of 5% per year before expenses, which is not the Fund’s actual return for such share class. The hypothetical account values and expenses may not be used to estimate the actual
ending account balance or expenses you paid for the period. You may use this information to compare the ongoing costs of investing in the Fund and other funds. To do so, compare these 5% hypothetical examples with the 5% hypothetical examples
that appear in the shareholder reports of the other funds. Please note that the expenses shown in the table are meant to highlight your ongoing costs only. Therefore, the second lines under “Investor Class” and “Institutional Class” are
useful in comparing ongoing costs only and will not help you determine the relative total costs of owning different funds.
|
WWW.HENNESSYFUNDS.COM
|
34
|
EXPENSE EXAMPLE
|
|
Expenses Paid
|
|||
|
Beginning
|
Ending
|
During Period(1)
|
|
|
Account Value
|
Account Value
|
May 1, 2023 –
|
|
|
May 1, 2023
|
October 31, 2023
|
October 31, 2023
|
|
|
Investor Class
|
|||
|
Actual
|
$1,000.00
|
$ 946.30
|
$6.03
|
|
Hypothetical (5% return before expenses)
|
$1,000.00
|
$1,019.00
|
$6.26
|
|
Institutional Class
|
|||
|
Actual
|
$1,000.00
|
$ 947.30
|
$5.25
|
|
Hypothetical (5% return before expenses)
|
$1,000.00
|
$1,019.81
|
$5.45
|
|
(1)
|
Expenses are equal to the Fund’s annualized expense ratio of 1.23% for Investor Class shares or 1.07% for Institutional Class shares, as applicable, multiplied by the average account value over the period,
multiplied by 184/365 days (to reflect the half-year period).
|
|
HENNESSY FUNDS
|
1-800-966-4354
|
35
How to Obtain a Copy of the Fund’s Proxy
Voting Policy and Proxy Voting Records
A description of the policies and procedures the Fund uses to determine how to vote proxies relating to portfolio securities is available without charge (1) by calling 800-966-4354, (2) on the Hennessy Funds’
website at www.hennessyfunds.com/proxy-voting/voting-policy, or (3) on the U.S. Securities and Exchange Commission’s (the “SEC”) website at www.sec.gov. The Fund’s proxy voting record is available without charge on both the Hennessy Funds’
website at www.hennessyfunds.com/proxy-voting/voting-record and the SEC’s website at www.sec.gov no later than August 31 for the prior 12 months ending June 30.
Availability of Quarterly Portfolio Schedule
The Fund files a complete schedule of portfolio holdings with the SEC for the first and third quarters of each fiscal year as an exhibit to its reports on Form N-PORT. The Fund’s Form N-PORT reports are available on
the SEC’s website at www.sec.gov or on request by calling 800-966-4354.
Federal Tax Distribution Information (Unaudited)
For fiscal year 2023, certain dividends paid by the Fund may be subject to a maximum tax rate of 23.8%, as provided for by the Jobs and Growth Tax Relief Reconciliation Act of 2003. The percentage of dividends
declared from ordinary income designated as qualified dividend income was 100.00%.
For corporate shareholders, the percent of ordinary income distributions that qualified for the corporate dividends received deduction for fiscal year 2023 was 93.15%.
The percentage of taxable ordinary income distributions that were designated as short-term capital gain distributions under Section 871(k)(2)(C) of the Internal Revenue Code of 1986, as amended,
for the Fund was 0.00%.
Important Notice Regarding Delivery
of Shareholder Documents
To help keep the Fund’s costs as low as possible, we generally deliver a single copy of shareholder reports, proxy statements, and prospectuses to shareholders who share an address and have the same last name. This
process does not apply to account statements. You may request an individual copy of a shareholder document at any time. If you would like to receive separate mailings of shareholder documents, please call U.S. Bank Global Fund Services at
800-261-6950 or 414-765-4124, and individual delivery will begin within 30 days of your request. If your account is held through a financial institution or other intermediary, please contact such intermediary directly to request individual
delivery.
Electronic Delivery
As currently permitted by SEC regulations, the Fund’s shareholder reports are made available on a website, and unless you sign for eDelivery or elect to receive paper copies as detailed below, you will be notified
by mail each time a report is posted and provided with a website link to access the report.
To elect to receive paper copies of all future reports free of charge, please call U.S. Bank Global Fund Services at 800-261-6950 or 414-765-4124.
The Fund also offers shareholders the option to receive all notices, account statements, prospectuses, tax forms, and shareholder reports electronically. To sign up for eDelivery or change your
delivery preference, please visit www.hennessyfunds.com/account.
Shareholder reports transmitted after July 24, 2024, will comply with the new tailored shareholder reporting requirements, which require streamlined annual and semi-annual reports to shareholders
that highlight key information. These reports will be transmitted in paper unless a shareholder elects to receive reports electronically via eDelivery. To sign up for eDelivery, please visit http://www.hennessyfunds.com/account.
Subscribe to receive our team’s unique market and sector insights delivered to your inbox
www.hennessyfunds.com/subscribe
Follow us on social media
| |
|
|
|
|
WWW.HENNESSYFUNDS.COM
|
36
|
PROXY VOTING — PRIVACY POLICY
|
Liquidity Risk Management Program
In accordance with Rule 22e-4 under the Investment Company Act of 1940, as amended (the “Liquidity Rule”), we have adopted and implemented a liquidity risk management program (the “Liquidity Program”). The purpose
of the Liquidity Program is to assess and manage the Fund’s liquidity risk, which is the risk that the Fund would not be able to meet requests to redeem Fund shares without significant dilution of the remaining shareholders’ interests in the
Fund. The Board of Trustees of the Fund (the “Board”) designated a committee comprising representatives of Hennessy Advisors, Inc., the investment adviser to the Fund, as the administrator of the Liquidity Program (the “Program
Administrator”).
The Program Administrator provided a written report regarding the Liquidity Program to the Board in advance of its meeting on June 7, 2023. The report covered the period from June 1, 2022, through
May 31, 2023. The report addressed the operation of the Liquidity Program, assessed the adequacy and effectiveness of its implementation, and described any material changes to the Liquidity Program during the review period. The Trust’s chief
compliance officer presented the report to the Board at the meeting and provided additional information regarding the Liquidity Program. The Board reviewed the Liquidity Program and considered, among other items, the following:
|
1.
|
The Program Administrator reviewed daily historical net redemption activity during the review period and during prior periods with higher-than-average redemption activity and concluded that the Fund has
historically been able to meet requests to redeem Fund shares without significant dilution to the Fund’s remaining shareholders, and the Program Administrator expects the Fund to be able to continue to do so in the future during both
normal and reasonably foreseeable stressed conditions.
|
|
|
2.
|
The Fund primarily holds assets that are highly liquid investments and is not required to establish a highly liquid investment minimum for the Fund or adopt policies and procedures for responding to a highly
liquid investment minimum shortfall.
|
|
|
3.
|
The Program Administrator did not make or recommend any material changes to the Liquidity Program during the review period.
|
|
|
4.
|
The Program Administrator concluded that the Liquidity Program was reasonably designed to assess and manage the Fund’s liquidity risk, complies with the requirements of the Liquidity Rule, and was operating
as intended during the review period.
|
Privacy Policy
We collect the following personal information about you:
|
1.
|
Information we receive from you in applications or other forms, correspondence, or conversations, including, but not limited to, your name, address, phone number, social security number, assets, income, and
date of birth;
|
|
|
2.
|
Information about your transactions with us, our affiliates, or others, including, but not limited to, your account number and balance, payments history, parties to transactions, cost basis information, and
other financial information; and
|
|
HENNESSY FUNDS
|
1-800-966-4354
|
37
|
3.
|
Other personal information we collect from various sources, even if you have not entered into a prior transaction with us, including the following:
|
|
•
|
Name, alias, address, unique personal identifier, online identifier, IP address, email address, telephone number, account name, and other similar identifiers;
|
||
|
•
|
Age and marital status;
|
||
|
•
|
Commercial information, including records of products purchased;
|
||
|
•
|
Browsing history, search history, and information on interaction with our website;
|
||
|
•
|
Geolocation data;
|
||
|
•
|
Employment and employment history, educational history, financial information, and purchasing and consuming histories or tendencies; and
|
||
|
•
|
Inferences drawn from the above-listed information to create a profile about your preferences, characteristics, predispositions, and behavior.
|
We collect this information directly from you, indirectly in the course of providing services to you, directly and indirectly from your activity on our website, from broker dealers, marketing
agencies, and other third parties that interact with us in connection with the services we perform and products we offer, and from anonymized and aggregated consumer information.
We use this information to fulfill the reason you provided the information to us, to provide you with other relevant products that you request from us, to provide you with information about
products that may interest you, to improve our website or present our website’s contents to you, and as otherwise described to you when collecting your personal information.
We do not disclose any personal information to unaffiliated third parties, except as permitted by law. We may disclose your personal information to our affiliates, vendors, and service providers
for a business purpose. For example, we are permitted by law to disclose all of the information we collect, as described above, to our transfer agent to process your transactions. When disclosing your personal information to third parties, we
enter into a contract with each third party describing the purpose of such disclosure and requiring that such personal information be kept confidential and not used for any purpose except to perform the services contracted or respond to
regulatory or law enforcement requests.
Furthermore, we restrict access to your personal information to those persons who require such information to provide products or services to you. As a result, we do not provide a means for opting
out of our limited sharing of your information. We maintain physical, electronic, and procedural safeguards that comply with federal standards to guard your personal information.
If you hold shares of the Funds through a financial intermediary, including, but not limited to, a broker-dealer, bank, or trust company, the privacy policy of your financial intermediary governs
how your personal information is shared with unaffiliated third parties.
If you live in a state such as California where the laws provide further privacy rights, we will not share information unless the law allows, and we will comply with the other state-specific
requirements.
|
WWW.HENNESSYFUNDS.COM
|
38
|
PRIVACY POLICY
|
Supplemental Privacy Notice for Residents of California
The California Consumer Privacy Act of 2018 (the “CCPA”) provides you, as a California resident, with certain additional rights relating to your personal information.
Under the CCPA, you have the right to request that we disclose to you the categories of personal information we have collected about you over the past 12 months, the categories of sources of such
information, our business purpose for collecting the information, the categories of third parties, if any, with whom we shared the information, and the specific information we have collected about you. You also have the right to request that
we delete any of your personal information, and, unless an exception applies, we will delete such information upon receiving and confirming your request. To make a request, call us at 1-800-966-4354, email us at privacy@hennessyfunds.com, or
go to www.hennessyfunds.com/contact. We will not discriminate against you for exercising your rights under the CCPA. Further, we will not collect additional categories of your personal information or use the personal information we collected
for materially different, unrelated, or incompatible purposes without providing you notice.
|
HENNESSY FUNDS
|
1-800-966-4354
|
39
(This Page Intentionally Left Blank.)
For information, questions, or assistance, please call
The Hennessy Funds
800-966-4354 or 415-899-1555
INVESTMENT ADVISOR
Hennessy Advisors, Inc.
7250 Redwood Boulevard, Suite 200
Novato, California 94945
ADMINISTRATOR,
TRANSFER AGENT,
DIVIDEND PAYING AGENT, &
SHAREHOLDER SERVICING AGENT
U.S. Bancorp Fund Services, LLC
d/b/a U.S. Bank Global Fund Services
P.O. Box 701
Milwaukee, Wisconsin 53201-0701
CUSTODIAN
U.S. Bank N.A.
Custody Operations
1555 North River Center Drive, Suite 302
Milwaukee, Wisconsin 53212
TRUSTEES
Neil J. Hennessy
Robert T. Doyle
J. Dennis DeSousa
Doug Franklin
Claire Garvie
Gerald P. Richardson
COUNSEL
Foley & Lardner LLP
777 East Wisconsin Avenue
Milwaukee, Wisconsin 53202-5306
INDEPENDENT REGISTERED
PUBLIC ACCOUNTING FIRM
Tait, Weller & Baker LLP
Two Liberty Place
50 South 16th Street, Suite 2900
Philadelphia, Pennsylvania 19102-2529
DISTRIBUTOR
Quasar Distributors, LLC
111 East Kilbourn Avenue, Suite 1250
Milwaukee, Wisconsin 53202
www.hennessyfunds.com | 800-966-4354
This report has been prepared for shareholders and may be distributed to
others only if preceded or accompanied by a current prospectus.
ANNUAL REPORT
OCTOBER 31, 2023

HENNESSY TOTAL RETURN FUND
Investor Class HDOGX
www.hennessyfunds.com | 1-800-966-4354
(This Page Intentionally Left Blank.)
Contents
|
Letter to Shareholders
|
2
|
|
|
Performance Overview
|
6
|
|
|
Financial Statements
|
||
|
Schedule of Investments
|
9
|
|
|
Statement of Assets and Liabilities
|
13
|
|
|
Statement of Operations
|
14
|
|
|
Statements of Changes in Net Assets
|
15
|
|
|
Statement of Cash Flows
|
16
|
|
|
Financial Highlights
|
18
|
|
|
Notes to the Financial Statements
|
20
|
|
|
Report of Independent Registered Public Accounting Firm
|
29
|
|
|
Trustees and Officers of the Fund
|
30
|
|
|
Expense Example
|
34
|
|
|
Proxy Voting Policy and Proxy Voting Records
|
35
|
|
|
Availability of Quarterly Portfolio Schedule
|
35
|
|
|
Federal Tax Distribution Information
|
35
|
|
|
Important Notice Regarding Delivery of Shareholder Documents
|
35
|
|
|
Electronic Delivery
|
35
|
|
|
Liquidity Risk Management Program
|
36
|
|
|
Privacy Policy
|
36
|
|
HENNESSY FUNDS
|
1-800-966-4354
|
November 2023
Dear Hennessy Funds Shareholder:
Market Myopia: Tough Beginnings & Fantastic Finishes
During an interview this summer, I was reminded how important it is to maintain a long-term view of the market and investing and how easy it is to focus on the very recent past. In mid-July, when the Nasdaq
Composite Index was soaring to new 2023 highs and large-cap tech was once again dominating both returns and news headlines, the interviewer seemed confused – and somewhat disappointed – when I mentioned that even with 2023’s stellar
performance, the Nasdaq was negative if you included the prior year (2022) and that during that same time, utilities had outperformed. As of the time of writing this letter, a similar story can be seen when considering eight technology
giants: Microsoft, Tesla, Facebook (Meta), Apple, Amazon, Netflix, Nvidia, and Google, or “MT. FAANNG” as a much easier to say (and remember) acronym.(1) MT. FAANNG is up on average a whopping 89.69% in 2023 on a total return basis as of November 7, 2023. However, this same group was down -46.71% in 2022, a
dismal year for large-cap tech. Due to the unforgiving nature of percentages, from the end of 2021 until now, this group of highflyers, believe it or not, is still down -3.14% on average, despite an incredible 2023.
I like to call this phenomenon “market myopia.” Investors tend to be optimists, as am I. This makes it so much more comforting to forget the “tough beginnings” when you’d
rather remember the “fantastic finishes.” In continuing with the example above, unless you were an investor with prescient foresight, you likely didn’t sell all your MT. FAANNG stocks on January 4, 2022, as the market started its
correction, and you probably didn’t then buy them all back on September 30, 2022, when the market hit its low. An average investor’s experience would be much different than that. Which brings me to the point of all this: what are some
elements of our investment philosophy here at Hennessy Funds?
First, what about timing the market? Simply put, we don’t do it. As Neil Hennessy, our Chief Market Strategist and long-tenured Portfolio Manager, aptly put it, “It’s not
about timing the market, but rather about time in the market.” The long-term annualized return of the market, as measured by the Dow Jones Industrial Average
going back 104 years to 1920, is about 9.6%, and that number would be closer to 7-8% on a real return basis when factoring in inflation. If an investor is poorly timing when to enter and when to exit the market, it would be very difficult
to achieve similar, attractive returns to what they would experience simply by staying invested through a complete market cycle.
We are optimistic investors. We understand that some years or months may be tougher than others, but we tend to think in longer timeframes. An investor solely invested in
the Nasdaq might have looked at their portfolio at the end of 2022 and been extremely disappointed with a -32.51% return. But as Josh Wein, one of our Portfolio Managers with over 25 years of experience, pointed out, “2022 was what 8% real
returns look like.” In other words, with the year prior (2021) providing a +22.21% return and the year after (2023) hitting a +31.21% return, 2022’s dismal performance of -32.51% created an annualized total return for the Nasdaq of 8.22%
over the entire period (December 31, 2020, to November 7, 2023). Josh simply observed that while corrections happen over the course of a market cycle, it’s best not to panic by selling when stocks are hitting new lows.
_______________
|
(1)
|
The acronym, MT. FAANNG, refers to the following companies: Microsoft Corporation, Tesla, Inc., Meta Platforms, Inc., Amazon.com, Inc., Apple, Inc., Netflix, Inc., NVIDIA Corporation, and Alphabet, Inc.
|
|
WWW.HENNESSYFUNDS.COM
|
2
|
LETTER TO SHAREHOLDERS
|
Downside risk mitigation is relevant. While we normally remain fully invested within our individual funds, we seek to reduce risk through other means, including sector
diversification and investing in companies that exhibit strong fundamentals at compelling valuations. Dave Ellison, the long-tenured Portfolio Manager of our two financial funds, consistently reminds us, “Losing less money in difficult
markets is more important than making the most in rising ones.”
Finally, we are investors in companies, not traders of stocks. Many of our portfolios hold certain positions for long periods of time, a demonstration of the Portfolio
Managers’ convictions. In fact, both the Hennessy Focus Fund and the Hennessy Large Cap Financial Fund have held some positions for 25 years or more. We recognize that much of the performance of the Hennessy Funds comes from the actual
stocks we own (stock selection) and not from our weightings within certain sectors (sector allocation). Moving in and out of sectors can enhance performance, but it can also hinder it in the same way as market timing, and it takes a
significant number of correct “calls” regarding the macro-environment. We’d rather invest long term than rely on lucky calls. Our highly experienced energy funds Portfolio Manager, Ben Cook, summed up our philosophy on the macro environment
nicely: “While macro-economic trends help to inform our investment process, ultimately it’s the individual stocks with solid fundamentals and attractive valuations that, over time, drive positive risk-adjusted returns for our funds.”
We are long term investors, staying ever mindful of downside risk while striving to participate in the upside, with each individual fund having its own objective, process,
portfolio construction, and investment criteria.
The stock market has once again seen dramatic differences in stock performance. For our fiscal year ended October 31, 2023, all three broad-based indexes were positive,
although with a large dispersion of total returns, with the Dow Jones Industrial Average up 3.17%, the S&P 500® Index up 10.14%, and the Nasdaq Composite
Index up 17.99%. During our fiscal year, large caps significantly outperformed mid caps and small caps, and growth substantially outperformed value. Large-cap tech once again pushed the overall broader market higher, as evidenced by the
Nasdaq-100 Index posting a return of 27.45%. From a sector point of view, besides Technology, the only other sector with outsized (greater than 10%) returns was Communication Services, while six of the 11 GICS sectors of the S&P 500® Index were negative.
Similar to the overall market, our funds experienced mixed results. Many of our funds exhibit more value-oriented characteristics and, given that value underperformed growth
this year by a significant amount, that negatively affected our relative performance. In addition, three of our funds are sector-specific funds that were invested in underperforming sectors, while six more are focused on small- and mid-cap
stocks in a time period when large caps substantially outperformed. Ten of our 16 mutual funds and our exchange-traded-fund (ETF) posted positive returns for the fiscal year ended October 31, 2023.
Several factors caused this disparity of returns in the market: interest rates and inflation being two of the most important. With the Federal Reserve pausing interest rate
hikes and inflation numbers subsiding, the market reacted positively once it became more apparent that we were not heading into a recession. Consumer demand also remained strong, and unemployment numbers remained historically low.
We believe that the outlook for U.S. stocks remains positive, primarily as we believe that the Federal Reserve may be done, or close to done, raising interest rates.
Inflation has shown signs of easing, creating a better environment for consumers as well as businesses. The unemployment rate remains near record lows, there are elevated levels of cash on the
|
HENNESSY FUNDS
|
1-800-966-4354
|
3
balance sheets of U.S. companies and in the pockets of many consumers and investors, and there is the prospect of a more dovish Federal Reserve heading into 2024. However, we are cautiously watching certain parts
of the economy for any hints of weakness, including consumer spending and credit issues. While volatility and uncertainty may impact the markets, we encourage investors to stay the course, maintain a diversified portfolio, and keep a
long-term perspective.
We thank you for your continued interest in our Funds and are grateful that you have chosen to invest with us. If you have any questions or would like to speak with us
directly, please call us at (800) 966-4354.
Best regards,
|
|
|
|
|
Ryan C. Kelley, CFA
|
|
|
Chief Investment Officer,
|
|
|
Senior Vice President, and Portfolio Manager
|
Past performance does not guarantee future results.
Mutual fund investing involves risk. Principal loss is possible.
Opinions expressed are those of Ryan C. Kelley and are subject to change, are not guaranteed, and should not be considered investment advice.
The Dow Jones Industrial Average and S&P 500® Index are commonly used to measure the performance of U.S. stocks. The Nasdaq
Composite Index comprises all common stocks listed on The Nasdaq Stock Market and is commonly used to measure the performance of technology-related stocks. The Nasdaq-100 Index includes 100 of the largest domestic and international
non-financial companies listed on The NASDAQ Stock Market based on market capitalization. The indices are used herein for comparative purposes in accordance with SEC regulations. One cannot invest directly in an index. All returns are shown
on a total return basis.
|
WWW.HENNESSYFUNDS.COM
|
4
|
LETTER TO SHAREHOLDERS
|
(This Page Intentionally Left Blank.)
|
HENNESSY FUNDS
|
1-800-966-4354
|
5
Performance Overview (Unaudited)
CHANGE IN VALUE OF $10,000 INVESTMENT
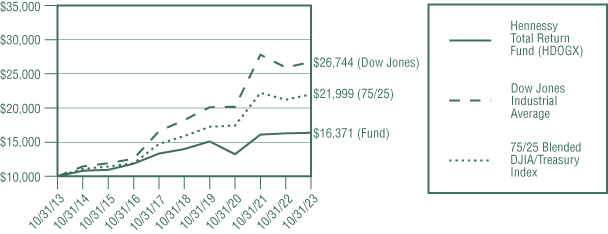
This graph illustrates the performance of an initial investment of $10,000 made in the Fund 10 years ago and assumes the reinvestment of dividends and capital gains.
AVERAGE ANNUAL TOTAL RETURN FOR PERIODS ENDED OCTOBER 31, 2023
|
One
|
Five
|
Ten
|
|
|
Year
|
Years
|
Years
|
|
|
Hennessy Total Return Fund (HDOGX)
|
0.53%
|
3.20%
|
5.05%
|
|
75/25 Blended DJIA/Treasury Index
|
3.72%
|
6.72%
|
8.20%
|
|
Dow Jones Industrial Average
|
3.17%
|
7.96%
|
10.34%
|
Expense ratio: 1.77%
Performance data quoted represents past performance; past performance does not guarantee future results. The investment return and principal value of an investment will fluctuate so that an
investor’s shares, when redeemed, may be worth more or less than their original cost. The performance table does not reflect the deduction of taxes that a shareholder would pay on Fund distributions or the redemption of Fund shares. Current
performance of the Fund may be lower or higher than the performance quoted. Performance data current to the most recent month end may be obtained by visiting www.hennessyfunds.com.
The 75/25 Blended DJIA/Treasury Index consists of 75% common stocks represented by the Dow Jones Industrial Average and 25% short-duration Treasury securities represented by the ICE BofAML U.S. 3-Month Treasury
Bill Index, which comprises U.S. Treasury securities maturing in three months. The Dow Jones Industrial Average is a price-weighted average of 30 significant stocks traded on the New York Stock Exchange or The Nasdaq Stock Market LLC. One
cannot invest directly in an index. These indices are used for comparative purposes in accordance with Securities and Exchange Commission regulations.
The expense ratio presented is from the most recent prospectus. The expense ratio for the current reporting period is available in the Financial Highlights section of this report.
|
WWW.HENNESSYFUNDS.COM
|
6
|
PERFORMANCE OVERVIEW
|
PERFORMANCE NARRATIVE
Portfolio Managers Neil J. Hennessy, Ryan C. Kelley, CFA, and L. Joshua Wein, CAIA
Performance:
For the one-year period ended October 31, 2023, the Hennessy Total Return Fund returned 0.53%, underperforming both the 75/25 Blended DJIA/Treasury Index (the Fund’s primary benchmark) and the Dow Jones Industrial
Average, which returned 3.72% and 3.17%, respectively, for the same period.
The Fund underperformed its primary benchmark predominantly as a result of stock selection in the Consumer Staples, Industrials, and Energy sectors. The largest detractors from performance
within each of these sectors during the period were Walgreens Boots Alliance, Inc., 3M Company, and Chevron Corporation. The largest contributors to performance during the period were investments in the Information Technology, Health Care,
and Financials sectors. The largest contributors to performance within these sectors were Intel Corporation, Merck & Co., Inc., and JPMorgan Chase & Co.
The Fund continues to own all the companies mentioned except for Merck & Co.
Portfolio Strategy:
The Fund invests approximately 75% of its assets in the “Dogs of the Dow,” the 10 highest dividend-yielding Dow stocks, and 25% of its assets in U.S. Treasuries. As a result of this “blended” strategy, we expect
the Fund to outperform equities in periods when equity markets fall and underperform in periods when equity markets rise. The Fund is designed to allow its investors to gain exposure to the equity market while maintaining a significant
percentage of its investment in fixed income securities. We believe the Fund is well positioned for the more conservative investor because the equity portion of the portfolio is invested in what we deem to be high-quality companies, each of
which pay a quarterly dividend, while the balance of the Fund is invested in lower-risk, short-duration U.S. Treasuries.
Investment Commentary:
Notwithstanding a rebound in equity prices over the last twelve months, we believe that the outlook for U.S. stocks remains positive. We continue to believe that equities are attractive from a valuation
standpoint, even in the face of an expected slowdown in economic activity. While the Federal Reserve has raised rates several times throughout the last year, we believe that the prospect of slower economic growth and lower inflation numbers
could prompt the Federal Reserve to put any further rate hikes on hold. With the unemployment rate near record lows, high levels of cash on the balance sheets of U.S. companies, and the prospect of a more dovish Federal Reserve in 2024, we
remain bullish on equities long-term.
If the market experiences further weakness, we would expect our more defensive holdings to perform well relative to the market. The relatively short duration of the 25% weighting of U.S.
Treasuries in the portfolio (all less than three months) may allow us the ability to roll into higher-yielding Treasuries in the event interest rates continue to rise.
_______________
Opinions expressed are those of the Portfolio Managers as of the date written and are subject to change, are not guaranteed, and should not be considered investment advice or an indication of trading intent.
|
HENNESSY FUNDS
|
1-800-966-4354
|
7
The Fund is non-diversified, meaning it may concentrate its assets in fewer individual holdings than a diversified fund, making it more exposed to individual stock volatility than a diversified
fund. The Fund’s formula-based strategy may cause the Fund to buy or sell securities at times when it may not be advantageous. Please see the Fund’s prospectus for a more complete discussion of these and other risks.
References to specific securities should not be considered a recommendation to buy or sell any security. Fund holdings and sector allocations are subject to change. Please refer to the Schedule of Investments
included in this report for additional portfolio information.
|
WWW.HENNESSYFUNDS.COM
|
8
|
PERFORMANCE OVERVIEW/SCHEDULE OF INVESTMENTS
|
Financial Statements
|
Schedule of Investments as of October 31, 2023
|
HENNESSY TOTAL RETURN FUND
(% of Net Assets)
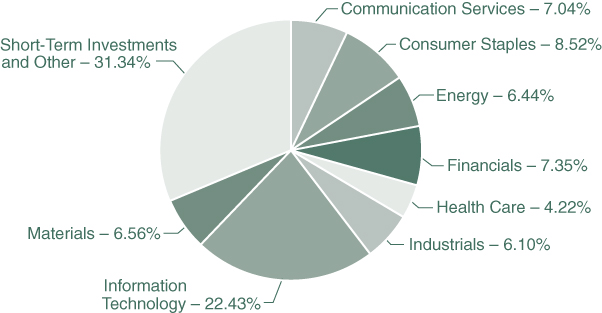
|
TOP TEN HOLDINGS (EXCLUDING MONEY MARKET FUNDS)
|
% NET ASSETS
|
|
U.S. Treasury Bill, 5.340%, 01/11/2024
|
31.22%
|
|
U.S. Treasury Bill, 5.290%, 11/09/2023
|
18.91%
|
|
U.S. Treasury Bill, 5.295%, 12/14/2023
|
18.81%
|
|
Intel Corp.
|
7.72%
|
|
International Business Machines Corp.
|
7.64%
|
|
Cisco Systems, Inc.
|
7.07%
|
|
Verizon Communications, Inc.
|
7.04%
|
|
JPMorgan Chase & Co.
|
6.96%
|
|
Dow, Inc.
|
6.56%
|
|
Chevron Corp.
|
6.44%
|
Note: For presentation purposes, the Fund has grouped some of the industry categories. For purposes of categorizing securities for compliance with Section 8(b)(1) of the Investment Company Act of 1940, as amended,
the Fund uses more specific industry classifications.
The Global Industry Classification Standard (GICS®) was developed by and is the exclusive property and a service mark of MSCI, Inc.
and Standard & Poor’s Financial Services LLC. It has been licensed for use by the Hennessy Funds.
|
HENNESSY FUNDS
|
1-800-966-4354
|
9
|
COMMON STOCKS – 68.66%
|
Number
|
% of
|
||||||||||
|
|
of Shares
|
Value
|
Net Assets
|
|||||||||
|
Communication Services – 7.04%
|
||||||||||||
|
Verizon Communications, Inc.
|
95,300
|
$
|
3,347,889
|
7.04
|
%
|
|||||||
|
Consumer Staples – 8.52%
|
||||||||||||
|
The Coca-Cola Co.
|
32,800
|
1,852,872
|
3.90
|
%
|
||||||||
|
Walgreens Boots Alliance, Inc.
|
104,300
|
2,198,644
|
4.62
|
%
|
||||||||
|
|
4,051,516
|
8.52
|
%
|
|||||||||
|
Energy – 6.44%
|
||||||||||||
|
Chevron Corp.
|
21,000
|
3,060,330
|
6.44
|
%
|
||||||||
|
Financials – 7.35%
|
||||||||||||
|
JPMorgan Chase & Co.
|
23,800
|
3,309,628
|
6.96
|
%
|
||||||||
|
The Goldman Sachs Group, Inc.
|
600
|
182,166
|
0.39
|
%
|
||||||||
|
|
3,491,794
|
7.35
|
%
|
|||||||||
|
Health Care – 4.22%
|
||||||||||||
|
Amgen, Inc.
|
7,100
|
1,815,470
|
3.81
|
%
|
||||||||
|
Johnson & Johnson
|
1,300
|
192,842
|
0.41
|
%
|
||||||||
|
|
2,008,312
|
4.22
|
%
|
|||||||||
|
Industrials – 6.10%
|
||||||||||||
|
3M Co.
|
31,900
|
2,901,305
|
6.10
|
%
|
||||||||
|
Information Technology – 22.43%
|
||||||||||||
|
Cisco Systems, Inc.
|
64,500
|
3,362,385
|
7.07
|
%
|
||||||||
|
Intel Corp.
|
100,600
|
3,671,900
|
7.72
|
%
|
||||||||
|
International Business Machines Corp.
|
25,100
|
3,630,464
|
7.64
|
%
|
||||||||
|
|
10,664,749
|
22.43
|
%
|
|||||||||
|
Materials – 6.56%
|
||||||||||||
|
Dow, Inc.
|
64,500
|
3,117,930
|
6.56
|
%
|
||||||||
|
|
||||||||||||
|
Total Common Stocks
|
||||||||||||
|
(Cost $33,990,420)
|
32,643,825
|
68.66
|
%
|
|||||||||
The accompanying notes are an integral part of these financial statements.
|
WWW.HENNESSYFUNDS.COM
|
10
|
SCHEDULE OF INVESTMENTS
|
|
SHORT-TERM INVESTMENTS – 73.24%
|
Number of Shares/
|
% of
|
||||||||||
|
|
Par Amount
|
Value
|
Net Assets
|
|||||||||
|
Money Market Funds – 4.30%
|
||||||||||||
|
First American Treasury Obligations Fund – Class X, 5.275% (a)
|
2,045,029
|
$
|
2,045,029
|
4.30
|
%
|
|||||||
|
|
||||||||||||
|
U.S. Treasury Bills – 68.94%
|
||||||||||||
|
5.290%, 11/09/2023 (b)(c)
|
9,000,000
|
8,989,480
|
18.91
|
%
|
||||||||
|
5.295%, 12/14/2023 (b)(c)
|
9,000,000
|
8,943,133
|
18.81
|
%
|
||||||||
|
5.340%, 01/11/2024 (b)(c)
|
15,000,000
|
14,843,503
|
31.22
|
%
|
||||||||
|
|
32,776,116
|
68.94
|
%
|
|||||||||
|
|
||||||||||||
|
Total Short-Term Investments
|
||||||||||||
|
(Cost $34,820,258)
|
34,821,145
|
73.24
|
%
|
|||||||||
|
|
||||||||||||
|
Total Investments
|
||||||||||||
|
(Cost $68,810,678) – 141.90%
|
67,464,970
|
141.90
|
%
|
|||||||||
|
Liabilities in Excess of Other Assets – (41.90)%
|
(19,921,669
|
)
|
(41.90
|
)%
|
||||||||
|
TOTAL NET ASSETS – 100.00%
|
$
|
47,543,301
|
100.00
|
%
|
||||||||
Percentages are stated as a percent of net assets.
|
(a)
|
The rate listed is the fund’s seven-day yield as of October 31, 2023.
|
|
(b)
|
The rate listed is the discount rate at issue.
|
|
(c)
|
All or a portion of this security is pledged as collateral for securities sold subject to repurchase. The aggregate fair value of the collateral is $21,850,742.
|
Summary of Fair Value Exposure as of October 31, 2023
The following is a summary of the inputs used to value the Fund’s net assets as of October 31, 2023 (see Note 3 in the accompanying Notes to the Financial Statements):
|
Common Stocks
|
Level 1
|
Level 2
|
Level 3
|
Total
|
||||||||||||
|
Communication Services
|
$
|
3,347,889
|
$
|
—
|
$
|
—
|
$
|
3,347,889
|
||||||||
|
Consumer Staples
|
4,051,516
|
—
|
—
|
4,051,516
|
||||||||||||
|
Energy
|
3,060,330
|
—
|
—
|
3,060,330
|
||||||||||||
|
Financials
|
3,491,794
|
—
|
—
|
3,491,794
|
||||||||||||
|
Health Care
|
2,008,312
|
—
|
—
|
2,008,312
|
||||||||||||
|
Industrials
|
2,901,305
|
—
|
—
|
2,901,305
|
||||||||||||
|
Information Technology
|
10,664,749
|
—
|
—
|
10,664,749
|
||||||||||||
|
Materials
|
3,117,930
|
—
|
—
|
3,117,930
|
||||||||||||
|
Total Common Stocks
|
$
|
32,643,825
|
$
|
—
|
$
|
—
|
$
|
32,643,825
|
||||||||
|
Short-Term Investments
|
||||||||||||||||
|
Money Market Funds
|
$
|
2,045,029
|
$
|
—
|
$
|
—
|
$
|
2,045,029
|
||||||||
|
U.S. Treasury Bills
|
—
|
32,776,116
|
—
|
32,776,116
|
||||||||||||
|
Total Short-Term Investments
|
$
|
2,045,029
|
$
|
32,776,116
|
$
|
—
|
$
|
34,821,145
|
||||||||
|
Total Investments
|
$
|
34,688,854
|
$
|
32,776,116
|
$
|
—
|
$
|
67,464,970
|
||||||||
The accompanying notes are an integral part of these financial statements.
|
HENNESSY FUNDS
|
1-800-966-4354
|
11
Schedule of Reverse Repurchase Agreements
|
Principal
|
Maturity
|
Maturity
|
||||||||||||
|
Face Value
|
Counterparty
|
Rate
|
Trade Date
|
Date
|
Amount
|
|||||||||
|
$
|
5,397,000
|
Jefferies LLC
|
5.60%
|
|
8/10/23
|
11/9/23
|
$
|
5,472,558
|
||||||
|
5,397,000
|
Jefferies LLC
|
5.65%
|
|
9/14/23
|
12/14/23
|
5,473,232
|
||||||||
|
8,995,000
|
Jefferies LLC
|
5.70%
|
|
10/12/23
|
1/11/24
|
9,123,179
|
||||||||
|
$
|
19,789,000
|
$
|
20,068,969
|
|||||||||||
As of October 31, 2023, the fair value of securities held as collateral for reverse repurchase agreements was $21,850,742 as noted on the Schedule of Investments.
Reverse repurchase agreements are carried at face value; hence, they are not included in the fair valuation hierarchy. The face value of the reverse repurchase agreements at October 31, 2023,
was $19,789,000. Due to the short-term nature of the reverse repurchase agreements, face value approximates fair value. The face value plus interest due at maturity is equal to $20,068,969.
The accompanying notes are an integral part of these financial statements.
|
WWW.HENNESSYFUNDS.COM
|
12
|
SCHEDULE OF INVESTMENTS/STATEMENT OF ASSETS AND LIABILITIES
|
Financial Statements
|
Statement of Assets and Liabilities as of October 31, 2023
|
|
ASSETS:
|
||||
|
Investments in securities, at value (cost $68,810,678)
|
$
|
67,464,970
|
||
|
Dividends and interest receivable
|
71,647
|
|||
|
Receivable for fund shares sold
|
31
|
|||
|
Prepaid expenses and other assets
|
12,338
|
|||
|
Total assets
|
67,548,986
|
|||
|
LIABILITIES:
|
||||
|
Payable to advisor
|
24,373
|
|||
|
Payable to administrator
|
9,477
|
|||
|
Payable to auditor
|
22,746
|
|||
|
Accrued distribution fees
|
7,806
|
|||
|
Accrued service fees
|
4,062
|
|||
|
Reverse repurchase agreements
|
19,789,000
|
|||
|
Accrued interest payable
|
135,712
|
|||
|
Accrued trustees fees
|
5,813
|
|||
|
Accrued expenses and other payables
|
6,696
|
|||
|
Total liabilities
|
20,005,685
|
|||
|
NET ASSETS
|
$
|
47,543,301
|
||
|
NET ASSETS CONSISTS OF:
|
||||
|
Capital stock
|
$
|
46,821,718
|
||
|
Total distributable earnings
|
721,583
|
|||
|
Total net assets
|
$
|
47,543,301
|
||
|
NET ASSETS:
|
||||
|
Investor Class
|
||||
|
Shares authorized (no par value)
|
Unlimited
|
|||
|
Net assets applicable to outstanding shares
|
$
|
47,543,301
|
||
|
Shares issued and outstanding
|
3,793,030
|
|||
|
Net asset value, offering price, and redemption price per share
|
$
|
12.53
|
||
The accompanying notes are an integral part of these financial statements.
|
HENNESSY FUNDS
|
1-800-966-4354
|
13
Financial Statements
|
Statement of Operations for the year ended October 31, 2023
|
|
INVESTMENT INCOME:
|
||||
|
Dividend income
|
$
|
1,598,510
|
||
|
Interest income
|
1,760,408
|
|||
|
Total investment income
|
3,358,918
|
|||
|
EXPENSES:
|
||||
|
Interest expense (See Notes 7 and 9)
|
1,111,239
|
|||
|
Investment advisory fees (See Note 5)
|
313,920
|
|||
|
Distribution fees – Investor Class (See Note 5)
|
78,480
|
|||
|
Administration, accounting, custody, and transfer agent fees (See Note 5)
|
59,808
|
|||
|
Service fees – Investor Class (See Note 5)
|
52,320
|
|||
|
Sub-transfer agent expenses – Investor Class (See Note 5)
|
39,739
|
|||
|
Compliance expense (See Note 5)
|
22,668
|
|||
|
Audit fees
|
22,747
|
|||
|
Federal and state registration fees
|
21,560
|
|||
|
Trustees’ fees and expenses
|
20,493
|
|||
|
Reports to shareholders
|
10,154
|
|||
|
Legal fees
|
1,687
|
|||
|
Other expenses
|
9,517
|
|||
|
Total expenses
|
1,764,332
|
|||
|
NET INVESTMENT INCOME
|
$
|
1,594,586
|
||
|
REALIZED AND UNREALIZED GAINS (LOSSES):
|
||||
|
Net realized gain on investments
|
$
|
2,437,331
|
||
|
Net change in unrealized appreciation/depreciation on investments
|
(3,681,426
|
)
|
||
|
Net loss on investments
|
(1,244,095
|
)
|
||
|
NET INCREASE IN NET ASSETS RESULTING FROM OPERATIONS
|
$
|
350,491
|
||
The accompanying notes are an integral part of these financial statements.
|
WWW.HENNESSYFUNDS.COM
|
14
|
STATEMENT OF OPERATIONS/STATEMENTS OF CHANGES IN NET ASSETS
|
Financial Statements
|
Statements of Changes in Net Assets
|
|
Year Ended
|
Year Ended
|
|||||||
|
October 31, 2023
|
October 31, 2022
|
|||||||
|
OPERATIONS:
|
||||||||
|
Net investment income
|
$
|
1,594,586
|
$
|
870,240
|
||||
|
Net realized gain on investments
|
2,437,331
|
3,139,523
|
||||||
|
Net change in unrealized
|
||||||||
|
appreciation/depreciation on investments
|
(3,681,426
|
)
|
(3,362,849
|
)
|
||||
|
Net increase in net assets resulting from operations
|
350,491
|
646,914
|
||||||
|
DISTRIBUTIONS TO SHAREHOLDERS:
|
||||||||
|
Distributable earnings – Investor Class
|
(4,133,781
|
)
|
(852,484
|
)
|
||||
|
Total distributions
|
(4,133,781
|
)
|
(852,484
|
)
|
||||
|
CAPITAL SHARE TRANSACTIONS:
|
||||||||
|
Proceeds from shares subscribed – Investor Class
|
4,112,285
|
3,818,336
|
||||||
|
Dividends reinvested – Investor Class
|
3,946,628
|
810,781
|
||||||
|
Cost of shares redeemed – Investor Class
|
(10,088,636
|
)
|
(5,519,799
|
)
|
||||
|
Net decrease in net assets derived
|
||||||||
|
from capital share transactions
|
(2,029,723
|
)
|
(890,682
|
)
|
||||
|
TOTAL DECREASE IN NET ASSETS
|
(5,813,013
|
)
|
(1,096,252
|
)
|
||||
|
NET ASSETS:
|
||||||||
|
Beginning of year
|
53,356,314
|
54,452,566
|
||||||
|
End of year
|
$
|
47,543,301
|
$
|
53,356,314
|
||||
|
CHANGES IN SHARES OUTSTANDING:
|
||||||||
|
Shares sold – Investor Class
|
308,055
|
278,708
|
||||||
|
Shares issued to holders as reinvestment
|
||||||||
|
of dividends – Investor Class
|
299,644
|
60,970
|
||||||
|
Shares redeemed – Investor Class
|
(774,401
|
)
|
(402,382
|
)
|
||||
|
Net decrease in shares outstanding
|
(166,702
|
)
|
(62,704
|
)
|
||||
The accompanying notes are an integral part of these financial statements.
|
HENNESSY FUNDS
|
1-800-966-4354
|
15
Financial Statements
|
Statement of Cash Flows for the year ended October 31, 2023
|
|
Cash flows from operating activities:
|
||||
|
Net increase in net assets from operations
|
$
|
350,491
|
||
|
Adjustments to reconcile net increase in net assets resulting
|
||||
|
from operations to net cash provided by operating activities:
|
||||
|
Payments to purchase securities
|
(13,336,644
|
)
|
||
|
Proceeds from sale of securities
|
17,037,438
|
|||
|
Proceeds from securities litigation
|
122
|
|||
|
Net sale of short term investments
|
4,349,095
|
|||
|
Realized gain on investments in securities
|
(2,437,331
|
)
|
||
|
Net accretion of discount on securities
|
(1,696,612
|
)
|
||
|
Change in unrealized appreciation/depreciation on investments in securities
|
3,681,426
|
|||
|
(Increases) decreases in operating assets:
|
||||
|
Increase in dividends and interest receivable
|
(18,050
|
)
|
||
|
Increase in prepaid expenses and other assets
|
(1,037
|
)
|
||
|
Increases (decreases) in operating liabilities:
|
||||
|
Decrease in payable to advisor
|
(1,408
|
)
|
||
|
Decrease in payable to administrator
|
(1,976
|
)
|
||
|
Decrease in payable for distribution fees
|
(12,846
|
)
|
||
|
Decrease in payable for service fees
|
(235
|
)
|
||
|
Increase in accrued interest payable
|
49,190
|
|||
|
Decrease in accrued audit fees
|
(3
|
)
|
||
|
Increase in accrued trustee fees
|
687
|
|||
|
Decrease in other accrued expenses and payables
|
(2,764
|
)
|
||
|
Net cash provided by operating securities
|
7,959,543
|
|||
|
Cash flows from financing activities:
|
||||
|
Decrease in reverse repurchase agreements
|
(1,799,000
|
)
|
||
|
Proceeds on shares sold
|
4,118,452
|
|||
|
Payment on shares redeemed
|
(10,091,842
|
)
|
||
|
Distributions paid in cash, net of reinvestments
|
(187,153
|
)
|
||
|
Net cash used for financing activities
|
(7,959,543
|
)
|
||
|
Net increase in cash
|
—
|
|||
|
Cash:
|
||||
|
Beginning balance
|
—
|
|||
|
Ending balance
|
$
|
—
|
||
|
Supplemental information:
|
||||
|
Non-cash financing activities not included herein, consisting
|
||||
|
of dividend reinvestment of dividends and distributions
|
$
|
3,946,628
|
||
|
Cash paid for interest
|
$
|
1,062,049
|
||
The accompanying notes are an integral part of these financial statements.
|
WWW.HENNESSYFUNDS.COM
|
16
|
STATEMENT OF CASH FLOWS
|
(This Page Intentionally Left Blank.)
|
HENNESSY FUNDS
|
1-800-966-4354
|
17
Financial Statements
|
Financial Highlights
|
For an Investor Class share outstanding throughout each year
PER SHARE DATA:
Net asset value, beginning of year
Income from investment operations:
Net investment income(1)
Net realized and unrealized gains (losses) on investments
Total from investment operations
Less distributions:
Dividends from net investment income
Dividends from net realized gains
Total distributions
Net asset value, end of year
TOTAL RETURN
SUPPLEMENTAL DATA AND RATIOS:
Net assets, end of year (millions)
Ratio of expenses to average net assets
Ratio of net investment income to average net assets
Portfolio turnover rate
|
(1)
|
Calculated using the average shares outstanding method.
|
The accompanying notes are an integral part of these financial statements.
|
WWW.HENNESSYFUNDS.COM
|
18
|
FINANCIAL HIGHLIGHTS — INVESTOR CLASS
|
|
Year Ended October 31,
|
||||||||||||||||||
|
2023
|
2022
|
2021
|
2020
|
2019
|
||||||||||||||
|
$
|
13.47
|
$
|
13.54
|
$
|
11.97
|
$
|
13.98
|
$
|
13.57
|
|||||||||
|
0.40
|
0.22
|
0.20
|
0.27
|
0.24
|
||||||||||||||
|
(0.30
|
)
|
(0.07
|
)
|
2.33
|
(1.99
|
)
|
0.81
|
|||||||||||
|
0.10
|
0.15
|
2.53
|
(1.72
|
)
|
1.05
|
|||||||||||||
|
(0.38
|
)
|
(0.22
|
)
|
(0.20
|
)
|
(0.29
|
)
|
(0.24
|
)
|
|||||||||
|
(0.66
|
)
|
—
|
(0.76
|
)
|
—
|
(0.40
|
)
|
|||||||||||
|
(1.04
|
)
|
(0.22
|
)
|
(0.96
|
)
|
(0.29
|
)
|
(0.64
|
)
|
|||||||||
|
$
|
12.53
|
$
|
13.47
|
$
|
13.54
|
$
|
11.97
|
$
|
13.98
|
|||||||||
|
0.53
|
%
|
1.12
|
%
|
21.72
|
%
|
-12.36
|
%
|
7.93
|
%
|
|||||||||
|
$
|
47.54
|
$
|
53.36
|
$
|
54.45
|
$
|
50.67
|
$
|
72.94
|
|||||||||
|
3.37
|
%
|
1.77
|
%
|
1.35
|
%
|
1.73
|
%
|
2.31
|
%
|
|||||||||
|
3.05
|
%
|
1.62
|
%
|
1.52
|
%
|
2.05
|
%
|
1.74
|
%
|
|||||||||
|
36
|
%
|
24
|
%
|
19
|
%
|
39
|
%
|
30
|
%
|
|||||||||
The accompanying notes are an integral part of these financial statements.
|
HENNESSY FUNDS
|
1-800-966-4354
|
19
Financial Statements
|
Notes to the Financial Statements October 31, 2023
|
1). ORGANIZATION
The Hennessy Total Return Fund (the “Fund”) is a series of Hennessy Funds Trust (the “Trust”), which was organized as a Delaware statutory trust on September 17, 1992. The Fund is an open-end management investment
company registered under the Investment Company Act of 1940, as amended. The investment objective of the Fund is total return, consisting of capital appreciation and current income. The Fund is a non-diversified fund and offers Investor
Class shares.
As an investment company, the Fund follows the investment company accounting and reporting guidance of the Financial Accounting Standards Board (the “FASB”) Accounting Standard Codification
Topic 946 “Financial Services—Investment Companies.”
2). SIGNIFICANT ACCOUNTING POLICIES
The following is a summary of significant accounting policies consistently followed by the Fund in the preparation of the financial statements. These policies conform to U.S. generally accepted accounting
principles (“GAAP”).
|
a).
|
Securities Valuation – All investments in securities are valued in accordance with the Fund’s valuation policies and procedures, as described in Note 3.
|
|
b).
|
Federal Income Taxes – The Fund has elected to be taxed as a regulated investment company and intends to distribute substantially all of its taxable income to its shareholders and otherwise comply with the
provisions of the Internal Revenue Code of 1986, as amended, applicable to regulated investment companies. As a result, the Fund has made no provision for federal income taxes or excise taxes. Net investment income/loss and realized
gains/losses for federal income tax purposes may differ from those reported in the financial statements because of temporary book-basis and tax-basis differences. Temporary differences are primarily the result of the treatment of
wash sales for tax reporting purposes. The Fund recognizes interest and penalties related to income tax benefits, if any, in the Statement of Operations as an income tax expense. Distributions from net realized gains for book
purposes may include short-term capital gains, which are included as ordinary income to shareholders for tax purposes. The Fund may utilize equalization accounting for tax purposes and designate earnings and profits, including net
realized gains distributed to shareholders on redemption of shares, as part of the dividends paid deduction for income tax purposes.
|
|
Due to inherent differences in the recognition of income, expenses, and realized gains/losses under GAAP and federal income tax
regulations, permanent differences between book and tax basis for reporting are identified and appropriately reclassified in the Statement of Assets and Liabilities, as needed. The adjustments for fiscal year 2023 are as follows:
|
|
Total
|
|||
|
Distributable
|
|||
|
Earnings
|
Capital Stock
|
||
|
$(475,365)
|
$475,365
|
|
WWW.HENNESSYFUNDS.COM
|
20
|
NOTES TO THE FINANCIAL STATEMENTS
|
|
c).
|
Accounting for Uncertainty in Income Taxes – The Fund has accounting policies regarding recognition and measurement of tax positions taken or expected to be taken on a tax return. The tax returns of the
Fund for the prior three fiscal years are open for examination. The Fund has reviewed all open tax years in major tax jurisdictions and concluded that there is no impact on the Fund’s net assets and no tax liability resulting from
unrecognized tax benefits relating to uncertain income tax positions taken or expected to be taken on a tax return. The Fund’s major tax jurisdictions are U.S. federal and Delaware.
|
|
d).
|
Income and Expenses – Dividend income is recognized on the ex-dividend date or as soon as information is available to the Fund. Interest income, which includes the amortization of premium and accretion of
discount, is recognized on an accrual basis. Market discounts, original issue discounts, and market premiums on debt securities are accreted or amortized to interest income over the life of a security with a corresponding increase
or decrease, as applicable, in the cost basis of such security using the yield-to-maturity method or, where applicable, the first call date of the security. Other non-cash dividends are recognized as investment income at the fair
value of the property received. The Fund is charged for those expenses that are directly attributable to its portfolio, such as advisory, administration, and certain shareholder service fees.
|
|
e).
|
Distributions to Shareholders – Dividends from net investment income for the Fund, if any, are declared and paid at the end of each calendar quarter. Distributions of net realized capital gains, if any,
are declared and paid annually, usually in December.
|
|
f).
|
Security Transactions – Investment and shareholder transactions are recorded on the trade date. The Fund determines the realized gain/loss from an investment transaction by comparing the original cost of
the security lot sold with the net sale proceeds. Discounts and premiums on securities purchased are accreted or amortized, respectively, over the life of each such security.
|
|
g).
|
Use of Estimates – Preparing financial statements in accordance with GAAP requires management to make estimates and assumptions that affect the reported amounts of assets and liabilities and disclosure of
contingent assets and liabilities at the date of the financial statements, as well as the reported change in net assets during the reporting period. Actual results could differ from those estimates.
|
|
h).
|
Share Valuation – The net asset value (“NAV”) per share of the Fund is calculated by dividing (i) the total value of the securities held by the Fund, plus cash and other assets, minus all liabilities
(including estimated accrued expenses) by (ii) the total number of Fund shares outstanding, rounded to the nearest $0.01. Fund shares are not priced on days the New York Stock Exchange is closed for trading. The offering and
redemption price per share for the Fund is equal to the Fund’s NAV per share.
|
|
i).
|
Reverse Repurchase Agreements – Transactions involving reverse repurchase agreements are treated as collateralized financing transactions and are recorded at their contracted resell or repurchase amounts,
which approximates fair value. Upon entering into a reverse repurchase agreement transaction, the Fund establishes a segregated account in which it maintains liquid assets in an amount at least equal to the repurchase price marked
to market daily (including accrued interest), and the Fund subsequently monitors the account to ensure that it maintains such equivalent value. Interest on reverse repurchase agreements is included in interest payable.
|
|
HENNESSY FUNDS
|
1-800-966-4354
|
21
|
As of October 31, 2023, securities with a fair value of $21,850,742, which are included in investments in securities in the Statement
of Assets and Liabilities, were pledged to collateralize reverse repurchase agreements.
|
|
|
j).
|
Offsetting Assets and Liabilities – The Fund follows the financial reporting rules regarding offsetting assets and liabilities and related netting arrangements to enable users of its financial statements
to understand the effect of those arrangements on its financial position. Reverse repurchase transactions are entered into by the Fund under Master Repurchase Agreements (“MRAs”) that permit the Fund, under certain circumstances,
including an event of default (such as bankruptcy or insolvency), to offset payables under the MRA with collateral held with the counterparty and create one single net payment from the Fund. Upon a bankruptcy or insolvency of the
MRA counterparty, the Fund is considered an unsecured creditor with respect to excess collateral and, as such, the return of excess collateral may be delayed. In the event the buyer of securities under an MRA files for bankruptcy or
becomes insolvent, the Fund’s use of the proceeds of the MRA may be restricted while the other party, or its trustee or receiver, determines whether or not to enforce the Fund’s obligation to repurchase the securities. For
additional information regarding the offsetting of assets and liabilities as of October 31, 2023, please refer to the table in Note 9.
|
|
k).
|
Illiquid Securities – Pursuant to Rule 22e-4 under the 1940 Act, the Fund has adopted a Liquidity Risk Management Program (the “Liquidity Program”). The Liquidity Program requires, among other things, that
the Fund limit its illiquid investments to no more than 15% of its net assets. An illiquid investment is any investment that the Fund reasonably expects cannot be sold or disposed of by the Fund in current market conditions in seven
calendar days or less without the sale or disposition significantly changing the market value of the investment.
|
|
l).
|
Recent Accounting Pronouncements and Regulatory Updates – In October 2022, the Securities and Exchange Commission (“SEC”) adopted a final rule relating to Tailored Shareholder Reports for Mutual Funds and
Exchange-Traded Funds (ETFs); Fee Information in Investment Company Advertisements. The rule and form amendments will require mutual funds and ETFs to transmit concise and visually engaging shareholder reports that highlight key
information. The amendments also will require that funds tag information in a structured data format. In addition, the rule amendments will require that certain more in-depth information be made available online and available for
delivery free of charge to investors on request. The amendments became effective January 24, 2023. There is an 18-month transition period after the effective date of the amendment.
|
|
In June 2022, the FASB issued Accounting Standards Update (“ASU”) 2022-03, Fair Value Measurement (Topic 820): Fair Value Measurement
of Equity Securities Subject to Contractual Sale Restrictions. The ASU clarifies that a contractual restriction on the sale of an equity security is not considered part of the unit of account of the equity security and, therefore,
is not considered in measuring the fair value. The amendments also require additional disclosures related to equity securities subject to contractual sale restrictions. The ASU is effective for fiscal years beginning after December
15, 2023, and interim periods within those fiscal years.
|
3). SECURITIES VALUATION
The Fund follows its valuation policies and procedures in determining its NAV and, in preparing these financial statements, the fair value accounting standards that establish an
|
WWW.HENNESSYFUNDS.COM
|
22
|
NOTES TO THE FINANCIAL STATEMENTS
|
authoritative definition of fair value and set out a hierarchy for measuring fair value. These standards require additional disclosures about the various inputs and valuation techniques used to develop the
measurements of fair value and a discussion of changes in valuation techniques and related inputs during the period. These inputs are summarized in the three broad levels listed below:
|
Level 1 –
|
Unadjusted, quoted prices in active markets for identical instruments that the Fund has the ability to access at the date of measurement.
|
|
|
Level 2 –
|
Other significant observable inputs other than quoted prices included in Level 1 (including, but not limited to, quoted prices in active markets for similar instruments, quoted prices in markets that are
not active for identical or similar instruments, and model-derived valuations in which all significant inputs and significant value drivers are observable in active markets, such as interest rates, prepayment speeds, credit risk
curves, default rates, and similar data).
|
|
|
Level 3 –
|
Significant unobservable inputs (including the Fund’s own assumptions about what market participants would use to price the asset or liability based on the best available information) when observable
inputs are unavailable.
|
The following is a description of the valuation techniques applied to the Fund’s major categories of assets and liabilities on a recurring basis:
|
Equity Securities – Equity securities, including common stocks, preferred stocks, exchange-traded funds, closed-end mutual funds, partnerships, rights, and real
estate investment trusts, that are traded on a securities exchange for which a last-quoted sales price is readily available generally are valued at the last sales price as reported by the primary exchange on which the securities are
listed. Securities listed on The Nasdaq Stock Market (“Nasdaq”) generally are valued at the Nasdaq Official Closing Price, which may differ from the last sales price reported. Securities traded on a securities exchange for which a
last-quoted sales price is not readily available generally are valued at the mean between the bid and ask prices. To the extent these securities are actively traded and valuation adjustments are not applied, they are classified in
Level 1 of the fair value hierarchy.
|
|
|
Registered Investment Companies – Investments in open-end registered investment companies, commonly referred to as mutual funds, generally are priced at the ending
NAV provided by the applicable mutual fund’s service agent and are classified in Level 1 of the fair value hierarchy.
|
|
|
Debt Securities – Debt securities, including corporate bonds, asset-backed securities, mortgage-backed securities, municipal bonds, U.S. Treasuries, and U.S.
government agency issues, are generally valued at market on the basis of valuations furnished by an independent pricing service that utilizes both dealer-supplied valuations and formula-based techniques. The pricing service may
consider recently executed transactions in securities of the issuer or comparable issuers, market price quotations (where observable), bond spreads, and fundamental data relating to the issuer. In addition, the model may incorporate
observable market data, such as reported sales of similar securities, broker quotes, yields, bids, offers, and reference data. Certain securities are valued primarily using dealer quotations. These securities are generally
classified in Level 2 of the fair value hierarchy.
|
|
|
Short-Term Securities – Short-term equity investments, including money market funds, are valued in the manner specified above for equity securities. Short-term debt
|
|
HENNESSY FUNDS
|
1-800-966-4354
|
23
|
investments with an original term to maturity of 60 days or less are valued at amortized cost, which approximates fair market value. If the original term to maturity of a short-term debt investment exceeds
60 days, then the values as of the 61st day prior to maturity are amortized. Amortized cost is not used if its use would be inappropriate due to credit or other impairments of the issuer, in which case the security’s fair value
would be determined as described below. Short-term securities are generally classified in Level 1 or Level 2 of the fair value hierarchy depending on the inputs used and market activity levels for specific securities.
|
If market quotations are not readily available or if a significant event has occurred that indicates the closing price of a security no longer represents the true value of that security, any
security or other asset will be valued at its fair value in accordance with Rule 2a-5 under the 1940 Act. The Board of Trustees of the Fund (the “Board”) has designated Hennessy Advisors, Inc. (the “Advisor”) as the Fund’s valuation
designee to make all fair value determinations with respect to the Fund’s portfolio investments under the Fund’s fair value pricing procedures, subject to the Board’s oversight. There are numerous criteria considered in determining a fair
value of a security, such as the trading volume of a security and markets, the values of other similar securities, and news events with direct bearing on a security or markets. Fair value pricing results in an estimated price for a security
that reflects the amount the Fund might reasonably expect to receive in a current sale. Depending on the relative significance of the valuation inputs, these securities may be classified in either Level 2 or Level 3 of the fair value
hierarchy. The Advisor will regularly evaluate whether the Fund’s fair value pricing procedures continue to be appropriate in light of the specific circumstances of the Fund and the quality of prices obtained through their application of
such procedures.
The Fund has performed an analysis of all existing investments to determine the significance and character of all inputs to their fair value determinations. Various inputs are used to determine
the value of the Fund’s investments. The inputs or methodology used for valuing securities are not necessarily an indication of the risk associated with investing in those securities. Details related to the fair value hierarchy of the
Fund’s securities as of October 31, 2023, are included in the Schedule of Investments.
4). INVESTMENT TRANSACTIONS
Purchases and sales of investment securities (excluding government and short-term investments) for the Fund during fiscal year 2023 were $13,336,644 and $17,037,438, respectively.
There were no purchases or sales/maturities of long-term U.S. government securities for the Fund during fiscal year 2023.
5). INVESTMENT ADVISORY FEE AND OTHER TRANSACTIONS WITH AFFILIATES
The Advisor provides the Fund with investment advisory services under an Investment Advisory Agreement. The Advisor furnishes all investment advice, office space, and facilities and most of the personnel needed by
the Fund. As compensation for its services, the Advisor is entitled to a monthly fee from the Fund. The fee is based on the average daily net assets of the Fund at an annual rate of 0.60%. The net investment advisory fees expensed by the
Fund during fiscal year 2023 are included in the Statement of Operations.
The Board has approved a Shareholder Servicing Agreement for the Fund, which compensates the Advisor for the non-investment advisory services it provides to the Fund. The Shareholder Servicing
Agreement provides for a monthly fee paid to the
|
WWW.HENNESSYFUNDS.COM
|
24
|
NOTES TO THE FINANCIAL STATEMENTS
|
Advisor at an annual rate of 0.10% of the average daily net assets of the Fund. The shareholder service fees expensed by the Fund during fiscal year 2023 are included in the Statement of Operations.
The Fund has adopted a plan pursuant to Rule 12b-1 under the Investment Company Act of 1940, as amended, that authorizes payments in connection with the distribution of Fund shares at an annual
rate of up to 0.25% of the Fund’s average daily net assets. Even though the authorized rate is up to 0.25%, the Fund is currently only using up to 0.15% of its average daily net assets for such purpose. Amounts paid under the plan may be
spent on any activities or expenses primarily intended to result in the sale of shares, including, but not limited to, advertising, shareholder account servicing, printing and mailing of prospectuses to other than current shareholders,
printing and mailing of sales literature, and compensation for sales and marketing activities or to financial institutions and others, such as dealers and distributors. The distribution fees expensed by the Fund during fiscal year 2023 are
included in the Statement of Operations.
The Fund has entered into agreements with various brokers, dealers, and financial intermediaries in connection with the sale of Fund shares. The agreements provide for periodic payments of
sub-transfer agent expenses by the Fund to the brokers, dealers, and financial intermediaries for providing certain shareholder maintenance services. These shareholder services include the pre-processing and quality control of new accounts,
shareholder correspondence, answering customer inquiries regarding account status, and facilitating shareholder telephone transactions. The sub-transfer agent fees expensed by the Fund during fiscal year 2023 are included in the Statement
of Operations.
U.S. Bancorp Fund Services, LLC, d/b/a U.S. Bank Global Fund Services (“Fund Services”) provides the Fund with administrative, accounting, and transfer agent services. As administrator, Fund
Services is responsible for activities such as (i) preparing various federal and state regulatory filings, reports, and returns for the Fund, (ii) preparing reports and materials to be supplied to the Board, (iii) monitoring the activities
of the Fund’s custodian, transfer agent, and accountants, and (iv) coordinating the preparation and payment of the Fund’s expenses and reviewing the Fund’s expense accruals. U.S. Bank N.A., an affiliate of Fund Services, serves as the
Fund’s custodian. The servicing agreements between the Trust, Fund Services, and U.S. Bank N.A. contain a fee schedule that is inclusive of administrative, accounting, custody, and transfer agent fees. The administrative, accounting,
custody, and transfer agent fees expensed by the Fund during fiscal year 2023 are included in the Statement of Operations.
Quasar Distributors, LLC, a wholly owned broker-dealer subsidiary of Foreside Financial Group, LLC, acts as the Fund’s principal underwriter in a continuous public offering of Fund shares.
The officers of the Fund are affiliated with the Advisor. With the exception of the Chief Compliance Officer, such officers receive no compensation from the Fund for serving in their respective
roles. The Fund, along with the other funds in the Hennessy Funds family (collectively, the “Hennessy Funds”), makes reimbursement payments on an equal basis to the Advisor for a portion of the salary and benefits associated with the office
of the Chief Compliance Officer. The compliance fees expensed by the Fund during fiscal year 2023 for reimbursement payments to the Advisor are included in the Statement of Operations.
|
HENNESSY FUNDS
|
1-800-966-4354
|
25
6). GUARANTEES AND INDEMNIFICATIONS
Under the Hennessy Funds’ organizational documents, their officers and trustees are indemnified by the Hennessy Funds against certain liabilities arising out of the performance of their duties to the Hennessy
Funds. Additionally, in the normal course of business, the Hennessy Funds enter into contracts with service providers that contain general indemnification clauses. The Fund’s maximum exposure under these arrangements is unknown as this
would involve future claims that may be made against the Fund that have not yet occurred. Currently, the Fund expects the risk of loss to be remote.
7). LINE OF CREDIT
The Fund has an uncommitted line of credit with the other Hennessy Funds in the amount of the lesser of (i) $100,000,000 or (ii) 33.33% of each Hennessy Fund’s net assets, or 30% for the Hennessy Gas Utility Fund,
the Hennessy Japan Fund, and the Hennessy Japan Small Cap Fund and 10% for the Hennessy Balanced Fund. The line of credit is intended to provide any necessary short-term financing in connection with shareholder redemptions, subject to
certain restrictions. The credit facility is with the Hennessy Funds’ custodian bank, U.S. Bank N.A. Borrowings under this arrangement bear interest at the bank’s prime rate and are secured by all of the Fund’s assets (as to its own
borrowings only). During fiscal year 2023, the Fund had an outstanding average daily balance and a weighted average interest rate of $7,019 and 7.84%, respectively. The interest expensed by the Fund under the line of credit during fiscal
year 2023 is included as a component of interest expense in the Statement of Operations. The maximum amount outstanding for the Fund during fiscal year 2023 was $398,000. As of October 31, 2023, the Fund did not have any borrowings
outstanding under the line of credit.
8). FEDERAL TAX INFORMATION
As of October 31, 2023, the components of accumulated earnings (losses) for income tax purposes were as follows:
|
Investments
|
|||||
|
Cost of investments for tax purposes
|
$
|
68,876,602
|
|||
|
Gross tax unrealized appreciation
|
$
|
4,317,858
|
|||
|
Gross tax unrealized depreciation
|
(5,729,490
|
)
|
|||
|
Net tax unrealized appreciation/(depreciation)
|
$
|
(1,411,632
|
)
|
||
|
Undistributed ordinary income
|
$
|
124,312
|
|||
|
Undistributed long-term capital gains
|
2,008,903
|
||||
|
Total distributable earnings
|
$
|
2,133,215
|
|||
|
Other accumulated gain/(loss)
|
$
|
—
|
|||
|
Total accumulated gain/(loss)
|
$
|
721,583
|
|||
The difference between book-basis unrealized appreciation/depreciation and tax-basis unrealized appreciation/depreciation (as shown above) is attributable primarily to wash sales.
As of October 31, 2023, the Fund had no tax-basis capital losses to offset future capital gains.
As of October 31, 2023, the Fund did not defer, on a tax basis, any late-year ordinary losses. Late-year ordinary losses are net ordinary losses incurred after December 31, 2022, but within the
taxable year, that are deemed to arise on the first day of the Fund’s next taxable year.
|
WWW.HENNESSYFUNDS.COM
|
26
|
NOTES TO THE FINANCIAL STATEMENTS
|
During fiscal years 2023 and 2022, the tax character of distributions paid by the Fund was as follows:
|
Year Ended
|
Year Ended
|
||||||||
|
October 31, 2023
|
October 31, 2022
|
||||||||
|
Ordinary income(1)
|
$
|
1,508,864
|
$
|
852,484
|
|||||
|
Long-term capital gains
|
2,624,917
|
—
|
|||||||
|
Total distributions
|
$
|
4,133,781
|
$
|
852,484
|
|||||
|
(1) Ordinary income includes short-term capital gains.
|
|||||||||
9). REVERSE REPURCHASE AGREEMENTS
Under a reverse repurchase agreement, the Fund sells securities and agrees to repurchase them at a mutually agreed date and price. Reverse repurchase agreements are regarded as a form of secured borrowing by the
Fund. Securities sold under reverse repurchase agreements are reflected as a liability in the Statement of Assets and Liabilities. Interest payments made under reverse repurchase agreements during fiscal year 2023 totaled $1,110,681 and are
recorded as a component of interest expense in the Statement of Operations.
During fiscal year 2023, the average daily balance and average interest rate in effect for reverse repurchase agreements were $21,947,800 and 5.00%, respectively. Below is information about the
scheduled maturity date, amount, and interest rate for outstanding reverse repurchase agreements as of October 31, 2023:
|
Maturity Date
|
Amount
|
Interest Rate
|
||
|
November 9, 2023
|
$5,397,000
|
5.60%
|
||
|
December 14, 2023
|
$5,397,000
|
5.65%
|
||
|
January 11, 2024
|
$8,995,000
|
5.70%
|
Outstanding reverse repurchase agreements as of October 31, 2023, comprised 41.62% of the Fund’s net assets.
Below is information about reverse repurchase agreements eligible for offset in the Statement of Assets and Liabilities, on both a gross and net basis:
|
Gross
|
Net
|
Gross Amounts Not
Offset in the Statement
of Assets and Liabilities
|
|||||||||||||||||||||
|
Amounts
|
Amounts
|
||||||||||||||||||||||
|
Offset
|
Presented
|
||||||||||||||||||||||
|
Gross
|
in the
|
in the
|
|||||||||||||||||||||
|
Amounts of
|
Statement of
|
Statement of
|
Collateral
|
||||||||||||||||||||
|
Recognized
|
Assets and
|
Assets and
|
Financial
|
Pledged
|
Net
|
||||||||||||||||||
|
Liabilities
|
Liabilities
|
Liabilities
|
Instruments
|
(Received)
|
Amount
|
||||||||||||||||||
|
$
|
19,789,000
|
$
|
—
|
$
|
19,789,000
|
$
|
19,789,000
|
$
|
—
|
$
|
—
|
||||||||||||
|
$
|
19,789,000
|
$
|
—
|
$
|
19,789,000
|
$
|
19,789,000
|
$
|
—
|
$
|
—
|
||||||||||||
For additional information, please refer to the “Offsetting Assets and Liabilities” section in Note 2.
10). GLOBAL EVENTS
A rise in protectionist trade policies, the possibility of a national or global recession, risks associated with pandemic and epidemic diseases, trade tensions, the possibility of changes to some international
trade agreements, political events, and continuing political tension and armed conflicts may adversely impact financial markets and the broader economy. For example, ongoing armed conflicts between Ukraine and Russia in Europe and among
|
HENNESSY FUNDS
|
1-800-966-4354
|
27
Israel, Hamas, and other militant groups in the Middle East have caused and could continue to cause significant market disruptions and volatility with the markets in Europe and the Middle East, and have had
negative impacts on markets in the United States. These events could also have negative effects on the Fund’s investments that cannot be foreseen at the present time. As global systems, economies and financial markets are increasingly
interconnected, events that once had only local impact are now more likely to have regional or even global effects. Events that occur in one country, region or financial market will, more frequently, adversely impact issuers in other
countries, regions, or markets. These impacts can be exacerbated by failures of governments and societies to adequately respond to an emerging event or threat. Your investment would be negatively impacted if the value of your portfolio
holdings decreases as a result of such events, if these events adversely impact the operations and effectiveness of the Advisor or other key service providers or if these events disrupt systems and processes necessary or beneficial to the
management of accounts. These events may negatively impact broad segments of businesses and populations and could have a significant and rapid negative impact on the performance of the Fund’s investments, increase the Fund’s volatility, or
exacerbate pre-existing risks to the Fund.
11). EVENTS SUBSEQUENT TO YEAR END
Management has evaluated the Fund’s related events and transactions that occurred subsequent to October 31, 2023, through the date of issuance of the Fund’s financial statements. Other than as disclosed below,
management has determined that there were no subsequent events requiring recognition or disclosure in the financial statements.
On December 7, 2023, capital gains were declared and paid to shareholders of record on December 6, 2023, as follows:
|
Long-term
|
|||
|
Investor Class
|
0.53706
|
|
WWW.HENNESSYFUNDS.COM
|
28
|
NOTES/REPORT OF INDEPENDENT REGISTERED PUBLIC ACCOUNTING FIRM
|
Report of Independent Registered Public
Accounting Firm
To the Board of Trustees of Hennessy Funds Trust
and the shareholders of the Hennessy Total Return Fund
Novato, CA
Opinion on the Financial Statements
We have audited the accompanying statement of assets and liabilities of the Hennessy Total Return Fund (the “Fund”), a series of Hennessy Funds Trust, including the schedule of investments, as of October 31, 2023,
the related statement of operations and cash flows for the year then ended, the statements of changes in net assets for each of the two years in the period then ended, the financial highlights for each of the five years in the period then
ended, and the related notes (collectively referred to as the “financial statements”). In our opinion, the financial statements present fairly, in all material respects, the financial position of the Fund as of October 31, 2023, the results
of its operations and its cash flows for the year then ended, the changes in its net assets for each of the two years in the period then ended, and the financial highlights for each of the five years in the period then ended in conformity
with accounting principles generally accepted in the United States of America.
Basis for Opinion
These financial statements are the responsibility of the Fund’s management. Our responsibility is to express an opinion on the Fund’s financial statements based on our audits. We are a public accounting firm
registered with the Public Company Accounting Oversight Board (United States) (“PCAOB”) and are required to be independent with respect to the Fund in accordance with the U.S. federal securities laws and the applicable rules and regulations
of the Securities and Exchange Commission and the PCAOB. We have served as the auditor of one or more of the funds in the Trust since 2002.
We conducted our audits in accordance with the standards of the PCAOB. Those standards require that we plan and perform the audit to obtain reasonable assurance about whether the financial statements are free of
material misstatement, whether due to error or fraud. The Fund is not required to have, nor were we engaged to perform, an audit of its internal control over financial reporting. As part of our audits we are required to obtain an
understanding of internal control over financial reporting, but not for the purpose of expressing an opinion on the effectiveness of the Fund’s internal control over financial reporting. Accordingly, we express no such opinion.
Our audits included performing procedures to assess the risks of material misstatement of the financial statements, whether due to error or fraud, and performing procedures that respond to those risks. Such
procedures included examining, on a test basis, evidence regarding the amounts and disclosures in the financial statements. Our audits also included evaluating the accounting principles used and significant estimates made by management, as
well as evaluating the overall presentation of the financial statements. Our procedures included confirmation of securities owned as of October 31, 2023 by correspondence with the custodian and broker. We believe that our audits provide a
reasonable basis for our opinion.
|
|
|
TAIT, WELLER & BAKER LLP
|
Philadelphia, Pennsylvania
December 22, 2023
|
HENNESSY FUNDS
|
1-800-966-4354
|
29
Trustees and Officers of the Fund (Unaudited)
The business and affairs of the Funds are managed under the direction of the Board of Trustees of the Trust, and the Board of Trustees elects the officers of the Trust (“Officers”). From time to time, the Board of
Trustees also has appointed advisers to the Board of Trustees (“Advisers”) with the intention of having qualified individuals serve in an advisory capacity to garner experience in the mutual fund and asset management industry and be
considered as potential Trustees in the future. There are currently two Advisers, Brian Alexander and A.J. Hennessy. As Advisers, Mr. Alexander and Mr. A.J. Hennessy attend meetings of the Board of Trustees and act as non-voting
participants. Information pertaining to the Trustees, Advisers, and the Officers of the Trust is set forth below. The Trustees and Officers serve until their successors are duly elected and qualified or until their earlier death,
resignation, or removal. Each Trustee oversees all 17 Hennessy Funds. Unless otherwise indicated, the address of all persons listed below is 7250 Redwood Boulevard, Suite 200, Novato, CA 94945. The Fund’s Statement of Additional Information
includes more information about the persons listed below and is available without charge by calling 800-966-4354 or by visiting www.hennessyfunds.com.
|
Other
|
|||
|
Directorships
|
|||
|
Held Outside
|
|||
|
Name, Age,
|
of Fund
|
||
|
and Position Held
|
Start Date
|
Principal Occupation(s)
|
Complex During
|
|
with the Trust
|
of Service
|
During Past Five Years
|
Past Five Years
|
|
Disinterested Trustees(1) and Disinterested Advisers
|
|||
|
J. Dennis DeSousa
|
January 1996
|
Mr. DeSousa is a real estate investor.
|
None.
|
|
87
|
|||
|
Trustee
|
|||
|
Robert T. Doyle
|
January 1996
|
Mr. Doyle is retired. He served as the
|
None.
|
|
76
|
Sheriff of Marin County, California
|
||
|
Trustee
|
from 1996 to June 2022.
|
||
|
Doug Franklin
|
March 2016
|
Mr. Franklin is a retired insurance
|
None.
|
|
59
|
as an Adviser
|
industry executive. From 1987
|
|
|
Trustee
|
to the Board
|
through 2015, he was employed by
|
|
|
and June 2023
|
the Allianz-Fireman’s Fund Insurance
|
||
|
as a Trustee
|
Company in various positions,
|
||
|
including as its Chief Actuary and
|
|||
|
Chief Risk Officer.
|
|||
|
Claire Garvie
|
December 2015
|
Ms. Garvie is a founder of Kiosk and
|
None.
|
|
49
|
as an Adviser
|
has served as its Chief Operating
|
|
|
Trustee
|
to the Board and
|
Officer since 2004. Kiosk is a
|
|
|
December 2021
|
full-service marketing agency with
|
||
|
as a Trustee
|
offices in the San Francisco Bay Area
|
||
|
and Liverpool, UK and staff across
|
|||
|
nine states in the U.S.
|
|||
|
WWW.HENNESSYFUNDS.COM
|
30
|
TRUSTEES AND OFFICERS OF THE FUND
|
|
Other
|
|||
|
Directorships
|
|||
|
Held Outside
|
|||
|
Name, Age,
|
of Fund
|
||
|
and Position Held
|
Start Date
|
Principal Occupation(s)
|
Complex During
|
|
with the Trust
|
of Service
|
During Past Five Years
|
Past Five Years
|
|
Gerald P. Richardson
|
May 2004
|
Mr. Richardson is an independent
|
None.
|
|
78
|
consultant in the securities industry.
|
||
|
Trustee
|
|||
|
Brian Alexander
|
March 2015
|
Mr. Alexander has served as the
|
None.
|
|
42
|
Chief Operating Officer of Solis
|
||
|
Adviser to the Board
|
Mammography since March 2023.
|
||
|
Prior to that, he worked for the
|
|||
|
Sutter Health organization from
|
|||
|
2011 to 2023 in various positions.
|
|||
|
He served as the Chief Executive
|
|||
|
Officer of the North Valley Hospital
|
|||
|
Area from 2021 to March 2023.
|
|||
|
From 2018 to 2021, he served as the
|
|||
|
Chief Executive Officer of Sutter
|
|||
|
Roseville Medical Center. From 2016
|
|||
|
through 2018, he served as the Vice
|
|||
|
President of Strategy for the Sutter
|
|||
|
Health Valley Area, which includes
|
|||
|
11 hospitals, 13 ambulatory surgery
|
|||
|
centers, 16,000 employees, and
|
|||
|
1,900 physicians.
|
|||
|
Interested Trustee and Interested Adviser(2)
|
|||
|
Neil J. Hennessy
|
January 1996 as
|
Mr. Neil Hennessy has been employed
|
Hennessy
|
|
67
|
a Trustee and
|
by Hennessy Advisors, Inc. since
|
Advisors, Inc.
|
|
Chairman of the Board,
|
June 2008 as
|
1989 and currently serves as its
|
|
|
Chief Market Strategist,
|
an Officer
|
Chairman and Chief Executive Officer.
|
|
|
Portfolio Manager,
|
|||
|
and President
|
|||
|
A.J. Hennessy
|
December 2022
|
Mr. A.J. Hennessy has been employed
|
None.
|
|
37
|
by Hennessy Advisors, Inc. since 2011.
|
||
|
Adviser to the Board
|
|||
|
and Vice President,
|
|||
|
Corporate Development
|
|||
|
and Operations
|
|||
|
HENNESSY FUNDS
|
1-800-966-4354
|
31
|
Name, Age,
|
||
|
and Position Held
|
Start Date
|
Principal Occupation(s)
|
|
with the Trust
|
of Service
|
During Past Five Years
|
|
Officers
|
||
|
Teresa M. Nilsen
|
January 1996
|
Ms. Nilsen has been employed by Hennessy Advisors, Inc.
|
|
57
|
since 1989 and currently serves as its President, Chief
|
|
|
Executive Vice President
|
Operating Officer, and Secretary.
|
|
|
and Treasurer
|
||
|
Daniel B. Steadman
|
March 2000
|
Mr. Steadman has been employed by Hennessy Advisors, Inc.
|
|
67
|
since 2000 and currently serves as its Executive Vice President.
|
|
|
Executive Vice President
|
||
|
and Secretary
|
||
|
Brian Carlson
|
December 2013
|
Mr. Carlson has been employed by Hennessy Advisors, Inc.
|
|
51
|
since December 2013 and currently serves as its Chief
|
|
|
Senior Vice President
|
Compliance Officer and Senior Vice President.
|
|
|
and Head of Distribution
|
||
|
David Ellison(3)
|
October 2012
|
Mr. Ellison has been employed by Hennessy Advisors, Inc.
|
|
65
|
since October 2012. He has served as a Portfolio Manager of
|
|
|
Senior Vice President
|
the Hennessy Large Cap Financial Fund and the Hennessy
|
|
|
and Portfolio Manager
|
Small Cap Financial Fund since their inception. Mr. Ellison also
|
|
|
served as a Portfolio Manager of the Hennessy Technology
|
||
|
Fund from its inception until February 2017. Mr. Ellison served
|
||
|
as Director, CIO, and President of FBR Fund Advisers, Inc.
|
||
|
from December 1999 to October 2012.
|
||
|
Jennifer Emerson(4)
|
June 2013
|
Ms. Emerson has been employed by Hennessy Advisors, Inc.
|
|
46
|
as its General Counsel since June 2013.
|
|
|
Senior Vice President and
|
||
|
Chief Compliance Officer
|
||
|
Ryan Kelley(5)
|
March 2013
|
Mr. Kelley has been employed by Hennessy Advisors, Inc. since
|
|
51
|
October 2012. He has served as Chief Investment Officer of the
|
|
|
Senior Vice President,
|
Hennessy Funds since March 2021 and has served as a Portfolio
|
|
|
Chief Investment Officer,
|
Manager of the Hennessy Gas Utility Fund, the Hennessy Large
|
|
|
and Portfolio Manager
|
Cap Financial Fund, and the Hennessy Small Cap Financial Fund
|
|
|
since October 2014. Mr. Kelley served as Co-Portfolio Manager
|
||
|
of these same funds from March 2013 through September
|
||
|
2014 and as a Portfolio Analyst for the Hennessy Funds from
|
||
|
October 2012 through February 2013. He has also served as a
|
||
|
Portfolio Manager of the Hennessy Cornerstone Growth Fund,
|
||
|
the Hennessy Cornerstone Mid Cap 30 Fund, the Hennessy
|
||
|
Cornerstone Large Growth Fund, and the Hennessy
|
||
|
Cornerstone Value Fund since February 2017 and as a Portfolio
|
||
|
Manager of the Hennessy Total Return Fund, the Hennessy
|
||
|
Balanced Fund, and the Hennessy Technology Fund since May
|
||
|
2018. He previously served as Co-Portfolio Manager of the
|
||
|
Hennessy Technology Fund from February 2017 until May 2018.
|
||
|
Mr. Kelley served as Portfolio Manager of FBR Fund
|
||
|
Advisers, Inc. from January 2008 to October 2012.
|
|
WWW.HENNESSYFUNDS.COM
|
32
|
TRUSTEES AND OFFICERS OF THE FUND
|
|
Name, Age,
|
||
|
and Position Held
|
Start Date
|
Principal Occupation(s)
|
|
with the Trust
|
of Service
|
During Past Five Years
|
|
L. Joshua Wein(5)
|
September 2018
|
Mr. Wein has been employed by Hennessy Advisors, Inc. since
|
|
50
|
2018. He has served as Portfolio Manager of the Hennessy
|
|
|
Vice President and
|
Cornerstone Growth Fund, the Hennessy Cornerstone Mid Cap
|
|
|
Portfolio Manager
|
30 Fund, the Hennessy Cornerstone Large Growth Fund, the
|
|
|
Hennessy Cornerstone Value Fund, Hennessy Total Return Fund,
|
||
|
the Hennessy Balanced Fund, the Hennessy Gas Utility Fund,
|
||
|
and the Hennessy Technology Fund since February 2021, and
|
||
|
as the Co-Portfolio Manager of these Funds since February
|
||
|
2019. He served as a Senior Analyst of those same Funds from
|
||
|
September 2018 through February 2019. He also has served as
|
||
|
a Portfolio Manager of the Hennessy Energy Transition Fund
|
||
|
and the Hennessy Midstream Fund since January 2022.
|
||
|
Mr. Wein served as Director of Alternative Investments and
|
||
|
Co-Portfolio Manager at Sterling Capital Management
|
||
|
from 2008 to 2018.
|
_______________
|
(1)
|
The Funds have determined that Mr. DeSousa, Mr. Doyle, Mr. Franklin, Ms. Garvie, and Mr. Richardson are not interested persons, as defined in the 1940 Act, of the Investment Manager or
of any predecessor investment adviser for purposes of Section 15(f) of the 1940 Act.
|
|
(2)
|
Each of Neil J. Hennessy and A.J. Hennessy is considered an interested person, as defined in the 1940 Act, because he is an officer of the Trust.
|
|
(3)
|
The address of this officer is 101 Federal Street, Suite 1615B, Boston, MA 02110.
|
|
(4)
|
The address of this officer is 4800 Bee Caves Road, Suite 100, Austin, TX 78746.
|
|
(5)
|
The address of this officer is 1340 Environ Way, Chapel Hill, NC 27517.
|
|
HENNESSY FUNDS
|
1-800-966-4354
|
33
Expense Example (Unaudited)
October 31, 2023
As a shareholder of the Fund, you incur ongoing costs, including management fees, service fees, and other Fund expenses. This Example is intended to help you understand your ongoing costs (in dollars) of investing
in the Fund and to compare these costs with the ongoing costs of investing in other investment funds. The Example is based on an investment of $1,000 invested at the beginning of the period and held for the entire period from May 1, 2023,
through October 31, 2023.
Actual Expenses
The first line of the table below provides information about actual account values and actual expenses. You may use this information, together with the amount you invested, to estimate the expenses that you paid
over the period. Simply divide your account value by $1,000 (for example, an $8,600 account value divided by $1,000 = 8.6), then multiply the result by the number in the first line under the heading “Expenses Paid During Period” to estimate
the expenses you paid on your account during this period. Although the Fund charges no sales loads or transaction fees, you will be assessed fees for outgoing wire transfers, returned checks, and stop payment orders at prevailing rates
charged by U.S. Bank Global Fund Services, the Fund’s transfer agent. If you request that a redemption be made by wire transfer, the Fund’s transfer agent charges a $15 fee. IRAs are charged a $15 annual maintenance fee (up to $30 maximum
per shareholder for shareholders with multiple IRAs). The example below includes, but is not limited to, management, shareholder servicing, accounting, custody, and transfer agent fees. However, the example below does not include portfolio
trading commissions and related expenses.
Hypothetical Example for Comparison Purposes
The second line of the table below provides information about hypothetical account values and hypothetical expenses based on the Fund’s actual expense ratio and an assumed rate of return of 5% per year before
expenses, which is not the Fund’s actual return. The hypothetical account values and expenses may not be used to estimate the actual ending account balance or expenses you paid for the period. You may use this information to compare the
ongoing costs of investing in the Fund and other funds. To do so, compare this 5% hypothetical example with the 5% hypothetical examples that appear in the shareholder reports of the other funds. Please note that the expenses shown in the
table are meant to highlight your ongoing costs only. Therefore, the second line is useful in comparing ongoing costs only and will not help you determine the relative total costs of owning different funds.
|
Expenses Paid
|
|||
|
Beginning
|
Ending
|
During Period(1)
|
|
|
Account Value
|
Account Value
|
May 1, 2023 –
|
|
|
May 1, 2023
|
October 31, 2023
|
October 31, 2023
|
|
|
Investor Class
|
|||
|
Actual
|
$1,000.00
|
$ 979.60
|
$18.11
|
|
Hypothetical (5% return before expenses)
|
$1,000.00
|
$1,006.91
|
$18.36
|
|
(1)
|
Expenses are equal to the Fund’s annualized expense ratio of 3.63%, multiplied by the average account value over the period, multiplied by 184/365 days (to reflect the half-year period).
|
|
WWW.HENNESSYFUNDS.COM
|
34
|
EXPENSE EXAMPLE — ELECTRONIC DELIVERY
|
How to Obtain a Copy of the Fund’s Proxy
Voting Policy and Proxy Voting Records
A description of the policies and procedures the Fund uses to determine how to vote proxies relating to portfolio securities is available without charge (1) by calling 800-966-4354, (2) on the Hennessy Funds’
website at www.hennessyfunds.com/proxy-voting/voting-policy, or (3) on the U.S. Securities and Exchange Commission’s (the “SEC”) website at www.sec.gov. The Fund’s proxy voting record is available without charge on both the Hennessy Funds’
website at www.hennessyfunds.com/proxy-voting/voting-record and the SEC’s website at www.sec.gov no later than August 31 for the prior 12 months ending June 30.
Availability of Quarterly Portfolio Schedule
The Fund files a complete schedule of portfolio holdings with the SEC for the first and third quarters of each fiscal year as an exhibit to its reports on Form N-PORT. The Fund’s Form N-PORT reports are available
on the SEC’s website at www.sec.gov or on request by calling 800-966-4354.
Federal Tax Distribution Information (Unaudited)
For fiscal year 2023, certain dividends paid by the Fund may be subject to a maximum tax rate of 23.8%, as provided for by the Jobs and Growth Tax Relief Reconciliation Act of 2003. The percentage of dividends
declared from ordinary income designated as qualified dividend income was 100.00%.
For corporate shareholders, the percent of ordinary income distributions that qualified for the corporate dividends received deduction for fiscal year 2023 was 100.00%.
The percentage of taxable ordinary income distributions that were designated as short-term capital gain distributions under Section 871(k)(2)(C) of the Internal Revenue Code of 1986, as amended,
for the Fund was 0.00%.
Important Notice Regarding Delivery
of Shareholder Documents
To help keep the Fund’s costs as low as possible, we generally deliver a single copy of shareholder reports, proxy statements, and prospectuses to shareholders who share an address and have the same last name.
This process does not apply to account statements. You may request an individual copy of a shareholder document at any time. If you would like to receive separate mailings of shareholder documents, please call U.S. Bank Global Fund Services
at 800-261-6950 or 414-765-4124, and individual delivery will begin within 30 days of your request. If your account is held through a financial institution or other intermediary, please contact such intermediary directly to request
individual delivery.
Electronic Delivery
As currently permitted by SEC regulations, the Fund’s shareholder reports are made available on a website, and unless you sign for eDelivery or elect to receive paper copies as detailed below, you will be notified
by mail each time a report is posted and provided with a website link to access the report.
To elect to receive paper copies of all future reports free of charge, please call U.S. Bank Global Fund Services at 800-261-6950 or 414-765-4124.
The Fund also offers shareholders the option to receive all notices, account statements, prospectuses, tax forms, and shareholder reports electronically. To sign up for eDelivery or change your
delivery preference, please visit www.hennessyfunds.com/account.
Shareholder reports transmitted after July 24, 2024, will comply with the new tailored shareholder reporting requirements, which require streamlined annual and semi-annual reports to
shareholders that highlight key information. These reports will be transmitted in paper unless a shareholder elects to receive reports electronically via eDelivery. To sign up for eDelivery, please visit
http://www.hennessyfunds.com/account.
Subscribe to receive our team’s unique market and sector insights delivered to your inbox
www.hennessyfunds.com/subscribe
Follow us on social media
| |
|
|
HENNESSY FUNDS
|
1-800-966-4354
|
35
Liquidity Risk Management Program
In accordance with Rule 22e-4 under the Investment Company Act of 1940, as amended (the “Liquidity Rule”), we have adopted and implemented a liquidity risk management program (the “Liquidity Program”). The purpose
of the Liquidity Program is to assess and manage the Fund’s liquidity risk, which is the risk that the Fund would not be able to meet requests to redeem Fund shares without significant dilution of the remaining shareholders’ interests in
the Fund. The Board of Trustees of the Fund (the “Board”) designated a committee comprising representatives of Hennessy Advisors, Inc., the investment adviser to the Fund, as the administrator of the Liquidity Program (the “Program
Administrator”).
The Program Administrator provided a written report regarding the Liquidity Program to the Board in advance of its meeting on June 7, 2023. The report covered the period from June 1, 2022,
through May 31, 2023. The report addressed the operation of the Liquidity Program, assessed the adequacy and effectiveness of its implementation, and described any material changes to the Liquidity Program during the review period. The
Trust’s chief compliance officer presented the report to the Board at the meeting and provided additional information regarding the Liquidity Program. The Board reviewed the Liquidity Program and considered, among other items, the
following:
|
1.
|
The Program Administrator reviewed daily historical net redemption activity during the review period and during prior periods with higher-than-average redemption activity and concluded that the Fund has
historically been able to meet requests to redeem Fund shares without significant dilution to the Fund’s remaining shareholders, and the Program Administrator expects the Fund to be able to continue to do so in the future during
both normal and reasonably foreseeable stressed conditions.
|
|
|
2.
|
The Fund primarily holds assets that are highly liquid investments and is not required to establish a highly liquid investment minimum for the Fund or adopt policies and procedures for responding to a
highly liquid investment minimum shortfall.
|
|
|
3.
|
The Program Administrator did not make or recommend any material changes to the Liquidity Program during the review period.
|
|
|
4.
|
The Program Administrator concluded that the Liquidity Program was reasonably designed to assess and manage the Fund’s liquidity risk, complies with the requirements of the Liquidity Rule, and was
operating as intended during the review period.
|
Privacy Policy
We collect the following personal information about you:
|
1.
|
Information we receive from you in applications or other forms, correspondence, or conversations, including, but not limited to, your name, address, phone number, social security number, assets, income,
and date of birth;
|
|
|
2.
|
Information about your transactions with us, our affiliates, or others, including, but not limited to, your account number and balance, payments history, parties to transactions, cost basis information,
and other financial information; and
|
|
WWW.HENNESSYFUNDS.COM
|
36
|
LIQUIDITY RISK MANAGEMENT PROGRAM/PRIVACY POLICY
|
|
3.
|
Other personal information we collect from various sources, even if you have not entered into a prior transaction with us, including the following:
|
|
•
|
Name, alias, address, unique personal identifier, online identifier, IP address, email address, telephone number, account name, and other similar identifiers;
|
||
|
•
|
Age and marital status;
|
||
|
•
|
Commercial information, including records of products purchased;
|
||
|
•
|
Browsing history, search history, and information on interaction with our website;
|
||
|
•
|
Geolocation data;
|
||
|
•
|
Employment and employment history, educational history, financial information, and purchasing and consuming histories or tendencies; and
|
||
|
•
|
Inferences drawn from the above-listed information to create a profile about your preferences, characteristics, predispositions, and behavior.
|
We collect this information directly from you, indirectly in the course of providing services to you, directly and indirectly from your activity on our website, from broker dealers, marketing
agencies, and other third parties that interact with us in connection with the services we perform and products we offer, and from anonymized and aggregated consumer information.
We use this information to fulfill the reason you provided the information to us, to provide you with other relevant products that you request from us, to provide you with information about
products that may interest you, to improve our website or present our website’s contents to you, and as otherwise described to you when collecting your personal information.
We do not disclose any personal information to unaffiliated third parties, except as permitted by law. We may disclose your personal information to our affiliates, vendors, and service providers
for a business purpose. For example, we are permitted by law to disclose all of the information we collect, as described above, to our transfer agent to process your transactions. When disclosing your personal information to third parties,
we enter into a contract with each third party describing the purpose of such disclosure and requiring that such personal information be kept confidential and not used for any purpose except to perform the services contracted or respond to
regulatory or law enforcement requests.
Furthermore, we restrict access to your personal information to those persons who require such information to provide products or services to you. As a result, we do not provide a means for
opting out of our limited sharing of your information. We maintain physical, electronic, and procedural safeguards that comply with federal standards to guard your personal information.
If you hold shares of the Funds through a financial intermediary, including, but not limited to, a broker-dealer, bank, or trust company, the privacy policy of your financial intermediary
governs how your personal information is shared with unaffiliated third parties.
If you live in a state such as California where the laws provide further privacy rights, we will not share information unless the law allows, and we will comply with the other state-specific
requirements.
|
HENNESSY FUNDS
|
1-800-966-4354
|
37
Supplemental Privacy Notice for Residents of California
The California Consumer Privacy Act of 2018 (the “CCPA”) provides you, as a California resident, with certain additional rights relating to your personal information.
Under the CCPA, you have the right to request that we disclose to you the categories of personal information we have collected about you over the past 12 months, the categories of sources of
such information, our business purpose for collecting the information, the categories of third parties, if any, with whom we shared the information, and the specific information we have collected about you. You also have the right to
request that we delete any of your personal information, and, unless an exception applies, we will delete such information upon receiving and confirming your request. To make a request, call us at 1-800-966-4354, email us at
privacy@hennessyfunds.com, or go to www.hennessyfunds.com/contact. We will not discriminate against you for exercising your rights under the CCPA. Further, we will not collect additional categories of your personal information or use the
personal information we collected for materially different, unrelated, or incompatible purposes without providing you notice.
|
WWW.HENNESSYFUNDS.COM
|
38
|
PRIVACY POLICY
|
(This Page Intentionally Left Blank.)
For information, questions, or assistance, please call
The Hennessy Funds
800-966-4354 or 415-899-1555
INVESTMENT ADVISOR
Hennessy Advisors, Inc.
7250 Redwood Boulevard, Suite 200
Novato, California 94945
ADMINISTRATOR,
TRANSFER AGENT,
DIVIDEND PAYING AGENT, &
SHAREHOLDER SERVICING AGENT
U.S. Bancorp Fund Services, LLC
d/b/a U.S. Bank Global Fund Services
P.O. Box 701
Milwaukee, Wisconsin 53201-0701
CUSTODIAN
U.S. Bank N.A.
Custody Operations
1555 North River Center Drive, Suite 302
Milwaukee, Wisconsin 53212
TRUSTEES
Neil J. Hennessy
Robert T. Doyle
J. Dennis DeSousa
Doug Franklin
Claire Garvie
Gerald P. Richardson
COUNSEL
Foley & Lardner LLP
777 East Wisconsin Avenue
Milwaukee, Wisconsin 53202-5306
INDEPENDENT REGISTERED
PUBLIC ACCOUNTING FIRM
Tait, Weller & Baker LLP
Two Liberty Place
50 South 16th Street, Suite 2900
Philadelphia, Pennsylvania 19102-2529
DISTRIBUTOR
Quasar Distributors, LLC
111 East Kilbourn Avenue, Suite 1250
Milwaukee, Wisconsin 53202
www.hennessyfunds.com | 800-966-4354
This report has been prepared for shareholders and may be distributed to
others only if preceded or accompanied by a current prospectus.
ANNUAL REPORT
OCTOBER 31, 2023

HENNESSY EQUITY AND INCOME FUND
Investor Class HEIFX
Institutional Class HEIIX
www.hennessyfunds.com | 1-800-966-4354
(This Page Intentionally Left Blank.)
Contents
|
Letter to Shareholders
|
2
|
|
|
Performance Overview
|
6
|
|
|
Financial Statements
|
||
|
Schedule of Investments
|
10
|
|
|
Statement of Assets and Liabilities
|
19
|
|
|
Statement of Operations
|
20
|
|
|
Statements of Changes in Net Assets
|
21
|
|
|
Financial Highlights
|
22
|
|
|
Notes to the Financial Statements
|
26
|
|
|
Report of Independent Registered Public Accounting Firm
|
35
|
|
|
Trustees and Officers of the Fund
|
36
|
|
|
Expense Example
|
40
|
|
|
Proxy Voting Policy and Proxy Voting Records
|
42
|
|
|
Availability of Quarterly Portfolio Schedule
|
42
|
|
|
Federal Tax Distribution Information
|
42
|
|
|
Important Notice Regarding Delivery of Shareholder Documents
|
42
|
|
|
Electronic Delivery
|
42
|
|
|
Liquidity Risk Management Program
|
43
|
|
|
Privacy Policy
|
43
|
|
HENNESSY FUNDS
|
1-800-966-4354
|
November 2023
Dear Hennessy Funds Shareholder:
Market Myopia: Tough Beginnings & Fantastic Finishes
During an interview this summer, I was reminded how important it is to maintain a long-term view of the market and investing and how easy it is to focus on the very recent past. In mid-July, when the Nasdaq
Composite Index was soaring to new 2023 highs and large-cap tech was once again dominating both returns and news headlines, the interviewer seemed confused – and somewhat disappointed – when I mentioned that even with 2023’s stellar
performance, the Nasdaq was negative if you included the prior year (2022) and that during that same time, utilities had outperformed. As of the time of writing this letter, a similar story can be seen when considering eight technology
giants: Microsoft, Tesla, Facebook (Meta), Apple, Amazon, Netflix, Nvidia, and Google, or “MT. FAANNG” as a much easier to say
(and remember) acronym.(1) MT. FAANNG is up on average a whopping 89.69% in 2023 on a total return basis as of November 7, 2023. However, this same group
was down -46.71% in 2022, a dismal year for large-cap tech. Due to the unforgiving nature of percentages, from the end of 2021 until now, this group of highflyers, believe it or not, is still down -3.14% on average, despite an incredible
2023.
I like to call this phenomenon “market myopia.” Investors tend to be optimists, as am I. This makes it so much more comforting to forget the “tough beginnings” when you’d
rather remember the “fantastic finishes.” In continuing with the example above, unless you were an investor with prescient foresight, you likely didn’t sell all your MT. FAANNG stocks on January 4, 2022, as the market started its
correction, and you probably didn’t then buy them all back on September 30, 2022, when the market hit its low. An average investor’s experience would be much different than that. Which brings me to the point of all this: what are some
elements of our investment philosophy here at Hennessy Funds?
First, what about timing the market? Simply put, we don’t do it. As Neil Hennessy, our Chief Market Strategist and long-tenured Portfolio Manager, aptly put it, “It’s not
about timing the market, but rather about time in the market.” The long-term annualized return of the market, as measured by the Dow Jones Industrial
Average going back 104 years to 1920, is about 9.6%, and that number would be closer to 7-8% on a real return basis when factoring in inflation. If an investor is poorly timing when to enter and when to exit the market, it would be very
difficult to achieve similar, attractive returns to what they would experience simply by staying invested through a complete market cycle.
We are optimistic investors. We understand that some years or months may be tougher than others, but we tend to think in longer timeframes. An investor solely invested in
the Nasdaq might have looked at their portfolio at the end of 2022 and been extremely disappointed with a -32.51% return. But as Josh Wein, one of our Portfolio Managers with over 25 years of experience, pointed out, “2022 was what 8%
real returns look like.” In other words, with the year prior (2021) providing a +22.21% return and the year after (2023) hitting a +31.21% return, 2022’s dismal performance of -32.51% created an annualized total return for the Nasdaq of
8.22% over the entire period (December 31, 2020, to November 7, 2023). Josh simply observed that while corrections happen over the course of a market cycle, it’s best not to panic by selling when stocks are hitting new lows.
_______________
|
(1)
|
The acronym, MT. FAANNG, refers to the following companies: Microsoft Corporation, Tesla, Inc., Meta Platforms, Inc., Amazon.com, Inc., Apple, Inc., Netflix, Inc., NVIDIA Corporation, and Alphabet, Inc.
|
|
WWW.HENNESSYFUNDS.COM
|
2
|
LETTER TO SHAREHOLDERS
|
Downside risk mitigation is relevant. While we normally remain fully invested within our individual funds, we seek to reduce risk through other means, including sector
diversification and investing in companies that exhibit strong fundamentals at compelling valuations. Dave Ellison, the long-tenured Portfolio Manager of our two financial funds, consistently reminds us, “Losing less money in difficult
markets is more important than making the most in rising ones.”
Finally, we are investors in companies, not traders of stocks. Many of our portfolios hold certain positions for long periods of time, a demonstration of the Portfolio
Managers’ convictions. In fact, both the Hennessy Focus Fund and the Hennessy Large Cap Financial Fund have held some positions for 25 years or more. We recognize that much of the performance of the Hennessy Funds comes from the actual
stocks we own (stock selection) and not from our weightings within certain sectors (sector allocation). Moving in and out of sectors can enhance performance, but it can also hinder it in the same way as market timing, and it takes a
significant number of correct “calls” regarding the macro-environment. We’d rather invest long term than rely on lucky calls. Our highly experienced energy funds Portfolio Manager, Ben Cook, summed up our philosophy on the macro
environment nicely: “While macro-economic trends help to inform our investment process, ultimately it’s the individual stocks with solid fundamentals and attractive valuations that, over time, drive positive risk-adjusted returns for our
funds.”
We are long term investors, staying ever mindful of downside risk while striving to participate in the upside, with each individual fund having its own objective, process,
portfolio construction, and investment criteria.
The stock market has once again seen dramatic differences in stock performance. For our fiscal year ended October 31, 2023, all three broad-based indexes were positive,
although with a large dispersion of total returns, with the Dow Jones Industrial Average up 3.17%, the S&P 500® Index up 10.14%, and the Nasdaq Composite
Index up 17.99%. During our fiscal year, large caps significantly outperformed mid caps and small caps, and growth substantially outperformed value. Large-cap tech once again pushed the overall broader market higher, as evidenced by the
Nasdaq-100 Index posting a return of 27.45%. From a sector point of view, besides Technology, the only other sector with outsized (greater than 10%) returns was Communication Services, while six of the 11 GICS sectors of the S&P 500® Index were negative.
Similar to the overall market, our funds experienced mixed results. Many of our funds exhibit more value-oriented characteristics and, given that value underperformed
growth this year by a significant amount, that negatively affected our relative performance. In addition, three of our funds are sector-specific funds that were invested in underperforming sectors, while six more are focused on small- and
mid-cap stocks in a time period when large caps substantially outperformed. Ten of our 16 mutual funds and our exchange-traded-fund (ETF) posted positive returns for the fiscal year ended October 31, 2023.
Several factors caused this disparity of returns in the market: interest rates and inflation being two of the most important. With the Federal Reserve pausing interest
rate hikes and inflation numbers subsiding, the market reacted positively once it became more apparent that we were not heading into a recession. Consumer demand also remained strong, and unemployment numbers remained historically low.
We believe that the outlook for U.S. stocks remains positive, primarily as we believe that the Federal Reserve may be done, or close to done, raising interest rates.
Inflation has shown signs of easing, creating a better environment for consumers as well as businesses. The unemployment rate remains near record lows, there are elevated levels of cash on the
|
HENNESSY FUNDS
|
1-800-966-4354
|
3
balance sheets of U.S. companies and in the pockets of many consumers and investors, and there is the prospect of a more dovish Federal Reserve heading into 2024. However, we are cautiously watching certain
parts of the economy for any hints of weakness, including consumer spending and credit issues. While volatility and uncertainty may impact the markets, we encourage investors to stay the course, maintain a diversified portfolio, and keep
a long-term perspective.
We thank you for your continued interest in our Funds and are grateful that you have chosen to invest with us. If you have any questions or would like to speak with us
directly, please call us at (800) 966-4354.
Best regards,
|
|
|
|
|
Ryan C. Kelley, CFA
|
|
|
Chief Investment Officer,
|
|
|
Senior Vice President, and Portfolio Manager
|
Past performance does not guarantee future results.
Mutual fund investing involves risk. Principal loss is possible.
Opinions expressed are those of Ryan C. Kelley and are subject to change, are not guaranteed, and should not be considered investment advice.
The Dow Jones Industrial Average and S&P 500® Index are commonly used to measure the performance of U.S. stocks. The Nasdaq
Composite Index comprises all common stocks listed on The Nasdaq Stock Market and is commonly used to measure the performance of technology-related stocks. The Nasdaq-100 Index includes 100 of the largest domestic and international
non-financial companies listed on The NASDAQ Stock Market based on market capitalization. The indices are used herein for comparative purposes in accordance with SEC regulations. One cannot invest directly in an index. All returns are
shown on a total return basis.
|
WWW.HENNESSYFUNDS.COM
|
4
|
LETTER TO SHAREHOLDERS
|
(This Page Intentionally Left Blank.)
|
HENNESSY FUNDS
|
1-800-966-4354
|
5
Performance Overview (Unaudited)
CHANGE IN VALUE OF $10,000 INVESTMENT
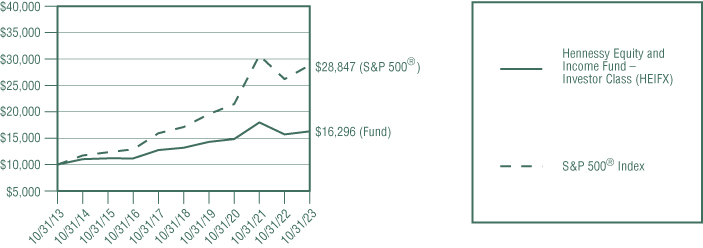
This graph illustrates the performance of an initial investment of $10,000 made in the Fund 10 years ago and assumes the reinvestment of dividends and capital gains.
AVERAGE ANNUAL TOTAL RETURN FOR PERIODS ENDED OCTOBER 31, 2023
|
One
|
Five
|
Ten
|
|
|
Year
|
Years
|
Years
|
|
|
Hennessy Equity and Income Fund –
|
|||
|
Investor Class (HEIFX)
|
3.67%
|
4.32%
|
5.00%
|
|
Hennessy Equity and Income Fund –
|
|||
|
Institutional Class (HEIIX)
|
3.99%
|
4.70%
|
5.39%
|
|
S&P 500® Index
|
10.14%
|
11.01%
|
11.18%
|
Expense ratios: 1.58% (Investor Class); 1.20% (Institutional Class)
Performance data quoted represents past performance; past performance does not guarantee future results. The investment return and principal value of an investment will fluctuate so that an
investor’s shares, when redeemed, may be worth more or less than their original cost. The performance table does not reflect the deduction of taxes that a shareholder would pay on Fund distributions or the redemption of Fund shares.
Current performance of the Fund may be lower or higher than the performance quoted. Performance data current to the most recent month end may be obtained by visiting www.hennessyfunds.com.
The S&P 500® Index is a capitalization-weighted index that is designed to represent the broad domestic economy through changes
in the aggregate market value of 500 stocks across all major industries. One cannot invest directly in an index. This index is used for comparative purposes in accordance with Securities and Exchange Commission regulations.
Standard & Poor’s Financial Services is the source and owner of the S&P® and S&P 500® trademarks.
The expense ratios presented are from the most recent prospectus. The expense ratios for the current reporting period are available in the Financial Highlights section of this report.
PERFORMANCE NARRATIVE
Portfolio Managers for Equity Allocation: Stephen M. Goddard, CFA, Jonathan T. Moody, CFA, J. Brian Campbell, CFA, Mark E. DeVaul, CFA, CPA, and Samuel D. Hutchings, CFA
The London Company of Virginia, LLC (sub-advisor)
|
WWW.HENNESSYFUNDS.COM
|
6
|
PERFORMANCE OVERVIEW
|
Portfolio Managers for Fixed Income Allocation: Gary B. Cloud, CFA, and Peter G. Greig, CFA
FCI Advisors (sub-advisor)
Performance:
For the one-year period ended October 31, 2023, the Investor Class of the Hennessy Equity and Income Fund returned 3.67%, underperforming the S&P 500® Index (the Fund’s benchmark), which returned 10.14% for the same period.
Equities: U.S. stocks posted gains over the one-year period ended October 31, 2023. Positive equity returns were concentrated in the large-cap space and driven by a
handful of companies with strong growth expectations. Equities closed lower versus the prior year in the small- and mid-cap space. Moderating inflation, a strong labor market, and better than expected economic growth aided equity prices,
while rising interest rates were a headwind.
Looking to factors that affected stock prices over the one-year period ended October 31, 2023, growth, higher beta, and quality factors had a positive influence on relative returns. The
positive influence of quality factors was concentrated in the smaller market cap space. Value and yield factors had a negative impact. These factors were headwinds to the relative performance of the equity portion of the Fund, reflecting
the Fund’s exposure to slower growth, lower beta, and higher yielding equities.
Both sector allocation and stock selection presented headwinds to relative performance in the equity portion of the Fund. The best performing stocks over the one-year period ended October 31,
2023, included NewMarket Corporation, FedEx Corporation, Alphabet, Inc. (Class C), Old Dominion Freight Line, Inc., and Progressive Corporation. The weakest names over the one-year period ended October 31, 2023, included Charles Schwab
Corp., Albemarle Corporation, Norfolk Southern Corporation, Pfizer, Inc., and Texas Instruments Incorporated. The Fund continues to own all of the companies mentioned.
Sector allocation had a negative impact on the Fund’s relative performance. The Fund’s underweight position in the Information Technology sector and overweight position in the Financials
sector had a negative impact on relative performance, partially offset by the positive impact of the Fund’s underweight position in both the Health Care and Real Estate sectors.
Fixed Income: Through the one-year period ended October 31, 2023, the Federal Reserve (Fed) continued its unprecedented rate-hiking cycle, increasing the overnight
rate by an additional 225 basis points (bps). These rate hikes, as well as the market’s eventual realization that additional rate cuts were not on the horizon, led to continued upward pressure across the yield curve. For the period,
returns for broad investment-grade indexes typically delivered slightly positive returns, but less than their starting yield as price declines detracted from income.
The fixed income allocation managed by FCI Advisors outperformed most widely known Intermediate benchmarks for the period. Sector allocation, specifically an overweight to investment grade
corporate credit, provided the largest contribution to relative performance as credit spreads tightened materially. Treasury holdings at the index level, an intentionally underweighted sector, declined in value over the same period. We
have maintained a neutral duration policy relative to the benchmark, so the continued climb in interest rates did not materially affect relative performance. Additionally, we reduced the already small allocation to “core-plus” securities
by half. Our allocation to preferred stock securities, which detracted from overall performance, was trimmed, while allocations to Business Development Companies, which had contributed to performance during the period, were exited
entirely.
|
HENNESSY FUNDS
|
1-800-966-4354
|
7
Portfolio Strategy:
The Fund seeks a balanced portfolio with the goal of maintaining broad market exposure with lower volatility. Our bottom-up equity selection strategy seeks companies with strong returns on capital and the
flexibility to enhance shareholder value by using their balance sheets. The Fund’s fixed income allocation focuses on high-quality domestic corporate, agency, and government bonds.
Investment Commentary:
Equities: Looking ahead, while we have been pleased with the better than expected economic data and improving inflation readings in recent months, we note that core
inflation remains higher than the Fed’s long-term target of 2% and the labor market remains tight with unemployment below 4%. With that backdrop, it has become more apparent to investors that interest rates may stay higher for longer than
previously expected.
Predicting the future direction of the economy is always challenging. Potential positives include a strong labor market, rising wages, and lower inflation. Potential negatives include higher
interest rates, elevated energy prices, tighter bank lending standards, and the drawdown of savings accumulated by consumers during the pandemic. While we believe the odds of a recession over the next 12-18 months remain somewhat
elevated, a soft landing may be possible. Longer term, we remain positive on the U.S. economy and expect real GDP growth in the 2-3% range driven by growth in the labor force and improving productivity.
In terms of the equity market, we recognize the difficulty in determining what investors have priced into stocks at a specific point in the economic cycle. Valuations based on near-term
earnings appear somewhat elevated in the context of higher interest rates and a possible recession. Going forward, we believe that equity returns in the near term may be modest, with shareholder yield (dividends, share repurchase, and
debt reduction) comprising a significant percentage of the total return from equities. We continue to expect greater volatility in share prices in the months ahead and believe that quality attributes and solid company fundamentals will
lead to strong risk adjusted returns over time. Compared to the broader market, we believe that the companies held in the Fund generate much higher returns on capital, have stronger balance sheets, and trade at reasonable valuations.
Fixed Income: Following a challenging year and a half for bond investors, it looked like there might be some relief in late 2022 and early 2023 as yields trended
lower. After raising the overnight rate by 75 bps in November 2022 and 50 bps in December 2022, much of the decline in the yield curve stemmed from a belief the Fed might be near the end of its rate hiking cycle. However, a blowout
employment report in February 2023, as well as stubborn inflation metrics, showed the economy wasn’t ready to cooperate. In response, yields once again moved sharply higher as investors priced in additional rate hikes.
Those higher yields attracted investors who were eager to earn 5% on Treasury debt in lieu of the much smaller amounts they were earning in their checking and savings accounts. This proved
problematic for banks and led to a run on deposits. At the same time, news quickly spread that the security portfolios at certain banks had substantial losses. In some instances, like Silicon Valley Bank, that led to depositors pulling
out billions in just a few hours. In the end, this caused only a handful of banks to be shuttered, but the strain on the sector sent yields to their lowest levels of the year as investors assessed the impact on lending, economic activity,
and the need for further tightening of monetary policy.
|
WWW.HENNESSYFUNDS.COM
|
8
|
PERFORMANCE OVERVIEW
|
Fortunately, a major bank crisis was avoided, and investors again focused on economic growth that remained stronger than expected. In fact, after four quarters of GDP growth that averaged
2.4%, the economy accelerated into a shockingly high 5.2% annualized rate during the third quarter of 2023. That overall solid economic growth, combined with Congress’s inability to pass a budget, heavy issuances from the Treasury, and a
Fitch Ratings downgrade of the U.S. government debt from AAA to AA+, sent yields across the curve to their year-to-date highs.
After continuing to increase the overnight rate by 25 bps in March, May, and July 2023, the Federal Reserve’s Open Market Committee (FOMC) passed on raising the overnight rate in September
2023, thereby leaving the rate at a range of 5.25% to 5.50%. Nearly 19 months and 525 bps after the Fed first began increasing the overnight rate from the pandemic zero bound, we are likely at, or very near, the end of the rate-hiking
cycle. Fortunately, bond yields now provide a substantial cushion to absorb price declines if rates were to increase further.
Without further Fed tightening, there is little reason to expect short rates to increase materially. The long end of the curve could move somewhat higher as investors seek a term premium for
owning longer maturities, but even that should be short lived with the consensus expecting Fed rate cuts to commence sometime in 2024. While it is possible some pressure remains, going forward, bond math favors investors. While not
calling for an exact top, we believe today’s yields represent a buying opportunity for long-term investors.
_______________
Opinions expressed are those of the Portfolio Managers as of the date written and are subject to change, are not guaranteed, and should not be considered investment advice or an indication of trading intent.
Investments in debt securities typically decrease in value when interest rates rise. The risk is greater for longer-term debt securities. Investments by the Fund in lower-rated and non-rated
securities presents a greater risk of loss to principal and interest than higher-rated securities. Mortgage- and asset-backed securities are subject to prepayment risk, which is the risk that the borrower will prepay some or all of the
principal owed to the issuer. Investments in foreign securities may involve political, economic, and currency risks, greater volatility, and differences in accounting methods. Funds that invest in other investment companies, including
exchange-traded funds, may experience higher fees. Funds concentrated in one or more industry sectors may be subject to a higher degree of market risk. Please see the Fund’s prospectus for a more complete discussion of these and other
risks.
References to specific securities should not be considered a recommendation to buy or sell any security. Fund holdings and sector allocations are subject to change. Please refer to the Schedule of Investments
included in this report for additional portfolio information.
Basis point refers to a common unit of measurement for interest rates and other percentages in finance and is equal to 1/100th of 1%. Duration
is a measure of the sensitivity of the price (the value of the principal) of a fixed-income investment to a change in interest rates and is expressed as a number of years. Investment grade is a
rating that indicates that a municipal or corporate bond has a relatively low risk of default.
|
HENNESSY FUNDS
|
1-800-966-4354
|
9
Financial Statements
|
Schedule of Investments as of October 31, 2023
|
HENNESSY EQUITY AND INCOME FUND
(% of Net Assets)
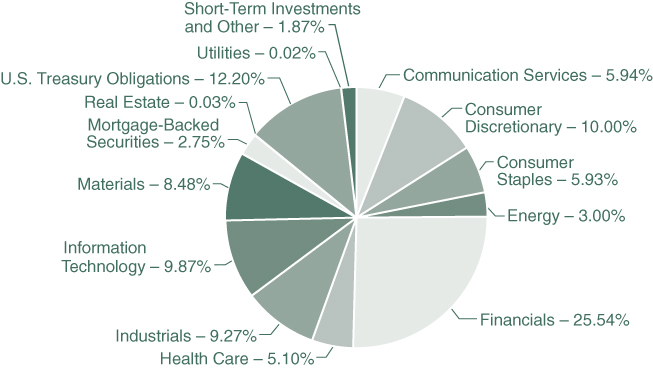
|
TOP TEN HOLDINGS (EXCLUDING MONEY MARKET FUNDS)
|
% NET ASSETS
|
|
Apple, Inc.
|
4.80%
|
|
Berkshire Hathaway, Inc., Class B
|
4.54%
|
|
Alphabet, Inc., Class C
|
4.07%
|
|
The Progressive Corp.
|
2.88%
|
|
Martin Marietta Materials, Inc.
|
2.86%
|
|
Visa, Inc., Class A
|
2.80%
|
|
BlackRock, Inc.
|
2.72%
|
|
NewMarket Corp.
|
2.33%
|
|
FedEx Corp.
|
2.28%
|
|
Starbucks Corp.
|
2.28%
|
Note: For presentation purposes, the Fund has grouped some of the industry categories. For purposes of categorizing securities for compliance with Section 8(b)(1) of the Investment Company Act of 1940, as
amended, the Fund uses more specific industry classifications.
The Global Industry Classification Standard (GICS®) was developed by and is the exclusive property and a service mark of MSCI,
Inc. and Standard & Poor’s Financial Services LLC. It has been licensed for use by the Hennessy Funds.
|
WWW.HENNESSYFUNDS.COM
|
10
|
SCHEDULE OF INVESTMENTS
|
|
COMMON STOCKS – 66.29%
|
Number
|
% of
|
||||||||||
|
|
of Shares
|
Value
|
Net Assets
|
|||||||||
|
Communication Services – 4.07%
|
||||||||||||
|
Alphabet, Inc., Class C (a)
|
22,437
|
$
|
2,811,356
|
4.07
|
%
|
|||||||
|
Consumer Discretionary – 9.09%
|
||||||||||||
|
CarMax, Inc. (a)
|
11,619
|
709,805
|
1.03
|
%
|
||||||||
|
Lowe’s Companies., Inc.
|
4,739
|
903,111
|
1.31
|
%
|
||||||||
|
O’Reilly Automotive, Inc. (a)
|
1,621
|
1,508,243
|
2.19
|
%
|
||||||||
|
Starbucks Corp.
|
17,072
|
1,574,722
|
2.28
|
%
|
||||||||
|
The Home Depot, Inc.
|
5,531
|
1,574,620
|
2.28
|
%
|
||||||||
|
|
6,270,501
|
9.09
|
%
|
|||||||||
|
Consumer Staples – 5.90%
|
||||||||||||
|
Altria Group, Inc.
|
33,266
|
1,336,295
|
1.94
|
%
|
||||||||
|
Church & Dwight Co., Inc.
|
15,430
|
1,403,204
|
2.03
|
%
|
||||||||
|
Nestlé S.A. – ADR
|
12,399
|
1,336,116
|
1.93
|
%
|
||||||||
|
|
4,075,615
|
5.90
|
%
|
|||||||||
|
Energy – 2.04%
|
||||||||||||
|
Chevron Corp.
|
9,659
|
1,407,606
|
2.04
|
%
|
||||||||
|
Financials – 17.21%
|
||||||||||||
|
Berkshire Hathaway, Inc., Class B (a)
|
9,192
|
3,137,504
|
4.54
|
%
|
||||||||
|
BlackRock, Inc.
|
3,066
|
1,877,250
|
2.72
|
%
|
||||||||
|
Fiserv, Inc. (a)
|
13,437
|
1,528,459
|
2.22
|
%
|
||||||||
|
The Charles Schwab Corp.
|
27,202
|
1,415,592
|
2.05
|
%
|
||||||||
|
The Progressive Corp.
|
12,563
|
1,986,085
|
2.88
|
%
|
||||||||
|
Visa, Inc., Class A
|
8,207
|
1,929,466
|
2.80
|
%
|
||||||||
|
|
11,874,356
|
17.21
|
%
|
|||||||||
|
Health Care – 2.69%
|
||||||||||||
|
Johnson & Johnson
|
7,657
|
1,135,840
|
1.65
|
%
|
||||||||
|
Pfizer, Inc.
|
23,527
|
718,985
|
1.04
|
%
|
||||||||
|
|
1,854,825
|
2.69
|
%
|
|||||||||
|
Industrials – 8.32%
|
||||||||||||
|
FedEx Corp.
|
6,570
|
1,577,457
|
2.28
|
%
|
||||||||
|
Norfolk Southern Corp.
|
6,567
|
1,252,918
|
1.82
|
%
|
||||||||
|
Old Dominion Freight Line, Inc.
|
3,882
|
1,462,194
|
2.12
|
%
|
||||||||
|
Republic Services, Inc.
|
9,746
|
1,447,184
|
2.10
|
%
|
||||||||
|
|
5,739,753
|
8.32
|
%
|
|||||||||
The accompanying notes are an integral part of these financial statements.
|
HENNESSY FUNDS
|
1-800-966-4354
|
11
|
COMMON STOCKS
|
Number
|
% of
|
||||||||||
|
|
of Shares
|
Value
|
Net Assets
|
|||||||||
|
Information Technology – 8.49%
|
||||||||||||
|
Apple, Inc.
|
19,398
|
$
|
3,312,596
|
4.80
|
%
|
|||||||
|
Cisco Systems, Inc.
|
21,713
|
1,131,899
|
1.64
|
%
|
||||||||
|
Texas Instruments, Inc.
|
9,967
|
1,415,414
|
2.05
|
%
|
||||||||
|
|
5,859,909
|
8.49
|
%
|
|||||||||
|
Materials – 8.48%
|
||||||||||||
|
Air Products and Chemicals, Inc.
|
4,789
|
1,352,605
|
1.96
|
%
|
||||||||
|
Albemarle Corp.
|
7,253
|
919,535
|
1.33
|
%
|
||||||||
|
Martin Marietta Materials, Inc.
|
4,810
|
1,967,002
|
2.86
|
%
|
||||||||
|
NewMarket Corp.
|
3,339
|
1,609,899
|
2.33
|
%
|
||||||||
|
|
5,849,041
|
8.48
|
%
|
|||||||||
|
|
||||||||||||
|
Total Common Stocks
|
||||||||||||
|
(Cost $28,795,840)
|
45,742,962
|
66.29
|
%
|
|||||||||
|
|
||||||||||||
|
PREFERRED STOCKS – 1.15%
|
||||||||||||
|
Consumer Staples – 0.03%
|
||||||||||||
|
CHS, Inc., Series 4, 7.500%, Perpetual
|
940
|
23,688
|
0.03
|
%
|
||||||||
|
Financials – 1.08%
|
||||||||||||
|
AEGON Funding Co. LLC, 5.100%, 12/15/2049
|
985
|
18,351
|
0.03
|
%
|
||||||||
|
Allstate Corp., Series H, 5.100%, Perpetual
|
1,120
|
21,280
|
0.03
|
%
|
||||||||
|
American International Group, Inc., Series A, 5.850%, Perpetual
|
1,015
|
22,736
|
0.03
|
%
|
||||||||
|
Arch Capital Group Ltd., Series F, 5.450%, Perpetual
|
726
|
14,818
|
0.02
|
%
|
||||||||
|
Axis Capital Holdings Ltd., Series E, 5.500%, Perpetual
|
1,005
|
19,587
|
0.03
|
%
|
||||||||
|
Bank of America Corp., Series KK, 5.375%, Perpetual
|
1,675
|
34,605
|
0.06
|
%
|
||||||||
|
Bank of Hawaii Corp., Series A, 4.375%, Perpetual
|
770
|
10,095
|
0.01
|
%
|
||||||||
|
Capital One Financial Corp., Series I, 5.000%, Perpetual
|
1,900
|
30,951
|
0.04
|
%
|
||||||||
|
Carlyle Finance LLC, 4.625%, 05/15/2061
|
630
|
10,294
|
0.01
|
%
|
||||||||
|
Citigroup, Inc., Series K, 6.875% to 11/15/2023 then
|
||||||||||||
|
3 Month CME Term SOFR + 4.392%, Perpetual (b)
|
780
|
19,789
|
0.03
|
%
|
||||||||
|
Citizens Financial Group, Inc., Series D, 6.350% to 04/06/2024
|
||||||||||||
|
then 3 Month CME Term SOFR + 3.904%, Perpetual (b)
|
1,180
|
27,128
|
0.04
|
%
|
||||||||
|
Cullen/Frost Bankers, Inc., Series B, 4.450%, Perpetual
|
860
|
13,803
|
0.02
|
%
|
||||||||
|
Equitable Holdings, Inc., Series A, 5.250%, Perpetual
|
1,190
|
21,456
|
0.03
|
%
|
||||||||
|
Federal Agricultural Mortgage Corp., Series F, 5.250%, Perpetual
|
585
|
11,168
|
0.02
|
%
|
||||||||
|
Fifth Third Bancorp, Series I, 6.625% to 12/31/2023 then
|
||||||||||||
|
3 Month CME Term SOFR + 3.972%, Perpetual (b)
|
765
|
18,643
|
0.03
|
%
|
||||||||
The accompanying notes are an integral part of these financial statements.
|
WWW.HENNESSYFUNDS.COM
|
12
|
SCHEDULE OF INVESTMENTS
|
|
PREFERRED STOCKS
|
Number
|
% of
|
||||||||||
|
|
of Shares
|
Value
|
Net Assets
|
|||||||||
|
Financials (Continued)
|
||||||||||||
|
First Citizens BancShares, Inc., Series C, 5.625%, Perpetual
|
675
|
$
|
13,001
|
0.02
|
%
|
|||||||
|
First Horizon Corp., Series B, 6.625% to 08/01/2025 then
|
||||||||||||
|
3 Month LIBOR USD + 4.262%, Perpetual (b)
|
575
|
12,420
|
0.02
|
%
|
||||||||
|
Hartford Financial Services Group, Inc., Series G, 6.000%, Perpetual
|
1,125
|
25,706
|
0.04
|
%
|
||||||||
|
Huntington Bancshares, Inc., Series J, 6.875% to 04/15/2028 then
|
||||||||||||
|
5 Year CMT Rate + 2.704%, Perpetual (b)
|
1,325
|
29,349
|
0.04
|
%
|
||||||||
|
JPMorgan Chase & Co.
|
||||||||||||
|
Series JJ, 4.550%, Perpetual
|
1,310
|
24,065
|
0.03
|
%
|
||||||||
|
Series LL, 4.625%, Perpetual
|
1,285
|
24,119
|
0.03
|
%
|
||||||||
|
KeyCorp
|
||||||||||||
|
Series G, 5.625%, Perpetual
|
955
|
14,421
|
0.02
|
%
|
||||||||
|
Series E, 6.125% to 12/15/2026 then
|
||||||||||||
|
3 Month CME Term SOFR + 4.154%, Perpetual (b)
|
512
|
9,139
|
0.01
|
%
|
||||||||
|
MetLife, Inc., Series F, 4.750%, Perpetual
|
1,720
|
32,215
|
0.05
|
%
|
||||||||
|
Morgan Stanley, Series O, 4.250%, Perpetual
|
2,365
|
38,809
|
0.07
|
%
|
||||||||
|
Regions Financial Corp., Series C, 5.700% to 05/15/2029 then
|
||||||||||||
|
3 Month LIBOR USD + 3.148%, Perpetual (b)
|
1,035
|
18,475
|
0.03
|
%
|
||||||||
|
Reinsurance Group of America, Inc., 7.125% to 10/15/2027 then
|
||||||||||||
|
5 Year CMT Rate + 3.456%,10/15/2052 (b)
|
610
|
15,555
|
0.02
|
%
|
||||||||
|
Synchrony Financial, Series A, 5.625%, Perpetual
|
1,255
|
18,536
|
0.03
|
%
|
||||||||
|
Synovus Financial Corp., Series E, 5.875% to 07/01/2024 then
|
||||||||||||
|
5 Year CMT Rate + 4.127%, Perpetual (b)
|
920
|
20,902
|
0.03
|
%
|
||||||||
|
The Charles Schwab Corp., Series J, 4.450%, Perpetual
|
1,495
|
26,387
|
0.04
|
%
|
||||||||
|
The Goldman Sachs Group, Inc., Series K, 6.375% to 05/10/2024 then
|
||||||||||||
|
3 Month CME Term SOFR + 3.812%, Perpetual (b)
|
895
|
22,518
|
0.03
|
%
|
||||||||
|
Truist Financial Corp., Series O, 5.250%, Perpetual
|
1,625
|
32,662
|
0.05
|
%
|
||||||||
|
US Bancorp, Series O, 4.500%, Perpetual
|
1,295
|
21,834
|
0.03
|
%
|
||||||||
|
Wells Fargo & Co.
|
||||||||||||
|
Series Y, 5.625%, Perpetual
|
780
|
16,708
|
0.02
|
%
|
||||||||
|
Series Z, 4.750%, Perpetual
|
1,555
|
27,679
|
0.04
|
%
|
||||||||
|
|
739,204
|
1.08
|
%
|
|||||||||
|
Industrials – 0.02%
|
||||||||||||
|
WESCO International, Inc., Series A, 10.625% to 06/22/2025 then
|
||||||||||||
|
5 Year CMT Rate + 10.325%, Perpetual (b)
|
595
|
15,863
|
0.02
|
%
|
||||||||
|
Utilities – 0.02%
|
||||||||||||
|
Entergy Arkansas LLC, 4.875%, 09/01/2066
|
770
|
15,577
|
0.02
|
%
|
||||||||
|
|
||||||||||||
|
Total Preferred Stocks
|
||||||||||||
|
(Cost $1,008,789)
|
794,332
|
1.15
|
%
|
|||||||||
The accompanying notes are an integral part of these financial statements.
|
HENNESSY FUNDS
|
1-800-966-4354
|
13
|
REITS – 0.03%
|
Number of Shares/
|
% of
|
||||||||||
|
|
Par Amount
|
Value
|
Net Assets
|
|||||||||
|
Real Estate – 0.03%
|
||||||||||||
|
Public Storage, Series P, 4.000%, Perpetual
|
1,185
|
$
|
18,711
|
0.03
|
%
|
|||||||
|
|
||||||||||||
|
Total REITS
|
||||||||||||
|
(Cost $24,228)
|
18,711
|
0.03
|
%
|
|||||||||
|
|
||||||||||||
|
CORPORATE BONDS – 15.71%
|
||||||||||||
|
Communication Services – 1.87%
|
||||||||||||
|
AT&T, Inc., 4.250%, 03/01/2027
|
$
|
980,000
|
930,211
|
1.35
|
%
|
|||||||
|
Comcast Corp., 4.650%, 02/15/2033
|
250,000
|
226,897
|
0.33
|
%
|
||||||||
|
T-Mobile USA, Inc., 3.875%, 04/15/2030
|
150,000
|
130,857
|
0.19
|
%
|
||||||||
|
|
1,287,965
|
1.87
|
%
|
|||||||||
|
Consumer Discretionary – 0.91%
|
||||||||||||
|
Lowe’s Companies, Inc., 2.625%, 04/01/2031
|
325,000
|
257,305
|
0.37
|
%
|
||||||||
|
Starbucks Corp., 3.500%, 03/01/2028
|
400,000
|
367,733
|
0.54
|
%
|
||||||||
|
|
625,038
|
0.91
|
%
|
|||||||||
|
Energy – 0.96%
|
||||||||||||
|
Canadian Natural Resources Ltd., 3.900%, 02/01/2025
|
300,000
|
291,740
|
0.42
|
%
|
||||||||
|
The Williams Companies, Inc., 2.600%, 03/15/2031
|
475,000
|
371,281
|
0.54
|
%
|
||||||||
|
|
663,021
|
0.96
|
%
|
|||||||||
|
Financials – 7.25%
|
||||||||||||
|
Aflac, Inc., 3.600%, 4/1/2030
|
300,000
|
261,959
|
0.38
|
%
|
||||||||
|
Bank of America Corp., 2.299% to 07/21/2031 then
|
||||||||||||
|
SOFR + 1.220%, 07/21/2032 (b)
|
575,000
|
425,246
|
0.62
|
%
|
||||||||
|
Fifth Third Bancorp, 3.650%, 01/25/2024
|
225,000
|
223,403
|
0.32
|
%
|
||||||||
|
Huntington Bancshares, Inc.
|
||||||||||||
|
2.550%, 02/04/2030
|
525,000
|
404,773
|
0.59
|
%
|
||||||||
|
4.000%, 05/15/2025
|
365,000
|
349,804
|
0.51
|
%
|
||||||||
|
JPMorgan Chase & Co., 2.069% to 06/01/2028 then
|
||||||||||||
|
SOFR + 1.015%, 06/01/2029 (b)
|
325,000
|
270,364
|
0.39
|
%
|
||||||||
|
Marsh & McLennan Companies, Inc., 4.375%, 03/15/2029
|
275,000
|
257,368
|
0.37
|
%
|
||||||||
|
Morgan Stanley
|
||||||||||||
|
1.593% to 05/04/2026 then SOFR + 0.879%, 05/04/2027 (b)
|
295,000
|
262,122
|
0.38
|
%
|
||||||||
|
2.239% to 07/21/2031 then SOFR + 1.178%, 07/21/2032 (b)
|
330,000
|
244,008
|
0.35
|
%
|
||||||||
|
PayPal Holdings, Inc., 2.850%, 10/1/2029
|
750,000
|
638,665
|
0.93
|
%
|
||||||||
|
Prudential Financial, Inc., 3.878%, 03/27/2028
|
260,000
|
241,715
|
0.35
|
%
|
||||||||
|
Regions Financial Corp., 1.800%, 08/12/2028
|
325,000
|
254,362
|
0.37
|
%
|
||||||||
The accompanying notes are an integral part of these financial statements.
|
WWW.HENNESSYFUNDS.COM
|
14
|
SCHEDULE OF INVESTMENTS
|
|
CORPORATE BONDS
|
% of
|
|||||||||||
|
|
Par Amount
|
Value
|
Net Assets
|
|||||||||
|
Financials (Continued)
|
||||||||||||
|
State Street Corp., 4.821% to 01/26/2033 then
|
||||||||||||
|
SOFR + 1.567%,01/26/2034 (b)
|
$
|
175,000
|
$
|
155,591
|
0.23
|
%
|
||||||
|
The Goldman Sachs Group, Inc., 4.223% to 05/01/2028 then
|
||||||||||||
|
3 Month CME Term SOFR + 1.563%,05/01/2029 (b)
|
300,000
|
274,081
|
0.40
|
%
|
||||||||
|
Willis North America, Inc., 3.600%, 05/15/2024
|
750,000
|
739,464
|
1.06
|
%
|
||||||||
|
|
5,002,925
|
7.25
|
%
|
|||||||||
|
Health Care – 2.41%
|
||||||||||||
|
Edwards Lifesciences Corp., 4.300%, 06/15/2028
|
700,000
|
656,599
|
0.95
|
%
|
||||||||
|
Evernorth Health, Inc., 3.500%, 06/15/2024
|
700,000
|
686,839
|
0.99
|
%
|
||||||||
|
Regeneron Pharmaceuticals, Inc., 1.750%, 09/15/2030
|
425,000
|
321,051
|
0.47
|
%
|
||||||||
|
|
1,664,489
|
2.41
|
%
|
|||||||||
|
Industrials – 0.93%
|
||||||||||||
|
General Electric Co., 3.625%, 05/01/2030
|
380,000
|
324,633
|
0.47
|
%
|
||||||||
|
The Boeing Co., 2.196%, 02/04/2026
|
225,000
|
206,775
|
0.30
|
%
|
||||||||
|
The Timken Co., 6.875%, 05/08/2028
|
110,000
|
110,111
|
0.16
|
%
|
||||||||
|
|
641,519
|
0.93
|
%
|
|||||||||
|
Information Technology – 1.38%
|
||||||||||||
|
Autodesk, Inc., 2.850%, 01/15/2030
|
675,000
|
564,562
|
0.81
|
%
|
||||||||
|
Broadcom, Inc., 4.110%, 09/15/2028
|
425,000
|
390,133
|
0.57
|
%
|
||||||||
|
|
954,695
|
1.38
|
%
|
|||||||||
|
|
||||||||||||
|
Total Corporate Bonds
|
||||||||||||
|
(Cost $12,414,668)
|
10,839,652
|
15.71
|
%
|
|||||||||
|
|
||||||||||||
|
MORTGAGE-BACKED SECURITIES – 2.75%
|
||||||||||||
|
Federal Agency Mortgage-Backed Obligations – 2.75%
|
||||||||||||
|
Fannie Mae Pool
|
||||||||||||
|
3.000%, 10/01/2043
|
790,014
|
664,550
|
0.96
|
%
|
||||||||
|
3.500%, 01/01/2042
|
144,001
|
126,742
|
0.18
|
%
|
||||||||
|
6.000%, 10/01/2037
|
73,359
|
72,807
|
0.11
|
%
|
||||||||
|
Fannie Mae REMICS
|
||||||||||||
|
Series 2013-52, 1.250%, 06/25/2043
|
36,754
|
28,516
|
0.04
|
%
|
||||||||
|
Series 2012-16, 2.000%, 11/25/2041
|
33,663
|
28,291
|
0.04
|
%
|
||||||||
|
Freddie Mac Gold Pool
|
||||||||||||
|
3.000%, 05/01/2042
|
420,723
|
356,255
|
0.52
|
%
|
||||||||
|
3.000%, 09/01/2042
|
526,591
|
446,243
|
0.65
|
%
|
||||||||
|
5.500%, 04/01/2037
|
28,394
|
27,970
|
0.04
|
%
|
||||||||
The accompanying notes are an integral part of these financial statements.
|
HENNESSY FUNDS
|
1-800-966-4354
|
15
|
MORTGAGE-BACKED SECURITIES
|
% of
|
|||||||||||
|
|
Par Amount
|
Value
|
Net Assets
|
|||||||||
|
Federal Agency Mortgage-Backed Obligations (Continued)
|
||||||||||||
|
Freddie Mac REMICS
|
||||||||||||
|
Series 4146, 1.500%, 10/15/2042
|
$
|
8,454
|
$
|
8,071
|
0.01
|
%
|
||||||
|
Series 4309, 2.000%, 10/15/2043
|
29,720
|
26,024
|
0.04
|
%
|
||||||||
|
Series 3870, 2.750%, 01/15/2041
|
9,074
|
8,569
|
0.01
|
%
|
||||||||
|
Series 4322, 3.000%, 05/15/2043
|
41,730
|
39,298
|
0.06
|
%
|
||||||||
|
Government National Mortgage Association,
|
||||||||||||
|
Series 2013-24, 1.750%, 2/16/2043
|
78,183
|
64,524
|
0.09
|
%
|
||||||||
|
|
||||||||||||
|
Total Mortgage-Backed Securities
|
||||||||||||
|
(Cost $2,224,280)
|
1,897,860
|
2.75
|
%
|
|||||||||
|
|
||||||||||||
|
U.S. TREASURY OBLIGATIONS – 12.20%
|
||||||||||||
|
U.S. Treasury Notes – 12.20%
|
||||||||||||
|
0.250%, 08/31/2025
|
1,250,000
|
1,144,580
|
1.66
|
%
|
||||||||
|
0.625%, 03/31/2027
|
450,000
|
390,551
|
0.57
|
%
|
||||||||
|
0.750%, 04/30/2026
|
1,500,000
|
1,353,633
|
1.96
|
%
|
||||||||
|
1.250%, 12/31/2026
|
625,000
|
559,595
|
0.81
|
%
|
||||||||
|
1.500%, 02/15/2025
|
200,000
|
190,559
|
0.28
|
%
|
||||||||
|
1.875%, 07/31/2026
|
1,550,000
|
1,429,875
|
2.07
|
%
|
||||||||
|
2.500%, 03/31/2027
|
300,000
|
277,980
|
0.40
|
%
|
||||||||
|
2.625%, 04/15/2025
|
300,000
|
289,072
|
0.42
|
%
|
||||||||
|
2.750%, 08/15/2032
|
550,000
|
466,426
|
0.68
|
%
|
||||||||
|
3.000%, 10/31/2025
|
450,000
|
432,308
|
0.63
|
%
|
||||||||
|
3.375%, 05/15/2033
|
400,000
|
354,625
|
0.51
|
%
|
||||||||
|
3.500%, 02/15/2033
|
225,000
|
201,938
|
0.29
|
%
|
||||||||
|
3.625%, 05/15/2026
|
350,000
|
339,021
|
0.49
|
%
|
||||||||
|
4.125%, 09/30/2027
|
275,000
|
267,792
|
0.39
|
%
|
||||||||
|
4.125%, 11/15/2032
|
500,000
|
472,168
|
0.68
|
%
|
||||||||
|
4.250%, 05/31/2025
|
250,000
|
246,396
|
0.36
|
%
|
||||||||
|
|
||||||||||||
|
Total U.S. Treasury Obligations
|
||||||||||||
|
(Cost $9,106,280)
|
8,416,519
|
12.20
|
%
|
|||||||||
The accompanying notes are an integral part of these financial statements.
|
WWW.HENNESSYFUNDS.COM
|
16
|
SCHEDULE OF INVESTMENTS
|
|
SHORT-TERM INVESTMENTS – 1.91%
|
Number
|
% of
|
||||||||||
|
|
of Shares
|
Value
|
Net Assets
|
|||||||||
|
Money Market Funds – 1.91%
|
||||||||||||
|
First American Treasury Obligations Fund – Class X, 5.275% (c)
|
1,314,593
|
$
|
1,314,593
|
1.91
|
%
|
|||||||
|
|
||||||||||||
|
Total Short-Term Investments
|
||||||||||||
|
(Cost $1,314,593)
|
1,314,593
|
1.91
|
%
|
|||||||||
|
|
||||||||||||
|
Total Investments
|
||||||||||||
|
(Cost $54,888,678) – 100.04%
|
69,024,629
|
100.04
|
%
|
|||||||||
|
Liabilities in Excess of Other Assets – (0.04)%
|
(24,151
|
)
|
(0.04
|
)%
|
||||||||
|
|
||||||||||||
|
TOTAL NET ASSETS – 100.00%
|
$
|
69,000,478
|
100.00
|
%
|
||||||||
Percentages are stated as a percent of net assets.
ADR – American Depositary Receipt
CMT – Constant Maturity Treasury
LIBOR – London Interbank Offered Rate
REIT – Real Estate Investment Trust
SOFR – Secured Overnight Financing Rate
|
(a)
|
Non-income producing security.
|
|
(b)
|
Variable rate security; rate disclosed is the rate as of October 31, 2023
|
|
(c)
|
The rate listed is the fund’s seven-day yield as of October 31, 2023.
|
The accompanying notes are an integral part of these financial statements.
|
HENNESSY FUNDS
|
1-800-966-4354
|
17
Summary of Fair Value Exposure as of October 31, 2023
The following is a summary of the inputs used to value the Fund’s net assets as of October 31, 2023 (see Note 3 in the accompanying Notes to the Financial Statements):
|
Common Stocks
|
Level 1
|
Level 2
|
Level 3
|
Total
|
||||||||||||
|
Communication Services
|
$
|
2,811,356
|
$
|
—
|
$
|
—
|
$
|
2,811,356
|
||||||||
|
Consumer Discretionary
|
6,270,501
|
—
|
—
|
6,270,501
|
||||||||||||
|
Consumer Staples
|
4,075,615
|
—
|
—
|
4,075,615
|
||||||||||||
|
Energy
|
1,407,606
|
—
|
—
|
1,407,606
|
||||||||||||
|
Financials
|
11,874,356
|
—
|
—
|
11,874,356
|
||||||||||||
|
Health Care
|
1,854,825
|
—
|
—
|
1,854,825
|
||||||||||||
|
Industrials
|
5,739,753
|
—
|
—
|
5,739,753
|
||||||||||||
|
Information Technology
|
5,859,909
|
—
|
—
|
5,859,909
|
||||||||||||
|
Materials
|
5,849,041
|
—
|
—
|
5,849,041
|
||||||||||||
|
Total Common Stocks
|
$
|
45,742,962
|
$
|
—
|
$
|
—
|
$
|
45,742,962
|
||||||||
|
Preferred Stocks
|
||||||||||||||||
|
Consumer Staples
|
$
|
23,688
|
$
|
—
|
$
|
—
|
$
|
23,688
|
||||||||
|
Financials
|
739,204
|
—
|
—
|
739,204
|
||||||||||||
|
Industrials
|
15,863
|
—
|
—
|
15,863
|
||||||||||||
|
Utilities
|
15,577
|
—
|
—
|
15,577
|
||||||||||||
|
Total Preferred Stocks
|
$
|
794,332
|
$
|
—
|
$
|
—
|
$
|
794,332
|
||||||||
|
REITS
|
||||||||||||||||
|
Real Estate
|
$
|
18,711
|
$
|
—
|
$
|
—
|
$
|
18,711
|
||||||||
|
Total REITS
|
$
|
18,711
|
$
|
—
|
$
|
—
|
$
|
18,711
|
||||||||
|
Corporate Bonds
|
||||||||||||||||
|
Communication Services
|
$
|
—
|
$
|
1,287,965
|
$
|
—
|
$
|
1,287,965
|
||||||||
|
Consumer Discretionary
|
—
|
625,038
|
—
|
625,038
|
||||||||||||
|
Energy
|
—
|
663,021
|
—
|
663,021
|
||||||||||||
|
Financials
|
—
|
5,002,925
|
—
|
5,002,925
|
||||||||||||
|
Health Care
|
—
|
1,664,489
|
—
|
1,664,489
|
||||||||||||
|
Industrials
|
—
|
641,519
|
—
|
641,519
|
||||||||||||
|
Information Technology
|
—
|
954,695
|
—
|
954,695
|
||||||||||||
|
Total Corporate Bonds
|
$
|
—
|
$
|
10,839,652
|
$
|
—
|
$
|
10,839,652
|
||||||||
|
Mortgage-Backed Securities
|
||||||||||||||||
|
Federal Agency Mortgage-Backed Obligations
|
$
|
—
|
$
|
1,897,860
|
$
|
—
|
$
|
1,897,860
|
||||||||
|
Total Mortgage-Backed Securities
|
$
|
—
|
$
|
1,897,860
|
$
|
—
|
$
|
1,897,860
|
||||||||
|
U.S. Treasury Obligations
|
||||||||||||||||
|
U.S. Treasury Notes
|
$
|
—
|
$
|
8,416,519
|
$
|
—
|
$
|
8,416,519
|
||||||||
|
Total U.S. Treasury Obligations
|
$
|
—
|
$
|
8,416,519
|
$
|
—
|
$
|
8,416,519
|
||||||||
|
Short-Term Investments
|
||||||||||||||||
|
Money Market Funds
|
$
|
1,314,593
|
$
|
—
|
$
|
—
|
$
|
1,314,593
|
||||||||
|
Total Short-Term Investments
|
$
|
1,314,593
|
$
|
—
|
$
|
—
|
$
|
1,314,593
|
||||||||
|
Total Investments
|
$
|
47,870,598
|
$
|
21,154,031
|
$
|
—
|
$
|
69,024,629
|
||||||||
The accompanying notes are an integral part of these financial statements.
|
WWW.HENNESSYFUNDS.COM
|
18
|
SCHEDULE OF INVESTMENTS/STATEMENT OF ASSETS AND LIABILITIES
|
Financial Statements
|
Statement of Assets and Liabilities as of October 31, 2023
|
|
ASSETS:
|
||||
|
Investments in securities, at value (cost $54,888,678)
|
$
|
69,024,629
|
||
|
Dividends and interest receivable
|
211,629
|
|||
|
Receivable for fund shares sold
|
39,053
|
|||
|
Prepaid expenses and other assets
|
21,055
|
|||
|
Total assets
|
69,296,366
|
|||
|
LIABILITIES:
|
||||
|
Payable for fund shares redeemed
|
182,494
|
|||
|
Payable to advisor
|
48,233
|
|||
|
Payable to administrator
|
13,329
|
|||
|
Payable to auditor
|
22,752
|
|||
|
Accrued distribution fees
|
6,665
|
|||
|
Accrued service fees
|
2,970
|
|||
|
Accrued trustees fees
|
6,073
|
|||
|
Accrued expenses and other payables
|
13,372
|
|||
|
Total liabilities
|
295,888
|
|||
|
NET ASSETS
|
$
|
69,000,478
|
||
|
NET ASSETS CONSISTS OF:
|
||||
|
Capital stock
|
$
|
49,392,170
|
||
|
Total distributable earnings
|
19,608,308
|
|||
|
Total net assets
|
$
|
69,000,478
|
||
|
NET ASSETS:
|
||||
|
Investor Class
|
||||
|
Shares authorized (no par value)
|
Unlimited
|
|||
|
Net assets applicable to outstanding shares
|
$
|
34,290,347
|
||
|
Shares issued and outstanding
|
2,432,734
|
|||
|
Net asset value, offering price, and redemption price per share
|
$
|
14.10
|
||
|
Institutional Class
|
||||
|
Shares authorized (no par value)
|
Unlimited
|
|||
|
Net assets applicable to outstanding shares
|
$
|
34,710,131
|
||
|
Shares issued and outstanding
|
2,624,343
|
|||
|
Net asset value, offering price, and redemption price per share
|
$
|
13.23
|
||
The accompanying notes are an integral part of these financial statements.
|
HENNESSY FUNDS
|
1-800-966-4354
|
19
Financial Statements
|
Statement of Operations for the year ended October 31, 2023
|
|
INVESTMENT INCOME:
|
||||
|
Dividend income(1)
|
$
|
1,071,574
|
||
|
Interest income
|
749,892
|
|||
|
Total investment income
|
1,821,466
|
|||
|
EXPENSES:
|
||||
|
Investment advisory fees (See Note 5)
|
652,474
|
|||
|
Sub-transfer agent expenses – Investor Class (See Note 5)
|
78,752
|
|||
|
Sub-transfer agent expenses – Institutional Class (See Note 5)
|
39,594
|
|||
|
Administration, accounting, custody, and transfer agent fees (See Note 5)
|
87,437
|
|||
|
Distribution fees – Investor Class (See Note 5)
|
56,928
|
|||
|
Service fees – Investor Class (See Note 5)
|
37,952
|
|||
|
Federal and state registration fees
|
31,313
|
|||
|
Audit fees
|
22,753
|
|||
|
Compliance expense (See Note 5)
|
22,672
|
|||
|
Trustees’ fees and expenses
|
20,712
|
|||
|
Reports to shareholders
|
13,000
|
|||
|
Legal fees
|
2,164
|
|||
|
Interest expense (See Note 7)
|
97
|
|||
|
Other expenses
|
14,845
|
|||
|
Total expenses
|
1,080,693
|
|||
|
NET INVESTMENT INCOME
|
$
|
740,773
|
||
|
REALIZED AND UNREALIZED GAINS (LOSSES):
|
||||
|
Net realized gain on investments:
|
$
|
6,577,550
|
||
|
Net change in unrealized appreciation/depreciation on investments:
|
(3,501,366
|
)
|
||
|
Net gain on investments
|
3,076,184
|
|||
|
NET INCREASE IN NET ASSETS RESULTING FROM OPERATIONS
|
$
|
3,816,957
|
||
|
(1)
|
Net of foreign taxes withheld and issuance fees of $7,955.
|
The accompanying notes are an integral part of these financial statements.
|
WWW.HENNESSYFUNDS.COM
|
20
|
STATEMENT OF OPERATIONS/STATEMENTS OF CHANGES IN NET ASSETS
|
Financial Statements
|
Statements of Changes in Net Assets
|
|
Year Ended
|
Year Ended
|
|||||||
|
October 31, 2023
|
October 31, 2022
|
|||||||
|
OPERATIONS:
|
||||||||
|
Net investment income
|
$
|
740,773
|
$
|
757,118
|
||||
|
Net realized gain on investments
|
6,577,550
|
2,841,084
|
||||||
|
Net change in unrealized
|
||||||||
|
appreciation/depreciation on investments
|
(3,501,366
|
)
|
(17,205,736
|
)
|
||||
|
Net increase (decrease) in net
|
||||||||
|
assets resulting from operations
|
3,816,957
|
(13,607,534
|
)
|
|||||
|
DISTRIBUTIONS TO SHAREHOLDERS:
|
||||||||
|
Distributable earnings – Investor Class
|
(1,298,637
|
)
|
(3,654,611
|
)
|
||||
|
Distributable earnings – Institutional Class
|
(1,743,953
|
)
|
(4,723,563
|
)
|
||||
|
Total distributions
|
(3,042,590
|
)
|
(8,378,174
|
)
|
||||
|
CAPITAL SHARE TRANSACTIONS:
|
||||||||
|
Proceeds from shares subscribed – Investor Class
|
316,740
|
1,881,768
|
||||||
|
Proceeds from shares subscribed – Institutional Class
|
1,100,458
|
2,382,337
|
||||||
|
Dividends reinvested – Investor Class
|
1,260,827
|
3,556,955
|
||||||
|
Dividends reinvested – Institutional Class
|
1,285,409
|
3,602,091
|
||||||
|
Cost of shares redeemed – Investor Class
|
(6,701,151
|
)
|
(10,361,778
|
)
|
||||
|
Cost of shares redeemed – Institutional Class
|
(15,950,410
|
)
|
(12,193,431
|
)
|
||||
|
Net decrease in net assets derived
|
||||||||
|
from capital share transactions
|
(18,688,127
|
)
|
(11,132,058
|
)
|
||||
|
TOTAL DECREASE IN NET ASSETS
|
(17,913,760
|
)
|
(33,117,766
|
)
|
||||
|
NET ASSETS:
|
||||||||
|
Beginning of year
|
86,914,238
|
120,032,004
|
||||||
|
End of year
|
$
|
69,000,478
|
$
|
86,914,238
|
||||
|
CHANGES IN SHARES OUTSTANDING:
|
||||||||
|
Shares sold – Investor Class
|
22,144
|
115,566
|
||||||
|
Shares sold – Institutional Class
|
81,665
|
160,649
|
||||||
|
Shares issued to holders as reinvestment
|
||||||||
|
of dividends – Investor Class
|
88,230
|
217,125
|
||||||
|
Shares issued to holders as reinvestment
|
||||||||
|
of dividends – Institutional Class
|
95,776
|
234,876
|
||||||
|
Shares redeemed – Investor Class
|
(462,960
|
)
|
(673,769
|
)
|
||||
|
Shares redeemed – Institutional Class
|
(1,168,441
|
)
|
(853,794
|
)
|
||||
|
Net decrease in shares outstanding
|
(1,343,586
|
)
|
(799,347
|
)
|
||||
The accompanying notes are an integral part of these financial statements.
|
HENNESSY FUNDS
|
1-800-966-4354
|
21
Financial Statements
|
Financial Highlights
|
For an Investor Class share outstanding throughout each year
PER SHARE DATA:
Net asset value, beginning of year
Income from investment operations:
Net investment income(1)
Net realized and unrealized gains (losses) on investments
Total from investment operations
Less distributions:
Dividends from net investment income
Dividends from net realized gains
Total distributions
Net asset value, end of year
TOTAL RETURN
SUPPLEMENTAL DATA AND RATIOS:
Net assets, end of year (millions)
Ratio of expenses to average net assets
Ratio of net investment income to average net assets
Portfolio turnover rate(2)
|
(1)
|
Calculated using the average shares outstanding method.
|
|
(2)
|
Calculated on the basis of the Fund as a whole.
|
The accompanying notes are an integral part of these financial statements.
|
WWW.HENNESSYFUNDS.COM
|
22
|
FINANCIAL HIGHLIGHTS — INVESTOR CLASS
|
|
Year Ended October 31,
|
||||||||||||||||||
|
2023
|
2022
|
2021
|
2020
|
2019
|
||||||||||||||
|
$
|
14.06
|
$
|
17.26
|
$
|
15.12
|
$
|
15.72
|
$
|
15.82
|
|||||||||
|
0.10
|
0.08
|
0.09
|
0.16
|
0.18
|
||||||||||||||
|
0.42
|
(2.09
|
)
|
3.01
|
0.40
|
1.02
|
|||||||||||||
|
0.52
|
(2.01
|
)
|
3.10
|
0.56
|
1.20
|
|||||||||||||
|
(0.10
|
)
|
(0.08
|
)
|
(0.10
|
)
|
(0.16
|
)
|
(0.17
|
)
|
|||||||||
|
(0.38
|
)
|
(1.11
|
)
|
(0.86
|
)
|
(1.00
|
)
|
(1.13
|
)
|
|||||||||
|
(0.48
|
)
|
(1.19
|
)
|
(0.96
|
)
|
(1.16
|
)
|
(1.30
|
)
|
|||||||||
|
$
|
14.10
|
$
|
14.06
|
$
|
17.26
|
$
|
15.12
|
$
|
15.72
|
|||||||||
|
3.67
|
%
|
-12.60
|
%
|
21.24
|
%
|
3.74
|
%
|
8.39
|
%
|
|||||||||
|
$
|
34.29
|
$
|
39.17
|
$
|
53.97
|
$
|
51.29
|
$
|
93.51
|
|||||||||
|
1.52
|
%
|
1.51
|
%
|
1.49
|
%
|
1.49
|
%
|
1.46
|
%
|
|||||||||
|
0.71
|
%
|
0.53
|
%
|
0.54
|
%
|
1.08
|
%
|
1.16
|
%
|
|||||||||
|
11
|
%
|
15
|
%
|
26
|
%
|
22
|
%
|
16
|
%
|
|||||||||
The accompanying notes are an integral part of these financial statements.
|
HENNESSY FUNDS
|
1-800-966-4354
|
23
Financial Statements
|
Financial Highlights
|
For an Institutional Class share outstanding throughout each year
PER SHARE DATA:
Net asset value, beginning of year
Income from investment operations:
Net investment income(1)
Net realized and unrealized gains (losses) on investments
Total from investment operations
Less distributions:
Dividends from net investment income
Dividends from net realized gains
Total distributions
Net asset value, end of year
TOTAL RETURN
SUPPLEMENTAL DATA AND RATIOS:
Net assets, end of year (millions)
Ratio of expenses to average net assets
Ratio of net investment income to average net assets
Portfolio turnover rate(2)
|
(1)
|
Calculated using the average shares outstanding method.
|
|
(2)
|
Calculated on the basis of the Fund as a whole.
|
The accompanying notes are an integral part of these financial statements.
|
WWW.HENNESSYFUNDS.COM
|
24
|
FINANCIAL HIGHLIGHTS — INSTITUTIONAL CLASS
|
|
Year Ended October 31,
|
||||||||||||||||||
|
2023
|
2022
|
2021
|
2020
|
2019
|
||||||||||||||
|
$
|
13.21
|
$
|
16.22
|
$
|
14.22
|
$
|
14.80
|
$
|
14.93
|
|||||||||
|
0.15
|
0.13
|
0.14
|
0.20
|
0.22
|
||||||||||||||
|
0.38
|
(1.97
|
)
|
2.83
|
0.38
|
0.96
|
|||||||||||||
|
0.53
|
(1.84
|
)
|
2.97
|
0.58
|
1.18
|
|||||||||||||
|
(0.15
|
)
|
(0.13
|
)
|
(0.16
|
)
|
(0.22
|
)
|
(0.24
|
)
|
|||||||||
|
(0.36
|
)
|
(1.04
|
)
|
(0.81
|
)
|
(0.94
|
)
|
(1.07
|
)
|
|||||||||
|
(0.51
|
)
|
(1.17
|
)
|
(0.97
|
)
|
(1.16
|
)
|
(1.31
|
)
|
|||||||||
|
$
|
13.23
|
$
|
13.21
|
$
|
16.22
|
$
|
14.22
|
$
|
14.80
|
|||||||||
|
3.99
|
%
|
-12.25
|
%
|
21.68
|
%
|
4.16
|
%
|
8.76
|
%
|
|||||||||
|
$
|
34.71
|
$
|
47.74
|
$
|
66.06
|
$
|
61.75
|
$
|
80.40
|
|||||||||
|
1.15
|
%
|
1.13
|
%
|
1.12
|
%
|
1.12
|
%
|
1.09
|
%
|
|||||||||
|
1.08
|
%
|
0.90
|
%
|
0.91
|
%
|
1.44
|
%
|
1.53
|
%
|
|||||||||
|
11
|
%
|
15
|
%
|
26
|
%
|
22
|
%
|
16
|
%
|
|||||||||
The accompanying notes are an integral part of these financial statements.
|
HENNESSY FUNDS
|
1-800-966-4354
|
25
Financial Statements
|
Notes to the Financial Statements October 31, 2023
|
1). ORGANIZATION
The Hennessy Equity and Income Fund (the “Fund”) is a series of Hennessy Funds Trust (the “Trust”), which was organized as a Delaware statutory trust on September 17, 1992. The Fund is an open-end management
investment company registered under the Investment Company Act of 1940, as amended. The investment objective of the Fund is long-term capital growth and current income. The Fund is a diversified fund.
The Fund offers Investor Class and Institutional Class shares. Each class of shares differs principally in its respective 12b-1 distribution and service, shareholder servicing, and
sub-transfer agent expenses. There are no sales charges. Each class has identical rights to earnings, assets, and voting privileges, except for class-specific expenses and exclusive rights to vote on matters affecting only one class.
As an investment company, the Fund follows the investment company accounting and reporting guidance of the Financial Accounting Standards Board (the “FASB”) Accounting Standard Codification
Topic 946 “Financial Services—Investment Companies.”
2). SIGNIFICANT ACCOUNTING POLICIES
The following is a summary of significant accounting policies consistently followed by the Fund in the preparation of the financial statements. These policies conform to U.S. generally accepted accounting
principles (“GAAP”).
|
a).
|
Securities Valuation – All investments in securities are valued in accordance with the Fund’s valuation policies and procedures, as described in Note 3.
|
|
b).
|
Federal Income Taxes – The Fund has elected to be taxed as a regulated investment company and intends to distribute substantially all of its taxable income to its shareholders and otherwise comply with
the provisions of the Internal Revenue Code of 1986, as amended, applicable to regulated investment companies. As a result, the Fund has made no provision for federal income taxes or excise taxes. Net investment income/loss and
realized gains/losses for federal income tax purposes may differ from those reported in the financial statements because of temporary book-basis and tax-basis differences. Temporary differences are primarily the result of the
treatment of wash sales for tax reporting purposes. The Fund recognizes interest and penalties related to income tax benefits, if any, in the Statement of Operations as an income tax expense. Distributions from net realized
gains for book purposes may include short-term capital gains, which are included as ordinary income to shareholders for tax purposes. The Fund may utilize equalization accounting for tax purposes and designate earnings and
profits, including net realized gains distributed to shareholders on redemption of shares, as part of the dividends paid deduction for income tax purposes.
|
|
Due to inherent differences in the recognition of income, expenses, and realized gains/losses under GAAP and federal income tax regulations, permanent differences between book and tax basis for
reporting are identified and appropriately reclassified in the Statement of Assets and Liabilities, as needed. The adjustments for fiscal year 2023 are as follows:
|
|
Total
|
|||
|
Distributable
|
|||
|
Earnings
|
Capital Stock
|
||
|
$(858,254)
|
$858,254
|
|
WWW.HENNESSYFUNDS.COM
|
26
|
NOTES TO THE FINANCIAL STATEMENTS
|
|
c).
|
Accounting for Uncertainty in Income Taxes – The Fund has accounting policies regarding recognition and measurement of tax positions taken or expected to be taken on a tax return. The tax returns of the
Fund for the prior three fiscal years are open for examination. The Fund has reviewed all open tax years in major tax jurisdictions and concluded that there is no impact on the Fund’s net assets and no tax liability resulting from
unrecognized tax benefits relating to uncertain income tax positions taken or expected to be taken on a tax return. The Fund’s major tax jurisdictions are U.S. federal and Delaware.
|
|
d).
|
Income and Expenses – Dividend income is recognized on the ex-dividend date or as soon as information is available to the Fund. Interest income, which includes the amortization of premium and accretion
of discount, is recognized on an accrual basis. Market discounts, original issue discounts, and market premiums on debt securities are accreted or amortized to interest income over the life of a security with a corresponding
increase or decrease, as applicable, in the cost basis of such security using the yield-to-maturity method or, where applicable, the first call date of the security. Other non-cash dividends are recognized as investment income at
the fair value of the property received. The Fund is charged for those expenses that are directly attributable to its portfolio, such as advisory, administration, and certain shareholder service fees. Income, expenses (other than
expenses attributable to a specific class), and realized and unrealized gains/losses on investments are allocated to each class of shares based on such class’s net assets.
|
|
e).
|
Distributions to Shareholders – Dividends from net investment income for the Fund, if any, are declared and paid at the end of each calendar quarter. Distributions of net realized capital gains, if any,
are declared and paid annually, usually in December.
|
|
f).
|
Security Transactions – Investment and shareholder transactions are recorded on the trade date. The Fund determines the realized gain/loss from an investment transaction by comparing the original cost of
the security lot sold with the net sale proceeds. Discounts and premiums on securities purchased are accreted or amortized, respectively, over the life of each such security.
|
|
g).
|
Use of Estimates – Preparing financial statements in accordance with GAAP requires management to make estimates and assumptions that affect the reported amounts of assets and liabilities and disclosure
of contingent assets and liabilities at the date of the financial statements, as well as the reported change in net assets during the reporting period. Actual results could differ from those estimates.
|
|
h).
|
Share Valuation – The net asset value (“NAV”) per share of the Fund is calculated by dividing (i) the total value of the securities held by the Fund, plus cash and other assets, minus all liabilities
(including estimated accrued expenses) by (ii) the total number of Fund shares outstanding, rounded to the nearest $0.01. Fund shares are not priced on days the New York Stock Exchange is closed for trading. The offering and
redemption price per share for the Fund is equal to the Fund’s NAV per share.
|
|
i).
|
REIT Equity Securities – Distributions received from real estate investment trusts (“REITs”) may be classified as dividends, capital gains, or return of capital. Investments in REITs may require the Fund
to accrue and distribute income not yet received. To generate sufficient cash to make any required distributions, the Fund may be required to sell securities in its portfolio (including when it is not advantageous to do so) that
it otherwise would have continued to hold. At other times, investments in a REIT may result in the Fund’s receipt of cash in excess of the REIT’s earnings. If the Fund distributes these amounts, these distributions could
constitute a return of capital to Fund shareholders for U.S. federal income tax
|
|
HENNESSY FUNDS
|
1-800-966-4354
|
27
|
purposes. Dividends received by the Fund from a REIT generally do not constitute qualified dividend income and do not qualify for the dividends-received deduction.
|
|
|
j).
|
Illiquid Securities – Pursuant to Rule 22e-4 under the 1940 Act, the Fund has adopted a Liquidity Risk Management Program (the “Liquidity Program”). The Liquidity Program requires, among other things,
that the Fund limit its illiquid investments to no more than 15% of its net assets. An illiquid investment is any investment that the Fund reasonably expects cannot be sold or disposed of by the Fund in current market conditions
in seven calendar days or less without the sale or disposition significantly changing the market value of the investment.
|
|
k).
|
Recent Accounting Pronouncements and Regulatory Updates – In October 2022, the Securities and Exchange Commission (“SEC”) adopted a final rule relating to Tailored Shareholder Reports for Mutual Funds
and Exchange-Traded Funds (ETFs); Fee Information in Investment Company Advertisements. The rule and form amendments will require mutual funds and ETFs to transmit concise and visually engaging shareholder reports that highlight
key information. The amendments also will require that funds tag information in a structured data format. In addition, the rule amendments will require that certain more in-depth information be made available online and available
for delivery free of charge to investors on request. The amendments became effective January 24, 2023. There is an 18-month transition period after the effective date of the amendment.
|
|
In June 2022, the FASB issued Accounting Standards Update (“ASU”) 2022-03, Fair Value Measurement (Topic 820): Fair Value Measurement of Equity Securities Subject to Contractual
Sale Restrictions. The ASU clarifies that a contractual restriction on the sale of an equity security is not considered part of the unit of account of the equity security and, therefore, is not considered in measuring the fair
value. The amendments also require additional disclosures related to equity securities subject to contractual sale restrictions. The ASU is effective for fiscal years beginning after December 15, 2023, and interim periods within
those fiscal years.
|
3). SECURITIES VALUATION
The Fund follows its valuation policies and procedures in determining its NAV and, in preparing these financial statements, the fair value accounting standards that establish an authoritative definition of fair
value and set out a hierarchy for measuring fair value. These standards require additional disclosures about the various inputs and valuation techniques used to develop the measurements of fair value and a discussion of changes in
valuation techniques and related inputs during the period. These inputs are summarized in the three broad levels listed below:
|
Level 1 –
|
Unadjusted, quoted prices in active markets for identical instruments that the Fund has the ability to access at the date of measurement.
|
|
|
Level 2 –
|
Other significant observable inputs other than quoted prices included in Level 1 (including, but not limited to, quoted prices in active markets for similar instruments, quoted prices in markets that are
not active for identical or similar instruments, and model-derived valuations in which all significant inputs and significant value drivers are observable in active markets, such as interest rates, prepayment speeds, credit risk
curves, default rates, and similar data).
|
|
|
Level 3 –
|
Significant unobservable inputs (including the Fund’s own assumptions about what market participants would use to price the asset or liability based on the best available information) when observable
inputs are unavailable.
|
|
WWW.HENNESSYFUNDS.COM
|
28
|
NOTES TO THE FINANCIAL STATEMENTS
|
The following is a description of the valuation techniques applied to the Fund’s major categories of assets and liabilities on a recurring basis:
|
Equity Securities – Equity securities, including common stocks, preferred stocks, foreign-issued common stocks, exchange-traded funds, closed-end mutual funds,
partnerships, rights, and real estate investment trusts, that are traded on a securities exchange for which a last-quoted sales price is readily available generally are valued at the last sales price as reported by the primary
exchange on which the securities are listed. Securities listed on The Nasdaq Stock Market (“Nasdaq”) generally are valued at the Nasdaq Official Closing Price, which may differ from the last sales price reported. Securities traded
on a securities exchange for which a last-quoted sales price is not readily available generally are valued at the mean between the bid and ask prices. To the extent these securities are actively traded and valuation adjustments
are not applied, they are classified in Level 1 of the fair value hierarchy. Securities traded on foreign exchanges generally are not valued at the same time the Fund calculates its NAV because most foreign markets close well
before such time. The earlier close of most foreign markets gives rise to the possibility that significant events, including broad market moves, may have occurred in the interim. In certain circumstances, it may be determined that
a foreign security needs to be fair valued because it appears that the value of the security might have been materially affected by events occurring after the close of the market in which the security is principally traded, but
before the time the Fund calculates its NAV, such as by a development that affects an entire market or region (e.g., a weather-related event) or a potentially global development (e.g., a terrorist attack that may be expected to
have an effect on investor expectations worldwide).
|
|
|
Registered Investment Companies – Investments in open-end registered investment companies, commonly referred to as mutual funds, generally are priced at the
ending NAV provided by the applicable mutual fund’s service agent and are classified in Level 1 of the fair value hierarchy.
|
|
|
Debt Securities – Debt securities, including corporate bonds, asset-backed securities, mortgage-backed securities, municipal bonds, U.S. Treasuries, and U.S.
government agency issues, are generally valued at market on the basis of valuations furnished by an independent pricing service that utilizes both dealer-supplied valuations and formula-based techniques. The pricing service may
consider recently executed transactions in securities of the issuer or comparable issuers, market price quotations (where observable), bond spreads, and fundamental data relating to the issuer. In addition, the model may
incorporate observable market data, such as reported sales of similar securities, broker quotes, yields, bids, offers, and reference data. Certain securities are valued primarily using dealer quotations. These securities are
generally classified in Level 2 of the fair value hierarchy.
|
|
|
Short-Term Securities – Short-term equity investments, including money market funds, are valued in the manner specified above for equity securities. Short-term
debt investments with an original term to maturity of 60 days or less are valued at amortized cost, which approximates fair market value. If the original term to maturity of a short-term debt investment exceeds 60 days, then the
values as of the 61st day prior to maturity are amortized. Amortized cost is not used if its use would be inappropriate due to credit or other impairments of the issuer, in which case the security’s fair value would be determined
as described below. Short-term securities are generally classified in Level 1 or Level 2 of the fair value hierarchy depending on the inputs used and market activity levels for specific securities.
|
|
HENNESSY FUNDS
|
1-800-966-4354
|
29
If market quotations are not readily available or if a significant event has occurred that indicates the closing price of a security no longer represents the true value of that security, any
security or other asset will be valued at its fair value in accordance with Rule 2a-5 under the 1940 Act. The Board of Trustees of the Fund (the “Board”) has designated Hennessy Advisors, Inc. (the “Advisor”) as the Fund’s valuation
designee to make all fair value determinations with respect to the Fund’s portfolio investments under the Fund’s fair value pricing procedures, subject to the Board’s oversight. There are numerous criteria considered in determining a fair
value of a security, such as the trading volume of a security and markets, the values of other similar securities, and news events with direct bearing on a security or markets. Fair value pricing results in an estimated price for a
security that reflects the amount the Fund might reasonably expect to receive in a current sale. Depending on the relative significance of the valuation inputs, these securities may be classified in either Level 2 or Level 3 of the fair
value hierarchy. The Advisor will regularly evaluate whether the Fund’s fair value pricing procedures continue to be appropriate in light of the specific circumstances of the Fund and the quality of prices obtained through their
application of such procedures.
The fair value of foreign securities may be determined with the assistance of a pricing service using correlations between the movement of prices of such securities and indices of domestic
securities and other appropriate indicators, such as closing market prices of relevant American Depositary Receipts or futures contracts. Using fair value pricing means that the Fund’s NAV reflects the affected portfolio securities’
values as determined by the Advisor, the Board’s valuation designee, pursuant to the Fund’s fair value pricing procedures, instead of being determined by the market. Using a fair value pricing methodology to price a foreign security may
result in a value that is different from such foreign security’s most recent closing price and from the value used by other investment companies to calculate their NAVs. Such securities are generally classified in Level 2 of the fair
value hierarchy. Because the Fund may invest in foreign securities, the value of the Fund’s portfolio securities may change on days when a shareholder is unable to purchase or redeem Fund shares.
The Fund has performed an analysis of all existing investments to determine the significance and character of all inputs to their fair value determinations. Various inputs are used to
determine the value of the Fund’s investments. The inputs or methodology used for valuing securities are not necessarily an indication of the risk associated with investing in those securities. Details related to the fair value hierarchy
of the Fund’s securities as of October 31, 2023, are included in the Schedule of Investments.
4). INVESTMENT TRANSACTIONS
Purchases and sales of investment securities (excluding government and short-term investments) for the Fund during fiscal year 2023 were $6,911,642 and $27,217,352, respectively.
Purchases and sales/maturities of long-term U.S. government securities for the Fund during fiscal year 2023 were $1,887,025 and $2,025,713 respectively.
5). INVESTMENT ADVISORY FEE AND OTHER TRANSACTIONS WITH AFFILIATES
The Advisor provides the Fund with investment advisory services under an Investment Advisory Agreement. The Advisor oversees the provision of investment advice and furnishes office space, facilities, and most of
the personnel needed by the Fund. As compensation for its services, the Advisor is entitled to a monthly fee from the Fund. The fee is based on the average daily net assets of the Fund at an annual rate of 0.80%. The net investment
advisory fees expensed by the Fund during fiscal year 2023 are included in the Statement of Operations.
|
WWW.HENNESSYFUNDS.COM
|
30
|
NOTES TO THE FINANCIAL STATEMENTS
|
The Advisor has delegated the day-to-day management of the equity allocation of the Fund to a sub-advisor, The London Company of Virginia, LLC, and has delegated the day-to-day management of
the fixed income allocation of the Fund to a sub-advisor, FCI Advisors. The Advisor pays the sub-advisory fees from its own assets, and these fees are not an additional expense of the Fund. During fiscal year 2023, the Advisor (not the
Fund) paid a sub-advisory fee at the rate of 0.33% of the daily net assets of the equity allocation of the Fund and 0.27% of the daily net assets of the fixed income allocation of the Fund.
The Board has approved a Shareholder Servicing Agreement for Investor Class shares of the Fund, which compensates the Advisor for the non-investment advisory services it provides to the Fund.
The Shareholder Servicing Agreement provides for a monthly fee paid to the Advisor at an annual rate of 0.10% of the average daily net assets of the Fund attributable to Investor Class shares. The shareholder service fees expensed by the
Fund during fiscal year 2023 are included in the Statement of Operations.
The Fund has adopted a plan pursuant to Rule 12b-1 under the Investment Company Act of 1940, as amended, that authorizes payments in connection with the distribution of Fund shares at an
annual rate of up to 0.25% of the Fund’s average daily net assets attributable to Investor Class shares. Even though the authorized rate is up to 0.25%, the Fund is currently only using up to 0.15% of its average daily net assets
attributable to Investor Class shares for such purpose. Amounts paid under the plan may be spent on any activities or expenses primarily intended to result in the sale of shares, including, but not limited to, advertising, shareholder
account servicing, printing and mailing of prospectuses to other than current shareholders, printing and mailing of sales literature, and compensation for sales and marketing activities or to financial institutions and others, such as
dealers and distributors. The distribution fees expensed by the Fund during fiscal year 2023 are included in the Statement of Operations.
The Fund has entered into agreements with various brokers, dealers, and financial intermediaries in connection with the sale of Fund shares. The agreements provide for periodic payments of
sub-transfer agent expenses by the Fund to the brokers, dealers, and financial intermediaries for providing certain shareholder maintenance services. These shareholder services include the pre-processing and quality control of new
accounts, shareholder correspondence, answering customer inquiries regarding account status, and facilitating shareholder telephone transactions. The sub-transfer agent fees expensed by the Fund during fiscal year 2023 are included in the
Statement of Operations.
U.S. Bancorp Fund Services, LLC, d/b/a U.S. Bank Global Fund Services (“Fund Services”) provides the Fund with administrative, accounting, and transfer agent services. As administrator, Fund
Services is responsible for activities such as (i) preparing various federal and state regulatory filings, reports, and returns for the Fund, (ii) preparing reports and materials to be supplied to the Board, (iii) monitoring the
activities of the Fund’s custodian, transfer agent, and accountants, and (iv) coordinating the preparation and payment of the Fund’s expenses and reviewing the Fund’s expense accruals. U.S. Bank N.A., an affiliate of Fund Services, serves
as the Fund’s custodian. The servicing agreements between the Trust, Fund Services, and U.S. Bank N.A. contain a fee schedule that is inclusive of administrative, accounting, custody, and transfer agent fees. The administrative,
accounting, custody, and transfer agent fees expensed by the Fund during fiscal year 2023 are included in the Statement of Operations.
Quasar Distributors, LLC, a wholly owned broker-dealer subsidiary of Foreside Financial Group, LLC, acts as the Fund’s principal underwriter in a continuous public offering of Fund shares.
|
HENNESSY FUNDS
|
1-800-966-4354
|
31
The officers of the Fund are affiliated with the Advisor. With the exception of the Chief Compliance Officer, such officers receive no compensation from the Fund for serving in their
respective roles. The Fund, along with the other funds in the Hennessy Funds family (collectively, the “Hennessy Funds”), makes reimbursement payments on an equal basis to the Advisor for a portion of the salary and benefits associated
with the office of the Chief Compliance Officer. The compliance fees expensed by the Fund during fiscal year 2023 for reimbursement payments to the Advisor are included in the Statement of Operations.
6). GUARANTEES AND INDEMNIFICATIONS
Under the Hennessy Funds’ organizational documents, their officers and trustees are indemnified by the Hennessy Funds against certain liabilities arising out of the performance of their duties to the Hennessy
Funds. Additionally, in the normal course of business, the Hennessy Funds enter into contracts with service providers that contain general indemnification clauses. The Fund’s maximum exposure under these arrangements is unknown as this
would involve future claims that may be made against the Fund that have not yet occurred. Currently, the Fund expects the risk of loss to be remote.
7). LINE OF CREDIT
The Fund has an uncommitted line of credit with the other Hennessy Funds in the amount of the lesser of (i) $100,000,000 or (ii) 33.33% of each Hennessy Fund’s net assets, or 30% for the Hennessy Gas Utility
Fund, the Hennessy Japan Fund, and the Hennessy Japan Small Cap Fund and 10% for the Hennessy Balanced Fund. The line of credit is intended to provide any necessary short-term financing in connection with shareholder redemptions, subject
to certain restrictions. The credit facility is with the Hennessy Funds’ custodian bank, U.S. Bank N.A. Borrowings under this arrangement bear interest at the bank’s prime rate and are secured by all of the Fund’s assets (as to its own
borrowings only). During fiscal year 2023, the Fund had an outstanding average daily balance and a weighted average interest rate of $1,222 and 7.80%, respectively. The interest expensed by the Fund during fiscal year 2023 is included in
the Statement of Operations. The maximum amount outstanding for the Fund during fiscal year 2023 was $110,000. As of October 31, 2023, the Fund did not have any borrowings outstanding under the line of credit.
8). FEDERAL TAX INFORMATION
As of October 31, 2023, the components of accumulated earnings (losses) for income tax purposes were as follows:
|
Investments
|
|||||
|
Cost of investments for tax purposes
|
$
|
55,103,252
|
|||
|
Gross tax unrealized appreciation
|
$
|
18,175,094
|
|||
|
Gross tax unrealized depreciation
|
(4,253,750
|
)
|
|||
|
Net tax unrealized appreciation/(depreciation)
|
$
|
13,921,344
|
|||
|
Undistributed ordinary income
|
$
|
14,821
|
|||
|
Undistributed long-term capital gains
|
5,672,143
|
||||
|
Total distributable earnings
|
$
|
5,686,964
|
|||
|
Other accumulated gain/(loss)
|
$
|
—
|
|||
|
Total accumulated gain/(loss)
|
$
|
19,608,308
|
|||
The difference between book-basis unrealized appreciation/depreciation and tax-basis unrealized appreciation/depreciation (as shown above) is attributable primarily to wash sales.
|
WWW.HENNESSYFUNDS.COM
|
32
|
NOTES TO THE FINANCIAL STATEMENTS
|
As of October 31, 2023, the Fund had no tax-basis capital losses to offset future capital gains.
As of October 31, 2023, the Fund did not defer, on a tax basis, any late-year ordinary losses. Late-year ordinary losses are net ordinary losses incurred after December 31, 2022, but within
the taxable year, that are deemed to arise on the first day of the Fund’s next taxable year.
During fiscal years 2023 and 2022, the tax character of distributions paid by the Fund was as follows:
|
Year Ended
|
Year Ended
|
||||||||
|
October 31, 2023
|
October 31, 2022
|
||||||||
|
Ordinary income(1)
|
$
|
743,879
|
$
|
779,687
|
|||||
|
Long-term capital gains
|
2,298,711
|
7,598,487
|
|||||||
|
Total distributions
|
$
|
3,042,590
|
$
|
8,378,174
|
|||||
|
(1) Ordinary income includes short-term capital gains.
|
|||||||||
9). GLOBAL EVENTS
A rise in protectionist trade policies, the possibility of a national or global recession, risks associated with pandemic and epidemic diseases, trade tensions, the possibility of changes to some international
trade agreements, political events, and continuing political tension and armed conflicts may adversely impact financial markets and the broader economy. For example, ongoing armed conflicts between Ukraine and Russia in Europe and among
Israel, Hamas, and other militant groups in the Middle East have caused and could continue to cause significant market disruptions and volatility with the markets in Europe and the Middle East, and have had negative impacts on markets in
the United States. These events could also have negative effects on the Fund’s investments that cannot be foreseen at the present time. As global systems, economies and financial markets are increasingly interconnected, events that once
had only local impact are now more likely to have regional or even global effects. Events that occur in one country, region or financial market will, more frequently, adversely impact issuers in other countries, regions, or markets. These
impacts can be exacerbated by failures of governments and societies to adequately respond to an emerging event or threat. Your investment would be negatively impacted if the value of your portfolio holdings decreases as a result of such
events, if these events adversely impact the operations and effectiveness of the Advisor or other key service providers or if these events disrupt systems and processes necessary or beneficial to the management of accounts. These events
may negatively impact broad segments of businesses and populations and could have a significant and rapid negative impact on the performance of the Fund’s investments, increase the Fund’s volatility, or exacerbate pre-existing risks to
the Fund.
10). EVENTS SUBSEQUENT TO YEAR END
Management has evaluated the Fund’s related events and transactions that occurred subsequent to October 31, 2023, through the date of issuance of the Fund’s financial statements. Other than as disclosed below,
management has determined that there were no subsequent events requiring recognition or disclosure in the financial statements.
On December 7, 2023, capital gains were declared and paid to shareholders of record on December 6, 2023, as follows:
|
Long-term
|
|||
|
Investor Class
|
1.21186
|
||
|
Institutional Class
|
1.13754
|
|
HENNESSY FUNDS
|
1-800-966-4354
|
33
(This Page Intentionally Left Blank.)
|
WWW.HENNESSYFUNDS.COM
|
34
|
REPORT OF INDEPENDENT REGISTERED PUBLIC ACCOUNTING FIRM
|
Report of Independent Registered Public
Accounting Firm
To the Board of Trustees of Hennessy Funds Trust
and the shareholders of the Hennessy Equity and Income Fund
Novato, CA
Opinion on the Financial Statements
We have audited the accompanying statement of assets and liabilities of the Hennessy Equity and Income Fund (the “Fund”), a series of Hennessy Funds Trust, including the schedule of investments, as of October
31, 2023, the related statement of operations for the year then ended, the statements of changes in net assets for each of the two years in the period then ended, financial highlights for each of the five years in the period then ended,
and the related notes (collectively referred to as the “financial statements”). In our opinion, the financial statements present fairly, in all material respects, the financial position of the Fund as of October 31, 2023, the results of
its operations for the year then ended, the changes in its net assets for each of the two years in the period then ended, and the financial highlights for each of the five years in the period then ended, in conformity with accounting
principles generally accepted in the United States of America.
Basis for Opinion
These financial statements are the responsibility of the Fund’s management. Our responsibility is to express an opinion on the Fund’s financial statements based on our audits. We are a public accounting firm
registered with the Public Company Accounting Oversight Board (United States) (“PCAOB”) and are required to be independent with respect to the Fund in accordance with the U.S. federal securities laws and the applicable rules and
regulations of the Securities and Exchange Commission and the PCAOB. We have served as the auditor of one or more of the funds in the Trust since 2002.
We conducted our audits in accordance with the standards of the PCAOB. Those standards require that we plan and perform the audit to obtain reasonable assurance about whether the financial statements are free of
material misstatement, whether due to error or fraud. The Fund is not required to have, nor were we engaged to perform, an audit of its internal control over financial reporting. As part of our audits we are required to obtain an
understanding of internal control over financial reporting, but not for the purpose of expressing an opinion on the effectiveness of the Fund’s internal control over financial reporting. Accordingly, we express no such opinion.
Our audits included performing procedures to assess the risks of material misstatement of the financial statements, whether due to error or fraud, and performing procedures that respond to those risks. Such
procedures included examining, on a test basis, evidence regarding the amounts and disclosures in the financial statements. Our audits also included evaluating the accounting principles used and significant estimates made by management,
as well as evaluating the overall presentation of the financial statements. Our procedures included confirmation of securities owned as of October 31, 2023 by correspondence with the custodian. We believe that our audits provide a
reasonable basis for our opinion.
|
|
|
TAIT, WELLER & BAKER LLP
|
Philadelphia, Pennsylvania
December 22, 2023
|
HENNESSY FUNDS
|
1-800-966-4354
|
35
Trustees and Officers of the Fund (Unaudited)
The business and affairs of the Funds are managed under the direction of the Board of Trustees of the Trust, and the Board of Trustees elects the officers of the Trust (“Officers”). From time to time, the Board
of Trustees also has appointed advisers to the Board of Trustees (“Advisers”) with the intention of having qualified individuals serve in an advisory capacity to garner experience in the mutual fund and asset management industry and be
considered as potential Trustees in the future. There are currently two Advisers, Brian Alexander and A.J. Hennessy. As Advisers, Mr. Alexander and Mr. A.J. Hennessy attend meetings of the Board of Trustees and act as non-voting
participants. Information pertaining to the Trustees, Advisers, and the Officers of the Trust is set forth below. The Trustees and Officers serve until their successors are duly elected and qualified or until their earlier death,
resignation, or removal. Each Trustee oversees all 17 Hennessy Funds. Unless otherwise indicated, the address of all persons listed below is 7250 Redwood Boulevard, Suite 200, Novato, CA 94945. The Fund’s Statement of Additional
Information includes more information about the persons listed below and is available without charge by calling 800-966-4354 or by visiting www.hennessyfunds.com.
|
Other
|
|||
|
Directorships
|
|||
|
Held Outside
|
|||
|
Name, Age,
|
of Fund
|
||
|
and Position Held
|
Start Date
|
Principal Occupation(s)
|
Complex During
|
|
with the Trust
|
of Service
|
During Past Five Years
|
Past Five Years
|
|
Disinterested Trustees(1) and Disinterested Advisers
|
|||
|
J. Dennis DeSousa
|
January 1996
|
Mr. DeSousa is a real estate investor.
|
None.
|
|
87
|
|||
|
Trustee
|
|||
|
Robert T. Doyle
|
January 1996
|
Mr. Doyle is retired. He served as the
|
None.
|
|
76
|
Sheriff of Marin County, California
|
||
|
Trustee
|
from 1996 to June 2022.
|
||
|
Doug Franklin
|
March 2016
|
Mr. Franklin is a retired insurance
|
None.
|
|
59
|
as an Adviser
|
industry executive. From 1987
|
|
|
Trustee
|
to the Board
|
through 2015, he was employed by
|
|
|
and June 2023
|
the Allianz-Fireman’s Fund Insurance
|
||
|
as a Trustee
|
Company in various positions,
|
||
|
including as its Chief Actuary and
|
|||
|
Chief Risk Officer.
|
|||
|
Claire Garvie
|
December 2015
|
Ms. Garvie is a founder of Kiosk and
|
None.
|
|
49
|
as an Adviser
|
has served as its Chief Operating
|
|
|
Trustee
|
to the Board and
|
Officer since 2004. Kiosk is a
|
|
|
December 2021
|
full-service marketing agency with
|
||
|
as a Trustee
|
offices in the San Francisco Bay Area
|
||
|
and Liverpool, UK and staff across
|
|||
|
nine states in the U.S.
|
|||
|
WWW.HENNESSYFUNDS.COM
|
36
|
TRUSTEES AND OFFICERS OF THE FUND
|
|
Other
|
|||
|
Directorships
|
|||
|
Held Outside
|
|||
|
Name, Age,
|
of Fund
|
||
|
and Position Held
|
Start Date
|
Principal Occupation(s)
|
Complex During
|
|
with the Trust
|
of Service
|
During Past Five Years
|
Past Five Years
|
|
Gerald P. Richardson
|
May 2004
|
Mr. Richardson is an independent
|
None.
|
|
78
|
consultant in the securities industry.
|
||
|
Trustee
|
|||
|
Brian Alexander
|
March 2015
|
Mr. Alexander has served as the
|
None.
|
|
42
|
Chief Operating Officer of Solis
|
||
|
Adviser to the Board
|
Mammography since March 2023.
|
||
|
Prior to that, he worked for the
|
|||
|
Sutter Health organization from
|
|||
|
2011 to 2023 in various positions.
|
|||
|
He served as the Chief Executive
|
|||
|
Officer of the North Valley Hospital
|
|||
|
Area from 2021 to March 2023.
|
|||
|
From 2018 to 2021, he served as the
|
|||
|
Chief Executive Officer of Sutter
|
|||
|
Roseville Medical Center. From 2016
|
|||
|
through 2018, he served as the Vice
|
|||
|
President of Strategy for the Sutter
|
|||
|
Health Valley Area, which includes
|
|||
|
11 hospitals, 13 ambulatory surgery
|
|||
|
centers, 16,000 employees, and
|
|||
|
1,900 physicians.
|
|||
|
Interested Trustee and Interested Adviser(2)
|
|||
|
Neil J. Hennessy
|
January 1996 as
|
Mr. Neil Hennessy has been employed
|
Hennessy
|
|
67
|
a Trustee and
|
by Hennessy Advisors, Inc. since
|
Advisors, Inc.
|
|
Chairman of the Board,
|
June 2008 as
|
1989 and currently serves as its
|
|
|
Chief Market Strategist,
|
an Officer
|
Chairman and Chief Executive Officer.
|
|
|
Portfolio Manager,
|
|||
|
and President
|
|||
|
A.J. Hennessy
|
December 2022
|
Mr. A.J. Hennessy has been employed
|
None.
|
|
37
|
by Hennessy Advisors, Inc. since 2011.
|
||
|
Adviser to the Board
|
|||
|
and Vice President,
|
|||
|
Corporate Development
|
|||
|
and Operations
|
|||
|
HENNESSY FUNDS
|
1-800-966-4354
|
37
|
Name, Age,
|
||
|
and Position Held
|
Start Date
|
Principal Occupation(s)
|
|
with the Trust
|
of Service
|
During Past Five Years
|
|
Officers
|
||
|
Teresa M. Nilsen
|
January 1996
|
Ms. Nilsen has been employed by Hennessy Advisors, Inc.
|
|
57
|
since 1989 and currently serves as its President, Chief
|
|
|
Executive Vice President
|
Operating Officer, and Secretary.
|
|
|
and Treasurer
|
||
|
Daniel B. Steadman
|
March 2000
|
Mr. Steadman has been employed by Hennessy Advisors, Inc.
|
|
67
|
since 2000 and currently serves as its Executive Vice President.
|
|
|
Executive Vice President
|
||
|
and Secretary
|
||
|
Brian Carlson
|
December 2013
|
Mr. Carlson has been employed by Hennessy Advisors, Inc.
|
|
51
|
since December 2013 and currently serves as its Chief
|
|
|
Senior Vice President
|
Compliance Officer and Senior Vice President.
|
|
|
and Head of Distribution
|
||
|
David Ellison(3)
|
October 2012
|
Mr. Ellison has been employed by Hennessy Advisors, Inc.
|
|
65
|
since October 2012. He has served as a Portfolio Manager of
|
|
|
Senior Vice President
|
the Hennessy Large Cap Financial Fund and the Hennessy
|
|
|
and Portfolio Manager
|
Small Cap Financial Fund since their inception. Mr. Ellison also
|
|
|
served as a Portfolio Manager of the Hennessy Technology
|
||
|
Fund from its inception until February 2017. Mr. Ellison served
|
||
|
as Director, CIO, and President of FBR Fund Advisers, Inc.
|
||
|
from December 1999 to October 2012.
|
||
|
Jennifer Emerson(4)
|
June 2013
|
Ms. Emerson has been employed by Hennessy Advisors, Inc.
|
|
46
|
as its General Counsel since June 2013.
|
|
|
Senior Vice President and
|
||
|
Chief Compliance Officer
|
||
|
Ryan Kelley(5)
|
March 2013
|
Mr. Kelley has been employed by Hennessy Advisors, Inc. since
|
|
51
|
October 2012. He has served as Chief Investment Officer of the
|
|
|
Senior Vice President,
|
Hennessy Funds since March 2021 and has served as a Portfolio
|
|
|
Chief Investment Officer,
|
Manager of the Hennessy Gas Utility Fund, the Hennessy Large
|
|
|
and Portfolio Manager
|
Cap Financial Fund, and the Hennessy Small Cap Financial Fund
|
|
|
since October 2014. Mr. Kelley served as Co-Portfolio Manager
|
||
|
of these same funds from March 2013 through September
|
||
|
2014 and as a Portfolio Analyst for the Hennessy Funds from
|
||
|
October 2012 through February 2013. He has also served as a
|
||
|
Portfolio Manager of the Hennessy Cornerstone Growth Fund,
|
||
|
the Hennessy Cornerstone Mid Cap 30 Fund, the Hennessy
|
||
|
Cornerstone Large Growth Fund, and the Hennessy
|
||
|
Cornerstone Value Fund since February 2017 and as a Portfolio
|
||
|
Manager of the Hennessy Total Return Fund, the Hennessy
|
||
|
Balanced Fund, and the Hennessy Technology Fund since May
|
||
|
2018. He previously served as Co-Portfolio Manager of the
|
||
|
Hennessy Technology Fund from February 2017 until May 2018.
|
||
|
Mr. Kelley served as Portfolio Manager of FBR Fund
|
||
|
Advisers, Inc. from January 2008 to October 2012.
|
|
WWW.HENNESSYFUNDS.COM
|
38
|
TRUSTEES AND OFFICERS OF THE FUND
|
|
Name, Age,
|
||
|
and Position Held
|
Start Date
|
Principal Occupation(s)
|
|
with the Trust
|
of Service
|
During Past Five Years
|
|
L. Joshua Wein(5)
|
September 2018
|
Mr. Wein has been employed by Hennessy Advisors, Inc. since
|
|
50
|
2018. He has served as Portfolio Manager of the Hennessy
|
|
|
Vice President and
|
Cornerstone Growth Fund, the Hennessy Cornerstone Mid Cap
|
|
|
Portfolio Manager
|
30 Fund, the Hennessy Cornerstone Large Growth Fund, the
|
|
|
Hennessy Cornerstone Value Fund, Hennessy Total Return Fund,
|
||
|
the Hennessy Balanced Fund, the Hennessy Gas Utility Fund,
|
||
|
and the Hennessy Technology Fund since February 2021, and
|
||
|
as the Co-Portfolio Manager of these Funds since February
|
||
|
2019. He served as a Senior Analyst of those same Funds from
|
||
|
September 2018 through February 2019. He also has served as
|
||
|
a Portfolio Manager of the Hennessy Energy Transition Fund
|
||
|
and the Hennessy Midstream Fund since January 2022.
|
||
|
Mr. Wein served as Director of Alternative Investments and
|
||
|
Co-Portfolio Manager at Sterling Capital Management
|
||
|
from 2008 to 2018.
|
_______________
|
(1)
|
The Funds have determined that Mr. DeSousa, Mr. Doyle, Mr. Franklin, Ms. Garvie, and Mr. Richardson are not interested persons, as defined in the 1940 Act, of the Investment Manager
or of any predecessor investment adviser for purposes of Section 15(f) of the 1940 Act.
|
|
(2)
|
Each of Neil J. Hennessy and A.J. Hennessy is considered an interested person, as defined in the 1940 Act, because he is an officer of the Trust.
|
|
(3)
|
The address of this officer is 101 Federal Street, Suite 1615B, Boston, MA 02110.
|
|
(4)
|
The address of this officer is 4800 Bee Caves Road, Suite 100, Austin, TX 78746.
|
|
(5)
|
The address of this officer is 1340 Environ Way, Chapel Hill, NC 27517.
|
|
HENNESSY FUNDS
|
1-800-966-4354
|
39
Expense Example (Unaudited)
October 31, 2023
As a shareholder of the Fund, you incur ongoing costs, including management fees, service fees, and other Fund expenses. This Example is intended to help you understand your ongoing costs (in dollars) of
investing in the Fund and to compare these costs with the ongoing costs of investing in other investment funds. The Example is based on an investment of $1,000 invested at the beginning of the period and held for the entire period from
May 1, 2023, through October 31, 2023.
Actual Expenses
In the table below, the first line under each of the “Investor Class” and “Institutional Class” headings provides information about actual account values and actual expenses for each share class. You may use
this information, together with the amount you invested, to estimate the expenses that you paid over the period. Simply divide your account value by $1,000 (for example, an $8,600 account value divided by $1,000 = 8.6), then multiply the
result by the number in the first line under the heading “Expenses Paid During Period” to estimate the expenses you paid on your account during this period. Although the Fund charges no sales loads or transaction fees, you will be
assessed fees for outgoing wire transfers, returned checks, and stop payment orders at prevailing rates charged by U.S. Bank Global Fund Services, the Fund’s transfer agent. If you request that a redemption be made by wire transfer, the
Fund’s transfer agent charges a $15 fee. IRAs are charged a $15 annual maintenance fee (up to $30 maximum per shareholder for shareholders with multiple IRAs). The examples below include, but are not limited to, management, shareholder
servicing, accounting, custody, and transfer agent fees. However, the examples below do not include portfolio trading commissions and related expenses.
Hypothetical Example for Comparison Purposes
In the table below, the second line under each of the “Investor Class” and “Institutional Class” headings provides information about hypothetical account values and hypothetical expenses based on the Fund’s
actual expense ratio for each share class and an assumed rate of return of 5% per year before expenses, which is not the Fund’s actual return for such share class. The hypothetical account values and expenses may not be used to estimate
the actual ending account balance or expenses you paid for the period. You may use this information to compare the ongoing costs of investing in the Fund and other funds. To do so, compare these 5% hypothetical examples with the 5%
hypothetical examples that appear in the shareholder reports of the other funds. Please note that the expenses shown in the table are meant to highlight your ongoing costs only. Therefore, the second lines under “Investor Class” and
“Institutional Class” are useful in comparing ongoing costs only and will not help you determine the relative total costs of owning different funds.
|
WWW.HENNESSYFUNDS.COM
|
40
|
EXPENSE EXAMPLE
|
|
Expenses Paid
|
|||
|
Beginning
|
Ending
|
During Period(1)
|
|
|
Account Value
|
Account Value
|
May 1, 2023 –
|
|
|
May 1, 2023
|
October 31, 2023
|
October 31, 2023
|
|
|
Investor Class
|
|||
|
Actual
|
$1,000.00
|
$ 971.30
|
$7.55
|
|
Hypothetical (5% return before expenses)
|
$1,000.00
|
$1,017.54
|
$7.73
|
|
Institutional Class
|
|||
|
Actual
|
$1,000.00
|
$ 973.60
|
$5.62
|
|
Hypothetical (5% return before expenses)
|
$1,000.00
|
$1,019.51
|
$5.75
|
|
(1)
|
Expenses are equal to the Fund’s annualized expense ratio of 1.52% for Investor Class shares or 1.13% for Institutional Class shares, as applicable, multiplied by the average account value over the
period, multiplied by 184/365 days (to reflect the half-year period).
|
|
HENNESSY FUNDS
|
1-800-966-4354
|
41
How to Obtain a Copy of the Fund’s Proxy
Voting Policy and Proxy Voting Records
A description of the policies and procedures the Fund uses to determine how to vote proxies relating to portfolio securities is available without charge (1) by calling 800-966-4354, (2) on the Hennessy Funds’
website at www.hennessyfunds.com/proxy-voting/voting-policy, or (3) on the U.S. Securities and Exchange Commission’s (the “SEC”) website at www.sec.gov. The Fund’s proxy voting record is available without charge on both the Hennessy
Funds’ website at www.hennessyfunds.com/proxy-voting/voting-record and the SEC’s website at www.sec.gov no later than August 31 for the prior 12 months ending June 30.
Availability of Quarterly Portfolio Schedule
The Fund files a complete schedule of portfolio holdings with the SEC for the first and third quarters of each fiscal year as an exhibit to its reports on Form N-PORT. The Fund’s Form N-PORT reports are
available on the SEC’s website at www.sec.gov or on request by calling 800-966-4354.
Federal Tax Distribution Information (Unaudited)
For fiscal year 2023, certain dividends paid by the Fund may be subject to a maximum tax rate of 23.8%, as provided for by the Jobs and Growth Tax Relief Reconciliation Act of 2003. The percentage of dividends
declared from ordinary income designated as qualified dividend income was 100.00%.
For corporate shareholders, the percent of ordinary income distributions that qualified for the corporate dividends received deduction for fiscal year 2023 was 100.00%.
The percentage of taxable ordinary income distributions that were designated as short-term capital gain distributions under Section 871(k)(2)(C) of the Internal Revenue Code of 1986, as
amended, for the Fund was 0.00%.
Important Notice Regarding Delivery
of Shareholder Documents
To help keep the Fund’s costs as low as possible, we generally deliver a single copy of shareholder reports, proxy statements, and prospectuses to shareholders who share an address and have the same last name.
This process does not apply to account statements. You may request an individual copy of a shareholder document at any time. If you would like to receive separate mailings of shareholder documents, please call U.S. Bank Global Fund
Services at 800-261-6950 or 414-765-4124, and individual delivery will begin within 30 days of your request. If your account is held through a financial institution or other intermediary, please contact such intermediary directly to
request individual delivery.
Electronic Delivery
As currently permitted by SEC regulations, the Fund’s shareholder reports are made available on a website, and unless you sign for eDelivery or elect to receive paper copies as detailed below, you will be
notified by mail each time a report is posted and provided with a website link to access the report.
To elect to receive paper copies of all future reports free of charge, please call U.S. Bank Global Fund Services at 800-261-6950 or 414-765-4124.
The Fund also offers shareholders the option to receive all notices, account statements, prospectuses, tax forms, and shareholder reports electronically. To sign up for eDelivery or change
your delivery preference, please visit www.hennessyfunds.com/account.
Shareholder reports transmitted after July 24, 2024, will comply with the new tailored shareholder reporting requirements, which require streamlined annual and semi-annual reports to
shareholders that highlight key information. These reports will be transmitted in paper unless a shareholder elects to receive reports electronically via eDelivery. To sign up for eDelivery, please visit
http://www.hennessyfunds.com/account.
Subscribe to receive our team’s unique market and sector insights delivered to your inbox
www.hennessyfunds.com/subscribe
Follow us on social media
| |
|
|
|
WWW.HENNESSYFUNDS.COM
|
42
|
PROXY VOTING — PRIVACY POLICY
|
Liquidity Risk Management Program
In accordance with Rule 22e-4 under the Investment Company Act of 1940, as amended (the “Liquidity Rule”), we have adopted and implemented a liquidity risk management program (the “Liquidity Program”). The
purpose of the Liquidity Program is to assess and manage the Fund’s liquidity risk, which is the risk that the Fund would not be able to meet requests to redeem Fund shares without significant dilution of the remaining shareholders’
interests in the Fund. The Board of Trustees of the Fund (the “Board”) designated a committee comprising representatives of Hennessy Advisors, Inc., the investment adviser to the Fund, as the administrator of the Liquidity Program (the
“Program Administrator”).
The Program Administrator provided a written report regarding the Liquidity Program to the Board in advance of its meeting on June 7, 2023. The report covered the period from June 1, 2022,
through May 31, 2023. The report addressed the operation of the Liquidity Program, assessed the adequacy and effectiveness of its implementation, and described any material changes to the Liquidity Program during the review period. The
Trust’s chief compliance officer presented the report to the Board at the meeting and provided additional information regarding the Liquidity Program. The Board reviewed the Liquidity Program and considered, among other items, the
following:
|
1.
|
The Program Administrator reviewed daily historical net redemption activity during the review period and during prior periods with higher-than-average redemption activity and concluded that the Fund has
historically been able to meet requests to redeem Fund shares without significant dilution to the Fund’s remaining shareholders, and the Program Administrator expects the Fund to be able to continue to do so in the future during
both normal and reasonably foreseeable stressed conditions.
|
|
|
2.
|
The Fund primarily holds assets that are highly liquid investments and is not required to establish a highly liquid investment minimum for the Fund or adopt policies and procedures for responding to a
highly liquid investment minimum shortfall.
|
|
|
3.
|
The Program Administrator did not make or recommend any material changes to the Liquidity Program during the review period.
|
|
|
4.
|
The Program Administrator concluded that the Liquidity Program was reasonably designed to assess and manage the Fund’s liquidity risk, complies with the requirements of the Liquidity Rule, and was
operating as intended during the review period.
|
Privacy Policy
We collect the following personal information about you:
|
1.
|
Information we receive from you in applications or other forms, correspondence, or conversations, including, but not limited to, your name, address, phone number, social security number, assets, income,
and date of birth;
|
|
|
2.
|
Information about your transactions with us, our affiliates, or others, including, but not limited to, your account number and balance, payments history, parties to transactions, cost basis information,
and other financial information; and
|
|
HENNESSY FUNDS
|
1-800-966-4354
|
43
|
3.
|
Other personal information we collect from various sources, even if you have not entered into a prior transaction with us, including the following:
|
|
•
|
Name, alias, address, unique personal identifier, online identifier, IP address, email address, telephone number, account name, and other similar identifiers;
|
||
|
•
|
Age and marital status;
|
||
|
•
|
Commercial information, including records of products purchased;
|
||
|
•
|
Browsing history, search history, and information on interaction with our website;
|
||
|
•
|
Geolocation data;
|
||
|
•
|
Employment and employment history, educational history, financial information, and purchasing and consuming histories or tendencies; and
|
||
|
•
|
Inferences drawn from the above-listed information to create a profile about your preferences, characteristics, predispositions, and behavior.
|
We collect this information directly from you, indirectly in the course of providing services to you, directly and indirectly from your activity on our website, from broker dealers, marketing
agencies, and other third parties that interact with us in connection with the services we perform and products we offer, and from anonymized and aggregated consumer information.
We use this information to fulfill the reason you provided the information to us, to provide you with other relevant products that you request from us, to provide you with information about
products that may interest you, to improve our website or present our website’s contents to you, and as otherwise described to you when collecting your personal information.
We do not disclose any personal information to unaffiliated third parties, except as permitted by law. We may disclose your personal information to our affiliates, vendors, and service
providers for a business purpose. For example, we are permitted by law to disclose all of the information we collect, as described above, to our transfer agent to process your transactions. When disclosing your personal information to
third parties, we enter into a contract with each third party describing the purpose of such disclosure and requiring that such personal information be kept confidential and not used for any purpose except to perform the services
contracted or respond to regulatory or law enforcement requests.
Furthermore, we restrict access to your personal information to those persons who require such information to provide products or services to you. As a result, we do not provide a means for
opting out of our limited sharing of your information. We maintain physical, electronic, and procedural safeguards that comply with federal standards to guard your personal information.
If you hold shares of the Funds through a financial intermediary, including, but not limited to, a broker-dealer, bank, or trust company, the privacy policy of your financial intermediary
governs how your personal information is shared with unaffiliated third parties.
If you live in a state such as California where the laws provide further privacy rights, we will not share information unless the law allows, and we will comply with the other state-specific
requirements.
|
WWW.HENNESSYFUNDS.COM
|
44
|
PRIVACY POLICY
|
Supplemental Privacy Notice for Residents of California
The California Consumer Privacy Act of 2018 (the “CCPA”) provides you, as a California resident, with certain additional rights relating to your personal information.
Under the CCPA, you have the right to request that we disclose to you the categories of personal information we have collected about you over the past 12 months, the categories of sources of
such information, our business purpose for collecting the information, the categories of third parties, if any, with whom we shared the information, and the specific information we have collected about you. You also have the right to
request that we delete any of your personal information, and, unless an exception applies, we will delete such information upon receiving and confirming your request. To make a request, call us at 1-800-966-4354, email us at
privacy@hennessyfunds.com, or go to www.hennessyfunds.com/contact. We will not discriminate against you for exercising your rights under the CCPA. Further, we will not collect additional categories of your personal information or use the
personal information we collected for materially different, unrelated, or incompatible purposes without providing you notice.
|
HENNESSY FUNDS
|
1-800-966-4354
|
45
For information, questions, or assistance, please call
The Hennessy Funds
800-966-4354 or 415-899-1555
INVESTMENT ADVISOR
Hennessy Advisors, Inc.
7250 Redwood Boulevard, Suite 200
Novato, California 94945
ADMINISTRATOR,
TRANSFER AGENT,
DIVIDEND PAYING AGENT, &
SHAREHOLDER SERVICING AGENT
U.S. Bancorp Fund Services, LLC
d/b/a U.S. Bank Global Fund Services
P.O. Box 701
Milwaukee, Wisconsin 53201-0701
CUSTODIAN
U.S. Bank N.A.
Custody Operations
1555 North River Center Drive, Suite 302
Milwaukee, Wisconsin 53212
TRUSTEES
Neil J. Hennessy
Robert T. Doyle
J. Dennis DeSousa
Doug Franklin
Claire Garvie
Gerald P. Richardson
COUNSEL
Foley & Lardner LLP
777 East Wisconsin Avenue
Milwaukee, Wisconsin 53202-5306
INDEPENDENT REGISTERED
PUBLIC ACCOUNTING FIRM
Tait, Weller & Baker LLP
Two Liberty Place
50 South 16th Street, Suite 2900
Philadelphia, Pennsylvania 19102-2529
DISTRIBUTOR
Quasar Distributors, LLC
111 East Kilbourn Avenue, Suite 1250
Milwaukee, Wisconsin 53202
www.hennessyfunds.com | 800-966-4354
This report has been prepared for shareholders and may be distributed to
others only if preceded or accompanied by a current prospectus.
ANNUAL REPORT
OCTOBER 31, 2023
HENNESSY BALANCED FUND
Investor Class HBFBX
www.hennessyfunds.com | 1-800-966-4354
(This Page Intentionally Left Blank.)
Contents
|
Letter to Shareholders
|
2
|
|
|
Performance Overview
|
6
|
|
|
Financial Statements
|
||
|
Schedule of Investments
|
8
|
|
|
Statement of Assets and Liabilities
|
11
|
|
|
Statement of Operations
|
12
|
|
|
Statements of Changes in Net Assets
|
13
|
|
|
Financial Highlights
|
14
|
|
|
Notes to the Financial Statements
|
16
|
|
|
Report of Independent Registered Public Accounting Firm
|
23
|
|
|
Trustees and Officers of the Fund
|
24
|
|
|
Expense Example
|
28
|
|
|
Proxy Voting Policy and Proxy Voting Records
|
29
|
|
|
Availability of Quarterly Portfolio Schedule
|
29
|
|
|
Federal Tax Distribution Information
|
29
|
|
|
Important Notice Regarding Delivery of Shareholder Documents
|
29
|
|
|
Electronic Delivery
|
29
|
|
|
Liquidity Risk Management Program
|
30
|
|
|
Privacy Policy
|
30
|
|
HENNESSY FUNDS
|
1-800-966-4354
|
November 2023
Dear Hennessy Funds Shareholder:
Market Myopia: Tough Beginnings & Fantastic Finishes
During an interview this summer, I was reminded how important it is to maintain a long-term view of the market and investing and how easy it is to focus on the very recent past. In mid-July, when the Nasdaq
Composite Index was soaring to new 2023 highs and large-cap tech was once again dominating both returns and news headlines, the interviewer seemed confused – and somewhat disappointed – when I mentioned that even with 2023’s stellar
performance, the Nasdaq was negative if you included the prior year (2022) and that during that same time, utilities had outperformed. As of the time of writing this letter, a similar story can be seen when considering eight technology
giants: Microsoft, Tesla, Facebook (Meta), Apple, Amazon, Netflix, Nvidia, and Google, or “MT. FAANNG” as a much easier to say
(and remember) acronym.(1) MT. FAANNG is up on average a whopping 89.69% in 2023 on a total return basis as of November 7, 2023. However, this same group
was down -46.71% in 2022, a dismal year for large-cap tech. Due to the unforgiving nature of percentages, from the end of 2021 until now, this group of highflyers, believe it or not, is still down -3.14% on average, despite an
incredible 2023.
I like to call this phenomenon “market myopia.” Investors tend to be optimists, as am I. This makes it so much more comforting to forget the “tough beginnings” when
you’d rather remember the “fantastic finishes.” In continuing with the example above, unless you were an investor with prescient foresight, you likely didn’t sell all your MT. FAANNG stocks on January 4, 2022, as the market started its
correction, and you probably didn’t then buy them all back on September 30, 2022, when the market hit its low. An average investor’s experience would be much different than that. Which brings me to the point of all this: what are some
elements of our investment philosophy here at Hennessy Funds?
First, what about timing the market? Simply put, we don’t do it. As Neil Hennessy, our Chief Market Strategist and long-tenured Portfolio Manager, aptly put it, “It’s
not about timing the market, but rather about time in the market.” The long-term annualized return of the market, as measured by the Dow Jones Industrial
Average going back 104 years to 1920, is about 9.6%, and that number would be closer to 7-8% on a real return basis when factoring in inflation. If an investor is poorly timing when to enter and when to exit the market, it would be very
difficult to achieve similar, attractive returns to what they would experience simply by staying invested through a complete market cycle.
We are optimistic investors. We understand that some years or months may be tougher than others, but we tend to think in longer timeframes. An investor solely invested
in the Nasdaq might have looked at their portfolio at the end of 2022 and been extremely disappointed with a -32.51% return. But as Josh Wein, one of our Portfolio Managers with over 25 years of experience, pointed out, “2022 was what
8% real returns look like.” In other words, with the year prior (2021) providing a +22.21% return and the year after (2023) hitting a +31.21% return, 2022’s dismal performance of -32.51% created an annualized total return for the Nasdaq
of 8.22% over the entire period (December 31, 2020, to November 7, 2023). Josh simply observed that while corrections happen over the course of a market cycle, it’s best not to panic by selling when stocks are hitting new lows.
_______________
|
(1)
|
The acronym, MT. FAANNG, refers to the following companies: Microsoft Corporation, Tesla, Inc., Meta Platforms, Inc., Amazon.com, Inc., Apple, Inc., Netflix, Inc., NVIDIA Corporation, and Alphabet,
Inc.
|
|
WWW.HENNESSYFUNDS.COM
|
2
|
LETTER TO SHAREHOLDERS
|
Downside risk mitigation is relevant. While we normally remain fully invested within our individual funds, we seek to reduce risk through other means, including sector
diversification and investing in companies that exhibit strong fundamentals at compelling valuations. Dave Ellison, the long-tenured Portfolio Manager of our two financial funds, consistently reminds us, “Losing less money in difficult
markets is more important than making the most in rising ones.”
Finally, we are investors in companies, not traders of stocks. Many of our portfolios hold certain positions for long periods of time, a demonstration of the Portfolio
Managers’ convictions. In fact, both the Hennessy Focus Fund and the Hennessy Large Cap Financial Fund have held some positions for 25 years or more. We recognize that much of the performance of the Hennessy Funds comes from the actual
stocks we own (stock selection) and not from our weightings within certain sectors (sector allocation). Moving in and out of sectors can enhance performance, but it can also hinder it in the same way as market timing, and it takes a
significant number of correct “calls” regarding the macro-environment. We’d rather invest long term than rely on lucky calls. Our highly experienced energy funds Portfolio Manager, Ben Cook, summed up our philosophy on the macro
environment nicely: “While macro-economic trends help to inform our investment process, ultimately it’s the individual stocks with solid fundamentals and attractive valuations that, over time, drive positive risk-adjusted returns for
our funds.”
We are long term investors, staying ever mindful of downside risk while striving to participate in the upside, with each individual fund having its own objective,
process, portfolio construction, and investment criteria.
The stock market has once again seen dramatic differences in stock performance. For our fiscal year ended October 31, 2023, all three broad-based indexes were positive,
although with a large dispersion of total returns, with the Dow Jones Industrial Average up 3.17%, the S&P 500® Index up 10.14%, and the Nasdaq
Composite Index up 17.99%. During our fiscal year, large caps significantly outperformed mid caps and small caps, and growth substantially outperformed value. Large-cap tech once again pushed the overall broader market higher, as
evidenced by the Nasdaq-100 Index posting a return of 27.45%. From a sector point of view, besides Technology, the only other sector with outsized (greater than 10%) returns was Communication Services, while six of the 11 GICS sectors
of the S&P 500® Index were negative.
Similar to the overall market, our funds experienced mixed results. Many of our funds exhibit more value-oriented characteristics and, given that value underperformed
growth this year by a significant amount, that negatively affected our relative performance. In addition, three of our funds are sector-specific funds that were invested in underperforming sectors, while six more are focused on small-
and mid-cap stocks in a time period when large caps substantially outperformed. Ten of our 16 mutual funds and our exchange-traded-fund (ETF) posted positive returns for the fiscal year ended October 31, 2023.
Several factors caused this disparity of returns in the market: interest rates and inflation being two of the most important. With the Federal Reserve pausing interest
rate hikes and inflation numbers subsiding, the market reacted positively once it became more apparent that we were not heading into a recession. Consumer demand also remained strong, and unemployment numbers remained historically low.
We believe that the outlook for U.S. stocks remains positive, primarily as we believe that the Federal Reserve may be done, or close to done, raising interest rates.
Inflation has shown signs of easing, creating a better environment for consumers as well as businesses. The unemployment rate remains near record lows, there are elevated levels of cash on the
|
HENNESSY FUNDS
|
1-800-966-4354
|
3
balance sheets of U.S. companies and in the pockets of many consumers and investors, and there is the prospect of a more dovish Federal Reserve heading into 2024. However, we are cautiously watching certain
parts of the economy for any hints of weakness, including consumer spending and credit issues. While volatility and uncertainty may impact the markets, we encourage investors to stay the course, maintain a diversified portfolio, and
keep a long-term perspective.
We thank you for your continued interest in our Funds and are grateful that you have chosen to invest with us. If you have any questions or would like to speak with us
directly, please call us at (800) 966-4354.
Best regards,
|
|
|
|
|
Ryan C. Kelley, CFA
|
|
|
Chief Investment Officer,
|
|
|
Senior Vice President, and Portfolio Manager
|
Past performance does not guarantee future results.
Mutual fund investing involves risk. Principal loss is possible.
Opinions expressed are those of Ryan C. Kelley and are subject to change, are not guaranteed, and should not be considered investment advice.
The Dow Jones Industrial Average and S&P 500® Index are commonly used to measure the performance of U.S. stocks. The Nasdaq
Composite Index comprises all common stocks listed on The Nasdaq Stock Market and is commonly used to measure the performance of technology-related stocks. The Nasdaq-100 Index includes 100 of the largest domestic and international
non-financial companies listed on The NASDAQ Stock Market based on market capitalization. The indices are used herein for comparative purposes in accordance with SEC regulations. One cannot invest directly in an index. All returns are
shown on a total return basis.
|
WWW.HENNESSYFUNDS.COM
|
4
|
LETTER TO SHAREHOLDERS
|
(This Page Intentionally Left Blank.)
|
HENNESSY FUNDS
|
1-800-966-4354
|
5
Performance Overview (Unaudited)
CHANGE IN VALUE OF $10,000 INVESTMENT
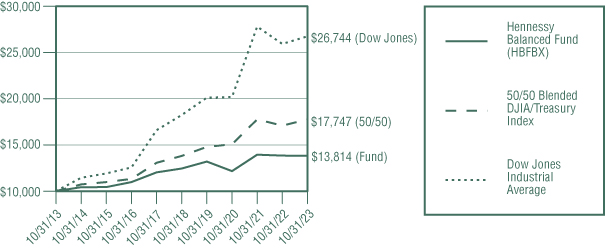
This graph illustrates the performance of an initial investment of $10,000 made in the Fund 10 years ago and assumes the reinvestment of dividends and capital gains.
AVERAGE ANNUAL TOTAL RETURN FOR PERIODS ENDED OCTOBER 31, 2023
|
One
|
Five
|
Ten
|
|
|
Year
|
Years
|
Years
|
|
|
Hennessy Balanced Fund (HBFBX)
|
-0.22%
|
2.11%
|
3.28%
|
|
50/50 Blended DJIA/Treasury Index
|
3.86%
|
5.15%
|
5.90%
|
|
Dow Jones Industrial Average
|
3.17%
|
7.96%
|
10.34%
|
Expense ratio: 1.80%
Performance data quoted represents past performance; past performance does not guarantee future results. The investment return and principal value of an investment will fluctuate so that an
investor’s shares, when redeemed, may be worth more or less than their original cost. The performance table does not reflect the deduction of taxes that a shareholder would pay on Fund distributions or the redemption of Fund shares.
Current performance of the Fund may be lower or higher than the performance quoted. Performance data current to the most recent month end may be obtained by visiting www.hennessyfunds.com.
The 50/50 Blended DJIA/Treasury Index consists of 50% common stocks represented by the Dow Jones Industrial Average and 50% short-duration Treasury securities represented by the ICE BofAML 1-Year U.S. Treasury
Note Index, which comprises U.S. Treasury securities maturing in approximately one year. The Dow Jones Industrial Average is a price-weighted average of 30 significant stocks traded on the New York Stock Exchange or The Nasdaq Stock
Market LLC. One cannot invest directly in an index. These indices are used for comparative purposes in accordance with Securities and Exchange Commission regulations.
The expense ratio presented is from the most recent prospectus. The expense ratio for the current reporting period is available in the Financial Highlights section of this report.
PERFORMANCE NARRATIVE
Portfolio Managers Neil J. Hennessy, Ryan C. Kelley, CFA, and L. Joshua Wein, CAIA
Performance:
For the one-year period ended October 31, 2023, the Hennessy Balanced Fund returned -0.22%, underperforming both the 50/50 Blended DJIA/Treasury Index (the Fund’s primary benchmark) and the Dow Jones
Industrial Average, which returned 3.86% and 3.17%, respectively, for the same period.
|
WWW.HENNESSYFUNDS.COM
|
6
|
PERFORMANCE OVERVIEW
|
The Fund underperformed its primary benchmark predominantly as a result of stock selection in the Consumer Staples, Industrials, and Energy sectors. The largest detractors from performance
within each of these sectors during the period were Walgreens Boots Alliance, Inc., 3M Company, and Chevron Corporation. The largest contributors to performance during the period were investments in the Information Technology,
Financials, and Materials sectors. The largest contributors to performance within these sectors were Intel Corporation, JPMorgan Chase & Co., and Dow, Inc.
The Fund continues to own all the companies mentioned.
Portfolio Strategy:
The Fund invests approximately 50% of its assets in the “Dogs of the Dow,” the 10 highest dividend-yielding Dow stocks, and 50% of its assets in U.S. Treasuries. As a result of this “blended” strategy, we
expect the Fund to outperform equities in periods when equity markets fall and underperform equities in periods when equity markets rise. The Fund is designed to allow its investors to gain exposure to the equity market while
maintaining a significant percentage of its investment in fixed income securities. We believe the Fund is well positioned for the more conservative investor because the equity portion of the portfolio is invested in what we deem to be
high-quality companies, each of which pay a quarterly dividend, while the balance of the Fund is invested in lower-risk, short-duration U.S. Treasuries.
Investment Commentary:
Notwithstanding a rebound in equity prices over the last twelve months, we believe that the outlook for U.S. stocks remains positive. We continue to believe that equities are attractive from a valuation
standpoint, even in the face of an expected slowdown in economic activity. While the Federal Reserve has raised interest rates several times throughout the last year, we believe that the prospect of slower economic growth and lower
inflation numbers could prompt the Federal Reserve to put any further rate hikes on hold. With the unemployment rate near record lows, high levels of cash on the balance sheets of U.S. companies, and the prospect of a more dovish
Federal Reserve in 2024, we remain bullish on equities long-term.
If the market experiences further weakness, we would expect our more defensive holdings to perform well relative to the market. The relatively short duration of the 50% weighting of U.S.
Treasuries in the portfolio (all less than one year) may allow us the ability to roll into higher-yielding Treasuries in the event interest rates continue to rise.
_______________
Opinions expressed are those of the Portfolio Managers as of the date written and are subject to change, are not guaranteed, and should not be considered investment advice or an indication of trading intent.
The Fund is non-diversified, meaning it may concentrate its assets in fewer individual holdings than a diversified fund, making it more exposed to individual stock volatility than a
diversified fund. The Fund’s formula-based strategy may cause the Fund to buy or sell securities at times when it may not be advantageous. Please see the Fund’s prospectus for a more complete discussion of these and other risks.
References to specific securities should not be considered a recommendation to buy or sell any security. Fund holdings and sector allocations are subject to change. Please refer to the Schedule of Investments
included in this report for additional portfolio information.
|
HENNESSY FUNDS
|
1-800-966-4354
|
7
Financial Statements
|
Schedule of Investments as of October 31, 2023
|
HENNESSY BALANCED FUND
(% of Net Assets)
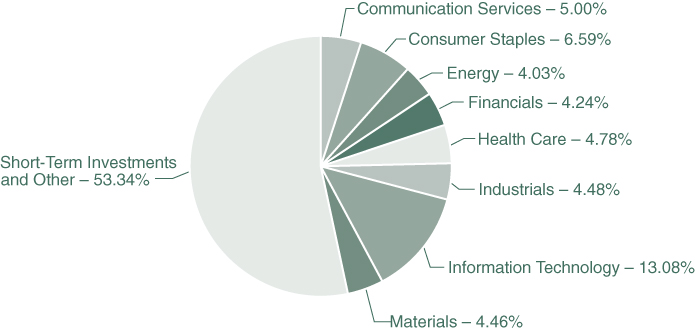
|
TOP TEN HOLDINGS (EXCLUDING MONEY MARKET FUNDS)
|
% NET ASSETS
|
|
U.S. Treasury Bill, 5.310%, 01/25/2024
|
20.08%
|
|
U.S. Treasury Bill, 5.325%, 11/30/2023
|
10.54%
|
|
U.S. Treasury Bill, 4.930%, 06/13/2024
|
9.45%
|
|
U.S. Treasury Bill, 4.645%, 05/16/2024
|
7.90%
|
|
International Business Machines Corp.
|
5.12%
|
|
Cisco Systems, Inc.
|
5.05%
|
|
Verizon Communications, Inc.
|
5.00%
|
|
Amgen, Inc.
|
4.78%
|
|
3M Co.
|
4.48%
|
|
Dow, Inc.
|
4.46%
|
Note: For presentation purposes, the Fund has grouped some of the industry categories. For purposes of categorizing securities for compliance with Section 8(b)(1) of the Investment Company Act of 1940, as
amended, the Fund uses more specific industry classifications.
The Global Industry Classification Standard (GICS®) was developed by and is the exclusive property and a service mark of MSCI,
Inc. and Standard & Poor’s Financial Services LLC. It has been licensed for use by the Hennessy Funds.
|
WWW.HENNESSYFUNDS.COM
|
8
|
SCHEDULE OF INVESTMENTS
|
|
COMMON STOCKS – 46.66%
|
Number
|
% of
|
||||||||||
|
|
of Shares
|
Value
|
Net Assets
|
|||||||||
|
Communication Services – 5.00%
|
||||||||||||
|
Verizon Communications, Inc.
|
17,500
|
$
|
614,775
|
5.00
|
%
|
|||||||
|
Consumer Staples – 6.59%
|
||||||||||||
|
The Coca-Cola Co.
|
6,100
|
344,589
|
2.81
|
%
|
||||||||
|
Walgreens Boots Alliance, Inc.
|
22,050
|
464,814
|
3.78
|
%
|
||||||||
|
|
809,403
|
6.59
|
%
|
|||||||||
|
Energy – 4.03%
|
||||||||||||
|
Chevron Corp.
|
3,400
|
495,482
|
4.03
|
%
|
||||||||
|
Financials – 4.24%
|
||||||||||||
|
JPMorgan Chase & Co.
|
1,350
|
187,731
|
1.53
|
%
|
||||||||
|
The Goldman Sachs Group, Inc.
|
1,100
|
333,971
|
2.71
|
%
|
||||||||
|
|
521,702
|
4.24
|
%
|
|||||||||
|
Health Care – 4.78%
|
||||||||||||
|
Amgen, Inc.
|
2,300
|
588,110
|
4.78
|
%
|
||||||||
|
Industrials – 4.48%
|
||||||||||||
|
3M Co.
|
6,050
|
550,248
|
4.48
|
%
|
||||||||
|
Information Technology – 13.08%
|
||||||||||||
|
Cisco Systems, Inc.
|
11,900
|
620,347
|
5.05
|
%
|
||||||||
|
Intel Corp.
|
9,800
|
357,700
|
2.91
|
%
|
||||||||
|
International Business Machines Corp.
|
4,350
|
629,184
|
5.12
|
%
|
||||||||
|
|
1,607,231
|
13.08
|
%
|
|||||||||
|
Materials – 4.46%
|
||||||||||||
|
Dow, Inc.
|
11,350
|
548,659
|
4.46
|
%
|
||||||||
|
|
||||||||||||
|
Total Common Stocks
|
||||||||||||
|
(Cost $6,026,118)
|
5,735,610
|
46.66
|
%
|
|||||||||
The accompanying notes are an integral part of these financial statements.
|
HENNESSY FUNDS
|
1-800-966-4354
|
9
|
SHORT-TERM INVESTMENTS – 53.52%
|
Number of Shares/
|
% of
|
||||||||||
|
|
Par Amount
|
Value
|
Net Assets
|
|||||||||
|
Money Market Funds – 5.55%
|
||||||||||||
|
First American Government Obligations Fund – Class X, 5.276% (a)
|
68,320
|
$
|
68,320
|
0.56
|
%
|
|||||||
|
First American Treasury Obligations Fund – Class X, 5.275% (a)
|
614,000
|
614,000
|
4.99
|
%
|
||||||||
|
|
682,320
|
5.55
|
%
|
|||||||||
|
U.S. Treasury Bills – 47.97%
|
||||||||||||
|
5.325%, 11/30/2023 (b)
|
1,300,000
|
1,295,329
|
10.54
|
%
|
||||||||
|
5.310%, 01/25/2024 (b)
|
2,500,000
|
2,468,670
|
20.08
|
%
|
||||||||
|
4.645%, 05/16/2024 (b)
|
1,000,000
|
971,297
|
7.90
|
%
|
||||||||
|
4.930%, 06/13/2024 (b)
|
1,200,000
|
1,161,169
|
9.45
|
%
|
||||||||
|
|
5,896,465
|
47.97
|
%
|
|||||||||
|
|
||||||||||||
|
Total Short-Term Investments
|
||||||||||||
|
(Cost $6,588,920)
|
6,578,785
|
53.52
|
%
|
|||||||||
|
|
||||||||||||
|
Total Investments
|
||||||||||||
|
(Cost $12,615,038) – 100.18%
|
12,314,395
|
100.18
|
%
|
|||||||||
|
Liabilities in Excess of Other Assets – (0.18)%
|
(22,646
|
)
|
(0.18
|
)%
|
||||||||
|
|
||||||||||||
|
TOTAL NET ASSETS – 100.00%
|
$
|
12,291,749
|
100.00
|
%
|
||||||||
Percentages are stated as a percent of net assets.
|
(a)
|
The rate listed is the fund’s seven-day yield as of October 31, 2023.
|
|
(b)
|
The rate listed is the discount rate at issue.
|
Summary of Fair Value Exposure as of October 31, 2023
The following is a summary of the inputs used to value the Fund’s net assets as of October 31, 2023 (see Note 3 in the accompanying Notes to the Financial Statements):
|
Common Stocks
|
Level 1
|
Level 2
|
Level 3
|
Total
|
||||||||||||
|
Communication Services
|
$
|
614,775
|
$
|
—
|
$
|
—
|
$
|
614,775
|
||||||||
|
Consumer Staples
|
809,403
|
—
|
—
|
809,403
|
||||||||||||
|
Energy
|
495,482
|
—
|
—
|
495,482
|
||||||||||||
|
Financials
|
521,702
|
—
|
—
|
521,702
|
||||||||||||
|
Health Care
|
588,110
|
—
|
—
|
588,110
|
||||||||||||
|
Industrials
|
550,248
|
—
|
—
|
550,248
|
||||||||||||
|
Information Technology
|
1,607,231
|
—
|
—
|
1,607,231
|
||||||||||||
|
Materials
|
548,659
|
—
|
—
|
548,659
|
||||||||||||
|
Total Common Stocks
|
$
|
5,735,610
|
$
|
—
|
$
|
—
|
$
|
5,735,610
|
||||||||
|
Short-Term Investments
|
||||||||||||||||
|
Money Market Funds
|
$
|
682,320
|
$
|
—
|
$
|
—
|
$
|
682,320
|
||||||||
|
U.S. Treasury Bills
|
—
|
5,896,465
|
—
|
5,896,465
|
||||||||||||
|
Total Short-Term Investments
|
$
|
682,320
|
$
|
5,896,465
|
$
|
—
|
$
|
6,578,785
|
||||||||
|
Total Investments
|
$
|
6,417,930
|
$
|
5,896,465
|
$
|
—
|
$
|
12,314,395
|
||||||||
The accompanying notes are an integral part of these financial statements.
|
WWW.HENNESSYFUNDS.COM
|
10
|
SCHEDULE OF INVESTMENTS/STATEMENT OF ASSETS AND LIABILITIES
|
Financial Statements
|
Statement of Assets and Liabilities as of October 31, 2023
|
|
ASSETS:
|
||||
|
Investments in securities, at value (cost $12,615,038)
|
$
|
12,314,395
|
||
|
Dividends and interest receivable
|
14,011
|
|||
|
Receivable for fund shares sold
|
33
|
|||
|
Prepaid expenses and other assets
|
8,045
|
|||
|
Total assets
|
12,336,484
|
|||
|
LIABILITIES:
|
||||
|
Payable to advisor
|
6,205
|
|||
|
Payable to administrator
|
4,061
|
|||
|
Payable to auditor
|
22,746
|
|||
|
Accrued distribution fees
|
1,654
|
|||
|
Accrued service fees
|
1,034
|
|||
|
Accrued trustees fees
|
5,422
|
|||
|
Accrued expenses and other payables
|
3,613
|
|||
|
Total liabilities
|
44,735
|
|||
|
NET ASSETS
|
$
|
12,291,749
|
||
|
NET ASSETS CONSIST OF:
|
||||
|
Capital stock
|
$
|
12,578,067
|
||
|
Accumulated deficit
|
(286,318
|
)
|
||
|
Total net assets
|
$
|
12,291,749
|
||
|
NET ASSETS:
|
||||
|
Investor Class
|
||||
|
Shares authorized (no par value)
|
Unlimited
|
|||
|
Net assets applicable to outstanding shares
|
$
|
12,291,749
|
||
|
Shares issued and outstanding
|
1,105,839
|
|||
|
Net asset value, offering price, and redemption price per share
|
$
|
11.12
|
||
The accompanying notes are an integral part of these financial statements.
|
HENNESSY FUNDS
|
1-800-966-4354
|
11
Financial Statements
|
Statement of Operations for the year ended October 31, 2023
|
|
INVESTMENT INCOME:
|
||||
|
Dividend income
|
$
|
266,928
|
||
|
Interest income
|
243,792
|
|||
|
Total investment income
|
510,720
|
|||
|
EXPENSES:
|
||||
|
Investment advisory fees (See Note 5)
|
74,697
|
|||
|
Administration, accounting, custody, and transfer agent fees (See Note 5)
|
23,939
|
|||
|
Audit fees
|
22,747
|
|||
|
Compliance expense (See Note 5)
|
22,676
|
|||
|
Trustees’ fees and expenses
|
19,763
|
|||
|
Distribution fees – Investor Class (See Note 5)
|
18,674
|
|||
|
Federal and state registration fees
|
18,171
|
|||
|
Service fees – Investor Class (See Note 5)
|
12,450
|
|||
|
Reports to shareholders
|
6,641
|
|||
|
Sub-transfer agent expenses – Investor Class (See Note 5)
|
3,331
|
|||
|
Legal fees
|
1,034
|
|||
|
Other expenses
|
4,637
|
|||
|
Total expenses
|
228,760
|
|||
|
NET INVESTMENT INCOME
|
$
|
281,960
|
||
|
REALIZED AND UNREALIZED GAINS (LOSSES):
|
||||
|
Net realized gain on investments
|
$
|
24,850
|
||
|
Net change in unrealized appreciation/depreciation on investments
|
(338,727
|
)
|
||
|
Net loss on investments
|
(313,877
|
)
|
||
|
NET DECREASE IN NET ASSETS RESULTING FROM OPERATIONS
|
$
|
(31,917
|
)
|
|
The accompanying notes are an integral part of these financial statements.
|
WWW.HENNESSYFUNDS.COM
|
12
|
STATEMENT OF OPERATIONS/STATEMENTS OF CHANGES IN NET ASSETS
|
Financial Statements
|
Statements of Changes in Net Assets
|
|
Year Ended
|
Year Ended
|
|||||||
|
October 31, 2023
|
October 31, 2022
|
|||||||
|
OPERATIONS:
|
||||||||
|
Net investment income
|
$
|
281,960
|
$
|
66,939
|
||||
|
Net realized gain on investments
|
24,850
|
492,822
|
||||||
|
Net change in unrealized
|
||||||||
|
appreciation/depreciation on investments
|
(338,727
|
)
|
(683,111
|
)
|
||||
|
Net decrease in net assets resulting from operations
|
(31,917
|
)
|
(123,350
|
)
|
||||
|
DISTRIBUTIONS TO SHAREHOLDERS:
|
||||||||
|
Distributable earnings – Investor Class
|
(743,448
|
)
|
(524,145
|
)
|
||||
|
Total distributions
|
(743,448
|
)
|
(524,145
|
)
|
||||
|
CAPITAL SHARE TRANSACTIONS:
|
||||||||
|
Proceeds from shares subscribed – Investor Class
|
1,168,635
|
2,103,328
|
||||||
|
Dividends reinvested – Investor Class
|
729,717
|
519,982
|
||||||
|
Cost of shares redeemed – Investor Class
|
(1,723,755
|
)
|
(2,614,494
|
)
|
||||
|
Net increase in net assets
|
||||||||
|
derived from capital share transactions
|
174,597
|
8,816
|
||||||
|
TOTAL DECREASE IN NET ASSETS
|
(600,768
|
)
|
(638,679
|
)
|
||||
|
NET ASSETS:
|
||||||||
|
Beginning of year
|
12,892,517
|
13,531,196
|
||||||
|
End of year
|
$
|
12,291,749
|
$
|
12,892,517
|
||||
|
CHANGES IN SHARES OUTSTANDING:
|
||||||||
|
Shares sold – Investor Class
|
102,839
|
173,711
|
||||||
|
Shares issued to holders as reinvestment
|
||||||||
|
of dividends – Investor Class
|
63,200
|
43,919
|
||||||
|
Shares redeemed – Investor Class
|
(150,502
|
)
|
(219,333
|
)
|
||||
|
Net increase (decrease) in shares outstanding
|
15,537
|
(1,703
|
)
|
|||||
The accompanying notes are an integral part of these financial statements.
|
HENNESSY FUNDS
|
1-800-966-4354
|
13
Financial Statements
|
Financial Highlights
|
For an Investor Class share outstanding throughout each year
PER SHARE DATA:
Net asset value, beginning of year
Income from investment operations:
Net investment income(1)
Net realized and unrealized gains (losses) on investments
Total from investment operations
Less distributions:
Dividends from net investment income
Dividends from net realized gains
Total distributions
Net asset value, end of year
TOTAL RETURN
SUPPLEMENTAL DATA AND RATIOS:
Net assets, end of year (millions)
Ratio of expenses to average net assets
Ratio of net investment income to average net assets
Portfolio turnover rate
|
(1)
|
Calculated using the average shares outstanding method.
|
The accompanying notes are an integral part of these financial statements.
|
WWW.HENNESSYFUNDS.COM
|
14
|
FINANCIAL HIGHLIGHTS — INVESTOR CLASS
|
|
Year Ended October 31,
|
||||||||||||||||||
|
2023
|
2022
|
2021
|
2020
|
2019
|
||||||||||||||
|
$
|
11.82
|
$
|
12.39
|
$
|
10.84
|
$
|
12.38
|
$
|
12.34
|
|||||||||
|
0.26
|
0.06
|
0.02
|
0.12
|
0.13
|
||||||||||||||
|
(0.27
|
)
|
(0.15
|
)
|
1.56
|
(1.04
|
)
|
0.59
|
|||||||||||
|
(0.01
|
)
|
(0.09
|
)
|
1.58
|
(0.92
|
)
|
0.72
|
|||||||||||
|
(0.25
|
)
|
(0.05
|
)
|
(0.03
|
)
|
(0.12
|
)
|
(0.13
|
)
|
|||||||||
|
(0.44
|
)
|
(0.43
|
)
|
—
|
(0.50
|
)
|
(0.55
|
)
|
||||||||||
|
(0.69
|
)
|
(0.48
|
)
|
(0.03
|
)
|
(0.62
|
)
|
(0.68
|
)
|
|||||||||
|
$
|
11.12
|
$
|
11.82
|
$
|
12.39
|
$
|
10.84
|
$
|
12.38
|
|||||||||
|
-0.22
|
%
|
-0.70
|
%
|
14.62
|
%
|
-7.84
|
%
|
6.05
|
%
|
|||||||||
|
$
|
12.29
|
$
|
12.89
|
$
|
13.53
|
$
|
11.99
|
$
|
12.30
|
|||||||||
|
1.84
|
%
|
1.80
|
%
|
1.85
|
%
|
1.89
|
%
|
1.88
|
%
|
|||||||||
|
2.26
|
%
|
0.49
|
%
|
0.17
|
%
|
1.05
|
%
|
1.04
|
%
|
|||||||||
|
22
|
%
|
29
|
%
|
31
|
%
|
42
|
%
|
52
|
%
|
|||||||||
The accompanying notes are an integral part of these financial statements.
|
HENNESSY FUNDS
|
1-800-966-4354
|
15
Financial Statements
|
Notes to the Financial Statements October 31, 2023
|
1). ORGANIZATION
The Hennessy Balanced Fund (the “Fund”) is a series of Hennessy Funds Trust (the “Trust”), which was organized as a Delaware statutory trust on September 17, 1992. The Fund is an open-end management investment
company registered under the Investment Company Act of 1940, as amended. The investment objective of the Fund is a combination of capital appreciation and current income. The Fund is a non-diversified fund and offers Investor Class
shares.
As an investment company, the Fund follows the investment company accounting and reporting guidance of the Financial Accounting Standards Board (the “FASB”) Accounting Standard Codification
Topic 946 “Financial Services—Investment Companies.”
2). SIGNIFICANT ACCOUNTING POLICIES
The following is a summary of significant accounting policies consistently followed by the Fund in the preparation of the financial statements. These policies conform to U.S. generally accepted accounting
principles (“GAAP”).
|
a).
|
Securities Valuation – All investments in securities are valued in accordance with the Fund’s valuation policies and procedures, as described in Note 3.
|
|
b).
|
Federal Income Taxes – The Fund has elected to be taxed as a regulated investment company and intends to distribute substantially all of its taxable income to its shareholders and otherwise comply with
the provisions of the Internal Revenue Code of 1986, as amended, applicable to regulated investment companies. As a result, the Fund has made no provision for federal income taxes or excise taxes. Net investment income/loss and
realized gains/losses for federal income tax purposes may differ from those reported in the financial statements because of temporary book-basis and tax-basis differences. Temporary differences are primarily the result of the
treatment of wash sales for tax reporting purposes. The Fund recognizes interest and penalties related to income tax benefits, if any, in the Statement of Operations as an income tax expense. Distributions from net realized
gains for book purposes may include short-term capital gains, which are included as ordinary income to shareholders for tax purposes. The Fund may utilize equalization accounting for tax purposes and designate earnings and
profits, including net realized gains distributed to shareholders on redemption of shares, as part of the dividends paid deduction for income tax purposes.
|
|
Due to inherent differences in the recognition of income, expenses, and realized gains/losses under GAAP and federal income tax
regulations, permanent differences between book and tax basis for reporting are identified and appropriately reclassified in the Statement of Assets and Liabilities, as needed. The adjustments for fiscal year 2023 are as
follows:
|
|
Total
|
|||
|
Distributable
|
|||
|
Earnings
|
Capital Stock
|
||
|
$(11,865)
|
$11,865
|
|
c).
|
Accounting for Uncertainty in Income Taxes – The Fund has accounting policies regarding recognition and measurement of tax positions taken or expected to be taken on a tax return. The tax returns of
the Fund for the prior three fiscal years are
|
|
WWW.HENNESSYFUNDS.COM
|
16
|
NOTES TO THE FINANCIAL STATEMENTS
|
|
open for examination. The Fund has reviewed all open tax years in major tax jurisdictions and concluded that there is no impact on the Fund’s net assets and no tax liability resulting from unrecognized
tax benefits relating to uncertain income tax positions taken or expected to be taken on a tax return. The Fund’s major tax jurisdictions are U.S. federal and Delaware.
|
|
|
d).
|
Income and Expenses – Dividend income is recognized on the ex-dividend date or as soon as information is available to the Fund. Interest income, which includes the amortization of premium and accretion
of discount, is recognized on an accrual basis. Market discounts, original issue discounts, and market premiums on debt securities are accreted or amortized to interest income over the life of a security with a corresponding
increase or decrease, as applicable, in the cost basis of such security using the yield-to-maturity method or, where applicable, the first call date of the security. Other non-cash dividends are recognized as investment income
at the fair value of the property received. The Fund is charged for those expenses that are directly attributable to its portfolio, such as advisory, administration, and certain shareholder service fees.
|
|
e).
|
Distributions to Shareholders – Dividends from net investment income for the Fund, if any, are declared and paid at the end of each calendar quarter. Distributions of net realized capital gains, if
any, are declared and paid annually, usually in December.
|
|
f).
|
Security Transactions – Investment and shareholder transactions are recorded on the trade date. The Fund determines the realized gain/loss from an investment transaction by comparing the original cost
of the security lot sold with the net sale proceeds. Discounts and premiums on securities purchased are accreted or amortized, respectively, over the life of each such security.
|
|
g).
|
Use of Estimates – Preparing financial statements in accordance with GAAP requires management to make estimates and assumptions that affect the reported amounts of assets and liabilities and disclosure
of contingent assets and liabilities at the date of the financial statements, as well as the reported change in net assets during the reporting period. Actual results could differ from those estimates.
|
|
h).
|
Share Valuation – The net asset value (“NAV”) per share of the Fund is calculated by dividing (i) the total value of the securities held by the Fund, plus cash and other assets, minus all liabilities
(including estimated accrued expenses) by (ii) the total number of Fund shares outstanding, rounded to the nearest $0.01. Fund shares are not priced on days the New York Stock Exchange is closed for trading. The offering and
redemption price per share for the Fund is equal to the Fund’s NAV per share.
|
|
i).
|
Illiquid Securities – Pursuant to Rule 22e-4 under the 1940 Act, the Fund has adopted a Liquidity Risk Management Program (the “Liquidity Program”). The Liquidity Program requires, among other things,
that the Fund limit its illiquid investments to no more than 15% of its net assets. An illiquid investment is any investment that the Fund reasonably expects cannot be sold or disposed of by the Fund in current market conditions
in seven calendar days or less without the sale or disposition significantly changing the market value of the investment.
|
|
j).
|
Recent Accounting Pronouncements and Regulatory Updates – In October 2022, the Securities and Exchange Commission (“SEC”) adopted a final rule relating to Tailored Shareholder Reports for Mutual Funds
and Exchange-Traded Funds (ETFs); Fee Information in Investment Company Advertisements. The rule and form amendments will require mutual funds and ETFs to transmit concise and visually engaging shareholder reports that highlight
key information. The amendments also will require that funds tag information in a structured data format. In addition, the
|
|
HENNESSY FUNDS
|
1-800-966-4354
|
17
|
rule amendments will require that certain more in-depth information be made available online and available for delivery free of charge to investors on request. The amendments became effective January
24, 2023. There is an 18-month transition period after the effective date of the amendment.
|
|
|
In June 2022, the FASB issued Accounting Standards Update (“ASU”) 2022-03, Fair Value Measurement (Topic 820): Fair Value
Measurement of Equity Securities Subject to Contractual Sale Restrictions. The ASU clarifies that a contractual restriction on the sale of an equity security is not considered part of the unit of account of the equity security
and, therefore, is not considered in measuring the fair value. The amendments also require additional disclosures related to equity securities subject to contractual sale restrictions. The ASU is effective for fiscal years
beginning after December 15, 2023, and interim periods within those fiscal years.
|
3). SECURITIES VALUATION
The Fund follows its valuation policies and procedures in determining its NAV and, in preparing these financial statements, the fair value accounting standards that establish an authoritative definition of
fair value and set out a hierarchy for measuring fair value. These standards require additional disclosures about the various inputs and valuation techniques used to develop the measurements of fair value and a discussion of changes in
valuation techniques and related inputs during the period. These inputs are summarized in the three broad levels listed below:
|
Level 1 –
|
Unadjusted, quoted prices in active markets for identical instruments that the Fund has the ability to access at the date of measurement.
|
|
|
Level 2 –
|
Other significant observable inputs other than quoted prices included in Level 1 (including, but not limited to, quoted prices in active markets for similar instruments, quoted prices in markets that
are not active for identical or similar instruments, and model-derived valuations in which all significant inputs and significant value drivers are observable in active markets, such as interest rates, prepayment speeds, credit
risk curves, default rates, and similar data).
|
|
|
Level 3 –
|
Significant unobservable inputs (including the Fund’s own assumptions about what market participants would use to price the asset or liability based on the best available information) when observable
inputs are unavailable.
|
The following is a description of the valuation techniques applied to the Fund’s major categories of assets and liabilities on a recurring basis:
|
Equity Securities – Equity securities, including common stocks, preferred stocks, exchange-traded funds, closed-end mutual funds, partnerships, rights, and real
estate investment trusts, that are traded on a securities exchange for which a last-quoted sales price is readily available generally are valued at the last sales price as reported by the primary exchange on which the securities
are listed. Securities listed on The Nasdaq Stock Market (“Nasdaq”) generally are valued at the Nasdaq Official Closing Price, which may differ from the last sales price reported. Securities traded on a securities exchange for
which a last-quoted sales price is not readily available generally are valued at the mean between the bid and ask prices. To the extent these securities are actively traded and valuation adjustments are not applied, they are
classified in Level 1 of the fair value hierarchy.
|
|
|
Registered Investment Companies – Investments in open-end registered investment companies, commonly referred to as mutual funds, generally are priced at the
ending NAV provided by the applicable mutual fund’s service agent and are classified in Level 1 of the fair value hierarchy.
|
|
WWW.HENNESSYFUNDS.COM
|
18
|
NOTES TO THE FINANCIAL STATEMENTS
|
|
Debt Securities – Debt securities, including corporate bonds, asset-backed securities, mortgage-backed securities, municipal bonds, U.S. Treasuries, and U.S.
government agency issues, are generally valued at market on the basis of valuations furnished by an independent pricing service that utilizes both dealer-supplied valuations and formula-based techniques. The pricing service may
consider recently executed transactions in securities of the issuer or comparable issuers, market price quotations (where observable), bond spreads, and fundamental data relating to the issuer. In addition, the model may
incorporate observable market data, such as reported sales of similar securities, broker quotes, yields, bids, offers, and reference data. Certain securities are valued primarily using dealer quotations. These securities are
generally classified in Level 2 of the fair value hierarchy.
|
|
|
Short-Term Securities – Short-term equity investments, including money market funds, are valued in the manner specified above for equity securities. Short-term
debt investments with an original term to maturity of 60 days or less are valued at amortized cost, which approximates fair market value. If the original term to maturity of a short-term debt investment exceeds 60 days, then the
values as of the 61st day prior to maturity are amortized. Amortized cost is not used if its use would be inappropriate due to credit or other impairments of the issuer, in which case the security’s fair value would be
determined as described below. Short-term securities are generally classified in Level 1 or Level 2 of the fair value hierarchy depending on the inputs used and market activity levels for specific securities.
|
If market quotations are not readily available or if a significant event has occurred that indicates the closing price of a security no longer represents the true value of that security, any
security or other asset will be valued at its fair value in accordance with Rule 2a-5 under the 1940 Act. The Board of Trustees of the Fund (the “Board”) has designated Hennessy Advisors, Inc. (the “Advisor”) as the Fund’s valuation
designee to make all fair value determinations with respect to the Fund’s portfolio investments under the Fund’s fair value pricing procedures, subject to the Board’s oversight. There are numerous criteria considered in determining a
fair value of a security, such as the trading volume of a security and markets, the values of other similar securities, and news events with direct bearing on a security or markets. Fair value pricing results in an estimated price for a
security that reflects the amount the Fund might reasonably expect to receive in a current sale. Depending on the relative significance of the valuation inputs, these securities may be classified in either Level 2 or Level 3 of the fair
value hierarchy. The Advisor will regularly evaluate whether the Fund’s fair value pricing procedures continue to be appropriate in light of the specific circumstances of the Fund and the quality of prices obtained through their
application of such procedures.
The Fund has performed an analysis of all existing investments to determine the significance and character of all inputs to their fair value determinations. Various inputs are used to
determine the value of the Fund’s investments. The inputs or methodology used for valuing securities are not necessarily an indication of the risk associated with investing in those securities. Details related to the fair value
hierarchy of the Fund’s securities as of October 31, 2023, are included in the Schedule of Investments.
4). INVESTMENT TRANSACTIONS
Purchases and sales of investment securities (excluding government and short-term investments) for the Fund during fiscal year 2023 were $1,482,670 and $1,306,437, respectively.
There were no purchases or sales/maturities of long-term U.S. government securities for the Fund during fiscal year 2023.
|
HENNESSY FUNDS
|
1-800-966-4354
|
19
5). INVESTMENT ADVISORY FEE AND OTHER TRANSACTIONS WITH AFFILIATES
The Advisor provides the Fund with investment advisory services under an Investment Advisory Agreement. The Advisor furnishes all investment advice, office space, and facilities and most of the personnel
needed by the Fund. As compensation for its services, the Advisor is entitled to a monthly fee from the Fund. The fee is based on the average daily net assets of the Fund at an annual rate of 0.60%. The net investment advisory fees
expensed by the Fund during fiscal year 2023 are included in the Statement of Operations.
The Board has approved a Shareholder Servicing Agreement for the Fund, which compensates the Advisor for the non-investment advisory services it provides to the Fund. The Shareholder
Servicing Agreement provides for a monthly fee paid to the Advisor at an annual rate of 0.10% of the average daily net assets of the Fund. The shareholder service fees expensed by the Fund during fiscal year 2023 are included in the
Statement of Operations.
The Fund has adopted a plan pursuant to Rule 12b-1 under the Investment Company Act of 1940, as amended, that authorizes payments in connection with the distribution of Fund shares at an
annual rate of up to 0.25% of the Fund’s average daily net assets. Even though the authorized rate is up to 0.25%, the Fund is currently only using up to 0.15% of its average daily net assets for such purpose. Amounts paid under the
plan may be spent on any activities or expenses primarily intended to result in the sale of shares, including, but not limited to, advertising, shareholder account servicing, printing and mailing of prospectuses to other than current
shareholders, printing and mailing of sales literature, and compensation for sales and marketing activities or to financial institutions and others, such as dealers and distributors. The distribution fees expensed by the Fund during
fiscal year 2023 are included in the Statement of Operations.
The Fund has entered into agreements with various brokers, dealers, and financial intermediaries in connection with the sale of Fund shares. The agreements provide for periodic payments of
sub-transfer agent expenses by the Fund to the brokers, dealers, and financial intermediaries for providing certain shareholder maintenance services. These shareholder services include the pre-processing and quality control of new
accounts, shareholder correspondence, answering customer inquiries regarding account status, and facilitating shareholder telephone transactions. The sub-transfer agent fees expensed by the Fund during fiscal year 2023 are included in
the Statement of Operations.
U.S. Bancorp Fund Services, LLC, d/b/a U.S. Bank Global Fund Services (“Fund Services”) provides the Fund with administrative, accounting, and transfer agent services. As administrator, Fund
Services is responsible for activities such as (i) preparing various federal and state regulatory filings, reports, and returns for the Fund, (ii) preparing reports and materials to be supplied to the Board, (iii) monitoring the
activities of the Fund’s custodian, transfer agent, and accountants, and (iv) coordinating the preparation and payment of the Fund’s expenses and reviewing the Fund’s expense accruals. U.S. Bank N.A., an affiliate of Fund Services,
serves as the Fund’s custodian. The servicing agreements between the Trust, Fund Services, and U.S. Bank N.A. contain a fee schedule that is inclusive of administrative, accounting, custody, and transfer agent fees. The administrative,
accounting, custody, and transfer agent fees expensed by the Fund during fiscal year 2023 are included in the Statement of Operations.
Quasar Distributors, LLC, a wholly owned broker-dealer subsidiary of Foreside Financial Group, LLC, acts as the Fund’s principal underwriter in a continuous public offering of Fund shares.
The officers of the Fund are affiliated with the Advisor. With the exception of the Chief Compliance Officer, such officers receive no compensation from the Fund for serving in
|
WWW.HENNESSYFUNDS.COM
|
20
|
NOTES TO THE FINANCIAL STATEMENTS
|
their respective roles. The Fund, along with the other funds in the Hennessy Funds family (collectively, the “Hennessy Funds”), makes reimbursement payments on an equal basis to the Advisor for a portion of
the salary and benefits associated with the office of the Chief Compliance Officer. The compliance fees expensed by the Fund during fiscal year 2023 for reimbursement payments to the Advisor are included in the Statement of Operations.
6). GUARANTEES AND INDEMNIFICATIONS
Under the Hennessy Funds’ organizational documents, their officers and trustees are indemnified by the Hennessy Funds against certain liabilities arising out of the performance of their duties to the Hennessy
Funds. Additionally, in the normal course of business, the Hennessy Funds enter into contracts with service providers that contain general indemnification clauses. The Fund’s maximum exposure under these arrangements is unknown as this
would involve future claims that may be made against the Fund that have not yet occurred. Currently, the Fund expects the risk of loss to be remote.
7). LINE OF CREDIT
The Fund has an uncommitted line of credit with the other Hennessy Funds in the amount of the lesser of (i) $100,000,000 or (ii) 33.33% of each Hennessy Fund’s net assets, or 30% for the Hennessy Gas Utility
Fund, the Hennessy Japan Fund, and the Hennessy Japan Small Cap Fund and 10% for the Fund. The line of credit is intended to provide any necessary short-term financing in connection with shareholder redemptions, subject to certain
restrictions. The credit facility is with the Hennessy Funds’ custodian bank, U.S. Bank N.A. Borrowings under this arrangement bear interest at the bank’s prime rate and are secured by all of the Fund’s assets (as to its own borrowings
only). During fiscal year 2023, the Fund did not have any borrowings outstanding under the line of credit.
8). FEDERAL TAX INFORMATION
As of October 31, 2023, the components of accumulated earnings (losses) for income tax purposes were as follows:
|
Investments
|
|||||
|
Cost of investments for tax purposes
|
$
|
12,638,263
|
|||
|
Gross tax unrealized appreciation
|
$
|
698,724
|
|||
|
Gross tax unrealized depreciation
|
(1,022,592
|
)
|
|||
|
Net tax unrealized appreciation/(depreciation)
|
$
|
(323,868
|
)
|
||
|
Undistributed ordinary income
|
$
|
24,233
|
|||
|
Undistributed long-term capital gains
|
13,317
|
||||
|
Total distributable earnings
|
$
|
37,550
|
|||
|
Other accumulated gain/(loss)
|
$
|
—
|
|||
|
Total accumulated gain/(loss)
|
$
|
(286,318
|
)
|
||
The difference between book-basis unrealized appreciation/depreciation and tax-basis unrealized appreciation/depreciation (as shown above) is attributable primarily to wash sales.
As of October 31, 2023, the Fund had no tax-basis capital losses to offset future capital gains.
As of October 31, 2023, the Fund did not defer, on a tax basis, any late-year ordinary losses. Late-year ordinary losses are net ordinary losses incurred after December 31, 2022, but within
the taxable year, that are deemed to arise on the first day of the Fund’s next taxable year.
|
HENNESSY FUNDS
|
1-800-966-4354
|
21
During fiscal years 2023 and 2022, the tax character of distributions paid by the Fund was as follows:
|
Year Ended
|
Year Ended
|
||||||||
|
October 31, 2023
|
October 31, 2022
|
||||||||
|
Ordinary income(1)
|
$
|
265,250
|
$
|
70,052
|
|||||
|
Long-term capital gains
|
478,198
|
454,093
|
|||||||
|
Total distributions
|
$
|
743,448
|
$
|
524,145
|
|||||
|
(1) Ordinary income includes short-term capital gains.
|
|||||||||
9). GLOBAL EVENTS
A rise in protectionist trade policies, the possibility of a national or global recession, risks associated with pandemic and epidemic diseases, trade tensions, the possibility of changes to some international
trade agreements, political events, and continuing political tension and armed conflicts may adversely impact financial markets and the broader economy. For example, ongoing armed conflicts between Ukraine and Russia in Europe and among
Israel, Hamas, and other militant groups in the Middle East have caused and could continue to cause significant market disruptions and volatility with the markets in Europe and the Middle East, and have had negative impacts on markets
in the United States. These events could also have negative effects on the Fund’s investments that cannot be foreseen at the present time. As global systems, economies and financial markets are increasingly interconnected, events that
once had only local impact are now more likely to have regional or even global effects. Events that occur in one country, region or financial market will, more frequently, adversely impact issuers in other countries, regions, or
markets. These impacts can be exacerbated by failures of governments and societies to adequately respond to an emerging event or threat. Your investment would be negatively impacted if the value of your portfolio holdings decreases as a
result of such events, if these events adversely impact the operations and effectiveness of the Advisor or other key service providers or if these events disrupt systems and processes necessary or beneficial to the management of
accounts. These events may negatively impact broad segments of businesses and populations and could have a significant and rapid negative impact on the performance of the Fund’s investments, increase the Fund’s volatility, or exacerbate
pre-existing risks to the Fund.
10). EVENTS SUBSEQUENT TO YEAR END
Management has evaluated the Fund’s related events and transactions that occurred subsequent to October 31, 2023, through the date of issuance of the Fund’s financial statements. Other than as disclosed below,
management has determined that there were no subsequent events requiring recognition or disclosure in the financial statements.
On December 7, 2023, capital gains were declared and paid to shareholders of record on December 6, 2023, as follows:
|
Long-term
|
|||
|
Investor Class
|
0.01216
|
|
WWW.HENNESSYFUNDS.COM
|
22
|
NOTES/REPORT OF INDEPENDENT REGISTERED PUBLIC ACCOUNTING FIRM
|
Report of Independent Registered Public
Accounting Firm
To the Board of Trustees of Hennessy Funds Trust
and the shareholders of the Hennessy Balanced Fund
Novato, CA
Opinion on the Financial Statements
We have audited the accompanying statement of assets and liabilities of the Hennessy Balanced Fund (the “Fund”), a series of Hennessy Funds Trust, including the schedule of investments, as of October 31, 2023,
the related statement of operations for the year then ended, the statements of changes in net assets for each of the two years in the period then ended, the financial highlights for each of the five years in the period then ended, and
the related notes (collectively referred to as the “financial statements”). In our opinion, the financial statements present fairly, in all material respects, the financial position of the Fund as of October 31, 2023, the results of its
operations for the year then ended, the changes in its net assets for each of the two years in the period then ended, and the financial highlights for each of the five years in the period then ended in conformity with accounting
principles generally accepted in the United States of America.
Basis for Opinion
These financial statements are the responsibility of the Fund’s management. Our responsibility is to express an opinion on the Fund’s financial statements based on our audits. We are a public accounting firm
registered with the Public Company Accounting Oversight Board (United States) (“PCAOB”) and are required to be independent with respect to the Fund in accordance with the U.S. federal securities laws and the applicable rules and
regulations of the Securities and Exchange Commission and the PCAOB. We have served as the auditor of one or more of the funds in the Trust since 2002.
We conducted our audits in accordance with the standards of the PCAOB. Those standards require that we plan and perform the audit to obtain reasonable assurance about whether the financial statements are free
of material misstatement, whether due to error or fraud. The Fund is not required to have, nor were we engaged to perform, an audit of its internal control over financial reporting. As part of our audits we are required to obtain an
understanding of internal control over financial reporting, but not for the purpose of expressing an opinion on the effectiveness of the Fund’s internal control over financial reporting. Accordingly, we express no such opinion.
Our audits included performing procedures to assess the risks of material misstatement of the financial statements, whether due to error or fraud, and performing procedures that respond to those risks. Such
procedures included examining, on a test basis, evidence regarding the amounts and disclosures in the financial statements. Our audits also included evaluating the accounting principles used and significant estimates made by management,
as well as evaluating the overall presentation of the financial statements. Our procedures included confirmation of securities owned as of October 31, 2023 by correspondence with the custodian. We believe that our audits provide a
reasonable basis for our opinion.
|
|
|
TAIT, WELLER & BAKER LLP
|
Philadelphia, Pennsylvania
December 22, 2023
|
HENNESSY FUNDS
|
1-800-966-4354
|
23
Trustees and Officers of the Fund (Unaudited)
The business and affairs of the Funds are managed under the direction of the Board of Trustees of the Trust, and the Board of Trustees elects the officers of the Trust (“Officers”). From time to time, the
Board of Trustees also has appointed advisers to the Board of Trustees (“Advisers”) with the intention of having qualified individuals serve in an advisory capacity to garner experience in the mutual fund and asset management industry
and be considered as potential Trustees in the future. There are currently two Advisers, Brian Alexander and A.J. Hennessy. As Advisers, Mr. Alexander and Mr. A.J. Hennessy attend meetings of the Board of Trustees and act as non-voting
participants. Information pertaining to the Trustees, Advisers, and the Officers of the Trust is set forth below. The Trustees and Officers serve until their successors are duly elected and qualified or until their earlier death,
resignation, or removal. Each Trustee oversees all 17 Hennessy Funds. Unless otherwise indicated, the address of all persons listed below is 7250 Redwood Boulevard, Suite 200, Novato, CA 94945. The Fund’s Statement of Additional
Information includes more information about the persons listed below and is available without charge by calling 800-966-4354 or by visiting www.hennessyfunds.com.
|
Other
|
|||
|
Directorships
|
|||
|
Held Outside
|
|||
|
Name, Age,
|
of Fund
|
||
|
and Position Held
|
Start Date
|
Principal Occupation(s)
|
Complex During
|
|
with the Trust
|
of Service
|
During Past Five Years
|
Past Five Years
|
|
Disinterested Trustees(1) and Disinterested Advisers
|
|||
|
J. Dennis DeSousa
|
January 1996
|
Mr. DeSousa is a real estate investor.
|
None.
|
|
87
|
|||
|
Trustee
|
|||
|
Robert T. Doyle
|
January 1996
|
Mr. Doyle is retired. He served as the
|
None.
|
|
76
|
Sheriff of Marin County, California
|
||
|
Trustee
|
from 1996 to June 2022.
|
||
|
Doug Franklin
|
March 2016
|
Mr. Franklin is a retired insurance
|
None.
|
|
59
|
as an Adviser
|
industry executive. From 1987
|
|
|
Trustee
|
to the Board
|
through 2015, he was employed by
|
|
|
and June 2023
|
the Allianz-Fireman’s Fund Insurance
|
||
|
as a Trustee
|
Company in various positions,
|
||
|
including as its Chief Actuary and
|
|||
|
Chief Risk Officer.
|
|||
|
Claire Garvie
|
December 2015
|
Ms. Garvie is a founder of Kiosk and
|
None.
|
|
49
|
as an Adviser
|
has served as its Chief Operating
|
|
|
Trustee
|
to the Board and
|
Officer since 2004. Kiosk is a
|
|
|
December 2021
|
full-service marketing agency with
|
||
|
as a Trustee
|
offices in the San Francisco Bay Area
|
||
|
and Liverpool, UK and staff across
|
|||
|
nine states in the U.S.
|
|||
|
WWW.HENNESSYFUNDS.COM
|
24
|
TRUSTEES AND OFFICERS OF THE FUND
|
|
Other
|
|||
|
Directorships
|
|||
|
Held Outside
|
|||
|
Name, Age,
|
of Fund
|
||
|
and Position Held
|
Start Date
|
Principal Occupation(s)
|
Complex During
|
|
with the Trust
|
of Service
|
During Past Five Years
|
Past Five Years
|
|
Gerald P. Richardson
|
May 2004
|
Mr. Richardson is an independent
|
None.
|
|
78
|
consultant in the securities industry.
|
||
|
Trustee
|
|||
|
Brian Alexander
|
March 2015
|
Mr. Alexander has served as the
|
None.
|
|
42
|
Chief Operating Officer of Solis
|
||
|
Adviser to the Board
|
Mammography since March 2023.
|
||
|
Prior to that, he worked for the
|
|||
|
Sutter Health organization from
|
|||
|
2011 to 2023 in various positions.
|
|||
|
He served as the Chief Executive
|
|||
|
Officer of the North Valley Hospital
|
|||
|
Area from 2021 to March 2023.
|
|||
|
From 2018 to 2021, he served as the
|
|||
|
Chief Executive Officer of Sutter
|
|||
|
Roseville Medical Center. From 2016
|
|||
|
through 2018, he served as the Vice
|
|||
|
President of Strategy for the Sutter
|
|||
|
Health Valley Area, which includes
|
|||
|
11 hospitals, 13 ambulatory surgery
|
|||
|
centers, 16,000 employees, and
|
|||
|
1,900 physicians.
|
|||
|
Interested Trustee and Interested Adviser(2)
|
|||
|
Neil J. Hennessy
|
January 1996 as
|
Mr. Neil Hennessy has been employed
|
Hennessy
|
|
67
|
a Trustee and
|
by Hennessy Advisors, Inc. since
|
Advisors, Inc.
|
|
Chairman of the Board,
|
June 2008 as
|
1989 and currently serves as its
|
|
|
Chief Market Strategist,
|
an Officer
|
Chairman and Chief Executive Officer.
|
|
|
Portfolio Manager,
|
|||
|
and President
|
|||
|
A.J. Hennessy
|
December 2022
|
Mr. A.J. Hennessy has been employed
|
None.
|
|
37
|
by Hennessy Advisors, Inc. since 2011.
|
||
|
Adviser to the Board
|
|||
|
and Vice President,
|
|||
|
Corporate Development
|
|||
|
and Operations
|
|||
|
HENNESSY FUNDS
|
1-800-966-4354
|
25
|
Name, Age,
|
||
|
and Position Held
|
Start Date
|
Principal Occupation(s)
|
|
with the Trust
|
of Service
|
During Past Five Years
|
|
Officers
|
||
|
Teresa M. Nilsen
|
January 1996
|
Ms. Nilsen has been employed by Hennessy Advisors, Inc.
|
|
57
|
since 1989 and currently serves as its President, Chief
|
|
|
Executive Vice President
|
Operating Officer, and Secretary.
|
|
|
and Treasurer
|
||
|
Daniel B. Steadman
|
March 2000
|
Mr. Steadman has been employed by Hennessy Advisors, Inc.
|
|
67
|
since 2000 and currently serves as its Executive Vice President.
|
|
|
Executive Vice President
|
||
|
and Secretary
|
||
|
Brian Carlson
|
December 2013
|
Mr. Carlson has been employed by Hennessy Advisors, Inc.
|
|
51
|
since December 2013 and currently serves as its Chief
|
|
|
Senior Vice President
|
Compliance Officer and Senior Vice President.
|
|
|
and Head of Distribution
|
||
|
David Ellison(3)
|
October 2012
|
Mr. Ellison has been employed by Hennessy Advisors, Inc.
|
|
65
|
since October 2012. He has served as a Portfolio Manager of
|
|
|
Senior Vice President
|
the Hennessy Large Cap Financial Fund and the Hennessy
|
|
|
and Portfolio Manager
|
Small Cap Financial Fund since their inception. Mr. Ellison also
|
|
|
served as a Portfolio Manager of the Hennessy Technology
|
||
|
Fund from its inception until February 2017. Mr. Ellison served
|
||
|
as Director, CIO, and President of FBR Fund Advisers, Inc.
|
||
|
from December 1999 to October 2012.
|
||
|
Jennifer Emerson(4)
|
June 2013
|
Ms. Emerson has been employed by Hennessy Advisors, Inc.
|
|
46
|
as its General Counsel since June 2013.
|
|
|
Senior Vice President and
|
||
|
Chief Compliance Officer
|
||
|
Ryan Kelley(5)
|
March 2013
|
Mr. Kelley has been employed by Hennessy Advisors, Inc. since
|
|
51
|
October 2012. He has served as Chief Investment Officer of the
|
|
|
Senior Vice President,
|
Hennessy Funds since March 2021 and has served as a Portfolio
|
|
|
Chief Investment Officer,
|
Manager of the Hennessy Gas Utility Fund, the Hennessy Large
|
|
|
and Portfolio Manager
|
Cap Financial Fund, and the Hennessy Small Cap Financial Fund
|
|
|
since October 2014. Mr. Kelley served as Co-Portfolio Manager
|
||
|
of these same funds from March 2013 through September
|
||
|
2014 and as a Portfolio Analyst for the Hennessy Funds from
|
||
|
October 2012 through February 2013. He has also served as a
|
||
|
Portfolio Manager of the Hennessy Cornerstone Growth Fund,
|
||
|
the Hennessy Cornerstone Mid Cap 30 Fund, the Hennessy
|
||
|
Cornerstone Large Growth Fund, and the Hennessy
|
||
|
Cornerstone Value Fund since February 2017 and as a Portfolio
|
||
|
Manager of the Hennessy Total Return Fund, the Hennessy
|
||
|
Balanced Fund, and the Hennessy Technology Fund since May
|
||
|
2018. He previously served as Co-Portfolio Manager of the
|
||
|
Hennessy Technology Fund from February 2017 until May 2018.
|
||
|
Mr. Kelley served as Portfolio Manager of FBR Fund
|
||
|
Advisers, Inc. from January 2008 to October 2012.
|
|
WWW.HENNESSYFUNDS.COM
|
26
|
TRUSTEES AND OFFICERS OF THE FUND
|
|
Name, Age,
|
||
|
and Position Held
|
Start Date
|
Principal Occupation(s)
|
|
with the Trust
|
of Service
|
During Past Five Years
|
|
L. Joshua Wein(5)
|
September 2018
|
Mr. Wein has been employed by Hennessy Advisors, Inc. since
|
|
50
|
2018. He has served as Portfolio Manager of the Hennessy
|
|
|
Vice President and
|
Cornerstone Growth Fund, the Hennessy Cornerstone Mid Cap
|
|
|
Portfolio Manager
|
30 Fund, the Hennessy Cornerstone Large Growth Fund, the
|
|
|
Hennessy Cornerstone Value Fund, Hennessy Total Return Fund,
|
||
|
the Hennessy Balanced Fund, the Hennessy Gas Utility Fund,
|
||
|
and the Hennessy Technology Fund since February 2021, and
|
||
|
as the Co-Portfolio Manager of these Funds since February
|
||
|
2019. He served as a Senior Analyst of those same Funds from
|
||
|
September 2018 through February 2019. He also has served as
|
||
|
a Portfolio Manager of the Hennessy Energy Transition Fund
|
||
|
and the Hennessy Midstream Fund since January 2022.
|
||
|
Mr. Wein served as Director of Alternative Investments and
|
||
|
Co-Portfolio Manager at Sterling Capital Management
|
||
|
from 2008 to 2018.
|
_______________
|
(1)
|
The Funds have determined that Mr. DeSousa, Mr. Doyle, Mr. Franklin, Ms. Garvie, and Mr. Richardson are not interested persons, as defined in the 1940 Act, of the Investment
Manager or of any predecessor investment adviser for purposes of Section 15(f) of the 1940 Act.
|
|
(2)
|
Each of Neil J. Hennessy and A.J. Hennessy is considered an interested person, as defined in the 1940 Act, because he is an officer of the Trust.
|
|
(3)
|
The address of this officer is 101 Federal Street, Suite 1615B, Boston, MA 02110.
|
|
(4)
|
The address of this officer is 4800 Bee Caves Road, Suite 100, Austin, TX 78746.
|
|
(5)
|
The address of this officer is 1340 Environ Way, Chapel Hill, NC 27517.
|
|
HENNESSY FUNDS
|
1-800-966-4354
|
27
Expense Example (Unaudited)
October 31, 2023
As a shareholder of the Fund, you incur ongoing costs, including management fees, service fees, and other Fund expenses. This Example is intended to help you understand your ongoing costs (in dollars) of
investing in the Fund and to compare these costs with the ongoing costs of investing in other investment funds. The Example is based on an investment of $1,000 invested at the beginning of the period and held for the entire period from
May 1, 2023, through October 31, 2023.
Actual Expenses
The first line of the table below provides information about actual account values and actual expenses. You may use this information, together with the amount you invested, to estimate the expenses that you
paid over the period. Simply divide your account value by $1,000 (for example, an $8,600 account value divided by $1,000 = 8.6), then multiply the result by the number in the first line under the heading “Expenses Paid During Period” to
estimate the expenses you paid on your account during this period. Although the Fund charges no sales loads or transaction fees, you will be assessed fees for outgoing wire transfers, returned checks, and stop payment orders at
prevailing rates charged by U.S. Bank Global Fund Services, the Fund’s transfer agent. If you request that a redemption be made by wire transfer, the Fund’s transfer agent charges a $15 fee. IRAs are charged a $15 annual maintenance fee
(up to $30 maximum per shareholder for shareholders with multiple IRAs). The example below includes, but is not limited to, management, shareholder servicing, accounting, custody, and transfer agent fees. However, the example below does
not include portfolio trading commissions and related expenses.
Hypothetical Example for Comparison Purposes
The second line of the table below provides information about hypothetical account values and hypothetical expenses based on the Fund’s actual expense ratio and an assumed rate of return of 5% per year before
expenses, which is not the Fund’s actual return. The hypothetical account values and expenses may not be used to estimate the actual ending account balance or expenses you paid for the period. You may use this information to compare the
ongoing costs of investing in the Fund and other funds. To do so, compare this 5% hypothetical example with the 5% hypothetical examples that appear in the shareholder reports of the other funds. Please note that the expenses shown in
the table are meant to highlight your ongoing costs only. Therefore, the second line is useful in comparing ongoing costs only and will not help you determine the relative total costs of owning different funds.
|
Expenses Paid
|
|||
|
Beginning
|
Ending
|
During Period(1)
|
|
|
Account Value
|
Account Value
|
May 1, 2023 –
|
|
|
May 1, 2023
|
October 31, 2023
|
October 31, 2023
|
|
|
Investor Class
|
|||
|
Actual
|
$1,000.00
|
$ 988.30
|
$9.37
|
|
Hypothetical (5% return before expenses)
|
$1,000.00
|
$1,015.78
|
$9.50
|
|
(1)
|
Expenses are equal to the Fund’s annualized expense ratio of 1.87%, multiplied by the average account value over the period, multiplied by 184/365 days (to reflect the half-year period).
|
|
WWW.HENNESSYFUNDS.COM
|
28
|
EXPENSE EXAMPLE — ELECTRONIC DELIVERY
|
How to Obtain a Copy of the Fund’s Proxy
Voting Policy and Proxy Voting Records
A description of the policies and procedures the Fund uses to determine how to vote proxies relating to portfolio securities is available without charge (1) by calling 800-966-4354, (2) on the Hennessy Funds’
website at www.hennessyfunds.com/proxy-voting/voting-policy, or (3) on the U.S. Securities and Exchange Commission’s (the “SEC”) website at www.sec.gov. The Fund’s proxy voting record is available without charge on both the Hennessy
Funds’ website at www.hennessyfunds.com/proxy-voting/voting-record and the SEC’s website at www.sec.gov no later than August 31 for the prior 12 months ending June 30.
Availability of Quarterly Portfolio Schedule
The Fund files a complete schedule of portfolio holdings with the SEC for the first and third quarters of each fiscal year as an exhibit to its reports on Form N-PORT. The Fund’s Form N-PORT reports are
available on the SEC’s website at www.sec.gov or on request by calling 800-966-4354.
Federal Tax Distribution Information (Unaudited)
For fiscal year 2023, certain dividends paid by the Fund may be subject to a maximum tax rate of 23.8%, as provided for by the Jobs and Growth Tax Relief Reconciliation Act of 2003. The percentage of dividends
declared from ordinary income designated as qualified dividend income was 94.82%.
For corporate shareholders, the percent of ordinary income distributions that qualified for the corporate dividends received deduction for fiscal year 2023 was 94.82%.
The percentage of taxable ordinary income distributions that were designated as short-term capital gain distributions under Section 871(k)(2)(C) of the Internal Revenue Code of 1986, as
amended, for the Fund was 0.00%.
Important Notice Regarding Delivery
of Shareholder Documents
To help keep the Fund’s costs as low as possible, we generally deliver a single copy of shareholder reports, proxy statements, and prospectuses to shareholders who share an address and have the same last name.
This process does not apply to account statements. You may request an individual copy of a shareholder document at any time. If you would like to receive separate mailings of shareholder documents, please call U.S. Bank Global Fund
Services at 800-261-6950 or 414-765-4124, and individual delivery will begin within 30 days of your request. If your account is held through a financial institution or other intermediary, please contact such intermediary directly to
request individual delivery.
Electronic Delivery
As currently permitted by SEC regulations, the Fund’s shareholder reports are made available on a website, and unless you sign for eDelivery or elect to receive paper copies as detailed below, you will be
notified by mail each time a report is posted and provided with a website link to access the report.
To elect to receive paper copies of all future reports free of charge, please call U.S. Bank Global Fund Services at 800-261-6950 or 414-765-4124.
The Fund also offers shareholders the option to receive all notices, account statements, prospectuses, tax forms, and shareholder reports electronically. To sign up for eDelivery or change
your delivery preference, please visit www.hennessyfunds.com/account.
Shareholder reports transmitted after July 24, 2024, will comply with the new tailored shareholder reporting requirements, which require streamlined annual and semi-annual reports to
shareholders that highlight key information. These reports will be transmitted in paper unless a shareholder elects to receive reports electronically via eDelivery. To sign up for eDelivery, please visit
http://www.hennessyfunds.com/account.
Subscribe to receive our team’s unique market and sector insights delivered to your inbox
www.hennessyfunds.com/subscribe
Follow us on social media
| |
|
|
|
HENNESSY FUNDS
|
1-800-966-4354
|
29
Liquidity Risk Management Program
In accordance with Rule 22e-4 under the Investment Company Act of 1940, as amended (the “Liquidity Rule”), we have adopted and implemented a liquidity risk management program (the “Liquidity Program”). The
purpose of the Liquidity Program is to assess and manage the Fund’s liquidity risk, which is the risk that the Fund would not be able to meet requests to redeem Fund shares without significant dilution of the remaining shareholders’
interests in the Fund. The Board of Trustees of the Fund (the “Board”) designated a committee comprising representatives of Hennessy Advisors, Inc., the investment adviser to the Fund, as the administrator of the Liquidity Program (the
“Program Administrator”).
The Program Administrator provided a written report regarding the Liquidity Program to the Board in advance of its meeting on June 7, 2023. The report covered the period from June 1, 2022,
through May 31, 2023. The report addressed the operation of the Liquidity Program, assessed the adequacy and effectiveness of its implementation, and described any material changes to the Liquidity Program during the review period. The
Trust’s chief compliance officer presented the report to the Board at the meeting and provided additional information regarding the Liquidity Program. The Board reviewed the Liquidity Program and considered, among other items, the
following:
|
1.
|
The Program Administrator reviewed daily historical net redemption activity during the review period and during prior periods with higher-than-average redemption activity and concluded that the Fund
has historically been able to meet requests to redeem Fund shares without significant dilution to the Fund’s remaining shareholders, and the Program Administrator expects the Fund to be able to continue to do so in the future
during both normal and reasonably foreseeable stressed conditions.
|
|
|
2.
|
The Fund primarily holds assets that are highly liquid investments and is not required to establish a highly liquid investment minimum for the Fund or adopt policies and procedures for responding to a
highly liquid investment minimum shortfall.
|
|
|
3.
|
The Program Administrator did not make or recommend any material changes to the Liquidity Program during the review period.
|
|
|
4.
|
The Program Administrator concluded that the Liquidity Program was reasonably designed to assess and manage the Fund’s liquidity risk, complies with the requirements of the Liquidity Rule, and was
operating as intended during the review period.
|
Privacy Policy
We collect the following personal information about you:
|
1.
|
Information we receive from you in applications or other forms, correspondence, or conversations, including, but not limited to, your name, address, phone number, social security number, assets,
income, and date of birth;
|
|
|
2.
|
Information about your transactions with us, our affiliates, or others, including, but not limited to, your account number and balance, payments history, parties to transactions, cost basis
information, and other financial information; and
|
|
WWW.HENNESSYFUNDS.COM
|
30
|
LIQUIDITY RISK MANAGEMENT PROGRAM/PRIVACY POLICY
|
|
3.
|
Other personal information we collect from various sources, even if you have not entered into a prior transaction with us, including the following:
|
|
•
|
Name, alias, address, unique personal identifier, online identifier, IP address, email address, telephone number, account name, and other similar identifiers;
|
||
|
•
|
Age and marital status;
|
||
|
•
|
Commercial information, including records of products purchased;
|
||
|
•
|
Browsing history, search history, and information on interaction with our website;
|
||
|
•
|
Geolocation data;
|
||
|
•
|
Employment and employment history, educational history, financial information, and purchasing and consuming histories or tendencies; and
|
||
|
•
|
Inferences drawn from the above-listed information to create a profile about your preferences, characteristics, predispositions, and behavior.
|
We collect this information directly from you, indirectly in the course of providing services to you, directly and indirectly from your activity on our website, from broker dealers,
marketing agencies, and other third parties that interact with us in connection with the services we perform and products we offer, and from anonymized and aggregated consumer information.
We use this information to fulfill the reason you provided the information to us, to provide you with other relevant products that you request from us, to provide you with information
about products that may interest you, to improve our website or present our website’s contents to you, and as otherwise described to you when collecting your personal information.
We do not disclose any personal information to unaffiliated third parties, except as permitted by law. We may disclose your personal information to our affiliates, vendors, and service
providers for a business purpose. For example, we are permitted by law to disclose all of the information we collect, as described above, to our transfer agent to process your transactions. When disclosing your personal information to
third parties, we enter into a contract with each third party describing the purpose of such disclosure and requiring that such personal information be kept confidential and not used for any purpose except to perform the services
contracted or respond to regulatory or law enforcement requests.
Furthermore, we restrict access to your personal information to those persons who require such information to provide products or services to you. As a result, we do not provide a means
for opting out of our limited sharing of your information. We maintain physical, electronic, and procedural safeguards that comply with federal standards to guard your personal information.
If you hold shares of the Funds through a financial intermediary, including, but not limited to, a broker-dealer, bank, or trust company, the privacy policy of your financial intermediary
governs how your personal information is shared with unaffiliated third parties.
If you live in a state such as California where the laws provide further privacy rights, we will not share information unless the law allows, and we will comply with the other
state-specific requirements.
|
HENNESSY FUNDS
|
1-800-966-4354
|
31
Supplemental Privacy Notice for Residents of California
The California Consumer Privacy Act of 2018 (the “CCPA”) provides you, as a California resident, with certain additional rights relating to your personal information.
Under the CCPA, you have the right to request that we disclose to you the categories of personal information we have collected about you over the past 12 months, the categories of sources of
such information, our business purpose for collecting the information, the categories of third parties, if any, with whom we shared the information, and the specific information we have collected about you. You also have the right to
request that we delete any of your personal information, and, unless an exception applies, we will delete such information upon receiving and confirming your request. To make a request, call us at 1-800-966-4354, email us at
privacy@hennessyfunds.com, or go to www.hennessyfunds.com/contact. We will not discriminate against you for exercising your rights under the CCPA. Further, we will not collect additional categories of your personal information or use
the personal information we collected for materially different, unrelated, or incompatible purposes without providing you notice.
|
WWW.HENNESSYFUNDS.COM
|
32
|
PRIVACY POLICY
|
(This Page Intentionally Left Blank.)
For information, questions, or assistance, please call
The Hennessy Funds
800-966-4354 or 415-899-1555
INVESTMENT ADVISOR
Hennessy Advisors, Inc.
7250 Redwood Boulevard, Suite 200
Novato, California 94945
ADMINISTRATOR,
TRANSFER AGENT,
DIVIDEND PAYING AGENT, &
SHAREHOLDER SERVICING AGENT
U.S. Bancorp Fund Services, LLC
d/b/a U.S. Bank Global Fund Services
P.O. Box 701
Milwaukee, Wisconsin 53201-0701
CUSTODIAN
U.S. Bank N.A.
Custody Operations
1555 North River Center Drive, Suite 302
Milwaukee, Wisconsin 53212
TRUSTEES
Neil J. Hennessy
Robert T. Doyle
J. Dennis DeSousa
Doug Franklin
Claire Garvie
Gerald P. Richardson
COUNSEL
Foley & Lardner LLP
777 East Wisconsin Avenue
Milwaukee, Wisconsin 53202-5306
INDEPENDENT REGISTERED
PUBLIC ACCOUNTING FIRM
Tait, Weller & Baker LLP
Two Liberty Place
50 South 16th Street, Suite 2900
Philadelphia, Pennsylvania 19102-2529
DISTRIBUTOR
Quasar Distributors, LLC
111 East Kilbourn Avenue, Suite 1250
Milwaukee, Wisconsin 53202
www.hennessyfunds.com | 800-966-4354
This report has been prepared for shareholders and may be distributed to
others only if preceded or accompanied by a current prospectus.
ANNUAL REPORT
OCTOBER 31, 2023

HENNESSY ENERGY TRANSITION FUND
Investor Class HNRGX
Institutional Class HNRIX
www.hennessyfunds.com | 1-800-966-4354
(This Page Intentionally Left Blank.)
Contents
|
Letter to Shareholders
|
2
|
|
|
Performance Overview
|
6
|
|
|
Financial Statements
|
||
|
Schedule of Investments
|
10
|
|
|
Statement of Assets and Liabilities
|
14
|
|
|
Statement of Operations
|
15
|
|
|
Statements of Changes in Net Assets
|
17
|
|
|
Financial Highlights
|
18
|
|
|
Notes to the Financial Statements
|
22
|
|
|
Report of Independent Registered Public Accounting Firm
|
30
|
|
|
Trustees and Officers of the Fund
|
31
|
|
|
Expense Example
|
36
|
|
|
Proxy Voting Policy and Proxy Voting Records
|
38
|
|
|
Availability of Quarterly Portfolio Schedule
|
38
|
|
|
Federal Tax Distribution Information
|
38
|
|
|
Important Notice Regarding Delivery of Shareholder Documents
|
38
|
|
|
Electronic Delivery
|
38
|
|
|
Liquidity Risk Management Program
|
39
|
|
|
Privacy Policy
|
39
|
|
HENNESSY FUNDS
|
1-800-966-4354
|
November 2023
Dear Hennessy Funds Shareholder:
Market Myopia: Tough Beginnings & Fantastic Finishes
During an interview this summer, I was reminded how important it is to maintain a long-term view of the market and investing and how easy it is to focus on the very recent past. In mid-July, when the Nasdaq
Composite Index was soaring to new 2023 highs and large-cap tech was once again dominating both returns and news headlines, the interviewer seemed confused – and somewhat disappointed – when I mentioned that even with 2023’s stellar
performance, the Nasdaq was negative if you included the prior year (2022) and that during that same time, utilities had outperformed. As of the time of writing this letter, a similar story can be seen when considering eight technology
giants: Microsoft, Tesla, Facebook (Meta), Apple, Amazon, Netflix, Nvidia, and Google, or “MT. FAANNG” as a much easier to say
(and remember) acronym.(1) MT. FAANNG is up on average a whopping 89.69% in 2023 on a total return basis as of November 7, 2023. However, this same group
was down -46.71% in 2022, a dismal year for large-cap tech. Due to the unforgiving nature of percentages, from the end of 2021 until now, this group of highflyers, believe it or not, is still down -3.14% on average, despite an
incredible 2023.
I like to call this phenomenon “market myopia.” Investors tend to be optimists, as am I. This makes it so much more comforting to forget the “tough beginnings” when
you’d rather remember the “fantastic finishes.” In continuing with the example above, unless you were an investor with prescient foresight, you likely didn’t sell all your MT. FAANNG stocks on January 4, 2022, as the market started its
correction, and you probably didn’t then buy them all back on September 30, 2022, when the market hit its low. An average investor’s experience would be much different than that. Which brings me to the point of all this: what are some
elements of our investment philosophy here at Hennessy Funds?
First, what about timing the market? Simply put, we don’t do it. As Neil Hennessy, our Chief Market Strategist and long-tenured Portfolio Manager, aptly put it, “It’s
not about timing the market, but rather about time in the market.” The long-term annualized return of the market, as measured by the Dow Jones Industrial
Average going back 104 years to 1920, is about 9.6%, and that number would be closer to 7-8% on a real return basis when factoring in inflation. If an investor is poorly timing when to enter and when to exit the market, it would be very
difficult to achieve similar, attractive returns to what they would experience simply by staying invested through a complete market cycle.
We are optimistic investors. We understand that some years or months may be tougher than others, but we tend to think in longer timeframes. An investor solely invested
in the Nasdaq might have looked at their portfolio at the end of 2022 and been extremely disappointed with a -32.51% return. But as Josh Wein, one of our Portfolio Managers with over 25 years of experience, pointed out, “2022 was what
8% real returns look like.” In other words, with the year prior (2021) providing a +22.21% return and the year after (2023) hitting a +31.21% return, 2022’s dismal performance of -32.51% created an annualized total return for the Nasdaq
of 8.22% over the entire period (December 31, 2020, to November 7, 2023). Josh simply observed that while corrections happen over the course of a market cycle, it’s best not to panic by selling when stocks are hitting new lows.
_______________
|
(1)
|
The acronym, MT. FAANNG, refers to the following companies: Microsoft Corporation, Tesla, Inc., Meta Platforms, Inc., Amazon.com, Inc., Apple, Inc., Netflix, Inc., NVIDIA Corporation, and Alphabet,
Inc.
|
|
WWW.HENNESSYFUNDS.COM
|
2
|
LETTER TO SHAREHOLDERS
|
Downside risk mitigation is relevant. While we normally remain fully invested within our individual funds, we seek to reduce risk through other means, including sector
diversification and investing in companies that exhibit strong fundamentals at compelling valuations. Dave Ellison, the long-tenured Portfolio Manager of our two financial funds, consistently reminds us, “Losing less money in difficult
markets is more important than making the most in rising ones.”
Finally, we are investors in companies, not traders of stocks. Many of our portfolios hold certain positions for long periods of time, a demonstration of the Portfolio
Managers’ convictions. In fact, both the Hennessy Focus Fund and the Hennessy Large Cap Financial Fund have held some positions for 25 years or more. We recognize that much of the performance of the Hennessy Funds comes from the actual
stocks we own (stock selection) and not from our weightings within certain sectors (sector allocation). Moving in and out of sectors can enhance performance, but it can also hinder it in the same way as market timing, and it takes a
significant number of correct “calls” regarding the macro-environment. We’d rather invest long term than rely on lucky calls. Our highly experienced energy funds Portfolio Manager, Ben Cook, summed up our philosophy on the macro
environment nicely: “While macro-economic trends help to inform our investment process, ultimately it’s the individual stocks with solid fundamentals and attractive valuations that, over time, drive positive risk-adjusted returns for
our funds.”
We are long term investors, staying ever mindful of downside risk while striving to participate in the upside, with each individual fund having its own objective,
process, portfolio construction, and investment criteria.
The stock market has once again seen dramatic differences in stock performance. For our fiscal year ended October 31, 2023, all three broad-based indexes were positive,
although with a large dispersion of total returns, with the Dow Jones Industrial Average up 3.17%, the S&P 500® Index up 10.14%, and the Nasdaq
Composite Index up 17.99%. During our fiscal year, large caps significantly outperformed mid caps and small caps, and growth substantially outperformed value. Large-cap tech once again pushed the overall broader market higher, as
evidenced by the Nasdaq-100 Index posting a return of 27.45%. From a sector point of view, besides Technology, the only other sector with outsized (greater than 10%) returns was Communication Services, while six of the 11 GICS sectors
of the S&P 500® Index were negative.
Similar to the overall market, our funds experienced mixed results. Many of our funds exhibit more value-oriented characteristics and, given that value underperformed
growth this year by a significant amount, that negatively affected our relative performance. In addition, three of our funds are sector-specific funds that were invested in underperforming sectors, while six more are focused on small-
and mid-cap stocks in a time period when large caps substantially outperformed. Ten of our 16 mutual funds and our exchange-traded-fund (ETF) posted positive returns for the fiscal year ended October 31, 2023.
Several factors caused this disparity of returns in the market: interest rates and inflation being two of the most important. With the Federal Reserve pausing interest
rate hikes and inflation numbers subsiding, the market reacted positively once it became more apparent that we were not heading into a recession. Consumer demand also remained strong, and unemployment numbers remained historically low.
We believe that the outlook for U.S. stocks remains positive, primarily as we believe that the Federal Reserve may be done, or close to done, raising interest rates.
Inflation has shown signs of easing, creating a better environment for consumers as well as businesses. The unemployment rate remains near record lows, there are elevated levels of cash on the
|
HENNESSY FUNDS
|
1-800-966-4354
|
3
balance sheets of U.S. companies and in the pockets of many consumers and investors, and there is the prospect of a more dovish Federal Reserve heading into 2024. However, we are cautiously watching certain
parts of the economy for any hints of weakness, including consumer spending and credit issues. While volatility and uncertainty may impact the markets, we encourage investors to stay the course, maintain a diversified portfolio, and
keep a long-term perspective.
We thank you for your continued interest in our Funds and are grateful that you have chosen to invest with us. If you have any questions or would like to speak with us
directly, please call us at (800) 966-4354.
Best regards,
| |
|
|
|
|
Ryan C. Kelley, CFA
|
|
|
Chief Investment Officer,
|
|
|
Senior Vice President, and Portfolio Manager
|
Past performance does not guarantee future results.
Mutual fund investing involves risk. Principal loss is possible.
Opinions expressed are those of Ryan C. Kelley and are subject to change, are not guaranteed, and should not be considered investment advice.
The Dow Jones Industrial Average and S&P 500® Index are commonly used to measure the performance of U.S. stocks. The Nasdaq
Composite Index comprises all common stocks listed on The Nasdaq Stock Market and is commonly used to measure the performance of technology-related stocks. The Nasdaq-100 Index includes 100 of the largest domestic and international
non-financial companies listed on The NASDAQ Stock Market based on market capitalization. The indices are used herein for comparative purposes in accordance with SEC regulations. One cannot invest directly in an index. All returns are
shown on a total return basis.
|
WWW.HENNESSYFUNDS.COM
|
4
|
LETTER TO SHAREHOLDERS
|
(This Page Intentionally Left Blank.)
|
HENNESSY FUNDS
|
1-800-966-4354
|
5
Performance Overview (Unaudited)
CHANGE IN VALUE OF $10,000 INVESTMENT
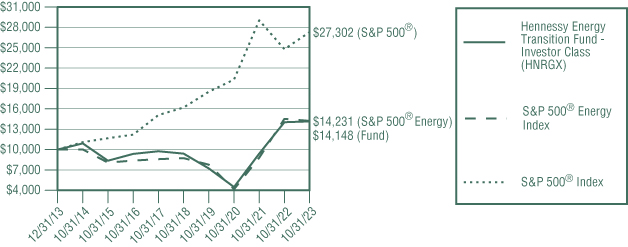
This graph illustrates the performance of an initial investment of $10,000 made in the Fund on its inception date and assumes the reinvestment of dividends and capital gains.
AVERAGE ANNUAL TOTAL RETURN FOR PERIODS ENDED OCTOBER 31, 2023
|
One
|
Five
|
Since Inception
|
|
|
Year
|
Years
|
(12/31/13)
|
|
|
Hennessy Energy Transition Fund –
|
|||
|
Investor Class (HNRGX)
|
0.81%
|
8.50%
|
3.59%
|
|
Hennessy Energy Transition Fund –
|
|||
|
Institutional Class (HNRIX)
|
1.14%
|
8.82%
|
3.87%
|
|
S&P 500® Energy Index
|
-2.03%
|
10.23%
|
3.65%
|
|
S&P 500® Index
|
10.14%
|
11.01%
|
10.75%
|
|
Expense ratios:
|
Gross 2.42%, Net 2.25%(1) (Investor Class);
|
|
Gross 2.09%, Net 1.92%(1) (Institutional Class)
|
|
(1)
|
Certain service provider expenses will be voluntarily waived through July 31, 2025, at which time the arrangement will automatically terminate. In addition, the arrangement will not apply at any time
the Fund’s net assets exceed $125 million.
|
Performance data quoted represents past performance; past performance does not guarantee future results. The investment return and principal value of an investment will fluctuate so that an
investor’s shares, when redeemed, may be worth more or less than their original cost. The performance table does not reflect the deduction of taxes that a shareholder would pay on Fund distributions or the redemption of Fund shares.
Current performance of the Fund may be lower or higher than the performance quoted. Performance data current to the most recent month end may be obtained by visiting www.hennessyfunds.com. Performance for periods including or prior to
October 26, 2018, is that of the BP Capital TwinLine Energy Fund.
The S&P 500® Energy Index comprises those companies included in the S&P 500® that are classified in the Energy sector. The S&P 500® Index is a capitalization-weighted index that is
designed to represent the broad domestic economy through changes in the aggregate market value of 500 stocks across all major industries. One cannot invest directly in an index. These indices are used for comparative purposes in
accordance with Securities and Exchange Commission regulations.
|
WWW.HENNESSYFUNDS.COM
|
6
|
PERFORMANCE OVERVIEW
|
Standard & Poor’s Financial Services is the source and owner of the S&P® and S&P 500® trademarks.
The expense ratios presented are from the most recent prospectus. The expense ratios for the current reporting period are available in the Financial Highlights section of this report.
PERFORMANCE NARRATIVE
Portfolio Managers Ben Cook, CFA, and L. Joshua Wein, CAIA
Performance:
For the one-year period ended October 31, 2023, the Investor Class of the Hennessy Energy Transition Fund returned 0.81%, outperforming the S&P 500® Energy Index (the Fund’s primary benchmark), which returned -2.03%, and underperforming the S&P 500® Index, which
returned 10.14%, for the same period.
Relative energy equity performance during the period generally tracked the influence of energy commodity prices, favoring hydrocarbon energy equities that outperformed the renewable energy
equity category which, by contrast, was challenged by rising capital costs, evolving regulatory frameworks, and lengthening permitting periods.
As in the prior period, hydrocarbon company investment merit remained relatively attractive, benefiting from a combination of favorable commodity fundamentals, desirable valuation, and
shareholder friendly corporate governance. Risks to global energy supplies remained a key driver of energy commodity performance as continued pressure to Russian exports and the Israel-Hamas conflict late in the period provided a
reminder that any disruption to global supplies could trigger significant upside to both crude oil and natural gas pricing. Throughout the period, Fund exposure to hydrocarbon-oriented equities remained elevated relative to historical
averages.
Portfolio Strategy:
The Fund seeks to invest in companies across the energy value chain, including both hydrocarbons and renewable energy sources. This investible universe includes crude oil and natural gas exploration and
production companies, oilfield service providers, midstream companies, refiners, and energy end users. The renewable energy value chain comprises materials producers, machinery and equipment manufacturers, service providers, and
utilities. We believe the inclusion of energy end users, such as industrials and transportation companies, differentiates the Fund from traditional energy funds that do not include such companies. We believe including such companies in
the investment universe enables the Fund to hold a broader range of energy-related themes and provides greater flexibility to adjust sub-sector weightings based on our investment outlook. The Fund typically owns 25 to 40 securities and
historically has had little overlap with the top holdings of commonly used energy and commodity equity benchmarks.
Investment Commentary:
Energy commodity prices softened during the first half of the one-year period ended October 31, 2023, as energy commodity demand tracked an uneven pace of global economic activity hindered by China’s sluggish
post-pandemic expansion. Tightening monetary policy in the U.S. and abroad added to fears of weakening demand, while at the same time, energy commodity supplies proved to be ample despite Russian embargo related supply loss and
persistent underinvestment in industry productive capacity. During the period, the Biden administration continued to supplement domestic crude oil supplies with the gradual release of approximately 50 million barrels of crude oil from
the U.S. Strategic Petroleum Reserve.
|
HENNESSY FUNDS
|
1-800-966-4354
|
7
Recognizing risks to demand, the OPEC+ quota alliance moved to balance the global crude oil market by implementing several output cuts during the period. A sizeable, surprise OPEC+ volume
cut of over 1 million barrels per day (mmbbls/d) was announced in April 2023, which was then followed by a surprise unilateral Saudi cut of an additional 1 mmbbls/d, announced in June 2023. By period end, OPEC+’s quota alliance had
diminished output by over 2 mmbbls/d, sending global supply levels below that of demand, which in turn triggered meaningful draws in global inventories. The Saudi led defense of crude oil market fundamentals brought support to global
crude oil pricing, with NYMEX WTI crude oil rising from the $70 per barrel level mid period to the mid-$80 per barrel level by period end. For the 12-month period ended October 31, 2023, NYMEX WTI crude oil prices were little changed
from period beginning to end, falling $5.51 per barrel from $86.53 per barrel on October 31, 2022, to $81.02 per barrel on October 31, 2023, which was slightly above the period average price of $78.57 per barrel.
Global natural gas market fundamentals softened meaningfully during the period as Russian export volume loss was offset by a combination of factors that ultimately spared European markets
from a potentially disastrous wintertime supply shortfall. These factors included above average winter temperatures, price related demand destruction, and the rerouting of significant liquified natural gas (LNG) cargo volume into
European markets. With the onset of reduced northern hemisphere heating demand during the spring and summer, European natural gas storage operators were able to increase natural gas storage levels to near full capacity by period end,
materially reducing the risk of shortages in the coming winter. By period end, adequate U.S and European inventories as well as loosening global LNG markets allowed global natural gas prices to remain well below peak pricing early in
the period. In the U.S, NYMEX Henry Hub natural gas prices declined meaningfully, dropping $2.78 per thousand cubic feet (mcf), from the period starting price of $6.355 per mcf to $3.575 per mcf at period end.
While the global macro outlook remains clouded given the headwinds associated with tightening monetary conditions and an uneven pace of economic growth, we believe the investment merit
inherent in U.S. energy equities remains favorable for a variety of reasons. Relatively tight commodity fundamentals, rising demand for U.S. energy exports, a defensive posture with respect to inflation, and current attractive
valuations all contribute to the sector’s appeal.
On a global basis, crude oil inventories remain well below historical norms, as years of underinvestment in industry capacity and only modest gains in production volume have proven
insufficient to fully satisfy rising consumption and inventory replenishment needs. As a consequence, commodity prices are likely to remain elevated and provide U.S. upstream companies with incentive to develop the resources required to
meet rising demand in the U.S and abroad. Existing and projected export capacity expansion in the U.S. should allow for export volume growth through the end of the decade. The continued pressure to Russian export volumes underscores the
importance of energy security, reliability, and affordability, which are all qualities that likely will increase the appeal of U.S. energy resources. As one of the few sectors offering the potential for strong returns and cash flows
that are generally positively correlated with rising price levels, hydrocarbon-oriented equities provide a logical hedge in an inflationary environment. Inflation protection coupled with attractive valuation relative to historical norms
combine to offer unique appeal in the current environment.
As the world pursues greenhouse gas emission reduction targets, we believe policy and technology, as well as consumer and investor preference, will continue to drive change in the world’s
primary fuel mix. However, we expect that critical impediments in the form of
|
WWW.HENNESSYFUNDS.COM
|
8
|
PERFORMANCE OVERVIEW
|
policy gaps, reliability issues, and simple cost disadvantages, as well as geo-political disruption, will continue to hamper the pace of the transition toward renewables, and we see these drivers prolonging
the dependence upon hydrocarbons. Beyond these longer-term challenges, the rise in funding costs, restrictive policy requirements, and permitting delays have emerged as more recent impediments to the pace of renewable capacity
expansion, particularly in the wind-power segment. Given the challenges to renewable power expansion, we envision a landscape that reflects the coexistence and need for diversity in energy supply, inclusive of both hydrocarbons and
renewables, which should provide investment opportunity for investors for decades to come.
_______________
Opinions expressed are those of the Portfolio Managers as of the date written and are subject to change, are not guaranteed, and should not be considered investment advice or an indication of trading intent.
The Fund invests in small-capitalization and medium-capitalization companies, which may have more limited liquidity and greater volatility than larger companies. Funds that concentrate in a
single sector may be subject to a higher degree of risk. Energy-related companies are subject to specific risks, including fluctuations in commodity prices and consumer demand, substantial government regulation, and depletion of
reserves. Investments in lower-rated and non-rated securities present a greater risk of loss to principal and interest than higher-rated securities. Use of derivatives can increase the volatility of the Fund.
Master limited partnerships (MLPs) and MLP investments have unique characteristics. The Fund does not receive the same tax benefits as a direct investment in an MLP.
The prices of MLP units may fluctuate abruptly and trading volume may be low, making it difficult for the Fund to sell its units at a favorable price. MLP general partners have the power to
take actions that adversely affect the interests of unit holders. Most MLPs do not pay U.S. federal income tax at the partnership level, but an adverse change in tax laws could result in MLPs being treated as corporations for federal
income tax purposes, which could reduce or eliminate distributions paid by MLPs to the Fund. If the Fund’s MLP investments exceed 25% of its assets, the Fund may not qualify for treatment as a regulated investment company under the
Internal Revenue Code. The Fund would be taxed as an ordinary corporation, which could substantially reduce the Fund’s net assets and its distributions to shareholders. Please see the Fund’s prospectus for a more complete discussion of
these and other risks.
References to specific securities should not be considered a recommendation to buy or sell any security. Fund holdings and sector allocations are subject to change. Please refer to the Schedule of Investments
included in this report for additional portfolio information.
Cash flow refers to the net amount of cash and cash equivalents transferred into and out of a company.
|
HENNESSY FUNDS
|
1-800-966-4354
|
9
Financial Statements
|
Schedule of Investments as of October 31,
2023
|
HENNESSY ENERGY TRANSITION FUND
(% of Total Assets)
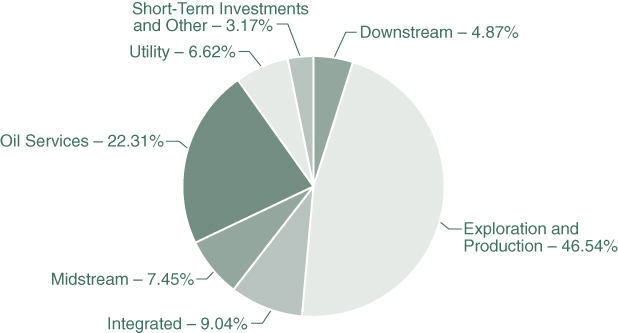
|
TOP TEN HOLDINGS (EXCLUDING MONEY MARKET FUNDS)
|
% TOTAL ASSETS
|
|
Canadian Natural Resources Ltd.
|
5.53%
|
|
Cheniere Energy, Inc.
|
5.45%
|
|
Pioneer Natural Resources Co.
|
5.20%
|
|
EOG Resources, Inc.
|
4.95%
|
|
Antero Resources Corp.
|
4.88%
|
|
Diamondback Energy, Inc.
|
4.80%
|
|
ConocoPhillips
|
4.79%
|
|
Suncor Energy, Inc.
|
4.71%
|
|
EQT Corp.
|
4.68%
|
|
Exxon Mobile Corp.
|
4.66%
|
Note: The Fund concentrates its investments in the Energy industry. For presentation purposes, the Fund uses custom categories.
|
WWW.HENNESSYFUNDS.COM
|
10
|
SCHEDULE OF INVESTMENTS
|
|
COMMON STOCKS – 95.13%
|
Number
|
% of
|
||||||||||
|
|
of Shares
|
Value
|
Net Assets
|
|||||||||
|
Downstream – 4.88%
|
||||||||||||
|
Phillips 66
|
4,000
|
$
|
456,280
|
2.24
|
%
|
|||||||
|
Valero Energy Corp.
|
4,250
|
539,750
|
2.64
|
%
|
||||||||
|
|
996,030
|
4.88
|
%
|
|||||||||
|
Exploration & Production – 46.68%
|
||||||||||||
|
Antero Resources Corp. (a)
|
33,900
|
998,016
|
4.89
|
%
|
||||||||
|
Canadian Natural Resources Ltd.
|
17,800
|
1,130,834
|
5.54
|
%
|
||||||||
|
Comstock Resources, Inc.
|
47,000
|
592,200
|
2.90
|
%
|
||||||||
|
ConocoPhillips
|
8,245
|
979,506
|
4.80
|
%
|
||||||||
|
Diamondback Energy, Inc.
|
6,120
|
981,158
|
4.81
|
%
|
||||||||
|
EOG Resources, Inc.
|
8,030
|
1,013,788
|
4.97
|
%
|
||||||||
|
EQT Corp.
|
22,600
|
957,788
|
4.70
|
%
|
||||||||
|
Marathon Oil Corp.
|
30,800
|
841,148
|
4.12
|
%
|
||||||||
|
Pioneer Natural Resources Co.
|
4,450
|
1,063,550
|
5.22
|
%
|
||||||||
|
Suncor Energy, Inc.
|
29,760
|
964,224
|
4.73
|
%
|
||||||||
|
|
9,522,212
|
46.68
|
%
|
|||||||||
|
Integrated – 9.07%
|
||||||||||||
|
Chevron Corp.
|
6,157
|
897,260
|
4.40
|
%
|
||||||||
|
Exxon Mobil Corp.
|
9,000
|
952,650
|
4.67
|
%
|
||||||||
|
|
1,849,910
|
9.07
|
%
|
|||||||||
|
Midstream – 5.47%
|
||||||||||||
|
Cheniere Energy, Inc.
|
6,700
|
1,115,014
|
5.47
|
%
|
||||||||
|
Oil Services – 22.39%
|
||||||||||||
|
Halliburton Co.
|
21,650
|
851,711
|
4.18
|
%
|
||||||||
|
NOV, Inc.
|
19,500
|
389,220
|
1.91
|
%
|
||||||||
|
Schlumberger Ltd.
|
16,810
|
935,644
|
4.59
|
%
|
||||||||
|
Solaris Oilfield Infrastructure, Inc.
|
87,920
|
812,381
|
3.98
|
%
|
||||||||
|
TechnipFMC PLC
|
36,840
|
792,797
|
3.89
|
%
|
||||||||
|
Tenaris SA – ADR
|
25,000
|
783,000
|
3.84
|
%
|
||||||||
|
|
4,564,753
|
22.39
|
%
|
|||||||||
|
Utility – 6.64%
|
||||||||||||
|
Freeport-McMoRan, Inc.
|
18,420
|
622,227
|
3.05
|
%
|
||||||||
|
NextEra Energy, Inc.
|
12,570
|
732,831
|
3.59
|
%
|
||||||||
|
|
1,355,058
|
6.64
|
%
|
|||||||||
|
|
||||||||||||
|
Total Common Stocks
|
||||||||||||
|
(Cost $13,254,787)
|
19,402,977
|
95.13
|
%
|
|||||||||
The accompanying notes are an integral part of these financial statements.
|
HENNESSY FUNDS
|
1-800-966-4354
|
11
|
PARTNERSHIPS & TRUSTS – 2.01%
|
Number
|
% of
|
||||||||||
|
|
of Shares
|
Value
|
Net Assets
|
|||||||||
|
Midstream – 2.01%
|
||||||||||||
|
Plains All American Pipeline LP
|
27,010
|
$
|
409,201
|
2.01
|
%
|
|||||||
|
|
||||||||||||
|
Total Partnerships & Trusts
|
||||||||||||
|
(Cost $203,624)
|
409,201
|
2.01
|
%
|
|||||||||
|
|
||||||||||||
|
SHORT-TERM INVESTMENTS– 3.08%
|
||||||||||||
|
Money Market Funds – 3.08%
|
||||||||||||
|
First American Treasury Obligations Fund – Class X, 5.275% (b)
|
629,221
|
629,221
|
3.08
|
%
|
||||||||
|
|
||||||||||||
|
Total Short-Term Investments
|
||||||||||||
|
(Cost $629,221)
|
629,221
|
3.08
|
%
|
|||||||||
|
|
||||||||||||
|
Total Investments
|
||||||||||||
|
(Cost $14,087,632) – 100.22%
|
20,441,399
|
100.22
|
%
|
|||||||||
|
Liabilities in Excess of Other Assets – (0.22)%
|
(44,093
|
)
|
(0.22
|
)%
|
||||||||
|
|
||||||||||||
|
TOTAL NET ASSETS – 100.00%
|
$
|
20,397,306
|
100.00
|
%
|
||||||||
Percentages are stated as a percent of net assets.
ADR – American Depositary Receipt
PLC – Public Limited Company
|
(a)
|
Non-income producing security.
|
|
(b)
|
The rate listed is the fund’s seven-day yield as of October 31, 2023.
|
The accompanying notes are an integral part of these financial statements.
|
WWW.HENNESSYFUNDS.COM
|
12
|
SCHEDULE OF INVESTMENTS
|
Summary of Fair Value Exposure as of October 31, 2023
The following is a summary of the inputs used to value the Fund’s net assets as of October 31, 2023 (see Note 3 in the accompanying Notes to the Financial Statements):
|
Common Stocks
|
Level 1
|
Level 2
|
Level 3
|
Total
|
||||||||||||
|
Downstream
|
$
|
996,030
|
$
|
—
|
$
|
—
|
$
|
996,030
|
||||||||
|
Exploration & Production
|
9,522,212
|
—
|
—
|
9,522,212
|
||||||||||||
|
Integrated
|
1,849,910
|
—
|
—
|
1,849,910
|
||||||||||||
|
Midstream
|
1,115,014
|
—
|
—
|
1,115,014
|
||||||||||||
|
Oil Services
|
4,564,753
|
—
|
—
|
4,564,753
|
||||||||||||
|
Utility
|
1,355,058
|
—
|
—
|
1,355,058
|
||||||||||||
|
Total Common Stocks
|
$
|
19,402,977
|
$
|
—
|
$
|
—
|
$
|
19,402,977
|
||||||||
|
Partnerships & Trusts
|
||||||||||||||||
|
Midstream
|
$
|
409,201
|
$
|
—
|
$
|
—
|
$
|
409,201
|
||||||||
|
Total Partnerships & Trusts
|
$
|
409,201
|
$
|
—
|
$
|
—
|
$
|
409,201
|
||||||||
|
Short-Term Investments
|
||||||||||||||||
|
Money Market Funds
|
$
|
629,221
|
$
|
—
|
$
|
—
|
$
|
629,221
|
||||||||
|
Total Short-Term Investments
|
$
|
629,221
|
$
|
—
|
$
|
—
|
$
|
629,221
|
||||||||
|
Total Investments
|
$
|
20,441,399
|
$
|
—
|
$
|
—
|
$
|
20,441,399
|
||||||||
The accompanying notes are an integral part of these financial statements.
|
HENNESSY FUNDS
|
1-800-966-4354
|
13
Financial Statements
|
Statement of Assets and Liabilities as of October 31, 2023
|
|
ASSETS:
|
||||
|
Investments in securities, at value (cost $14,087,632)
|
$
|
20,441,399
|
||
|
Dividends and interest receivable
|
4,240
|
|||
|
Receivable for fund shares sold
|
597
|
|||
|
Return of capital receivable
|
7,225
|
|||
|
Prepaid expenses and other assets
|
8,481
|
|||
|
Total assets
|
20,461,942
|
|||
|
LIABILITIES:
|
||||
|
Payable for fund shares redeemed
|
4,649
|
|||
|
Payable to advisor
|
21,965
|
|||
|
Payable to auditor
|
23,401
|
|||
|
Accrued distribution fees
|
2,041
|
|||
|
Accrued service fees
|
759
|
|||
|
Accrued trustees fees
|
5,496
|
|||
|
Accrued expenses and other payables
|
6,325
|
|||
|
Total liabilities
|
64,636
|
|||
|
NET ASSETS
|
$
|
20,397,306
|
||
|
NET ASSETS CONSISTS OF:
|
||||
|
Capital stock
|
$
|
53,216,583
|
||
|
Accumulated deficit
|
(32,819,277
|
)
|
||
|
Total net assets
|
$
|
20,397,306
|
||
|
NET ASSETS:
|
||||
|
Investor Class
|
||||
|
Shares authorized (no par value)
|
Unlimited
|
|||
|
Net assets applicable to outstanding shares
|
$
|
8,964,410
|
||
|
Shares issued and outstanding
|
370,173
|
|||
|
Net asset value, offering price, and redemption price per share
|
$
|
24.22
|
||
|
Institutional Class
|
||||
|
Shares authorized (no par value)
|
Unlimited
|
|||
|
Net assets applicable to outstanding shares
|
$
|
11,432,896
|
||
|
Shares issued and outstanding
|
463,200
|
|||
|
Net asset value, offering price, and redemption price per share
|
$
|
24.68
|
||
The accompanying notes are an integral part of these financial statements.
|
WWW.HENNESSYFUNDS.COM
|
14
|
STATEMENT OF ASSETS AND LIABILITIES/STATEMENT OF OPERATIONS
|
Financial Statements
|
Statement of Operations for the year ended October 31, 2023
|
|
INVESTMENT INCOME:
|
||||
|
Distributions received from master limited partnerships
|
$
|
51,371
|
||
|
Return of capital on distributions received
|
(51,371
|
)
|
||
|
Dividend income from common stock(1)
|
608,225
|
|||
|
Interest income
|
10,649
|
|||
|
Total investment income
|
618,874
|
|||
|
EXPENSES:
|
||||
|
Investment advisory fees (See Note 5)
|
257,907
|
|||
|
Federal and state registration fees
|
31,654
|
|||
|
Sub-transfer agent expenses – Investor Class (See Note 5)
|
18,518
|
|||
|
Sub-transfer agent expenses – Institutional Class (See Note 5)
|
13,062
|
|||
|
Administration, accounting, custody, and transfer agent fees (See Note 5)
|
30,885
|
|||
|
Audit fees
|
23,396
|
|||
|
Compliance expense (See Note 5)
|
22,664
|
|||
|
Trustees’ fees and expenses
|
19,978
|
|||
|
Distribution fees – Investor Class (See Note 5)
|
13,607
|
|||
|
Reports to shareholders
|
9,670
|
|||
|
Service fees – Investor Class (See Note 5)
|
9,071
|
|||
|
Interest expense (See Note 7)
|
1,468
|
|||
|
Legal fees
|
920
|
|||
|
Other expenses
|
6,662
|
|||
|
Total expenses before waiver
|
459,462
|
|||
|
Service provider expense waiver (See Note 5)
|
(30,885
|
)
|
||
|
Net expenses
|
428,577
|
|||
|
NET INVESTMENT INCOME
|
$
|
190,297
|
||
|
REALIZED AND UNREALIZED GAINS (LOSSES):
|
||||
|
Net realized gain on investments
|
$
|
1,977,506
|
||
|
Net change in unrealized appreciation/depreciation on investments
|
(2,314,370
|
)
|
||
|
Net loss on investments
|
(336,864
|
)
|
||
|
NET DECREASE IN NET ASSETS RESULTING FROM OPERATIONS
|
$
|
(146,567
|
)
|
|
|
(1)
|
Net of foreign taxes withheld of $12,817.
|
The accompanying notes are an integral part of these financial statements.
|
HENNESSY FUNDS
|
1-800-966-4354
|
15
(This Page Intentionally Left Blank.)
|
WWW.HENNESSYFUNDS.COM
|
16
|
STATEMENTS OF CHANGES IN NET ASSETS
|
Financial Statements
|
Statements of Changes in Net Assets
|
|
Year Ended
|
Year Ended
|
|||||||
|
October 31, 2023
|
October 31, 2022
|
|||||||
|
OPERATIONS:
|
||||||||
|
Net investment income
|
$
|
190,297
|
$
|
203,796
|
||||
|
Net realized gain on investments
|
1,977,506
|
1,336,639
|
||||||
|
Net change in unrealized
|
||||||||
|
appreciation/depreciation on investments
|
(2,314,370
|
)
|
6,207,910
|
|||||
|
Net increase (decrease) in
|
||||||||
|
net assets resulting from operations
|
(146,567
|
)
|
7,748,345
|
|||||
|
DISTRIBUTIONS TO SHAREHOLDERS:
|
||||||||
|
Distributable earnings – Investor Class
|
(51,574
|
)
|
(751,147
|
)
|
||||
|
Distributable earnings – Institutional Class
|
(87,195
|
)
|
(1,188,176
|
)
|
||||
|
Total distributions
|
(138,769
|
)
|
(1,939,323
|
)
|
||||
|
CAPITAL SHARE TRANSACTIONS:
|
||||||||
|
Proceeds from shares subscribed – Investor Class
|
3,946,163
|
8,234,369
|
||||||
|
Proceeds from shares subscribed – Institutional Class
|
2,359,407
|
6,681,659
|
||||||
|
Dividends reinvested – Investor Class
|
47,756
|
698,292
|
||||||
|
Dividends reinvested – Institutional Class
|
86,765
|
1,181,355
|
||||||
|
Cost of shares redeemed – Investor Class
|
(5,037,219
|
)
|
(7,622,351
|
)
|
||||
|
Cost of shares redeemed – Institutional Class
|
(4,259,986
|
)
|
(7,693,364
|
)
|
||||
|
Net increase (decrease) in net assets derived
|
||||||||
|
from capital share transactions
|
(2,857,114
|
)
|
1,479,960
|
|||||
|
TOTAL INCREASE (DECREASE) IN NET ASSETS
|
(3,142,450
|
)
|
7,288,982
|
|||||
|
NET ASSETS:
|
||||||||
|
Beginning of year
|
23,539,756
|
16,250,774
|
||||||
|
End of year
|
$
|
20,397,306
|
$
|
23,539,756
|
||||
|
CHANGES IN SHARES OUTSTANDING:
|
||||||||
|
Shares sold – Investor Class
|
166,878
|
394,224
|
||||||
|
Shares sold – Institutional Class
|
100,869
|
331,064
|
||||||
|
Shares issued to holders as reinvestment
|
||||||||
|
of dividends – Investor Class
|
2,122
|
44,449
|
||||||
|
Shares issued to holders as reinvestment
|
||||||||
|
of dividends – Institutional Class
|
3,794
|
74,066
|
||||||
|
Shares redeemed – Investor Class
|
(221,723
|
)
|
(387,313
|
)
|
||||
|
Shares redeemed – Institutional Class
|
(183,343
|
)
|
(371,343
|
)
|
||||
|
Net increase (decrease) in shares outstanding
|
(131,403
|
)
|
85,147
|
|||||
The accompanying notes are an integral part of these financial statements.
|
HENNESSY FUNDS
|
1-800-966-4354
|
17
Financial Statements
|
Financial Highlights
|
For an Investor Class share outstanding throughout each year
PER SHARE DATA:
Net asset value, beginning of year
Income from investment operations:
Net investment income (loss)(1)
Net realized and unrealized gains (losses) on investments
Total from investment operations
Less distributions:
Dividends from net investment income
Total distributions
Net asset value, end of year
TOTAL RETURN
SUPPLEMENTAL DATA AND RATIOS:
Net assets, end of year (millions)
Ratio of expenses to average net assets:
Before expense reimbursement
After expense reimbursement
Ratio of net investment income (loss) to average net assets:
Before expense reimbursement
After expense reimbursement
Portfolio turnover rate(4)
|
(1)
|
Calculated using the average shares outstanding method.
|
|
(2)
|
The Fund had an expense limitation agreement in place through October 25, 2020.
|
|
(3)
|
Certain service provider expenses were voluntarily waived during the fiscal year.
|
|
(4)
|
Calculated on the basis of the Fund as a whole.
|
The accompanying notes are an integral part of these financial statements.
|
WWW.HENNESSYFUNDS.COM
|
18
|
FINANCIAL HIGHLIGHTS — INVESTOR CLASS
|
|
Year Ended October 31,
|
||||||||||||||||||
|
2023
|
2022
|
2021
|
2020
|
2019
|
||||||||||||||
|
$
|
24.15
|
$
|
18.31
|
$
|
8.74
|
$
|
14.08
|
$
|
18.32
|
|||||||||
|
0.17
|
0.16
|
0.06
|
0.04
|
(0.07
|
)
|
|||||||||||||
|
0.02
|
7.74
|
9.51
|
(5.38
|
)
|
(4.17
|
)
|
||||||||||||
|
0.19
|
7.90
|
9.57
|
(5.34
|
)
|
(4.24
|
)
|
||||||||||||
|
(0.12
|
)
|
(2.06
|
)
|
—
|
—
|
—
|
||||||||||||
|
(0.12
|
)
|
(2.06
|
)
|
—
|
—
|
—
|
||||||||||||
|
$
|
24.22
|
$
|
24.15
|
$
|
18.31
|
$
|
8.74
|
$
|
14.08
|
|||||||||
|
0.81
|
%
|
49.24
|
%
|
109.50
|
%
|
-37.93
|
%
|
-23.14
|
%
|
|||||||||
|
$
|
8.96
|
$
|
10.21
|
$
|
6.80
|
$
|
2.50
|
$
|
6.83
|
|||||||||
|
2.42
|
%
|
2.42
|
%
|
2.96
|
%
|
2.59
|
%
|
1.97
|
%
|
|||||||||
|
2.27
|
%(3)
|
2.25
|
%(3)
|
2.74
|
%(3)
|
2.03
|
%(2)(3)
|
1.97
|
%
|
|||||||||
|
0.59
|
%
|
0.64
|
%
|
0.16
|
%
|
(0.18
|
)%
|
(0.46
|
)%
|
|||||||||
|
0.74
|
%
|
0.81
|
%
|
0.38
|
%
|
0.38
|
%
|
(0.46
|
)%
|
|||||||||
|
28
|
%
|
31
|
%
|
74
|
%
|
73
|
%
|
87
|
%
|
|||||||||
The accompanying notes are an integral part of these financial statements.
|
HENNESSY FUNDS
|
1-800-966-4354
|
19
Financial Statements
|
Financial Highlights
|
For an Institutional Class share outstanding throughout each year
PER SHARE DATA:
Net asset value, beginning of year
Income from investment operations:
Net investment income (loss)(1)
Net realized and unrealized gains (losses) on investments
Total from investment operations
Less distributions:
Dividends from net investment income
Total distributions
Net asset value, end of year
TOTAL RETURN
SUPPLEMENTAL DATA AND RATIOS:
Net assets, end of year (millions)
Ratio of expenses to average net assets:
Before expense reimbursement
After expense reimbursement
Ratio of net investment income (loss) to average net assets:
Before expense reimbursement
After expense reimbursement
Portfolio turnover rate(4)
|
(1)
|
Calculated using the average shares outstanding method.
|
|
(2)
|
The Fund had an expense limitation agreement in place through October 25, 2020.
|
|
(3)
|
Certain service provider expenses were voluntarily waived during the fiscal year.
|
|
(4)
|
Calculated on the basis of the Fund as a whole.
|
The accompanying notes are an integral part of these financial statements.
|
WWW.HENNESSYFUNDS.COM
|
20
|
FINANCIAL HIGHLIGHTS — INSTITUTIONAL CLASS
|
|
Year Ended October 31,
|
||||||||||||||||||
|
2023
|
2022
|
2021
|
2020
|
2019
|
||||||||||||||
|
$
|
24.59
|
$
|
18.60
|
$
|
8.85
|
$
|
14.26
|
$
|
18.50
|
|||||||||
|
0.25
|
0.23
|
0.07
|
0.12
|
(0.02
|
)
|
|||||||||||||
|
0.02
|
7.87
|
9.68
|
(5.50
|
)
|
(4.22
|
)
|
||||||||||||
|
0.27
|
8.10
|
9.75
|
(5.38
|
)
|
(4.24
|
)
|
||||||||||||
|
(0.18
|
)
|
(2.11
|
)
|
—
|
(0.03
|
)
|
—
|
|||||||||||
|
(0.18
|
)
|
(2.11
|
)
|
—
|
(0.03
|
)
|
—
|
|||||||||||
|
$
|
24.68
|
$
|
24.59
|
$
|
18.60
|
$
|
8.85
|
$
|
14.26
|
|||||||||
|
1.14
|
%
|
49.71
|
%
|
110.17
|
%
|
-37.80
|
%
|
-22.92
|
%
|
|||||||||
|
$
|
11.43
|
$
|
13.33
|
$
|
9.45
|
$
|
3.82
|
$
|
44.37
|
|||||||||
|
2.08
|
%
|
2.09
|
%
|
2.61
|
%
|
2.01
|
%
|
1.66
|
%
|
|||||||||
|
1.93
|
%(3)
|
1.92
|
%(3)
|
2.39
|
%(3)
|
1.77
|
%(2)(3)
|
1.66
|
%
|
|||||||||
|
0.92
|
%
|
0.96
|
%
|
0.22
|
%
|
0.79
|
%
|
(0.12
|
)%
|
|||||||||
|
1.07
|
%
|
1.13
|
%
|
0.44
|
%
|
1.03
|
%
|
(0.12
|
)%
|
|||||||||
|
28
|
%
|
31
|
%
|
74
|
%
|
73
|
%
|
87
|
%
|
|||||||||
The accompanying notes are an integral part of these financial statements.
|
HENNESSY FUNDS
|
1-800-966-4354
|
21
Financial Statements
|
Notes to the Financial Statements October 31, 2023
|
1). ORGANIZATION
The Hennessy Energy Transition Fund (the “Fund”) is a series of Hennessy Funds Trust (the “Trust”), which was organized as a Delaware statutory trust on September 17, 1992. The Fund is an open-end management
investment company registered under the Investment Company Act of 1940, as amended. The investment objective of the Fund is to seek total return. The Fund is a diversified fund.
The Fund offers Investor Class and Institutional Class shares. Each class of shares differs principally in its respective 12b-1 distribution and service, shareholder servicing, and
sub-transfer agent expenses. There are no sales charges. Each class has identical rights to earnings, assets, and voting privileges, except for class-specific expenses and exclusive rights to vote on matters affecting only one class.
As an investment company, the Fund follows the investment company accounting and reporting guidance of the Financial Accounting Standards Board (the “FASB”) Accounting Standard Codification
Topic 946 “Financial Services—Investment Companies.”
2). SIGNIFICANT ACCOUNTING POLICIES
The following is a summary of significant accounting policies consistently followed by the Fund in the preparation of the financial statements. These policies conform to U.S. generally accepted accounting
principles (“GAAP”).
|
a).
|
Securities Valuation – All investments in securities are valued in accordance with the Fund’s valuation policies and procedures, as described in Note 3.
|
|
b).
|
Federal Income Taxes – The Fund has elected to be taxed as a regulated investment company and intends to distribute substantially all of its taxable income to its shareholders and otherwise comply with
the provisions of the Internal Revenue Code of 1986, as amended, applicable to regulated investment companies. As a result, the Fund has made no provision for federal income taxes or excise taxes. Net investment income/loss and
realized gains/losses for federal income tax purposes may differ from those reported in the financial statements because of temporary book-basis and tax-basis differences. Temporary differences are primarily the result of the
treatment of wash sales for tax reporting purposes and investments in companies organized as partnerships for tax purposes. The Fund recognizes interest and penalties related to income tax benefits, if any, in the Statement of
Operations as an income tax expense. Distributions from net realized gains for book purposes may include short-term capital gains, which are included as ordinary income to shareholders for tax purposes. The Fund may utilize
equalization accounting for tax purposes and designate earnings and profits, including net realized gains distributed to shareholders on redemption of shares, as part of the dividends paid deduction for income tax purposes.
|
|
Due to inherent differences in the recognition of income, expenses, and realized gains/losses under GAAP and federal income tax
regulations, permanent differences between book and tax basis for reporting are identified and appropriately reclassified in the Statement of Assets and Liabilities, as needed. The adjustments for fiscal year 2023 are as
follows:
|
|
Total
|
|||
|
Distributable
|
|||
|
Earnings
|
Capital Stock
|
||
|
$2,975
|
$(2,975)
|
|
WWW.HENNESSYFUNDS.COM
|
22
|
NOTES TO THE FINANCIAL STATEMENTS
|
|
c).
|
Accounting for Uncertainty in Income Taxes – The Fund has accounting policies regarding recognition and measurement of tax positions taken or expected to be taken on a tax return. The tax returns of
the Fund for the prior three fiscal years are open for examination. The Fund has reviewed all open tax years in major tax jurisdictions and concluded that there is no impact on the Fund’s net assets and no tax liability
resulting from unrecognized tax benefits relating to uncertain income tax positions taken or expected to be taken on a tax return. The Fund’s major tax jurisdictions are U.S. federal and Delaware.
|
|
d).
|
Income and Expenses – Dividend income is recognized on the ex-dividend date or as soon as information is available to the Fund. Interest income, which includes the amortization of premium and accretion
of discount, is recognized on an accrual basis. Market discounts, original issue discounts, and market premiums on debt securities are accreted or amortized to interest income over the life of a security with a corresponding
increase or decrease, as applicable, in the cost basis of such security using the yield-to-maturity method or, where applicable, the first call date of the security. Other non-cash dividends are recognized as investment income
at the fair value of the property received. The Fund is charged for those expenses that are directly attributable to its portfolio, such as advisory, administration, and certain shareholder service fees. Income, expenses (other
than expenses attributable to a specific class), and realized and unrealized gains/losses on investments are allocated to each class of shares based on such class’s net assets. Distributions received from the Fund’s investments
in master limited partnerships (“MLPs”) generally consist of ordinary income, capital gains, and return of capital. The Fund records investment income on the ex-date of the distributions. For financial statement purposes, the
Fund uses return of capital and income estimates to allocate the dividend income received. Such estimates are based on historical information available from the MLPs and other industry sources. These estimates may subsequently
be revised based on information received from the MLPs after their tax reporting periods are concluded, as the actual character of these distributions is not known until after the fiscal year end of the Fund.
|
|
e).
|
Distributions to Shareholders – Dividends from net investment income for the Fund, if any, are declared and paid annually, usually in December. Distributions of net realized capital gains, if any, are
declared and paid annually, usually in December.
|
|
f).
|
Security Transactions – Investment and shareholder transactions are recorded on the trade date. The Fund determines the realized gain/loss from an investment transaction by comparing the original cost
of the security lot sold with the net sale proceeds. Discounts and premiums on securities purchased are accreted or amortized, respectively, over the life of each such security.
|
|
g).
|
Use of Estimates – Preparing financial statements in accordance with GAAP requires management to make estimates and assumptions that affect the reported amounts of assets and liabilities and disclosure
of contingent assets and liabilities at the date of the financial statements, as well as the reported change in net assets during the reporting period. Actual results could differ from those estimates.
|
|
h).
|
Share Valuation – The net asset value (“NAV”) per share of the Fund is calculated by dividing (i) the total value of the securities held by the Fund, plus cash and other assets, minus all liabilities
(including estimated accrued expenses) by (ii) the total number of Fund shares outstanding, rounded to the nearest $0.01. Fund shares are not priced on days the New York Stock Exchange is closed for trading. The offering and
redemption price per share for the Fund is equal to the Fund’s NAV per share.
|
|
HENNESSY FUNDS
|
1-800-966-4354
|
23
|
i).
|
Partnership Accounting Policy – To the extent the Fund receives distributions from underlying partnerships in which it invests, the Fund records its pro rata share of income/loss and capital
gains/losses and accordingly adjusts the cost basis of the underlying partnerships for return of capital.
|
|
j).
|
Illiquid Securities – Pursuant to Rule 22e-4 under the 1940 Act, the Fund has adopted a Liquidity Risk Management Program (the “Liquidity Program”). The Liquidity Program requires, among other things,
that the Fund limit its illiquid investments to no more than 15% of its net assets. An illiquid investment is any investment that the Fund reasonably expects cannot be sold or disposed of by the Fund in current market conditions
in seven calendar days or less without the sale or disposition significantly changing the market value of the investment.
|
|
k).
|
Recent Accounting Pronouncements and Regulatory Updates – In October 2022, the Securities and Exchange Commission (“SEC”) adopted a final rule relating to Tailored Shareholder Reports for Mutual Funds
and Exchange-Traded Funds (ETFs); Fee Information in Investment Company Advertisements. The rule and form amendments will require mutual funds and ETFs to transmit concise and visually engaging shareholder reports that highlight
key information. The amendments also will require that funds tag information in a structured data format. In addition, the rule amendments will require that certain more in-depth information be made available online and
available for delivery free of charge to investors on request. The amendments became effective January 24, 2023. There is an 18-month transition period after the effective date of the amendment.
|
|
In June 2022, the FASB issued Accounting Standards Update (“ASU”) 2022-03, Fair Value Measurement (Topic 820): Fair Value
Measurement of Equity Securities Subject to Contractual Sale Restrictions. The ASU clarifies that a contractual restriction on the sale of an equity security is not considered part of the unit of account of the equity security
and, therefore, is not considered in measuring the fair value. The amendments also require additional disclosures related to equity securities subject to contractual sale restrictions. The ASU is effective for fiscal years
beginning after December 15, 2023, and interim periods within those fiscal years.
|
3). SECURITIES VALUATION
The Fund follows its valuation policies and procedures in determining its NAV and, in preparing these financial statements, the fair value accounting standards that establish an authoritative definition of
fair value and set out a hierarchy for measuring fair value. These standards require additional disclosures about the various inputs and valuation techniques used to develop the measurements of fair value and a discussion of changes in
valuation techniques and related inputs during the period. These inputs are summarized in the three broad levels listed below:
|
Level 1 –
|
Unadjusted, quoted prices in active markets for identical instruments that the Fund has the ability to access at the date of measurement.
|
|
|
Level 2 –
|
Other significant observable inputs other than quoted prices included in Level 1 (including, but not limited to, quoted prices in active markets for similar instruments, quoted prices in markets that
are not active for identical or similar instruments, and model-derived valuations in which all significant inputs and significant value drivers are observable in active markets, such as interest rates, prepayment speeds, credit
risk curves, default rates, and similar data).
|
|
WWW.HENNESSYFUNDS.COM
|
24
|
NOTES TO THE FINANCIAL STATEMENTS
|
|
Level 3 –
|
Significant unobservable inputs (including the Fund’s own assumptions about what market participants would use to price the asset or liability based on the best available information) when observable
inputs are unavailable.
|
The following is a description of the valuation techniques applied to the Fund’s major categories of assets and liabilities on a recurring basis:
|
Equity Securities – Equity securities, including common stocks, preferred stocks, foreign-issued common stocks, exchange-traded funds, closed-end mutual funds,
partnerships, rights, MLPs, and real estate investment trusts, that are traded on a securities exchange for which a last-quoted sales price is readily available generally are valued at the last sales price as reported by the
primary exchange on which the securities are listed. Securities listed on The Nasdaq Stock Market (“Nasdaq”) generally are valued at the Nasdaq Official Closing Price, which may differ from the last sales price reported.
Securities traded on a securities exchange for which a last-quoted sales price is not readily available generally are valued at the mean between the bid and ask prices. To the extent these securities are actively traded and
valuation adjustments are not applied, they are classified in Level 1 of the fair value hierarchy. Securities traded on foreign exchanges generally are not valued at the same time the Fund calculates its NAV because most foreign
markets close well before such time. The earlier close of most foreign markets gives rise to the possibility that significant events, including broad market moves, may have occurred in the interim. In certain circumstances, it
may be determined that a foreign security needs to be fair valued because it appears that the value of the security might have been materially affected by events occurring after the close of the market in which the security is
principally traded, but before the time the Fund calculates its NAV, such as by a development that affects an entire market or region (e.g., a weather-related event) or a potentially global development (e.g., a terrorist attack
that may be expected to have an effect on investor expectations worldwide).
|
|
|
Registered Investment Companies – Investments in open-end registered investment companies, commonly referred to as mutual funds, generally are priced at the
ending NAV provided by the applicable mutual fund’s service agent and are classified in Level 1 of the fair value hierarchy.
|
|
|
Debt Securities – Debt securities, including corporate bonds, asset-backed securities, mortgage-backed securities, municipal bonds, U.S. Treasuries, and U.S.
government agency issues, are generally valued at market on the basis of valuations furnished by an independent pricing service that utilizes both dealer-supplied valuations and formula-based techniques. The pricing service may
consider recently executed transactions in securities of the issuer or comparable issuers, market price quotations (where observable), bond spreads, and fundamental data relating to the issuer. In addition, the model may
incorporate observable market data, such as reported sales of similar securities, broker quotes, yields, bids, offers, and reference data. Certain securities are valued primarily using dealer quotations. These securities are
generally classified in Level 2 of the fair value hierarchy.
|
|
|
Short-Term Securities – Short-term equity investments, including money market funds, are valued in the manner specified above for equity securities. Short-term
debt investments with an original term to maturity of 60 days or less are valued at amortized cost, which approximates fair market value. If the original term to maturity of a short-term debt investment exceeds 60 days, then the
values as of the 61st day prior to maturity are amortized. Amortized cost is not used if its use would
|
|
HENNESSY FUNDS
|
1-800-966-4354
|
25
|
be inappropriate due to credit or other impairments of the issuer, in which case the security’s fair value would be determined as described below. Short-term securities are generally classified in
Level 1 or Level 2 of the fair value hierarchy depending on the inputs used and market activity levels for specific securities.
|
If market quotations are not readily available or if a significant event has occurred that indicates the closing price of a security no longer represents the true value of that security, any
security or other asset will be valued at its fair value in accordance with Rule 2a-5 under the 1940 Act. The Board of Trustees of the Fund (the “Board”) has designated Hennessy Advisors, Inc. (the “Advisor”) as the Fund’s valuation
designee to make all fair value determinations with respect to the Fund’s portfolio investments under the Fund’s fair value pricing procedures, subject to the Board’s oversight. There are numerous criteria considered in determining a
fair value of a security, such as the trading volume of a security and markets, the values of other similar securities, and news events with direct bearing on a security or markets. Fair value pricing results in an estimated price for a
security that reflects the amount the Fund might reasonably expect to receive in a current sale. Depending on the relative significance of the valuation inputs, these securities may be classified in either Level 2 or Level 3 of the fair
value hierarchy. The Advisor will regularly evaluate whether the Fund’s fair value pricing procedures continue to be appropriate in light of the specific circumstances of the Fund and the quality of prices obtained through their
application of such procedures.
The fair value of foreign securities may be determined with the assistance of a pricing service using correlations between the movement of prices of such securities and indices of domestic
securities and other appropriate indicators, such as closing market prices of relevant American Depositary Receipts or futures contracts. Using fair value pricing means that the Fund’s NAV reflects the affected portfolio securities’
values as determined by the Advisor, the Board’s valuation designee, pursuant to the Fund’s fair value pricing procedures, instead of being determined by the market. Using a fair value pricing methodology to price a foreign security may
result in a value that is different from such foreign security’s most recent closing price and from the value used by other investment companies to calculate their NAVs. Such securities are generally classified in Level 2 of the fair
value hierarchy. Because the Fund may invest in foreign securities, the value of the Fund’s portfolio securities may change on days when a shareholder is unable to purchase or redeem Fund shares.
The Fund has performed an analysis of all existing investments to determine the significance and character of all inputs to their fair value determinations. Various inputs are used to
determine the value of the Fund’s investments. The inputs or methodology used for valuing securities are not necessarily an indication of the risk associated with investing in those securities. Details related to the fair value
hierarchy of the Fund’s securities as of October 31, 2023, are included in the Schedule of Investments.
4). INVESTMENT TRANSACTIONS
Purchases and sales of investment securities (excluding government and short-term investments) for the Fund during fiscal year 2023 were $5,773,269 and $8,523,727, respectively.
There were no purchases or sales/maturities of long-term U.S. government securities for the Fund during fiscal year 2023.
5). INVESTMENT ADVISORY FEE AND OTHER TRANSACTIONS WITH AFFILIATES
The Advisor provides the Fund with investment advisory services under an Investment Advisory Agreement. The Advisor furnishes all investment advice, office space, and
|
WWW.HENNESSYFUNDS.COM
|
26
|
NOTES TO THE FINANCIAL STATEMENTS
|
facilities and most of the personnel needed by the Fund. As compensation for its services, the Advisor is entitled to a monthly fee from the Fund. The fee is based on the average daily net assets of the Fund
at an annual rate of 1.25 %. The net investment advisory fees expensed by the Fund during fiscal year 2023 are included in the Statement of Operations.
The Board has approved a Shareholder Servicing Agreement for Investor Class shares of the Fund, which compensates the Advisor for the non-investment advisory services it provides to the
Fund. The Shareholder Servicing Agreement provides for a monthly fee paid to the Advisor at an annual rate of 0.10% of the average daily net assets of the Fund attributable to Investor Class shares. The shareholder service fees expensed
by the Fund during fiscal year 2023 are included in the Statement of Operations.
The Fund has adopted a plan pursuant to Rule 12b-1 under the Investment Company Act of 1940, as amended, that authorizes payments in connection with the distribution of Fund shares at an
annual rate of up to 0.25% of the Fund’s average daily net assets attributable to Investor Class shares. Even though the authorized rate is up to 0.25%, the Fund is currently only using up to 0.15% of its average daily net assets
attributable to Investor Class shares for such purpose. Amounts paid under the plan may be spent on any activities or expenses primarily intended to result in the sale of shares, including, but not limited to, advertising, shareholder
account servicing, printing and mailing of prospectuses to other than current shareholders, printing and mailing of sales literature, and compensation for sales and marketing activities or to financial institutions and others, such as
dealers and distributors. The distribution fees expensed by the Fund during fiscal year 2023 are included in the Statement of Operations.
The Fund has entered into agreements with various brokers, dealers, and financial intermediaries in connection with the sale of Fund shares. The agreements provide for periodic payments of
sub-transfer agent expenses by the Fund to the brokers, dealers, and financial intermediaries for providing certain shareholder maintenance services. These shareholder services include the pre-processing and quality control of new
accounts, shareholder correspondence, answering customer inquiries regarding account status, and facilitating shareholder telephone transactions. The sub-transfer agent fees expensed by the Fund during fiscal year 2023 are included in
the Statement of Operations.
U.S. Bancorp Fund Services, LLC, d/b/a U.S. Bank Global Fund Services (“Fund Services”) provides the Fund with administrative, accounting, and transfer agent services. As administrator, Fund
Services is responsible for activities such as (i) preparing various federal and state regulatory filings, reports, and returns for the Fund, (ii) preparing reports and materials to be supplied to the Board, (iii) monitoring the
activities of the Fund’s custodian, transfer agent, and accountants, and (iv) coordinating the preparation and payment of the Fund’s expenses and reviewing the Fund’s expense accruals. U.S. Bank N.A., an affiliate of Fund Services,
serves as the Fund’s custodian. The servicing agreements between the Trust, Fund Services, and U.S. Bank N.A. contain a fee schedule that is inclusive of administrative, accounting, custody, and transfer agent fees. The administrative,
accounting, custody, and transfer agent fees expensed by the Fund during fiscal year 2023 are included in the Statement of Operations. Fund Services has voluntarily waived all or a portion of its fees for the Fund. The fees voluntarily
waived by Fund Services during fiscal year 2023 are included in the Statement of Operations.
Quasar Distributors, LLC, a wholly owned broker-dealer subsidiary of Foreside Financial Group, LLC, acts as the Fund’s principal underwriter in a continuous public offering of Fund shares.
The officers of the Fund are affiliated with the Advisor. With the exception of the Chief Compliance Officer, such officers receive no compensation from the Fund for serving in
|
HENNESSY FUNDS
|
1-800-966-4354
|
27
their respective roles. The Fund, along with the other funds in the Hennessy Funds family (collectively, the “Hennessy Funds”), makes reimbursement payments on an equal basis to the Advisor for a portion of
the salary and benefits associated with the office of the Chief Compliance Officer. The compliance fees expensed by the Fund during fiscal year 2023 for reimbursement payments to the Advisor are included in the Statement of Operations.
6). GUARANTEES AND INDEMNIFICATIONS
Under the Hennessy Funds’ organizational documents, their officers and trustees are indemnified by the Hennessy Funds against certain liabilities arising out of the performance of their duties to the Hennessy
Funds. Additionally, in the normal course of business, the Hennessy Funds enter into contracts with service providers that contain general indemnification clauses. The Fund’s maximum exposure under these arrangements is unknown as this
would involve future claims that may be made against the Fund that have not yet occurred. Currently, the Fund expects the risk of loss to be remote.
7). LINE OF CREDIT
The Fund has an uncommitted line of credit with the other Hennessy Funds in the amount of the lesser of (i) $100,000,000 or (ii) 33.33% of each Hennessy Fund’s net assets, or 30% for the Hennessy Gas Utility
Fund, the Hennessy Japan Fund, and the Hennessy Japan Small Cap Fund and 10% for the Hennessy Balanced Fund. The line of credit is intended to provide any necessary short-term financing in connection with shareholder redemptions,
subject to certain restrictions. The credit facility is with the Hennessy Funds’ custodian bank, U.S. Bank N.A. Borrowings under this arrangement bear interest at the bank’s prime rate and are secured by all of the Fund’s assets (as to
its own borrowings only). During fiscal year 2023, the Fund had an outstanding average daily balance and a weighted average interest rate of $18,827 and 7.69%, respectively. The interest expensed by the Fund during fiscal year 2023 is
included in the Statement of Operations. The maximum amount outstanding for the Fund during fiscal year 2023 was $485,000. As of October 31, 2023, the Fund did not have any borrowings outstanding under the line of credit.
8). FEDERAL TAX INFORMATION
As of October 31, 2023, the components of accumulated earnings (losses) for income tax purposes were as follows:
|
Investments
|
|||||
|
Cost of investments for tax purposes
|
$
|
14,577,040
|
|||
|
Gross tax unrealized appreciation
|
$
|
6,659,122
|
|||
|
Gross tax unrealized depreciation
|
(794,763
|
)
|
|||
|
Net tax unrealized appreciation/(depreciation)
|
$
|
5,864,359
|
|||
|
Undistributed ordinary income
|
$
|
—
|
|||
|
Undistributed long-term capital gains
|
—
|
||||
|
Total distributable earnings
|
$
|
—
|
|||
|
Other accumulated gain/(loss)
|
$
|
(38,683,636
|
)
|
||
|
Total accumulated gain/(loss)
|
$
|
(32,819,277
|
)
|
||
The difference between book-basis unrealized appreciation/depreciation and tax-basis unrealized appreciation/depreciation (as shown above) is attributable primarily to wash sales and
partnership adjustments.
As of October 31, 2023, the Fund had $19,987,078 in unlimited long-term and $18,433,308 in unlimited short-term capital loss carryforwards. During fiscal year 2023, the capital losses
utilized by the Fund were $1,874,691.
|
WWW.HENNESSYFUNDS.COM
|
28
|
NOTES TO THE FINANCIAL STATEMENTS
|
Capital losses sustained in or after fiscal year 2012 can be carried forward indefinitely, but any such loss retains the character of the original loss and must be utilized prior to any loss
incurred before fiscal year 2012. As a result of this ordering rule, capital loss carryforwards incurred prior to fiscal year 2012 may be more likely to expire unused. Capital losses sustained prior to fiscal year 2012 can be carried
forward for eight years and can be carried forward as short-term capital losses regardless of the character of the original loss.
As of October 31, 2023, the Fund deferred, on a tax basis, a late-year ordinary loss of $263,251. Late-year ordinary losses are net ordinary losses incurred after December 31, 2022, but
within the taxable year, that are deemed to arise on the first day of the Fund’s next taxable year.
During fiscal years 2023 and 2022, the tax character of distributions paid by the Fund was as follows:
|
Year Ended
|
Year Ended
|
||||||||
|
October 31, 2023
|
October 31, 2022
|
||||||||
|
Ordinary income(1)
|
$
|
138,769
|
$
|
1,939,323
|
|||||
|
Long-term capital gains
|
—
|
—
|
|||||||
|
Total distributions
|
$
|
138,769
|
$
|
1,939,323
|
|||||
|
(1) Ordinary income includes short-term capital gains.
|
|||||||||
9). GLOBAL EVENTS
A rise in protectionist trade policies, the possibility of a national or global recession, risks associated with pandemic and epidemic diseases, trade tensions, the possibility of changes to some international
trade agreements, political events, and continuing political tension and armed conflicts may adversely impact financial markets and the broader economy. For example, ongoing armed conflicts between Ukraine and Russia in Europe and among
Israel, Hamas, and other militant groups in the Middle East have caused and could continue to cause significant market disruptions and volatility with the markets in Europe and the Middle East, and have had negative impacts on markets
in the United States. These events could also have negative effects on the Fund’s investments that cannot be foreseen at the present time. As global systems, economies and financial markets are increasingly interconnected, events that
once had only local impact are now more likely to have regional or even global effects. Events that occur in one country, region or financial market will, more frequently, adversely impact issuers in other countries, regions, or
markets. These impacts can be exacerbated by failures of governments and societies to adequately respond to an emerging event or threat. Your investment would be negatively impacted if the value of your portfolio holdings decreases as a
result of such events, if these events adversely impact the operations and effectiveness of the Advisor or other key service providers or if these events disrupt systems and processes necessary or beneficial to the management of
accounts. These events may negatively impact broad segments of businesses and populations and could have a significant and rapid negative impact on the performance of the Fund’s investments, increase the Fund’s volatility, or exacerbate
pre-existing risks to the Fund.
10). EVENTS SUBSEQUENT TO YEAR END
Management has evaluated the Fund’s related events and transactions that occurred subsequent to October 31, 2023, through the date of issuance of the Fund’s financial statements. Management has determined that
there were no subsequent events requiring recognition or disclosure in the financial statements.
|
HENNESSY FUNDS
|
1-800-966-4354
|
29
Report of Independent Registered Public
Accounting Firm
To the Board of Trustees of Hennessy Funds Trust
and the shareholders of the Hennessy Energy Transition Fund
Novato, CA
Opinion on the Financial Statements
We have audited the accompanying statement of assets and liabilities of the Hennessy Energy Transition Fund (the “Fund”), a series of Hennessy Funds Trust, including the schedule of investments, as of October
31, 2023, the related statement of operations for the year then ended, the statements of changes in net assets for each of the two years in the period then ended, the financial highlights for each of the five years in the period then
ended, and the related notes (collectively referred to as the “financial statements”). In our opinion, the financial statements present fairly, in all material respects, the financial position of the Fund as of October 31, 2023, the
results of its operations for the year then ended, the changes in its net assets for each of the two years in the period then ended and the financial highlights for each of the five years in the period then ended, in conformity with
accounting principles generally accepted in the United States of America.
Basis for Opinion
These financial statements are the responsibility of the Fund’s management. Our responsibility is to express an opinion on the Fund’s financial statements based on our audits. We are a public accounting firm
registered with the Public Company Accounting Oversight Board (United States) (“PCAOB”) and are required to be independent with respect to the Fund in accordance with the U.S. federal securities laws and the applicable rules and
regulations of the Securities and Exchange Commission and the PCAOB. We have served as the auditor of one or more of the funds in the Trust since 2002.
We conducted our audits in accordance with the standards of the PCAOB. Those standards require that we plan and perform the audit to obtain reasonable assurance about whether the financial statements are free
of material misstatement, whether due to error or fraud. The Fund is not required to have, nor were we engaged to perform, an audit of its internal control over financial reporting. As part of our audits we are required to obtain an
understanding of internal control over financial reporting, but not for the purpose of expressing an opinion on the effectiveness of the Fund’s internal control over financial reporting. Accordingly, we express no such opinion.
Our audits included performing procedures to assess the risks of material misstatement of the financial statements, whether due to error or fraud, and performing procedures that respond to those risks. Such
procedures included examining, on a test basis, evidence regarding the amounts and disclosures in the financial statements. Our audits also included evaluating the accounting principles used and significant estimates made by management,
as well as evaluating the overall presentation of the financial statements. Our procedures included confirmation of securities owned as of October 31, 2023, by correspondence with the custodian. We believe that our audits provide a
reasonable basis for our opinion.
|
|
|
TAIT, WELLER & BAKER LLP
|
Philadelphia, Pennsylvania
December 22, 2023
|
WWW.HENNESSYFUNDS.COM
|
30
|
REPORT OF INDEPENDENT REGISTERED PUBLIC ACCOUNTING FIRM/TRUSTEES AND OFFICERS
|
Trustees and Officers of the Fund (Unaudited)
The business and affairs of the Funds are managed under the direction of the Board of Trustees of the Trust, and the Board of Trustees elects the officers of the Trust (“Officers”). From time to time, the
Board of Trustees also has appointed advisers to the Board of Trustees (“Advisers”) with the intention of having qualified individuals serve in an advisory capacity to garner experience in the mutual fund and asset management industry
and be considered as potential Trustees in the future. There are currently two Advisers, Brian Alexander and A.J. Hennessy. As Advisers, Mr. Alexander and Mr. A.J. Hennessy attend meetings of the Board of Trustees and act as non-voting
participants. Information pertaining to the Trustees, Advisers, and the Officers of the Trust is set forth below. The Trustees and Officers serve until their successors are duly elected and qualified or until their earlier death,
resignation, or removal. Each Trustee oversees all 17 Hennessy Funds. Unless otherwise indicated, the address of all persons listed below is 7250 Redwood Boulevard, Suite 200, Novato, CA 94945. The Fund’s Statement of Additional
Information includes more information about the persons listed below and is available without charge by calling 800-966-4354 or by visiting www.hennessyfunds.com.
|
Other
|
|||
|
Directorships
|
|||
|
Held Outside
|
|||
|
Name, Age,
|
of Fund
|
||
|
and Position Held
|
Start Date
|
Principal Occupation(s)
|
Complex During
|
|
with the Trust
|
of Service
|
During Past Five Years
|
Past Five Years
|
|
Disinterested Trustees(1) and Disinterested Advisers
|
|||
|
J. Dennis DeSousa
|
January 1996
|
Mr. DeSousa is a real estate investor.
|
None.
|
|
87
|
|||
|
Trustee
|
|||
|
Robert T. Doyle
|
January 1996
|
Mr. Doyle is retired. He served as the
|
None.
|
|
76
|
Sheriff of Marin County, California
|
||
|
Trustee
|
from 1996 to June 2022.
|
||
|
Doug Franklin
|
March 2016
|
Mr. Franklin is a retired insurance
|
None.
|
|
59
|
as an Adviser
|
industry executive. From 1987
|
|
|
Trustee
|
to the Board
|
through 2015, he was employed by
|
|
|
and June 2023
|
the Allianz-Fireman’s Fund Insurance
|
||
|
as a Trustee
|
Company in various positions,
|
||
|
including as its Chief Actuary and
|
|||
|
Chief Risk Officer.
|
|||
|
Claire Garvie
|
December 2015
|
Ms. Garvie is a founder of Kiosk and
|
None.
|
|
49
|
as an Adviser
|
has served as its Chief Operating
|
|
|
Trustee
|
to the Board and
|
Officer since 2004. Kiosk is a
|
|
|
December 2021
|
full-service marketing agency with
|
||
|
as a Trustee
|
offices in the San Francisco Bay Area
|
||
|
and Liverpool, UK and staff across
|
|||
|
nine states in the U.S.
|
|||
|
HENNESSY FUNDS
|
1-800-966-4354
|
31
|
Other
|
|||
|
Directorships
|
|||
|
Held Outside
|
|||
|
Name, Age,
|
of Fund
|
||
|
and Position Held
|
Start Date
|
Principal Occupation(s)
|
Complex During
|
|
with the Trust
|
of Service
|
During Past Five Years
|
Past Five Years
|
|
Gerald P. Richardson
|
May 2004
|
Mr. Richardson is an independent
|
None.
|
|
78
|
consultant in the securities industry.
|
||
|
Trustee
|
|||
|
Brian Alexander
|
March 2015
|
Mr. Alexander has served as the
|
None.
|
|
42
|
Chief Operating Officer of Solis
|
||
|
Adviser to the Board
|
Mammography since March 2023.
|
||
|
Prior to that, he worked for the
|
|||
|
Sutter Health organization from
|
|||
|
2011 to 2023 in various positions.
|
|||
|
He served as the Chief Executive
|
|||
|
Officer of the North Valley Hospital
|
|||
|
Area from 2021 to March 2023.
|
|||
|
From 2018 to 2021, he served as the
|
|||
|
Chief Executive Officer of Sutter
|
|||
|
Roseville Medical Center. From 2016
|
|||
|
through 2018, he served as the Vice
|
|||
|
President of Strategy for the Sutter
|
|||
|
Health Valley Area, which includes
|
|||
|
11 hospitals, 13 ambulatory surgery
|
|||
|
centers, 16,000 employees, and
|
|||
|
1,900 physicians.
|
|||
|
Interested Trustee and Interested Adviser(2)
|
|||
|
Neil J. Hennessy
|
January 1996 as
|
Mr. Neil Hennessy has been employed
|
Hennessy
|
|
67
|
a Trustee and
|
by Hennessy Advisors, Inc. since
|
Advisors, Inc.
|
|
Chairman of the Board,
|
June 2008 as
|
1989 and currently serves as its
|
|
|
Chief Market Strategist,
|
an Officer
|
Chairman and Chief Executive Officer.
|
|
|
Portfolio Manager,
|
|||
|
and President
|
|||
|
A.J. Hennessy
|
December 2022
|
Mr. A.J. Hennessy has been employed
|
None.
|
|
37
|
by Hennessy Advisors, Inc. since 2011.
|
||
|
Adviser to the Board
|
|||
|
and Vice President,
|
|||
|
Corporate Development
|
|||
|
and Operations
|
|||
|
WWW.HENNESSYFUNDS.COM
|
32
|
TRUSTEES AND OFFICERS OF THE FUND
|
|
Name, Age,
|
||
|
and Position Held
|
Start Date
|
Principal Occupation(s)
|
|
with the Trust
|
of Service
|
During Past Five Years
|
|
Officers
|
||
|
Teresa M. Nilsen
|
January 1996
|
Ms. Nilsen has been employed by Hennessy Advisors, Inc.
|
|
57
|
since 1989 and currently serves as its President, Chief
|
|
|
Executive Vice President
|
Operating Officer, and Secretary.
|
|
|
and Treasurer
|
||
|
Daniel B. Steadman
|
March 2000
|
Mr. Steadman has been employed by Hennessy Advisors, Inc.
|
|
67
|
since 2000 and currently serves as its Executive Vice President.
|
|
|
Executive Vice President
|
||
|
and Secretary
|
||
|
Brian Carlson
|
December 2013
|
Mr. Carlson has been employed by Hennessy Advisors, Inc.
|
|
51
|
since December 2013 and currently serves as its Chief
|
|
|
Senior Vice President
|
Compliance Officer and Senior Vice President.
|
|
|
and Head of Distribution
|
||
|
David Ellison(3)
|
October 2012
|
Mr. Ellison has been employed by Hennessy Advisors, Inc.
|
|
65
|
since October 2012. He has served as a Portfolio Manager of
|
|
|
Senior Vice President
|
the Hennessy Large Cap Financial Fund and the Hennessy
|
|
|
and Portfolio Manager
|
Small Cap Financial Fund since their inception. Mr. Ellison also
|
|
|
served as a Portfolio Manager of the Hennessy Technology
|
||
|
Fund from its inception until February 2017. Mr. Ellison served
|
||
|
as Director, CIO, and President of FBR Fund Advisers, Inc.
|
||
|
from December 1999 to October 2012.
|
||
|
Jennifer Emerson(4)
|
June 2013
|
Ms. Emerson has been employed by Hennessy Advisors, Inc.
|
|
46
|
as its General Counsel since June 2013.
|
|
|
Senior Vice President and
|
||
|
Chief Compliance Officer
|
||
|
Ryan Kelley(5)
|
March 2013
|
Mr. Kelley has been employed by Hennessy Advisors, Inc. since
|
|
51
|
October 2012. He has served as Chief Investment Officer of the
|
|
|
Senior Vice President,
|
Hennessy Funds since March 2021 and has served as a Portfolio
|
|
|
Chief Investment Officer,
|
Manager of the Hennessy Gas Utility Fund, the Hennessy Large
|
|
|
and Portfolio Manager
|
Cap Financial Fund, and the Hennessy Small Cap Financial Fund
|
|
|
since October 2014. Mr. Kelley served as Co-Portfolio Manager
|
||
|
of these same funds from March 2013 through September
|
||
|
2014 and as a Portfolio Analyst for the Hennessy Funds from
|
||
|
October 2012 through February 2013. He has also served as a
|
||
|
Portfolio Manager of the Hennessy Cornerstone Growth Fund,
|
||
|
the Hennessy Cornerstone Mid Cap 30 Fund, the Hennessy
|
||
|
Cornerstone Large Growth Fund, and the Hennessy
|
||
|
Cornerstone Value Fund since February 2017 and as a Portfolio
|
||
|
Manager of the Hennessy Total Return Fund, the Hennessy
|
||
|
Balanced Fund, and the Hennessy Technology Fund since May
|
||
|
2018. He previously served as Co-Portfolio Manager of the
|
||
|
Hennessy Technology Fund from February 2017 until May 2018.
|
||
|
Mr. Kelley served as Portfolio Manager of FBR Fund
|
||
|
Advisers, Inc. from January 2008 to October 2012.
|
|
HENNESSY FUNDS
|
1-800-966-4354
|
33
|
Name, Age,
|
||
|
and Position Held
|
Start Date
|
Principal Occupation(s)
|
|
with the Trust
|
of Service
|
During Past Five Years
|
|
L. Joshua Wein(5)
|
September 2018
|
Mr. Wein has been employed by Hennessy Advisors, Inc. since
|
|
50
|
2018. He has served as Portfolio Manager of the Hennessy
|
|
|
Vice President and
|
Cornerstone Growth Fund, the Hennessy Cornerstone Mid Cap
|
|
|
Portfolio Manager
|
30 Fund, the Hennessy Cornerstone Large Growth Fund, the
|
|
|
Hennessy Cornerstone Value Fund, Hennessy Total Return Fund,
|
||
|
the Hennessy Balanced Fund, the Hennessy Gas Utility Fund,
|
||
|
and the Hennessy Technology Fund since February 2021, and
|
||
|
as the Co-Portfolio Manager of these Funds since February
|
||
|
2019. He served as a Senior Analyst of those same Funds from
|
||
|
September 2018 through February 2019. He also has served as
|
||
|
a Portfolio Manager of the Hennessy Energy Transition Fund
|
||
|
and the Hennessy Midstream Fund since January 2022.
|
||
|
Mr. Wein served as Director of Alternative Investments and
|
||
|
Co-Portfolio Manager at Sterling Capital Management
|
||
|
from 2008 to 2018.
|
_______________
|
(1)
|
The Funds have determined that Mr. DeSousa, Mr. Doyle, Mr. Franklin, Ms. Garvie, and Mr. Richardson are not interested persons, as defined in the 1940 Act, of the Investment
Manager or of any predecessor investment adviser for purposes of Section 15(f) of the 1940 Act.
|
|
(2)
|
Each of Neil J. Hennessy and A.J. Hennessy is considered an interested person, as defined in the 1940 Act, because he is an officer of the Trust.
|
|
(3)
|
The address of this officer is 101 Federal Street, Suite 1615B, Boston, MA 02110.
|
|
(4)
|
The address of this officer is 4800 Bee Caves Road, Suite 100, Austin, TX 78746.
|
|
(5)
|
The address of this officer is 1340 Environ Way, Chapel Hill, NC 27517.
|
|
WWW.HENNESSYFUNDS.COM
|
34
|
TRUSTEES AND OFFICERS OF THE FUND
|
(This Page Intentionally Left Blank.)
|
HENNESSY FUNDS
|
1-800-966-4354
|
35
Expense Example (Unaudited)
October 31, 2023
As a shareholder of the Fund, you incur ongoing costs, including management fees, service fees, and other Fund expenses. This Example is intended to help you understand your ongoing costs (in dollars) of
investing in the Fund and to compare these costs with the ongoing costs of investing in other investment funds. The Example is based on an investment of $1,000 invested at the beginning of the period and held for the entire period from
May 1, 2023, through October 31, 2023.
Actual Expenses
In the table below, the first line under each of the “Investor Class” and “Institutional Class” headings provides information about actual account values and actual expenses for each share class. You may use
this information, together with the amount you invested, to estimate the expenses that you paid over the period. Simply divide your account value by $1,000 (for example, an $8,600 account value divided by $1,000 = 8.6), then multiply
the result by the number in the first line under the heading “Expenses Paid During Period” to estimate the expenses you paid on your account during this period. Although the Fund charges no sales loads or transaction fees, you will be
assessed fees for outgoing wire transfers, returned checks, and stop payment orders at prevailing rates charged by U.S. Bank Global Fund Services, the Fund’s transfer agent. If you request that a redemption be made by wire transfer, the
Fund’s transfer agent charges a $15 fee. IRAs are charged a $15 annual maintenance fee (up to $30 maximum per shareholder for shareholders with multiple IRAs). The examples below include, but are not limited to, management, shareholder
servicing, accounting, custody, and transfer agent fees. However, the examples below do not include portfolio trading commissions and related expenses.
Hypothetical Example for Comparison Purposes
In the table below, the second line under each of the “Investor Class” and “Institutional Class” headings provides information about hypothetical account values and hypothetical expenses based on the Fund’s
actual expense ratio for each share class and an assumed rate of return of 5% per year before expenses, which is not the Fund’s actual return for such share class. The hypothetical account values and expenses may not be used to estimate
the actual ending account balance or expenses you paid for the period. You may use this information to compare the ongoing costs of investing in the Fund and other funds. To do so, compare these 5% hypothetical examples with the 5%
hypothetical examples that appear in the shareholder reports of the other funds. Please note that the expenses shown in the table are meant to highlight your ongoing costs only. Therefore, the second lines under “Investor Class” and
“Institutional Class” are useful in comparing ongoing costs only and will not help you determine the relative total costs of owning different funds.
|
WWW.HENNESSYFUNDS.COM
|
36
|
EXPENSE EXAMPLE
|
|
Expenses Paid
|
|||
|
Beginning
|
Ending
|
During Period(1)
|
|
|
Account Value
|
Account Value
|
May 1, 2023 –
|
|
|
May 1, 2023
|
October 31, 2023
|
October 31, 2023
|
|
|
Investor Class
|
|||
|
Actual
|
$1,000.00
|
$1,103.90
|
$12.14
|
|
Hypothetical (5% return before expenses)
|
$1,000.00
|
$1,013.66
|
$11.62
|
|
Institutional Class
|
|||
|
Actual
|
$1,000.00
|
$1,105.70
|
$10.35
|
|
Hypothetical (5% return before expenses)
|
$1,000.00
|
$1,015.38
|
$ 9.91
|
|
(1)
|
Expenses are equal to the Fund’s annualized expense ratio of 2.29% for Investor Class shares or 1.95% for Institutional Class shares, as applicable, multiplied by the average account value over the
period, multiplied by 184/365 days (to reflect the half-year period).
|
|
HENNESSY FUNDS
|
1-800-966-4354
|
37
How to Obtain a Copy of the Fund’s Proxy
Voting Policy and Proxy Voting Records
A description of the policies and procedures the Fund uses to determine how to vote proxies relating to portfolio securities is available without charge (1) by calling 800-966-4354, (2) on the Hennessy Funds’
website at www.hennessyfunds.com/proxy-voting/voting-policy, or (3) on the U.S. Securities and Exchange Commission’s (the “SEC”) website at www.sec.gov. The Fund’s proxy voting record is available without charge on both the Hennessy
Funds’ website at www.hennessyfunds.com/proxy-voting/voting-record and the SEC’s website at www.sec.gov no later than August 31 for the prior 12 months ending June 30.
Availability of Quarterly Portfolio Schedule
The Fund files a complete schedule of portfolio holdings with the SEC for the first and third quarters of each fiscal year as an exhibit to its reports on Form N-PORT. The Fund’s Form N-PORT reports are
available on the SEC’s website at www.sec.gov or on request by calling 800-966-4354.
Federal Tax Distribution Information (Unaudited)
For fiscal year 2023, certain dividends paid by the Fund may be subject to a maximum tax rate of 23.8%, as provided for by the Jobs and Growth Tax Relief Reconciliation Act of 2003. The percentage of dividends
declared from ordinary income designated as qualified dividend income was 100.00%.
For corporate shareholders, the percent of ordinary income distributions that qualified for the corporate dividends received deduction for fiscal year 2023 was 100.00%.
The percentage of taxable ordinary income distributions that were designated as short-term capital gain distributions under Section 871(k)(2)(C) of the Internal Revenue Code of 1986, as
amended, for the Fund was 0.00%.
Important Notice Regarding Delivery
of Shareholder Documents
To help keep the Fund’s costs as low as possible, we generally deliver a single copy of shareholder reports, proxy statements, and prospectuses to shareholders who share an address and have the same last name.
This process does not apply to account statements. You may request an individual copy of a shareholder document at any time. If you would like to receive separate mailings of shareholder documents, please call U.S. Bank Global Fund
Services at 800-261-6950 or 414-765-4124, and individual delivery will begin within 30 days of your request. If your account is held through a financial institution or other intermediary, please contact such intermediary directly to
request individual delivery.
Electronic Delivery
As currently permitted by SEC regulations, the Fund’s shareholder reports are made available on a website, and unless you sign for eDelivery or elect to receive paper copies as detailed below, you will be
notified by mail each time a report is posted and provided with a website link to access the report.
To elect to receive paper copies of all future reports free of charge, please call U.S. Bank Global Fund Services at 800-261-6950 or 414-765-4124.
The Fund also offers shareholders the option to receive all notices, account statements, prospectuses, tax forms, and shareholder reports electronically. To sign up for eDelivery or change
your delivery preference, please visit www.hennessyfunds.com/account.
Shareholder reports transmitted after July 24, 2024, will comply with the new tailored shareholder reporting requirements, which require streamlined annual and semi-annual reports to
shareholders that highlight key information. These reports will be transmitted in paper unless a shareholder elects to receive reports electronically via eDelivery. To sign up for eDelivery, please visit
http://www.hennessyfunds.com/account.
Subscribe to receive our team’s unique market and sector insights delivered to your inbox
www.hennessyfunds.com/subscribe
Follow us on social media
| |
|
|
|
|
WWW.HENNESSYFUNDS.COM
|
38
|
PROXY VOTING — PRIVACY POLICY
|
Liquidity Risk Management Program
In accordance with Rule 22e-4 under the Investment Company Act of 1940, as amended (the “Liquidity Rule”), we have adopted and implemented a liquidity risk management program (the “Liquidity Program”). The
purpose of the Liquidity Program is to assess and manage the Fund’s liquidity risk, which is the risk that the Fund would not be able to meet requests to redeem Fund shares without significant dilution of the remaining shareholders’
interests in the Fund. The Board of Trustees of the Fund (the “Board”) designated a committee comprising representatives of Hennessy Advisors, Inc., the investment adviser to the Fund, as the administrator of the Liquidity Program (the
“Program Administrator”).
The Program Administrator provided a written report regarding the Liquidity Program to the Board in advance of its meeting on June 7, 2023. The report covered the period from June 1, 2022,
through May 31, 2023. The report addressed the operation of the Liquidity Program, assessed the adequacy and effectiveness of its implementation, and described any material changes to the Liquidity Program during the review period. The
Trust’s chief compliance officer presented the report to the Board at the meeting and provided additional information regarding the Liquidity Program. The Board reviewed the Liquidity Program and considered, among other items, the
following:
|
1.
|
The Program Administrator reviewed daily historical net redemption activity during the review period and during prior periods with higher-than-average redemption activity and concluded that the Fund
has historically been able to meet requests to redeem Fund shares without significant dilution to the Fund’s remaining shareholders, and the Program Administrator expects the Fund to be able to continue to do so in the future
during both normal and reasonably foreseeable stressed conditions.
|
|
|
2.
|
The Fund primarily holds assets that are highly liquid investments and is not required to establish a highly liquid investment minimum for the Fund or adopt policies and procedures for responding to a
highly liquid investment minimum shortfall.
|
|
|
3.
|
The Program Administrator did not make or recommend any material changes to the Liquidity Program during the review period.
|
|
|
4.
|
The Program Administrator concluded that the Liquidity Program was reasonably designed to assess and manage the Fund’s liquidity risk, complies with the requirements of the Liquidity Rule, and was
operating as intended during the review period.
|
Privacy Policy
We collect the following personal information about you:
|
1.
|
Information we receive from you in applications or other forms, correspondence, or conversations, including, but not limited to, your name, address, phone number, social security number, assets,
income, and date of birth;
|
|
|
2.
|
Information about your transactions with us, our affiliates, or others, including, but not limited to, your account number and balance, payments history, parties to transactions, cost basis
information, and other financial information; and
|
|
HENNESSY FUNDS
|
1-800-966-4354
|
39
|
3.
|
Other personal information we collect from various sources, even if you have not entered into a prior transaction with us, including the following:
|
|
•
|
Name, alias, address, unique personal identifier, online identifier, IP address, email address, telephone number, account name, and other similar identifiers;
|
||
|
•
|
Age and marital status;
|
||
|
•
|
Commercial information, including records of products purchased;
|
||
|
•
|
Browsing history, search history, and information on interaction with our website;
|
||
|
•
|
Geolocation data;
|
||
|
•
|
Employment and employment history, educational history, financial information, and purchasing and consuming histories or tendencies; and
|
||
|
•
|
Inferences drawn from the above-listed information to create a profile about your preferences, characteristics, predispositions, and behavior.
|
We collect this information directly from you, indirectly in the course of providing services to you, directly and indirectly from your activity on our website, from broker dealers,
marketing agencies, and other third parties that interact with us in connection with the services we perform and products we offer, and from anonymized and aggregated consumer information.
We use this information to fulfill the reason you provided the information to us, to provide you with other relevant products that you request from us, to provide you with information about
products that may interest you, to improve our website or present our website’s contents to you, and as otherwise described to you when collecting your personal information.
We do not disclose any personal information to unaffiliated third parties, except as permitted by law. We may disclose your personal information to our affiliates, vendors, and service
providers for a business purpose. For example, we are permitted by law to disclose all of the information we collect, as described above, to our transfer agent to process your transactions. When disclosing your personal information to
third parties, we enter into a contract with each third party describing the purpose of such disclosure and requiring that such personal information be kept confidential and not used for any purpose except to perform the services
contracted or respond to regulatory or law enforcement requests.
Furthermore, we restrict access to your personal information to those persons who require such information to provide products or services to you. As a result, we do not provide a means for
opting out of our limited sharing of your information. We maintain physical, electronic, and procedural safeguards that comply with federal standards to guard your personal information.
If you hold shares of the Funds through a financial intermediary, including, but not limited to, a broker-dealer, bank, or trust company, the privacy policy of your financial intermediary
governs how your personal information is shared with unaffiliated third parties.
If you live in a state such as California where the laws provide further privacy rights, we will not share information unless the law allows, and we will comply with the other state-specific
requirements.
|
WWW.HENNESSYFUNDS.COM
|
40
|
PRIVACY POLICY
|
Supplemental Privacy Notice for Residents of California
The California Consumer Privacy Act of 2018 (the “CCPA”) provides you, as a California resident, with certain additional rights relating to your personal information.
Under the CCPA, you have the right to request that we disclose to you the categories of personal information we have collected about you over the past 12 months, the categories of sources of
such information, our business purpose for collecting the information, the categories of third parties, if any, with whom we shared the information, and the specific information we have collected about you. You also have the right to
request that we delete any of your personal information, and, unless an exception applies, we will delete such information upon receiving and confirming your request. To make a request, call us at 1-800-966-4354, email us at
privacy@hennessyfunds.com, or go to www.hennessyfunds.com/contact. We will not discriminate against you for exercising your rights under the CCPA. Further, we will not collect additional categories of your personal information or use
the personal information we collected for materially different, unrelated, or incompatible purposes without providing you notice.
|
HENNESSY FUNDS
|
1-800-966-4354
|
41
For information, questions, or assistance, please call
The Hennessy Funds
800-966-4354 or 415-899-1555
INVESTMENT ADVISOR
Hennessy Advisors, Inc.
7250 Redwood Boulevard, Suite 200
Novato, California 94945
ADMINISTRATOR,
TRANSFER AGENT,
DIVIDEND PAYING AGENT, &
SHAREHOLDER SERVICING AGENT
U.S. Bancorp Fund Services, LLC
d/b/a U.S. Bank Global Fund Services
P.O. Box 701
Milwaukee, Wisconsin 53201-0701
CUSTODIAN
U.S. Bank N.A.
Custody Operations
1555 North River Center Drive, Suite 302
Milwaukee, Wisconsin 53212
TRUSTEES
Neil J. Hennessy
Robert T. Doyle
J. Dennis DeSousa
Doug Franklin
Claire Garvie
Gerald P. Richardson
COUNSEL
Foley & Lardner LLP
777 East Wisconsin Avenue
Milwaukee, Wisconsin 53202-5306
INDEPENDENT REGISTERED
PUBLIC ACCOUNTING FIRM
Tait, Weller & Baker LLP
Two Liberty Place
50 South 16th Street, Suite 2900
Philadelphia, Pennsylvania 19102-2529
DISTRIBUTOR
Quasar Distributors, LLC
111 East Kilbourn Avenue, Suite 1250
Milwaukee, Wisconsin 53202
www.hennessyfunds.com | 800-966-4354
This report has been prepared for shareholders and may be distributed to
others only if preceded or accompanied by a current prospectus.
ANNUAL REPORT
OCTOBER 31, 2023

HENNESSY MIDSTREAM FUND
Investor Class HMSFX
Institutional Class HMSIX
www.hennessyfunds.com | 1-800-966-4354
(This Page Intentionally Left Blank.)
Contents
|
Letter to Shareholders
|
2
|
|
|
Performance Overview
|
5
|
|
|
Financial Statements
|
||
|
Schedule of Investments
|
10
|
|
|
Statement of Assets and Liabilities
|
13
|
|
|
Statement of Operations
|
14
|
|
|
Statements of Changes in Net Assets
|
15
|
|
|
Financial Highlights
|
16
|
|
|
Notes to the Financial Statements
|
20
|
|
|
Report of Independent Registered Public Accounting Firm
|
30
|
|
|
Trustees and Officers of the Fund
|
31
|
|
|
Expense Example
|
36
|
|
|
Proxy Voting Policy and Proxy Voting Records
|
38
|
|
|
Availability of Quarterly Portfolio Schedule
|
38
|
|
|
Important Notice Regarding Delivery of Shareholder Documents
|
38
|
|
|
Electronic Delivery
|
38
|
|
|
Liquidity Risk Management Program
|
39
|
|
|
Privacy Policy
|
39
|
|
HENNESSY FUNDS
|
1-800-966-4354
|
November 2023
Dear Hennessy Funds Shareholder:
Market Myopia: Tough Beginnings & Fantastic Finishes
During an interview this summer, I was reminded how important it is to maintain a long-term view of the market and investing and how easy it is to focus on the very recent past. In mid-July, when the Nasdaq
Composite Index was soaring to new 2023 highs and large-cap tech was once again dominating both returns and news headlines, the interviewer seemed confused – and somewhat disappointed – when I mentioned that even with 2023’s stellar
performance, the Nasdaq was negative if you included the prior year (2022) and that during that same time, utilities had outperformed. As of the time of writing this letter, a similar story can be seen when considering eight technology
giants: Microsoft, Tesla, Facebook (Meta), Apple, Amazon, Netflix, Nvidia, and Google, or “MT. FAANNG” as a much easier to say
(and remember) acronym.(1) MT. FAANNG is up on average a whopping 89.69% in 2023 on a total return basis as of November 7, 2023. However, this same group
was down -46.71% in 2022, a dismal year for large-cap tech. Due to the unforgiving nature of percentages, from the end of 2021 until now, this group of highflyers, believe it or not, is still down -3.14% on average, despite an
incredible 2023.
I like to call this phenomenon “market myopia.” Investors tend to be optimists, as am I. This makes it so much more comforting to forget the “tough beginnings” when
you’d rather remember the “fantastic finishes.” In continuing with the example above, unless you were an investor with prescient foresight, you likely didn’t sell all your MT. FAANNG stocks on January 4, 2022, as the market started its
correction, and you probably didn’t then buy them all back on September 30, 2022, when the market hit its low. An average investor’s experience would be much different than that. Which brings me to the point of all this: what are some
elements of our investment philosophy here at Hennessy Funds?
First, what about timing the market? Simply put, we don’t do it. As Neil Hennessy, our Chief Market Strategist and long-tenured Portfolio Manager, aptly put it, “It’s
not about timing the market, but rather about time in the market.” The long-term annualized return of the market, as measured by the Dow Jones Industrial
Average going back 104 years to 1920, is about 9.6%, and that number would be closer to 7-8% on a real return basis when factoring in inflation. If an investor is poorly timing when to enter and when to exit the market, it would be very
difficult to achieve similar, attractive returns to what they would experience simply by staying invested through a complete market cycle.
We are optimistic investors. We understand that some years or months may be tougher than others, but we tend to think in longer timeframes. An investor solely invested
in the Nasdaq might have looked at their portfolio at the end of 2022 and been extremely disappointed with a -32.51% return. But as Josh Wein, one of our Portfolio Managers with over 25 years of experience, pointed out, “2022 was what
8% real returns look like.” In other words, with the year prior (2021) providing a +22.21% return and the year after (2023) hitting a +31.21% return, 2022’s dismal performance of -32.51% created an annualized total return for the Nasdaq
of 8.22% over the entire period (December 31, 2020, to November 7, 2023). Josh simply observed that while corrections happen over the course of a market cycle, it’s best not to panic by selling when stocks are hitting new lows.
_______________
|
(1)
|
The acronym, MT. FAANNG, refers to the following companies: Microsoft Corporation, Tesla, Inc., Meta Platforms, Inc., Amazon.com, Inc., Apple, Inc., Netflix, Inc., NVIDIA Corporation, and Alphabet,
Inc.
|
|
WWW.HENNESSYFUNDS.COM
|
2
|
LETTER TO SHAREHOLDERS
|
Downside risk mitigation is relevant. While we normally remain fully invested within our individual funds, we seek to reduce risk through other means, including sector
diversification and investing in companies that exhibit strong fundamentals at compelling valuations. Dave Ellison, the long-tenured Portfolio Manager of our two financial funds, consistently reminds us, “Losing less money in difficult
markets is more important than making the most in rising ones.”
Finally, we are investors in companies, not traders of stocks. Many of our portfolios hold certain positions for long periods of time, a demonstration of the Portfolio
Managers’ convictions. In fact, both the Hennessy Focus Fund and the Hennessy Large Cap Financial Fund have held some positions for 25 years or more. We recognize that much of the performance of the Hennessy Funds comes from the actual
stocks we own (stock selection) and not from our weightings within certain sectors (sector allocation). Moving in and out of sectors can enhance performance, but it can also hinder it in the same way as market timing, and it takes a
significant number of correct “calls” regarding the macro-environment. We’d rather invest long term than rely on lucky calls. Our highly experienced energy funds Portfolio Manager, Ben Cook, summed up our philosophy on the macro
environment nicely: “While macro-economic trends help to inform our investment process, ultimately it’s the individual stocks with solid fundamentals and attractive valuations that, over time, drive positive risk-adjusted returns for
our funds.”
We are long term investors, staying ever mindful of downside risk while striving to participate in the upside, with each individual fund having its own objective,
process, portfolio construction, and investment criteria.
The stock market has once again seen dramatic differences in stock performance. For our fiscal year ended October 31, 2023, all three broad-based indexes were positive,
although with a large dispersion of total returns, with the Dow Jones Industrial Average up 3.17%, the S&P 500® Index up 10.14%, and the Nasdaq
Composite Index up 17.99%. During our fiscal year, large caps significantly outperformed mid caps and small caps, and growth substantially outperformed value. Large-cap tech once again pushed the overall broader market higher, as
evidenced by the Nasdaq-100 Index posting a return of 27.45%. From a sector point of view, besides Technology, the only other sector with outsized (greater than 10%) returns was Communication Services, while six of the 11 GICS sectors
of the S&P 500® Index were negative.
Similar to the overall market, our funds experienced mixed results. Many of our funds exhibit more value-oriented characteristics and, given that value underperformed
growth this year by a significant amount, that negatively affected our relative performance. In addition, three of our funds are sector-specific funds that were invested in underperforming sectors, while six more are focused on small-
and mid-cap stocks in a time period when large caps substantially outperformed. Ten of our 16 mutual funds and our exchange-traded-fund (ETF) posted positive returns for the fiscal year ended October 31, 2023.
Several factors caused this disparity of returns in the market: interest rates and inflation being two of the most important. With the Federal Reserve pausing interest
rate hikes and inflation numbers subsiding, the market reacted positively once it became more apparent that we were not heading into a recession. Consumer demand also remained strong, and unemployment numbers remained historically low.
We believe that the outlook for U.S. stocks remains positive, primarily as we believe that the Federal Reserve may be done, or close to done, raising interest rates.
Inflation has shown signs of easing, creating a better environment for consumers as well as businesses. The unemployment rate remains near record lows, there are elevated levels of cash on the
|
HENNESSY FUNDS
|
1-800-966-4354
|
3
balance sheets of U.S. companies and in the pockets of many consumers and investors, and there is the prospect of a more dovish Federal Reserve heading into 2024. However, we are cautiously watching certain
parts of the economy for any hints of weakness, including consumer spending and credit issues. While volatility and uncertainty may impact the markets, we encourage investors to stay the course, maintain a diversified portfolio, and
keep a long-term perspective.
We thank you for your continued interest in our Funds and are grateful that you have chosen to invest with us. If you have any questions or would like to speak with us
directly, please call us at (800) 966-4354.
Best regards,
|
|
|
|
|
Ryan C. Kelley, CFA
|
|
|
Chief Investment Officer,
|
|
|
Senior Vice President, and Portfolio Manager
|
Past performance does not guarantee future results.
Mutual fund investing involves risk. Principal loss is possible.
Opinions expressed are those of Ryan C. Kelley and are subject to change, are not guaranteed, and should not be considered investment advice.
The Dow Jones Industrial Average and S&P 500® Index are commonly used to measure the performance of U.S. stocks. The Nasdaq
Composite Index comprises all common stocks listed on The Nasdaq Stock Market and is commonly used to measure the performance of technology-related stocks. The Nasdaq-100 Index includes 100 of the largest domestic and international
non-financial companies listed on The NASDAQ Stock Market based on market capitalization. The indices are used herein for comparative purposes in accordance with SEC regulations. One cannot invest directly in an index. All returns are
shown on a total return basis.
|
WWW.HENNESSYFUNDS.COM
|
4
|
LETTER TO SHAREHOLDERS/PERFORMANCE OVERVIEW
|
Performance Overview (Unaudited)
CHANGE IN VALUE OF $10,000 INVESTMENT
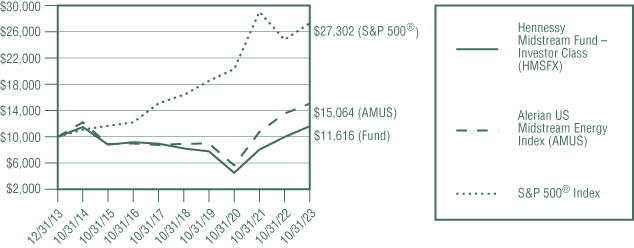
This graph illustrates the performance of an initial investment of $10,000 made in the Fund on its inception date and assumes the reinvestment of dividends and capital gains.
AVERAGE ANNUAL TOTAL RETURN FOR PERIODS ENDED OCTOBER 31, 2023
|
One
|
Five
|
Since Inception
|
|
|
Year
|
Years
|
(12/31/13)
|
|
|
Hennessy Midstream Fund –
|
|||
|
Investor Class (HMSFX)
|
16.39%
|
6.91%
|
1.54%
|
|
Hennessy Midstream Fund –
|
|||
|
Institutional Class (HMSIX)
|
16.67%
|
7.16%
|
1.79%
|
|
Alerian US Midstream Energy Index
|
11.22%
|
10.70%
|
4.25%
|
|
S&P 500® Index
|
10.14%
|
11.01%
|
10.75%
|
|
Expense ratios:
|
Gross 2.05%, Net 1.76%(1)(2) (Investor Class);
|
|
Gross 1.69%, Net 1.51%(1)(2) (Institutional Class)
|
|
(1)
|
The Fund’s investment advisor has contractually agreed to limit expenses until February 28, 2024.
|
|
(2)
|
Certain service provider expenses will be voluntarily waived through July 31, 2025, at which time the arrangement will automatically terminate. In addition, the arrangement will not apply at any time
the Fund’s net assets exceed $125 million.
|
Performance data quoted represents past performance; past performance does not guarantee future results. The investment return and principal value of an investment will fluctuate so that an
investor’s shares, when redeemed, may be worth more or less than their original cost. The performance table does not reflect the deduction of taxes that a shareholder would pay on Fund distributions or the redemption of Fund shares.
Current performance of the Fund may be lower or higher than the performance quoted. Performance data current to the most recent month end may be obtained by visiting www.hennessyfunds.com. Performance for periods including or prior to
October 26, 2018, is that of the BP Capital TwinLine MLP Fund.
The Alerian US Midstream Energy Index comprises companies that earn a majority of their cash flows from midstream activities involving energy commodities. The S&P 500® Index is a capitalization-weighted index that is designed to represent the broad domestic economy through changes in the aggregate market value of 500 stocks across all major industries.
One cannot invest directly in an index. These indices are used for comparative purposes in accordance with Securities and Exchange Commission regulations.
Standard & Poor’s Financial Services is the source and owner of the S&P® and S&P 500® trademarks.
|
HENNESSY FUNDS
|
1-800-966-4354
|
5
The Alerian US Midstream Energy Index is a servicemark of GKD Index Partners, LLC d/b/a Alerian (“Alerian”), and its use is granted under a license from Alerian. Alerian makes no express or implied warranties,
representations, or promises regarding the originality, merchantability, suitability, or fitness for a particular purpose or use with respect to the Alerian indices. No party may rely on, and Alerian does not accept any liability for
any errors, omissions, interruptions, or defects in, the Alerian indices or underlying data. In no event shall Alerian have any liability for any direct, indirect, special, incidental, punitive, consequential, or other damages
(including lost profits), even if notified of the possibility of such damages.
The expense ratios presented are from the most recent prospectus. The expense ratios for the current reporting period are available in the Financial Highlights section of this report.
PERFORMANCE NARRATIVE
Portfolio Managers: Ben Cook, CFA, and L. Joshua Wein, CAIA
Performance:
For the one-year period ended October 31, 2023, the Investor Class of the Hennessy Midstream Fund returned 16.39%, outperforming both the Alerian US Midstream Energy Index (the Fund’s primary benchmark) and
the S&P 500® Index, which returned 11.22% and 10.14%, respectively, for the same period.
The principal reason for the Fund’s outperformance relative to its primary benchmark was the lower relative exposure to several large cap C-Corp structured midstream companies possessing
assets oriented toward natural gas which were top members of the Fund’s primary benchmark index, the Alerian US Midstream Energy Index. By contrast, the Fund maintained an overweight position in both crude oil-oriented companies
structured as master limited partnerships (MLPs) and diversified midstream companies structured as MLPs, which generally outperformed their C-Corp structured peers possessing assets oriented toward natural gas.
During the period, midstream assets with a crude oil orientation enjoyed a relative operating environment tailwind driven by relatively steady crude oil pricing and rising crude oil
production volume. Although NYMEX WTI crude oil prices declined $5.51 per barrel, or approximately 6.3%, to end the period at $81.02, the period average price of $78.57 per barrel reflected generally healthy fundamentals for crude oil.
Lower 48 U.S. crude oil production volume grew by approximately 9.4%, reaching a post-pandemic high of 12.8 million barrels per day by period end. The Fund maintained an overweight position in crude oil-oriented companies operating
assets located in key oil prone shale basins relative to its benchmark, which afforded the Fund with positive excess return during the period.
The Fund’s exposure to natural gas-oriented companies was below comparable benchmark exposures and contributed modestly to overall Fund performance given the slight underperformance of the
subsector relative to the primary benchmark during the period. In the U.S, NYMEX Henry Hub natural gas prices declined meaningfully, dropping $2.78 per thousand cubic feet (mcf), from the period starting price of $6.355 per mcf to
$3.575 per mcf at period end. Though the price decline was material during the period, the average price for the period of $3.224 per mcf did remain above most operator’s cash operating cost levels in most of the U.S. lower 48 natural
gas prone shale basins. As with U.S. lower 48 crude oil volumes, U.S. lower 48 dry gas production increased roughly 3%, reaching a post pandemic high of approximately 103 billion cubic feet per day.
|
WWW.HENNESSYFUNDS.COM
|
6
|
PERFORMANCE OVERVIEW
|
The Fund’s exposure to gathering and processing-oriented companies contributed slightly to Fund outperformance relative to its primary benchmark, as the sub-sector’s performance generally
underperformed the broader benchmark and the Fund’s relative weighting was slightly lower than the benchmark’s weighting. Operating and financial results of gathering and processing-oriented companies generally held steady despite
declines in natural gas liquid purity product prices which were offset by rising volumetric throughput during the period.
Portfolio exposure adjustments during the period were modest but reflected continued confidence in favorable energy commodity pricing and moderating activity levels in the U.S. upstream oil
and gas sector. Portfolio exposure to gathering and processing-oriented companies decreased by 2.4%, while exposures to both natural gas and natural gas liquid-oriented companies representing a more diversified grouping of assets
increased 2.6%, and crude oil and refined product-oriented companies diminished by 2.4%. At period end, 51% of the portfolio represented exposure to companies operating natural gas and natural gas liquid-oriented assets while gathering
and processing-oriented companies represented 24% of exposure, and crude oil and refined products-oriented companies represented 21% of exposure.
Portfolio Strategy:
The Fund generally seeks to build a concentrated portfolio of midstream energy companies with the following characteristics: (i) large and strategically protected integrated businesses, linking economic basins
to strong demand centers; (ii) contracted and visible cash flows with strong counterparties such as utilities or power consumers; and (iii) strong balance sheets. However, given the current strong macroeconomic conditions, as well as
favorable commodity prices and midstream energy company fundamentals, we expect that the Fund’s portfolio will continue to include companies with direct commodity sensitivity. We believe our industry experience and intensive,
fundamental, “boots-on-the-ground” research process allows us to uncover potential equity mispricing that can meaningfully drive performance.
Investment Commentary:
Energy commodity prices softened during the first half of the one-year period ended October 31, 2023, as energy commodity demand tracked an uneven pace of global economic activity hindered by China’s sluggish
post-pandemic expansion. Tightening monetary policy in the U.S. and abroad added to fears of weakening demand, while at the same time, energy commodity supplies proved to be ample despite Russian embargo related supply loss and
persistent underinvestment in industry productive capacity. During the period, the Biden administration continued to supplement domestic crude oil supplies with the gradual release of approximately 50 million barrels of crude oil from
the U.S. Strategic Petroleum Reserve.
Recognizing risks to crude oil demand, the OPEC+ quota alliance moved to balance the global crude oil market by implementing several output cuts during the period. A sizeable, surprise OPEC+
volume cut of over 1 million barrels per day (mmbbls/d) was announced in April 2023, which was then followed by a surprise unilateral Saudi cut of an additional 1 mmbbls/d, announced in June 2023. By period end, OPEC+’s quota alliance
had diminished output by over 2 mmbbls/d, sending global supply levels below that of demand, which in turn triggered meaningful draws in global inventories. The Saudi led defense of crude oil market fundamentals brought support to
global crude oil pricing, with NYMEX WTI crude oil rising from the $70 per barrel level mid period to the mid-$80 per barrel level by period end.
|
HENNESSY FUNDS
|
1-800-966-4354
|
7
Global natural gas market fundamentals softened meaningfully during the period as Russian export volume loss was offset by a combination of factors that ultimately spared European markets
from a potentially disastrous wintertime supply shortfall. These factors included above average winter temperatures, price-related demand destruction, and the rerouting of significant liquified natural gas (LNG) cargo volume into
European markets. With the onset of reduced northern hemisphere heating demand during the spring and summer, European natural gas storage operators were able to increase natural gas storage levels to near full capacity by period end,
materially reducing the risk of shortages in the coming winter.
While the global macro outlook remains clouded given the headwinds associated with tightening monetary conditions and an uneven pace of economic growth, we believe investment merit inherent
in U.S. energy equities remains favorable for a variety of reasons. Relatively tight commodity fundamentals, rising demand for U.S. energy exports, a defensive posture with respect to inflation, and current attractive valuations all
contribute to the sector’s appeal.
On a global basis, crude oil inventories remain well below historical norms, as years of underinvestment in industry capacity and only modest gains in production volume have proven
insufficient to fully satisfy rising consumption and inventory replenishment needs. As a consequence, commodity prices are likely to remain elevated and provide U.S. upstream companies with incentive to develop the resources required to
meet rising demand in the U.S and abroad. Existing and projected export capacity expansion in the U.S. should allow for export volume growth through the end of the decade. Continued pressure on Russian export volumes underscores the
importance of energy security, reliability, and affordability, which are all qualities that likely will increase the appeal of U.S. energy resources. As one of few sectors offering the potential for strong returns and cash flows that
are generally positively correlated with rising price levels, midstream equities provide a logical hedge in an inflationary environment. Inflation protection coupled with attractive valuation relative to historical norms combine to
offer unique appeal in the current environment. In total, we believe these and other drivers should continue to benefit energy fundamentals and midstream energy equities going forward.
_______________
Opinions expressed are those of the Portfolio Managers as of the date written and are subject to change, are not guaranteed, and should not be considered investment advice or an indication of trading intent.
The Fund is non-diversified, meaning it may concentrate its assets in fewer individual holdings than a diversified fund, making it more exposed to individual stock volatility than a
diversified fund. The Fund invests in small-capitalization and medium-capitalization companies, which may have more limited liquidity and greater volatility than larger companies. Funds that concentrate in a single sector may be subject
to a higher degree of risk. Energy-related companies are subject to specific risks, including fluctuations in commodity prices and consumer demand, substantial government regulation, and depletion of reserves.
MLPs and MLP investments have unique characteristics. The Fund does not receive the same tax benefits as a direct investment in an MLP.
The prices of MLP units may fluctuate abruptly and trading volume may be low, making it difficult for the Fund to sell its units at a favorable price. MLP general partners have the power to
take actions that adversely affect the interests of unit holders. Most MLPs do not pay U.S. federal income tax at the partnership level, but an adverse change in tax laws could result in MLPs being treated as corporations for federal
income tax purposes, which could reduce or eliminate distributions paid by MLPs to the Fund. The Fund is treated as a regular corporation, or “C” corporation, for U.S. federal income tax purposes, and therefore, is subject to U.S.
federal income tax on its taxable income at the graduated rates applicable to corporations (currently a maximum
|
WWW.HENNESSYFUNDS.COM
|
8
|
PERFORMANCE OVERVIEW
|
rate of 21%), as well as state and local income taxes. The Fund will not benefit from current favorable federal income tax rates on long-term capital gains, and Fund income and losses will
not be passed on to shareholders. The Fund accrues deferred income taxes for future tax liabilities associated with the portion of MLP distributions considered to be a tax-deferred return of capital and for any net operating gains as
well as capital appreciation of its investments. This deferred tax liability is reflected in the daily net asset value of the Fund and as a result the Fund’s after-tax performance could differ significantly from the underlying assets
even if the pre-tax performance is closely tracked. Please see the Fund’s prospectus for a more complete discussion of these and other risks.
References to specific securities should not be considered a recommendation to buy or sell any security. Fund holdings and sector allocations are subject to change. Please refer to the Schedule of Investments
included in this report for additional portfolio information.
Cash flow refers to the net amount of cash and cash equivalents transferred into and out of a company. Mcf is a unit of measurement of natural gas and is equal to one
thousand cubic feet.
|
HENNESSY FUNDS
|
1-800-966-4354
|
9
Financial Statements
|
Schedule of Investments as of October 31,
2023
|
HENNESSY MIDSTREAM FUND
(% of Total Assets)
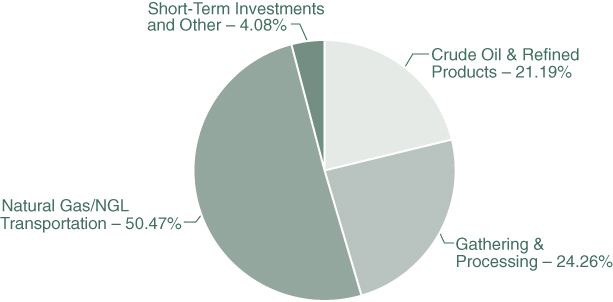
|
TOP TEN HOLDINGS (EXCLUDING MONEY MARKET FUNDS)
|
% TOTAL ASSETS
|
|
Energy Transfer LP
|
14.16%
|
|
Enterprise Products Partners LP
|
12.76%
|
|
Plains All American Pipeline LP
|
11.05%
|
|
MPLX LP
|
10.14%
|
|
Antero Midstream Corp.
|
7.87%
|
|
ONEOK, Inc.
|
7.24%
|
|
Western Midstream Partners LP
|
5.96%
|
|
The Williams Companies, Inc.
|
5.82%
|
|
Equitrans Midstream Corp.
|
5.52%
|
|
TC Energy Corp.
|
3.80%
|
Note: The Fund concentrates its investments in the Energy industry. For presentation purposes, the Fund uses custom categories.
|
WWW.HENNESSYFUNDS.COM
|
10
|
SCHEDULE OF INVESTMENTS
|
|
COMMON STOCKS – 40.99%
|
Number of
|
% of
|
||||||||||
|
|
Shares
|
Value
|
Net Assets
|
|||||||||
|
Gathering & Processing – 18.34%
|
||||||||||||
|
Antero Midstream Corp.
|
346,600
|
$
|
4,277,044
|
7.88
|
%
|
|||||||
|
EnLink Midstream LLC
|
109,000
|
1,339,610
|
2.47
|
%
|
||||||||
|
Equitrans Midstream Corp.
|
338,500
|
3,002,495
|
5.54
|
%
|
||||||||
|
Targa Resources Corp.
|
15,900
|
1,329,399
|
2.45
|
%
|
||||||||
|
|
9,948,548
|
18.34
|
%
|
|||||||||
|
Natural Gas/NGL Transportation – 22.65%
|
||||||||||||
|
DT Midstream, Inc.
|
19,800
|
1,068,606
|
1.97
|
%
|
||||||||
|
Kinder Morgan, Inc.
|
126,690
|
2,052,378
|
3.79
|
%
|
||||||||
|
ONEOK, Inc.
|
60,345
|
3,934,494
|
7.25
|
%
|
||||||||
|
TC Energy Corp.
|
60,000
|
2,067,000
|
3.81
|
%
|
||||||||
|
The Williams Companies, Inc.
|
91,952
|
3,163,149
|
5.83
|
%
|
||||||||
|
|
12,285,627
|
22.65
|
%
|
|||||||||
|
|
||||||||||||
|
Total Common Stocks
|
||||||||||||
|
(Cost $15,663,676)
|
22,234,175
|
40.99
|
%
|
|||||||||
|
|
||||||||||||
|
PARTNERSHIPS & TRUSTS – 55.14%
|
||||||||||||
|
Crude Oil and Refined Products – 21.23%
|
||||||||||||
|
MPLX LP
|
152,949
|
5,512,282
|
10.16
|
%
|
||||||||
|
Plains All American Pipeline LP
|
396,426
|
6,005,854
|
11.07
|
%
|
||||||||
|
|
11,518,136
|
21.23
|
%
|
|||||||||
|
Gathering & Processing – 5.97%
|
||||||||||||
|
Western Midstream Partners LP
|
120,700
|
3,238,381
|
5.97
|
%
|
||||||||
|
Natural Gas/NGL Transportation – 27.94%
|
||||||||||||
|
Cheniere Energy Partners LP
|
9,300
|
518,568
|
0.96
|
%
|
||||||||
|
Energy Transfer LP
|
585,500
|
7,699,325
|
14.19
|
%
|
||||||||
|
Enterprise Products Partners LP
|
266,400
|
6,937,056
|
12.79
|
%
|
||||||||
|
|
15,154,949
|
27.94
|
%
|
|||||||||
|
|
||||||||||||
|
Total Partnerships & Trusts
|
||||||||||||
|
(Cost $17,261,815)
|
29,911,466
|
55.14
|
%
|
|||||||||
The accompanying notes are an integral part of these financial statements.
|
HENNESSY FUNDS
|
1-800-966-4354
|
11
|
SHORT-TERM INVESTMENTS – 2.56%
|
Number of
|
% of
|
||||||||||
|
|
Shares
|
Value
|
Net Assets
|
|||||||||
|
Money Market Funds – 2.56%
|
||||||||||||
|
First American Treasury Obligations Fund – Class X, 5.275% (a)
|
1,390,442
|
$
|
1,390,442
|
2.56
|
%
|
|||||||
|
|
||||||||||||
|
Total Short-Term Investments
|
||||||||||||
|
(Cost $1,390,442)
|
1,390,442
|
2.56
|
%
|
|||||||||
|
|
||||||||||||
|
Total Investments
|
||||||||||||
|
(Cost $34,315,933) – 98.69%
|
53,536,083
|
98.69
|
%
|
|||||||||
|
Other Assets in Excess of Liabilities – 1.31%
|
711,720
|
1.31
|
%
|
|||||||||
|
|
||||||||||||
|
TOTAL NET ASSETS – 100.00%
|
$
|
54,247,803
|
100.00
|
%
|
||||||||
Percentages are stated as a percent of net assets.
|
(a)
|
The rate listed is the fund’s seven-day yield as of October 31, 2023.
|
Summary of Fair Value Exposure as of October 31, 2023
The following is a summary of the inputs used to value the Fund’s net assets as of October 31, 2023 (see Note 3 in the accompanying Notes to the Financial Statements):
|
Common Stocks
|
Level 1
|
Level 2
|
Level 3
|
Total
|
||||||||||||
|
Gathering & Processing
|
$
|
9,948,548
|
$
|
—
|
$
|
—
|
$
|
9,948,548
|
||||||||
|
Natural Gas/NGL Transportation
|
12,285,627
|
—
|
—
|
12,285,627
|
||||||||||||
|
Total Common Stocks
|
$
|
22,234,175
|
$
|
—
|
$
|
—
|
$
|
22,234,175
|
||||||||
|
Partnerships & Trusts
|
||||||||||||||||
|
Crude Oil and Refined Products
|
$
|
11,518,136
|
$
|
—
|
$
|
—
|
$
|
11,518,136
|
||||||||
|
Gathering & Processing
|
3,238,381
|
—
|
—
|
3,238,381
|
||||||||||||
|
Natural Gas/NGL Transportation
|
15,154,949
|
—
|
—
|
15,154,949
|
||||||||||||
|
Total Partnerships & Trusts
|
$
|
29,911,466
|
$
|
—
|
$
|
—
|
$
|
29,911,466
|
||||||||
|
Short-Term Investments
|
||||||||||||||||
|
Money Market Funds
|
$
|
1,390,442
|
$
|
—
|
$
|
—
|
$
|
1,390,442
|
||||||||
|
Total Short-Term Investments
|
$
|
1,390,442
|
$
|
—
|
$
|
—
|
$
|
1,390,442
|
||||||||
|
Total Investments
|
$
|
53,536,083
|
$
|
—
|
$
|
—
|
$
|
53,536,083
|
||||||||
The accompanying notes are an integral part of these financial statements.
|
WWW.HENNESSYFUNDS.COM
|
12
|
SCHEDULE OF INVESTMENTS/STATEMENT OF ASSETS AND LIABILITIES
|
Financial Statements
|
Statement of Assets and Liabilities as of October 31, 2023
|
|
ASSETS:
|
||||
|
Investments in securities, at value (cost $34,315,933)
|
$
|
53,536,083
|
||
|
Dividends and interest receivable
|
87,851
|
|||
|
Receivable for fund shares sold
|
127,203
|
|||
|
Return of capital receivable
|
603,427
|
|||
|
Deferred income tax
|
—
|
|||
|
Prepaid expenses and other assets
|
11,171
|
|||
|
Total assets
|
54,365,735
|
|||
|
LIABILITIES:
|
||||
|
Payable for fund shares redeemed
|
7,725
|
|||
|
Payable to advisor
|
48,287
|
|||
|
Payable to auditor
|
41,298
|
|||
|
Accrued distribution fees
|
2,429
|
|||
|
Accrued service fees
|
1,419
|
|||
|
Accrued trustees fees
|
5,720
|
|||
|
Accrued expenses and other payables
|
11,054
|
|||
|
Total liabilities
|
117,932
|
|||
|
NET ASSETS
|
$
|
54,247,803
|
||
|
NET ASSETS CONSISTS OF:
|
||||
|
Capital stock
|
$
|
58,128,279
|
||
|
Accumulated deficit
|
(3,880,476
|
)
|
||
|
Total net assets
|
$
|
54,247,803
|
||
|
NET ASSETS:
|
||||
|
Investor Class
|
||||
|
Shares authorized (no par value)
|
Unlimited
|
|||
|
Net assets applicable to outstanding shares
|
$
|
16,789,064
|
||
|
Shares issued and outstanding
|
1,675,645
|
|||
|
Net asset value, offering price, and redemption price per share
|
$
|
10.02
|
||
|
Institutional Class
|
||||
|
Shares authorized (no par value)
|
Unlimited
|
|||
|
Net assets applicable to outstanding shares
|
$
|
37,458,739
|
||
|
Shares issued and outstanding
|
3,593,059
|
|||
|
Net asset value, offering price, and redemption price per share
|
$
|
10.43
|
||
The accompanying notes are an integral part of these financial statements.
|
HENNESSY FUNDS
|
1-800-966-4354
|
13
Financial Statements
|
Statement of Operations for the year ended October 31, 2023
|
|
INVESTMENT INCOME:
|
||||
|
Distributions received from master limited partnerships
|
$
|
2,693,875
|
||
|
Return of capital on distributions received
|
(2,693,875
|
)
|
||
|
Dividend income(1)
|
707,540
|
|||
|
Interest income
|
29,223
|
|||
|
Total investment income
|
736,763
|
|||
|
EXPENSES:
|
||||
|
Investment advisory fees (See Note 5)
|
530,344
|
|||
|
Sub-transfer agent expenses – Investor Class (See Note 5)
|
32,152
|
|||
|
Sub-transfer agent expenses – Institutional Class (See Note 5)
|
31,865
|
|||
|
Administration, accounting, custody, and transfer agent fees (See Note 5)
|
55,789
|
|||
|
Audit fees
|
41,297
|
|||
|
Federal and state registration fees
|
34,838
|
|||
|
Compliance expense (See Note 5)
|
22,664
|
|||
|
Distribution fees – Investor Class (See Note 5)
|
20,828
|
|||
|
Trustees’ fees and expenses
|
20,364
|
|||
|
Reports to shareholders
|
13,944
|
|||
|
Service fees – Investor Class (See Note 5)
|
13,885
|
|||
|
Franchise tax expense
|
12,000
|
|||
|
Interest expense (See Note 7)
|
2,072
|
|||
|
Legal fees
|
1,554
|
|||
|
Income tax expense
|
900
|
|||
|
Other expenses
|
13,485
|
|||
|
Total expenses before waivers and reimbursements
|
847,981
|
|||
|
Service provider expense waiver (See Note 5)
|
(55,789
|
)
|
||
|
Expense reimbursement by advisor – Investor Class (See Note 5)
|
(19,218
|
)
|
||
|
Expense reimbursement by advisor – Institutional Class (See Note 5)
|
(93
|
)
|
||
|
Net expenses
|
772,881
|
|||
|
NET INVESTMENT LOSS
|
$
|
(36,118
|
)
|
|
|
REALIZED AND UNREALIZED GAINS (LOSSES):
|
||||
|
Net realized gain on investments
|
$
|
4,940,132
|
||
|
Net change in unrealized appreciation/depreciation on investments
|
2,693,911
|
|||
|
Income tax expense
|
—
|
|||
|
Net gain on investments
|
7,634,043
|
|||
|
NET INCREASE IN NET ASSETS RESULTING FROM OPERATIONS
|
$
|
7,597,925
|
||
|
(1)
|
Net of foreign taxes withheld of $5,024.
|
The accompanying notes are an integral part of these financial statements.
|
WWW.HENNESSYFUNDS.COM
|
14
|
STATEMENT OF OPERATIONS/STATEMENTS OF CHANGES IN NET ASSETS
|
Financial Statements
|
Statements of Changes in Net Assets
|
|
Year Ended
|
Year Ended
|
|||||||
|
October 31, 2023
|
October 31, 2022
|
|||||||
|
OPERATIONS:
|
||||||||
|
Net investment loss
|
$
|
(36,118
|
)
|
$
|
(246,112
|
)
|
||
|
Net realized gain on investments
|
4,940,132
|
2,241,454
|
||||||
|
Net change in unrealized
|
||||||||
|
appreciation/deprecation on investments
|
2,693,911
|
6,041,810
|
||||||
|
Net increase in net assets resulting from operations
|
7,597,925
|
8,037,152
|
||||||
|
DISTRIBUTIONS TO SHAREHOLDERS FROM:
|
||||||||
|
Distributable earnings – Investor Class
|
(1,196,626
|
)
|
(56,001
|
)
|
||||
|
Return of capital – Investor Class
|
(266,609
|
)
|
(932,728
|
)
|
||||
|
Distributable earnings – Institutional Class
|
(2,875,616
|
)
|
(205,718
|
)
|
||||
|
Return of capital – Institutional Class
|
(640,689
|
)
|
(3,426,419
|
)
|
||||
|
Total distributions
|
(4,979,540
|
)
|
(4,620,866
|
)
|
||||
|
CAPITAL SHARE TRANSACTIONS:
|
||||||||
|
Proceeds from shares subscribed – Investor Class
|
6,315,025
|
5,720,090
|
||||||
|
Proceeds from shares subscribed – Institutional Class
|
6,346,640
|
11,963,118
|
||||||
|
Dividends reinvested – Investor Class
|
1,090,514
|
840,503
|
||||||
|
Dividends reinvested – Institutional Class
|
3,298,865
|
3,393,598
|
||||||
|
Cost of shares redeemed – Investor Class
|
(2,904,969
|
)
|
(2,598,309
|
)
|
||||
|
Cost of shares redeemed – Institutional Class
|
(7,050,850
|
)
|
(15,368,206
|
)
|
||||
|
Net increase in net assets derived
|
||||||||
|
from capital share transactions
|
7,095,225
|
3,950,794
|
||||||
|
TOTAL INCREASE IN NET ASSETS
|
9,713,610
|
7,367,080
|
||||||
|
NET ASSETS:
|
||||||||
|
Beginning of year
|
44,534,193
|
37,167,113
|
||||||
|
End of year
|
$
|
54,247,803
|
$
|
44,534,193
|
||||
|
CHANGES IN SHARES OUTSTANDING:
|
||||||||
|
Shares sold – Investor Class
|
662,994
|
634,991
|
||||||
|
Shares sold – Institutional Class
|
637,501
|
1,295,385
|
||||||
|
Shares issued to holders as reinvestment
|
||||||||
|
of dividends – Investor Class
|
114,390
|
93,668
|
||||||
|
Shares issued to holders as reinvestment
|
||||||||
|
of dividends – Institutional Class
|
334,274
|
369,848
|
||||||
|
Shares redeemed – Investor Class
|
(299,262
|
)
|
(307,053
|
)
|
||||
|
Shares redeemed – Institutional Class
|
(716,204
|
)
|
(1,747,350
|
)
|
||||
|
Net increase in shares outstanding
|
733,693
|
339,489
|
||||||
The accompanying notes are an integral part of these financial statements.
|
HENNESSY FUNDS
|
1-800-966-4354
|
15
Financial Statements
|
Financial Highlights
|
For an Investor Class share outstanding throughout each year
PER SHARE DATA:
Net asset value, beginning of year
Income from investment operations:
Net investment loss(1)(2)
Net realized and unrealized gains (losses) on investments
Total from investment operations
Less distributions:
Dividends from net investment income
Dividends from return of capital
Total distributions
Net asset value, end of year
TOTAL RETURN
SUPPLEMENTAL DATA AND RATIOS:
Net assets, end of year (millions)
Ratio of expenses to average net assets:
Before expense reimbursement
After expense reimbursement
Ratio of net investment loss to average net assets:
Before expense reimbursement(2)
After expense reimbursement(2)
Portfolio turnover rate(4)
|
(1)
|
Calculated using the average shares outstanding method.
|
|
(2)
|
Includes current and deferred tax benefit/expense from net investment income/loss only.
|
|
(3)
|
Certain service provider expenses were voluntarily waived during the fiscal year.
|
|
(4)
|
Calculated on the basis of the Fund as a whole.
|
The accompanying notes are an integral part of these financial statements.
|
WWW.HENNESSYFUNDS.COM
|
16
|
FINANCIAL HIGHLIGHTS — INVESTOR CLASS
|
|
Year Ended October 31,
|
||||||||||||||||||
|
2023
|
2022
|
2021
|
2020
|
2019
|
||||||||||||||
|
$
|
9.58
|
$
|
8.66
|
$
|
5.55
|
$
|
10.90
|
$
|
12.66
|
|||||||||
|
(0.02
|
)
|
(0.07
|
)
|
(0.07
|
)
|
(0.10
|
)
|
(0.10
|
)
|
|||||||||
|
1.49
|
2.02
|
4.21
|
(4.22
|
)
|
(0.63
|
)
|
||||||||||||
|
1.47
|
1.95
|
4.14
|
(4.32
|
)
|
(0.73
|
)
|
||||||||||||
|
(0.84
|
)
|
(0.06
|
)
|
—
|
—
|
—
|
||||||||||||
|
(0.19
|
)
|
(0.97
|
)
|
(1.03
|
)
|
(1.03
|
)
|
(1.03
|
)
|
|||||||||
|
(1.03
|
)
|
(1.03
|
)
|
(1.03
|
)
|
(1.03
|
)
|
(1.03
|
)
|
|||||||||
|
$
|
10.02
|
$
|
9.58
|
$
|
8.66
|
$
|
5.55
|
$
|
10.90
|
|||||||||
|
16.39
|
%
|
24.03
|
%
|
78.41
|
%
|
-42.13
|
%
|
-6.28
|
%
|
|||||||||
|
$
|
16.79
|
$
|
11.47
|
$
|
6.72
|
$
|
3.81
|
$
|
9.20
|
|||||||||
|
2.03
|
%
|
2.05
|
%
|
2.11
|
%
|
2.12
|
%
|
1.89
|
%
|
|||||||||
|
1.78
|
%(3)
|
1.76
|
%(3)
|
1.76
|
%(3)
|
1.76
|
%(3)
|
1.76
|
%
|
|||||||||
|
(0.50
|
)%
|
(1.08
|
)%
|
(1.26
|
)%
|
(1.63
|
)%
|
(0.92
|
)%
|
|||||||||
|
(0.25
|
)%
|
(0.79
|
)%
|
(0.91
|
)%
|
(1.27
|
)%
|
(0.79
|
)%
|
|||||||||
|
16
|
%
|
33
|
%
|
40
|
%
|
53
|
%
|
41
|
%
|
|||||||||
The accompanying notes are an integral part of these financial statements.
|
HENNESSY FUNDS
|
1-800-966-4354
|
17
Financial Statements
|
Financial Highlights
|
For an Institutional Class share outstanding throughout each year
PER SHARE DATA:
Net asset value, beginning of year
Income from investment operations:
Net investment loss(1)(2)
Net realized and unrealized gains (losses) on investments
Total from investment operations
Less distributions:
Dividends from net investment income
Dividends from return of capital
Total distributions
Net asset value, end of year
TOTAL RETURN
SUPPLEMENTAL DATA AND RATIOS:
Net assets, end of year (millions)
Ratio of expenses to average net assets:
Before expense reimbursement
After expense reimbursement
Ratio of net investment loss to average net assets:
Before expense reimbursement(2)
After expense reimbursement(2)
Portfolio turnover rate(5)
|
(1)
|
Calculated using the average shares outstanding method.
|
|
(2)
|
Includes current and deferred tax benefit/expense from net investment income/loss only.
|
|
(3)
|
Amount is between $(0.005) and $0.005.
|
|
(4)
|
Certain service provider expenses were voluntarily waived during the fiscal year.
|
|
(5)
|
Calculated on the basis of the Fund as a whole.
|
The accompanying notes are an integral part of these financial statements.
|
WWW.HENNESSYFUNDS.COM
|
18
|
FINANCIAL HIGHLIGHTS — INSTITUTIONAL CLASS
|
|
Year Ended October 31,
|
||||||||||||||||||
|
2023
|
2022
|
2021
|
2020
|
2019
|
||||||||||||||
|
$
|
9.91
|
$
|
8.90
|
$
|
5.68
|
$
|
11.09
|
$
|
12.83
|
|||||||||
|
(0.00
|
)(3)
|
(0.05
|
)
|
(0.05
|
)
|
(0.10
|
)
|
(0.09
|
)
|
|||||||||
|
1.55
|
2.09
|
4.30
|
(4.28
|
)
|
(0.62
|
)
|
||||||||||||
|
1.55
|
2.04
|
4.25
|
(4.38
|
)
|
(0.71
|
)
|
||||||||||||
|
(0.84
|
)
|
(0.06
|
)
|
—
|
—
|
—
|
||||||||||||
|
(0.19
|
)
|
(0.97
|
)
|
(1.03
|
)
|
(1.03
|
)
|
(1.03
|
)
|
|||||||||
|
(1.03
|
)
|
(1.03
|
)
|
(1.03
|
)
|
(1.03
|
)
|
(1.03
|
)
|
|||||||||
|
$
|
10.43
|
$
|
9.91
|
$
|
8.90
|
$
|
5.68
|
$
|
11.09
|
|||||||||
|
16.67
|
%
|
24.41
|
%
|
78.57
|
%
|
-41.93
|
%
|
-6.10
|
%
|
|||||||||
|
$
|
37.46
|
$
|
33.06
|
$
|
30.45
|
$
|
18.33
|
$
|
31.78
|
|||||||||
|
1.65
|
%
|
1.69
|
%
|
1.74
|
%
|
1.79
|
%
|
1.56
|
%
|
|||||||||
|
1.53
|
%(4)
|
1.51
|
%(4)
|
1.51
|
%(4)
|
1.51
|
%(4)
|
1.51
|
%
|
|||||||||
|
(0.12
|
)%
|
(0.71
|
)%
|
(0.89
|
)%
|
(1.55
|
)%
|
(0.76
|
)%
|
|||||||||
|
(0.00
|
)%(3)
|
(0.53
|
)%
|
(0.66
|
)%
|
(1.27
|
)%
|
(0.71
|
)%
|
|||||||||
|
16
|
%
|
33
|
%
|
40
|
%
|
53
|
%
|
41
|
%
|
|||||||||
The accompanying notes are an integral part of these financial statements.
|
HENNESSY FUNDS
|
1-800-966-4354
|
19
Financial Statements
|
Notes to the Financial Statements October 31, 2023
|
1). ORGANIZATION
The Hennessy Midstream Fund (the “Fund”) is a series of Hennessy Funds Trust (the “Trust”), which was organized as a Delaware statutory trust on September 17, 1992. The Fund is an open-end management
investment company registered under the Investment Company Act of 1940, as amended. The investment objective of the Fund is to seek capital appreciation through distribution growth along with current income. The Fund is treated as a
regular corporation, or “C” corporation, for U.S. federal income tax purposes. Because the Fund is treated as a “C” corporation, it is not taxed as a regulated investment company under Subchapter M of the Code and is not required to
comply with the diversification requirements applicable to regulated investment companies. The Fund is a non-diversified fund.
The Fund offers Investor Class and Institutional Class shares. Each class of shares differs principally in its respective 12b-1 distribution and service, shareholder servicing, and
sub-transfer agent expenses. There are no sales charges. Each class has identical rights to earnings, assets, and voting privileges, except for class-specific expenses and exclusive rights to vote on matters affecting only one class.
As an investment company, the Fund follows the investment company accounting and reporting guidance of the Financial Accounting Standards Board (the “FASB”) Accounting Standard Codification
Topic 946 “Financial Services—Investment Companies.”
2). SIGNIFICANT ACCOUNTING POLICIES
The following is a summary of significant accounting policies consistently followed by the Fund in the preparation of the financial statements. These policies conform to U.S. generally accepted accounting
principles (“GAAP”).
|
a).
|
Securities Valuation – All investments in securities are valued in accordance with the Fund’s valuation policies and procedures, as described in Note 3.
|
|
b).
|
Federal Income Taxes – The Fund is taxed as a corporation and is obligated to pay U.S. federal and state income tax on its taxable income. Currently, the maximum marginal regular federal income tax
rate for a corporation is 21%. The Fund invests a substantial portion of its assets in master limited partnerships (“MLPs”), which are treated as partnerships for federal income tax purposes. As a limited partner in MLPs, the
Fund reports its allocable share of each MLP’s taxable income in computing its own taxable income.
|
|
The Fund includes any tax expense or benefit in the Statement of Operations based on the component of income or gains/losses to
which such expense or benefit relates. Deferred income taxes reflect the net tax effects of temporary differences between the carrying amount of assets and liabilities for financial reporting purposes and the carrying amount of
assets and liabilities for income tax purposes. The Fund recognizes a valuation allowance if, based on the weight of available evidence, it is more likely than not that the Fund will not realize some portion or all of the
deferred income tax assets. As of October 31, 2023, the Fund has placed a full valuation allowance on its deferred tax assets.
|
|
WWW.HENNESSYFUNDS.COM
|
20
|
NOTES TO THE FINANCIAL STATEMENTS
|
|
c).
|
Accounting for Uncertainty in Income Taxes – The Fund has accounting policies regarding recognition and measurement of tax positions taken or expected to be taken on a tax return. The tax returns of
the Fund for the prior three fiscal years are open for examination. The Fund has reviewed all open tax years in major tax jurisdictions and concluded that there is no impact on the Fund’s net assets and no tax liability
resulting from unrecognized tax benefits relating to uncertain income tax positions taken or expected to be taken on a tax return. The Fund files U.S. federal income tax returns and various state income tax returns.
|
|
d).
|
Income and Expenses – Dividend income is recognized on the ex-dividend date or as soon as information is available to the Fund. Interest income, which includes the amortization of premium and accretion
of discount, is recognized on an accrual basis. Market discounts, original issue discounts, and market premiums on debt securities are accreted or amortized to interest income over the life of a security with a corresponding
increase or decrease, as applicable, in the cost basis of such security using the yield-to-maturity method or, where applicable, the first call date of the security. Other non-cash dividends are recognized as investment income
at the fair value of the property received. The Fund is charged for those expenses that are directly attributable to its portfolio, such as advisory, administration, and certain shareholder service fees. Income, expenses (other
than expenses attributable to a specific class), and realized and unrealized gains/losses on investments are allocated to each class of shares based on such class’s net assets. Distributions received from the Fund’s investments
in MLPs generally consist of ordinary income, capital gains, and return of capital. The Fund records investment income on the ex-date of the distributions. For financial statement purposes, the Fund uses return of capital and
income estimates to allocate the dividend income received. Such estimates are based on historical information available from the MLPs and other industry sources. These estimates may subsequently be revised based on information
received from the MLPs after their tax reporting periods are concluded, as the actual character of these distributions is not known until after the fiscal year end of the Fund.
|
|
e).
|
Distributions to Shareholders – The Fund typically makes cash distributions to its shareholders quarterly at the beginning of the months of March, June, September, and December. Due to the tax
treatment of the Fund’s allocations and distributions from MLPs, a significant portion of the Fund’s distributions to shareholders typically is treated as return of capital to shareholders for U.S. federal income tax purposes
(i.e., as distributions in excess of the Fund’s current and accumulated earnings and profits as described below). However, no assurance can be given in this regard; just as the Fund’s corporate income tax liability can fluctuate
materially from year to year, the extent to which the Fund is able to make return-of-capital distributions also can vary materially from year to year depending on a number of different factors, including the composition of the
Fund’s portfolio, the level of allocations of net income and other tax items for the Fund from its underlying MLP investments, the length of time the Fund has owned the MLP equity securities in its portfolio, and the extent to
which the Fund disposes of MLP equity securities during a particular year, including to meet Fund shareholder redemption requests as necessary.
|
|
In general, a distribution constitutes a return of capital to a shareholder rather than a dividend to the extent such distribution
exceeds the Fund’s current and accumulated earnings and profits. The portion of any distribution treated as a return of capital constitutes a tax-free return of capital to the extent of a shareholder’s cost basis in Fund shares
and thereafter generally is taxable to the shareholder as a capital gain. A return-of-capital distribution also reduces the shareholder’s cost basis in Fund
|
|
HENNESSY FUNDS
|
1-800-966-4354
|
21
|
shares (but not below zero). A lower cost basis means that a shareholder recognizes more gain or less loss when the shareholder eventually sells Fund shares, which increases the shareholder’s tax
liability.
|
|
|
The Fund attempts to maintain a stable distribution rate and therefore may distribute more or less than the actual amount of cash
it receives from its investments in a particular period. Any undistributed cash would be available to supplement future distributions, and until distributed would increase the Fund’s net asset value (“NAV”). Correspondingly,
such amounts, once distributed, decrease the Fund’s NAV. In addition, the Fund may opt not to make distributions in quarters in which the Fund believes that a distribution could cause adverse tax consequences to shareholders,
including when the Fund believes that a distribution may not constitute a tax-free return of capital as described above.
|
|
|
f).
|
Security Transactions – Investment and shareholder transactions are recorded on the trade date. The Fund determines the realized gain/loss from an investment transaction by comparing the original cost
of the security lot sold with the net sale proceeds. Discounts and premiums on securities purchased are accreted or amortized, respectively, over the life of each such security.
|
|
g).
|
Use of Estimates – Preparing financial statements in accordance with GAAP requires management to make estimates and assumptions that affect the reported amounts of assets and liabilities and disclosure
of contingent assets and liabilities at the date of the financial statements, as well as the reported change in net assets during the reporting period. Actual results could differ from those estimates.
|
|
h).
|
Share Valuation – The NAV per share of the Fund is calculated by dividing (i) the total value of the securities held by the Fund, plus cash and other assets, minus all liabilities (including estimated
accrued expenses) by (ii) the total number of Fund shares outstanding, rounded to the nearest $0.01. Fund shares are not priced on days the New York Stock Exchange is closed for trading. The offering and redemption price per
share for the Fund is equal to the Fund’s NAV per share.
|
|
i).
|
Partnership Accounting Policy – To the extent the Fund receives distributions from underlying partnerships in which it invests, the Fund records its pro rata share of income/loss and capital
gains/losses and accordingly adjusts the cost basis of the underlying partnerships for return of capital.
|
|
j).
|
Illiquid Securities – Pursuant to Rule 22e-4 under the 1940 Act, the Fund has adopted a Liquidity Risk Management Program (the “Liquidity Program”). The Liquidity Program requires, among other things,
that the Fund limit its illiquid investments to no more than 15% of its net assets. An illiquid investment is any investment that the Fund reasonably expects cannot be sold or disposed of by the Fund in current market conditions
in seven calendar days or less without the sale or disposition significantly changing the market value of the investment.
|
|
k).
|
Recent Accounting Pronouncements and Regulatory Updates – In October 2022, the Securities and Exchange Commission (“SEC”) adopted a final rule relating to Tailored Shareholder Reports for Mutual Funds
and Exchange-Traded Funds (ETFs); Fee Information in Investment Company Advertisements. The rule and form amendments will require mutual funds and ETFs to transmit concise and visually engaging shareholder reports that highlight
key information. The amendments also will require that funds tag information in a structured data format. In addition, the rule amendments will require that certain more in-depth information be made available online and
available for delivery free of charge to investors on request. The amendments became effective January 24, 2023. There is an 18-month transition period after the effective date of the amendment.
|
|
WWW.HENNESSYFUNDS.COM
|
22
|
NOTES TO THE FINANCIAL STATEMENTS
|
|
In June 2022, the FASB issued Accounting Standards Update (“ASU”) 2022-03, Fair Value Measurement (Topic 820): Fair Value
Measurement of Equity Securities Subject to Contractual Sale Restrictions. The ASU clarifies that a contractual restriction on the sale of an equity security is not considered part of the unit of account of the equity security
and, therefore, is not considered in measuring the fair value. The amendments also require additional disclosures related to equity securities subject to contractual sale restrictions. The ASU is effective for fiscal years
beginning after December 15, 2023, and interim periods within those fiscal years.
|
3). SECURITIES VALUATION
The Fund follows its valuation policies and procedures in determining its NAV and, in preparing these financial statements, the fair value accounting standards that establish an authoritative definition of
fair value and set out a hierarchy for measuring fair value. These standards require additional disclosures about the various inputs and valuation techniques used to develop the measurements of fair value and a discussion of changes in
valuation techniques and related inputs during the period. These inputs are summarized in the three broad levels listed below:
|
Level 1 –
|
Unadjusted, quoted prices in active markets for identical instruments that the Fund has the ability to access at the date of measurement.
|
|
|
Level 2 –
|
Other significant observable inputs other than quoted prices included in Level 1 (including, but not limited to, quoted prices in active markets for similar instruments, quoted prices in markets that
are not active for identical or similar instruments, and model-derived valuations in which all significant inputs and significant value drivers are observable in active markets, such as interest rates, prepayment speeds, credit
risk curves, default rates, and similar data).
|
|
|
Level 3 –
|
Significant unobservable inputs (including the Fund’s own assumptions about what market participants would use to price the asset or liability based on the best available information) when observable
inputs are unavailable.
|
The following is a description of the valuation techniques applied to the Fund’s major categories of assets and liabilities on a recurring basis:
|
Equity Securities – Equity securities, including common stocks, preferred stocks, foreign-issued common stocks, exchange-traded funds, closed-end mutual funds,
partnerships, rights, MLPs, and real estate investment trusts, that are traded on a securities exchange for which a last-quoted sales price is readily available generally are valued at the last sales price as reported by the
primary exchange on which the securities are listed. Securities listed on The Nasdaq Stock Market (“Nasdaq”) generally are valued at the Nasdaq Official Closing Price, which may differ from the last sales price reported.
Securities traded on a securities exchange for which a last-quoted sales price is not readily available generally are valued at the mean between the bid and ask prices. To the extent these securities are actively traded and
valuation adjustments are not applied, they are classified in Level 1 of the fair value hierarchy. Securities traded on foreign exchanges generally are not valued at the same time the Fund calculates its NAV because most foreign
markets close well before such time. The earlier close of most foreign markets gives rise to the possibility that significant events, including broad market moves, may have occurred in the interim. In certain circumstances, it
may be determined that a foreign security needs to be fair valued because it appears that the value of the security might have been materially affected
|
|
HENNESSY FUNDS
|
1-800-966-4354
|
23
|
by events occurring after the close of the market in which the security is principally traded, but before the time the Fund calculates its NAV, such as by a development that affects an entire market or
region (e.g., a weather-related event) or a potentially global development (e.g., a terrorist attack that may be expected to have an effect on investor expectations worldwide).
|
|
|
Registered Investment Companies – Investments in open-end registered investment companies, commonly referred to as mutual funds, generally are priced at the
ending NAV provided by the applicable mutual fund’s service agent and are classified in Level 1 of the fair value hierarchy.
|
|
|
Debt Securities – Debt securities, including corporate bonds, asset-backed securities, mortgage-backed securities, municipal bonds, U.S. Treasuries, and U.S.
government agency issues, are generally valued at market on the basis of valuations furnished by an independent pricing service that utilizes both dealer-supplied valuations and formula-based techniques. The pricing service may
consider recently executed transactions in securities of the issuer or comparable issuers, market price quotations (where observable), bond spreads, and fundamental data relating to the issuer. In addition, the model may
incorporate observable market data, such as reported sales of similar securities, broker quotes, yields, bids, offers, and reference data. Certain securities are valued primarily using dealer quotations. These securities are
generally classified in Level 2 of the fair value hierarchy.
|
|
|
Short-Term Securities – Short-term equity investments, including money market funds, are valued in the manner specified above for equity securities. Short-term
debt investments with an original term to maturity of 60 days or less are valued at amortized cost, which approximates fair market value. If the original term to maturity of a short-term debt investment exceeds 60 days, then the
values as of the 61st day prior to maturity are amortized. Amortized cost is not used if its use would be inappropriate due to credit or other impairments of the issuer, in which case the security’s fair value would be
determined as described below. Short-term securities are generally classified in Level 1 or Level 2 of the fair value hierarchy depending on the inputs used and market activity levels for specific securities.
|
If market quotations are not readily available or if a significant event has occurred that indicates the closing price of a security no longer represents the true value of that security, any
security or other asset will be valued at its fair value in accordance with Rule 2a-5 under the 1940 Act. The Board of Trustees of the Fund (the “Board”) has designated Hennessy Advisors, Inc. (the “Advisor”) as the Fund’s valuation
designee to make all fair value determinations with respect to the Fund’s portfolio investments under the Fund’s fair value pricing procedures, subject to the Board’s oversight. There are numerous criteria considered in determining a
fair value of a security, such as the trading volume of a security and markets, the values of other similar securities, and news events with direct bearing on a security or markets. Fair value pricing results in an estimated price for a
security that reflects the amount the Fund might reasonably expect to receive in a current sale. Depending on the relative significance of the valuation inputs, these securities may be classified in either Level 2 or Level 3 of the fair
value hierarchy. The Advisor will regularly evaluate whether the Fund’s fair value pricing procedures continue to be appropriate in light of the specific circumstances of the Fund and the quality of prices obtained through their
application of such procedures.
The fair value of foreign securities may be determined with the assistance of a pricing service using correlations between the movement of prices of such securities and indices of domestic
securities and other appropriate indicators, such as closing market prices of
|
WWW.HENNESSYFUNDS.COM
|
24
|
NOTES TO THE FINANCIAL STATEMENTS
|
relevant American Depositary Receipts or futures contracts. Using fair value pricing means that the Fund’s NAV reflects the affected portfolio securities’ values as determined by the Advisor, the Board’s
valuation designee, pursuant to the Fund’s fair value pricing procedures, instead of being determined by the market. Using a fair value pricing methodology to price a foreign security may result in a value that is different from such
foreign security’s most recent closing price and from the value used by other investment companies to calculate their NAVs. Such securities are generally classified in Level 2 of the fair value hierarchy. Because the Fund may invest in
foreign securities, the value of the Fund’s portfolio securities may change on days when a shareholder is unable to purchase or redeem Fund shares.
The Fund has performed an analysis of all existing investments to determine the significance and character of all inputs to their fair value determinations. Various inputs are used to
determine the value of the Fund’s investments. The inputs or methodology used for valuing securities are not necessarily an indication of the risk associated with investing in those securities. Details related to the fair value
hierarchy of the Fund’s securities as of October 31, 2023, are included in the Schedule of Investments.
4). INVESTMENT TRANSACTIONS
Purchases and sales of investment securities (excluding government and short-term investments) for the Fund during fiscal year 2023 were $12,735,328 and $7,514,902, respectively.
There were no purchases or sales/maturities of long-term U.S. government securities for the Fund during fiscal year 2023.
5). INVESTMENT ADVISORY FEE AND OTHER TRANSACTIONS WITH AFFILIATES
The Advisor provides the Fund with investment advisory services under an Investment Advisory Agreement. The Advisor furnishes all investment advice, office space, and facilities and most of the personnel
needed by the Fund. As compensation for its services, the Advisor is entitled to a monthly fee from the Fund. The fee is based on the average daily net assets of the Fund at an annual rate of 1.10%. The net investment advisory fees
expensed by the Fund during fiscal year 2023 are included in the Statement of Operations.
The Advisor has contractually agreed to limit total annual operating expenses to 1.75% of the Fund’s net assets for Investor Class shares and 1.50% of the Fund’s net assets for Institutional
Class shares (in each case, excluding all federal, state, and local taxes, interest, brokerage commissions, dividend and interest expenses on short sales, extraordinary items, and acquired fund fees and expenses and other costs incurred
in connection with the purchase and sale of securities) through February 28, 2024.
For three years following the date on which expenses were waived or incurred, the Advisor may recoup waived or reimbursed expenses from the Fund if total operating expenses, including such
recoupment, does not exceed the expense limitation in effect (i) at the time the Advisor waived or reimbursed such expenses and (ii) at the time the Advisor recoups such expenses. As of October 31, 2023, expenses subject to potential
recovery for Investor Class and Institutional Class shares and the fiscal years in which they expire were as follows:
|
Fiscal Year
|
Fiscal Year
|
Fiscal Year
|
|||
|
2024
|
2025
|
2026
|
Total
|
||
|
Investor Class
|
$12,376
|
$13,391
|
$19,218
|
$44,985
|
|
|
Institutional Class
|
$26,693
|
$11,840
|
$ 2,585
|
$41,118
|
|
HENNESSY FUNDS
|
1-800-966-4354
|
25
The amount of the expense reimbursement by the Advisor for Institutional Class shares set forth in the Statement of Operations is net of $2,492 that the Advisor recouped from the Fund during
fiscal year 2023.
The Board has approved a Shareholder Servicing Agreement for Investor Class shares of the Fund, which compensates the Advisor for the non-investment advisory services it provides to the
Fund. The Shareholder Servicing Agreement provides for a monthly fee paid to the Advisor at an annual rate of 0.10% of the average daily net assets of the Fund attributable to Investor Class shares. The shareholder service fees expensed
by the Fund during fiscal year 2023 are included in the Statement of Operations.
The Fund has adopted a plan pursuant to Rule 12b-1 under the Investment Company Act of 1940, as amended, that authorizes payments in connection with the distribution of Fund shares at an
annual rate of up to 0.25% of the Fund’s average daily net assets attributable to Investor Class shares. Even though the authorized rate is up to 0.25%, the Fund is currently only using up to 0.15% of its average daily net assets
attributable to Investor Class shares for such purpose. Amounts paid under the plan may be spent on any activities or expenses primarily intended to result in the sale of shares, including, but not limited to, advertising, shareholder
account servicing, printing and mailing of prospectuses to other than current shareholders, printing and mailing of sales literature, and compensation for sales and marketing activities or to financial institutions and others, such as
dealers and distributors. The distribution fees expensed by the Fund during fiscal year 2023 are included in the Statement of Operations.
The Fund has entered into agreements with various brokers, dealers, and financial intermediaries in connection with the sale of Fund shares. The agreements provide for periodic payments of
sub-transfer agent expenses by the Fund to the brokers, dealers, and financial intermediaries for providing certain shareholder maintenance services. These shareholder services include the pre-processing and quality control of new
accounts, shareholder correspondence, answering customer inquiries regarding account status, and facilitating shareholder telephone transactions. The sub-transfer agent fees expensed by the Fund during fiscal year 2023 are included in
the Statement of Operations.
U.S. Bancorp Fund Services, LLC, d/b/a U.S. Bank Global Fund Services (“Fund Services”) provides the Fund with administrative, accounting, and transfer agent services. As administrator, Fund
Services is responsible for activities such as (i) preparing various federal and state regulatory filings, reports, and returns for the Fund, (ii) preparing reports and materials to be supplied to the Board, (iii) monitoring the
activities of the Fund’s custodian, transfer agent, and accountants, and (iv) coordinating the preparation and payment of the Fund’s expenses and reviewing the Fund’s expense accruals. U.S. Bank N.A., an affiliate of Fund Services,
serves as the Fund’s custodian. The servicing agreements between the Trust, Fund Services, and U.S. Bank N.A. contain a fee schedule that is inclusive of administrative, accounting, custody, and transfer agent fees. The administrative,
accounting, custody, and transfer agent fees expensed by the Fund during fiscal year 2023, are included in the Statement of Operations. Fund Services has voluntarily waived all or a portion of its fees for the Fund. The fees voluntarily
waived by Fund Services during fiscal year 2023 are included in the Statement of Operations.
Quasar Distributors, LLC, a wholly owned broker-dealer subsidiary of Foreside Financial Group, LLC, acts as the Fund’s principal underwriter in a continuous public offering of Fund shares.
The officers of the Fund are affiliated with the Advisor. With the exception of the Chief Compliance Officer, such officers receive no compensation from the Fund for serving in their
respective roles. The Fund, along with the other funds in the Hennessy Funds family
|
WWW.HENNESSYFUNDS.COM
|
26
|
NOTES TO THE FINANCIAL STATEMENTS
|
(collectively, the “Hennessy Funds”), makes reimbursement payments on an equal basis to the Advisor for a portion of the salary and benefits associated with the office of the Chief Compliance Officer. The
compliance fees expensed by the Fund during fiscal year 2023 for reimbursement payments to the Advisor are included in the Statement of Operations.
6). GUARANTEES AND INDEMNIFICATIONS
Under the Hennessy Funds’ organizational documents, their officers and trustees are indemnified by the Hennessy Funds against certain liabilities arising out of the performance of their duties to the Hennessy
Funds. Additionally, in the normal course of business, the Hennessy Funds enter into contracts with service providers that contain general indemnification clauses. The Fund’s maximum exposure under these arrangements is unknown as this
would involve future claims that may be made against the Fund that have not yet occurred. Currently, the Fund expects the risk of loss to be remote.
7). LINE OF CREDIT
The Fund has an uncommitted line of credit with the other Hennessy Funds in the amount of the lesser of (i) $100,000,000 or (ii) 33.33% of each Hennessy Fund’s net assets, or 30% for the Hennessy Gas Utility
Fund, the Hennessy Japan Fund, and the Hennessy Japan Small Cap Fund and 10% for the Hennessy Balanced Fund. The line of credit is intended to provide any necessary short-term financing in connection with shareholder redemptions,
subject to certain restrictions. The credit facility is with the Hennessy Funds’ custodian bank, U.S. Bank N.A. Borrowings under this arrangement bear interest at the bank’s prime rate and are secured by all of the Fund’s assets (as to
its own borrowings only). During fiscal year 2023, the Fund had an outstanding average daily balance and a weighted average interest rate of $24,882 and 8.21%, respectively. The interest expensed by the Fund during fiscal year 2023 is
included in the Statement of Operations. The maximum amount outstanding for the Fund during fiscal year 2023 was $771,000. As of October 31, 2023, the Fund did not have any borrowings outstanding under the line of credit.
8). FEDERAL TAX INFORMATION
As of October 31, 2023, the components of accumulated earnings (losses) for income tax purposes were as follows:
|
Investments
|
|||||
|
Cost of investments for tax purposes
|
$
|
30,493,623
|
|||
|
Gross tax unrealized appreciation
|
$
|
23,069,245
|
|||
|
Gross tax unrealized depreciation
|
(26,785
|
)
|
|||
|
Net tax unrealized appreciation/(depreciation)
|
$
|
23,042,460
|
|||
|
As of October 31, 2023, deferred tax assets consisted of the following:
|
|||||
|
Deferred tax assets (liabilities):
|
|||||
|
Net operating losses
|
$
|
635,317
|
|||
|
Capital loss
|
3,540,860
|
||||
|
Unrealized (gain) loss on investments
|
(3,807,967
|
)
|
|||
|
Total deferred tax assets, net
|
368,210
|
||||
|
Valuation allowance
|
(368,210
|
)
|
|||
|
Net
|
$
|
—
|
|||
For fiscal year 2023, the Fund had an effective tax rate of 0% and a federal statutory rate of 21%, with the difference resulting from a change in the balances of the deferred tax assets and
liability and the related valuation allowance applied against the deferred tax assets and liability.
|
HENNESSY FUNDS
|
1-800-966-4354
|
27
Deferred income tax assets and liabilities are recorded for differences between the financial statement and tax basis of the assets and liabilities that will result in taxable or deductible
amounts in the future based on enacted laws and rates applicable to the periods in which the differences are expected to affect taxable income. Valuation allowances are established when necessary to reduce deferred tax assets to the
amount expected to be realized. The Fund has evaluated the available evidence supporting the realization of its gross deferred tax assets, including the amount and timing of future taxable income, and has determined that, based on net
losses to date, it may not utilize all of its deferred tax assets in the future. As of October 31, 2023, the Fund established a valuation allowance in the amount of $368,210 against its net deferred tax assets.
The Fund may carry forward any net capital loss five years to offset any future realized capital gains. The Fund may carry forward indefinitely any net operating loss arising in a tax year
ending after December 31, 2018. As of October 31, 2023, the Fund had $15,769,180 in capital loss carryforwards that expire as follows:
|
Amount
|
Expiration
|
||
|
$8,590,317
|
10/31/2024
|
||
|
7,178,863
|
10/31/2025
|
As of October 31, 2023, the Fund had $2,856,952 in net operating loss carryforwards that expire as follows:
|
Amount
|
Expiration
|
||
|
$2,856,952
|
Indefinite
|
Total income taxes have been computed by applying the federal statutory income tax rate of 21% plus a blended state income tax rate. The Fund applied this effective rate to net investment
income and realized and unrealized gains on investments before taxes in computing its total income taxes.
|
Tax expense (benefit) at statutory rates
|
$
|
1,598,084
|
|||
|
State income tax expense, net of federal benefit
|
56,626
|
||||
|
Tax expense (benefit) on permanent items(1)
|
(58,741
|
)
|
|||
|
Tax expense (benefit) due to change in effective state rates
|
—
|
||||
|
Total current tax expense (benefit)
|
—
|
||||
|
Change in valuation allowance
|
(1,595,969
|
)
|
|||
|
Total tax expense
|
$
|
—
|
|||
|
(1) Permanent items consist of dividends-received deductions.
|
The Fund recognizes the tax benefits of uncertain tax positions only where the position is “more likely than not” to be sustained assuming examination by tax authorities. Management has
analyzed the Fund’s tax positions in all open tax years and has concluded that no liability for unrecognized tax benefits should be recorded related to uncertain tax positions taken on U.S. federal tax returns and state tax returns
filed or expected to be filed. No income tax returns are currently under examination. Generally, the tax returns of the Fund for the prior three fiscal years are open for examination. Due to the nature of the Fund’s investments, the
Fund may be required to file income tax returns in several states. The Fund is not aware of any tax positions for which it is reasonably possible that the total amounts of unrecognized tax benefits will change materially.
|
WWW.HENNESSYFUNDS.COM
|
28
|
NOTES TO THE FINANCIAL STATEMENTS
|
During fiscal years 2023 (estimated) and 2022, the tax character of distributions paid by the Fund was as follows:
|
Year Ended
|
Year Ended
|
||||||||
|
October 31, 2023
|
October 31, 2022
|
||||||||
|
Ordinary income(1)
|
$
|
4,072,242
|
$
|
261,719
|
|||||
|
Long-term capital gains
|
—
|
—
|
|||||||
|
Return of capital
|
907,298
|
4,359,147
|
|||||||
|
Total distributions
|
$
|
4,979,540
|
$
|
4,620,866
|
|||||
|
(1) Ordinary income includes short-term capital gains.
|
|||||||||
9). GLOBAL EVENTS
A rise in protectionist trade policies, the possibility of a national or global recession, risks associated with pandemic and epidemic diseases, trade tensions, the possibility of changes to some international
trade agreements, political events, and continuing political tension and armed conflicts may adversely impact financial markets and the broader economy. For example, ongoing armed conflicts between Ukraine and Russia in Europe and among
Israel, Hamas, and other militant groups in the Middle East have caused and could continue to cause significant market disruptions and volatility with the markets in Europe and the Middle East, and have had negative impacts on markets
in the United States. These events could also have negative effects on the Fund’s investments that cannot be foreseen at the present time. As global systems, economies and financial markets are increasingly interconnected, events that
once had only local impact are now more likely to have regional or even global effects. Events that occur in one country, region or financial market will, more frequently, adversely impact issuers in other countries, regions, or
markets. These impacts can be exacerbated by failures of governments and societies to adequately respond to an emerging event or threat. Your investment would be negatively impacted if the value of your portfolio holdings decreases as a
result of such events, if these events adversely impact the operations and effectiveness of the Advisor or other key service providers or if these events disrupt systems and processes necessary or beneficial to the management of
accounts. These events may negatively impact broad segments of businesses and populations and could have a significant and rapid negative impact on the performance of the Fund’s investments, increase the Fund’s volatility, or exacerbate
pre-existing risks to the Fund.
10). EVENTS SUBSEQUENT TO YEAR END
Management has evaluated the Fund’s related events and transactions that occurred subsequent to October 31, 2023, through the date of issuance of the Fund’s financial statements. Other than as disclosed below,
management has determined that there were no subsequent events requiring recognition or disclosure in the financial statements.
On December 1, 2023, distributions were declared and paid to shareholders of record on November 30, 2023, as follows:
|
Return of Capital
|
||
|
Investor Class
|
$0.2575
|
|
|
Institutional Class
|
$0.2575
|
|
HENNESSY FUNDS
|
1-800-966-4354
|
29
Report of Independent Registered Public
Accounting Firm
To the Board of Trustees of Hennessy Funds Trust
and the shareholders of the Hennessy Midstream Fund
Novato, CA
Opinion on the Financial Statements
We have audited the accompanying statement of assets and liabilities of the Hennessy Midstream Fund (the “Fund”), a series of Hennessy Funds Trust, including the schedule of investments, as of October 31,
2023, the related statement of operations for the year then ended, the statements of changes in net assets for each of the two years in the period then ended, and financial highlights for each of the five years in the period then
ended,, and the related notes (collectively referred to as the “financial statements”). In our opinion, the financial statements present fairly, in all material respects, the financial position of the Fund as of October 31, 2023, the
results of its operations for the year then ended, the changes in its net assets for each of the two years in the period then ended, and the financial highlights for each of the five years in the period then ended, in conformity with
accounting principles generally accepted in the United States of America.
Basis for Opinion
These financial statements are the responsibility of the Fund’s management. Our responsibility is to express an opinion on the Fund’s financial statements based on our audits. We are a public accounting firm
registered with the Public Company Accounting Oversight Board (United States) (“PCAOB”) and are required to be independent with respect to the Fund in accordance with the U.S. federal securities laws and the applicable rules and
regulations of the Securities and Exchange Commission and the PCAOB. We have served as the auditor of one or more of the funds in the Trust since 2002.
We conducted our audits in accordance with the standards of the PCAOB. Those standards require that we plan and perform the audit to obtain reasonable assurance about whether the financial statements are free
of material misstatement, whether due to error or fraud. The Fund is not required to have, nor were we engaged to perform, an audit of its internal control over financial reporting. As part of our audits we are required to obtain an
understanding of internal control over financial reporting, but not for the purpose of expressing an opinion on the effectiveness of the Fund’s internal control over financial reporting. Accordingly, we express no such opinion.
Our audits included performing procedures to assess the risks of material misstatement of the financial statements, whether due to error or fraud, and performing procedures that respond to those risks. Such
procedures included examining, on a test basis, evidence regarding the amounts and disclosures in the financial statements. Our audits also included evaluating the accounting principles used and significant estimates made by management,
as well as evaluating the overall presentation of the financial statements. Our procedures included confirmation of securities owned as of October 31, 2023, by correspondence with the custodian. We believe that our audits provide a
reasonable basis for our opinion.
|
|
|
TAIT, WELLER & BAKER LLP
|
Philadelphia, Pennsylvania
December 22, 2023
|
WWW.HENNESSYFUNDS.COM
|
30
|
REPORT OF INDEPENDENT REGISTERED PUBLIC ACCOUNTING FIRM/TRUSTEES AND OFFICERS
|
Trustees and Officers of the Fund (Unaudited)
The business and affairs of the Funds are managed under the direction of the Board of Trustees of the Trust, and the Board of Trustees elects the officers of the Trust (“Officers”). From time to time, the
Board of Trustees also has appointed advisers to the Board of Trustees (“Advisers”) with the intention of having qualified individuals serve in an advisory capacity to garner experience in the mutual fund and asset management industry
and be considered as potential Trustees in the future. There are currently two Advisers, Brian Alexander and A.J. Hennessy. As Advisers, Mr. Alexander and Mr. A.J. Hennessy attend meetings of the Board of Trustees and act as non-voting
participants. Information pertaining to the Trustees, Advisers, and the Officers of the Trust is set forth below. The Trustees and Officers serve until their successors are duly elected and qualified or until their earlier death,
resignation, or removal. Each Trustee oversees all 17 Hennessy Funds. Unless otherwise indicated, the address of all persons listed below is 7250 Redwood Boulevard, Suite 200, Novato, CA 94945. The Fund’s Statement of Additional
Information includes more information about the persons listed below and is available without charge by calling 800-966-4354 or by visiting www.hennessyfunds.com.
|
Other
|
|||
|
Directorships
|
|||
|
Held Outside
|
|||
|
Name, Age,
|
of Fund
|
||
|
and Position Held
|
Start Date
|
Principal Occupation(s)
|
Complex During
|
|
with the Trust
|
of Service
|
During Past Five Years
|
Past Five Years
|
|
Disinterested Trustees(1) and Disinterested Advisers
|
|||
|
J. Dennis DeSousa
|
January 1996
|
Mr. DeSousa is a real estate investor.
|
None.
|
|
87
|
|||
|
Trustee
|
|||
|
Robert T. Doyle
|
January 1996
|
Mr. Doyle is retired. He served as the
|
None.
|
|
76
|
Sheriff of Marin County, California
|
||
|
Trustee
|
from 1996 to June 2022.
|
||
|
Doug Franklin
|
March 2016
|
Mr. Franklin is a retired insurance
|
None.
|
|
59
|
as an Adviser
|
industry executive. From 1987
|
|
|
Trustee
|
to the Board
|
through 2015, he was employed by
|
|
|
and June 2023
|
the Allianz-Fireman’s Fund Insurance
|
||
|
as a Trustee
|
Company in various positions,
|
||
|
including as its Chief Actuary and
|
|||
|
Chief Risk Officer.
|
|||
|
Claire Garvie
|
December 2015
|
Ms. Garvie is a founder of Kiosk and
|
None.
|
|
49
|
as an Adviser
|
has served as its Chief Operating
|
|
|
Trustee
|
to the Board and
|
Officer since 2004. Kiosk is a
|
|
|
December 2021
|
full-service marketing agency with
|
||
|
as a Trustee
|
offices in the San Francisco Bay Area
|
||
|
and Liverpool, UK and staff across
|
|||
|
nine states in the U.S.
|
|||
|
HENNESSY FUNDS
|
1-800-966-4354
|
31
|
Other
|
|||
|
Directorships
|
|||
|
Held Outside
|
|||
|
Name, Age,
|
of Fund
|
||
|
and Position Held
|
Start Date
|
Principal Occupation(s)
|
Complex During
|
|
with the Trust
|
of Service
|
During Past Five Years
|
Past Five Years
|
|
Gerald P. Richardson
|
May 2004
|
Mr. Richardson is an independent
|
None.
|
|
78
|
consultant in the securities industry.
|
||
|
Trustee
|
|||
|
Brian Alexander
|
March 2015
|
Mr. Alexander has served as the
|
None.
|
|
42
|
Chief Operating Officer of Solis
|
||
|
Adviser to the Board
|
Mammography since March 2023.
|
||
|
Prior to that, he worked for the
|
|||
|
Sutter Health organization from
|
|||
|
2011 to 2023 in various positions.
|
|||
|
He served as the Chief Executive
|
|||
|
Officer of the North Valley Hospital
|
|||
|
Area from 2021 to March 2023.
|
|||
|
From 2018 to 2021, he served as the
|
|||
|
Chief Executive Officer of Sutter
|
|||
|
Roseville Medical Center. From 2016
|
|||
|
through 2018, he served as the Vice
|
|||
|
President of Strategy for the Sutter
|
|||
|
Health Valley Area, which includes
|
|||
|
11 hospitals, 13 ambulatory surgery
|
|||
|
centers, 16,000 employees, and
|
|||
|
1,900 physicians.
|
|||
|
Interested Trustee and Interested Adviser(2)
|
|||
|
Neil J. Hennessy
|
January 1996 as
|
Mr. Neil Hennessy has been employed
|
Hennessy
|
|
67
|
a Trustee and
|
by Hennessy Advisors, Inc. since
|
Advisors, Inc.
|
|
Chairman of the Board,
|
June 2008 as
|
1989 and currently serves as its
|
|
|
Chief Market Strategist,
|
an Officer
|
Chairman and Chief Executive Officer.
|
|
|
Portfolio Manager,
|
|||
|
and President
|
|||
|
A.J. Hennessy
|
December 2022
|
Mr. A.J. Hennessy has been employed
|
None.
|
|
37
|
by Hennessy Advisors, Inc. since 2011.
|
||
|
Adviser to the Board
|
|||
|
and Vice President,
|
|||
|
Corporate Development
|
|||
|
and Operations
|
|||
|
WWW.HENNESSYFUNDS.COM
|
32
|
TRUSTEES AND OFFICERS OF THE FUND
|
|
Name, Age,
|
||
|
and Position Held
|
Start Date
|
Principal Occupation(s)
|
|
with the Trust
|
of Service
|
During Past Five Years
|
|
Officers
|
||
|
Teresa M. Nilsen
|
January 1996
|
Ms. Nilsen has been employed by Hennessy Advisors, Inc.
|
|
57
|
since 1989 and currently serves as its President, Chief
|
|
|
Executive Vice President
|
Operating Officer, and Secretary.
|
|
|
and Treasurer
|
||
|
Daniel B. Steadman
|
March 2000
|
Mr. Steadman has been employed by Hennessy Advisors, Inc.
|
|
67
|
since 2000 and currently serves as its Executive Vice President.
|
|
|
Executive Vice President
|
||
|
and Secretary
|
||
|
Brian Carlson
|
December 2013
|
Mr. Carlson has been employed by Hennessy Advisors, Inc.
|
|
51
|
since December 2013 and currently serves as its Chief
|
|
|
Senior Vice President
|
Compliance Officer and Senior Vice President.
|
|
|
and Head of Distribution
|
||
|
David Ellison(3)
|
October 2012
|
Mr. Ellison has been employed by Hennessy Advisors, Inc.
|
|
65
|
since October 2012. He has served as a Portfolio Manager of
|
|
|
Senior Vice President
|
the Hennessy Large Cap Financial Fund and the Hennessy
|
|
|
and Portfolio Manager
|
Small Cap Financial Fund since their inception. Mr. Ellison also
|
|
|
served as a Portfolio Manager of the Hennessy Technology
|
||
|
Fund from its inception until February 2017. Mr. Ellison served
|
||
|
as Director, CIO, and President of FBR Fund Advisers, Inc.
|
||
|
from December 1999 to October 2012.
|
||
|
Jennifer Emerson(4)
|
June 2013
|
Ms. Emerson has been employed by Hennessy Advisors, Inc.
|
|
46
|
as its General Counsel since June 2013.
|
|
|
Senior Vice President and
|
||
|
Chief Compliance Officer
|
||
|
Ryan Kelley(5)
|
March 2013
|
Mr. Kelley has been employed by Hennessy Advisors, Inc. since
|
|
51
|
October 2012. He has served as Chief Investment Officer of the
|
|
|
Senior Vice President,
|
Hennessy Funds since March 2021 and has served as a Portfolio
|
|
|
Chief Investment Officer,
|
Manager of the Hennessy Gas Utility Fund, the Hennessy Large
|
|
|
and Portfolio Manager
|
Cap Financial Fund, and the Hennessy Small Cap Financial Fund
|
|
|
since October 2014. Mr. Kelley served as Co-Portfolio Manager
|
||
|
of these same funds from March 2013 through September
|
||
|
2014 and as a Portfolio Analyst for the Hennessy Funds from
|
||
|
October 2012 through February 2013. He has also served as a
|
||
|
Portfolio Manager of the Hennessy Cornerstone Growth Fund,
|
||
|
the Hennessy Cornerstone Mid Cap 30 Fund, the Hennessy
|
||
|
Cornerstone Large Growth Fund, and the Hennessy
|
||
|
Cornerstone Value Fund since February 2017 and as a Portfolio
|
||
|
Manager of the Hennessy Total Return Fund, the Hennessy
|
||
|
Balanced Fund, and the Hennessy Technology Fund since May
|
||
|
2018. He previously served as Co-Portfolio Manager of the
|
||
|
Hennessy Technology Fund from February 2017 until May 2018.
|
||
|
Mr. Kelley served as Portfolio Manager of FBR Fund
|
||
|
Advisers, Inc. from January 2008 to October 2012.
|
|
HENNESSY FUNDS
|
1-800-966-4354
|
33
|
Name, Age,
|
||
|
and Position Held
|
Start Date
|
Principal Occupation(s)
|
|
with the Trust
|
of Service
|
During Past Five Years
|
|
L. Joshua Wein(5)
|
September 2018
|
Mr. Wein has been employed by Hennessy Advisors, Inc. since
|
|
50
|
2018. He has served as Portfolio Manager of the Hennessy
|
|
|
Vice President and
|
Cornerstone Growth Fund, the Hennessy Cornerstone Mid Cap
|
|
|
Portfolio Manager
|
30 Fund, the Hennessy Cornerstone Large Growth Fund, the
|
|
|
Hennessy Cornerstone Value Fund, Hennessy Total Return Fund,
|
||
|
the Hennessy Balanced Fund, the Hennessy Gas Utility Fund,
|
||
|
and the Hennessy Technology Fund since February 2021, and
|
||
|
as the Co-Portfolio Manager of these Funds since February
|
||
|
2019. He served as a Senior Analyst of those same Funds from
|
||
|
September 2018 through February 2019. He also has served as
|
||
|
a Portfolio Manager of the Hennessy Energy Transition Fund
|
||
|
and the Hennessy Midstream Fund since January 2022.
|
||
|
Mr. Wein served as Director of Alternative Investments and
|
||
|
Co-Portfolio Manager at Sterling Capital Management
|
||
|
from 2008 to 2018.
|
_______________
|
(1)
|
The Funds have determined that Mr. DeSousa, Mr. Doyle, Mr. Franklin, Ms. Garvie, and Mr. Richardson are not interested persons, as defined in the 1940 Act, of the Investment
Manager or of any predecessor investment adviser for purposes of Section 15(f) of the 1940 Act.
|
|
(2)
|
Each of Neil J. Hennessy and A.J. Hennessy is considered an interested person, as defined in the 1940 Act, because he is an officer of the Trust.
|
|
(3)
|
The address of this officer is 101 Federal Street, Suite 1615B, Boston, MA 02110.
|
|
(4)
|
The address of this officer is 4800 Bee Caves Road, Suite 100, Austin, TX 78746.
|
|
(5)
|
The address of this officer is 1340 Environ Way, Chapel Hill, NC 27517.
|
|
WWW.HENNESSYFUNDS.COM
|
34
|
TRUSTEES AND OFFICERS OF THE FUND
|
(This Page Intentionally Left Blank.)
|
HENNESSY FUNDS
|
1-800-966-4354
|
35
Expense Example (Unaudited)
October 31, 2023
As a shareholder of the Fund, you incur ongoing costs, including management fees, service fees, and other Fund expenses. This Example is intended to help you understand your ongoing costs (in dollars) of
investing in the Fund and to compare these costs with the ongoing costs of investing in other investment funds. The Example is based on an investment of $1,000 invested at the beginning of the period and held for the entire period from
May 1, 2023, through October 31, 2023.
Actual Expenses
In the table below, the first line under each of the “Investor Class” and “Institutional Class” headings provides information about actual account values and actual expenses for each share class. You may use
this information, together with the amount you invested, to estimate the expenses that you paid over the period. Simply divide your account value by $1,000 (for example, an $8,600 account value divided by $1,000 = 8.6), then multiply
the result by the number in the first line under the heading “Expenses Paid During Period” to estimate the expenses you paid on your account during this period. Although the Fund charges no sales loads or transaction fees, you will be
assessed fees for outgoing wire transfers, returned checks, and stop payment orders at prevailing rates charged by U.S. Bank Global Fund Services, the Fund’s transfer agent. If you request that a redemption be made by wire transfer, the
Fund’s transfer agent charges a $15 fee. IRAs are charged a $15 annual maintenance fee (up to $30 maximum per shareholder for shareholders with multiple IRAs). The examples below include, but are not limited to, management, shareholder
servicing, accounting, custody, and transfer agent fees. However, the examples below do not include portfolio trading commissions and related expenses.
Hypothetical Example for Comparison Purposes
In the table below, the second line under each of the “Investor Class” and “Institutional Class” headings provides information about hypothetical account values and hypothetical expenses based on the Fund’s
actual expense ratio for each share class and an assumed rate of return of 5% per year before expenses, which is not the Fund’s actual return for such share class. The hypothetical account values and expenses may not be used to estimate
the actual ending account balance or expenses you paid for the period. You may use this information to compare the ongoing costs of investing in the Fund and other funds. To do so, compare these 5% hypothetical examples with the 5%
hypothetical examples that appear in the shareholder reports of the other funds. Please note that the expenses shown in the table are meant to highlight your ongoing costs only. Therefore, the second lines under “Investor Class” and
“Institutional Class” are useful in comparing ongoing costs only and will not help you determine the relative total costs of owning different funds.
|
WWW.HENNESSYFUNDS.COM
|
36
|
EXPENSE EXAMPLE
|
|
Expenses Paid
|
|||
|
Beginning
|
Ending
|
During Period(1)
|
|
|
Account Value
|
Account Value
|
May 1, 2023 –
|
|
|
May 1, 2023
|
October 31, 2023
|
October 31, 2023
|
|
|
Investor Class
|
|||
|
Actual
|
$1,000.00
|
$1,132.30
|
$9.46
|
|
Hypothetical (5% return before expenses)
|
$1,000.00
|
$1,016.33
|
$8.94
|
|
Institutional Class
|
|||
|
Actual
|
$1,000.00
|
$1,133.70
|
$8.12
|
|
Hypothetical (5% return before expenses)
|
$1,000.00
|
$1,017.59
|
$7.68
|
|
(1)
|
Expenses are equal to the Fund’s annualized expense ratio of 1.76% for Investor Class shares or 1.51% for Institutional Class shares, as applicable, multiplied by the average account value over the
period, multiplied by 184/365 days (to reflect the half-year period).
|
|
HENNESSY FUNDS
|
1-800-966-4354
|
37
How to Obtain a Copy of the Fund’s Proxy
Voting Policy and Proxy Voting Records
A description of the policies and procedures the Fund uses to determine how to vote proxies relating to portfolio securities is available without charge (1) by calling 800-966-4354, (2) on the Hennessy Funds’
website at www.hennessyfunds.com/proxy-voting/voting-policy, or (3) on the U.S. Securities and Exchange Commission’s (the “SEC”) website at www.sec.gov. The Fund’s proxy voting record is available without charge on both the Hennessy
Funds’ website at www.hennessyfunds.com/proxy-voting/voting-record and the SEC’s website at www.sec.gov no later than August 31 for the prior 12 months ending June 30.
Availability of Quarterly Portfolio Schedule
The Fund files a complete schedule of portfolio holdings with the SEC for the first and third quarters of each fiscal year as an exhibit to its reports on Form N-PORT. The Fund’s Form N-PORT reports are
available on the SEC’s website at www.sec.gov or on request by calling 800-966-4354.
Important Notice Regarding Delivery
of Shareholder Documents
To help keep the Fund’s costs as low as possible, we generally deliver a single copy of shareholder reports, proxy statements, and prospectuses to shareholders who share an address and have the same last name.
This process does not apply to account statements. You may request an individual copy of a shareholder document at any time. If you would like to receive separate mailings of shareholder documents, please call U.S. Bank Global Fund
Services at 800-261-6950 or 414-765-4124, and individual delivery will begin within 30 days of your request. If your account is held through a financial institution or other intermediary, please contact such intermediary directly to
request individual delivery.
Electronic Delivery
As currently permitted by SEC regulations, the Fund’s shareholder reports are made available on a website, and unless you sign for eDelivery or elect to receive paper copies as detailed below, you will be
notified by mail each time a report is posted and provided with a website link to access the report.
To elect to receive paper copies of all future reports free of charge, please call U.S. Bank Global Fund Services at 800-261-6950 or 414-765-4124.
The Fund also offers shareholders the option to receive all notices, account statements, prospectuses, tax forms, and shareholder reports electronically. To sign up for eDelivery or change
your delivery preference, please visit www.hennessyfunds.com/account.
Shareholder reports transmitted after July 24, 2024, will comply with the new tailored shareholder reporting requirements, which require streamlined annual and semi-annual reports to
shareholders that highlight key information. These reports will be transmitted in paper unless a shareholder elects to receive reports electronically via eDelivery. To sign up for eDelivery, please visit
http://www.hennessyfunds.com/account.
Subscribe to receive our team’s unique market and sector insights delivered to your inbox
www.hennessyfunds.com/subscribe
Follow us on social media
| |
|
|
|
|
WWW.HENNESSYFUNDS.COM
|
38
|
PROXY VOTING — PRIVACY POLICY
|
Liquidity Risk Management Program
In accordance with Rule 22e-4 under the Investment Company Act of 1940, as amended (the “Liquidity Rule”), we have adopted and implemented a liquidity risk management program (the “Liquidity Program”). The
purpose of the Liquidity Program is to assess and manage the Fund’s liquidity risk, which is the risk that the Fund would not be able to meet requests to redeem Fund shares without significant dilution of the remaining shareholders’
interests in the Fund. The Board of Trustees of the Fund (the “Board”) designated a committee comprising representatives of Hennessy Advisors, Inc., the investment adviser to the Fund, as the administrator of the Liquidity Program (the
“Program Administrator”).
The Program Administrator provided a written report regarding the Liquidity Program to the Board in advance of its meeting on June 7, 2023. The report covered the period from June 1, 2022,
through May 31, 2023. The report addressed the operation of the Liquidity Program, assessed the adequacy and effectiveness of its implementation, and described any material changes to the Liquidity Program during the review period. The
Trust’s chief compliance officer presented the report to the Board at the meeting and provided additional information regarding the Liquidity Program. The Board reviewed the Liquidity Program and considered, among other items, the
following:
|
1.
|
The Program Administrator reviewed daily historical net redemption activity during the review period and during prior periods with higher-than-average redemption activity and concluded that the Fund
has historically been able to meet requests to redeem Fund shares without significant dilution to the Fund’s remaining shareholders, and the Program Administrator expects the Fund to be able to continue to do so in the future
during both normal and reasonably foreseeable stressed conditions.
|
|
|
2.
|
The Fund primarily holds assets that are highly liquid investments and is not required to establish a highly liquid investment minimum for the Fund or adopt policies and procedures for responding to a
highly liquid investment minimum shortfall.
|
|
|
3.
|
The Program Administrator did not make or recommend any material changes to the Liquidity Program during the review period.
|
|
|
4.
|
The Program Administrator concluded that the Liquidity Program was reasonably designed to assess and manage the Fund’s liquidity risk, complies with the requirements of the Liquidity Rule, and was
operating as intended during the review period.
|
Privacy Policy
We collect the following personal information about you:
|
1.
|
Information we receive from you in applications or other forms, correspondence, or conversations, including, but not limited to, your name, address, phone number, social security number, assets,
income, and date of birth;
|
|
|
2.
|
Information about your transactions with us, our affiliates, or others, including, but not limited to, your account number and balance, payments history, parties to transactions, cost basis
information, and other financial information; and
|
|
HENNESSY FUNDS
|
1-800-966-4354
|
39
|
3.
|
Other personal information we collect from various sources, even if you have not entered into a prior transaction with us, including the following:
|
|
•
|
Name, alias, address, unique personal identifier, online identifier, IP address, email address, telephone number, account name, and other similar identifiers;
|
||
|
•
|
Age and marital status;
|
||
|
•
|
Commercial information, including records of products purchased;
|
||
|
•
|
Browsing history, search history, and information on interaction with our website;
|
||
|
•
|
Geolocation data;
|
||
|
•
|
Employment and employment history, educational history, financial information, and purchasing and consuming histories or tendencies; and
|
||
|
•
|
Inferences drawn from the above-listed information to create a profile about your preferences, characteristics, predispositions, and behavior.
|
We collect this information directly from you, indirectly in the course of providing services to you, directly and indirectly from your activity on our website, from broker dealers,
marketing agencies, and other third parties that interact with us in connection with the services we perform and products we offer, and from anonymized and aggregated consumer information.
We use this information to fulfill the reason you provided the information to us, to provide you with other relevant products that you request from us, to provide you with information about
products that may interest you, to improve our website or present our website’s contents to you, and as otherwise described to you when collecting your personal information.
We do not disclose any personal information to unaffiliated third parties, except as permitted by law. We may disclose your personal information to our affiliates, vendors, and service
providers for a business purpose. For example, we are permitted by law to disclose all of the information we collect, as described above, to our transfer agent to process your transactions. When disclosing your personal information to
third parties, we enter into a contract with each third party describing the purpose of such disclosure and requiring that such personal information be kept confidential and not used for any purpose except to perform the services
contracted or respond to regulatory or law enforcement requests.
Furthermore, we restrict access to your personal information to those persons who require such information to provide products or services to you. As a result, we do not provide a means for
opting out of our limited sharing of your information. We maintain physical, electronic, and procedural safeguards that comply with federal standards to guard your personal information.
If you hold shares of the Funds through a financial intermediary, including, but not limited to, a broker-dealer, bank, or trust company, the privacy policy of your financial intermediary
governs how your personal information is shared with unaffiliated third parties.
If you live in a state such as California where the laws provide further privacy rights, we will not share information unless the law allows, and we will comply with the other state-specific
requirements.
|
WWW.HENNESSYFUNDS.COM
|
40
|
PRIVACY POLICY
|
Supplemental Privacy Notice for Residents of California
The California Consumer Privacy Act of 2018 (the “CCPA”) provides you, as a California resident, with certain additional rights relating to your personal information.
Under the CCPA, you have the right to request that we disclose to you the categories of personal information we have collected about you over the past 12 months, the categories of sources of
such information, our business purpose for collecting the information, the categories of third parties, if any, with whom we shared the information, and the specific information we have collected about you. You also have the right to
request that we delete any of your personal information, and, unless an exception applies, we will delete such information upon receiving and confirming your request. To make a request, call us at 1-800-966-4354, email us at
privacy@hennessyfunds.com, or go to www.hennessyfunds.com/contact. We will not discriminate against you for exercising your rights under the CCPA. Further, we will not collect additional categories of your personal information or use
the personal information we collected for materially different, unrelated, or incompatible purposes without providing you notice.
|
HENNESSY FUNDS
|
1-800-966-4354
|
41
For information, questions, or assistance, please call
The Hennessy Funds
800-966-4354 or 415-899-1555
INVESTMENT ADVISOR
Hennessy Advisors, Inc.
7250 Redwood Boulevard, Suite 200
Novato, California 94945
ADMINISTRATOR,
TRANSFER AGENT,
DIVIDEND PAYING AGENT, &
SHAREHOLDER SERVICING AGENT
U.S. Bancorp Fund Services, LLC
d/b/a U.S. Bank Global Fund Services
P.O. Box 701
Milwaukee, Wisconsin 53201-0701
CUSTODIAN
U.S. Bank N.A.
Custody Operations
1555 North River Center Drive, Suite 302
Milwaukee, Wisconsin 53212
TRUSTEES
Neil J. Hennessy
Robert T. Doyle
J. Dennis DeSousa
Doug Franklin
Claire Garvie
Gerald P. Richardson
COUNSEL
Foley & Lardner LLP
777 East Wisconsin Avenue
Milwaukee, Wisconsin 53202-5306
INDEPENDENT REGISTERED
PUBLIC ACCOUNTING FIRM
Tait, Weller & Baker LLP
Two Liberty Place
50 South 16th Street, Suite 2900
Philadelphia, Pennsylvania 19102-2529
DISTRIBUTOR
Quasar Distributors, LLC
111 East Kilbourn Avenue, Suite 1250
Milwaukee, Wisconsin 53202
www.hennessyfunds.com | 800-966-4354
This report has been prepared for shareholders and may be distributed to
others only if preceded or accompanied by a current prospectus.
ANNUAL REPORT
OCTOBER 31, 2023

HENNESSY GAS UTILITY FUND
Investor Class GASFX
Institutional Class HGASX
www.hennessyfunds.com | 1-800-966-4354
(This Page Intentionally Left Blank.)
Contents
|
Letter to Shareholders
|
2
|
|
|
Performance Overview
|
6
|
|
|
Financial Statements
|
||
|
Schedule of Investments
|
9
|
|
|
Statement of Assets and Liabilities
|
13
|
|
|
Statement of Operations
|
14
|
|
|
Statements of Changes in Net Assets
|
15
|
|
|
Financial Highlights
|
16
|
|
|
Notes to the Financial Statements
|
20
|
|
|
Report of Independent Registered Public Accounting Firm
|
28
|
|
|
Trustees and Officers of the Fund
|
29
|
|
|
Expense Example
|
34
|
|
|
Proxy Voting Policy and Proxy Voting Records
|
36
|
|
|
Availability of Quarterly Portfolio Schedule
|
36
|
|
|
Federal Tax Distribution Information
|
36
|
|
|
Important Notice Regarding Delivery of Shareholder Documents
|
36
|
|
|
Electronic Delivery
|
36
|
|
|
Liquidity Risk Management Program
|
37
|
|
|
Privacy Policy
|
37
|
|
HENNESSY FUNDS
|
1-800-966-4354
|
November 2023
Dear Hennessy Funds Shareholder:
Market Myopia: Tough Beginnings & Fantastic Finishes
During an interview this summer, I was reminded how important it is to maintain a long-term view of the market and investing and how easy it is to focus on the very recent past. In mid-July, when the Nasdaq
Composite Index was soaring to new 2023 highs and large-cap tech was once again dominating both returns and news headlines, the interviewer seemed confused – and somewhat disappointed – when I mentioned that even with 2023’s stellar
performance, the Nasdaq was negative if you included the prior year (2022) and that during that same time, utilities had outperformed. As of the time of writing this letter, a similar story can be seen when considering eight technology
giants: Microsoft, Tesla, Facebook (Meta), Apple, Amazon, Netflix, Nvidia, and Google, or “MT. FAANNG” as a much easier to say
(and remember) acronym.(1) MT. FAANNG is up on average a whopping 89.69% in 2023 on a total return basis as of November 7, 2023. However, this same group
was down -46.71% in 2022, a dismal year for large-cap tech. Due to the unforgiving nature of percentages, from the end of 2021 until now, this group of highflyers, believe it or not, is still down -3.14% on average, despite an
incredible 2023.
I like to call this phenomenon “market myopia.” Investors tend to be optimists, as am I. This makes it so much more comforting to forget the “tough beginnings” when
you’d rather remember the “fantastic finishes.” In continuing with the example above, unless you were an investor with prescient foresight, you likely didn’t sell all your MT. FAANNG stocks on January 4, 2022, as the market started its
correction, and you probably didn’t then buy them all back on September 30, 2022, when the market hit its low. An average investor’s experience would be much different than that. Which brings me to the point of all this: what are some
elements of our investment philosophy here at Hennessy Funds?
First, what about timing the market? Simply put, we don’t do it. As Neil Hennessy, our Chief Market Strategist and long-tenured Portfolio Manager, aptly put it, “It’s
not about timing the market, but rather about time in the market.” The long-term annualized return of the market, as measured by the Dow Jones Industrial
Average going back 104 years to 1920, is about 9.6%, and that number would be closer to 7-8% on a real return basis when factoring in inflation. If an investor is poorly timing when to enter and when to exit the market, it would be very
difficult to achieve similar, attractive returns to what they would experience simply by staying invested through a complete market cycle.
We are optimistic investors. We understand that some years or months may be tougher than others, but we tend to think in longer timeframes. An investor solely invested
in the Nasdaq might have looked at their portfolio at the end of 2022 and been extremely disappointed with a -32.51% return. But as Josh Wein, one of our Portfolio Managers with over 25 years of experience, pointed out, “2022 was what
8% real returns look like.” In other words, with the year prior (2021) providing a +22.21% return and the year after (2023) hitting a +31.21% return, 2022’s dismal performance of -32.51% created an annualized total return for the Nasdaq
of 8.22% over the entire period (December 31, 2020, to November 7, 2023). Josh simply observed that while corrections happen over the course of a market cycle, it’s best not to panic by selling when stocks are hitting new lows.
_______________
|
(1)
|
The acronym, MT. FAANNG, refers to the following companies: Microsoft Corporation, Tesla, Inc., Meta Platforms, Inc., Amazon.com, Inc., Apple, Inc., Netflix, Inc., NVIDIA Corporation, and Alphabet,
Inc.
|
|
WWW.HENNESSYFUNDS.COM
|
2
|
LETTER TO SHAREHOLDERS
|
Downside risk mitigation is relevant. While we normally remain fully invested within our individual funds, we seek to reduce risk through other means, including sector
diversification and investing in companies that exhibit strong fundamentals at compelling valuations. Dave Ellison, the long-tenured Portfolio Manager of our two financial funds, consistently reminds us, “Losing less money in difficult
markets is more important than making the most in rising ones.”
Finally, we are investors in companies, not traders of stocks. Many of our portfolios hold certain positions for long periods of time, a demonstration of the Portfolio
Managers’ convictions. In fact, both the Hennessy Focus Fund and the Hennessy Large Cap Financial Fund have held some positions for 25 years or more. We recognize that much of the performance of the Hennessy Funds comes from the actual
stocks we own (stock selection) and not from our weightings within certain sectors (sector allocation). Moving in and out of sectors can enhance performance, but it can also hinder it in the same way as market timing, and it takes a
significant number of correct “calls” regarding the macro-environment. We’d rather invest long term than rely on lucky calls. Our highly experienced energy funds Portfolio Manager, Ben Cook, summed up our philosophy on the macro
environment nicely: “While macro-economic trends help to inform our investment process, ultimately it’s the individual stocks with solid fundamentals and attractive valuations that, over time, drive positive risk-adjusted returns for
our funds.”
We are long term investors, staying ever mindful of downside risk while striving to participate in the upside, with each individual fund having its own objective,
process, portfolio construction, and investment criteria.
The stock market has once again seen dramatic differences in stock performance. For our fiscal year ended October 31, 2023, all three broad-based indexes were positive,
although with a large dispersion of total returns, with the Dow Jones Industrial Average up 3.17%, the S&P 500® Index up 10.14%, and the Nasdaq
Composite Index up 17.99%. During our fiscal year, large caps significantly outperformed mid caps and small caps, and growth substantially outperformed value. Large-cap tech once again pushed the overall broader market higher, as
evidenced by the Nasdaq-100 Index posting a return of 27.45%. From a sector point of view, besides Technology, the only other sector with outsized (greater than 10%) returns was Communication Services, while six of the 11 GICS sectors
of the S&P 500® Index were negative.
Similar to the overall market, our funds experienced mixed results. Many of our funds exhibit more value-oriented characteristics and, given that value underperformed
growth this year by a significant amount, that negatively affected our relative performance. In addition, three of our funds are sector-specific funds that were invested in underperforming sectors, while six more are focused on small-
and mid-cap stocks in a time period when large caps substantially outperformed. Ten of our 16 mutual funds and our exchange-traded-fund (ETF) posted positive returns for the fiscal year ended October 31, 2023.
Several factors caused this disparity of returns in the market: interest rates and inflation being two of the most important. With the Federal Reserve pausing interest
rate hikes and inflation numbers subsiding, the market reacted positively once it became more apparent that we were not heading into a recession. Consumer demand also remained strong, and unemployment numbers remained historically low.
We believe that the outlook for U.S. stocks remains positive, primarily as we believe that the Federal Reserve may be done, or close to done, raising interest rates.
Inflation has shown signs of easing, creating a better environment for consumers as well as businesses. The unemployment rate remains near record lows, there are elevated levels of cash on the
|
HENNESSY FUNDS
|
1-800-966-4354
|
3
balance sheets of U.S. companies and in the pockets of many consumers and investors, and there is the prospect of a more dovish Federal Reserve heading into 2024. However, we are cautiously watching certain
parts of the economy for any hints of weakness, including consumer spending and credit issues. While volatility and uncertainty may impact the markets, we encourage investors to stay the course, maintain a diversified portfolio, and
keep a long-term perspective.
We thank you for your continued interest in our Funds and are grateful that you have chosen to invest with us. If you have any questions or would like to speak with us
directly, please call us at (800) 966-4354.
Best regards,
| |
|
|
|
|
Ryan C. Kelley, CFA
|
|
|
Chief Investment Officer,
|
|
|
Senior Vice President, and Portfolio Manager
|
Past performance does not guarantee future results.
Mutual fund investing involves risk. Principal loss is possible.
Opinions expressed are those of Ryan C. Kelley and are subject to change, are not guaranteed, and should not be considered investment advice.
The Dow Jones Industrial Average and S&P 500® Index are commonly used to measure the performance of U.S. stocks. The Nasdaq
Composite Index comprises all common stocks listed on The Nasdaq Stock Market and is commonly used to measure the performance of technology-related stocks. The Nasdaq-100 Index includes 100 of the largest domestic and international
non-financial companies listed on The NASDAQ Stock Market based on market capitalization. The indices are used herein for comparative purposes in accordance with SEC regulations. One cannot invest directly in an index. All returns are
shown on a total return basis.
|
WWW.HENNESSYFUNDS.COM
|
4
|
LETTER TO SHAREHOLDERS
|
(This Page Intentionally Left Blank.)
|
HENNESSY FUNDS
|
1-800-966-4354
|
5
Performance Overview (Unaudited)
CHANGE IN VALUE OF $10,000 INVESTMENT
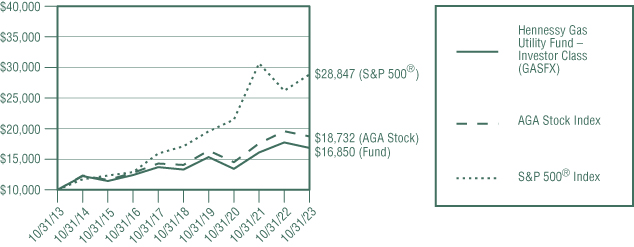
This graph illustrates the performance of an initial investment of $10,000 made in the Fund 10 years ago and assumes the reinvestment of dividends and capital gains.
AVERAGE ANNUAL TOTAL RETURN FOR PERIODS ENDED OCTOBER 31, 2023
|
One
|
Five
|
Ten
|
|
|
Year
|
Years
|
Years
|
|
|
Hennessy Gas Utility Fund –
|
|||
|
Investor Class (GASFX)
|
-5.01%
|
4.82%
|
5.36%
|
|
Hennessy Gas Utility Fund –
|
|||
|
Institutional Class (HGASX)(1)
|
-4.74%
|
5.15%
|
5.58%
|
|
AGA Stock Index
|
-4.31%
|
5.89%
|
6.48%
|
|
S&P 500® Index
|
10.14%
|
11.01%
|
11.18%
|
Expense ratios: 1.00% (Investor Class); 0.68% (Institutional Class)
|
(1)
|
The inception date of Institutional Class shares is March 1, 2017. Performance shown prior to the inception of Institutional Class shares reflects the performance of Investor Class shares and includes
expenses that are not applicable to, and are higher than, those of Institutional Class shares.
|
Performance data quoted represents past performance; past performance does not guarantee future results. The investment return and principal value of an investment will fluctuate so that an investor’s shares, when redeemed, may be worth more or less than their original cost. The performance table does not reflect the deduction of taxes that a shareholder would pay on Fund distributions or the redemption of Fund shares. Current performance of the Fund may be lower or higher than the performance quoted. Performance data current to the most recent month end may be obtained by visiting www.hennessyfunds.com.
The AGA Stock Index is a capitalization-weighted index that consists of members of the American Gas Association whose securities are traded on a U.S. stock exchange. The S&P 500® Index is a capitalization-weighted index that is designed to represent the broad domestic economy through changes in the aggregate market value of 500 stocks across all major
industries. One cannot invest directly in an index. These indices are used for comparative purposes in accordance with Securities and Exchange Commission regulations.
Standard & Poor’s Financial Services is the source and owner of the S&P® and S&P 500® trademarks.
The expense ratios presented are from the most recent prospectus. The expense ratios for the current reporting period are available in the Financial Highlights section of this report.
|
WWW.HENNESSYFUNDS.COM
|
6
|
PERFORMANCE OVERVIEW
|
PERFORMANCE NARRATIVE
Portfolio Managers Ryan C. Kelley, CFA, and L. Joshua Wein, CAIA
Performance:
For the one-year period ended October 31, 2023, the Investor Class of the Hennessy Gas Utility Fund returned -5.01%, underperforming both the AGA Stock Index (the Fund’s primary benchmark) and the S&P 500® Index, which returned -4.31% and 10.14%, respectively, for the same period.
The Fund slightly underperformed its primary benchmark due to Fund expenses, the timing of cash flows, trading costs, and the impact of holding cash. The Fund underperformed the broader
domestic equity market, as represented by the S&P 500® Index, in part due to a rebound in equities, particularly in large-cap technology names. Among
the holdings that detracted the most from performance over the period were multi-utility Dominion Energy, Inc., TC Energy Corporation, a Canadian energy company, and Enbridge, Inc., an energy infrastructure company. Among the holdings
that contributed the most to Fund performance were Berkshire Hathaway, Inc. which operates gas and utility-related assets, energy infrastructure company ONEOK, Inc., and National Grid PLC, a multi utility.
The Fund continues to own all the companies mentioned.
Portfolio Strategy:
The Fund’s objective is to maintain a high correlation with its primary benchmark, the AGA Stock Index. The Fund seeks to achieve this goal by owning all the companies in the AGA Stock Index in substantially
the same proportion as their weightings in the AGA Stock Index. The Fund seeks positive returns by investing in companies with natural gas distribution operations that have the potential for both income and long-term stock appreciation.
Relative affordability, abundant domestic supply, increased accessibility, and new sources and uses of natural gas should lead to long-term, steady growth in demand that should drive growth
of natural gas distribution. In turn, this should drive long-term growth in earnings of many of the Fund’s holdings. We believe that natural gas’s position as the cleanest of the fossil fuels should lead to continued strong demand,
particularly for utility-scale electricity generation. Furthermore, the continued growth in demand for natural gas and electricity should benefit the significant portion of the Fund that is invested in multi- and electric- utilities, as
well as pipeline and liquified natural gas (LNG) export companies.
Investment Commentary:
We believe the strategy of the Fund remains compelling. The production of natural gas in the United States, in particular from shale producers, continues to grow steadily. Demand for natural gas from domestic
sources, especially the power industry, also continues to trend upwards. In addition, exports of natural gas via pipelines to Mexico and LNG to the rest of the world remain a key demand driver, especially considering continued worldwide
geo-political disruptions. Demand for energy in general, and electricity and natural gas in particular, remains a positive tailwind for the Fund.
_______________
Opinions expressed are those of the Portfolio Manager as of the date written and are subject to change, are not guaranteed, and should not be considered investment advice or an indication of trading intent.
|
HENNESSY FUNDS
|
1-800-966-4354
|
7
Investments in foreign securities may involve political, economic, and currency risks, greater volatility, and differences in accounting methods. Investments are focused in the natural gas
distribution and transmission industry; sector funds may be subject to a higher degree of market risk. Please see the Fund’s prospectus for a more complete discussion of these and other risks.
References to specific securities should not be considered a recommendation to buy or sell any security. Fund holdings and sector allocations are subject to change. Please refer to the Schedule of Investments
included in this report for additional portfolio information.
Correlation measures the relationship between the changes of two or more financial variables over time.
|
WWW.HENNESSYFUNDS.COM
|
8
|
PERFORMANCE OVERVIEW/SCHEDULE OF INVESTMENTS
|
Financial Statements
|
Schedule of Investments as of October 31,
2023
|
HENNESSY GAS UTILITY FUND
(% of Net Assets)
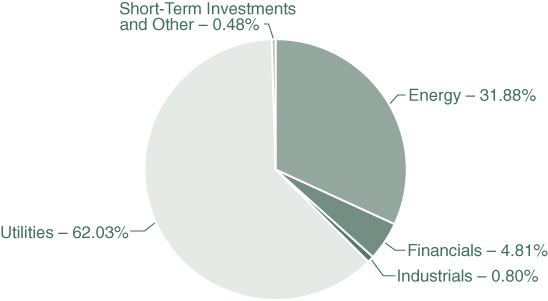
|
TOP TEN HOLDINGS (EXCLUDING MONEY MARKET FUNDS)
|
% NET ASSETS
|
|
EQT Corp.
|
5.27%
|
|
Sempra
|
5.12%
|
|
The Southern Co.
|
5.06%
|
|
Atmos Energy Corp.
|
5.02%
|
|
ONEOK, Inc.
|
5.02%
|
|
TC Energy Corp.
|
4.99%
|
|
Cheniere Energy, Inc.
|
4.90%
|
|
Kinder Morgan, Inc.
|
4.82%
|
|
Berkshire Hathaway, Inc., Class A
|
4.81%
|
|
Enbridge, Inc.
|
4.79%
|
Note: For presentation purposes, the Fund has grouped some of the industry categories. For purposes of categorizing securities for compliance with Section 8(b)(1) of the Investment Company Act of 1940, as
amended, the Fund uses more specific industry classifications.
The Global Industry Classification Standard (GICS®) was developed by and is the exclusive property and a service mark of MSCI,
Inc. and Standard & Poor's Financial Services LLC. It has been licensed for use by the Hennessy Funds.
|
HENNESSY FUNDS
|
1-800-966-4354
|
9
|
COMMON STOCKS – 99.52%
|
Number of
|
% of
|
||||||||||
|
|
Shares
|
Value
|
Net Assets
|
|||||||||
|
Energy – 31.88%
|
||||||||||||
|
Cheniere Energy, Inc.
|
129,817
|
$
|
21,604,145
|
4.90
|
%
|
|||||||
|
DT Midstream, Inc.
|
164,000
|
8,851,080
|
2.01
|
%
|
||||||||
|
Enbridge, Inc.
|
659,765
|
21,138,871
|
4.79
|
%
|
||||||||
|
EQT Corp.
|
549,500
|
23,287,810
|
5.27
|
%
|
||||||||
|
Kinder Morgan, Inc.
|
1,313,801
|
21,283,576
|
4.82
|
%
|
||||||||
|
ONEOK, Inc.
|
339,500
|
22,135,400
|
5.02
|
%
|
||||||||
|
TC Energy Corp.
|
638,400
|
21,992,880
|
4.99
|
%
|
||||||||
|
Tellurian, Inc. (a)
|
503,190
|
347,201
|
0.08
|
%
|
||||||||
|
|
140,640,963
|
31.88
|
%
|
|||||||||
|
Financials – 4.81%
|
||||||||||||
|
Berkshire Hathaway, Inc., Class A (a)
|
41
|
21,230,825
|
4.81
|
%
|
||||||||
|
Industrials – 0.80%
|
||||||||||||
|
MDU Resources Group, Inc.
|
190,707
|
3,549,057
|
0.80
|
%
|
||||||||
|
Utilities – 62.03%
|
||||||||||||
|
Algonquin Power & Utilities Corp.
|
111,964
|
563,179
|
0.13
|
%
|
||||||||
|
ALLETE, Inc.
|
375
|
20,078
|
0.00
|
%
|
||||||||
|
Alliant Energy Corp.
|
33,900
|
1,653,981
|
0.37
|
%
|
||||||||
|
Ameren Corp.
|
45,840
|
3,470,546
|
0.79
|
%
|
||||||||
|
Atmos Energy Corp.
|
205,686
|
22,144,155
|
5.02
|
%
|
||||||||
|
Avangrid, Inc.
|
89,900
|
2,685,313
|
0.61
|
%
|
||||||||
|
Avista Corp.
|
26,072
|
826,222
|
0.19
|
%
|
||||||||
|
Black Hills Corp.
|
64,547
|
3,120,847
|
0.71
|
%
|
||||||||
|
CenterPoint Energy, Inc.
|
493,028
|
13,252,593
|
3.00
|
%
|
||||||||
|
Chesapeake Utilities Corp.
|
22,358
|
1,981,142
|
0.45
|
%
|
||||||||
|
CMS Energy Corp.
|
186,898
|
10,156,037
|
2.30
|
%
|
||||||||
|
Consolidated Edison, Inc.
|
138,936
|
12,197,191
|
2.77
|
%
|
||||||||
|
Dominion Energy, Inc.
|
327,777
|
13,215,969
|
3.00
|
%
|
||||||||
|
DTE Energy Co.
|
56,204
|
5,416,942
|
1.23
|
%
|
||||||||
|
Duke Energy Corp.
|
118,887
|
10,567,865
|
2.40
|
%
|
||||||||
|
Entergy Corp.
|
3,760
|
359,418
|
0.08
|
%
|
||||||||
|
Essential Utilities, Inc.
|
182,300
|
6,099,758
|
1.38
|
%
|
||||||||
|
Eversource Energy
|
87,875
|
4,726,796
|
1.07
|
%
|
||||||||
|
Exelon Corp.
|
157,531
|
6,134,257
|
1.39
|
%
|
||||||||
|
Fortis, Inc.
|
127,176
|
5,052,702
|
1.15
|
%
|
||||||||
The accompanying notes are an integral part of these financial statements.
|
WWW.HENNESSYFUNDS.COM
|
10
|
SCHEDULE OF INVESTMENTS
|
|
COMMON STOCKS
|
Number of
|
% of
|
||||||||||
|
|
Shares
|
Value
|
Net Assets
|
|||||||||
|
Utilities (Continued)
|
||||||||||||
|
MGE Energy, Inc.
|
10,779
|
$
|
772,100
|
0.18
|
%
|
|||||||
|
National Fuel Gas Co.
|
88,424
|
4,505,203
|
1.02
|
%
|
||||||||
|
National Grid PLC
|
172,344
|
10,366,492
|
2.34
|
%
|
||||||||
|
New Jersey Resources Corp.
|
129,934
|
5,272,722
|
1.20
|
%
|
||||||||
|
NiSource, Inc.
|
439,481
|
11,057,342
|
2.51
|
%
|
||||||||
|
Northwest Natural Holding Co.
|
54,503
|
2,000,805
|
0.45
|
%
|
||||||||
|
Northwestern Energy Group, Inc.
|
19,298
|
926,497
|
0.21
|
%
|
||||||||
|
ONE Gas, Inc.
|
94,775
|
5,724,410
|
1.30
|
%
|
||||||||
|
PG&E Corp. (a)
|
922,149
|
15,031,029
|
3.41
|
%
|
||||||||
|
PPL Corp.
|
124,619
|
3,061,889
|
0.69
|
%
|
||||||||
|
Public Service Enterprise Group, Inc.
|
193,090
|
11,903,999
|
2.70
|
%
|
||||||||
|
RGC Resources, Inc.
|
17,154
|
268,289
|
0.06
|
%
|
||||||||
|
Sempra
|
322,380
|
22,576,270
|
5.12
|
%
|
||||||||
|
Southwest Gas Holdings, Inc.
|
78,917
|
4,625,325
|
1.05
|
%
|
||||||||
|
Spire, Inc.
|
61,791
|
3,437,433
|
0.78
|
%
|
||||||||
|
The Southern Co.
|
331,700
|
22,323,410
|
5.06
|
%
|
||||||||
|
UGI Corp.
|
97,752
|
2,033,242
|
0.46
|
%
|
||||||||
|
Unitil Corp.
|
16,898
|
771,732
|
0.17
|
%
|
||||||||
|
WEC Energy Group, Inc.
|
199,540
|
16,240,561
|
3.68
|
%
|
||||||||
|
Xcel Energy, Inc.
|
118,899
|
7,047,144
|
1.60
|
%
|
||||||||
|
|
273,590,885
|
62.03
|
%
|
|||||||||
|
|
||||||||||||
|
Total Common Stocks
|
||||||||||||
|
(Cost $255,079,825)
|
439,011,730
|
99.52
|
%
|
|||||||||
The accompanying notes are an integral part of these financial statements.
|
HENNESSY FUNDS
|
1-800-966-4354
|
11
|
SHORT-TERM INVESTMENTS – 0.42%
|
Number of
|
% of
|
||||||||||
|
|
Shares
|
Value
|
Net Assets
|
|||||||||
|
Money Market Funds – 0.42%
|
||||||||||||
|
First American Treasury Obligations Fund – Class X, 5.275% (b)
|
1,844,630
|
$
|
1,844,630
|
0.42
|
%
|
|||||||
|
|
||||||||||||
|
Total Short-Term Investments
|
||||||||||||
|
(Cost $1,844,630)
|
1,844,630
|
0.42
|
%
|
|||||||||
|
|
||||||||||||
|
Total Investments
|
||||||||||||
|
(Cost $256,924,455) – 99.94%
|
440,856,360
|
99.94
|
%
|
|||||||||
|
Other Assets in Excess of Liabilities – 0.06%
|
265,748
|
0.06
|
%
|
|||||||||
|
|
||||||||||||
|
TOTAL NET ASSETS – 100.00%
|
$
|
441,122,108
|
100.00
|
%
|
||||||||
Percentages are stated as a percent of net assets.
ADR – American Depositary Receipt
PLC – Public Limited Company
|
(a)
|
Non-income producing security.
|
|
(b)
|
The rate listed is the fund’s seven-day yield as of October 31, 2023.
|
Summary of Fair Value Exposure as of October 31, 2023
The following is a summary of the inputs used to value the Fund’s net assets as of October 31, 2023 (see Note 3 in the accompanying Notes to the Financial Statements):
|
Common Stocks
|
Level 1
|
Level 2
|
Level 3
|
Total
|
||||||||||||
|
Energy
|
$
|
140,640,963
|
$
|
—
|
$
|
—
|
$
|
140,640,963
|
||||||||
|
Financials
|
21,230,825
|
—
|
—
|
21,230,825
|
||||||||||||
|
Industrials
|
3,549,057
|
—
|
—
|
3,549,057
|
||||||||||||
|
Utilities
|
273,590,885
|
—
|
—
|
273,590,885
|
||||||||||||
|
Total Common Stocks
|
$
|
439,011,730
|
$
|
—
|
$
|
—
|
$
|
439,011,730
|
||||||||
|
Short-Term Investments
|
||||||||||||||||
|
Money Market Funds
|
$
|
1,844,630
|
$
|
—
|
$
|
—
|
$
|
1,844,630
|
||||||||
|
Total Short-Term Investments
|
$
|
1,844,630
|
$
|
—
|
$
|
—
|
$
|
1,844,630
|
||||||||
|
Total Investments
|
$
|
440,856,360
|
$
|
—
|
$
|
—
|
$
|
440,856,360
|
||||||||
The accompanying notes are an integral part of these financial statements.
|
WWW.HENNESSYFUNDS.COM
|
12
|
SCHEDULE OF INVESTMENTS/STATEMENT OF ASSETS AND LIABILITIES
|
Financial Statements
|
Statement of Assets and Liabilities as of October 31, 2023
|
|
ASSETS:
|
||||
|
Investments in securities, at value (cost $256,924,455)
|
$
|
440,856,360
|
||
|
Dividends and interest receivable
|
691,000
|
|||
|
Receivable for fund shares sold
|
27,701
|
|||
|
Return of capital receivable
|
175,080
|
|||
|
Prepaid expenses and other assets
|
41,875
|
|||
|
Total assets
|
441,792,016
|
|||
|
LIABILITIES:
|
||||
|
Payable for fund shares redeemed
|
230,678
|
|||
|
Payable to advisor
|
150,868
|
|||
|
Payable to administrator
|
81,983
|
|||
|
Payable to auditor
|
22,746
|
|||
|
Accrued distribution fees
|
60,885
|
|||
|
Accrued service fees
|
32,787
|
|||
|
Accrued trustees fees
|
9,881
|
|||
|
Accrued expenses and other payables
|
80,080
|
|||
|
Total liabilities
|
669,908
|
|||
|
NET ASSETS
|
$
|
441,122,108
|
||
|
NET ASSETS CONSISTS OF:
|
||||
|
Capital stock
|
$
|
262,922,778
|
||
|
Total distributable earnings
|
178,199,330
|
|||
|
Total net assets
|
$
|
441,122,108
|
||
|
NET ASSETS:
|
||||
|
Investor Class
|
||||
|
Shares authorized (no par value)
|
Unlimited
|
|||
|
Net assets applicable to outstanding shares
|
$
|
384,374,147
|
||
|
Shares issued and outstanding
|
17,033,515
|
|||
|
Net asset value, offering price, and redemption price per share
|
$
|
22.57
|
||
|
Institutional Class
|
||||
|
Shares authorized (no par value)
|
Unlimited
|
|||
|
Net assets applicable to outstanding shares
|
$
|
56,747,961
|
||
|
Shares issued and outstanding
|
2,521,517
|
|||
|
Net asset value, offering price, and redemption price per share
|
$
|
22.51
|
||
The accompanying notes are an integral part of these financial statements.
|
HENNESSY FUNDS
|
1-800-966-4354
|
13
Financial Statements
|
Statement of Operations for the year ended October 31, 2023
|
|
INVESTMENT INCOME:
|
||||
|
Dividend income(1)
|
$
|
15,977,224
|
||
|
Interest income
|
138,651
|
|||
|
Total investment income
|
16,115,875
|
|||
|
EXPENSES:
|
||||
|
Investment advisory fees (See Note 5)
|
2,005,569
|
|||
|
Sub-transfer agent expenses – Investor Class (See Note 5)
|
724,410
|
|||
|
Sub-transfer agent expenses – Institutional Class (See Note 5)
|
86,424
|
|||
|
Distribution fees – Investor Class (See Note 5)
|
646,278
|
|||
|
Administration, accounting, custody, and transfer agent fees (See Note 5)
|
475,622
|
|||
|
Service fees – Investor Class (See Note 5)
|
430,852
|
|||
|
Reports to shareholders
|
43,628
|
|||
|
Federal and state registration fees
|
43,243
|
|||
|
Trustees’ fees and expenses
|
28,585
|
|||
|
Audit fees
|
22,747
|
|||
|
Compliance expense (See Note 5)
|
22,676
|
|||
|
Interest expense (See Note 7)
|
14,649
|
|||
|
Legal fees
|
11,281
|
|||
|
Other expenses
|
273,099
|
|||
|
Total expenses
|
4,829,063
|
|||
|
NET INVESTMENT INCOME
|
$
|
11,286,812
|
||
|
REALIZED AND UNREALIZED GAINS (LOSSES):
|
||||
|
Net realized gain on investments
|
$
|
20,986,535
|
||
|
Net change in unrealized appreciation/depreciation on investments
|
(54,552,818
|
)
|
||
|
Net loss on investments
|
(33,566,283
|
)
|
||
|
NET DECREASE IN NET ASSETS RESULTING FROM OPERATIONS
|
$
|
(22,279,471
|
)
|
|
|
(1)
|
Net of foreign taxes withheld and issuance fees of $559,768.
|
The accompanying notes are an integral part of these financial statements.
|
WWW.HENNESSYFUNDS.COM
|
14
|
STATEMENT OF OPERATIONS/STATEMENTS OF CHANGES IN NET ASSETS
|
Financial Statements
|
Statements of Changes in Net Assets
|
|
Year Ended
|
Year Ended
|
|||||||
|
October 31, 2023
|
October 31, 2022
|
|||||||
|
OPERATIONS:
|
||||||||
|
Net investment income
|
$
|
11,286,812
|
$
|
10,843,179
|
||||
|
Net realized gain on investments
|
20,986,535
|
49,402,174
|
||||||
|
Net change in unrealized
|
||||||||
|
appreciation/depreciation on investments
|
(54,552,818
|
)
|
(11,790,358
|
)
|
||||
|
Net increase (decrease) in
|
||||||||
|
net assets resulting from operations
|
(22,279,471
|
)
|
48,454,995
|
|||||
|
DISTRIBUTIONS TO SHAREHOLDERS:
|
||||||||
|
Distributable earnings – Investor Class
|
(38,297,319
|
)
|
(46,296,164
|
)
|
||||
|
Distributable earnings – Institutional Class
|
(6,775,915
|
)
|
(7,042,572
|
)
|
||||
|
Total distributions
|
(45,073,234
|
)
|
(53,338,736
|
)
|
||||
|
CAPITAL SHARE TRANSACTIONS:
|
||||||||
|
Proceeds from shares subscribed – Investor Class
|
8,286,887
|
38,263,106
|
||||||
|
Proceeds from shares subscribed – Institutional Class
|
13,926,472
|
60,525,251
|
||||||
|
Dividends reinvested – Investor Class
|
36,097,085
|
43,695,547
|
||||||
|
Dividends reinvested – Institutional Class
|
6,392,644
|
6,632,283
|
||||||
|
Cost of shares redeemed – Investor Class
|
(61,097,011
|
)
|
(77,677,738
|
)
|
||||
|
Cost of shares redeemed – Institutional Class
|
(48,130,570
|
)
|
(33,930,524
|
)
|
||||
|
Net increase (decrease) in net assets derived
|
||||||||
|
from capital share transactions
|
(44,524,493
|
)
|
37,507,925
|
|||||
|
TOTAL INCREASE (DECREASE) IN NET ASSETS
|
(111,877,198
|
)
|
32,624,184
|
|||||
|
NET ASSETS:
|
||||||||
|
Beginning of year
|
552,999,306
|
520,375,122
|
||||||
|
End of year
|
$
|
441,122,108
|
$
|
552,999,306
|
||||
|
CHANGES IN SHARES OUTSTANDING:
|
||||||||
|
Shares sold – Investor Class
|
335,314
|
1,378,820
|
||||||
|
Shares sold – Institutional Class
|
578,892
|
2,219,309
|
||||||
|
Shares issued to holders as reinvestment
|
||||||||
|
of dividends – Investor Class
|
1,467,946
|
1,762,321
|
||||||
|
Shares issued to holders as reinvestment
|
||||||||
|
of dividends – Institutional Class
|
260,586
|
266,844
|
||||||
|
Shares redeemed – Investor Class
|
(2,499,516
|
)
|
(2,942,205
|
)
|
||||
|
Shares redeemed – Institutional Class
|
(1,939,801
|
)
|
(1,288,690
|
)
|
||||
|
Net increase (decrease) in shares outstanding
|
(1,796,579
|
)
|
1,396,399
|
|||||
The accompanying notes are an integral part of these financial statements.
|
HENNESSY FUNDS
|
1-800-966-4354
|
15
Financial Statements
|
Financial Highlights
|
For an Investor Class share outstanding throughout each year
PER SHARE DATA:
Net asset value, beginning of year
Income from investment operations:
Net investment income(1)
Net realized and unrealized gains (losses) on investments
Total from investment operations
Less distributions:
Dividends from net investment income
Dividends from net realized gains
Total distributions
Net asset value, end of year
TOTAL RETURN
SUPPLEMENTAL DATA AND RATIOS:
Net assets, end of year (millions)
Ratio of expenses to average net assets
Ratio of net investment income to average net assets
Portfolio turnover rate(2)
|
(1)
|
Calculated using the average shares outstanding method.
|
|
(2)
|
Calculated on the basis of the Fund as a whole.
|
The accompanying notes are an integral part of these financial statements.
|
WWW.HENNESSYFUNDS.COM
|
16
|
FINANCIAL HIGHLIGHTS — INVESTOR CLASS
|
|
Year Ended October 31,
|
||||||||||||||||||
|
2023
|
2022
|
2021
|
2020
|
2019
|
||||||||||||||
|
$
|
25.91
|
$
|
26.09
|
$
|
24.08
|
$
|
29.64
|
$
|
28.68
|
|||||||||
|
0.54
|
0.50
|
0.52
|
0.58
|
0.56
|
||||||||||||||
|
(1.70
|
)
|
1.98
|
4.00
|
(4.14
|
)
|
3.50
|
||||||||||||
|
(1.16
|
)
|
2.48
|
4.52
|
(3.56
|
)
|
4.06
|
||||||||||||
|
(0.53
|
)
|
(0.50
|
)
|
(0.57
|
)
|
(0.56
|
)
|
(0.62
|
)
|
|||||||||
|
(1.65
|
)
|
(2.16
|
)
|
(1.94
|
)
|
(1.44
|
)
|
(2.48
|
)
|
|||||||||
|
(2.18
|
)
|
(2.66
|
)
|
(2.51
|
)
|
(2.00
|
)
|
(3.10
|
)
|
|||||||||
|
$
|
22.57
|
$
|
25.91
|
$
|
26.09
|
$
|
24.08
|
$
|
29.64
|
|||||||||
|
-5.01
|
%
|
10.14
|
%
|
19.91
|
%
|
-12.49
|
%
|
15.28
|
%
|
|||||||||
|
$
|
384.37
|
$
|
459.41
|
$
|
457.31
|
$
|
483.56
|
$
|
764.10
|
|||||||||
|
1.00
|
%
|
1.00
|
%
|
1.00
|
%
|
1.02
|
%
|
1.00
|
%
|
|||||||||
|
2.21
|
%
|
1.88
|
%
|
2.06
|
%
|
2.24
|
%
|
1.98
|
%
|
|||||||||
|
12
|
%
|
31
|
%
|
15
|
%
|
16
|
%
|
12
|
%
|
|||||||||
The accompanying notes are an integral part of these financial statements.
|
HENNESSY FUNDS
|
1-800-966-4354
|
17
Financial Statements
|
Financial Highlights
|
For an Institutional Class share outstanding throughout each year
PER SHARE DATA:
Net asset value, beginning of year
Income from investment operations:
Net investment income(1)
Net realized and unrealized gains (losses) on investments
Total from investment operations
Less distributions:
Dividends from net investment income
Dividends from net realized gains
Total distributions
Net asset value, end of year
TOTAL RETURN
SUPPLEMENTAL DATA AND RATIOS:
Net assets, end of year (millions)
Ratio of expenses to average net assets
Ratio of net investment income to average net assets
Portfolio turnover rate(2)
|
(1)
|
Calculated using the average shares outstanding method.
|
|
(2)
|
Calculated on the basis of the Fund as a whole.
|
The accompanying notes are an integral part of these financial statements.
|
WWW.HENNESSYFUNDS.COM
|
18
|
FINANCIAL HIGHLIGHTS — INSTITUTIONAL CLASS
|
|
Year Ended October 31,
|
||||||||||||||||||
|
2023
|
2022
|
2021
|
2020
|
2019
|
||||||||||||||
|
$
|
25.84
|
$
|
26.01
|
$
|
24.01
|
$
|
29.56
|
$
|
28.65
|
|||||||||
|
0.62
|
0.57
|
0.59
|
0.66
|
0.64
|
||||||||||||||
|
(1.70
|
)
|
1.99
|
3.99
|
(4.13
|
)
|
3.50
|
||||||||||||
|
(1.08
|
)
|
2.56
|
4.58
|
(3.47
|
)
|
4.14
|
||||||||||||
|
(0.60
|
)
|
(0.58
|
)
|
(0.65
|
)
|
(0.64
|
)
|
(0.73
|
)
|
|||||||||
|
(1.65
|
)
|
(2.15
|
)
|
(1.93
|
)
|
(1.44
|
)
|
(2.50
|
)
|
|||||||||
|
(2.25
|
)
|
(2.73
|
)
|
(2.58
|
)
|
(2.08
|
)
|
(3.23
|
)
|
|||||||||
|
$
|
22.51
|
$
|
25.84
|
$
|
26.01
|
$
|
24.01
|
$
|
29.56
|
|||||||||
|
-4.74
|
%
|
10.53
|
%
|
20.29
|
%
|
-12.22
|
%
|
15.63
|
%
|
|||||||||
|
$
|
56.75
|
$
|
93.58
|
$
|
63.06
|
$
|
66.46
|
$
|
107.18
|
|||||||||
|
0.71
|
%
|
0.68
|
%
|
0.69
|
%
|
0.70
|
%
|
0.69
|
%
|
|||||||||
|
2.52
|
%
|
2.13
|
%
|
2.35
|
%
|
2.57
|
%
|
2.25
|
%
|
|||||||||
|
12
|
%
|
31
|
%
|
15
|
%
|
16
|
%
|
12
|
%
|
|||||||||
The accompanying notes are an integral part of these financial statements.
|
HENNESSY FUNDS
|
1-800-966-4354
|
19
Financial Statements
|
Notes to the Financial Statements October 31, 2023
|
1). ORGANIZATION
The Hennessy Gas Utility Fund (the “Fund”) is a series of Hennessy Funds Trust (the “Trust”), which was organized as a Delaware statutory trust on September 17, 1992. The Fund is an open-end management
investment company registered under the Investment Company Act of 1940, as amended. The investment objective of the Fund is income and capital appreciation. The Fund is a diversified fund.
The Fund offers Investor Class and Institutional Class shares. Each class of shares differs principally in its respective 12b-1 distribution and service, shareholder servicing, and
sub-transfer agent expenses. There are no sales charges. Each class has identical rights to earnings, assets, and voting privileges, except for class-specific expenses and exclusive rights to vote on matters affecting only one class.
As an investment company, the Fund follows the investment company accounting and reporting guidance of the Financial Accounting Standards Board (the “FASB”) Accounting Standard Codification
Topic 946 “Financial Services—Investment Companies.”
2). SIGNIFICANT ACCOUNTING POLICIES
The following is a summary of significant accounting policies consistently followed by the Fund in the preparation of the financial statements. These policies conform to U.S. generally accepted accounting
principles (“GAAP”).
|
a).
|
Securities Valuation – All investments in securities are valued in accordance with the Fund’s valuation policies and procedures, as described in Note 3.
|
|
b).
|
Federal Income Taxes – The Fund has elected to be taxed as a regulated investment company and intends to distribute substantially all of its taxable income to its shareholders and otherwise comply with
the provisions of the Internal Revenue Code of 1986, as amended, applicable to regulated investment companies. As a result, the Fund has made no provision for federal income taxes or excise taxes. Net investment income/loss and
realized gains/losses for federal income tax purposes may differ from those reported in the financial statements because of temporary book-basis and tax-basis differences. Temporary differences are primarily the result of the
treatment of wash sales for tax reporting purposes. The Fund recognizes interest and penalties related to income tax benefits, if any, in the Statement of Operations as an income tax expense. Distributions from net realized
gains for book purposes may include short-term capital gains, which are included as ordinary income to shareholders for tax purposes. The Fund may utilize equalization accounting for tax purposes and designate earnings and
profits, including net realized gains distributed to shareholders on redemption of shares, as part of the dividends paid deduction for income tax purposes.
|
|
Due to inherent differences in the recognition of income, expenses, and realized gains/losses under GAAP and federal income tax
regulations, permanent differences between book and tax basis for reporting are identified and appropriately reclassified in the Statement of Assets and Liabilities, as needed. The adjustments for fiscal year 2023 are as
follows:
|
|
Total Distributable
|
|||
|
Earnings
|
Capital Stock
|
||
|
$(2,841,901)
|
$2,841,901
|
|
WWW.HENNESSYFUNDS.COM
|
20
|
NOTES TO THE FINANCIAL STATEMENTS
|
|
c).
|
Accounting for Uncertainty in Income Taxes – The Fund has accounting policies regarding recognition and measurement of tax positions taken or expected to be taken on a tax return. The tax returns of
the Fund for the prior three fiscal years are open for examination. The Fund has reviewed all open tax years in major tax jurisdictions and concluded that there is no impact on the Fund’s net assets and no tax liability
resulting from unrecognized tax benefits relating to uncertain income tax positions taken or expected to be taken on a tax return. The Fund’s major tax jurisdictions are U.S. federal and Delaware.
|
|
d).
|
Income and Expenses – Dividend income is recognized on the ex-dividend date or as soon as information is available to the Fund. Interest income, which includes the amortization of premium and accretion
of discount, is recognized on an accrual basis. Market discounts, original issue discounts, and market premiums on debt securities are accreted or amortized to interest income over the life of a security with a corresponding
increase or decrease, as applicable, in the cost basis of such security using the yield-to-maturity method or, where applicable, the first call date of the security. Other non-cash dividends are recognized as investment income
at the fair value of the property received. The Fund is charged for those expenses that are directly attributable to its portfolio, such as advisory, administration, and certain shareholder service fees. Income, expenses (other
than expenses attributable to a specific class), and realized and unrealized gains/losses on investments are allocated to each class of shares based on such class’s net assets.
|
|
e).
|
Distributions to Shareholders – Dividends from net investment income for the Fund, if any, are declared and paid at the end of each calendar quarter. Distributions of net realized capital gains, if
any, are declared and paid annually, usually in December.
|
|
f).
|
Security Transactions – Investment and shareholder transactions are recorded on the trade date. The Fund determines the realized gain/loss from an investment transaction by comparing the original cost
of the security lot sold with the net sale proceeds. Discounts and premiums on securities purchased are accreted or amortized, respectively, over the life of each such security.
|
|
g).
|
Use of Estimates – Preparing financial statements in accordance with GAAP requires management to make estimates and assumptions that affect the reported amounts of assets and liabilities and disclosure
of contingent assets and liabilities at the date of the financial statements, as well as the reported change in net assets during the reporting period. Actual results could differ from those estimates.
|
|
h).
|
Share Valuation – The net asset value (“NAV”) per share of the Fund is calculated by dividing (i) the total value of the securities held by the Fund, plus cash and other assets, minus all liabilities
(including estimated accrued expenses) by (ii) the total number of Fund shares outstanding, rounded to the nearest $0.01. Fund shares are not priced on days the New York Stock Exchange is closed for trading. The offering and
redemption price per share for the Fund is equal to the Fund’s NAV per share.
|
|
i).
|
Illiquid Securities – Pursuant to Rule 22e-4 under the 1940 Act, the Fund has adopted a Liquidity Risk Management Program (the “Liquidity Program”). The Liquidity Program requires, among other things,
that the Fund limit its illiquid investments to no more than 15% of its net assets. An illiquid investment is any investment that the Fund reasonably expects cannot be sold or disposed of by the Fund in current market conditions
in seven calendar days or less without the sale or disposition significantly changing the market value of the investment.
|
|
HENNESSY FUNDS
|
1-800-966-4354
|
21
|
j).
|
Recent Accounting Pronouncements and Regulatory Updates – In October 2022, the Securities and Exchange Commission (“SEC”) adopted a final rule relating to Tailored Shareholder Reports for Mutual Funds
and Exchange-Traded Funds (ETFs); Fee Information in Investment Company Advertisements. The rule and form amendments will require mutual funds and ETFs to transmit concise and visually engaging shareholder reports that highlight
key information. The amendments also will require that funds tag information in a structured data format. In addition, the rule amendments will require that certain more in-depth information be made available online and
available for delivery free of charge to investors on request. The amendments became effective January 24, 2023. There is an 18-month transition period after the effective date of the amendment.
|
|
In June 2022, the FASB issued Accounting Standards Update (“ASU”) 2022-03, Fair Value Measurement (Topic 820): Fair Value
Measurement of Equity Securities Subject to Contractual Sale Restrictions. The ASU clarifies that a contractual restriction on the sale of an equity security is not considered part of the unit of account of the equity security
and, therefore, is not considered in measuring the fair value. The amendments also require additional disclosures related to equity securities subject to contractual sale restrictions. The ASU is effective for fiscal years
beginning after December 15, 2023, and interim periods within those fiscal years.
|
3). SECURITIES VALUATION
The Fund follows its valuation policies and procedures in determining its NAV and, in preparing these financial statements, the fair value accounting standards that establish an authoritative definition of
fair value and set out a hierarchy for measuring fair value. These standards require additional disclosures about the various inputs and valuation techniques used to develop the measurements of fair value and a discussion of changes in
valuation techniques and related inputs during the period. These inputs are summarized in the three broad levels listed below:
|
Level 1 –
|
Unadjusted, quoted prices in active markets for identical instruments that the Fund has the ability to access at the date of measurement.
|
|
|
Level 2 –
|
Other significant observable inputs other than quoted prices included in Level 1 (including, but not limited to, quoted prices in active markets for similar instruments, quoted prices in markets that
are not active for identical or similar instruments, and model-derived valuations in which all significant inputs and significant value drivers are observable in active markets, such as interest rates, prepayment speeds, credit
risk curves, default rates, and similar data).
|
|
|
Level 3 –
|
Significant unobservable inputs (including the Fund’s own assumptions about what market participants would use to price the asset or liability based on the best available information) when observable
inputs are unavailable.
|
The following is a description of the valuation techniques applied to the Fund’s major categories of assets and liabilities on a recurring basis:
|
Equity Securities – Equity securities, including common stocks, preferred stocks, foreign-issued common stocks, exchange-traded funds, closed-end mutual funds,
partnerships, rights, and real estate investment trusts, that are traded on a securities exchange for which a last-quoted sales price is readily available generally are valued at the last sales price as reported by the primary
exchange on which the securities are
|
|
WWW.HENNESSYFUNDS.COM
|
22
|
NOTES TO THE FINANCIAL STATEMENTS
|
|
listed. Securities listed on The Nasdaq Stock Market (“Nasdaq”) generally are valued at the Nasdaq Official Closing Price, which may differ from the last sales price reported. Securities traded on a
securities exchange for which a last-quoted sales price is not readily available generally are valued at the mean between the bid and ask prices. To the extent these securities are actively traded and valuation adjustments are
not applied, they are classified in Level 1 of the fair value hierarchy. Securities traded on foreign exchanges generally are not valued at the same time the Fund calculates its NAV because most foreign markets close well before
such time. The earlier close of most foreign markets gives rise to the possibility that significant events, including broad market moves, may have occurred in the interim. In certain circumstances, it may be determined that a
foreign security needs to be fair valued because it appears that the value of the security might have been materially affected by events occurring after the close of the market in which the security is principally traded, but
before the time the Fund calculates its NAV, such as by a development that affects an entire market or region (e.g., a weather-related event) or a potentially global development (e.g., a terrorist attack that may be expected to
have an effect on investor expectations worldwide).
|
|
|
Registered Investment Companies – Investments in open-end registered investment companies, commonly referred to as mutual funds, generally are priced at the
ending NAV provided by the applicable mutual fund’s service agent and are classified in Level 1 of the fair value hierarchy.
|
|
|
Debt Securities – Debt securities, including corporate bonds, asset-backed securities, mortgage-backed securities, municipal bonds, U.S. Treasuries, and U.S.
government agency issues, are generally valued at market on the basis of valuations furnished by an independent pricing service that utilizes both dealer-supplied valuations and formula-based techniques. The pricing service may
consider recently executed transactions in securities of the issuer or comparable issuers, market price quotations (where observable), bond spreads, and fundamental data relating to the issuer. In addition, the model may
incorporate observable market data, such as reported sales of similar securities, broker quotes, yields, bids, offers, and reference data. Certain securities are valued primarily using dealer quotations. These securities are
generally classified in Level 2 of the fair value hierarchy.
|
|
|
Short-Term Securities – Short-term equity investments, including money market funds, are valued in the manner specified above for equity securities. Short-term
debt investments with an original term to maturity of 60 days or less are valued at amortized cost, which approximates fair market value. If the original term to maturity of a short-term debt investment exceeds 60 days, then the
values as of the 61st day prior to maturity are amortized. Amortized cost is not used if its use would be inappropriate due to credit or other impairments of the issuer, in which case the security’s fair value would be
determined as described below. Short-term securities are generally classified in Level 1 or Level 2 of the fair value hierarchy depending on the inputs used and market activity levels for specific securities.
|
If market quotations are not readily available or if a significant event has occurred that indicates the closing price of a security no longer represents the true value of that security, any
security or other asset will be valued at its fair value in accordance with Rule 2a-5 under the 1940 Act. The Board of Trustees of the Fund (the “Board”) has designated Hennessy Advisors, Inc. (the “Advisor”) as the Fund’s valuation
designee to make all fair value determinations with respect to the Fund’s portfolio investments under the Fund’s fair value pricing procedures, subject to the Board’s oversight. There are numerous criteria
|
HENNESSY FUNDS
|
1-800-966-4354
|
23
considered in determining a fair value of a security, such as the trading volume of a security and markets, the values of other similar securities, and news events with direct bearing on a security or markets.
Fair value pricing results in an estimated price for a security that reflects the amount the Fund might reasonably expect to receive in a current sale. Depending on the relative significance of the valuation inputs, these securities may
be classified in either Level 2 or Level 3 of the fair value hierarchy. The Advisor will regularly evaluate whether the Fund’s fair value pricing procedures continue to be appropriate in light of the specific circumstances of the Fund
and the quality of prices obtained through their application of such procedures.
The fair value of foreign securities may be determined with the assistance of a pricing service using correlations between the movement of prices of such securities and indices of domestic
securities and other appropriate indicators, such as closing market prices of relevant American Depositary Receipts or futures contracts. Using fair value pricing means that the Fund’s NAV reflects the affected portfolio securities’
values as determined by the Advisor, the Board’s valuation designee, pursuant to the Fund’s fair value pricing procedures, instead of being determined by the market. Using a fair value pricing methodology to price a foreign security may
result in a value that is different from such foreign security’s most recent closing price and from the value used by other investment companies to calculate their NAVs. Such securities are generally classified in Level 2 of the fair
value hierarchy. Because the Fund may invest in foreign securities, the value of the Fund’s portfolio securities may change on days when a shareholder is unable to purchase or redeem Fund shares.
The Fund has performed an analysis of all existing investments to determine the significance and character of all inputs to their fair value determinations. Various inputs are used to
determine the value of the Fund’s investments. The inputs or methodology used for valuing securities are not necessarily an indication of the risk associated with investing in those securities. Details related to the fair value
hierarchy of the Fund’s securities as of October 31, 2023, are included in the Schedule of Investments.
4). INVESTMENT TRANSACTIONS
Purchases and sales of investment securities (excluding government and short-term investments) for the Fund during fiscal year 2023 were $61,137,787 and $135,414,185, respectively.
There were no purchases or sales/maturities of long-term U.S. government securities for the Fund during fiscal year 2023.
5). INVESTMENT ADVISORY FEE AND OTHER TRANSACTIONS WITH AFFILIATES
The Advisor provides the Fund with investment advisory services under an Investment Advisory Agreement. The Advisor furnishes all investment advice, office space, and facilities and most of the personnel
needed by the Fund. As compensation for its services, the Advisor is entitled to a monthly fee from the Fund. The fee is based on the average daily net assets of the Fund at an annual rate of 0.40%. The net investment advisory fees
expensed by the Fund during fiscal year 2023 are included in the Statement of Operations.
The Board has approved a Shareholder Servicing Agreement for Investor Class shares of the Fund, which compensates the Advisor for the non-investment advisory services it provides to the
Fund. The Shareholder Servicing Agreement provides for a monthly fee paid to the Advisor at an annual rate of 0.10% of the average daily net assets of the Fund attributable to Investor Class shares. The shareholder service fees expensed
by the Fund during fiscal year 2023 are included in the Statement of Operations.
|
WWW.HENNESSYFUNDS.COM
|
24
|
NOTES TO THE FINANCIAL STATEMENTS
|
The Fund has adopted a plan pursuant to Rule 12b-1 under the Investment Company Act of 1940, as amended, that authorizes payments in connection with the distribution of Fund shares at an
annual rate of up to 0.25% of the Fund’s average daily net assets attributable to Investor Class shares. Even though the authorized rate is up to 0.25%, the Fund is currently only using up to 0.15% of its average daily net assets
attributable to Investor Class shares for such purpose. Amounts paid under the plan may be spent on any activities or expenses primarily intended to result in the sale of shares, including, but not limited to, advertising, shareholder
account servicing, printing and mailing of prospectuses to other than current shareholders, printing and mailing of sales literature, and compensation for sales and marketing activities or to financial institutions and others, such as
dealers and distributors. The distribution fees expensed by the Fund during fiscal year 2023 are included in the Statement of Operations.
The Fund has entered into agreements with various brokers, dealers, and financial intermediaries in connection with the sale of Fund shares. The agreements provide for periodic payments of
sub-transfer agent expenses by the Fund to the brokers, dealers, and financial intermediaries for providing certain shareholder maintenance services. These shareholder services include the pre-processing and quality control of new
accounts, shareholder correspondence, answering customer inquiries regarding account status, and facilitating shareholder telephone transactions. The sub-transfer agent fees expensed by the Fund during fiscal year 2023 are included in
the Statement of Operations.
The Fund has entered into an Administrative Services Agreement among the Fund, the Advisor, and the American Gas Association (“AGA”), pursuant to which the AGA provides administrative
services to the Fund, including overseeing the calculation of the AGA Stock Index. ScottMadden, Inc. performs the actual computations required to produce the AGA Stock Index and receives a fee for such calculations pursuant to a
contractual arrangement with AGA. AGA does not furnish other securities advice to the Fund or the Advisor or make recommendations regarding the purchase or sale of securities by the Fund. Under the terms of the Administrative Services
Agreement, which has been approved by the Board, AGA provides the Fund with current information regarding the common stock composition of the AGA Stock Index at least monthly. In addition, on request, AGA provides the Fund and the
Advisor with information on the natural gas industry. The Fund pays AGA a fee at an annual rate of 0.04% of the average daily net assets of the Fund.
U.S. Bancorp Fund Services, LLC, d/b/a U.S. Bank Global Fund Services (“Fund Services”) provides the Fund with administrative, accounting, and transfer agent services. As administrator, Fund
Services is responsible for activities such as (i) preparing various federal and state regulatory filings, reports, and returns for the Fund, (ii) preparing reports and materials to be supplied to the Board, (iii) monitoring the
activities of the Fund’s custodian, transfer agent, and accountants, and (iv) coordinating the preparation and payment of the Fund’s expenses and reviewing the Fund’s expense accruals. U.S. Bank N.A., an affiliate of Fund Services,
serves as the Fund’s custodian. The servicing agreements between the Trust, Fund Services, and U.S. Bank N.A. contain a fee schedule that is inclusive of administrative, accounting, custody, and transfer agent fees. The administrative,
accounting, custody, and transfer agent fees expensed by the Fund during fiscal year 2023 are included in the Statement of Operations.
Quasar Distributors, LLC, a wholly owned broker-dealer subsidiary of Foreside Financial Group, LLC, acts as the Fund’s principal underwriter in a continuous public offering of Fund shares.
|
HENNESSY FUNDS
|
1-800-966-4354
|
25
The officers of the Fund are affiliated with the Advisor. With the exception of the Chief Compliance Officer, such officers receive no compensation from the Fund for serving in their
respective roles. The Fund, along with the other funds in the Hennessy Funds family (collectively, the “Hennessy Funds”), makes reimbursement payments on an equal basis to the Advisor for a portion of the salary and benefits associated
with the office of the Chief Compliance Officer. The compliance fees expensed by the Fund during fiscal year 2023 for reimbursement payments to the Advisor are included in the Statement of Operations.
6). GUARANTEES AND INDEMNIFICATIONS
Under the Hennessy Funds’ organizational documents, their officers and trustees are indemnified by the Hennessy Funds against certain liabilities arising out of the performance of their duties to the Hennessy
Funds. Additionally, in the normal course of business, the Hennessy Funds enter into contracts with service providers that contain general indemnification clauses. The Fund’s maximum exposure under these arrangements is unknown as this
would involve future claims that may be made against the Fund that have not yet occurred. Currently, the Fund expects the risk of loss to be remote.
7). LINE OF CREDIT
The Fund has an uncommitted line of credit with the other Hennessy Funds in the amount of the lesser of (i) $100,000,000 or (ii) 33.33% of each Hennessy Fund’s net assets, or 30% for the Fund, the Hennessy
Japan Fund, and the Hennessy Japan Small Cap Fund and 10% for the Hennessy Balanced Fund. The line of credit is intended to provide any necessary short-term financing in connection with shareholder redemptions, subject to certain
restrictions. The credit facility is with the Hennessy Funds’ custodian bank, U.S. Bank N.A. Borrowings under this arrangement bear interest at the bank’s prime rate and are secured by all of the Fund’s assets (as to its own borrowings
only). During fiscal year 2023, the Fund had an outstanding average daily balance and a weighted average interest rate of $193,381 and 7.47%, respectively. The interest expensed by the Fund during fiscal year 2023 is included in the
Statement of Operations. The maximum amount outstanding for the Fund during fiscal year 2023 was $8,822,000. As of October 31, 2023, the Fund did not have any borrowings outstanding under the line of credit.
8). FEDERAL TAX INFORMATION
As of October 31, 2023, the components of accumulated earnings (losses) for income tax purposes were as follows:
|
Investments
|
|||||
|
Cost of investments for tax purposes
|
$
|
280,951,523
|
|||
|
Gross tax unrealized appreciation
|
$
|
205,117,524
|
|||
|
Gross tax unrealized depreciation
|
(45,212,687
|
)
|
|||
|
Net tax unrealized appreciation/(depreciation)
|
$
|
159,904,837
|
|||
|
Undistributed ordinary income
|
$
|
276,605
|
|||
|
Undistributed long-term capital gains
|
18,017,888
|
||||
|
Total distributable earnings
|
$
|
18,294,493
|
|||
|
Other accumulated gain/(loss)
|
$
|
—
|
|||
|
Total accumulated gain/(loss)
|
$
|
178,199,330
|
|||
The difference between book-basis unrealized appreciation/depreciation and tax-basis unrealized appreciation/depreciation (as shown above) is attributable primarily to wash sales.
|
WWW.HENNESSYFUNDS.COM
|
26
|
NOTES TO THE FINANCIAL STATEMENTS
|
As of October 31, 2023, the Fund had no tax-basis capital losses to offset future capital gains.
As of October 31, 2023, the Fund did not defer, on a tax basis, any late-year ordinary losses. Late-year ordinary losses are net ordinary losses incurred after December 31, 2022, but within
the taxable year, that are deemed to arise on the first day of the Fund’s next taxable year.
During fiscal years 2023 and 2022, the tax character of distributions paid by the Fund was as follows:
|
Year Ended
|
Year Ended
|
||||||||
|
October 31, 2023
|
October 31, 2022
|
||||||||
|
Ordinary income(1)
|
$
|
13,981,342
|
$
|
10,974,058
|
|||||
|
Long-term capital gains
|
31,091,892
|
42,364,678
|
|||||||
|
Total distributions
|
$
|
45,073,234
|
$
|
53,338,736
|
|||||
|
(1) Ordinary income includes short-term capital gains.
|
|||||||||
9). GLOBAL EVENTS
A rise in protectionist trade policies, the possibility of a national or global recession, risks associated with pandemic and epidemic diseases, trade tensions, the possibility of changes to some international
trade agreements, political events, and continuing political tension and armed conflicts may adversely impact financial markets and the broader economy. For example, ongoing armed conflicts between Ukraine and Russia in Europe and among
Israel, Hamas, and other militant groups in the Middle East have caused and could continue to cause significant market disruptions and volatility with the markets in Europe and the Middle East, and have had negative impacts on markets
in the United States. These events could also have negative effects on the Fund’s investments that cannot be foreseen at the present time. As global systems, economies and financial markets are increasingly interconnected, events that
once had only local impact are now more likely to have regional or even global effects. Events that occur in one country, region or financial market will, more frequently, adversely impact issuers in other countries, regions, or
markets. These impacts can be exacerbated by failures of governments and societies to adequately respond to an emerging event or threat. Your investment would be negatively impacted if the value of your portfolio holdings decreases as a
result of such events, if these events adversely impact the operations and effectiveness of the Advisor or other key service providers or if these events disrupt systems and processes necessary or beneficial to the management of
accounts. These events may negatively impact broad segments of businesses and populations and could have a significant and rapid negative impact on the performance of the Fund’s investments, increase the Fund’s volatility, or exacerbate
pre-existing risks to the Fund.
10). EVENTS SUBSEQUENT TO YEAR END
Management has evaluated the Fund’s related events and transactions that occurred subsequent to October 31, 2023, through the date of issuance of the Fund’s financial statements. Other than as disclosed below,
management has determined that there were no subsequent events requiring recognition or disclosure in the financial statements.
On December 7, 2023, capital gains were declared and paid to shareholders of record on December 6, 2023, as follows:
|
Long-term
|
|||
|
Investor Class
|
0.93724
|
||
|
Institutional Class
|
0.93500
|
|
HENNESSY FUNDS
|
1-800-966-4354
|
27
Report of Independent Registered Public
Accounting Firm
To the Board of Trustees of Hennessy Funds Trust
and the shareholders of the Hennessy Gas Utility Fund
Novato, CA
Opinion on the Financial Statements
We have audited the accompanying statement of assets and liabilities of the Hennessy Gas Utility Fund (the “Fund”), a series of Hennessy Funds Trust, including the schedule of investments, as of October 31,
2023, the related statement of operations for the year then ended, the statements of changes in net assets for each of the two years in the period then ended, the financial highlights for each of the five years in the period then ended,
and the related notes (collectively referred to as the “financial statements”). In our opinion, the financial statements present fairly, in all material respects, the financial position of the Fund as of October 31, 2023, the results of
its operations for the year then ended, the changes in its net assets for each of the two years in the period then ended, and the financial highlights for each of the five years in the period then ended in conformity with accounting
principles generally accepted in the United States of America.
Basis for Opinion
These financial statements are the responsibility of the Fund’s management. Our responsibility is to express an opinion on the Fund’s financial statements based on our audits. We are a public accounting firm
registered with the Public Company Accounting Oversight Board (United States) (“PCAOB”) and are required to be independent with respect to the Fund in accordance with the U.S. federal securities laws and the applicable rules and
regulations of the Securities and Exchange Commission and the PCAOB. We have served as the auditor of one or more of the funds in the Trust since 2002.
We conducted our audits in accordance with the standards of the PCAOB. Those standards require that we plan and perform the audit to obtain reasonable assurance about whether the financial statements are free
of material misstatement, whether due to error or fraud. The Fund is not required to have, nor were we engaged to perform, an audit of its internal control over financial reporting. As part of our audits we are required to obtain an
understanding of internal control over financial reporting, but not for the purpose of expressing an opinion on the effectiveness of the Fund’s internal control over financial reporting. Accordingly, we express no such opinion.
Our audits included performing procedures to assess the risks of material misstatement of the financial statements, whether due to error or fraud, and performing procedures that respond to those risks. Such
procedures included examining, on a test basis, evidence regarding the amounts and disclosures in the financial statements. Our audits also included evaluating the accounting principles used and significant estimates made by management,
as well as evaluating the overall presentation of the financial statements. Our procedures included confirmation of securities owned as of October 31, 2023 by correspondence with the custodian. We believe that our audits provide a
reasonable basis for our opinion.
|
|
|
TAIT, WELLER & BAKER LLP
|
Philadelphia, Pennsylvania
December 22, 2023
|
WWW.HENNESSYFUNDS.COM
|
28
|
REPORT OF INDEPENDENT REGISTERED PUBLIC ACCOUNTING FIRM/TRUSTEES AND OFFICERS
|
Trustees and Officers of the Fund (Unaudited)
The business and affairs of the Funds are managed under the direction of the Board of Trustees of the Trust, and the Board of Trustees elects the officers of the Trust (“Officers”). From time to time, the
Board of Trustees also has appointed advisers to the Board of Trustees (“Advisers”) with the intention of having qualified individuals serve in an advisory capacity to garner experience in the mutual fund and asset management industry
and be considered as potential Trustees in the future. There are currently two Advisers, Brian Alexander and A.J. Hennessy. As Advisers, Mr. Alexander and Mr. A.J. Hennessy attend meetings of the Board of Trustees and act as non-voting
participants. Information pertaining to the Trustees, Advisers, and the Officers of the Trust is set forth below. The Trustees and Officers serve until their successors are duly elected and qualified or until their earlier death,
resignation, or removal. Each Trustee oversees all 17 Hennessy Funds. Unless otherwise indicated, the address of all persons listed below is 7250 Redwood Boulevard, Suite 200, Novato, CA 94945. The Fund’s Statement of Additional
Information includes more information about the persons listed below and is available without charge by calling 800-966-4354 or by visiting www.hennessyfunds.com.
|
Other
|
|||
|
Directorships
|
|||
|
Held Outside
|
|||
|
Name, Age,
|
of Fund
|
||
|
and Position Held
|
Start Date
|
Principal Occupation(s)
|
Complex During
|
|
with the Trust
|
of Service
|
During Past Five Years
|
Past Five Years
|
|
Disinterested Trustees(1) and Disinterested Advisers
|
|||
|
J. Dennis DeSousa
|
January 1996
|
Mr. DeSousa is a real estate investor.
|
None.
|
|
87
|
|||
|
Trustee
|
|||
|
Robert T. Doyle
|
January 1996
|
Mr. Doyle is retired. He served as the
|
None.
|
|
76
|
Sheriff of Marin County, California
|
||
|
Trustee
|
from 1996 to June 2022.
|
||
|
Doug Franklin
|
March 2016
|
Mr. Franklin is a retired insurance
|
None.
|
|
59
|
as an Adviser
|
industry executive. From 1987
|
|
|
Trustee
|
to the Board
|
through 2015, he was employed by
|
|
|
and June 2023
|
the Allianz-Fireman’s Fund Insurance
|
||
|
as a Trustee
|
Company in various positions,
|
||
|
including as its Chief Actuary and
|
|||
|
Chief Risk Officer.
|
|||
|
Claire Garvie
|
December 2015
|
Ms. Garvie is a founder of Kiosk and
|
None.
|
|
49
|
as an Adviser
|
has served as its Chief Operating
|
|
|
Trustee
|
to the Board and
|
Officer since 2004. Kiosk is a
|
|
|
December 2021
|
full-service marketing agency with
|
||
|
as a Trustee
|
offices in the San Francisco Bay Area
|
||
|
and Liverpool, UK and staff across
|
|||
|
nine states in the U.S.
|
|||
|
HENNESSY FUNDS
|
1-800-966-4354
|
29
|
Other
|
|||
|
Directorships
|
|||
|
Held Outside
|
|||
|
Name, Age,
|
of Fund
|
||
|
and Position Held
|
Start Date
|
Principal Occupation(s)
|
Complex During
|
|
with the Trust
|
of Service
|
During Past Five Years
|
Past Five Years
|
|
Gerald P. Richardson
|
May 2004
|
Mr. Richardson is an independent
|
None.
|
|
78
|
consultant in the securities industry.
|
||
|
Trustee
|
|||
|
Brian Alexander
|
March 2015
|
Mr. Alexander has served as the
|
None.
|
|
42
|
Chief Operating Officer of Solis
|
||
|
Adviser to the Board
|
Mammography since March 2023.
|
||
|
Prior to that, he worked for the
|
|||
|
Sutter Health organization from
|
|||
|
2011 to 2023 in various positions.
|
|||
|
He served as the Chief Executive
|
|||
|
Officer of the North Valley Hospital
|
|||
|
Area from 2021 to March 2023.
|
|||
|
From 2018 to 2021, he served as the
|
|||
|
Chief Executive Officer of Sutter
|
|||
|
Roseville Medical Center. From 2016
|
|||
|
through 2018, he served as the Vice
|
|||
|
President of Strategy for the Sutter
|
|||
|
Health Valley Area, which includes
|
|||
|
11 hospitals, 13 ambulatory surgery
|
|||
|
centers, 16,000 employees, and
|
|||
|
1,900 physicians.
|
|||
|
Interested Trustee and Interested Adviser(2)
|
|||
|
Neil J. Hennessy
|
January 1996 as
|
Mr. Neil Hennessy has been employed
|
Hennessy
|
|
67
|
a Trustee and
|
by Hennessy Advisors, Inc. since
|
Advisors, Inc.
|
|
Chairman of the Board,
|
June 2008 as
|
1989 and currently serves as its
|
|
|
Chief Market Strategist,
|
an Officer
|
Chairman and Chief Executive Officer.
|
|
|
Portfolio Manager,
|
|||
|
and President
|
|||
|
A.J. Hennessy
|
December 2022
|
Mr. A.J. Hennessy has been employed
|
None.
|
|
37
|
by Hennessy Advisors, Inc. since 2011.
|
||
|
Adviser to the Board
|
|||
|
and Vice President,
|
|||
|
Corporate Development
|
|||
|
and Operations
|
|||
|
WWW.HENNESSYFUNDS.COM
|
30
|
TRUSTEES AND OFFICERS OF THE FUND
|
|
Name, Age,
|
||
|
and Position Held
|
Start Date
|
Principal Occupation(s)
|
|
with the Trust
|
of Service
|
During Past Five Years
|
|
Officers
|
||
|
Teresa M. Nilsen
|
January 1996
|
Ms. Nilsen has been employed by Hennessy Advisors, Inc.
|
|
57
|
since 1989 and currently serves as its President, Chief
|
|
|
Executive Vice President
|
Operating Officer, and Secretary.
|
|
|
and Treasurer
|
||
|
Daniel B. Steadman
|
March 2000
|
Mr. Steadman has been employed by Hennessy Advisors, Inc.
|
|
67
|
since 2000 and currently serves as its Executive Vice President.
|
|
|
Executive Vice President
|
||
|
and Secretary
|
||
|
Brian Carlson
|
December 2013
|
Mr. Carlson has been employed by Hennessy Advisors, Inc.
|
|
51
|
since December 2013 and currently serves as its Chief
|
|
|
Senior Vice President
|
Compliance Officer and Senior Vice President.
|
|
|
and Head of Distribution
|
||
|
David Ellison(3)
|
October 2012
|
Mr. Ellison has been employed by Hennessy Advisors, Inc.
|
|
65
|
since October 2012. He has served as a Portfolio Manager of
|
|
|
Senior Vice President
|
the Hennessy Large Cap Financial Fund and the Hennessy
|
|
|
and Portfolio Manager
|
Small Cap Financial Fund since their inception. Mr. Ellison also
|
|
|
served as a Portfolio Manager of the Hennessy Technology
|
||
|
Fund from its inception until February 2017. Mr. Ellison served
|
||
|
as Director, CIO, and President of FBR Fund Advisers, Inc.
|
||
|
from December 1999 to October 2012.
|
||
|
Jennifer Emerson(4)
|
June 2013
|
Ms. Emerson has been employed by Hennessy Advisors, Inc.
|
|
46
|
as its General Counsel since June 2013.
|
|
|
Senior Vice President and
|
||
|
Chief Compliance Officer
|
||
|
Ryan Kelley(5)
|
March 2013
|
Mr. Kelley has been employed by Hennessy Advisors, Inc. since
|
|
51
|
October 2012. He has served as Chief Investment Officer of the
|
|
|
Senior Vice President,
|
Hennessy Funds since March 2021 and has served as a Portfolio
|
|
|
Chief Investment Officer,
|
Manager of the Hennessy Gas Utility Fund, the Hennessy Large
|
|
|
and Portfolio Manager
|
Cap Financial Fund, and the Hennessy Small Cap Financial Fund
|
|
|
since October 2014. Mr. Kelley served as Co-Portfolio Manager
|
||
|
of these same funds from March 2013 through September
|
||
|
2014 and as a Portfolio Analyst for the Hennessy Funds from
|
||
|
October 2012 through February 2013. He has also served as a
|
||
|
Portfolio Manager of the Hennessy Cornerstone Growth Fund,
|
||
|
the Hennessy Cornerstone Mid Cap 30 Fund, the Hennessy
|
||
|
Cornerstone Large Growth Fund, and the Hennessy
|
||
|
Cornerstone Value Fund since February 2017 and as a Portfolio
|
||
|
Manager of the Hennessy Total Return Fund, the Hennessy
|
||
|
Balanced Fund, and the Hennessy Technology Fund since May
|
||
|
2018. He previously served as Co-Portfolio Manager of the
|
||
|
Hennessy Technology Fund from February 2017 until May 2018.
|
||
|
Mr. Kelley served as Portfolio Manager of FBR Fund
|
||
|
Advisers, Inc. from January 2008 to October 2012.
|
|
HENNESSY FUNDS
|
1-800-966-4354
|
31
|
Name, Age,
|
||
|
and Position Held
|
Start Date
|
Principal Occupation(s)
|
|
with the Trust
|
of Service
|
During Past Five Years
|
|
L. Joshua Wein(5)
|
September 2018
|
Mr. Wein has been employed by Hennessy Advisors, Inc. since
|
|
50
|
2018. He has served as Portfolio Manager of the Hennessy
|
|
|
Vice President and
|
Cornerstone Growth Fund, the Hennessy Cornerstone Mid Cap
|
|
|
Portfolio Manager
|
30 Fund, the Hennessy Cornerstone Large Growth Fund, the
|
|
|
Hennessy Cornerstone Value Fund, Hennessy Total Return Fund,
|
||
|
the Hennessy Balanced Fund, the Hennessy Gas Utility Fund,
|
||
|
and the Hennessy Technology Fund since February 2021, and
|
||
|
as the Co-Portfolio Manager of these Funds since February
|
||
|
2019. He served as a Senior Analyst of those same Funds from
|
||
|
September 2018 through February 2019. He also has served as
|
||
|
a Portfolio Manager of the Hennessy Energy Transition Fund
|
||
|
and the Hennessy Midstream Fund since January 2022.
|
||
|
Mr. Wein served as Director of Alternative Investments and
|
||
|
Co-Portfolio Manager at Sterling Capital Management
|
||
|
from 2008 to 2018.
|
_______________
|
(1)
|
The Funds have determined that Mr. DeSousa, Mr. Doyle, Mr. Franklin, Ms. Garvie, and Mr. Richardson are not interested persons, as defined in the 1940 Act, of the Investment
Manager or of any predecessor investment adviser for purposes of Section 15(f) of the 1940 Act.
|
|
(2)
|
Each of Neil J. Hennessy and A.J. Hennessy is considered an interested person, as defined in the 1940 Act, because he is an officer of the Trust.
|
|
(3)
|
The address of this officer is 101 Federal Street, Suite 1615B, Boston, MA 02110.
|
|
(4)
|
The address of this officer is 4800 Bee Caves Road, Suite 100, Austin, TX 78746.
|
|
(5)
|
The address of this officer is 1340 Environ Way, Chapel Hill, NC 27517.
|
|
WWW.HENNESSYFUNDS.COM
|
32
|
TRUSTEES AND OFFICERS OF THE FUND
|
(This Page Intentionally Left Blank.)
|
HENNESSY FUNDS
|
1-800-966-4354
|
33
Expense Example (Unaudited)
October 31, 2023
As a shareholder of the Fund, you incur ongoing costs, including management fees, service fees, and other Fund expenses. This Example is intended to help you understand your ongoing costs (in dollars) of
investing in the Fund and to compare these costs with the ongoing costs of investing in other investment funds. The Example is based on an investment of $1,000 invested at the beginning of the period and held for the entire period from
May 1, 2023, through October 31, 2023.
Actual Expenses
In the table below, the first line under each of the “Investor Class” and “Institutional Class” headings provides information about actual account values and actual expenses for each share class. You may use
this information, together with the amount you invested, to estimate the expenses that you paid over the period. Simply divide your account value by $1,000 (for example, an $8,600 account value divided by $1,000 = 8.6), then multiply
the result by the number in the first line under the heading “Expenses Paid During Period” to estimate the expenses you paid on your account during this period. Although the Fund charges no sales loads or transaction fees, you will be
assessed fees for outgoing wire transfers, returned checks, and stop payment orders at prevailing rates charged by U.S. Bank Global Fund Services, the Fund’s transfer agent. If you request that a redemption be made by wire transfer, the
Fund’s transfer agent charges a $15 fee. IRAs are charged a $15 annual maintenance fee (up to $30 maximum per shareholder for shareholders with multiple IRAs). The examples below include, but are not limited to, management, shareholder
servicing, accounting, custody, and transfer agent fees. However, the examples below do not include portfolio trading commissions and related expenses.
Hypothetical Example for Comparison Purposes
In the table below, the second line under each of the “Investor Class” and “Institutional Class” headings provides information about hypothetical account values and hypothetical expenses based on the Fund’s
actual expense ratio for each share class and an assumed rate of return of 5% per year before expenses, which is not the Fund’s actual return for such share class. The hypothetical account values and expenses may not be used to estimate
the actual ending account balance or expenses you paid for the period. You may use this information to compare the ongoing costs of investing in the Fund and other funds. To do so, compare these 5% hypothetical examples with the 5%
hypothetical examples that appear in the shareholder reports of the other funds. Please note that the expenses shown in the table are meant to highlight your ongoing costs only. Therefore, the second lines under “Investor Class” and
“Institutional Class” are useful in comparing ongoing costs only and will not help you determine the relative total costs of owning different funds.
|
WWW.HENNESSYFUNDS.COM
|
34
|
EXPENSE EXAMPLE
|
|
Expenses Paid
|
|||
|
Beginning
|
Ending
|
During Period(1)
|
|
|
Account Value
|
Account Value
|
May 1, 2023 –
|
|
|
May 1, 2023
|
October 31, 2023
|
October 31, 2023
|
|
|
Investor Class
|
|||
|
Actual
|
$1,000.00
|
$ 922.10
|
$4.84
|
|
Hypothetical (5% return before expenses)
|
$1,000.00
|
$1,020.16
|
$5.09
|
|
Institutional Class
|
|||
|
Actual
|
$1,000.00
|
$ 923.30
|
$3.39
|
|
Hypothetical (5% return before expenses)
|
$1,000.00
|
$1,021.68
|
$3.57
|
|
(1)
|
Expenses are equal to the Fund’s annualized expense ratio of 1.00% for Investor Class shares or 0.70% for Institutional Class shares, as applicable, multiplied by the average account value over the
period, multiplied by 184/365 days (to reflect the half-year period.
|
|
HENNESSY FUNDS
|
1-800-966-4354
|
35
How to Obtain a Copy of the Fund’s Proxy
Voting Policy and Proxy Voting Records
A description of the policies and procedures the Fund uses to determine how to vote proxies relating to portfolio securities is available without charge (1) by calling 800-966-4354, (2) on the Hennessy Funds’
website at www.hennessyfunds.com/proxy-voting/voting-policy, or (3) on the U.S. Securities and Exchange Commission’s (the “SEC”) website at www.sec.gov. The Fund’s proxy voting record is available without charge on both the Hennessy
Funds’ website at www.hennessyfunds.com/proxy-voting/voting-record and the SEC’s website at www.sec.gov no later than August 31 for the prior 12 months ending June 30.
Availability of Quarterly Portfolio Schedule
The Fund files a complete schedule of portfolio holdings with the SEC for the first and third quarters of each fiscal year as an exhibit to its reports on Form N-PORT. The Fund’s Form N-PORT reports are
available on the SEC’s website at www.sec.gov or on request by calling 800-966-4354.
Federal Tax Distribution Information (Unaudited)
For fiscal year 2023, certain dividends paid by the Fund may be subject to a maximum tax rate of 23.8%, as provided for by the Jobs and Growth Tax Relief Reconciliation Act of 2003. The percentage of dividends
declared from ordinary income designated as qualified dividend income was 100.00%.
For corporate shareholders, the percent of ordinary income distributions that qualified for the corporate dividends received deduction for fiscal year 2023 was 98.24%.
The percentage of taxable ordinary income distributions that were designated as short-term capital gain distributions under Section 871(k)(2)(C) of the Internal Revenue Code of 1986, as
amended, for the Fund was 21.25%.
Important Notice Regarding Delivery
of Shareholder Documents
To help keep the Fund’s costs as low as possible, we generally deliver a single copy of shareholder reports, proxy statements, and prospectuses to shareholders who share an address and have the same last name.
This process does not apply to account statements. You may request an individual copy of a shareholder document at any time. If you would like to receive separate mailings of shareholder documents, please call U.S. Bank Global Fund
Services at 800-261-6950 or 414-765-4124, and individual delivery will begin within 30 days of your request. If your account is held through a financial institution or other intermediary, please contact such intermediary directly to
request individual delivery.
Electronic Delivery
As currently permitted by SEC regulations, the Fund’s shareholder reports are made available on a website, and unless you sign for eDelivery or elect to receive paper copies as detailed below, you will be
notified by mail each time a report is posted and provided with a website link to access the report.
To elect to receive paper copies of all future reports free of charge, please call U.S. Bank Global Fund Services at 800-261-6950 or 414-765-4124.
The Fund also offers shareholders the option to receive all notices, account statements, prospectuses, tax forms, and shareholder reports electronically. To sign up for eDelivery or change
your delivery preference, please visit www.hennessyfunds.com/account.
Shareholder reports transmitted after July 24, 2024, will comply with the new tailored shareholder reporting requirements, which require streamlined annual and semi-annual reports to
shareholders that highlight key information. These reports will be transmitted in paper unless a shareholder elects to receive reports electronically via eDelivery. To sign up for eDelivery, please visit
http://www.hennessyfunds.com/account.
Subscribe to receive our team’s unique market and sector insights delivered to your inbox
www.hennessyfunds.com/subscribe
Follow us on social media
| |
|
|
WWW.HENNESSYFUNDS.COM
|
36
|
PROXY VOTING — PRIVACY POLICY
|
Liquidity Risk Management Program
In accordance with Rule 22e-4 under the Investment Company Act of 1940, as amended (the “Liquidity Rule”), we have adopted and implemented a liquidity risk management program (the “Liquidity Program”). The
purpose of the Liquidity Program is to assess and manage the Fund’s liquidity risk, which is the risk that the Fund would not be able to meet requests to redeem Fund shares without significant dilution of the remaining shareholders’
interests in the Fund. The Board of Trustees of the Fund (the “Board”) designated a committee comprising representatives of Hennessy Advisors, Inc., the investment adviser to the Fund, as the administrator of the Liquidity Program (the
“Program Administrator”).
The Program Administrator provided a written report regarding the Liquidity Program to the Board in advance of its meeting on June 7, 2023. The report covered the period from June 1, 2022,
through May 31, 2023. The report addressed the operation of the Liquidity Program, assessed the adequacy and effectiveness of its implementation, and described any material changes to the Liquidity Program during the review period. The
Trust’s chief compliance officer presented the report to the Board at the meeting and provided additional information regarding the Liquidity Program. The Board reviewed the Liquidity Program and considered, among other items, the
following:
|
1.
|
The Program Administrator reviewed daily historical net redemption activity during the review period and during prior periods with higher-than-average redemption activity and concluded that the Fund
has historically been able to meet requests to redeem Fund shares without significant dilution to the Fund’s remaining shareholders, and the Program Administrator expects the Fund to be able to continue to do so in the future
during both normal and reasonably foreseeable stressed conditions.
|
|
|
2.
|
The Fund primarily holds assets that are highly liquid investments and is not required to establish a highly liquid investment minimum for the Fund or adopt policies and procedures for responding to a
highly liquid investment minimum shortfall.
|
|
|
3.
|
The Program Administrator did not make or recommend any material changes to the Liquidity Program during the review period.
|
|
|
4.
|
The Program Administrator concluded that the Liquidity Program was reasonably designed to assess and manage the Fund’s liquidity risk, complies with the requirements of the Liquidity Rule, and was
operating as intended during the review period.
|
Privacy Policy
We collect the following personal information about you:
|
1.
|
Information we receive from you in applications or other forms, correspondence, or conversations, including, but not limited to, your name, address, phone number, social security number, assets,
income, and date of birth;
|
|
|
2.
|
Information about your transactions with us, our affiliates, or others, including, but not limited to, your account number and balance, payments history, parties to transactions, cost basis
information, and other financial information; and
|
|
HENNESSY FUNDS
|
1-800-966-4354
|
37
|
3.
|
Other personal information we collect from various sources, even if you have not entered into a prior transaction with us, including the following:
|
|
•
|
Name, alias, address, unique personal identifier, online identifier, IP address, email address, telephone number, account name, and other similar identifiers;
|
||
|
•
|
Age and marital status;
|
||
|
•
|
Commercial information, including records of products purchased;
|
||
|
•
|
Browsing history, search history, and information on interaction with our website;
|
||
|
•
|
Geolocation data;
|
||
|
•
|
Employment and employment history, educational history, financial information, and purchasing and consuming histories or tendencies; and
|
||
|
•
|
Inferences drawn from the above-listed information to create a profile about your preferences, characteristics, predispositions, and behavior.
|
We collect this information directly from you, indirectly in the course of providing services to you, directly and indirectly from your activity on our website, from broker dealers,
marketing agencies, and other third parties that interact with us in connection with the services we perform and products we offer, and from anonymized and aggregated consumer information.
We use this information to fulfill the reason you provided the information to us, to provide you with other relevant products that you request from us, to provide you with information about
products that may interest you, to improve our website or present our website’s contents to you, and as otherwise described to you when collecting your personal information.
We do not disclose any personal information to unaffiliated third parties, except as permitted by law. We may disclose your personal information to our affiliates, vendors, and service
providers for a business purpose. For example, we are permitted by law to disclose all of the information we collect, as described above, to our transfer agent to process your transactions. When disclosing your personal information to
third parties, we enter into a contract with each third party describing the purpose of such disclosure and requiring that such personal information be kept confidential and not used for any purpose except to perform the services
contracted or respond to regulatory or law enforcement requests.
Furthermore, we restrict access to your personal information to those persons who require such information to provide products or services to you. As a result, we do not provide a means for
opting out of our limited sharing of your information. We maintain physical, electronic, and procedural safeguards that comply with federal standards to guard your personal information.
If you hold shares of the Funds through a financial intermediary, including, but not limited to, a broker-dealer, bank, or trust company, the privacy policy of your financial intermediary
governs how your personal information is shared with unaffiliated third parties.
If you live in a state such as California where the laws provide further privacy rights, we will not share information unless the law allows, and we will comply with the other state-specific
requirements.
|
WWW.HENNESSYFUNDS.COM
|
38
|
PRIVACY POLICY
|
Supplemental Privacy Notice for Residents of California
The California Consumer Privacy Act of 2018 (the “CCPA”) provides you, as a California resident, with certain additional rights relating to your personal information.
Under the CCPA, you have the right to request that we disclose to you the categories of personal information we have collected about you over the past 12 months, the categories of sources of
such information, our business purpose for collecting the information, the categories of third parties, if any, with whom we shared the information, and the specific information we have collected about you. You also have the right to
request that we delete any of your personal information, and, unless an exception applies, we will delete such information upon receiving and confirming your request. To make a request, call us at 1-800-966-4354, email us at
privacy@hennessyfunds.com, or go to www.hennessyfunds.com/contact. We will not discriminate against you for exercising your rights under the CCPA. Further, we will not collect additional categories of your personal information or use
the personal information we collected for materially different, unrelated, or incompatible purposes without providing you notice.
|
HENNESSY FUNDS
|
1-800-966-4354
|
39
(This Page Intentionally Left Blank.)
For information, questions, or assistance, please call
The Hennessy Funds
800-966-4354 or 415-899-1555
INVESTMENT ADVISOR
Hennessy Advisors, Inc.
7250 Redwood Boulevard, Suite 200
Novato, California 94945
ADMINISTRATOR,
TRANSFER AGENT,
DIVIDEND PAYING AGENT, &
SHAREHOLDER SERVICING AGENT
U.S. Bancorp Fund Services, LLC
d/b/a U.S. Bank Global Fund Services
P.O. Box 701
Milwaukee, Wisconsin 53201-0701
CUSTODIAN
U.S. Bank N.A.
Custody Operations
1555 North River Center Drive, Suite 302
Milwaukee, Wisconsin 53212
TRUSTEES
Neil J. Hennessy
Robert T. Doyle
J. Dennis DeSousa
Doug Franklin
Claire Garvie
Gerald P. Richardson
COUNSEL
Foley & Lardner LLP
777 East Wisconsin Avenue
Milwaukee, Wisconsin 53202-5306
INDEPENDENT REGISTERED
PUBLIC ACCOUNTING FIRM
Tait, Weller & Baker LLP
Two Liberty Place
50 South 16th Street, Suite 2900
Philadelphia, Pennsylvania 19102-2529
DISTRIBUTOR
Quasar Distributors, LLC
111 East Kilbourn Avenue, Suite 1250
Milwaukee, Wisconsin 53202
www.hennessyfunds.com | 800-966-4354
This report has been prepared for shareholders and may be distributed to
others only if preceded or accompanied by a current prospectus.
ANNUAL REPORT
OCTOBER 31, 2023

HENNESSY JAPAN FUND
Investor Class HJPNX
Institutional Class HJPIX
www.hennessyfunds.com | 1-800-966-4354
(This Page Intentionally Left Blank.)
Contents
|
Letter to Shareholders
|
2
|
|
|
Performance Overview
|
4
|
|
|
Financial Statements
|
||
|
Schedule of Investments
|
7
|
|
|
Statement of Assets and Liabilities
|
11
|
|
|
Statement of Operations
|
12
|
|
|
Statements of Changes in Net Assets
|
13
|
|
|
Financial Highlights
|
14
|
|
|
Notes to the Financial Statements
|
18
|
|
|
Report of Independent Registered Public Accounting Firm
|
27
|
|
|
Trustees and Officers of the Fund
|
28
|
|
|
Expense Example
|
32
|
|
|
Proxy Voting Policy and Proxy Voting Records
|
34
|
|
|
Availability of Quarterly Portfolio Schedule
|
34
|
|
|
Important Notice Regarding Delivery of Shareholder Documents
|
34
|
|
|
Electronic Delivery
|
34
|
|
|
Liquidity Risk Management Program
|
35
|
|
|
Privacy Policy
|
35
|
|
HENNESSY FUNDS
|
1-800-966-4354
|
December 2023
Dear Hennessy Funds Shareholder:
The Japanese stock market returned 17.58% as measured by the Tokyo Stock Price Index (TOPIX) over the 12-month period ended October 31, 2023 (in U.S. dollar terms). During this period, the TOPIX recorded a
33-year high. Increasing global geopolitical risks, the monetary policy of the Bank of Japan (BOJ) under new governor Kazuo Ueda, inflationary trends and pressure on wage increases, along with yen depreciation, were among the factors
pushing Japanese equities higher.
On the macroeconomic front, Japan is showing resilience despite a darkening outlook abroad. One of the tailwinds is continued expansionary monetary policy. Contrary to the rest of the
world, the new BOJ governor Ueda has repeatedly reaffirmed that the current ultra-low interest rates will remain unchanged until there are clear signs of stable 2% inflation rate. A pro-growth, pro-inflation central bank is what Japan
needs to overcome a decades-long deflationary mindset.
Another factor boosting positive momentum included continued efforts around corporate governance and stock market reform by the Tokyo Stock Exchange (TSE). The TSE has requested listed
companies with price-to-book (PB) ratios below 1 to increase shareholder value, aiming to improve the share prices of these companies to PB ratios above 1. This initiative is part of a series of corporate governance reforms that have
been making progress since the introduction of the stewardship code and corporate governance code in 2014 and 2015 respectively, under so-called Abenomics. Prior to these initiatives, shareholders’ interests were hardly among the top
priorities of management resulting in below-cost-of-equity ROEs (around mid-single digits). Fast forward to today, Japan’s ROEs have improved meaningfully to an average of around 10% due to a greater focus on profitability and capital
efficiency. Nevertheless, approximately 1,800 stocks (out of 3,300 listed on TSE Prime and Standard section), or over 50% of the entire Japanese stock market as of the end of March, are still trading below book value. The TSE aims to
reduce the number of such companies.
|
WWW.HENNESSYFUNDS.COM
|
2
|
LETTER TO SHAREHOLDERS
|
Thank you for your continued confidence and investment in the Hennessy Funds.
Sincerely,

 |
 |
|
Tadahiro Fujimura
|
Masakazu Takeda
|
|
Portfolio Manager,
|
Portfolio Manager,
|
|
Hennessy Japan Small Cap Fund;
|
Hennessy Japan Fund;
|
|
Chief Investment Officer
|
Fund Manager
|
|
SPARX Asset Management Co., Ltd.
|
SPARX Asset Management Co., Ltd.
|
SPARX Asset Management Co., Ltd., located in Tokyo, Japan, is the sub-advisor to the Hennessy Japan Fund and the Hennessy Japan Small Cap Fund.
Past performance does not guarantee future results.
Mutual fund investing involves risk. Principal loss is possible.
Opinions expressed are those of Tadahiro Fujimura and Masakazu Takeda and are subject to change, are not guaranteed, and should not be considered investment advice.
The Tokyo Stock Price Index (TOPIX) is a capitalization-weighted index of all of the companies listed on the First Section of the Tokyo Stock Exchange. The index is used herein for comparative purposes in
accordance with SEC regulations. One cannot invest directly in an index.
Price-to-book ratio is a valuation measure calculated by dividing a company’s market price per share by its book value per share. Return
on equity (ROE) is the measure of a company’s net income divided by its shareholders’ equity.
|
HENNESSY FUNDS
|
1-800-966-4354
|
3
Performance Overview (Unaudited)
CHANGE IN VALUE OF $10,000 INVESTMENT

This graph illustrates the performance of an initial investment of $10,000 made in the Fund 10 years ago and assumes the reinvestment of dividends and capital gains.
AVERAGE ANNUAL TOTAL RETURN FOR PERIODS ENDED OCTOBER 31, 2023
|
One
|
Five
|
Ten
|
|
|
Year
|
Years
|
Years
|
|
|
Hennessy Japan Fund –
|
|||
|
Investor Class (HJPNX)
|
18.89%
|
1.01%
|
6.04%
|
|
Hennessy Japan Fund –
|
|||
|
Institutional Class (HJPIX)
|
19.36%
|
1.41%
|
6.41%
|
|
Russell/Nomura Total Market™ Index
|
17.77%
|
3.18%
|
4.56%
|
|
Tokyo Stock Price Index (TOPIX)
|
17.58%
|
2.89%
|
4.36%
|
Expense ratios: 1.44% (Investor Class); 1.05% (Institutional Class)
Performance data quoted represents past performance; past performance does not guarantee future results. The investment return and principal value of an investment will fluctuate so that
an investor’s shares, when redeemed, may be worth more or less than their original cost. The performance table does not reflect the deduction of taxes that a shareholder would pay on Fund distributions or the redemption of Fund
shares. Current performance of the Fund may be lower or higher than the performance quoted. Performance data current to the most recent month end may be obtained by visiting www.hennessyfunds.com.
The Russell/Nomura Total Market™ Index represents approximately 98% of the investable Japan equity market. The Tokyo Stock
Price Index (TOPIX) is a capitalization-weighted index of all of the companies listed on the First Section of the Tokyo Stock Exchange. One cannot invest directly in an index. These indices are used for comparative purposes in
accordance with Securities and Exchange Commission regulations.
Frank Russell Company (“Russell”) is the source and owner of the trademarks, service marks, and copyrights related to the Russell Indexes. Russell® is a trademark of Frank Russell Company. Neither Russell nor its licensors accept any liability for any errors or omissions in the Russell Indexes or Russell ratings or underlying data and no party may
rely on any Russell Indexes or Russell ratings or underlying data contained in this communication. No further distribution of Russell data is permitted without Russell’s express written consent. Russell does not promote, sponsor, or
endorse the content of this communication.
The expense ratios presented are from the most recent prospectus. The expense ratios for the current reporting period are available in the Financial Highlights section of this report.
|
WWW.HENNESSYFUNDS.COM
|
4
|
PERFORMANCE OVERVIEW
|
PERFORMANCE NARRATIVE
Portfolio Managers Masakazu Takeda, CFA and CMA*, Angus Lee, CFA*, and Kohei Matsui
SPARX Asset Management Co., Ltd. (sub-advisor)
Performance:
For the one-year period ended October 31, 2023, the Investor Class of the Hennessy Japan Fund returned 18.89%, outperforming both the Russell/Nomura Total Market™ Index (the Fund’s primary benchmark) and the Tokyo Stock Price Index (TOPIX), which returned 17.77% and 17.58%, respectively, for the same period in U.S. dollar terms.
Among positive contributors in the Fund during the period were Mitsubishi Corporation, the largest trading company in Japan, Hitachi, Ltd., one of Japan’s oldest electric equipment and
heavy industrial machinery manufacturers, and Rohto Pharmaceuticals Company, Ltd., a leading skincare cosmetics and over-the-counter (OTC) ophthalmic medicines producer. Mitsubishi Corp’s share price rose on expectations of an upturn
in earnings this fiscal year due to higher resource prices since the beginning of the year. Hitachi is steadily increasing its order backlog in its Hitachi Energy and railway systems businesses and is expected to contribute to the
global decarbonization trend by combining this with its IT-related Lumada business in the future. Personal care products of Rohto, such as OTC eye drops, skincare cosmetics, and sunscreen, are selling well both in Japan and overseas.
The main detractors to the Fund’s performance were Olympus Corporation, a leading company in the medical field with a 70% share of the world market in gastrointestinal endoscopy, Recruit
Holdings Co., Ltd., Japan’s unique HR and media company and the owner of U.S.-based online job advertisement subsidiary Indeed, and Renesas Electronics Corporation, Japan’s largest semiconductor maker specializing in microcontroller
units (MCUs) and analog chips. Olympus’ share price was weighed down by a warning letter from the FDA to the company’s domestic production plant regarding design verification and documentation-related matters. Recruit’s share price
fell as the market became aware of weakness due to the economic slowdown. Renesas saw a correction in share price due to rising industry inventory levels, which resulted in lower factory utilization.
The Fund continues to own all of the companies mentioned.
Portfolio Strategy:
The Fund seeks long-term capital appreciation by investing in equity securities of Japanese companies regardless of market capitalization. We screen for companies that we believe have strong businesses and
management and that are trading at attractive valuations. Through in-depth and rigorous analysis and on-site research, we identify stocks with a potential “value gap.” The portfolio is limited to our best ideas and maintains a
concentrated number of holdings.
Investment Commentary:
Our portfolio approach is to construct a concentrated portfolio of what we believe are great global companies based in Japan, and we hold these companies for the long term to capture the potential capital
compounding effect. Seeking out great companies means looking not just for businesses with sustainably high returns on invested capital, but also for those that can grow consistently regardless of macroeconomic conditions. In our
portfolio, you will find consumer stocks that we consider defensive, economically-sensitive but high-quality industrials, and recession-resistant healthcare and internet stocks, as well as companies with diversified business
portfolios. We aim to blend these types of
|
HENNESSY FUNDS
|
1-800-966-4354
|
5
businesses to pursue our goal of a portfolio that we believe can perform better than average in both strong and weak markets. This strategy serves as our first line of defense against downside risk to the
Fund’s performance in both absolute and relative terms.
The recent inflationary trend and the expectation for interest rate hikes in Japan can be seen as positive developments for the economy. But the prospects are not “definitive positives”
yet as it remains to be seen whether the current inflation becomes “good inflation” or “bad inflation,” though we are cautiously optimistic. There is a persistent view that Japan could always fall back into deflation if a recession
hits, but we see the possibility of unexpectedly high and sticky inflation. We learned last year that overseas inflation could spread to Japan when a sharp rise in U.S. Treasury yields triggered a rapid depreciation of the yen,
fueling domestic inflation through soaring import prices. In the meantime, we believe the portfolio is positioned well. It continues to remain concentrated around select attractive mid-to-large cap Japanese companies with global
operations, yet sufficiently diversified to weather unexpected adverse macro-economic events, be it higher-than-expected inflation, higher interest rates, or currency movements. Some of the Fund’s holdings are genuinely fast-growing
companies with attractive valuations, while others are growth companies trading at value stock-like multiples with significant ability to buy back shares and maintain high dividend yields. The overarching characteristics of all these
names are that they have strong durable competitive advantages and huge addressable markets.
______________
* Chartered Member of the Security Analysts Association of Japan
Opinions expressed are those of the Portfolio Managers as of the date written and are subject to change, are not guaranteed, and should not be considered investment advice or an indication of trading intent.
The Fund invests in small-capitalization and medium-capitalization companies, which may have more limited liquidity and greater price volatility than larger companies. The Fund invests in
the stocks of companies operating in Japan; single-country funds and those that are concentrated in one or more industry sectors may be subject to a higher degree of market risk. Funds that invest in other investment companies,
including exchange-traded funds, may experience higher fees. Please see the Fund’s prospectus for a more complete discussion of these and other risks.
References to specific securities should not be considered a recommendation to buy or sell any security. Fund holdings and sector allocations are subject to change. Please refer to the Schedule of
Investments included in this report for additional portfolio information.
|
WWW.HENNESSYFUNDS.COM
|
6
|
PERFORMANCE OVERVIEW/SCHEDULE OF INVESTMENTS
|
Financial Statements
|
Schedule of Investments as of October 31,
2023
|
HENNESSY JAPAN FUND
(% of Net Assets)
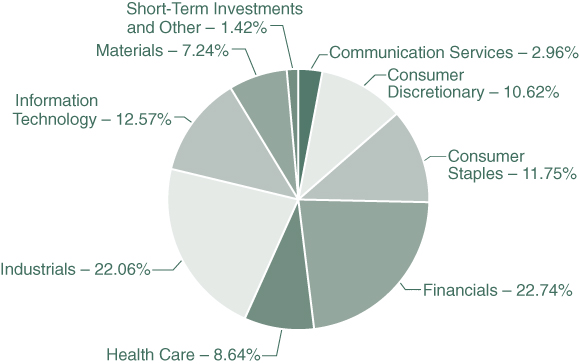
|
TOP TEN HOLDINGS (EXCLUDING MONEY MARKET FUNDS)
|
% NET ASSETS
|
|
Hitachi Ltd.
|
7.40%
|
|
Mitsubishi Corp.
|
7.04%
|
|
Mitsubishi UF J Financial Group, Inc.
|
5.69%
|
|
Shin-Etsu Chemical Co., Ltd.
|
5.41%
|
|
Seven & i Holdings Co., Ltd.
|
5.32%
|
|
Sony Group Corp.
|
5.29%
|
|
ORIX Corp.
|
5.22%
|
|
Recruit Holdings Co., Ltd.
|
4.84%
|
|
Tokyo Electron Ltd.
|
4.70%
|
|
Tokyo Marine Holdings, Inc.
|
4.57%
|
Note: For presentation purposes, the Fund has grouped some of the industry categories. For purposes of categorizing securities for compliance with Section 8(b)(1) of the Investment Company Act of 1940, as
amended, the Fund uses more specific industry classifications.
The Global Industry Classification Standard (GICS®) was developed by and is the exclusive property and a service mark of MSCI,
Inc. and Standard & Poor’s Financial Services LLC. It has been licensed for use by the Hennessy Funds.
|
HENNESSY FUNDS
|
1-800-966-4354
|
7
|
COMMON STOCKS – 98.58%
|
Number
|
% of
|
||||||||||
|
|
of Shares
|
Value
|
Net Assets
|
|||||||||
|
Communication Services – 2.96%
|
||||||||||||
|
Nippon Telegraph & Telephone Corp.
|
7,023,000
|
$
|
8,264,496
|
2.96
|
%
|
|||||||
|
Consumer Discretionary – 10.62%
|
||||||||||||
|
Asics Corp.
|
152,500
|
4,830,740
|
1.73
|
%
|
||||||||
|
Fast Retailing Co., Ltd.
|
45,400
|
10,051,397
|
3.60
|
%
|
||||||||
|
Sony Group Corp.
|
177,400
|
14,748,838
|
5.29
|
%
|
||||||||
|
|
29,630,975
|
10.62
|
%
|
|||||||||
|
Consumer Staples – 11.75%
|
||||||||||||
|
Rohto Pharmaceutical Co., Ltd.
|
510,600
|
11,912,966
|
4.27
|
%
|
||||||||
|
Seven & i Holdings Co., Ltd.
|
405,000
|
14,838,678
|
5.32
|
%
|
||||||||
|
Unicharm Corp.
|
177,900
|
6,044,842
|
2.16
|
%
|
||||||||
|
|
32,796,486
|
11.75
|
%
|
|||||||||
|
Financials – 22.74%
|
||||||||||||
|
Japan Exchange Group, Inc.
|
322,300
|
6,373,417
|
2.28
|
%
|
||||||||
|
Mitsubishi UFJ Financial Group, Inc.
|
1,892,000
|
15,872,266
|
5.69
|
%
|
||||||||
|
MS&AD Insurance Group Holdings, Inc.
|
199,200
|
7,298,795
|
2.62
|
%
|
||||||||
|
ORIX Corp.
|
800,700
|
14,561,812
|
5.22
|
%
|
||||||||
|
Sompo Holdings, Inc.
|
152,200
|
6,593,299
|
2.36
|
%
|
||||||||
|
Tokio Marine Holdings, Inc.
|
570,600
|
12,765,598
|
4.57
|
%
|
||||||||
|
|
63,465,187
|
22.74
|
%
|
|||||||||
|
Health Care – 8.64%
|
||||||||||||
|
Hoya Corp.
|
35,900
|
3,456,044
|
1.24
|
%
|
||||||||
|
Olympus Corp.
|
852,700
|
11,388,108
|
4.08
|
%
|
||||||||
|
Santen Pharmaceutical Co., Ltd.
|
640,100
|
5,551,938
|
1.99
|
%
|
||||||||
|
Terumo Corp.
|
136,200
|
3,726,186
|
1.33
|
%
|
||||||||
|
|
24,122,276
|
8.64
|
%
|
|||||||||
|
Industrials – 22.06%
|
||||||||||||
|
Daikin Industries, Ltd.
|
44,500
|
6,415,963
|
2.30
|
%
|
||||||||
|
Hitachi Ltd.
|
325,700
|
20,645,025
|
7.40
|
%
|
||||||||
|
MISUMI Group, Inc.
|
88,700
|
1,342,799
|
0.48
|
%
|
||||||||
|
Mitsubishi Corp.
|
421,500
|
19,648,459
|
7.04
|
%
|
||||||||
|
Recruit Holdings Co., Ltd.
|
470,600
|
13,493,376
|
4.84
|
%
|
||||||||
|
|
61,545,622
|
22.06
|
%
|
|||||||||
The accompanying notes are an integral part of these financial statements.
|
WWW.HENNESSYFUNDS.COM
|
8
|
SCHEDULE OF INVESTMENTS
|
|
COMMON STOCKS
|
Number
|
% of
|
||||||||||
|
|
of Shares
|
Value
|
Net Assets
|
|||||||||
|
Information Technology – 12.57%
|
||||||||||||
|
Keyence Corp.
|
21,600
|
$
|
8,361,764
|
3.00
|
%
|
|||||||
|
Renesas Electronics Corp. (a)
|
586,800
|
7,707,982
|
2.76
|
%
|
||||||||
|
Rohm Co. Ltd.
|
18,700
|
299,611
|
0.11
|
%
|
||||||||
|
Socionext, Inc.
|
57,100
|
5,569,369
|
2.00
|
%
|
||||||||
|
Tokyo Electron Ltd.
|
99,300
|
13,121,273
|
4.70
|
%
|
||||||||
|
|
35,059,999
|
12.57
|
%
|
|||||||||
|
Materials – 7.24%
|
||||||||||||
|
Nissan Chemical Corp.
|
125,300
|
5,110,384
|
1.83
|
%
|
||||||||
|
Shin-Etsu Chemical Co., Ltd.
|
504,700
|
15,092,235
|
5.41
|
%
|
||||||||
|
|
20,202,619
|
7.24
|
%
|
|||||||||
|
|
||||||||||||
|
Total Common Stocks
|
||||||||||||
|
(Cost $225,142,204)
|
275,087,660
|
98.58
|
%
|
|||||||||
|
|
||||||||||||
|
SHORT-TERM INVESTMENTS – 0.00%
|
||||||||||||
|
Money Market Funds – 0.00%
|
||||||||||||
|
First American Treasury Obligations Fund - Class X, 5.275% (b)
|
320
|
320
|
0.00
|
%
|
||||||||
|
|
||||||||||||
|
Total Short-Term Investments
|
||||||||||||
|
(Cost $320)
|
320
|
0.00
|
%
|
|||||||||
|
|
||||||||||||
|
Total Investments
|
||||||||||||
|
(Cost $225,142,524) – 98.58%
|
275,087,980
|
98.58
|
%
|
|||||||||
|
Other Assets in Excess of Liabilities - 1.42%
|
3,960,990
|
1.42
|
%
|
|||||||||
|
|
||||||||||||
|
TOTAL NET ASSETS – 100.00%
|
$
|
279,048,970
|
100.00
|
%
|
||||||||
Percentages are stated as a percent of net assets.
|
(a)
|
Non-income producing security.
|
|
(b)
|
The rate listed is the fund’s seven-day yield as of October 31, 2023.
|
The accompanying notes are an integral part of these financial statements.
|
HENNESSY FUNDS
|
1-800-966-4354
|
9
Summary of Fair Value Exposure as of October 31, 2023
The following is a summary of the inputs used to value the Fund’s net assets as of October 31, 2023 (see Note 3 in the accompanying Notes to the Financial Statements):
|
Common Stocks
|
Level 1
|
Level 2
|
Level 3
|
Total
|
||||||||||||
|
Communication Services
|
$
|
—
|
$
|
8,264,496
|
$
|
—
|
$
|
8,264,496
|
||||||||
|
Consumer Discretionary
|
—
|
29,630,975
|
—
|
29,630,975
|
||||||||||||
|
Consumer Staples
|
—
|
32,796,486
|
—
|
32,796,486
|
||||||||||||
|
Financials
|
—
|
63,465,187
|
—
|
63,465,187
|
||||||||||||
|
Health Care
|
—
|
24,122,276
|
—
|
24,122,276
|
||||||||||||
|
Industrials
|
—
|
61,545,622
|
—
|
61,545,622
|
||||||||||||
|
Information Technology
|
—
|
35,059,999
|
—
|
35,059,999
|
||||||||||||
|
Materials
|
—
|
20,202,619
|
—
|
20,202,619
|
||||||||||||
|
Total Common Stocks
|
$
|
—
|
$
|
275,087,660
|
$
|
—
|
$
|
275,087,660
|
||||||||
|
Short-Term Investments
|
||||||||||||||||
|
Money Market Funds
|
$
|
320
|
$
|
—
|
$
|
—
|
$
|
320
|
||||||||
|
Total Short-Term Investments
|
$
|
320
|
$
|
—
|
$
|
—
|
$
|
320
|
||||||||
|
Total Investments
|
$
|
320
|
$
|
275,087,660
|
$
|
—
|
$
|
275,087,980
|
||||||||
The accompanying notes are an integral part of these financial statements.
|
WWW.HENNESSYFUNDS.COM
|
10
|
SCHEDULE OF INVESTMENTS/STATEMENT OF ASSETS AND LIABILITIES
|
Financial Statements
|
Statement of Assets and Liabilities as of October 31, 2023
|
|
ASSETS:
|
||||
|
Investments in securities, at value (cost $225,142,524)
|
$
|
275,087,980
|
||
|
Dividends and interest receivable
|
2,494,041
|
|||
|
Receivable for fund shares sold
|
220,122
|
|||
|
Receivable for securities sold
|
5,246,872
|
|||
|
Prepaid expenses and other assets
|
109,070
|
|||
|
Total assets
|
283,158,085
|
|||
|
LIABILITIES:
|
||||
|
Loans payable
|
3,640,000
|
|||
|
Payable for fund shares redeemed
|
162,375
|
|||
|
Payable to advisor
|
196,873
|
|||
|
Payable to administrator
|
50,565
|
|||
|
Payable to auditor
|
22,750
|
|||
|
Accrued distribution fees
|
7,982
|
|||
|
Accrued service fees
|
3,979
|
|||
|
Accrued trustees fees
|
7,463
|
|||
|
Accrued expenses and other payables
|
17,128
|
|||
|
Total liabilities
|
4,109,115
|
|||
|
NET ASSETS
|
$
|
279,048,970
|
||
|
NET ASSETS CONSISTS OF:
|
||||
|
Capital stock
|
$
|
213,501,457
|
||
|
Total distributable earnings
|
65,547,513
|
|||
|
Total net assets
|
$
|
279,048,970
|
||
|
NET ASSETS:
|
||||
|
Investor Class
|
||||
|
Shares authorized (no par value)
|
Unlimited
|
|||
|
Net assets applicable to outstanding shares
|
$
|
45,607,762
|
||
|
Shares issued and outstanding
|
1,303,532
|
|||
|
Net asset value, offering price, and redemption price per share
|
$
|
34.99
|
||
|
Institutional Class
|
||||
|
Shares authorized (no par value)
|
Unlimited
|
|||
|
Net assets applicable to outstanding shares
|
$
|
233,441,208
|
||
|
Shares issued and outstanding
|
6,426,892
|
|||
|
Net asset value, offering price, and redemption price per share
|
$
|
36.32
|
||
The accompanying notes are an integral part of these financial statements.
|
HENNESSY FUNDS
|
1-800-966-4354
|
11
Financial Statements
|
Statement of Operations for the year ended October 31, 2023
|
|
INVESTMENT INCOME:
|
||||
|
Dividend income(1)
|
$
|
5,011,845
|
||
|
Interest income
|
473,684
|
|||
|
Total investment income
|
5,485,529
|
|||
|
EXPENSES:
|
||||
|
Investment advisory fees (See Note 5)
|
2,288,901
|
|||
|
Administration, accounting, custody, and transfer agent fees (See Note 5)
|
273,192
|
|||
|
Sub-transfer agent expenses – Investor Class (See Note 5)
|
94,245
|
|||
|
Sub-transfer agent expenses – Institutional Class (See Note 5)
|
145,604
|
|||
|
Distribution fees – Investor Class (See Note 5)
|
68,570
|
|||
|
Federal and state registration fees
|
47,792
|
|||
|
Service fees – Investor Class (See Note 5)
|
45,714
|
|||
|
Interest expense (See Note 7)
|
44,693
|
|||
|
Reports to shareholders
|
28,245
|
|||
|
Audit fees
|
22,747
|
|||
|
Compliance expense (See Note 5)
|
22,676
|
|||
|
Trustees’ fees and expenses
|
19,754
|
|||
|
Legal fees
|
5,983
|
|||
|
Other expenses
|
58,588
|
|||
|
Total expenses
|
3,166,704
|
|||
|
NET INVESTMENT INCOME
|
$
|
2,318,825
|
||
|
REALIZED AND UNREALIZED GAINS (LOSSES):
|
||||
|
Net realized gain on investments
|
$
|
42,400,692
|
||
|
Net change in unrealized appreciation/depreciation on investments
|
6,442,668
|
|||
|
Net gain on investments
|
48,843,360
|
|||
|
NET INCREASE IN NET ASSETS RESULTING FROM OPERATIONS
|
$
|
51,162,185
|
||
|
(1)
|
Net of foreign taxes withheld of $557,038.
|
The accompanying notes are an integral part of these financial statements.
|
WWW.HENNESSYFUNDS.COM
|
12
|
STATEMENT OF OPERATIONS/STATEMENTS OF CHANGES IN NET ASSETS
|
Financial Statements
|
Statements of Changes in Net Assets
|
|
Year Ended
|
Year Ended
|
|||||||
|
October 31, 2023
|
October 31, 2022
|
|||||||
|
OPERATIONS:
|
||||||||
|
Net investment income
|
$
|
2,318,825
|
$
|
4,811
|
||||
|
Net realized gain (loss) on investments
|
42,400,692
|
(12,342,481
|
)
|
|||||
|
Net change in unrealized
|
||||||||
|
appreciation/depreciation on investments
|
6,442,668
|
(265,779,808
|
)
|
|||||
|
Net increase (decrease) in net
|
||||||||
|
assets resulting from operations
|
51,162,185
|
(278,117,478
|
)
|
|||||
|
DISTRIBUTIONS TO SHAREHOLDERS:
|
||||||||
|
Distributable earnings – Investor Class
|
—
|
(747,296
|
)
|
|||||
|
Distributable earnings – Institutional Class
|
—
|
(11,015,401
|
)
|
|||||
|
Total distributions
|
—
|
(11,762,697
|
)
|
|||||
|
CAPITAL SHARE TRANSACTIONS:
|
||||||||
|
Proceeds from shares subscribed – Investor Class
|
20,718,473
|
15,554,341
|
||||||
|
Proceeds from shares subscribed – Institutional Class
|
125,835,127
|
190,629,014
|
||||||
|
Dividends reinvested – Investor Class
|
—
|
703,285
|
||||||
|
Dividends reinvested – Institutional Class
|
—
|
10,598,719
|
||||||
|
Cost of shares redeemed – Investor Class
|
(21,606,576
|
)
|
(30,693,545
|
)
|
||||
|
Cost of shares redeemed – Institutional Class
|
(211,849,600
|
)
|
(395,706,790
|
)
|
||||
|
Net decrease in net assets derived
|
||||||||
|
from capital share transactions
|
(86,902,576
|
)
|
(208,914,976
|
)
|
||||
|
TOTAL DECREASE IN NET ASSETS
|
(35,740,391
|
)
|
(498,795,151
|
)
|
||||
|
NET ASSETS:
|
||||||||
|
Beginning of year
|
314,789,361
|
813,584,512
|
||||||
|
End of year
|
$
|
279,048,970
|
$
|
314,789,361
|
||||
|
CHANGES IN SHARES OUTSTANDING:
|
||||||||
|
Shares sold – Investor Class
|
585,760
|
403,264
|
||||||
|
Shares sold – Institutional Class
|
3,442,909
|
4,980,990
|
||||||
|
Shares issued to holders as reinvestment
|
||||||||
|
of dividends – Investor Class
|
—
|
15,157
|
||||||
|
Shares issued to holders as reinvestment
|
||||||||
|
of dividends – Institutional Class
|
—
|
221,545
|
||||||
|
Shares redeemed – Investor Class
|
(626,166
|
)
|
(876,884
|
)
|
||||
|
Shares redeemed – Institutional Class
|
(6,060,158
|
)
|
(10,842,081
|
)
|
||||
|
Net decrease in shares outstanding
|
(2,657,655
|
)
|
(6,098,009
|
)
|
||||
The accompanying notes are an integral part of these financial statements.
|
HENNESSY FUNDS
|
1-800-966-4354
|
13
Financial Statements
|
Financial Highlights
|
For an Investor Class share outstanding throughout each year
PER SHARE DATA:
Net asset value, beginning of year
Income from investment operations:
Net investment income (loss)(1)
Net realized and unrealized gains (losses) on investments
Total from investment operations
Less distributions:
Dividends from net investment income
Dividends from net realized gains
Total distributions
Net asset value, end of year
TOTAL RETURN
SUPPLEMENTAL DATA AND RATIOS:
Net assets, end of year (millions)
Ratio of expenses to average net assets
Ratio of net investment income (loss) to average net assets
Portfolio turnover rate(2)
|
(1)
|
Calculated using the average shares outstanding method.
|
|
(2)
|
Calculated on the basis of the Fund as a whole.
|
The accompanying notes are an integral part of these financial statements.
|
WWW.HENNESSYFUNDS.COM
|
14
|
FINANCIAL HIGHLIGHTS — INVESTOR CLASS
|
|
Year Ended October 31,
|
||||||||||||||||||
|
2023
|
2022
|
2021
|
2020
|
2019
|
||||||||||||||
|
$
|
29.43
|
$
|
47.78
|
$
|
42.79
|
$
|
37.17
|
$
|
33.63
|
|||||||||
|
0.23
|
(0.11
|
)
|
(0.23
|
)
|
(0.14
|
)
|
0.05
|
|||||||||||
|
5.33
|
(17.83
|
)
|
5.22
|
5.81
|
3.50
|
|||||||||||||
|
5.56
|
(17.94
|
)
|
4.99
|
5.67
|
3.55
|
|||||||||||||
|
—
|
(0.41
|
)
|
—
|
(0.02
|
)
|
(0.01
|
)
|
|||||||||||
|
—
|
—
|
—
|
(0.03
|
)
|
—
|
|||||||||||||
|
—
|
(0.41
|
)
|
—
|
(0.05
|
)
|
(0.01
|
)
|
|||||||||||
|
$
|
34.99
|
$
|
29.43
|
$
|
47.78
|
$
|
42.79
|
$
|
37.17
|
|||||||||
|
18.89
|
%
|
-37.86
|
%
|
11.66
|
%
|
15.27
|
%
|
10.60
|
%
|
|||||||||
|
$
|
45.61
|
$
|
39.55
|
$
|
86.11
|
$
|
142.30
|
$
|
87.22
|
|||||||||
|
1.44
|
%
|
1.44
|
%
|
1.43
|
%
|
1.43
|
%
|
1.43
|
%
|
|||||||||
|
0.65
|
%
|
(0.30
|
)%
|
(0.49
|
)%
|
(0.37
|
)%
|
0.14
|
%
|
|||||||||
|
57
|
%
|
21
|
%
|
16
|
%
|
23
|
%
|
9
|
%
|
|||||||||
The accompanying notes are an integral part of these financial statements.
|
HENNESSY FUNDS
|
1-800-966-4354
|
15
Financial Statements
|
Financial Highlights
|
For an Institutional Class share outstanding throughout each year
PER SHARE DATA:
Net asset value, beginning of year
Income from investment operations:
Net investment income (loss)(1)
Net realized and unrealized gains (losses) on investments
Total from investment operations
Less distributions:
Dividends from net investment income
Dividends from net realized gains
Total distributions
Net asset value, end of year
TOTAL RETURN
SUPPLEMENTAL DATA AND RATIOS:
Net assets, end of year (millions)
Ratio of expenses to average net assets
Ratio of net investment income (loss) to average net assets
Portfolio turnover rate(3)
|
(1)
|
Calculated using the average shares outstanding method.
|
|
(2)
|
Amount is between $(0.005) and $0.005.
|
|
(3)
|
Calculated on the basis of the Fund as a whole.
|
The accompanying notes are an integral part of these financial statements.
|
WWW.HENNESSYFUNDS.COM
|
16
|
FINANCIAL HIGHLIGHTS — INSTITUTIONAL CLASS
|
|
Year Ended October 31,
|
||||||||||||||||||
|
2023
|
2022
|
2021
|
2020
|
2019
|
||||||||||||||
|
$
|
30.43
|
$
|
49.54
|
$
|
44.19
|
$
|
38.37
|
$
|
34.67
|
|||||||||
|
0.30
|
0.02
|
(0.03
|
)
|
0.02
|
0.21
|
|||||||||||||
|
5.59
|
(18.39
|
)
|
5.38
|
5.99
|
3.60
|
|||||||||||||
|
5.89
|
(18.37
|
)
|
5.35
|
6.01
|
3.81
|
|||||||||||||
|
—
|
(0.74
|
)
|
(0.00
|
)(2)
|
(0.16
|
)
|
(0.11
|
)
|
||||||||||
|
—
|
—
|
—
|
(0.03
|
)
|
—
|
|||||||||||||
|
—
|
(0.74
|
)
|
(0.00
|
)(2)
|
(0.19
|
)
|
(0.11
|
)
|
||||||||||
|
$
|
36.32
|
$
|
30.43
|
$
|
49.54
|
$
|
44.19
|
$
|
38.37
|
|||||||||
|
19.36
|
%
|
-37.63
|
%
|
12.11
|
%
|
15.72
|
%
|
11.02
|
%
|
|||||||||
|
$
|
233.44
|
$
|
275.24
|
$
|
727.47
|
$
|
608.11
|
$
|
611.41
|
|||||||||
|
1.04
|
%
|
1.05
|
%
|
1.04
|
%
|
1.04
|
%
|
1.03
|
%
|
|||||||||
|
0.84
|
%
|
0.04
|
%
|
(0.07
|
)%
|
0.04
|
%
|
0.59
|
%
|
|||||||||
|
57
|
%
|
21
|
%
|
16
|
%
|
23
|
%
|
9
|
%
|
|||||||||
The accompanying notes are an integral part of these financial statements.
|
HENNESSY FUNDS
|
1-800-966-4354
|
17
Financial Statements
|
Notes to the Financial Statements October 31, 2023
|
1). ORGANIZATION
The Hennessy Japan Fund (the “Fund”) is a series of Hennessy Funds Trust (the “Trust”), which was organized as a Delaware statutory trust on September 17, 1992. The Fund is an open-end management investment
company registered under the Investment Company Act of 1940, as amended. The investment objective of the Fund is long-term capital appreciation. The Fund is a diversified fund, but employs a relatively concentrated investment strategy
and may hold securities of fewer issuers than other diversified funds.
The Fund offers Investor Class and Institutional Class shares. Each class of shares differs principally in its respective 12b-1 distribution and service, shareholder servicing, and
sub-transfer agent expenses. There are no sales charges. Each class has identical rights to earnings, assets, and voting privileges, except for class-specific expenses and exclusive rights to vote on matters affecting only one class.
As an investment company, the Fund follows the investment company accounting and reporting guidance of the Financial Accounting Standards Board (the “FASB”) Accounting Standard
Codification Topic 946 “Financial Services—Investment Companies.”
2). SIGNIFICANT ACCOUNTING POLICIES
The following is a summary of significant accounting policies consistently followed by the Fund in the preparation of the financial statements. These policies conform to U.S. generally accepted accounting
principles (“GAAP”).
|
a).
|
Securities Valuation – All investments in securities are valued in accordance with the Fund’s valuation policies and procedures, as described in Note 3.
|
|
b).
|
Federal Income Taxes – The Fund has elected to be taxed as a regulated investment company and intends to distribute substantially all of its taxable income to its shareholders and otherwise comply
with the provisions of the Internal Revenue Code of 1986, as amended, applicable to regulated investment companies. As a result, the Fund has made no provision for federal income taxes or excise taxes. Net investment
income/loss and realized gains/losses for federal income tax purposes may differ from those reported in the financial statements because of temporary book-basis and tax-basis differences. Temporary differences are primarily
the result of the treatment of wash sales for tax reporting purposes. The Fund recognizes interest and penalties related to income tax benefits, if any, in the Statement of Operations as an income tax expense. Distributions
from net realized gains for book purposes may include short-term capital gains, which are included as ordinary income to shareholders for tax purposes. The Fund may utilize equalization accounting for tax purposes and
designate earnings and profits, including net realized gains distributed to shareholders on redemption of shares, as part of the dividends paid deduction for income tax purposes.
|
|
Due to inherent differences in the recognition of income, expenses, and realized gains/losses under GAAP and federal income tax
regulations, permanent differences between book and tax basis for reporting are identified and appropriately reclassified in the Statement of Assets and Liabilities, as needed. The adjustments for fiscal year 2023 are as
follows:
|
|
Total
|
|||
|
Distributable
|
|||
|
Earnings
|
Capital Stock
|
||
|
$3,146,828
|
$(3,146,828)
|
|
WWW.HENNESSYFUNDS.COM
|
18
|
NOTES TO THE FINANCIAL STATEMENTS
|
|
c).
|
Accounting for Uncertainty in Income Taxes – The Fund has accounting policies regarding recognition and measurement of tax positions taken or expected to be taken on a tax return. The tax returns of
the Fund for the prior three fiscal years are open for examination. The Fund has reviewed all open tax years in major tax jurisdictions and concluded that there is no impact on the Fund’s net assets and no tax liability
resulting from unrecognized tax benefits relating to uncertain income tax positions taken or expected to be taken on a tax return. The Fund’s major tax jurisdictions are U.S. federal and Delaware.
|
|
d).
|
Income and Expenses – Dividend income is recognized on the ex-dividend date or as soon as information is available to the Fund. Interest income, which includes the amortization of premium and
accretion of discount, is recognized on an accrual basis. Market discounts, original issue discounts, and market premiums on debt securities are accreted or amortized to interest income over the life of a security with a
corresponding increase or decrease, as applicable, in the cost basis of such security using the yield-to-maturity method or, where applicable, the first call date of the security. Other non-cash dividends are recognized as
investment income at the fair value of the property received. The Fund is charged for those expenses that are directly attributable to its portfolio, such as advisory, administration, and certain shareholder service fees.
Income, expenses (other than expenses attributable to a specific class), and realized and unrealized gains/losses on investments are allocated to each class of shares based on such class’s net assets.
|
|
e).
|
Distributions to Shareholders – Dividends from net investment income for the Fund, if any, are declared and paid annually, usually in December. Distributions of net realized capital gains, if any,
are declared and paid annually, usually in December.
|
|
f).
|
Security Transactions – Investment and shareholder transactions are recorded on the trade date. The Fund determines the realized gain/loss from an investment transaction by comparing the original
cost of the security lot sold with the net sale proceeds. Discounts and premiums on securities purchased are accreted or amortized, respectively, over the life of each such security.
|
|
g).
|
Use of Estimates – Preparing financial statements in accordance with GAAP requires management to make estimates and assumptions that affect the reported amounts of assets and liabilities and
disclosure of contingent assets and liabilities at the date of the financial statements, as well as the reported change in net assets during the reporting period. Actual results could differ from those estimates.
|
|
h).
|
Share Valuation – The net asset value (“NAV”) per share of the Fund is calculated by dividing (i) the total value of the securities held by the Fund, plus cash and other assets, minus all liabilities
(including estimated accrued expenses) by (ii) the total number of Fund shares outstanding, rounded to the nearest $0.01. Fund shares are not priced on days the New York Stock Exchange is closed for trading. The offering and
redemption price per share for the Fund is equal to the Fund’s NAV per share.
|
|
i).
|
Foreign Currency – Values of investments denominated in foreign currencies are converted into U.S. dollars using the spot market exchange rate at the time of valuation. Purchases and sales of
investments and income are translated into U.S. dollars using the spot market exchange rate prevailing on the respective dates of such transactions. The Fund does not isolate the portion of the results of operations resulting
from fluctuations in foreign exchange rates on investments from fluctuations resulting from changes in the market prices of securities held. Such fluctuations are included with the net realized and unrealized gain/loss on
investments. Foreign investments present additional risks due to currency fluctuations, economic and political factors, lower liquidity, government regulations, differences in accounting standards, and other factors.
|
|
HENNESSY FUNDS
|
1-800-966-4354
|
19
|
j).
|
Illiquid Securities – Pursuant to Rule 22e-4 under the 1940 Act, the Fund has adopted a Liquidity Risk Management Program (the “Liquidity Program”). The Liquidity Program requires, among other
things, that the Fund limit its illiquid investments to no more than 15% of its net assets. An illiquid investment is any investment that the Fund reasonably expects cannot be sold or disposed of by the Fund in current market
conditions in seven calendar days or less without the sale or disposition significantly changing the market value of the investment.
|
|
k).
|
Recent Accounting Pronouncements and Regulatory Updates – In October 2022, the Securities and Exchange Commission (“SEC”) adopted a final rule relating to Tailored Shareholder Reports for Mutual
Funds and Exchange-Traded Funds (ETFs); Fee Information in Investment Company Advertisements. The rule and form amendments will require mutual funds and ETFs to transmit concise and visually engaging shareholder reports that
highlight key information. The amendments also will require that funds tag information in a structured data format. In addition, the rule amendments will require that certain more in-depth information be made available online
and available for delivery free of charge to investors on request. The amendments became effective January 24, 2023. There is an 18-month transition period after the effective date of the amendment.
|
|
In June 2022, the FASB issued Accounting Standards Update (“ASU”) 2022-03, Fair Value Measurement (Topic 820): Fair Value
Measurement of Equity Securities Subject to Contractual Sale Restrictions. The ASU clarifies that a contractual restriction on the sale of an equity security is not considered part of the unit of account of the equity security
and, therefore, is not considered in measuring the fair value. The amendments also require additional disclosures related to equity securities subject to contractual sale restrictions. The ASU is effective for fiscal years
beginning after December 15, 2023, and interim periods within those fiscal years.
|
3). SECURITIES VALUATION
The Fund follows its valuation policies and procedures in determining its NAV and, in preparing these financial statements, the fair value accounting standards that establish an authoritative definition of
fair value and set out a hierarchy for measuring fair value. These standards require additional disclosures about the various inputs and valuation techniques used to develop the measurements of fair value and a discussion of changes
in valuation techniques and related inputs during the period. These inputs are summarized in the three broad levels listed below:
|
Level 1 –
|
Unadjusted, quoted prices in active markets for identical instruments that the Fund has the ability to access at the date of measurement.
|
|
|
Level 2 –
|
Other significant observable inputs other than quoted prices included in Level 1 (including, but not limited to, quoted prices in active markets for similar instruments, quoted prices in markets that
are not active for identical or similar instruments, and model-derived valuations in which all significant inputs and significant value drivers are observable in active markets, such as interest rates, prepayment speeds,
credit risk curves, default rates, and similar data).
|
|
|
Level 3 –
|
Significant unobservable inputs (including the Fund’s own assumptions about what market participants would use to price the asset or liability based on the best available information) when observable
inputs are unavailable.
|
|
WWW.HENNESSYFUNDS.COM
|
20
|
NOTES TO THE FINANCIAL STATEMENTS
|
The following is a description of the valuation techniques applied to the Fund’s major categories of assets and liabilities on a recurring basis:
|
Equity Securities – Equity securities, including common stocks, preferred stocks, foreign-issued common stocks, exchange-traded funds, closed-end mutual
funds, partnerships, rights, and real estate investment trusts, that are traded on a securities exchange for which a last-quoted sales price is readily available generally are valued at the last sales price as reported by the
primary exchange on which the securities are listed. Securities listed on The Nasdaq Stock Market (“Nasdaq”) generally are valued at the Nasdaq Official Closing Price, which may differ from the last sales price reported.
Securities traded on a securities exchange for which a last-quoted sales price is not readily available generally are valued at the mean between the bid and ask prices. To the extent these securities are actively traded and
valuation adjustments are not applied, they are classified in Level 1 of the fair value hierarchy. Securities traded on foreign exchanges generally are not valued at the same time the Fund calculates its NAV because most
foreign markets close well before such time. The earlier close of most foreign markets gives rise to the possibility that significant events, including broad market moves, may have occurred in the interim. In certain
circumstances, it may be determined that a foreign security needs to be fair valued because it appears that the value of the security might have been materially affected by events occurring after the close of the market in
which the security is principally traded, but before the time the Fund calculates its NAV, such as by a development that affects an entire market or region (e.g., a weather-related event) or a potentially global development
(e.g., a terrorist attack that may be expected to have an effect on investor expectations worldwide).
|
|
|
Registered Investment Companies – Investments in open-end registered investment companies, commonly referred to as mutual funds, generally are priced at the
ending NAV provided by the applicable mutual fund’s service agent and are classified in Level 1 of the fair value hierarchy.
|
|
|
Debt Securities – Debt securities, including corporate bonds, asset-backed securities, mortgage-backed securities, municipal bonds, U.S. Treasuries, and U.S.
government agency issues, are generally valued at market on the basis of valuations furnished by an independent pricing service that utilizes both dealer-supplied valuations and formula-based techniques. The pricing service
may consider recently executed transactions in securities of the issuer or comparable issuers, market price quotations (where observable), bond spreads, and fundamental data relating to the issuer. In addition, the model may
incorporate observable market data, such as reported sales of similar securities, broker quotes, yields, bids, offers, and reference data. Certain securities are valued primarily using dealer quotations. These securities are
generally classified in Level 2 of the fair value hierarchy.
|
|
|
Short-Term Securities – Short-term equity investments, including money market funds, are valued in the manner specified above for equity securities.
Short-term debt investments with an original term to maturity of 60 days or less are valued at amortized cost, which approximates fair market value. If the original term to maturity of a short-term debt investment exceeds 60
days, then the values as of the 61st day prior to maturity are amortized. Amortized cost is not used if its use would be inappropriate due to credit or other impairments of the issuer, in which case the security’s fair value
would be determined as described below. Short-term securities are generally classified in Level 1 or Level 2 of the fair value hierarchy depending on the inputs used and market activity levels for specific securities.
|
|
HENNESSY FUNDS
|
1-800-966-4354
|
21
If market quotations are not readily available or if a significant event has occurred that indicates the closing price of a security no longer represents the true value of that security,
any security or other asset will be valued at its fair value in accordance with Rule 2a-5 under the 1940 Act. The Board of Trustees of the Fund (the “Board”) has designated Hennessy Advisors, Inc. (the “Advisor”) as the Fund’s
valuation designee to make all fair value determinations with respect to the Fund’s portfolio investments under the Fund’s fair value pricing procedures, subject to the Board’s oversight. There are numerous criteria considered in
determining a fair value of a security, such as the trading volume of a security and markets, the values of other similar securities, and news events with direct bearing on a security or markets. Fair value pricing results in an
estimated price for a security that reflects the amount the Fund might reasonably expect to receive in a current sale. Depending on the relative significance of the valuation inputs, these securities may be classified in either Level
2 or Level 3 of the fair value hierarchy. The Advisor will regularly evaluate whether the Fund’s fair value pricing procedures continue to be appropriate in light of the specific circumstances of the Fund and the quality of prices
obtained through their application of such procedures.
The fair value of foreign securities may be determined with the assistance of a pricing service using correlations between the movement of prices of such securities and indices of domestic
securities and other appropriate indicators, such as closing market prices of relevant American Depositary Receipts or futures contracts. Using fair value pricing means that the Fund’s NAV reflects the affected portfolio securities’
values as determined by the Advisor, the Board’s valuation designee, pursuant to the Fund’s fair value pricing procedures, instead of being determined by the market. Using a fair value pricing methodology to price a foreign security
may result in a value that is different from such foreign security’s most recent closing price and from the value used by other investment companies to calculate their NAVs. Such securities are generally classified in Level 2 of the
fair value hierarchy. Because the Fund invests in foreign securities, the value of the Fund’s portfolio securities may change on days when a shareholder is unable to purchase or redeem Fund shares.
The Fund has performed an analysis of all existing investments to determine the significance and character of all inputs to their fair value determinations. Various inputs are used to
determine the value of the Fund’s investments. The inputs or methodology used for valuing securities are not necessarily an indication of the risk associated with investing in those securities. Details related to the fair value
hierarchy of the Fund’s securities as of October 31, 2023, are included in the Schedule of Investments.
4). INVESTMENT TRANSACTIONS
Purchases and sales of investment securities (excluding government and short-term investments) for the Fund during fiscal year 2023 were $157,409,935 and $227,584,781, respectively.
There were no purchases or sales/maturities of long-term U.S. government securities for the Fund during fiscal year 2023.
5). INVESTMENT ADVISORY FEE AND OTHER TRANSACTIONS WITH AFFILIATES
The Advisor provides the Fund with investment advisory services under an Investment Advisory Agreement. The Advisor oversees the provision of investment advice and furnishes office space, facilities, and
most of the personnel needed by the Fund. As compensation for its services, the Advisor is entitled to a monthly fee from the Fund. The fee is based on the average daily net assets of the Fund at an annual rate of 0.80%. The net
investment advisory fees expensed by the Fund during fiscal year 2023 are included in the Statement of Operations.
|
WWW.HENNESSYFUNDS.COM
|
22
|
NOTES TO THE FINANCIAL STATEMENTS
|
The Advisor has delegated the day-to-day management of the Fund to a sub-advisor, SPARX Asset Management Co., Ltd. The Advisor pays the sub-advisory fees from its own assets, and these
fees are not an additional expense of the Fund. During fiscal year 2023, the Advisor (not the Fund) paid a sub-advisory fee at the average rate of 0.35% of the daily net assets of the Fund. Pursuant to the sub-advisory agreement, the
Advisor pays sub-advisory fees at the rate of 0.35% of the first $500 million of daily net assets, 0.40% of daily net assets between $500 million and $1 billion, and 0.42% of daily net assets over $1 billion.
The Board has approved a Shareholder Servicing Agreement for Investor Class shares of the Fund, which compensates the Advisor for the non-investment advisory services it provides to the
Fund. The Shareholder Servicing Agreement provides for a monthly fee paid to the Advisor at an annual rate of 0.10% of the average daily net assets of the Fund attributable to Investor Class shares. The shareholder service fees
expensed by the Fund during fiscal year 2023 are included in the Statement of Operations.
The Fund has adopted a plan pursuant to Rule 12b-1 under the Investment Company Act of 1940, as amended, that authorizes payments in connection with the distribution of Fund shares at an
annual rate of up to 0.25% of the Fund’s average daily net assets attributable to Investor Class shares. Even though the authorized rate is up to 0.25%, the Fund is currently only using up to 0.15% of its average daily net assets
attributable to Investor Class shares for such purpose. Amounts paid under the plan may be spent on any activities or expenses primarily intended to result in the sale of shares, including, but not limited to, advertising, shareholder
account servicing, printing and mailing of prospectuses to other than current shareholders, printing and mailing of sales literature, and compensation for sales and marketing activities or to financial institutions and others, such as
dealers and distributors. The distribution fees expensed by the Fund during fiscal year 2023 are included in the Statement of Operations.
The Fund has entered into agreements with various brokers, dealers, and financial intermediaries in connection with the sale of Fund shares. The agreements provide for periodic payments of
sub-transfer agent expenses by the Fund to the brokers, dealers, and financial intermediaries for providing certain shareholder maintenance services. These shareholder services include the pre-processing and quality control of new
accounts, shareholder correspondence, answering customer inquiries regarding account status, and facilitating shareholder telephone transactions. The sub-transfer agent fees expensed by the Fund during fiscal year 2023 are included in
the Statement of Operations.
U.S. Bancorp Fund Services, LLC, d/b/a U.S. Bank Global Fund Services (“Fund Services”) provides the Fund with administrative, accounting, and transfer agent services. As administrator,
Fund Services is responsible for activities such as (i) preparing various federal and state regulatory filings, reports, and returns for the Fund, (ii) preparing reports and materials to be supplied to the Board, (iii) monitoring the
activities of the Fund’s custodian, transfer agent, and accountants, and (iv) coordinating the preparation and payment of the Fund’s expenses and reviewing the Fund’s expense accruals. U.S. Bank N.A., an affiliate of Fund Services,
serves as the Fund’s custodian. The servicing agreements between the Trust, Fund Services, and U.S. Bank N.A. contain a fee schedule that is inclusive of administrative, accounting, custody, and transfer agent fees. The
administrative, accounting, custody, and transfer agent fees expensed by the Fund during fiscal year 2023 are included in the Statement of Operations.
Quasar Distributors, LLC, a wholly owned broker-dealer subsidiary of Foreside Financial Group, LLC, acts as the Fund’s principal underwriter in a continuous public offering of Fund shares.
|
HENNESSY FUNDS
|
1-800-966-4354
|
23
The officers of the Fund are affiliated with the Advisor. With the exception of the Chief Compliance Officer, such officers receive no compensation from the Fund for serving in their
respective roles. The Fund, along with the other funds in the Hennessy Funds family (collectively, the “Hennessy Funds”), makes reimbursement payments on an equal basis to the Advisor for a portion of the salary and benefits
associated with the office of the Chief Compliance Officer. The compliance fees expensed by the Fund during fiscal year 2023 for reimbursement payments to the Advisor are included in the Statement of Operations.
6). GUARANTEES AND INDEMNIFICATIONS
Under the Hennessy Funds’ organizational documents, their officers and trustees are indemnified by the Hennessy Funds against certain liabilities arising out of the performance of their duties to the
Hennessy Funds. Additionally, in the normal course of business, the Hennessy Funds enter into contracts with service providers that contain general indemnification clauses. The Fund’s maximum exposure under these arrangements is
unknown as this would involve future claims that may be made against the Fund that have not yet occurred. Currently, the Fund expects the risk of loss to be remote.
7). LINE OF CREDIT
The Fund has an uncommitted line of credit with the other Hennessy Funds in the amount of the lesser of (i) $100,000,000 or (ii) 33.33% of each Hennessy Fund’s net assets, or 30% for the Fund, the Hennessy
Gas Utility Fund, and the Hennessy Japan Small Cap Fund and 10% for the Hennessy Balanced Fund. The line of credit is intended to provide any necessary short-term financing in connection with shareholder redemptions, subject to
certain restrictions. The credit facility is with the Hennessy Funds’ custodian bank, U.S. Bank N.A. Borrowings under this arrangement bear interest at the bank’s prime rate and are secured by all of the Fund’s assets (as to its own
borrowings only). During fiscal year 2023, the Fund had an outstanding average daily balance and a weighted average interest rate of $564,244 and 7.81%, respectively. The interest expensed by the Fund during fiscal year 2023 is
included in the Statement of Operations. The maximum amount outstanding for the Fund during fiscal year 2023 was $27,613,000. As of October 31, 2023, the Fund had $3,640,000 outstanding under the line of credit.
8). FEDERAL TAX INFORMATION
As of October 31, 2023, the components of accumulated earnings (losses) for income tax purposes were as follows:
|
Investments
|
|||||
|
Cost of investments for tax purposes
|
$
|
226,792,994
|
|||
|
Gross tax unrealized appreciation
|
$
|
60,153,235
|
|||
|
Gross tax unrealized depreciation
|
(11,916,315
|
)
|
|||
|
Net tax unrealized appreciation/(depreciation)
|
$
|
48,236,920
|
|||
|
Undistributed ordinary income
|
$
|
—
|
|||
|
Undistributed long-term capital gains
|
17,310,593
|
||||
|
Total distributable earnings
|
$
|
17,310,593
|
|||
|
Other accumulated gain/(loss)
|
$
|
—
|
|||
|
Total accumulated gain/(loss)
|
$
|
65,547,513
|
|||
The difference between book-basis unrealized appreciation/depreciation and tax-basis unrealized appreciation/depreciation (as shown above) is attributable primarily to wash sales and
investments in passive foreign investment companies.
|
WWW.HENNESSYFUNDS.COM
|
24
|
NOTES TO THE FINANCIAL STATEMENTS
|
As of October 31, 2023, the Fund had no tax-basis capital losses to offset future capital gains. During fiscal year 2023, the capital losses utilized by the Fund were $22,702,721.
Capital losses sustained in or after fiscal year 2012 can be carried forward indefinitely, but any such loss retains the character of the original loss and must be utilized prior to any
loss incurred before fiscal year 2012. As a result of this ordering rule, capital loss carryforwards incurred prior to fiscal year 2012 may be more likely to expire unused. Capital losses sustained prior to fiscal year 2012 can be
carried forward for eight years and can be carried forward as short-term capital losses regardless of the character of the original loss.
As of October 31, 2023, the Fund did not defer, on a tax basis, any late-year ordinary losses. Late-year ordinary losses are net ordinary losses incurred after December 31, 2022, but
within the taxable year, that are deemed to arise on the first day of the Fund’s next taxable year.
During fiscal years 2023 and 2022, the tax character of distributions paid by the Fund was as follows:
|
Year Ended
|
Year Ended
|
||||||||
|
October 31, 2023
|
October 31, 2022
|
||||||||
|
Ordinary income(1)
|
$
|
—
|
$
|
11,762,697
|
|||||
|
Long-term capital gains
|
—
|
—
|
|||||||
|
Total distributions
|
$
|
—
|
$
|
11,762,697
|
|||||
|
(1) Ordinary income includes short-term capital gains.
|
|||||||||
9). GLOBAL EVENTS
A rise in protectionist trade policies, the possibility of a national or global recession, risks associated with pandemic and epidemic diseases, trade tensions, the possibility of changes to some
international trade agreements, political events, and continuing political tension and armed conflicts may adversely impact financial markets and the broader economy. For example, ongoing armed conflicts between Ukraine and Russia in
Europe and among Israel, Hamas, and other militant groups in the Middle East have caused and could continue to cause significant market disruptions and volatility with the markets in Europe and the Middle East, and have had negative
impacts on markets in the United States. These events could also have negative effects on the Fund’s investments that cannot be foreseen at the present time. As global systems, economies and financial markets are increasingly
interconnected, events that once had only local impact are now more likely to have regional or even global effects. Events that occur in one country, region or financial market will, more frequently, adversely impact issuers in other
countries, regions, or markets. These impacts can be exacerbated by failures of governments and societies to adequately respond to an emerging event or threat. Your investment would be negatively impacted if the value of your
portfolio holdings decreases as a result of such events, if these events adversely impact the operations and effectiveness of the Advisor or other key service providers or if these events disrupt systems and processes necessary or
beneficial to the management of accounts. These events may negatively impact broad segments of businesses and populations and could have a significant and rapid negative impact on the performance of the Fund’s investments, increase
the Fund’s volatility, or exacerbate pre-existing risks to the Fund.
|
HENNESSY FUNDS
|
1-800-966-4354
|
25
10). EVENTS SUBSEQUENT TO YEAR END
Management has evaluated the Fund’s related events and transactions that occurred subsequent to October 31, 2023, through the date of issuance of the Fund’s financial statements. Other than as disclosed
below, management has determined that there were no subsequent events requiring recognition or disclosure in the financial statements.
On December 7, 2023, capital gains were declared and paid to shareholders of record on December 6, 2023, as follows:
|
Long-term
|
|||
|
Investor Class
|
2.17988
|
||
|
Institutional Class
|
2.26393
|
|
WWW.HENNESSYFUNDS.COM
|
26
|
NOTES/REPORT OF INDEPENDENT REGISTERED PUBLIC ACCOUNTING FIRM
|
Report of Independent Registered Public
Accounting Firm
To the Board of Trustees of Hennessy Funds Trust
and the shareholders of the Hennessy Japan Fund
Novato, CA
Opinion on the Financial Statements
We have audited the accompanying statement of assets and liabilities of the Hennessy Japan Fund (the “Fund”), a series of Hennessy Funds Trust, including the schedule of investments, as of October 31, 2023,
the related statement of operations for the year then ended, the statements of changes in net assets for each of the two years in the period then ended, the financial highlights for each of the five years in the period then ended, and
the related notes (collectively referred to as the “financial statements”). In our opinion, the financial statements present fairly, in all material respects, the financial position of the Fund as of October 31, 2023, the results of
its operations for the year then ended, the changes in its net assets for each of the two years in the period then ended, and the financial highlights for each of the five years in the period then ended in conformity with accounting
principles generally accepted in the United States of America.
Basis for Opinion
These financial statements are the responsibility of the Fund’s management. Our responsibility is to express an opinion on the Fund’s financial statements based on our audits. We are a public accounting firm
registered with the Public Company Accounting Oversight Board (United States) (“PCAOB”) and are required to be independent with respect to the Fund in accordance with the U.S. federal securities laws and the applicable rules and
regulations of the Securities and Exchange Commission and the PCAOB. We have served as the auditor of one or more of the funds in the Trust since 2002.
We conducted our audits in accordance with the standards of the PCAOB. Those standards require that we plan and perform the audit to obtain reasonable assurance about whether the financial statements are
free of material misstatement, whether due to error or fraud. The Fund is not required to have, nor were we engaged to perform, an audit of its internal control over financial reporting. As part of our audits we are required to obtain
an understanding of internal control over financial reporting, but not for the purpose of expressing an opinion on the effectiveness of the Fund’s internal control over financial reporting. Accordingly, we express no such opinion.
Our audits included performing procedures to assess the risks of material misstatement of the financial statements, whether due to error or fraud, and performing procedures that respond to those risks. Such
procedures included examining, on a test basis, evidence regarding the amounts and disclosures in the financial statements. Our audits also included evaluating the accounting principles used and significant estimates made by
management, as well as evaluating the overall presentation of the financial statements. Our procedures included confirmation of securities owned as of October 31, 2023 by correspondence with the custodian. We believe that our audits
provide a reasonable basis for our opinion.
|
|
|
TAIT, WELLER & BAKER LLP
|
Philadelphia, Pennsylvania
December 22, 2023
|
HENNESSY FUNDS
|
1-800-966-4354
|
27
Trustees and Officers of the Fund (Unaudited)
The business and affairs of the Funds are managed under the direction of the Board of Trustees of the Trust, and the Board of Trustees elects the officers of the Trust (“Officers”). From time to time, the
Board of Trustees also has appointed advisers to the Board of Trustees (“Advisers”) with the intention of having qualified individuals serve in an advisory capacity to garner experience in the mutual fund and asset management industry
and be considered as potential Trustees in the future. There are currently two Advisers, Brian Alexander and A.J. Hennessy. As Advisers, Mr. Alexander and Mr. A.J. Hennessy attend meetings of the Board of Trustees and act as
non-voting participants. Information pertaining to the Trustees, Advisers, and the Officers of the Trust is set forth below. The Trustees and Officers serve until their successors are duly elected and qualified or until their earlier
death, resignation, or removal. Each Trustee oversees all 17 Hennessy Funds. Unless otherwise indicated, the address of all persons listed below is 7250 Redwood Boulevard, Suite 200, Novato, CA 94945. The Fund’s Statement of
Additional Information includes more information about the persons listed below and is available without charge by calling 800-966-4354 or by visiting www.hennessyfunds.com.
|
Other
|
|||
|
Directorships
|
|||
|
Held Outside
|
|||
|
Name, Age,
|
of Fund
|
||
|
and Position Held
|
Start Date
|
Principal Occupation(s)
|
Complex During
|
|
with the Trust
|
of Service
|
During Past Five Years
|
Past Five Years
|
|
Disinterested Trustees(1) and Disinterested Advisers
|
|||
|
J. Dennis DeSousa
|
January 1996
|
Mr. DeSousa is a real estate investor.
|
None.
|
|
87
|
|||
|
Trustee
|
|||
|
Robert T. Doyle
|
January 1996
|
Mr. Doyle is retired. He served as the
|
None.
|
|
76
|
Sheriff of Marin County, California
|
||
|
Trustee
|
from 1996 to June 2022.
|
||
|
Doug Franklin
|
March 2016
|
Mr. Franklin is a retired insurance
|
None.
|
|
59
|
as an Adviser
|
industry executive. From 1987
|
|
|
Trustee
|
to the Board
|
through 2015, he was employed by
|
|
|
and June 2023
|
the Allianz-Fireman’s Fund Insurance
|
||
|
as a Trustee
|
Company in various positions,
|
||
|
including as its Chief Actuary and
|
|||
|
Chief Risk Officer.
|
|||
|
Claire Garvie
|
December 2015
|
Ms. Garvie is a founder of Kiosk and
|
None.
|
|
49
|
as an Adviser
|
has served as its Chief Operating
|
|
|
Trustee
|
to the Board and
|
Officer since 2004. Kiosk is a
|
|
|
December 2021
|
full-service marketing agency with
|
||
|
as a Trustee
|
offices in the San Francisco Bay Area
|
||
|
and Liverpool, UK and staff across
|
|||
|
nine states in the U.S.
|
|||
|
WWW.HENNESSYFUNDS.COM
|
28
|
TRUSTEES AND OFFICERS OF THE FUND
|
|
Other
|
|||
|
Directorships
|
|||
|
Held Outside
|
|||
|
Name, Age,
|
of Fund
|
||
|
and Position Held
|
Start Date
|
Principal Occupation(s)
|
Complex During
|
|
with the Trust
|
of Service
|
During Past Five Years
|
Past Five Years
|
|
Gerald P. Richardson
|
May 2004
|
Mr. Richardson is an independent
|
None.
|
|
78
|
consultant in the securities industry.
|
||
|
Trustee
|
|||
|
Brian Alexander
|
March 2015
|
Mr. Alexander has served as the
|
None.
|
|
42
|
Chief Operating Officer of Solis
|
||
|
Adviser to the Board
|
Mammography since March 2023.
|
||
|
Prior to that, he worked for the
|
|||
|
Sutter Health organization from
|
|||
|
2011 to 2023 in various positions.
|
|||
|
He served as the Chief Executive
|
|||
|
Officer of the North Valley Hospital
|
|||
|
Area from 2021 to March 2023.
|
|||
|
From 2018 to 2021, he served as the
|
|||
|
Chief Executive Officer of Sutter
|
|||
|
Roseville Medical Center. From 2016
|
|||
|
through 2018, he served as the Vice
|
|||
|
President of Strategy for the Sutter
|
|||
|
Health Valley Area, which includes
|
|||
|
11 hospitals, 13 ambulatory surgery
|
|||
|
centers, 16,000 employees, and
|
|||
|
1,900 physicians.
|
|||
|
Interested Trustee and Interested Adviser(2)
|
|||
|
Neil J. Hennessy
|
January 1996 as
|
Mr. Neil Hennessy has been employed
|
Hennessy
|
|
67
|
a Trustee and
|
by Hennessy Advisors, Inc. since
|
Advisors, Inc.
|
|
Chairman of the Board,
|
June 2008 as
|
1989 and currently serves as its
|
|
|
Chief Market Strategist,
|
an Officer
|
Chairman and Chief Executive Officer.
|
|
|
Portfolio Manager,
|
|||
|
and President
|
|||
|
A.J. Hennessy
|
December 2022
|
Mr. A.J. Hennessy has been employed
|
None.
|
|
37
|
by Hennessy Advisors, Inc. since 2011.
|
||
|
Adviser to the Board
|
|||
|
and Vice President,
|
|||
|
Corporate Development
|
|||
|
and Operations
|
|||
|
HENNESSY FUNDS
|
1-800-966-4354
|
29
|
Name, Age,
|
||
|
and Position Held
|
Start Date
|
Principal Occupation(s)
|
|
with the Trust
|
of Service
|
During Past Five Years
|
|
Officers
|
||
|
Teresa M. Nilsen
|
January 1996
|
Ms. Nilsen has been employed by Hennessy Advisors, Inc.
|
|
57
|
since 1989 and currently serves as its President, Chief
|
|
|
Executive Vice President
|
Operating Officer, and Secretary.
|
|
|
and Treasurer
|
||
|
Daniel B. Steadman
|
March 2000
|
Mr. Steadman has been employed by Hennessy Advisors, Inc.
|
|
67
|
since 2000 and currently serves as its Executive Vice President.
|
|
|
Executive Vice President
|
||
|
and Secretary
|
||
|
Brian Carlson
|
December 2013
|
Mr. Carlson has been employed by Hennessy Advisors, Inc.
|
|
51
|
since December 2013 and currently serves as its Chief
|
|
|
Senior Vice President
|
Compliance Officer and Senior Vice President.
|
|
|
and Head of Distribution
|
||
|
David Ellison(3)
|
October 2012
|
Mr. Ellison has been employed by Hennessy Advisors, Inc.
|
|
65
|
since October 2012. He has served as a Portfolio Manager of
|
|
|
Senior Vice President
|
the Hennessy Large Cap Financial Fund and the Hennessy
|
|
|
and Portfolio Manager
|
Small Cap Financial Fund since their inception. Mr. Ellison also
|
|
|
served as a Portfolio Manager of the Hennessy Technology
|
||
|
Fund from its inception until February 2017. Mr. Ellison served
|
||
|
as Director, CIO, and President of FBR Fund Advisers, Inc.
|
||
|
from December 1999 to October 2012.
|
||
|
Jennifer Emerson(4)
|
June 2013
|
Ms. Emerson has been employed by Hennessy Advisors, Inc.
|
|
46
|
as its General Counsel since June 2013.
|
|
|
Senior Vice President and
|
||
|
Chief Compliance Officer
|
||
|
Ryan Kelley(5)
|
March 2013
|
Mr. Kelley has been employed by Hennessy Advisors, Inc. since
|
|
51
|
October 2012. He has served as Chief Investment Officer of the
|
|
|
Senior Vice President,
|
Hennessy Funds since March 2021 and has served as a Portfolio
|
|
|
Chief Investment Officer,
|
Manager of the Hennessy Gas Utility Fund, the Hennessy Large
|
|
|
and Portfolio Manager
|
Cap Financial Fund, and the Hennessy Small Cap Financial Fund
|
|
|
since October 2014. Mr. Kelley served as Co-Portfolio Manager
|
||
|
of these same funds from March 2013 through September
|
||
|
2014 and as a Portfolio Analyst for the Hennessy Funds from
|
||
|
October 2012 through February 2013. He has also served as a
|
||
|
Portfolio Manager of the Hennessy Cornerstone Growth Fund,
|
||
|
the Hennessy Cornerstone Mid Cap 30 Fund, the Hennessy
|
||
|
Cornerstone Large Growth Fund, and the Hennessy
|
||
|
Cornerstone Value Fund since February 2017 and as a Portfolio
|
||
|
Manager of the Hennessy Total Return Fund, the Hennessy
|
||
|
Balanced Fund, and the Hennessy Technology Fund since May
|
||
|
2018. He previously served as Co-Portfolio Manager of the
|
||
|
Hennessy Technology Fund from February 2017 until May 2018.
|
||
|
Mr. Kelley served as Portfolio Manager of FBR Fund
|
||
|
Advisers, Inc. from January 2008 to October 2012.
|
|
WWW.HENNESSYFUNDS.COM
|
30
|
TRUSTEES AND OFFICERS OF THE FUND
|
|
Name, Age,
|
||
|
and Position Held
|
Start Date
|
Principal Occupation(s)
|
|
with the Trust
|
of Service
|
During Past Five Years
|
|
L. Joshua Wein(5)
|
September 2018
|
Mr. Wein has been employed by Hennessy Advisors, Inc. since
|
|
50
|
2018. He has served as Portfolio Manager of the Hennessy
|
|
|
Vice President and
|
Cornerstone Growth Fund, the Hennessy Cornerstone Mid Cap
|
|
|
Portfolio Manager
|
30 Fund, the Hennessy Cornerstone Large Growth Fund, the
|
|
|
Hennessy Cornerstone Value Fund, Hennessy Total Return Fund,
|
||
|
the Hennessy Balanced Fund, the Hennessy Gas Utility Fund,
|
||
|
and the Hennessy Technology Fund since February 2021, and
|
||
|
as the Co-Portfolio Manager of these Funds since February
|
||
|
2019. He served as a Senior Analyst of those same Funds from
|
||
|
September 2018 through February 2019. He also has served as
|
||
|
a Portfolio Manager of the Hennessy Energy Transition Fund
|
||
|
and the Hennessy Midstream Fund since January 2022.
|
||
|
Mr. Wein served as Director of Alternative Investments and
|
||
|
Co-Portfolio Manager at Sterling Capital Management
|
||
|
from 2008 to 2018.
|
_______________
|
(1)
|
The Funds have determined that Mr. DeSousa, Mr. Doyle, Mr. Franklin, Ms. Garvie, and Mr. Richardson are not interested persons, as defined in the 1940 Act, of the Investment
Manager or of any predecessor investment adviser for purposes of Section 15(f) of the 1940 Act.
|
|
(2)
|
Each of Neil J. Hennessy and A.J. Hennessy is considered an interested person, as defined in the 1940 Act, because he is an officer of the Trust.
|
|
(3)
|
The address of this officer is 101 Federal Street, Suite 1615B, Boston, MA 02110.
|
|
(4)
|
The address of this officer is 4800 Bee Caves Road, Suite 100, Austin, TX 78746.
|
|
(5)
|
The address of this officer is 1340 Environ Way, Chapel Hill, NC 27517.
|
|
HENNESSY FUNDS
|
1-800-966-4354
|
31
Expense Example (Unaudited)
October 31, 2023
As a shareholder of the Fund, you incur ongoing costs, including management fees, service fees, and other Fund expenses. This Example is intended to help you understand your ongoing costs (in dollars) of
investing in the Fund and to compare these costs with the ongoing costs of investing in other investment funds. The Example is based on an investment of $1,000 invested at the beginning of the period and held for the entire period
from May 1, 2023, through October 31, 2023.
Actual Expenses
In the table below, the first line under each of the “Investor Class” and “Institutional Class” headings provides information about actual account values and actual expenses for each share class. You may use
this information, together with the amount you invested, to estimate the expenses that you paid over the period. Simply divide your account value by $1,000 (for example, an $8,600 account value divided by $1,000 = 8.6), then multiply
the result by the number in the first line under the heading “Expenses Paid During Period” to estimate the expenses you paid on your account during this period. Although the Fund charges no sales loads or transaction fees, you will be
assessed fees for outgoing wire transfers, returned checks, and stop payment orders at prevailing rates charged by U.S. Bank Global Fund Services, the Fund’s transfer agent. If you request that a redemption be made by wire transfer,
the Fund’s transfer agent charges a $15 fee. IRAs are charged a $15 annual maintenance fee (up to $30 maximum per shareholder for shareholders with multiple IRAs). The examples below include, but are not limited to, management,
shareholder servicing, accounting, custody, and transfer agent fees. However, the examples below do not include portfolio trading commissions and related expenses.
Hypothetical Example for Comparison Purposes
In the table below, the second line under each of the “Investor Class” and “Institutional Class” headings provides information about hypothetical account values and hypothetical expenses based on the Fund’s
actual expense ratio for each share class and an assumed rate of return of 5% per year before expenses, which is not the Fund’s actual return for such share class. The hypothetical account values and expenses may not be used to
estimate the actual ending account balance or expenses you paid for the period. You may use this information to compare the ongoing costs of investing in the Fund and other funds. To do so, compare these 5% hypothetical examples with
the 5% hypothetical examples that appear in the shareholder reports of the other funds. Please note that the expenses shown in the table are meant to highlight your ongoing costs only. Therefore, the second lines under “Investor
Class” and “Institutional Class” are useful in comparing ongoing costs only and will not help you determine the relative total costs of owning different funds.
|
WWW.HENNESSYFUNDS.COM
|
32
|
EXPENSE EXAMPLE
|
|
Expenses Paid
|
|||
|
Beginning
|
Ending
|
During Period(1)
|
|
|
Account Value
|
Account Value
|
May 1, 2023 –
|
|
|
May 1, 2023
|
October 31, 2023
|
October 31, 2023
|
|
|
Investor Class
|
|||
|
Actual
|
$1,000.00
|
$1,015.70
|
$7.16
|
|
Hypothetical (5% return before expenses)
|
$1,000.00
|
$1,018.10
|
$7.17
|
|
Institutional Class
|
|||
|
Actual
|
$1,000.00
|
$1,017.70
|
$4.98
|
|
Hypothetical (5% return before expenses)
|
$1,000.00
|
$1,020.27
|
$4.99
|
|
(1)
|
Expenses are equal to the Fund’s annualized expense ratio of 1.41% for Investor Class shares or 0.98% for Institutional Class shares, as applicable, multiplied by the average account value over the
period, multiplied by 184/365 days (to reflect the half-year period).
|
|
HENNESSY FUNDS
|
1-800-966-4354
|
33
How to Obtain a Copy of the Fund’s Proxy
Voting Policy and Proxy Voting Records
A description of the policies and procedures the Fund uses to determine how to vote proxies relating to portfolio securities is available without charge (1) by calling 800-966-4354, (2) on the Hennessy
Funds’ website at www.hennessyfunds.com/proxy-voting/voting-policy, or (3) on the U.S. Securities and Exchange Commission’s (the “SEC”) website at www.sec.gov. The Fund’s proxy voting record is available without charge on both the
Hennessy Funds’ website at www.hennessyfunds.com/proxy-voting/voting-record and the SEC’s website at www.sec.gov no later than August 31 for the prior 12 months ending June 30.
Availability of Quarterly Portfolio Schedule
The Fund files a complete schedule of portfolio holdings with the SEC for the first and third quarters of each fiscal year as an exhibit to its reports on Form N-PORT. The Fund’s Form N-PORT reports are
available on the SEC’s website at www.sec.gov or on request by calling 800-966-4354.
Important Notice Regarding Delivery of
Shareholder Documents
To help keep the Fund’s costs as low as possible, we generally deliver a single copy of shareholder reports, proxy statements, and prospectuses to shareholders who share an address and have the same last
name. This process does not apply to account statements. You may request an individual copy of a shareholder document at any time. If you would like to receive separate mailings of shareholder documents, please call U.S. Bank Global
Fund Services at 800-261-6950 or 414-765-4124, and individual delivery will begin within 30 days of your request. If your account is held through a financial institution or other intermediary, please contact such intermediary directly
to request individual delivery.
Electronic Delivery
As currently permitted by SEC regulations, the Fund’s shareholder reports are made available on a website, and unless you sign for eDelivery or elect to receive paper copies as detailed below, you will be
notified by mail each time a report is posted and provided with a website link to access the report.
To elect to receive paper copies of all future reports free of charge, please call U.S. Bank Global Fund Services at 800-261-6950 or 414-765-4124.
The Fund also offers shareholders the option to receive all notices, account statements, prospectuses, tax forms, and shareholder reports electronically. To sign up for eDelivery or change
your delivery preference, please visit www.hennessyfunds.com/account.
Shareholder reports transmitted after July 24, 2024, will comply with the new tailored shareholder reporting requirements, which require streamlined annual and semi-annual reports to
shareholders that highlight key information. These reports will be transmitted in paper unless a shareholder elects to receive reports electronically via eDelivery. To sign up for eDelivery, please visit
http://www.hennessyfunds.com/account.
Subscribe to receive our team’s unique market and sector insights delivered to your inbox
www.hennessyfunds.com/subscribe
Follow us on social media
| |
|
|
|
|
WWW.HENNESSYFUNDS.COM
|
34
|
PROXY VOTING — PRIVACY POLICY
|
Liquidity Risk Management Program
In accordance with Rule 22e-4 under the Investment Company Act of 1940, as amended (the “Liquidity Rule”), we have adopted and implemented a liquidity risk management program (the “Liquidity Program”). The
purpose of the Liquidity Program is to assess and manage the Fund’s liquidity risk, which is the risk that the Fund would not be able to meet requests to redeem Fund shares without significant dilution of the remaining shareholders’
interests in the Fund. The Board of Trustees of the Fund (the “Board”) designated a committee comprising representatives of Hennessy Advisors, Inc., the investment adviser to the Fund, as the administrator of the Liquidity Program
(the “Program Administrator”).
The Program Administrator provided a written report regarding the Liquidity Program to the Board in advance of its meeting on June 7, 2023. The report covered the period from June 1, 2022,
through May 31, 2023. The report addressed the operation of the Liquidity Program, assessed the adequacy and effectiveness of its implementation, and described any material changes to the Liquidity Program during the review period.
The Trust’s chief compliance officer presented the report to the Board at the meeting and provided additional information regarding the Liquidity Program. The Board reviewed the Liquidity Program and considered, among other items, the
following:
|
1.
|
The Program Administrator reviewed daily historical net redemption activity during the review period and during prior periods with higher-than-average redemption activity and concluded that the Fund
has historically been able to meet requests to redeem Fund shares without significant dilution to the Fund’s remaining shareholders, and the Program Administrator expects the Fund to be able to continue to do so in the future
during both normal and reasonably foreseeable stressed conditions.
|
|
|
2.
|
The Fund primarily holds assets that are highly liquid investments and is not required to establish a highly liquid investment minimum for the Fund or adopt policies and procedures for responding to
a highly liquid investment minimum shortfall.
|
|
|
3.
|
The Program Administrator did not make or recommend any material changes to the Liquidity Program during the review period.
|
|
|
4.
|
The Program Administrator concluded that the Liquidity Program was reasonably designed to assess and manage the Fund’s liquidity risk, complies with the requirements of the Liquidity Rule, and was
operating as intended during the review period.
|
Privacy Policy
We collect the following personal information about you:
|
1.
|
Information we receive from you in applications or other forms, correspondence, or conversations, including, but not limited to, your name, address, phone number, social security number, assets,
income, and date of birth;
|
|
|
2.
|
Information about your transactions with us, our affiliates, or others, including, but not limited to, your account number and balance, payments history, parties to transactions, cost basis
information, and other financial information; and
|
|
|
3.
|
Other personal information we collect from various sources, even if you have not entered into a prior transaction with us, including the following:
|
|
HENNESSY FUNDS
|
1-800-966-4354
|
35
|
•
|
Name, alias, address, unique personal identifier, online identifier, IP address, email address, telephone number, account name, and other similar identifiers;
|
||
|
•
|
Age and marital status;
|
||
|
•
|
Commercial information, including records of products purchased;
|
||
|
•
|
Browsing history, search history, and information on interaction with our website;
|
||
|
•
|
Geolocation data;
|
||
|
•
|
Employment and employment history, educational history, financial information, and purchasing and consuming histories or tendencies; and
|
||
|
•
|
Inferences drawn from the above-listed information to create a profile about your preferences, characteristics, predispositions, and behavior.
|
We collect this information directly from you, indirectly in the course of providing services to you, directly and indirectly from your activity on our website, from broker dealers,
marketing agencies, and other third parties that interact with us in connection with the services we perform and products we offer, and from anonymized and aggregated consumer information.
We use this information to fulfill the reason you provided the information to us, to provide you with other relevant products that you request from us, to provide you with information
about products that may interest you, to improve our website or present our website’s contents to you, and as otherwise described to you when collecting your personal information.
We do not disclose any personal information to unaffiliated third parties, except as permitted by law. We may disclose your personal information to our affiliates, vendors, and service
providers for a business purpose. For example, we are permitted by law to disclose all of the information we collect, as described above, to our transfer agent to process your transactions. When disclosing your personal information to
third parties, we enter into a contract with each third party describing the purpose of such disclosure and requiring that such personal information be kept confidential and not used for any purpose except to perform the services
contracted or respond to regulatory or law enforcement requests.
Furthermore, we restrict access to your personal information to those persons who require such information to provide products or services to you. As a result, we do not provide a means
for opting out of our limited sharing of your information. We maintain physical, electronic, and procedural safeguards that comply with federal standards to guard your personal information.
If you hold shares of the Funds through a financial intermediary, including, but not limited to, a broker-dealer, bank, or trust company, the privacy policy of your financial intermediary
governs how your personal information is shared with unaffiliated third parties.
If you live in a state such as California where the laws provide further privacy rights, we will not share information unless the law allows, and we will comply with the other
state-specific requirements.
|
WWW.HENNESSYFUNDS.COM
|
36
|
PRIVACY POLICY
|
Supplemental Privacy Notice for Residents of California
The California Consumer Privacy Act of 2018 (the “CCPA”) provides you, as a California resident, with certain additional rights relating to your personal information.
Under the CCPA, you have the right to request that we disclose to you the categories of personal information we have collected about you over the past 12 months, the categories of sources
of such information, our business purpose for collecting the information, the categories of third parties, if any, with whom we shared the information, and the specific information we have collected about you. You also have the right
to request that we delete any of your personal information, and, unless an exception applies, we will delete such information upon receiving and confirming your request. To make a request, call us at 1-800-966-4354, email us at
privacy@hennessyfunds.com, or go to www.hennessyfunds.com/contact. We will not discriminate against you for exercising your rights under the CCPA. Further, we will not collect additional categories of your personal information or use
the personal information we collected for materially different, unrelated, or incompatible purposes without providing you notice.
|
HENNESSY FUNDS
|
1-800-966-4354
|
37
For information, questions, or assistance, please call
The Hennessy Funds
800-966-4354 or 415-899-1555
INVESTMENT ADVISOR
Hennessy Advisors, Inc.
7250 Redwood Boulevard, Suite 200
Novato, California 94945
ADMINISTRATOR,
TRANSFER AGENT,
DIVIDEND PAYING AGENT, &
SHAREHOLDER SERVICING AGENT
U.S. Bancorp Fund Services, LLC
d/b/a U.S. Bank Global Fund Services
P.O. Box 701
Milwaukee, Wisconsin 53201-0701
CUSTODIAN
U.S. Bank N.A.
Custody Operations
1555 North River Center Drive, Suite 302
Milwaukee, Wisconsin 53212
TRUSTEES
Neil J. Hennessy
Robert T. Doyle
J. Dennis DeSousa
Doug Franklin
Claire Garvie
Gerald P. Richardson
COUNSEL
Foley & Lardner LLP
777 East Wisconsin Avenue
Milwaukee, Wisconsin 53202-5306
INDEPENDENT REGISTERED
PUBLIC ACCOUNTING FIRM
Tait, Weller & Baker LLP
Two Liberty Place
50 South 16th Street, Suite 2900
Philadelphia, Pennsylvania 19102-2529
DISTRIBUTOR
Quasar Distributors, LLC
111 East Kilbourn Avenue, Suite 1250
Milwaukee, Wisconsin 53202
www.hennessyfunds.com | 800-966-4354
This report has been prepared for shareholders and may be distributed to
others only if preceded or accompanied by a current prospectus.
ANNUAL REPORT
OCTOBER 31, 2023

HENNESSY JAPAN SMALL CAP FUND
Investor Class HJPSX
Institutional Class HJSIX
www.hennessyfunds.com | 1-800-966-4354
(This Page Intentionally Left Blank.)
Contents
|
Letter to Shareholders
|
2
|
|
|
Performance Overview
|
4
|
|
|
Financial Statements
|
||
|
Schedule of Investments
|
7
|
|
|
Statement of Assets and Liabilities
|
12
|
|
|
Statement of Operations
|
13
|
|
|
Statements of Changes in Net Assets
|
15
|
|
|
Financial Highlights
|
16
|
|
|
Notes to the Financial Statements
|
20
|
|
|
Report of Independent Registered Public Accounting Firm
|
29
|
|
|
Trustees and Officers of the Fund
|
30
|
|
|
Expense Example
|
34
|
|
|
Proxy Voting Policy and Proxy Voting Records
|
36
|
|
|
Availability of Quarterly Portfolio Schedule
|
36
|
|
|
Federal Tax Distribution Information
|
36
|
|
|
Important Notice Regarding Delivery of Shareholder Documents
|
36
|
|
|
Electronic Delivery
|
37
|
|
|
Liquidity Risk Management Program
|
37
|
|
|
Privacy Policy
|
38
|
|
HENNESSY FUNDS
|
1-800-966-4354
|
December 2023
Dear Hennessy Funds Shareholder:
The Japanese stock market returned 17.58% as measured by the Tokyo Stock Price Index (TOPIX) over the 12-month period ended October 31, 2023 (in U.S. dollar terms). During this period, the TOPIX recorded a
33-year high. Increasing global geopolitical risks, the monetary policy of the Bank of Japan (BOJ) under new governor Kazuo Ueda, inflationary trends and pressure on wage increases, along with yen depreciation, were among the factors
pushing Japanese equities higher.
On the macroeconomic front, Japan is showing resilience despite a darkening outlook abroad. One of the tailwinds is continued expansionary monetary policy. Contrary to the rest of the world,
the new BOJ governor Ueda has repeatedly reaffirmed that the current ultra-low interest rates will remain unchanged until there are clear signs of stable 2% inflation rate. A pro-growth, pro-inflation central bank is what Japan needs to
overcome a decades-long deflationary mindset.
Another factor boosting positive momentum included continued efforts around corporate governance and stock market reform by the Tokyo Stock Exchange (TSE). The TSE has requested listed
companies with price-to-book (PB) ratios below 1 to increase shareholder value, aiming to improve the share prices of these companies to PB ratios above 1. This initiative is part of a series of corporate governance reforms that have
been making progress since the introduction of the stewardship code and corporate governance code in 2014 and 2015 respectively, under so-called Abenomics. Prior to these initiatives, shareholders’ interests were hardly among the top
priorities of management resulting in below-cost-of-equity ROEs (around mid-single digits). Fast forward to today, Japan’s ROEs have improved meaningfully to an average of around 10% due to a greater focus on profitability and capital
efficiency. Nevertheless, approximately 1,800 stocks (out of 3,300 listed on TSE Prime and Standard section), or over 50% of the entire Japanese stock market as of the end of March, are still trading below book value. The TSE aims to
reduce the number of such companies.
|
WWW.HENNESSYFUNDS.COM
|
2
|
LETTER TO SHAREHOLDERS
|
Thank you for your continued confidence and investment in the Hennessy Funds.
Sincerely,
|
|
|
Tadahiro Fujimura
|
Masakazu Takeda
|
|
Portfolio Manager,
|
Portfolio Manager,
|
|
Hennessy Japan Small Cap Fund;
|
Hennessy Japan Fund;
|
|
Chief Investment Officer
|
Fund Manager
|
|
SPARX Asset Management Co., Ltd.
|
SPARX Asset Management Co., Ltd.
|
SPARX Asset Management Co., Ltd., located in Tokyo, Japan, is the sub-advisor to the Hennessy Japan Fund and the Hennessy Japan Small Cap Fund.
Past performance does not guarantee future results.
Mutual fund investing involves risk. Principal loss is possible.
Opinions expressed are those of Tadahiro Fujimura and Masakazu Takeda and are subject to change, are not guaranteed, and should not be considered investment advice.
The Tokyo Stock Price Index (TOPIX) is a capitalization-weighted index of all of the companies listed on the First Section of the Tokyo Stock Exchange. The index is used herein for comparative purposes in
accordance with SEC regulations. One cannot invest directly in an index.
Price-to-book ratio is a valuation measure calculated by dividing a company’s market price per share by its book value per share. Return
on equity (ROE) is the measure of a company’s net income divided by its shareholders’ equity.
|
HENNESSY FUNDS
|
1-800-966-4354
|
3
Performance Overview (Unaudited)
CHANGE IN VALUE OF $10,000 INVESTMENT
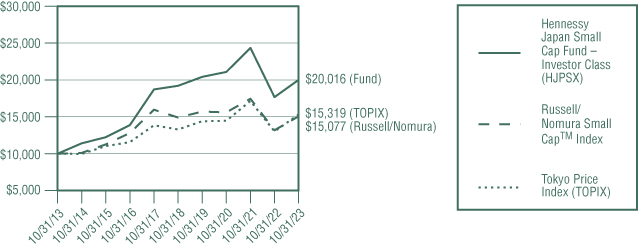
This graph illustrates the performance of an initial investment of $10,000 made in the Fund 10 years ago and assumes the reinvestment of dividends and capital gains.
AVERAGE ANNUAL TOTAL RETURN FOR PERIODS ENDED OCTOBER 31, 2023
|
One
|
Five
|
Ten
|
|
|
Year
|
Years
|
Years
|
|
|
Hennessy Japan Small Cap Fund –
|
|||
|
Investor Class (HJPSX)
|
13.22%
|
0.82%
|
7.19%
|
|
Hennessy Japan Small Cap Fund –
|
|||
|
Institutional Class (HJSIX)(1)
|
13.60%
|
1.23%
|
7.52%
|
|
Russell/Nomura Small Cap™ Index
|
14.33%
|
0.22%
|
4.19%
|
|
Tokyo Stock Price Index (TOPIX)
|
17.58%
|
2.89%
|
4.36%
|
Expense ratios: 1.58% (Investor Class); 1.18% (Institutional Class)
|
(1)
|
The inception date of Institutional Class shares is June 15, 2015. Performance shown prior to the inception of Institutional Class shares reflects the performance of Investor Class shares and includes
expenses that are not applicable to, and are higher than, those of Institutional Class shares.
|
Performance data quoted represents past performance; past performance does not guarantee future results. The investment return and principal value of an investment will fluctuate so that an
investor’s shares, when redeemed, may be worth more or less than their original cost. The performance table does not reflect the deduction of taxes that a shareholder would pay on Fund distributions or the redemption of Fund shares.
Current performance of the Fund may be lower or higher than the performance quoted. Performance data current to the most recent month end may be obtained by visiting www.hennessyfunds.com.
The Russell/Nomura Small Cap™ Index comprises the bottom 15% of the Russell/Nomura Total Market™ Index based on market capitalization. The Tokyo Stock Price Index (TOPIX) is a capitalization-weighted index of all of the companies listed on the First Section of the Tokyo Stock
Exchange. One cannot invest directly in an index. These indices are used for comparative purposes in accordance with Securities and Exchange Commission regulations.
Frank Russell Company (“Russell”) is the source and owner of the trademarks, service marks, and copyrights related to the Russell Indexes. Russell® is a trademark of Frank Russell Company. Neither Russell nor its licensors accept any liability for any errors or omissions in the Russell Indexes or Russell ratings or underlying data and no party may
|
WWW.HENNESSYFUNDS.COM
|
4
|
PERFORMANCE OVERVIEW
|
rely on any Russell Indexes or Russell ratings or underlying data contained in this communication. No further distribution of Russell data is permitted without Russell’s express written consent. Russell does
not promote, sponsor, or endorse the content of this communication.
The expense ratios presented are from the most recent prospectus. The expense ratios for the current reporting period are available in the Financial Highlights section of this report.
PERFORMANCE NARRATIVE
Portfolio Managers Tadahiro Fujimura, CFA and CMA*, and Takenari Okumura, CMA*
SPARX Asset Management Co., Ltd. (sub-advisor)
Performance:
For the one-year period ended October 31, 2023, the Investor Class of the Hennessy Japan Small Cap Fund returned 13.22%, underperforming both the Russell/Nomura Small Cap™ Index (the Fund’s primary benchmark) and the Tokyo Stock Price Index (TOPIX), which returned 14.33% and 17.58%, respectively, for the same period in U.S. dollar terms.
The Japanese stock market performed well, buoyed by the Bank of Japan’s continued monetary easing, improved U.S. economic indicators, and yen depreciation. A marked increase in Japanese
equity investment from overseas investors drove the market rally. On the other hand, there were some declines due to concerns over continued monetary tightening in the U.S. and the Chinese property crisis. The performance of Japanese
mid- and small-cap stocks this year was inferior to large caps as foreign investors appeared to primarily focus on the latter.
In terms of individual stocks, semiconductor production equipment manufacturer Towa Corporation, Italian restaurant chain operator Saizeriya Company, Ltd., and a regional bank based in the
Saitama prefecture, Musashino Bank, Ltd., positively contributed to the Fund’s performance. Towa’s share price climbed in response to a sense that its incoming orders have continued to turn the corner in the third quarter of 2023.
Saizeriya was buoyed by an increase in operating profit in its third quarter earnings. Musashino Bank benefited from expectations of the Bank of Japan’s monetary policy change, boosting prospects for future earnings.
One of the stocks that detracted most from the Fund’s performance was employee benefits outsourcing contractor Benefit One, Inc., an internet advertising agency and consultancy company
ValueCommerce Co., Ltd., and peptide-based drug discovery support service provider PeptiDream, Inc. Benefit One saw its share price drop due to the trend of selling growth stocks. There was no specific news on ValueCommerce’s share
price decline, which was possibly due to broad-based selling in internet-related names. PeptiDream also suffered amid a sell-off of stocks with high growth expectations.
The Fund continues to own all the companies mentioned.
Portfolio Strategy and Investment Commentary:
While the stock market has been performing well, domestic demand-related stocks, which we think have particularly high growth potential among small and mid-cap stocks, has been relatively weak. In this
context, we increased the portfolio weighting in the Manufacturing sector where future growth is expected due to infrastructure and environment-related investments. Furthermore, we reduced our investment weighting in some
non-manufacturing sectors, which have been experiencing weakness for a longer period than expected in spite of their promising characteristics.
|
HENNESSY FUNDS
|
1-800-966-4354
|
5
Despite a highly uncertain environment in terms of interest rate trends, the Chinese economy, and geopolitical risks, Japanese equities have performed well in terms of both relative and
absolute returns, because absolute valuations are still low and there is a high potential for continued earnings recovery for the Japanese market in our view. Given the continued strong appetite for investment in Japanese equities among
both domestic and foreign investors, we believe that Japanese equities will continue to perform well toward the calendar year end. Although rising oil prices and weak yen are risks, we believe that the market will continue to be firm,
mainly in domestic demand-related sectors, due to price transfers and accelerating wage increases. The relative undervaluation of small- and mid-cap stocks continues, and we expect a reassessment of small- and mid-cap companies to
follow future positive earnings announcements.
_______________
* Chartered Member of the Security Analysts Association of Japan
Opinions expressed are those of the Portfolio Managers as of the date written and are subject to change, are not guaranteed, and should not be considered investment advice or an indication of trading intent.
The Fund invests in small-capitalization and medium-capitalization companies, which may have more limited liquidity and greater price volatility than larger companies. The Fund invests in
the stocks of companies operating in Japan; single-country funds and those that are concentrated in one or more industry sectors may be subject to a higher degree of market risk. Funds that invest in other investment companies,
including exchange-traded funds, may experience higher fees. Please see the Fund’s prospectus for a more complete discussion of these and other risks.
References to specific securities should not be considered a recommendation to buy or sell any security. Fund holdings and sector allocations are subject to change. Please refer to the Schedule of Investments
included in this report for additional portfolio information.
|
WWW.HENNESSYFUNDS.COM
|
6
|
PERFORMANCE OVERVIEW/SCHEDULE OF INVESTMENTS
|
Financial Statements
|
Schedule of Investments as of October 31,
2023
|
HENNESSY JAPAN SMALL CAP FUND
(% of Net Assets)
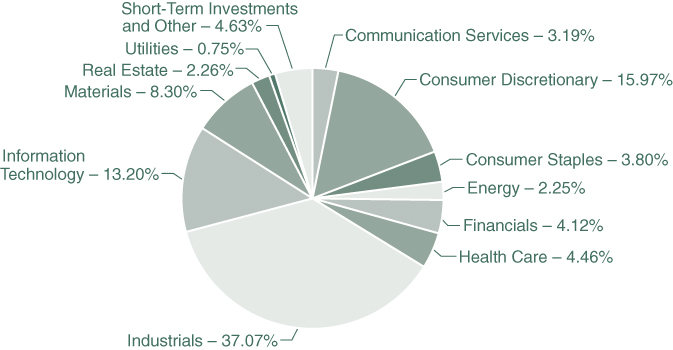
|
TOP TEN HOLDINGS (EXCLUDING MONEY MARKET FUNDS)
|
% NET ASSETS
|
|
Saizeriya Co. Ltd.
|
3.10%
|
|
Towa Corp.
|
2.87%
|
|
Musashino Bank Ltd.
|
2.29%
|
|
Iwatani Corp.
|
2.25%
|
|
Penta-Ocean Construction Co. Ltd.
|
2.17%
|
|
Takasago Thermal Engineering Co. Ltd.
|
2.17%
|
|
Nishimoto Co. Ltd.
|
2.15%
|
|
Asia Pile Holdings Corp.
|
2.07%
|
|
Tsubakimoto Chain Co.
|
2.07%
|
|
Tsukishima Holdings Co. Ltd.
|
2.06%
|
Note: For presentation purposes, the Fund has grouped some of the industry categories. For purposes of categorizing securities for compliance with Section 8(b)(1) of the Investment Company Act of 1940, as
amended, the Fund uses more specific industry classifications.
The Global Industry Classification Standard (GICS®) was developed by and is the exclusive property and a service mark of MSCI,
Inc. and Standard & Poor’s Financial Services LLC. It has been licensed for use by the Hennessy Funds.
|
HENNESSY FUNDS
|
1-800-966-4354
|
7
|
COMMON STOCKS – 95.37%
|
Number
|
% of
|
||||||||||
|
|
of Shares
|
Value
|
Net Assets
|
|||||||||
|
Communication Services – 3.19%
|
||||||||||||
|
Imagica Group, Inc.
|
259,600
|
$
|
1,019,209
|
0.99
|
%
|
|||||||
|
Kufu Co., Inc. (a)
|
201,600
|
407,460
|
0.39
|
%
|
||||||||
|
Macromill, Inc.
|
200,000
|
888,643
|
0.86
|
%
|
||||||||
|
ValueCommerce Co. Ltd.
|
118,600
|
985,901
|
0.95
|
%
|
||||||||
|
|
3,301,213
|
3.19
|
%
|
|||||||||
|
Consumer Discretionary – 15.97%
|
||||||||||||
|
Aeon Fantasy Co. Ltd.
|
90,400
|
1,617,718
|
1.56
|
%
|
||||||||
|
Benesse Holdings, Inc.
|
106,100
|
1,254,461
|
1.21
|
%
|
||||||||
|
J Front Retailing Co. Ltd.
|
196,800
|
1,876,154
|
1.81
|
%
|
||||||||
|
Matsuoka Corp.
|
127,500
|
1,350,595
|
1.30
|
%
|
||||||||
|
Musashi Seimitsu Industry Co. Ltd.
|
177,000
|
1,703,572
|
1.65
|
%
|
||||||||
|
Nojima Corp.
|
216,900
|
1,931,764
|
1.87
|
%
|
||||||||
|
Onward Holdings Co. Ltd.
|
446,200
|
1,412,832
|
1.36
|
%
|
||||||||
|
Sac’s Bar Holdings, Inc.
|
167,400
|
930,401
|
0.90
|
%
|
||||||||
|
Saizeriya Co. Ltd.
|
78,900
|
3,205,833
|
3.10
|
%
|
||||||||
|
Topre Corp.
|
115,900
|
1,248,872
|
1.21
|
%
|
||||||||
|
|
16,532,202
|
15.97
|
%
|
|||||||||
|
Consumer Staples – 3.80%
|
||||||||||||
|
Ariake Japan Co. Ltd.
|
36,600
|
1,157,480
|
1.12
|
%
|
||||||||
|
Cosmos Pharmaceutical Corp.
|
5,300
|
551,558
|
0.53
|
%
|
||||||||
|
Nishimoto Co. Ltd.
|
56,000
|
2,221,230
|
2.15
|
%
|
||||||||
|
|
3,930,268
|
3.80
|
%
|
|||||||||
|
Energy – 2.25%
|
||||||||||||
|
Iwatani Corp.
|
48,700
|
2,329,249
|
2.25
|
%
|
||||||||
|
Financials – 4.12%
|
||||||||||||
|
Musashino Bank Ltd.
|
125,600
|
2,368,236
|
2.29
|
%
|
||||||||
|
Nishi-Nippon Financial Holdings, Inc.
|
159,000
|
1,898,956
|
1.83
|
%
|
||||||||
|
|
4,267,192
|
4.12
|
%
|
|||||||||
|
Health Care – 4.46%
|
||||||||||||
|
Nihon Kohden Corp.
|
81,300
|
1,920,205
|
1.86
|
%
|
||||||||
|
PeptiDream, Inc. (a)
|
134,900
|
983,399
|
0.95
|
%
|
||||||||
|
Ship Healthcare Holdings, Inc.
|
111,100
|
1,715,285
|
1.65
|
%
|
||||||||
|
|
4,618,889
|
4.46
|
%
|
|||||||||
The accompanying notes are an integral part of these financial statements.
|
WWW.HENNESSYFUNDS.COM
|
8
|
SCHEDULE OF INVESTMENTS
|
|
COMMON STOCKS
|
Number
|
% of
|
||||||||||
|
|
of Shares
|
Value
|
Net Assets
|
|||||||||
|
Industrials – 37.07%
|
||||||||||||
|
Amada Co. Ltd.
|
218,300
|
$
|
2,117,610
|
2.05
|
%
|
|||||||
|
Benefit One, Inc.
|
148,400
|
1,064,084
|
1.03
|
%
|
||||||||
|
Creek & River Co. Ltd.
|
96,300
|
1,256,174
|
1.21
|
%
|
||||||||
|
Daihen Corp.
|
62,200
|
1,960,422
|
1.89
|
%
|
||||||||
|
Furukawa Co. Ltd.
|
84,400
|
1,184,144
|
1.14
|
%
|
||||||||
|
Glory Ltd.
|
66,700
|
1,243,576
|
1.20
|
%
|
||||||||
|
Hanwa Co. Ltd.
|
34,500
|
1,039,937
|
1.00
|
%
|
||||||||
|
Integrated Design & Engineering Holdings Co. Ltd.
|
80,100
|
1,778,019
|
1.72
|
%
|
||||||||
|
Keihan Holdings Co. Ltd.
|
78,400
|
1,917,504
|
1.85
|
%
|
||||||||
|
Kyudenko Corp.
|
51,800
|
1,547,317
|
1.49
|
%
|
||||||||
|
Mitsubishi Logisnext Co. Ltd.
|
183,000
|
1,435,710
|
1.39
|
%
|
||||||||
|
Nichiha Corp.
|
71,700
|
1,415,788
|
1.37
|
%
|
||||||||
|
Nissei ASB Machine Co. Ltd.
|
54,700
|
1,688,091
|
1.63
|
%
|
||||||||
|
Nittoku Co. Ltd.
|
80,200
|
1,175,980
|
1.14
|
%
|
||||||||
|
Penta-Ocean Construction Co. Ltd.
|
381,900
|
2,245,162
|
2.17
|
%
|
||||||||
|
Raksul, Inc. (a)
|
137,300
|
1,153,850
|
1.11
|
%
|
||||||||
|
SBS Holdings, Inc.
|
96,200
|
1,707,874
|
1.65
|
%
|
||||||||
|
Tadano Ltd.
|
278,400
|
2,093,046
|
2.02
|
%
|
||||||||
|
Takasago Thermal Engineering Co. Ltd.
|
113,700
|
2,244,963
|
2.17
|
%
|
||||||||
|
Tanseisha Co. Ltd.
|
299,900
|
1,685,128
|
1.63
|
%
|
||||||||
|
Tocalo Co. Ltd.
|
55,000
|
497,132
|
0.48
|
%
|
||||||||
|
TRE Holdings Corp.
|
212,700
|
1,660,313
|
1.60
|
%
|
||||||||
|
Tsubakimoto Chain Co.
|
84,900
|
2,146,125
|
2.07
|
%
|
||||||||
|
Tsukishima Holdings Co. Ltd.
|
251,200
|
2,132,782
|
2.06
|
%
|
||||||||
|
|
38,390,731
|
37.07
|
%
|
|||||||||
|
Information Technology – 13.20%
|
||||||||||||
|
Macnica Holdings, Inc.
|
26,100
|
1,060,428
|
1.02
|
%
|
||||||||
|
Maxell Ltd.
|
190,500
|
2,037,544
|
1.97
|
%
|
||||||||
|
Mimaki Engineering Co., Ltd.
|
285,200
|
1,397,597
|
1.35
|
%
|
||||||||
|
NEC Networks & System Integration Corp.
|
87,900
|
1,189,609
|
1.15
|
%
|
||||||||
|
Nippon Signal Co. Ltd.
|
212,300
|
1,312,823
|
1.27
|
%
|
||||||||
|
SIIX Corp.
|
196,400
|
1,839,978
|
1.78
|
%
|
||||||||
|
Towa Corp.
|
86,700
|
2,973,819
|
2.87
|
%
|
||||||||
|
WingArc1st, Inc.
|
72,500
|
1,296,981
|
1.25
|
%
|
||||||||
The accompanying notes are an integral part of these financial statements.
|
HENNESSY FUNDS
|
1-800-966-4354
|
9
|
COMMON STOCKS
|
Number
|
% of
|
||||||||||
|
|
of Shares
|
Value
|
Net Assets
|
|||||||||
|
Information Technology (Continued)
|
||||||||||||
|
Yamaichi Electronics Co. Ltd.
|
48,600
|
$
|
562,129
|
0.54
|
%
|
|||||||
|
|
13,670,908
|
13.20
|
%
|
|||||||||
|
Materials – 8.30%
|
||||||||||||
|
Asia Pile Holdings Corp.
|
434,900
|
2,138,029
|
2.07
|
%
|
||||||||
|
Daicel Corp.
|
97,300
|
827,408
|
0.80
|
%
|
||||||||
|
Kyoei Steel Ltd.
|
89,400
|
1,134,076
|
1.10
|
%
|
||||||||
|
Maeda Kosen Co. Ltd.
|
87,700
|
1,708,541
|
1.65
|
%
|
||||||||
|
Tokyo Ohka Kogyo Co. Ltd.
|
34,800
|
2,010,772
|
1.94
|
%
|
||||||||
|
Toyobo Co. Ltd.
|
114,800
|
770,243
|
0.74
|
%
|
||||||||
|
|
8,589,069
|
8.30
|
%
|
|||||||||
|
Real Estate – 2.26%
|
||||||||||||
|
Star Mica Holdings Co. Ltd.
|
165,400
|
663,718
|
0.64
|
%
|
||||||||
|
Tosei Corp.
|
141,900
|
1,676,787
|
1.62
|
%
|
||||||||
|
|
2,340,505
|
2.26
|
%
|
|||||||||
|
Utilities – 0.75%
|
||||||||||||
|
EF-ON, Inc.
|
244,900
|
776,534
|
0.75
|
%
|
||||||||
|
|
||||||||||||
|
Total Common Stocks
|
||||||||||||
|
(Cost $100,785,561)
|
98,746,760
|
95.37
|
%
|
|||||||||
|
|
||||||||||||
|
SHORT-TERM INVESTMENTS – 3.54%
|
||||||||||||
|
Money Market Funds – 3.54%
|
||||||||||||
|
First American Treasury Obligations Fund – Class X, 5.275% (b)
|
3,667,081
|
3,667,081
|
3.54
|
%
|
||||||||
|
|
||||||||||||
|
Total Short-Term Investments
|
||||||||||||
|
(Cost $3,667,081)
|
3,667,081
|
3.54
|
%
|
|||||||||
|
|
||||||||||||
|
Total Investments
|
||||||||||||
|
(Cost $104,452,642) – 98.91%
|
102,413,841
|
98.91
|
%
|
|||||||||
|
Other Assets in Excess of Liabilities – 1.09%
|
1,130,882
|
1.09
|
%
|
|||||||||
|
|
||||||||||||
|
TOTAL NET ASSETS – 100.00%
|
$
|
103,544,723
|
100.00
|
%
|
||||||||
Percentages are stated as a percent of net assets.
|
(a)
|
Non-income producing security.
|
|
(b)
|
The rate listed is the fund’s seven-day yield as of October 31, 2023.
|
The accompanying notes are an integral part of these financial statements.
|
WWW.HENNESSYFUNDS.COM
|
10
|
SCHEDULE OF INVESTMENTS
|
Summary of Fair Value Exposure as of October 31, 2023
The following is a summary of the inputs used to value the Fund’s net assets as of October 31, 2023 (see Note 3 in the accompanying Notes to the Financial Statements):
|
Common Stocks
|
Level 1
|
Level 2
|
Level 3
|
Total
|
||||||||||||
|
Communication Services
|
$
|
—
|
$
|
3,301,213
|
$
|
—
|
$
|
3,301,213
|
||||||||
|
Consumer Discretionary
|
—
|
16,532,202
|
—
|
16,532,202
|
||||||||||||
|
Consumer Staples
|
—
|
3,930,268
|
—
|
3,930,268
|
||||||||||||
|
Energy
|
—
|
2,329,249
|
—
|
2,329,249
|
||||||||||||
|
Financials
|
—
|
4,267,192
|
—
|
4,267,192
|
||||||||||||
|
Health Care
|
—
|
4,618,889
|
—
|
4,618,889
|
||||||||||||
|
Industrials
|
—
|
38,390,731
|
—
|
38,390,731
|
||||||||||||
|
Information Technology
|
—
|
13,670,908
|
—
|
13,670,908
|
||||||||||||
|
Materials
|
—
|
8,589,069
|
—
|
8,589,069
|
||||||||||||
|
Real Estate
|
—
|
2,340,505
|
—
|
2,340,505
|
||||||||||||
|
Utilities
|
—
|
776,534
|
—
|
776,534
|
||||||||||||
|
Total Common Stocks
|
$
|
—
|
$
|
98,746,760
|
$
|
—
|
$
|
98,746,760
|
||||||||
|
Short-Term Investments
|
||||||||||||||||
|
Money Market Funds
|
$
|
3,667,081
|
$
|
—
|
$
|
—
|
$
|
3,667,081
|
||||||||
|
Total Short-Term Investments
|
$
|
3,667,081
|
$
|
—
|
$
|
—
|
$
|
3,667,081
|
||||||||
|
Total Investments
|
$
|
3,667,081
|
$
|
98,746,760
|
$
|
—
|
$
|
102,413,841
|
||||||||
The accompanying notes are an integral part of these financial statements.
|
HENNESSY FUNDS
|
1-800-966-4354
|
11
Financial Statements
|
Statement of Assets and Liabilities as of October 31, 2023
|
|
ASSETS:
|
||||
|
Investments in securities, at value (cost $104,452,642)
|
$
|
102,413,841
|
||
|
Foreign currencies
|
21,604
|
|||
|
Dividends and interest receivable
|
623,938
|
|||
|
Receivable for fund shares sold
|
147,273
|
|||
|
Receivable for securities sold
|
384,569
|
|||
|
Dividend tax reclaim receivable
|
204,251
|
|||
|
Prepaid expenses and other assets
|
27,954
|
|||
|
Total assets
|
103,823,430
|
|||
|
LIABILITIES:
|
||||
|
Payable for fund shares redeemed
|
142,038
|
|||
|
Payable to advisor
|
71,640
|
|||
|
Payable to administrator
|
18,692
|
|||
|
Payable to auditor
|
22,746
|
|||
|
Accrued distribution fees
|
5,289
|
|||
|
Accrued service fees
|
2,787
|
|||
|
Accrued trustees fees
|
6,295
|
|||
|
Accrued expenses and other payables
|
9,220
|
|||
|
Total liabilities
|
278,707
|
|||
|
NET ASSETS
|
$
|
103,544,723
|
||
|
NET ASSETS CONSISTS OF:
|
||||
|
Capital stock
|
$
|
106,183,441
|
||
|
Accumulated deficit
|
(2,638,718
|
)
|
||
|
Total net assets
|
$
|
103,544,723
|
||
|
NET ASSETS:
|
||||
|
Investor Class
|
||||
|
Shares authorized (no par value)
|
Unlimited
|
|||
|
Net assets applicable to outstanding shares
|
$
|
32,557,416
|
||
|
Shares issued and outstanding
|
2,208,315
|
|||
|
Net asset value, offering price, and redemption price per share
|
$
|
14.74
|
||
|
Institutional Class
|
||||
|
Shares authorized (no par value)
|
Unlimited
|
|||
|
Net assets applicable to outstanding shares
|
$
|
70,987,307
|
||
|
Shares issued and outstanding
|
4,874,808
|
|||
|
Net asset value, offering price, and redemption price per share
|
$
|
14.56
|
||
The accompanying notes are an integral part of these financial statements.
|
WWW.HENNESSYFUNDS.COM
|
12
|
STATEMENT OF ASSETS AND LIABILITIES/STATEMENT OF OPERATIONS
|
Financial Statements
|
Statement of Operations for the year ended October 31, 2023
|
|
INVESTMENT INCOME:
|
||||
|
Dividend income(1)
|
$
|
2,314,973
|
||
|
Interest income
|
294,838
|
|||
|
Total investment income
|
2,609,811
|
|||
|
EXPENSES:
|
||||
|
Investment advisory fees (See Note 5)
|
824,948
|
|||
|
Sub-transfer agent expenses – Investor Class (See Note 5)
|
73,636
|
|||
|
Sub-transfer agent expenses – Institutional Class (See Note 5)
|
47,519
|
|||
|
Administration, accounting, custody, and transfer agent fees (See Note 5)
|
105,681
|
|||
|
Distribution fees – Investor Class (See Note 5)
|
50,867
|
|||
|
Federal and state registration fees
|
39,755
|
|||
|
Service fees – Investor Class (See Note 5)
|
33,912
|
|||
|
Audit fees
|
22,747
|
|||
|
Compliance expense (See Note 5)
|
22,664
|
|||
|
Trustees’ fees and expenses
|
21,057
|
|||
|
Reports to shareholders
|
15,033
|
|||
|
Legal fees
|
3,095
|
|||
|
Other expenses
|
19,864
|
|||
|
Total expenses
|
1,280,778
|
|||
|
NET INVESTMENT INCOME
|
$
|
1,329,033
|
||
|
REALIZED AND UNREALIZED GAINS (LOSSES):
|
||||
|
Net realized gain on investments
|
$
|
207,238
|
||
|
Net change in unrealized appreciation/depreciation on investments
|
9,306,806
|
|||
|
Net gain on investments
|
9,514,044
|
|||
|
NET INCREASE IN NET ASSETS RESULTING FROM OPERATIONS
|
$
|
10,843,077
|
||
|
(1)
|
Net of foreign taxes withheld of $257,562.
|
The accompanying notes are an integral part of these financial statements.
|
HENNESSY FUNDS
|
1-800-966-4354
|
13
(This Page Intentionally Left Blank.)
|
WWW.HENNESSYFUNDS.COM
|
14
|
STATEMENTS OF CHANGES IN NET ASSETS
|
Financial Statements
|
Statements of Changes in Net Assets
|
|
Year Ended
|
Year Ended
|
|||||||
|
October 31, 2023
|
October 31, 2022
|
|||||||
|
OPERATIONS:
|
||||||||
|
Net investment income
|
$
|
1,329,033
|
$
|
949,649
|
||||
|
Net realized gain (loss) on investments
|
207,238
|
(2,110,306
|
)
|
|||||
|
Net change in unrealized
|
||||||||
|
appreciation/depreciation on investments
|
9,306,806
|
(29,078,282
|
)
|
|||||
|
Net increase (decrease) in net
|
||||||||
|
assets resulting from operations
|
10,843,077
|
(30,238,939
|
)
|
|||||
|
DISTRIBUTIONS TO SHAREHOLDERS:
|
||||||||
|
Distributable earnings – Investor Class
|
(198,569
|
)
|
(186,236
|
)
|
||||
|
Distributable earnings – Institutional Class
|
(658,423
|
)
|
(589,255
|
)
|
||||
|
Total distributions
|
(856,992
|
)
|
(775,491
|
)
|
||||
|
CAPITAL SHARE TRANSACTIONS:
|
||||||||
|
Proceeds from shares subscribed – Investor Class
|
5,265,277
|
6,437,217
|
||||||
|
Proceeds from shares subscribed – Institutional Class
|
44,132,157
|
38,467,373
|
||||||
|
Dividends reinvested – Investor Class
|
191,702
|
180,038
|
||||||
|
Dividends reinvested – Institutional Class
|
641,326
|
571,970
|
||||||
|
Cost of shares redeemed – Investor Class
|
(7,954,407
|
)
|
(8,822,706
|
)
|
||||
|
Cost of shares redeemed – Institutional Class
|
(27,597,536
|
)
|
(39,666,483
|
)
|
||||
|
Net increase (decrease) in net assets
|
||||||||
|
derived from capital share transactions
|
14,678,519
|
(2,832,591
|
)
|
|||||
|
TOTAL INCREASE (DECREASE) IN NET ASSETS
|
24,664,604
|
(33,847,021
|
)
|
|||||
|
NET ASSETS:
|
||||||||
|
Beginning of year
|
78,880,119
|
112,727,140
|
||||||
|
End of year
|
$
|
103,544,723
|
$
|
78,880,119
|
||||
|
CHANGES IN SHARES OUTSTANDING:
|
||||||||
|
Shares sold – Investor Class
|
350,407
|
424,356
|
||||||
|
Shares sold – Institutional Class
|
3,029,428
|
2,624,209
|
||||||
|
Shares issued to holders as reinvestment
|
||||||||
|
of dividends – Investor Class
|
13,791
|
10,154
|
||||||
|
Shares issued to holders as reinvestment
|
||||||||
|
of dividends – Institutional Class
|
46,881
|
33,206
|
||||||
|
Shares redeemed – Investor Class
|
(538,838
|
)
|
(598,751
|
)
|
||||
|
Shares redeemed – Institutional Class
|
(1,876,510
|
)
|
(2,693,301
|
)
|
||||
|
Net increase (decrease) in shares outstanding
|
1,025,159
|
(200,127
|
)
|
|||||
The accompanying notes are an integral part of these financial statements.
|
HENNESSY FUNDS
|
1-800-966-4354
|
15
Financial Statements
|
Financial Highlights
|
For an Investor Class share outstanding throughout each year
PER SHARE DATA:
Net asset value, beginning of year
Income from investment operations:
Net investment income(1)
Net realized and unrealized gains (losses) on investments
Total from investment operations
Less distributions:
Dividends from net investment income
Dividends from net realized gains
Total distributions
Net asset value, end of year
TOTAL RETURN
SUPPLEMENTAL DATA AND RATIOS:
Net assets, end of year (millions)
Ratio of expenses to average net assets
Ratio of net investment income to average net assets
Portfolio turnover rate(3)
|
(1)
|
Calculated using the average shares outstanding method.
|
|
(2)
|
Amount is between $(0.005) and $0.005.
|
|
(3)
|
Calculated on the basis of the Fund as a whole.
|
The accompanying notes are an integral part of these financial statements.
|
WWW.HENNESSYFUNDS.COM
|
16
|
FINANCIAL HIGHLIGHTS — INVESTOR CLASS
|
|
Year Ended October 31,
|
||||||||||||||||||
|
2023
|
2022
|
2021
|
2020
|
2019
|
||||||||||||||
|
$
|
13.10
|
$
|
18.12
|
$
|
15.73
|
$
|
15.43
|
$
|
14.99
|
|||||||||
|
0.14
|
0.12
|
0.03
|
0.01
|
0.03
|
||||||||||||||
|
1.58
|
(5.07
|
)
|
2.40
|
0.50
|
0.88
|
|||||||||||||
|
1.72
|
(4.95
|
)
|
2.43
|
0.51
|
0.91
|
|||||||||||||
|
(0.08
|
)
|
(0.00
|
)(2)
|
(0.04
|
)
|
(0.21
|
)
|
—
|
||||||||||
|
—
|
(0.07
|
)
|
—
|
—
|
(0.47
|
)
|
||||||||||||
|
(0.08
|
)
|
(0.07
|
)
|
(0.04
|
)
|
(0.21
|
)
|
(0.47
|
)
|
|||||||||
|
$
|
14.74
|
$
|
13.10
|
$
|
18.12
|
$
|
15.73
|
$
|
15.43
|
|||||||||
|
13.22
|
%
|
-27.41
|
%
|
15.46
|
%
|
3.27
|
%
|
6.30
|
%
|
|||||||||
|
$
|
32.56
|
$
|
31.23
|
$
|
46.15
|
$
|
46.41
|
$
|
66.30
|
|||||||||
|
1.51
|
%
|
1.57
|
%
|
1.53
|
%
|
1.55
|
%
|
1.52
|
%
|
|||||||||
|
0.97
|
%
|
0.83
|
%
|
0.16
|
%
|
0.09
|
%
|
0.23
|
%
|
|||||||||
|
32
|
%
|
45
|
%
|
24
|
%
|
17
|
%
|
21
|
%
|
|||||||||
The accompanying notes are an integral part of these financial statements.
|
HENNESSY FUNDS
|
1-800-966-4354
|
17
Financial Statements
|
Financial Highlights
|
For an Institutional Class share outstanding throughout each year
PER SHARE DATA:
Net asset value, beginning of year
Income from investment operations:
Net investment income(1)
Net realized and unrealized gains (losses) on investments
Total from investment operations
Less distributions:
Dividends from net investment income
Dividends from net realized gains
Total distributions
Net asset value, end of year
TOTAL RETURN
SUPPLEMENTAL DATA AND RATIOS:
Net assets, end of year (millions)
Ratio of expenses to average net assets
Ratio of net investment income to average net assets
Portfolio turnover rate(2)
|
(1)
|
Calculated using the average shares outstanding method.
|
|
(2)
|
Calculated on the basis of the Fund as a whole.
|
The accompanying notes are an integral part of these financial statements.
|
WWW.HENNESSYFUNDS.COM
|
18
|
FINANCIAL HIGHLIGHTS — INSTITUTIONAL CLASS
|
|
Year Ended October 31,
|
||||||||||||||||||
|
2023
|
2022
|
2021
|
2020
|
2019
|
||||||||||||||
|
$
|
12.97
|
$
|
17.94
|
$
|
15.58
|
$
|
15.28
|
$
|
14.83
|
|||||||||
|
0.21
|
0.18
|
0.11
|
0.07
|
0.09
|
||||||||||||||
|
1.54
|
(4.99
|
)
|
2.37
|
0.50
|
0.86
|
|||||||||||||
|
1.75
|
(4.81
|
)
|
2.48
|
0.57
|
0.95
|
|||||||||||||
|
(0.16
|
)
|
(0.09
|
)
|
(0.12
|
)
|
(0.27
|
)
|
(0.04
|
)
|
|||||||||
|
—
|
(0.07
|
)
|
—
|
—
|
(0.46
|
)
|
||||||||||||
|
(0.16
|
)
|
(0.16
|
)
|
(0.12
|
)
|
(0.27
|
)
|
(0.50
|
)
|
|||||||||
|
$
|
14.56
|
$
|
12.97
|
$
|
17.94
|
$
|
15.58
|
$
|
15.28
|
|||||||||
|
13.60
|
%
|
-27.05
|
%
|
15.90
|
%
|
3.69
|
%
|
6.73
|
%
|
|||||||||
|
$
|
70.99
|
$
|
47.65
|
$
|
66.58
|
$
|
34.58
|
$
|
63.78
|
|||||||||
|
1.11
|
%
|
1.17
|
%
|
1.13
|
%
|
1.13
|
%
|
1.12
|
%
|
|||||||||
|
1.44
|
%
|
1.22
|
%
|
0.63
|
%
|
0.45
|
%
|
0.61
|
%
|
|||||||||
|
32
|
%
|
45
|
%
|
24
|
%
|
17
|
%
|
21
|
%
|
|||||||||
The accompanying notes are an integral part of these financial statements.
|
HENNESSY FUNDS
|
1-800-966-4354
|
19
Financial Statements
|
Notes to the Financial Statements October 31, 2023
|
1). ORGANIZATION
The Hennessy Japan Small Cap Fund (the “Fund”) is a series of Hennessy Funds Trust (the “Trust”), which was organized as a Delaware statutory trust on September 17, 1992. The Fund is an open-end management
investment company registered under the Investment Company Act of 1940, as amended. The investment objective of the Fund is long-term capital appreciation. The Fund is a diversified fund.
The Fund offers Investor Class and Institutional Class shares. Each class of shares differs principally in its respective 12b-1 distribution and service, shareholder servicing, and
sub-transfer agent expenses. There are no sales charges. Each class has identical rights to earnings, assets, and voting privileges, except for class-specific expenses and exclusive rights to vote on matters affecting only one class.
As an investment company, the Fund follows the investment company accounting and reporting guidance of the Financial Accounting Standards Board (the “FASB”) Accounting Standard Codification
Topic 946 “Financial Services—Investment Companies.”
2). SIGNIFICANT ACCOUNTING POLICIES
The following is a summary of significant accounting policies consistently followed by the Fund in the preparation of the financial statements. These policies conform to U.S. generally accepted accounting
principles (“GAAP”).
|
a).
|
Securities Valuation – All investments in securities are valued in accordance with the Fund’s valuation policies and procedures, as described in Note 3.
|
|
b).
|
Federal Income Taxes – The Fund has elected to be taxed as a regulated investment company and intends to distribute substantially all of its taxable income to its shareholders and otherwise comply with
the provisions of the Internal Revenue Code of 1986, as amended, applicable to regulated investment companies. As a result, the Fund has made no provision for federal income taxes or excise taxes. Net investment income/loss and
realized gains/losses for federal income tax purposes may differ from those reported in the financial statements because of temporary book-basis and tax-basis differences. Temporary differences are primarily the result of the
treatment of wash sales for tax reporting purposes. The Fund recognizes interest and penalties related to income tax benefits, if any, in the Statement of Operations as an income tax expense. Distributions from net realized
gains for book purposes may include short-term capital gains, which are included as ordinary income to shareholders for tax purposes. The Fund may utilize equalization accounting for tax purposes and designate earnings and
profits, including net realized gains distributed to shareholders on redemption of shares, as part of the dividends paid deduction for income tax purposes.
|
|
Due to inherent differences in the recognition of income, expenses, and realized gains/losses under GAAP and federal income tax
regulations, permanent differences between book and tax basis for reporting are identified and appropriately reclassified in the Statement of Assets and Liabilities, as needed. As of October 31, 2023, no such reclassifications
were required for fiscal year 2023.
|
|
|
c).
|
Accounting for Uncertainty in Income Taxes – The Fund has accounting policies regarding recognition and measurement of tax positions taken or expected to be taken on a tax return. The tax returns of
the Fund for the prior three fiscal years are open for examination. The Fund has reviewed all open tax years in major tax
|
|
WWW.HENNESSYFUNDS.COM
|
20
|
NOTES TO THE FINANCIAL STATEMENTS
|
|
jurisdictions and concluded that there is no impact on the Fund’s net assets and no tax liability resulting from unrecognized tax benefits relating to uncertain income tax positions taken or expected
to be taken on a tax return. The Fund’s major tax jurisdictions are U.S. federal and Delaware.
|
|
|
d).
|
Income and Expenses – Dividend income is recognized on the ex-dividend date or as soon as information is available to the Fund. Interest income, which includes the amortization of premium and accretion
of discount, is recognized on an accrual basis. Market discounts, original issue discounts, and market premiums on debt securities are accreted or amortized to interest income over the life of a security with a corresponding
increase or decrease, as applicable, in the cost basis of such security using the yield-to-maturity method or, where applicable, the first call date of the security. Other non-cash dividends are recognized as investment income
at the fair value of the property received. The Fund is charged for those expenses that are directly attributable to its portfolio, such as advisory, administration, and certain shareholder service fees. Income, expenses (other
than expenses attributable to a specific class), and realized and unrealized gains/losses on investments are allocated to each class of shares based on such class’s net assets.
|
|
e).
|
Distributions to Shareholders – Dividends from net investment income for the Fund, if any, are declared and paid annually, usually in December. Distributions of net realized capital gains, if any, are
declared and paid annually, usually in December.
|
|
f).
|
Security Transactions – Investment and shareholder transactions are recorded on the trade date. The Fund determines the realized gain/loss from an investment transaction by comparing the original cost
of the security lot sold with the net sale proceeds. Discounts and premiums on securities purchased are accreted or amortized, respectively, over the life of each such security.
|
|
g).
|
Use of Estimates – Preparing financial statements in accordance with GAAP requires management to make estimates and assumptions that affect the reported amounts of assets and liabilities and disclosure
of contingent assets and liabilities at the date of the financial statements, as well as the reported change in net assets during the reporting period. Actual results could differ from those estimates.
|
|
h).
|
Share Valuation – The net asset value (“NAV”) per share of the Fund is calculated by dividing (i) the total value of the securities held by the Fund, plus cash and other assets, minus all liabilities
(including estimated accrued expenses) by (ii) the total number of Fund shares outstanding, rounded to the nearest $0.01. Fund shares are not priced on days the New York Stock Exchange is closed for trading. The offering and
redemption price per share for the Fund is equal to the Fund’s NAV per share.
|
|
i).
|
Foreign Currency – Values of investments denominated in foreign currencies are converted into U.S. dollars using the spot market exchange rate at the time of valuation. Purchases and sales of
investments and income are translated into U.S. dollars using the spot market exchange rate prevailing on the respective dates of such transactions. The Fund does not isolate the portion of the results of operations resulting
from fluctuations in foreign exchange rates on investments from fluctuations resulting from changes in the market prices of securities held. Such fluctuations are included with the net realized and unrealized gain/loss on
investments. Foreign investments present additional risks due to currency fluctuations, economic and political factors, lower liquidity, government regulations, differences in accounting standards, and other factors.
|
|
j).
|
REIT Equity Securities – Distributions received from real estate investment trusts (“REITs”) may be classified as dividends, capital gains, or return of capital.
|
|
HENNESSY FUNDS
|
1-800-966-4354
|
21
|
Investments in REITs may require the Fund to accrue and distribute income not yet received. To generate sufficient cash to make any required distributions, the Fund may be required to sell securities
in its portfolio (including when it is not advantageous to do so) that it otherwise would have continued to hold. At other times, investments in a REIT may result in the Fund’s receipt of cash in excess of the REIT’s earnings.
If the Fund distributes these amounts, these distributions could constitute a return of capital to Fund shareholders for U.S. federal income tax purposes. Dividends received by the Fund from a REIT generally do not constitute
qualified dividend income and do not qualify for the dividends-received deduction.
|
|
|
k).
|
Illiquid Securities – Pursuant to Rule 22e-4 under the 1940 Act, the Fund has adopted a Liquidity Risk Management Program (the “Liquidity Program”). The Liquidity Program requires, among other things,
that the Fund limit its illiquid investments to no more than 15% of its net assets. An illiquid investment is any investment that the Fund reasonably expects cannot be sold or disposed of by the Fund in current market conditions
in seven calendar days or less without the sale or disposition significantly changing the market value of the investment.
|
|
l).
|
Recent Accounting Pronouncements and Regulatory Updates – In October 2022, the Securities and Exchange Commission (“SEC”) adopted a final rule relating to Tailored Shareholder Reports for Mutual Funds
and Exchange-Traded Funds (ETFs); Fee Information in Investment Company Advertisements. The rule and form amendments will require mutual funds and ETFs to transmit concise and visually engaging shareholder reports that highlight
key information. The amendments also will require that funds tag information in a structured data format. In addition, the rule amendments will require that certain more in-depth information be made available online and
available for delivery free of charge to investors on request. The amendments became effective January 24, 2023. There is an 18-month transition period after the effective date of the amendment.
|
|
In June 2022, the FASB issued Accounting Standards Update (“ASU”) 2022-03, Fair Value Measurement (Topic 820): Fair Value
Measurement of Equity Securities Subject to Contractual Sale Restrictions. The ASU clarifies that a contractual restriction on the sale of an equity security is not considered part of the unit of account of the equity security
and, therefore, is not considered in measuring the fair value. The amendments also require additional disclosures related to equity securities subject to contractual sale restrictions. The ASU is effective for fiscal years
beginning after December 15, 2023, and interim periods within those fiscal years.
|
3). SECURITIES VALUATION
The Fund follows its valuation policies and procedures in determining its NAV and, in preparing these financial statements, the fair value accounting standards that establish an authoritative definition of
fair value and set out a hierarchy for measuring fair value. These standards require additional disclosures about the various inputs and valuation techniques used to develop the measurements of fair value and a discussion of changes in
valuation techniques and related inputs during the period. These inputs are summarized in the three broad levels listed below:
|
Level 1 –
|
Unadjusted, quoted prices in active markets for identical instruments that the Fund has the ability to access at the date of measurement.
|
|
|
Level 2 –
|
Other significant observable inputs other than quoted prices included in Level 1 (including, but not limited to, quoted prices in active markets for similar instruments, quoted prices in markets that
are not active for identical or similar instruments, and model-derived valuations in which all
|
|
WWW.HENNESSYFUNDS.COM
|
22
|
NOTES TO THE FINANCIAL STATEMENTS
|
|
significant inputs and significant value drivers are observable in active markets, such as interest rates, prepayment speeds, credit risk curves, default rates, and similar data).
|
||
|
Level 3 –
|
Significant unobservable inputs (including the Fund’s own assumptions about what market participants would use to price the asset or liability based on the best available information) when observable
inputs are unavailable.
|
The following is a description of the valuation techniques applied to the Fund’s major categories of assets and liabilities on a recurring basis:
|
Equity Securities – Equity securities, including common stocks, preferred stocks, foreign-issued common stocks, exchange-traded funds, closed-end mutual funds,
partnerships, rights, and real estate investment trusts, that are traded on a securities exchange for which a last-quoted sales price is readily available generally are valued at the last sales price as reported by the primary
exchange on which the securities are listed. Securities listed on The Nasdaq Stock Market (“Nasdaq”) generally are valued at the Nasdaq Official Closing Price, which may differ from the last sales price reported. Securities
traded on a securities exchange for which a last-quoted sales price is not readily available generally are valued at the mean between the bid and ask prices. To the extent these securities are actively traded and valuation
adjustments are not applied, they are classified in Level 1 of the fair value hierarchy. Securities traded on foreign exchanges generally are not valued at the same time the Fund calculates its NAV because most foreign markets
close well before such time. The earlier close of most foreign markets gives rise to the possibility that significant events, including broad market moves, may have occurred in the interim. In certain circumstances, it may be
determined that a foreign security needs to be fair valued because it appears that the value of the security might have been materially affected by events occurring after the close of the market in which the security is
principally traded, but before the time the Fund calculates its NAV, such as by a development that affects an entire market or region (e.g., a weather-related event) or a potentially global development (e.g., a terrorist attack
that may be expected to have an effect on investor expectations worldwide).
|
|
|
Registered Investment Companies – Investments in open-end registered investment companies, commonly referred to as mutual funds, generally are priced at the
ending NAV provided by the applicable mutual fund’s service agent and are classified in Level 1 of the fair value hierarchy.
|
|
|
Debt Securities – Debt securities, including corporate bonds, asset-backed securities, mortgage-backed securities, municipal bonds, U.S. Treasuries, and U.S.
government agency issues, are generally valued at market on the basis of valuations furnished by an independent pricing service that utilizes both dealer-supplied valuations and formula-based techniques. The pricing service may
consider recently executed transactions in securities of the issuer or comparable issuers, market price quotations (where observable), bond spreads, and fundamental data relating to the issuer. In addition, the model may
incorporate observable market data, such as reported sales of similar securities, broker quotes, yields, bids, offers, and reference data. Certain securities are valued primarily using dealer quotations. These securities are
generally classified in Level 2 of the fair value hierarchy.
|
|
|
Short-Term Securities – Short-term equity investments, including money market funds, are valued in the manner specified above for equity securities. Short-term
debt investments with an original term to maturity of 60 days or less are valued at amortized cost, which approximates fair market value. If the original term to
|
|
HENNESSY FUNDS
|
1-800-966-4354
|
23
|
maturity of a short-term debt investment exceeds 60 days, then the values as of the 61st day prior to maturity are amortized. Amortized cost is not used if its use would be inappropriate due to credit
or other impairments of the issuer, in which case the security’s fair value would be determined as described below. Short-term securities are generally classified in Level 1 or Level 2 of the fair value hierarchy depending on
the inputs used and market activity levels for specific securities.
|
If market quotations are not readily available or if a significant event has occurred that indicates the closing price of a security no longer represents the true value of that security, any
security or other asset will be valued at its fair value in accordance with Rule 2a-5 under the 1940 Act. The Board of Trustees of the Fund (the “Board”) has designated Hennessy Advisors, Inc. (the “Advisor”) as the Fund’s valuation
designee to make all fair value determinations with respect to the Fund’s portfolio investments under the Fund’s fair value pricing procedures, subject to the Board’s oversight. There are numerous criteria considered in determining a
fair value of a security, such as the trading volume of a security and markets, the values of other similar securities, and news events with direct bearing on a security or markets. Fair value pricing results in an estimated price for a
security that reflects the amount the Fund might reasonably expect to receive in a current sale. Depending on the relative significance of the valuation inputs, these securities may be classified in either Level 2 or Level 3 of the fair
value hierarchy. The Advisor will regularly evaluate whether the Fund’s fair value pricing procedures continue to be appropriate in light of the specific circumstances of the Fund and the quality of prices obtained through their
application of such procedures.
The fair value of foreign securities may be determined with the assistance of a pricing service using correlations between the movement of prices of such securities and indices of domestic
securities and other appropriate indicators, such as closing market prices of relevant American Depositary Receipts or futures contracts. Using fair value pricing means that the Fund’s NAV reflects the affected portfolio securities’
values as determined by the Advisor, the Board’s valuation designee, pursuant to the Fund’s fair value pricing procedures, instead of being determined by the market. Using a fair value pricing methodology to price a foreign security may
result in a value that is different from such foreign security’s most recent closing price and from the value used by other investment companies to calculate their NAVs. Such securities are generally classified in Level 2 of the fair
value hierarchy. Because the Fund invests in foreign securities, the value of the Fund’s portfolio securities may change on days when a shareholder is unable to purchase or redeem Fund shares.
The Fund has performed an analysis of all existing investments to determine the significance and character of all inputs to their fair value determinations. Various inputs are used to
determine the value of the Fund’s investments. The inputs or methodology used for valuing securities are not necessarily an indication of the risk associated with investing in those securities. Details related to the fair value
hierarchy of the Fund’s securities as of October 31, 2023, are included in the Schedule of Investments.
4). INVESTMENT TRANSACTIONS
Purchases and sales of investment securities (excluding government and short-term investments) for the Fund during fiscal year 2023 were $45,706,183 and $30,977,474, respectively.
There were no purchases or sales/maturities of long-term U.S. government securities for the Fund during fiscal year 2023.
|
WWW.HENNESSYFUNDS.COM
|
24
|
NOTES TO THE FINANCIAL STATEMENTS
|
5). INVESTMENT ADVISORY FEE AND OTHER TRANSACTIONS WITH AFFILIATES
The Advisor provides the Fund with investment advisory services under an Investment Advisory Agreement. The Advisor oversees the provision of investment advice and furnishes office space, facilities, and most
of the personnel needed by the Fund. As compensation for its services, the Advisor is entitled to a monthly fee from the Fund. The fee is based on the average daily net assets of the Fund at an annual rate of 0.80%. The net investment
advisory fees expensed by the Fund during fiscal year 2023 are included in the Statement of Operations.
The Advisor has delegated the day-to-day management of the Fund to a sub-advisor, SPARX Asset Management Co., Ltd. The Advisor pays the sub-advisory fees from its own assets, and these fees
are not an additional expense of the Fund. During fiscal year 2023, the Advisor (not the Fund) paid a sub-advisory fee at the average rate of 0.35% of the daily net assets of the Fund. Pursuant to the sub-advisory agreement, the Advisor
pays sub-advisory fees at the rate of 0.35% of the first $500 million of daily net assets, 0.40% of daily net assets between $500 million and $1 billion, and 0.42% of daily net assets over $1 billion.
The Board has approved a Shareholder Servicing Agreement for Investor Class shares of the Fund, which compensates the Advisor for the non-investment advisory services it provides to the
Fund. The Shareholder Servicing Agreement provides for a monthly fee paid to the Advisor at an annual rate of 0.10% of the average daily net assets of the Fund attributable to Investor Class shares. The shareholder service fees expensed
by the Fund during fiscal year 2023 are included in the Statement of Operations.
The Fund has adopted a plan pursuant to Rule 12b-1 under the Investment Company Act of 1940, as amended, that authorizes payments in connection with the distribution of Fund shares at an
annual rate of up to 0.25% of the Fund’s average daily net assets attributable to Investor Class shares. Even though the authorized rate is up to 0.25%, the Fund is currently only using up to 0.15% of its average daily net assets
attributable to Investor Class shares for such purpose. Amounts paid under the plan may be spent on any activities or expenses primarily intended to result in the sale of shares, including, but not limited to, advertising, shareholder
account servicing, printing and mailing of prospectuses to other than current shareholders, printing and mailing of sales literature, and compensation for sales and marketing activities or to financial institutions and others, such as
dealers and distributors. The distribution fees expensed by the Fund during fiscal year 2023 are included in the Statement of Operations.
The Fund has entered into agreements with various brokers, dealers, and financial intermediaries in connection with the sale of Fund shares. The agreements provide for periodic payments of
sub-transfer agent expenses by the Fund to the brokers, dealers, and financial intermediaries for providing certain shareholder maintenance services. These shareholder services include the pre-processing and quality control of new
accounts, shareholder correspondence, answering customer inquiries regarding account status, and facilitating shareholder telephone transactions. The sub-transfer agent fees expensed by the Fund during fiscal year 2023 are included in
the Statement of Operations.
U.S. Bancorp Fund Services, LLC, d/b/a U.S. Bank Global Fund Services (“Fund Services”) provides the Fund with administrative, accounting, and transfer agent services. As administrator, Fund
Services is responsible for activities such as (i) preparing various federal and state regulatory filings, reports, and returns for the Fund, (ii) preparing reports and materials to be supplied to the Board, (iii) monitoring the
activities of the Fund’s custodian, transfer agent, and accountants, and (iv) coordinating the preparation and payment of the Fund’s expenses and reviewing the Fund’s expense accruals. U.S. Bank N.A., an affiliate of Fund Services,
serves as the Fund’s custodian. The servicing
|
HENNESSY FUNDS
|
1-800-966-4354
|
25
agreements between the Trust, Fund Services, and U.S. Bank N.A. contain a fee schedule that is inclusive of administrative, accounting, custody, and transfer agent fees. The administrative, accounting,
custody, and transfer agent fees expensed by the Fund during fiscal year 2023 are included in the Statement of Operations.
Quasar Distributors, LLC, a wholly owned broker-dealer subsidiary of Foreside Financial Group, LLC, acts as the Fund’s principal underwriter in a continuous public offering of Fund shares.
The officers of the Fund are affiliated with the Advisor. With the exception of the Chief Compliance Officer, such officers receive no compensation from the Fund for serving in their
respective roles. The Fund, along with the other funds in the Hennessy Funds family (collectively, the “Hennessy Funds”), makes reimbursement payments on an equal basis to the Advisor for a portion of the salary and benefits associated
with the office of the Chief Compliance Officer. The compliance fees expensed by the Fund during fiscal year 2023 for reimbursement payments to the Advisor are included in the Statement of Operations.
6). GUARANTEES AND INDEMNIFICATIONS
Under the Hennessy Funds’ organizational documents, their officers and trustees are indemnified by the Hennessy Funds against certain liabilities arising out of the performance of their duties to the Hennessy
Funds. Additionally, in the normal course of business, the Hennessy Funds enter into contracts with service providers that contain general indemnification clauses. The Fund’s maximum exposure under these arrangements is unknown as this
would involve future claims that may be made against the Fund that have not yet occurred. Currently, the Fund expects the risk of loss to be remote.
7). LINE OF CREDIT
The Fund has an uncommitted line of credit with the other Hennessy Funds in the amount of the lesser of (i) $100,000,000 or (ii) 33.33% of each Hennessy Fund’s net assets, or 30% for the Fund, the Hennessy Gas
Utility Fund, and the Hennessy Japan Fund and 10% for the Hennessy Balanced Fund. The line of credit is intended to provide any necessary short-term financing in connection with shareholder redemptions, subject to certain restrictions.
The credit facility is with the Hennessy Funds’ custodian bank, U.S. Bank N.A. Borrowings under this arrangement bear interest at the bank’s prime rate and are secured by all of the Fund’s assets (as to its own borrowings only). During
fiscal year 2023, the Fund did not have any borrowings outstanding under the line of credit.
8). FEDERAL TAX INFORMATION
As of October 31, 2023, the components of accumulated earnings (losses) for income tax purposes were as follows:
|
Investments
|
|||||
|
Cost of investments for tax purposes
|
$
|
105,018,160
|
|||
|
Gross tax unrealized appreciation
|
$
|
12,719,525
|
|||
|
Gross tax unrealized depreciation
|
(15,360,514
|
)
|
|||
|
Net tax unrealized appreciation/(depreciation)
|
$
|
(2,640,989
|
)
|
||
|
Undistributed ordinary income
|
$
|
1,194,105
|
|||
|
Undistributed long-term capital gains
|
—
|
||||
|
Total distributable earnings
|
$
|
1,194,105
|
|||
|
Other accumulated gain/(loss)
|
$
|
(1,191,834
|
)
|
||
|
Total accumulated gain/(loss)
|
$
|
(2,638,718
|
)
|
||
|
WWW.HENNESSYFUNDS.COM
|
26
|
NOTES TO THE FINANCIAL STATEMENTS
|
The difference between book-basis unrealized appreciation/depreciation and tax-basis unrealized appreciation/depreciation (as shown above) is attributable primarily to wash sales and
investments in passive foreign investment companies.
As of October 31, 2023, the Fund had $1,191,834 in unlimited short-term capital loss carryforwards. During fiscal year 2023, the capital losses utilized by the Fund were $243,739.
Capital losses sustained in or after fiscal year 2012 can be carried forward indefinitely, but any such loss retains the character of the original loss and must be utilized prior to any loss
incurred before fiscal year 2012. As a result of this ordering rule, capital loss carryforwards incurred prior to fiscal year 2012 may be more likely to expire unused. Capital losses sustained prior to fiscal year 2012 can be carried
forward for eight years and can be carried forward as short-term capital losses regardless of the character of the original loss.
As of October 31, 2023, the Fund did not defer, on a tax basis, any late-year ordinary losses. Late-year ordinary losses are net ordinary losses incurred after December 31, 2022, but within
the taxable year, that are deemed to arise on the first day of the Fund’s next taxable year.
During fiscal years 2023 and 2022, the tax character of distributions paid by the Fund was as follows:
|
Year Ended
|
Year Ended
|
||||||||
|
October 31, 2023
|
October 31, 2022
|
||||||||
|
Ordinary income(1)
|
$
|
856,992
|
$
|
327,698
|
|||||
|
Long-term capital gains
|
—
|
447,793
|
|||||||
|
Total distributions
|
$
|
856,992
|
$
|
775,491
|
|||||
|
(1) Ordinary income includes short-term capital gains.
|
|||||||||
9). GLOBAL EVENTS
A rise in protectionist trade policies, the possibility of a national or global recession, risks associated with pandemic and epidemic diseases, trade tensions, the possibility of changes to some international
trade agreements, political events, and continuing political tension and armed conflicts may adversely impact financial markets and the broader economy. For example, ongoing armed conflicts between Ukraine and Russia in Europe and among
Israel, Hamas, and other militant groups in the Middle East have caused and could continue to cause significant market disruptions and volatility with the markets in Europe and the Middle East, and have had negative impacts on markets
in the United States. These events could also have negative effects on the Fund’s investments that cannot be foreseen at the present time. As global systems, economies and financial markets are increasingly interconnected, events that
once had only local impact are now more likely to have regional or even global effects. Events that occur in one country, region or financial market will, more frequently, adversely impact issuers in other countries, regions, or
markets. These impacts can be exacerbated by failures of governments and societies to adequately respond to an emerging event or threat. Your investment would be negatively impacted if the value of your portfolio holdings decreases as a
result of such events, if these events adversely impact the operations and effectiveness of the Advisor or other key service providers or if these events disrupt systems and processes necessary or beneficial to the management of
accounts. These events may negatively impact broad segments of
|
HENNESSY FUNDS
|
1-800-966-4354
|
27
businesses and populations and could have a significant and rapid negative impact on the performance of the Fund’s investments, increase the Fund’s volatility, or exacerbate pre-existing risks to the Fund.
10). EVENTS SUBSEQUENT TO YEAR END
Management has evaluated the Fund’s related events and transactions that occurred subsequent to October 31, 2023, through the date of issuance of the Fund’s financial statements. Management has determined that
there were no subsequent events requiring recognition or disclosure in the financial statements.
|
WWW.HENNESSYFUNDS.COM
|
28
|
NOTES/REPORT OF INDEPENDENT REGISTERED PUBLIC ACCOUNTING FIRM
|
Report of Independent Registered Public
Accounting Firm
To the Board of Trustees of Hennessy Funds Trust
and the shareholders of the Hennessy Japan Small Cap Fund
Novato, CA
Opinion on the Financial Statements
We have audited the accompanying statement of assets and liabilities of the Hennessy Japan Small Cap Fund (the “Fund”), a series of Hennessy Funds Trust, including the schedule of investments, as of October
31, 2023, the related statement of operations for the year then ended, the statements of changes in net assets for each of the two years in the period then ended, the financial highlights for each of the five years in the period then
ended, and the related notes (collectively referred to as the “financial statements”). In our opinion, the financial statements present fairly, in all material respects, the financial position of the Fund as of October 31, 2023, the
results of its operations for the year then ended, the changes in its net assets for each of the two years in the period then ended, and the financial highlights for each of the five years in the period then ended in conformity with
accounting principles generally accepted in the United States of America.
Basis for Opinion
These financial statements are the responsibility of the Fund’s management. Our responsibility is to express an opinion on the Fund’s financial statements based on our audits. We are a public accounting firm
registered with the Public Company Accounting Oversight Board (United States) (“PCAOB”) and are required to be independent with respect to the Fund in accordance with the U.S. federal securities laws and the applicable rules and
regulations of the Securities and Exchange Commission and the PCAOB. We have served as the auditor of one or more of the funds in the Trust since 2002.
We conducted our audits in accordance with the standards of the PCAOB. Those standards require that we plan and perform the audit to obtain reasonable assurance about whether the financial statements are free
of material misstatement, whether due to error or fraud. The Fund is not required to have, nor were we engaged to perform, an audit of its internal control over financial reporting. As part of our audits we are required to obtain an
understanding of internal control over financial reporting, but not for the purpose of expressing an opinion on the effectiveness of the Fund’s internal control over financial reporting. Accordingly, we express no such opinion.
Our audits included performing procedures to assess the risks of material misstatement of the financial statements, whether due to error or fraud, and performing procedures that respond to those risks. Such
procedures included examining, on a test basis, evidence regarding the amounts and disclosures in the financial statements. Our audits also included evaluating the accounting principles used and significant estimates made by management,
as well as evaluating the overall presentation of the financial statements. Our procedures included confirmation of securities owned as of October 31, 2023 by correspondence with the custodian. We believe that our audits provide a
reasonable basis for our opinion.
|
|
|
TAIT, WELLER & BAKER LLP
|
Philadelphia, Pennsylvania
December 22, 2023
|
HENNESSY FUNDS
|
1-800-966-4354
|
29
Trustees and Officers of the Fund (Unaudited)
The business and affairs of the Funds are managed under the direction of the Board of Trustees of the Trust, and the Board of Trustees elects the officers of the Trust (“Officers”). From time to time, the
Board of Trustees also has appointed advisers to the Board of Trustees (“Advisers”) with the intention of having qualified individuals serve in an advisory capacity to garner experience in the mutual fund and asset management industry
and be considered as potential Trustees in the future. There are currently two Advisers, Brian Alexander and A.J. Hennessy. As Advisers, Mr. Alexander and Mr. A.J. Hennessy attend meetings of the Board of Trustees and act as non-voting
participants. Information pertaining to the Trustees, Advisers, and the Officers of the Trust is set forth below. The Trustees and Officers serve until their successors are duly elected and qualified or until their earlier death,
resignation, or removal. Each Trustee oversees all 17 Hennessy Funds. Unless otherwise indicated, the address of all persons listed below is 7250 Redwood Boulevard, Suite 200, Novato, CA 94945. The Fund’s Statement of Additional
Information includes more information about the persons listed below and is available without charge by calling 800-966-4354 or by visiting www.hennessyfunds.com.
|
Other
|
|||
|
Directorships
|
|||
|
Held Outside
|
|||
|
Name, Age,
|
of Fund
|
||
|
and Position Held
|
Start Date
|
Principal Occupation(s)
|
Complex During
|
|
with the Trust
|
of Service
|
During Past Five Years
|
Past Five Years
|
|
Disinterested Trustees(1) and Disinterested Advisers
|
|||
|
J. Dennis DeSousa
|
January 1996
|
Mr. DeSousa is a real estate investor.
|
None.
|
|
87
|
|||
|
Trustee
|
|||
|
Robert T. Doyle
|
January 1996
|
Mr. Doyle is retired. He served as the
|
None.
|
|
76
|
Sheriff of Marin County, California
|
||
|
Trustee
|
from 1996 to June 2022.
|
||
|
Doug Franklin
|
March 2016
|
Mr. Franklin is a retired insurance
|
None.
|
|
59
|
as an Adviser
|
industry executive. From 1987
|
|
|
Trustee
|
to the Board
|
through 2015, he was employed by
|
|
|
and June 2023
|
the Allianz-Fireman’s Fund Insurance
|
||
|
as a Trustee
|
Company in various positions,
|
||
|
including as its Chief Actuary and
|
|||
|
Chief Risk Officer.
|
|||
|
Claire Garvie
|
December 2015
|
Ms. Garvie is a founder of Kiosk and
|
None.
|
|
49
|
as an Adviser
|
has served as its Chief Operating
|
|
|
Trustee
|
to the Board and
|
Officer since 2004. Kiosk is a
|
|
|
December 2021
|
full-service marketing agency with
|
||
|
as a Trustee
|
offices in the San Francisco Bay Area
|
||
|
and Liverpool, UK and staff across
|
|||
|
nine states in the U.S.
|
|||
|
WWW.HENNESSYFUNDS.COM
|
30
|
TRUSTEES AND OFFICERS OF THE FUND
|
|
Other
|
|||
|
Directorships
|
|||
|
Held Outside
|
|||
|
Name, Age,
|
of Fund
|
||
|
and Position Held
|
Start Date
|
Principal Occupation(s)
|
Complex During
|
|
with the Trust
|
of Service
|
During Past Five Years
|
Past Five Years
|
|
Gerald P. Richardson
|
May 2004
|
Mr. Richardson is an independent
|
None.
|
|
78
|
consultant in the securities industry.
|
||
|
Trustee
|
|||
|
Brian Alexander
|
March 2015
|
Mr. Alexander has served as the
|
None.
|
|
42
|
Chief Operating Officer of Solis
|
||
|
Adviser to the Board
|
Mammography since March 2023.
|
||
|
Prior to that, he worked for the
|
|||
|
Sutter Health organization from
|
|||
|
2011 to 2023 in various positions.
|
|||
|
He served as the Chief Executive
|
|||
|
Officer of the North Valley Hospital
|
|||
|
Area from 2021 to March 2023.
|
|||
|
From 2018 to 2021, he served as the
|
|||
|
Chief Executive Officer of Sutter
|
|||
|
Roseville Medical Center. From 2016
|
|||
|
through 2018, he served as the Vice
|
|||
|
President of Strategy for the Sutter
|
|||
|
Health Valley Area, which includes
|
|||
|
11 hospitals, 13 ambulatory surgery
|
|||
|
centers, 16,000 employees, and
|
|||
|
1,900 physicians.
|
|||
|
Interested Trustee and Interested Adviser(2)
|
|||
|
Neil J. Hennessy
|
January 1996 as
|
Mr. Neil Hennessy has been employed
|
Hennessy
|
|
67
|
a Trustee and
|
by Hennessy Advisors, Inc. since
|
Advisors, Inc.
|
|
Chairman of the Board,
|
June 2008 as
|
1989 and currently serves as its
|
|
|
Chief Market Strategist,
|
an Officer
|
Chairman and Chief Executive Officer.
|
|
|
Portfolio Manager,
|
|||
|
and President
|
|||
|
A.J. Hennessy
|
December 2022
|
Mr. A.J. Hennessy has been employed
|
None.
|
|
37
|
by Hennessy Advisors, Inc. since 2011.
|
||
|
Adviser to the Board
|
|||
|
and Vice President,
|
|||
|
Corporate Development
|
|||
|
and Operations
|
|||
|
HENNESSY FUNDS
|
1-800-966-4354
|
31
|
Name, Age,
|
||
|
and Position Held
|
Start Date
|
Principal Occupation(s)
|
|
with the Trust
|
of Service
|
During Past Five Years
|
|
Officers
|
||
|
Teresa M. Nilsen
|
January 1996
|
Ms. Nilsen has been employed by Hennessy Advisors, Inc.
|
|
57
|
since 1989 and currently serves as its President, Chief
|
|
|
Executive Vice President
|
Operating Officer, and Secretary.
|
|
|
and Treasurer
|
||
|
Daniel B. Steadman
|
March 2000
|
Mr. Steadman has been employed by Hennessy Advisors, Inc.
|
|
67
|
since 2000 and currently serves as its Executive Vice President.
|
|
|
Executive Vice President
|
||
|
and Secretary
|
||
|
Brian Carlson
|
December 2013
|
Mr. Carlson has been employed by Hennessy Advisors, Inc.
|
|
51
|
since December 2013 and currently serves as its Chief
|
|
|
Senior Vice President
|
Compliance Officer and Senior Vice President.
|
|
|
and Head of Distribution
|
||
|
David Ellison(3)
|
October 2012
|
Mr. Ellison has been employed by Hennessy Advisors, Inc.
|
|
65
|
since October 2012. He has served as a Portfolio Manager of
|
|
|
Senior Vice President
|
the Hennessy Large Cap Financial Fund and the Hennessy
|
|
|
and Portfolio Manager
|
Small Cap Financial Fund since their inception. Mr. Ellison also
|
|
|
served as a Portfolio Manager of the Hennessy Technology
|
||
|
Fund from its inception until February 2017. Mr. Ellison served
|
||
|
as Director, CIO, and President of FBR Fund Advisers, Inc.
|
||
|
from December 1999 to October 2012.
|
||
|
Jennifer Emerson(4)
|
June 2013
|
Ms. Emerson has been employed by Hennessy Advisors, Inc.
|
|
46
|
as its General Counsel since June 2013.
|
|
|
Senior Vice President and
|
||
|
Chief Compliance Officer
|
||
|
Ryan Kelley(5)
|
March 2013
|
Mr. Kelley has been employed by Hennessy Advisors, Inc. since
|
|
51
|
October 2012. He has served as Chief Investment Officer of the
|
|
|
Senior Vice President,
|
Hennessy Funds since March 2021 and has served as a Portfolio
|
|
|
Chief Investment Officer,
|
Manager of the Hennessy Gas Utility Fund, the Hennessy Large
|
|
|
and Portfolio Manager
|
Cap Financial Fund, and the Hennessy Small Cap Financial Fund
|
|
|
since October 2014. Mr. Kelley served as Co-Portfolio Manager
|
||
|
of these same funds from March 2013 through September
|
||
|
2014 and as a Portfolio Analyst for the Hennessy Funds from
|
||
|
October 2012 through February 2013. He has also served as a
|
||
|
Portfolio Manager of the Hennessy Cornerstone Growth Fund,
|
||
|
the Hennessy Cornerstone Mid Cap 30 Fund, the Hennessy
|
||
|
Cornerstone Large Growth Fund, and the Hennessy
|
||
|
Cornerstone Value Fund since February 2017 and as a Portfolio
|
||
|
Manager of the Hennessy Total Return Fund, the Hennessy
|
||
|
Balanced Fund, and the Hennessy Technology Fund since May
|
||
|
2018. He previously served as Co-Portfolio Manager of the
|
||
|
Hennessy Technology Fund from February 2017 until May 2018.
|
||
|
Mr. Kelley served as Portfolio Manager of FBR Fund
|
||
|
Advisers, Inc. from January 2008 to October 2012.
|
|
WWW.HENNESSYFUNDS.COM
|
32
|
TRUSTEES AND OFFICERS OF THE FUND
|
|
Name, Age,
|
||
|
and Position Held
|
Start Date
|
Principal Occupation(s)
|
|
with the Trust
|
of Service
|
During Past Five Years
|
|
L. Joshua Wein(5)
|
September 2018
|
Mr. Wein has been employed by Hennessy Advisors, Inc. since
|
|
50
|
2018. He has served as Portfolio Manager of the Hennessy
|
|
|
Vice President and
|
Cornerstone Growth Fund, the Hennessy Cornerstone Mid Cap
|
|
|
Portfolio Manager
|
30 Fund, the Hennessy Cornerstone Large Growth Fund, the
|
|
|
Hennessy Cornerstone Value Fund, Hennessy Total Return Fund,
|
||
|
the Hennessy Balanced Fund, the Hennessy Gas Utility Fund,
|
||
|
and the Hennessy Technology Fund since February 2021, and
|
||
|
as the Co-Portfolio Manager of these Funds since February
|
||
|
2019. He served as a Senior Analyst of those same Funds from
|
||
|
September 2018 through February 2019. He also has served as
|
||
|
a Portfolio Manager of the Hennessy Energy Transition Fund
|
||
|
and the Hennessy Midstream Fund since January 2022.
|
||
|
Mr. Wein served as Director of Alternative Investments and
|
||
|
Co-Portfolio Manager at Sterling Capital Management
|
||
|
from 2008 to 2018.
|
_______________
|
(1)
|
The Funds have determined that Mr. DeSousa, Mr. Doyle, Mr. Franklin, Ms. Garvie, and Mr. Richardson are not interested persons, as defined in the 1940 Act, of the Investment
Manager or of any predecessor investment adviser for purposes of Section 15(f) of the 1940 Act.
|
|
(2)
|
Each of Neil J. Hennessy and A.J. Hennessy is considered an interested person, as defined in the 1940 Act, because he is an officer of the Trust.
|
|
(3)
|
The address of this officer is 101 Federal Street, Suite 1615B, Boston, MA 02110.
|
|
(4)
|
The address of this officer is 4800 Bee Caves Road, Suite 100, Austin, TX 78746.
|
|
(5)
|
The address of this officer is 1340 Environ Way, Chapel Hill, NC 27517.
|
|
HENNESSY FUNDS
|
1-800-966-4354
|
33
Expense Example (Unaudited)
October 31, 2023
As a shareholder of the Fund, you incur ongoing costs, including management fees, service fees, and other Fund expenses. This Example is intended to help you understand your ongoing costs (in dollars) of
investing in the Fund and to compare these costs with the ongoing costs of investing in other investment funds. The Example is based on an investment of $1,000 invested at the beginning of the period and held for the entire period from
May 1, 2023, through October 31, 2023.
Actual Expenses
In the table below, the first line under each of the “Investor Class” and “Institutional Class” headings provides information about actual account values and actual expenses for each share class. You may use
this information, together with the amount you invested, to estimate the expenses that you paid over the period. Simply divide your account value by $1,000 (for example, an $8,600 account value divided by $1,000 = 8.6), then multiply
the result by the number in the first line under the heading “Expenses Paid During Period” to estimate the expenses you paid on your account during this period. Although the Fund charges no sales loads or transaction fees, you will be
assessed fees for outgoing wire transfers, returned checks, and stop payment orders at prevailing rates charged by U.S. Bank Global Fund Services, the Fund’s transfer agent. If you request that a redemption be made by wire transfer, the
Fund’s transfer agent charges a $15 fee. IRAs are charged a $15 annual maintenance fee (up to $30 maximum per shareholder for shareholders with multiple IRAs). The examples below include, but are not limited to, management, shareholder
servicing, accounting, custody, and transfer agent fees. However, the examples below do not include portfolio trading commissions and related expenses.
Hypothetical Example for Comparison Purposes
In the table below, the second line under each of the “Investor Class” and “Institutional Class” headings provides information about hypothetical account values and hypothetical expenses based on the Fund’s
actual expense ratio for each share class and an assumed rate of return of 5% per year before expenses, which is not the Fund’s actual return for such share class. The hypothetical account values and expenses may not be used to estimate
the actual ending account balance or expenses you paid for the period. You may use this information to compare the ongoing costs of investing in the Fund and other funds. To do so, compare these 5% hypothetical examples with the 5%
hypothetical examples that appear in the shareholder reports of the other funds. Please note that the expenses shown in the table are meant to highlight your ongoing costs only. Therefore, the second lines under “Investor Class” and
“Institutional Class” are useful in comparing ongoing costs only and will not help you determine the relative total costs of owning different funds.
|
WWW.HENNESSYFUNDS.COM
|
34
|
EXPENSE EXAMPLE
|
|
Expenses Paid
|
|||
|
Beginning
|
Ending
|
During Period(1)
|
|
|
Account Value
|
Account Value
|
May 1, 2023 –
|
|
|
May 1, 2023
|
October 31, 2023
|
October 31, 2023
|
|
|
Investor Class
|
|||
|
Actual
|
$1,000.00
|
$ 964.70
|
$7.43
|
|
Hypothetical (5% return before expenses)
|
$1,000.00
|
$1,017.64
|
$7.63
|
|
Institutional Class
|
|||
|
Actual
|
$1,000.00
|
$ 966.80
|
$5.40
|
|
Hypothetical (5% return before expenses)
|
$1,000.00
|
$1,019.71
|
$5.55
|
|
(1)
|
Expenses are equal to the Fund’s annualized expense ratio of 1.50% for Investor Class shares or 1.09% for Institutional Class shares, as applicable, multiplied by the average account value over the
period, multiplied by 184/365 days (to reflect the half-year period).
|
|
HENNESSY FUNDS
|
1-800-966-4354
|
35
How to Obtain a Copy of the Fund’s Proxy
Voting Policy and Proxy Voting Records
A description of the policies and procedures the Fund uses to determine how to vote proxies relating to portfolio securities is available without charge (1) by calling 800-966-4354, (2) on the Hennessy Funds’
website at www.hennessyfunds.com/proxy-voting/voting-policy, or (3) on the U.S. Securities and Exchange Commission’s (the “SEC”) website at www.sec.gov. The Fund’s proxy voting record is available without charge on both the Hennessy
Funds’ website at www.hennessyfunds.com/proxy-voting/voting-record and the SEC’s website at www.sec.gov no later than August 31 for the prior 12 months ending June 30.
Availability of Quarterly Portfolio Schedule
The Fund files a complete schedule of portfolio holdings with the SEC for the first and third quarters of each fiscal year as an exhibit to its reports on Form N-PORT. The Fund’s Form N-PORT reports are
available on the SEC’s website at www.sec.gov or on request by calling 800-966-4354.
Federal Tax Distribution Information (Unaudited)
For fiscal year 2023, certain dividends paid by the Fund may be subject to a maximum tax rate of 23.8%, as provided for by the Jobs and Growth Tax Relief Reconciliation Act of 2003. The percentage of dividends
declared from ordinary income designated as qualified dividend income was 100.00%.
For corporate shareholders, the percent of ordinary income distributions that qualified for the corporate dividends received deduction for fiscal year 2023 was 0.00%.
The percentage of taxable ordinary income distributions that were designated as short-term capital gain distributions under Section 871(k)(2)(C) of the Internal Revenue Code of 1986, as
amended, for the Fund was 0.00%.
For the year ended October 31, 2023, the Fund earned foreign-source income and paid foreign taxes as noted below, which it intends to pass through to its shareholders pursuant to Section 853
of the Internal Revenue Code.
|
Country
|
Gross Foreign Income
|
Foreign Tax Paid
|
||
|
Japan
|
$2,572,534
|
$257,562
|
Important Notice Regarding Delivery of
Shareholder Documents
To help keep the Fund’s costs as low as possible, we generally deliver a single copy of shareholder reports, proxy statements, and prospectuses to shareholders who share an address and have the same last name.
This process does not apply to account statements. You may request an individual copy of a shareholder document at any time. If you would like to receive separate mailings of shareholder documents, please call U.S. Bank Global Fund
Services at 800-261-6950 or 414-765-4124, and individual delivery will begin within 30 days of your request. If your account is held through a financial institution or other intermediary, please contact such intermediary directly to
request individual delivery.
|
WWW.HENNESSYFUNDS.COM
|
36
|
PROXY VOTING — LIQUIDITY RISK MANAGEMENT PROGRAM
|
Electronic Delivery
As currently permitted by SEC regulations, the Fund’s shareholder reports are made available on a website, and unless you sign for eDelivery or elect to receive paper copies as detailed below, you will be
notified by mail each time a report is posted and provided with a website link to access the report.
To elect to receive paper copies of all future reports free of charge, please call U.S. Bank Global Fund Services at 800-261-6950 or 414-765-4124.
The Fund also offers shareholders the option to receive all notices, account statements, prospectuses, tax forms, and shareholder reports electronically. To sign up for eDelivery or change
your delivery preference, please visit www.hennessyfunds.com/account.
Shareholder reports transmitted after July 24, 2024, will comply with the new tailored shareholder reporting requirements, which require streamlined annual and semi-annual reports to
shareholders that highlight key information. These reports will be transmitted in paper unless a shareholder elects to receive reports electronically via eDelivery. To sign up for eDelivery, please visit
http://www.hennessyfunds.com/account.
Subscribe to receive our team’s unique market and sector insights delivered to your inbox
www.hennessyfunds.com/subscribe
Follow us on social media
| |
|
|
|
Liquidity Risk Management Program
In accordance with Rule 22e-4 under the Investment Company Act of 1940, as amended (the “Liquidity Rule”), we have adopted and implemented a liquidity risk management program (the “Liquidity Program”). The
purpose of the Liquidity Program is to assess and manage the Fund’s liquidity risk, which is the risk that the Fund would not be able to meet requests to redeem Fund shares without significant dilution of the remaining shareholders’
interests in the Fund. The Board of Trustees of the Fund (the “Board”) designated a committee comprising representatives of Hennessy Advisors, Inc., the investment adviser to the Fund, as the administrator of the Liquidity Program (the
“Program Administrator”).
The Program Administrator provided a written report regarding the Liquidity Program to the Board in advance of its meeting on June 7, 2023. The report covered the period from June 1, 2022,
through May 31, 2023. The report addressed the operation of the Liquidity Program, assessed the adequacy and effectiveness of its implementation, and described any material changes to the Liquidity Program during the review period. The
Trust’s chief compliance officer presented the report to the Board at the meeting and provided additional information regarding the Liquidity Program. The Board reviewed the Liquidity Program and considered, among other items, the
following:
|
1.
|
The Program Administrator reviewed daily historical net redemption activity during the review period and during prior periods with higher-than-average redemption activity and concluded that the Fund
has historically been able to meet requests to redeem Fund shares without significant dilution to the Fund’s remaining shareholders, and the Program Administrator expects the Fund to be able to continue to do so in the future
during both normal and reasonably foreseeable stressed conditions.
|
|
HENNESSY FUNDS
|
1-800-966-4354
|
37
|
2.
|
The Fund primarily holds assets that are highly liquid investments and is not required to establish a highly liquid investment minimum for the Fund or adopt policies and procedures for responding to a
highly liquid investment minimum shortfall.
|
|
|
3.
|
The Program Administrator did not make or recommend any material changes to the Liquidity Program during the review period.
|
|
|
4.
|
The Program Administrator concluded that the Liquidity Program was reasonably designed to assess and manage the Fund’s liquidity risk, complies with the requirements of the Liquidity Rule, and was
operating as intended during the review period.
|
Privacy Policy
We collect the following personal information about you:
|
1.
|
Information we receive from you in applications or other forms, correspondence, or conversations, including, but not limited to, your name, address, phone number, social security number, assets,
income, and date of birth;
|
|
|
2.
|
Information about your transactions with us, our affiliates, or others, including, but not limited to, your account number and balance, payments history, parties to transactions, cost basis
information, and other financial information; and
|
|
|
3.
|
Other personal information we collect from various sources, even if you have not entered into a prior transaction with us, including the following:
|
|
•
|
Name, alias, address, unique personal identifier, online identifier, IP address, email address, telephone number, account name, and other similar identifiers;
|
||
|
•
|
Age and marital status;
|
||
|
•
|
Commercial information, including records of products purchased;
|
||
|
•
|
Browsing history, search history, and information on interaction with our website;
|
||
|
•
|
Geolocation data;
|
||
|
•
|
Employment and employment history, educational history, financial information, and purchasing and consuming histories or tendencies; and
|
||
|
•
|
Inferences drawn from the above-listed information to create a profile about your preferences, characteristics, predispositions, and behavior.
|
We collect this information directly from you, indirectly in the course of providing services to you, directly and indirectly from your activity on our website, from broker dealers,
marketing agencies, and other third parties that interact with us in connection with the services we perform and products we offer, and from anonymized and aggregated consumer information.
We use this information to fulfill the reason you provided the information to us, to provide you with other relevant products that you request from us, to provide you with information about
products that may interest you, to improve our website or present our website’s contents to you, and as otherwise described to you when collecting your personal information.
|
WWW.HENNESSYFUNDS.COM
|
38
|
LIQUIDITY RISK MANAGEMENT PROGRAM/PRIVACY POLICY
|
We do not disclose any personal information to unaffiliated third parties, except as permitted by law. We may disclose your personal information to our affiliates, vendors, and service
providers for a business purpose. For example, we are permitted by law to disclose all of the information we collect, as described above, to our transfer agent to process your transactions. When disclosing your personal information to
third parties, we enter into a contract with each third party describing the purpose of such disclosure and requiring that such personal information be kept confidential and not used for any purpose except to perform the services
contracted or respond to regulatory or law enforcement requests.
Furthermore, we restrict access to your personal information to those persons who require such information to provide products or services to you. As a result, we do not provide a means for
opting out of our limited sharing of your information. We maintain physical, electronic, and procedural safeguards that comply with federal standards to guard your personal information.
If you hold shares of the Funds through a financial intermediary, including, but not limited to, a broker-dealer, bank, or trust company, the privacy policy of your financial intermediary
governs how your personal information is shared with unaffiliated third parties.
If you live in a state such as California where the laws provide further privacy rights, we will not share information unless the law allows, and we will comply with the other state-specific
requirements.
Supplemental Privacy Notice for Residents of California
The California Consumer Privacy Act of 2018 (the “CCPA”) provides you, as a California resident, with certain additional rights relating to your personal information.
Under the CCPA, you have the right to request that we disclose to you the categories of personal information we have collected about you over the past 12 months, the categories of sources of
such information, our business purpose for collecting the information, the categories of third parties, if any, with whom we shared the information, and the specific information we have collected about you. You also have the right to
request that we delete any of your personal information, and, unless an exception applies, we will delete such information upon receiving and confirming your request. To make a request, call us at 1-800-966-4354, email us at
privacy@hennessyfunds.com, or go to www.hennessyfunds.com/contact. We will not discriminate against you for exercising your rights under the CCPA. Further, we will not collect additional categories of your personal information or use
the personal information we collected for materially different, unrelated, or incompatible purposes without providing you notice.
|
HENNESSY FUNDS
|
1-800-966-4354
|
39
(This Page Intentionally Left Blank.)
For information, questions, or assistance, please call
The Hennessy Funds
800-966-4354 or 415-899-1555
INVESTMENT ADVISOR
Hennessy Advisors, Inc.
7250 Redwood Boulevard, Suite 200
Novato, California 94945
ADMINISTRATOR,
TRANSFER AGENT,
DIVIDEND PAYING AGENT, &
SHAREHOLDER SERVICING AGENT
U.S. Bancorp Fund Services, LLC
d/b/a U.S. Bank Global Fund Services
P.O. Box 701
Milwaukee, Wisconsin 53201-0701
CUSTODIAN
U.S. Bank N.A.
Custody Operations
1555 North River Center Drive, Suite 302
Milwaukee, Wisconsin 53212
TRUSTEES
Neil J. Hennessy
Robert T. Doyle
J. Dennis DeSousa
Doug Franklin
Claire Garvie
Gerald P. Richardson
COUNSEL
Foley & Lardner LLP
777 East Wisconsin Avenue
Milwaukee, Wisconsin 53202-5306
INDEPENDENT REGISTERED
PUBLIC ACCOUNTING FIRM
Tait, Weller & Baker LLP
Two Liberty Place
50 South 16th Street, Suite 2900
Philadelphia, Pennsylvania 19102-2529
DISTRIBUTOR
Quasar Distributors, LLC
111 East Kilbourn Avenue, Suite 1250
Milwaukee, Wisconsin 53202
www.hennessyfunds.com | 800-966-4354
This report has been prepared for shareholders and may be distributed to
others only if preceded or accompanied by a current prospectus.
ANNUAL REPORT
OCTOBER 31, 2023

HENNESSY LARGE CAP FINANCIAL FUND
Investor Class HLFNX
Institutional Class HILFX
www.hennessyfunds.com | 1-800-966-4354
(This Page Intentionally Left Blank.)
Contents
|
Letter to Shareholders
|
2
|
|
|
Performance Overview
|
6
|
|
|
Financial Statements
|
||
|
Schedule of Investments
|
9
|
|
|
Statement of Assets and Liabilities
|
12
|
|
|
Statement of Operations
|
13
|
|
|
Statements of Changes in Net Assets
|
15
|
|
|
Financial Highlights
|
16
|
|
|
Notes to the Financial Statements
|
20
|
|
|
Report of Independent Registered Public Accounting Firm
|
28
|
|
|
Trustees and Officers of the Fund
|
29
|
|
|
Expense Example
|
34
|
|
|
Proxy Voting Policy and Proxy Voting Records
|
36
|
|
|
Availability of Quarterly Portfolio Schedule
|
36
|
|
|
Federal Tax Distribution Information
|
36
|
|
|
Important Notice Regarding Delivery of Shareholder Documents
|
36
|
|
|
Electronic Delivery
|
36
|
|
|
Liquidity Risk Management Program
|
37
|
|
|
Privacy Policy
|
37
|
|
HENNESSY FUNDS
|
1-800-966-4354
|
November 2023
Dear Hennessy Funds Shareholder:
Market Myopia: Tough Beginnings & Fantastic Finishes
During an interview this summer, I was reminded how important it is to maintain a long-term view of the market and investing and how easy it is to focus on the very recent past. In mid-July, when the Nasdaq
Composite Index was soaring to new 2023 highs and large-cap tech was once again dominating both returns and news headlines, the interviewer seemed confused – and somewhat disappointed – when I mentioned that even with 2023’s stellar
performance, the Nasdaq was negative if you included the prior year (2022) and that during that same time, utilities had outperformed. As of the time of writing this letter, a similar story can be seen when considering eight
technology giants: Microsoft, Tesla, Facebook (Meta), Apple, Amazon, Netflix, Nvidia, and Google, or “MT. FAANNG” as a much easier to
say (and remember) acronym.(1) MT. FAANNG is up on average a whopping 89.69% in 2023 on a total return basis as of November 7, 2023. However, this same
group was down -46.71% in 2022, a dismal year for large-cap tech. Due to the unforgiving nature of percentages, from the end of 2021 until now, this group of highflyers, believe it or not, is still down -3.14% on average, despite an
incredible 2023.
I like to call this phenomenon “market myopia.” Investors tend to be optimists, as am I. This makes it so much more comforting to forget the “tough beginnings” when
you’d rather remember the “fantastic finishes.” In continuing with the example above, unless you were an investor with prescient foresight, you likely didn’t sell all your MT. FAANNG stocks on January 4, 2022, as the market started
its correction, and you probably didn’t then buy them all back on September 30, 2022, when the market hit its low. An average investor’s experience would be much different than that. Which brings me to the point of all this: what are
some elements of our investment philosophy here at Hennessy Funds?
First, what about timing the market? Simply put, we don’t do it. As Neil Hennessy, our Chief Market Strategist and long-tenured Portfolio Manager, aptly put it, “It’s
not about timing the market, but rather about time in the market.” The long-term annualized return of the market, as measured by the Dow Jones
Industrial Average going back 104 years to 1920, is about 9.6%, and that number would be closer to 7-8% on a real return basis when factoring in inflation. If an investor is poorly timing when to enter and when to exit the market, it
would be very difficult to achieve similar, attractive returns to what they would experience simply by staying invested through a complete market cycle.
We are optimistic investors. We understand that some years or months may be tougher than others, but we tend to think in longer timeframes. An investor solely invested
in the Nasdaq might have looked at their portfolio at the end of 2022 and been extremely disappointed with a -32.51% return. But as Josh Wein, one of our Portfolio Managers with over 25 years of experience, pointed out, “2022 was what
8% real returns look like.” In other words, with the year prior (2021) providing a +22.21% return and the year after (2023) hitting a +31.21% return, 2022’s dismal performance of -32.51% created an annualized total return for the
Nasdaq of 8.22% over the entire period (December 31, 2020, to November 7, 2023). Josh simply observed that while corrections happen over the course of a market cycle, it’s best not to panic by selling when stocks are hitting new lows.
_______________
|
(1)
|
The acronym, MT. FAANNG, refers to the following companies: Microsoft Corporation, Tesla, Inc., Meta Platforms, Inc., Amazon.com, Inc., Apple, Inc., Netflix, Inc., NVIDIA Corporation, and Alphabet,
Inc.
|
|
WWW.HENNESSYFUNDS.COM
|
2
|
LETTER TO SHAREHOLDERS
|
Downside risk mitigation is relevant. While we normally remain fully invested within our individual funds, we seek to reduce risk through other means, including
sector diversification and investing in companies that exhibit strong fundamentals at compelling valuations. Dave Ellison, the long-tenured Portfolio Manager of our two financial funds, consistently reminds us, “Losing less money in
difficult markets is more important than making the most in rising ones.”
Finally, we are investors in companies, not traders of stocks. Many of our portfolios hold certain positions for long periods of time, a demonstration of the Portfolio
Managers’ convictions. In fact, both the Hennessy Focus Fund and the Hennessy Large Cap Financial Fund have held some positions for 25 years or more. We recognize that much of the performance of the Hennessy Funds comes from the
actual stocks we own (stock selection) and not from our weightings within certain sectors (sector allocation). Moving in and out of sectors can enhance performance, but it can also hinder it in the same way as market timing, and it
takes a significant number of correct “calls” regarding the macro-environment. We’d rather invest long term than rely on lucky calls. Our highly experienced energy funds Portfolio Manager, Ben Cook, summed up our philosophy on the
macro environment nicely: “While macro-economic trends help to inform our investment process, ultimately it’s the individual stocks with solid fundamentals and attractive valuations that, over time, drive positive risk-adjusted
returns for our funds.”
We are long term investors, staying ever mindful of downside risk while striving to participate in the upside, with each individual fund having its own objective,
process, portfolio construction, and investment criteria.
The stock market has once again seen dramatic differences in stock performance. For our fiscal year ended October 31, 2023, all three broad-based indexes were
positive, although with a large dispersion of total returns, with the Dow Jones Industrial Average up 3.17%, the S&P 500® Index up 10.14%, and the
Nasdaq Composite Index up 17.99%. During our fiscal year, large caps significantly outperformed mid caps and small caps, and growth substantially outperformed value. Large-cap tech once again pushed the overall broader market higher,
as evidenced by the Nasdaq-100 Index posting a return of 27.45%. From a sector point of view, besides Technology, the only other sector with outsized (greater than 10%) returns was Communication Services, while six of the 11 GICS
sectors of the S&P 500® Index were negative.
Similar to the overall market, our funds experienced mixed results. Many of our funds exhibit more value-oriented characteristics and, given that value underperformed
growth this year by a significant amount, that negatively affected our relative performance. In addition, three of our funds are sector-specific funds that were invested in underperforming sectors, while six more are focused on small-
and mid-cap stocks in a time period when large caps substantially outperformed. Ten of our 16 mutual funds and our exchange-traded-fund (ETF) posted positive returns for the fiscal year ended October 31, 2023.
Several factors caused this disparity of returns in the market: interest rates and inflation being two of the most important. With the Federal Reserve pausing interest
rate hikes and inflation numbers subsiding, the market reacted positively once it became more apparent that we were not heading into a recession. Consumer demand also remained strong, and unemployment numbers remained historically
low.
We believe that the outlook for U.S. stocks remains positive, primarily as we believe that the Federal Reserve may be done, or close to done, raising interest rates.
Inflation has shown signs of easing, creating a better environment for consumers as well as businesses. The unemployment rate remains near record lows, there are elevated levels of cash on the
|
HENNESSY FUNDS
|
1-800-966-4354
|
3
balance sheets of U.S. companies and in the pockets of many consumers and investors, and there is the prospect of a more dovish Federal Reserve heading into 2024. However, we are cautiously watching certain
parts of the economy for any hints of weakness, including consumer spending and credit issues. While volatility and uncertainty may impact the markets, we encourage investors to stay the course, maintain a diversified portfolio, and
keep a long-term perspective.
We thank you for your continued interest in our Funds and are grateful that you have chosen to invest with us. If you have any questions or would like to speak with us
directly, please call us at (800) 966-4354.
Best regards,
| |
|
|
|
|
Ryan C. Kelley, CFA
|
|
|
Chief Investment Officer,
|
|
|
Senior Vice President, and Portfolio Manager
|
Past performance does not guarantee future results.
Mutual fund investing involves risk. Principal loss is possible.
Opinions expressed are those of Ryan C. Kelley and are subject to change, are not guaranteed, and should not be considered investment advice.
The Dow Jones Industrial Average and S&P 500® Index are commonly used to measure the performance of U.S. stocks. The
Nasdaq Composite Index comprises all common stocks listed on The Nasdaq Stock Market and is commonly used to measure the performance of technology-related stocks. The Nasdaq-100 Index includes 100 of the largest domestic and
international non-financial companies listed on The NASDAQ Stock Market based on market capitalization. The indices are used herein for comparative purposes in accordance with SEC regulations. One cannot invest directly in an index.
All returns are shown on a total return basis.
|
WWW.HENNESSYFUNDS.COM
|
4
|
LETTER TO SHAREHOLDERS
|
(This Page Intentionally Left Blank.)
|
HENNESSY FUNDS
|
1-800-966-4354
|
5
Performance Overview (Unaudited)
CHANGE IN VALUE OF $10,000 INVESTMENT
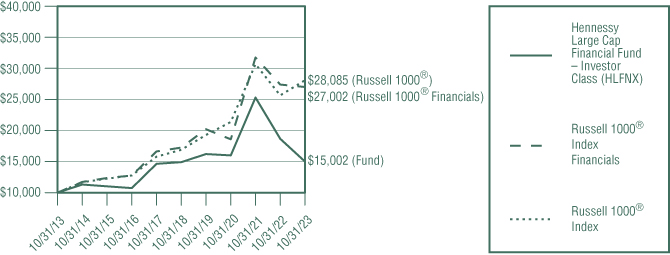
This graph illustrates the performance of an initial investment of $10,000 made in the Fund 10 years ago and assumes the reinvestment of dividends and capital gains.
AVERAGE ANNUAL TOTAL RETURN FOR PERIODS ENDED OCTOBER 31, 2023
|
One
|
Five
|
Ten
|
|
|
Year
|
Years
|
Years
|
|
|
Hennessy Large Cap Financial Fund –
|
|||
|
Investor Class (HLFNX)
|
-19.62%
|
0.13%
|
4.14%
|
|
Hennessy Large Cap Financial Fund –
|
|||
|
Institutional Class (HILFX)(1)
|
-19.41%
|
0.46%
|
4.45%
|
|
Russell 1000® Index Financials
|
-1.43%
|
9.37%
|
10.44%
|
|
Russell 1000® Index
|
9.48%
|
10.71%
|
10.88%
|
Expense ratios: 1.69% (Investor Class); 1.33% (Institutional Class)
|
(1)
|
The inception date of Institutional Class shares is June 15, 2015. Performance shown prior to the inception of Institutional Class shares reflects the performance of Investor Class shares and
includes expenses that are not applicable to, and are higher than, those of Institutional Class shares.
|
Performance data quoted represents past performance; past performance does not guarantee future results. The investment return and principal value of an investment will fluctuate so that
an investor’s shares, when redeemed, may be worth more or less than their original cost. The performance table does not reflect the deduction of taxes that a shareholder would pay on Fund distributions or the redemption of Fund
shares. Current performance of the Fund may be lower or higher than the performance quoted. Performance data current to the most recent month end may be obtained by visiting www.hennessyfunds.com.
The Russell 1000® Index Financials is a subset of the Russell 1000® Index that measures the performance of securities classified in the Financials sector of the large-cap U.S. equity market. The Russell 1000® Index is a subset of the Russell 3000® Index that measures the performance of the large-cap segment of the U.S. equity market. The
Russell 1000® Index comprises the 1,000 largest companies in the Russell 3000®
Index based on market capitalization and current index membership, representing approximately 93% of the total market capitalization of the Russell 3000®
Index. One cannot invest directly in an index. These indices are used for comparative purposes in accordance with Securities and Exchange Commission regulations.
|
WWW.HENNESSYFUNDS.COM
|
6
|
PERFORMANCE OVERVIEW
|
Frank Russell Company (“Russell”) is the source and owner of the trademarks, service marks, and copyrights related to the Russell Indexes. Russell® is a trademark of Frank Russell Company. Neither Russell nor its licensors accept any liability for any errors or omissions in the Russell Indexes or Russell ratings or underlying data and no party may
rely on any Russell Indexes or Russell ratings or underlying data contained in this communication. No further distribution of Russell data is permitted without Russell’s express written consent. Russell does not promote, sponsor, or
endorse the content of this communication.
The expense ratios presented are from the most recent prospectus. The expense ratios for the current reporting period are available in the Financial Highlights section of this report.
PERFORMANCE NARRATIVE
Portfolio Managers David H. Ellison and Ryan C. Kelley, CFA
Performance:
For the one-year period ended October 31, 2023, the Investor Class of the Hennessy Large Cap Financial Fund returned -19.62%, underperforming both the Russell 1000® Index Financials (the Fund’s primary benchmark) and the Russell 1000® Index, which returned -1.43% and
9.48%, respectively, for the same period.
The Fund’s underperformance relative to its primary benchmark predominantly stemmed from its overweight allocation to regional and large cap banks, which performed poorly in the period.
Among the biggest detractors from Fund performance during the period were Signature Bank, Citizens Financial Group, Inc., and Fifth Third Bancorp. Positive contributors to Fund performance included investments in J.P. Morgan Chase
& Co., Apple, Inc., and Regions Financial Corporation.
The Fund continues to own all the companies mentioned except Apple, Regions Financial, and Signature Bank.
Portfolio Strategy:
Historically, the Fund has been invested primarily in large-cap banks and, to a lesser degree, insurance, real estate, and asset managers. While we have increased our exposure to electronic payment companies
and other financial technology companies at various times in the past, in recent years we have repositioned the Fund back towards large-cap banks and regional banks, as we believe the more traditional financial institutions currently
offer the best relative valuations in the sector.
In general, we seek companies that we believe have high-quality management teams, less complex business models, and the prospect of sustainable earnings growth over time. We believe the
timing of changes in macro industry dynamics is difficult to predict and that greater opportunity exists by investing in companies that focus on the long term. We also try to identify companies that we expect will do better relative
to peers in the current environment, which is characterized by high interest rates, competitive loan markets, evolving electronic payment platforms, growing attention to costs, increasing potential for loan charge-offs, and business
model repositioning.
Investment Commentary:
The Financials sector has been challenged for the last couple of years as the Federal Reserve has tightened financial conditions to fight inflation. Not only have interest rates increased, but the yield
curve has inverted with short term rates moving higher than longer-term rates. This development has pressured lending margins, reduced capital via mark-to-market accounting and heightened concerns about a recession leading to higher
|
HENNESSY FUNDS
|
1-800-966-4354
|
7
loan losses. While these pressures persisted throughout 2023, companies are making adjustments and working through this difficult macro backdrop. We view the difficult operating environment as an opportunity
to invest in high quality companies at a discount as group valuations currently reflect investor fears about rising rates and credit losses. The best opportunities in this space occur when operating conditions move from ugly to ok to
good to great. We view today as ugly to ok conditions. We are positioning the portfolio in the companies we believe have the management and/or valuation to allow us the chance to outperform as operating conditions improve.
_______________
Opinions expressed are those of the Portfolio Managers as of the date written and are subject to change, are not guaranteed, and should not be considered investment advice or an indication of trading intent.
The Fund is non-diversified, meaning it may concentrate its assets in fewer individual holdings than a diversified fund, making it more exposed to individual stock volatility than a
diversified fund. Investments are focused on the financial services industry; sector funds may be subject to a higher degree of market risk. The Fund invests in medium-sized companies, which may have limited liquidity and greater
volatility than larger companies. Investments in foreign securities may involve political, economic, and currency risk, greater volatility, and differences in accounting methods. Please see the Fund’s prospectus for a more complete
discussion of these and other risks.
References to specific securities should not be considered a recommendation to buy or sell any security. Fund holdings and sector allocations are subject to change. Please refer to the Schedule of
Investments included in this report for additional portfolio information.
Earnings growth is not a measure of the Fund’s future performance.
|
WWW.HENNESSYFUNDS.COM
|
8
|
PERFORMANCE OVERVIEW/SCHEDULE OF INVESTMENTS
|
Financial Statements
|
Schedule of Investments as of October 31,
2023
|
HENNESSY LARGE CAP FINANCIAL FUND
(% of Net Assets)
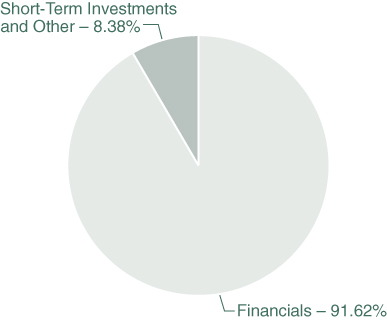
|
TOP TEN HOLDINGS (EXCLUDING MONEY MARKET FUNDS)
|
% NET ASSETS
|
|
Berkshire Hathaway, Inc., Class B
|
5.80%
|
|
Visa, Inc., Class A
|
5.60%
|
|
Wells Fargo & Co.
|
5.41%
|
|
JPMorgan Chase & Co.
|
5.19%
|
|
Mastercard, Inc., Class A
|
5.11%
|
|
Bank of America Corp.
|
5.10%
|
|
KeyCorp
|
5.10%
|
|
Fifth Third Bancorp.
|
4.99%
|
|
Webster Financial Corp.
|
4.90%
|
|
Citizens Financial Group, Inc.
|
4.85%
|
Note: For presentation purposes, the Fund has grouped some of the industry categories. For purposes of categorizing securities for compliance with Section 8(b)(1) of the Investment Company Act of 1940, as
amended, the Fund uses more specific industry classifications.
The Global Industry Classification Standard (GICS®) was developed by and is the exclusive property and a service mark of MSCI,
Inc. and Standard & Poor’s Financial Services LLC. It has been licensed for use by the Hennessy Funds.
|
HENNESSY FUNDS
|
1-800-966-4354
|
9
|
COMMON STOCKS – 91.62%
|
Number
|
% of
|
||||||||||
|
|
of Shares
|
Value
|
Net Assets
|
|||||||||
|
Financials – 91.62%
|
||||||||||||
|
Bank of America Corp.
|
57,000
|
$
|
1,501,380
|
5.10
|
%
|
|||||||
|
Berkshire Hathaway, Inc., Class B (a)
|
5,000
|
1,706,650
|
5.80
|
%
|
||||||||
|
Capital One Financial Corp.
|
6,000
|
607,740
|
2.06
|
%
|
||||||||
|
Charles Schwab Corp.
|
13,000
|
676,520
|
2.30
|
%
|
||||||||
|
Citigroup, Inc.
|
20,000
|
789,800
|
2.68
|
%
|
||||||||
|
Citizens Financial Group, Inc.
|
61,000
|
1,429,230
|
4.85
|
%
|
||||||||
|
Comerica, Inc.
|
14,000
|
551,600
|
1.87
|
%
|
||||||||
|
Fidelity National Information Services, Inc.
|
9,000
|
441,990
|
1.50
|
%
|
||||||||
|
Fifth Third Bancorp
|
62,000
|
1,470,020
|
4.99
|
%
|
||||||||
|
Fiserv, Inc. (a)
|
4,000
|
455,000
|
1.54
|
%
|
||||||||
|
JPMorgan Chase & Co.
|
11,000
|
1,529,660
|
5.19
|
%
|
||||||||
|
KeyCorp
|
147,000
|
1,502,340
|
5.10
|
%
|
||||||||
|
M&T Bank Corp.
|
10,500
|
1,183,875
|
4.02
|
%
|
||||||||
|
Mastercard, Inc., Class A
|
4,000
|
1,505,400
|
5.11
|
%
|
||||||||
|
Morgan Stanley
|
20,000
|
1,416,400
|
4.81
|
%
|
||||||||
|
New York Community Bancorp, Inc.
|
144,000
|
1,365,120
|
4.63
|
%
|
||||||||
|
PayPal Holdings, Inc. (a)
|
21,000
|
1,087,800
|
3.69
|
%
|
||||||||
|
SoFi Technologies, Inc. (a)
|
70,000
|
528,500
|
1.79
|
%
|
||||||||
|
The Goldman Sachs Group, Inc.
|
2,500
|
759,025
|
2.58
|
%
|
||||||||
|
Truist Financial Corp.
|
31,000
|
879,160
|
2.98
|
%
|
||||||||
|
U.S. Bancorp
|
26,000
|
828,880
|
2.81
|
%
|
||||||||
|
Visa, Inc., Class A
|
7,000
|
1,645,700
|
5.60
|
%
|
||||||||
|
Webster Financial Corp.
|
38,000
|
1,442,860
|
4.90
|
%
|
||||||||
|
Wells Fargo & Co.
|
40,000
|
1,590,800
|
5.41
|
%
|
||||||||
|
Zions Bancorp NA
|
3,000
|
92,550
|
0.31
|
%
|
||||||||
|
|
26,988,000
|
91.62
|
%
|
|||||||||
|
|
||||||||||||
|
Total Common Stocks
|
||||||||||||
|
(Cost $26,100,283)
|
26,988,000
|
91.62
|
%
|
|||||||||
The accompanying notes are an integral part of these financial statements.
|
WWW.HENNESSYFUNDS.COM
|
10
|
SCHEDULE OF INVESTMENTS
|
|
SHORT-TERM INVESTMENTS – 9.01%
|
Number
|
% of
|
||||||||||
|
|
of Shares
|
Value
|
Net Assets
|
|||||||||
|
Money Market Funds – 9.01%
|
||||||||||||
|
First American Government Obligations Fund – Class X, 5.276% (b)
|
1,196,274
|
$
|
1,196,274
|
4.06
|
%
|
|||||||
|
First American Treasury Obligations Fund – Class X, 5.275% (b)
|
1,457,135
|
1,457,135
|
4.95
|
%
|
||||||||
|
|
||||||||||||
|
Total Short-Term Investments
|
||||||||||||
|
(Cost $2,653,409)
|
2,653,409
|
9.01
|
%
|
|||||||||
|
|
||||||||||||
|
Total Investments
|
||||||||||||
|
(Cost $28,753,692) – 100.63%
|
29,641,409
|
100.63
|
%
|
|||||||||
|
Liabilities in Excess of Other Assets – (0.63)%
|
(185,816
|
)
|
(0.63
|
)%
|
||||||||
|
|
||||||||||||
|
TOTAL NET ASSETS – 100.00%
|
$
|
29,455,593
|
100.00
|
%
|
||||||||
Percentages are stated as a percent of net assets.
|
(a)
|
Non-income producing security.
|
|
(b)
|
The rate listed is the fund’s seven-day yield as of October 31, 2023.
|
Summary of Fair Value Exposure as of October 31, 2023
The following is a summary of the inputs used to value the Fund’s net assets as of October 31, 2023 (see Note 3 in the accompanying Notes to the Financial Statements):
|
Common Stocks
|
Level 1
|
Level 2
|
Level 3
|
Total
|
||||||||||||
|
Financials
|
$
|
26,988,000
|
$
|
—
|
$
|
—
|
$
|
26,988,000
|
||||||||
|
Total Common Stocks
|
$
|
26,988,000
|
$
|
—
|
$
|
—
|
$
|
26,988,000
|
||||||||
|
Short-Term Investments
|
||||||||||||||||
|
Money Market Funds
|
$
|
2,653,409
|
$
|
—
|
$
|
—
|
$
|
2,653,409
|
||||||||
|
Total Short-Term Investments
|
$
|
2,653,409
|
$
|
—
|
$
|
—
|
$
|
2,653,409
|
||||||||
|
Total Investments
|
$
|
29,641,409
|
$
|
—
|
$
|
—
|
$
|
29,641,409
|
||||||||
The accompanying notes are an integral part of these financial statements.
|
HENNESSY FUNDS
|
1-800-966-4354
|
11
Financial Statements
|
Statement of Assets and Liabilities as of October 31, 2023
|
|
ASSETS:
|
||||
|
Investments in securities, at value (cost $28,753,692)
|
$
|
29,641,409
|
||
|
Dividends and interest receivable
|
54,824
|
|||
|
Receivable for fund shares sold
|
108
|
|||
|
Prepaid expenses and other assets
|
16,116
|
|||
|
Total assets
|
29,712,457
|
|||
|
LIABILITIES:
|
||||
|
Payable for securities purchased
|
186,771
|
|||
|
Payable to advisor
|
23,233
|
|||
|
Payable to administrator
|
6,897
|
|||
|
Payable to auditor
|
22,746
|
|||
|
Accrued distribution fees
|
2,719
|
|||
|
Accrued service fees
|
1,476
|
|||
|
Accrued trustees fees
|
5,660
|
|||
|
Accrued expenses and other payables
|
7,362
|
|||
|
Total liabilities
|
256,864
|
|||
|
NET ASSETS
|
$
|
29,455,593
|
||
|
NET ASSETS CONSISTS OF:
|
||||
|
Capital stock
|
$
|
32,900,724
|
||
|
Accumulated deficit
|
(3,445,131
|
)
|
||
|
Total net assets
|
$
|
29,455,593
|
||
|
NET ASSETS:
|
||||
|
Investor Class
|
||||
|
Shares authorized (no par value)
|
Unlimited
|
|||
|
Net assets applicable to outstanding shares
|
$
|
16,879,577
|
||
|
Shares issued and outstanding
|
909,160
|
|||
|
Net asset value, offering price, and redemption price per share
|
$
|
18.57
|
||
|
Institutional Class
|
||||
|
Shares authorized (no par value)
|
Unlimited
|
|||
|
Net assets applicable to outstanding shares
|
$
|
12,576,016
|
||
|
Shares issued and outstanding
|
670,273
|
|||
|
Net asset value, offering price, and redemption price per share
|
$
|
18.76
|
||
The accompanying notes are an integral part of these financial statements.
|
WWW.HENNESSYFUNDS.COM
|
12
|
STATEMENT OF ASSETS AND LIABILITIES/STATEMENT OF OPERATIONS
|
Financial Statements
|
Statement of Operations for the year ended October 31, 2023
|
|
INVESTMENT INCOME:
|
||||
|
Dividend income
|
$
|
1,164,455
|
||
|
Interest income
|
122,299
|
|||
|
Total investment income
|
1,286,754
|
|||
|
EXPENSES:
|
||||
|
Investment advisory fees (See Note 5)
|
336,344
|
|||
|
Sub-transfer agent expenses – Investor Class (See Note 5)
|
38,906
|
|||
|
Sub-transfer agent expenses – Institutional Class (See Note 5)
|
20,133
|
|||
|
Administration, accounting, custody, and transfer agent fees (See Note 5)
|
46,217
|
|||
|
Federal and state registration fees
|
31,958
|
|||
|
Distribution fees – Investor Class (See Note 5)
|
30,385
|
|||
|
Audit fees
|
22,747
|
|||
|
Compliance expense (See Note 5)
|
22,664
|
|||
|
Service fees – Investor Class (See Note 5)
|
20,257
|
|||
|
Trustees’ fees and expenses
|
20,020
|
|||
|
Reports to shareholders
|
10,435
|
|||
|
Legal fees
|
1,749
|
|||
|
Other expenses
|
11,176
|
|||
|
Total expenses
|
612,991
|
|||
|
NET INVESTMENT INCOME
|
$
|
673,763
|
||
|
REALIZED AND UNREALIZED GAINS (LOSSES):
|
||||
|
Net realized loss on investments:
|
$
|
(3,665,381
|
)
|
|
|
Net change in unrealized appreciation/deprecation on investments:
|
(4,861,309
|
)
|
||
|
Net loss on investments
|
(8,526,690
|
)
|
||
|
NET DECREASE IN NET ASSETS RESULTING FROM OPERATIONS
|
$
|
(7,852,927
|
)
|
|
The accompanying notes are an integral part of these financial statements.
|
HENNESSY FUNDS
|
1-800-966-4354
|
13
(This Page Intentionally Left Blank.)
|
WWW.HENNESSYFUNDS.COM
|
14
|
STATEMENTS OF CHANGES IN NET ASSETS
|
Financial Statements
|
Statements of Changes in Net Assets
|
|
Year Ended
|
Year Ended
|
|||||||
|
October 31, 2023
|
October 31, 2022
|
|||||||
|
OPERATIONS:
|
||||||||
|
Net investment income
|
$
|
673,763
|
$
|
415,244
|
||||
|
Net realized gain (loss) on investments
|
(3,665,381
|
)
|
3,448,215
|
|||||
|
Net change in unrealized
|
||||||||
|
appreciation/depreciation on investments
|
(4,861,309
|
)
|
(23,178,978
|
)
|
||||
|
Net decrease in net assets resulting from operations
|
(7,852,927
|
)
|
(19,315,519
|
)
|
||||
|
DISTRIBUTIONS TO SHAREHOLDERS:
|
||||||||
|
Distributable earnings – Investor Class
|
(1,558,247
|
)
|
(1,687,916
|
)
|
||||
|
Distributable earnings – Institutional Class
|
(1,514,267
|
)
|
(1,797,726
|
)
|
||||
|
Total distributions
|
(3,072,514
|
)
|
(3,485,642
|
)
|
||||
|
CAPITAL SHARE TRANSACTIONS:
|
||||||||
|
Proceeds from shares subscribed – Investor Class
|
760,547
|
2,685,032
|
||||||
|
Proceeds from shares subscribed – Institutional Class
|
1,148,806
|
11,877,575
|
||||||
|
Dividends reinvested – Investor Class
|
1,514,582
|
1,636,787
|
||||||
|
Dividends reinvested – Institutional Class
|
1,483,154
|
1,782,399
|
||||||
|
Cost of shares redeemed – Investor Class
|
(3,144,689
|
)
|
(6,195,638
|
)
|
||||
|
Cost of shares redeemed – Institutional Class
|
(7,157,957
|
)
|
(14,692,333
|
)
|
||||
|
Net decrease in net assets derived
|
||||||||
|
from capital share transactions
|
(5,395,557
|
)
|
(2,906,178
|
)
|
||||
|
TOTAL DECREASE IN NET ASSETS
|
(16,320,998
|
)
|
(25,707,339
|
)
|
||||
|
NET ASSETS:
|
||||||||
|
Beginning of year
|
45,776,591
|
71,483,930
|
||||||
|
End of year
|
$
|
29,455,593
|
$
|
45,776,591
|
||||
|
CHANGES IN SHARES OUTSTANDING:
|
||||||||
|
Shares sold – Investor Class
|
38,167
|
92,861
|
||||||
|
Shares sold – Institutional Class
|
54,558
|
380,400
|
||||||
|
Shares issued to holders as reinvestment
|
||||||||
|
of dividends – Investor Class
|
66,892
|
50,270
|
||||||
|
Shares issued to holders as reinvestment
|
||||||||
|
of dividends – Institutional Class
|
64,811
|
54,242
|
||||||
|
Shares redeemed – Investor Class
|
(148,352
|
)
|
(221,850
|
)
|
||||
|
Shares redeemed – Institutional Class
|
(331,352
|
)
|
(536,409
|
)
|
||||
|
Net decrease in shares outstanding
|
(255,276
|
)
|
(180,486
|
)
|
||||
The accompanying notes are an integral part of these financial statements.
|
HENNESSY FUNDS
|
1-800-966-4354
|
15
Financial Statements
|
Financial Highlights
|
For an Investor Class share outstanding throughout each year
PER SHARE DATA:
Net asset value, beginning of year
Income from investment operations:
Net investment income (loss)(1)
Net realized and unrealized gains (losses) on investments
Total from investment operations
Less distributions:
Dividends from net investment income
Dividends from net realized gains
Total distributions
Net asset value, end of year
TOTAL RETURN
SUPPLEMENTAL DATA AND RATIOS:
Net assets, end of year (millions)
Ratio of expenses to average net assets
Ratio of net investment income (loss) to average net assets
Portfolio turnover rate(2)
|
(1)
|
Calculated using the average shares outstanding method.
|
|
(2)
|
Calculated on the basis of the Fund as a whole.
|
The accompanying notes are an integral part of these financial statements.
|
WWW.HENNESSYFUNDS.COM
|
16
|
FINANCIAL HIGHLIGHTS — INVESTOR CLASS
|
|
Year Ended October 31,
|
||||||||||||||||||
|
2023
|
2022
|
2021
|
2020
|
2019
|
||||||||||||||
|
$
|
24.80
|
$
|
35.32
|
$
|
22.33
|
$
|
22.63
|
$
|
21.43
|
|||||||||
|
0.35
|
0.15
|
(0.15
|
)
|
(0.05
|
)
|
(0.05
|
)
|
|||||||||||
|
(4.92
|
)
|
(9.02
|
)
|
13.14
|
(0.25
|
)
|
1.84
|
|||||||||||
|
(4.57
|
)
|
(8.87
|
)
|
12.99
|
(0.30
|
)
|
1.79
|
|||||||||||
|
(0.13
|
)
|
—
|
—
|
—
|
—
|
|||||||||||||
|
(1.53
|
)
|
(1.65
|
)
|
—
|
—
|
(0.59
|
)
|
|||||||||||
|
(1.66
|
)
|
(1.65
|
)
|
—
|
—
|
(0.59
|
)
|
|||||||||||
|
$
|
18.57
|
$
|
24.80
|
$
|
35.32
|
$
|
22.33
|
$
|
22.63
|
|||||||||
|
-19.62
|
%
|
-26.22
|
%
|
58.17
|
%
|
-1.33
|
%
|
8.75
|
%
|
|||||||||
|
$
|
16.88
|
$
|
23.63
|
$
|
36.42
|
$
|
22.51
|
$
|
23.63
|
|||||||||
|
1.79
|
%
|
1.69
|
%
|
1.68
|
%
|
1.75
|
%
|
1.82
|
%
|
|||||||||
|
1.64
|
%
|
0.55
|
%
|
(0.47
|
)%
|
(0.21
|
)%
|
(0.23
|
)%
|
|||||||||
|
114
|
%
|
78
|
%
|
62
|
%
|
88
|
%
|
83
|
%
|
|||||||||
The accompanying notes are an integral part of these financial statements.
|
HENNESSY FUNDS
|
1-800-966-4354
|
17
Financial Statements
|
Financial Highlights
|
For an Institutional Class share outstanding throughout each year
PER SHARE DATA:
Net asset value, beginning of year
Income from investment operations:
Net investment income (loss)(1)
Net realized and unrealized gains (losses) on investments
Total from investment operations
Less distributions:
Dividends from net investment income
Dividends from net realized gains
Total distributions
Net asset value, end of year
TOTAL RETURN
SUPPLEMENTAL DATA AND RATIOS:
Net assets, end of year (millions)
Ratio of expenses to average net assets
Ratio of net investment income (loss) to average net assets
Portfolio turnover rate(2)
|
(1)
|
Calculated using the average shares outstanding method.
|
|
(2)
|
Calculated on the basis of the Fund as a whole.
|
The accompanying notes are an integral part of these financial statements.
|
WWW.HENNESSYFUNDS.COM
|
18
|
FINANCIAL HIGHLIGHTS — INSTITUTIONAL CLASS
|
|
Year Ended October 31,
|
||||||||||||||||||
|
2023
|
2022
|
2021
|
2020
|
2019
|
||||||||||||||
|
$
|
25.11
|
$
|
35.63
|
$
|
22.44
|
$
|
22.68
|
$
|
21.39
|
|||||||||
|
0.43
|
0.25
|
(0.03
|
)
|
0.02
|
0.01
|
|||||||||||||
|
(4.99
|
)
|
(9.10
|
)
|
13.22
|
(0.26
|
)
|
1.87
|
|||||||||||
|
(4.56
|
)
|
(8.85
|
)
|
13.19
|
(0.24
|
)
|
1.88
|
|||||||||||
|
(0.24
|
)
|
—
|
—
|
—
|
—
|
|||||||||||||
|
(1.55
|
)
|
(1.67
|
)
|
—
|
—
|
(0.59
|
)
|
|||||||||||
|
(1.79
|
)
|
(1.67
|
)
|
—
|
—
|
(0.59
|
)
|
|||||||||||
|
$
|
18.76
|
$
|
25.11
|
$
|
35.63
|
$
|
22.44
|
$
|
22.68
|
|||||||||
|
-19.41
|
%
|
-25.95
|
%
|
58.78
|
%
|
-1.06
|
%
|
9.16
|
%
|
|||||||||
|
$
|
12.58
|
$
|
22.15
|
$
|
35.06
|
$
|
21.15
|
$
|
21.97
|
|||||||||
|
1.46
|
%
|
1.33
|
%
|
1.32
|
%
|
1.45
|
%
|
1.43
|
%
|
|||||||||
|
1.99
|
%
|
0.89
|
%
|
(0.11
|
)%
|
0.08
|
%
|
0.05
|
%
|
|||||||||
|
114
|
%
|
78
|
%
|
62
|
%
|
88
|
%
|
83
|
%
|
|||||||||
The accompanying notes are an integral part of these financial statements.
|
HENNESSY FUNDS
|
1-800-966-4354
|
19
Financial Statements
|
Notes to the Financial Statements October 31, 2023
|
1). ORGANIZATION
The Hennessy Large Cap Financial Fund (the “Fund”) is a series of Hennessy Funds Trust (the “Trust”), which was organized as a Delaware statutory trust on September 17, 1992. The Fund is an open-end
management investment company registered under the Investment Company Act of 1940, as amended. The investment objective of the Fund is capital appreciation. The Fund is a non-diversified fund.
The Fund offers Investor Class and Institutional Class shares. Each class of shares differs principally in its respective 12b-1 distribution and service, shareholder servicing, and
sub-transfer agent expenses. There are no sales charges. Each class has identical rights to earnings, assets, and voting privileges, except for class-specific expenses and exclusive rights to vote on matters affecting only one class.
As an investment company, the Fund follows the investment company accounting and reporting guidance of the Financial Accounting Standards Board (the “FASB”) Accounting Standard
Codification Topic 946 “Financial Services—Investment Companies.”
2). SIGNIFICANT ACCOUNTING POLICIES
The following is a summary of significant accounting policies consistently followed by the Fund in the preparation of the financial statements. These policies conform to U.S. generally accepted accounting
principles (“GAAP”).
|
a).
|
Securities Valuation – All investments in securities are valued in accordance with the Fund’s valuation policies and procedures, as described in Note 3.
|
|
b).
|
Federal Income Taxes – The Fund has elected to be taxed as a regulated investment company and intends to distribute substantially all of its taxable income to its shareholders and otherwise comply
with the provisions of the Internal Revenue Code of 1986, as amended, applicable to regulated investment companies. As a result, the Fund has made no provision for federal income taxes or excise taxes. Net investment
income/loss and realized gains/losses for federal income tax purposes may differ from those reported in the financial statements because of temporary book-basis and tax-basis differences. Temporary differences are primarily
the result of the treatment of wash sales for tax reporting purposes. The Fund recognizes interest and penalties related to income tax benefits, if any, in the Statement of Operations as an income tax expense. Distributions
from net realized gains for book purposes may include short-term capital gains, which are included as ordinary income to shareholders for tax purposes. The Fund may utilize equalization accounting for tax purposes and
designate earnings and profits, including net realized gains distributed to shareholders on redemption of shares, as part of the dividends paid deduction for income tax purposes.
|
|
Due to inherent differences in the recognition of income, expenses, and realized gains/losses under GAAP and federal income tax
regulations, permanent differences between book and tax basis for reporting are identified and appropriately reclassified in the Statement of Assets and Liabilities, as needed. As of October 31, 2023, no such reclassifications
were required for fiscal year 2023.
|
|
|
c).
|
Accounting for Uncertainty in Income Taxes – The Fund has accounting policies regarding recognition and measurement of tax positions taken or expected to be taken on a tax return. The tax returns of
the Fund for the prior three fiscal years are
|
|
WWW.HENNESSYFUNDS.COM
|
20
|
NOTES TO THE FINANCIAL STATEMENTS
|
|
open for examination. The Fund has reviewed all open tax years in major tax jurisdictions and concluded that there is no impact on the Fund’s net assets and no tax liability resulting from
unrecognized tax benefits relating to uncertain income tax positions taken or expected to be taken on a tax return. The Fund’s major tax jurisdictions are U.S. federal and Delaware.
|
|
|
d).
|
Income and Expenses – Dividend income is recognized on the ex-dividend date or as soon as information is available to the Fund. Interest income, which includes the amortization of premium and
accretion of discount, is recognized on an accrual basis. Market discounts, original issue discounts, and market premiums on debt securities are accreted or amortized to interest income over the life of a security with a
corresponding increase or decrease, as applicable, in the cost basis of such security using the yield-to-maturity method or, where applicable, the first call date of the security. Other non-cash dividends are recognized as
investment income at the fair value of the property received. The Fund is charged for those expenses that are directly attributable to its portfolio, such as advisory, administration, and certain shareholder service fees.
Income, expenses (other than expenses attributable to a specific class), and realized and unrealized gains/losses on investments are allocated to each class of shares based on such class’s net assets.
|
|
e).
|
Distributions to Shareholders – Dividends from net investment income for the Fund, if any, are declared and paid annually, usually in December. Distributions of net realized capital gains, if any,
are declared and paid annually, usually in December.
|
|
f).
|
Security Transactions – Investment and shareholder transactions are recorded on the trade date. The Fund determines the realized gain/loss from an investment transaction by comparing the original
cost of the security lot sold with the net sale proceeds. Discounts and premiums on securities purchased are accreted or amortized, respectively, over the life of each such security.
|
|
g).
|
Use of Estimates – Preparing financial statements in accordance with GAAP requires management to make estimates and assumptions that affect the reported amounts of assets and liabilities and
disclosure of contingent assets and liabilities at the date of the financial statements, as well as the reported change in net assets during the reporting period. Actual results could differ from those estimates.
|
|
h).
|
Share Valuation – The net asset value (“NAV”) per share of the Fund is calculated by dividing (i) the total value of the securities held by the Fund, plus cash and other assets, minus all liabilities
(including estimated accrued expenses) by (ii) the total number of Fund shares outstanding, rounded to the nearest $0.01. Fund shares are not priced on days the New York Stock Exchange is closed for trading. The offering and
redemption price per share for the Fund is equal to the Fund’s NAV per share.
|
|
i).
|
Illiquid Securities – Pursuant to Rule 22e-4 under the 1940 Act, the Fund has adopted a Liquidity Risk Management Program (the “Liquidity Program”). The Liquidity Program requires, among other
things, that the Fund limit its illiquid investments to no more than 15% of its net assets. An illiquid investment is any investment that the Fund reasonably expects cannot be sold or disposed of by the Fund in current market
conditions in seven calendar days or less without the sale or disposition significantly changing the market value of the investment.
|
|
j).
|
Recent Accounting Pronouncements and Regulatory Updates – In October 2022, the Securities and Exchange Commission (“SEC”) adopted a final rule relating to Tailored Shareholder Reports for Mutual
Funds and Exchange-Traded Funds (ETFs); Fee Information in Investment Company Advertisements. The rule and form amendments will require mutual funds and ETFs to transmit concise and visually
|
|
HENNESSY FUNDS
|
1-800-966-4354
|
21
|
engaging shareholder reports that highlight key information. The amendments also will require that funds tag information in a structured data format. In addition, the rule amendments will require
that certain more in-depth information be made available online and available for delivery free of charge to investors on request. The amendments became effective January 24, 2023. There is an 18-month transition period after
the effective date of the amendment.
|
|
|
In June 2022, the FASB issued Accounting Standards Update (“ASU”) 2022-03, Fair Value Measurement (Topic 820): Fair Value
Measurement of Equity Securities Subject to Contractual Sale Restrictions. The ASU clarifies that a contractual restriction on the sale of an equity security is not considered part of the unit of account of the equity security
and, therefore, is not considered in measuring the fair value. The amendments also require additional disclosures related to equity securities subject to contractual sale restrictions. The ASU is effective for fiscal years
beginning after December 15, 2023, and interim periods within those fiscal years.
|
3). SECURITIES VALUATION
The Fund follows its valuation policies and procedures in determining its NAV and, in preparing these financial statements, the fair value accounting standards that establish an authoritative definition of
fair value and set out a hierarchy for measuring fair value. These standards require additional disclosures about the various inputs and valuation techniques used to develop the measurements of fair value and a discussion of changes
in valuation techniques and related inputs during the period. These inputs are summarized in the three broad levels listed below:
|
Level 1 –
|
Unadjusted, quoted prices in active markets for identical instruments that the Fund has the ability to access at the date of measurement.
|
|
|
Level 2 –
|
Other significant observable inputs other than quoted prices included in Level 1 (including, but not limited to, quoted prices in active markets for similar instruments, quoted prices in markets that
are not active for identical or similar instruments, and model-derived valuations in which all significant inputs and significant value drivers are observable in active markets, such as interest rates, prepayment speeds,
credit risk curves, default rates, and similar data).
|
|
|
Level 3 –
|
Significant unobservable inputs (including the Fund’s own assumptions about what market participants would use to price the asset or liability based on the best available information) when observable
inputs are unavailable.
|
The following is a description of the valuation techniques applied to the Fund’s major categories of assets and liabilities on a recurring basis:
|
Equity Securities – Equity securities, including common stocks, preferred stocks, foreign-issued common stocks, exchange-traded funds, closed-end mutual
funds, partnerships, rights, and real estate investment trusts, that are traded on a securities exchange for which a last-quoted sales price is readily available generally are valued at the last sales price as reported by the
primary exchange on which the securities are listed. Securities listed on The Nasdaq Stock Market (“Nasdaq”) generally are valued at the Nasdaq Official Closing Price, which may differ from the last sales price reported.
Securities traded on a securities exchange for which a last-quoted sales price is not readily available generally are valued at the mean between the bid and ask prices. To the extent these securities are actively traded and
valuation adjustments are not applied, they are classified in Level 1 of the fair value hierarchy. Securities traded on foreign exchanges generally are not valued at the same time the
|
|
WWW.HENNESSYFUNDS.COM
|
22
|
NOTES TO THE FINANCIAL STATEMENTS
|
|
Fund calculates its NAV because most foreign markets close well before such time. The earlier close of most foreign markets gives rise to the possibility that significant events, including broad
market moves, may have occurred in the interim. In certain circumstances, it may be determined that a foreign security needs to be fair valued because it appears that the value of the security might have been materially
affected by events occurring after the close of the market in which the security is principally traded, but before the time the Fund calculates its NAV, such as by a development that affects an entire market or region (e.g., a
weather-related event) or a potentially global development (e.g., a terrorist attack that may be expected to have an effect on investor expectations worldwide).
|
|
|
Registered Investment Companies – Investments in open-end registered investment companies, commonly referred to as mutual funds, generally are priced at the
ending NAV provided by the applicable mutual fund’s service agent and are classified in Level 1 of the fair value hierarchy.
|
|
|
Debt Securities – Debt securities, including corporate bonds, asset-backed securities, mortgage-backed securities, municipal bonds, U.S. Treasuries, and U.S.
government agency issues, are generally valued at market on the basis of valuations furnished by an independent pricing service that utilizes both dealer-supplied valuations and formula-based techniques. The pricing service
may consider recently executed transactions in securities of the issuer or comparable issuers, market price quotations (where observable), bond spreads, and fundamental data relating to the issuer. In addition, the model may
incorporate observable market data, such as reported sales of similar securities, broker quotes, yields, bids, offers, and reference data. Certain securities are valued primarily using dealer quotations. These securities are
generally classified in Level 2 of the fair value hierarchy.
|
|
|
Short-Term Securities – Short-term equity investments, including money market funds, are valued in the manner specified above for equity securities.
Short-term debt investments with an original term to maturity of 60 days or less are valued at amortized cost, which approximates fair market value. If the original term to maturity of a short-term debt investment exceeds 60
days, then the values as of the 61st day prior to maturity are amortized. Amortized cost is not used if its use would be inappropriate due to credit or other impairments of the issuer, in which case the security’s fair value
would be determined as described below. Short-term securities are generally classified in Level 1 or Level 2 of the fair value hierarchy depending on the inputs used and market activity levels for specific securities.
|
If market quotations are not readily available or if a significant event has occurred that indicates the closing price of a security no longer represents the true value of that security,
any security or other asset will be valued at its fair value in accordance with Rule 2a-5 under the 1940 Act. The Board of Trustees of the Fund (the “Board”) has designated Hennessy Advisors, Inc. (the “Advisor”) as the Fund’s
valuation designee to make all fair value determinations with respect to the Fund’s portfolio investments under the Fund’s fair value pricing procedures, subject to the Board’s oversight. There are numerous criteria considered in
determining a fair value of a security, such as the trading volume of a security and markets, the values of other similar securities, and news events with direct bearing on a security or markets. Fair value pricing results in an
estimated price for a security that reflects the amount the Fund might reasonably expect to receive in a current sale. Depending on the relative significance of the valuation inputs, these securities may be classified in either Level
2 or Level 3 of the fair value hierarchy. The Advisor will
|
HENNESSY FUNDS
|
1-800-966-4354
|
23
regularly evaluate whether the Fund’s fair value pricing procedures continue to be appropriate in light of the specific circumstances of the Fund and the quality of prices obtained through their application
of such procedures.
The fair value of foreign securities may be determined with the assistance of a pricing service using correlations between the movement of prices of such securities and indices of domestic
securities and other appropriate indicators, such as closing market prices of relevant American Depositary Receipts or futures contracts. Using fair value pricing means that the Fund’s NAV reflects the affected portfolio securities’
values as determined by the Advisor, the Board’s valuation designee, pursuant to the Fund’s fair value pricing procedures, instead of being determined by the market. Using a fair value pricing methodology to price a foreign security
may result in a value that is different from such foreign security’s most recent closing price and from the value used by other investment companies to calculate their NAVs. Such securities are generally classified in Level 2 of the
fair value hierarchy. Because the Fund may invest in foreign securities, the value of the Fund’s portfolio securities may change on days when a shareholder is unable to purchase or redeem Fund shares.
The Fund has performed an analysis of all existing investments to determine the significance and character of all inputs to their fair value determinations. Various inputs are used to
determine the value of the Fund’s investments. The inputs or methodology used for valuing securities are not necessarily an indication of the risk associated with investing in those securities. Details related to the fair value
hierarchy of the Fund’s securities as of October 31, 2023, are included in the Schedule of Investments.
4). INVESTMENT TRANSACTIONS
Purchases and sales of investment securities (excluding government and short-term investments) for the Fund during fiscal year 2023 were $39,902,719 and $49,396,884, respectively.
There were no purchases or sales/maturities of long-term U.S. government securities for the Fund during fiscal year 2023.
5). INVESTMENT ADVISORY FEE AND OTHER TRANSACTIONS WITH AFFILIATES
The Advisor provides the Fund with investment advisory services under an Investment Advisory Agreement. The Advisor furnishes all investment advice, office space, and facilities and most of the personnel
needed by the Fund. As compensation for its services, the Advisor is entitled to a monthly fee from the Fund. The fee is based on the average daily net assets of the Fund at an annual rate of 0.90%. The net investment advisory fees
expensed by the Fund during fiscal year 2023 are included in the Statement of Operations.
The Board has approved a Shareholder Servicing Agreement for Investor Class shares of the Fund, which compensates the Advisor for the non-investment advisory services it provides to the
Fund. The Shareholder Servicing Agreement provides for a monthly fee paid to the Advisor at an annual rate of 0.10% of the average daily net assets of the Fund attributable to Investor Class shares. The shareholder service fees
expensed by the Fund during fiscal year 2023 are included in the Statement of Operations.
The Fund has adopted a plan pursuant to Rule 12b-1 under the Investment Company Act of 1940, as amended, that authorizes payments in connection with the distribution of Fund shares at an
annual rate of up to 0.25% of the Fund’s average daily net assets attributable to Investor Class shares. Even though the authorized rate is up to 0.25%, the Fund is currently only using up to 0.15% of its average daily net assets
attributable to Investor Class shares for such purpose. Amounts paid under the plan may
|
WWW.HENNESSYFUNDS.COM
|
24
|
NOTES TO THE FINANCIAL STATEMENTS
|
be spent on any activities or expenses primarily intended to result in the sale of shares, including, but not limited to, advertising, shareholder account servicing, printing and mailing of prospectuses to
other than current shareholders, printing and mailing of sales literature, and compensation for sales and marketing activities or to financial institutions and others, such as dealers and distributors. The distribution fees expensed
by the Fund during fiscal year 2023 are included in the Statement of Operations.
The Fund has entered into agreements with various brokers, dealers, and financial intermediaries in connection with the sale of Fund shares. The agreements provide for periodic payments of
sub-transfer agent expenses by the Fund to the brokers, dealers, and financial intermediaries for providing certain shareholder maintenance services. These shareholder services include the pre-processing and quality control of new
accounts, shareholder correspondence, answering customer inquiries regarding account status, and facilitating shareholder telephone transactions. The sub-transfer agent fees expensed by the Fund during fiscal year 2023 are included in
the Statement of Operations.
U.S. Bancorp Fund Services, LLC, d/b/a U.S. Bank Global Fund Services (“Fund Services”) provides the Fund with administrative, accounting, and transfer agent services. As administrator,
Fund Services is responsible for activities such as (i) preparing various federal and state regulatory filings, reports, and returns for the Fund, (ii) preparing reports and materials to be supplied to the Board, (iii) monitoring the
activities of the Fund’s custodian, transfer agent, and accountants, and (iv) coordinating the preparation and payment of the Fund’s expenses and reviewing the Fund’s expense accruals. U.S. Bank N.A., an affiliate of Fund Services,
serves as the Fund’s custodian. The servicing agreements between the Trust, Fund Services, and U.S. Bank N.A. contain a fee schedule that is inclusive of administrative, accounting, custody, and transfer agent fees. The
administrative, accounting, custody, and transfer agent fees expensed by the Fund during fiscal year 2023 are included in the Statement of Operations.
Quasar Distributors, LLC, a wholly owned broker-dealer subsidiary of Foreside Financial Group, LLC, acts as the Fund’s principal underwriter in a continuous public offering of Fund shares.
The officers of the Fund are affiliated with the Advisor. With the exception of the Chief Compliance Officer, such officers receive no compensation from the Fund for serving in their
respective roles. The Fund, along with the other funds in the Hennessy Funds family (collectively, the “Hennessy Funds”), makes reimbursement payments on an equal basis to the Advisor for a portion of the salary and benefits
associated with the office of the Chief Compliance Officer. The compliance fees expensed by the Fund during fiscal year 2023 for reimbursement payments to the Advisor are included in the Statement of Operations.
6). GUARANTEES AND INDEMNIFICATIONS
Under the Hennessy Funds’ organizational documents, their officers and trustees are indemnified by the Hennessy Funds against certain liabilities arising out of the performance of their duties to the
Hennessy Funds. Additionally, in the normal course of business, the Hennessy Funds enter into contracts with service providers that contain general indemnification clauses. The Fund’s maximum exposure under these arrangements is
unknown as this would involve future claims that may be made against the Fund that have not yet occurred. Currently, the Fund expects the risk of loss to be remote.
|
HENNESSY FUNDS
|
1-800-966-4354
|
25
7). LINE OF CREDIT
The Fund has an uncommitted line of credit with the other Hennessy Funds in the amount of the lesser of (i) $100,000,000 or (ii) 33.33% of each Hennessy Fund’s net assets, or 30% for the Hennessy Gas Utility
Fund, the Hennessy Japan Fund, and the Hennessy Japan Small Cap Fund and 10% for the Hennessy Balanced Fund. The line of credit is intended to provide any necessary short-term financing in connection with shareholder redemptions,
subject to certain restrictions. The credit facility is with the Hennessy Funds’ custodian bank, U.S. Bank N.A. Borrowings under this arrangement bear interest at the bank’s prime rate and are secured by all of the Fund’s assets (as
to its own borrowings only). During fiscal year 2023, the Fund did not have any borrowings outstanding under the line of credit.
8). FEDERAL TAX INFORMATION
As of October 31, 2023, the components of accumulated earnings (losses) for income tax purposes were as follows:
|
Investments
|
|||||
|
Cost of investments for tax purposes
|
$
|
30,980,881
|
|||
|
Gross tax unrealized appreciation
|
$
|
4,621,781
|
|||
|
Gross tax unrealized depreciation
|
(5,961,253
|
)
|
|||
|
Net tax unrealized appreciation/(depreciation)
|
$
|
(1,339,472
|
)
|
||
|
Undistributed ordinary income
|
$
|
462,310
|
|||
|
Undistributed long-term capital gains
|
—
|
||||
|
Total distributable earnings
|
$
|
462,310
|
|||
|
Other accumulated gain/(loss)
|
$
|
(2,567,969
|
)
|
||
|
Total accumulated gain/(loss)
|
$
|
(3,445,131
|
)
|
||
The difference between book-basis unrealized appreciation/depreciation and tax-basis unrealized appreciation/depreciation (as shown above) is attributable primarily to wash sales.
As of October 31, 2023, the Fund had $2,567,969 in unlimited short-term capital loss carryforwards.
Capital losses sustained in or after fiscal year 2012 can be carried forward indefinitely, but any such loss retains the character of the original loss and must be utilized prior to any
loss incurred before fiscal year 2012. As a result of this ordering rule, capital loss carryforwards incurred prior to fiscal year 2012 may be more likely to expire unused. Capital losses sustained prior to fiscal year 2012 can be
carried forward for eight years and can be carried forward as short-term capital losses regardless of the character of the original loss.
As of October 31, 2023, the Fund did not defer, on a tax basis, any late-year ordinary losses. Late-year ordinary losses are net ordinary losses incurred after December 31, 2022, but
within the taxable year, that are deemed to arise on the first day of the Fund’s next taxable year.
During fiscal years 2023 and 2022, the tax character of distributions paid by the Fund was as follows:
|
Year Ended
|
Year Ended
|
||||||||
|
October 31, 2023
|
October 31, 2022
|
||||||||
|
Ordinary income(1)
|
$
|
338,619
|
$
|
—
|
|||||
|
Long-term capital gains
|
2,733,895
|
3,485,642
|
|||||||
|
Total distributions
|
$
|
3,072,514
|
$
|
3,485,642
|
|||||
|
(1) Ordinary income includes short-term capital gains.
|
|||||||||
|
WWW.HENNESSYFUNDS.COM
|
26
|
NOTES TO THE FINANCIAL STATEMENTS
|
9). GLOBAL EVENTS
A rise in protectionist trade policies, the possibility of a national or global recession, risks associated with pandemic and epidemic diseases, trade tensions, the possibility of changes to some
international trade agreements, political events, and continuing political tension and armed conflicts may adversely impact financial markets and the broader economy. For example, ongoing armed conflicts between Ukraine and Russia in
Europe and among Israel, Hamas, and other militant groups in the Middle East have caused and could continue to cause significant market disruptions and volatility with the markets in Europe and the Middle East, and have had negative
impacts on markets in the United States. These events could also have negative effects on the Fund’s investments that cannot be foreseen at the present time. As global systems, economies and financial markets are increasingly
interconnected, events that once had only local impact are now more likely to have regional or even global effects. Events that occur in one country, region or financial market will, more frequently, adversely impact issuers in other
countries, regions, or markets. These impacts can be exacerbated by failures of governments and societies to adequately respond to an emerging event or threat. Your investment would be negatively impacted if the value of your
portfolio holdings decreases as a result of such events, if these events adversely impact the operations and effectiveness of the Advisor or other key service providers or if these events disrupt systems and processes necessary or
beneficial to the management of accounts. These events may negatively impact broad segments of businesses and populations and could have a significant and rapid negative impact on the performance of the Fund’s investments, increase
the Fund’s volatility, or exacerbate pre-existing risks to the Fund.
10). EVENTS SUBSEQUENT TO YEAR END
Management has evaluated the Fund’s related events and transactions that occurred subsequent to October 31, 2023, through the date of issuance of the Fund’s financial statements. Management has determined
that there were no subsequent events requiring recognition or disclosure in the financial statements.
|
HENNESSY FUNDS
|
1-800-966-4354
|
27
Report of Independent Registered Public
Accounting Firm
To the Board of Trustees of Hennessy Funds Trust
and the shareholders of the Hennessy Large Cap Financial Fund
Novato, CA
Opinion on the Financial Statements
We have audited the accompanying statement of assets and liabilities of the Hennessy Large Cap Financial Fund (the “Fund”), a series of Hennessy Funds Trust, including the schedule of investments, as of
October 31, 2023, the related statement of operations for the year then ended, the statements of changes in net assets for each of the two years in the period then ended, financial highlights for each of the five years in the period
then ended, and the related notes (collectively referred to as the “financial statements”). In our opinion, the financial statements present fairly, in all material respects, the financial position of the Fund as of October 31, 2023,
the results of its operations for the year then ended, the changes in its net assets for each of the two years in the period then ended, and the financial highlights for each of the five years in the period then ended, in conformity
with accounting principles generally accepted in the United States of America.
Basis for Opinion
These financial statements are the responsibility of the Fund’s management. Our responsibility is to express an opinion on the Fund’s financial statements based on our audits. We are a public accounting firm
registered with the Public Company Accounting Oversight Board (United States) (“PCAOB”) and are required to be independent with respect to the Fund in accordance with the U.S. federal securities laws and the applicable rules and
regulations of the Securities and Exchange Commission and the PCAOB. We have served as the auditor of one or more of the funds in the Trust since 2002.
We conducted our audits in accordance with the standards of the PCAOB. Those standards require that we plan and perform the audit to obtain reasonable assurance about whether the financial statements are
free of material misstatement, whether due to error or fraud. The Fund is not required to have, nor were we engaged to perform, an audit of its internal control over financial reporting. As part of our audits we are required to obtain
an understanding of internal control over financial reporting, but not for the purpose of expressing an opinion on the effectiveness of the Fund’s internal control over financial reporting. Accordingly, we express no such opinion.
Our audits included performing procedures to assess the risks of material misstatement of the financial statements, whether due to error or fraud, and performing procedures that respond to those risks. Such
procedures included examining, on a test basis, evidence regarding the amounts and disclosures in the financial statements. Our audits also included evaluating the accounting principles used and significant estimates made by
management, as well as evaluating the overall presentation of the financial statements. Our procedures included confirmation of securities owned as of October 31, 2023 by correspondence with the custodian and brokers; when replies
were not received from brokers, we performed other auditing procedures. We believe that our audits provide a reasonable basis for our opinion.
|
|
|
TAIT, WELLER & BAKER LLP
|
Philadelphia, Pennsylvania
December 22, 2023
|
WWW.HENNESSYFUNDS.COM
|
28
|
REPORT OF INDEPENDENT REGISTERED PUBLIC ACCOUNTING FIRM/TRUSTEES AND OFFICERS
|
Trustees and Officers of the Fund (Unaudited)
The business and affairs of the Funds are managed under the direction of the Board of Trustees of the Trust, and the Board of Trustees elects the officers of the Trust (“Officers”). From time to time, the
Board of Trustees also has appointed advisers to the Board of Trustees (“Advisers”) with the intention of having qualified individuals serve in an advisory capacity to garner experience in the mutual fund and asset management industry
and be considered as potential Trustees in the future. There are currently two Advisers, Brian Alexander and A.J. Hennessy. As Advisers, Mr. Alexander and Mr. A.J. Hennessy attend meetings of the Board of Trustees and act as
non-voting participants. Information pertaining to the Trustees, Advisers, and the Officers of the Trust is set forth below. The Trustees and Officers serve until their successors are duly elected and qualified or until their earlier
death, resignation, or removal. Each Trustee oversees all 17 Hennessy Funds. Unless otherwise indicated, the address of all persons listed below is 7250 Redwood Boulevard, Suite 200, Novato, CA 94945. The Fund’s Statement of
Additional Information includes more information about the persons listed below and is available without charge by calling 800-966-4354 or by visiting www.hennessyfunds.com.
|
Other
|
|||
|
Directorships
|
|||
|
Held Outside
|
|||
|
Name, Age,
|
of Fund
|
||
|
and Position Held
|
Start Date
|
Principal Occupation(s)
|
Complex During
|
|
with the Trust
|
of Service
|
During Past Five Years
|
Past Five Years
|
|
Disinterested Trustees(1) and Disinterested Advisers
|
|||
|
J. Dennis DeSousa
|
January 1996
|
Mr. DeSousa is a real estate investor.
|
None.
|
|
87
|
|||
|
Trustee
|
|||
|
Robert T. Doyle
|
January 1996
|
Mr. Doyle is retired. He served as the
|
None.
|
|
76
|
Sheriff of Marin County, California
|
||
|
Trustee
|
from 1996 to June 2022.
|
||
|
Doug Franklin
|
March 2016
|
Mr. Franklin is a retired insurance
|
None.
|
|
59
|
as an Adviser
|
industry executive. From 1987
|
|
|
Trustee
|
to the Board
|
through 2015, he was employed by
|
|
|
and June 2023
|
the Allianz-Fireman’s Fund Insurance
|
||
|
as a Trustee
|
Company in various positions,
|
||
|
including as its Chief Actuary and
|
|||
|
Chief Risk Officer.
|
|||
|
Claire Garvie
|
December 2015
|
Ms. Garvie is a founder of Kiosk and
|
None.
|
|
49
|
as an Adviser
|
has served as its Chief Operating
|
|
|
Trustee
|
to the Board and
|
Officer since 2004. Kiosk is a
|
|
|
December 2021
|
full-service marketing agency with
|
||
|
as a Trustee
|
offices in the San Francisco Bay Area
|
||
|
and Liverpool, UK and staff across
|
|||
|
nine states in the U.S.
|
|||
|
HENNESSY FUNDS
|
1-800-966-4354
|
29
|
Other
|
|||
|
Directorships
|
|||
|
Held Outside
|
|||
|
Name, Age,
|
of Fund
|
||
|
and Position Held
|
Start Date
|
Principal Occupation(s)
|
Complex During
|
|
with the Trust
|
of Service
|
During Past Five Years
|
Past Five Years
|
|
Gerald P. Richardson
|
May 2004
|
Mr. Richardson is an independent
|
None.
|
|
78
|
consultant in the securities industry.
|
||
|
Trustee
|
|||
|
Brian Alexander
|
March 2015
|
Mr. Alexander has served as the
|
None.
|
|
42
|
Chief Operating Officer of Solis
|
||
|
Adviser to the Board
|
Mammography since March 2023.
|
||
|
Prior to that, he worked for the
|
|||
|
Sutter Health organization from
|
|||
|
2011 to 2023 in various positions.
|
|||
|
He served as the Chief Executive
|
|||
|
Officer of the North Valley Hospital
|
|||
|
Area from 2021 to March 2023.
|
|||
|
From 2018 to 2021, he served as the
|
|||
|
Chief Executive Officer of Sutter
|
|||
|
Roseville Medical Center. From 2016
|
|||
|
through 2018, he served as the Vice
|
|||
|
President of Strategy for the Sutter
|
|||
|
Health Valley Area, which includes
|
|||
|
11 hospitals, 13 ambulatory surgery
|
|||
|
centers, 16,000 employees, and
|
|||
|
1,900 physicians.
|
|||
|
Interested Trustee and Interested Adviser(2)
|
|||
|
Neil J. Hennessy
|
January 1996 as
|
Mr. Neil Hennessy has been employed
|
Hennessy
|
|
67
|
a Trustee and
|
by Hennessy Advisors, Inc. since
|
Advisors, Inc.
|
|
Chairman of the Board,
|
June 2008 as
|
1989 and currently serves as its
|
|
|
Chief Market Strategist,
|
an Officer
|
Chairman and Chief Executive Officer.
|
|
|
Portfolio Manager,
|
|||
|
and President
|
|||
|
A.J. Hennessy
|
December 2022
|
Mr. A.J. Hennessy has been employed
|
None.
|
|
37
|
by Hennessy Advisors, Inc. since 2011.
|
||
|
Adviser to the Board
|
|||
|
and Vice President,
|
|||
|
Corporate Development
|
|||
|
and Operations
|
|||
|
WWW.HENNESSYFUNDS.COM
|
30
|
TRUSTEES AND OFFICERS OF THE FUND
|
|
Name, Age,
|
||
|
and Position Held
|
Start Date
|
Principal Occupation(s)
|
|
with the Trust
|
of Service
|
During Past Five Years
|
|
Officers
|
||
|
Teresa M. Nilsen
|
January 1996
|
Ms. Nilsen has been employed by Hennessy Advisors, Inc.
|
|
57
|
since 1989 and currently serves as its President, Chief
|
|
|
Executive Vice President
|
Operating Officer, and Secretary.
|
|
|
and Treasurer
|
||
|
Daniel B. Steadman
|
March 2000
|
Mr. Steadman has been employed by Hennessy Advisors, Inc.
|
|
67
|
since 2000 and currently serves as its Executive Vice President.
|
|
|
Executive Vice President
|
||
|
and Secretary
|
||
|
Brian Carlson
|
December 2013
|
Mr. Carlson has been employed by Hennessy Advisors, Inc.
|
|
51
|
since December 2013 and currently serves as its Chief
|
|
|
Senior Vice President
|
Compliance Officer and Senior Vice President.
|
|
|
and Head of Distribution
|
||
|
David Ellison(3)
|
October 2012
|
Mr. Ellison has been employed by Hennessy Advisors, Inc.
|
|
65
|
since October 2012. He has served as a Portfolio Manager of
|
|
|
Senior Vice President
|
the Hennessy Large Cap Financial Fund and the Hennessy
|
|
|
and Portfolio Manager
|
Small Cap Financial Fund since their inception. Mr. Ellison also
|
|
|
served as a Portfolio Manager of the Hennessy Technology
|
||
|
Fund from its inception until February 2017. Mr. Ellison served
|
||
|
as Director, CIO, and President of FBR Fund Advisers, Inc.
|
||
|
from December 1999 to October 2012.
|
||
|
Jennifer Emerson(4)
|
June 2013
|
Ms. Emerson has been employed by Hennessy Advisors, Inc.
|
|
46
|
as its General Counsel since June 2013.
|
|
|
Senior Vice President and
|
||
|
Chief Compliance Officer
|
||
|
Ryan Kelley(5)
|
March 2013
|
Mr. Kelley has been employed by Hennessy Advisors, Inc. since
|
|
51
|
October 2012. He has served as Chief Investment Officer of the
|
|
|
Senior Vice President,
|
Hennessy Funds since March 2021 and has served as a Portfolio
|
|
|
Chief Investment Officer,
|
Manager of the Hennessy Gas Utility Fund, the Hennessy Large
|
|
|
and Portfolio Manager
|
Cap Financial Fund, and the Hennessy Small Cap Financial Fund
|
|
|
since October 2014. Mr. Kelley served as Co-Portfolio Manager
|
||
|
of these same funds from March 2013 through September
|
||
|
2014 and as a Portfolio Analyst for the Hennessy Funds from
|
||
|
October 2012 through February 2013. He has also served as a
|
||
|
Portfolio Manager of the Hennessy Cornerstone Growth Fund,
|
||
|
the Hennessy Cornerstone Mid Cap 30 Fund, the Hennessy
|
||
|
Cornerstone Large Growth Fund, and the Hennessy
|
||
|
Cornerstone Value Fund since February 2017 and as a Portfolio
|
||
|
Manager of the Hennessy Total Return Fund, the Hennessy
|
||
|
Balanced Fund, and the Hennessy Technology Fund since May
|
||
|
2018. He previously served as Co-Portfolio Manager of the
|
||
|
Hennessy Technology Fund from February 2017 until May 2018.
|
||
|
Mr. Kelley served as Portfolio Manager of FBR Fund
|
||
|
Advisers, Inc. from January 2008 to October 2012.
|
|
HENNESSY FUNDS
|
1-800-966-4354
|
31
|
Name, Age,
|
||
|
and Position Held
|
Start Date
|
Principal Occupation(s)
|
|
with the Trust
|
of Service
|
During Past Five Years
|
|
L. Joshua Wein(5)
|
September 2018
|
Mr. Wein has been employed by Hennessy Advisors, Inc. since
|
|
50
|
2018. He has served as Portfolio Manager of the Hennessy
|
|
|
Vice President and
|
Cornerstone Growth Fund, the Hennessy Cornerstone Mid Cap
|
|
|
Portfolio Manager
|
30 Fund, the Hennessy Cornerstone Large Growth Fund, the
|
|
|
Hennessy Cornerstone Value Fund, Hennessy Total Return Fund,
|
||
|
the Hennessy Balanced Fund, the Hennessy Gas Utility Fund,
|
||
|
and the Hennessy Technology Fund since February 2021, and
|
||
|
as the Co-Portfolio Manager of these Funds since February
|
||
|
2019. He served as a Senior Analyst of those same Funds from
|
||
|
September 2018 through February 2019. He also has served as
|
||
|
a Portfolio Manager of the Hennessy Energy Transition Fund
|
||
|
and the Hennessy Midstream Fund since January 2022.
|
||
|
Mr. Wein served as Director of Alternative Investments and
|
||
|
Co-Portfolio Manager at Sterling Capital Management
|
||
|
from 2008 to 2018.
|
_______________
|
(1)
|
The Funds have determined that Mr. DeSousa, Mr. Doyle, Mr. Franklin, Ms. Garvie, and Mr. Richardson are not interested persons, as defined in the 1940 Act, of the Investment
Manager or of any predecessor investment adviser for purposes of Section 15(f) of the 1940 Act.
|
|
(2)
|
Each of Neil J. Hennessy and A.J. Hennessy is considered an interested person, as defined in the 1940 Act, because he is an officer of the Trust.
|
|
(3)
|
The address of this officer is 101 Federal Street, Suite 1615B, Boston, MA 02110.
|
|
(4)
|
The address of this officer is 4800 Bee Caves Road, Suite 100, Austin, TX 78746.
|
|
(5)
|
The address of this officer is 1340 Environ Way, Chapel Hill, NC 27517.
|
|
WWW.HENNESSYFUNDS.COM
|
32
|
TRUSTEES AND OFFICERS OF THE FUND
|
(This Page Intentionally Left Blank.)
|
HENNESSY FUNDS
|
1-800-966-4354
|
33
Expense Example (Unaudited)
October 31, 2023
As a shareholder of the Fund, you incur ongoing costs, including management fees, service fees, and other Fund expenses. This Example is intended to help you understand your ongoing costs (in dollars) of
investing in the Fund and to compare these costs with the ongoing costs of investing in other investment funds. The Example is based on an investment of $1,000 invested at the beginning of the period and held for the entire period
from May 1, 2023, through October 31, 2023.
Actual Expenses
In the table below, the first line under each of the “Investor Class” and “Institutional Class” headings provides information about actual account values and actual expenses for each share class. You may use
this information, together with the amount you invested, to estimate the expenses that you paid over the period. Simply divide your account value by $1,000 (for example, an $8,600 account value divided by $1,000 = 8.6), then multiply
the result by the number in the first line under the heading “Expenses Paid During Period” to estimate the expenses you paid on your account during this period. Although the Fund charges no sales loads or transaction fees, you will be
assessed fees for outgoing wire transfers, returned checks, and stop payment orders at prevailing rates charged by U.S. Bank Global Fund Services, the Fund’s transfer agent. If you request that a redemption be made by wire transfer,
the Fund’s transfer agent charges a $15 fee. IRAs are charged a $15 annual maintenance fee (up to $30 maximum per shareholder for shareholders with multiple IRAs). The examples below include, but are not limited to, management,
shareholder servicing, accounting, custody, and transfer agent fees. However, the examples below do not include portfolio trading commissions and related expenses.
Hypothetical Example for Comparison Purposes
In the table below, the second line under each of the “Investor Class” and “Institutional Class” headings provides information about hypothetical account values and hypothetical expenses based on the Fund’s
actual expense ratio for each share class and an assumed rate of return of 5% per year before expenses, which is not the Fund’s actual return for such share class. The hypothetical account values and expenses may not be used to
estimate the actual ending account balance or expenses you paid for the period. You may use this information to compare the ongoing costs of investing in the Fund and other funds. To do so, compare these 5% hypothetical examples with
the 5% hypothetical examples that appear in the shareholder reports of the other funds. Please note that the expenses shown in the table are meant to highlight your ongoing costs only. Therefore, the second lines under “Investor
Class” and “Institutional Class” are useful in comparing ongoing costs only and will not help you determine the relative total costs of owning different funds.
|
WWW.HENNESSYFUNDS.COM
|
34
|
EXPENSE EXAMPLE
|
|
Expenses Paid
|
|||
|
Beginning
|
Ending
|
During Period(1)
|
|
|
Account Value
|
Account Value
|
May 1, 2023 –
|
|
|
May 1, 2023
|
October 31, 2023
|
October 31, 2023
|
|
|
Investor Class
|
|||
|
Actual
|
$1,000.00
|
$ 950.80
|
$8.95
|
|
Hypothetical (5% return before expenses)
|
$1,000.00
|
$1,016.03
|
$9.25
|
|
Institutional Class
|
|||
|
Actual
|
$1,000.00
|
$ 952.30
|
$7.33
|
|
Hypothetical (5% return before expenses)
|
$1,000.00
|
$1,017.69
|
$7.58
|
|
(1)
|
Expenses are equal to the Fund’s annualized expense ratio of 1.82% for Investor Class shares or 1.49% for Institutional Class shares, as applicable, multiplied by the average account value over the
period, multiplied by 184/365 days (to reflect the half-year period).
|
|
HENNESSY FUNDS
|
1-800-966-4354
|
35
How to Obtain a Copy of the Fund’s Proxy
Voting Policy and Proxy Voting Records
A description of the policies and procedures the Fund uses to determine how to vote proxies relating to portfolio securities is available without charge (1) by calling 800-966-4354, (2) on the Hennessy
Funds’ website at www.hennessyfunds.com/proxy-voting/voting-policy, or (3) on the U.S. Securities and Exchange Commission’s (the “SEC”) website at www.sec.gov. The Fund’s proxy voting record is available without charge on both the
Hennessy Funds’ website at www.hennessyfunds.com/proxy-voting/voting-record and the SEC’s website at www.sec.gov no later than August 31 for the prior 12 months ending June 30.
Availability of Quarterly Portfolio Schedule
The Fund files a complete schedule of portfolio holdings with the SEC for the first and third quarters of each fiscal year as an exhibit to its reports on Form N-PORT. The Fund’s Form N-PORT reports are
available on the SEC’s website at www.sec.gov or on request by calling 800-966-4354.
Federal Tax Distribution Information (Unaudited)
For fiscal year 2023, certain dividends paid by the Fund may be subject to a maximum tax rate of 23.8%, as provided for by the Jobs and Growth Tax Relief Reconciliation Act of 2003. The percentage of
dividends declared from ordinary income designated as qualified dividend income was 100.00%.
For corporate shareholders, the percent of ordinary income distributions that qualified for the corporate dividends received deduction for fiscal year 2023 was 100.00%.
The percentage of taxable ordinary income distributions that were designated as short-term capital gain distributions under Section 871(k)(2)(C) of the Internal Revenue Code of 1986, as
amended, for the Fund was 0.00%.
Important Notice Regarding Delivery
of Shareholder Documents
To help keep the Fund’s costs as low as possible, we generally deliver a single copy of shareholder reports, proxy statements, and prospectuses to shareholders who share an address and have the same
last name. This process does not apply to account statements. You may request an individual copy of a shareholder document at any time. If you would like to receive separate mailings of shareholder documents, please call U.S. Bank
Global Fund Services at 800-261-6950 or 414-765-4124, and individual delivery will begin within 30 days of your request. If your account is held through a financial institution or other intermediary, please contact such intermediary
directly to request individual delivery.
Electronic Delivery
As currently permitted by SEC regulations, the Fund’s shareholder reports are made available on a website, and unless you sign for eDelivery or elect to receive paper copies as detailed below, you will be
notified by mail each time a report is posted and provided with a website link to access the report.
To elect to receive paper copies of all future reports free of charge, please call U.S. Bank Global Fund Services at 800-261-6950 or 414-765-4124.
The Fund also offers shareholders the option to receive all notices, account statements, prospectuses, tax forms, and shareholder reports electronically. To sign up for eDelivery or change
your delivery preference, please visit www.hennessyfunds.com/account.
Shareholder reports transmitted after July 24, 2024, will comply with the new tailored shareholder reporting requirements, which require streamlined annual and semi-annual reports to
shareholders that highlight key information. These reports will be transmitted in paper unless a shareholder elects to receive reports electronically via eDelivery. To sign up for eDelivery, please visit
http://www.hennessyfunds.com/account.
Subscribe to receive our team’s unique market and sector insights delivered to your inbox
www.hennessyfunds.com/subscribe
Follow us on social media
| |
|
|
|
|
WWW.HENNESSYFUNDS.COM
|
36
|
PROXY VOTING — PRIVACY POLICY
|
Liquidity Risk Management Program
In accordance with Rule 22e-4 under the Investment Company Act of 1940, as amended (the “Liquidity Rule”), we have adopted and implemented a liquidity risk management program (the “Liquidity Program”). The
purpose of the Liquidity Program is to assess and manage the Fund’s liquidity risk, which is the risk that the Fund would not be able to meet requests to redeem Fund shares without significant dilution of the remaining shareholders’
interests in the Fund. The Board of Trustees of the Fund (the “Board”) designated a committee comprising representatives of Hennessy Advisors, Inc., the investment adviser to the Fund, as the administrator of the Liquidity Program
(the “Program Administrator”).
The Program Administrator provided a written report regarding the Liquidity Program to the Board in advance of its meeting on June 7, 2023. The report covered the period from June 1, 2022,
through May 31, 2023. The report addressed the operation of the Liquidity Program, assessed the adequacy and effectiveness of its implementation, and described any material changes to the Liquidity Program during the review period.
The Trust’s chief compliance officer presented the report to the Board at the meeting and provided additional information regarding the Liquidity Program. The Board reviewed the Liquidity Program and considered, among other items, the
following:
|
1.
|
The Program Administrator reviewed daily historical net redemption activity during the review period and during prior periods with higher-than-average redemption activity and concluded that the Fund
has historically been able to meet requests to redeem Fund shares without significant dilution to the Fund’s remaining shareholders, and the Program Administrator expects the Fund to be able to continue to do so in the future
during both normal and reasonably foreseeable stressed conditions.
|
|
|
2.
|
The Fund primarily holds assets that are highly liquid investments and is not required to establish a highly liquid investment minimum for the Fund or adopt policies and procedures for responding to
a highly liquid investment minimum shortfall.
|
|
|
3.
|
The Program Administrator did not make or recommend any material changes to the Liquidity Program during the review period.
|
|
|
4.
|
The Program Administrator concluded that the Liquidity Program was reasonably designed to assess and manage the Fund’s liquidity risk, complies with the requirements of the Liquidity Rule, and was
operating as intended during the review period.
|
Privacy Policy
We collect the following personal information about you:
|
1.
|
Information we receive from you in applications or other forms, correspondence, or conversations, including, but not limited to, your name, address, phone number, social security number, assets,
income, and date of birth;
|
|
|
2.
|
Information about your transactions with us, our affiliates, or others, including, but not limited to, your account number and balance, payments history, parties to transactions, cost basis
information, and other financial information; and
|
|
HENNESSY FUNDS
|
1-800-966-4354
|
37
|
3.
|
Other personal information we collect from various sources, even if you have not entered into a prior transaction with us, including the following:
|
|
•
|
Name, alias, address, unique personal identifier, online identifier, IP address, email address, telephone number, account name, and other similar identifiers;
|
||
|
•
|
Age and marital status;
|
||
|
•
|
Commercial information, including records of products purchased;
|
||
|
•
|
Browsing history, search history, and information on interaction with our website;
|
||
|
•
|
Geolocation data;
|
||
|
•
|
Employment and employment history, educational history, financial information, and purchasing and consuming histories or tendencies; and
|
||
|
•
|
Inferences drawn from the above-listed information to create a profile about your preferences, characteristics, predispositions, and behavior.
|
We collect this information directly from you, indirectly in the course of providing services to you, directly and indirectly from your activity on our website, from broker dealers,
marketing agencies, and other third parties that interact with us in connection with the services we perform and products we offer, and from anonymized and aggregated consumer information.
We use this information to fulfill the reason you provided the information to us, to provide you with other relevant products that you request from us, to provide you with information
about products that may interest you, to improve our website or present our website’s contents to you, and as otherwise described to you when collecting your personal information.
We do not disclose any personal information to unaffiliated third parties, except as permitted by law. We may disclose your personal information to our affiliates, vendors, and service
providers for a business purpose. For example, we are permitted by law to disclose all of the information we collect, as described above, to our transfer agent to process your transactions. When disclosing your personal information to
third parties, we enter into a contract with each third party describing the purpose of such disclosure and requiring that such personal information be kept confidential and not used for any purpose except to perform the services
contracted or respond to regulatory or law enforcement requests.
Furthermore, we restrict access to your personal information to those persons who require such information to provide products or services to you. As a result, we do not provide a means
for opting out of our limited sharing of your information. We maintain physical, electronic, and procedural safeguards that comply with federal standards to guard your personal information.
If you hold shares of the Funds through a financial intermediary, including, but not limited to, a broker-dealer, bank, or trust company, the privacy policy of your financial intermediary
governs how your personal information is shared with unaffiliated third parties.
If you live in a state such as California where the laws provide further privacy rights, we will not share information unless the law allows, and we will comply with the other
state-specific requirements.
|
WWW.HENNESSYFUNDS.COM
|
38
|
PRIVACY POLICY
|
Supplemental Privacy Notice for Residents of California
The California Consumer Privacy Act of 2018 (the “CCPA”) provides you, as a California resident, with certain additional rights relating to your personal information.
Under the CCPA, you have the right to request that we disclose to you the categories of personal information we have collected about you over the past 12 months, the categories of sources
of such information, our business purpose for collecting the information, the categories of third parties, if any, with whom we shared the information, and the specific information we have collected about you. You also have the right
to request that we delete any of your personal information, and, unless an exception applies, we will delete such information upon receiving and confirming your request. To make a request, call us at 1-800-966-4354, email us at
privacy@hennessyfunds.com, or go to www.hennessyfunds.com/contact. We will not discriminate against you for exercising your rights under the CCPA. Further, we will not collect additional categories of your personal information or use
the personal information we collected for materially different, unrelated, or incompatible purposes without providing you notice.
|
HENNESSY FUNDS
|
1-800-966-4354
|
39
(This Page Intentionally Left Blank.)
For information, questions, or assistance, please call
The Hennessy Funds
800-966-4354 or 415-899-1555
INVESTMENT ADVISOR
Hennessy Advisors, Inc.
7250 Redwood Boulevard, Suite 200
Novato, California 94945
ADMINISTRATOR,
TRANSFER AGENT,
DIVIDEND PAYING AGENT, &
SHAREHOLDER SERVICING AGENT
U.S. Bancorp Fund Services, LLC
d/b/a U.S. Bank Global Fund Services
P.O. Box 701
Milwaukee, Wisconsin 53201-0701
CUSTODIAN
U.S. Bank N.A.
Custody Operations
1555 North River Center Drive, Suite 302
Milwaukee, Wisconsin 53212
TRUSTEES
Neil J. Hennessy
Robert T. Doyle
J. Dennis DeSousa
Doug Franklin
Claire Garvie
Gerald P. Richardson
COUNSEL
Foley & Lardner LLP
777 East Wisconsin Avenue
Milwaukee, Wisconsin 53202-5306
INDEPENDENT REGISTERED
PUBLIC ACCOUNTING FIRM
Tait, Weller & Baker LLP
Two Liberty Place
50 South 16th Street, Suite 2900
Philadelphia, Pennsylvania 19102-2529
DISTRIBUTOR
Quasar Distributors, LLC
111 East Kilbourn Avenue, Suite 1250
Milwaukee, Wisconsin 53202
www.hennessyfunds.com | 800-966-4354
This report has been prepared for shareholders and may be distributed to
others only if preceded or accompanied by a current prospectus.
ANNUAL REPORT
OCTOBER 31, 2023
HENNESSY SMALL CAP FINANCIAL FUND
Investor Class HSFNX
Institutional Class HISFX
www.hennessyfunds.com | 1-800-966-4354
(This Page Intentionally Left Blank.)
Contents
|
Letter to Shareholders
|
2
|
|
|
Performance Overview
|
6
|
|
|
Financial Statements
|
||
|
Schedule of Investments
|
9
|
|
|
Statement of Assets and Liabilities
|
12
|
|
|
Statement of Operations
|
13
|
|
|
Statements of Changes in Net Assets
|
15
|
|
|
Financial Highlights
|
16
|
|
|
Notes to the Financial Statements
|
20
|
|
|
Report of Independent Registered Public Accounting Firm
|
28
|
|
|
Trustees and Officers of the Fund
|
29
|
|
|
Expense Example
|
34
|
|
|
Proxy Voting Policy and Proxy Voting Records
|
36
|
|
|
Availability of Quarterly Portfolio Schedule
|
36
|
|
|
Federal Tax Distribution Information
|
36
|
|
|
Important Notice Regarding Delivery of Shareholder Documents
|
36
|
|
|
Electronic Delivery
|
36
|
|
|
Liquidity Risk Management Program
|
37
|
|
|
Privacy Policy
|
37
|
|
HENNESSY FUNDS
|
1-800-966-4354
|
November 2023
Dear Hennessy Funds Shareholder:
Market Myopia: Tough Beginnings & Fantastic Finishes
During an interview this summer, I was reminded how important it is to maintain a long-term view of the market and investing and how easy it is to focus on the very recent past. In mid-July, when the
Nasdaq Composite Index was soaring to new 2023 highs and large-cap tech was once again dominating both returns and news headlines, the interviewer seemed confused – and somewhat disappointed – when I mentioned that even with 2023’s
stellar performance, the Nasdaq was negative if you included the prior year (2022) and that during that same time, utilities had outperformed. As of the time of writing this letter, a similar story can be seen when considering eight
technology giants: Microsoft, Tesla, Facebook (Meta), Apple, Amazon, Netflix, Nvidia, and Google, or “MT. FAANNG” as a much easier to
say (and remember) acronym.(1) MT. FAANNG is up on average a whopping 89.69% in 2023 on a total return basis as of November 7, 2023. However, this
same group was down -46.71% in 2022, a dismal year for large-cap tech. Due to the unforgiving nature of percentages, from the end of 2021 until now, this group of highflyers, believe it or not, is still down -3.14% on average,
despite an incredible 2023.
I like to call this phenomenon “market myopia.” Investors tend to be optimists, as am I. This makes it so much more comforting to forget the “tough beginnings” when
you’d rather remember the “fantastic finishes.” In continuing with the example above, unless you were an investor with prescient foresight, you likely didn’t sell all your MT. FAANNG stocks on January 4, 2022, as the market started
its correction, and you probably didn’t then buy them all back on September 30, 2022, when the market hit its low. An average investor’s experience would be much different than that. Which brings me to the point of all this: what
are some elements of our investment philosophy here at Hennessy Funds?
First, what about timing the market? Simply put, we don’t do it. As Neil Hennessy, our Chief Market Strategist and long-tenured Portfolio Manager, aptly put it,
“It’s not about timing the market, but rather about time in the market.” The long-term annualized return of the market, as measured by the Dow Jones
Industrial Average going back 104 years to 1920, is about 9.6%, and that number would be closer to 7-8% on a real return basis when factoring in inflation. If an investor is poorly timing when to enter and when to exit the market,
it would be very difficult to achieve similar, attractive returns to what they would experience simply by staying invested through a complete market cycle.
We are optimistic investors. We understand that some years or months may be tougher than others, but we tend to think in longer timeframes. An investor solely
invested in the Nasdaq might have looked at their portfolio at the end of 2022 and been extremely disappointed with a -32.51% return. But as Josh Wein, one of our Portfolio Managers with over 25 years of experience, pointed out,
“2022 was what 8% real returns look like.” In other words, with the year prior (2021) providing a +22.21% return and the year after (2023) hitting a +31.21% return, 2022’s dismal performance of -32.51% created an annualized total
return for the Nasdaq of 8.22% over the entire period (December 31, 2020, to November 7, 2023). Josh simply observed that while corrections happen over the course of a market cycle, it’s best not to panic by selling when stocks are
hitting new lows.
_______________
|
(1)
|
The acronym, MT. FAANNG, refers to the following companies: Microsoft Corporation, Tesla, Inc., Meta Platforms, Inc., Amazon.com, Inc., Apple, Inc., Netflix, Inc., NVIDIA Corporation, and Alphabet,
Inc.
|
|
WWW.HENNESSYFUNDS.COM
|
2
|
LETTER TO SHAREHOLDERS
|
Downside risk mitigation is relevant. While we normally remain fully invested within our individual funds, we seek to reduce risk through other means, including
sector diversification and investing in companies that exhibit strong fundamentals at compelling valuations. Dave Ellison, the long-tenured Portfolio Manager of our two financial funds, consistently reminds us, “Losing less money in
difficult markets is more important than making the most in rising ones.”
Finally, we are investors in companies, not traders of stocks. Many of our portfolios hold certain positions for long periods of time, a demonstration of the
Portfolio Managers’ convictions. In fact, both the Hennessy Focus Fund and the Hennessy Large Cap Financial Fund have held some positions for 25 years or more. We recognize that much of the performance of the Hennessy Funds comes
from the actual stocks we own (stock selection) and not from our weightings within certain sectors (sector allocation). Moving in and out of sectors can enhance performance, but it can also hinder it in the same way as market
timing, and it takes a significant number of correct “calls” regarding the macro-environment. We’d rather invest long term than rely on lucky calls. Our highly experienced energy funds Portfolio Manager, Ben Cook, summed up our
philosophy on the macro environment nicely: “While macro-economic trends help to inform our investment process, ultimately it’s the individual stocks with solid fundamentals and attractive valuations that, over time, drive positive
risk-adjusted returns for our funds.”
We are long term investors, staying ever mindful of downside risk while striving to participate in the upside, with each individual fund having its own objective,
process, portfolio construction, and investment criteria.
The stock market has once again seen dramatic differences in stock performance. For our fiscal year ended October 31, 2023, all three broad-based indexes were
positive, although with a large dispersion of total returns, with the Dow Jones Industrial Average up 3.17%, the S&P 500® Index up 10.14%, and the
Nasdaq Composite Index up 17.99%. During our fiscal year, large caps significantly outperformed mid caps and small caps, and growth substantially outperformed value. Large-cap tech once again pushed the overall broader market
higher, as evidenced by the Nasdaq-100 Index posting a return of 27.45%. From a sector point of view, besides Technology, the only other sector with outsized (greater than 10%) returns was Communication Services, while six of the 11
GICS sectors of the S&P 500® Index were negative.
Similar to the overall market, our funds experienced mixed results. Many of our funds exhibit more value-oriented characteristics and, given that value
underperformed growth this year by a significant amount, that negatively affected our relative performance. In addition, three of our funds are sector-specific funds that were invested in underperforming sectors, while six more are
focused on small- and mid-cap stocks in a time period when large caps substantially outperformed. Ten of our 16 mutual funds and our exchange-traded-fund (ETF) posted positive returns for the fiscal year ended October 31, 2023.
Several factors caused this disparity of returns in the market: interest rates and inflation being two of the most important. With the Federal Reserve pausing
interest rate hikes and inflation numbers subsiding, the market reacted positively once it became more apparent that we were not heading into a recession. Consumer demand also remained strong, and unemployment numbers remained
historically low.
We believe that the outlook for U.S. stocks remains positive, primarily as we believe that the Federal Reserve may be done, or close to done, raising interest rates.
Inflation has shown signs of easing, creating a better environment for consumers as well as businesses. The unemployment rate remains near record lows, there are elevated levels of cash on the
|
HENNESSY FUNDS
|
1-800-966-4354
|
3
balance sheets of U.S. companies and in the pockets of many consumers and investors, and there is the prospect of a more dovish Federal Reserve heading into 2024. However, we are cautiously watching
certain parts of the economy for any hints of weakness, including consumer spending and credit issues. While volatility and uncertainty may impact the markets, we encourage investors to stay the course, maintain a diversified
portfolio, and keep a long-term perspective.
We thank you for your continued interest in our Funds and are grateful that you have chosen to invest with us. If you have any questions or would like to speak with
us directly, please call us at (800) 966-4354.
Best regards,
|
|
|
|
|
Ryan C. Kelley, CFA
|
|
|
Chief Investment Officer,
|
|
|
Senior Vice President, and Portfolio Manager
|
Past performance does not guarantee future results.
Mutual fund investing involves risk. Principal loss is possible.
Opinions expressed are those of Ryan C. Kelley and are subject to change, are not guaranteed, and should not be considered investment advice.
The Dow Jones Industrial Average and S&P 500® Index are commonly used to measure the performance of U.S. stocks. The
Nasdaq Composite Index comprises all common stocks listed on The Nasdaq Stock Market and is commonly used to measure the performance of technology-related stocks. The Nasdaq-100 Index includes 100 of the largest domestic and
international non-financial companies listed on The NASDAQ Stock Market based on market capitalization. The indices are used herein for comparative purposes in accordance with SEC regulations. One cannot invest directly in an index.
All returns are shown on a total return basis.
|
WWW.HENNESSYFUNDS.COM
|
4
|
LETTER TO SHAREHOLDERS
|
(This Page Intentionally Left Blank.)
|
HENNESSY FUNDS
|
1-800-966-4354
|
5
Performance Overview (Unaudited)
CHANGE IN VALUE OF $10,000 INVESTMENT
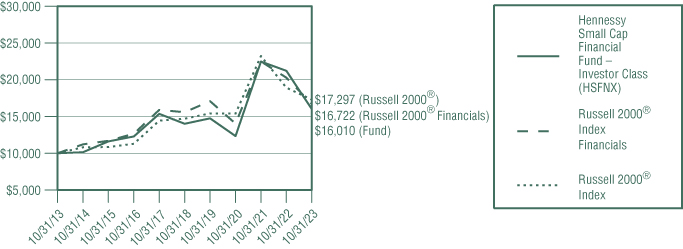
This graph illustrates the performance of an initial investment of $10,000 made in the Fund 10 years ago and assumes the reinvestment of dividends and capital gains.
AVERAGE ANNUAL TOTAL RETURN FOR PERIODS ENDED OCTOBER 31, 2023
|
One
|
Five
|
Ten
|
|
|
Year
|
Years
|
Years
|
|
|
Hennessy Small Cap Financial Fund –
|
|||
|
Investor Class (HSFNX)
|
-24.53%
|
2.71%
|
4.82%
|
|
Hennessy Small Cap Financial Fund –
|
|||
|
Institutional Class (HISFX)
|
-24.32%
|
3.06%
|
5.20%
|
|
Russell 2000® Index Financials
|
-17.55%
|
1.42%
|
5.28%
|
|
Russell 2000® Index
|
-8.56%
|
3.31%
|
5.63%
|
Expense ratios: 1.59% (Investor Class); 1.22% (Institutional Class)
Performance data quoted represents past performance; past performance does not guarantee future results. The investment return and principal value of an investment will fluctuate so
that an investor’s shares, when redeemed, may be worth more or less than their original cost. The performance table does not reflect the deduction of taxes that a shareholder would pay on Fund distributions or the redemption of Fund
shares. Current performance of the Fund may be lower or higher than the performance quoted. Performance data current to the most recent month end may be obtained by visiting www.hennessyfunds.com.
The Russell 2000® Index Financials is a subset of the Russell 2000® Index that measures the performance of securities classified in the Financials sector of the small-cap U.S. equity market. The Russell 2000® Index is a subset of the Russell 3000® Index that measures the performance of the small-cap segment of the U.S. equity
market. The Russell 2000® Index comprises the smallest 2,000 companies in the Russell 3000® Index based on market capitalization and current index membership, representing approximately 7% of the total market capitalization of the Russell 3000® Index. One cannot invest directly in an index. These indices are used for comparative purposes in accordance with Securities and Exchange Commission regulations.
Frank Russell Company (“Russell”) is the source and owner of the trademarks, service marks, and copyrights related to the Russell Indexes. Russell® is a trademark of Frank Russell Company. Neither Russell nor its licensors accept any liability for any errors or omissions in the Russell Indexes or Russell ratings or underlying data and no party may
|
WWW.HENNESSYFUNDS.COM
|
6
|
PERFORMANCE OVERVIEW
|
rely on any Russell Indexes or Russell ratings or underlying data contained in this communication. No further distribution of Russell data is permitted without Russell’s express written consent. Russell
does not promote, sponsor, or endorse the content of this communication.
The expense ratios presented are from the most recent prospectus. The expense ratios for the current reporting period are available in the Financial Highlights section of this report.
PERFORMANCE NARRATIVE
Portfolio Managers David H. Ellison and Ryan C. Kelley, CFA
Performance:
For the one-year period ended October 31, 2023, the Investor Class of the Hennessy Small Cap Financial Fund returned -24.53%, underperforming both the Russell 2000® Index Financials (the Fund’s primary benchmark) and the Russell 2000® Index, which returned -17.55% and
-8.56%, respectively, for the same period.
The Fund’s underperformance relative to its primary benchmark resulted predominantly from a heavier allocation to both medium and small banks as well as stock selection within those
sub-categories. In general, regional banks and other smaller, more traditional banking institutions significantly underperformed this year compared to the broader stock market as well as other types of financials. Top detractors
from performance included PacWest Bancorp, OceanFirst Financial Corporation, and Hancock Whitney Corporation. Conversely, the largest contributors to fund performance were First Citizens BancShares, Inc. of North Carolina, New York
Community Bancorp, Inc., and First Internet Bancshares, Inc.
The Fund continues to own all the companies mentioned except New York Community and First Internet.
Portfolio Strategy:
Generally, the Fund invests more heavily within the Financials sector in regional banks, thrifts, and, at times, mortgage finance companies. Within these preferred sub-industries, we seek companies that we
believe have high-quality management teams, uncomplicated business models, strong balance sheets, and sustainable earnings growth opportunities. Moreover, we seek to identify companies that we expect will do better than peers in the
current environment, which is characterized by high interest rates, competitive loan markets, growing attention to costs, and the potential for increased loan charge-offs. Finally, we believe the timing of changes in macro industry
dynamics is difficult to predict, and we prefer to focus on companies that remain competitive over the long term.
Investment Commentary:
The Financials sector has been challenged for the last couple of years as the Federal Reserve has tightened financial conditions to fight inflation. Not only have interest rates increased, but the yield
curve has inverted with short-term rates moving higher than longer-term rates. This development has pressured lending margins, reduced capital via mark-to-market accounting and heightened concerns about a recession leading to higher
loan losses. While these pressures persisted throughout 2023, companies are making adjustments and working through this difficult macro backdrop. We view the difficult operating environment as an opportunity to invest in
high-quality companies at a discount as group valuations currently reflect investor fears about rising rates and credit losses. The best opportunities in this space occur when operating conditions move from
|
HENNESSY FUNDS
|
1-800-966-4354
|
7
ugly to ok to good to great. We view today as ugly to ok conditions. We are positioning the portfolio in the companies we believe have the management or valuation to allow us the chance to outperform as
operating conditions improve.
_______________
Opinions expressed are those of the Portfolio Managers as of the date written and are subject to change, are not guaranteed, and should not be considered investment advice or an indication of trading
intent.
The Fund is non-diversified, meaning it may concentrate its assets in fewer individual holdings than a diversified fund, making it more exposed to individual stock volatility than a
diversified fund. Investments are focused on the financial services industry; sector funds may be subject to a higher degree of market risk. The Fund invests in small-capitalization and medium-capitalization companies, which may
have limited liquidity and greater price volatility than larger companies. Investments in foreign securities may involve political, economic, and currency risk, greater volatility, and differences in accounting methods. Please see
the Fund’s prospectus for a more complete discussion of these and other risks.
References to specific securities should not be considered a recommendation to buy or sell any security. Fund holdings and sector allocations are subject to change. Please refer to the Schedule of
Investments included in this report for additional portfolio information.
Earnings growth is not a measure of the Fund’s future performance.
|
WWW.HENNESSYFUNDS.COM
|
8
|
PERFORMANCE OVERVIEW/SCHEDULE OF INVESTMENTS
|
Financial Statements
|
Schedule of Investments as of October 31, 2023
|
HENNESSY SMALL CAP FINANCIAL FUND
(% of Net Assets)
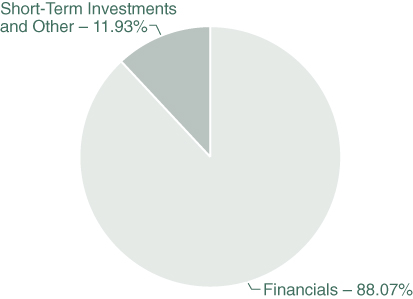
|
TOP TEN HOLDINGS (EXCLUDING MONEY MARKET FUNDS)
|
% NET ASSETS
|
|
Midland States Bancorp, Inc.
|
4.62%
|
|
Flushing Financial Corp.
|
4.54%
|
|
Texas Capital Bancshares, Inc.
|
4.39%
|
|
Western New England Bancorp, Inc.
|
4.26%
|
|
ConnectOne Bancorp, Inc.
|
4.19%
|
|
Wintrust Financial Corp.
|
4.13%
|
|
Associated Banc-Corp
|
4.11%
|
|
BankUnited, Inc.
|
4.08%
|
|
Pacific Premier Bancorp, Inc.
|
3.89%
|
|
WaFD, Inc.
|
3.69%
|
Note: For presentation purposes, the Fund has grouped some of the industry categories. For purposes of categorizing securities for compliance with Section 8(b)(1) of the Investment Company Act of 1940, as
amended, the Fund uses more specific industry classifications.
The Global Industry Classification Standard (GICS®) was developed by and is the exclusive property and a service mark of
MSCI, Inc. and Standard & Poor’s Financial Services LLC. It has been licensed for use by the Hennessy Funds.
|
HENNESSY FUNDS
|
1-800-966-4354
|
9
|
COMMON STOCKS – 88.07%
|
Number
|
% of
|
||||||||||
|
|
of Shares
|
Value
|
Net Assets
|
|||||||||
|
Financials – 88.07%
|
||||||||||||
|
Associated Banc-Corp.
|
156,000
|
$
|
2,528,760
|
4.11
|
%
|
|||||||
|
BankUnited, Inc.
|
115,000
|
2,508,150
|
4.08
|
%
|
||||||||
|
Banner Corp.
|
20,000
|
844,200
|
1.37
|
%
|
||||||||
|
Brookline Bancorp, Inc.
|
245,000
|
1,994,300
|
3.24
|
%
|
||||||||
|
Cambridge Bancorp
|
40,000
|
2,148,400
|
3.50
|
%
|
||||||||
|
Columbia Banking System, Inc.
|
68,000
|
1,337,560
|
2.18
|
%
|
||||||||
|
ConnectOne Bancorp, Inc.
|
158,000
|
2,573,820
|
4.19
|
%
|
||||||||
|
Dime Community Bancshares, Inc.
|
90,000
|
1,655,100
|
2.69
|
%
|
||||||||
|
Eastern Bankshares, Inc.
|
190,000
|
2,091,900
|
3.40
|
%
|
||||||||
|
First BanCorp.
|
105,000
|
1,401,750
|
2.28
|
%
|
||||||||
|
First Citizens BancShares, Inc.
|
700
|
966,518
|
1.57
|
%
|
||||||||
|
Flushing Financial Corp.
|
226,000
|
2,788,840
|
4.54
|
%
|
||||||||
|
Hancock Whitney Corp.
|
60,000
|
2,065,800
|
3.36
|
%
|
||||||||
|
Hingham Institution for Savings
|
7,500
|
1,114,350
|
1.81
|
%
|
||||||||
|
HomeTrust Bancshares, Inc.
|
70,000
|
1,442,700
|
2.35
|
%
|
||||||||
|
Independent Bank Corp.
|
26,000
|
1,268,800
|
2.06
|
%
|
||||||||
|
Lakeland Bancorp, Inc.
|
180,000
|
2,030,400
|
3.30
|
%
|
||||||||
|
Midland States Bancorp, Inc.
|
130,000
|
2,836,600
|
4.62
|
%
|
||||||||
|
Northeast Community Bancorp, Inc.
|
100,000
|
1,524,000
|
2.48
|
%
|
||||||||
|
OceanFirst Financial Corp.
|
160,000
|
2,025,600
|
3.30
|
%
|
||||||||
|
Old National Bancorp
|
126,000
|
1,726,200
|
2.81
|
%
|
||||||||
|
Orange County Bancorp, Inc.
|
12,000
|
529,200
|
0.86
|
%
|
||||||||
|
Pacific Premier Bancorp, Inc.
|
126,000
|
2,394,000
|
3.89
|
%
|
||||||||
|
PacWest Bancorp
|
165,000
|
1,168,200
|
1.90
|
%
|
||||||||
|
Texas Capital Bancshares, Inc. (a)
|
49,000
|
2,697,940
|
4.39
|
%
|
||||||||
|
Valley National Bancorp
|
135,000
|
1,050,300
|
1.71
|
%
|
||||||||
|
WaFd, Inc.
|
92,000
|
2,270,560
|
3.69
|
%
|
||||||||
|
Western New England Bancorp, Inc.
|
365,000
|
2,617,050
|
4.26
|
%
|
||||||||
|
Wintrust Financial Corp.
|
34,000
|
2,539,460
|
4.13
|
%
|
||||||||
|
|
54,140,458
|
88.07
|
%
|
|||||||||
|
|
||||||||||||
|
Total Common Stocks
|
||||||||||||
|
(Cost $54,745,608)
|
54,140,458
|
88.07
|
%
|
|||||||||
The accompanying notes are an integral part of these financial statements.
|
WWW.HENNESSYFUNDS.COM
|
10
|
SCHEDULE OF INVESTMENTS
|
|
SHORT-TERM INVESTMENTS – 12.56%
|
Number
|
% of
|
||||||||||
|
|
of Shares
|
Value
|
Net Assets
|
|||||||||
|
Money Market Funds – 12.56%
|
||||||||||||
|
Fidelity Government Portfolio – Class I, 5.240% (b)
|
1,540,376
|
$
|
1,540,376
|
2.50
|
%
|
|||||||
|
First American Government Obligations Fund – Class X, 5.276% (b)
|
3,091,000
|
3,091,000
|
5.03
|
%
|
||||||||
|
First American Treasury Obligations Fund – Class X, 5.275% (b)
|
3,091,000
|
3,091,000
|
5.03
|
%
|
||||||||
|
|
||||||||||||
|
Total Short-Term Investments
|
||||||||||||
|
(Cost $7,722,376)
|
7,722,376
|
12.56
|
%
|
|||||||||
|
|
||||||||||||
|
Total Investments
|
||||||||||||
|
(Cost $62,467,984) – 100.63%
|
61,862,834
|
100.63
|
%
|
|||||||||
|
Liabilities in Excess of Other Assets – (0.63)%
|
(387,049
|
)
|
(0.63
|
)%
|
||||||||
|
|
||||||||||||
|
TOTAL NET ASSETS – 100.00%
|
$
|
61,475,785
|
100.00
|
%
|
||||||||
Percentages are stated as a percent of net assets.
|
(a)
|
Non-income producing security.
|
|
(b)
|
The rate listed is the fund’s seven-day yield as of October 31, 2023.
|
Summary of Fair Value Exposure as of October 31, 2023
The following is a summary of the inputs used to value the Fund’s net assets as of October 31, 2023 (see Note 3 in the accompanying Notes to the Financial Statements):
|
Common Stocks
|
Level 1
|
Level 2
|
Level 3
|
Total
|
||||||||||||
|
Financials
|
$
|
54,140,458
|
$
|
—
|
$
|
—
|
$
|
54,140,458
|
||||||||
|
Total Common Stocks
|
$
|
54,140,458
|
$
|
—
|
$
|
—
|
$
|
54,140,458
|
||||||||
|
Short-Term Investments
|
||||||||||||||||
|
Money Market Funds
|
$
|
7,722,376
|
$
|
—
|
$
|
—
|
$
|
7,722,376
|
||||||||
|
Total Short-Term Investments
|
$
|
7,722,376
|
$
|
—
|
$
|
—
|
$
|
7,722,376
|
||||||||
|
Total Investments
|
$
|
61,862,834
|
$
|
—
|
$
|
—
|
$
|
61,862,834
|
||||||||
The accompanying notes are an integral part of these financial statements.
|
HENNESSY FUNDS
|
1-800-966-4354
|
11
Financial Statements
|
Statement of Assets and Liabilities as of October 31, 2023
|
|
ASSETS:
|
||||
|
Investments in securities, at value (cost $62,467,984)
|
$
|
61,862,834
|
||
|
Dividends and interest receivable
|
47,096
|
|||
|
Receivable for fund shares sold
|
767
|
|||
|
Receivable for securities sold
|
178,912
|
|||
|
Prepaid expenses and other assets
|
20,405
|
|||
|
Total assets
|
62,110,014
|
|||
|
LIABILITIES:
|
||||
|
Payable for securities purchased
|
510,746
|
|||
|
Payable for fund shares redeemed
|
7,402
|
|||
|
Payable to advisor
|
48,824
|
|||
|
Payable to administrator
|
11,989
|
|||
|
Payable to auditor
|
22,754
|
|||
|
Accrued distribution fees
|
9,131
|
|||
|
Accrued service fees
|
4,810
|
|||
|
Accrued trustees fees
|
6,092
|
|||
|
Accrued expenses and other payables
|
12,481
|
|||
|
Total liabilities
|
634,229
|
|||
|
NET ASSETS
|
$
|
61,475,785
|
||
|
NET ASSETS CONSISTS OF:
|
||||
|
Capital stock
|
$
|
61,472,198
|
||
|
Total distributable earnings
|
3,587
|
|||
|
Total net assets
|
$
|
61,475,785
|
||
|
NET ASSETS:
|
||||
|
Investor Class
|
||||
|
Shares authorized (no par value)
|
Unlimited
|
|||
|
Net assets applicable to outstanding shares
|
$
|
54,603,386
|
||
|
Shares issued and outstanding
|
2,674,402
|
|||
|
Net asset value, offering price, and redemption price per share
|
$
|
20.42
|
||
|
Institutional Class
|
||||
|
Shares authorized (no par value)
|
Unlimited
|
|||
|
Net assets applicable to outstanding shares
|
$
|
6,872,399
|
||
|
Shares issued and outstanding
|
581,369
|
|||
|
Net asset value, offering price, and redemption price per share
|
$
|
11.82
|
||
The accompanying notes are an integral part of these financial statements.
|
WWW.HENNESSYFUNDS.COM
|
12
|
STATEMENT OF ASSETS AND LIABILITIES/STATEMENT OF OPERATIONS
|
Financial Statements
|
Statement of Operations for the year ended October 31, 2023
|
|
INVESTMENT INCOME:
|
||||
|
Dividend income(1)
|
$
|
2,584,148
|
||
|
Interest income
|
262,186
|
|||
|
Total investment income
|
2,846,334
|
|||
|
EXPENSES:
|
||||
|
Investment advisory fees (See Note 5)
|
743,349
|
|||
|
Sub-transfer agent expenses – Investor Class (See Note 5)
|
134,651
|
|||
|
Sub-transfer agent expenses – Institutional Class (See Note 5)
|
15,094
|
|||
|
Distribution fees – Investor Class (See Note 5)
|
104,321
|
|||
|
Administration, accounting, custody, and transfer agent fees (See Note 5)
|
86,804
|
|||
|
Service fees – Investor Class (See Note 5)
|
69,547
|
|||
|
Federal and state registration fees
|
37,659
|
|||
|
Audit fees
|
22,755
|
|||
|
Compliance expense (See Note 5)
|
22,674
|
|||
|
Trustees’ fees and expenses
|
20,675
|
|||
|
Reports to shareholders
|
15,099
|
|||
|
Legal fees
|
2,518
|
|||
|
Other expenses
|
20,101
|
|||
|
Total expenses
|
1,295,247
|
|||
|
NET INVESTMENT INCOME
|
$
|
1,551,087
|
||
|
REALIZED AND UNREALIZED GAINS (LOSSES):
|
||||
|
Net realized gain on investments
|
$
|
2,691,655
|
||
|
Net change in unrealized appreciation/depreciation on investments
|
(28,455,053
|
)
|
||
|
Net loss on investments
|
(25,763,398
|
)
|
||
|
NET DECREASE IN NET ASSETS RESULTING FROM OPERATIONS
|
$
|
(24,212,311
|
)
|
|
|
(1)
|
Net of foreign taxes withheld of $11,580.
|
The accompanying notes are an integral part of these financial statements.
|
HENNESSY FUNDS
|
1-800-966-4354
|
13
(This Page Intentionally Left Blank.)
|
WWW.HENNESSYFUNDS.COM
|
14
|
STATEMENTS OF CHANGES IN NET ASSETS
|
Financial Statements
|
Statements of Changes in Net Assets
|
|
Year Ended
|
Year Ended
|
|||||||
|
October 31, 2023
|
October 31, 2022
|
|||||||
|
OPERATIONS:
|
||||||||
|
Net investment income
|
$
|
1,551,087
|
$
|
1,056,994
|
||||
|
Net realized gain on investments
|
2,691,655
|
12,617,156
|
||||||
|
Net change in unrealized
|
||||||||
|
appreciation/depreciation on investments
|
(28,455,053
|
)
|
(22,730,488
|
)
|
||||
|
Net decrease in net assets resulting from operations
|
(24,212,311
|
)
|
(9,056,338
|
)
|
||||
|
DISTRIBUTIONS TO SHAREHOLDERS:
|
||||||||
|
Distributable earnings – Investor Class
|
(7,452,661
|
)
|
(1,276,583
|
)
|
||||
|
Distributable earnings – Institutional Class
|
(1,876,496
|
)
|
(587,596
|
)
|
||||
|
Total distributions
|
(9,329,157
|
)
|
(1,864,179
|
)
|
||||
|
CAPITAL SHARE TRANSACTIONS:
|
||||||||
|
Proceeds from shares subscribed – Investor Class
|
2,129,827
|
21,043,349
|
||||||
|
Proceeds from shares subscribed – Institutional Class
|
2,747,009
|
13,669,099
|
||||||
|
Dividends reinvested – Investor Class
|
7,283,862
|
1,243,912
|
||||||
|
Dividends reinvested – Institutional Class
|
1,825,197
|
549,827
|
||||||
|
Cost of shares redeemed – Investor Class
|
(20,718,495
|
)
|
(60,100,417
|
)
|
||||
|
Cost of shares redeemed – Institutional Class
|
(11,825,149
|
)
|
(24,017,634
|
)
|
||||
|
Net decrease in net assets
|
||||||||
|
derived from capital share transactions
|
(18,557,749
|
)
|
(47,611,864
|
)
|
||||
|
TOTAL DECREASE IN NET ASSETS
|
(52,099,217
|
)
|
(58,532,381
|
)
|
||||
|
NET ASSETS:
|
||||||||
|
Beginning of year
|
113,575,002
|
172,107,383
|
||||||
|
End of year
|
$
|
61,475,785
|
$
|
113,575,002
|
||||
|
CHANGES IN SHARES OUTSTANDING:
|
||||||||
|
Shares sold – Investor Class
|
86,638
|
685,704
|
||||||
|
Shares sold – Institutional Class
|
172,929
|
758,917
|
||||||
|
Shares issued to holders as reinvestment
|
||||||||
|
of dividends – Investor Class
|
274,193
|
39,265
|
||||||
|
Shares issued to holders as reinvestment
|
||||||||
|
of dividends – Institutional Class
|
118,272
|
29,680
|
||||||
|
Shares redeemed – Investor Class
|
(855,557
|
)
|
(1,998,475
|
)
|
||||
|
Shares redeemed – Institutional Class
|
(879,954
|
)
|
(1,345,808
|
)
|
||||
|
Net decrease in shares outstanding
|
(1,083,479
|
)
|
(1,830,717
|
)
|
||||
The accompanying notes are an integral part of these financial statements.
|
HENNESSY FUNDS
|
1-800-966-4354
|
15
Financial Statements
|
Financial Highlights
|
For an Investor Class share outstanding throughout each year
PER SHARE DATA:
Net asset value, beginning of year
Income from investment operations:
Net investment income(1)
Net realized and unrealized gains (losses) on investments
Total from investment operations
Less distributions:
Dividends from net investment income
Dividends from net realized gains
Total distributions
Net asset value, end of year
TOTAL RETURN
SUPPLEMENTAL DATA AND RATIOS:
Net assets, end of year (millions)
Ratio of expenses to average net assets
Ratio of net investment income to average net assets
Portfolio turnover rate(2)
|
(1)
|
Calculated using the average shares outstanding method.
|
|
(2)
|
Calculated on the basis of the Fund as a whole.
|
The accompanying notes are an integral part of these financial statements.
|
WWW.HENNESSYFUNDS.COM
|
16
|
FINANCIAL HIGHLIGHTS — INVESTOR CLASS
|
|
Year Ended October 31,
|
||||||||||||||||||
|
2023
|
2022
|
2021
|
2020
|
2019
|
||||||||||||||
|
$
|
29.47
|
$
|
31.52
|
$
|
17.46
|
$
|
21.60
|
$
|
21.96
|
|||||||||
|
0.43
|
0.22
|
0.25
|
0.16
|
0.10
|
||||||||||||||
|
(7.13
|
)
|
(1.96
|
)
|
14.01
|
(3.55
|
)
|
0.93
|
|||||||||||
|
(6.70
|
)
|
(1.74
|
)
|
14.26
|
(3.39
|
)
|
1.03
|
|||||||||||
|
(0.19
|
)
|
(0.22
|
)
|
(0.20
|
)
|
(0.09
|
)
|
(0.07
|
)
|
|||||||||
|
(2.16
|
)
|
(0.09
|
)
|
—
|
(0.66
|
)
|
(1.32
|
)
|
||||||||||
|
(2.35
|
)
|
(0.31
|
)
|
(0.20
|
)
|
(0.75
|
)
|
(1.39
|
)
|
|||||||||
|
$
|
20.42
|
$
|
29.47
|
$
|
31.52
|
$
|
17.46
|
$
|
21.60
|
|||||||||
|
-24.53
|
%
|
-5.60
|
%
|
82.20
|
%
|
-16.37
|
%
|
5.27
|
%
|
|||||||||
|
$
|
54.60
|
$
|
93.40
|
$
|
140.03
|
$
|
54.96
|
$
|
89.36
|
|||||||||
|
1.62
|
%
|
1.59
|
%
|
1.58
|
%
|
1.65
|
%
|
1.58
|
%
|
|||||||||
|
1.83
|
%
|
0.72
|
%
|
0.90
|
%
|
0.96
|
%
|
0.47
|
%
|
|||||||||
|
72
|
%
|
27
|
%
|
28
|
%
|
75
|
%
|
46
|
%
|
|||||||||
The accompanying notes are an integral part of these financial statements.
|
HENNESSY FUNDS
|
1-800-966-4354
|
17
Financial Statements
|
Financial Highlights
|
For an Institutional Class share outstanding throughout each year
PER SHARE DATA:
Net asset value, beginning of year
Income from investment operations:
Net investment income(1)
Net realized and unrealized gains (losses) on investments
Total from investment operations
Less distributions:
Dividends from net investment income
Dividends from net realized gains
Total distributions
Net asset value, end of year
TOTAL RETURN
SUPPLEMENTAL DATA AND RATIOS:
Net assets, end of year (millions)
Ratio of expenses to average net assets
Ratio of net investment income to average net assets
Portfolio turnover rate(2)
|
(1)
|
Calculated using the average shares outstanding method.
|
|
(2)
|
Calculated on the basis of the Fund as a whole.
|
The accompanying notes are an integral part of these financial statements.
|
WWW.HENNESSYFUNDS.COM
|
18
|
FINANCIAL HIGHLIGHTS — INSTITUTIONAL CLASS
|
|
Year Ended October 31,
|
||||||||||||||||||
|
2023
|
2022
|
2021
|
2020
|
2019
|
||||||||||||||
|
$
|
17.24
|
$
|
18.57
|
$
|
10.37
|
$
|
12.92
|
$
|
13.28
|
|||||||||
|
0.30
|
0.20
|
0.21
|
0.13
|
0.10
|
||||||||||||||
|
(4.14
|
)
|
(1.14
|
)
|
8.26
|
(2.10
|
)
|
0.54
|
|||||||||||
|
(3.84
|
)
|
(0.94
|
)
|
8.47
|
(1.97
|
)
|
0.64
|
|||||||||||
|
(0.31
|
)
|
(0.34
|
)
|
(0.27
|
)
|
(0.19
|
)
|
(0.18
|
)
|
|||||||||
|
(1.27
|
)
|
(0.05
|
)
|
—
|
(0.39
|
)
|
(0.82
|
)
|
||||||||||
|
(1.58
|
)
|
(0.39
|
)
|
(0.27
|
)
|
(0.58
|
)
|
(1.00
|
)
|
|||||||||
|
$
|
11.82
|
$
|
17.24
|
$
|
18.57
|
$
|
10.37
|
$
|
12.92
|
|||||||||
|
-24.32
|
%
|
-5.21
|
%
|
82.88
|
%
|
-16.05
|
%
|
5.57
|
%
|
|||||||||
|
$
|
6.87
|
$
|
20.17
|
$
|
32.08
|
$
|
10.61
|
$
|
20.74
|
|||||||||
|
1.29
|
%
|
1.22
|
%
|
1.20
|
%
|
1.29
|
%
|
1.23
|
%
|
|||||||||
|
2.13
|
%
|
1.13
|
%
|
1.31
|
%
|
1.27
|
%
|
0.84
|
%
|
|||||||||
|
72
|
%
|
27
|
%
|
28
|
%
|
75
|
%
|
46
|
%
|
|||||||||
The accompanying notes are an integral part of these financial statements.
|
HENNESSY FUNDS
|
1-800-966-4354
|
19
Financial Statements
|
Notes to the Financial Statements October 31, 2023
|
1). ORGANIZATION
The Hennessy Small Cap Financial Fund (the “Fund”) is a series of Hennessy Funds Trust (the “Trust”), which was organized as a Delaware statutory trust on September 17, 1992. The Fund is an open-end
management investment company registered under the Investment Company Act of 1940, as amended. The investment objective of the Fund is capital appreciation. The Fund is a non-diversified fund.
The Fund offers Investor Class and Institutional Class shares. Each class of shares differs principally in its respective 12b-1 distribution and service, shareholder servicing, and
sub-transfer agent expenses. There are no sales charges. Each class has identical rights to earnings, assets, and voting privileges, except for class-specific expenses and exclusive rights to vote on matters affecting only one
class.
As an investment company, the Fund follows the investment company accounting and reporting guidance of the Financial Accounting Standards Board (the “FASB”) Accounting Standard
Codification Topic 946 “Financial Services—Investment Companies.”
2). SIGNIFICANT ACCOUNTING POLICIES
The following is a summary of significant accounting policies consistently followed by the Fund in the preparation of the financial statements. These policies conform to U.S. generally accepted accounting
principles (“GAAP”).
|
a).
|
Securities Valuation – All investments in securities are valued in accordance with the Fund’s valuation policies and procedures, as described in Note 3.
|
|
b).
|
Federal Income Taxes – The Fund has elected to be taxed as a regulated investment company and intends to distribute substantially all of its taxable income to its shareholders and otherwise comply
with the provisions of the Internal Revenue Code of 1986, as amended, applicable to regulated investment companies. As a result, the Fund has made no provision for federal income taxes or excise taxes. Net investment
income/loss and realized gains/losses for federal income tax purposes may differ from those reported in the financial statements because of temporary book-basis and tax-basis differences. Temporary differences are primarily
the result of the treatment of wash sales for tax reporting purposes. The Fund recognizes interest and penalties related to income tax benefits, if any, in the Statement of Operations as an income tax expense. Distributions
from net realized gains for book purposes may include short-term capital gains, which are included as ordinary income to shareholders for tax purposes. The Fund may utilize equalization accounting for tax purposes and
designate earnings and profits, including net realized gains distributed to shareholders on redemption of shares, as part of the dividends paid deduction for income tax purposes.
|
|
Due to inherent differences in the recognition of income, expenses, and realized gains/losses under GAAP and federal income tax
regulations, permanent differences between book and tax basis for reporting are identified and appropriately reclassified in the Statement of Assets and Liabilities, as needed. The adjustments for fiscal year 2023 are as
follows:
|
|
Total
|
|||
|
Distributable
|
|||
|
Earnings
|
Capital Stock
|
||
|
$(986,204)
|
$986,204
|
|
WWW.HENNESSYFUNDS.COM
|
20
|
NOTES TO THE FINANCIAL STATEMENTS
|
|
c).
|
Accounting for Uncertainty in Income Taxes – The Fund has accounting policies regarding recognition and measurement of tax positions taken or expected to be taken on a tax return. The tax returns
of the Fund for the prior three fiscal years are open for examination. The Fund has reviewed all open tax years in major tax jurisdictions and concluded that there is no impact on the Fund’s net assets and no tax liability
resulting from unrecognized tax benefits relating to uncertain income tax positions taken or expected to be taken on a tax return. The Fund’s major tax jurisdictions are U.S. federal and Delaware.
|
|
d).
|
Income and Expenses – Dividend income is recognized on the ex-dividend date or as soon as information is available to the Fund. Interest income, which includes the amortization of premium and
accretion of discount, is recognized on an accrual basis. Market discounts, original issue discounts, and market premiums on debt securities are accreted or amortized to interest income over the life of a security with a
corresponding increase or decrease, as applicable, in the cost basis of such security using the yield-to-maturity method or, where applicable, the first call date of the security. Other non-cash dividends are recognized as
investment income at the fair value of the property received. The Fund is charged for those expenses that are directly attributable to its portfolio, such as advisory, administration, and certain shareholder service fees.
Income, expenses (other than expenses attributable to a specific class), and realized and unrealized gains/losses on investments are allocated to each class of shares based on such class’s net assets.
|
|
e).
|
Distributions to Shareholders – Dividends from net investment income for the Fund, if any, are declared and paid annually, usually in December. Distributions of net realized capital gains, if any,
are declared and paid annually, usually in December.
|
|
f).
|
Security Transactions – Investment and shareholder transactions are recorded on the trade date. The Fund determines the realized gain/loss from an investment transaction by comparing the original
cost of the security lot sold with the net sale proceeds. Discounts and premiums on securities purchased are accreted or amortized, respectively, over the life of each such security.
|
|
g).
|
Use of Estimates – Preparing financial statements in accordance with GAAP requires management to make estimates and assumptions that affect the reported amounts of assets and liabilities and
disclosure of contingent assets and liabilities at the date of the financial statements, as well as the reported change in net assets during the reporting period. Actual results could differ from those estimates.
|
|
h).
|
Share Valuation – The net asset value (“NAV”) per share of the Fund is calculated by dividing (i) the total value of the securities held by the Fund, plus cash and other assets, minus all
liabilities (including estimated accrued expenses) by (ii) the total number of Fund shares outstanding, rounded to the nearest $0.01. Fund shares are not priced on days the New York Stock Exchange is closed for trading. The
offering and redemption price per share for the Fund is equal to the Fund’s NAV per share.
|
|
i).
|
Illiquid Securities – Pursuant to Rule 22e-4 under the 1940 Act, the Fund has adopted a Liquidity Risk Management Program (the “Liquidity Program”). The Liquidity Program requires, among other
things, that the Fund limit its illiquid investments to no more than 15% of its net assets. An illiquid investment is any investment that the Fund reasonably expects cannot be sold or disposed of by the Fund in current
market conditions in seven calendar days or less without the sale or disposition significantly changing the market value of the investment.
|
|
j).
|
Recent Accounting Pronouncements and Regulatory Updates – In October 2022, the Securities and Exchange Commission (“SEC”) adopted a final rule relating to
|
|
HENNESSY FUNDS
|
1-800-966-4354
|
21
|
Tailored Shareholder Reports for Mutual Funds and Exchange-Traded Funds (ETFs); Fee Information in Investment Company Advertisements. The rule and form amendments will require mutual funds and ETFs
to transmit concise and visually engaging shareholder reports that highlight key information. The amendments also will require that funds tag information in a structured data format. In addition, the rule amendments will
require that certain more in-depth information be made available online and available for delivery free of charge to investors on request. The amendments became effective January 24, 2023. There is an 18-month transition
period after the effective date of the amendment.
|
|
|
In June 2022, the FASB issued Accounting Standards Update (“ASU”) 2022-03, Fair Value Measurement (Topic 820): Fair Value
Measurement of Equity Securities Subject to Contractual Sale Restrictions. The ASU clarifies that a contractual restriction on the sale of an equity security is not considered part of the unit of account of the equity
security and, therefore, is not considered in measuring the fair value. The amendments also require additional disclosures related to equity securities subject to contractual sale restrictions. The ASU is effective for
fiscal years beginning after December 15, 2023, and interim periods within those fiscal years.
|
3). SECURITIES VALUATION
The Fund follows its valuation policies and procedures in determining its NAV and, in preparing these financial statements, the fair value accounting standards that establish an authoritative definition of
fair value and set out a hierarchy for measuring fair value. These standards require additional disclosures about the various inputs and valuation techniques used to develop the measurements of fair value and a discussion of changes
in valuation techniques and related inputs during the period. These inputs are summarized in the three broad levels listed below:
|
Level 1 –
|
Unadjusted, quoted prices in active markets for identical instruments that the Fund has the ability to access at the date of measurement.
|
|
|
Level 2 –
|
Other significant observable inputs other than quoted prices included in Level 1 (including, but not limited to, quoted prices in active markets for similar instruments, quoted prices in markets
that are not active for identical or similar instruments, and model-derived valuations in which all significant inputs and significant value drivers are observable in active markets, such as interest rates, prepayment
speeds, credit risk curves, default rates, and similar data).
|
|
|
Level 3 –
|
Significant unobservable inputs (including the Fund’s own assumptions about what market participants would use to price the asset or liability based on the best available information) when
observable inputs are unavailable.
|
The following is a description of the valuation techniques applied to the Fund’s major categories of assets and liabilities on a recurring basis:
|
Equity Securities – Equity securities, including common stocks, preferred stocks, foreign-issued common stocks, exchange-traded funds, closed-end mutual
funds, partnerships, rights, and real estate investment trusts, that are traded on a securities exchange for which a last-quoted sales price is readily available generally are valued at the last sales price as reported by
the primary exchange on which the securities are listed. Securities listed on The Nasdaq Stock Market (“Nasdaq”) generally are valued at the Nasdaq Official Closing Price, which may differ from the last sales price reported.
Securities traded on a securities exchange for which a last-quoted sales price is not readily available generally are valued at the mean between the bid and
|
|
WWW.HENNESSYFUNDS.COM
|
22
|
NOTES TO THE FINANCIAL STATEMENTS
|
|
ask prices. To the extent these securities are actively traded and valuation adjustments are not applied, they are classified in Level 1 of the fair value hierarchy. Securities traded on foreign
exchanges generally are not valued at the same time the Fund calculates its NAV because most foreign markets close well before such time. The earlier close of most foreign markets gives rise to the possibility that
significant events, including broad market moves, may have occurred in the interim. In certain circumstances, it may be determined that a foreign security needs to be fair valued because it appears that the value of the
security might have been materially affected by events occurring after the close of the market in which the security is principally traded, but before the time the Fund calculates its NAV, such as by a development that
affects an entire market or region (e.g., a weather-related event) or a potentially global development (e.g., a terrorist attack that may be expected to have an effect on investor expectations worldwide).
|
|
|
Registered Investment Companies – Investments in open-end registered investment companies, commonly referred to as mutual funds, generally are priced at the
ending NAV provided by the applicable mutual fund’s service agent and are classified in Level 1 of the fair value hierarchy.
|
|
|
Debt Securities – Debt securities, including corporate bonds, asset-backed securities, mortgage-backed securities, municipal bonds, U.S. Treasuries, and
U.S. government agency issues, are generally valued at market on the basis of valuations furnished by an independent pricing service that utilizes both dealer-supplied valuations and formula-based techniques. The pricing
service may consider recently executed transactions in securities of the issuer or comparable issuers, market price quotations (where observable), bond spreads, and fundamental data relating to the issuer. In addition, the
model may incorporate observable market data, such as reported sales of similar securities, broker quotes, yields, bids, offers, and reference data. Certain securities are valued primarily using dealer quotations. These
securities are generally classified in Level 2 of the fair value hierarchy.
|
|
|
Short-Term Securities – Short-term equity investments, including money market funds, are valued in the manner specified above for equity securities.
Short-term debt investments with an original term to maturity of 60 days or less are valued at amortized cost, which approximates fair market value. If the original term to maturity of a short-term debt investment exceeds 60
days, then the values as of the 61st day prior to maturity are amortized. Amortized cost is not used if its use would be inappropriate due to credit or other impairments of the issuer, in which case the security’s fair value
would be determined as described below. Short-term securities are generally classified in Level 1 or Level 2 of the fair value hierarchy depending on the inputs used and market activity levels for specific securities.
|
If market quotations are not readily available or if a significant event has occurred that indicates the closing price of a security no longer represents the true value of that security,
any security or other asset will be valued at its fair value in accordance with Rule 2a-5 under the 1940 Act. The Board of Trustees of the Fund (the “Board”) has designated Hennessy Advisors, Inc. (the “Advisor”) as the Fund’s
valuation designee to make all fair value determinations with respect to the Fund’s portfolio investments under the Fund’s fair value pricing procedures, subject to the Board’s oversight. There are numerous criteria considered in
determining a fair value of a security, such as the trading volume of a security and markets, the values of other similar securities, and news events with direct bearing on a security or markets. Fair value pricing results in an
estimated price for a security that reflects the amount the Fund might reasonably expect to receive in a current
|
HENNESSY FUNDS
|
1-800-966-4354
|
23
sale. Depending on the relative significance of the valuation inputs, these securities may be classified in either Level 2 or Level 3 of the fair value hierarchy. The Advisor will regularly evaluate
whether the Fund’s fair value pricing procedures continue to be appropriate in light of the specific circumstances of the Fund and the quality of prices obtained through their application of such procedures.
The fair value of foreign securities may be determined with the assistance of a pricing service using correlations between the movement of prices of such securities and indices of
domestic securities and other appropriate indicators, such as closing market prices of relevant American Depositary Receipts or futures contracts. Using fair value pricing means that the Fund’s NAV reflects the affected portfolio
securities’ values as determined by the Advisor, the Board’s valuation designee, pursuant to the Fund’s fair value pricing procedures, instead of being determined by the market. Using a fair value pricing methodology to price a
foreign security may result in a value that is different from such foreign security’s most recent closing price and from the value used by other investment companies to calculate their NAVs. Such securities are generally classified
in Level 2 of the fair value hierarchy. Because the Fund may invest in foreign securities, the value of the Fund’s portfolio securities may change on days when a shareholder is unable to purchase or redeem Fund shares.
The Fund has performed an analysis of all existing investments to determine the significance and character of all inputs to their fair value determinations. Various inputs are used to
determine the value of the Fund’s investments. The inputs or methodology used for valuing securities are not necessarily an indication of the risk associated with investing in those securities. Details related to the fair value
hierarchy of the Fund’s securities as of October 31, 2023, are included in the Schedule of Investments.
4). INVESTMENT TRANSACTIONS
Purchases and sales of investment securities (excluding government and short-term investments) for the Fund during fiscal year 2023 were $55,362,258 and $83,645,714, respectively.
There were no purchases or sales/maturities of long-term U.S. government securities for the Fund during fiscal year 2023.
5). INVESTMENT ADVISORY FEE AND OTHER TRANSACTIONS WITH AFFILIATES
The Advisor provides the Fund with investment advisory services under an Investment Advisory Agreement. The Advisor furnishes all investment advice, office space, and facilities and most of the personnel
needed by the Fund. As compensation for its services, the Advisor is entitled to a monthly fee from the Fund. The fee is based on the average daily net assets of the Fund at an annual rate of 0.90%. The net investment advisory fees
expensed by the Fund during fiscal year 2023 are included in the Statement of Operations.
The Board has approved a Shareholder Servicing Agreement for Investor Class shares of the Fund, which compensates the Advisor for the non-investment advisory services it provides to the
Fund. The Shareholder Servicing Agreement provides for a monthly fee paid to the Advisor at an annual rate of 0.10% of the average daily net assets of the Fund attributable to Investor Class shares. The shareholder service fees
expensed by the Fund during fiscal year 2023 are included in the Statement of Operations.
The Fund has adopted a plan pursuant to Rule 12b-1 under the Investment Company Act of 1940, as amended, that authorizes payments in connection with the distribution of Fund shares at an
annual rate of up to 0.25% of the Fund’s average daily net assets attributable to Investor Class shares. Even though the authorized rate is up to
|
WWW.HENNESSYFUNDS.COM
|
24
|
NOTES TO THE FINANCIAL STATEMENTS
|
0.25%, the Fund is currently only using up to 0.15% of its average daily net assets attributable to Investor Class shares for such purpose. Amounts paid under the plan may be spent on any activities or
expenses primarily intended to result in the sale of shares, including, but not limited to, advertising, shareholder account servicing, printing and mailing of prospectuses to other than current shareholders, printing and mailing of
sales literature, and compensation for sales and marketing activities or to financial institutions and others, such as dealers and distributors. The distribution fees expensed by the Fund during fiscal year 2023 are included in the
Statement of Operations.
The Fund has entered into agreements with various brokers, dealers, and financial intermediaries in connection with the sale of Fund shares. The agreements provide for periodic payments
of sub-transfer agent expenses by the Fund to the brokers, dealers, and financial intermediaries for providing certain shareholder maintenance services. These shareholder services include the pre-processing and quality control of
new accounts, shareholder correspondence, answering customer inquiries regarding account status, and facilitating shareholder telephone transactions. The sub-transfer agent fees expensed by the Fund during fiscal year 2023 are
included in the Statement of Operations.
U.S. Bancorp Fund Services, LLC, d/b/a U.S. Bank Global Fund Services (“Fund Services”) provides the Fund with administrative, accounting, and transfer agent services. As administrator,
Fund Services is responsible for activities such as (i) preparing various federal and state regulatory filings, reports, and returns for the Fund, (ii) preparing reports and materials to be supplied to the Board, (iii) monitoring
the activities of the Fund’s custodian, transfer agent, and accountants, and (iv) coordinating the preparation and payment of the Fund’s expenses and reviewing the Fund’s expense accruals. U.S. Bank N.A., an affiliate of Fund
Services, serves as the Fund’s custodian. The servicing agreements between the Trust, Fund Services, and U.S. Bank N.A. contain a fee schedule that is inclusive of administrative, accounting, custody, and transfer agent fees. The
administrative, accounting, custody, and transfer agent fees expensed by the Fund during fiscal year 2023 are included in the Statement of Operations.
Quasar Distributors, LLC, a wholly owned broker-dealer subsidiary of Foreside Financial Group, LLC, acts as the Fund’s principal underwriter in a continuous public offering of Fund
shares.
The officers of the Fund are affiliated with the Advisor. With the exception of the Chief Compliance Officer, such officers receive no compensation from the Fund for serving in their
respective roles. The Fund, along with the other funds in the Hennessy Funds family (collectively, the “Hennessy Funds”), makes reimbursement payments on an equal basis to the Advisor for a portion of the salary and benefits
associated with the office of the Chief Compliance Officer. The compliance fees expensed by the Fund during fiscal year 2023 for reimbursement payments to the Advisor are included in the Statement of Operations.
6). GUARANTEES AND INDEMNIFICATIONS
Under the Hennessy Funds’ organizational documents, their officers and trustees are indemnified by the Hennessy Funds against certain liabilities arising out of the performance of their duties to the
Hennessy Funds. Additionally, in the normal course of business, the Hennessy Funds enter into contracts with service providers that contain general indemnification clauses. The Fund’s maximum exposure under these arrangements is
unknown as this would involve future claims that may be made against the Fund that have not yet occurred. Currently, the Fund expects the risk of loss to be remote.
|
HENNESSY FUNDS
|
1-800-966-4354
|
25
7). LINE OF CREDIT
The Fund has an uncommitted line of credit with the other Hennessy Funds in the amount of the lesser of (i) $100,000,000 or (ii) 33.33% of each Hennessy Fund’s net assets, or 30% for the Hennessy Gas
Utility Fund, the Hennessy Japan Fund, and the Hennessy Japan Small Cap Fund and 10% for the Hennessy Balanced Fund. The line of credit is intended to provide any necessary short-term financing in connection with shareholder
redemptions, subject to certain restrictions. The credit facility is with the Hennessy Funds’ custodian bank, U.S. Bank N.A. Borrowings under this arrangement bear interest at the bank’s prime rate and are secured by all of the
Fund’s assets (as to its own borrowings only). During fiscal year 2023, the Fund did not have any borrowings outstanding under the line of credit.
8). FEDERAL TAX INFORMATION
As of October 31, 2023, the components of accumulated earnings (losses) for income tax purposes were as follows:
|
Investments
|
|||||
|
Cost of investments for tax purposes
|
$
|
64,777,154
|
|||
|
Gross tax unrealized appreciation
|
$
|
7,591,484
|
|||
|
Gross tax unrealized depreciation
|
(10,505,804
|
)
|
|||
|
Net tax unrealized appreciation/(depreciation)
|
$
|
(2,914,320
|
)
|
||
|
Undistributed ordinary income
|
$
|
807,532
|
|||
|
Undistributed long-term capital gains
|
2,110,375
|
||||
|
Total distributable earnings
|
$
|
2,917,907
|
|||
|
Other accumulated gain/(loss)
|
$
|
—
|
|||
|
Total accumulated gain/(loss)
|
$
|
3,587
|
|||
The difference between book-basis unrealized appreciation/depreciation and tax-basis unrealized appreciation/depreciation (as shown above) is attributable primarily to wash sales.
As of October 31, 2023, the Fund had no tax-basis capital losses to offset future capital gains.
As of October 31, 2023, the Fund did not defer, on a tax basis, any late-year ordinary losses. Late-year ordinary losses are net ordinary losses incurred after December 31, 2022, but
within the taxable year, that are deemed to arise on the first day of the Fund’s next taxable year.
During fiscal years 2023 and 2022, the tax character of distributions paid by the Fund was as follows:
|
Year Ended
|
Year Ended
|
||||||||
|
October 31, 2023
|
October 31, 2022
|
||||||||
|
Ordinary income(1)
|
$
|
995,722
|
$
|
1,378,796
|
|||||
|
Long-term capital gains
|
8,333,435
|
485,383
|
|||||||
|
Total distributions
|
$
|
9,329,157
|
$
|
1,864,179
|
|||||
|
(1) Ordinary income includes short-term capital gains.
|
|||||||||
|
WWW.HENNESSYFUNDS.COM
|
26
|
NOTES TO THE FINANCIAL STATEMENTS
|
9). GLOBAL EVENTS
A rise in protectionist trade policies, the possibility of a national or global recession, risks associated with pandemic and epidemic diseases, trade tensions, the possibility of changes to some
international trade agreements, political events, and continuing political tension and armed conflicts may adversely impact financial markets and the broader economy. For example, ongoing armed conflicts between Ukraine and Russia
in Europe and among Israel, Hamas, and other militant groups in the Middle East have caused and could continue to cause significant market disruptions and volatility with the markets in Europe and the Middle East, and have had
negative impacts on markets in the United States. These events could also have negative effects on the Fund’s investments that cannot be foreseen at the present time. As global systems, economies and financial markets are
increasingly interconnected, events that once had only local impact are now more likely to have regional or even global effects. Events that occur in one country, region or financial market will, more frequently, adversely impact
issuers in other countries, regions, or markets. These impacts can be exacerbated by failures of governments and societies to adequately respond to an emerging event or threat. Your investment would be negatively impacted if the
value of your portfolio holdings decreases as a result of such events, if these events adversely impact the operations and effectiveness of the Advisor or other key service providers or if these events disrupt systems and processes
necessary or beneficial to the management of accounts. These events may negatively impact broad segments of businesses and populations and could have a significant and rapid negative impact on the performance of the Fund’s
investments, increase the Fund’s volatility, or exacerbate pre-existing risks to the Fund.
10). EVENTS SUBSEQUENT TO YEAR END
Management has evaluated the Fund’s related events and transactions that occurred subsequent to October 31, 2023, through the date of issuance of the Fund’s financial statements. Other than as disclosed
below, management has determined that there were no subsequent events requiring recognition or disclosure in the financial statements.
On December 7, 2023, capital gains were declared and paid to shareholders of record on December 6, 2023, as follows:
|
Long-term
|
|||
|
Investor Class
|
0.71216
|
||
|
Institutional Class
|
0.41247
|
|
HENNESSY FUNDS
|
1-800-966-4354
|
27
Report of Independent Registered Public
Accounting Firm
To the Board of Trustees of Hennessy Funds Trust
and the shareholders of the Hennessy Small Cap Financial Fund
Novato, CA
Opinion on the Financial Statements
We have audited the accompanying statement of assets and liabilities of the Hennessy Small Cap Financial Fund (the “Fund”), a series of Hennessy Funds Trust, including the schedule of investments, as of
October 31, 2023, the related statement of operations for the year then ended, the statements of changes in net assets for each of the two years in the period then ended, financial highlights for each of the five years in the period
then ended, and the related notes (collectively referred to as the “financial statements”). In our opinion, the financial statements present fairly, in all material respects, the financial position of the Fund as of October 31,
2023, the results of its operations for the year then ended, the changes in its net assets for each of the two years in the period then ended, and the financial highlights for each of the five years in the period then ended, in
conformity with accounting principles generally accepted in the United States of America.
Basis for Opinion
These financial statements are the responsibility of the Fund’s management. Our responsibility is to express an opinion on the Fund’s financial statements based on our audits. We are a public accounting
firm registered with the Public Company Accounting Oversight Board (United States) (“PCAOB”) and are required to be independent with respect to the Fund in accordance with the U.S. federal securities laws and the applicable rules
and regulations of the Securities and Exchange Commission and the PCAOB. We have served as the auditor of one or more of the funds in the Trust since 2002.
We conducted our audits in accordance with the standards of the PCAOB. Those standards require that we plan and perform the audit to obtain reasonable assurance about whether the financial statements are
free of material misstatement, whether due to error or fraud. The Fund is not required to have, nor were we engaged to perform, an audit of its internal control over financial reporting. As part of our audits we are required to
obtain an understanding of internal control over financial reporting, but not for the purpose of expressing an opinion on the effectiveness of the Fund’s internal control over financial reporting. Accordingly, we express no such
opinion.
Our audits included performing procedures to assess the risks of material misstatement of the financial statements, whether due to error or fraud, and performing procedures that respond to those risks.
Such procedures included examining, on a test basis, evidence regarding the amounts and disclosures in the financial statements. Our audits also included evaluating the accounting principles used and significant estimates made by
management, as well as evaluating the overall presentation of the financial statements. Our procedures included confirmation of securities owned as of October 31, 2023 by correspondence with the custodian and brokers; when replies
were not received from brokers, we performed other auditing procedures. We believe that our audits provide a reasonable basis for our opinion.
|
|
|
TAIT, WELLER & BAKER LLP
|
Philadelphia, Pennsylvania
December 22, 2023
|
WWW.HENNESSYFUNDS.COM
|
28
|
REPORT OF INDEPENDENT REGISTERED PUBLIC ACCOUNTING FIRM/TRUSTEES AND OFFICERS
|
Trustees and Officers of the Fund (Unaudited)
The business and affairs of the Funds are managed under the direction of the Board of Trustees of the Trust, and the Board of Trustees elects the officers of the Trust (“Officers”). From time to time, the
Board of Trustees also has appointed advisers to the Board of Trustees (“Advisers”) with the intention of having qualified individuals serve in an advisory capacity to garner experience in the mutual fund and asset management
industry and be considered as potential Trustees in the future. There are currently two Advisers, Brian Alexander and A.J. Hennessy. As Advisers, Mr. Alexander and Mr. A.J. Hennessy attend meetings of the Board of Trustees and act
as non-voting participants. Information pertaining to the Trustees, Advisers, and the Officers of the Trust is set forth below. The Trustees and Officers serve until their successors are duly elected and qualified or until their
earlier death, resignation, or removal. Each Trustee oversees all 17 Hennessy Funds. Unless otherwise indicated, the address of all persons listed below is 7250 Redwood Boulevard, Suite 200, Novato, CA 94945. The Fund’s Statement of
Additional Information includes more information about the persons listed below and is available without charge by calling 800-966-4354 or by visiting www.hennessyfunds.com.
|
Other
|
|||
|
Directorships
|
|||
|
Held Outside
|
|||
|
Name, Age,
|
of Fund
|
||
|
and Position Held
|
Start Date
|
Principal Occupation(s)
|
Complex During
|
|
with the Trust
|
of Service
|
During Past Five Years
|
Past Five Years
|
|
Disinterested Trustees(1) and Disinterested Advisers
|
|||
|
J. Dennis DeSousa
|
January 1996
|
Mr. DeSousa is a real estate investor.
|
None.
|
|
87
|
|||
|
Trustee
|
|||
|
Robert T. Doyle
|
January 1996
|
Mr. Doyle is retired. He served as the
|
None.
|
|
76
|
Sheriff of Marin County, California
|
||
|
Trustee
|
from 1996 to June 2022.
|
||
|
Doug Franklin
|
March 2016
|
Mr. Franklin is a retired insurance
|
None.
|
|
59
|
as an Adviser
|
industry executive. From 1987
|
|
|
Trustee
|
to the Board
|
through 2015, he was employed by
|
|
|
and June 2023
|
the Allianz-Fireman’s Fund Insurance
|
||
|
as a Trustee
|
Company in various positions,
|
||
|
including as its Chief Actuary and
|
|||
|
Chief Risk Officer.
|
|||
|
Claire Garvie
|
December 2015
|
Ms. Garvie is a founder of Kiosk and
|
None.
|
|
49
|
as an Adviser
|
has served as its Chief Operating
|
|
|
Trustee
|
to the Board and
|
Officer since 2004. Kiosk is a
|
|
|
December 2021
|
full-service marketing agency with
|
||
|
as a Trustee
|
offices in the San Francisco Bay Area
|
||
|
and Liverpool, UK and staff across
|
|||
|
nine states in the U.S.
|
|||
|
HENNESSY FUNDS
|
1-800-966-4354
|
29
|
Other
|
|||
|
Directorships
|
|||
|
Held Outside
|
|||
|
Name, Age,
|
of Fund
|
||
|
and Position Held
|
Start Date
|
Principal Occupation(s)
|
Complex During
|
|
with the Trust
|
of Service
|
During Past Five Years
|
Past Five Years
|
|
Gerald P. Richardson
|
May 2004
|
Mr. Richardson is an independent
|
None.
|
|
78
|
consultant in the securities industry.
|
||
|
Trustee
|
|||
|
Brian Alexander
|
March 2015
|
Mr. Alexander has served as the
|
None.
|
|
42
|
Chief Operating Officer of Solis
|
||
|
Adviser to the Board
|
Mammography since March 2023.
|
||
|
Prior to that, he worked for the
|
|||
|
Sutter Health organization from
|
|||
|
2011 to 2023 in various positions.
|
|||
|
He served as the Chief Executive
|
|||
|
Officer of the North Valley Hospital
|
|||
|
Area from 2021 to March 2023.
|
|||
|
From 2018 to 2021, he served as the
|
|||
|
Chief Executive Officer of Sutter
|
|||
|
Roseville Medical Center. From 2016
|
|||
|
through 2018, he served as the Vice
|
|||
|
President of Strategy for the Sutter
|
|||
|
Health Valley Area, which includes
|
|||
|
11 hospitals, 13 ambulatory surgery
|
|||
|
centers, 16,000 employees, and
|
|||
|
1,900 physicians.
|
|||
|
Interested Trustee and Interested Adviser(2)
|
|||
|
Neil J. Hennessy
|
January 1996 as
|
Mr. Neil Hennessy has been employed
|
Hennessy
|
|
67
|
a Trustee and
|
by Hennessy Advisors, Inc. since
|
Advisors, Inc.
|
|
Chairman of the Board,
|
June 2008 as
|
1989 and currently serves as its
|
|
|
Chief Market Strategist,
|
an Officer
|
Chairman and Chief Executive Officer.
|
|
|
Portfolio Manager,
|
|||
|
and President
|
|||
|
A.J. Hennessy
|
December 2022
|
Mr. A.J. Hennessy has been employed
|
None.
|
|
37
|
by Hennessy Advisors, Inc. since 2011.
|
||
|
Adviser to the Board
|
|||
|
and Vice President,
|
|||
|
Corporate Development
|
|||
|
and Operations
|
|||
|
WWW.HENNESSYFUNDS.COM
|
30
|
TRUSTEES AND OFFICERS OF THE FUND
|
|
Name, Age,
|
||
|
and Position Held
|
Start Date
|
Principal Occupation(s)
|
|
with the Trust
|
of Service
|
During Past Five Years
|
|
Officers
|
||
|
Teresa M. Nilsen
|
January 1996
|
Ms. Nilsen has been employed by Hennessy Advisors, Inc.
|
|
57
|
since 1989 and currently serves as its President, Chief
|
|
|
Executive Vice President
|
Operating Officer, and Secretary.
|
|
|
and Treasurer
|
||
|
Daniel B. Steadman
|
March 2000
|
Mr. Steadman has been employed by Hennessy Advisors, Inc.
|
|
67
|
since 2000 and currently serves as its Executive Vice President.
|
|
|
Executive Vice President
|
||
|
and Secretary
|
||
|
Brian Carlson
|
December 2013
|
Mr. Carlson has been employed by Hennessy Advisors, Inc.
|
|
51
|
since December 2013 and currently serves as its Chief
|
|
|
Senior Vice President
|
Compliance Officer and Senior Vice President.
|
|
|
and Head of Distribution
|
||
|
David Ellison(3)
|
October 2012
|
Mr. Ellison has been employed by Hennessy Advisors, Inc.
|
|
65
|
since October 2012. He has served as a Portfolio Manager of
|
|
|
Senior Vice President
|
the Hennessy Large Cap Financial Fund and the Hennessy
|
|
|
and Portfolio Manager
|
Small Cap Financial Fund since their inception. Mr. Ellison also
|
|
|
served as a Portfolio Manager of the Hennessy Technology
|
||
|
Fund from its inception until February 2017. Mr. Ellison served
|
||
|
as Director, CIO, and President of FBR Fund Advisers, Inc.
|
||
|
from December 1999 to October 2012.
|
||
|
Jennifer Emerson(4)
|
June 2013
|
Ms. Emerson has been employed by Hennessy Advisors, Inc.
|
|
46
|
as its General Counsel since June 2013.
|
|
|
Senior Vice President and
|
||
|
Chief Compliance Officer
|
||
|
Ryan Kelley(5)
|
March 2013
|
Mr. Kelley has been employed by Hennessy Advisors, Inc. since
|
|
51
|
October 2012. He has served as Chief Investment Officer of the
|
|
|
Senior Vice President,
|
Hennessy Funds since March 2021 and has served as a Portfolio
|
|
|
Chief Investment Officer,
|
Manager of the Hennessy Gas Utility Fund, the Hennessy Large
|
|
|
and Portfolio Manager
|
Cap Financial Fund, and the Hennessy Small Cap Financial Fund
|
|
|
since October 2014. Mr. Kelley served as Co-Portfolio Manager
|
||
|
of these same funds from March 2013 through September
|
||
|
2014 and as a Portfolio Analyst for the Hennessy Funds from
|
||
|
October 2012 through February 2013. He has also served as a
|
||
|
Portfolio Manager of the Hennessy Cornerstone Growth Fund,
|
||
|
the Hennessy Cornerstone Mid Cap 30 Fund, the Hennessy
|
||
|
Cornerstone Large Growth Fund, and the Hennessy
|
||
|
Cornerstone Value Fund since February 2017 and as a Portfolio
|
||
|
Manager of the Hennessy Total Return Fund, the Hennessy
|
||
|
Balanced Fund, and the Hennessy Technology Fund since May
|
||
|
2018. He previously served as Co-Portfolio Manager of the
|
||
|
Hennessy Technology Fund from February 2017 until May 2018.
|
||
|
Mr. Kelley served as Portfolio Manager of FBR Fund
|
||
|
Advisers, Inc. from January 2008 to October 2012.
|
|
HENNESSY FUNDS
|
1-800-966-4354
|
31
|
Name, Age,
|
||
|
and Position Held
|
Start Date
|
Principal Occupation(s)
|
|
with the Trust
|
of Service
|
During Past Five Years
|
|
L. Joshua Wein(5)
|
September 2018
|
Mr. Wein has been employed by Hennessy Advisors, Inc. since
|
|
50
|
2018. He has served as Portfolio Manager of the Hennessy
|
|
|
Vice President and
|
Cornerstone Growth Fund, the Hennessy Cornerstone Mid Cap
|
|
|
Portfolio Manager
|
30 Fund, the Hennessy Cornerstone Large Growth Fund, the
|
|
|
Hennessy Cornerstone Value Fund, Hennessy Total Return Fund,
|
||
|
the Hennessy Balanced Fund, the Hennessy Gas Utility Fund,
|
||
|
and the Hennessy Technology Fund since February 2021, and
|
||
|
as the Co-Portfolio Manager of these Funds since February
|
||
|
2019. He served as a Senior Analyst of those same Funds from
|
||
|
September 2018 through February 2019. He also has served as
|
||
|
a Portfolio Manager of the Hennessy Energy Transition Fund
|
||
|
and the Hennessy Midstream Fund since January 2022.
|
||
|
Mr. Wein served as Director of Alternative Investments and
|
||
|
Co-Portfolio Manager at Sterling Capital Management
|
||
|
from 2008 to 2018.
|
_______________
|
(1)
|
The Funds have determined that Mr. DeSousa, Mr. Doyle, Mr. Franklin, Ms. Garvie, and Mr. Richardson are not interested persons, as defined in the 1940 Act, of the Investment
Manager or of any predecessor investment adviser for purposes of Section 15(f) of the 1940 Act.
|
|
(2)
|
Each of Neil J. Hennessy and A.J. Hennessy is considered an interested person, as defined in the 1940 Act, because he is an officer of the Trust.
|
|
(3)
|
The address of this officer is 101 Federal Street, Suite 1615B, Boston, MA 02110.
|
|
(4)
|
The address of this officer is 4800 Bee Caves Road, Suite 100, Austin, TX 78746.
|
|
(5)
|
The address of this officer is 1340 Environ Way, Chapel Hill, NC 27517.
|
|
WWW.HENNESSYFUNDS.COM
|
32
|
TRUSTEES AND OFFICERS OF THE FUND
|
(This Page Intentionally Left Blank.)
|
HENNESSY FUNDS
|
1-800-966-4354
|
33
Expense Example (Unaudited)
October 31, 2023
As a shareholder of the Fund, you incur ongoing costs, including management fees, service fees, and other Fund expenses. This Example is intended to help you understand your ongoing costs (in dollars) of
investing in the Fund and to compare these costs with the ongoing costs of investing in other investment funds. The Example is based on an investment of $1,000 invested at the beginning of the period and held for the entire period
from May 1, 2023, through October 31, 2023.
Actual Expenses
In the table below, the first line under each of the “Investor Class” and “Institutional Class” headings provides information about actual account values and actual expenses for each share class. You may
use this information, together with the amount you invested, to estimate the expenses that you paid over the period. Simply divide your account value by $1,000 (for example, an $8,600 account value divided by $1,000 = 8.6), then
multiply the result by the number in the first line under the heading “Expenses Paid During Period” to estimate the expenses you paid on your account during this period. Although the Fund charges no sales loads or transaction fees,
you will be assessed fees for outgoing wire transfers, returned checks, and stop payment orders at prevailing rates charged by U.S. Bank Global Fund Services, the Fund’s transfer agent. If you request that a redemption be made by
wire transfer, the Fund’s transfer agent charges a $15 fee. IRAs are charged a $15 annual maintenance fee (up to $30 maximum per shareholder for shareholders with multiple IRAs). The examples below include, but are not limited to,
management, shareholder servicing, accounting, custody, and transfer agent fees. However, the examples below do not include portfolio trading commissions and related expenses.
Hypothetical Example for Comparison Purposes
In the table below, the second line under each of the “Investor Class” and “Institutional Class” headings provides information about hypothetical account values and hypothetical expenses based on the
Fund’s actual expense ratio for each share class and an assumed rate of return of 5% per year before expenses, which is not the Fund’s actual return for such share class. The hypothetical account values and expenses may not be used
to estimate the actual ending account balance or expenses you paid for the period. You may use this information to compare the ongoing costs of investing in the Fund and other funds. To do so, compare these 5% hypothetical examples
with the 5% hypothetical examples that appear in the shareholder reports of the other funds. Please note that the expenses shown in the table are meant to highlight your ongoing costs only. Therefore, the second lines under
“Investor Class” and “Institutional Class” are useful in comparing ongoing costs only and will not help you determine the relative total costs of owning different funds.
|
WWW.HENNESSYFUNDS.COM
|
34
|
EXPENSE EXAMPLE
|
|
Expenses Paid
|
|||
|
Beginning
|
Ending
|
During Period(1)
|
|
|
Account Value
|
Account Value
|
May 1, 2023 –
|
|
|
May 1, 2023
|
October 31, 2023
|
October 31, 2023
|
|
|
Investor Class
|
|||
|
Actual
|
$1,000.00
|
$1,001.00
|
$8.27
|
|
Hypothetical (5% return before expenses)
|
$1,000.00
|
$1,016.94
|
$8.34
|
|
Institutional Class
|
|||
|
Actual
|
$1,000.00
|
$1,002.50
|
$6.76
|
|
Hypothetical (5% return before expenses)
|
$1,000.00
|
$1,018.45
|
$6.82
|
|
(1)
|
Expenses are equal to the Fund’s annualized expense ratio of 1.64% for Investor Class shares or 1.34% for Institutional Class shares, as applicable, multiplied by the average account value over the
period, multiplied by 184/365 days (to reflect the half-year period).
|
|
HENNESSY FUNDS
|
1-800-966-4354
|
35
How to Obtain a Copy of the Fund’s Proxy
Voting Policy and Proxy Voting Records
A description of the policies and procedures the Fund uses to determine how to vote proxies relating to portfolio securities is available without charge (1) by calling 800-966-4354, (2) on the Hennessy
Funds’ website at www.hennessyfunds.com/proxy-voting/voting-policy, or (3) on the U.S. Securities and Exchange Commission’s (the “SEC”) website at www.sec.gov. The Fund’s proxy voting record is available without charge on both the
Hennessy Funds’ website at www.hennessyfunds.com/proxy-voting/voting-record and the SEC’s website at www.sec.gov no later than August 31 for the prior 12 months ending June 30.
Availability of Quarterly Portfolio Schedule
The Fund files a complete schedule of portfolio holdings with the SEC for the first and third quarters of each fiscal year as an exhibit to its reports on Form N-PORT. The Fund’s Form N-PORT reports are
available on the SEC’s website at www.sec.gov or on request by calling 800-966-4354.
Federal Tax Distribution Information (Unaudited)
For fiscal year 2023, certain dividends paid by the Fund may be subject to a maximum tax rate of 23.8%, as provided for by the Jobs and Growth Tax Relief Reconciliation Act of 2003. The percentage of
dividends declared from ordinary income designated as qualified dividend income was 100.00%.
For corporate shareholders, the percent of ordinary income distributions that qualified for the corporate dividends received deduction for fiscal year 2023 was 100.00%.
The percentage of taxable ordinary income distributions that were designated as short-term capital gain distributions under Section 871(k)(2)(C) of the Internal Revenue Code of 1986, as
amended, for the Fund was 0.00%.
Important Notice Regarding Delivery
of Shareholder Documents
To help keep the Fund’s costs as low as possible, we generally deliver a single copy of shareholder reports, proxy statements, and prospectuses to shareholders who share an address and have the same
last name. This process does not apply to account statements. You may request an individual copy of a shareholder document at any time. If you would like to receive separate mailings of shareholder documents, please call U.S. Bank
Global Fund Services at 800-261-6950 or 414-765-4124, and individual delivery will begin within 30 days of your request. If your account is held through a financial institution or other intermediary, please contact such intermediary
directly to request individual delivery.
Electronic Delivery
As currently permitted by SEC regulations, the Fund’s shareholder reports are made available on a website, and unless you sign for eDelivery or elect to receive paper copies as detailed below, you will be
notified by mail each time a report is posted and provided with a website link to access the report.
To elect to receive paper copies of all future reports free of charge, please call U.S. Bank Global Fund Services at 800-261-6950 or 414-765-4124.
The Fund also offers shareholders the option to receive all notices, account statements, prospectuses, tax forms, and shareholder reports electronically. To sign up for eDelivery or
change your delivery preference, please visit www.hennessyfunds.com/account.
Shareholder reports transmitted after July 24, 2024, will comply with the new tailored shareholder reporting requirements, which require streamlined annual and semi-annual reports to
shareholders that highlight key information. These reports will be transmitted in paper unless a shareholder elects to receive reports electronically via eDelivery. To sign up for eDelivery, please visit
http://www.hennessyfunds.com/account.
Subscribe to receive our team’s unique market and sector insights delivered to your inbox
www.hennessyfunds.com/subscribe
Follow us on social media
| |
|
|
|
|
WWW.HENNESSYFUNDS.COM
|
36
|
PROXY VOTING — PRIVACY POLICY
|
Liquidity Risk Management Program
In accordance with Rule 22e-4 under the Investment Company Act of 1940, as amended (the “Liquidity Rule”), we have adopted and implemented a liquidity risk management program (the “Liquidity Program”). The
purpose of the Liquidity Program is to assess and manage the Fund’s liquidity risk, which is the risk that the Fund would not be able to meet requests to redeem Fund shares without significant dilution of the remaining shareholders’
interests in the Fund. The Board of Trustees of the Fund (the “Board”) designated a committee comprising representatives of Hennessy Advisors, Inc., the investment adviser to the Fund, as the administrator of the Liquidity Program
(the “Program Administrator”).
The Program Administrator provided a written report regarding the Liquidity Program to the Board in advance of its meeting on June 7, 2023. The report covered the period from June 1,
2022, through May 31, 2023. The report addressed the operation of the Liquidity Program, assessed the adequacy and effectiveness of its implementation, and described any material changes to the Liquidity Program during the review
period. The Trust’s chief compliance officer presented the report to the Board at the meeting and provided additional information regarding the Liquidity Program. The Board reviewed the Liquidity Program and considered, among other
items, the following:
|
1.
|
The Program Administrator reviewed daily historical net redemption activity during the review period and during prior periods with higher-than-average redemption activity and concluded that the
Fund has historically been able to meet requests to redeem Fund shares without significant dilution to the Fund’s remaining shareholders, and the Program Administrator expects the Fund to be able to continue to do so in the
future during both normal and reasonably foreseeable stressed conditions.
|
|
|
2.
|
The Fund primarily holds assets that are highly liquid investments and is not required to establish a highly liquid investment minimum for the Fund or adopt policies and procedures for responding
to a highly liquid investment minimum shortfall.
|
|
|
3.
|
The Program Administrator did not make or recommend any material changes to the Liquidity Program during the review period.
|
|
|
4.
|
The Program Administrator concluded that the Liquidity Program was reasonably designed to assess and manage the Fund’s liquidity risk, complies with the requirements of the Liquidity Rule, and was
operating as intended during the review period.
|
Privacy Policy
We collect the following personal information about you:
|
1.
|
Information we receive from you in applications or other forms, correspondence, or conversations, including, but not limited to, your name, address, phone number, social security number, assets,
income, and date of birth;
|
|
|
2.
|
Information about your transactions with us, our affiliates, or others, including, but not limited to, your account number and balance, payments history, parties to transactions, cost basis
information, and other financial information; and
|
|
HENNESSY FUNDS
|
1-800-966-4354
|
37
|
3.
|
Other personal information we collect from various sources, even if you have not entered into a prior transaction with us, including the following:
|
|
•
|
Name, alias, address, unique personal identifier, online identifier, IP address, email address, telephone number, account name, and other similar identifiers;
|
||
|
•
|
Age and marital status;
|
||
|
•
|
Commercial information, including records of products purchased;
|
||
|
•
|
Browsing history, search history, and information on interaction with our website;
|
||
|
•
|
Geolocation data;
|
||
|
•
|
Employment and employment history, educational history, financial information, and purchasing and consuming histories or tendencies; and
|
||
|
•
|
Inferences drawn from the above-listed information to create a profile about your preferences, characteristics, predispositions, and behavior.
|
We collect this information directly from you, indirectly in the course of providing services to you, directly and indirectly from your activity on our website, from broker dealers,
marketing agencies, and other third parties that interact with us in connection with the services we perform and products we offer, and from anonymized and aggregated consumer information.
We use this information to fulfill the reason you provided the information to us, to provide you with other relevant products that you request from us, to provide you with information
about products that may interest you, to improve our website or present our website’s contents to you, and as otherwise described to you when collecting your personal information.
We do not disclose any personal information to unaffiliated third parties, except as permitted by law. We may disclose your personal information to our affiliates, vendors, and service
providers for a business purpose. For example, we are permitted by law to disclose all of the information we collect, as described above, to our transfer agent to process your transactions. When disclosing your personal information
to third parties, we enter into a contract with each third party describing the purpose of such disclosure and requiring that such personal information be kept confidential and not used for any purpose except to perform the services
contracted or respond to regulatory or law enforcement requests.
Furthermore, we restrict access to your personal information to those persons who require such information to provide products or services to you. As a result, we do not provide a means
for opting out of our limited sharing of your information. We maintain physical, electronic, and procedural safeguards that comply with federal standards to guard your personal information.
If you hold shares of the Funds through a financial intermediary, including, but not limited to, a broker-dealer, bank, or trust company, the privacy policy of your financial
intermediary governs how your personal information is shared with unaffiliated third parties.
If you live in a state such as California where the laws provide further privacy rights, we will not share information unless the law allows, and we will comply with the other
state-specific requirements.
|
WWW.HENNESSYFUNDS.COM
|
38
|
PRIVACY POLICY
|
Supplemental Privacy Notice for Residents of California
The California Consumer Privacy Act of 2018 (the “CCPA”) provides you, as a California resident, with certain additional rights relating to your personal information.
Under the CCPA, you have the right to request that we disclose to you the categories of personal information we have collected about you over the past 12 months, the categories of
sources of such information, our business purpose for collecting the information, the categories of third parties, if any, with whom we shared the information, and the specific information we have collected about you. You also have
the right to request that we delete any of your personal information, and, unless an exception applies, we will delete such information upon receiving and confirming your request. To make a request, call us at 1-800-966-4354, email
us at privacy@hennessyfunds.com, or go to www.hennessyfunds.com/contact. We will not discriminate against you for exercising your rights under the CCPA. Further, we will not collect additional categories of your personal information
or use the personal information we collected for materially different, unrelated, or incompatible purposes without providing you notice.
|
HENNESSY FUNDS
|
1-800-966-4354
|
39
(This Page Intentionally Left Blank.)
For information, questions, or assistance, please call
The Hennessy Funds
800-966-4354 or 415-899-1555
INVESTMENT ADVISOR
Hennessy Advisors, Inc.
7250 Redwood Boulevard, Suite 200
Novato, California 94945
ADMINISTRATOR,
TRANSFER AGENT,
DIVIDEND PAYING AGENT, &
SHAREHOLDER SERVICING AGENT
U.S. Bancorp Fund Services, LLC
d/b/a U.S. Bank Global Fund Services
P.O. Box 701
Milwaukee, Wisconsin 53201-0701
CUSTODIAN
U.S. Bank N.A.
Custody Operations
1555 North River Center Drive, Suite 302
Milwaukee, Wisconsin 53212
TRUSTEES
Neil J. Hennessy
Robert T. Doyle
J. Dennis DeSousa
Doug Franklin
Claire Garvie
Gerald P. Richardson
COUNSEL
Foley & Lardner LLP
777 East Wisconsin Avenue
Milwaukee, Wisconsin 53202-5306
INDEPENDENT REGISTERED
PUBLIC ACCOUNTING FIRM
Tait, Weller & Baker LLP
Two Liberty Place
50 South 16th Street, Suite 2900
Philadelphia, Pennsylvania 19102-2529
DISTRIBUTOR
Quasar Distributors, LLC
111 East Kilbourn Avenue, Suite 1250
Milwaukee, Wisconsin 53202
www.hennessyfunds.com | 800-966-4354
This report has been prepared for shareholders and may be distributed to
others only if preceded or accompanied by a current prospectus.
ANNUAL REPORT
OCTOBER 31, 2023

HENNESSY TECHNOLOGY FUND
Investor Class HTECX
Institutional Class HTCIX
www.hennessyfunds.com | 1-800-966-4354
(This Page Intentionally Left Blank.)
Contents
|
Letter to Shareholders
|
2
|
|
|
Performance Overview
|
6
|
|
|
Financial Statements
|
||
|
Schedule of Investments
|
9
|
|
|
Statement of Assets and Liabilities
|
13
|
|
|
Statement of Operations
|
14
|
|
|
Statements of Changes in Net Assets
|
15
|
|
|
Financial Highlights
|
16
|
|
|
Notes to the Financial Statements
|
20
|
|
|
Report of Independent Registered Public Accounting Firm
|
29
|
|
|
Trustees and Officers of the Fund
|
30
|
|
|
Expense Example
|
34
|
|
|
Proxy Voting Policy and Proxy Voting Records
|
36
|
|
|
Availability of Quarterly Portfolio Schedule
|
36
|
|
|
Federal Tax Distribution Information
|
36
|
|
|
Important Notice Regarding Delivery of Shareholder Documents
|
36
|
|
|
Electronic Delivery
|
36
|
|
|
Liquidity Risk Management Program
|
37
|
|
|
Privacy Policy
|
37
|
|
HENNESSY FUNDS
|
1-800-966-4354
|
November 2023
Dear Hennessy Funds Shareholder:
Market Myopia: Tough Beginnings & Fantastic Finishes
During an interview this summer, I was reminded how important it is to maintain a long-term view of the market and investing and how easy it is to focus on the very recent past. In mid-July, when the
Nasdaq Composite Index was soaring to new 2023 highs and large-cap tech was once again dominating both returns and news headlines, the interviewer seemed confused – and somewhat disappointed – when I mentioned that even with
2023’s stellar performance, the Nasdaq was negative if you included the prior year (2022) and that during that same time, utilities had outperformed. As of the time of writing this letter, a similar story can be seen when
considering eight technology giants: Microsoft, Tesla, Facebook (Meta), Apple,
Amazon, Netflix, Nvidia, and Google, or “MT. FAANNG” as a much
easier to say (and remember) acronym.(1) MT. FAANNG is up on average a whopping 89.69% in 2023 on a total return basis as of November 7, 2023.
However, this same group was down -46.71% in 2022, a dismal year for large-cap tech. Due to the unforgiving nature of percentages, from the end of 2021 until now, this group of highflyers, believe it or not, is still down -3.14%
on average, despite an incredible 2023.
I like to call this phenomenon “market myopia.” Investors tend to be optimists, as am I. This makes it so much more comforting to forget the “tough beginnings”
when you’d rather remember the “fantastic finishes.” In continuing with the example above, unless you were an investor with prescient foresight, you likely didn’t sell all your MT. FAANNG stocks on January 4, 2022, as the market
started its correction, and you probably didn’t then buy them all back on September 30, 2022, when the market hit its low. An average investor’s experience would be much different than that. Which brings me to the point of all
this: what are some elements of our investment philosophy here at Hennessy Funds?
First, what about timing the market? Simply put, we don’t do it. As Neil Hennessy, our Chief Market Strategist and long-tenured Portfolio Manager, aptly put it,
“It’s not about timing the market, but rather about time in the market.” The long-term annualized return of the market, as measured by the Dow Jones
Industrial Average going back 104 years to 1920, is about 9.6%, and that number would be closer to 7-8% on a real return basis when factoring in inflation. If an investor is poorly timing when to enter and when to exit the market,
it would be very difficult to achieve similar, attractive returns to what they would experience simply by staying invested through a complete market cycle.
We are optimistic investors. We understand that some years or months may be tougher than others, but we tend to think in longer timeframes. An investor solely
invested in the Nasdaq might have looked at their portfolio at the end of 2022 and been extremely disappointed with a -32.51% return. But as Josh Wein, one of our Portfolio Managers with over 25 years of experience, pointed out,
“2022 was what 8% real returns look like.” In other words, with the year prior (2021) providing a +22.21% return and the year after (2023) hitting a +31.21% return, 2022’s dismal performance of -32.51% created an annualized total
return for the Nasdaq of 8.22% over the entire period (December 31, 2020, to November 7, 2023). Josh simply observed that while corrections happen over the course of a market cycle, it’s best not to panic by selling when stocks
are hitting new lows.
_______________
|
(1)
|
The acronym, MT. FAANNG, refers to the following companies: Microsoft Corporation, Tesla, Inc., Meta Platforms, Inc., Amazon.com, Inc., Apple, Inc., Netflix, Inc., NVIDIA Corporation, and
Alphabet, Inc.
|
|
WWW.HENNESSYFUNDS.COM
|
2
|
LETTER TO SHAREHOLDERS
|
Downside risk mitigation is relevant. While we normally remain fully invested within our individual funds, we seek to reduce risk through other means, including
sector diversification and investing in companies that exhibit strong fundamentals at compelling valuations. Dave Ellison, the long-tenured Portfolio Manager of our two financial funds, consistently reminds us, “Losing less money
in difficult markets is more important than making the most in rising ones.”
Finally, we are investors in companies, not traders of stocks. Many of our portfolios hold certain positions for long periods of time, a demonstration of the
Portfolio Managers’ convictions. In fact, both the Hennessy Focus Fund and the Hennessy Large Cap Financial Fund have held some positions for 25 years or more. We recognize that much of the performance of the Hennessy Funds comes
from the actual stocks we own (stock selection) and not from our weightings within certain sectors (sector allocation). Moving in and out of sectors can enhance performance, but it can also hinder it in the same way as market
timing, and it takes a significant number of correct “calls” regarding the macro-environment. We’d rather invest long term than rely on lucky calls. Our highly experienced energy funds Portfolio Manager, Ben Cook, summed up our
philosophy on the macro environment nicely: “While macro-economic trends help to inform our investment process, ultimately it’s the individual stocks with solid fundamentals and attractive valuations that, over time, drive
positive risk-adjusted returns for our funds.”
We are long term investors, staying ever mindful of downside risk while striving to participate in the upside, with each individual fund having its own objective,
process, portfolio construction, and investment criteria.
The stock market has once again seen dramatic differences in stock performance. For our fiscal year ended October 31, 2023, all three broad-based indexes were
positive, although with a large dispersion of total returns, with the Dow Jones Industrial Average up 3.17%, the S&P 500® Index up 10.14%, and
the Nasdaq Composite Index up 17.99%. During our fiscal year, large caps significantly outperformed mid caps and small caps, and growth substantially outperformed value. Large-cap tech once again pushed the overall broader market
higher, as evidenced by the Nasdaq-100 Index posting a return of 27.45%. From a sector point of view, besides Technology, the only other sector with outsized (greater than 10%) returns was Communication Services, while six of the
11 GICS sectors of the S&P 500® Index were negative.
Similar to the overall market, our funds experienced mixed results. Many of our funds exhibit more value-oriented characteristics and, given that value
underperformed growth this year by a significant amount, that negatively affected our relative performance. In addition, three of our funds are sector-specific funds that were invested in underperforming sectors, while six more
are focused on small- and mid-cap stocks in a time period when large caps substantially outperformed. Ten of our 16 mutual funds and our exchange-traded-fund (ETF) posted positive returns for the fiscal year ended October 31,
2023.
Several factors caused this disparity of returns in the market: interest rates and inflation being two of the most important. With the Federal Reserve pausing
interest rate hikes and inflation numbers subsiding, the market reacted positively once it became more apparent that we were not heading into a recession. Consumer demand also remained strong, and unemployment numbers remained
historically low.
We believe that the outlook for U.S. stocks remains positive, primarily as we believe that the Federal Reserve may be done, or close to done, raising interest
rates. Inflation has shown signs of easing, creating a better environment for consumers as well as businesses. The unemployment rate remains near record lows, there are elevated levels of cash on the
|
HENNESSY FUNDS
|
1-800-966-4354
|
3
balance sheets of U.S. companies and in the pockets of many consumers and investors, and there is the prospect of a more dovish Federal Reserve heading into 2024. However, we are cautiously watching
certain parts of the economy for any hints of weakness, including consumer spending and credit issues. While volatility and uncertainty may impact the markets, we encourage investors to stay the course, maintain a diversified
portfolio, and keep a long-term perspective.
We thank you for your continued interest in our Funds and are grateful that you have chosen to invest with us. If you have any questions or would like to speak
with us directly, please call us at (800) 966-4354.
Best regards,
|
|
|
|
|
Ryan C. Kelley, CFA
|
|
|
Chief Investment Officer,
|
|
|
Senior Vice President, and Portfolio Manager
|
Past performance does not guarantee future results.
Mutual fund investing involves risk. Principal loss is possible.
Opinions expressed are those of Ryan C. Kelley and are subject to change, are not guaranteed, and should not be considered investment advice.
The Dow Jones Industrial Average and S&P 500® Index are commonly used to measure the performance of U.S. stocks. The
Nasdaq Composite Index comprises all common stocks listed on The Nasdaq Stock Market and is commonly used to measure the performance of technology-related stocks. The Nasdaq-100 Index includes 100 of the largest domestic and
international non-financial companies listed on The NASDAQ Stock Market based on market capitalization. The indices are used herein for comparative purposes in accordance with SEC regulations. One cannot invest directly in an
index. All returns are shown on a total return basis.
|
WWW.HENNESSYFUNDS.COM
|
4
|
LETTER TO SHAREHOLDERS
|
(This Page Intentionally Left Blank.)
|
HENNESSY FUNDS
|
1-800-966-4354
|
5
Performance Overview (Unaudited)
CHANGE IN VALUE OF $10,000 INVESTMENT
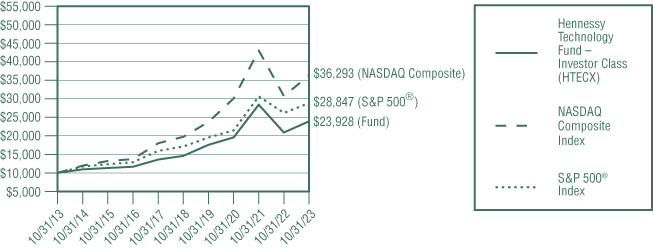
This graph illustrates the performance of an initial investment of $10,000 made in the Fund 10 years ago and assumes the reinvestment of dividends and capital gains.
AVERAGE ANNUAL TOTAL RETURN FOR PERIODS ENDED OCTOBER 31, 2023
|
One
|
Five
|
Ten
|
|
|
Year
|
Years
|
Years
|
|
|
Hennessy Technology Fund –
|
|||
|
Investor Class (HTECX)
|
14.47%
|
10.40%
|
9.12%
|
|
Hennessy Technology Fund –
|
|||
|
Institutional Class (HTCIX)
|
14.77%
|
10.67%
|
9.42%
|
|
Nasdaq Composite Index
|
17.99%
|
12.94%
|
13.76%
|
|
S&P 500® Index
|
10.14%
|
11.01%
|
11.18%
|
|
Expense ratios:
|
Gross 3.06%, Net 1.23%(1)(2) (Investor Class);
|
|
Gross 2.73%, Net 0.98%(1)(2) (Institutional Class)
|
|
(1)
|
The Fund’s investment advisor has contractually agreed to limit expenses until February 28, 2024.
|
|
(2)
|
Certain service provider expenses will be voluntarily waived through July 31, 2025, at which time the arrangement will automatically terminate. In addition, the arrangement will not apply at any
time the Fund’s net assets exceed $125 million.
|
Performance data quoted represents past performance; past performance does not guarantee future results. The investment return and principal value of an investment will fluctuate so
that an investor’s shares, when redeemed, may be worth more or less than their original cost. The performance table does not reflect the deduction of taxes that a shareholder would pay on Fund distributions or the redemption of
Fund shares. Current performance of the Fund may be lower or higher than the performance quoted. Performance data current to the most recent month end may be obtained by visiting www.hennessyfunds.com.
The Nasdaq Composite Index is a broad-based capitalization-weighted index of all common stocks listed on The Nasdaq Stock Market LLC. The S&P 500® Index is a capitalization-weighted index that is designed to represent the broad domestic economy through changes in the aggregate market value of 500 stocks across all major industries. One cannot
invest directly in an index. These indices are used for comparative purposes in accordance with Securities and Exchange Commission regulations.
Standard & Poor’s Financial Services is the source and owner of the S&P® and S&P 500® trademarks.
|
WWW.HENNESSYFUNDS.COM
|
6
|
PERFORMANCE OVERVIEW
|
The expense ratios presented are from the most recent prospectus. The expense ratios for the current reporting period are available in the Financial Highlights section of this report.
PERFORMANCE NARRATIVE
Portfolio Managers Ryan C. Kelley, CFA, and L. Joshua Wein, CAIA
Performance:
For the one-year period ended October 31, 2023, the Investor Class of the Hennessy Technology Fund returned 14.47%, underperforming the Nasdaq Composite Index (the Fund’s primary benchmark), which
returned 17.99%, and outperforming the S&P 500® Index, which returned 10.14%, for the same period.
The Fund’s underperformance relative to its primary benchmark resulted predominantly from stock selection within the Information Technology sector. Among the holdings that detracted
the most from Fund performance were Enphase Energy, Inc., a manufacturer of solar energy equipment, Tower Semiconductor, Ltd., a provider of manufacturing services to semiconductor companies, and dLocal, Ltd., a payment solutions
provider. Among the holdings that contributed the most to Fund performance were Meta Platforms, Inc., a social media company, Jabil, Inc., a contract manufacturer, and Adobe, Inc., a print and electronic media software provider.
The Fund continues to own all the companies mentioned except Tower Semiconductor and dLocal.
Portfolio Strategy:
The Fund utilizes a formula-based investment strategy designed to identify technology-related stocks that (1) exhibit strong cash flows and profits, (2) demonstrate the ability to sustain profitability,
(3) have historically delivered returns in excess of their cost of capital, (4) have attractive balance sheet risk profiles, and (5) trade at attractive relative valuations.
Investment Commentary:
Notwithstanding a rebound in equity prices over the last 12 months, we believe that the outlook for U.S. stocks remains positive. We continue to believe that equities are attractive from a valuation
standpoint, even in the face of an expected slowdown in economic activity. While the Federal Reserve has raised interest rates several times throughout the last year, we believe that the prospect of slower economic growth and
lower inflation numbers could prompt the Federal Reserve to put any further rate hikes on hold. With the unemployment rate near record lows, high levels of cash on the balance sheets of U.S. companies, and the prospect of a more
dovish Federal Reserve in 2024, we remain bullish on equities long-term.
We believe that the outlook for technology-related stocks is also positive. Earnings growth for technology companies, as measured by the technology-heavy Nasdaq Composite Index, has
been outpacing earnings growth for the market by a significant margin. We believe that many technology stocks remain attractive compared to the broader stock market, despite their recent rally.
_______________
Opinions expressed are those of the Portfolio Manager as of the date written and are subject to change, are not guaranteed, and should not be considered investment advice or an indication of trading
intent.
Investments are focused in the Technology sector as well as the following sub-industries: Internet & Direct Marketing Retail, Interactive Home Entertainment, and Interactive Media
Services. Sector funds may be subject to a higher degree of market risk. Investments in foreign securities
|
HENNESSY FUNDS
|
1-800-966-4354
|
7
may involve political, economic, and currency risks, greater volatility, and differences in accounting methods. The Fund invests in small-sized and medium-sized companies, which may
have more limited liquidity and greater volatility than larger companies. Please see the Fund’s prospectus for a more complete discussion of these and other risks.
References to specific securities should not be considered a recommendation to buy or sell any security. Fund holdings and sector allocations are subject to change. Please refer to the Schedule of
Investments included in this report for additional portfolio information.
Earnings growth is not a measure of the Fund’s future performance.
Cash flow refers to the net amount of cash and cash equivalents transferred into and out of a company.
|
WWW.HENNESSYFUNDS.COM
|
8
|
PERFORMANCE OVERVIEW/SCHEDULE OF INVESTMENTS
|
Financial Statements
|
Schedule of Investments as of October 31, 2023
|
HENNESSY TECHNOLOGY FUND
(% of Net Assets)

|
TOP TEN HOLDINGS (EXCLUDING MONEY MARKET FUNDS)
|
% NET ASSETS
|
|
Logitech International SA
|
1.97%
|
|
Microsoft Corp.
|
1.83%
|
|
Shutterstock, Inc.
|
1.81%
|
|
ServiceNow, Inc.
|
1.80%
|
|
Crowdstrike Holdings, Inc.
|
1.78%
|
|
Seagate Technology Holdings PLC
|
1.77%
|
|
Adobe, Inc.
|
1.76%
|
|
ASML Holding NV
|
1.76%
|
|
Motorola Solutions, Inc.
|
1.76%
|
|
Palo Alto Networks, Inc.
|
1.76%
|
Note: For presentation purposes, the Fund has grouped some of the industry categories. For purposes of categorizing securities for compliance with Section 8(b)(1) of the Investment Company Act of 1940,
as amended, the Fund uses more specific industry classifications.
The Global Industry Classification Standard (GICS®) was developed by and is the exclusive property and a service mark of
MSCI, Inc. and Standard & Poor’s Financial Services LLC. It has been licensed for use by the Hennessy Funds.
|
HENNESSY FUNDS
|
1-800-966-4354
|
9
|
COMMON STOCKS – 97.03%
|
Number
|
% of
|
||||||||||
|
|
of Shares
|
Value
|
Net Assets
|
|||||||||
|
Communication Services – 6.86%
|
||||||||||||
|
Cargurus, Inc. (a)
|
6,283
|
$
|
108,256
|
1.71
|
%
|
|||||||
|
Meta Platforms, Inc., Class A (a)
|
357
|
107,553
|
1.69
|
%
|
||||||||
|
Shutterstock, Inc.
|
2,832
|
115,206
|
1.81
|
%
|
||||||||
|
Ziff Davis, Inc. (a)
|
1,730
|
104,596
|
1.65
|
%
|
||||||||
|
|
435,611
|
6.86
|
%
|
|||||||||
|
Information Technology – 90.17%
|
||||||||||||
|
Accenture PLC, Class A
|
356
|
105,764
|
1.67
|
%
|
||||||||
|
Adobe, Inc. (a)
|
210
|
111,733
|
1.76
|
%
|
||||||||
|
Apple, Inc.
|
628
|
107,243
|
1.69
|
%
|
||||||||
|
Applied Materials, Inc.
|
775
|
102,571
|
1.62
|
%
|
||||||||
|
Arrow Electronics, Inc. (a)
|
871
|
98,780
|
1.56
|
%
|
||||||||
|
ASE Technology Holding Co. Ltd.
|
14,502
|
108,040
|
1.70
|
%
|
||||||||
|
ASML Holding NV
|
187
|
111,977
|
1.76
|
%
|
||||||||
|
Atlassian Corp. (a)
|
546
|
98,629
|
1.55
|
%
|
||||||||
|
Autodesk, Inc. (a)
|
523
|
103,360
|
1.63
|
%
|
||||||||
|
Avnet, Inc.
|
2,253
|
104,381
|
1.64
|
%
|
||||||||
|
Broadcom, Inc.
|
131
|
110,219
|
1.74
|
%
|
||||||||
|
Cadence Design Systems, Inc. (a)
|
460
|
110,331
|
1.74
|
%
|
||||||||
|
CDW Corp.
|
546
|
109,418
|
1.72
|
%
|
||||||||
|
Cellebrite DI Ltd. (a)
|
14,435
|
96,426
|
1.52
|
%
|
||||||||
|
Check Point Software Technologies Ltd. (a)
|
819
|
109,951
|
1.73
|
%
|
||||||||
|
Cisco Systems, Inc.
|
2,038
|
106,241
|
1.67
|
%
|
||||||||
|
CommVault Systems, Inc. (a)
|
1,598
|
104,429
|
1.65
|
%
|
||||||||
|
Crowdstrike Holdings, Inc. (a)
|
638
|
112,780
|
1.78
|
%
|
||||||||
|
DXC Technology Co. (a)
|
5,174
|
104,360
|
1.64
|
%
|
||||||||
|
Enphase Energy, Inc. (a)
|
925
|
73,612
|
1.16
|
%
|
||||||||
|
Extreme Networks, Inc. (a)
|
4,411
|
90,955
|
1.43
|
%
|
||||||||
|
Fortinet, Inc. (a)
|
1,839
|
105,136
|
1.66
|
%
|
||||||||
|
Gartner, Inc. (a)
|
313
|
103,929
|
1.64
|
%
|
||||||||
|
Hackett Group, Inc.
|
4,599
|
102,512
|
1.62
|
%
|
||||||||
|
Hewlett Packard Enterprise Co.
|
6,248
|
96,094
|
1.51
|
%
|
||||||||
|
Infosys Ltd.
|
6,392
|
104,957
|
1.65
|
%
|
||||||||
|
Insight Enterprises, Inc. (a)
|
760
|
108,908
|
1.72
|
%
|
||||||||
|
Jabil, Inc.
|
859
|
105,485
|
1.66
|
%
|
||||||||
The accompanying notes are an integral part of these financial statements.
|
WWW.HENNESSYFUNDS.COM
|
10
|
SCHEDULE OF INVESTMENTS
|
|
COMMON STOCKS
|
Number
|
% of
|
||||||||||
|
|
of Shares
|
Value
|
Net Assets
|
|||||||||
|
Information Technology (Continued)
|
||||||||||||
|
KLA Corp.
|
235
|
$
|
110,380
|
1.74
|
%
|
|||||||
|
Lam Research Corp.
|
171
|
100,586
|
1.59
|
%
|
||||||||
|
Logitech International SA
|
1,580
|
124,235
|
1.97
|
%
|
||||||||
|
MACOM Technology Solutions Holdings, Inc. (a)
|
1,326
|
93,536
|
1.47
|
%
|
||||||||
|
Microchip Technology, Inc.
|
1,390
|
99,093
|
1.56
|
%
|
||||||||
|
Microsoft Corp.
|
341
|
115,297
|
1.83
|
%
|
||||||||
|
Motorola Solutions, Inc.
|
401
|
111,663
|
1.76
|
%
|
||||||||
|
NetApp, Inc.
|
1,439
|
104,730
|
1.65
|
%
|
||||||||
|
NVIDIA Corp.
|
243
|
99,095
|
1.56
|
%
|
||||||||
|
NXP Semiconductors NV
|
545
|
93,974
|
1.48
|
%
|
||||||||
|
Palo Alto Networks, Inc. (a)
|
460
|
111,788
|
1.76
|
%
|
||||||||
|
Pure Storage, Inc. (a)
|
3,040
|
102,782
|
1.62
|
%
|
||||||||
|
QUALCOMM, Inc.
|
981
|
106,919
|
1.68
|
%
|
||||||||
|
Sanmina Corp. (a)
|
2,012
|
102,350
|
1.61
|
%
|
||||||||
|
ScanSource, Inc. (a)
|
3,579
|
108,802
|
1.71
|
%
|
||||||||
|
Seagate Technology Holdings PLC
|
1,645
|
112,271
|
1.77
|
%
|
||||||||
|
ServiceNow, Inc. (a)
|
196
|
114,044
|
1.80
|
%
|
||||||||
|
STMicroelectronics NV
|
2,536
|
96,317
|
1.52
|
%
|
||||||||
|
Super Micro Computer, Inc. (a)
|
375
|
89,801
|
1.42
|
%
|
||||||||
|
Taiwan Semiconductor Manufacturing Co. Ltd.
|
1,238
|
106,852
|
1.68
|
%
|
||||||||
|
Telefonaktiebolaget LM Ericsson
|
22,956
|
102,384
|
1.61
|
%
|
||||||||
|
Teradata Corp. (a)
|
2,409
|
102,912
|
1.62
|
%
|
||||||||
|
Texas Instruments, Inc.
|
684
|
97,135
|
1.53
|
%
|
||||||||
|
United Microelectronics Corp. – ADR
|
15,466
|
110,118
|
1.74
|
%
|
||||||||
|
Vishay Intertechnology, Inc.
|
4,337
|
96,455
|
1.52
|
%
|
||||||||
|
VMware, Inc., Class A (a)
|
654
|
95,255
|
1.50
|
%
|
||||||||
|
Vontier Corp.
|
3,549
|
104,908
|
1.65
|
%
|
||||||||
|
|
5,721,903
|
90.17
|
%
|
|||||||||
|
|
||||||||||||
|
Total Common Stocks
|
||||||||||||
|
(Cost $5,551,359)
|
6,157,514
|
97.03
|
%
|
|||||||||
The accompanying notes are an integral part of these financial statements.
|
HENNESSY FUNDS
|
1-800-966-4354
|
11
|
SHORT-TERM INVESTMENTS – 3.12%
|
Number
|
% of
|
||||||||||
|
|
of Shares
|
Value
|
Net Assets
|
|||||||||
|
Money Market Funds – 3.12%
|
||||||||||||
|
First American Treasury Obligations Fund – Class X, 5.275% (b)
|
197,774
|
$
|
197,774
|
3.12
|
%
|
|||||||
|
|
||||||||||||
|
Total Short-Term Investments
|
||||||||||||
|
(Cost $197,774)
|
197,774
|
3.12
|
%
|
|||||||||
|
|
||||||||||||
|
Total Investments
|
||||||||||||
|
(Cost $5,749,133) – 100.15%
|
6,355,288
|
100.15
|
%
|
|||||||||
|
Liabilities in Excess of Other Assets – (0.15)%
|
(9,495
|
)
|
(0.15
|
)%
|
||||||||
|
|
||||||||||||
|
TOTAL NET ASSETS– 100.00%
|
$
|
6,345,793
|
100.00
|
%
|
||||||||
Percentages are stated as a percent of net assets.
ADR – American Depositary Receipt
PLC – Public Limited Company
|
(a)
|
Non-income producing security.
|
|
(b)
|
The rate listed is the fund’s seven-day yield as of October 31, 2023.
|
Summary of Fair Value Exposure as of October 31, 2023
The following is a summary of the inputs used to value the Fund’s net assets as of October 31, 2023 (see Note 3 in the accompanying Notes to the Financial Statements):
|
Common Stocks
|
Level 1
|
Level 2
|
Level 3
|
Total
|
||||||||||||
|
Communication Services
|
$
|
435,611
|
$
|
—
|
$
|
—
|
$
|
435,611
|
||||||||
|
Information Technology
|
5,721,903
|
—
|
—
|
5,721,903
|
||||||||||||
|
Total Common Stocks
|
$
|
6,157,514
|
$
|
—
|
$
|
—
|
$
|
6,157,514
|
||||||||
|
Short-Term Investments
|
||||||||||||||||
|
Money Market Funds
|
$
|
197,774
|
$
|
—
|
$
|
—
|
$
|
197,774
|
||||||||
|
Total Short-Term Investments
|
$
|
197,774
|
$
|
—
|
$
|
—
|
$
|
197,774
|
||||||||
|
Total Investments
|
$
|
6,355,288
|
$
|
—
|
$
|
—
|
$
|
6,355,288
|
||||||||
The accompanying notes are an integral part of these financial statements.
|
WWW.HENNESSYFUNDS.COM
|
12
|
SCHEDULE OF INVESTMENTS/STATEMENT OF ASSETS AND LIABILITIES
|
Financial Statements
|
Statement of Assets and Liabilities as of October 31, 2023
|
|
ASSETS:
|
||||
|
Investments in securities, at value (cost $5,749,133)
|
$
|
6,355,288
|
||
|
Dividends and interest receivable
|
3,926
|
|||
|
Prepaid expenses and other assets
|
15,097
|
|||
|
Due from advisor
|
4,946
|
|||
|
Total assets
|
6,379,257
|
|||
|
LIABILITIES:
|
||||
|
Payable to auditor
|
22,756
|
|||
|
Accrued distribution fees
|
775
|
|||
|
Accrued service fees
|
382
|
|||
|
Accrued trustees fees
|
5,373
|
|||
|
Accrued expenses and other payables
|
4,178
|
|||
|
Total liabilities
|
33,464
|
|||
|
NET ASSETS
|
$
|
6,345,793
|
||
|
NET ASSETS CONSISTS OF:
|
||||
|
Capital stock
|
$
|
6,601,101
|
||
|
Accumulated deficit
|
(255,308
|
)
|
||
|
Total net assets
|
$
|
6,345,793
|
||
|
NET ASSETS:
|
||||
|
Investor Class
|
||||
|
Shares authorized (no par value)
|
Unlimited
|
|||
|
Net assets applicable to outstanding shares
|
$
|
4,353,849
|
||
|
Shares issued and outstanding
|
256,978
|
|||
|
Net asset value, offering price, and redemption price per share
|
$
|
16.94
|
||
|
Institutional Class
|
||||
|
Shares authorized (no par value)
|
Unlimited
|
|||
|
Net assets applicable to outstanding shares
|
$
|
1,991,944
|
||
|
Shares issued and outstanding
|
114,266
|
|||
|
Net asset value, offering price, and redemption price per share
|
$
|
17.43
|
||
The accompanying notes are an integral part of these financial statements.
|
HENNESSY FUNDS
|
1-800-966-4354
|
13
Financial Statements
|
Statement of Operations for the year ended October 31, 2023
|
|
INVESTMENT INCOME:
|
||||
|
Dividend income(1)
|
$
|
61,374
|
||
|
Interest income
|
8,021
|
|||
|
Total investment income
|
69,395
|
|||
|
EXPENSES:
|
||||
|
Investment advisory fees (See Note 5)
|
44,596
|
|||
|
Federal and state registration fees
|
29,219
|
|||
|
Audit fees
|
22,759
|
|||
|
Compliance expense (See Note 5)
|
22,664
|
|||
|
Trustees’ fees and expenses
|
19,646
|
|||
|
Administration, accounting, custody, and transfer agent fees (See Note 5)
|
17,695
|
|||
|
Reports to shareholders
|
6,702
|
|||
|
Distribution fees – Investor Class (See Note 5)
|
6,576
|
|||
|
Sub-transfer agent expenses – Investor Class (See Note 5)
|
5,159
|
|||
|
Sub-transfer agent expenses – Institutional Class (See Note 5)
|
871
|
|||
|
Service fees – Investor Class (See Note 5)
|
4,384
|
|||
|
Legal fees
|
858
|
|||
|
Interest expense (See Note 7)
|
114
|
|||
|
Other expenses
|
4,745
|
|||
|
Total expenses before waivers and reimbursements
|
185,988
|
|||
|
Service provider expense waiver (See Note 5)
|
(17,695
|
)
|
||
|
Expense reimbursement from advisor – Investor Class
|
(72,197
|
)
|
||
|
Expense reimbursement from advisor – Institutional Class
|
(25,964
|
)
|
||
|
Net expenses
|
70,132
|
|||
|
NET INVESTMENT LOSS
|
$
|
(737
|
)
|
|
|
REALIZED AND UNREALIZED GAINS (LOSSES):
|
||||
|
Net realized gain on investments
|
$
|
42,670
|
||
|
Net change in unrealized appreciation/depreciation on investments
|
724,024
|
|||
|
Net increase on investments
|
766,694
|
|||
|
NET INCREASE IN NET ASSETS RESULTING FROM OPERATIONS
|
$
|
765,957
|
||
|
(1)
|
Net of foreign taxes withheld and issuance fees of $5,254.
|
The accompanying notes are an integral part of these financial statements.
|
WWW.HENNESSYFUNDS.COM
|
14
|
STATEMENT OF OPERATIONS/STATEMENTS OF CHANGES IN NET ASSETS
|
Financial Statements
|
Statements of Changes in Net Assets
|
|
Year Ended
|
Year Ended
|
|||||||
|
October 31, 2023
|
October 31, 2022
|
|||||||
|
OPERATIONS:
|
||||||||
|
Net investment income (loss)
|
$
|
(737
|
)
|
$
|
5,524
|
|||
|
Net realized gain (loss) on investments
|
42,670
|
(867,706
|
)
|
|||||
|
Net change in unrealized
|
||||||||
|
appreciation/depreciation on investments
|
724,024
|
(1,169,054
|
)
|
|||||
|
Net increase (decrease) in net
|
||||||||
|
assets resulting from operations
|
765,957
|
(2,031,236
|
)
|
|||||
|
DISTRIBUTIONS TO SHAREHOLDERS:
|
||||||||
|
Distributable earnings – Investor Class
|
(2,801
|
)
|
(1,498,176
|
)
|
||||
|
Distributable earnings – Institutional Class
|
(6,430
|
)
|
(513,645
|
)
|
||||
|
Total distributions
|
(9,231
|
)
|
(2,011,821
|
)
|
||||
|
CAPITAL SHARE TRANSACTIONS:
|
||||||||
|
Proceeds from shares subscribed – Investor Class
|
371,996
|
265,541
|
||||||
|
Proceeds from shares subscribed – Institutional Class
|
522,804
|
89,997
|
||||||
|
Dividends reinvested – Investor Class
|
2,743
|
1,465,101
|
||||||
|
Dividends reinvested – Institutional Class
|
6,429
|
513,645
|
||||||
|
Cost of shares redeemed – Investor Class
|
(569,642
|
)
|
(779,866
|
)
|
||||
|
Cost of shares redeemed – Institutional Class
|
(121,520
|
)
|
(262,162
|
)
|
||||
|
Net increase in net assets derived
|
||||||||
|
from capital share transactions
|
212,810
|
1,292,256
|
||||||
|
TOTAL INCREASE (DECREASE) IN NET ASSETS
|
969,536
|
(2,750,801
|
)
|
|||||
|
NET ASSETS:
|
||||||||
|
Beginning of year
|
5,376,257
|
8,127,058
|
||||||
|
End of year
|
$
|
6,345,793
|
$
|
5,376,257
|
||||
|
CHANGES IN SHARES OUTSTANDING:
|
||||||||
|
Shares sold – Investor Class
|
21,312
|
16,191
|
||||||
|
Shares sold – Institutional Class
|
29,720
|
5,427
|
||||||
|
Shares issued to holders as reinvestment
|
||||||||
|
of dividends – Investor Class
|
189
|
73,365
|
||||||
|
Shares issued to holders as reinvestment
|
||||||||
|
of dividends – Institutional Class
|
433
|
25,019
|
||||||
|
Shares redeemed – Investor Class
|
(33,810
|
)
|
(45,743
|
)
|
||||
|
Shares redeemed – Institutional Class
|
(6,780
|
)
|
(14,199
|
)
|
||||
|
Net increase in shares outstanding
|
11,064
|
60,060
|
||||||
The accompanying notes are an integral part of these financial statements.
|
HENNESSY FUNDS
|
1-800-966-4354
|
15
Financial Statements
|
Financial Highlights
|
For an Investor Class share outstanding throughout each year
PER SHARE DATA:
Net asset value, beginning of year
Income from investment operations:
Net investment income (loss)(1)
Net realized and unrealized gains (losses) on investments
Total from investment operations
Less distributions:
Dividends from net investment income
Dividends from net realized gains
Total distributions
Net asset value, end of year
TOTAL RETURN
SUPPLEMENTAL DATA AND RATIOS:
Net assets, end of year (millions)
Ratio of expenses to average net assets:
Before expense reimbursement
After expense reimbursement
Ratio of net investment income (loss) to average net assets:
Before expense reimbursement
After expense reimbursement
Portfolio turnover rate(4)
|
(1)
|
Calculated using the average shares outstanding method.
|
|
(2)
|
Amount is between $(0.005) and $0.005.
|
|
(3)
|
Certain service provider expenses were voluntarily waived during the fiscal year.
|
|
(4)
|
Calculated on the basis of the Fund as a whole.
|
The accompanying notes are an integral part of these financial statements.
|
WWW.HENNESSYFUNDS.COM
|
16
|
FINANCIAL HIGHLIGHTS — INVESTOR CLASS
|
|
Year Ended October 31,
|
||||||||||||||||||
|
2023
|
2022
|
2021
|
2020
|
2019
|
||||||||||||||
|
$
|
14.81
|
$
|
26.89
|
$
|
20.50
|
$
|
18.90
|
$
|
18.04
|
|||||||||
|
(0.01
|
)
|
0.00
|
(2)
|
(0.02
|
)
|
0.02
|
(0.03
|
)
|
||||||||||
|
2.15
|
(5.38
|
)
|
8.82
|
2.10
|
3.15
|
|||||||||||||
|
2.14
|
(5.38
|
)
|
8.80
|
2.12
|
3.12
|
|||||||||||||
|
(0.01
|
)
|
—
|
(0.04
|
)
|
—
|
—
|
||||||||||||
|
—
|
(6.70
|
)
|
(2.37
|
)
|
(0.52
|
)
|
(2.26
|
)
|
||||||||||
|
(0.01
|
)
|
(6.70
|
)
|
(2.41
|
)
|
(0.52
|
)
|
(2.26
|
)
|
|||||||||
|
$
|
16.94
|
$
|
14.81
|
$
|
26.89
|
$
|
20.50
|
$
|
18.90
|
|||||||||
|
14.47
|
%
|
-26.44
|
%
|
45.11
|
%
|
11.42
|
%
|
20.47
|
%
|
|||||||||
|
$
|
4.35
|
$
|
3.99
|
$
|
6.06
|
$
|
4.26
|
$
|
3.89
|
|||||||||
|
3.17
|
%
|
3.06
|
%
|
2.79
|
%
|
3.45
|
%
|
3.84
|
%
|
|||||||||
|
1.23
|
%(3)
|
1.23
|
%(3)
|
1.23
|
%(3)
|
1.23
|
%(3)
|
1.23
|
%
|
|||||||||
|
(2.02
|
)%
|
(1.81
|
)%
|
(1.64
|
)%
|
(2.12
|
)%
|
(2.80
|
)%
|
|||||||||
|
(0.08
|
)%
|
0.02
|
%
|
(0.08
|
)%
|
0.10
|
%
|
(0.19
|
)%
|
|||||||||
|
101
|
%
|
151
|
%
|
200
|
%
|
192
|
%
|
185
|
%
|
|||||||||
The accompanying notes are an integral part of these financial statements.
|
HENNESSY FUNDS
|
1-800-966-4354
|
17
Financial Statements
|
Financial Highlights
|
For an Institutional Class share outstanding throughout each year
PER SHARE DATA:
Net asset value, beginning of year
Income from investment operations:
Net investment income(1)
Net realized and unrealized gains (losses) on investments
Total from investment operations
Less distributions:
Dividends from net investment income
Dividends from net realized gains
Total distributions
Net asset value, end of year
TOTAL RETURN
SUPPLEMENTAL DATA AND RATIOS:
Net assets, end of year (millions)
Ratio of expenses to average net assets:
Before expense reimbursement
After expense reimbursement
Ratio of net investment income (loss) to average net assets:
Before expense reimbursement
After expense reimbursement
Portfolio turnover rate(3)
|
(1)
|
Calculated using the average shares outstanding method.
|
|
(2)
|
Certain service provider expenses were voluntarily waived during the fiscal year.
|
|
(3)
|
Calculated on the basis of the Fund as a whole.
|
The accompanying notes are an integral part of these financial statements.
|
WWW.HENNESSYFUNDS.COM
|
18
|
FINANCIAL HIGHLIGHTS — INSTITUTIONAL CLASS
|
|
Year Ended October 31,
|
||||||||||||||||||
|
2023
|
2022
|
2021
|
2020
|
2019
|
||||||||||||||
|
$
|
15.26
|
$
|
27.65
|
$
|
21.08
|
$
|
19.40
|
$
|
18.47
|
|||||||||
|
0.03
|
0.05
|
0.05
|
0.07
|
0.01
|
||||||||||||||
|
2.21
|
(5.55
|
)
|
9.06
|
2.15
|
3.23
|
|||||||||||||
|
2.24
|
(5.50
|
)
|
9.11
|
2.22
|
3.24
|
|||||||||||||
|
(0.07
|
)
|
—
|
(0.11
|
)
|
(0.01
|
)
|
—
|
|||||||||||
|
—
|
(6.89
|
)
|
(2.43
|
)
|
(0.53
|
)
|
(2.31
|
)
|
||||||||||
|
(0.07
|
)
|
(6.89
|
)
|
(2.54
|
)
|
(0.54
|
)
|
(2.31
|
)
|
|||||||||
|
$
|
17.43
|
$
|
15.26
|
$
|
27.65
|
$
|
21.08
|
$
|
19.40
|
|||||||||
|
14.77
|
%
|
-26.28
|
%
|
45.49
|
%
|
11.67
|
%
|
20.77
|
%
|
|||||||||
|
$
|
1.99
|
$
|
1.39
|
$
|
2.06
|
$
|
1.47
|
$
|
1.34
|
|||||||||
|
2.85
|
%
|
2.73
|
%
|
2.44
|
%
|
3.08
|
%
|
3.47
|
%
|
|||||||||
|
0.98
|
%(2)
|
0.98
|
%(2)
|
0.98
|
%(2)
|
0.98
|
%(2)
|
0.98
|
%
|
|||||||||
|
(1.70
|
)%
|
(1.48
|
)%
|
(1.29
|
)%
|
(1.74
|
)%
|
(2.43
|
)%
|
|||||||||
|
0.17
|
%
|
0.27
|
%
|
0.17
|
%
|
0.36
|
%
|
0.06
|
%
|
|||||||||
|
101
|
%
|
151
|
%
|
200
|
%
|
192
|
%
|
185
|
%
|
|||||||||
The accompanying notes are an integral part of these financial statements.
|
HENNESSY FUNDS
|
1-800-966-4354
|
19
Financial Statements
|
Notes to the Financial Statements October 31, 2023
|
1). ORGANIZATION
The Hennessy Technology Fund (the “Fund”) is a series of Hennessy Funds Trust (the “Trust”), which was organized as a Delaware statutory trust on September 17, 1992. The Fund is an open-end management
investment company registered under the Investment Company Act of 1940, as amended. The investment objective of the Fund is long-term capital appreciation. The Fund is a diversified fund.
The Fund offers Investor Class and Institutional Class shares. Each class of shares differs principally in its respective 12b-1 distribution and service, shareholder servicing, and
sub-transfer agent expenses. There are no sales charges. Each class has identical rights to earnings, assets, and voting privileges, except for class-specific expenses and exclusive rights to vote on matters affecting only one
class.
As an investment company, the Fund follows the investment company accounting and reporting guidance of the Financial Accounting Standards Board (the “FASB”) Accounting Standard
Codification Topic 946 “Financial Services—Investment Companies.”
2). SIGNIFICANT ACCOUNTING POLICIES
The following is a summary of significant accounting policies consistently followed by the Fund in the preparation of the financial statements. These policies conform to U.S. generally accepted
accounting principles (“GAAP”).
|
a).
|
Securities Valuation – All investments in securities are valued in accordance with the Fund’s valuation policies and procedures, as described in Note 3.
|
|
b).
|
Federal Income Taxes – The Fund has elected to be taxed as a regulated investment company and intends to distribute substantially all of its taxable income to its shareholders and otherwise
comply with the provisions of the Internal Revenue Code of 1986, as amended, applicable to regulated investment companies. As a result, the Fund has made no provision for federal income taxes or excise taxes. Net
investment income/loss and realized gains/losses for federal income tax purposes may differ from those reported in the financial statements because of temporary book-basis and tax-basis differences. Temporary differences
are primarily the result of the treatment of wash sales for tax reporting purposes. The Fund recognizes interest and penalties related to income tax benefits, if any, in the Statement of Operations as an income tax
expense. Distributions from net realized gains for book purposes may include short-term capital gains, which are included as ordinary income to shareholders for tax purposes. The Fund may utilize equalization accounting
for tax purposes and designate earnings and profits, including net realized gains distributed to shareholders on redemption of shares, as part of the dividends paid deduction for income tax purposes.
|
|
Due to inherent differences in the recognition of income, expenses, and realized gains/losses under GAAP and federal income
tax regulations, permanent differences between book and tax basis for reporting are identified and appropriately reclassified in the Statement of Assets and Liabilities, as needed. As of October 31, 2023, no such
reclassifications were required for fiscal year 2023.
|
|
|
c).
|
Accounting for Uncertainty in Income Taxes – The Fund has accounting policies regarding recognition and measurement of tax positions taken or expected to be taken on a tax return. The tax returns
of the Fund for the prior three fiscal years are
|
|
WWW.HENNESSYFUNDS.COM
|
20
|
NOTES TO THE FINANCIAL STATEMENTS
|
|
open for examination. The Fund has reviewed all open tax years in major tax jurisdictions and concluded that there is no impact on the Fund’s net assets and no tax liability resulting from
unrecognized tax benefits relating to uncertain income tax positions taken or expected to be taken on a tax return. The Fund’s major tax jurisdictions are U.S. federal and Delaware.
|
|
|
d).
|
Income and Expenses – Dividend income is recognized on the ex-dividend date or as soon as information is available to the Fund. Interest income, which includes the amortization of premium and
accretion of discount, is recognized on an accrual basis. Market discounts, original issue discounts, and market premiums on debt securities are accreted or amortized to interest income over the life of a security with a
corresponding increase or decrease, as applicable, in the cost basis of such security using the yield-to-maturity method or, where applicable, the first call date of the security. Other non-cash dividends are recognized as
investment income at the fair value of the property received. The Fund is charged for those expenses that are directly attributable to its portfolio, such as advisory, administration, and certain shareholder service fees.
Income, expenses (other than expenses attributable to a specific class), and realized and unrealized gains/losses on investments are allocated to each class of shares based on such class’s net assets.
|
|
e).
|
Distributions to Shareholders – Dividends from net investment income for the Fund, if any, are declared and paid annually, usually in December. Distributions of net realized capital gains, if
any, are declared and paid annually, usually in December.
|
|
f).
|
Security Transactions – Investment and shareholder transactions are recorded on the trade date. The Fund determines the realized gain/loss from an investment transaction by comparing the original
cost of the security lot sold with the net sale proceeds. Discounts and premiums on securities purchased are accreted or amortized, respectively, over the life of each such security.
|
|
g).
|
Use of Estimates – Preparing financial statements in accordance with GAAP requires management to make estimates and assumptions that affect the reported amounts of assets and liabilities and
disclosure of contingent assets and liabilities at the date of the financial statements, as well as the reported change in net assets during the reporting period. Actual results could differ from those estimates.
|
|
h).
|
Share Valuation – The net asset value (“NAV”) per share of the Fund is calculated by dividing (i) the total value of the securities held by the Fund, plus cash and other assets, minus all
liabilities (including estimated accrued expenses) by (ii) the total number of Fund shares outstanding, rounded to the nearest $0.01. Fund shares are not priced on days the New York Stock Exchange is closed for trading.
The offering and redemption price per share for the Fund is equal to the Fund’s NAV per share.
|
|
i).
|
Illiquid Securities – Pursuant to Rule 22e-4 under the 1940 Act, the Fund has adopted a Liquidity Risk Management Program (the “Liquidity Program”). The Liquidity Program requires, among other
things, that the Fund limit its illiquid investments to no more than 15% of its net assets. An illiquid investment is any investment that the Fund reasonably expects cannot be sold or disposed of by the Fund in current
market conditions in seven calendar days or less without the sale or disposition significantly changing the market value of the investment.
|
|
j).
|
Recent Accounting Pronouncements and Regulatory Updates – In October 2022, the Securities and Exchange Commission (“SEC”) adopted a final rule relating to Tailored Shareholder Reports for Mutual
Funds and Exchange-Traded Funds (ETFs); Fee Information in Investment Company Advertisements. The rule and form amendments will require mutual funds and ETFs to transmit concise and visually
|
|
HENNESSY FUNDS
|
1-800-966-4354
|
21
|
engaging shareholder reports that highlight key information. The amendments also will require that funds tag information in a structured data format. In addition, the rule amendments will require
that certain more in-depth information be made available online and available for delivery free of charge to investors on request. The amendments became effective January 24, 2023. There is an 18-month transition period
after the effective date of the amendment.
|
|
|
In June 2022, the FASB issued Accounting Standards Update (“ASU”) 2022-03, Fair Value Measurement (Topic 820): Fair Value
Measurement of Equity Securities Subject to Contractual Sale Restrictions. The ASU clarifies that a contractual restriction on the sale of an equity security is not considered part of the unit of account of the equity
security and, therefore, is not considered in measuring the fair value. The amendments also require additional disclosures related to equity securities subject to contractual sale restrictions. The ASU is effective for
fiscal years beginning after December 15, 2023, and interim periods within those fiscal years.
|
3). SECURITIES VALUATION
The Fund follows its valuation policies and procedures in determining its NAV and, in preparing these financial statements, the fair value accounting standards that establish an authoritative definition
of fair value and set out a hierarchy for measuring fair value. These standards require additional disclosures about the various inputs and valuation techniques used to develop the measurements of fair value and a discussion of
changes in valuation techniques and related inputs during the period. These inputs are summarized in the three broad levels listed below:
|
Level 1 –
|
Unadjusted, quoted prices in active markets for identical instruments that the Fund has the ability to access at the date of measurement.
|
|
|
Level 2 –
|
Other significant observable inputs other than quoted prices included in Level 1 (including, but not limited to, quoted prices in active markets for similar instruments, quoted prices in markets
that are not active for identical or similar instruments, and model-derived valuations in which all significant inputs and significant value drivers are observable in active markets, such as interest rates, prepayment
speeds, credit risk curves, default rates, and similar data).
|
|
|
Level 3 –
|
Significant unobservable inputs (including the Fund’s own assumptions about what market participants would use to price the asset or liability based on the best available information) when
observable inputs are unavailable.
|
The following is a description of the valuation techniques applied to the Fund’s major categories of assets and liabilities on a recurring basis:
|
Equity Securities – Equity securities, including common stocks, preferred stocks, foreign-issued common stocks, exchange-traded funds, closed-end mutual
funds, partnerships, rights, and real estate investment trusts, that are traded on a securities exchange for which a last-quoted sales price is readily available generally are valued at the last sales price as reported by
the primary exchange on which the securities are listed. Securities listed on The Nasdaq Stock Market (“Nasdaq”) generally are valued at the Nasdaq Official Closing Price, which may differ from the last sales price
reported. Securities traded on a securities exchange for which a last-quoted sales price is not readily available generally are valued at the mean between the bid and ask prices. To the extent these securities are actively
traded and valuation adjustments are not applied, they are classified in Level 1 of the fair value hierarchy.
|
|
WWW.HENNESSYFUNDS.COM
|
22
|
NOTES TO THE FINANCIAL STATEMENTS
|
|
Securities traded on foreign exchanges generally are not valued at the same time the Fund calculates its NAV because most foreign markets close well before such time. The earlier close of most
foreign markets gives rise to the possibility that significant events, including broad market moves, may have occurred in the interim. In certain circumstances, it may be determined that a foreign security needs to be fair
valued because it appears that the value of the security might have been materially affected by events occurring after the close of the market in which the security is principally traded, but before the time the Fund
calculates its NAV, such as by a development that affects an entire market or region (e.g., a weather-related event) or a potentially global development (e.g., a terrorist attack that may be expected to have an effect on
investor expectations worldwide).
|
|
|
Registered Investment Companies – Investments in open-end registered investment companies, commonly referred to as mutual funds, generally are priced at
the ending NAV provided by the applicable mutual fund’s service agent and are classified in Level 1 of the fair value hierarchy.
|
|
|
Debt Securities – Debt securities, including corporate bonds, asset-backed securities, mortgage-backed securities, municipal bonds, U.S. Treasuries, and
U.S. government agency issues, are generally valued at market on the basis of valuations furnished by an independent pricing service that utilizes both dealer-supplied valuations and formula-based techniques. The pricing
service may consider recently executed transactions in securities of the issuer or comparable issuers, market price quotations (where observable), bond spreads, and fundamental data relating to the issuer. In addition, the
model may incorporate observable market data, such as reported sales of similar securities, broker quotes, yields, bids, offers, and reference data. Certain securities are valued primarily using dealer quotations. These
securities are generally classified in Level 2 of the fair value hierarchy.
|
|
|
Short-Term Securities – Short-term equity investments, including money market funds, are valued in the manner specified above for equity securities.
Short-term debt investments with an original term to maturity of 60 days or less are valued at amortized cost, which approximates fair market value. If the original term to maturity of a short-term debt investment exceeds
60 days, then the values as of the 61st day prior to maturity are amortized. Amortized cost is not used if its use would be inappropriate due to credit or other impairments of the issuer, in which case the security’s fair
value would be determined as described below. Short-term securities are generally classified in Level 1 or Level 2 of the fair value hierarchy depending on the inputs used and market activity levels for specific
securities.
|
If market quotations are not readily available or if a significant event has occurred that indicates the closing price of a security no longer represents the true value of that
security, any security or other asset will be valued at its fair value in accordance with Rule 2a-5 under the 1940 Act. The Board of Trustees of the Fund (the “Board”) has designated Hennessy Advisors, Inc. (the “Advisor”) as the
Fund’s valuation designee to make all fair value determinations with respect to the Fund’s portfolio investments under the Fund’s fair value pricing procedures, subject to the Board’s oversight. There are numerous criteria
considered in determining a fair value of a security, such as the trading volume of a security and markets, the values of other similar securities, and news events with direct bearing on a security or markets. Fair value pricing
results in an estimated price for a security that reflects the amount the Fund might reasonably expect to receive in a current sale. Depending on the relative significance of the valuation inputs, these securities may be
classified in either Level 2 or Level 3 of the fair value hierarchy. The Advisor will
|
HENNESSY FUNDS
|
1-800-966-4354
|
23
regularly evaluate whether the Fund’s fair value pricing procedures continue to be appropriate in light of the specific circumstances of the Fund and the quality of prices obtained through their
application of such procedures.
The fair value of foreign securities may be determined with the assistance of a pricing service using correlations between the movement of prices of such securities and indices of
domestic securities and other appropriate indicators, such as closing market prices of relevant American Depositary Receipts or futures contracts. Using fair value pricing means that the Fund’s NAV reflects the affected portfolio
securities’ values as determined by the Advisor, the Board’s valuation designee, pursuant to the Fund’s fair value pricing procedures, instead of being determined by the market. Using a fair value pricing methodology to price a
foreign security may result in a value that is different from such foreign security’s most recent closing price and from the value used by other investment companies to calculate their NAVs. Such securities are generally
classified in Level 2 of the fair value hierarchy. Because the Fund may invest in foreign securities, the value of the Fund’s portfolio securities may change on days when a shareholder is unable to purchase or redeem Fund shares.
The Fund has performed an analysis of all existing investments to determine the significance and character of all inputs to their fair value determinations. Various inputs are used to
determine the value of the Fund’s investments. The inputs or methodology used for valuing securities are not necessarily an indication of the risk associated with investing in those securities. Details related to the fair value
hierarchy of the Fund’s securities as of October 31, 2023, are included in the Schedule of Investments.
4). INVESTMENT TRANSACTIONS
Purchases and sales of investment securities (excluding government and short-term investments) for the Fund during fiscal year 2023 were $6,074,307 and $5,912,430, respectively.
There were no purchases or sales/maturities of long-term U.S. government securities for the Fund during fiscal year 2023.
5). INVESTMENT ADVISORY FEE AND OTHER TRANSACTIONS WITH AFFILIATES
The Advisor provides the Fund with investment advisory services under an Investment Advisory Agreement. The Advisor furnishes all investment advice, office space, and facilities and most of the personnel
needed by the Fund. As compensation for its services, the Advisor is entitled to a monthly fee from the Fund. The fee is based on the average daily net assets of the Fund at an annual rate of 0.74%. The net investment advisory
fees expensed by the Fund during fiscal year 2023 are included in the Statement of Operations.
The Advisor has contractually agreed to limit total annual operating expenses to 0.98% of the Fund’s net assets for both Investor Class shares and Institutional Class shares (excluding
all federal, state and local taxes, interest, brokerage commissions, 12b-1 fees, shareholder servicing fees payable to the Advisor, extraordinary items, and acquired fund fees and expenses and other costs incurred in connection
with the purchase and sale of securities) through February 28, 2024.
For three years following the date on which expenses were waived or incurred, the Advisor may recoup waived or reimbursed expenses from the Fund if total operating expenses, including
such recoupment, does not exceed the expense limitation in effect (i) at the time the Advisor waived or reimbursed such expenses and (ii) at the time the
|
WWW.HENNESSYFUNDS.COM
|
24
|
NOTES TO THE FINANCIAL STATEMENTS
|
Advisor recoups such expenses. As of October 31, 2023, expenses subject to potential recovery for Investor Class and Institutional Class shares and the fiscal years in which they expire were as follows:
|
Fiscal Year
|
Fiscal Year
|
Fiscal Year
|
|||||||||||||||
|
2024
|
2025
|
2026
|
Total
|
||||||||||||||
|
Investor Class
|
$
|
75,956
|
$
|
73,628
|
$
|
72,197
|
$
|
221,781
|
|||||||||
|
Institutional Class
|
$
|
23,799
|
$
|
23,122
|
$
|
25,964
|
$
|
72,885
|
|||||||||
The Advisor did not recoup expenses from the Fund during fiscal year 2023.
The Board has approved a Shareholder Servicing Agreement for Investor Class shares of the Fund, which compensates the Advisor for the non-investment advisory services it provides to
the Fund. The Shareholder Servicing Agreement provides for a monthly fee paid to the Advisor at an annual rate of 0.10% of the average daily net assets of the Fund attributable to Investor Class shares. The shareholder service
fees expensed by the Fund during fiscal year 2023 are included in the Statement of Operations.
The Fund has adopted a plan pursuant to Rule 12b-1 under the Investment Company Act of 1940, as amended, that authorizes payments in connection with the distribution of Fund shares at
an annual rate of up to 0.25% of the Fund’s average daily net assets attributable to Investor Class shares. Even though the authorized rate is up to 0.25%, the Fund is currently only using up to 0.15% of its average daily net
assets attributable to Investor Class shares for such purpose. Amounts paid under the plan may be spent on any activities or expenses primarily intended to result in the sale of shares, including, but not limited to, advertising,
shareholder account servicing, printing and mailing of prospectuses to other than current shareholders, printing and mailing of sales literature, and compensation for sales and marketing activities or to financial institutions and
others, such as dealers and distributors. The distribution fees expensed by the Fund during fiscal year 2023 are included in the Statement of Operations.
The Fund has entered into agreements with various brokers, dealers, and financial intermediaries in connection with the sale of Fund shares. The agreements provide for periodic
payments of sub-transfer agent expenses by the Fund to the brokers, dealers, and financial intermediaries for providing certain shareholder maintenance services. These shareholder services include the pre-processing and quality
control of new accounts, shareholder correspondence, answering customer inquiries regarding account status, and facilitating shareholder telephone transactions. The sub-transfer agent fees expensed by the Fund during fiscal year
2023 are included in the Statement of Operations.
U.S. Bancorp Fund Services, LLC, d/b/a U.S. Bank Global Fund Services (“Fund Services”) provides the Fund with administrative, accounting, and transfer agent services. As
administrator, Fund Services is responsible for activities such as (i) preparing various federal and state regulatory filings, reports, and returns for the Fund, (ii) preparing reports and materials to be supplied to the Board,
(iii) monitoring the activities of the Fund’s custodian, transfer agent, and accountants, and (iv) coordinating the preparation and payment of the Fund’s expenses and reviewing the Fund’s expense accruals. U.S. Bank N.A., an
affiliate of Fund Services, serves as the Fund’s custodian. The servicing agreements between the Trust, Fund Services, and U.S. Bank N.A. contain a fee schedule that is inclusive of administrative, accounting, custody, and
transfer agent fees. The administrative, accounting, custody, and transfer agent fees expensed by the Fund during fiscal year 2023 are included in the Statement of Operations. Fund Services has voluntarily waived all or a portion
of its fees for the Fund. The fees voluntarily waived by Fund Services during fiscal year 2023 are included in the Statement of Operations.
|
HENNESSY FUNDS
|
1-800-966-4354
|
25
Quasar Distributors, LLC, a wholly owned broker-dealer subsidiary of Foreside Financial Group, LLC, acts as the Fund’s principal underwriter in a continuous public offering of Fund
shares.
The officers of the Fund are affiliated with the Advisor. With the exception of the Chief Compliance Officer, such officers receive no compensation from the Fund for serving in their
respective roles. The Fund, along with the other funds in the Hennessy Funds family (collectively, the “Hennessy Funds”), makes reimbursement payments on an equal basis to the Advisor for a portion of the salary and benefits
associated with the office of the Chief Compliance Officer. The compliance fees expensed by the Fund during fiscal year 2023 for reimbursement payments to the Advisor are included in the Statement of Operations.
6). GUARANTEES AND INDEMNIFICATIONS
Under the Hennessy Funds’ organizational documents, their officers and trustees are indemnified by the Hennessy Funds against certain liabilities arising out of the performance of their duties to the
Hennessy Funds. Additionally, in the normal course of business, the Hennessy Funds enter into contracts with service providers that contain general indemnification clauses. The Fund’s maximum exposure under these arrangements is
unknown as this would involve future claims that may be made against the Fund that have not yet occurred. Currently, the Fund expects the risk of loss to be remote.
7). LINE OF CREDIT
The Fund has an uncommitted line of credit with the other Hennessy Funds in the amount of the lesser of (i) $100,000,000 or (ii) 33.33% of each Hennessy Fund’s net assets, or 30% for the Hennessy Gas
Utility Fund, the Hennessy Japan Fund, and the Hennessy Japan Small Cap Fund and 10% for the Hennessy Balanced Fund. The line of credit is intended to provide any necessary short-term financing in connection with shareholder
redemptions, subject to certain restrictions. The credit facility is with the Hennessy Funds’ custodian bank, U.S. Bank N.A. Borrowings under this arrangement bear interest at the bank’s prime rate and are secured by all of the
Fund’s assets (as to its own borrowings only). During fiscal year 2023, the Fund had an outstanding average daily balance and a weighted average interest rate of $1,359 and 8.25%, respectively. The interest expensed by the Fund
during fiscal year 2023 is included in the Statement of Operations. The maximum amount outstanding for the Fund during fiscal year 2023 was $60,000. As of October 31, 2023, the Fund did not have any borrowings outstanding under
the line of credit.
8). FEDERAL TAX INFORMATION
As of October 31, 2023, the components of accumulated earnings (losses) for income tax purposes were as follows:
|
Investments
|
|||||
|
Cost of investments for tax purposes
|
$
|
5,762,718
|
|||
|
Gross tax unrealized appreciation
|
$
|
961,825
|
|||
|
Gross tax unrealized depreciation
|
(369,255
|
)
|
|||
|
Net tax unrealized appreciation/(depreciation)
|
$
|
592,570
|
|||
|
Undistributed ordinary income
|
$
|
—
|
|||
|
Undistributed long-term capital gains
|
—
|
||||
|
Total distributable earnings
|
$
|
—
|
|||
|
Other accumulated gain/(loss)
|
$
|
(847,878
|
)
|
||
|
Total accumulated gain/(loss)
|
$
|
(255,308
|
)
|
||
|
WWW.HENNESSYFUNDS.COM
|
26
|
NOTES TO THE FINANCIAL STATEMENTS
|
The difference between book-basis unrealized appreciation/depreciation and tax-basis unrealized appreciation/depreciation (as shown above) is attributable primarily to wash sales.
As of October 31, 2023, the Fund had $106,038 in unlimited long-term and $741,103 in unlimited short-term capital loss carryforwards. During fiscal year 2023, the capital losses
utilized by the Fund were $5,730.
Capital losses sustained in or after fiscal year 2012 can be carried forward indefinitely, but any such loss retains the character of the original loss and must be utilized prior to
any loss incurred before fiscal year 2012. As a result of this ordering rule, capital loss carryforwards incurred prior to fiscal year 2012 may be more likely to expire unused. Capital losses sustained prior to fiscal year 2012
can be carried forward for eight years and can be carried forward as short-term capital losses regardless of the character of the original loss.
As of October 31, 2023, the Fund deferred, on a tax basis, a late-year ordinary loss of $737. Late-year ordinary losses are net ordinary losses incurred after December 31, 2022, but
within the taxable year, that are deemed to arise on the first day of the Fund’s next taxable year.
During fiscal years 2023 and 2022, the tax character of distributions paid by the Fund was as follows:
|
Year Ended
|
Year Ended
|
||||||||
|
October 31, 2023
|
October 31, 2022
|
||||||||
|
Ordinary income(1)
|
$
|
9,231
|
$
|
1,183,102
|
|||||
|
Long-term capital gains
|
—
|
828,719
|
|||||||
|
Total distributions
|
$
|
9,231
|
$
|
2,011,821
|
|||||
|
(1) Ordinary income includes short-term capital gains.
|
|||||||||
9). GLOBAL EVENTS
A rise in protectionist trade policies, the possibility of a national or global recession, risks associated with pandemic and epidemic diseases, trade tensions, the possibility of changes to some
international trade agreements, political events, and continuing political tension and armed conflicts may adversely impact financial markets and the broader economy. For example, ongoing armed conflicts between Ukraine and Russia
in Europe and among Israel, Hamas, and other militant groups in the Middle East have caused and could continue to cause significant market disruptions and volatility with the markets in Europe and the Middle East, and have had
negative impacts on markets in the United States. These events could also have negative effects on the Fund’s investments that cannot be foreseen at the present time. As global systems, economies and financial markets are
increasingly interconnected, events that once had only local impact are now more likely to have regional or even global effects. Events that occur in one country, region or financial market will, more frequently, adversely impact
issuers in other countries, regions, or markets. These impacts can be exacerbated by failures of governments and societies to adequately respond to an emerging event or threat. Your investment would be negatively impacted if the
value of your portfolio holdings decreases as a result of such events, if these events adversely impact the operations and effectiveness of the Advisor or other key service providers or if these events disrupt systems and
processes necessary or beneficial to the management of accounts. These events may negatively impact broad segments of
|
HENNESSY FUNDS
|
1-800-966-4354
|
27
businesses and populations and could have a significant and rapid negative impact on the performance of the Fund’s investments, increase the Fund’s volatility, or exacerbate pre-existing risks to the
Fund.
10). EVENTS SUBSEQUENT TO YEAR END
Management has evaluated the Fund’s related events and transactions that occurred subsequent to October 31, 2023, through the date of issuance of the Fund’s financial statements. Management has
determined that there were no subsequent events requiring recognition or disclosure in the financial statements.
|
WWW.HENNESSYFUNDS.COM
|
28
|
NOTES/REPORT OF INDEPENDENT REGISTERED PUBLIC ACCOUNTING FIRM
|
Report of Independent Registered Public
Accounting Firm
To the Board of Trustees of Hennessy Funds Trust
and the shareholders of the Hennessy Technology Fund
Novato, CA
Opinion on the Financial Statements
We have audited the accompanying statement of assets and liabilities of the Hennessy Technology Fund (the “Fund”), a series of Hennessy Funds Trust, including the schedule of investments, as of October
31, 2023, the related statement of operations for the year then ended, the statements of changes in net assets for each of the two years in the period then ended, financial highlights for each of the five years in the period then
ended, and the related notes (collectively referred to as the “financial statements”). In our opinion, the financial statements present fairly, in all material respects, the financial position of the Fund as of October 31, 2023,
the results of its operations for the year then ended, the changes in its net assets for each of the two years in the period then ended, and the financial highlights for each of the five years in the period then ended, in
conformity with accounting principles generally accepted in the United States of America.
Basis for Opinion
These financial statements are the responsibility of the Fund’s management. Our responsibility is to express an opinion on the Fund’s financial statements based on our audits. We are a public accounting
firm registered with the Public Company Accounting Oversight Board (United States) (“PCAOB”) and are required to be independent with respect to the Fund in accordance with the U.S. federal securities laws and the applicable rules
and regulations of the Securities and Exchange Commission and the PCAOB. We have served as the auditor of one or more of the funds in the Trust since 2002.
We conducted our audits in accordance with the standards of the PCAOB. Those standards require that we plan and perform the audit to obtain reasonable assurance about whether the financial statements are
free of material misstatement, whether due to error or fraud. The Fund is not required to have, nor were we engaged to perform, an audit of its internal control over financial reporting. As part of our audits we are required to
obtain an understanding of internal control over financial reporting, but not for the purpose of expressing an opinion on the effectiveness of the Fund’s internal control over financial reporting. Accordingly, we express no such
opinion.
Our audits included performing procedures to assess the risks of material misstatement of the financial statements, whether due to error or fraud, and performing procedures that respond to those risks.
Such procedures included examining, on a test basis, evidence regarding the amounts and disclosures in the financial statements. Our audits also included evaluating the accounting principles used and significant estimates made by
management, as well as evaluating the overall presentation of the financial statements. Our procedures included confirmation of securities owned as of October 31, 2023 by correspondence with the custodian. We believe that our
audits provide a reasonable basis for our opinion.
|
|
|
TAIT, WELLER & BAKER LLP
|
Philadelphia, Pennsylvania
December 22, 2023
|
HENNESSY FUNDS
|
1-800-966-4354
|
29
Trustees and Officers of the Fund (Unaudited)
The business and affairs of the Funds are managed under the direction of the Board of Trustees of the Trust, and the Board of Trustees elects the officers of the Trust (“Officers”). From time to time,
the Board of Trustees also has appointed advisers to the Board of Trustees (“Advisers”) with the intention of having qualified individuals serve in an advisory capacity to garner experience in the mutual fund and asset management
industry and be considered as potential Trustees in the future. There are currently two Advisers, Brian Alexander and A.J. Hennessy. As Advisers, Mr. Alexander and Mr. A.J. Hennessy attend meetings of the Board of Trustees and act
as non-voting participants. Information pertaining to the Trustees, Advisers, and the Officers of the Trust is set forth below. The Trustees and Officers serve until their successors are duly elected and qualified or until their
earlier death, resignation, or removal. Each Trustee oversees all 17 Hennessy Funds. Unless otherwise indicated, the address of all persons listed below is 7250 Redwood Boulevard, Suite 200, Novato, CA 94945. The Fund’s Statement
of Additional Information includes more information about the persons listed below and is available without charge by calling 800-966-4354 or by visiting www.hennessyfunds.com.
|
Other
|
|||
|
Directorships
|
|||
|
Held Outside
|
|||
|
Name, Age,
|
of Fund
|
||
|
and Position Held
|
Start Date
|
Principal Occupation(s)
|
Complex During
|
|
with the Trust
|
of Service
|
During Past Five Years
|
Past Five Years
|
|
Disinterested Trustees(1) and Disinterested Advisers
|
|||
|
J. Dennis DeSousa
|
January 1996
|
Mr. DeSousa is a real estate investor.
|
None.
|
|
87
|
|||
|
Trustee
|
|||
|
Robert T. Doyle
|
January 1996
|
Mr. Doyle is retired. He served as the
|
None.
|
|
76
|
Sheriff of Marin County, California
|
||
|
Trustee
|
from 1996 to June 2022.
|
||
|
Doug Franklin
|
March 2016
|
Mr. Franklin is a retired insurance
|
None.
|
|
59
|
as an Adviser
|
industry executive. From 1987
|
|
|
Trustee
|
to the Board
|
through 2015, he was employed by
|
|
|
and June 2023
|
the Allianz-Fireman’s Fund Insurance
|
||
|
as a Trustee
|
Company in various positions,
|
||
|
including as its Chief Actuary and
|
|||
|
Chief Risk Officer.
|
|||
|
Claire Garvie
|
December 2015
|
Ms. Garvie is a founder of Kiosk and
|
None.
|
|
49
|
as an Adviser
|
has served as its Chief Operating
|
|
|
Trustee
|
to the Board and
|
Officer since 2004. Kiosk is a
|
|
|
December 2021
|
full-service marketing agency with
|
||
|
as a Trustee
|
offices in the San Francisco Bay Area
|
||
|
and Liverpool, UK and staff across
|
|||
|
nine states in the U.S.
|
|||
|
WWW.HENNESSYFUNDS.COM
|
30
|
TRUSTEES AND OFFICERS OF THE FUND
|
|
Other
|
|||
|
Directorships
|
|||
|
Held Outside
|
|||
|
Name, Age,
|
of Fund
|
||
|
and Position Held
|
Start Date
|
Principal Occupation(s)
|
Complex During
|
|
with the Trust
|
of Service
|
During Past Five Years
|
Past Five Years
|
|
Gerald P. Richardson
|
May 2004
|
Mr. Richardson is an independent
|
None.
|
|
78
|
consultant in the securities industry.
|
||
|
Trustee
|
|||
|
Brian Alexander
|
March 2015
|
Mr. Alexander has served as the
|
None.
|
|
42
|
Chief Operating Officer of Solis
|
||
|
Adviser to the Board
|
Mammography since March 2023.
|
||
|
Prior to that, he worked for the
|
|||
|
Sutter Health organization from
|
|||
|
2011 to 2023 in various positions.
|
|||
|
He served as the Chief Executive
|
|||
|
Officer of the North Valley Hospital
|
|||
|
Area from 2021 to March 2023.
|
|||
|
From 2018 to 2021, he served as the
|
|||
|
Chief Executive Officer of Sutter
|
|||
|
Roseville Medical Center. From 2016
|
|||
|
through 2018, he served as the Vice
|
|||
|
President of Strategy for the Sutter
|
|||
|
Health Valley Area, which includes
|
|||
|
11 hospitals, 13 ambulatory surgery
|
|||
|
centers, 16,000 employees, and
|
|||
|
1,900 physicians.
|
|||
|
Interested Trustee and Interested Adviser(2)
|
|||
|
Neil J. Hennessy
|
January 1996 as
|
Mr. Neil Hennessy has been employed
|
Hennessy
|
|
67
|
a Trustee and
|
by Hennessy Advisors, Inc. since
|
Advisors, Inc.
|
|
Chairman of the Board,
|
June 2008 as
|
1989 and currently serves as its
|
|
|
Chief Market Strategist,
|
an Officer
|
Chairman and Chief Executive Officer.
|
|
|
Portfolio Manager,
|
|||
|
and President
|
|||
|
A.J. Hennessy
|
December 2022
|
Mr. A.J. Hennessy has been employed
|
None.
|
|
37
|
by Hennessy Advisors, Inc. since 2011.
|
||
|
Adviser to the Board
|
|||
|
and Vice President,
|
|||
|
Corporate Development
|
|||
|
and Operations
|
|||
|
HENNESSY FUNDS
|
1-800-966-4354
|
31
|
Name, Age,
|
||
|
and Position Held
|
Start Date
|
Principal Occupation(s)
|
|
with the Trust
|
of Service
|
During Past Five Years
|
|
Officers
|
||
|
Teresa M. Nilsen
|
January 1996
|
Ms. Nilsen has been employed by Hennessy Advisors, Inc.
|
|
57
|
since 1989 and currently serves as its President, Chief
|
|
|
Executive Vice President
|
Operating Officer, and Secretary.
|
|
|
and Treasurer
|
||
|
Daniel B. Steadman
|
March 2000
|
Mr. Steadman has been employed by Hennessy Advisors, Inc.
|
|
67
|
since 2000 and currently serves as its Executive Vice President.
|
|
|
Executive Vice President
|
||
|
and Secretary
|
||
|
Brian Carlson
|
December 2013
|
Mr. Carlson has been employed by Hennessy Advisors, Inc.
|
|
51
|
since December 2013 and currently serves as its Chief
|
|
|
Senior Vice President
|
Compliance Officer and Senior Vice President.
|
|
|
and Head of Distribution
|
||
|
David Ellison(3)
|
October 2012
|
Mr. Ellison has been employed by Hennessy Advisors, Inc.
|
|
65
|
since October 2012. He has served as a Portfolio Manager of
|
|
|
Senior Vice President
|
the Hennessy Large Cap Financial Fund and the Hennessy
|
|
|
and Portfolio Manager
|
Small Cap Financial Fund since their inception. Mr. Ellison also
|
|
|
served as a Portfolio Manager of the Hennessy Technology
|
||
|
Fund from its inception until February 2017. Mr. Ellison served
|
||
|
as Director, CIO, and President of FBR Fund Advisers, Inc.
|
||
|
from December 1999 to October 2012.
|
||
|
Jennifer Emerson(4)
|
June 2013
|
Ms. Emerson has been employed by Hennessy Advisors, Inc.
|
|
46
|
as its General Counsel since June 2013.
|
|
|
Senior Vice President and
|
||
|
Chief Compliance Officer
|
||
|
Ryan Kelley(5)
|
March 2013
|
Mr. Kelley has been employed by Hennessy Advisors, Inc. since
|
|
51
|
October 2012. He has served as Chief Investment Officer of the
|
|
|
Senior Vice President,
|
Hennessy Funds since March 2021 and has served as a Portfolio
|
|
|
Chief Investment Officer,
|
Manager of the Hennessy Gas Utility Fund, the Hennessy Large
|
|
|
and Portfolio Manager
|
Cap Financial Fund, and the Hennessy Small Cap Financial Fund
|
|
|
since October 2014. Mr. Kelley served as Co-Portfolio Manager
|
||
|
of these same funds from March 2013 through September
|
||
|
2014 and as a Portfolio Analyst for the Hennessy Funds from
|
||
|
October 2012 through February 2013. He has also served as a
|
||
|
Portfolio Manager of the Hennessy Cornerstone Growth Fund,
|
||
|
the Hennessy Cornerstone Mid Cap 30 Fund, the Hennessy
|
||
|
Cornerstone Large Growth Fund, and the Hennessy
|
||
|
Cornerstone Value Fund since February 2017 and as a Portfolio
|
||
|
Manager of the Hennessy Total Return Fund, the Hennessy
|
||
|
Balanced Fund, and the Hennessy Technology Fund since May
|
||
|
2018. He previously served as Co-Portfolio Manager of the
|
||
|
Hennessy Technology Fund from February 2017 until May 2018.
|
||
|
Mr. Kelley served as Portfolio Manager of FBR Fund
|
||
|
Advisers, Inc. from January 2008 to October 2012.
|
|
WWW.HENNESSYFUNDS.COM
|
32
|
TRUSTEES AND OFFICERS OF THE FUND
|
|
Name, Age,
|
||
|
and Position Held
|
Start Date
|
Principal Occupation(s)
|
|
with the Trust
|
of Service
|
During Past Five Years
|
|
L. Joshua Wein(5)
|
September 2018
|
Mr. Wein has been employed by Hennessy Advisors, Inc. since
|
|
50
|
2018. He has served as Portfolio Manager of the Hennessy
|
|
|
Vice President and
|
Cornerstone Growth Fund, the Hennessy Cornerstone Mid Cap
|
|
|
Portfolio Manager
|
30 Fund, the Hennessy Cornerstone Large Growth Fund, the
|
|
|
Hennessy Cornerstone Value Fund, Hennessy Total Return Fund,
|
||
|
the Hennessy Balanced Fund, the Hennessy Gas Utility Fund,
|
||
|
and the Hennessy Technology Fund since February 2021, and
|
||
|
as the Co-Portfolio Manager of these Funds since February
|
||
|
2019. He served as a Senior Analyst of those same Funds from
|
||
|
September 2018 through February 2019. He also has served as
|
||
|
a Portfolio Manager of the Hennessy Energy Transition Fund
|
||
|
and the Hennessy Midstream Fund since January 2022.
|
||
|
Mr. Wein served as Director of Alternative Investments and
|
||
|
Co-Portfolio Manager at Sterling Capital Management
|
||
|
from 2008 to 2018.
|
_______________
|
(1)
|
The Funds have determined that Mr. DeSousa, Mr. Doyle, Mr. Franklin, Ms. Garvie, and Mr. Richardson are not interested persons, as defined in the 1940 Act, of the Investment
Manager or of any predecessor investment adviser for purposes of Section 15(f) of the 1940 Act.
|
|
(2)
|
Each of Neil J. Hennessy and A.J. Hennessy is considered an interested person, as defined in the 1940 Act, because he is an officer of the Trust.
|
|
(3)
|
The address of this officer is 101 Federal Street, Suite 1615B, Boston, MA 02110.
|
|
(4)
|
The address of this officer is 4800 Bee Caves Road, Suite 100, Austin, TX 78746.
|
|
(5)
|
The address of this officer is 1340 Environ Way, Chapel Hill, NC 27517.
|
|
HENNESSY FUNDS
|
1-800-966-4354
|
33
Expense Example (Unaudited)
October 31, 2023
As a shareholder of the Fund, you incur ongoing costs, including management fees, service fees, and other Fund expenses. This Example is intended to help you understand your ongoing costs (in dollars) of
investing in the Fund and to compare these costs with the ongoing costs of investing in other investment funds. The Example is based on an investment of $1,000 invested at the beginning of the period and held for the entire period
from May 1, 2023, through October 31, 2023.
Actual Expenses
In the table below, the first line under each of the “Investor Class” and “Institutional Class” headings provides information about actual account values and actual expenses for each share class. You may
use this information, together with the amount you invested, to estimate the expenses that you paid over the period. Simply divide your account value by $1,000 (for example, an $8,600 account value divided by $1,000 = 8.6), then
multiply the result by the number in the first line under the heading “Expenses Paid During Period” to estimate the expenses you paid on your account during this period. Although the Fund charges no sales loads or transaction
fees, you will be assessed fees for outgoing wire transfers, returned checks, and stop payment orders at prevailing rates charged by U.S. Bank Global Fund Services, the Fund’s transfer agent. If you request that a redemption be
made by wire transfer, the Fund’s transfer agent charges a $15 fee. IRAs are charged a $15 annual maintenance fee (up to $30 maximum per shareholder for shareholders with multiple IRAs). The examples below include, but are not
limited to, management, shareholder servicing, accounting, custody, and transfer agent fees. However, the examples below do not include portfolio trading commissions and related expenses.
Hypothetical Example for Comparison Purposes
In the table below, the second line under each of the “Investor Class” and “Institutional Class” headings provides information about hypothetical account values and hypothetical expenses based on the
Fund’s actual expense ratio for each share class and an assumed rate of return of 5% per year before expenses, which is not the Fund’s actual return for such share class. The hypothetical account values and expenses may not be
used to estimate the actual ending account balance or expenses you paid for the period. You may use this information to compare the ongoing costs of investing in the Fund and other funds. To do so, compare these 5% hypothetical
examples with the 5% hypothetical examples that appear in the shareholder reports of the other funds. Please note that the expenses shown in the table are meant to highlight your ongoing costs only. Therefore, the second lines
under “Investor Class” and “Institutional Class” are useful in comparing ongoing costs only and will not help you determine the relative total costs of owning different funds.
|
WWW.HENNESSYFUNDS.COM
|
34
|
EXPENSE EXAMPLE
|
|
Expenses Paid
|
|||
|
Beginning
|
Ending
|
During Period(1)
|
|
|
Account Value
|
Account Value
|
May 1, 2023 –
|
|
|
May 1, 2023
|
October 31, 2023
|
October 31, 2023
|
|
|
Investor Class
|
|||
|
Actual
|
$1,000.00
|
$1,068.80
|
$6.41
|
|
Hypothetical (5% return before expenses)
|
$1,000.00
|
$1,019.00
|
$6.26
|
|
Institutional Class
|
|||
|
Actual
|
$1,000.00
|
$1,070.00
|
$5.11
|
|
Hypothetical (5% return before expenses)
|
$1,000.00
|
$1,020.27
|
$4.99
|
|
(1)
|
Expenses are equal to the Fund’s annualized expense ratio of 1.23% for Investor Class shares or 0.98% for Institutional Class shares, as applicable, multiplied by the average account value over
the period, multiplied by 184/365 days (to reflect the half-year period).
|
|
HENNESSY FUNDS
|
1-800-966-4354
|
35
How to Obtain a Copy of the Fund’s Proxy
Voting Policy and Proxy Voting Records
A description of the policies and procedures the Fund uses to determine how to vote proxies relating to portfolio securities is available without charge (1) by calling 800-966-4354, (2) on the Hennessy
Funds’ website at www.hennessyfunds.com/proxy-voting/voting-policy, or (3) on the U.S. Securities and Exchange Commission’s (the “SEC”) website at www.sec.gov. The Fund’s proxy voting record is available without charge on both the
Hennessy Funds’ website at www.hennessyfunds.com/proxy-voting/voting-record and the SEC’s website at www.sec.gov no later than August 31 for the prior 12 months ending June 30.
Availability of Quarterly Portfolio Schedule
The Fund files a complete schedule of portfolio holdings with the SEC for the first and third quarters of each fiscal year as an exhibit to its reports on Form N-PORT. The Fund’s Form N-PORT reports are
available on the SEC’s website at www.sec.gov or on request by calling 800-966-4354.
Federal Tax Distribution Information (Unaudited)
For fiscal year 2023, certain dividends paid by the Fund may be subject to a maximum tax rate of 23.8%, as provided for by the Jobs and Growth Tax Relief Reconciliation Act of 2003. The percentage of
dividends declared from ordinary income designated as qualified dividend income was 7.34%.
For corporate shareholders, the percent of ordinary income distributions that qualified for the corporate dividends received deduction for fiscal year 2023 was 5.48%.
The percentage of taxable ordinary income distributions that were designated as short-term capital gain distributions under Section 871(k)(2)(C) of the Internal Revenue Code of 1986,
as amended, for the Fund was 0.00%.
Important Notice Regarding Delivery
of Shareholder Documents
To help keep the Fund’s costs as low as possible, we generally deliver a single copy of shareholder reports, proxy statements, and prospectuses to shareholders who share an address and have the same
last name. This process does not apply to account statements. You may request an individual copy of a shareholder document at any time. If you would like to receive separate mailings of shareholder documents, please call U.S. Bank
Global Fund Services at 800-261-6950 or 414-765-4124, and individual delivery will begin within 30 days of your request. If your account is held through a financial institution or other intermediary, please contact such
intermediary directly to request individual delivery.
Electronic Delivery
As currently permitted by SEC regulations, the Fund’s shareholder reports are made available on a website, and unless you sign for eDelivery or elect to receive paper copies as detailed below, you will
be notified by mail each time a report is posted and provided with a website link to access the report.
To elect to receive paper copies of all future reports free of charge, please call U.S. Bank Global Fund Services at 800-261-6950 or 414-765-4124.
The Fund also offers shareholders the option to receive all notices, account statements, prospectuses, tax forms, and shareholder reports electronically. To sign up for eDelivery or
change your delivery preference, please visit www.hennessyfunds.com/account.
Shareholder reports transmitted after July 24, 2024, will comply with the new tailored shareholder reporting requirements, which require streamlined annual and semi-annual reports to
shareholders that highlight key information. These reports will be transmitted in paper unless a shareholder elects to receive reports electronically via eDelivery. To sign up for eDelivery, please visit
http://www.hennessyfunds.com/account.
Subscribe to receive our team’s unique market and sector insights delivered to your inbox
www.hennessyfunds.com/subscribe
Follow us on social media
| |
|
|
|
|
WWW.HENNESSYFUNDS.COM
|
36
|
PROXY VOTING — PRIVACY POLICY
|
Liquidity Risk Management Program
In accordance with Rule 22e-4 under the Investment Company Act of 1940, as amended (the “Liquidity Rule”), we have adopted and implemented a liquidity risk management program (the “Liquidity Program”).
The purpose of the Liquidity Program is to assess and manage the Fund’s liquidity risk, which is the risk that the Fund would not be able to meet requests to redeem Fund shares without significant dilution of the remaining
shareholders’ interests in the Fund. The Board of Trustees of the Fund (the “Board”) designated a committee comprising representatives of Hennessy Advisors, Inc., the investment adviser to the Fund, as the administrator of the
Liquidity Program (the “Program Administrator”).
The Program Administrator provided a written report regarding the Liquidity Program to the Board in advance of its meeting on June 7, 2023. The report covered the period from June 1,
2022, through May 31, 2023. The report addressed the operation of the Liquidity Program, assessed the adequacy and effectiveness of its implementation, and described any material changes to the Liquidity Program during the review
period. The Trust’s chief compliance officer presented the report to the Board at the meeting and provided additional information regarding the Liquidity Program. The Board reviewed the Liquidity Program and considered, among
other items, the following:
|
1.
|
The Program Administrator reviewed daily historical net redemption activity during the review period and during prior periods with higher-than-average redemption activity and concluded that the
Fund has historically been able to meet requests to redeem Fund shares without significant dilution to the Fund’s remaining shareholders, and the Program Administrator expects the Fund to be able to continue to do so in
the future during both normal and reasonably foreseeable stressed conditions.
|
|
|
2.
|
The Fund primarily holds assets that are highly liquid investments and is not required to establish a highly liquid investment minimum for the Fund or adopt policies and procedures for responding
to a highly liquid investment minimum shortfall.
|
|
|
3.
|
The Program Administrator did not make or recommend any material changes to the Liquidity Program during the review period.
|
|
|
4.
|
The Program Administrator concluded that the Liquidity Program was reasonably designed to assess and manage the Fund’s liquidity risk, complies with the requirements of the Liquidity Rule, and
was operating as intended during the review period.
|
Privacy Policy
We collect the following personal information about you:
|
1.
|
Information we receive from you in applications or other forms, correspondence, or conversations, including, but not limited to, your name, address, phone number, social security number, assets,
income, and date of birth;
|
|
|
2.
|
Information about your transactions with us, our affiliates, or others, including, but not limited to, your account number and balance, payments history, parties to transactions, cost basis
information, and other financial information; and
|
|
HENNESSY FUNDS
|
1-800-966-4354
|
37
|
3.
|
Other personal information we collect from various sources, even if you have not entered into a prior transaction with us, including the following:
|
|
•
|
Name, alias, address, unique personal identifier, online identifier, IP address, email address, telephone number, account name, and other similar identifiers;
|
||
|
•
|
Age and marital status;
|
||
|
•
|
Commercial information, including records of products purchased;
|
||
|
•
|
Browsing history, search history, and information on interaction with our website;
|
||
|
•
|
Geolocation data;
|
||
|
•
|
Employment and employment history, educational history, financial information, and purchasing and consuming histories or tendencies; and
|
||
|
•
|
Inferences drawn from the above-listed information to create a profile about your preferences, characteristics, predispositions, and behavior.
|
We collect this information directly from you, indirectly in the course of providing services to you, directly and indirectly from your activity on our website, from broker dealers,
marketing agencies, and other third parties that interact with us in connection with the services we perform and products we offer, and from anonymized and aggregated consumer information.
We use this information to fulfill the reason you provided the information to us, to provide you with other relevant products that you request from us, to provide you with information
about products that may interest you, to improve our website or present our website’s contents to you, and as otherwise described to you when collecting your personal information.
We do not disclose any personal information to unaffiliated third parties, except as permitted by law. We may disclose your personal information to our affiliates, vendors, and service
providers for a business purpose. For example, we are permitted by law to disclose all of the information we collect, as described above, to our transfer agent to process your transactions. When disclosing your personal
information to third parties, we enter into a contract with each third party describing the purpose of such disclosure and requiring that such personal information be kept confidential and not used for any purpose except to
perform the services contracted or respond to regulatory or law enforcement requests.
Furthermore, we restrict access to your personal information to those persons who require such information to provide products or services to you. As a result, we do not provide a
means for opting out of our limited sharing of your information. We maintain physical, electronic, and procedural safeguards that comply with federal standards to guard your personal information.
If you hold shares of the Funds through a financial intermediary, including, but not limited to, a broker-dealer, bank, or trust company, the privacy policy of your financial
intermediary governs how your personal information is shared with unaffiliated third parties.
If you live in a state such as California where the laws provide further privacy rights, we will not share information unless the law allows, and we will comply with the other
state-specific requirements.
|
WWW.HENNESSYFUNDS.COM
|
38
|
PRIVACY POLICY
|
Supplemental Privacy Notice for Residents of California
The California Consumer Privacy Act of 2018 (the “CCPA”) provides you, as a California resident, with certain additional rights relating to your personal information.
Under the CCPA, you have the right to request that we disclose to you the categories of personal information we have collected about you over the past 12 months, the categories of
sources of such information, our business purpose for collecting the information, the categories of third parties, if any, with whom we shared the information, and the specific information we have collected about you. You also
have the right to request that we delete any of your personal information, and, unless an exception applies, we will delete such information upon receiving and confirming your request. To make a request, call us at 1-800-966-4354,
email us at privacy@hennessyfunds.com, or go to www.hennessyfunds.com/contact. We will not discriminate against you for exercising your rights under the CCPA. Further, we will not collect additional categories of your personal
information or use the personal information we collected for materially different, unrelated, or incompatible purposes without providing you notice.
|
HENNESSY FUNDS
|
1-800-966-4354
|
39
(This Page Intentionally Left Blank.)
For information, questions, or assistance, please call
The Hennessy Funds
800-966-4354 or 415-899-1555
INVESTMENT ADVISOR
Hennessy Advisors, Inc.
7250 Redwood Boulevard, Suite 200
Novato, California 94945
ADMINISTRATOR,
TRANSFER AGENT,
DIVIDEND PAYING AGENT, &
SHAREHOLDER SERVICING AGENT
U.S. Bancorp Fund Services, LLC
d/b/a U.S. Bank Global Fund Services
P.O. Box 701
Milwaukee, Wisconsin 53201-0701
CUSTODIAN
U.S. Bank N.A.
Custody Operations
1555 North River Center Drive, Suite 302
Milwaukee, Wisconsin 53212
TRUSTEES
Neil J. Hennessy
Robert T. Doyle
J. Dennis DeSousa
Doug Franklin
Claire Garvie
Gerald P. Richardson
COUNSEL
Foley & Lardner LLP
777 East Wisconsin Avenue
Milwaukee, Wisconsin 53202-5306
INDEPENDENT REGISTERED
PUBLIC ACCOUNTING FIRM
Tait, Weller & Baker LLP
Two Liberty Place
50 South 16th Street, Suite 2900
Philadelphia, Pennsylvania 19102-2529
DISTRIBUTOR
Quasar Distributors, LLC
111 East Kilbourn Avenue, Suite 1250
Milwaukee, Wisconsin 53202
www.hennessyfunds.com | 800-966-4354
This report has been prepared for shareholders and may be distributed to
others only if preceded or accompanied by a current prospectus.
ANNUAL REPORT
OCTOBER 31, 2023

HENNESSY STANCE ESG ETF
Ticker STNC
This ETF is different from traditional ETFs.
Traditional ETFs tell the public what assets they hold each day. This ETF will not. This may create additional risks for your investment. For example:
• You may have to pay more money to trade the ETF’s shares. This ETF will provide less information to traders, who tend to charge more for trades when they have less information.
• The price you pay to buy ETF shares on an exchange may not match the value of the ETF’s portfolio. The same is true when you sell shares. These price differences may be greater for this ETF compared
to other ETFs because it provides less information to traders.
• These additional risks may be even greater in bad or uncertain market conditions.
• The ETF will publish on its website each day a “Portfolio Reference Basket” designed to help trading in shares of the ETF. While the Portfolio Reference Basket includes all the names of the ETF’s
holdings, it is not the ETF’s actual portfolio.
The differences between this ETF and other ETFs may also have advantages. By keeping certain information about the ETF portfolio secret, this ETF may face less risk that other traders can predict or
copy its investment strategy. This may improve the ETF’s performance. If other traders are able to copy or predict the ETF’s investment strategy, however, this may hurt the ETF’s performance.
www.hennessyetfs.com | 1-800-966-4354
(This Page Intentionally Left Blank.)
Contents
|
Letter to Shareholders
|
2
|
|
|
Performance Overview
|
6
|
|
|
Financial Statements
|
||
|
Schedule of Investments
|
9
|
|
|
Statement of Assets and Liabilities
|
13
|
|
|
Statement of Operations
|
14
|
|
|
Statements of Changes in Net Assets
|
15
|
|
|
Financial Highlights
|
16
|
|
|
Notes to the Financial Statements
|
18
|
|
|
Report of Independent Registered Public Accounting Firm
|
28
|
|
|
Trustees and Officers of the Fund
|
29
|
|
|
Expense Example
|
33
|
|
|
Proxy Voting Policy and Proxy Voting Records
|
34
|
|
|
Availability of Quarterly Portfolio Schedule
|
34
|
|
|
Federal Tax Distribution Information
|
34
|
|
|
Premium/Discount Information
|
34
|
|
|
Important Notice Regarding Delivery of Shareholder Documents
|
35
|
|
|
Privacy Policy
|
36
|
|
HENNESSY FUNDS
|
1-800-966-4354
|
November 2023
Dear Hennessy Funds Shareholder:
Market Myopia: Tough Beginnings & Fantastic Finishes
During an interview this summer, I was reminded how important it is to maintain a long-term view of the market and investing and how easy it is to focus on the very recent past. In mid-July, when the
Nasdaq Composite Index was soaring to new 2023 highs and large-cap tech was once again dominating both returns and news headlines, the interviewer seemed confused – and somewhat disappointed – when I mentioned that even with
2023’s stellar performance, the Nasdaq was negative if you included the prior year (2022) and that during that same time, utilities had outperformed. As of the time of writing this letter, a similar story can be seen when
considering eight technology giants: Microsoft, Tesla, Facebook (Meta), Apple,
Amazon, Netflix, Nvidia, and Google, or “MT. FAANNG” as a much
easier to say (and remember) acronym.(1) MT. FAANNG is up on average a whopping 89.69% in 2023 on a total return basis as of November 7, 2023.
However, this same group was down -46.71% in 2022, a dismal year for large-cap tech. Due to the unforgiving nature of percentages, from the end of 2021 until now, this group of highflyers, believe it or not, is still down -3.14%
on average, despite an incredible 2023.
I like to call this phenomenon “market myopia.” Investors tend to be optimists, as am I. This makes it so much more comforting to forget the “tough beginnings”
when you’d rather remember the “fantastic finishes.” In continuing with the example above, unless you were an investor with prescient foresight, you likely didn’t sell all your MT. FAANNG stocks on January 4, 2022, as the market
started its correction, and you probably didn’t then buy them all back on September 30, 2022, when the market hit its low. An average investor’s experience would be much different than that. Which brings me to the point of all
this: what are some elements of our investment philosophy here at Hennessy Funds?
First, what about timing the market? Simply put, we don’t do it. As Neil Hennessy, our Chief Market Strategist and long-tenured Portfolio Manager, aptly put it,
“It’s not about timing the market, but rather about time in the market.” The long-term annualized return of the market, as measured by the Dow
Jones Industrial Average going back 104 years to 1920, is about 9.6%, and that number would be closer to 7-8% on a real return basis when factoring in inflation. If an investor is poorly timing when to enter and when to exit the
market, it would be very difficult to achieve similar, attractive returns to what they would experience simply by staying invested through a complete market cycle.
We are optimistic investors. We understand that some years or months may be tougher than others, but we tend to think in longer timeframes. An investor solely
invested in the Nasdaq might have looked at their portfolio at the end of 2022 and been extremely disappointed with a -32.51% return. But as Josh Wein, one of our Portfolio Managers with over 25 years of experience, pointed out,
“2022 was what 8% real returns look like.” In other words, with the year prior (2021) providing a +22.21% return and the year after (2023) hitting a +31.21% return, 2022’s dismal performance of -32.51% created an annualized
total return for the Nasdaq of 8.22% over the entire period (December 31, 2020, to November 7, 2023). Josh simply observed that while corrections happen over the course of a market cycle, it’s best not to panic by selling when
stocks are hitting new lows.
_______________
|
(1)
|
The acronym, MT. FAANNG, refers to the following companies: Microsoft Corporation, Tesla, Inc., Meta Platforms, Inc., Amazon.com, Inc., Apple, Inc., Netflix, Inc., NVIDIA Corporation, and
Alphabet, Inc.
|
|
WWW.HENNESSYFUNDS.COM
|
2
|
LETTER TO SHAREHOLDERS
|
Downside risk mitigation is relevant. While we normally remain fully invested within our individual funds, we seek to reduce risk through other means, including
sector diversification and investing in companies that exhibit strong fundamentals at compelling valuations. Dave Ellison, the long-tenured Portfolio Manager of our two financial funds, consistently reminds us, “Losing less
money in difficult markets is more important than making the most in rising ones.”
Finally, we are investors in companies, not traders of stocks. Many of our portfolios hold certain positions for long periods of time, a demonstration of the
Portfolio Managers’ convictions. In fact, both the Hennessy Focus Fund and the Hennessy Large Cap Financial Fund have held some positions for 25 years or more. We recognize that much of the performance of the Hennessy Funds
comes from the actual stocks we own (stock selection) and not from our weightings within certain sectors (sector allocation). Moving in and out of sectors can enhance performance, but it can also hinder it in the same way as
market timing, and it takes a significant number of correct “calls” regarding the macro-environment. We’d rather invest long term than rely on lucky calls. Our highly experienced energy funds Portfolio Manager, Ben Cook, summed
up our philosophy on the macro environment nicely: “While macro-economic trends help to inform our investment process, ultimately it’s the individual stocks with solid fundamentals and attractive valuations that, over time,
drive positive risk-adjusted returns for our funds.”
We are long term investors, staying ever mindful of downside risk while striving to participate in the upside, with each individual fund having its own
objective, process, portfolio construction, and investment criteria.
The stock market has once again seen dramatic differences in stock performance. For our fiscal year ended October 31, 2023, all three broad-based indexes were
positive, although with a large dispersion of total returns, with the Dow Jones Industrial Average up 3.17%, the S&P 500® Index up 10.14%, and
the Nasdaq Composite Index up 17.99%. During our fiscal year, large caps significantly outperformed mid caps and small caps, and growth substantially outperformed value. Large-cap tech once again pushed the overall broader
market higher, as evidenced by the Nasdaq-100 Index posting a return of 27.45%. From a sector point of view, besides Technology, the only other sector with outsized (greater than 10%) returns was Communication Services, while
six of the 11 GICS sectors of the S&P 500® Index were negative.
Similar to the overall market, our funds experienced mixed results. Many of our funds exhibit more value-oriented characteristics and, given that value
underperformed growth this year by a significant amount, that negatively affected our relative performance. In addition, three of our funds are sector-specific funds that were invested in underperforming sectors, while six more
are focused on small- and mid-cap stocks in a time period when large caps substantially outperformed. Ten of our 16 mutual funds and our exchange-traded-fund (ETF) posted positive returns for the fiscal year ended October 31,
2023.
Several factors caused this disparity of returns in the market: interest rates and inflation being two of the most important. With the Federal Reserve pausing
interest rate hikes and inflation numbers subsiding, the market reacted positively once it became more apparent that we were not heading into a recession. Consumer demand also remained strong, and unemployment numbers remained
historically low.
We believe that the outlook for U.S. stocks remains positive, primarily as we believe that the Federal Reserve may be done, or close to done, raising interest
rates. Inflation has shown signs of easing, creating a better environment for consumers as well as businesses. The unemployment rate remains near record lows, there are elevated levels of cash on the
|
HENNESSY FUNDS
|
1-800-966-4354
|
3
balance sheets of U.S. companies and in the pockets of many consumers and investors, and there is the prospect of a more dovish Federal Reserve heading into 2024. However, we are cautiously watching
certain parts of the economy for any hints of weakness, including consumer spending and credit issues. While volatility and uncertainty may impact the markets, we encourage investors to stay the course, maintain a diversified
portfolio, and keep a long-term perspective.
We thank you for your continued interest in our Funds and are grateful that you have chosen to invest with us. If you have any questions or would like to speak
with us directly, please call us at (800) 966-4354.
Best regards,
|
|
|
|
|
Ryan C. Kelley, CFA
|
|
|
Chief Investment Officer,
|
|
|
Senior Vice President, and Portfolio Manager
|
Past performance does not guarantee future results.
Mutual fund investing involves risk. Principal loss is possible.
Opinions expressed are those of Ryan C. Kelley and are subject to change, are not guaranteed, and should not be considered investment advice.
The Dow Jones Industrial Average and S&P 500® Index are commonly used to measure the performance of U.S. stocks. The
Nasdaq Composite Index comprises all common stocks listed on The Nasdaq Stock Market and is commonly used to measure the performance of technology-related stocks. The Nasdaq-100 Index includes 100 of the largest domestic and
international non-financial companies listed on The NASDAQ Stock Market based on market capitalization. The indices are used herein for comparative purposes in accordance with SEC regulations. One cannot invest directly in an
index. All returns are shown on a total return basis.
|
WWW.HENNESSYFUNDS.COM
|
4
|
LETTER TO SHAREHOLDERS
|
(This Page Intentionally Left Blank.)
|
HENNESSY FUNDS
|
1-800-966-4354
|
5
Performance Overview (Unaudited)
CHANGE IN VALUE OF $10,000 INVESTMENT
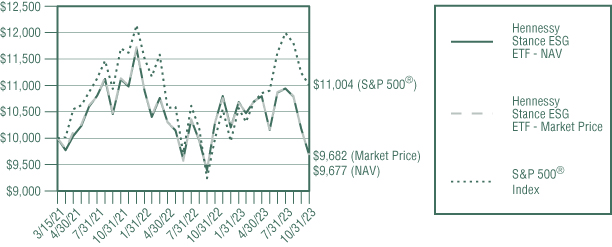
This graph illustrates the performance of an initial investment of $10,000 made in the Fund on its inception date and assumes the reinvestment of dividends and capital gains.
AVERAGE ANNUAL TOTAL RETURN FOR PERIODS ENDED OCTOBER 31, 2023
|
Since
|
|||
|
Two
|
One
|
Inception
|
|
|
Months(1)(2)
|
Year
|
(3/15/21)
|
|
|
Hennessy Stance ESG ETF
|
|||
|
(STNC) – NAV(3)
|
-10.31%
|
-5.99%
|
-1.24%
|
|
Hennessy Stance ESG ETF
|
|||
|
(STNC) – Market Price(3)
|
-10.34%
|
-5.97%
|
-1.22%
|
|
S&P 500® Index
|
-6.77%
|
10.14%
|
3.70%
|
Expense ratio: Gross 0.95%, Net 0.85%(4)
|
(1)
|
The period from September 1, 2023, to October 31, 2023, consists of two months because the Fund changed its fiscal year end from August 31 to October 31, effective October 8, 2023.
|
|
(2)
|
Periods of less than one year are not annualized.
|
|
(3)
|
Fund performance is shown based on both a net asset value (“NAV”) and market price basis. The Fund’s per share NAV is the value of one share of the Fund. NAV is calculated by taking the Fund’s
total assets (including the fair value of securities owned), subtracting liabilities, and dividing by the number of shares outstanding. The NAV return is based on the NAV of the Fund, and the market price return is based
on the market price per share of the Fund. The price used to calculate market price return is determined using the official closing price of the primary stock exchange (generally, 4:00 p.m. Eastern time) and may not
represent the returns you would receive if shares were traded at other times. NAV and market price returns assume that dividends and capital gain distributions have been reinvested in the Fund at NAV and market price,
respectively.
|
|
(4)
|
The Fund’s investment advisor has contractually agreed to limit expenses until December 31, 2024.
|
Performance data quoted represents past performance; past performance does not guarantee future results. The investment return and principal value of an investment will fluctuate so
that an investor’s shares, when redeemed, may be worth more or less than their original cost. Shares are bought and sold at market price (closing price), not NAV, and are not individually redeemed from the Fund. Brokerage
commissions will reduce returns. The performance table does not reflect the deduction of taxes that a shareholder would pay on Fund distributions or the redemption of Fund shares. Current performance of the Fund may be lower or
higher than the performance quoted. Performance data current to the most recent month end may be obtained by visiting www.hennessyetfs.com. Performance for periods including or prior to December 22, 2022, is that of the Stance
Equity ESG Large Cap Core ETF.
|
WWW.HENNESSYFUNDS.COM
|
6
|
PERFORMANCE OVERVIEW
|
The S&P 500® Index is a capitalization-weighted index that is designed to represent the broad domestic economy
through changes in the aggregate market value of 500 stocks across all major industries. One cannot invest directly in an index. This index is used for comparative purposes in accordance with Securities and Exchange Commission
regulations.
Standard & Poor’s Financial Services is the source and owner of the S&P® and S&P 500® trademarks.
The expense ratio presented is from the most recent prospectus. The expense ratio for the current reporting period is available in the Financial Highlights section of this report.
PERFORMANCE NARRATIVE
Portfolio Managers Bill Davis and Kyle Balkissoon
Stance Capital, LLC (portfolio composition sub-advisor)
Performance:
For the two-month period ended October 31, 2023, the Hennessy Stance ESG ETF (ticker: STNC) returned -10.31%, underperforming the S&P 500® Index (the Fund’s primary benchmark), which returned -6.77% for the same period.
During this two-month period, the Fund’s returns were more closely aligned with the S&P 500®
Equal Weight Index, which returned -9.0%, as the Fund tends to avoid over allocation to mega caps and has a targeted maximum position size in a single security of 3.5%. In terms of rate exposure risk, the Fund had insignificant
exposure to interest rates as proxied by long term Treasuries, while the S&P 500® Index had a significant risk due to the growth orientation of
mega cap stocks.
For the month of September 2023, the Fund slightly underperformed the average security of the S&P 500®
Index. This was largely driven by our aversion to the riskiest, highly-correlated mega-cap names, leading to the optimizer allocating in a manner that detracted from performance.
For the month of October 2023, the Fund performed slightly worse than the average security of the S&P 500® Index, as our quant and environmental, social, and governance (“ESG”) models detracted from performance, while our optimizer reduced risk in the portfolio and added significant value.
Portfolio Strategy:
The Fund seeks long-term growth of capital by combining ESG and machine learning/artificial intelligence (“ML/AI”) in an ETF structure. We seek exposure to companies that score well on ESG metrics and
that we believe will outperform based on ML/AI models. The Fund leverages optimization in an attempt to reduce portfolio level tail risk and mitigate downside losses.
Investment Commentary:
We continue to believe strongly that the market will soon transition to greater breadth, and there is a historical context for this view. Using the performance of the S&P 500® Equal Weight Index as a proxy, since its inception in 1989, Equal Weight has actually outperformed the cap-weighted S&P 500® Index. Thus far in 2023, the cap-weighted S&P 500® Index has
dramatically outperformed S&P 500® Equal Weight Index, although less so during September and October 2023. After similar rolling 6-month
periods of outperformance by 9% or more by the S&P 500® Index, the S&P 500® Equal Weight Index posted significantly higher returns than the S&P 500® Index over subsequent 6- and 12-month periods.
Thus, we expect to see a reversion to broader participation by the full S&P 500® Index, which certainly favors the Fund.
|
HENNESSY FUNDS
|
1-800-966-4354
|
7
_______________
Opinions expressed are those of the Portfolio Managers as of the date written and are subject to change, are not guaranteed, and should not be considered investment advice or an indication of trading
intent.
References to specific securities should not be considered a recommendation to buy or sell any security. Fund holdings and sector allocations are subject to change. Please refer to the Schedule of
Investments included in this report for additional portfolio information.
The S&P 500® Index is a capitalization-weighted index that is designed to represent the broad domestic economy
through changes in aggregate market value of 500 stocks across all major industries. The S&P 500® Equal Weight Index is comprised of the same
companies as the S&P 500® Index, but each stock’s return is equally weighted on a daily basis. Index return does not include trading and
management costs, which would lower performance. The indexes are used herein for comparative purposes in accordance with SEC regulations. One cannot invest directly in an index.
|
WWW.HENNESSYFUNDS.COM
|
8
|
PERFORMANCE OVERVIEW/SCHEDULE OF INVESTMENTS
|
Financial Statements
|
Schedule of Investments as of October 31, 2023
|
HENNESSY STANCE ESG ETF
(% of Net Assets)
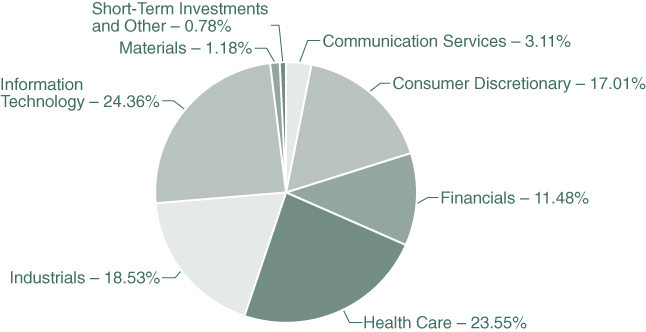
|
TOP TEN HOLDINGS (EXCLUDING MONEY MARKET FUNDS)
|
% NET ASSETS
|
|
Nike Inc., Class A
|
3.85%
|
|
The Cigna Group
|
3.81%
|
|
Microsoft Corp.
|
3.78%
|
|
A. O. Smith Corp.
|
3.74%
|
|
Adobe, Inc.
|
3.69%
|
|
Synopsys, Inc.
|
3.54%
|
|
Apple, Inc.
|
3.53%
|
|
Marriott International, Inc., Class A
|
3.50%
|
|
Masco Corp.
|
3.48%
|
|
Yum! Brands, Inc.
|
3.47%
|
Note: For presentation purposes, the Fund has grouped some of the industry categories. For purposes of categorizing securities for compliance with Section 8(b)(1) of the Investment Company Act of 1940,
as amended, the Fund uses more specific industry classifications.
The Global Industry Classification Standard (GICS®) was developed by and is the exclusive property and a service mark of
MSCI, Inc. and Standard & Poor’s Financial Services LLC. It has been licensed for use by the Hennessy Funds.
|
HENNESSY FUNDS
|
1-800-966-4354
|
9
|
COMMON STOCKS – 99.22%
|
Number
|
% of
|
||||||||||
|
|
of Shares
|
Value
|
Net Assets
|
|||||||||
|
Communication Services – 3.11%
|
||||||||||||
|
Alphabet, Inc., Class A (a)
|
10,136
|
$
|
1,257,675
|
3.11
|
%
|
|||||||
|
Consumer Discretionary – 17.01%
|
||||||||||||
|
AutoZone, Inc. (a)
|
384
|
951,218
|
2.35
|
%
|
||||||||
|
Expedia Group, Inc. (a)
|
14,194
|
1,352,546
|
3.35
|
%
|
||||||||
|
Marriott International, Inc., Class A
|
7,492
|
1,412,692
|
3.50
|
%
|
||||||||
|
Nike Inc., Class A
|
15,107
|
1,552,546
|
3.85
|
%
|
||||||||
|
Tesla, Inc. (a)
|
987
|
198,229
|
0.49
|
%
|
||||||||
|
Yum! Brands, Inc.
|
11,610
|
1,403,185
|
3.47
|
%
|
||||||||
|
|
6,870,416
|
17.01
|
%
|
|||||||||
|
Financials – 11.48%
|
||||||||||||
|
Aon PLC
|
4,501
|
1,392,609
|
3.44
|
%
|
||||||||
|
Mastercard, Inc., Class A
|
3,669
|
1,380,828
|
3.42
|
%
|
||||||||
|
MSCI, Inc.
|
1,265
|
596,511
|
1.48
|
%
|
||||||||
|
PayPal Holdings, Inc. (a)
|
24,494
|
1,268,789
|
3.14
|
%
|
||||||||
|
|
4,638,737
|
11.48
|
%
|
|||||||||
|
Health Care – 23.55%
|
||||||||||||
|
Agilent Technologies, Inc.
|
13,085
|
1,352,596
|
3.35
|
%
|
||||||||
|
Biogen, Inc. (a)
|
5,601
|
1,330,462
|
3.29
|
%
|
||||||||
|
DaVita, Inc. (a)
|
15,400
|
1,189,342
|
2.94
|
%
|
||||||||
|
Edwards Lifesciences Corp. (a)
|
3,559
|
226,779
|
0.56
|
%
|
||||||||
|
Regeneron Pharmaceuticals, Inc. (a)
|
1,658
|
1,293,058
|
3.20
|
%
|
||||||||
|
The Cigna Group
|
4,969
|
1,536,415
|
3.81
|
%
|
||||||||
|
Waters Corp. (a)
|
5,347
|
1,275,420
|
3.16
|
%
|
||||||||
|
Zoetis, Inc.
|
8,338
|
1,309,066
|
3.24
|
%
|
||||||||
|
|
9,513,138
|
23.55
|
%
|
|||||||||
|
Industrials – 18.53%
|
||||||||||||
|
A. O. Smith Corp.
|
21,689
|
1,513,025
|
3.74
|
%
|
||||||||
|
Fortive Corp.
|
19,090
|
1,246,195
|
3.09
|
%
|
||||||||
|
Generac Holdings, Inc. (a)
|
2,254
|
189,494
|
0.47
|
%
|
||||||||
|
Masco Corp.
|
26,981
|
1,405,440
|
3.48
|
%
|
||||||||
|
Pentair PLC
|
22,422
|
1,303,167
|
3.23
|
%
|
||||||||
|
Verisk Analytics, Inc.
|
6,122
|
1,391,898
|
3.45
|
%
|
||||||||
|
WW Grainger, Inc.
|
594
|
433,519
|
1.07
|
%
|
||||||||
|
|
7,482,738
|
18.53
|
%
|
|||||||||
The accompanying notes are an integral part of these financial statements.
|
WWW.HENNESSYFUNDS.COM
|
10
|
SCHEDULE OF INVESTMENTS
|
|
COMMON STOCKS
|
Number
|
% of
|
||||||||||
|
|
of Shares
|
Value
|
Net Assets
|
|||||||||
|
Information Technology – 24.36%
|
||||||||||||
|
Adobe, Inc. (a)
|
2,799
|
$
|
1,489,236
|
3.69
|
%
|
|||||||
|
Amphenol Corp., Class A
|
17,412
|
1,402,537
|
3.47
|
%
|
||||||||
|
Apple, Inc.
|
8,341
|
1,424,393
|
3.53
|
%
|
||||||||
|
Enphase Energy, Inc. (a)
|
4,744
|
377,528
|
0.93
|
%
|
||||||||
|
Fortinet, Inc. (a)
|
6,888
|
393,787
|
0.97
|
%
|
||||||||
|
Microsoft Corp.
|
4,503
|
1,522,509
|
3.78
|
%
|
||||||||
|
Palo Alto Networks, Inc. (a)
|
5,168
|
1,255,927
|
3.11
|
%
|
||||||||
|
SolarEdge Technologies, Inc. (a)
|
4,261
|
323,623
|
0.80
|
%
|
||||||||
|
Synopsys, Inc. (a)
|
3,050
|
1,431,792
|
3.54
|
%
|
||||||||
|
Texas Instruments, Inc.
|
1,535
|
217,985
|
0.54
|
%
|
||||||||
|
|
9,839,317
|
24.36
|
%
|
|||||||||
|
Materials – 1.18%
|
||||||||||||
|
Nucor Corp.
|
1,576
|
232,917
|
0.58
|
%
|
||||||||
|
Steel Dynamics, Inc.
|
2,293
|
244,227
|
0.60
|
%
|
||||||||
|
|
477,144
|
1.18
|
%
|
|||||||||
|
|
||||||||||||
|
Total Common Stocks
|
||||||||||||
|
(Cost $42,354,009)
|
40,079,165
|
99.22
|
%
|
|||||||||
|
|
||||||||||||
|
SHORT-TERM INVESTMENTS – 0.79%
|
||||||||||||
|
Money Market Funds – 0.79%
|
||||||||||||
|
First American Treasury Obligations Fund – Class X, 5.275% (b)
|
319,802
|
319,802
|
0.79
|
%
|
||||||||
|
|
||||||||||||
|
Total Short-Term Investments
|
||||||||||||
|
(Cost $319,802)
|
319,802
|
0.79
|
%
|
|||||||||
|
|
||||||||||||
|
Total Investments
|
||||||||||||
|
(Cost $42,673,811) – 100.01%
|
40,398,967
|
100.01
|
%
|
|||||||||
|
Liabilities in Excess of Other Assets – (0.01)%
|
(3,814
|
)
|
(0.01
|
)%
|
||||||||
|
|
||||||||||||
|
TOTAL NET ASSETS – 100.00%
|
$
|
40,395,153
|
100.00
|
%
|
||||||||
Percentages are stated as a percent of net assets.
PLC – Public Limited Company
|
(a)
|
Non-income producing security.
|
|
(b)
|
The rate listed is the fund’s seven-day yield as of October 31, 2023.
|
The accompanying notes are an integral part of these financial statements.
|
HENNESSY FUNDS
|
1-800-966-4354
|
11
Summary of Fair Value Exposure as of October 31, 2023
The following is a summary of the inputs used to value the Fund’s net assets as of October 31, 2023 (see Note 3 in the accompanying Notes to the Financial Statements):
|
Common Stocks
|
Level 1
|
Level 2
|
Level 3
|
Total
|
||||||||||||
|
Communication Services
|
$
|
1,257,675
|
$
|
—
|
$
|
—
|
$
|
1,257,675
|
||||||||
|
Consumer Discretionary
|
6,870,416
|
—
|
—
|
6,870,416
|
||||||||||||
|
Financials
|
4,638,737
|
—
|
—
|
4,638,737
|
||||||||||||
|
Health Care
|
9,513,138
|
—
|
—
|
9,513,138
|
||||||||||||
|
Industrials
|
7,482,738
|
—
|
—
|
7,482,738
|
||||||||||||
|
Information Technology
|
9,839,317
|
—
|
—
|
9,839,317
|
||||||||||||
|
Materials
|
477,144
|
—
|
—
|
477,144
|
||||||||||||
|
Total Common Stocks
|
$
|
40,079,165
|
$
|
—
|
$
|
—
|
$
|
40,079,165
|
||||||||
|
Short-Term Investments
|
||||||||||||||||
|
Money Market Funds
|
$
|
319,802
|
$
|
—
|
$
|
—
|
$
|
319,802
|
||||||||
|
Total Short-Term Investments
|
$
|
319,802
|
$
|
—
|
$
|
—
|
$
|
319,802
|
||||||||
|
Total Investments
|
$
|
40,398,967
|
$
|
—
|
$
|
—
|
$
|
40,398,967
|
||||||||
The accompanying notes are an integral part of these financial statements.
|
WWW.HENNESSYFUNDS.COM
|
12
|
SCHEDULE OF INVESTMENTS/STATEMENT OF ASSETS AND LIABILITIES
|
Financial Statements
|
Statement of Assets and Liabilities as of October 31, 2023
|
|
ASSETS:
|
||||
|
Investments in securities, at value (cost $42,673,811)
|
$
|
40,398,967
|
||
|
Dividends and interest receivable
|
26,100
|
|||
|
Total assets
|
40,425,067
|
|||
|
LIABILITIES:
|
||||
|
Payable to advisor
|
29,914
|
|||
|
Total liabilities
|
29,914
|
|||
|
NET ASSETS
|
$
|
40,395,153
|
||
|
NET ASSETS CONSIST OF:
|
||||
|
Par Value
|
$
|
1,685
|
||
|
Capital stock
|
46,823,850
|
|||
|
Accumulated deficit
|
(6,430,382
|
)
|
||
|
Total net assets
|
$
|
40,395,153
|
||
|
NET ASSETS:
|
||||
|
Shares authorized ($0.001 par value)
|
100,000,000
|
|||
|
Net assets applicable to outstanding shares
|
$
|
40,395,153
|
||
|
Shares issued and outstanding
|
1,685,000
|
|||
|
Net asset value, offering price, and redemption price per share
|
$
|
23.97
|
||
The accompanying notes are an integral part of these financial statements.
|
HENNESSY FUNDS
|
1-800-966-4354
|
13
Financial Statements
|
Statement of Operations
|
|
Two-Month
|
||||||||
|
Period Ended
|
Year Ended
|
|||||||
|
October 31, 2023(1)
|
August 31, 2023
|
|||||||
|
INVESTMENT INCOME:
|
||||||||
|
Dividend income
|
$
|
58,240
|
$
|
487,041
|
(2)
|
|||
|
Interest income
|
1,532
|
5,240
|
||||||
|
Total investment income
|
59,772
|
492,281
|
||||||
|
EXPENSES:
|
||||||||
|
Investment advisory fees (See Note 5)
|
67,243
|
418,300
|
||||||
|
Total expenses before waivers
|
67,243
|
418,300
|
||||||
|
Expense reimbursement from advisor
|
(7,067
|
)
|
(44,032
|
)
|
||||
|
Net expenses
|
60,176
|
374,268
|
||||||
|
NET INVESTMENT INCOME (LOSS)
|
$
|
(404
|
)
|
$
|
118,013
|
|||
|
REALIZED AND UNREALIZED GAINS (LOSSES):
|
||||||||
|
Net realized gain (loss) on investments
|
$
|
(2,649,850
|
)
|
$
|
2,720,539
|
|||
|
Net realized gain from redemption in-kind
|
12,471
|
228,423
|
||||||
|
Net change in unrealized
|
||||||||
|
appreciation/depreciation on investments
|
(1,930,821
|
)
|
454,119
|
|||||
|
Net gain (loss) on investments
|
(4,568,200
|
)
|
3,403,081
|
|||||
|
NET INCREASE (DECREASE) IN NET ASSETS
|
||||||||
|
RESULTING FROM OPERATIONS
|
$
|
(4,568,604
|
)
|
$
|
3,521,094
|
|||
|
(1)
|
The period ended October 31, 2023, consists of 2 months due to the Fund’s fiscal year end change from August 31 to October 31, effective October 8, 2023.
|
|
(2)
|
Net of foreign taxes and issuance fees withheld of $195.
|
The accompanying notes are an integral part of these financial statements.
|
WWW.HENNESSYFUNDS.COM
|
14
|
STATEMENT OF OPERATIONS/STATEMENTS OF CHANGES IN NET ASSETS
|
Financial Statements
|
Statements of Changes in Net Assets
|
|
Two-Month
|
||||||||||||
|
Period Ended
|
Year Ended
|
Year Ended
|
||||||||||
|
October 31, 2023(1)
|
August 31, 2023
|
August 31, 2022
|
||||||||||
|
OPERATIONS:
|
||||||||||||
|
Net investment income (loss)
|
$
|
(404
|
)
|
$
|
118,013
|
$
|
285,024
|
|||||
|
Net realized gain (loss) on investments
|
(2,637,379
|
)
|
2,948,962
|
(1,557,093
|
)
|
|||||||
|
Net change in unrealized
|
||||||||||||
|
appreciation/depreciation on investments
|
(1,930,821
|
)
|
454,119
|
(3,140,125
|
)
|
|||||||
|
Net increase (decrease) in net assets
|
||||||||||||
|
resulting from operations
|
(4,568,604
|
)
|
3,521,094
|
(4,412,194
|
)
|
|||||||
|
DISTRIBUTIONS TO SHAREHOLDERS:
|
||||||||||||
|
Distributable earnings
|
—
|
(247,449
|
)
|
(164,737
|
)
|
|||||||
|
Total distributions
|
—
|
(247,449
|
)
|
(164,737
|
)
|
|||||||
|
CAPITAL SHARE TRANSACTIONS:
|
||||||||||||
|
Proceeds from shares subscribed
|
596,298
|
4,008,931
|
34,013,802
|
|||||||||
|
Cost of shares redeemed
|
(938,382
|
)
|
(4,506,305
|
)
|
(24,191,858
|
)
|
||||||
|
Net increase (decrease) in net assets
|
||||||||||||
|
derived from capital share transactions
|
(342,084
|
)
|
(497,374
|
)
|
9,821,944
|
|||||||
|
TOTAL INCREASE
|
||||||||||||
|
(DECREASE) IN NET ASSETS
|
(4,910,688
|
)
|
2,776,271
|
5,245,013
|
||||||||
|
NET ASSETS:
|
||||||||||||
|
Beginning of period
|
45,305,841
|
42,529,570
|
37,284,557
|
|||||||||
|
End of period
|
$
|
40,395,153
|
$
|
45,305,841
|
$
|
42,529,570
|
||||||
|
CHANGES IN SHARES OUTSTANDING:
|
||||||||||||
|
Shares sold
|
25,000
|
155,000
|
1,245,000
|
|||||||||
|
Shares redeemed
|
(35,000
|
)
|
(175,000
|
)
|
(870,000
|
)
|
||||||
|
Net increase (decrease)
|
||||||||||||
|
in shares outstanding
|
(10,000
|
)
|
(20,000
|
)
|
375,000
|
|||||||
|
(1)
|
The period ended October 31, 2023, consists of 2 months due to the Fund’s fiscal year end change from August 31 to October 31, effective October 8, 2023.
|
The accompanying notes are an integral part of these financial statements.
|
HENNESSY FUNDS
|
1-800-966-4354
|
15
Financial Statements
|
Financial Highlights
|
For a share outstanding throughout each period
PER SHARE DATA:
Net asset value, beginning of period
Income from investment operations:
Net investment income (loss)(2)
Net realized and unrealized gains (losses) on investments
Total from investment operations
Less distributions:
Dividends from net investment income
Dividends from net realized gains
Total distributions
Net asset value, end of period
Market value, end of period
TOTAL RETURN ON NET ASSET VALUE(4)
TOTAL RETURN ON MARKET PRICE(5)
SUPPLEMENTAL DATA AND RATIOS:
Net assets, end of period (millions)
Ratio of expenses to average net assets:
Before expense reimbursement
After expense reimbursement
Ratio of net investment income (loss) to average net assets:
Before expense reimbursement
After expense reimbursement
Portfolio turnover rate(8)
|
(1)
|
Inception date of the Fund was March 15, 2021.
|
|
(2)
|
Calculated using the average shares outstanding method.
|
|
(3)
|
Amount is between $(0.005) and $0.005.
|
|
(4)
|
Total investment return/(loss) on net asset value is calculated assuming a purchase of shares on the first day and a sale of shares on the last day of each period reported and includes
reinvestments of dividends and distributions, if any.
|
|
(5)
|
Total investment return/(loss) on market price is calculated assuming an initial investment made at the market price on the first day of the period, reinvestment of dividends and distributions
at market price during the period, and redemption at market price on the last day of the period.
|
|
(6)
|
Not annualized.
|
|
(7)
|
Annualized.
|
|
(8)
|
Excludes effect of in-kind transfers.
|
The accompanying notes are an integral part of these financial statements.
|
WWW.HENNESSYFUNDS.COM
|
16
|
FINANCIAL HIGHLIGHTS
|
|
Two-Month
|
|||||||||||||||
|
Period Ended
|
Year Ended August 31,
|
Period Ended
|
|||||||||||||
|
October 31,
|
August 31,
|
||||||||||||||
|
2023
|
2023
|
2022
|
2021(1)
|
||||||||||||
|
$
|
26.73
|
$
|
24.80
|
$
|
27.82
|
$
|
25.00
|
||||||||
|
(0.00
|
)(3)
|
0.07
|
0.20
|
0.02
|
|||||||||||
|
(2.76
|
)
|
2.01
|
(3.10
|
)
|
2.80
|
||||||||||
|
(2.76
|
)
|
2.08
|
(2.90
|
)
|
2.82
|
||||||||||
|
—
|
(0.15
|
)
|
(0.10
|
)
|
—
|
||||||||||
|
—
|
—
|
(0.02
|
)
|
—
|
|||||||||||
|
—
|
(0.15
|
)
|
(0.12
|
)
|
—
|
||||||||||
|
$
|
23.97
|
$
|
26.73
|
$
|
24.80
|
$
|
27.82
|
||||||||
|
$
|
23.98
|
$
|
26.74
|
$
|
24.83
|
$
|
27.91
|
||||||||
|
-10.31
|
%(6)
|
8.39
|
%
|
-10.50
|
%
|
11.23
|
%(6)
|
||||||||
|
-10.34
|
%(6)
|
8.32
|
%
|
-10.63
|
%
|
11.56
|
%(6)
|
||||||||
|
$
|
40.40
|
$
|
45.31
|
$
|
42.53
|
$
|
37.29
|
||||||||
|
0.95
|
%(7)
|
0.95
|
%
|
0.95
|
%
|
0.95
|
%(7)
|
||||||||
|
0.85
|
%(7)
|
0.85
|
%
|
0.85
|
%
|
0.85
|
%(7)
|
||||||||
|
(0.11
|
)%(7)
|
0.17
|
%
|
0.64
|
%
|
0.09
|
%(7)
|
||||||||
|
(0.01
|
)%(7)
|
0.27
|
%
|
0.74
|
%
|
0.19
|
%(7)
|
||||||||
|
62
|
%(6)
|
274
|
%
|
290
|
%
|
180
|
%(6)
|
||||||||
The accompanying notes are an integral part of these financial statements.
|
HENNESSY FUNDS
|
1-800-966-4354
|
17
Financial Statements
|
Notes to the Financial Statements October 31, 2023
|
1). ORGANIZATION
The Hennessy Stance ESG ETF (the “Fund”) is a series of Hennessy Funds Trust (the “Trust”), which was organized as a Delaware statutory trust on September 17, 1992. The Fund is an actively managed
exchange-traded fund that operates pursuant to an exemptive order from the Securities and Exchange Commission (the “SEC”). The Fund is a successor to the Stance Equity ESG Large Cap Core ETF (the “Predecessor Fund”) pursuant to
a reorganization that took place after the close of business on December 22, 2022. Prior to December 22, 2022, the Fund had no investment operations. The Fund is the accounting and performance information successor of the
Predecessor Fund. The investment objective of the Fund is long-term capital appreciation. The Fund is a diversified fund and offers one class of shares. Effective October 8, 2023, the Fund changed its fiscal year end for
financial reporting purposes from August 31 to October 31.
As an investment company, the Fund follows the investment company accounting and reporting guidance of the Financial Accounting Standards Board (the “FASB”) Accounting Standard
Codification Topic 946 “Financial Services—Investment Companies.”
2). SIGNIFICANT ACCOUNTING POLICIES
The following is a summary of significant accounting policies consistently followed by the Fund in the preparation of the financial statements. These policies conform to U.S. generally accepted
accounting principles (“GAAP”).
|
a).
|
Securities Valuation – All investments in securities are valued in accordance with the Fund’s valuation policies and procedures, as described in Note 3.
|
|
b).
|
Federal Income Taxes – The Fund has elected to be taxed as a regulated investment company and intends to distribute substantially all of its taxable income to its shareholders and otherwise
comply with the provisions of the Internal Revenue Code of 1986, as amended, applicable to regulated investment companies. As a result, the Fund has made no provision for federal income taxes or excise taxes. Net
investment income/loss and realized gains/losses for federal income tax purposes may differ from those reported in the financial statements because of temporary book-basis and tax-basis differences. Temporary differences
are primarily the result of the treatment of partnership income and wash sales for tax reporting purposes. The Fund recognizes interest and penalties related to income tax benefits, if any, in the Statement of Operations
as an income tax expense. Distributions from net realized gains for book purposes may include short-term capital gains, which are included as ordinary income to shareholders for tax purposes. The Fund may utilize
equalization accounting for tax purposes and designate earnings and profits, including net realized gains distributed to shareholders on redemption of shares, as part of the dividends paid deduction for income tax
purposes.
|
|
Due to inherent differences in the recognition of income, expenses, and realized gains/losses under GAAP and federal income tax regulations, permanent differences
between book and tax basis for reporting are identified and appropriately reclassified
|
|
WWW.HENNESSYFUNDS.COM
|
18
|
NOTES TO THE FINANCIAL STATEMENTS
|
|
in the Statement of Assets and Liabilities, as needed. The adjustments for the period ended October 31, 2023, are as follows:
|
|
Total
|
|||
|
Distributable
|
|||
|
Earnings
|
Capital Stock
|
||
|
$(208,980)
|
$208,980
|
|
c).
|
Accounting for Uncertainty in Income Taxes – The Fund has accounting policies regarding recognition and measurement of tax positions taken or expected to be taken on a tax return. The tax
returns of the Fund for the prior three fiscal years are open for examination. The Fund has reviewed all open tax years in major tax jurisdictions and concluded that there is no impact on the Fund’s net assets and no tax
liability resulting from unrecognized tax benefits relating to uncertain income tax positions taken or expected to be taken on a tax return. The Fund’s major tax jurisdictions are U.S. federal and Delaware.
|
|
d).
|
Income and Expenses – Dividend income is recognized on the ex-dividend date or as soon as information is available to the Fund. Interest income, which includes the amortization of premium and
accretion of discount, is recognized on an accrual basis. Market discounts, original issue discounts, and market premiums on debt securities are accreted or amortized to interest income over the life of a security with a
corresponding increase or decrease, as applicable, in the cost basis of such security using the yield-to-maturity method or, where applicable, the first call date of the security. Other non-cash dividends are recognized
as investment income at the fair value of the property received. Expenses and fees, including investment advisory fees, are accrued daily and taken into account for the purpose of determining the net asset value (“NAV”)
of the Fund. As discussed further in Note 5, most expenses of the Fund are paid by Hennessy Advisors, Inc. (the “Advisor”) under a unitary fee arrangement.
|
|
e).
|
Distributions to Shareholders – Dividends from net investment income for the Fund, if any, are declared and paid annually, usually in December. Distributions of net realized capital gains, if
any, are declared and paid annually, usually in December.
|
|
f).
|
Security Transactions – Investment transactions are recorded on the trade date. The Fund determines the realized gain/loss from an investment transaction by comparing the original cost of the
security lot sold with the net sale proceeds. Discounts and premiums on securities purchased are accreted or amortized, respectively, over the life of each such security.
|
|
g).
|
Use of Estimates – Preparing financial statements in accordance with GAAP requires management to make estimates and assumptions that affect the reported amounts of assets and liabilities and
disclosure of contingent assets and liabilities at the date of the financial statements, as well as the reported change in net assets during the reporting period. Actual results could differ from those estimates.
|
|
h).
|
Share Valuation – The NAV per share of the Fund is calculated by dividing (i) the total value of the securities held by the Fund, plus cash and other assets, minus all liabilities (including
estimated accrued expenses) by (ii) the total number of Fund shares outstanding, rounded to the nearest $0.01. Fund shares are not priced on days the New York Stock Exchange is closed for trading.
|
|
i).
|
Illiquid Securities – Pursuant to Rule 22e-4 under the 1940 Act, the Fund has adopted a Liquidity Risk Management Program (the “Liquidity Program”). The Liquidity Program requires, among other
things, that the Fund limit its illiquid investments to no more than 15% of its net assets. An illiquid investment is any
|
|
HENNESSY FUNDS
|
1-800-966-4354
|
19
|
investment that the Fund reasonably expects cannot be sold or disposed of by the Fund in current market conditions in seven calendar days or less without the sale or disposition significantly
changing the market value of the investment.
|
|
|
j).
|
Recent Accounting Pronouncements and Regulatory Updates – In October 2022, the Securities and Exchange Commission (“SEC”) adopted a final rule relating to Tailored Shareholder Reports for
Mutual Funds and Exchange-Traded Funds (ETFs); Fee Information in Investment Company Advertisements. The rule and form amendments will require mutual funds and ETFs to transmit concise and visually engaging shareholder
reports that highlight key information. The amendments also will require that funds tag information in a structured data format. In addition, the rule amendments will require that certain more in-depth information be
made available online and available for delivery free of charge to investors on request. The amendments became effective January 24, 2023. There is an 18-month transition period after the effective date of the amendment.
|
|
In June 2022, the FASB issued Accounting Standards Update (“ASU”) 2022-03, Fair Value Measurement (Topic 820): Fair Value Measurement of Equity Securities Subject to
Contractual Sale Restrictions. The ASU clarifies that a contractual restriction on the sale of an equity security is not considered part of the unit of account of the equity security and, therefore, is not considered in
measuring the fair value. The amendments also require additional disclosures related to equity securities subject to contractual sale restrictions. The ASU is effective for fiscal years beginning after December 15, 2023,
and interim periods within those fiscal years.
|
3). SECURITIES VALUATION
The Fund follows its valuation policies and procedures in determining its NAV and, in preparing these financial statements, the fair value accounting standards that establish an authoritative
definition of fair value and set out a hierarchy for measuring fair value. These standards require additional disclosures about the various inputs and valuation techniques used to develop the measurements of fair value and a
discussion of changes in valuation techniques and related inputs during the period. These inputs are summarized in the three broad levels listed below:
|
Level 1 –
|
Unadjusted, quoted prices in active markets for identical instruments that the Fund has the ability to access at the date of measurement.
|
|
|
Level 2 –
|
Other significant observable inputs other than quoted prices included in Level 1 (including, but not limited to, quoted prices in active markets for similar instruments, quoted prices in
markets that are not active for identical or similar instruments, and model-derived valuations in which all significant inputs and significant value drivers are observable in active markets, such as interest rates,
prepayment speeds, credit risk curves, default rates, and similar data).
|
|
|
Level 3 –
|
Significant unobservable inputs (including the Fund’s own assumptions about what market participants would use to price the asset or liability based on the best available information) when
observable inputs are unavailable.
|
The following is a description of the valuation techniques applied to the Fund’s major categories of assets and liabilities on a recurring basis:
|
Equity Securities – Equity securities, including common stocks, preferred stocks, foreign-issued common stocks, exchange- traded funds, and real estate
investment trusts, that are traded on a securities exchange for which a last-quoted sales price is readily available generally are valued at the last sales price as reported by the primary
|
|
WWW.HENNESSYFUNDS.COM
|
20
|
NOTES TO THE FINANCIAL STATEMENTS
|
|
exchange on which the securities are listed. Securities listed on The Nasdaq Stock Market (“Nasdaq”) generally are valued at the Nasdaq Official Closing Price, which may differ from the last
sales price reported. Securities traded on a securities exchange for which a last-quoted sales price is not readily available generally are valued at the mean between the bid and ask prices. To the extent these
securities are actively traded and valuation adjustments are not applied, they are classified in Level 1 of the fair value hierarchy. Securities traded on foreign exchanges generally are not valued at the same time the
Fund calculates its NAV because most foreign markets close well before such time. The earlier close of most foreign markets gives rise to the possibility that significant events, including broad market moves, may have
occurred in the interim. In certain circumstances, it may be determined that a foreign security needs to be fair valued because it appears that the value of the security might have been materially affected by events
occurring after the close of the market in which the security is principally traded, but before the time the Fund calculates its NAV, such as by a development that affects an entire market or region (e.g., a
weather-related event) or a potentially global development (e.g., a terrorist attack that may be expected to have an effect on investor expectations worldwide).
|
|
|
Registered Investment Companies – Investments in open-end registered investment companies, commonly referred to as mutual funds, generally are priced at
the ending NAV provided by the applicable mutual fund’s service agent and are classified in Level 1 of the fair value hierarchy.
|
|
|
Debt Securities – Debt securities, including corporate bonds, asset-backed securities, mortgage-backed securities, municipal bonds, U.S. Treasuries, and
U.S. government agency issues, are generally valued at market on the basis of valuations furnished by an independent pricing service that utilizes both dealer-supplied valuations and formula-based techniques. The pricing
service may consider recently executed transactions in securities of the issuer or comparable issuers, market price quotations (where observable), bond spreads, and fundamental data relating to the issuer. In addition,
the model may incorporate observable market data, such as reported sales of similar securities, broker quotes, yields, bids, offers, and reference data. Certain securities are valued primarily using dealer quotations.
These securities are generally classified in Level 2 of the fair value hierarchy.
|
|
|
Short-Term Securities – Short-term equity investments, including money market funds, are valued in the manner specified above for equity securities.
Short-term debt investments with an original term to maturity of 60 days or less are valued at amortized cost, which approximates fair market value. If the original term to maturity of a short-term debt investment
exceeds 60 days, then the values as of the 61st day prior to maturity are amortized. Amortized cost is not used if its use would be inappropriate due to credit or other impairments of the issuer, in which case the
security’s fair value would be determined as described below. Short-term securities are generally classified in Level 1 or Level 2 of the fair value hierarchy depending on the inputs used and market activity levels for
specific securities.
|
If market quotations are not readily available or if a significant event has occurred that indicates the closing price of a security no longer represents the true value of that
security, any security or other asset will be valued at its fair value in accordance with Rule 2a-5 under the 1940 Act. The Board of Trustees of the Fund (the “Board”) has designated the Advisor as the Fund’s valuation designee
to make all fair value determinations with respect to the Fund’s portfolio investments under the Fund’s fair value pricing procedures, subject to the Board’s oversight. There are numerous criteria considered in determining a
fair value
|
HENNESSY FUNDS
|
1-800-966-4354
|
21
of a security, such as the trading volume of a security and markets, the values of other similar securities, and news events with direct bearing on a security or markets. Fair value pricing results in
an estimated price for a security that reflects the amount the Fund might reasonably expect to receive in a current sale. Depending on the relative significance of the valuation inputs, these securities may be classified in
either Level 2 or Level 3 of the fair value hierarchy. The Advisor will regularly evaluate whether the Fund’s fair value pricing procedures continue to be appropriate in light of the specific circumstances of the Fund and the
quality of prices obtained through their application of such procedures.
The fair value of foreign securities may be determined with the assistance of a pricing service using correlations between the movement of prices of such securities and indices of
domestic securities and other appropriate indicators, such as closing market prices of relevant American Depositary Receipts or futures contracts. Using fair value pricing means that the Fund’s NAV reflects the affected
portfolio securities’ values as determined by the Advisor, the Board’s valuation designee, pursuant to the Fund’s fair value pricing procedures, instead of being determined by the market. Using a fair value pricing methodology
to price a foreign security may result in a value that is different from such foreign security’s most recent closing price and from the value used by other investment companies to calculate their NAVs. Such securities are
generally classified in Level 2 of the fair value hierarchy. Because the Fund may invest in foreign securities, the value of the Fund’s portfolio securities may change on days when a shareholder is unable to purchase or redeem
Fund shares.
The Fund has performed an analysis of all existing investments to determine the significance and character of all inputs to their fair value determinations. Various inputs are used
to determine the value of the Fund’s investments. The inputs or methodology used for valuing securities are not necessarily an indication of the risk associated with investing in those securities. Details related to the fair
value hierarchy of the Fund’s securities as of October 31, 2023, are included in the Schedule of Investments.
4). INVESTMENT TRANSACTIONS
Purchases and sales of investment securities (excluding government and short-term investments) for the Fund during the two-month period ended October 31, 2023, were $26,345,300 and $26,601,479,
respectively. For the fiscal year ended August 31, 2023, the purchases and sales of investment securities (excluding government and short-term investments) for the Fund were $120,620,332 and $120,596,628, respectively.
There were no purchases or sales/maturities of long-term U.S. government securities for the Fund during the two-month period ended October 31, 2023, or the fiscal year ended August
31, 2023.
Purchases and sales of in-kind transactions for the Fund during the two-month period ended October 31, 2023 were $593,476 and $904,720, respectively. For the fiscal year ended August
31, 2023, purchases and sales of in-kind transactions for the Fund were $3,928,126 and $4,415,168, respectively.
5). INVESTMENT ADVISORY FEE AND OTHER TRANSACTIONS WITH AFFILIATES
Prior to the close of business on December 22, 2022, Red Gate Advisors, LLC acted as the investment advisor to the Predecessor Fund. Red Gate Advisors, LLC furnished all investment advice, office
space, and facilities, as well as most of the personnel needed by the Fund. As compensation for its services, Red Gate Advisors, LLC was entitled to a unitary management fee from the Predecessor Fund. The fee was based upon the
average daily net assets of the Predecessor Fund at an annual rate of 0.95%. From the unitary management fee, Red Gate Advisors, LLC paid most of the expenses of the Predecessor Fund, including
|
WWW.HENNESSYFUNDS.COM
|
22
|
NOTES TO THE FINANCIAL STATEMENTS
|
the cost of sub-advisory, transfer agency, custody, fund administration, legal, audit, and other services. The net investment advisory fees expensed by the Predecessor Fund during the period from
September 1, 2022, to December 22, 2022, were $127,031.
Effective following the close of business on December 22, 2022, the Advisor provides the Fund with investment advisory services under an Investment Advisory Agreement (the
“Investment Advisory Agreement”). The Advisor furnishes all investment advice, office space, and facilities and most of the personnel needed by the Fund. As compensation for its services, the Advisor is entitled to a unitary
management fee from the Fund. The fee is based on the average daily net assets of the Fund at an annual rate of 0.95%. From the unitary management fee, the Advisor pays most of the expenses of the Fund, including the cost of
sub-advisory, transfer agency, custody, fund administration, legal, audit, and other services. The net investment advisory fees expensed by the Fund during the two-month period ended October 31, 2023, are included in the
Statement of Operations. The net investment advisory fees expensed by the Fund during the period from December 23, 2022, to August 31, 2023, were $291,269.
The Advisor has contractually agreed to waive a portion of its unitary management fee to the extent necessary to limit the Fund’s annual operating expenses (excluding all federal,
state, and local taxes, interest, brokerage commissions, dividend and interest expenses on short sales, extraordinary items, and acquired fund fees and expenses and other costs incurred in connection with the purchase and sale
of securities) to 0.85% of the Fund’s net assets through December 31, 2024.
For a period of three years after the year in which the Advisor waives or reimburses expenses, the Advisor may seek reimbursement from the Fund to the extent that total annual fund
operating expenses are less than the expense limitation that was in effect at the time the Advisor waived or reimbursed expenses. As of October 31, 2023, expenses subject to potential recovery and the periods in which they
expire were as follows:
|
August 31,
|
October 31,
|
|||
|
2026
|
2026
|
Total
|
||
|
$30,660
|
$7,067
|
$37,727
|
During the period from September 1, 2022, to the close of business on December 22, 2022, Red Gate Advisors, LLC had contractually agreed to limit total annual operating expenses and
to maintain the expense limitation for the Predecessor Fund on the same terms as described above. The net investment advisory fees waived by the Predecessor Fund during the period from September 1, 2022, to December 22, 2022,
were $13,372.
Stance Capital, LLC (“Stance Capital”) and Vident Advisory, LLC (“Vident”) each serve as an investment sub-advisor to the Fund. The Advisor has delegated the day-to-day management of
the portfolio composition of the Fund to Stance Capital. Following the close of business on December 22, 2022, the Advisor (not the Fund) paid a sub-advisory fee to Stance Capital at the average rate of 0.40% of the daily net
assets of the Fund. Pursuant to the sub-advisory agreement, the Advisor pays Stance Capital sub-advisory fees at an annual rate of 0.40% of the average daily net assets up to $125 million, 0.37% of average daily net assets for
assets over $125 million and up to $250 million, and 0.35% for average daily net assets over $250 million. Prior to July 14, 2023, the Advisor had delegated the responsibility for selecting broker-dealers to execute purchase and
sale transactions for the Fund to Vident Investment Advisory, LLC (“VIA”), as instructed by Stance Capital and subject to the supervision of the Advisor and the Board. On July 14, 2023, VIA completed an acquisition transaction
that resulted in a change of control of
|
HENNESSY FUNDS
|
1-800-966-4354
|
23
VIA and automatic termination of our sub-advisory agreement with VIA. On the same date, we entered into a new sub-advisory agreement with Vident with the same terms and conditions as the prior
sub-advisory agreement with VIA. Following the close of business on December 22, 2022, the Advisor (not the Fund) paid a sub-advisory fee to VIA or Vident, as applicable, at the average rate of 0.05% of the daily net assets of
the Fund. Pursuant to the prior sub-advisory agreement with VIA and the current sub-advisory agreement with Vident, the Advisor pays sub-advisory fees at an annual rate of 0.05% of the Fund’s average daily net assets up to $250
million, 0.045% of average daily net assets for assets over $250 million and up to $500 million, and 0.04% for average daily net assets in excess of $500 million, subject to a minimum sub-advisory fee to of $18,750 on an annual
basis. Prior to the close of business on December 22, 2022, Red Gate Advisors, LLC paid the sub-advisory fees to Stance Capital and VIA from its own assets, and these fees were not an additional expense of the Fund.
U.S. Bancorp Fund Services, LLC, d/b/a U.S. Bank Global Fund Services (“Fund Services”) provides the Fund with administrative, accounting, and transfer agent services. As
administrator, Fund Services is responsible for activities such as (i) preparing various federal and state regulatory filings, reports, and returns for the Fund, (ii) preparing reports and materials to be supplied to the Board,
(iii) monitoring the activities of the Fund’s custodian, transfer agent, and accountants, and (iv) coordinating the preparation and payment of the Fund’s expenses and reviewing the Fund’s expense accruals. U.S. Bank N.A., an
affiliate of Fund Services, serves as the Fund’s custodian. The servicing agreements between the Trust, Fund Services, and U.S. Bank N.A. contain a fee schedule that is inclusive of administrative, accounting, custody, and
transfer agent fees. Under the terms of the Investment Advisory Agreement, the Advisor pays the Fund’s administrative, accounting, custody, and transfer agency fees.
Quasar Distributors, LLC, a wholly owned broker-dealer subsidiary of Foreside Financial Group, LLC, acts as the Fund’s principal underwriter in a continuous public offering of Fund
shares.
During the period from September 1, 2022, to the close of business on December 22, 2022, the officers and Chief Compliance Officer of the Predecessor Fund were employees of Fund
Services. Chief Compliance Officer fees paid by the Predecessor Fund to Fund services during the period from September 1, 2022, to December 22, 2022 were paid by Red Gate Advisors, LLC. Effective following the close of business
on December 22, 2022, the officers of the Fund are affiliated with the Advisor. Under the terms of the Investment Advisory Agreement, the Advisor pays the Fund’s Chief Compliance Officer fees.
6). GUARANTEES AND INDEMNIFICATIONS
Under the Hennessy Funds’ organizational documents, their officers and trustees are indemnified by the Hennessy Funds against certain liabilities arising out of the performance of their duties to the
Hennessy Funds. Additionally, in the normal course of business, the Hennessy Funds enter into contracts with service providers that contain general indemnification clauses. The Fund’s maximum exposure under these arrangements is
unknown as this would involve future claims that may be made against the Fund that have not yet occurred. Currently, the Fund expects the risk of loss to be remote.
|
WWW.HENNESSYFUNDS.COM
|
24
|
NOTES TO THE FINANCIAL STATEMENTS
|
7). FEDERAL TAX INFORMATION
As of October 31, 2023, the components of accumulated earnings (losses) for income tax purposes were as follows:
|
Investments
|
|||||
|
Cost of investments for tax purposes
|
$
|
42,691,300
|
|||
|
Gross tax unrealized appreciation
|
$
|
542,957
|
|||
|
Gross tax unrealized depreciation
|
(2,835,290
|
)
|
|||
|
Net tax unrealized appreciation/(depreciation)
|
$
|
(2,292,333
|
)
|
||
|
Undistributed ordinary income
|
$
|
50,006
|
|||
|
Undistributed long-term capital gains
|
—
|
||||
|
Total distributable earnings
|
$
|
50,006
|
|||
|
Other accumulated gain/(loss)
|
$
|
(4,188,055
|
)
|
||
|
Total accumulated gain/(loss)
|
$
|
(6,430,382
|
)
|
||
As of October 31, 2023, the Fund had $4,188,055 in unlimited short-term capital loss carryforwards.
As of October 31, 2023, the Fund did not defer, on a tax basis, any late-year ordinary losses. Late-year ordinary losses are net ordinary losses incurred after December 31, 2022, but
within the taxable year, that are deemed to arise on the first day of the Fund’s next taxable year.
During the two-month period ended October 31, 2023, and the fiscal years ended August 31, 2023 and 2022, the tax character of distributions paid by the Fund was as follows:
|
Two-Month Period Ended
|
Year Ended
|
Year Ended
|
|||||||||||
|
October 31, 2023
|
August 31, 2023
|
August 31, 2022
|
|||||||||||
|
Ordinary income(1)
|
$
|
—
|
$
|
247,449
|
$
|
134,419
|
|||||||
|
Long-term capital gains
|
—
|
—
|
30,318
|
||||||||||
|
Total distributions
|
$
|
—
|
$
|
247,449
|
$
|
164,737
|
|||||||
|
(1) Ordinary income includes short-term capital gains.
|
|||||||||||||
8). SHARE TRANSACTIONS
Shares of the Fund are listed and traded on the NYSE Arca, Inc. (the “Exchange”). Market prices for the shares may be different from their NAV. The Fund issues and redeems shares on a continuous basis
at NAV only in blocks of 5,000 shares, called “Creation Units.” Creation Units are issued and redeemed principally in-kind for securities included in a specified universe. Once created, shares generally trade in the secondary
market at market prices that change throughout the day. Except when aggregated in Creation Units, shares are not redeemable securities of the Fund. Creation Units may only be purchased or redeemed by certain financial
institutions (“Authorized Participants”). An Authorized Participant is either (i) a broker-dealer or other participant in the clearing process through the Continuous Net Settlement System of the National Securities Clearing
Corporation or (ii) a Depository Trust Company participant and, in each case, must have executed a Participant Agreement with the Distributor. Most retail investors do not qualify as Authorized Participants and do not have the
resources to buy and sell whole Creation Units. Therefore, they are unable to purchase or redeem shares directly from the Fund. Rather, most retail investors may purchase shares in the secondary market with the assistance of a
broker and are subject to customary brokerage commissions or fees.
|
HENNESSY FUNDS
|
1-800-966-4354
|
25
The Fund currently offers one class of shares, which has no front-end sales load, no deferred sales charge, and no redemption fee. A fixed transaction fee is imposed for the transfer
and other transaction costs associated with the purchase or sale of Creation Units. The standard fixed transaction fee for the Fund is $300, payable to the custodian. In addition, a variable fee may be charged on all cash
transactions or substitutes for Creation Units of up to a maximum of 2% as a percentage of the value of the Creation Units subject to the transaction. Variable fees are imposed to compensate the Fund for the transaction costs
associated with the cash transactions. Variable fees received by the Fund, if any, are displayed in the capital shares transactions section of the Statement of Changes in Net Assets. Shares of the Fund have equal rights and
privileges.
From time to time, settlement of securities related to in-kind redemptions may be delayed. In such cases, securities related to in-kind transactions are reflected as a receivable or
a payable in the Statements of Assets and Liabilities.
9). GLOBAL EVENTS
A rise in protectionist trade policies, the possibility of a national or global recession, risks associated with pandemic and epidemic diseases, trade tensions, the possibility of changes to some
international trade agreements, political events, and continuing political tension and armed conflicts may adversely impact financial markets and the broader economy. For example, ongoing armed conflicts between Ukraine and
Russia in Europe and among Israel, Hamas, and other militant groups in the Middle East have caused and could continue to cause significant market disruptions and volatility with the markets in Europe and the Middle East, and
have had negative impacts on markets in the United States. These events could also have negative effects on the Fund’s investments that cannot be foreseen at the present time. As global systems, economies and financial markets
are increasingly interconnected, events that once had only local impact are now more likely to have regional or even global effects. Events that occur in one country, region or financial market will, more frequently, adversely
impact issuers in other countries, regions, or markets. These impacts can be exacerbated by failures of governments and societies to adequately respond to an emerging event or threat. Your investment would be negatively impacted
if the value of your portfolio holdings decreases as a result of such events, if these events adversely impact the operations and effectiveness of the Advisor or other key service providers or if these events disrupt systems and
processes necessary or beneficial to the management of accounts. These events may negatively impact broad segments of businesses and populations and could have a significant and rapid negative impact on the performance of the
Fund’s investments, increase the Fund’s volatility, or exacerbate pre-existing risks to the Fund.
|
WWW.HENNESSYFUNDS.COM
|
26
|
NOTES TO THE FINANCIAL STATEMENTS
|
10). AGREEMENT AND PLAN OF REORGANIZATION
On December 6, 2022, shareholders of the Predecessor Fund approved an Agreement and Plan of Reorganization between the Trust, on behalf of the Fund, and The RBB Fund, Inc., a Maryland corporation, on
behalf of the Predecessor Fund. The Agreement and Plan of Reorganization provided for the transfer of all of the assets of the Predecessor Fund to the Fund and the assumption of the liabilities (other than any excluded
liabilities) of the Predecessor Fund by the Fund. The Fund was created to carry out the reorganization and has a substantially similar investment objective and substantially similar principal investment strategies as the
Predecessor Fund. The following table illustrates the specifics of the reorganization of the Predecessor Fund into the Fund as of December 22, 2022:
|
Shares Issued to
|
||||||
|
Predecessor
|
Shareholders of
|
Fund
|
Combined
|
Tax Status
|
||
|
Fund Net Assets
|
Predecessor Fund
|
Net Assets
|
Net Assets
|
of Transfer
|
||
|
$42,147,609(1)
|
1,670,000
|
$0
|
$42,147,609
|
Non-taxable
|
|
(1)
|
Includes accumulated net investment income, accumulated realized gains, and unrealized appreciation in the amounts of $14,189, $5,465,299, and $2,059,710, respectively.
|
11). EVENTS SUBSEQUENT TO PERIOD END
Management has evaluated the Fund’s related events and transactions that occurred subsequent to October 31, 2023, through the date of issuance of the Fund’s financial statements. Other than as
disclosed below, management has determined that there were no subsequent events requiring recognition or disclosure in the financial statements.
On October 24, 2023, shareholders of the CCM Small/Mid Cap Impact Value Fund approved an Agreement and Plan of Reorganization between the Trust, on behalf of the Fund, and the Quaker
Investment Trust, a Delaware statutory trust, on behalf of the CCM Small/Mid Cap Impact Value Fund. The Agreement and Plan of Reorganization provided for the transfer of all of the assets of the CCM Small/Mid Cap Impact Value
Fund to the Fund and the assumption of all liabilities of the CCM Small/ Mid Cap Impact Value Fund by the Fund. The CCM Small/Mid Cap Impact Value Fund and the Fund have substantially similar investment objectives. The
reorganization was completed following the close of business on November 10, 2023.
The meeting of shareholders of the CCM Core Impact Equity Fund was postponed to January 31, 2024.
In addition, the Fund paid a distribution to shareholders as follow:
|
Record Date
|
Ex-Date
|
Payable Date
|
Ordinary Income Rate
|
||
|
12/15/2023
|
12/14/2023
|
12/18/2023
|
0.02314927
|
|
HENNESSY FUNDS
|
1-800-966-4354
|
27
Report of Independent Registered Public
Accounting Firm
To the Board of Trustees of Hennessy Funds Trust
and the shareholders of the Hennessy Stance ESG ETF
Novato, CA
Opinion on the Financial Statements
We have audited the accompanying statement of assets and liabilities of the Hennessy Stance ESG ETF (the “Fund”), a series of Hennessy Funds Trust, including the schedule of investments, as of October
31, 2023, the related statements of operations, the statements of changes in net assets, and financial highlights for the two-month period ended October 31, 2023, and for the year ended August 31, 2023, and the related notes
(collectively referred to as the “financial statements”). In our opinion, the financial statements present fairly, in all material respects, the financial position of the Fund as of October 31, 2023, the results of its
operations, the changes in its net assets and the financial highlights for the two-month period ended October 31, 2023 and for the year ended August 31, 2023, in conformity with accounting principles generally accepted in the
United States of America.
The statements of changes in net assets for the year ended August 31, 2022, and the financial highlights for the year ended August 31, 2022, and for the period March 15, 2021 (commencement of
operations) through August 31, 2021, were audited by other auditors, whose report dated October 28, 2022, expressed an unqualified opinion on those financial statements and financial highlights.
Basis for Opinion
These financial statements are the responsibility of the Fund’s management. Our responsibility is to express an opinion on the Fund’s financial statements based on our audits. We are a public
accounting firm registered with the Public Company Accounting Oversight Board (United States) (“PCAOB”) and are required to be independent with respect to the Fund in accordance with the U.S. federal securities laws and the
applicable rules and regulations of the Securities and Exchange Commission and the PCAOB. We have served as the auditor of one or more of the funds in the Trust since 2002.
We conducted our audits in accordance with the standards of the PCAOB. Those standards require that we plan and perform the audit to obtain reasonable assurance about whether the financial statements
are free of material misstatement, whether due to error or fraud. The Fund is not required to have, nor were we engaged to perform, an audit of its internal control over financial reporting. As part of our audits we are required
to obtain an understanding of internal control over financial reporting, but not for the purpose of expressing an opinion on the effectiveness of the Fund’s internal control over financial reporting. Accordingly, we express no
such opinion.
Our audits included performing procedures to assess the risks of material misstatement of the financial statements, whether due to error or fraud, and performing procedures that respond to those risks.
Such procedures included examining, on a test basis, evidence regarding the amounts and disclosures in the financial statements. Our audit also included evaluating the accounting principles used and significant estimates made by
management, as well as evaluating the overall presentation of the financial statements. Our procedures included confirmation of securities owned as of October 31, 2023, by correspondence with the custodian. We believe that our
audits provide a reasonable basis for our opinion.
|
|
|
TAIT, WELLER & BAKER LLP
|
Philadelphia, Pennsylvania
December 22, 2023
|
WWW.HENNESSYFUNDS.COM
|
28
|
REPORT OF INDEPENDENT REGISTERED PUBLIC ACCOUNTING FIRM/TRUSTEES AND OFFICERS
|
Trustees and Officers of the Fund (Unaudited)
The business and affairs of the Funds are managed under the direction of the Board of Trustees of the Trust, and the Board of Trustees elects the officers of the Trust (“Officers”). From time to time,
the Board of Trustees also has appointed advisers to the Board of Trustees (“Advisers”) with the intention of having qualified individuals serve in an advisory capacity to garner experience in the mutual fund and asset
management industry and be considered as potential Trustees in the future. There are currently two Advisers, Brian Alexander and A.J. Hennessy. As Advisers, Mr. Alexander and Mr. A.J. Hennessy attend meetings of the Board of
Trustees and act as non-voting participants. Information pertaining to the Trustees, Advisers, and the Officers of the Trust is set forth below. The Trustees and Officers serve until their successors are duly elected and
qualified or until their earlier death, resignation, or removal. Each Trustee oversees all 17 Hennessy Funds. Unless otherwise indicated, the address of all persons listed below is 7250 Redwood Boulevard, Suite 200, Novato, CA
94945. The Fund’s Statement of Additional Information includes more information about the persons listed below and is available without charge by calling 800-966-4354 or by visiting www.hennessyetfs.com.
|
Other
|
|||
|
Directorships
|
|||
|
Held Outside
|
|||
|
Name, Age,
|
of Fund
|
||
|
and Position Held
|
Start Date
|
Principal Occupation(s)
|
Complex During
|
|
with the Trust
|
of Service
|
During Past Five Years
|
Past Five Years
|
|
Disinterested Trustees(1) and Disinterested Advisers
|
|||
|
J. Dennis DeSousa
|
January 1996
|
Mr. DeSousa is a real estate investor.
|
None.
|
|
87
|
|||
|
Trustee
|
|||
|
Robert T. Doyle
|
January 1996
|
Mr. Doyle is retired. He served as the
|
None.
|
|
76
|
Sheriff of Marin County, California
|
||
|
Trustee
|
from 1996 to June 2022.
|
||
|
Doug Franklin
|
March 2016
|
Mr. Franklin is a retired insurance
|
None.
|
|
59
|
as an Adviser
|
industry executive. From 1987
|
|
|
Trustee
|
to the Board
|
through 2015, he was employed by
|
|
|
and June 2023
|
the Allianz-Fireman’s Fund Insurance
|
||
|
as a Trustee
|
Company in various positions,
|
||
|
including as its Chief Actuary and
|
|||
|
Chief Risk Officer.
|
|||
|
Claire Garvie
|
December 2015
|
Ms. Garvie is a founder of Kiosk and
|
None.
|
|
49
|
as an Adviser
|
has served as its Chief Operating
|
|
|
Trustee
|
to the Board and
|
Officer since 2004. Kiosk is a
|
|
|
December 2021
|
full-service marketing agency with
|
||
|
as a Trustee
|
offices in the San Francisco Bay Area
|
||
|
and Liverpool, UK and staff across
|
|||
|
nine states in the U.S.
|
|||
|
HENNESSY FUNDS
|
1-800-966-4354
|
29
|
Other
|
|||
|
Directorships
|
|||
|
Held Outside
|
|||
|
Name, Age,
|
of Fund
|
||
|
and Position Held
|
Start Date
|
Principal Occupation(s)
|
Complex During
|
|
with the Trust
|
of Service
|
During Past Five Years
|
Past Five Years
|
|
Gerald P. Richardson
|
May 2004
|
Mr. Richardson is an independent
|
None.
|
|
78
|
consultant in the securities industry.
|
||
|
Trustee
|
|||
|
Brian Alexander
|
March 2015
|
Mr. Alexander has served as the
|
None.
|
|
42
|
Chief Operating Officer of Solis
|
||
|
Adviser to the Board
|
Mammography since March 2023.
|
||
|
Prior to that, he worked for the
|
|||
|
Sutter Health organization from
|
|||
|
2011 to 2023 in various positions.
|
|||
|
He served as the Chief Executive
|
|||
|
Officer of the North Valley Hospital
|
|||
|
Area from 2021 to March 2023.
|
|||
|
From 2018 to 2021, he served as the
|
|||
|
Chief Executive Officer of Sutter
|
|||
|
Roseville Medical Center. From 2016
|
|||
|
through 2018, he served as the Vice
|
|||
|
President of Strategy for the Sutter
|
|||
|
Health Valley Area, which includes
|
|||
|
11 hospitals, 13 ambulatory surgery
|
|||
|
centers, 16,000 employees, and
|
|||
|
1,900 physicians.
|
|||
|
Interested Trustee and Interested Adviser(2)
|
|||
|
Neil J. Hennessy
|
January 1996 as
|
Mr. Neil Hennessy has been employed
|
Hennessy
|
|
67
|
a Trustee and
|
by Hennessy Advisors, Inc. since
|
Advisors, Inc.
|
|
Chairman of the Board,
|
June 2008 as
|
1989 and currently serves as its
|
|
|
Chief Market Strategist,
|
an Officer
|
Chairman and Chief Executive Officer.
|
|
|
Portfolio Manager,
|
|||
|
and President
|
|||
|
A.J. Hennessy
|
December 2022
|
Mr. A.J. Hennessy has been employed
|
None.
|
|
37
|
by Hennessy Advisors, Inc. since 2011.
|
||
|
Adviser to the Board
|
|||
|
and Vice President,
|
|||
|
Corporate Development
|
|||
|
and Operations
|
|||
|
WWW.HENNESSYFUNDS.COM
|
30
|
TRUSTEES AND OFFICERS OF THE FUND
|
|
Name, Age,
|
||
|
and Position Held
|
Start Date
|
Principal Occupation(s)
|
|
with the Trust
|
of Service
|
During Past Five Years
|
|
Officers
|
||
|
Teresa M. Nilsen
|
January 1996
|
Ms. Nilsen has been employed by Hennessy Advisors, Inc.
|
|
57
|
since 1989 and currently serves as its President, Chief
|
|
|
Executive Vice President
|
Operating Officer, and Secretary.
|
|
|
and Treasurer
|
||
|
Daniel B. Steadman
|
March 2000
|
Mr. Steadman has been employed by Hennessy Advisors, Inc.
|
|
67
|
since 2000 and currently serves as its Executive Vice President.
|
|
|
Executive Vice President
|
||
|
and Secretary
|
||
|
Brian Carlson
|
December 2013
|
Mr. Carlson has been employed by Hennessy Advisors, Inc.
|
|
51
|
since December 2013 and currently serves as its Chief
|
|
|
Senior Vice President
|
Compliance Officer and Senior Vice President.
|
|
|
and Head of Distribution
|
||
|
David Ellison(3)
|
October 2012
|
Mr. Ellison has been employed by Hennessy Advisors, Inc.
|
|
65
|
since October 2012. He has served as a Portfolio Manager of
|
|
|
Senior Vice President
|
the Hennessy Large Cap Financial Fund and the Hennessy
|
|
|
and Portfolio Manager
|
Small Cap Financial Fund since their inception. Mr. Ellison also
|
|
|
served as a Portfolio Manager of the Hennessy Technology
|
||
|
Fund from its inception until February 2017. Mr. Ellison served
|
||
|
as Director, CIO, and President of FBR Fund Advisers, Inc.
|
||
|
from December 1999 to October 2012.
|
||
|
Jennifer Emerson(4)
|
June 2013
|
Ms. Emerson has been employed by Hennessy Advisors, Inc.
|
|
46
|
as its General Counsel since June 2013.
|
|
|
Senior Vice President and
|
||
|
Chief Compliance Officer
|
||
|
Ryan Kelley(5)
|
March 2013
|
Mr. Kelley has been employed by Hennessy Advisors, Inc. since
|
|
51
|
October 2012. He has served as Chief Investment Officer of the
|
|
|
Senior Vice President,
|
Hennessy Funds since March 2021 and has served as a Portfolio
|
|
|
Chief Investment Officer,
|
Manager of the Hennessy Gas Utility Fund, the Hennessy Large
|
|
|
and Portfolio Manager
|
Cap Financial Fund, and the Hennessy Small Cap Financial Fund
|
|
|
since October 2014. Mr. Kelley served as Co-Portfolio Manager
|
||
|
of these same funds from March 2013 through September
|
||
|
2014 and as a Portfolio Analyst for the Hennessy Funds from
|
||
|
October 2012 through February 2013. He has also served as a
|
||
|
Portfolio Manager of the Hennessy Cornerstone Growth Fund,
|
||
|
the Hennessy Cornerstone Mid Cap 30 Fund, the Hennessy
|
||
|
Cornerstone Large Growth Fund, and the Hennessy
|
||
|
Cornerstone Value Fund since February 2017 and as a Portfolio
|
||
|
Manager of the Hennessy Total Return Fund, the Hennessy
|
||
|
Balanced Fund, and the Hennessy Technology Fund since May
|
||
|
2018. He previously served as Co-Portfolio Manager of the
|
||
|
Hennessy Technology Fund from February 2017 until May 2018.
|
||
|
Mr. Kelley served as Portfolio Manager of FBR Fund
|
||
|
Advisers, Inc. from January 2008 to October 2012.
|
|
HENNESSY FUNDS
|
1-800-966-4354
|
31
|
Name, Age,
|
||
|
and Position Held
|
Start Date
|
Principal Occupation(s)
|
|
with the Trust
|
of Service
|
During Past Five Years
|
|
L. Joshua Wein(5)
|
September 2018
|
Mr. Wein has been employed by Hennessy Advisors, Inc. since
|
|
50
|
2018. He has served as Portfolio Manager of the Hennessy
|
|
|
Vice President and
|
Cornerstone Growth Fund, the Hennessy Cornerstone Mid Cap
|
|
|
Portfolio Manager
|
30 Fund, the Hennessy Cornerstone Large Growth Fund, the
|
|
|
Hennessy Cornerstone Value Fund, Hennessy Total Return Fund,
|
||
|
the Hennessy Balanced Fund, the Hennessy Gas Utility Fund,
|
||
|
and the Hennessy Technology Fund since February 2021, and
|
||
|
as the Co-Portfolio Manager of these Funds since February
|
||
|
2019. He served as a Senior Analyst of those same Funds from
|
||
|
September 2018 through February 2019. He also has served as
|
||
|
a Portfolio Manager of the Hennessy Energy Transition Fund
|
||
|
and the Hennessy Midstream Fund since January 2022.
|
||
|
Mr. Wein served as Director of Alternative Investments and
|
||
|
Co-Portfolio Manager at Sterling Capital Management
|
||
|
from 2008 to 2018.
|
_______________
|
(1)
|
The Funds have determined that Mr. DeSousa, Mr. Doyle, Mr. Franklin, Ms. Garvie, and Mr. Richardson are not interested persons, as defined in the 1940 Act, of the
Investment Manager or of any predecessor investment adviser for purposes of Section 15(f) of the 1940 Act.
|
|
(2)
|
Each of Neil J. Hennessy and A.J. Hennessy is considered an interested person, as defined in the 1940 Act, because he is an officer of the Trust.
|
|
(3)
|
The address of this officer is 101 Federal Street, Suite 1615B, Boston, MA 02110.
|
|
(4)
|
The address of this officer is 4800 Bee Caves Road, Suite 100, Austin, TX 78746.
|
|
(5)
|
The address of this officer is 1340 Environ Way, Chapel Hill, NC 27517.
|
|
WWW.HENNESSYFUNDS.COM
|
32
|
TRUSTEES AND OFFICERS OF THE FUND/EXPENSE EXAMPLE
|
Expense Example (Unaudited)
October 31, 2023
As a shareholder of the Fund, you incur ongoing costs, including management fees, service fees, and other Fund expenses. This Example is intended to help you understand your ongoing costs (in dollars)
of investing in the Fund and to compare these costs with the ongoing costs of investing in other investment funds. The Example is based on an investment of $1,000 invested at the beginning of the period and held for the entire
period from May 1, 2023, through October 31, 2023.
Actual Expenses
The first line of the table below provides information about actual account values and actual expenses. You may use this information, together with the amount you invested, to estimate the expenses
that you paid over the period. Simply divide your account value by $1,000 (for example, an $8,600 account value divided by $1,000 = 8.6), then multiply the result by the number in the first line under the heading “Expenses Paid
During Period” to estimate the expenses you paid on your account during this period. You may pay brokerage commissions on your purchases and sales of Fund shares, which are not reflected in the example.
Hypothetical Example for Comparison Purposes
The second line of the table below provides information about hypothetical account values and hypothetical expenses based on the Fund’s actual expense ratio and an assumed rate of return of 5% per year
before expenses, which is not the Fund’s actual return. The hypothetical account values and expenses may not be used to estimate the actual ending account balance or expenses you paid for the period. You may use this information
to compare the ongoing costs of investing in the Fund and other funds. To do so, compare this 5% hypothetical example with the 5% hypothetical examples that appear in the shareholder reports of the other funds. Please note that
the expenses shown in the table are meant to highlight your ongoing costs only. Therefore, the second line is useful in comparing ongoing costs only and will not help you determine the relative total costs of owning different
funds.
|
Expenses Paid
|
|||
|
Beginning
|
Ending
|
During Period(1)
|
|
|
Account Value
|
Account Value
|
May 1, 2023 –
|
|
|
May 1, 2023
|
October 31, 2023
|
October 31, 2023
|
|
|
Investor Class
|
|||
|
Actual
|
$1,000.00
|
$ 896.40
|
$4.06
|
|
Hypothetical (5% return before expenses)
|
$1,000.00
|
$1,020.92
|
$4.33
|
|
(1)
|
Expenses are equal to the Fund’s annualized expense ratio of 0.85, multiplied by the average account value over the period, multiplied by 184/365 days (to reflect the half-year period).
|
|
HENNESSY FUNDS
|
1-800-966-4354
|
33
How to Obtain a Copy of the Fund’s Proxy
Voting Policy and Proxy Voting Records
A description of the policies and procedures the Fund uses to determine how to vote proxies relating to portfolio securities is available without charge (1) by calling 800-966-4354, (2) on the Fund’s
website at www.hennessyetfs.com/proxy-voting/voting-policy, or (3) on the U.S. Securities and Exchange Commission’s (the “SEC”) website at www.sec.gov. The Fund’s proxy voting record is available without charge on both the
Fund’s website at www.hennessyetfs.com/proxy-voting/voting-record and the SEC’s website at www.sec.gov no later than August 31 for the prior 12 months ending June 30.
Availability of Quarterly Portfolio Schedule
The Fund files a complete schedule of portfolio holdings with the SEC for the first and third quarters of each fiscal year as an exhibit to its reports on Form N-PORT. The Fund’s Form N-PORT reports
are available on the SEC’s website at www.sec.gov or on request by calling 800-966-4354.
Federal Tax Distribution Information (Unaudited)
For tax year 2023, certain dividends paid by the Fund may be subject to a maximum tax rate of 23.8%, as provided for by the Jobs and Growth Tax Relief Reconciliation Act of 2003. The percentage of
dividends declared from ordinary income designated as qualified dividend income was 100.00%.
For corporate shareholders, the percent of ordinary income distributions that qualified for the corporate dividends received deduction for tax year 2023 was 100.00%.
The percentage of taxable ordinary income distributions that were designated as short-term capital gain distributions under Section 871(k)(2)(C) of the Internal Revenue Code of 1986,
as amended, for the Fund was 0.00%.
Frequency Distributions of Premiums
and Discounts
Information regarding how often the shares of the Fund trade on an exchange at a price above (i.e., at a premium) or below (i.e., at a discount) the net asset value of the Fund is available, without
charge, on the Fund’s website at www.hennessyetfs.com.
|
WWW.HENNESSYFUNDS.COM
|
34
|
PROXY VOTING — IMPORTANT NOTICE
|
Important Notice Regarding Delivery
of Shareholder Documents
All of our shareholders other than banks, broker-dealers and other financial intermediaries acting as authorized participants of the Fund are beneficial owners, as shown on the records of The
Depository Trust Company (“DTC”) or its participants. The DTC participants are the banks, broker-dealers and other financial intermediaries acting as authorized participants of the Fund, and these financial intermediaries are
responsible to pass along communications to you, including notices, account statements, prospectuses, tax forms, and shareholder reports. Please contact your financial intermediary for information regarding electronic delivery
of the Fund’s shareholder reports.
Householding is a method of delivery, based on the preference of the individual beneficial owner, in which a single copy of certain shareholder documents can be delivered to
beneficial owners who share the same address, even if their accounts are registered under different names. Householding for the Fund may be available through the banks, broker-dealers and other financial intermediaries acting as
authorized participants of the Fund. If you are interested in enrolling in householding and receiving a single copy of the prospectus and other shareholder documents, please contact your financial intermediary. If you currently
are enrolled in householding and wish to change your householding status, please contact your financial intermediary.
As permitted by SEC regulations, the Fund’s shareholder reports are made available to banks, broker-dealers and other financial intermediaries on a website, and unless the
intermediaries sign for eDelivery or elect to receive paper copies, the financial intermediaries will be notified by mail each time a report is posted and provided with a website link to access the report.
Shareholder reports transmitted after July 24, 2024, will comply with the new tailored shareholder reporting requirements, which require streamlined annual and semi-annual reports to
shareholders that highlight key information. These reports will be transmitted in paper unless banks, broker-dealers, and other financial intermediaries elect to receive reports electronically via eDelivery.
Subscribe to receive our team’s unique market and sector insights delivered to your inbox
www.hennessyetfs.com/subscribe
Follow us on social media
| |
|
|
|
HENNESSY FUNDS
|
1-800-966-4354
|
35
Privacy Policy
We collect the following personal information about you:
|
1.
|
Information we receive from you in applications or other forms, correspondence, or conversations, including, but not limited to, your name, address, phone number, social security number,
assets, income, and date of birth;
|
|
|
2.
|
Information about your transactions with us, our affiliates, or others, including, but not limited to, your account number and balance, payments history, parties to transactions, cost basis
information, and other financial information; and
|
|
|
3.
|
Other personal information we collect from various sources, even if you have not entered into a prior transaction with us, including the following:
|
|
•
|
Name, alias, address, unique personal identifier, online identifier, IP address, email address, telephone number, account name, and other similar identifiers;
|
||
|
•
|
Age and marital status;
|
||
|
•
|
Commercial information, including records of products purchased;
|
||
|
•
|
Browsing history, search history, and information on interaction with our website;
|
||
|
•
|
Geolocation data;
|
||
|
•
|
Employment and employment history, educational history, financial information, and purchasing and consuming histories or tendencies; and
|
||
|
•
|
Inferences drawn from the above-listed information to create a profile about your preferences, characteristics, predispositions, and behavior.
|
We collect this information directly from you, indirectly in the course of providing services to you, directly and indirectly from your activity on our website, from broker dealers,
marketing agencies, and other third parties that interact with us in connection with the services we perform and products we offer, and from anonymized and aggregated consumer information.
We use this information to fulfill the reason you provided the information to us, to provide you with other relevant products that you request from us, to provide you with
information about products that may interest you, to improve our website or present our website’s contents to you, and as otherwise described to you when collecting your personal information.
We do not disclose any personal information to unaffiliated third parties, except as permitted by law. We may disclose your personal information to our affiliates, vendors, and
service providers for a business purpose. For example, we are permitted by law to disclose all of the information we collect, as described above, to our transfer agent to process your transactions. When disclosing your personal
information to third parties, we enter into a contract with each third party describing the purpose of such disclosure and requiring that such personal information be kept confidential and not used for any purpose except to
perform the services contracted or respond to regulatory or law enforcement requests.
|
WWW.HENNESSYFUNDS.COM
|
36
|
PRIVACY POLICY
|
Furthermore, we restrict access to your personal information to those persons who require such information to provide products or services to you. As a result, we do not provide a
means for opting out of our limited sharing of your information. We maintain physical, electronic, and procedural safeguards that comply with federal standards to guard your personal information.
If you hold shares of the Funds through a financial intermediary, including, but not limited to, a broker-dealer, bank, or trust company, the privacy policy of your financial
intermediary governs how your personal information is shared with unaffiliated third parties.
If you live in a state such as California where the laws provide further privacy rights, we will not share information unless the law allows, and we will comply with the other
state-specific requirements.
Supplemental Privacy Notice for Residents of California
The California Consumer Privacy Act of 2018 (the “CCPA”) provides you, as a California resident, with certain additional rights relating to your personal information.
Under the CCPA, you have the right to request that we disclose to you the categories of personal information we have collected about you over the past 12 months, the categories of
sources of such information, our business purpose for collecting the information, the categories of third parties, if any, with whom we shared the information, and the specific information we have collected about you. You also
have the right to request that we delete any of your personal information, and, unless an exception applies, we will delete such information upon receiving and confirming your request. To make a request, call us at
1-800-966-4354, email us at privacy@hennessyfunds.com, or go to www.hennessyfunds.com/contact. We will not discriminate against you for exercising your rights under the CCPA. Further, we will not collect additional categories of
your personal information or use the personal information we collected for materially different, unrelated, or incompatible purposes without providing you notice.
|
HENNESSY FUNDS
|
1-800-966-4354
|
37
For information, questions, or assistance, please call
The Hennessy Funds
800-966-4354 or 415-899-1555
INVESTMENT ADVISOR
Hennessy Advisors, Inc.
7250 Redwood Boulevard, Suite 200
Novato, California 94945
ADMINISTRATOR,
TRANSFER AGENT,
DIVIDEND PAYING AGENT, &
SHAREHOLDER SERVICING AGENT
U.S. Bancorp Fund Services, LLC
d/b/a U.S. Bank Global Fund Services
P.O. Box 701
Milwaukee, Wisconsin 53201-0701
CUSTODIAN
U.S. Bank N.A.
Custody Operations
1555 North River Center Drive, Suite 302
Milwaukee, Wisconsin 53212
TRUSTEES
Neil J. Hennessy
Robert T. Doyle
J. Dennis DeSousa
Doug Franklin
Claire Garvie
Gerald P. Richardson
COUNSEL
Foley & Lardner LLP
777 East Wisconsin Avenue
Milwaukee, Wisconsin 53202-5306
INDEPENDENT REGISTERED
PUBLIC ACCOUNTING FIRM
Tait, Weller & Baker LLP
Two Liberty Place
50 South 16th Street, Suite 2900
Philadelphia, Pennsylvania 19102-2529
DISTRIBUTOR
Quasar Distributors, LLC
111 East Kilbourn Avenue, Suite 1250
Milwaukee, Wisconsin 53202
www.hennessyetfs.com | 800-966-4354
This report has been prepared for shareholders and may be distributed to
others only if preceded or accompanied by a current prospectus.
|
(b)
|
|
NOTICE:
Important Shareholder Report(s) Available Online and in Print by Request
Shareholder reports contain important information about your investments, including portfolio holdings and financial statements. We encourage you to review the shareholder report(s) and
other information by visiting: www.hennessyfunds.com/funds/fund-documents
You may request printed copies or change your delivery preferences at any time by calling:
U.S. Bank Global Fund Services
1-800-261-6950 or 1-414-765-4124
Please contact U.S. Bank Global Fund Services if you would like to:
|
✔
|
Request a paper copy of a specific shareholder report, free of charge. Unless you contact U.S. Bank Global Fund Services, you will NOT receive a paper copy.
|
|
✔
|
Elect to receive paper copies of ALL future shareholder reports, free of charge.
|
|
✔
|
Elect to receive shareholder reports and other communications (including quarterly statements, annual tax statements, and prospectuses) electronically delivered to your email.
|
Note: You may also elect eDelivery by accessing your account online at www.hennessyfunds.com/account
Subscribe to receive our team’s unique market and sector insights delivered to your inbox
www.hennessyfunds.com/subscribe
Follow us on social media
|
|
|
|
|
|
|
Item 2. Code of Ethics.
The registrant has adopted a code of ethics that applies to the registrant’s principal executive officer and principal financial officer. The registrant amended its code of ethics in February 2023 and again in August 2023 to (1) specify that
each of the registrant and the investment advisor to the registrant’s series, as an entity, is prohibited from trading on the basis of material non‑public information or communicating material non‑public information to others in violation of law,
(2) add a requirement that the implementation, modification, or termination of any Rule 10b5‑1 plan under the Securities Exchange Act of 1934, as amended (the “Exchange Act”), by the investment advisor to the registrant’s series or any director,
trustee, officer, or employee of the registrant or the investment advisor to the registrant’s series must be approved in advance by external or internal legal counsel to the investment advisor to the registrant’s series, (3) exclude summer
associates or other temporary employees of the registrant or of the investment advisor to the registrant’s series as access persons, (4) explicitly exempt in‑kind transfers from pre‑clearance requirements, and (5) remove the prohibition of
frequent trading of securities (while retaining the 14‑day short swing period). The registrant has not granted any waivers from any provisions of the code of ethics during the period covered by this report.
A copy of the registrant’s Code of Ethics is filed herewith, along with an exhibit that shows the portions of the Code of Ethics that were updated, as discussed above.
Item 3. Audit Committee Financial Expert.
The registrant’s board of directors has determined that it does not have an audit committee financial expert serving on its audit committee. At this time, the registrant believes that the financial and business experience provided by each
member of the audit committee together offers the registrant adequate oversight for the registrant’s level of financial complexity.
Item 4. Principal Accountant Fees and Services.
The registrant has engaged the principal accountant to the Hennessy Funds, Tait, Weller & Baker LLP, to perform audit services, audit-related services, tax services, and other services during the past
two fiscal years. “Audit services” refer to performing an audit of the registrant's annual financial statements or services that are normally provided by the accountant in connection with statutory and regulatory filings or engagements for those
fiscal years. “Audit‑related services” refer to the assurance and related services by the principal accountant that are reasonably related to the performance of the audit. “Tax services” refer to professional services rendered by the principal
accountant for tax compliance, tax advice, tax planning, and review of federal and state tax returns. The following table details the aggregate fees billed or expected to be billed for each of the last two fiscal years for audit fees,
audit-related fees, tax fees, and other fees by the principal accountant to the Hennessy Funds.
|
FYE 10/31/2023
|
FYE 8/31/2023(1)
|
FYE 10/31/2022
|
FYE 8/31/2022(2)
|
|
|
(a) Audit Fees
|
$322,300
|
$12,500
|
$315,800
|
$22,155
|
|
(b) Audit-Related Fees
|
-
|
-
|
-
|
-
|
|
(c) Tax Fees
|
$69,900
|
-
|
$67,400
|
$4,220
|
|
(d) All Other Fees
|
-
|
-
|
-
|
-
|
|
(1)
|
Fees relate to the audit for the Hennessy Stance ESG ETF for the fiscal year ended August 31, 2023. At a meeting of the Board of Trustees of the registrant held on October 8, 2023,
the Board of Trustees approved changing the fiscal year end of the Hennessy Stance ESG ETF for financial reporting purposes from August 31 to October 31.
|
|
(2)
|
Fees relate to the predecessor of the Hennessy Stance ESG ETF, the Stance Equity ESG Large Cap Core ETF, which was audited by a previous independent registered public accounting
firm.
|
(e)(1) The audit committee has adopted pre-approval procedures for audit and non-audit services provided to the registrant. Under the procedures, at any regularly scheduled audit committee meeting, the audit committee may pre-approve any
audit, audit-related, tax, and other non-audit services to be rendered or that may be rendered by a principal accountant to the registrant and certain non-audit services to be rendered by a principal accountant to the investment advisor to the
registrant’s series or such advisor’s affiliates that provide ongoing services to the registrant. The audit committee either specifically pre-approves the services or pre-approves a type of a service. No pre-approval is required for non-audit
services that meet the following criteria: (1) the aggregate amount of fees to be paid for all such non-audit services is not more than 5% of the total revenues paid by the registrant to the principal accountant in the fiscal year in which the
non-audit services are provided; (2) such services were not recognized by the registrant at the time of the engagement to be non-audit services; and (3) such services are promptly brought to the attention of the audit committee and approved prior
to the completion of the audit.
The audit committee must pre-approve a principal accountant’s engagements for non-audit services with the investment advisor to the registrant’s series and such advisor’s affiliates that provide ongoing services to the registrant, if the
engagement relates directly to the operations and financial reporting of the registrant, unless the aggregate amount of fees to be paid for all such services provided constitutes no more than 5% of the aggregate revenues paid to the principal
accountant by the registrant, the investment advisor and such advisor’s affiliates that provide ongoing services to the registrant, during the fiscal year in which the services are to be provided.
If a service has not been pre-approved at a regularly scheduled audit committee meeting, and if, in the opinion of the Chief Compliance Officer of the registrant, a proposed engagement must commence before the next regularly scheduled audit
committee meeting, any member of the audit committee is authorized under the procedures to pre-approve the engagement. The Chief Compliance Officer of the registrant will arrange for this interim review, coordinate with the designated member of
the audit committee and provide, with the assistance of the principal accountant, information about the service to be pre-approved for the interim period. Any interim pre-approval decisions are reported (for informational purposes) to the audit
committee at its next regularly scheduled meeting.
All of the tax services referenced above were pre-approved in accordance with the pre-approval procedures for audit and non-audit services.
(e)(2) The percentage of fees billed by Tait, Weller & Baker LLP applicable to non-audit services pursuant to waiver of pre-approval requirement were as follows:
|
FYE 10/31/2023
|
FYE 8/31/2023
|
FYE 10/31/2022
|
|
|
Audit-Related Fees
|
0%
|
0%
|
0%
|
|
Tax Fees
|
0%
|
0%
|
0%
|
|
All Other Fees
|
0%
|
0%
|
0%
|
The percentage of fees billed by the previous independent registered public accounting firm of the predecessor to the Hennessy Stance ESG ETF, the Stance Equity ESG Large Cap
Core ETF, applicable to non-audit services pursuant to waiver of pre‑approval requirement were as follows:
|
FYE 8/31/2022
|
|
|
Audit-Related Fees
|
0%
|
|
Tax Fees
|
0%
|
|
All Other Fees
|
0%
|
(f) All of the principal accountant’s hours spent on auditing the registrant’s financial statements were attributed to work performed by full‑time permanent employees of the principal accountant.
(g) The principal accountant has not provided any non-audit services in the last two fiscal years to the registrant, to the investment advisor to the registrant’s series, Hennessy Advisors, Inc., or to any entity controlling, controlled by, or
under common control with Hennessy Advisors, Inc.
(h) In assessing the independence of the registrant’s principal accountant, the board of trustees noted that the principal accountant has not provided any non-audit services to the investment advisor to the registrant’s series, Hennessy
Advisors, Inc., or to any entity controlling, controlled by, or under common control with Hennessy Advisors, Inc.
(i) Not applicable.
(j) Not applicable.
Item 5. Audit Committee of Listed Registrants.
The registrant is an issuer as defined in Rule 10A-3 under the Exchange Act and has a separately-designated standing audit committee established in accordance with Section 3(a)(58)(A) of the Exchange Act. The independent members of the
committee are as follows: Robert Doyle, J. Dennis DeSousa, Claire Garvie, and Gerald Richardson.
Item 6. Investments.
(a) The Schedules of Investments are included as part of the reports to shareholders filed under Item 1 of this Form.
(b) Not applicable.
Item 7. Disclosure of Proxy Voting Policies and Procedures for Closed-End Management Investment Companies.
Not applicable to open-end investment companies.
Item 8. Portfolio Managers of Closed-End Management Investment Companies.
Not applicable to open-end investment companies.
Item 9. Purchases of Equity Securities by Closed‑End Management Investment Company and Affiliated Purchasers.
Not applicable to open-end investment companies.
Item 10. Submission of Matters to a Vote of Security Holders.
Not applicable.
Item 11. Controls and Procedures.
|
(a)
|
The registrant’s principal executive officer and principal financial officer have reviewed the registrant's disclosure controls and procedures (as defined in Rule 30a-3(c) under the Investment Company Act of 1940 (the “Act”)) as of a
date within 90 days of the filing date of this report, as required by Rule 30a‑3(b) under the Act and Rules 13a-15(b) or 15d‑15(b) under the Exchange Act. Based on their review, such officers have concluded that the disclosure controls
and procedures are effective in ensuring that information required to be disclosed in this report is appropriately recorded, processed, summarized and reported and made known to them by others within the registrant and by the
registrant’s service providers.
|
|
(b)
|
There were no changes in the registrant's internal control over financial reporting (as defined in Rule 30a-3(d) under the Act) that occurred during the period covered by this report that has materially affected, or is reasonably
likely to materially affect, the registrant's internal control over financial reporting.
|
Item 12. Disclosure of Securities Lending Activities for Closed-End Management Investment Companies.
Not applicable to open-end investment companies.
Item 13. Exhibits.
(3) Any written solicitation to purchase securities under Rule 23c‑1 under the Act sent or given during the period covered by the report by or on behalf of the registrant to 10 or
more persons. Not applicable to open-end investment companies.
(4) Change in the registrant’s independent public accountant. Provide the information called for by Item 4 of Form 8-K under the Exchange Act. Unless otherwise specified by Item 4,
or related to and necessary for a complete understanding of information not previously disclosed, the information should relate to events occurring during the reporting period. There was
no change in the registrant's independent public accountant for the period covered by this report.
SIGNATURES
Pursuant to the requirements of the Securities Exchange Act of 1934 and the Investment Company Act of 1940, the registrant has duly caused this report to be signed on its behalf by the undersigned, thereunto duly
authorized.
HENNESSY FUNDS TRUST
(Registrant)
By: /s/Neil J. Hennessy
Neil J. Hennessy
President
Date: January 4, 2024
Pursuant to the requirements of the Securities Exchange Act of 1934 and the Investment Company Act of 1940, this report has been signed below by the following persons on behalf of the registrant and in the capacities
and on the dates indicated.
|
By: /s/Neil J. Hennessy
Neil J. Hennessy, President and Principal Executive Officer |
|
Date: January 4, 2024
|
|
By: /s/Teresa M. Nilsen
Teresa M. Nilsen, Treasurer and Principal Financial Officer
|
|
Date: January 4, 2024
|